SANDRIDGE ENERGY INC
10-Ks and 10-Qs
|
|
|
|
|
|
|
|
|
|
|
|
|
|
|
|
|
|
|
|
|
|
|
|
|
|
|
|
|
|
|
|
|
|
|
|
|
|
|
|
|
|
|
|
|
|
|
|
|
|
|
|
|
|
|
|
UNITED STATES
SECURITIES AND EXCHANGE COMMISSION
Washington, D.C. 20549
|
Form 10-K
|
||||
(Mark One)
|
þ
|
ANNUAL REPORT PURSUANT TO SECTION 13 OR 15(d) OF THE SECURITIES EXCHANGE ACT OF 1934
|
For the fiscal year ended December 31,
2017
OR
|
¨
|
TRANSITION REPORT PURSUANT TO SECTION 13 OR 15(d) OF THE SECURITIES EXCHANGE ACT OF 1934
|
For the transition period from to
Commission File Number: 001-33784
|
SANDRIDGE ENERGY, INC.
|
||||
|
(Exact name of registrant as specified in its charter)
|
||||
|
Delaware
|
20-8084793
|
|||
|
(State or other jurisdiction of
incorporation or organization)
|
(I.R.S. Employer
Identification No.)
|
|||
|
123 Robert S. Kerr Avenue
Oklahoma City, Oklahoma
|
73102
|
|||
|
(Address of principal executive offices)
|
(Zip Code)
|
|||
|
(405) 429-5500
|
||||
|
(Registrant’s telephone number, including area code)
|
||||
|
Securities registered pursuant to Section 12(b) of the Act:
|
||||
|
Title of Each Class
|
Name of Each Exchange on Which Registered
|
|||
|
Common Stock, $0.001 par value
|
New York Stock Exchange
|
|||
|
Securities registered pursuant to Section 12(g) of the Act:
|
||||
|
None
|
||||
Indicate by check mark if the registrant is a well-known seasoned issuer, as defined in Rule 405 of the Securities Act. Yes
¨
No
þ
Indicate by check mark if the registrant is not required to file reports pursuant to Section 13 or Section 15(d) of the Act. Yes
¨
No
þ
Indicate by check mark whether the registrant (1) has filed all reports required to be filed by Section 13 or 15(d) of the Securities Exchange Act of 1934 during the preceding 12 months (or for such shorter period that the registrant was required to file such reports), and (2) has been subject to such filing requirements for the past 90 days. Yes
þ
No
¨
Indicate by check mark whether the registrant has submitted electronically and posted on its corporate website, if any, every Interactive Data File required to be submitted and posted pursuant to Rule 405 of Regulation S-T during the preceding 12 months (or for such shorter period that the registrant was required to submit and post such files). Yes
þ
No
¨
Indicate by check mark if disclosure of delinquent filers pursuant to Item 405 of Regulation S-K is not contained herein, and will not be contained, to the best of registrant’s knowledge, in definitive proxy or information statements incorporated by reference in Part III of this Form 10-K or any amendment to this Form 10-K.
þ
Indicate by check mark whether the registrant has filed all documents and reports required to be filed by Section 12, 13 or 15(d) of the Securities Exchange Act of 1934 subsequent to the distribution of securities under a plan confirmed by a court. Yes
þ
No
o
Indicate by check mark whether the registrant is a large accelerated filer, an accelerated filer, a non-accelerated filer, a smaller reporting company, or an emerging growth company. See the definitions of “large accelerated filer,” “accelerated filer,” “smaller reporting company,” and “emerging growth company” in Rule 12b-2 of the Exchange Act.
|
Large accelerated filer
o
|
Accelerated filer
þ
|
|
Non-accelerated filer
o
(Do not check if smaller reporting company)
|
Smaller reporting company
o
|
|
Emerging growth company
o
|
|
If an emerging growth company, indicate by check mark if the registrant has elected not to use the extended transition period for complying with any new or revised financial accounting standards provided pursuant to Section 13(a) of the Exchange Act.
o
Indicate by check mark whether the registrant is a shell company (as defined in Rule 12b-2 of the Exchange Act). Yes
¨
No
þ
The aggregate market value of our common stock held by non-affiliates on
June 30, 2017
was approximately
$586.9 million
based on the closing price as quoted on the New York Stock Exchange. As of
February 15, 2018
, there were
35,641,907
shares of our common stock outstanding.
DOCUMENTS INCORPORATED BY REFERENCE
Portions of the Company’s definitive proxy statement for the
2018
Annual Meeting of Stockholders are incorporated by reference in Part III.
SANDRIDGE ENERGY, INC.
2017
ANNUAL REPORT ON FORM 10-K
TABLE OF CONTENTS
|
Item
|
|
Page
|
|
PART I
|
||
|
1.
|
||
|
1A.
|
||
|
1B.
|
||
|
2.
|
||
|
3.
|
||
|
4.
|
||
|
PART II
|
||
|
5.
|
||
|
6.
|
||
|
7.
|
||
|
7A.
|
||
|
8.
|
||
|
9.
|
||
|
9A.
|
||
|
9B.
|
||
|
PART III
|
||
|
10.
|
||
|
11.
|
||
|
12.
|
||
|
13.
|
||
|
14.
|
||
|
PART IV
|
||
|
15.
|
||
|
16.
|
||
Certain Defined Terms
References in this report to the “Company,” “SandRidge,” “we,” “our,” and “us” mean SandRidge Energy, Inc., including its consolidated subsidiaries and variable interest entities of which it is the primary beneficiary. In addition, this report includes terms commonly used in the oil and natural gas industry, which are defined in the “Glossary of Oil and Natural Gas Terms” beginning on page 23.
Cautionary Note Regarding Forward-Looking Statements
Various statements contained in this report, including those that express a belief, expectation, or intention, as well as those that are not statements of historical fact, are forward-looking statements within the meaning of Section 27A of the Securities Act of 1933, as amended (the “Securities Act”), and Section 21E of the Securities Exchange Act of 1934, as amended (the “Exchange Act”). These statements generally are accompanied by words that convey projected future events or outcomes. These forward-looking statements may include projections and estimates concerning the Company’s capital expenditures, liquidity, capital resources and debt profile, pending dispositions, the timing and success of specific projects, outcomes and effects of litigation, claims and disputes, elements of the Company’s business strategy, compliance with governmental regulation of the oil and natural gas industry, including environmental regulations, acquisitions and divestitures and the effects thereof on the Company’s financial condition and other statements concerning the Company’s operations, financial performance and financial condition. Forward-looking statements are generally accompanied by words such as “estimate,” “assume,” “target,” “project,” “predict,” “believe,” “expect,” “anticipate,” “potential,” “could,” “may,” “foresee,” “plan,” “goal,” “should,” “intend” or other words that convey the uncertainty of future events or outcomes. The Company has based these forward-looking statements on its current expectations and assumptions about future events. These statements are based on certain assumptions and analyses made by the Company in light of its experience and perception of historical trends, current conditions and expected future developments as well as other factors the Company believes are appropriate under the circumstances. The actual results or developments anticipated may not be realized or, even if substantially realized, may not have the expected consequences to or effects on the Company’s business or results. Such statements are not guarantees of future performance and actual results or developments may differ materially from those projected in such forward-looking statements. These forward-looking statements speak only as of the date hereof. The Company disclaims any obligation to update or revise these forward-looking statements unless required by law, and it cautions readers not to rely on them unduly. While the Company’s management considers these expectations and assumptions to be reasonable, they are inherently subject to significant business, economic, competitive, regulatory and other risks, contingencies and uncertainties relating to, among other matters, the risks and uncertainties discussed in “Risk Factors” in Item 1A of this report, as well as the following:
|
•
|
risks associated with drilling oil and natural gas wells;
|
|
•
|
the volatility of oil, natural gas and natural gas liquids (“NGL”) prices;
|
|
•
|
uncertainties in estimating oil, natural gas and NGL reserves;
|
|
•
|
the need to replace the oil, natural gas and NGL reserves the Company produces;
|
|
•
|
our ability to execute our growth strategy by drilling wells as planned;
|
|
•
|
the amount, nature and timing of capital expenditures, including future development costs, required to develop our undeveloped areas;
|
|
•
|
concentration of operations in the Mid-Continent region of the United States;
|
|
•
|
risks associated with shareholder activism;
|
|
•
|
limitations of seismic data;
|
|
•
|
the potential adverse effect of commodity price declines on the carrying value of our oil and natural properties;
|
|
•
|
severe or unseasonable weather that may adversely affect production;
|
|
•
|
availability of satisfactory oil, natural gas and NGL marketing and transportation;
|
|
•
|
availability and terms of capital to fund capital expenditures;
|
|
•
|
amount and timing of proceeds of asset monetizations;
|
|
•
|
potential financial losses or earnings reductions from commodity derivatives;
|
|
•
|
potential elimination or limitation of tax incentives;
|
|
•
|
competition in the oil and natural gas industry;
|
|
•
|
general economic conditions, either internationally or domestically affecting the areas where we operate;
|
|
•
|
costs to comply with current and future governmental regulation of the oil and natural gas industry, including environmental, health and safety laws and regulations, and regulations with respect to hydraulic fracturing and the disposal of produced water; and
|
|
•
|
the need to maintain adequate internal control over financial reporting.
|
Item 1.
Business
GENERAL
We are an oil and natural gas company, organized in 2006 as a Delaware corporation, with a principal focus on exploration and production activities in the U.S. Mid-Continent and North Park Basin of Colorado. Our North Park Basin properties were acquired during the fourth quarter of 2015.
As of
December 31, 2017
, we had
2,869
gross (
2,096.8
net) producing wells, approximately 2,419 of which we operate, and approximately
931,000
gross (
643,000
net) total acres under lease. As of
December 31, 2017
, we had two rigs drilling in the Mid-Continent and two rigs drilling in the North Park Basin. Total estimated proved reserves as of
December 31, 2017
, were
177.6
MMBoe, of which approximately
70%
were proved developed.
Our principal executive offices are located at 123 Robert S. Kerr Avenue, Oklahoma City, Oklahoma 73102 and our telephone number is (405) 429-5500. Our annual reports on Form 10-K, quarterly reports on Form 10-Q, current reports on Form 8-K and amendments to those reports are made available free of charge on our website at www.sandridgeenergy.com as soon as reasonably practicable after we electronically file such material with, or furnish it to, the Securities and Exchange Commission (“SEC”). Any materials that we have filed with the SEC may be read and copied at the SEC’s Public Reference Room at 100 F Street, N.E., Room 1580, Washington D.C. 20549 or accessed via the SEC’s website address at
www.sec.gov.
The public may also obtain information about the operation of the Public Reference Room by calling the SEC at 1-800-SEC-0330.
Reorganization Under Chapter 11 and Emergence from Bankruptcy
On May 16, 2016, the Company and certain of its direct and indirect subsidiaries (collectively, the “Debtors”) filed voluntary petitions (the “Bankruptcy Petitions”) for reorganization under Chapter 11 of the United States Bankruptcy Code (the “Bankruptcy Code”) in the United States Bankruptcy Court for the Southern District of Texas (the “Bankruptcy Court”). The Bankruptcy Court confirmed the Debtors’ joint plan of reorganization on September 9, 2016 (as amended, the “Plan”), and the Debtors’ subsequently emerged from bankruptcy on October 4, 2016 (the “Emergence Date”). The Company’s Chapter 11 reorganization and related matters are addressed in Item 7, “Management’s Discussion and Analysis of Financial Condition and Results of Operations”, “Note 1 - Voluntary Reorganization under Chapter 11 Proceedings” and “Note 2 - Fresh Start Accounting” to the accompanying consolidated financial statements contained in Item 8, “Financial Statements and Supplementary Data.”
Fresh Start Accounting
Upon emergence from Chapter 11, we elected to apply fresh start accounting effective October 1, 2016, to coincide with the timing of our normal fourth quarter reporting period, which resulted in SandRidge becoming a new entity for financial reporting purposes. As a result of the application of fresh start accounting and the effects of the implementation of the Plan, the financial statements after October 1, 2016 are not comparable with the financial statements prior to that date. References to the “Successor” or the “Successor Company” relate to SandRidge subsequent to October 1, 2016. References to the “Predecessor” or “Predecessor Company” refer to SandRidge on and prior to October 1, 2016.
Presentation of Royalty Trust Activities
Information presented for the year ended December 31, 2015, includes 100% of the interests and activities of the SandRidge Mississippian Trust I (the “Mississippian Trust I”), the SandRidge Permian Trust (the “Permian Trust”) and the SandRidge Mississippian Trust II (the “Mississippian Trust II”) (collectively, the “Royalty Trusts”), including amounts attributable to noncontrolling interest. On January 1, 2016, we adopted the provisions of ASU 2015-02, “Amendments to the Consolidation Analysis,” which led to the conclusion that the Royalty Trusts were no longer variable interest entities (“VIEs”), and a cumulative-effect adjustment was made to equity to remove the effect of any previously recorded non-controlling interest. Prior periods were not restated. For the 2016 and 2017 periods, we have proportionately consolidated only our share of each Royalty Trust’s assets, liabilities, revenues and expenses.
1
Strategic Objectives
Operate in a safe, reliable and environmentally responsible manner.
Our highest priority is the health and safety of our employees and contractors while protecting the environment in which we operate.
Operating Excellence
. We are committed to maintaining a culture and track record of operating excellence, as it is essential to capturing cost efficiencies while maximizing the value and return of our oil and gas properties.
Maintain top-quality human resource management, development and utilization.
Achieving our strategic objectives is to be accomplished by our employees. It is therefore critical to have development and compensation programs that attract, retain and motivate the types of people we need to succeed.
Financial discipline
. Maintaining financial flexibility is a key priority and requires balancing our economic growth objectives with preserving our conservatively leveraged balance sheet. We continually evaluate the appropriate capital allocation to our development program, largely driven by expected rates of return on our various drilling projects balanced with acceptable levels of debt. As the energy sector remains subject to significant volatility in oil and gas prices, we believe maintaining a leverage ratio of no more than two times earnings before interest, taxes, depletion and amortization to be an appropriate target. As such, the pace of delineation and development of our emerging North Park Basin and NW STACK assets will be set in part by limiting our capital outspend or our ability to attract financial partners.
Monetize our unutilized or non-core assets and infrastructure
. We will seek to divest assets at prices above our retention alternative with the aim of increasing our financial flexibility while focusing on the development of our core assets.
Maximize asset value and risk-adjusted returns
. Core to our value proposition is prioritizing projects with the greatest certainty of capturing economic returns well above our cost of capital while growing our oil and gas resource base.
Capture economic merger and acquisition opportunities.
We regularly evaluate merger and acquisition opportunities in our existing or complementary development areas. Any acquisition must be complementary and accretive to our existing property base. Evaluation criteria will include acquisition structure, synergies, proximity to our existing assets, the fit within our development plans, the stage in development cycle, and the fit of our core competencies and technical expertise. Specifically, our near-term focus will remain on optimizing and growing our existing asset portfolio in the Anadarko Basin of the Mid-Continent area and the North Park Basin of Colorado where we have significant operating experience. Use of our stock as a currency in such acquisitions will be primarily limited to acquisitions that carry a similar or lower multiple to our stock.
Acquisitions and Divestitures
2017 Acquisition and Divestitures
NW STACK.
On February 10, 2017, the Company acquired assets consisting of approximately
13,000
net acres in Woodward County, Oklahoma for approximately
$47.8 million
in cash, net of post-closing adjustments. Also included in the acquisition were working interests in
four
wells previously drilled on the acreage.
Oil and Natural Gas Property Divestitures.
In 2017, the Company divested various non-core oil and natural gas properties for approximately
$17.1 million
in cash. All of these divestitures were accounted for as adjustments to the full cost pool with no gain or loss recognized.
2016 Divestiture and Release from Treating Agreement
In January 2016, we transferred ownership of substantially all of our oil and natural gas properties and midstream assets located in the Piñon field in the West Texas Overthrust (“WTO”) and $11.0 million in cash to a wholly owned subsidiary of Occidental Petroleum Corporation (“Occidental”) and were released from all past, current and future claims and obligations under an existing 30-year treating agreement with Occidental. In connection with this transfer, the Predecessor Company recognized a loss of approximately $89.1 million on the termination of the treating agreement and the cease-use of transportation agreements that supported production from the Piñon field and reduced its asset retirement obligations associated with its oil and natural gas properties by $34.1 million. For the year ended December 31, 2015, production, revenues and direct operating expenses for the conveyed oil and natural gas properties were 1.9 MMBoe, $14.6 million and $41.1 million, respectively.
2
The assets of Piñon Gathering Company, LLC (“PGC”), which we acquired in October 2015 as discussed further below, were included in the consideration conveyed to Occidental.
2015 Acquisitions
Piñon Gathering Company, LLC
. In October 2015, we acquired the assets of and terminated a gas gathering agreement with PGC for
$48.0 million
in cash and
$78.0 million
principal amount of newly issued 8.75% Senior Secured Notes due 2020 (“PGC Senior Secured Notes”). PGC owned approximately 370 miles of gathering lines supporting the natural gas production from the Company's Piñon field in the WTO.
North Park Basin.
In December 2015, we acquired approximately
135,000
net acres in the North Park Basin, Jackson County, Colorado for approximately
$191.1 million
in cash, including post-closing adjustments. Also included in the acquisition were working interests in 16 wells previously drilled on the acreage. Additionally, the seller paid us $3.1 million for certain overriding interests retained in the properties.
PRIMARY BUSINESS OPERATIONS
Our primary operations are the exploration, development and production of oil and natural gas. The following table presents information concerning our exploration and production activities by geographic area of operation as of
December 31, 2017
.
|
Estimated Net
Proved
Reserves
(MMBoe)
|
Daily
Production
(MBoe/d)(1)
|
Reserves/
Production
(Years)(2)
|
Gross
Acreage
|
Net
Acreage
|
Capital Expenditures (In millions) (3)
|
|||||||||||||
|
Area
|
||||||||||||||||||
|
Mid-Continent
|
130.6
|
|
33.6
|
|
10.6
|
|
774,830
|
|
497,465
|
|
$
|
149.9
|
|
|||||
|
North Park Basin
|
40.2
|
|
2.9
|
|
38.0
|
|
128,490
|
|
121,712
|
|
94.7
|
|
||||||
|
Permian Basin
|
6.8
|
|
1.3
|
|
14.3
|
|
27,970
|
|
23,571
|
|
1.4
|
|
||||||
|
Total
|
177.6
|
|
37.8
|
|
12.9
|
|
931,290
|
|
642,748
|
|
$
|
246.0
|
|
|||||
|
(1)
|
Average daily net production for the month of December
2017
.
|
|
(2)
|
Estimated net proved reserves as of
December 31, 2017
divided by production for the month of December
2017
, annualized.
|
|
(3)
|
Capital expenditures for the year ended
December 31, 2017
, on an accrual basis.
|
Properties
Mid-Continent
We held interests in approximately
775,000
gross (
497,000
net) leasehold acres located primarily in Oklahoma and Kansas at
December 31, 2017
. Associated proved reserves at
December 31, 2017
totaled
130.6
MMBoe, 86.6% of which were proved developed reserves. Our interests in the Mid-Continent as of
December 31, 2017
included
1,774
gross (
1,021.3
net) producing wells with an average working interest of 58%. We had two rigs operating in the Mid-Continent as of
December 31, 2017
, which were drilling horizontal wells. One of the rigs was drilling under the drilling participation agreement described below. As of December 31, 2017, our Mid-Continent properties included an inventory of 64 operated proved undeveloped laterals in addition to several hundred undeveloped probable horizontal well locations. During 2017, we drilled a total of 16 horizontal producing wells in this area which included a combination of primarily short reach lateral and extended reach lateral well configurations.
NW STACK.
The Meramec and Osage formations are the primary targets in the STACK play of Blaine and Kingfisher Counties, and are currently being drilled using horizontal well technology in Garfield, Major, Dewey, and Woodward Counties, a play area called the NW STACK. These formations are Mississippian in age, lying above the Woodford Shale formation and below Chester (if present) and Pennsylvanian formations. The Meramec is composed of interbedded shales, sands, and carbonates while the Osage is composed of low porosity, fractured limestone and chert. The top of these target formations ranges in depth from about 5,800 feet at the northern edge of the basin to greater than 14,000 feet toward the interior of the basin. Meramec formation thickness ranges from about 50 feet to over 400 feet and the Osage formation thickness ranges from about 450 to 1,400 feet. The Woodford Shale is the primary hydrocarbon source for both the Meramec and Osage,
3
although the organic content in the Meramec Shale may provide a self-sourcing component as well. Similar to the STACK, there is an over-pressured area and normally pressured area in the NW STACK. Significant industry activity in the NW STACK has established both the Meramec and Osage as productive reservoirs with successful wells. We drilled 16 wells in the Meramec formation during 2017 and no Osage wells. Of our total Mid-Continent acreage at December 31, 2017, approximately 130,000 gross (72,000 net) acres are associated with the NW STACK play area.
In the third quarter of 2017, we entered into a
$200.0 million
drilling participation agreement with a Counterparty (the “Counterparty”) to jointly develop new horizontal wells on a wellbore only basis within certain dedicated sections of its undeveloped leasehold acreage within the Meramec formation in the NW STACK. Under this agreement, the Counterparty is paying
90%
of the net exploration and development costs, up to
$100.0 million
in the first tranche, in exchange for an initial
80%
net working interest in each new well, subject to certain reversionary hurdles, as shown in the table below. As a result, we are receiving a
20%
net working interest after funding
10%
of the exploration and development costs related to the subject wells. This will allow us to spend minimal additional capital while accelerating the delineation of our position in the NW STACK, realizing further efficiencies and holding additional acreage by production, potentially adding reserves. We will operate all of the wells developed under this agreement and will retain sole discretion as to the number, location and schedule of wells drilled. The Counterparty will also have the option to fund a second
$100.0 million
tranche, subject to mutual agreement.
Development Costs and Working Interest (“WI”) Structure
|
Counterparty
|
SandRidge
|
|||
|
Development Costs
|
90% of Costs
|
10% of Costs
|
||
|
Initial Working Interest
|
80% of WI
|
20% of WI
|
||
|
Reversion If Counterparty Achieves 10% IRR
|
35% of WI
|
65% of WI
|
||
|
Reversion If Counterparty Achieves 15% IRR
|
11% of WI
|
89% of WI
|
||
Mississippian Lime Formation.
The Mississippian Lime formation is an expansive carbonate hydrocarbon system located on the Anadarko Shelf in northern Oklahoma and southern Kansas, and is a target for exploration and development within the Mid-Continent. The top of this formation is encountered between approximately 4,000 and 7,000 feet and stratigraphically between various formations of Pennsylvanian age and the Devonian-aged Woodford Shale formation. The Mississippian formation is approximately 350 to 650 feet in gross thickness across our lease position and has targeted porosity zone(s) ranging between 20 and 150 feet in thickness. At
December 31, 2017
, we had approximately 645,000 gross (425,000 net) acres under lease and 1,359 gross (830.1 net) producing wells in the Mississippian formation. We completed one horizontal well in the Mississippian Lime formation in 2017. During 2017, our capital was focused on delineation and adding proved undeveloped locations and value in our NW STACK and North Park Basin assets. Our Mississippian Lime assets have previously booked proved undeveloped wells that we continually evaluate as we seek high-return, value adding drilling opportunities. We anticipate including these undeveloped Mississippi Lime wells in future drilling activity.
North Park Basin
Our North Park Basin properties consisted of approximately
128,000
gross (
122,000
net) acres, and
29
gross (
29.0
net) producing wells with an average working interest of 100%, at December 31, 2017. Associated proved reserves at December 31, 2017 were approximately
40.2
MMBoe, of which approximately 9.8% were proved developed reserves. The North Park Basin acreage is located in north central Colorado and, similar to the DJ Basin next to Colorado’s Front Range, has multiple potential pay targets with current activity focused on the Niobrara Shale play. Although untested, zones shallower and deeper than the Niobrara have indications of potentially producing hydrocarbons. The Niobrara Shale is characterized by stacked pay benches at depths of 5,500 to 9,000 feet with overall reservoir thickness over 450 feet. While we continued delineation drilling to establish federal units, we have identified a high confidence, proved area where we have 147 proved undeveloped lateral locations in two of the four Niobrara benches. Across the entire acreage position, there are approximately one thousand undeveloped probable horizontal laterals. We had two rigs operating in the North Park Basin as of
December 31, 2017
, one of which was drilling a horizontal well. We drilled a total of six horizontal producing wells, all extended reach laterals, in this area during 2017.
4
Permian Basin
Our Permian Basin properties primarily include our proportionate share of the Permian Trust properties in the Permian Basin. As of
December 31, 2017
, our other properties consisted of approximately
28,000
gross (
24,000
net) leasehold acres,
1,066
gross (
1,046.5
net) producing wells with an average working interest of 98%. Associated proved reserves at
December 31, 2017
were
6.8
MMBoe, 100% of which were proved developed reserves. We did not drill any wells in this area during 2017.
Proved Reserves
Preparation of
Reserves Estimates
The estimates of oil, natural gas and NGL reserves in this report are based on reserve reports, which were largely prepared by independent petroleum engineers. To achieve reasonable certainty, the Company’s reservoir engineers relied on technologies that have been demonstrated to yield results with consistency and repeatability. The technologies and economic data used to estimate our proved reserves include, but are not limited to, well logs, geological maps, seismic data, well test data, production data, historical price and cost information and property ownership interests. This data was reviewed by various levels of management for accuracy, before consultation with independent petroleum engineers. Such consultation included review of properties, assumptions and any new data available. The Company’s internal reserves estimates and methodologies, as prepared by various Subsurface and Corporate Reserves personnel, were compared to those prepared by independent petroleum engineers to test the reserves estimates and conclusions before the reserves estimates were included in this report. The accuracy of the reserve estimates is dependent on many factors, including the following:
|
•
|
the quality and quantity of available data and the engineering and geological interpretation of that data;
|
|
•
|
estimates regarding the amount and timing of future costs, which could vary considerably from actual costs;
|
|
•
|
the accuracy of economic assumptions; and
|
|
•
|
the judgment of the personnel preparing the estimates.
|
SandRidge’s Senior Vice President—Reserves, Technology and Business Development is the technical professional primarily responsible for overseeing the preparation of our reserves estimates. He has a Bachelor of Science degree in Petroleum Engineering with over 30 years of practical industry experience, including over 30 years of estimating and evaluating reserve information. He has also been a certified professional engineer in the state of Oklahoma since 2007 and a member of the Society of Petroleum Engineers since 1980.
SandRidge’s reservoir engineers continually monitor well performance, making reserves estimate adjustments, as necessary, to ensure the most current information is reflected in reserves estimates. This information used to prepare reserve estimates includes production histories as well as other geologic, economic, ownership and engineering data. The Corporate Reserves department currently has a total of eight full-time employees, comprised of four degreed engineers and four engineering and business analysts with a minimum of a four-year degree in mathematics, finance or other business or science field.
We encourage ongoing professional education for our engineers and analysts on new technologies and industry advancements as well as refresher training on basic skill sets.
In order to ensure the reliability of reserves estimates, internal controls within the reserve estimation process include
|
•
|
the Corporate Reserves department follows comprehensive SEC-compliant internal policies to determine and report proved reserves including:
|
|
•
|
confirming that reserves estimates include all properties owned and are based upon proper working and net revenue interests;
|
|
•
|
reviewing and using data provided by other departments within the Company such as Accounting in the estimation process;
|
|
•
|
communicating, collaborating, analytical engineering with technical personnel of our business units;
|
|
•
|
comparing and reconciling the internally generated reserves estimates to those prepared by third parties.
|
5
|
•
|
reserves estimates are prepared by experienced reservoir engineers or under their direct supervision; and
|
|
•
|
no employee’s compensation is tied to the amount of reserves recorded.
|
Each quarter, the Senior Vice President—Reserves, Technology and Business Development presents the status of the Company’s reserves to a committee of executives, and subsequently obtains approval of all changes from key executives. Additionally, the five year proved undeveloped reserves (“PUD”) development plan is reviewed and approved annually by the Company’s Chief Executive Officer, Chief Financial Officer, Chief Operating Officer, and the Senior Vice President - Reserves, Technology and Business Development.
The Corporate Reserves department works closely with its independent petroleum consultants at each fiscal year end to ensure the integrity, accuracy and timeliness of annual independent reserves estimates. These independently developed reserves estimates are presented to the Audit Committee. In addition to reviewing the independently developed reserve reports, the Audit Committee also periodically meets with the independent petroleum consultants that prepare estimates of proved reserves.
The percentage of the Company’s total proved reserves prepared by each of the independent petroleum consultants is shown in the table below.
|
|
December 31,
|
|||||||
|
|
2017
|
2016
|
2015
|
|||||
|
Cawley, Gillespie & Associates, Inc.
|
62.6
|
%
|
72.0
|
%
|
77.7
|
%
|
||
|
Ryder Scott Company, L.P.
|
29.0
|
%
|
18.4
|
%
|
8.5
|
%
|
||
|
Netherland, Sewell & Associates, Inc.
|
3.8
|
%
|
3.6
|
%
|
3.9
|
%
|
||
|
Total
|
95.4
|
%
|
94.0
|
%
|
90.1
|
%
|
||
The remaining
4.6%
and
6.0%
of the estimated proved reserves as of
December 31, 2017
and
2016
, respectively, were based on internally prepared estimates primarily for the Mid-Continent area. The remaining
9.9%
of the estimated proved reserved as of December 31,
2015
were based on internally prepared estimates primarily for properties located in WTO.
Copies of the reports issued by our independent petroleum consultants with respect to our oil, natural gas and NGL reserves for the substantial majority of all geographic locations as of
December 31, 2017
are filed with this report as Exhibits 99.1, 99.2 and 99.3. The geographic location of our estimated proved reserves prepared by each of the independent petroleum consultants as of
December 31, 2017
is presented below.
|
Geographic Locations—by Area by State
|
|
|
Cawley, Gillespie & Associates, Inc.
|
Mid-Continent—KS, OK
|
|
Ryder Scott Company, L.P.
|
North Park Basin—CO, Mid-Continent—OK
|
|
Netherland, Sewell & Associates, Inc.
|
Permian Basin—TX
|
The qualifications of the technical personnel at each of these firms primarily responsible for overseeing the firm’s preparation of the Company’s reserves estimates included in this report are set forth below. These qualifications meet or exceed the Society of Petroleum Engineers’ standard requirements to be a professionally qualified Reserve Estimator and Auditor.
Cawley, Gillespie & Associates, Inc.
|
•
|
more than 25 years of practical experience in the estimation and evaluation of petroleum reserves;
|
|
•
|
a registered professional engineer in the state of Texas; and
|
|
•
|
Bachelor of Science Degree in Petroleum Engineering.
|
6
Ryder Scott Company, L.P.
|
•
|
more than 30 years of practical experience in the estimation and evaluation of petroleum reserves;
|
|
•
|
a registered professional engineer in the states of Alaska, Colorado, Texas and Wyoming; and
|
|
•
|
Bachelor of Science Degree in Petroleum Engineering and MBA in Finance;
|
Netherland, Sewell & Associates, Inc.
|
•
|
practicing consultant in petroleum engineering since 2013 and over 14 years of prior industry experience;
|
|
•
|
licensed professional engineers in the state of Texas; and
|
|
•
|
Bachelor of Science Degree in Chemical Engineering
|
Technologies
Under SEC rules, proved reserves are those quantities of oil, natural gas and NGLs, which, by analysis of geoscience and engineering data, can be estimated with reasonable certainty to be economically producible, based on prices used to estimate reserves, from a given date forward from known reservoirs, and under existing economic conditions, operating methods, and government regulations prior to the time at which contracts providing the right to operate expire, unless evidence indicates that renewal is reasonably certain. The term “reasonable certainty” implies a high degree of confidence that the quantities of oil, natural gas and/or NGLs actually recovered will equal or exceed the estimate. Reasonable certainty can be established using techniques that have been proved effective by actual production from projects in the same reservoir or an analogous reservoir or by other evidence using reliable technology that establishes reasonable certainty. Reliable technology is a grouping of one or more technologies (including computational methods) that have been field tested and have been demonstrated to provide reasonably certain results with consistency and repeatability in the formation being evaluated or in an analogous formation.
The area of a reservoir considered proved includes (i) the area identified by drilling and limited by fluid contacts, if any, and (ii) adjacent undrilled portions of the reservoir that can, with reasonable certainty, be judged to be continuous with it and to contain economically producible oil, natural gas or NGLs on the basis of available geoscience and engineering data. In the absence of data on fluid contacts, proved quantities in a reservoir are limited by the lowest known hydrocarbons as seen in a well penetration unless geoscience, engineering or performance data and reliable technology establish a lower contact with reasonable certainty.
Existing economic conditions include prices and costs at which economic producibility from a reservoir is to be determined. In determining the amount of proved reserves, the price used must be the average price during the 12-month period prior to the ending date of the period covered by the reserve report, determined as an unweighted arithmetic average of the first-day-of-the-month price for each month within such period, unless prices are defined by contractual arrangements, excluding escalations based upon future conditions. See further discussion of prices in “Risk Factors” included in Item 1A of this report.
The estimates of proved developed reserves included in the reserve report were prepared using decline curve analysis to determine the reserves of individual producing wells. After estimating the reserves of each proved developed well, it was determined that a reasonable level of certainty exists with respect to the reserves that can be expected from close offset undeveloped wells in the field.
Reporting of Natural Gas Liquids
NGLs are produced as a result of the processing of a portion of our natural gas production stream. At
December 31, 2017
, NGLs comprised approximately 19% of total proved reserves on a barrel equivalent basis and represented volumes to be produced from properties where we have contracts in place for the extraction and separate sale of NGLs. NGLs are products sold by the gallon. In reporting proved reserves and production of NGLs, we have included production and reserves in barrels based on a conversion of 42 gallons per barrel. The extraction of NGLs in the processing of natural gas reduces the volume of natural gas available for sale. All production information related to natural gas is reported net of the effect of any reduction in natural gas volumes resulting from the processing and extraction of NGLs.
7
Reserve Quantities, PV-10 and Standardized Measure
The following estimates of proved oil, natural gas and NGL reserves are based on reserve reports as of
December 31, 2017
,
2016
and
2015
, the substantial majority of which were prepared by independent petroleum engineers. The PV-10 values shown in the table below are not intended to represent the current market value of estimated proved reserves as of the dates shown. The reserve reports were based on the Company’s drilling schedule at the time year end reserve reports were prepared. Reserves for 2017 and 2016 include our proportionate share of the reserves attributable to the Royalty Trusts while 2015 includes 100% of the reserves attributable to the Royalty Trusts. Our year end 2017 PUD development plan established that 100% of our current proved undeveloped reserves will be developed by the end of 2022. See “Critical Accounting Policies and Estimates” in Item 7 of this report for further discussion of uncertainties inherent to the reserves estimates.
|
|
December 31,
|
||||||||||
|
|
2017
|
2016
|
2015
|
||||||||
|
Estimated Proved Reserves(1)
|
|||||||||||
|
Developed
|
|||||||||||
|
Oil (MMBbls)
|
25.9
|
|
25.9
|
|
48.6
|
|
|||||
|
NGL (MMBbls)
|
29.9
|
|
29.3
|
|
51.1
|
|
|||||
|
Natural gas (Bcf)
|
408.0
|
|
393.0
|
|
964.6
|
|
|||||
|
Total proved developed (MMBoe)
|
123.8
|
|
120.7
|
|
260.5
|
|
|||||
|
Undeveloped
|
|||||||||||
|
Oil (MMBbls)
|
35.9
|
|
27.0
|
|
29.3
|
|
|||||
|
NGL (MMBbls)
|
4.4
|
|
4.2
|
|
9.9
|
|
|||||
|
Natural gas (Bcf)
|
80.9
|
|
71.8
|
|
149.2
|
|
|||||
|
Total proved undeveloped (MMBoe)
|
53.8
|
|
43.2
|
|
64.1
|
|
|||||
|
Total Proved
|
|||||||||||
|
Oil (MMBbls)
|
61.8
|
|
52.9
|
|
77.9
|
|
|||||
|
NGL (MMBbls)
|
34.3
|
|
33.5
|
|
61.0
|
|
|||||
|
Natural gas (Bcf)
|
488.9
|
|
464.8
|
|
1,113.8
|
|
|||||
|
Total proved (MMBoe)(2)
|
177.6
|
|
163.9
|
|
324.6
|
|
|||||
|
Standardized Measure of Discounted Net Cash Flows (in millions)(2)(3)
|
$
|
749.3
|
|
$
|
438.4
|
|
$
|
1,315.0
|
|
||
|
PV-10 (in millions)(4)
|
$
|
749.3
|
|
$
|
438.4
|
|
$
|
1,314.6
|
|
||
|
(1)
|
Estimated proved reserves and the future net revenues, PV-10 and Standardized Measure were determined using a 12-month unweighted average of the first-day-of-the-month index price for each month of each year, and do not reflect actual prices at
December 31, 2017
or current prices. All prices are held constant throughout the lives of the properties. The index prices and the equivalent weighted average wellhead prices used in the Company’s reserve reports are shown in the table below.
|
|
|
Index prices (a)
|
Weighted average
wellhead prices (b)
|
|||||||||||||||||
|
|
Oil
(per Bbl) |
Natural gas
(per Mcf) |
Oil
(per Bbl)
|
NGL (per Bbl)
|
Natural gas
(per Mcf)
|
||||||||||||||
|
December 31, 2017
|
$
|
51.34
|
|
$
|
2.98
|
|
$
|
48.47
|
|
$
|
20.28
|
|
$
|
1.90
|
|
||||
|
December 31, 2016
|
$
|
42.75
|
|
$
|
2.48
|
|
$
|
38.59
|
|
$
|
10.99
|
|
$
|
1.56
|
|
||||
|
December 31, 2015
|
$
|
50.28
|
|
$
|
2.59
|
|
$
|
45.29
|
|
$
|
12.68
|
|
$
|
1.87
|
|
||||
|
(a)
|
Index prices are based on average West Texas Intermediate (“WTI”) Cushing spot prices for oil and average Henry Hub spot market prices for natural gas.
|
|
(b)
|
Average adjusted volume-weighted wellhead product prices reflect adjustments for transportation, quality, gravity, and regional price differentials.
|
8
|
(2)
|
Estimated total proved reserves and Standardized Measure attributable to noncontrolling interests for the year ended December 31, 2015 are shown in the table below.
|
|
|
Estimated Proved
Reserves
(MMBoe)
|
Standardized Measure
(In millions)
|
||||
|
12/31/2015
|
19.1
|
|
$
|
224.6
|
|
|
See “Note
22
—Supplemental Information on Oil and Natural Gas Producing Activities” to the consolidated financial statements in Item 8 of this report for additional information regarding reserve and Standardized Measure amounts attributable to noncontrolling interests.
|
(3)
|
Standardized Measure represents the present value of estimated future cash inflows from proved oil, natural gas and NGL reserves, less future development and production costs, and income tax expenses, discounted at 10% per annum to reflect timing of future cash flows and using the same pricing assumptions used to calculate PV-10. Standardized Measure differs from PV-10 as Standardized Measure includes the effect of future income taxes. At December 31, 2017 and 2016, the present value of future income tax discounted at 10% was insignificant due to an excess of tax basis in oil and natural gas properties over projected undiscounted future cash flows from our proved reserves.
|
|
(4)
|
PV-10 is a non-GAAP financial measure and represents the present value of estimated future cash inflows from proved oil, natural gas and NGL reserves, less future development and production costs, discounted at 10% per annum to reflect timing of future cash flows and using 12-month average prices for the years ended
December 31, 2017
,
2016
and
2015
. PV-10 differs from Standardized Measure because it does not include the effects of income taxes on future net revenues. Neither PV-10 nor Standardized Measure represents an estimate of fair market value of the Company’s oil and natural gas properties. PV-10 is used by the industry and by management as a reserve asset value measure to compare against past reserve bases and the reserve bases of other business entities. It is useful because its calculation is not dependent on the taxpaying status of the entity. The following table provides a reconciliation of our Standardized Measure to PV-10:
|
|
|
December 31,
|
||||||||||
|
|
2017
|
2016
|
2015
|
||||||||
|
|
(In millions)
|
||||||||||
|
Standardized Measure of Discounted Net Cash Flows
|
$
|
749.3
|
|
$
|
438.4
|
|
$
|
1,314.6
|
|
||
|
Present value of future income tax discounted at 10%
|
—
|
|
—
|
|
0.4
|
|
|||||
|
PV-10
|
$
|
749.3
|
|
$
|
438.4
|
|
$
|
1,315.0
|
|
||
Proved Reserves - Mid-Continent
. Proved reserves in the Mid-Continent, primarily the Mississippian formation, increased from 127.8 MMBoe at December 31, 2016 to 130.6 MMBoe at December 31, 2017. Net of production, reserves increased by 18.4 MMBoe primarily due to 8.4 MMBoe of extensions from successful drilling in our NW STACK play and 9.8 MMBoe from revisions of prior estimates primarily due to significantly higher commodity prices in 2017 and minor revisions due to well performance. These increases were partially offset by 1.9 MMBoe of asset sales.
Proved Reserves - North Park Basin.
Our North Park Basin Niobrara proved reserves were acquired in December 2015 and increased from 30.2 MMBoe at December 31, 2016 to 40.2 MMBoe at December 31, 2017, primarily due to reserve extensions from horizontal drilling. The acquisition of these reserves in 2015 provided an important proved reserve addition to our asset base. Niobrara proved developed reserves were booked based on 29 horizontal producing wells across the play. Reservoir characteristics of the Niobrara in the North Park Basin are similar to those of the Niobrara in the DJ Basin to the east of North Park, with the Niobrara consisting of multiple stratigraphic benches. In North Park Basin, production performance and reservoir data gathered from the producing wells confirm consistency in reservoir properties such as porosity, thickness and stratigraphic conformity. Using the performance of the proved developed producing wells, proved undeveloped reserves were booked across 35 sections of the proved development area at a density of up to eight wells per section, considering only estimated recovery from the two deepest stratigraphic benches. Delineation drilling to determine effective spacing for optimal reserve recovery is ongoing, although early results and well density in the DJ Basin Niobrara indicates the potential for booking more than eight wells per section.
Proved Reserves - Permian Basin.
In 2017, proved reserves, net of production, increased by 1.4 MMBoe, primarily from higher commodity prices.
9
Proved Undeveloped Reserves.
The following table summarizes activity associated with proved undeveloped reserves during the periods presented:
|
Year Ended December 31,
|
|||||||||||
|
2017
|
2016
|
2015
|
|||||||||
|
Reserves converted from proved undeveloped to proved developed (MMBoe)
|
1.1
|
|
6.8
|
|
15.8
|
|
|||||
|
Drilling capital expended to convert proved undeveloped reserves to proved developed reserves (in millions)
|
$
|
21.0
|
|
$
|
64.5
|
|
$
|
117.7
|
|
||
Total estimated proved undeveloped reserves as of December 31, 2017, were 53.8 MMBoe, an increase of 10.6 MMBoe from the prior year. PUD reserves added from extensions and discoveries totaled 14.7 MMBoe, which consisted of 10.1 MMBoe in North Park from horizontal wells drilled in the Niobrara Shale, and 4.6 MMBoe in the Mid-Continent from horizontal drilling in our NW STACK play. These extensions were offset by 1.1 MMBoe of PUD conversions, 0.1MMBoe of PUD reserves at December 31, 2016, and 1.1 MMBoe of PUD reserves booked and converted during the year 2017, and net downward revisions of 4.0 MMBoe primarily due to removing PUDs attributable to expiring Mid-Continent undeveloped acreage outside of our NW STACK play that was not scheduled to be developed prior to lease expiry.
Total estimated proved undeveloped reserves as of December 31, 2016 were 43.2 MMBoe, a decrease of 20.9 MMBoe from the prior year, due primarily to downward revisions due to lower prices. Reserves added from extensions and discoveries totaled 5.5 MMBoe, 3.2 MMBoe in the Mid-Continent as a result of horizontal drilling and 2.3 MMBoe in the North Park Basin from horizontal wells drilled in the Niobrara Shale. These extensions were offset by 5.2 MMBoe of proved undeveloped reserves at December 31, 2015 that were converted to proved developed reserves during 2016. Approximately 1.6 MMBoe of proved undeveloped reserves were booked and converted during the year 2016.
For the year ended December 31, 2015, we recognized a decrease in proved undeveloped reserves of 115 MMBoe, primarily due to negative revisions of approximately 147 MMBoe resulting from lower commodity prices. These negative revisions were partially offset by an addition to oil, natural gas and NGL reserves associated with proved undeveloped properties of 48 MMBoe for the year ended December 31, 2015. Reserves added from extensions and discoveries totaled 22 MMBoe, primarily from horizontal drilling in the Mississippian formation in the Mid-Continent, which includes 6 MMBoe of proved undeveloped reserves booked and converted during 2015. Acquisition of the North Park Basin assets, located in Jackson County, Colorado, in December 2015 added 26 MMBoe of proved undeveloped reserves. Approximately 10 MMBoe of proved undeveloped reserves at December 31, 2014 were converted to proved developed reserves during 2015.
For additional information regarding changes in proved reserves during each of the three years ended
December 31, 2017
,
2016
and
2015
see “Note
22
—Supplemental Information on Oil and Natural Gas Producing Activities” to the consolidated financial statements in Item 8 of this report.
10
Significant Fields
Oil, natural gas and NGL production for fields containing more than 15% of the Company’s total proved reserves at each year end are presented in the table below. The Mississippi Lime Horizontal field, contained more than 15% of the Company’s total proved reserves at
December 31, 2017
,
2016
and
2015
, and the Niobrara field contained more than 15% of the Company’s total proved reserves at
December 31, 2017
and
2016
.
|
|
Oil
(MBbls)
|
NGL (MBbls)
|
Natural Gas
(MMcf)
|
Total
(MBoe)
|
|||||||
|
Year Ended December 31, 2017
|
|||||||||||
|
Mississippi Lime Horizontal
|
2,382
|
|
2,995
|
|
38,834
|
|
11,849
|
|
|||
|
Niobrara
|
673
|
|
—
|
|
—
|
|
673
|
|
|||
|
Year Ended December 31, 2016
|
|||||||||||
|
Mississippi Lime Horizontal
|
5,029
|
|
4,357
|
|
56,894
|
|
18,868
|
|
|||
|
Niobrara
|
500
|
|
—
|
|
—
|
|
500
|
|
|||
|
Year Ended December 31, 2015
|
|||||||||||
|
Mississippi Lime Horizontal
|
8,041
|
|
4,785
|
|
77,542
|
|
25,750
|
|
|||
Mississippi Lime Horizontal Field.
The Mississippi Lime Horizontal Field is located on the Anadarko Shelf in northern Oklahoma and Kansas and produces from the Mississippian formation. The Company’s interests in the Mississippi Lime Horizontal Field as of
December 31, 2017
included 1,359 gross (830.1 net) producing wells and a 61% average working interest in the producing area.
Niobrara Field.
The Niobrara field is located in Colorado and produces from the Niobrara Shale. The Company’s interests in the Niobrara Field as of
December 31, 2017
, included 29 gross (29.0 net) producing wells and a 100% average working interest in the producing area.
Production and Price History
The following tables set forth information regarding our net oil, natural gas and NGL production and certain price and cost information for each of the periods indicated.
|
Successor
|
Predecessor
|
Predecessor
|
||||||||||||||
|
Year Ended December 31,
|
Period from October 2, 2016 through December 31,
|
Period from January 1, 2016 through October 1,
|
Year Ended December 31,
|
|||||||||||||
|
2017
|
2016
|
2016
|
2015
|
|||||||||||||
|
Production data (in thousands)
|
||||||||||||||||
|
Oil (MBbls)
|
4,157
|
|
1,214
|
|
4,315
|
|
9,600
|
|
||||||||
|
NGL (MBbls)
|
3,376
|
|
999
|
|
3,358
|
|
5,044
|
|
||||||||
|
Natural gas (MMcf)
|
44,237
|
|
12,771
|
|
44,124
|
|
92,105
|
|
||||||||
|
Total volumes (MBoe)
|
14,906
|
|
4,342
|
|
15,027
|
|
29,995
|
|
||||||||
|
Average daily total volumes (MBoe/d)
|
40.8
|
|
47.7
|
|
54.6
|
|
82.2
|
|
||||||||
|
Average prices—as reported(1)
|
||||||||||||||||
|
Oil (per Bbl)
|
$
|
48.72
|
|
$
|
47.03
|
|
$
|
36.85
|
|
$
|
45.83
|
|
||||
|
NGL (per Bbl)
|
$
|
18.16
|
|
$
|
14.77
|
|
$
|
12.67
|
|
$
|
14.36
|
|
||||
|
Natural gas (per Mcf)
|
$
|
2.09
|
|
$
|
2.07
|
|
$
|
1.78
|
|
$
|
2.12
|
|
||||
|
Total (per Boe)
|
$
|
23.90
|
|
$
|
22.64
|
|
$
|
18.63
|
|
$
|
23.59
|
|
||||
|
Expenses per Boe
|
||||||||||||||||
|
Total lease operating expenses(2)(3)
|
$
|
6.64
|
|
$
|
5.69
|
|
$
|
8.49
|
|
$
|
10.06
|
|
||||
__________________
|
(1)
|
Prices represent actual average prices for the periods presented and do not include effects of derivative transactions.
|
|
(2)
|
Excludes production and ad valorem taxes.
|
11
|
(3)
|
The year ended December 31,
2015
includes
$34.9 million
for amounts related to shortfalls in meeting annual CO
2
delivery obligations under a CO
2
treating agreement as described under “—2016 Divestiture and Release from Treating Agreement” above.
|
Productive Wells
The following table sets forth the number of productive wells in which the Company owned a working interest at
December 31, 2017
. We operate substantially all of our wells. Productive wells consist of producing wells and wells capable of producing, including oil wells awaiting connection to production facilities and natural gas wells awaiting pipeline connections to commence deliveries. Gross wells are the total number of producing wells in which the Company has a working interest and net wells are the sum of the fractional working interests owned in gross wells.
|
|
Oil
|
Natural Gas
|
Total
|
||||||||||||||
|
|
Gross
|
Net
|
Gross
|
Net
|
Gross
|
Net
|
|||||||||||
|
Area
|
|||||||||||||||||
|
Mid-Continent
|
1,536
|
|
916.2
|
|
238
|
|
105.1
|
|
1,774
|
|
1,021.3
|
|
|||||
|
North Park Basin
|
29
|
|
29.0
|
|
—
|
|
—
|
|
29
|
|
29.0
|
|
|||||
|
Permian Basin
|
1,066
|
|
1,046.5
|
|
—
|
|
—
|
|
1,066
|
|
1,046.5
|
|
|||||
|
Total
|
2,631
|
|
1,991.7
|
|
238
|
|
105.1
|
|
2,869
|
|
2,096.8
|
|
|||||
Drilling Activity
The following table sets forth information with respect to wells completed during the periods indicated. The information presented is not necessarily indicative of future performance, and should not be interpreted to present any correlation between the number of productive wells drilled and quantities or economic value of reserves found. Productive wells are those that produce commercial quantities of hydrocarbons, regardless of whether they produce a reasonable rate of return. Gross wells refer to the total number of wells in which the Company had a working interest and net wells are the sum of fractional working interests owned in gross wells. As of
December 31, 2017
, we had 6 gross (4.9 net) operated wells drilling, completing or awaiting completion.
|
|
2017
|
2016
|
2015
|
||||||||||||||||||||||||||||||||
|
|
Gross
|
Percent
|
Net
|
Percent
|
Gross
|
Percent
|
Net
|
Percent
|
Gross
|
Percent
|
Net
|
Percent
|
|||||||||||||||||||||||
|
Completed Wells
|
|||||||||||||||||||||||||||||||||||
|
Development
|
|||||||||||||||||||||||||||||||||||
|
Productive
|
22
|
|
100.0
|
%
|
16.4
|
|
100.0
|
%
|
32
|
|
100.0
|
%
|
27.0
|
|
100.0
|
%
|
167
|
|
100.0
|
%
|
117.0
|
|
100.0
|
%
|
|||||||||||
|
Dry
|
—
|
|
—
|
%
|
—
|
|
—
|
%
|
—
|
|
—
|
%
|
—
|
|
—
|
%
|
—
|
|
—
|
%
|
—
|
|
—
|
%
|
|||||||||||
|
Total
|
22
|
|
100.0
|
%
|
16.4
|
|
100.0
|
%
|
32
|
|
100.0
|
%
|
27.0
|
|
100.0
|
%
|
167
|
|
100.0
|
%
|
117.0
|
|
100.0
|
%
|
|||||||||||
|
Exploratory
|
|||||||||||||||||||||||||||||||||||
|
Productive
|
1
|
|
100.0
|
%
|
1.0
|
|
100.0
|
%
|
—
|
|
—
|
%
|
—
|
|
—
|
%
|
9
|
|
100.0
|
%
|
7.0
|
|
100.0
|
%
|
|||||||||||
|
Dry
|
—
|
|
—
|
%
|
—
|
|
—
|
%
|
—
|
|
—
|
%
|
—
|
|
—
|
%
|
—
|
|
—
|
%
|
—
|
|
—
|
%
|
|||||||||||
|
Total
|
1
|
|
100.0
|
%
|
1.0
|
|
100.0
|
%
|
—
|
|
—
|
%
|
—
|
|
—
|
%
|
9
|
|
100.0
|
%
|
7.0
|
|
100.0
|
%
|
|||||||||||
|
Total
|
|||||||||||||||||||||||||||||||||||
|
Productive
|
23
|
|
100.0
|
%
|
17.4
|
|
100.0
|
%
|
32
|
|
100.0
|
%
|
27.0
|
|
100.0
|
%
|
176
|
|
100.0
|
%
|
124.0
|
|
100.0
|
%
|
|||||||||||
|
Dry
|
—
|
|
—
|
%
|
—
|
|
—
|
%
|
—
|
|
—
|
%
|
—
|
|
—
|
%
|
—
|
|
—
|
%
|
—
|
|
—
|
%
|
|||||||||||
|
Total
|
23
|
|
100.0
|
%
|
17.4
|
|
100.0
|
%
|
32
|
|
100.0
|
%
|
27.0
|
|
100.0
|
%
|
176
|
|
100.0
|
%
|
124.0
|
|
100.0
|
%
|
|||||||||||
The Company had two third-party rigs operating on its Mid-Continent acreage, and two rigs operating on its North Park Basin acreage as of
December 31, 2017
.
12
Developed and Undeveloped Acreage
The following table sets forth information regarding the Company’s developed and undeveloped acreage at
December 31, 2017
:
|
|
Developed Acreage
|
Undeveloped Acreage
|
|||||||||
|
|
Gross
|
Net
|
Gross
|
Net
|
|||||||
|
Area
|
|||||||||||
|
Mid-Continent
|
597,173
|
|
390,650
|
|
177,657
|
|
106,814
|
|
|||
|
North Park Basin
|
13,828
|
|
13,874
|
|
114,663
|
|
107,838
|
|
|||
|
Permian Basin
|
17,743
|
|
14,755
|
|
10,226
|
|
8,817
|
|
|||
|
Total
|
628,744
|
|
419,279
|
|
302,546
|
|
223,469
|
|
|||
Many of the leases comprising the undeveloped acreage set forth in the table above will expire at the end of their respective primary terms unless we exercise our contractual rights to pay delay rentals to extend the terms of leases we value or production from the leasehold acreage is established prior to such date, in which event the lease will remain in effect until production has ceased. As of
December 31, 2017
, the gross and net acres subject to leases in the undeveloped acreage summarized in the above table are set to expire as follows:
|
|
Acres Expiring
|
||||
|
|
Gross
|
Net
|
|||
|
Twelve Months Ending
|
|||||
|
December 31, 2018
|
53,891
|
|
36,804
|
|
|
|
December 31, 2019
|
42,698
|
|
31,402
|
|
|
|
December 31, 2020
|
27,324
|
|
18,811
|
|
|
|
December 31, 2021 and later
|
2,550
|
|
1,023
|
|
|
|
Lease in Suspense(1)
|
30,932
|
|
30,932
|
|
|
|
Other(2)
|
145,151
|
|
104,497
|
|
|
|
Total
|
302,546
|
|
223,469
|
|
|
|
(1)
|
Pending paying well determination.
|
|
(2)
|
Leases remaining in effect until development efforts or production on the developed portion of the particular lease has ceased.
|
The acreage due to expire during the twelve months ending December 31, 2018, includes approximately 49,662 gross (33,707 net) acres in the Mid-Continent area and 4,229 gross (3,097 net) acres in the North Park Basin area.
Marketing and Customers
We sell our oil, natural gas and NGLs to a variety of customers, including utilities, oil and natural gas companies and trading and energy marketing companies. We had two customers that individually accounted for more than 10% of our total revenue during the
2017
period. See “Note
3
—Summary of Significant Accounting Policies” to the consolidated financial statements in Item 8 of this report for additional information on our major customers. The number of readily available purchasers for our production makes it unlikely that the loss of a single customer in the areas in which we sell our production would materially affect our sales. We do not have any material commitments to deliver fixed and determinable quantities of oil and natural gas in the future under existing sales contracts or sales agreements.
Title to Properties
As is customary in the oil and natural gas industry, we conduct an initial preliminary review of the title to our properties. Prior to commencing drilling operations on those properties, we conduct a thorough title examination and perform curative work with respect to significant defects. We are typically responsible for curing any title defects at our expense. In addition, prior to completing an acquisition of producing oil and natural gas leases, we perform title reviews on the most significant leases and depending on the materiality of properties, may obtain a drilling title opinion or review previously obtained title opinions. To date, we have obtained drilling title opinions on substantially all of our producing properties and believe that we have good and defensible title to our producing properties. Our oil and natural gas properties are subject to
13
customary royalty and other interests, liens for current taxes and other burdens, which we believe does not materially interfere with the use of, or affect the carrying value of the properties.
COMPETITION
The Company competes with major oil and natural gas companies and independent oil and natural gas companies for leases, equipment, personnel and markets for the sale of oil, natural gas and NGLs. The Company believes that its leasehold acreage position, geographic concentration of operations and technical and operational capabilities enable it to compete effectively with other exploration and production operations. However, the oil and natural gas industry is intensely competitive. See “Item 1A. Risk Factors” for additional discussion of competition in the oil and natural gas industry.
Oil, natural gas and NGLs compete with other forms of energy available to customers, including alternate forms of energy such as electricity, coal and fuel oils. Changes in the availability or price of oil, natural gas and NGLs or other forms of energy, as well as business conditions, conservation, legislation, regulations and the ability to convert to alternate fuels and other forms of energy may affect the demand for oil, natural gas and NGLs.
SEASONAL NATURE OF BUSINESS
Generally, demand for natural gas decreases during the summer months and increases during the winter months and demand for oil peaks during the summer months. Certain natural gas users utilize natural gas storage facilities and purchase some of their anticipated winter requirements during the summer, which can lessen seasonal demand fluctuations. Seasonal weather conditions and lease stipulations can limit our drilling and producing activities and other oil and natural gas operations in a portion of our operating areas. These seasonal anomalies can pose challenges for meeting our well drilling objectives, can delay the installation of production facilities, and can increase competition for equipment, supplies and personnel during certain times of the year, which could lead to shortages and increase costs or delay operations.
ENVIRONMENTAL REGULATIONS
General
Our oil and natural gas exploration, development and production operations are subject to stringent and complex federal, state, tribal, regional and local laws and regulations governing worker safety and health, the discharge and disposal of substances into the environment, and the protection of the environment and natural resources. Numerous governmental entities, including the U.S. Environmental Protection Agency (“EPA”) and analogous state and local agencies, (and, under certain laws, private individuals) have the power to enforce compliance with these laws and regulations and any permits issued under them. These laws and regulations may, among other things: (i) require permits to conduct exploration, drilling, water withdrawal, wastewater disposal and other production related activities; (ii) govern the types, quantities and concentrations of substances that may be disposed or released into the environment or injected into formations in connection with drilling or production activities, and the manner of any such disposal, release, or injection; (iii) limit or prohibit construction or drilling activities or require formal mitigation measures in sensitive areas such as wetlands, wilderness areas or areas inhabited by endangered or threatened species; (iv) require investigatory and remedial actions to mitigate pollution conditions arising from the Company’s operations or attributable to former operations; (v) impose safety and health restrictions designed to protect employees from exposure to hazardous or dangerous substances; and (vi) impose obligations to reclaim and abandon well sites and pits. Failure to comply with these laws and regulations may result in the assessment of sanctions, including administrative, civil and criminal penalties, the imposition of investigatory, remedial or corrective action obligations, the occurrence of delays or restrictions in permitting or performance of projects and the issuance of orders enjoining operations in affected areas.
The trend in environmental regulation has been to place more restrictions and limitations on activities that may affect the environment. Any changes in or more stringent enforcement of these laws and regulations that result in delays or restrictions in permitting or development of projects or more stringent or costly construction, drilling, water management or completion activities or waste handling, storage, transport, remediation, or disposal emission or discharge requirements could have a material adverse effect on the Company. We may be unable to pass on increased compliance costs to our customers. Moreover, accidental releases, including spills, may occur in the course of our operations, and there can be no assurance that we will not incur significant costs and liabilities as a result of such releases or spills, including any third-party claims for damage to property and natural resources or personal injury. While we do not believe that compliance with existing environmental laws and regulations and that continued compliance with existing requirements will have an adverse material effect on us, we can
14
provide no assurance that we will not incur substantial costs in the future related to revised or additional environmental regulations that could have a material adverse effect on our business, financial condition, and results of operations.
The following is a summary of the more significant existing and proposed environmental and occupational safety and health laws and regulations, as amended from time to time, to which our business operations are subject and for which compliance may have a material adverse impact on the Company.
Hazardous Substances and Wastes
We currently own, lease, or operate, and in the past have owned, leased, or operated, properties that have been used in the exploration and production of oil and natural gas. We believe we have utilized operating and disposal practices that were standard in the industry at the applicable time, but hazardous substances, hydrocarbons, and wastes may have been disposed or released on, from or under the properties owned, leased, or operated by the Company or on or under other locations where these substances and wastes have been taken for treatment or disposal. In addition, certain of these properties have been operated by third parties whose storage treatment and disposal or release of hazardous substances, hydrocarbons, and wastes were not under our control. These properties and the substances or wastes disposed or released on them may be subject to the Comprehensive Environmental Response, Compensation, and Liability Act, as amended (“CERCLA”), the federal Resource Conservation and Recovery Act, (“RCRA”), and analogous state laws. Under these laws, we could be required to remove or remediate previously disposed substances or wastes (including substances or wastes disposed of or released by prior owners or operators), to investigate and clean up contaminated property, to perform remedial actions to prevent future contamination, or to pay some or all of the costs of any such action.
CERCLA, also known as the Superfund law, and comparable state laws may impose strict, joint and several liability without regard to fault or legality of conduct on certain classes of persons who are considered to be responsible for the release of a “hazardous substance” into the environment. These persons include current and prior owners or operators of the site where the release of a hazardous substance occurred as well as entities that disposed or arranged for the disposal of the hazardous substances released at the site. Under CERCLA, these “responsible persons” may be liable for the costs of cleaning up sites where the hazardous substances have been released into the environment, for damages to natural resources resulting from the release and for the costs of certain environmental and health studies. Additionally, landowners and other third parties may file claims for personal injury and natural resource and property damage allegedly caused by the release of hazardous substances into the environment. CERCLA also authorizes the EPA and, in some instances, third parties to act in response to threats to the public health or the environment from a hazardous substance release and to pursue steps to recover costs incurred for those actions from responsible parties. Despite the so-called “petroleum exclusion,” certain products used in the course of our operations may be regulated as CERCLA hazardous substances. To date, no Company-owned or operated site has been designated as a Superfund site, and we have not been identified as a responsible party for any Superfund site.
We also generate wastes that are subject to the requirements of RCRA and comparable state statutes. RCRA imposes strict “cradle-to-grave” requirements on the generation, transportation, treatment, storage, disposal and cleanup of hazardous and non-hazardous wastes. Drilling fluids, produced waters and other wastes associated with the exploration, production and/or development of oil and natural gas, including naturally-occurring radioactive material, if properly handled, are currently excluded from regulation as hazardous wastes under RCRA and, instead, are regulated under RCRA’s less stringent non-hazardous waste requirements. However, it is possible that these wastes could be classified as hazardous wastes in the future. For example, in December 2016, the EPA and environmental groups entered into a consent decree to address EPA’s alleged failure to timely assess its RCRA Subtitle D criteria regulations exempting certain exploration and production related oil and natural gas wastes from regulation as hazardous wastes under RCRA. The consent decree requires EPA to propose a rulemaking no later than March 15, 2019 for revision of certain Subtitle D criteria regulations pertaining to oil and natural gas wastes or to sign a determination that revision of the regulations is not necessary, and complete any revisions to the applicable RCRA regulations no later than July 15, 2021. Any change in the exclusion for such wastes could potentially result in an increase in costs to manage and dispose of wastes which could have a material adverse effect on our results of operations and financial position. In addition, in the course of our operations, we generate petroleum hydrocarbon wastes and ordinary industrial wastes that are subject to regulation under the RCRA if they have hazardous characteristics.
Air Emissions
The federal Clean Air Act (the “CAA”), as amended, and comparable state laws and regulations restrict the emission of air pollutants through emissions standards, construction and operating permitting programs and the imposition of other compliance requirements. These laws and regulations may require us to obtain pre-approval for the construction or modification of certain projects or facilities expected to produce or significantly increase air emissions, obtain and strictly comply with air
15
permit requirements or utilize specific equipment or technologies to control emissions. The need to acquire such permits has the potential to delay or limit the development of our oil and natural gas projects. Over the next several years, we may be required to incur certain capital expenditures for air pollution control equipment or other air emissions-related issues. For example, in October 2015, the EPA issued a final rule under the CAA, lowering the National Ambient Air Quality Standard for ground-level ozone to 70 parts per billion under both the primary and secondary standards to provide requisite protection of public health and welfare. The EPA was required to make attainment and non-attainment designations for specific geographic locations under the revised standards by October 1, 2017, but missed the deadline. Subsequently, in November 2017, the EPA published a list of areas that are in compliance with the new ozone standards and separately in December 2017 issued responses to state recommendation for designating non-attainment areas. States have the opportunity to submit new air quality monitoring to EPA prior to EPA finalizing any non-attainment designations. While the EPA has preliminarily determined that all counties in which we operate are in attainment with the new ozone standard, these determinations may be revised in the future. With the EPA lowering the ground-level ozone standard, certain states may be required to implement more stringent regulations, which could apply to our operations and result in the need to install new emissions controls, longer permitting timelines and significant increases in our capital or operating expenditures. In addition, in June 2016, the EPA finalized rules regarding criteria for aggregating multiple small surface sites into a single source for air-quality permitting purposes applicable to the oil and natural gas industry. This rule could cause small facilities, on an aggregate basis, to be deemed a major source, thereby triggering more stringent air permitting requirements. Compliance with these and other air pollution control and permitting requirements has the potential to delay the development of oil and natural gas projects and increase our costs of development and production, which costs could be significant.
Water Discharges
The federal Water Pollution Control Act, also known as the Clean Water Act (the “CWA”), and analogous state laws and implementing regulations, impose restrictions and strict controls regarding the discharge of pollutants into waters of the United States. Pursuant to these laws and regulations, the discharge of pollutants into regulated waters is prohibited unless it is permitted by the EPA, the Army Corps of Engineers (“Corps”) or an analogous state or tribal agency. We do not presently discharge pollutants associated with the exploration, development and production of oil and natural gas into federal or state waters. The CWA and analogous state laws and regulations also impose restrictions and controls regarding the discharge of sediment via storm water run-off from a wide variety of construction activities. Such activities are generally prohibited from discharging sediment unless permitted by the EPA or an analogous state agency. The EPA issued a final rule in September 2015 that attempts to clarify the federal jurisdictional reach over waters of the United States. The 2015 rule was previously stayed nationwide to determine whether federal district or appellate courts had jurisdiction to hear cases in the matter. The EPA and Corps proposed a rulemaking in June 2017 to repeal the June 2015 rule and also announced their intent to issue a new rule defining the CWA’s jurisdiction. Recently, in January 2018, the U.S. Supreme Court issued a decision finding that jurisdiction to hear challenges to the 2015 Rule resides with the federal district courts; consequently, the previously-filed district court cases will be allowed to proceed. Following the Supreme Court’s decision, the EPA and Corps issued a final rule in January 2018 staying implementation of the 2015 rule for two years. As a result of these recent developments, future implementation of the June 2015 rule is uncertain. To the extent this rule or a revised rule expands the scope of the CWA’s jurisdiction, we could face increased costs and delays with respect to obtaining permits for dredge and fill activities in wetland areas in connection with any expansion activities. Also, in June 2016, the EPA issued a final rule implementing wastewater pretreatment standards that prohibit onshore unconventional oil and natural gas extraction facilities from sending wastewater to publicly-owned treatment works. This restriction of disposal options for hydraulic fracturing waste and other changes to CWA requirements may result in increased costs.
Finally, the Oil Pollution Act of 1990 (“OPA”), which amends the CWA, establishes standards for prevention, containment and cleanup of oil spills into waters of the United States. The OPA requires measures to be taken to prevent the accidental discharge of oil into waters of the United States from onshore production facilities. Measures under the OPA and/or the CWA include inspection and maintenance programs to minimize spills from oil storage and conveyance systems; the use of secondary containment systems to prevent spills from reaching nearby water bodies; proof of financial responsibility to cover environmental cleanup and restoration costs that could be incurred in connection with an oil spill; and the development and implementation of spill prevention, control and countermeasure (“SPCC”) plans to prevent and respond to oil spills. The OPA also subjects owners and operators of facilities to strict, joint and several liability for all containment and cleanup costs and certain other damages arising from a spill. We have developed and implemented SPCC plans for properties as required under the CWA.
16
Subsurface Injections
Underground injection operations performed by us are subject to the Safe Drinking Water Act (“SDWA”), as well as analogous state laws and regulations. Under the SDWA, the EPA established the Underground Injection Control (“UIC”) program, which established the minimum program requirements for state and local programs regulating underground injection activities. The UIC program includes requirements for permitting, testing, monitoring, record keeping and reporting of injection well activities, as well as a prohibition against the migration of fluid containing any contaminant into underground sources of drinking water. State regulations require a permit from the applicable regulatory agencies to operate underground injection wells. Although the Company monitors the injection process of its wells, any leakage from the subsurface portions of the injection wells could cause degradation of fresh groundwater resources, potentially resulting in suspension of our UIC permit, issuance of fines and penalties from governmental agencies, incurrence of expenditures for remediation of the affected resource and imposition of liability by third-parties claiming damages for alternative water supplies, property damages and personal injuries. Additionally, some states have considered laws mandating the recycling of flowback and produced water. If such laws are adopted in areas where we conduct operations, our operating costs may increase significantly.
Furthermore, in response to recent seismic events near underground disposal wells used for the disposal by injection of produced water resulting from oil and natural gas activities, federal and some state agencies are investigating whether such wells have caused increased seismic activity, and some states have restricted, suspended or shut down the use of such disposal wells. For example, in Oklahoma, the Oklahoma Corporation Commission (“OCC”) has implemented a variety of measures including adopting the National Academy of Science’s “traffic light system,” pursuant to which the agency reviews new disposal well applications for proximity to faults, seismicity in the area and other factors in determining whether such wells should be permitted, permitted only with special restrictions, or not permitted. The OCC also evaluates existing wells to assess their continued operation, or operation with restrictions, based on location relative to such faults, seismicity and other factors, with certain of such existing wells required to make frequent, or even daily, volume and pressure reports. In addition, the OCC has rules requiring operators of certain saltwater disposal wells in the state to, among other things, conduct mechanical integrity testing or make certain demonstrations of such wells’ depth that, depending on the depth, could require the plugging back of such wells and/or the reduction of volumes disposed in such wells. As a result of these measures, the OCC from time to time has developed and implemented plans calling for wells within areas of interest where seismic incidents have occurred to restrict or suspend disposal well operations in an attempt to mitigate the occurrence of such incidents. For example, on February 16, 2016, the OCC issued a plan to reduce disposal well volume in the Arbuckle formation by 40 percent, covering approximately 5,281 square miles and 245 disposal wells injecting wastewater into the Arbuckle formation. In the plan, the OCC identified 76 SandRidge operated disposals wells, prescribed a four stage volume reduction schedule and set April 30, 2016 as the final date for compliance with the tiered volume reduction plan. On March 7, 2016, the OCC reduced the injection volume of additional Arbuckle disposal wells, including wells we operate. Following earthquakes in August, September and November 2016, the OCC and EPA further limited the disposal volumes that can be disposed in Arbuckle wells, although these recent actions did not cover our disposal wells. While induced seismic events generally decreased in 2017, the OCC expanded restrictions on the use of existing Arbuckle disposal wells and imposed new reporting requirements related to disposal volumes on wells injecting produced water into the Arbuckle formation.
Additionally, the Governor of Kansas has established a task force composed of various administrative agencies to study and develop an action plan for addressing seismic activity in the state. The task force issued a recommended Seismic Action Plan calling for enhanced seismic monitoring and the development of a seismic response plan, and in November 2014, the Governor of Kansas announced a plan to enhance seismic monitoring in the state. In March 2015, the Kansas Corporation Commission issued its Order Reducing Saltwater Injection Rates. The Order identified five areas of heightened seismic concern in Harper and Sumner Counties and created a timeframe over which the maximum of 8,000 barrels of saltwater injection daily into each well. SandRidge and other operators of injection wells were required to reduce the injection volume, and any injection well drilled deeper than the Arbuckle Formation was required to be plugged back to a shallower formation in a manner approved by the Kansas Corporation Commission. In August 2016, the Kansas Corporation Commission issued an order that put a 16,000 barrels per day limit on additional Arbuckle disposal wells not previously identified in the order released in March 2015. While no additional regulatory actions were taken in Kansas with respect to induced seismicity concerns in 2017, permit applications for new saltwater disposal well facilities have faced increased local opposition.
Evaluation of seismic incidents and whether or to what extent those events are induced by the injection of saltwater into disposal wells continues to evolve, as governmental authorities consider new and/or past seismic incidents in areas where salt water disposal activities occur or are proposed to be performed. The adoption of any new laws, regulations, or directives that restrict our ability to dispose of saltwater generated by production and development activities , whether by plugging back the depths of disposal wells, reducing the volume of salt water disposed in such wells, restricting disposal well locations or otherwise, or by requiring us to shut down disposal wells, could significantly increase our costs to manage and dispose of
17
this saltwater, which could negatively affect the economic lives of the affected properties. In addition, we could find ourselves subject to third party lawsuits alleging damages resulting from seismic events that occur in our areas of operation.
Climate Change
The EPA has published its findings that emissions of carbon dioxide (“CO
2
”), methane and certain other “greenhouse gases” (“GHGs”) present an endangerment to public health and the environment because emissions of such gases are, according to the EPA, contributing to warming of the earth’s atmosphere and other climatic changes. Based on its findings, the EPA has adopted and implemented regulations under existing provisions of the CAA that, among other things, establish Prevention of Significant Deterioration (“PSD”) construction and Title V operating permit reviews for GHG emissions from certain large stationary sources that already are potential major sources of certain principal, or criteria, pollutant emission. Facilities required to obtain PSD permits for their GHG emissions also will be required to meet “best available control technology” standards that typically are established by the states. This rule could adversely affect our operations and restrict or delay its ability to obtain air permits for new or modified facilities that exceed GHG emission thresholds. In addition, the EPA has adopted rules requiring the reporting of GHG emissions from oil and natural gas production and processing facilities on an annual basis, as well as reporting GHG emissions from gathering and boosting systems, oil well completions and workovers using hydraulic fracturing. More recently, in June 2016, the EPA finalized rules to reduce methane emissions from new, modified or reconstructed sources in the oil and natural gas sector, including implementation of a leak detection and repair (“LDAR”) program to minimize methane emissions, under the CAA’s New Source Performance Standards, Subpart OOOOa (“Quad Oa”). However, over the past year the EPA has taken several steps to delay implementation of the Quad Oa standards, and the agency proposed a rulemaking in June 2017 to stay the requirements for a period of two years and revisit implementation of Quad Oa in its entirety. The EPA has not yet published a final rule but, as a result of these developments, future implementation of the 2016 standards is uncertain at this time. In addition, in November 2016, the U.S. Department of the Interior Bureau of Land Management (“BLM”) issued final rules to reduce methane emissions from venting, flaring, and leaks during oil and natural gas operations on public lands that are substantially similar to the EPA Quad Oa requirements. However, on December 8, 2017, the BLM published a final rule to temporarily suspend or delay certain requirements contained in the November 2016 final rule until January 17, 2019, including those requirements relating to venting, flaring and leakage from oil and gas production activities. While, as a result of these developments, future implementation of the EPA and BLM methane rules is uncertain, given the long-term trend towards increasing regulation, future federal GHG regulations of the oil and gas industry remain a possibility. Moreover, several states, including Colorado, where we operate, have already adopted rules requiring operators of both new and existing sources to develop and implement LDAR program and install devices on certain equipment to capture 95 percent of methane emissions. Compliance with these rules could require us to purchase pollution control equipment, optical gas imaging equipment for LDAR inspections, and to hire additional personnel to assist with inspection and reporting requirements.
In addition, there are a number of state and regional efforts that are aimed at tracking and/or reducing GHG emissions by means of cap and trade programs that typically require major sources of GHG emissions to acquire and surrender emission allowances in return for emitting those GHGs. On an international level, the United States is one of almost 200 nations that agreed in December 2015 to an international climate change agreement in Paris, France that calls for countries to set their own GHG emissions targets and be transparent about the measure each country will use to achieve its GHG emissions targets, (the “Paris Agreement”). However, the Paris Agreement does not impose any binding obligations on the United States. Moreover, in June 2017, President Trump stated that the United States would withdraw from the Paris Agreement, but may enter into a future international agreement related to GHGs. In August 2017, the U.S. State Department officially informed the United Nations of the intent of the United States to withdraw from the Paris Agreement. The United States’ adherence to the exit process is uncertain and/or the terms on which the United States may reenter the Paris Agreement or a separately negotiated agreement are unclear at this time. The adoption and implementation of any laws or regulations imposing reporting obligations on, or limiting emissions of GHG from, our equipment and operations could require us to incur additional costs to reduce emissions of GHGs associated with its operations or could adversely affect demand for the oil and natural gas we produce, and thus possibly have a material adverse effect on our revenues, as well as having the potential effect of lowering the value of our reserves. Recently, activists concerned about the potential effects of climate change have directed their attention at sources of funding for fossil-fuel energy companies, which has resulted in certain financial institutions, funds and other sources of capital restricting or eliminating their investment in oil and natural gas activities. Ultimately, this could make it more difficult to secure funding for exploration and production activities. Notwithstanding potential risks related to climate change, the International Energy Agency estimates that global energy demand will continue to rise and will not peak until after 2040 and that oil and gas will continue to represent a substantial percentage of global energy use over that time. Finally, to the extent increasing concentrations of GHGs in the Earth’s atmosphere may produce climate changes that have significant physical effects, such as increased frequency and severity of storms, droughts, floods and other climatic events, such events could have a material adverse effect on the Company and potentially subject the Company to further regulation.
18
Endangered or Threatened Species
The federal Endangered Species Act (the “ESA”) restricts activities that may affect endangered or threatened species or their habitats without first obtaining an incidental take permit and implementing mitigation measures. Similar protections are offered to migratory birds under the federal Migratory Bird Treaty Act. While compliance with the ESA has not had an adverse effect on our exploration, development and production operations in areas where threatened or endangered species or their habitat are known to exist, it may require us to incur increased costs to implement mitigation or protective measures and also may delay, restrict or preclude drilling activities in those areas or during certain seasons, such as breeding and nesting seasons. In addition, certain of our federal and state leases may contain stipulations that require us to take measures to safeguard certain species, including the sage grouse, and their habitats known to be located within the area of the lease. Although the U.S. Fish and Wildlife Service (“USFWS”) declined to list the sage grouse under the ESA in 2015 and subsequently developed a conservation plan to protect existing habit, some environmental groups have continued to raise concerns about sufficient protections for the sage grouse population. In addition, the U.S. Department of Interior (“DOI”) announced in August 2017 that it would revise the existing sage grouse conservation plan that, amongst other things, shifts the focus of protective measures away from potential habitat areas to specific target populations of the sage grouse. Several environmental groups have already announced opposition to DOI’s proposed revisions to sage grouse conservation plan, and it is possible that these groups could pursue new litigation in the future to reconsider listing the sage grouse under the ESA. If endangered or otherwise protected species are located in areas where we wish to conduct seismic surveys, development activities or abandonment operations, the work could be prohibited or delayed or expensive mitigation may be required. On February 11, 2016, the U.S. Fish and Wildlife Service published a final policy which alters how it identifies critical habitats for endangered and threatened species. A critical habitat designation could result in further material restrictions to federal and private land use and could delay or prohibit land access or development. Moreover, as a result of a settlement approved by the U.S. District Court for the District of Columbia in 2011, the USFWS was required to consider listing numerous species as endangered under the ESA by the end of the agency’s 2017 fiscal year. The agency has not yet completed this process. For example, we operate in several areas in proximity to sage grouse habitat and we are prohibited from performing operations in those areas during certain hours from March to mid-July of each year.
The designation of previously unprotected species in areas where we operate as threatened or endangered could cause us to incur increased costs arising from species protection measures or could result in limitations on our exploration and production activities that could have an adverse impact on our ability to develop and produce our reserves.
We are an active participant on various agency and industry committees that are developing or addressing various USFWS and other federal and state agency programs to minimize potential impacts to business activity relating to the protection of any endangered or threatened species.
Employee Health and Safety
Our operations are subject to a number of federal and state laws and regulations, including the federal Occupational Safety and Health Act (“OSHA”), and comparable state statutes, whose purpose is to protect the health and safety of workers. In addition, the OSHA Hazard Communication Standard requires that information be maintained concerning hazardous materials used or produced in our operations and that this information be provided to employees. Pursuant to the Federal Emergency Planning and Community Right-to-Know Act, facilities that store threshold amounts of chemicals that are subject to OSHA’s Hazard Communication Standard above certain threshold quantities must submit information regarding those chemicals by March 1 of each year to state and local authorities in order to facilitate emergency planning and response. That information is generally available to employees, state and local governmental authorities, and the public. We do not believe that compliance with applicable laws and regulations relating to worker health and safety will have a material adverse effect on our business and results of operations.
State Regulation
The states in which we operate, along with some municipalities and Native American tribal areas, regulate some or all of the following activities: the drilling for, and the production and gathering of, oil and natural gas, including requirements relating to drilling permits, the location, spacing and density of wells, unitization and pooling of interests, the method of drilling, casing and equipping of wells, the protection of fresh water sources, the orderly development of common sources of supply of oil and natural gas, the operation of wells, allowable rates of production, the use of fresh water in oil and natural gas operations, saltwater injection and disposal operations, the plugging and abandonment of wells and the restoration of surface properties, the prevention of waste of oil and natural gas resources, the protection of the correlative rights of oil and natural gas owners and, where necessary to avoid unfair, unjust or discriminatory service, the fees, terms and conditions for
19
the gathering of natural gas. These regulations may affect the number and location of our wells and the amounts of oil and natural gas that may be produced from our wells, and increase the costs of our operations. Moreover, obtaining or renewing permits and other approvals for operating on Native American lands can take substantial amounts of time, and could result in increased costs or delays to our operations.
Hydraulic Fracturing
Hydraulic fracturing is a practice in the oil and natural gas industry used to stimulate production of natural gas and/or oil from low permeability subsurface rock formations. Oil and natural gas may be recovered from certain of our oil and natural gas properties through the use of hydraulic fracturing, combined with sophisticated drilling. Hydraulic fracturing, which involves the injection of water, sand and chemicals under pressure into formations to fracture the surrounding rock and stimulate production, is typically regulated by state oil and natural gas commissions. However, several federal agencies have asserted federal regulatory authority over certain aspects of the hydraulic fracturing process. For example, the EPA published permitting guidance in February 2014 addressing the use of diesel fuel in fracturing operations; issued CAA final regulations in 2012 and additional CAA regulations in June 2016 governing performance standards for the oil and natural gas industry; and in June 2016 issued final effluent limitations guidelines under the CWA that waste water from shale natural gas extraction operations must meet before discharging to a publicly-owned treatment plant. The EPA also issued an Advance Notice of Proposed Rulemaking under the Toxic Substances Control Act (“TSCA”) in 2014 regarding reporting of the chemical substances and mixtures used in hydraulic fracturing but, to date, has taken no further action. Separately, the BLM published a final rule in March 2015 that establishes new or more stringent standards for performing hydraulic fracturing on federal and Indian lands. However, the U.S. District Court of Wyoming struck down this rule in June 2016. The June 2016 decision was appealed by the BLM to the U.S. Circuit Court of Appeals for the Tenth Circuit. However, following issuance of a presidential executive order to review rules related to the energy industry, in July 2017, the BLM published a proposed rule to rescind the 2015 final rule. In September 2017, the Tenth Circuit issued a ruling to vacate the Wyoming trial court decision and dismiss the lawsuit challenging the 2015 rule in light of the BLM’s proposed rulemaking. The BLM issued a final rule repealing the 2015 hydraulic fracturing rule in December 2017.
Congress has from time to time considered legislation to provide for federal regulation of hydraulic fracturing and to require disclosure of the chemicals used in the hydraulic fracturing process but, at this time, federal legislation related to hydraulic fracturing appears unlikely. At the state level, some states, including Oklahoma and Colorado, have adopted, and other states are considering adopting, legal requirements that could impose more stringent permitting, disclosure, operational or well construction requirements on hydraulic fracturing activities, or that prohibit hydraulic fracturing altogether. Local government may also seek to adopt ordinances within their jurisdictions regulating the time, place and manner of drilling activities in general or hydraulic fracturing activities in particular. If new laws or regulations that significantly restrict hydraulic fracturing are adopted at the local, state or federal level, our fracturing activities could become subject to additional permit and financial assurance requirements, more stringent construction requirements, increased reporting or plugging and abandoning requirements or operational restrictions, and associated permitting delays and potential increases in costs. These delays or additional costs could adversely affect the determination of whether a well is commercially viable, and could cause us to incur substantial compliance costs. Restrictions on hydraulic fracturing could also reduce the amount of oil and natural gas that we are ultimately able to produce in commercial quantities.
In addition to asserting regulatory authority, certain government agencies have conducted reviews focusing on environmental issues associated with hydraulic fracturing practices. For example, the EPA released its final report on the potential impacts of hydraulic fracturing on drinking water resources in December 2016. The EPA report concluded that “water cycle” activities associated with hydraulic fracturing may impact drinking water sources “under some circumstances,” noting that the following hydraulic fracturing water cycle activities and local- or regional-scale factors are more likely than others to result in more frequent or more severe impacts: water withdrawals for fracturing in times or areas of low water availability; surface spills during the management of fracturing fluids, chemicals or produced water; injection of fracturing fluids into wells with inadequate mechanical integrity; injection of fracturing fluids directly into groundwater resources; discharge of inadequately treated fracturing wastewater to surface waters; and disposal or storage of fracturing wastewater in unlined pits. Since the report did not find a direct link between hydraulic fracturing itself and contamination of groundwater resources, this years-long study report does not appear to provide any basis for further regulation of hydraulic fracturing at the federal level.
We diligently review best practices and industry standards, serve on industry association committees and comply with all regulatory requirements in the protection of potable water sources. Protective practices include, but are not limited to, setting multiple strings of protection pipe across the potable water sources and cementing these pipes from setting depth to surface, continuously monitoring the hydraulic fracturing process in real time and disposing of all non-commercially
20
produced fluids in certified disposal wells at depths below the potable water sources. There have not been any incidents, citations or suits related to our hydraulic fracturing activities involving environmental concerns.
OTHER REGULATION OF THE OIL AND NATURAL GAS INDUSTRY
The oil and natural gas industry is extensively regulated by numerous federal, state, local, and regional authorities, as well as Native American tribes. Legislation affecting the oil and natural gas industry is under constant review for amendment or expansion, frequently increasing the regulatory burden. Also, numerous departments and agencies, both federal and state, and Native American tribes are authorized by statute to issue rules and regulations affecting the oil and natural gas industry and its individual members, some of which carry substantial penalties for noncompliance. Although the regulatory burden on the oil and natural gas industry increases the Company’s cost of doing business and, consequently, affects its profitability, these burdens generally do not affect the Company any differently or to any greater or lesser extent than they affect other companies in the industry with similar types, quantities and locations of production.
In July 2014, the U.S. Department of Transportation’s Pipeline and Hazardous Materials Safety Administration (“PHMSA”) released the details of a comprehensive rulemaking proposal to improve the safe transportation of large quantities of flammable materials by rail, particularly crude oil and ethanol. The Federal Railroad Administration (“FRA”) and PHMSA jointly published the final rule on May 1, 2015, and it became effective July 7, 2015. The final rule (i) contains a new enhanced tank car standard and a risk-based retrofitting schedule for older tank cars carrying crude oil and ethanol; (ii) requires a new braking standard for certain trains; (iii) designates new operational protocols for trains transporting large volumes of flammable liquids, such as routing requirements, speed restrictions, and information for local government agencies; and (iv) provides new sampling and testing requirements to improve classification of energy products placed into transport. On August 10, 2016, PHMSA, in coordination with the FRA, announced a final rule codifying certain requirements of the Fixing America’s Surface Transportation Act of 2015 (“FAST Act”), thereby building upon the May 2015 rule and expanding the requirements to use the enhanced tank car for shipping all flammable liquids, regardless of the length of the train. The rule also requires that new tank cars be equipped with a thermal protection blanket and that older tank cars retrofitted to the new standard be equipped with top fittings protection and a thermal protection blanket. The FAST Act also requires a modified phase out schedule for older Department of Transportation Specification 111 tank cars, such that older tank cars are phased out faster. As a result of the rule, certain of the tank cars that we currently use could be deemed unfit for further commercial use or require retrofits or modifications, and we could face increased transportation costs or constraints.
The price of oil, natural gas and NGLs is not currently regulated and are made at market prices. Although oil, natural gas and NGL prices are currently unregulated, Congress historically has been active in the area of oil and natural gas regulation. We cannot predict whether new legislation to regulate oil, natural gas and NGL prices might be proposed, what proposals, if any, might actually be enacted by Congress or the various state legislatures, and what effect, if any, the proposals might have on our operations.
Drilling and Production
Our operations are subject to various types of regulation at federal, state, local and Native American tribal levels. These types of regulation include requiring permits for the drilling of wells, drilling bonds and reports concerning operations. Most states, and some counties, municipalities and Native American tribal areas where we operate also regulate one or more of the following activities:
|
•
|
the location of wells;
|
|
•
|
the method of drilling and casing wells;
|
|
•
|
the timing of construction or drilling activities;
|
|
•
|
the rates of production, or “allowables”;
|
|
•
|
the use of surface or subsurface waters;
|
|
•
|
the surface use and restoration of properties upon which wells are drilled;
|
|
•
|
the plugging and abandoning of wells; and
|
|
•
|
the notice to surface owners and other third parties.
|
State laws regulate the size and shape of drilling and spacing units or proration units governing the pooling of oil and natural gas properties. Some states allow forced pooling or integration of tracts to facilitate exploration while other states
21
rely on voluntary pooling of lands and leases. In some instances, forced pooling or unitization may be implemented by third parties and may reduce our interest in the unitized properties. In addition, state conservation laws establish maximum rates of production from oil and natural gas wells, generally prohibit the venting or flaring of natural gas and impose requirements regarding the ratability of production. These laws and regulations may limit the amount of oil and natural gas we can produce from our wells or limit the number of wells or the locations at which we can drill. Moreover, each state generally imposes a production or severance tax with respect to the production and sale of oil, natural gas, and NGLs within its jurisdiction.
State agencies in Colorado, Kansas, Oklahoma and Texas impose financial assurance requirements on operators. The Corps and many other state and local authorities also have regulations for plugging and abandonment, decommissioning and site restoration.
Natural Gas Sales and Transportation
The availability, terms and cost of transportation significantly affect sales of oil and natural gas. The interstate transportation and sale for resale of oil and natural gas is subject to federal regulation, including regulation of the terms, conditions and rates for interstate transportation, storage and various other matters, primarily by the Federal Energy Regulatory Commission (“FERC”). Federal and state regulations govern the price and terms for access to oil and natural gas pipeline transportation. The FERC’s regulations for interstate oil and natural gas transmission in some circumstances may also affect the intrastate transportation of oil and natural gas.
Historically, federal legislation and regulatory controls have affected the price of the natural gas we produce and the manner in which we market our production. FERC has jurisdiction over the transportation and sale for resale of natural gas in interstate commerce by natural gas companies under the Natural Gas Act of 1938 (the “NGA”) and the Natural Gas Policy Act of 1978. Various federal laws enacted since 1978 have resulted in the removal of all price and non-price controls for sales of domestic natural gas sold in first sales, which include all of our sales of our own production. Under the Energy Policy Act of 2005 (the “EPAct 2005”), FERC has substantial enforcement authority to prohibit the manipulation of natural gas markets and enforce its rules and orders, including the ability to assess substantial civil penalties of up to $1,238,271 per day for each violation and disgorgement of profits associated with any violation. While our systems have not been regulated by FERC as a natural gas company under the NGA, we are required to report aggregate volumes of natural gas purchased or sold at wholesale to the extent such transactions utilize, contribute to, or may contribute to the formation of price indices. In addition, Congress may enact legislation or FERC may adopt regulations that may subject certain of our otherwise non-FERC jurisdictional facilities to further regulation. Failure to comply with those regulations in the future could subject us to civil penalty liability.
The Commodity Futures Trading Commission (the “CFTC”) also holds authority to monitor certain segments of the physical and futures energy commodities market including oil and natural gas. With regard to physical purchases and sales of natural gas and other energy commodities, and any related hedging activities that we undertake, we are thus required to observe anti-market manipulation laws and related regulations enforced by FERC and/or the CFTC. The CFTC also holds substantial enforcement authority, including the ability to assess civil penalties of up to $1,116,156 per day per violation.
FERC also regulates interstate natural gas transportation rates and service conditions and establishes the terms under which we may use interstate natural gas pipeline capacity, which affects the marketing of natural gas that we produce, as well as the revenues we receive for sales of our natural gas and release of our natural gas pipeline capacity. Commencing in 1985, FERC promulgated a series of orders, regulations and rule makings that significantly fostered competition in the business of transporting and marketing gas. Today, interstate pipeline companies are required to provide nondiscriminatory transportation services to producers, marketers and other shippers, regardless of whether such shippers are affiliated with an interstate pipeline company. FERC’s initiatives have led to the development of a competitive, open access market for natural gas purchases and sales that permits all purchasers of natural gas to buy gas directly from third-party sellers other than pipelines. However, the natural gas industry historically has been very heavily regulated; therefore, we cannot guarantee that the less stringent regulatory approach currently pursued by FERC and Congress will continue indefinitely into the future nor can we determine what effect, if any, future regulatory changes might have on the Company’s natural gas related activities.
Under FERC’s current regulatory regime, transmission services must be provided on an open-access, nondiscriminatory basis at cost-based rates or at market-based rates if the transportation market at issue is sufficiently competitive. Gathering service, which occurs upstream of jurisdictional transmission services, is regulated by the states onshore and in-state waters. Although its policy is still in flux, in the past FERC has reclassified certain jurisdictional transmission facilities as non-jurisdictional gathering facilities, which has the tendency to increase our cost of transporting gas to point-of-sale locations.
22
Oil Price Controls and Transportation Rates
Sales prices of oil and NGLs are not currently regulated and are made at market prices. Our sales of these commodities are, however, subject to laws and to regulations issued by the Federal Trade Commission (the “FTC”) prohibiting manipulative or fraudulent conduct in the wholesale petroleum market. The FTC holds substantial enforcement authority under these regulations, including the ability to assess civil penalties of up to $1,156,953 per day per violation. Our sales of these commodities, and any related hedging activities, are also subject to CFTC oversight as discussed above.
The price we receive from the sale of these products may be affected by the cost of transporting the products to market. Some of our transportation of oil, natural gas and NGLs is through interstate common carrier pipelines. Effective as of January 1, 1995, the FERC implemented regulations generally grandfathering all previously approved interstate transportation rates and establishing an indexing system for those rates by which adjustments are made annually based on the rate of inflation, subject to certain conditions and limitations. The FERC’s regulation of crude oil and natural gas liquids transportation rates may tend to increase the cost of transporting crude oil and natural gas liquids by interstate pipelines, although the annual adjustments may result in decreased rates in a given year. Every five years, the FERC must examine the relationship between the annual change in the applicable index and the actual cost changes experienced in the oil pipeline industry. We are not able at this time to predict the effects of these regulations or FERC proceedings, if any, on the transportation costs associated with crude oil production from our crude oil producing operations.
EMPLOYEES
As of
December 31, 2017
, the Company had
476
full-time employees, including
67
geologists, geophysicists, petroleum engineers, technicians, land and regulatory professionals. Of our
476
employees,
269
were located at the Company’s headquarters in Oklahoma City, Oklahoma at
December 31, 2017
, and the remaining employees worked in our various field offices and drilling sites.
GLOSSARY OF OIL AND NATURAL GAS TERMS
The following is a description of the meanings of certain oil and natural gas industry terms used in this report.
2-D seismic or 3-D seismic.
Geophysical data that depict the subsurface strata in two dimensions or three dimensions, respectively. 3-D seismic typically provides a more detailed and accurate interpretation of the subsurface strata than 2-D seismic.
Bbl.
One stock tank barrel, or 42 U.S. gallons liquid volume, used in this report in reference to oil or other liquid hydrocarbons.
Bcf.
Billion cubic feet of natural gas.
Bench.
A geological horizon; a distinctive stratum useful for stratigraphic correlation.
Boe.
Barrels of oil equivalent, with six thousand cubic feet of natural gas being equivalent to one barrel of oil. Although an equivalent barrel of condensate or natural gas may be equivalent to a barrel of oil on an energy basis, it is not equivalent on a value basis as there may be a large difference in value between an equivalent barrel and a barrel of oil. For example, based on the commodity prices used to prepare the estimate of the Company’s reserves at year-end 2017 of
$51.34
/Bbl for oil and
$2.98
/Mcf for natural gas, the ratio of economic value of oil to natural gas was approximately 17 to 1, even though the ratio for determining energy equivalency is 6 to 1.
Boe/d.
Boe per day.
Btu or British thermal unit.
The quantity of heat required to raise the temperature of one pound of water by one degree Fahrenheit.
Completion.
The process of treating a drilled well, primarily through hydraulic fracturing, followed by the installation of permanent equipment for the production of oil or natural gas, or in the case of a dry well, the reporting to the appropriate authority that the well has been abandoned.
CO
2
.
Carbon dioxide.
Developed acreage.
The number of acres that are assignable to productive wells.
23
Developed oil, natural gas and NGL reserves.
Reserves of any category that can be expected to be recovered (i) through existing wells with existing equipment and operating methods or in which the cost of the required equipment is relatively minor compared to the cost of a new well and (ii) through installed extraction equipment and infrastructure operational at the time of the reserves estimate if the extraction is by means not involving a well.
Development costs.
Costs incurred to obtain access to proved reserves, complete wells and provide facilities for extracting, treating, gathering and storing the oil and natural gas. More specifically, development costs, including depreciation and applicable operating costs of support equipment and facilities and other costs of development activities, are costs incurred to (i) gain access to and prepare well locations for drilling, including surveying well locations for the purpose of determining specific development drilling sites, clearing ground, draining, road building and relocating public roads, gas lines and power lines, to the extent necessary in developing the proved reserves, (ii) drill, equip and complete development wells, development-type stratigraphic test wells and service wells, including the costs of platforms and of well equipment such as casing, tubing, pumping equipment, and the wellhead assembly, (iii) acquire, construct and install production facilities such as lease flow lines, separators, treaters, heaters, manifolds, measuring devices and production storage tanks, natural gas cycling and processing plants, and central utility and waste disposal systems, and (iv) provide improved recovery systems.
Development well.
A well drilled within the proved area of an oil or natural gas reservoir to the depth of a stratigraphic horizon known to be productive.
Dry well.
An exploratory, development or extension well that proves to be incapable of producing either oil or natural gas in sufficient quantities to justify completion as an oil or natural gas well.
Environmental Assessment (“EA”).
A study to determine whether an action significantly affects the environment, which federal or state agencies may be required by the National Environmental Policy Act or similar state statutes to undertake prior to the commencement of activities that would constitute federal or state actions, such as permitting oil and natural gas exploration and production activities.
Exploratory well.
A well drilled to find a new field or to find a new reservoir in a field previously found to produce oil or natural gas in another reservoir.
Extended reach lateral (“XRL”)
. Extended-reach lateral wells are horizontal wells where the horizontal segment or lateral is at least approximately 9,000-9,500 feet in length and may extend further. When referencing lateral counts, XRL’s are counted as more than one lateral depending on the relationship of length to an SRL length. E.g. a 9,000 foot lateral would be counted as two laterals.
Field.
An area consisting of a single reservoir or multiple reservoirs all grouped on or related to the same individual geological structural feature and/or stratigraphic condition. There may be two or more reservoirs in a field which are separated vertically by intervening impervious strata, or laterally by local geological barriers, or both. Reservoirs that are associated by being in overlapping or adjacent fields may be treated as a single or common operational field. The geological terms “structural feature” and “stratigraphic condition” are intended to identify localized geological features as opposed to the broader terms of basins, trends, provinces, plays, areas of interest, etc.
Gross acres or gross wells.
The total acres or wells, as the case may be, in which a working interest is owned.
Horizontal well.
A well that is turned horizontally at depth, providing access to oil and gas reserves at a wide range of angles.
Hydraulic fracturing.
Procedure to stimulate production by forcing a mixture of fluid and proppant into the formation under high pressure. Hydraulic fracturing creates artificial fractures in the reservoir rock to increase permeability and porosity.
Lease.
A contract in which the owner of minerals gives a company or working interest owner temporary and limited rights to explore for, develop, and produce minerals from the property, or; any transfer where the owner of a mineral interest assigns all or a part of the operating rights to another party but retains a continuing nonoperating interest in production from the property.
MBbls.
Thousand barrels of oil or other liquid hydrocarbons.
MBoe.
Thousand barrels of oil equivalent.
Mcf.
Thousand cubic feet of natural gas.
MMBbls.
Million barrels of oil or other liquid hydrocarbons.
24
MMBoe.
Million barrels of oil equivalent.
MMBtu.
Million British Thermal Units.
MMcf.
Million cubic feet of natural gas.
MMcf/d.
MMcf per day.
Net acres or net wells.
The sum of the fractional working interest owned in gross acres or gross wells, as the case may be.
NGL.
Natural gas liquids, such as ethane, propane, butanes and natural gasoline that are extracted from natural gas production streams.
NYMEX.
The New York Mercantile Exchange.
Plugging and abandonment.
Refers to the sealing off of fluids in the strata penetrated by a well so that the fluids from one stratum will not escape into another or to the surface. Regulations of all states require plugging of abandoned wells.
Present value of future net revenues.
The present value of estimated future revenues to be generated from the production of proved reserves, before income taxes, calculated in accordance with SEC guidelines, net of estimated production and future development costs, using prices and costs as of the date of estimation without future escalation and without giving effect to hedging activities, non-property related expenses such as general and administrative expenses, debt service and depreciation, depletion and amortization. PV-10 is calculated using an annual discount rate of 10% and PV-9 is calculated using an annual discount rate of 9%.
Production costs.
Costs incurred to operate and maintain wells and related equipment and facilities, including depreciation and applicable operating costs of support equipment and facilities and other costs of operating and maintaining those wells and related equipment and facilities, that become part of the cost of oil and natural gas produced.
Productive well.
A well that is found to be capable of producing oil or natural gas in sufficient quantities to justify completion as an oil or natural gas well.
Prospect.
A specific geographic area that, based on supporting geological, geophysical or other data and also preliminary economic analysis using reasonably anticipated prices and costs, is deemed to have potential for the discovery of commercial hydrocarbons.
Proved developed reserves.
Reserves that are both proved and developed.
Proved oil, natural gas and NGL reserves.
Has the meaning given to such term in Rule 4-10(a)(22) of Regulation S-X, which defines proved reserves as:
Those quantities of oil and natural gas which, by analysis of geoscience and engineering data, can be estimated with reasonable certainty to be economically producible from a given date forward, from known reservoirs, and under existing economic conditions, operating methods, and government regulations, prior to the time at which contracts providing the right to operate expire, unless evidence indicates that renewal is reasonably certain, regardless of whether deterministic or probabilistic methods are used for estimation. The project to extract the hydrocarbons must have commenced or the operator must be reasonably certain that it will commence the project within a reasonable time.
The area of a reservoir considered proved includes (i) the area identified by drilling and limited by fluid contacts, if any, and (ii) adjacent undrilled portions of the reservoir that can, with reasonable certainty, be judged to be continuous with it and to contain economically producible oil or gas on the basis of available geoscience and engineering data. In the absence of data on fluid contacts, proved quantities in a reservoir are limited by the lowest known hydrocarbons as seen in a well penetration unless geoscience, engineering or performance data and reliable technology establish a lower contact with reasonable certainty.
Where direct observation from well penetrations has defined a highest known oil elevation and the potential exists for an associated gas cap, proved oil reserves may be assigned in the structurally higher portions of the reservoir only if geoscience, engineering or performance data and reliable technology establish the higher contact with reasonable certainty.
Reserves that can be produced economically through application of improved recovery techniques (including, but not limited to, fluid injection) are included in the proved classification when (i) successful testing by a pilot project in an area of the reservoir with properties no more favorable than in the reservoir as a whole, the operation of an installed program in
25
the reservoir, or an analogous reservoir, or other evidence using reliable technology establishes the reasonable certainty of the engineering analysis on which the project or program was based and (ii) the project has been approved for development by all necessary parties and entities, including governmental entities.
Existing economic conditions include prices and costs at which economic producibility from a reservoir is to be determined. The price shall be the average price during the 12-month period prior to the ending date of the period covered by the report, determined as an unweighted arithmetic average of the first-day-of-the-month price for each month within such period, unless prices are defined by contractual arrangements, excluding escalations based upon future conditions.
Proved undeveloped reserves.
Reserves that are both proved and undeveloped.
PV-9.
See “Present value of future net revenues” above.
PV-10.
See “Present value of future net revenues” above.
Reserves.
Estimated remaining quantities of oil and natural gas and related substances anticipated to be economically producible, as of a certain date, by application of development projects to known accumulations. In addition, there must exist, or there must be a reasonable expectation that there will exist, the legal right to produce or a revenue interest in the production, installed means of delivering oil and natural gas or related substances to market, and all permits and financing required to implement the project.
Reserves should not be assigned to adjacent reservoirs isolated by major, potentially sealing, faults until those reservoirs are penetrated and evaluated as economically producible. Reserves should not be assigned to areas that are clearly separated from a known accumulation by a non-productive reservoir (
i.e.,
absence of reservoir, structurally low reservoir, or negative test results). Such areas may contain prospective resources (
i.e.
, potentially recoverable resources from undiscovered accumulations).
Reservoir.
A porous and permeable underground formation containing a natural accumulation of producible oil and/or natural gas that is confined by impermeable rock or water barriers and is individual and separate from other reservoirs.
Royalty Interest.
An interest in an oil and natural gas property entitling the owner to a share of oil, natural gas or NGL production free of costs of production.
Standard-reach lateral (“SRL”).
Standard-reach lateral wells are horizontal wells where the horizontal segment or lateral is approximately 4,000- 4,500 feet in length.
Standardized measure or standardized measure of discounted future net cash flows.
The present value of estimated future cash inflows from proved oil, natural gas and NGL reserves, less future development and production costs and future income tax expenses, discounted at 10% per annum to reflect timing of future cash flows and using the same pricing assumptions as were used to calculate PV-10. Standardized Measure differs from PV-10 because Standardized Measure includes the effect of future income taxes on future net revenues.
Undeveloped acreage.
Lease acreage on which wells have not been drilled or completed to a point that would permit the production of economic quantities of oil or natural gas regardless of whether such acreage contains proved reserves.
Undeveloped oil, natural gas and NGL reserves.
Reserves of any category that are expected to be recovered from new wells on undrilled acreage, or from existing wells where a relatively major expenditure is required for recompletion.
|
(i)
|
Reserves on undrilled acreage are limited to those directly offsetting development spacing areas that are reasonably certain of production when drilled, unless evidence using reliable technology exists that establishes reasonable certainty of economic producibility at greater distances.
|
|
(ii)
|
Undrilled locations are classified as having undeveloped reserves only if a development plan has been adopted indicating that they are scheduled to be drilled within five years, unless the specific circumstances justify a longer time.
|
|
(iii)
|
Under no circumstances shall estimates for undeveloped reserves be attributable to any acreage for which an application of fluid injection or other improved recovery technique is contemplated, unless such techniques have been proved effective by actual projects in the same reservoir or an analogous reservoir or by other evidence using reliable technology establishing reasonable certainty.
|
26
Working interest.
The operating interest that gives the owner the right to drill, produce and conduct operating activities on the property and receive a share of production and requires the owner to pay a share of the costs of drilling and production operations.
27
Item 1A.
Risk Factors
Risks Related to the Oil and Natural Gas Industry and Our Business
Oil, natural gas and NGL prices can fluctuate widely due to a number of factors that are beyond our control. Declines in oil, natural gas or NGL prices could significantly affect our financial condition and results of operations.
Our revenues, profitability and cash flow are highly dependent upon the prices we realize from the sale of oil, natural gas and NGLs. Historically, the markets for these commodities are very volatile. Prices for oil, natural gas and NGLs can move quickly and fluctuate widely in response to a variety of factors that are beyond our control. These factors include, among others:
|
•
|
changes in regional, domestic and foreign supply of, and demand for, oil, natural gas and NGLs, as well as perceptions of supply of, and demand for, oil, natural gas and NGLs generally;
|
|
•
|
the price and quantity of foreign imports;
|
|
•
|
the ability of other companies to complete and commission liquefied natural gas export facilities in the U.S.;
|
|
•
|
U.S. and worldwide political and economic conditions;
|
|
•
|
the level of global and U.S. inventories;
|
|
•
|
weather conditions and seasonal trends;
|
|
•
|
anticipated future prices of oil, natural gas and NGLs, alternative fuels and other commodities;
|
|
•
|
technological advances affecting energy consumption and energy supply;
|
|
•
|
the proximity, capacity, cost and availability of pipeline infrastructure, treating, transportation and refining capacity;
|
|
•
|
natural disasters and other extraordinary events;
|
|
•
|
domestic and foreign governmental regulations and taxation;
|
|
•
|
energy conservation and environmental measures; and
|
|
•
|
the price and availability of alternative fuels.
|
These factors and the volatility of the energy markets, which we expect will continue, make it extremely difficult to predict future oil, natural gas and NGL price movements with any certainty. For oil, from January 2013 through December 2017, the highest month end NYMEX settled price was
$107.65
per Bbl and the lowest was
$33.62
per Bbl. For natural gas, from January 2013 through December 2017, the highest month end NYMEX settled price was
$5.56
per MMBtu and the lowest was
$1.71
per MMBtu. In addition, the market price of natural gas is generally higher in the winter months than during other months of the year due to increased demand for natural gas for heating purposes during the winter season.
Although oil, natural gas and NGL prices rose during 2017, a buildup in inventories, lower global demand, or other factors could cause prices for U.S. oil, natural gas and NGLs to weaken, which could negatively affect our cash flows and results of operations. Under such conditions, revenues may be negatively affected, and the amount of oil, natural gas and NGLs we can produce economically may be reduced, causing us to make substantial downward adjustments to our estimated proved reserves and having a material adverse effect on our financial condition and results of operations.
Unless we replace our oil, natural gas and NGL reserves, our reserves and production will decline, which would adversely affect our business, financial condition and results of operations.
Our future oil, natural gas and NGL reserves and production, and therefore our cash flow and income, are highly dependent on our success in efficiently developing and exploiting our current estimated proved reserves and finding or acquiring additional economically recoverable reserves. Declining cash flows from operations, as a result of lower commodity prices, could require us to reduce expenditures to develop and acquire additional reserves. Further, we may not be able to develop, find or acquire additional reserves to replace our current and future production at acceptable costs, which could adversely affect our business, financial condition and results of operations.
Drilling for and producing oil and natural gas are high risk activities with many uncertainties that could adversely affect our business, financial condition or results of operations.
Drilling for oil and natural gas can be unprofitable if dry wells are drilled and if productive wells do not produce sufficient revenues to return a profit. Furthermore, even if sufficient amounts of oil or natural gas exist, we may damage the potentially productive hydrocarbon bearing formation or experience mechanical difficulties while drilling or completing the well, resulting
28
in a reduction in production from the well or abandonment of the well. Decisions to develop properties depend in part on the evaluation of data obtained through geophysical and geological analyses, production data and engineering studies, the results of which are often inconclusive or subject to varying interpretations. The estimated cost of drilling, completing and operating wells is uncertain before drilling commences. Overruns in budgeted expenditures are common risks that can make a particular project uneconomical. In addition, our drilling and producing operations may be curtailed, delayed or canceled as a result of various factors, including the following:
|
•
|
reductions in oil, natural gas and NGL prices;
|
|
•
|
delays imposed by or resulting from compliance with regulatory requirements including permitting;
|
|
•
|
unusual or unexpected geological formations and miscalculations;
|
|
•
|
shortages of or delays in obtaining equipment and qualified personnel;
|
|
•
|
shortages of or delays in obtaining water for hydraulic fracturing operations;
|
|
•
|
equipment malfunctions, failures or accidents;
|
|
•
|
lack of available gathering or midstream facilities or delays in construction of gathering or midstream facilities;
|
|
•
|
lack of available capacity on interconnecting transmission pipelines;
|
|
•
|
lack of adequate electrical infrastructure and water disposal capacity;
|
|
•
|
unexpected operational events and drilling conditions;
|
|
•
|
pipe or cement failures and casing collapses;
|
|
•
|
pressures, fires, blowouts and explosions;
|
|
•
|
lost or damaged drilling and service tools;
|
|
•
|
loss of drilling fluid circulation;
|
|
•
|
uncontrollable flows of oil, natural gas, brine, water or drilling fluids;
|
|
•
|
natural disasters;
|
|
•
|
environmental hazards, such as oil spills and natural gas leaks, pipeline or tank ruptures, encountering naturally occurring radioactive materials and unauthorized discharges of brine, well stimulation and completion fluids, toxic gases or other pollutants into the surface and subsurface environment;
|
|
•
|
high costs, shortages or delivery delays of equipment, labor or other services, or water used in hydraulic fracturing;
|
|
•
|
compliance with environmental and other governmental requirements;
|
|
•
|
adverse weather conditions such as extreme cold, fires caused by extreme heat or lack of rain, and severe storms, tornadoes or hurricanes;
|
|
•
|
oil and natural gas property title problems; and
|
|
•
|
market and midstream limitations for oil, natural gas and NGLs.
|
Certain of these risks can cause substantial losses, including personal injury or loss of life, damage to or destruction of property, natural resources and equipment, environmental contamination or loss of wells and regulatory fines or penalties.
Market conditions or operational impediments may hinder our access to oil, natural gas and NGL markets or delay production of oil, natural gas and NGLs.
Market conditions or a lack of satisfactory oil and natural gas transportation arrangements may hinder our access to oil, natural gas and NGL markets or delay production of oil, natural gas and NGLs. The availability of a ready market for our oil, natural gas and NGL production depends on a number of factors, including the demand for and supply of oil, natural gas and NGLs and the proximity of reserves to pipelines and terminal facilities. Our ability to market our production depends, in substantial part, on the availability and capacity of gathering systems, pipelines and treating facilities for oil, natural gas and NGLs as well as gathering systems, treating facilities and disposal wells for water produced alongside the hydrocarbons. Our failure to obtain such services on acceptable terms in the future or to expand our midstream assets could have a material adverse effect on our business. We may be required to shut in wells for a lack of a market or because access to natural gas pipelines, gathering system capacity, treating facilities or disposal wells may be limited or unavailable. We would be unable to realize revenue from any shut-in wells until production arrangements were made to deliver the production to market.
29
Our North Park Basin acreage may require the construction of significant gathering systems and pipelines as we increase drilling and development activity. Obtaining these services or expanding our midstream assets with acceptable commercial terms could adversely affect our ability to develop this acreage in a timely manner.
Our identified drilling locations are scheduled over many years, making them susceptible to uncertainties that could materially alter the occurrence or timing of their drilling. In addition, we may not be able to raise the substantial amount of capital necessary to drill such locations or construct the midstream infrastructure required to make such development profitable.
Our management team has specifically identified and scheduled certain drilling locations as an estimation of our future multi-year drilling activities on our existing acreage. These locations represent a significant part of our growth strategy. Our ability to drill and develop these locations depends on a number of uncertainties, including oil and natural gas prices, the availability and cost of capital, drilling and production costs, availability of drilling services and equipment, drilling results, lease expirations, gathering and midstream system and pipeline transportation constraints, access to and availability of water sourcing and distribution systems, regulatory approvals and other factors. Because of these uncertain factors, we do not know if the numerous potential well locations we have identified will ever be drilled or if we will be able to produce natural gas or oil from these or any other potential locations. For example, our North Park Basin assets are in the delineation phase of the development cycle and may require significant investment over the next several years, including the construction of midstream and pipeline takeaway infrastructure, as we progress toward full field development with more activity and an expanded development footprint. We may not be able to raise the substantial amount of capital necessary to fully realize our North Park Basin assets.
In addition, unless production is established within the spacing units covering the undeveloped acres on which some of the potential locations are obtained, the leases for such acreage will expire. As such, our actual drilling activities may materially differ from those presently identified.
Our acreage not contained within federal units must be drilled before lease expiration, generally within three to five years, in order to hold the acreage by production, and our acreage committed to federal units must be drilled pursuant to the federal unit timelines provided within the unit agreements. In a highly competitive market for acreage, failure to drill sufficient wells to hold acreage may result in a substantial lease renewal cost, or if renewal is not feasible, loss of our lease and prospective drilling opportunities.
Leases on our oil and natural gas properties that are not federal units typically have a term of three to five years, after which they expire unless, prior to expiration, production is established within the spacing units covering the undeveloped acres, or the leases are renewed. The cost to renew such leases may increase significantly, and we may not be able to renew such leases on commercially reasonable terms or at all. Acreage committed to federal units must be drilled pursuant to the federal unit timelines provided within the unit agreements, typically requiring two unit wells within the first 5 years and two more wells within the next five years. At the end of the second five-year term the unit begins to reduce in size to designated participating areas within the Federal Units. Unless we increase our current drilling program, we could lose undeveloped acreage through lease expirations. Our reserves and future production and, therefore, our future cash flow and income are highly dependent on successfully developing our undeveloped leasehold acreage and the loss of any leases could materially and adversely affect our ability to so develop such acreage.
Our development and exploration operations require substantial capital. We may be unable to obtain needed capital or financing on satisfactory terms, which could lead to a loss of properties and a decline in our oil, natural gas and NGL reserves.
The oil and natural gas industry is capital intensive. We make substantial capital expenditures in our business and operations for the exploration, development, production and acquisition of oil, natural gas and NGL reserves. Historically, we have financed capital expenditures primarily with proceeds from asset sales and from the sale of equity and debt securities and cash generated by operations. In particular, cash flow from operations was
$181.2 million
for the year ended December 31, 2017. Cash flow from operations was $
65.6 million
for the Successor 2016 Period, cash used in operations was $112.1 million for the Predecessor 2016 Period, and cash flow from operations was
$373.5 million
, for the year ended December 31,
2015
. The capital markets that we have historically accessed have recently been and may continue to be constrained to such an extent that debt or equity capital raises are practically unfeasible. If the debt and equity capital markets are not accessible, we may be unable to implement our drilling and development plans or otherwise carry out our business strategy as expected. Our cash flow from operations and access to capital are subject to a number of variables, including:
|
•
|
the prices at which oil, natural gas and NGLs are sold;
|
|
•
|
our proved reserves;
|
|
•
|
the level of oil, natural gas and NGLs we are able to produce from existing wells;
|
30
|
•
|
our ability to acquire, locate and produce new reserves; and
|
|
•
|
our capital and operating costs.
|
Given our reduced capital budget for 2018, we are currently estimating a decline in production from approximately 41 MBoe per day to approximately 32 MBoe per day. This decline in production as well as other factors such as lower oil, natural gas and NGL prices, declines in reserves, or for any other reason may lead to reductions in our revenues and cash flow from operations and may limit our ability to obtain the capital necessary to sustain our operations at desired levels. In order to fund capital expenditures, we may seek additional financing.
Disruptions in the global financial and capital markets could also adversely affect our ability to obtain debt or equity financing on favorable terms, or at all. The failure to obtain additional financing could result in a curtailment of our operations relating to exploration and development of its prospects, which in turn could lead to a possible loss of properties and a decline in our oil, natural gas and NGL reserves.
Future price declines may result in reductions of the asset carrying values of our oil and natural gas properties.
We utilize the full cost method of accounting for costs related to our oil and natural gas properties. Under this accounting method, all costs for both productive and nonproductive properties are capitalized and amortized on an aggregate basis over the estimated lives of the properties using the unit-of-production method. However, the amount of these costs that can be carried as capitalized assets is subject to a ceiling, which limits such pooled costs to the aggregate of the present value of future net revenues of proved oil, natural gas and NGL reserves attributable to proved properties, discounted at 10%, plus the lower of cost or market value of unevaluated properties. The full cost ceiling is evaluated at the end of each quarter using the most recent 12-month average prices for oil and natural gas, adjusted for the impact of derivatives accounted for as cash flow hedges. The Successor Company did not incur any full cost ceiling impairment charges for the year ended December 31, 2017. During the Successor 2016 Period, the Predecessor 2016 Period and the year ended December 31,
2015
, we incurred full cost ceiling impairment charges of $
319.1 million
,
$657.4 million
and $
4.5 billion
, respectively. Cumulative full cost ceiling impairment from the Emergence date through December 31, 2016 and 2017 totaled
$319.1 million
, respectively. If oil, natural gas and NGL prices decline further in the near term, and without other mitigating circumstances, we may experience additional losses of future net revenues, including losses attributable to quantities that cannot be economically produced at lower prices, which would likely cause us to record additional write-downs of capitalized costs of its oil and natural gas properties and non-cash charges against future earnings. The amount of such future write-downs and non-cash charges could be substantial. Further, the borrowing base under our credit facility is calculated by reference to the value of our oil and natural gas reserves, as determined by the lenders under the credit facility, and declines in the value of such reserves as a result of sustained low commodity prices could reduce the amount available to be borrowed under our credit facility if prices decline from current levels.
Our estimated reserves are based on many assumptions that may turn out to be inaccurate. Any significant inaccuracies in these reserve estimates or underlying assumptions could materially affect the quantities and present value of our reserves. Our current estimates of reserves could change, potentially in material amounts, in the future.
The process of estimating oil, natural gas and NGL reserves is complex and inherently imprecise, requiring interpretations of available technical data and many assumptions, including assumptions relating to production rates and economic factors such as historic oil and natural gas prices, drilling and operating expenses, capital expenditures, the assumed effect of governmental regulation and availability of funds for development expenditures. Inaccuracies in these interpretations or assumptions could materially affect the estimated quantities and present value of our reserves. See “Business—Primary Business Operations” in Item 1 of this report for information about our oil, natural gas and NGL reserves.
Actual future production, oil, natural gas and NGL prices, revenues, taxes, development expenditures, operating expenses and quantities of recoverable oil, natural gas and NGL reserves will vary and could vary significantly from our estimates shown in this report, which in turn could have a negative effect on the value of our assets. In addition, from time to time in the future, we will adjust estimates of proved reserves, potentially in material amounts, to reflect production history, results of exploration and development, changes in oil, natural gas and NGL prices and other factors, many of which are beyond our control.
Our business and operations could be negatively impacted by shareholder activism, which could cause us to incur significant expense, hinder execution of our business strategy and impact our stock price.
Shareholder activism, which could take many forms and arise in a variety of situations, could result in substantial costs and divert management’s and our board of directors’ attention and resources from our business. Additionally, such shareholder activism could give rise to perceived uncertainties as to our future, adversely affect our relationships with service providers and make it more difficult to attract and retain qualified personnel. Also, we may be required to incur significant legal fees and
31
other expenses related to activist shareholder matters. Our stock price could be subject to significant fluctuation or otherwise be adversely affected by the events, risks and uncertainties of any shareholder activism.
The ability to attract and retain key personnel is critical to the success of our business and the loss of senior management or technical personnel or our inability to hire additional qualified personnel could adversely affect our operations.
The success of our business depends on key personnel. The ability to attract and retain these key personnel may be difficult in light of the uncertainties currently facing the business and changes we may make to the organizational structure to adjust to changing circumstances. We depend on the services of our senior management and technical personnel, including our director William M. Griffin, Jr., who is serving as our Interim President and Chief Executive Officer, and our Senior Vice President and Chief Accounting Officer Michael A. Johnson, who will be serving as our Interim Chief Financial Officer. The market for qualified personnel has historically been, and we expect that it will continue to be, intensely competitive. We cannot assure you that we will be successful in attracting or retaining such personnel. We may need to enter into retention or other arrangements that could be costly to maintain. If executives, managers or other key personnel resign, retire or are terminated, or their service is otherwise interrupted, we may not be able to replace them in a timely manner and we could experience significant declines in productivity.
The agreements governing our credit facility have restrictions, financial covenants and borrowing base redeterminations, which could adversely affect our operations.
The agreements governing our senior credit facility dated February 10, 2017, (the “credit facility”) restrict our ability to, among other things, obtain additional financing, incur liens, enter into sale and lease back transactions, make certain investments, lease equipment, merge, dissolve, liquidate or consolidate with another entity, pay dividends or make other distributions or repurchase or redeem our stock, enter into transactions with our affiliates, create additional subsidiaries, amend or modify certain provisions of our organizational documents, enter into new transactions with our affiliates, sell assets and engage in business combinations. The credit facility also requires us to comply with certain financial covenants and ratios. See additional discussion of the credit facility under
“Indebtedness—Credit Facilities.”
Persistent depressed oil or natural gas prices or further decline in such prices, without other mitigating circumstances, could prevent us from complying with the financial covenants under the credit facility. Our failure to comply with any of the restrictions and covenants under the credit facility or other debt financings could result in a default under those instruments, which, if left uncured, could lead to an event of default. Such an event of default could, among other things, result in all of our existing indebtedness becoming immediately due and payable. Additionally, an event of default under one of our financing instruments could trigger cross-default provisions under our other financing instruments. The application of the remedies under the financing instruments could have a material adverse effect on our financial position.
Our credit facility limits the amounts we can borrow to a borrowing base amount. The borrowing base is subject to review semi-annually; however, the lenders reserve the right to have one additional redetermination of the borrowing base per calendar year. Unscheduled redeterminations may be made at our request, but are limited to two requests per year. Borrowing base determinations are based upon proved developed producing reserves, proved developed non-producing reserves and proved undeveloped reserves. Outstanding borrowings exceeding the borrowing base must be repaid promptly, or we must pledge other oil and natural gas properties as additional collateral. The borrowing base is also subject to reductions upon the incurrence of junior debt, hedge terminations, dispositions of assets and casualty events which may require us to repay any deficiencies or pledge additional collateral. We may not have the financial resources in the future to make any mandatory principal prepayments under the credit facility, which are required, for example, when the committed line of credit is exceeded, proceeds of asset sales in new oil and natural gas properties are not reinvested, or indebtedness that is not permitted by the terms of the credit facility is incurred. If any future indebtedness under our credit facility were to be accelerated, our assets may not be sufficient to repay such indebtedness in full.
We do not expect to pay dividends or repurchase shares of our common stock in the near future.
Consideration is continually given to returning capital to our shareholders through dividends or repurchases of our common stock. Points of consideration include our cash balance, projected cash requirements, financial liquidity, trading levels of our common stock, appropriate levels of development activities and other available opportunities. As the oil and gas business is very capital intensive, we have not paid dividends or other distributions on our common stock historically. With the expected significant capital needs in developing our North Park Basin and NW STACK assets, we do not anticipate that cash dividends or other distributions will be paid with respect to our common stock and do not anticipate we will repurchase shares of our common stock in the foreseeable future. In addition, restrictive covenants in certain debt instruments to which we are, or may be, a party, may limit our ability to pay dividends or for us to receive dividends from our operating companies, any of which may negatively impact the trading price of our common stock.
32
The present value of future net cash flows from our proved reserves calculated in accordance with SEC guidelines
are not the same as the current market value of our estimated oil, natural gas and NGL reserves.
We base the estimated discounted future net cash flows from our proved reserves on 12-month average index prices and costs, as is required by SEC rules and regulations. Actual future net cash flows from our oil and natural gas properties will be affected by actual prices we receive for oil, natural gas and NGLs, as well as other factors such as:
|
•
|
the accuracy of our reserve estimates;
|
|
•
|
the actual cost of development and production expenditures;
|
|
•
|
the amount and timing of actual production;
|
|
•
|
supply of and demand for oil, natural gas and NGLs; and
|
|
•
|
changes in governmental regulation or taxation.
|
The timing of both our production and its incurrence of expenses in connection with the development and production of oil and natural gas properties will affect the timing of actual future net cash flows from proved reserves, and thus their actual present value. In addition, we use a 10% discount factor when calculating discounted future net cash flows, which may not be the most appropriate discount factor based on interest rates in effect from time to time and risks associated with us or the oil and natural gas industry in general.
We will not know conclusively prior to drilling whether oil or natural gas will be present in sufficient quantities to be economically producible.
The cost of drilling, completing and operating any well is often uncertain, and new wells may not be productive or may suffer from declining production faster than anticipated. The use of seismic data and other technologies and the study of producing fields in the same area do not enable us to know conclusively prior to drilling whether oil or natural gas will be present or, if present, whether oil or natural gas will be present in sufficient quantities to be economically viable. During 2017, we completed a total of
23
gross wells, none of which were identified as dry wells. If we drill additional wells that we identify as dry wells in our current and future prospects, our drilling success rate may decline and materially harm our business.
Production of oil, natural gas and NGLs could be materially and adversely affected by natural disasters or severe weather.
Production of oil, natural gas and NGLs could be materially and adversely affected by natural disasters or severe weather. Repercussions of natural disasters or severe weather conditions may include:
|
•
|
evacuation of personnel and curtailment of operations;
|
|
•
|
damage to drilling rigs or other facilities, resulting in suspension of operations;
|
|
•
|
inability to deliver materials to worksites; and
|
|
•
|
damage to, or shutting in of, pipelines and other transportation facilities.
|
In addition, our hydraulic fracturing operations require significant quantities of water. Regions in which we operate have recently experienced drought conditions. Any diminished access to water for use in hydraulic fracturing, whether due to usage restrictions or drought or other weather conditions, could curtail our operations or otherwise result in delays in operations or increased costs.
The capital markets could be volatile, and such volatility could adversely affect our ability to obtain capital, cause us to incur additional financing expense or affect the value of certain assets.
During and following the 2008 global financial crisis, financial and capital markets were volatile due to multiple factors, including significant losses in the financial services sector and uncertain and rapidly changing economic conditions both in the U.S. and globally. In some cases, financial markets produced downward pressure on stock prices and credit capacity for certain issuers without regard to those issuers’ underlying financial and/or operating strength. Volatility in the capital markets can significantly increase the cost of raising money in the debt and equity capital markets. Future market volatility, generally, and persistent weakness in commodity prices may adversely affect our ability to access capital and credit markets or to obtain funds at low interest rates or on other advantageous terms. These factors may adversely affect our business, results of operations or liquidity.
33
These factors may also adversely affect the value of certain of our assets and ability to draw on our credit facility. Adverse credit and capital market conditions may require us to reduce the carrying value of assets associated with derivative contracts to account for non-performance by, or increased credit risk from, counterparties to those contracts. If financial institutions that extended credit commitments to us are adversely affected by volatile conditions of the U.S. and international capital markets, they may become unable to fund borrowings under their credit commitments to us, which could have a material adverse effect on our financial condition and ability to borrow additional funds, if needed, for working capital, capital expenditures and other corporate purposes.
Properties we acquire may not produce as projected, and we may be unable to determine reserve potential, identify liabilities associated with the properties or obtain protection from sellers against them.
Our initial technical reviews of properties we acquire are necessarily limited because an in-depth review of every individual property involved in each acquisition generally is not feasible. Even a detailed review of records and properties may not necessarily reveal existing or potential problems, nor will it permit a buyer to become sufficiently familiar with the properties to assess fully their deficiencies and potential. Inspections may not always be performed on every well and environmental problems, such as soil or ground water contamination, are not necessarily observable even when an inspection is undertaken. Even when problems are identified, we may assume certain environmental and other risks and liabilities in connection with acquired properties, and such risks and liabilities could have a material adverse effect on our results of operations and financial condition.
The development of our proved undeveloped reserves may take longer and may require higher levels of capital expenditures than we currently anticipate.
As of
December 31, 2017
, approximately
30.3%
of our total reserves were proved undeveloped reserves. Development of these reserves may take longer and require higher levels of capital expenditures than we currently anticipate. Therefore, recoveries from these fields may not match current expectations. Delays in the development of our reserves or increases in costs to drill and develop such reserves will reduce the PV-10 value of our estimated proved undeveloped reserves and future net revenues estimated for such reserves.
A significant portion of our operations are located in the Mid-Continent region, making us vulnerable to risks associated with operating in a limited number of major geographic areas.
As of
December 31, 2017
, approximately
73.5%
of our proved reserves and approximately
92.1%
of our annual production was located in the Mid-Continent. This concentration could disproportionately expose us to operational and regulatory risk in these areas. This relative lack of diversification in location of our key operations could expose us to adverse developments in the Mid-Continent or the oil and natural gas markets, including, for example, transportation or treatment capacity constraints, curtailment of production due to weather, electrical outages, treatment plant closures for scheduled maintenance, changes in the regulatory environment or other factors. These factors could have a significantly greater impact on our financial condition, results of operations and cash flows than if our properties were more diversified.
Our derivative activities could result in financial losses and reduce earnings.
To achieve a more predictable cash flow and to reduce our exposure to adverse fluctuations in the prices of oil and natural gas, we currently have entered, and may in the future enter, into derivative contracts for a portion of our future oil and natural gas production, including fixed price swaps, collars and basis swaps. We have not designated and do not plan to designate any of our derivative contracts as hedges for accounting purposes and, as a result, record all derivative contracts on our balance sheet at fair value with changes in fair value recognized in current period earnings. Accordingly, our earnings may fluctuate significantly as a result of changes in the fair value of our derivative contracts. Derivative contracts also expose us to the risk of financial loss in some circumstances, including when:
|
•
|
production is less than expected;
|
|
•
|
the counterparty to the derivative contract defaults on its contract obligations; or
|
|
•
|
the actual differential between the underlying price in the derivative contract and actual prices received is materially different from that expected.
|
In addition, these types of derivative contracts can limit the benefit we would receive from increases in the prices for oil and natural gas.
34
Oil and natural gas wells are subject to operational hazards that can cause substantial losses for which we may not be adequately insured.
There are a variety of operating risks inherent in oil, natural gas and NGL production and associated activities, such as fires, leaks, explosions, mechanical problems, major equipment failures, blowouts, uncontrollable flow of oil, natural gas and NGLs, water or drilling fluids, casing collapses, abnormally pressurized formations and natural disasters. The occurrence of any of these or similar accidents that temporarily or permanently halt the production and sale of oil, natural gas and NGLs at any of our properties could have a material adverse impact on our business activities, financial condition and results of operations.
Additionally, if any of such risks or similar accidents occur, we could incur substantial losses as a result of injury or loss of life, severe damage or destruction of property, natural resources and equipment, regulatory investigation and penalties and environmental damage and clean-up responsibility. If we experience any of these problems, our ability to conduct operations could be adversely affected. While we maintain insurance coverage that we deem appropriate for these risks, our operations may result in liabilities exceeding such insurance coverage or liabilities not covered by insurance.
Shortages or increases in costs of equipment, services and qualified personnel could adversely affect our ability to execute our exploration and development plans on a timely basis and within our budget.
The demand for qualified and experienced personnel to conduct field operations, geologists, geophysicists, engineers and other professionals in the oil and natural gas industry can fluctuate significantly, often in correlation with oil and natural gas prices, causing periodic shortages. Additionally, higher oil and natural gas prices generally stimulate demand and result in increased prices for drilling rigs, crews and associated supplies, equipment and services. Shortages of field personnel and equipment or price increases could significantly affect our ability to execute our exploration and development plans as projected.
Competition in the oil and natural gas industry is intense, which may adversely affect our ability to succeed.
The oil and natural gas industry is intensely competitive, and we compete with many companies that have greater financial and other resources than we do. Many of these companies not only explore for and produce oil and natural gas, but also conduct refining operations and market petroleum and other products on a regional, national or worldwide basis. These companies may be able to pay more for productive oil and natural gas properties and exploratory prospects or identify, evaluate, bid for and purchase a greater number of properties and prospects than our financial or human resources permit. In addition, these companies may have a greater ability to continue exploration activities during periods of low oil and natural gas market prices. Our larger competitors may be able to absorb the burden of present and future federal, state, local and other laws and regulations more easily than we can, which would adversely affect our competitive position.
Our use of 2-D and 3-D seismic data is subject to interpretation and may not accurately identify the presence of oil and natural gas. In addition, the use of such technology requires greater predrilling expenditures, which could adversely affect the results of our drilling operations.
A significant aspect of our exploration and development plan involves seismic data. Even when properly used and interpreted, 2-D and 3-D seismic data and visualization techniques are only tools used to assist geoscientists in identifying subsurface structures and hydrocarbon indicators and do not enable the interpreter to know whether hydrocarbons are present in those structures. Other geologists and petroleum professionals, when studying the same seismic data, may have significantly different interpretations than our professionals. Our drilling activities may not be geologically successful or economical, and our overall drilling success rate or our drilling success rate for activities in a particular area may not improve as a result of using 2-D and 3-D seismic data.
The use of 2-D and 3-D seismic and other advanced technologies requires greater predrilling expenditures than traditional drilling strategies, and we could incur losses due to such expenditures. In addition, we may often gather 2-D and 3-D seismic data over large areas in order to help us delineate those portions of an area that we believe are desirable for drilling. Therefore, we may choose not to acquire option or lease rights prior to acquiring seismic data, and in many cases, we may identify hydrocarbon indicators before seeking option or lease rights in such location. If we are not able to lease those locations on acceptable terms, we will have made substantial expenditures to acquire and analyze 2-D and 3-D seismic data without having an opportunity to benefit from those expenditures.
We are subject to complex federal, state, local and other laws and regulations that could adversely affect the cost, manner or feasibility of conducting our operations or expose us to significant liabilities.
Our oil and natural gas exploration, production, transportation and treatment operations are subject to complex and stringent laws and regulations. In order to conduct our operations in compliance with these laws and regulations, we must obtain and maintain numerous permits, approvals and certificates from various federal, state and local governmental authorities. We may incur substantial costs in order to maintain compliance with these laws and regulations. As a result of recent incidents involving
35
the release of oil and natural gas and fluids as a result of drilling activities in the United States, there have been a variety of regulatory initiatives at the federal and state levels to restrict oil and natural gas drilling operations in certain locations. Any increased regulation or suspension of oil and natural gas exploration and production, or revision or reinterpretation of existing laws and regulations, that arises out of these incidents or otherwise could result in delays and higher operating costs. Such costs or significant delays could have a material adverse effect on our business, financial condition and results of operations. We must also comply with laws and regulations prohibiting fraud and market manipulations in energy markets. To the extent we are a shipper on interstate pipelines, we must comply with the FERC-approved tariffs of such pipelines and with federal policies related to the use of interstate capacity.
Laws and regulations governing oil and natural gas exploration and production may also affect production levels. We are required to comply with federal and state laws and regulations governing conservation matters, including provisions related to the unitization or pooling of our oil and natural gas properties; the establishment of maximum rates of production from wells; the spacing of wells; and the plugging and abandonment of wells. These and other laws and regulations can limit the amount of oil and natural gas we can produce from our wells, limit the number of wells we can drill, or limit the locations at which we can conduct drilling operations.
New laws or regulations, or changes to existing laws or regulations, may unfavorably impact us, could result in increased operating costs and could have a material adverse effect on our financial condition and results of operations. In addition, the Dodd-Frank Wall Street Reform and Consumer Protection Act (the “Dodd-Frank Act”) and rules promulgated thereunder could reduce trading positions in the energy futures or swaps markets and materially reduce hedging opportunities for us, which could adversely affect our revenues and cash flows during periods of low commodity prices, and which could adversely affect our ability to restructure hedges when it might be desirable to do so.
Additionally, state and federal regulatory authorities may expand or alter applicable pipeline safety laws and regulations, compliance with which may increase capital costs for us and third-party downstream oil and natural gas transporters. These and other potential regulations could increase our operating costs, reduce our liquidity, delay our operations, increase direct and third-party post production costs or otherwise alter the way we conduct our business, which could have a material adverse effect on our financial condition, results of operations and cash flows and which could reduce cash received by or available for distribution, including any amounts paid for transportation on downstream interstate pipelines.
Should we fail to comply with all applicable statutes, rules, regulations and orders of the FERC, the CFTC, or the FTC, we could be subject to substantial penalties and fines.
Under the EPAct 2005 and implementing regulations, the FERC prohibits market manipulation in connection with the purchase or sale of natural gas. The CFTC has similar authority under the Commodity Exchange Act and regulations it has promulgated thereunder with respect to certain segments of the physical and futures energy commodities market including oil and natural gas. The FTC also prohibits manipulative or fraudulent conduct in the wholesale petroleum market with respect to sales of commodities, including crude oil, condensate and natural gas liquids. These agencies have substantial enforcement authority, including the ability to impose penalties for current violations in excess of $1 million per day for each violation. The FERC has also imposed requirements related to reporting of natural gas sales volumes that may impact the formation of prices indices. Additional rules and legislation pertaining to these and other matters may be considered or adopted from time to time. Our failure to comply with these or other laws and regulations administered by these agencies could subject us to criminal and civil penalties, as described in Item 1. “Business— Other Regulation of the Oil and Natural Gas Industry.”
Our operations are subject to environmental and occupational safety and health laws and regulations that could adversely affect the cost, manner or feasibility of conducting operations or result in significant costs and liabilities.
Our oil and natural gas exploration and production operations are subject to stringent and complex federal, state, tribal, regional and local laws and regulations governing worker safety and health, the discharge and disposal of substances into the environment or otherwise relating to environmental protection. Failure to comply with these laws and regulations may result in litigation; the assessment of sanctions, including administrative, civil or criminal penalties; the imposition of investigatory, remedial or corrective action obligations; the occurrence of delays or restrictions in permitting or performance of projects; and the issuance of orders and injunctions limiting or preventing some or all of our operations in affected areas.
Under certain environmental laws and regulations, we could be subject to strict, and/or joint and several liability for the investigation, removal or remediation of previously released materials or property contamination, regardless of whether we were responsible for the release or contamination or whether the operations were in compliance with all applicable laws at the time those actions were taken. Private parties, including the owners of properties upon which our wells are drilled or facilities where
36
our petroleum hydrocarbons or wastes are taken for reclamation or disposal may also have the right to pursue legal actions to enforce compliance, to seek damages for contamination, for personal injury, natural resources damage or property damage.
Changes in environmental laws and regulations occur frequently, and any changes that result in delays or restrictions in permitting or development of projects or more stringent or costly construction, drilling, water management, or completion activities or waste handling, storage, transport, remediation or disposal, emission or discharge requirements could require significant expenditures by us to attain and maintain compliance and may otherwise have a material adverse effect on our results of operations, competitive position or financial condition.
Federal, state and local legislative and regulatory initiatives relating to hydraulic fracturing could result in increased costs and additional operating restrictions or delays and adversely affect our production.
Hydraulic fracturing is an important and common practice that is used to stimulate production of hydrocarbons from tight formations. The process involves the injection of water, sand and additives under pressure into targeted subsurface formations to stimulate oil and natural gas production. We routinely utilize hydraulic fracturing techniques in the majority of our drilling and completion programs. The process is typically regulated by state oil and gas commissions, but several federal agencies have asserted regulatory authority over certain aspects of the process. For example, the EPA published permitting guidance in February 2014 addressing the use of diesel fuel in fracturing operations: issued CAA final regulations in 2012 and additional CAA regulations in June 2016 governing performance standards for the oil and natural gas industry; and in June 2016 issued final effluent limitations guidelines under the CWA that waste water from shale natural gas extraction operations must meet before discharging to a publicly-owned treatment plant. The EPA also issued an Advance Notice of Proposed Rulemaking under TSCA in 2014 regarding reporting of the chemical substances and mixtures used in hydraulic fracturing, but, to date, has taken no further action. Separately, the BLM published a final rule in March 2015 that establishes new or more stringent standards for performing hydraulic fracturing on federal and Indian lands. However, the U.S. District Court of Wyoming struck down this rule in June 2016. The June 2016 decision was appealed to the U.S. Circuit Court of Appeals for the Tenth Circuit. However, following issuance of a presidential executive order to review rules related to the energy industry, in July 2017, the BLM published a proposed rule to rescind the 2015 final rule. In September 2017, the Tenth Circuit issued a ruling to vacate the Wyoming trial court decision and dismiss the lawsuit challenging the 2015 rule in light of the BLM’s proposed rulemaking. The BLM issued a final rule repealing the 2015 hydraulic fracturing rule in December 2017.
From time to time, the U.S. Congress has considered adopting legislation intended to provide for federal regulation of hydraulic fracturing and to require disclosure of the chemicals used in the hydraulic fracturing process but, at this time, federal legislation related to hydraulic fracturing appears unlikely. In addition, certain states, including Oklahoma and Colorado, have adopted regulations that could impose new or more stringent permitting, disclosure, and well-construction requirements on hydraulic fracturing operations. If new laws or regulations that significantly restrict or regulate hydraulic fracturing are adopted at the local, state or federal level, fracturing activities with respect to our properties could become subject to additional permit requirements, reporting requirements or operational restrictions, which may result in permitting delays and potential increases in costs. These delays or additional costs could adversely affect the determination of whether a well is commercially viable. Restrictions on hydraulic fracturing could also reduce the amount of oil, natural gas or NGLs that are ultimately produced in commercial quantities from our properties.
Legislation or regulatory initiatives intended to address seismic activity are restricting and could restrict our ability to dispose of saltwater produced alongside our hydrocarbons, which could limit our ability to produce oil and natural gas economically and have a material adverse effect on our business.
Large volumes of saltwater produced alongside our oil, natural gas and NGLs in connection with drilling and production operations are disposed of pursuant to permits issued by governmental authorities overseeing such disposal activities. While these permits are issued pursuant to existing laws and regulations, these legal requirements are subject to change, which could result in the imposition of more stringent operating constraints or new monitoring and reporting requirements, owing to, among other things, concerns of the public or governmental authorities regarding such gathering or disposal activities.
Evaluation of seismic incidents and whether or to what extent those events are induced by the injection of saltwater into disposal wells continues to evolve, as governmental authorities consider new and/or past seismic incidents in areas where salt water disposal activities occur or are proposed to be performed. The adoption of any new laws, regulations, or directives that restrict our ability to dispose of saltwater generated by production and development activities, whether by plugging back the depths of disposal wells, reducing the volume of salt water disposed in such wells, restricting disposal well locations or otherwise, or by requiring us to shut down disposal wells, which could negatively affect the economic lives of our properties.
Refer to “—Environmental Regulations— Subsurface Injections” included in Item 1 of this report for additional discussion of the current and potential impacts of legislation or regulatory initiatives related to seismic activity on the Company.
37
Climate change laws and regulations restricting emissions of GHGs could result in increased operating costs and reduced demand for the oil and natural gas that the Company produces.
The EPA has published its findings that emissions of GHGs present a danger to public health and the environment because such gases are, according to the EPA, contributing to warming of the Earth’s atmosphere and other climatic changes. Based on these findings, the EPA has adopted various rules to address GHG emissions under existing provisions of the CAA. For example, the EPA has adopted rules requiring the reporting of GHG emissions from various oil and natural gas operations on an annual basis, which includes certain of our operations. In addition, in June 2016, the EPA finalized rules to reduce methane emissions from new, modified or reconstructed sources in the oil and natural gas sector, including implementation of an LDAR program to minimize methane emissions, under the CAA’s New Source Performance Standards Quad Oa. However, over the past year the EPA has taken several steps to delay implementation of the Quad Oa standards, and the agency proposed a rulemaking in June 2017 to stay the requirements for a period of two years and revisit implementation of Quad Oa in its entirety. The EPA has not yet published a final rule but, as a result of these developments, future implementation of the 2016 standards is uncertain at this time.
In addition, in November 2016, the BLM issued final rules to reduce methane emissions from venting, flaring, and leaks during oil and gas operations on public lands that are substantially similar to the EPA Quad Oa requirements. However, on December 8, 2017, the BLM published a final rule to temporarily suspend or delay certain requirements contained in the November 2016 final rule until January 17, 2019, including those requirements relating to venting, flaring and leakage from oil and gas production activities. While, as a result of these developments, future implementation of the EPA and BLM methane rules is uncertain, given the long-term trend towards increasing regulation, future federal GHG regulations of the oil and gas industry remain a possibility. Moreover, several states, including Colorado, where we operate, have already adopted rules requiring operators of both new and existing sources to develop and implement LDAR program and install devices on certain equipment to capture 95% of methane emissions.
Compliance with these rules could require us to purchase pollution control equipment, optical gas imaging equipment for LDAR inspections, and to hire additional personnel to assist with inspection and reporting requirements.
In addition, there are a number of state and regional efforts that are aimed at tracking and/or reducing GHG emissions by means of cap and trade programs that typically require major sources of GHG emissions to acquire and surrender emission allowances in return for emitting those GHGs. On an international level, the United States was one of almost 200 nations that agreed in December 2015 to the Paris Agreement. However, the Paris Agreement did not impose any binding obligations on the United States. Moreover, in June 2017, President Trump stated that the United States would withdraw from the Paris Agreement
but may enter into a future international agreement related to GHGs. In August 2017, the U.S. State Department officially informed the United Nations of the intent of the United States to withdraw from the Paris Agreement. The United States’ adherence to the exit process is uncertain and/or the terms on which the United States may reenter the Paris Agreement or a separately negotiated agreement are unclear at this time.
The adoption and implementation of any laws or regulations imposing reporting obligations on, or limiting emissions of GHGs from, our equipment and operations could require us to incur additional costs to monitor, report and potentially reduce emissions of GHGs associated with its operations or could adversely affect demand for the oil and natural gas that we produce, and thus possibly have a material adverse effect on our revenues, as well as having the potential effect of lowering the value of our reserves. Recently, activists concerned about the potential effects of climate change have directed their attention at sources of funding for fossil-fuel energy companies, which has resulted in certain financial institutions, funds and other sources of capital restricting or eliminating their investment in oil and natural gas activities. Ultimately, this could make it more difficult to secure funding for exploration and production activities. Notwithstanding potential risks related to climate change, the International Energy Agency estimates that global energy demand will continue to rise and will not peak until after 2040 and that oil and gas will continue to represent a substantial percentage of global energy use over that time. Finally, to the extent increasing concentrations of GHGs in the Earth’s atmosphere may produce climate changes that could have significant physical effects, such as increased frequency and severity of storms, droughts, floods and other climatic events, such events could have a material adverse effect on our assets and operations, and potentially subject us to greater regulation.
Repercussions from terrorist activities or armed conflict could harm our business.
Terrorist activities, anti-terrorist efforts or other armed conflict involving the United States or its interests abroad may adversely affect the United States and global economies and could prevent us from meeting our financial and other obligations. If events of this nature occur and persist, the attendant political instability and societal disruption could reduce overall demand for oil and natural gas, potentially putting downward pressure on prevailing oil and natural gas prices and causing a reduction in our revenues. Oil and natural gas production facilities, transportation systems and storage facilities could be direct targets of terrorist attacks, and/or operations could be adversely impacted if infrastructure integral to our operations is destroyed by such an
38
attack. Costs for insurance and other security may increase as a result of these threats, and some insurance coverage may become more difficult to obtain, if available at all.
Our failure to maintain an adequate system of internal control over financial reporting, could adversely affect our ability to accurately report our results.
Management is responsible for establishing and maintaining adequate internal control over financial reporting. Our internal control over financial reporting is a process designed to provide reasonable assurance regarding the reliability of financial reporting and the preparation of financial statements in accordance with generally accepted accounting principles. A material weakness is a deficiency, or a combination of deficiencies, in our internal control over financial reporting that results in a reasonable possibility that a material misstatement of the annual or interim financial statements will not be prevented or detected on a timely basis. Effective internal controls are necessary for us to provide reliable financial reports and deter and detect any material fraud. If we cannot provide reliable financial reports or prevent material fraud, our reputation and operating results would be harmed. We maintained effective internal control over financial reporting as of December 31, 2017, as further described in Part II “Item 9A—Controls and Procedures” and “Management’s Report on Internal Control over Financial Reporting.” Our efforts to develop and maintain our internal controls and to remediate material weaknesses in our controls may not be successful, and we may be unable to maintain adequate controls over our financial processes and reporting in the future, including future compliance with the obligations under Section 404 of the Sarbanes-Oxley Act of 2002. Any failure to develop or maintain effective controls, or difficulties encountered in their implementation, including those related to acquired businesses, or other effective improvement of our internal controls could harm our operating results. Ineffective internal controls could also cause investors to lose confidence in our reported financial information.
New derivatives legislation and regulation could adversely affect our ability to hedge risks associated with its business.
The Dodd-Frank Act created a new regulatory framework for oversight of derivatives transactions by the CFTC and the SEC. Among other things, the Dodd-Frank Act subjects certain swap participants to new capital, margin and business conduct standards. In addition, the Dodd-Frank Act contemplates that where appropriate in light of outstanding exposures, trading liquidity and other factors, swaps (broadly defined to include most hedging instruments other than futures) will be required to be cleared through a registered clearing facility and traded on a designated exchange or swap execution facility, unless the “end-user” exception from clearing applies. The Dodd-Frank Act also established a new Energy and Environmental Markets Advisory Committee to make recommendations to the CFTC regarding matters of concern to exchanges, firms, end users and regulators with respect to energy and environmental markets and also expands the CFTC’s power to impose position limits on specific categories of swaps (excluding swaps entered into for
bona fide
hedging purposes).
There are some exceptions to these requirements for entities that use swaps to hedge or mitigate commercial risk. However, although we may qualify for exceptions, our derivatives counterparties may be subject to new capital, margin and business conduct requirements imposed as a result of the Dodd-Frank Act, which may increase our transaction costs or make it more difficult for us to enter into hedging transactions on favorable terms.
The full impact of the Dodd-Frank Act and related regulatory requirements upon our business will not be known until the regulations are implemented and the market for derivatives contracts has adjusted. The Dodd-Frank Act and any new regulations could significantly increase the cost of derivative contracts, materially alter the terms of derivative contracts, reduce the availability of derivatives to protect against risks we encounter and reduce our ability to monetize or restructure our existing derivative contracts. If we reduce our use of derivatives as a result of the Dodd-Frank Act and regulations, our results of operations may become more volatile and our cash flows may be less predictable, which could adversely affect our ability to plan for and fund capital expenditures. Finally, the Dodd-Frank Act was intended, in part, to reduce the volatility of oil and gas prices, which some legislators attributed to speculative trading in derivatives and commodity instruments related to oil and gas. Our revenues could therefore be adversely affected if a consequence of the Dodd-Frank Act and implementing regulations is to lower commodity prices. Any of these consequences could have a material adverse effect on us, our financial condition and our results of operations. In addition, the European Union and other non-U.S. jurisdictions are implementing regulations with respect to the derivatives market. To the extent we transact with counterparties in foreign jurisdictions, we may become subject to such regulations. At this time, the impact of such regulations is not clear.
The future of the CFTC's rulemaking remains uncertain under the new presidential administration. Recent rule proposals by the CFTC suggest that final consideration of major proposed rules will be made by the new administration. During the last quarter of 2016, the CFTC decided to re-propose, rather than finalize, certain regulations, including (a) limitations on speculative futures and swap positions, (b) regulations on automated trading algorithms and (c) limitations on swap capital requirements for swap dealers and major swap participants. In December 2016, the Chairman of the CFTC stated that the CFTC decided to re-propose, rather than finalize, the above regulations, in part based on the uncertainty over the next presidential administration. It
39
is also uncertain whether the current Chairman of the CFTC and other CFTC staff will remain with the CFTC under the new presidential administration. The current Chairman's term expires in April 2017, and two seats are currently open for new appointees, leaving the CFTC's future rulemaking unclear.
Cyber-attacks or other failures in telecommunications or IT systems could result in information theft, data corruption and significant disruption of our business operations.
In recent years, we have increasingly relied on information technology systems and networks in connection with our business activities, including certain of our exploration, development and production activities. We rely on digital technology, including information systems and related infrastructure, as well as cloud applications and services, to, among other things, estimate quantities of oil and natural gas reserves, analyze seismic and drilling information, process and record financial and operating data and communicate with employees and third parties. As dependence on digital technologies has increased, cyber incidents, including deliberate attacks and attempts to gain unauthorized access to computer systems and networks, have increased in frequency and sophistication. These threats pose a risk to the security of our systems and networks, the confidentiality, availability and integrity of our data and the physical security of our employees and assets. We have experienced, and expect to continue to confront, attempts from hackers and other third parties to gain unauthorized access to our information technology systems and networks. Although prior cyber-attacks have not had a material adverse impact on our operations or financial performance, there can be no assurance that we will be successful in preventing cyber-attacks or successfully mitigating their effect. Any cyber-attack could have a material adverse effect on our reputation, competitive position, business, financial condition and results of operations. Cyber-attacks or security breaches also could result in litigation or regulatory action, as well as significant additional expense to implement further data protection measures.
In addition to the risks presented to our systems and networks, cyber-attacks affecting oil and natural gas distribution systems maintained by third parties, or the networks and infrastructure on which they rely, could delay or prevent delivery of our production to markets. A cyber-attack of this nature would be outside our control, but could have a material, adverse effect on our business, financial condition and results of operations.
Risk Relating to Our Emergence from Bankruptcy
Our historical financial information may not be indicative of future financial performance.
Our capital structure was significantly impacted by the Plan of Reorganization (as defined below). Under fresh-start reporting rules that applied to us upon the Emergence Date, assets and liabilities were adjusted to fair values and our accumulated deficit was restated to zero. Accordingly, because fresh-start reporting rules applied, our financial condition and results of operations following emergence from Chapter 11 will not be comparable to the financial condition and results of operations reflected in our historical financial statements.
The exercise of all or any number of outstanding Warrants or the issuance of stock-based awards may dilute your holding of shares of our common stock.
As of the date of filing this report, we have outstanding Warrants (as defined in Part IV. Note 1 - Voluntary Reorganization under Chapter 11 Proceedings) to purchase approximately 6.6 million shares of our common stock at average exercise prices of either $41.34 and $42.03 per share. In addition, we have as of the date of this report, 3.0 million shares of common stock reserved for future issuance under the SandRidge Energy, Inc. 2016 Omnibus Incentive Plan (the, “Omnibus Incentive Plan”). The exercise of equity awards, including any stock options that we may grant in the future, the Warrants, and the sale of shares of our common stock underlying any such options or the Warrants, could have an adverse effect on the market for our common stock, including the price that an investor could obtain for their shares. Investors may experience dilution in the net tangible book value of their investment upon the exercise of the Warrants and any stock options that may be granted or issued pursuant to the Omnibus Incentive Plan in the future.
40
Item 1B.
Unresolved Staff Comments
None.
Item 2.
Properties
Information regarding the Company’s properties is included in Item 1.
Item 3.
Legal Proceedings
On October 14, 2016, Lisa West and Stormy Hopson filed an amended class action complaint in the United States District Court for the Western District of Oklahoma against SandRidge Exploration and Production, LLC, among other defendants. In their amended complaint, plaintiffs asserted various tort claims seeking relief for damages, including the reimbursement of past and future earthquake insurance premiums, resulting from seismic activity allegedly caused by the defendants’ operation of wastewater disposal wells. The court dismissed the plaintiffs’ amended complaint on May 12, 2017, but permitted the plaintiffs to file a second amended complaint. On July 18, 2017, the plaintiffs filed a second amended class action complaint making allegations substantially similar to those contained in the amended complaint that was previously dismissed. An estimate of reasonably possible losses associated with this action cannot be made at this time, and the Company has not established any reserves relating to this action.
In addition to the matter described above, the Company is involved in various lawsuits, claims and proceedings which are being handled and defended by the Company in the ordinary course of business.
Item 4.
Mine Safety Disclosures
Not applicable.
41
|
Item 5.
|
Market for Registrant’s Common Equity, Related Stockholder Matters and Issuer Purchases of Equity Securities
|
PRICE RANGE OF COMMON STOCK
From October 4, 2016 through December 31, 2017, the Successor Company’s common stock was listed on the New York Stock Exchange (“NYSE”) under the symbol “SD.” During the period from January 7, 2016 through October 3, 2016, our common stock was quoted for public trading on the Pink Sheets quotations system, an over-the-counter market, under the symbol “SDOCQ.PK.” The over-the-counter market quotations reflect inter-dealer prices, without retail mark-up, mark-down or commission and may not necessarily represent actual transactions. Prior to January 7, 2016, the Predecessor Company’s common stock was also listed on the NYSE under the symbol “SD.”
The range of high and low sales prices for the Successor Company’s and the Predecessor Company’s respective common stock for the periods indicated, as reported by the NYSE and the Pink Sheets quotations system, is as follows:
|
Successor Company
|
High
|
Low
|
|||||
|
2017
|
|||||||
|
Fourth Quarter
|
$
|
21.50
|
|
$
|
14.65
|
|
|
|
Third Quarter
|
$
|
20.62
|
|
$
|
16.63
|
|
|
|
Second Quarter
|
$
|
20.72
|
|
$
|
15.03
|
|
|
|
First Quarter
|
$
|
23.96
|
|
$
|
16.80
|
|
|
|
2016
|
|||||||
|
Fourth Quarter (from October 4, 2016 through December 31, 2016)
|
$
|
26.85
|
|
$
|
15.75
|
|
|
|
Predecessor Company
|
|||||||
|
Fourth Quarter (through October 3, 2016)
|
$
|
0.02
|
|
$
|
0.01
|
|
|
|
Third Quarter
|
$
|
0.06
|
|
$
|
—
|
|
|
|
Second Quarter
|
$
|
0.11
|
|
$
|
0.01
|
|
|
|
First Quarter
|
$
|
0.20
|
|
$
|
0.03
|
|
|
On
February 15, 2018
, there were
287
record holders of the Company’s common stock.
We have neither declared nor paid any cash dividends on either the Predecessor or the Successor Company’s respective common stock, and we do not anticipate declaring any dividends on our common stock in the foreseeable future. We expect to retain cash for the operation and expansion of our business, including exploration, development and production activities. In addition, the terms of the Successor Company’s indebtedness restrict our ability to pay dividends to our common stock holders. If our dividend policy were to change in the future, our ability to pay dividends would be subject to these restrictions and the Company’s then-existing conditions, including results of operations, financial condition, contractual obligations, capital requirements, business prospects and other factors deemed relevant by the Successor Company’s board of directors. See further discussion of the risks and uncertainties surrounding the payment of dividends in “Risk Factors” in Item 1A of this report.
42
PERFORMANCE GRAPH
The following graph compares the cumulative total return to stockholders on SandRidge common stock relative to the cumulative total returns of the S&P Oil and Gas Exploration and Production Index and the S&P 500 Index from October 4, 2016 through December 31, 2017. The graph assumes that the value of the investment in the Successor Company’s common stock and in each of the indexes was $100.00 on October 4, 2016, the date the Successor Company’s common stock began trading.
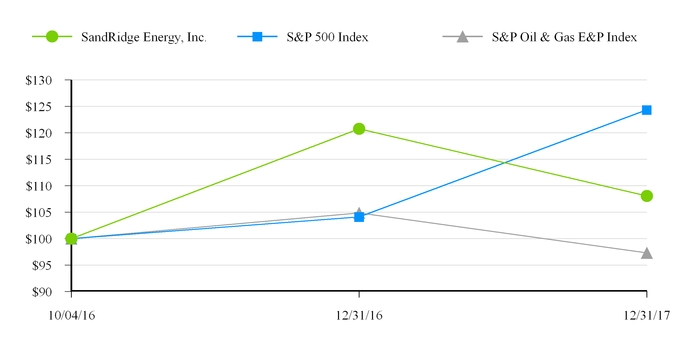
The following graph compares the cumulative total return to stockholders on SandRidge common stock relative to the cumulative total returns of the S&P Oil and Gas Exploration and Production Index and the S&P 500 Index from January 1, 2013 through October 3, 2016. The graph assumes that the value of the investment in the Predecessor Company’s common stock and in each of the indexes was $100.00 on January 1, 2013.
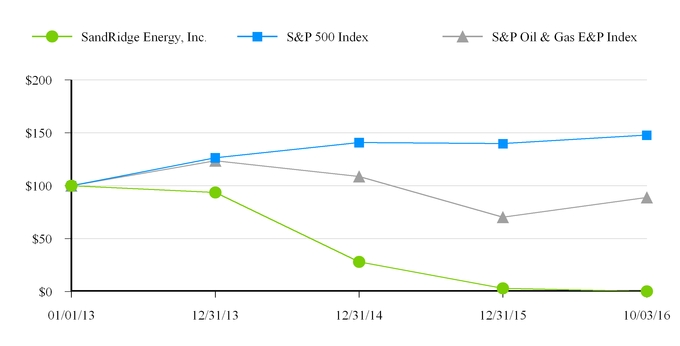
The performance graphs above are furnished and not filed for purposes of Section 18 of the Exchange Act and will not be incorporated by reference into any registration statement filed under the Securities Act unless specifically identified therein as being incorporated therein by reference. The performance graphs are not soliciting material subject to Regulation 14A.
43
ISSUER PURCHASES OF EQUITY SECURITIES
The following table presents a summary of share repurchases made during the three-month period ended
December 31, 2017
.
|
Total Number of Shares Purchased(1)
|
Average Price
Paid per Share
|
Total Number of Shares Purchased as Part of Publicly Announced Program
|
Maximum Approximate Dollar Value of Shares that May Yet Be Purchased Under the Program (In millions)
|
||||||||
|
Period
|
|||||||||||
|
October 1, 2017 — October 31, 2017
|
153,408
|
|
$
|
19.10
|
|
N/A
|
|
N/A
|
|||
|
November 1, 2017 — November 30, 2017
|
—
|
|
$
|
—
|
|
N/A
|
|
N/A
|
|||
|
December 1, 2017 — December 31, 2017
|
1,611
|
|
$
|
21.07
|
|
N/A
|
|
N/A
|
|||
|
Total
|
155,019
|
|
—
|
|
|||||||
____________________
|
(1)
|
Includes shares of common stock tendered by employees in order to satisfy tax withholding requirements upon vesting of their stock awards.
|
44
Item 6.
Selected Financial Data
The following table sets forth, as of the dates and for the periods indicated, our selected financial information, which is derived from our audited consolidated financial statements for the respective periods. The information should be read in conjunction with “Management’s Discussion and Analysis of Financial Condition and Results of Operations” in Item 7 of this report and our consolidated financial statements and notes thereto contained in “Financial Statements and Supplementary Data” in Item 8 of this report. The following information is not necessarily indicative of future results.
|
Successor
|
Predecessor
|
|||||||||||||||||||||||
|
|
Year Ended December 31,
|
Period from October 2, 2016 through December 31,
|
Period from January 1, 2016 through October 1,
|
Year Ended December 31,
|
||||||||||||||||||||
|
|
2017
|
2016
|
2016
|
2015
|
2014
|
2013
|
||||||||||||||||||
|
Statement of Operations Data
(in thousands, except per share data)
|
||||||||||||||||||||||||
|
Revenues
|
$
|
357,299
|
|
$
|
98,456
|
|
$
|
293,809
|
|
$
|
768,709
|
|
$
|
1,558,758
|
|
$
|
1,983,388
|
|
||||||
|
Total operating expenses(1)
|
317,668
|
|
434,801
|
|
|
1,200,012
|
|
5,411,387
|
|
968,534
|
|
2,152,389
|
|
|||||||||||
|
Income (loss) from operations
|
39,631
|
|
(336,345
|
)
|
|
(906,203
|
)
|
(4,642,678
|
)
|
590,224
|
|
(169,001
|
)
|
|||||||||||
|
Other (expense) income
|
||||||||||||||||||||||||
|
Interest expense
|
(3,868
|
)
|
(372
|
)
|
(126,099
|
)
|
(321,421
|
)
|
(244,109
|
)
|
(270,234
|
)
|
||||||||||||
|
Gain (loss) on extinguishment of debt
|
—
|
|
—
|
|
41,179
|
|
641,131
|
|
—
|
|
(82,005
|
)
|
||||||||||||
|
Reorganization items
|
—
|
|
—
|
|
2,430,599
|
|
—
|
|
—
|
|
—
|
|
||||||||||||
|
Other income, net
|
2,550
|
|
2,744
|
|
1,332
|
|
2,040
|
|
3,490
|
|
12,445
|
|
||||||||||||
|
Total other (expense) income
|
(1,318
|
)
|
2,372
|
|
|
2,347,011
|
|
321,750
|
|
(240,619
|
)
|
(339,794
|
)
|
|||||||||||
|
Income (loss) before income taxes
|
38,313
|
|
(333,973
|
)
|
|
1,440,808
|
|
(4,320,928
|
)
|
349,605
|
|
(508,795
|
)
|
|||||||||||
|
Income tax (benefit) expense
|
(8,749
|
)
|
9
|
|
11
|
|
123
|
|
(2,293
|
)
|
5,684
|
|
||||||||||||
|
Net income (loss)
|
47,062
|
|
(333,982
|
)
|
|
1,440,797
|
|
(4,321,051
|
)
|
351,898
|
|
(514,479
|
)
|
|||||||||||
|
Less: net (loss) income attributable to noncontrolling interest
|
—
|
|
—
|
|
—
|
|
(623,506
|
)
|
98,613
|
|
39,410
|
|
||||||||||||
|
Net income (loss)attributable to SandRidge Energy, Inc.
|
47,062
|
|
(333,982
|
)
|
|
1,440,797
|
|
(3,697,545
|
)
|
253,285
|
|
(553,889
|
)
|
|||||||||||
|
Preferred stock dividends
|
—
|
|
—
|
|
16,321
|
|
37,950
|
|
50,025
|
|
55,525
|
|
||||||||||||
|
Income available (loss applicable) to SandRidge Energy, Inc. common stockholders
|
$
|
47,062
|
|
$
|
(333,982
|
)
|
|
$
|
1,424,476
|
|
$
|
(3,735,495
|
)
|
$
|
203,260
|
|
$
|
(609,414
|
)
|
|||||
|
Earnings (loss) per share
|
||||||||||||||||||||||||
|
Basic
|
$
|
1.45
|
|
$
|
(17.61
|
)
|
$
|
2.01
|
|
$
|
(7.16
|
)
|
$
|
0.42
|
|
$
|
(1.27
|
)
|
||||||
|
Diluted
|
$
|
1.44
|
|
$
|
(17.61
|
)
|
$
|
2.01
|
|
$
|
(7.16
|
)
|
$
|
0.42
|
|
$
|
(1.27
|
)
|
||||||
____________________
|
(1)
|
Includes full cost ceiling limitation impairments of $319.1 million, $657.4 million, $4.5 billion and $164.8 million for the Successor 2016 Period, the Predecessor 2016 Period and the years ended December 31, 2015 and 2014, respectively. No full cost ceiling limitation impairments were recorded for the years ended December 31, 2017 and December 31, 2013.
|
45
|
Successor
|
Predecessor
|
|||||||||||||||||||
|
|
As of December 31,
|
As of December 31,
|
||||||||||||||||||
|
|
2017
|
2016
|
2015
|
2014
|
2013
|
|||||||||||||||
|
Balance Sheet Data
(in thousands)
|
||||||||||||||||||||
|
Cash and cash equivalents
|
$
|
99,143
|
|
$
|
121,231
|
|
$
|
435,588
|
|
$
|
181,253
|
|
$
|
814,663
|
|
|||||
|
Property, plant and equipment, net
|
$
|
923,240
|
|
$
|
817,932
|
|
$
|
2,234,702
|
|
$
|
6,215,057
|
|
$
|
6,307,675
|
|
|||||
|
Total assets(1)
|
$
|
1,119,627
|
|
$
|
1,081,392
|
|
$
|
2,922,027
|
|
$
|
7,211,823
|
|
$
|
7,630,307
|
|
|||||
|
Total debt(1)
|
$
|
37,502
|
|
$
|
305,308
|
|
$
|
3,562,378
|
|
$
|
3,148,034
|
|
$
|
3,140,419
|
|
|||||
|
Total stockholders’ equity (deficit)
|
$
|
839,940
|
|
$
|
512,917
|
|
$
|
(1,187,733
|
)
|
$
|
3,209,820
|
|
$
|
3,175,627
|
|
|||||
|
Total liabilities and stockholders’ equity (deficit)
|
$
|
1,119,627
|
|
$
|
1,081,392
|
|
$
|
2,922,027
|
|
$
|
7,211,823
|
|
$
|
7,630,307
|
|
|||||
____________________
|
(1)
|
Reflects the reclassification of certain debt issuance costs from other assets to long-term debt of $69.1 million, $47.4 million and $54.5 million for the years ended December 31, 2015, 2014 and 2013, respectively, as a result of the retrospective adoption of ASU 2015-03 on January 1, 2016. See “Note 3 - Accounting Policies and Procedures” included in Item 8 of this report for further discussion of the classification of debt issuance costs.
|
There have been no cash dividends declared or paid on either the Predecessor or Successor Company’s common stock.
46
Item 7.
Management’s Discussion and Analysis of Financial Condition and Results of Operations
The following discussion and analysis is intended to help the reader understand our business, financial condition, results of operations, liquidity and capital resources. This discussion and analysis should be read in conjunction with other sections of this report, including: “Business” in Item 1, “Selected Financial Data” in Item 6 and “Financial Statements and Supplementary Data” in Item 8. Our discussion and analysis includes the following subjects:
|
•
|
Overview;
|
|
•
|
Consolidated Results of Operations;
|
|
•
|
Liquidity and Capital Resources;
|
|
•
|
Valuation Allowance; and
|
|
•
|
Critical Accounting Policies and Estimates.
|
Overview
We are an oil and natural gas company with a principal focus on exploration and production activities in the U.S. Mid-Continent and North Park Basin of Colorado. Our North Park Basin properties were acquired during the fourth quarter of 2015.
Basis of Presentation
We emerged from Chapter 11 and applied fresh start accounting in October 2016; however, this reorganization did not result in the divestiture of any of our oil and natural gas properties. As a result, certain operating results and key operating performance measures, including those related to production, average oil and natural gas selling prices, revenues and lease operating expenses, were not significantly impacted and certain of the combined operating results of the Predecessor 2016 Period and the Successor 2016 Period during the year ended December 31, 2016, are still comparable with certain operating results in the other years presented. Accordingly, we believe that discussing the combined results of operations and cash flows of the Predecessor Company and the Successor Company for the two periods in 2016 is useful when analyzing certain performance measures. For items that are not comparable, we have included additional analysis to supplement the discussion.
Presentation of Royalty Trust Activities.
We adopted the provisions of ASU 2015-02 “Amendments to the Consolidation Analysis,” effective January 1, 2016, which resulted in the determination that the Royalty Trusts no longer qualify as VIEs. As a result, the activities of the Royalty Trusts have been proportionately consolidated for the year ended December 31, 2017, the Predecessor 2016 Period and the Successor 2016 Period. Under the proportionate consolidation method, only our share of each Royalty Trust’s asset, liabilities, revenues and expenses are recorded within the appropriate classifications in the accompanying consolidated financial statements. We adopted the provisions of ASU 2015-02 by recording a cumulative-effect adjustment to equity as of January 1, 2016. As such, the financial information presented for the year ended December 31, 2015 has not been restated and includes 100% of the activities of the Royalty Trusts with activities attributable to third-party ownership interests presented as noncontrolling interest.
2017 Operational Activities and Recent Events
Operational highlights for 2017 include the following:
|
•
|
Total production for
2017
was comprised of approximately
27.9%
oil,
49.5%
natural gas and
22.6%
NGLs compared to
28.5%
oil,
49.0%
natural gas and
22.5%
NGLs in
2016
.
|
|
•
|
Increased the total rigs drilling to four at
December 31, 2017
from
one
at December 31, 2016.
|
|
•
|
Drilled 17 wells in the Mid-Continent and 6 wells in the North Park Basin in 2017 compared to drilling 16 wells in the Mid-Continent and 10 wells in the North Park Basin in 2016, respectively.
|
|
•
|
In the third quarter of 2017, we entered into a $200.0 million drilling participation agreement with a Counterparty to jointly develop new horizontal wells on a wellbore only basis within certain dedicated sections of our undeveloped leasehold acreage within the NW STACK. See “Note
5
- Recent Transactions” to the accompanying unaudited condensed consolidated financial statements for additional discussion of the drilling participation agreement.
|
47
|
•
|
In November 2017, we announced our entry into a definitive merger agreement with Bonanza Creek Energy, Inc. (“Bonanza Creek”), whereby we would acquire all of the outstanding shares of common stock of Bonanza Creek in a cash and stock transaction valued at $36.00 per share. In December 2017, after consultation with our largest shareholders, we announced the mutual termination of this agreement. We incurred approximately $8.2 million in costs related to this terminated transaction through December 31, 2017.
|
|
•
|
On February 6, 2018, we received an unsolicited proposal from Midstates Petroleum Company, Inc. (“Midstates”) to combine SandRidge and Midstates in an all stock merger transaction. On February 7, 2018, we announced that our board of directors, in consultation with independent financial and legal advisers, will carefully review and evaluate Midstates’ proposal, taking into account our current strategic plan and standalone prospects.
|
|
•
|
On February 8, 2018, we announced the departure of James Bennett, President and CEO, effective immediately, and Julian Bott, Chief Financial Officer, effective at the close of business on the date of filing this 2017 Annual Report with the SEC. We also announced the appointment of independent board member, Bill Griffin, as Interim President and Chief Executive Officer, the appointment of Chief Accounting Officer, Michael Johnson, as Interim Chief Financial Officer and the appointment of Sylvia K. Barnes as an independent director.
|
Outlook
Concurrently with the executive team reorganization noted above, we announced our 2018 strategic objectives to our shareholders which emphasize safety, operational excellence, financial discipline and a focus on maximizing asset value and risk-adjusted returns while capturing economic merger and acquisition opportunities. Based on these strategic objectives, we have established a range for our 2018 capital expenditures budget between $180.0 million and $190.0 million, which is a decrease of approximately 27.5% to 23.5% compared to actual 2017 capital expenditures, excluding acquisitions. The substantial majority of these budgeted expenditures is designated for exploration and production activities. Given this reduction in our capital budget for 2018, we are currently estimating a decline in production from approximately 41 MBoe per day to approximately 32 MBoe per day. Additionally, we are in the process of instituting further changes to our organizational structure, which are expected to substantially reduce our cash general and administrative expenses throughout 2018. We expect these measures to help us achieve our strategic objectives, enhance shareholder value and improve our competitiveness in the marketplace.
Consolidated Results of Operations
The majority of our consolidated revenues and cash flow are generated from the production and sale of oil, natural gas and NGLs. Our revenues, profitability and future growth depend substantially on prevailing prices received for our production, the quantity of oil, natural gas and NGLs we produce, our ability to find and economically develop and produce our reserves, and changes in the fair value of our commodity derivative contracts. Prices for oil, natural gas and NGLs fluctuate widely and are difficult to predict. To provide information on the general trend in pricing, the average annual NYMEX prices for oil and natural gas for recent years are presented in the table below:
|
Year Ended December 31,
|
|||||||||||||||||||
|
2017
|
2016
|
2015
|
2014
|
2013
|
|||||||||||||||
|
Oil (per Bbl)
|
$
|
50.85
|
|
$
|
43.47
|
|
$
|
48.75
|
|
$
|
92.91
|
|
$
|
98.05
|
|
||||
|
Natural gas (per Mcf)
|
$
|
3.02
|
|
$
|
2.55
|
|
$
|
2.62
|
|
$
|
4.26
|
|
$
|
3.73
|
|
||||
In order to reduce our exposure to price fluctuations, we have historically entered into commodity derivative contracts for a portion of our anticipated future oil and natural gas production as discussed in Item 7A. “Quantitative and Qualitative Disclosures About Market Risk.” Reducing the Company’s exposure to price volatility helps mitigate the risk that we will not have adequate funds available for our capital expenditure programs.
Acquisitions and Divestitures
Acquisition of NW STACK Properties.
On February 10, 2017, we acquired assets consisting of approximately
13,000
net acres in Woodward County, Oklahoma for approximately
$47.8 million
in cash, net of post-closing adjustments. Also included in the acquisition were working interests in
four
wells previously drilled on the acreage.
2017 Oil and Natural Gas Property Divestitures.
In 2017, we divested various non-core oil and natural gas properties for approximately
$17.1 million
in cash. All of these divestitures were accounted for as adjustments to the full cost pool with no gain or loss recognized.
48
Divestiture of WTO Properties and Release from Treating Agreement.
In January 2016, we paid $11.0 million in cash and transferred ownership of substantially all of our oil and natural gas properties and midstream assets located in the Piñon field in the WTO to Occidental and were released from all past, current and future claims and obligations under an existing 30-year treating agreement with Occidental. In connection with this transfer, the Predecessor Company recognized a loss of approximately $89.1 million on the termination of the treating agreement and the cease-use of transportation agreements that supported production from the Piñon field and reduced its asset retirement obligations associated with its oil and natural gas properties by $34.1 million. For the year ended December 31, 2015, production, revenues and direct operating expenses for the conveyed oil and natural gas properties were 1.9 MMBoe, $14.6 million and $41.1 million, respectively.
Acquisition of North Park Basin Properties.
In December 2015, we acquired approximately
135,000
net acres in the North Park Basin, Jackson County, Colorado, including working interests in
16
wells previously drilled on the acreage, for approximately
$191.1 million
in cash, including post-closing adjustments. Additionally, the seller paid us $3.1 million for certain overriding interests retained in the properties. We began developing the acquired acreage in early 2016.
Acquisition of Piñon Gathering Company, LLC
. In October 2015, we acquired the assets of and terminated a gas gathering agreement with PGC for $48.0 million cash and $78.0 million principal amount of Senior Secured Notes. PGC’s assets consisted of approximately 370 miles of
gathering lines that supported our production in the Piñon field in West Texas. The transaction resulted in the termination of a gas gathering agreement with PGC under which we were required to compensate PGC for any throughput shortfalls below a required minimum volume. The fair value of the consideration we paid, including the discount attributable to the Senior Secured Notes issued, was approximately
$98.3 million
and was allocated on a relative fair value basis between the assets acquired (approximately
$47.3 million
) and a loss on the termination of the gathering contract (approximately
$51.0 million
). These assets were subsequently transferred to Occidental in the divestiture of the WTO properties discussed above.
49
Oil, Natural Gas and NGL Production and Pricing
Set forth in the table below is production and pricing information for Successor Company and the Predecessor Company for the respective 2016 periods and the years ended
December 31, 2017
,
2016
and
2015
.
|
Successor
|
Predecessor
|
Combined
|
Predecessor
|
||||||||||||||||
|
Year Ended December 31,
|
Period from October 2, 2016 through December 31,
|
Period from January 1, 2016 through October 1,
|
Year Ended December 31,
|
Year Ended December 31,
|
|||||||||||||||
|
2017
|
2016
|
2016
|
2016
|
2015
|
|||||||||||||||
|
Production data (in thousands)
|
|||||||||||||||||||
|
Oil (MBbls)
|
4,157
|
|
1,214
|
|
4,315
|
|
5,529
|
|
9,600
|
|
|||||||||
|
NGL (MBbls)
|
3,376
|
|
999
|
|
3,358
|
|
4,357
|
|
5,044
|
|
|||||||||
|
Natural gas (MMcf)
|
44,237
|
|
12,771
|
|
44,124
|
|
56,895
|
|
92,105
|
|
|||||||||
|
Total volumes (MBoe)
|
14,906
|
|
4,342
|
|
15,027
|
|
19,369
|
|
29,995
|
|
|||||||||
|
Average daily total volumes (MBoe/d)
|
40.8
|
|
47.7
|
|
54.6
|
|
52.9
|
|
82.2
|
|
|||||||||
|
Average prices—as reported(1)
|
|||||||||||||||||||
|
Oil (per Bbl)
|
$
|
48.72
|
|
$
|
47.03
|
|
$
|
36.85
|
|
$
|
39.09
|
|
$
|
45.83
|
|
||||
|
NGL (per Bbl)
|
$
|
18.16
|
|
$
|
14.77
|
|
$
|
12.67
|
|
$
|
13.15
|
|
$
|
14.36
|
|
||||
|
Natural gas (per Mcf)
|
$
|
2.09
|
|
$
|
2.07
|
|
$
|
1.78
|
|
$
|
1.84
|
|
$
|
2.12
|
|
||||
|
Total (per Boe)
|
$
|
23.90
|
|
$
|
22.64
|
|
$
|
18.63
|
|
$
|
19.53
|
|
$
|
23.59
|
|
||||
|
Average prices—including impact of derivative contract settlements(2)
|
|||||||||||||||||||
|
Oil (per Bbl)
|
$
|
49.75
|
|
$
|
54.59
|
|
$
|
51.05
|
|
$
|
51.83
|
|
$
|
76.80
|
|
||||
|
NGL (per Bbl)
|
$
|
18.16
|
|
$
|
14.77
|
|
$
|
12.67
|
|
$
|
13.15
|
|
$
|
14.36
|
|
||||
|
Natural gas (per Mcf)
|
$
|
2.15
|
|
$
|
1.96
|
|
$
|
1.77
|
|
$
|
1.81
|
|
$
|
2.45
|
|
||||
|
Total (per Boe)
|
$
|
24.38
|
|
$
|
24.41
|
|
$
|
22.70
|
|
$
|
23.08
|
|
$
|
34.51
|
|
||||
____________________
|
(1)
|
Prices represent actual average prices for the periods presented and do not include the impact of derivative transactions.
|
|
(2)
|
Excludes settlements of commodity derivative contracts prior to their contractual maturity, if any.
|
For a discussion of reserves, PV-10 and reconciliation to Standardized Measure, see “Business— Primary Operations—Proved Reserves” in Item 1 of this report.
The table below presents production by area of operation for the year ended
December 31, 2017
, the Successor and Predecessor 2016 Periods and the year ended December 31,
2015
, and illustrates the impact of (i) the continued decrease in capital expenditures and number of new wells drilled in the Mid-Continent, (ii) drilling no new wells in the Permian and other regions during 2016 and 2017, and (ii) the acquisition of the North Park Basin properties in December 2015.
|
Successor
|
Predecessor
|
||||||||||||||||||||||
|
Year Ended December 31,
|
Period from October 2, 2016 through December 31,
|
Period from January 1, 2016 through October 1,
|
Year Ended December 31,
|
||||||||||||||||||||
|
2017
|
2016
|
2016
|
2015
|
||||||||||||||||||||
|
Production (MBoe)
|
% of Total Production
|
Production (MBoe)
|
% of Total Production
|
Production (MBoe)
|
% of Total Production
|
Production (MBoe)
|
% of Total Production
|
||||||||||||||||
|
Mid-Continent
|
13,720
|
|
92.1
|
%
|
4,018
|
|
92.5
|
%
|
14,119
|
|
94.0
|
%
|
26,558
|
|
88.5
|
%
|
|||||||
|
North Park Basin
|
673
|
|
4.5
|
%
|
180
|
|
4.1
|
%
|
320
|
|
2.1
|
%
|
—
|
|
—
|
%
|
|||||||
|
Permian Basin
|
513
|
|
3.4
|
%
|
144
|
|
3.4
|
%
|
489
|
|
3.3
|
%
|
1,567
|
|
5.2
|
%
|
|||||||
|
Other
|
—
|
|
—
|
%
|
—
|
|
—
|
%
|
99
|
|
0.6
|
%
|
1,870
|
|
6.3
|
%
|
|||||||
|
Total
|
14,906
|
|
100.0
|
%
|
4,342
|
|
100.0
|
%
|
15,027
|
|
100.0
|
%
|
29,995
|
|
100.0
|
%
|
|||||||
50
Revenues
Consolidated revenues for the year ended
December 31, 2017
, the Successor 2016 Period, the Predecessor 2016 Period, and the years ended December 31,
2016
and
2015
are presented in the table below (in thousands).
|
Successor
|
Predecessor
|
Combined
|
Predecessor
|
||||||||||||||||
|
|
Year Ended December 31,
|
Period from October 2, 2016 through December 31,
|
Period from January 1, 2016 through October 1,
|
Year Ended December 31,
|
Year Ended December 31,
|
||||||||||||||
|
|
2017
|
2016
|
2016
|
2016
|
2015
|
||||||||||||||
|
Revenues
|
|||||||||||||||||||
|
Oil
|
$
|
202,539
|
|
$
|
57,093
|
|
$
|
159,023
|
|
$
|
216,116
|
|
$
|
439,927
|
|
||||
|
NGL
|
61,322
|
|
14,756
|
|
42,541
|
|
57,297
|
|
72,440
|
|
|||||||||
|
Natural gas
|
92,349
|
|
26,458
|
|
78,407
|
|
104,865
|
|
195,067
|
|
|||||||||
|
Other
|
1,089
|
|
149
|
|
13,838
|
|
13,987
|
|
61,275
|
|
|||||||||
|
Total revenues(1)
|
$
|
357,299
|
|
$
|
98,456
|
|
$
|
293,809
|
|
$
|
392,265
|
|
$
|
768,709
|
|
||||
___________________
|
(1)
|
Includes
$57.0 million
of revenues attributable to noncontrolling interests in consolidated VIEs, after considering the effects of intercompany eliminations, for the year ended December 31, 2015.
|
Variances in oil, natural gas and NGL revenues attributable to changes in the average prices received for our production and total production volumes sold for the years ended
December 31, 2017
and
2016
are shown in the table below (in thousands):
|
2015 oil, natural gas and NGL revenues
|
$
|
707,434
|
|
|
Change due to production volumes in 2016
|
(270,688
|
)
|
|
|
Change due to average prices in 2016
|
(58,468
|
)
|
|
|
2016 oil, natural gas and NGL revenues (supplemental pro forma combined)
|
378,278
|
|
|
|
Change due to production volumes in 2017
|
(90,073
|
)
|
|
|
Change due to average prices in 2017
|
68,005
|
|
|
|
2017 oil, natural gas and NGL revenues
|
$
|
356,210
|
|
Oil, natural gas and NGL revenues decreased by a combined
$22.1 million
, or
5.8%
for the year ended
December 31, 2017
, compared to
2016
. The decrease is due largely to a 4.5 MMBoe decrease in total production, primarily due to natural declines in existing producing wells and fewer wells brought on production. This decrease was partially offset by an increase in average prices received for our oil, NGL and natural gas production. Additionally, the average prices received in the 2017 period include the full effect of the Successor Company’s election to include transportation deductions in revenues as discussed below, whereas the combined 2016 period only includes the impact of this election for the Successor 2016 Period.
Oil, natural gas and NGL sales decreased by a combined
$329.2 million
, or
46.5%
for the year ended December 31, 2016, compared to 2015. The decrease is due largely to lower oil and natural gas production, primarily due to natural declines in existing producing wells, the decrease in new wells drilled during 2016 compared to 2015, and the proportionate consolidation of the Royalty Trusts’ activities during the 2016 period. The remaining decrease is primarily due to a decline in the average prices received as a result of declining market prices for oil production, and to a lesser extent, natural gas and NGL production. The decline in average prices received also includes the effects of the Successor Company’s election to include transportation deductions in revenues for the Successor 2016 Period.
Other revenues primarily include drilling and oilfield services and marketing and midstream sales, which decreased in 2017 and 2016 largely due to discontinuing all remaining drilling and oilfield services operations in 2016, and transferring substantially all oil and natural gas properties and midstream assets located in the Piñon field in the WTO to Occidental in January 2016.
51
Expenses
Consolidated expenses for the year ended
December 31, 2017
, the Successor 2016 Period, the Predecessor 2016 Period and the years ended
December 31, 2016
and
2015
are presented below.
|
Successor
|
Predecessor
|
Combined
|
Predecessor
|
||||||||||||||||
|
|
Year Ended December 31,
|
Period from October 2, 2016 through December 31,
|
Period from January 1, 2016 through October 1,
|
Year Ended December 31,
|
Year Ended December 31,
|
||||||||||||||
|
|
2017
|
2016
|
2016
|
2016
|
2015
|
||||||||||||||
|
|
(In thousands)
|
||||||||||||||||||
|
Expenses
|
|||||||||||||||||||
|
Production
|
$
|
102,728
|
|
$
|
24,997
|
|
$
|
129,608
|
|
$
|
154,605
|
|
$
|
308,701
|
|
||||
|
Production taxes
|
13,644
|
|
2,643
|
|
6,107
|
|
8,750
|
|
15,440
|
|
|||||||||
|
Depreciation and depletion—oil and natural gas
|
118,035
|
|
36,061
|
|
90,978
|
|
127,039
|
|
324,390
|
|
|||||||||
|
Depreciation and amortization—other
|
13,852
|
|
3,922
|
|
21,323
|
|
25,245
|
|
47,382
|
|
|||||||||
|
Impairment
|
4,019
|
|
319,087
|
|
718,194
|
|
1,037,281
|
|
4,534,689
|
|
|||||||||
|
General and administrative
|
76,024
|
|
9,837
|
|
116,091
|
|
125,928
|
|
137,715
|
|
|||||||||
|
Terminated merger costs
|
8,162
|
|
—
|
|
—
|
|
—
|
|
—
|
|
|||||||||
|
Employee termination benefits
|
4,815
|
|
12,334
|
|
18,356
|
|
30,690
|
|
12,451
|
|
|||||||||
|
(Gain) loss on derivative contracts
|
(24,090
|
)
|
25,652
|
|
4,823
|
|
30,475
|
|
(73,061
|
)
|
|||||||||
|
Loss on settlement of contract
|
—
|
|
—
|
|
90,184
|
|
90,184
|
|
50,976
|
|
|||||||||
|
Other operating expense
|
479
|
|
268
|
|
4,348
|
|
4,616
|
|
52,704
|
|
|||||||||
|
Total expenses(1)
|
$
|
317,668
|
|
$
|
434,801
|
|
$
|
1,200,012
|
|
$
|
1,634,813
|
|
$
|
5,411,387
|
|
||||
___________________
|
(1)
|
Includes
$679.9 million
of expenses attributable to noncontrolling interests in consolidated VIEs, after considering the effects of intercompany eliminations, for the year ended December 31,
2015
. The expenses attributable to noncontrolling interest in consolidated VIEs include
$655.9 million
of allocated full cost ceiling impairment for the year ended December 31, 2015.
|
Production expense includes but is not limited to, lease operating expense and treating costs. Production expenses for
2017
decreased
$51.9 million
, or
33.6%
from combined
2016
production expenses. Production costs per Boe decreased to
$6.89
per Boe for the
2017
period from
$7.98
per Boe in
2016
, primarily due to (i) the Successor Company’s presentation of transportation costs totaling $29.1 million as a reduction from revenues for the year ended
December 31, 2017
, compared to the presentation of only $7.4 million of transportation costs as a reduction from revenues in the Successor 2016 Period with the remaining 2016 transportation costs of $26.2 million being presented as production expenses by the Predecessor Company, and (ii) controlled reductions in expenditures for electricity, chemicals and various other costs. Production expenses for
2016
decreased $154.1 million, or 49.9% from
2015
. Production costs per Boe decreased to $7.98 per Boe for the
2016
period from $10.29 per Boe in
2015
, primarily due to (i) a decrease in well activity due to fewer new wells being brought on production, (ii) termination of the CO
2
delivery agreement with Occidental in the first quarter of 2016, which resulted in CO
2
delivery shortfall penalties of $2.0 million being incurred in the Predecessor 2016 Period compared to penalties of $34.9 million incurred during 2015, and (iii) the presentation of transportation costs as a reduction from revenues in the Successor 2016 Period versus the Predecessor Company’s presentation of these costs as production expenses.
Production taxes, which are levied by the state governments in the areas in which we operate, typically change in direct correlation with increases or decreases in our oil, natural gas and NGL revenues. However, production taxes increased by approximately
$4.9 million
, or
55.9%
, for
2017
, compared to
2016
and production taxes as a percentage of oil, natural gas and NGL revenue also increased in 2017 to approximately
3.8%
, compared to 2.3% for
2016
, and 2.2% for 2015. These increases were primarily due to fewer wells having the benefit of tax credits in 2017 compared to 2016 due to the loss of certain horizontal tax credits, which caused previous rates to increase back to the statutory rates. Production taxes decreased by $6.7 million, or 43.3%, for 2016, compared to 2015, primarily due to the decrease in oil, natural gas and NGL revenues.
Depreciation and depletion for oil and natural gas properties decreased by $9.0 million for the year ended
December 31, 2017
compared to the combined 2016 periods, primarily due to the decrease in production. This decrease was partially offset by an increase in the average depreciation and depletion rate to $7.92 per Boe in 2017 compared to an average rate of $6.56 per Boe for the combined 2016 periods. This increase in the average rate primarily resulted from (i) incurring higher actual drilling and
52
completion costs per Boe during the 2017 period compared to the rate per Boe calculated at December 31, 2016 following the significant ceiling test write-down incurred in the fourth quarter of 2016, (ii) a shift of more capital to develop our North Park Basin oil asset where the anticipated future development costs are likewise expected to be higher than the 2016 rate, and (iii) a
$3.1 million
increase in accretion for the year ended
December 31, 2017
, compared to the combined
2016
periods, primarily due to the Successor Company recording a higher fresh start valuation for asset retirement obligations on the Emergence Date.
Depreciation and depletion for oil and natural gas properties for the Successor 2016 Period was recorded at an average depreciation and depletion rate of $8.31 per Boe, which reflects an increase in reserve values due to fresh start valuation adjustments recorded for reserves as of October 1, 2016. The average depreciation and depletion rate for the Predecessor 2016 Period of $6.05 per Boe, which decreased from a rate of $10.81 per Boe in
2015
, primarily due to full cost ceiling impairments recorded in 2016, and the proportionate consolidation of the Royalty Trusts’ activities during 2016.
Depreciation and amortization for non-oil and gas properties decreased primarily due to (i) the sale of substantially all drilling assets during 2016 and 2015 after discontinuing drilling operations, (ii) the sale of a property located in downtown Oklahoma City, Oklahoma as well as other corporate assets, and (iii) the divestiture of the WTO properties and related assets.
Impairment expense for the year ended
December 31, 2017
, the Successor 2016 Period, the Predecessor 2016 Period and the years ended December 31, 2016 and 2015 consisted of the following (in thousands):
|
Successor
|
Successor
|
Predecessor
|
Combined
|
Predecessor
|
|||||||||||||||
|
|
Year Ended December 31,
|
Period from October 2, 2016 through December 31,
|
Period from January 1, 2016 through October 1,
|
Year Ended December 31,
|
Year Ended December 31,
|
||||||||||||||
|
|
2017
|
2016
|
2016
|
2016
|
2015
|
||||||||||||||
|
Impairment
|
|||||||||||||||||||
|
Full cost pool ceiling limitation
|
$
|
—
|
|
$
|
319,087
|
|
$
|
657,392
|
|
$
|
976,479
|
|
$
|
4,473,787
|
|
||||
|
Drilling assets
|
4,019
|
|
—
|
|
3,511
|
|
3,511
|
|
37,646
|
|
|||||||||
|
Electrical infrastructure assets
|
—
|
|
—
|
|
55,600
|
|
55,600
|
|
—
|
|
|||||||||
|
Midstream assets
|
—
|
|
—
|
|
1,691
|
|
1,691
|
|
7,148
|
|
|||||||||
|
Other
|
—
|
|
—
|
|
—
|
|
—
|
|
16,108
|
|
|||||||||
|
Total impairment
|
$
|
4,019
|
|
$
|
319,087
|
|
$
|
718,194
|
|
$
|
1,037,281
|
|
$
|
4,534,689
|
|
||||
Full cost pool impairment.
Upon the application of fresh start accounting, the value of the Successor Company full cost pool was determined based upon forward strip oil and natural gas prices as of the Emergence Date. Because these prices were higher than the 12-month weighted average prices used in the full cost ceiling limitation calculation at December 31, 2016, the Successor Company incurred a ceiling test impairment of $319.1 million.
Full cost pool impairment recorded for the Predecessor Company in 2016 was due to full cost ceiling limitations recognized in each of the first three quarters of 2016. The impairments recorded in 2015 and the first two quarters of 2016 resulted primarily from the significant decrease in oil prices, and to a lesser extent, natural gas prices, that began in the latter half of 2014 and continued throughout 2015 and the first half of 2016. The impairment recorded in the third quarter of 2016 resulted primarily from downward revisions to forecasted reserves due to a decrease in projected Mid-Continent production volumes. The decrease in projected production volumes resulted from steeper than anticipated well production decline rates for Mississippian horizontal wells in areas with increased natural fracture density and that have been developed with three or more horizontal wells per section as inter-well pressure communication has had more impact on well performance than originally forecasted. Additionally, changing pressure conditions in the Company’s Mississippian wells producing with artificial lift have resulted in increased production decline rates that are now becoming more predictable on a large group of base wells as this population of wells has been producing for more than two years.
Drilling asset impairment.
Impairment in 2017 reflects the write-down of remaining drilling and oilfield services assets classified as held for sale to net realizable value. Impairments were recorded on certain drilling assets in the years ended December 31, 2016, and 2015 upon determining their future use was limited after discontinuing drilling operations in the Permian region in 2015 and discontinuing all remaining drilling operations in 2016.
Electrical infrastructure asset impairment.
Impairment in 2016 primarily reflects a write-down of the value of our electrical transmission system due to a decrease in projected Mid-Continent production volumes supporting the system’s usage.
53
Midstream asset impairment.
Impairment recorded on midstream assets in 2016 and 2015 resulted primarily from the write-downs of generators, compressors and various other equipment, due to their limited use.
Other impairment.
Impairment recorded on other assets in 2015, includes a $15.4 million impairment on property located in downtown Oklahoma City, Oklahoma to adjust the carrying value of the property to the agreed upon sales price for which it was later sold in 2016.
General and administrative expenses decreased $49.9 million, or 39.6%, for the year ended
December 31, 2017
compared to
2016
due primarily to (i) a decrease of $25.0 million in professional services costs due to incurring significant consultant and legal fees in the 2016 period in contemplation of the Company’s restructuring, and (ii) a $23.6 million decrease in net salary costs largely resulting from reductions in force during the first and fourth quarters of 2016. The remaining change is due to the net effect of significant reductions in director and officer insurance costs, bad debt expense, and costs largely related to the reduction in headcount during 2016, offset partially by increases in other miscellaneous general and administrative items.
General and administrative expenses decreased $11.8 million, or 8.6%, for the year ended
December 31, 2016
, compared to
2015
due primarily to (i) an $8.4 million decrease in net payroll costs, and (ii) a decrease of $5.0 million due to recording a legal settlement in 2015. The remainder of the decrease in general and administrative expenses resulted primarily from a reduction in various other corporate support costs including office costs, travel, employee placement, training, vehicle and technology costs due to reductions in force in the first and fourth quarters of 2016 and corporate cost cutting measures. These reductions were partially offset by an increase of $8.2 million in professional services costs, which primarily related to consulting fees incurred for the restructuring of the Company prior to the Chapter 11 filings and after the Emergence Date.
Terminated merger costs include legal and professional costs incurred to facilitate the proposed merger of SandRidge with Bonanza Creek Energy Inc., as well as certain costs incurred to address shareholder activism claims and fees paid to Bonanza Creek for termination of the proposed merger in December 2017. We expect to incur further costs in 2018 related to ongoing shareholder activism claims as discussed in “Note
21
—Subsequent Events” to the Company’s consolidated financial statements in Item 8 of this report.
Employee termination benefits for the year ended
December 31, 2017
, primarily relate to severance costs incurred in conjunction with the departure of a former executive. Employee termination benefits for the year ended
December 31, 2016
, represent severance costs incurred primarily as a result of (i) reductions in force in the first and fourth quarters of 2016, (ii) severance costs associated with the departure of executive officers and other senior officers and (iii) discontinuing all remaining drilling and oilfield services operations and the majority of all midstream and marketing services operations in the first quarter of 2016.
Employee termination benefits recorded in 2015 represent severance costs incurred primarily as a result of (i) a reduction in force (ii) severance costs associated with the departure of an executive officer and other senior officers and (iii) discontinuing all remaining drilling and oilfield services operations in the Permian region in 2015.
We recorded (gain) loss on commodity derivative contracts of
$(24.1) million
and
$25.7 million
for the year ended
December 31, 2017
, and the Successor 2016 Period, respectively, as reflected in the accompanying consolidated statements of operations, which includes net cash receipts upon settlement of
$7.3 million
and
$7.7 million
, respectively.
We recorded loss (gain) on commodity derivative contracts of
$4.8 million
and
$(73.1) million
for the Predecessor 2016 Period and the year ended December 31,
2015
, respectively, as reflected in the accompanying consolidated statements of operations included in Item 8 of this report, which includes net cash receipts upon settlement of
$72.6 million
and
$327.7 million
, respectively. Included in the net receipts for the Predecessor 2016 Period is
$17.9 million
related to settlements of contracts prior to their contractual maturity (“early settlements”) in the second quarter of 2016, primarily in response to the Chapter 11 Petitions being filed.
Our derivative contracts are not designated as accounting hedges and, as a result, changes in the fair value of our commodity derivative contracts are recorded each quarter as a component of operating expenses. Internally, management views the settlement of commodity derivative contracts at contractual maturity as adjustments to the price received for oil and natural gas production to determine “effective prices.” Gains or losses on early settlements and losses related to amendments of contracts are not considered in the calculation of effective prices. In general, cash is received on settlement of contracts due to lower oil and natural gas prices at the time of settlement compared to the contract price for our commodity derivative contracts, and cash is paid on settlement of contracts due to higher oil and natural gas prices at the time of settlement compared to the contract price for our commodity derivative contracts. See Item 7A. “Quantitative and Qualitative Disclosures about Market Risk” of this report for additional discussion of our commodity derivatives.
54
Loss on settlement of contract in the Predecessor 2016 Period consists of a $78.9 million loss resulting from the termination of a gas treating and CO
2
delivery agreement with Occidental, and a loss of $11.2 million recorded for the cease-use of transportation agreements that supported production from the Piñon field.
Loss on settlement of contract in 2015 resulted from the termination of the Company’s gas gathering agreement with PGC under which it was required to compensate PGC for any throughput shortfalls below a required minimum volume. See “—Acquisitions and Divestitures” above and see “Note
6
—Acquisitions and Divestitures” to the Company’s consolidated financial statements in Item 8 of this report for additional discussion of the acquisition of PGC and the PGC gathering agreement.
Other operating expense primarily includes drilling and oilfield services costs which largely decreased due to discontinuing all remaining drilling and oilfield services operations in 2016.
Other (Expense) Income
Other (expense) income for the year ended
December 31, 2017
, the Successor 2016 Period, the Predecessor 2016 Period and the years ended December 31,
2016
, and
2015
, is reflected in the table below (in thousands).
|
|
Successor
|
Predecessor
|
Combined
|
Predecessor
|
|||||||||||||||
|
|
Year Ended December 31,
|
Period from October 2, 2016 through December 31,
|
Period from January 1, 2016 through October 1,
|
Year Ended December 31,
|
Year Ended December 31,
|
||||||||||||||
|
2017
|
2016
|
2016
|
2016
|
2015
|
|||||||||||||||
|
Other (expense) income
|
|||||||||||||||||||
|
Interest expense
|
$
|
(3,868
|
)
|
$
|
(372
|
)
|
$
|
(126,099
|
)
|
$
|
(126,471
|
)
|
$
|
(321,421
|
)
|
||||
|
Gain on extinguishment of debt
|
—
|
|
—
|
|
41,179
|
|
41,179
|
|
641,131
|
|
|||||||||
|
Reorganization items
|
—
|
|
—
|
|
2,430,599
|
|
2,430,599
|
|
—
|
|
|||||||||
|
Other income, net
|
2,550
|
|
2,744
|
|
1,332
|
|
4,076
|
|
2,040
|
|
|||||||||
|
Total other (expense) income
|
$
|
(1,318
|
)
|
$
|
2,372
|
|
$
|
2,347,011
|
|
$
|
2,349,383
|
|
$
|
321,750
|
|
||||
Interest expense for the Successor Company and Predecessor Company for the year ended
December 31, 2017
, the Successor 2016 Period, the Predecessor 2016 Period and the years ended
December 31, 2016
, and
2015
consisted of the following (in thousands):
|
Successor
|
Successor
|
Predecessor
|
Combined
|
Predecessor
|
|||||||||||||||
|
Year Ended December 31,
|
Period from October 2, 2016 through December 31,
|
Period from January 1, 2016 through October 1,
|
Year Ended December 31,
|
Year Ended December 31,
|
|||||||||||||||
|
2017
|
2016
|
2016
|
2016
|
2015
|
|||||||||||||||
|
Interest expense
|
|||||||||||||||||||
|
Interest expense on debt
|
$
|
5,216
|
|
$
|
1,590
|
|
$
|
123,350
|
|
$
|
124,940
|
|
$
|
304,020
|
|
||||
|
Amortization of debt issuance costs, premium and discounts
|
(330
|
)
|
(81
|
)
|
7,730
|
|
7,649
|
|
15,014
|
|
|||||||||
|
Write off of debt issuance costs
|
—
|
|
—
|
|
—
|
|
—
|
|
7,108
|
|
|||||||||
|
(Gain) loss on long-term debt derivatives
|
—
|
|
—
|
|
(1,324
|
)
|
(1,324
|
)
|
10,377
|
|
|||||||||
|
Capitalized interest
|
—
|
|
—
|
|
(2,240
|
)
|
(2,240
|
)
|
(14,018
|
)
|
|||||||||
|
Total
|
4,886
|
|
1,509
|
|
127,516
|
|
129,025
|
|
322,501
|
|
|||||||||
|
Less: interest income
|
(1,018
|
)
|
(1,137
|
)
|
(1,417
|
)
|
(2,554
|
)
|
(1,080
|
)
|
|||||||||
|
Total interest expense
|
$
|
3,868
|
|
$
|
372
|
|
$
|
126,099
|
|
$
|
126,471
|
|
$
|
321,421
|
|
||||
Interest expense incurred during the year ended December 31, 2017, is primarily comprised of interest recorded on the Building Note and commitment fees on the undrawn portion of the credit facility. Interest expense in the Successor 2016 Period is comprised of interest expense incurred on the First Lien Exit Facility prior to the payment of the outstanding balance in October 2016 and commitment fees on the undrawn portion of the First Lien Exit Facility and letters of credit.
Total interest expense decreased $122.6 million for the year ended
December 31, 2017
compared to
2016
, primarily due
55
to
the elimination of our Senior Secured Notes, Senior Unsecured Notes, and senior credit facility as part of the reorganization in 2016. The senior notes were canceled upon our emergence from Chapter 11 in the fourth quarter of 2016 and amounts outstanding under the First Lien Exit Facility were also repaid in full in the fourth quarter of 2016. There were no new borrowings on either the First Lien Exit Facility or the credit facility during 2017.
Total interest expense decreased $195.0 million for the year ended
December 31, 2016
compared to
2015
, primarily due to (i) ceasing to record interest expense on the Senior Unsecured Notes at the time of the Chapter 11 filings, (ii) the repurchase of Senior Unsecured Notes in 2015, (iii) conversion of Convertible Senior Unsecured Notes into shares of the Predecessor Company’s common stock in the second half of 2015 and first quarter of 2016, and (iv), repayment of all amounts outstanding under the First Lien Exit Facility in October 2016. These decreases were partially offset by (i) interest expense and amortization of discount and debt issuance costs associated with the Senior Secured Notes issued in June and October 2015 through the date of the Chapter 11 filings, and (ii) a reduction in the amount of interest capitalized in the 2016 periods, primarily due to a decrease in drilling activity.
We recognized a gain on extinguishment of debt of
$41.2 million
in the Predecessor 2016 Period, primarily in connection with the exchange of approximately $232.1 million in aggregate principal amount ($77.8 million net of discount and including holders’ conversion feature liabilities) of the Convertible Senior Unsecured Notes for approximately 84.4 million shares of the Predecessor Company’s common stock during the first quarter of 2016. Further conversions of the Convertible Senior Unsecured Notes were stayed in May 2016 in conjunction with the filing of the Chapter 11 petitions.
We recognized a gain on extinguishment of debt of $641.1 million for the year ended December 31, 2015, primarily in connection with (i) the exchange of $575.0 million in aggregate principal of Senior Unsecured Notes for Convertible Senior Unsecured Notes, (ii) the repurchase of $350.0 million in aggregate principal of Senior Unsecured Notes for approximately $124.5 million in cash, (iii) the exchange of approximately $50.0 million aggregate principal of 7.5% Senior Unsecured Notes due 2021 and 8.125% Senior Unsecured Notes due 2022 for shares of the Company’s common stock, and (iv) conversions of Convertible Senior Unsecured Notes into shares of the Company’s common stock.
See “Note
12
- Long-Term Debt” to the Company’s consolidated financial statements in Item 8 of this report for additional discussion of the Company’s long-term debt transactions.
Reorganization items in the Predecessor 2016 Period primarily consist of the net gain recorded on the cancellation of Predecessor Company debt upon emergence from Chapter 11. See “Note 2 - Fresh Start Accounting” to the consolidated financial statements included in Item 8 of this Report for further discussion of reorganization items.
During the year ended
December 31, 2017
, the Company reduced the valuation allowance associated with deferred tax assets related to alternative minimum tax credits that became realizable as a result of a special tax election. Accordingly, the Company recorded an income tax benefit of
$8.7 million
in the year ended
December 31, 2017
. Tax expense and the effective tax rate for the Successor 2016 Period and the Predecessor 2016 Period and the year ended December 31, 2015 were low as a result of the valuation allowance against our net deferred tax asset in each period.
56
Liquidity and Capital Resources
At
December 31, 2017
, our cash and cash equivalents, excluding restricted cash, were $
99.1 million
. Additionally, we had approximately
$37.5 million
in total debt outstanding and $
6.7 million
in outstanding letters of credit. As of
February 15, 2018
, the Company had approximately
$77.8 million
in cash and cash equivalents, excluding restricted cash, an undrawn credit facility, and $6.7 million in outstanding letters of credit, which reduce the amount available under the credit facility.
Working Capital and Sources and Uses of Cash
Our principal sources of liquidity for 2017 include cash flow from operations, cash on hand and amounts available under our credit facility, as discussed in “—Credit Facility” below.
Additionally, our working capital deficit was
$3.8 million
at
December 31, 2017
, compared to a working capital surplus of $43.5 million at December 31, 2016, primarily due to (i) the acquisition of oil and natural gas properties for approximately $47.8 million in cash in the first quarter of 2017 and a change from derivative assets to liabilities due to quarterly mark-to-market adjustments. This decrease is partially offset by fluctuations in the timing and amount of collections of receivables and payments of accounts payable and accrued expenses as well as asset retirement obligation valuation adjustments related primarily to changes in estimated well lives, and reclassifying property in Oklahoma City, OK to assets held for sale in the fourth quarter of 2017.
We have established a range for our 2018 capital expenditures budget between $180.0 million and $190.0 million, with the substantial majority of the budgeted expenditures being designated for exploration and development activities. Management intends to fund 2018 capital expenditures using cash flow from operations, borrowings under the credit facility and cash on hand. Additionally, through changes in the organization structure and other efforts to efficiently execute our strategic objectives, we expect to reduce certain general and administrative expenses significantly beginning in 2018; however, we also expect to incur significant severance costs as a result of the organizational changes mentioned in “—Overview.”
Cash Flows
Our cash flows from operations are substantially dependent on current and future prices for oil and natural gas, which historically have been, and may continue to be, volatile. For example, for oil, from January 2013 through December 2017, the highest month end NYMEX settled price was
$107.65
per Bbl and the lowest was
$33.62
per Bbl. For natural gas, from January 2013 through December 2017, the highest month-end NYMEX settled price was $5.56 per MMBtu and the lowest was $1.71 per MMBtu.
If oil or natural gas prices decline from current levels, they could have a material adverse effect on our financial position, results of operations, cash flows and quantities of oil, natural gas and NGL reserves that may be economically produced. This could result in further full cost pool ceiling impairments. Further, if our future capital expenditures are limited or deferred, or we are unsuccessful in developing reserves and adding production through our capital program, the value of our oil and natural gas properties, financial condition and results of operations could be adversely affected.
Cash flows for the year ended
December 31, 2017
, the Successor 2016 Period, the Predecessor 2016 Period and the years ended
December 31, 2016
and
2015
, are presented in the following table and discussed below (in thousands):
|
Successor
|
Predecessor
|
Combined
|
Predecessor
|
||||||||||||||||
|
|
Year Ended December 31,
|
Period from October 2, 2016 through December 31,
|
Period from January 1, 2016 through October 1,
|
Year Ended December 31,
|
Year Ended December 31,
|
||||||||||||||
|
|
2017
|
2016
|
2016
|
2016
|
2015
|
||||||||||||||
|
Cash flows provided by (used in) operating activities
|
$
|
181,179
|
|
$
|
65,595
|
|
$
|
(112,077
|
)
|
$
|
(46,482
|
)
|
$
|
373,537
|
|
||||
|
Cash flows used in investing activities
|
(245,724
|
)
|
(39,835
|
)
|
(167,690
|
)
|
(207,525
|
)
|
(1,039,640
|
)
|
|||||||||
|
Cash flows (used in) provided by financing activities
|
(8,218
|
)
|
(415,061
|
)
|
407,551
|
|
(7,510
|
)
|
920,438
|
|
|||||||||
|
Net (decrease) increase in cash and cash equivalents
|
$
|
(72,763
|
)
|
$
|
(389,301
|
)
|
$
|
127,784
|
|
$
|
(261,517
|
)
|
$
|
254,335
|
|
||||
57
Cash Flows from Operating Activities
The $227.7 million increase in operating cash flows for the year ended
December 31, 2017
compared to 2016, is primarily due to (i) a reduction in cash paid for interest expense, (ii) a decrease in professional and other fees paid in connection with the Company’s restructuring in 2016, (iii) a reduction in payroll and other employee related general and administrative costs, (iv) a reduction in production expenses, and (v) the 2016 period including cash payments for the early conversion of notes and the settlement of contracts. These decreases in expenses were partially offset by reductions in cash received for the settlement of derivatives and lower revenues in 2017 compared to 2016. See “—Consolidated Results of Operations” for further analysis of the changes in operating expenses.
The $420.0 million reduction in operating cash flows for the year ended
December 31, 2016
compared to 2015, is primarily due to a decrease in revenues from oil, natural gas and NGLs, a reduction in proceeds received on settlement of commodity derivative contracts, an increase in professional and other fees paid in connection with the Company’s restructuring in 2016, and changes in working capital. These were partially offset by a reduction of $190.6 million in cash paid for interest expense and lower production expenses paid in 2016 compared to 2015.
Cash Flows from Investing Activities
The Company dedicates and expects to continue to dedicate a substantial portion of its capital expenditure program toward the exploration for and development of oil and natural gas. These capital expenditures are necessary to offset inherent declines in production and proven reserves, which is typical in the capital-intensive oil and natural gas industry.
During the year ended December 31, 2017, cash flows used in investing activities consisted primarily of capital expenditures for our exploration and development operations and the acquisition of 13,000 net acres in Woodward County, Oklahoma for approximately $47.8 million in cash and capital expenditures for exploration and development, which were partially offset by proceeds from the sale of various non-core oil and natural gas properties and certain drilling equipment previously classified as held for sale.
During the year ended December 31, 2016, cash flows used in investing activities consisted primarily of capital expenditures for our exploration and development operations. During the year ended December 31, 2015, cash flows used in investing activities largely consisted of capital expenditures, excluding acquisitions, as well as cash paid for the North Park acquisition and the PGC assets acquired.
Capital Expenditures.
The Company’s capital expenditures, on an accrual basis, for the year ended
December 31, 2017
, the Successor 2016 Period, the Predecessor 2016 Period and the years ended
December 31, 2016
and
2015
are summarized below (in thousands):
|
Successor
|
Predecessor
|
Combined
|
Predecessor
|
||||||||||||||||
|
|
Year Ended December 31,
|
Period from October 2, 2016 through December 31,
|
Period from January 1, 2016 through October 1,
|
Year Ended December 31,
|
Year Ended December 31,
|
||||||||||||||
|
|
2017
|
2016
|
2016
|
2016
|
2015
|
||||||||||||||
|
Capital Expenditures (on an accrual basis)
|
|||||||||||||||||||
|
Exploration and development
|
$
|
246,033
|
|
$
|
38,062
|
|
$
|
155,627
|
|
$
|
193,689
|
|
$
|
656,022
|
|
||||
|
Other - operating
|
854
|
|
2,901
|
|
3,108
|
|
6,009
|
|
26,188
|
|
|||||||||
|
Other - corporate
|
1,358
|
|
83
|
|
2,672
|
|
2,755
|
|
19,405
|
|
|||||||||
|
Capital expenditures, excluding acquisitions
|
248,245
|
|
41,046
|
|
161,407
|
|
202,453
|
|
701,615
|
|
|||||||||
|
Acquisitions
|
48,312
|
|
—
|
|
1,328
|
|
1,328
|
|
241,165
|
|
|||||||||
|
Total
|
$
|
296,557
|
|
$
|
41,046
|
|
$
|
162,735
|
|
$
|
203,781
|
|
$
|
942,780
|
|
||||
Capital expenditures, excluding acquisitions, for exploration and development activities increased for the year ended
December 31, 2017
compared to
2016
, primarily due to drilling longer laterals in the North Park Basin, which are more capital intensive.
Capital expenditures, excluding acquisitions, decreased significantly for the year ended
December 31, 2016
compared to
2015
, due to a decrease in drilling activity.
58
During the fourth quarter of 2015, the Company acquired (i) all of the assets of PGC for approximately
$47.3 million
and (ii) approximately 135,000 net acres and 16 existing oil and natural gas wells in the North Park Basin in Jackson County, Colorado for approximately
$191.1 million
in cash, including post-closing adjustments. The seller of the North Park Basin properties also paid the Company $3.1 million for certain overriding interests retained in the properties, which slightly offset acquisition expenditures.
Cash Flows from Financing Activities
Our financing activities used $8.2 million of cash for the year ended
December 31, 2017
, which consisted of cash paid for taxes upon the vesting of employee share-based compensation awards and deferred financing costs incurred on the credit facility.
Cash used in financing activities the year ended
December 31, 2016
, was insignificant, primarily due to the net effect of borrowings and repayments under the First Lien Exit Facility, as well as proceeds received from the Building Note, which were subsequently remitted to unsecured creditors on the Emergence Date in accordance with the Plan.
The Company’s financing activities provided
$920.4 million
in cash for the year ended December 31, 2015, due primarily to the issuance of $1.25 billion in Senior Secured Notes in June 2015. This increase was partially offset by $124.5 million in cash paid for the repurchase of debt, $138.3 million in noncontrolling interest distributions, debt issuance costs incurred of $53.2 million and $11.2 million in cash dividends paid on the Predecessor Company’s preferred stock.
Indebtedness
Long-term debt consists of the following at
December 31, 2017
(in thousands):
|
Credit facility
|
$
|
—
|
|
|
Building Note
|
37,502
|
|
|
|
Total debt
|
$
|
37,502
|
|
Credit Facility
On February 10, 2017, the New First Lien Exit Facility was refinanced into a new $600.0 million credit facility with a $425.0 million borrowing base. The new credit facility agreement had the following impacts:
|
•
|
increased the principal amount of commitments to $600.0 million from $425.0 million;
|
|
•
|
extended the maturity date to March 31, 2020 from February 4, 2020;
|
|
•
|
borrowing base determinations now include the Company’s proportionately consolidated share of proved reserves held by the Royalty Trusts;
|
|
•
|
reduced the interest rate from a flat base rate of LIBOR plus 4.75% per annum to a pricing grid tied to borrowing base utilization of (A) LIBOR plus an applicable margin that varies from 3.00% to 4.00% per annum, or (B) the base rate plus an applicable margin that varies from 2.00% to 3.00% per annum;
|
|
•
|
reduced the LIBOR floor from 1% to 0%;
|
|
•
|
eliminated the minimum proved developing producing reserves asset coverage ratio;
|
|
•
|
removed the requirement to maintain $50.0 million in a cash collateral account controlled by the administrative agent;
|
|
•
|
eliminated the holiday from borrowing base determinations and the maximum consolidated total net leverage ratio and the minimum consolidated interest coverage ratio covenants; and
|
|
•
|
eliminated certain negative covenants, such as the $20.0 million liquidity requirement and the limitation on capital expenditures.
|
The initial borrowing base under the credit facility was $425.0 million, which was reconfirmed in the October 2017
borrowing base redetermination. The next semi-annual borrowing base redetermination is scheduled for April 1, 2018. The credit facility is secured by (i) first-priority mortgages on at least 95% of the PV-9 valuation of all proved reserves included in the most recently delivered reserve report of the Company, (ii) a first-priority perfected pledge of substantially all of the capital stock owned by each credit party and equity interests in the Royalty Trusts that are owned by a credit party and (iii) a first-priority perfected security interest in substantially all the cash, cash equivalents, deposits, securities and other similar accounts, and other tangible and intangible assets of the credit parties (including but not limited to as-extracted collateral, accounts receivable, inventory,
59
equipment, general intangibles, investment property, intellectual property, real property and the proceeds of the foregoing). As described above, the credit facility refinanced and thereby replaced the First Lien Exit Facility.
Beginning with the quarter ended June 30, 2017, the credit facility requires us to maintain (i) a maximum consolidated total net leverage ratio, measured as of the end of any fiscal quarter, of no greater than 3.50 to 1.00 and (ii) a minimum consolidated interest coverage ratio, measured as of the end of any fiscal quarter, of no less than 2.25 to 1.00. These financial covenants are subject to customary cure rights. We were in compliance with all applicable financial covenants under the credit facility as of December 31, 2017.
The credit facility contains customary affirmative and negative covenants, including as to compliance with laws (including environmental laws, ERISA and anti-corruption laws), maintenance of required insurance, delivery of quarterly and annual financial statements, oil and gas engineering reports, maintenance and operation of property (including oil and gas properties), restrictions on the incurrence of liens, indebtedness, asset dispositions, fundamental changes, restricted payments and other customary covenants.
The credit facility includes events of default relating to customary matters, including, among other things: nonpayment of principal, interest or other amounts, violation of covenants, incorrectness of representations and warranties in any material respect, cross-payment default and cross acceleration with respect to indebtedness in an aggregate principal amount of $25.0 million or more, bankruptcy, judgments involving liability of $25.0 million or more that are not paid, and ERISA events. Many events of default are subject to customary notice and cure periods.
Building Note
On the Emergence Date, we entered into the Building Note, which has a principal amount of
$35.0 million
and is secured by first priority mortgage on our headquarters facility and certain other non-oil and gas real property in downtown Oklahoma City, Oklahoma. The Building Note was recorded at fair value ($36.6 million) upon implementation of fresh start accounting. Interest is payable on the Building Note at
6%
per annum for the first year following the Emergence Date,
8%
per annum for the second year following the Emergence Date, and
10%
thereafter through maturity. Interest on the Building Note was initially payable in kind. Approximately $1.3 million in in-kind interest costs were added to the Building Note principal from the Emergence Date through May 11, 2017, which was 90 days after the refinancing of the First Lien Exit Facility. Interest became payable thereafter in cash. The Building Note matures on October 2, 2021, and became prepayable in whole or in part without premium or penalty upon the refinancing of the First Lien Exit Facility. On February 14, 2018, the Company gave notice to the holder of the Building Note of its intent to prepay the Building Note in full during the first quarter of 2018.
See “Note
12
- Long-Term Debt” to the accompanying consolidated financial statements included in Item 8 of this report for additional discussion of the Company’s debt.
Contractual Obligations and Off-Balance Sheet Arrangements
At December 31, 2017, our contractual obligations included long-term debt obligations, third-party drilling rig agreements, asset retirement obligations, operating leases and other individually insignificant obligations. Additionally, we have certain financial instruments representing potential commitments that were incurred in the normal course of business to support our operations, including standby letters of credit and surety bonds. The underlying liabilities insured by these instruments are reflected in our balance sheets, where applicable. Therefore, no additional liability is reflected for the letters of credit and surety bonds.
60
As of
December 31, 2017
, we had future contractual payment commitments under various agreements, which are summarized below. The third-party drilling rig and operating leases are not recorded in the accompanying consolidated balance sheets.
|
|
Payments Due by Period
|
||||||||||||||||||
|
|
Total
|
Less than
1 year
|
1-3 years
|
3-5 years
|
More than
5 years
|
||||||||||||||
|
|
(In thousands)
|
||||||||||||||||||
|
Long-term debt obligations(1)
|
$
|
49,814
|
|
$
|
3,181
|
|
$
|
7,529
|
|
$
|
39,104
|
|
$
|
—
|
|
||||
|
Third-party drilling rig agreements(2)
|
3,400
|
|
3,400
|
|
—
|
|
—
|
|
—
|
|
|||||||||
|
Asset retirement obligations(3)
|
77,544
|
|
41,017
|
|
—
|
|
—
|
|
36,527
|
|
|||||||||
|
Operating leases and other(4)
|
12,039
|
|
8,827
|
|
1,688
|
|
380
|
|
1,144
|
|
|||||||||
|
Total
|
$
|
142,797
|
|
$
|
56,425
|
|
$
|
9,217
|
|
$
|
39,484
|
|
$
|
37,671
|
|
||||
|
(1)
|
Includes interest on long-term debt (if any) in the years which it will be incurred, and assumes debt principal amounts are outstanding until their latest contractual maturity.
|
|
(2)
|
Includes drilling contracts with third-party drilling rig operators at specified day or footage rates and termination fees associated with our hydraulic fracturing services agreements. All of our drilling rig contracts contain operator performance conditions that allow for pricing adjustments or early termination for operator nonperformance.
|
|
(3)
|
Asset retirement obligations are based on estimates and assumptions that affect the reported amounts as of December 31, 2017. Certain of these estimates and assumptions are inherently unpredictable and will differ from actual results given the uncertainty regarding the timing of such expenditures. As a result, we do not expect to incur all of the estimated costs for the current asset retirement obligation shown above in the next year, and have budgeted $5.0 million for actual expected plugging and abandonment costs in 2018.
|
|
(4)
|
Includes the remaining obligation of $5.1 million for employee and employer match contributions to the participants of our non-qualified deferred compensation plan for eligible highly compensated employees who elect to defer income exceeding the Internal Revenue Service (“IRS”) annual limitations on qualified 401(k) retirement plans. This plan was terminated and contributions were fully distributed to participants in January 2018.
|
Valuation Allowance
Upon emergence from bankruptcy and the application of fresh start accounting, our tax basis in property, plant, and equipment exceeded the book carrying value of our assets. Additionally, we had an estimated U.S. federal net operating loss of approximately $1.3 billion remaining after the attribute reduction caused by the restructuring transactions. As such, the Successor Company had significant deferred tax assets to consume upon emergence. We considered all available evidence and concluded that it was more likely than not that some or all of the deferred tax assets would not be realized and established a valuation allowance against our net deferred tax asset upon emergence and maintained the valuation allowance for the subsequent periods through September 30, 2017.
We continue to closely monitor all available evidence in considering whether to maintain a valuation allowance on our net deferred tax asset. Factors considered include, but are not limited to, the reversal periods of existing deferred tax liabilities and deferred tax assets, our historical earnings and the prospects of future earnings. For purposes of the valuation allowance analysis, “earnings” is defined as pre-tax earnings as adjusted for permanent tax adjustments. The “Tax Cuts and Jobs Act” (the “TCJA”) enacted in December 2017 includes significant changes to the taxation of business entities, most of which are effective for taxable years beginning after December 31, 2017. These changes were taken into consideration when evaluating the reversal periods of existing deferred tax liabilities and deferred tax assets and the prospects of future earnings.
In determining whether to maintain the valuation allowance at
December 31, 2017
, we concluded that the objectively verifiable negative evidence of the presumption of cumulative negative earnings upon emergence and actual cumulative negative earnings for the Successor Company period ending December 31, 2017, is difficult to overcome with any forms of positive evidence that may exist. Accordingly, we have not changed our judgment regarding the need for a full valuation allowance against our net deferred tax asset for the period ending
December 31, 2017
.
See “Note
19
- Income Taxes” to the accompanying unaudited condensed consolidated financial statements for additional discussion of income tax related matters.
61
Critical Accounting Policies and Estimates
The discussion and analysis of the Company’s financial condition and results of operations are based upon the Company’s consolidated financial statements, which have been prepared in accordance with accounting principles generally accepted in the United States of America. The preparation of the Company’s financial statements requires the Company to make assumptions and prepare estimates that affect the reported amounts of assets, liabilities, revenues and expenses and the disclosure of contingent assets and liabilities. The Company bases its estimates on historical experience and various other assumptions that the Company believes are reasonable; however, actual results may differ significantly. The Company’s critical accounting policies and additional information on significant estimates used by the Company are discussed below. See “Note
3
—Summary of Significant Accounting Policies” to the Company’s consolidated financial statements in Item 8 of this report for additional discussion of the Company’s significant accounting policies.
Fresh Start Accounting.
Upon emergence from bankruptcy, the Company applied fresh start accounting to its financial statements because (i) the holders of existing voting shares of the Company prior to its emergence received less than 50% of the voting shares of the Company outstanding following its emergence from bankruptcy and (ii) the reorganization value of the Company’s assets immediately prior to confirmation of the plan of reorganization was less than the post-petition liabilities and allowed claims. Fresh start accounting was applied to the Company’s consolidated financial statements as of October 1, 2016. Under the principles of fresh start accounting, a new reporting entity was considered to have been created, and, as a result, the Company allocated the reorganization value of the Company to its individual assets, including property, plant and equipment, based on their estimated fair values. As a result of the application of fresh start accounting and the effects of the implementation of the plan of reorganization, the financial statements on or after
October 1, 2016
, are not comparable with the financial statements prior to that date.
Derivative Financial Instruments.
To manage risks related to fluctuations in prices attributable to its expected oil and natural gas production, the Company enters into oil and natural gas derivative contracts. Entrance into such contracts is dependent upon prevailing or anticipated market conditions. The Company may also, from time to time, enter into interest rate swaps in order to manage risk associated with its exposure to variable interest rates and issue long-term debt that contains embedded derivatives.
The Company recognizes its derivative instruments as either assets or liabilities at fair value with changes in fair value recognized in earnings unless designated as a hedging instrument with specific hedge accounting criteria having been met. The Company has elected not to designate price risk management activities as accounting hedges under applicable accounting guidance, and, accordingly, accounts for its commodity derivative contracts at fair value with changes in fair value reported currently in earnings. The Company’s earnings may fluctuate significantly as a result of changes in fair value. Derivative assets and liabilities are netted whenever a legally enforceable master netting agreement exists with the counterparty to a derivative contract. The related cash flow impact of the Company’s derivative activities are reflected as cash flows from operating activities unless the derivative contract contains a significant financing element, in which case, cash settlements are classified as cash flows from financing activities in the consolidated statements of cash flows.
Fair values of the substantial majority of the Company’s commodity derivative financial instruments are determined primarily by using discounted cash flow calculations or option pricing models, and are based upon inputs that are either readily available in the public market, such as oil and natural gas futures prices, volatility factors, interest rates and discount rates, or can be corroborated from active markets. Estimates of future prices are based upon published forward commodity price curves for oil and natural gas instruments. Valuations also incorporate adjustments for the nonperformance risk of the Company or its counterparties, as applicable.
Proved Reserves.
Approximately
95.4%
of the Company’s reserves were estimated by independent petroleum engineers for the year ended
December 31, 2017
. Estimates of proved reserves are based on the quantities of oil, natural gas and NGLs that geological and engineering data demonstrate, with reasonable certainty, to be recoverable in future years from known reservoirs under existing economic and operating conditions. However, there are numerous uncertainties inherent in estimating quantities of proved reserves and in projecting future revenues, rates of production and timing of development expenditures, including many factors beyond the Company’s control. Estimating reserves is a complex process of estimating underground accumulations of oil and natural gas that cannot be measured in an exact manner and relies on assumptions and subjective interpretations of available geologic, geophysical, engineering and production data, and the accuracy of reserve estimates is a function of the quality and quantity of available data, engineering and geological interpretation and judgment. In addition, as a result of volatility and changing market conditions, commodity prices and future development costs will change from period to period, causing estimates of proved reserves to change, as well as causing estimates of future net revenues to change. For the years ended
December 31, 2017
,
2016
and
2015
, the Company revised its proved reserves from prior years’ reports by approximately
10.9
MMBoe,
(105.4)
MMBoe and
(234.6)
MMBoe, respectively, due to production performance indicating more (or less) reserves in place, market prices during or at the end of the applicable period, larger (or smaller) reservoir size than initially estimated or additional proved reserve bookings
62
within the original field boundaries. Estimates of proved reserves are key components of the Company’s most significant financial estimates used to determine depreciation and depletion on oil and natural gas properties and its full cost ceiling limitation. Future revisions to estimates of proved reserves may be material and could materially affect the Company’s future depreciation, depletion and impairment expenses. As part of fresh start accounting, proved reserves were adjusted to their estimated fair value as of October 1, 2016, as described in “Note
2
—Fresh Start Accounting.”
Method of Accounting for Oil and Natural Gas Properties.
The Company’s business is subject to accounting rules that are unique to the oil and natural gas industry. There are two allowable methods of accounting for oil and natural gas business activities: the successful efforts method and the full cost method. The Company uses the full cost method to account for its oil and natural gas properties. All direct costs and certain indirect costs associated with the acquisition, exploration and development of oil and natural gas properties are capitalized. Exploration and development costs include dry well costs, geological and geophysical costs, direct overhead related to exploration and development activities and other costs incurred for the purpose of finding oil, natural gas and NGL reserves. Amortization of oil and natural gas properties is calculated using the unit-of-production method based on estimated proved oil, natural gas and NGL reserves. Sales and abandonments of oil and natural gas properties being amortized are accounted for as adjustments to the full cost pool, with no gain or loss recognized, unless the adjustments would significantly alter the relationship between capitalized costs and proved oil, natural gas and NGL reserves. A significant alteration would not ordinarily be expected to occur upon the sale of reserves involving less than 25% of the proved reserve quantities of a cost center.
Under the successful efforts method, geological and geophysical costs and costs of carrying and retaining undeveloped properties are charged to expense as incurred. Costs of drilling exploratory wells that do not result in proved reserves are charged to expense. Depreciation, depletion and impairment of oil and natural gas properties are generally calculated on a well by well, lease or field basis versus the aggregated “full cost” pool basis. Additionally, gain or loss is generally recognized on all sales of oil and natural gas properties under the successful efforts method. As a result, the Company’s financial statements will differ from companies that apply the successful efforts method since the Company will generally reflect a higher level of capitalized costs as well as a higher oil and natural gas depreciation and depletion rate, and the Company will not have exploration expenses that successful efforts companies frequently have.
Impairment of Oil and Natural Gas Properties.
In accordance with full cost accounting rules, capitalized costs are subject to a limitation. The capitalized cost of oil and natural gas properties, net of accumulated depreciation, depletion and impairment, less related deferred income taxes, may not exceed an amount equal to the present value of future net revenues from proved oil, natural gas and NGL reserves, discounted at 10% per annum, plus the lower of cost or fair value of unproved properties, plus estimated salvage value, less related tax effects (the “ceiling limitation”). The Company calculates its full cost ceiling limitation using the 12-month average oil and natural gas prices for the most recent 12 months as of the balance sheet date and adjusted for basis or location differential, held constant over the life of the reserves. If capitalized costs exceed the ceiling limitation, the excess must be charged to expense. Once incurred, a write-down cannot be reversed at a later date. The Successor Company recorded full cost ceiling impairment of
$319.1 million
for the period from October 2, 2016 through December 31, 2016, and the Predecessor Company recorded full cost ceiling impairments of
$657.4 million
and
$4.5 billion
for the period from January 1, 2016 through October 1, 2016, and the year ended December 31, 2015, respectively. No full cost ceiling impairment was recorded for the year ended
December 31, 2017
. See “Consolidated Results of Operations” for additional discussion of full cost ceiling impairments.
Unproved Properties.
The balance of unproved properties consists primarily of costs to acquire unproved acreage. These costs are initially excluded from the Company’s amortization base until it is known whether proved reserves will or will not be assigned to the property. The Company assesses all properties, on an individual basis or as a group if properties are individually insignificant, classified as unproved on a quarterly basis for possible impairment or reduction in value. The assessment includes consideration of various factors, including, but not limited to, the following: intent to drill; remaining lease term; geological and geophysical evaluations; drilling results and activity; assignment of proved reserves; and economic viability of development if proved reserves are assigned. During any period in which these factors indicate an impairment, all or a portion of the associated leasehold costs are transferred to the full cost pool and become subject to amortization. Costs of seismic data are allocated to various unproved leaseholds and transferred to the amortization base with the associated leasehold costs on a specific project basis. The Company estimates that substantially all of its costs classified as unproved as of the balance sheet date will be evaluated and transferred within a 10-year period from the date of acquisition, contingent on the Company’s capital expenditures and drilling program. As part of fresh start accounting, proved reserves were adjusted to their estimated fair value as of October 1, 2016, as described in “Note
2
—Fresh Start Accounting.”
Property, Plant and Equipment, Net.
Other capitalized costs, including drilling equipment, natural gas gathering and treating equipment, transportation equipment and other property and equipment are carried at cost. Renewals and improvements are capitalized while repairs and maintenance are expensed. Depreciation of such property and equipment is computed using the straight-line method over the estimated useful lives of the assets, which range from 10 to 39 years for buildings and 2 to 30 years
63
for equipment. When property and equipment components are disposed of, the cost and the related accumulated depreciation are removed and any resulting gain or loss is reflected in operations. Realization of the carrying value of property and equipment is reviewed for possible impairment whenever events or changes in circumstances indicate that the carrying value of such asset or asset group may not be recoverable. Assets are considered to be impaired if a forecast of undiscounted estimated future net operating cash flows directly related to the asset or asset group including disposal value, if any, is less than the carrying amount of the asset or asset group. If an asset or asset group is determined to be impaired, the impairment loss is measured as the amount by which the carrying amount of the asset or asset group exceeds its fair value. Fair value may be estimated using comparable market data, a discounted cash flow method, or a combination of the two as considered appropriate based on the circumstances. The Company may also determine fair value by using the present value of estimated future cash inflows and/or outflows, or third-party offers or prices of comparable assets with consideration of current market conditions to value its non-financial assets and liabilities when circumstances dictate determining fair value is necessary. Changes in such estimates could cause the Company to reduce the carrying value of property and equipment. As part of fresh start accounting, property, plant and equipment were adjusted to their estimated fair value and depreciable lives were revised as of October 1, 2016, as described in “Note
2
—Fresh Start Accounting.”
See “—Consolidated Results of Operations” and “Note
10
—Impairment” to the Company’s consolidated financial statements in Item 8 of this report for a discussion of the Company’s impairments.
Asset Retirement Obligations.
Asset retirement obligations represent the estimate of fair value of the cost to plug, abandon and remediate the Company’s wells at the end of their productive lives, in accordance with applicable federal and state laws. The Company estimates the fair value of an asset’s retirement obligation in the period in which the liability is incurred (at the time the wells are drilled or acquired). Estimating future asset retirement obligations requires management to make estimates and judgments regarding timing, existence of a liability and what constitutes adequate restoration. The Company employs a present value technique to estimate the fair value of an asset retirement obligation, which reflects certain assumptions and requires significant judgment, including an inflation rate, its credit-adjusted, risk-free interest rate, the estimated settlement date of the liability and the estimated current cost to settle the liability based on third-party quotes and current actual costs. Inherent in the present value calculation are the timing of settlement and changes in the legal, regulatory, environmental and political environments, which are subject to change. Changes in timing or to the original estimate of cash flows will result in changes to the carrying amount of the liability.
Revenue Recognition.
Oil, natural gas and NGL revenues are recorded when title of production sold passes to the customer, net of royalties, discounts and allowances, as applicable. The Successor Company has made an accounting policy election to deduct transportation costs from oil, natural gas and NGL revenues. Taxes assessed by governmental authorities on oil, natural gas and NGL sales are presented separately from such revenues and included in production tax expense in the consolidated statements of operations.
Income Taxes.
Deferred income taxes are recorded for temporary differences between the financial statement and income tax basis of assets and liabilities. Deferred tax assets are recognized for temporary differences that will be deductible in future years’ tax returns and for operating loss and tax credit carryforwards. Deferred tax assets are reduced by a valuation allowance if it is deemed more likely than not that some or all of the deferred tax assets will not be realized. Deferred tax liabilities are recognized for temporary differences that will be taxable in future years’ tax returns. As of
December 31, 2017
, the Company had a full valuation allowance against its net deferred tax asset. The valuation allowance serves to reduce the tax benefits recognized from the net deferred tax asset to an amount that is more likely than not to be realized based on the weight of all available evidence.
New Accounting Pronouncements.
For a discussion of recently adopted accounting standards and recent accounting standards not yet adopted, see “Note
3
—Summary of Significant Accounting Policies” to the Company’s consolidated financial statements in Item 8 of this report.
64
Item 7A.
Quantitative and Qualitative Disclosures About Market Risk
General
This discussion provides information about the financial instruments we use to manage commodity prices. All contracts are settled in cash and do not require the actual delivery of a commodity at settlement. Additionally, our exposure to credit risk and interest rate risk is also discussed.
Commodity Price Risk.
Our most significant market risk relates to the prices we receive for oil, natural gas and NGLs. Due to the historical price volatility of these commodities, from time to time, depending upon our view of opportunities under the then-prevailing market conditions, we enter into commodity pricing derivative contracts for a portion of our anticipated production volumes for the purpose of reducing the variability of oil and natural gas prices we receive. Our credit facility limits our ability to enter into derivative transactions to 90% of expected production volumes from estimated proved reserves.
We use, and may continue to use, a variety of commodity-based derivative contracts, including fixed price swaps, basis swaps and collars. At
December 31, 2017
, our commodity derivative contracts consisted of fixed price swaps under which we receive a fixed price for the contract and pay a floating market price to the counterparty over a specified period for a contracted volume. In light of the high correlation between NGL and oil prices, for 2018 we plan to manage a portion of our NGL price exposure using oil fixed price swaps at a three-to-one (3:1) NGL to crude oil ratio.
Our oil fixed price swap transactions are settled based upon the average daily prices for the calendar month of the contract period and our natural gas fixed price swap transactions are settled based upon the last day settlement of the first nearby month futures contract of the contract period. Settlement for oil derivative contracts occurs in the succeeding month and natural gas derivative contracts are settled in the production month.
At
December 31, 2017
, our open commodity derivative contracts consisted of the following:
Oil Price Swaps
|
Notional (MBbls)
|
Weighted Average
Fixed Price
|
|||||
|
January 2018 - December 2018
|
3,464
|
|
$
|
55.08
|
|
|
|
January 2019 - December 2019
|
1,460
|
|
$
|
53.34
|
|
|
Natural Gas Price Swaps
|
Notional (MMcf)
|
Weighted Average
Fixed Price
|
|||||
|
January 2018 - December 2018
|
17,300
|
|
$
|
3.16
|
|
|
Because we have not designated any of our derivative contracts as hedges for accounting purposes, changes in fair values of our derivative contracts are recognized as gains and losses in current period earnings. As a result, our current period earnings may be significantly affected by changes in the fair value of our commodity derivative contracts. Changes in fair value are principally measured based on a comparison of future prices as of period-end to the contract price.
We recorded (gain) loss on commodity derivative contracts of
$(24.1) million
and
$25.7 million
for the year ended December 31,
2017
, and the Successor 2016 Period, respectively, as reflected in the accompanying consolidated statements of operations, which includes net cash receipts upon settlement of
$7.3 million
and
$7.7 million
, respectively.
We recorded loss (gain) on commodity derivative contracts of
$4.8 million
and
$(73.1) million
for the Predecessor 2016 Period and year ended December 31,
2015
, respectively, as reflected in the consolidated statements of operations in Item 8 of this report, which includes net cash receipts upon settlement of
$72.6 million
and
$327.7 million
, respectively. The net receipts for the Predecessor 2016 Period include early settlements after the Chapter 11 filings occurred, resulting in
$17.9 million
of cash receipts.
See “Note
13
—Derivatives” to the consolidated financial statements in Item 8 of this report for additional information regarding our commodity derivatives.
65
Credit Risk.
All of our derivative transactions have been carried out in the over-the-counter market. The use of derivative transactions in over-the-counter markets involves the risk that the counterparties may be unable to meet the financial terms of the transactions. The counterparties for all of our derivative transactions have an “investment grade” credit rating. We monitor the credit ratings of our derivative counterparties and consider our counterparties’ credit default risk ratings in determining the fair value of our derivative contracts. Our derivative contracts are with multiple counterparties to minimize exposure to any individual counterparty.
Both the default under the Predecessor’s senior credit facility and the Chapter 11 filing constituted defaults under our commodity derivative contracts. As a result, certain commodity derivative contracts were settled in the second quarter of 2016 and prior to their contractual maturities after the Chapter 11 filings occurred.
We do not require collateral or other security from counterparties to support derivative instruments. We have master netting agreements with each of our derivative contract counterparties, which allow us to net our derivative assets and liabilities by commodity type with the same counterparty. As a result of the netting provisions, our maximum amount of loss under derivative transactions due to credit risk is limited to the net amounts due from the counterparties under the commodity derivative contracts. Our loss is further limited as any amounts due from a defaulting counterparty that is a lender under the credit facility can be offset against amounts owed, if any, to such counterparty. As of
December 31, 2017
, the counterparties to our open commodity derivative contracts consisted of seven financial institutions, all of which are also lenders under the credit facility. As a result, we are not required to post additional collateral under our commodity derivative contracts.
Interest Rate Risk.
We are exposed to interest rate risk on our credit facility. This variable interest rate on our credit facility fluctuates, and exposes us to short-term changes in market interest rates as our interest obligations on this instrument is periodically redetermined based on prevailing market interest rates, primarily LIBOR and the federal funds rate. We had no outstanding variable rate debt as of
December 31, 2017
.
Item 8.
Financial Statements and Supplementary Data
The Company’s consolidated financial statements required by this item are included in this report beginning on page F-1.
Item 9.
Changes in and Disagreements with Accountants on Accounting and Financial Disclosure
Not applicable.
Item 9A.
Controls and Procedures
Disclosure Controls and Procedures.
Under the supervision and with the participation of the Company’s management, including its Interim Chief Executive Officer and Chief Financial Officer, the Company performed an evaluation of the effectiveness of the design and operation of its disclosure controls and procedures pursuant to Exchange Act Rules 13a-15(b) and 15d-15(b) as of the end of the period covered by this annual report. Based on that evaluation, the Company’s Interim Chief Executive Officer and its Chief Financial Officer concluded that its disclosure controls and procedures were effective as of December 31, 2017 to provide reasonable assurance that the information required to be disclosed by the Company in its reports filed or submitted under the Exchange Act is recorded, processed, summarized and reported within the time periods specified in the rules and forms of the SEC, and such information is accumulated and communicated to management, including the Interim Chief Executive Officer and Chief Financial Officer, as appropriate to allow timely decisions regarding required disclosur
e
.
Management’s Report on Internal Control over Financial Reporting
The information required to be filed pursuant to this item is set forth under the captions “Management’s Report on Internal Control over Financial Reporting” in Part IV of this report.
66
Changes in Internal Control over Financial Reporting
There were no changes in the Company’s internal control over financial reporting during the quarter ended December 31, 2017 that have materially affected, or are reasonably likely to materially affect, the Company’s internal control over financial reporting.
Item 9B.
Other Information
Not Applicable.
67
Item 10.
Directors, Executive Officers and Corporate Governance
The information required by this item is incorporated herein by reference to the following sections of the Company’s definitive proxy statement, which will be filed no later than
April 30, 2018
: “Director Biographical Information,” “Executive Officers,” “Compliance with Section 16(a) of the Exchange Act” and “Corporate Governance Matters.”
Item 11.
Executive Compensation
The information required by this item is incorporated herein by reference to the following sections of the Company’s definitive proxy statement, which will be filed no later than
April 30, 2018
: “Director Compensation,” “Outstanding Equity Awards” and “Executive Officers and Compensation.”
Item 12.
Security Ownership of Certain Beneficial Owners and Management and Related Stockholder Matters
The information required by this item is incorporated herein by reference to the following sections of the Company’s definitive proxy statement, which will be filed no later than
April 30, 2018
: “Equity Compensation Plan Information” and “Security Ownership of Certain Beneficial Owners and Management.”
Item 13.
Certain Relationships and Related Transactions and Director Independence
The information required by this item is incorporated herein by reference to the following sections of the Company’s definitive proxy statement, which will be filed no later than
April 30, 2018
: “Related Party Transactions” and “Corporate Governance Matters.”
Item 14.
Principal Accounting Fees and Services
The information required by this item is incorporated herein by reference to the section captioned “Ratification of Selection of Independent Registered Public Accounting Firm” in the Company’s definitive proxy statement, which will be filed no later than
April 30, 2018
.
68
Item 15.
Exhibits and Financial Statement Schedules
The following documents are filed as a part of this report:
(1)
Consolidated Financial Statements
Reference is made to the Index to Consolidated Financial Statements appearing on page F-1.
(2)
Financial Statement Schedules
All financial statement schedules have been omitted because they are not applicable or the required information is presented in the consolidated financial statements or notes thereto.
(3)
Exhibits
Item 16.
Form 10-K Summary
Not Applicable.
69
INDEX TO CONSOLIDATED FINANCIAL STATEMENTS
|
|
Page(s)
|
F-1
Management’s Report on Internal Control over Financial Reporting
Management of SandRidge Energy, Inc. is responsible for establishing and maintaining adequate internal control over financial reporting as defined in Rules 13a-15(f) and 15d-15(f) under the Securities Exchange Act of 1934, as amended (the “Exchange Act”). Internal control over financial reporting is a process designed by, or under the supervision of, the Company’s Chief Executive Officer and Chief Financial Officer to provide reasonable assurance regarding the reliability of financial reporting and the preparation of the Company’s financial statements for external purposes in accordance with generally accepted accounting principles.
Management assessed the effectiveness of the Company’s internal control over financial reporting as of December 31, 2017. In making this assessment, management used the criteria established in
Internal Control-Integrated Framework
issued by the Committee of Sponsoring Organizations of the Treadway Commission (2013) (the COSO criteria). Based on management’s assessment using the COSO criteria, management concluded the Company’s internal control over financial reporting was effective as of December 31, 2017.
The effectiveness of the Company’s internal control over financial reporting as of December 31, 2017 has been audited by PricewaterhouseCoopers LLP an independent registered public accounting firm, as stated in its report which appears herein.
|
/s/ W
ILLIAM
(B
ILL)
M. G
RIFFIN
|
|
/s/ J
ULIAN
B
OTT
|
|
William (Bill) M. Griffin
President and Chief Executive Officer
|
|
Julian Bott
Executive Vice President and Chief Financial Officer
|
F-2
Report of Independent Registered Public Accounting Firm
To the Board of Directors and Stockholders of SandRidge Energy, Inc.
Opinions on the Financial Statements and Internal Control over Financial Reporting
We have audited the accompanying consolidated balance sheets of SandRidge Energy, Inc. and its subsidiaries (Successor Company)
as of December 31, 2017
and 2016,
and the related consolidated statements of operations, changes in stockholders’ equity (deficit) and cash flows
for the year ended December 31, 2017 and the period from October 2, 2016 to December 31, 2016, including the related notes (collectively referred to as the “consolidated financial statements”).
We also have audited the Company's internal control over financial reporting as of December 31, 2017, based on criteria established in
Internal Control - Integrated Framework
(2013)
issued by the Committee of Sponsoring Organizations of the Treadway Commission (COSO).
In our opinion, the consolidated
financial statements referred to above present fairly, in all material respects, the financial position of the Company as of December 31, 2017 and 2016
,
and the results of their
operations and their
cash flows for the year ended December 31, 2017 and the period from October 2, 2016 to December 31, 2016 in conformity with accounting principles generally accepted in the United States of America. Also in our opinion, the Company maintained, in all material respects, effective internal control over financial reporting as of December 31, 2017, based on criteria established in
Internal Control - Integrated Framework
(2013)
issued by the COSO.
Basis of Accounting
As discussed in Note 1 to the consolidated
financial statements, the United States Bankruptcy Court for the district of Southern Texas confirmed the Company's Amended Joint Chapter 11 Plan of Reorganization (the "plan") on September 9, 2016. Confirmation of the plan resulted in the discharge of all claims against the Company that arose before October 1, 2016
and substantially alters or terminates all rights and interests of equity security holders as provided for in the plan. The plan was substantially consummated on October 4, 2016
and the Company emerged from bankruptcy. In connection with its emergence from bankruptcy, the
Company adopted fresh start accounting as of October 1, 2016.
Basis for Opinions
The Company's management is responsible for these consolidated financial statements, for maintaining effective internal control over financial reporting, and for its assessment of the effectiveness of internal control over financial reporting, included in the accompanying Management's Report on Internal Control over Financial Reporting. Our responsibility is to express opinions on the Company’s consolidated
financial statements and on the Company's internal control over financial reporting based on our audits. We are a public accounting firm registered with the Public Company Accounting Oversight Board (United States) ("PCAOB") and are required to be independent with respect to the Company in accordance with the U.S. federal securities laws and the applicable rules and regulations of the Securities and Exchange Commission and the PCAOB.
We conducted our audits in accordance with the standards of the PCAOB. Those standards require that we plan and perform the audits to obtain reasonable assurance about whether the consolidated
financial statements are free of material misstatement, whether due to error or fraud, and whether effective internal control over financial reporting was maintained in all material respects.
Our audits of the consolidated
financial statements included performing procedures to assess the risks of material misstatement of the consolidated
financial statements, whether due to error or fraud, and performing procedures that respond to those risks. Such procedures included examining, on a test basis, evidence regarding the amounts and disclosures in the consolidated
financial statements. Our audits also included evaluating the accounting principles used and significant estimates made by management, as well as evaluating the overall presentation of the consolidated
financial statements. Our audit of internal control over financial reporting included obtaining an understanding of internal control over financial reporting, assessing the risk that a material weakness exists, and testing and evaluating the design and operating effectiveness of internal control based on the assessed risk. Our audits also included performing such other procedures as we considered necessary in the circumstances. We believe that our audits provide a reasonable basis for our opinions.
Definition and Limitations of Internal Control over Financial Reporting
A company’s internal control over financial reporting is a process designed to provide reasonable assurance regarding the reliability of financial reporting and the preparation of financial statements for external purposes in accordance with generally accepted accounting principles. A company’s internal control over financial reporting includes those policies and procedures that (i) pertain to the maintenance of records that, in reasonable detail, accurately and fairly reflect the transactions and dispositions of the assets
F-3
of the company; (ii) provide reasonable assurance that transactions are recorded as necessary to permit preparation of financial statements in accordance with generally accepted accounting principles, and that receipts and expenditures of the company are being made only in accordance with authorizations of management and directors of the company; and (iii) provide reasonable assurance regarding prevention or timely detection of unauthorized acquisition, use, or disposition of the company’s assets that could have a material effect on the financial statements.
Because of its inherent limitations, internal control over financial reporting may not prevent or detect misstatements. Also, projections of any evaluation of effectiveness to future periods are subject to the risk that controls may become inadequate because of changes in conditions, or that the degree of compliance with the policies or procedures may deteriorate.
|
/s/ PricewaterhouseCoopers LLP
|
|
|
PricewaterhouseCoopers LLP
|
|
|
Oklahoma City, Oklahoma
|
|
|
February 22, 2018
|
|
|
|
|
|
We have served as the Company’s auditor since 2005.
|
|
F-4
Report of Independent Registered Public Accounting Firm
To the Board of Directors and Stockholders of SandRidge Energy, Inc.
In our opinion, the accompanying consolidated statements of operations, changes in stockholders’ equity (deficit) and cash flows present fairly, in all material respects, the results of operations and cash flows of SandRidge Energy, Inc. and its subsidiaries (Predecessor Company) for the period from January 1, 2016 to October 1, 2016, and the year ended December 31, 2015
in conformity with accounting principles generally accepted in the United States of America. These financial statements are the responsibility of the Company’s management. Our responsibility is to express an opinion on these financial statements based on our audits. We conducted our audits of these statements in accordance with the standards of the Public Company Accounting Oversight Board (United States). Those standards require that we plan and perform the audit to obtain reasonable assurance about whether the financial statements are free of material misstatement. An audit includes examining, on a test basis, evidence supporting the amounts and disclosures in the financial statements, assessing the accounting principles used and significant estimates made by management, and evaluating the overall financial statement presentation. We believe that our audits provide a reasonable basis for our opinion.
As discussed in Note 1 to the consolidated financial statements, the Company filed a petition on May 16, 2016 with the United States Bankruptcy Court for the district of Southern Texas for reorganization under the provisions of Chapter 11 of the Bankruptcy Code. The Company’s Amended Joint Chapter 11 Plan of Reorganization
was substantially consummated on October 4, 2016
and the Company emerged from bankruptcy. In connection with its emergence from bankruptcy, the
Company adopted fresh start accounting.
|
/s/ PricewaterhouseCoopers LLP
|
|
|
PricewaterhouseCoopers LLP
|
|
|
Oklahoma City, Oklahoma
|
|
|
March 3, 2017
|
|
F-5
SandRidge Energy, Inc. and Subsidiaries
(In thousands, except per share data)
|
|
December 31,
|
December 31,
|
|||||
|
|
2017
|
2016
|
|||||
|
ASSETS
|
|||||||
|
Current assets
|
|||||||
|
Cash and cash equivalents
|
$
|
|
|
$
|
|
|
|
|
Restricted cash - collateral
|
|
|
|
|
|||
|
Restricted cash - other
|
|
|
|
|
|||
|
Accounts receivable, net
|
|
|
|
|
|||
|
Derivative contracts
|
|
|
|
|
|||
|
Prepaid expenses
|
|
|
|
|
|||
|
Other current assets
|
|
|
|
|
|||
|
Total current assets
|
|
|
|
|
|||
|
Oil and natural gas properties, using full cost method of accounting
|
|||||||
|
Proved (includes development and project costs excluded from amortization of $16.7 million at December 31, 2016)
|
|
|
|
|
|||
|
Unproved
|
|
|
|
|
|||
|
Less: accumulated depreciation, depletion and impairment
|
(
|
)
|
(
|
)
|
|||
|
|
|
|
|
||||
|
Other property, plant and equipment, net
|
|
|
|
|
|||
|
Other assets
|
|
|
|
|
|||
|
Total assets
|
$
|
|
|
$
|
|
|
|
The accompanying notes are an integral part of these consolidated financial statements.
F-6
SandRidge Energy, Inc. and Subsidiaries
Consolidated Balance Sheets—Continued
(In thousands, except per share data)
|
|
December 31,
|
December 31,
|
|||||
|
|
2017
|
2016
|
|||||
|
LIABILITIES AND STOCKHOLDERS’ EQUITY
|
|||||||
|
Current liabilities
|
|||||||
|
Accounts payable and accrued expenses
|
$
|
|
|
$
|
|
|
|
|
Derivative contracts
|
|
|
|
|
|||
|
Asset retirement obligations
|
|
|
|
|
|||
|
Other current liabilities
|
|
|
|
|
|||
|
Total current liabilities
|
|
|
|
|
|||
|
Long-term debt
|
|
|
|
|
|||
|
Derivative contracts
|
|
|
|
|
|||
|
Asset retirement obligations
|
|
|
|
|
|||
|
Other long-term obligations
|
|
|
|
|
|||
|
Total liabilities
|
|
|
|
|
|||
|
Commitments and contingencies (Note 15)
|
|
|
|||||
|
Stockholders’ Equity
|
|||||||
|
Common stock, $0.001 par value; 250,000 shares authorized; 35,650 issued and outstanding at December 31, 2017 and 21,042 issued and 19,635 outstanding at December 31, 2016
|
|
|
|
|
|||
|
Warrants
|
|
|
|
|
|||
|
Additional paid-in capital
|
|
|
|
|
|||
|
Accumulated deficit
|
(
|
)
|
(
|
)
|
|||
|
Total stockholders’ equity
|
|
|
|
|
|||
|
Total liabilities and stockholders’ equity
|
$
|
|
|
$
|
|
|
|
The accompanying notes are an integral part of these consolidated financial statements.
F-7
SandRidge Energy, Inc. and Subsidiaries
For the Year Ended
December 31, 2017
, the
Period from October 2, 2016 through December 31, 2016
, the
Period from January 1, 2016 through October 1, 2016
and the Year Ended
December 31, 2015
(In thousands, except per share amounts)
|
|
Successor
|
Predecessor
|
||||||||||||||
|
|
Year Ended December 31, 2017
|
Period from October 2, 2016 through December 31, 2016
|
Period from January 1, 2016 through October 1, 2016
|
Year Ended December 31, 2015
|
||||||||||||
|
Revenues
|
||||||||||||||||
|
Oil, natural gas and NGL
|
$
|
|
|
$
|
|
|
$
|
|
|
$
|
|
|
||||
|
Other
|
|
|
|
|
|
|
|
|
||||||||
|
Total revenues
|
|
|
|
|
|
|
|
|
||||||||
|
Expenses
|
||||||||||||||||
|
Production
|
|
|
|
|
|
|
|
|
||||||||
|
Production taxes
|
|
|
|
|
|
|
|
|
||||||||
|
Depreciation and depletion—oil and natural gas
|
|
|
|
|
|
|
|
|
||||||||
|
Depreciation and amortization—other
|
|
|
|
|
|
|
|
|
||||||||
|
Impairment
|
|
|
|
|
|
|
|
|
||||||||
|
General and administrative
|
|
|
|
|
|
|
|
|
||||||||
|
Terminated merger costs
|
|
|
|
|
|
|
|
|
||||||||
|
Employee termination benefits
|
|
|
|
|
|
|
|
|
||||||||
|
(Gain) loss on derivative contracts
|
(
|
)
|
|
|
|
|
(
|
)
|
||||||||
|
Loss on settlement of contract
|
|
|
|
|
|
|
|
|
||||||||
|
Other operating expenses
|
|
|
|
|
|
|
|
|
||||||||
|
Total expenses
|
|
|
|
|
|
|
|
|
||||||||
|
Income (loss) from operations
|
|
|
(
|
)
|
(
|
)
|
(
|
)
|
||||||||
|
Other (expense) income
|
||||||||||||||||
|
Interest expense
|
(
|
)
|
(
|
)
|
(
|
)
|
(
|
)
|
||||||||
|
Gain on extinguishment of debt
|
|
|
|
|
|
|
|
|
||||||||
|
Gain on reorganization items, net
|
|
|
|
|
|
|
|
|
||||||||
|
Other income, net
|
|
|
|
|
|
|
|
|
||||||||
|
Total other (expense) income
|
(
|
)
|
|
|
|
|
|
|
||||||||
|
Income (loss) before income taxes
|
|
|
(
|
)
|
|
|
(
|
)
|
||||||||
|
Income tax (benefit) expense
|
(
|
)
|
|
|
|
|
|
|
||||||||
|
Net income (loss)
|
|
|
(
|
)
|
|
|
(
|
)
|
||||||||
|
Less: net loss attributable to noncontrolling interest
|
|
|
|
|
|
|
(
|
)
|
||||||||
|
Net income (loss) attributable to SandRidge Energy, Inc.
|
|
|
(
|
)
|
|
|
(
|
)
|
||||||||
|
Preferred stock dividends
|
|
|
|
|
|
|
|
|
||||||||
|
Income available (loss applicable) to SandRidge Energy, Inc. common stockholders
|
$
|
|
|
$
|
(
|
)
|
$
|
|
|
$
|
(
|
)
|
||||
|
Earnings (loss) per share
|
||||||||||||||||
|
Basic
|
$
|
|
|
$
|
(
|
)
|
$
|
|
|
$
|
(
|
)
|
||||
|
Diluted
|
$
|
|
|
$
|
(
|
)
|
$
|
|
|
$
|
(
|
)
|
||||
|
Weighted average number of common shares outstanding
|
||||||||||||||||
|
Basic
|
|
|
|
|
|
|
|
|
||||||||
|
Diluted
|
|
|
|
|
|
|
|
|
||||||||
The accompanying notes are an integral part of these consolidated financial statements.
F-8
SandRidge Energy, Inc. and Subsidiaries
Consolidated Statements of Changes in Stockholders’ Equity (Deficit)
For the Year Ended
December 31, 2017
, the
Period from October 2, 2016 through December 31, 2016
, the
Period from January 1, 2016 through October 1, 2016
and the Year Ended
December 31, 2015
|
|
Convertible
Perpetual
Preferred Stock
|
Common Stock
|
Additional
Paid-In
Capital
|
Treasury
Stock
|
Accumulated
Deficit
|
Non-controlling
Interest
|
Total
|
||||||||||||||||||||||||||
|
|
Shares
|
Amount
|
Shares
|
Amount
|
|||||||||||||||||||||||||||||
|
|
(In thousands)
|
||||||||||||||||||||||||||||||||
|
Balance at December 31, 2014 - Predecessor
|
|
|
$
|
|
|
|
|
$
|
|
|
$
|
|
|
$
|
(
|
)
|
$
|
(
|
)
|
$
|
|
|
$
|
|
|
||||||||
|
Distributions to noncontrolling interest owners
|
—
|
|
—
|
|
—
|
|
—
|
|
—
|
|
—
|
|
—
|
|
(
|
)
|
(
|
)
|
|||||||||||||||
|
Cash paid for tax withholdings on vested stock awards
|
—
|
|
—
|
|
—
|
|
—
|
|
(
|
)
|
—
|
|
—
|
|
—
|
|
(
|
)
|
|||||||||||||||
|
Stock distributions, net of purchases - retirement plans
|
—
|
|
—
|
|
(
|
)
|
—
|
|
(
|
)
|
|
|
—
|
|
—
|
|
|
|
|||||||||||||||
|
Stock-based compensation
|
—
|
|
—
|
|
—
|
|
—
|
|
|
|
—
|
|
—
|
|
—
|
|
|
|
|||||||||||||||
|
Payment received on shareholder receivable
|
—
|
|
—
|
|
—
|
|
—
|
|
|
|
—
|
|
—
|
|
—
|
|
|
|
|||||||||||||||
|
Issuance of restricted stock awards, net of cancellations
|
—
|
|
—
|
|
|
|
|
|
(
|
)
|
—
|
|
—
|
|
—
|
|
|
|
|||||||||||||||
|
Common stock issued for debt
|
—
|
|
—
|
|
|
|
|
|
|
|
—
|
|
—
|
|
|
|
|
|
|||||||||||||||
|
Conversion of preferred stock to common stock
|
(
|
)
|
—
|
|
|
|
|
|
(
|
)
|
—
|
|
—
|
|
—
|
|
|
|
|||||||||||||||
|
Net loss
|
—
|
|
—
|
|
—
|
|
—
|
|
—
|
|
—
|
|
(
|
)
|
(
|
)
|
(
|
)
|
|||||||||||||||
|
Convertible perpetual preferred stock dividends
|
—
|
|
—
|
|
|
|
|
|
|
|
—
|
|
(
|
)
|
—
|
|
(
|
)
|
|||||||||||||||
|
Balance at December 31, 2015 - Predecessor
|
|
|
|
|
|
|
|
|
|
|
(
|
)
|
(
|
)
|
|
|
(
|
)
|
|||||||||||||||
|
Cumulative effect of adoption of ASU 2015-02
|
—
|
|
—
|
|
—
|
|
—
|
|
—
|
|
—
|
|
|
|
(
|
)
|
(
|
)
|
|||||||||||||||
|
Cash paid for tax withholdings on vested stock awards
|
—
|
|
—
|
|
—
|
|
—
|
|
(
|
)
|
—
|
|
—
|
|
—
|
|
(
|
)
|
|||||||||||||||
|
Stock distributions, net of purchases - retirement plans
|
—
|
|
—
|
|
|
|
—
|
|
(
|
)
|
|
|
—
|
|
—
|
|
(
|
)
|
|||||||||||||||
|
Stock-based compensation
|
—
|
|
—
|
|
—
|
|
—
|
|
|
|
—
|
|
—
|
|
—
|
|
|
|
|||||||||||||||
|
Cancellations of restricted stock awards, net of issuance
|
—
|
|
—
|
|
(
|
)
|
|
|
(
|
)
|
—
|
|
—
|
|
—
|
|
|
|
|||||||||||||||
|
Common stock issued for debt
|
—
|
|
—
|
|
|
|
|
|
|
|
—
|
|
—
|
|
—
|
|
|
|
|||||||||||||||
|
Conversion of preferred stock to common stock
|
(
|
)
|
—
|
|
|
|
|
|
(
|
)
|
—
|
|
—
|
|
—
|
|
|
|
|||||||||||||||
|
Net income
|
—
|
|
—
|
|
—
|
|
—
|
|
—
|
|
—
|
|
|
|
—
|
|
|
|
|||||||||||||||
|
Convertible perpetual preferred stock dividends
|
—
|
|
—
|
|
—
|
|
—
|
|
—
|
|
—
|
|
(
|
)
|
—
|
|
(
|
)
|
|||||||||||||||
|
Balance at October 1, 2016 - Predecessor
|
|
|
|
|
|
|
|
|
|
|
(
|
)
|
(
|
)
|
(
|
)
|
(
|
)
|
|||||||||||||||
|
Cancellation of Predecessor equity
|
(
|
)
|
(
|
)
|
(
|
)
|
(
|
)
|
(
|
)
|
|
|
|
|
|
|
|
|
|||||||||||||||
|
Balance at October 1, 2016 - Predecessor
|
|
|
$
|
|
|
|
|
$
|
|
|
$
|
|
|
$
|
|
|
$
|
|
|
$
|
|
|
$
|
|
|
||||||||
The accompanying notes are an integral part of these consolidated financial statements.
F-9
SandRidge Energy, Inc. and Subsidiaries
Consolidated Statements of Changes in Stockholders’ Equity (Deficit)—Continued
For the Year Ended
December 31, 2017
, the
Period from October 2, 2016 through December 31, 2016
, the
Period from January 1, 2016 through October 1, 2016
and the Year Ended
December 31, 2015
|
|
Common Stock
|
Warrants
|
Additional
Paid-In
Capital
|
Accumulated
Deficit
|
Total
|
||||||||||||||||||||
|
|
Shares
|
Amount
|
Shares
|
Amount
|
|||||||||||||||||||||
|
|
|||||||||||||||||||||||||
|
Balance at October 1, 2016 - Predecessor
|
|
|
$
|
|
|
|
|
$
|
|
|
$
|
|
|
$
|
|
|
$
|
|
|
||||||
|
Issuance of Successor common stock
|
|
|
|
|
—
|
|
—
|
|
|
|
—
|
|
|
|
|||||||||||
|
Issuance of Successor warrants
|
—
|
|
—
|
|
|
|
|
|
—
|
|
—
|
|
|
|
|||||||||||
|
Convertible note premium
|
—
|
|
—
|
|
—
|
|
—
|
|
|
|
—
|
|
|
|
|||||||||||
|
Balance at October 1, 2016 - Successor
|
|
|
$
|
|
|
|
|
$
|
|
|
$
|
|
|
$
|
|
|
$
|
|
|
||||||
|
Issuance of stock awards, net of cancellations
|
|
|
|
|
—
|
|
—
|
|
|
|
—
|
|
|
|
|||||||||||
|
Common stock issued for debt
|
|
|
|
|
—
|
|
—
|
|
|
|
—
|
|
|
|
|||||||||||
|
Common stock issued for warrants
|
—
|
|
—
|
|
—
|
|
(
|
)
|
|
|
—
|
|
|
|
|||||||||||
|
Stock-based compensation
|
—
|
|
—
|
|
—
|
|
—
|
|
|
|
—
|
|
|
|
|||||||||||
|
Cash paid for tax withholdings on vested stock awards
|
—
|
|
—
|
|
—
|
|
—
|
|
(
|
)
|
—
|
|
(
|
)
|
|||||||||||
|
Net loss
|
—
|
|
—
|
|
—
|
|
—
|
|
—
|
|
(
|
)
|
(
|
)
|
|||||||||||
|
Balance at December 31, 2016 - Successor
|
|
|
|
|
|
|
|
|
|
|
(
|
)
|
|
|
|||||||||||
|
Issuance of stock awards, net of cancellations
|
|
|
|
|
—
|
|
—
|
|
(
|
)
|
—
|
|
|
|
|||||||||||
|
Common stock issued for debt
|
|
|
|
|
—
|
|
—
|
|
|
|
—
|
|
|
|
|||||||||||
|
Common stock issued for general unsecured claims
|
|
|
—
|
|
—
|
|
—
|
|
—
|
|
—
|
|
|
|
|||||||||||
|
Stock-based compensation
|
—
|
|
—
|
|
—
|
|
—
|
|
|
|
—
|
|
|
|
|||||||||||
|
Issuance of warrants for general unsecured claims
|
—
|
|
—
|
|
|
|
|
|
(
|
)
|
—
|
|
|
|
|||||||||||
|
Cash paid for tax withholdings on vested stock awards
|
—
|
|
—
|
|
—
|
|
—
|
|
(
|
)
|
—
|
|
(
|
)
|
|||||||||||
|
Net income
|
—
|
|
—
|
|
—
|
|
—
|
|
—
|
|
|
|
|
|
|||||||||||
|
Balance at December 31, 2017 - Successor
|
|
|
$
|
|
|
|
|
$
|
|
|
$
|
|
|
$
|
(
|
)
|
$
|
|
|
||||||
The accompanying notes are an integral part of these consolidated financial statements.
F-10
SandRidge Energy, Inc. and Subsidiaries
For the Year Ended
December 31, 2017
, the
Period from October 2, 2016 through December 31, 2016
, the
Period from January 1, 2016 through October 1, 2016
and the Year Ended
December 31, 2015
(In thousands)
|
|
Successor
|
Predecessor
|
||||||||||||||
|
|
Year Ended December 31, 2017
|
Period from October 2, 2016 through December 31, 2016
|
Period from January 1, 2016 through October 1, 2016
|
Year Ended December 31, 2015
|
||||||||||||
|
CASH FLOWS FROM OPERATING ACTIVITIES
|
||||||||||||||||
|
Net income (loss)
|
$
|
|
|
$
|
(
|
)
|
$
|
|
|
$
|
(
|
)
|
||||
|
Adjustments to reconcile net income (loss) to net cash provided by (used in) operating activities
|
||||||||||||||||
|
Provision for doubtful accounts
|
|
|
(
|
)
|
|
|
|
|
||||||||
|
Depreciation, depletion and amortization
|
|
|
|
|
|
|
|
|
||||||||
|
Impairment
|
|
|
|
|
|
|
|
|
||||||||
|
Gain on reorganization items, net
|
|
|
|
|
(
|
)
|
|
|
||||||||
|
Debt issuance costs amortization
|
|
|
|
|
|
|
|
|
||||||||
|
Amortization of discount, net of premium, on debt
|
(
|
)
|
(
|
)
|
|
|
|
|
||||||||
|
Gain on extinguishment of debt
|
|
|
|
|
(
|
)
|
(
|
)
|
||||||||
|
Write off of debt issuance costs
|
|
|
|
|
|
|
|
|
||||||||
|
(Gain) loss on debt derivatives
|
|
|
|
|
(
|
)
|
|
|
||||||||
|
Cash paid for early conversion of convertible notes
|
|
|
|
|
(
|
)
|
(
|
)
|
||||||||
|
(Gain) loss on derivative contracts
|
(
|
)
|
|
|
|
|
(
|
)
|
||||||||
|
Cash received on settlement of derivative contracts
|
|
|
|
|
|
|
|
|
||||||||
|
Loss on settlement of contract
|
|
|
|
|
|
|
|
|
||||||||
|
Cash paid on settlement of contract
|
|
|
|
|
(
|
)
|
(
|
)
|
||||||||
|
Stock-based compensation
|
|
|
|
|
|
|
|
|
||||||||
|
Other
|
|
|
|
|
(
|
)
|
|
|
||||||||
|
Changes in operating assets and liabilities increasing (decreasing) cash
|
||||||||||||||||
|
Deconsolidation of noncontrolling interest
|
|
|
|
|
(
|
)
|
|
|
||||||||
|
Receivables
|
|
|
|
|
|
|
|
|
||||||||
|
Prepaid expenses
|
|
|
(
|
)
|
(
|
)
|
|
|
||||||||
|
Other current assets
|
|
|
(
|
)
|
(
|
)
|
|
|
||||||||
|
Other assets and liabilities, net
|
|
|
|
|
(
|
)
|
|
|
||||||||
|
Accounts payable and accrued expenses
|
(
|
)
|
|
|
(
|
)
|
(
|
)
|
||||||||
|
Asset retirement obligations
|
(
|
)
|
(
|
)
|
(
|
)
|
(
|
)
|
||||||||
|
Net cash provided by (used in) operating activities
|
|
|
|
|
(
|
)
|
|
|
||||||||
|
CASH FLOWS FROM INVESTING ACTIVITIES
|
||||||||||||||||
|
Capital expenditures for property, plant and equipment
|
(
|
)
|
(
|
)
|
(
|
)
|
(
|
)
|
||||||||
|
Acquisitions of assets
|
(
|
)
|
|
|
(
|
)
|
(
|
)
|
||||||||
|
Proceeds from sale of assets
|
|
|
|
|
|
|
|
|
||||||||
|
Net cash used in investing activities
|
(
|
)
|
(
|
)
|
(
|
)
|
(
|
)
|
||||||||
|
CASH FLOWS FROM FINANCING ACTIVITIES
|
||||||||||||||||
|
Proceeds from borrowings
|
|
|
|
|
|
|
|
|
||||||||
|
Repayments of borrowings
|
|
|
(
|
)
|
(
|
)
|
(
|
)
|
||||||||
|
Debt issuance costs
|
(
|
)
|
|
|
(
|
)
|
(
|
)
|
||||||||
|
Proceeds from building mortgage
|
|
|
|
|
|
|
|
|
||||||||
|
Payment of mortgage proceeds and cash recovery to debt holders
|
|
|
|
|
(
|
)
|
|
|
||||||||
|
Noncontrolling interest distributions
|
|
|
|
|
|
|
(
|
)
|
||||||||
|
Cash paid for tax withholdings on vested stock awards
|
(
|
)
|
(
|
)
|
(
|
)
|
(
|
)
|
||||||||
|
Dividends paid—preferred
|
|
|
|
|
|
|
(
|
)
|
||||||||
|
Other
|
|
|
|
|
|
|
|
|
||||||||
|
Net cash (used in) provided by financing activities
|
(
|
)
|
(
|
)
|
|
|
|
|
||||||||
|
NET (DECREASE) INCREASE IN CASH, CASH EQUIVALENTS and RESTRICTED CASH
|
(
|
)
|
(
|
)
|
|
|
|
|
||||||||
|
CASH, CASH EQUIVALENTS and RESTRICTED CASH, beginning of year
|
|
|
|
|
|
|
|
|
||||||||
|
CASH, CASH EQUIVALENTS and RESTRICTED CASH end of year
|
$
|
|
|
$
|
|
|
$
|
|
|
$
|
|
|
||||
The accompanying notes are an integral part of these consolidated financial statements.
F-11
SandRidge Energy, Inc. and Subsidiaries
Notes to Consolidated Financial Statements
1
.
Voluntary Reorganization under Chapter 11 Proceedings
On May 16, 2016, the Company and certain of its direct and indirect subsidiaries (collectively with the Company, the “Debtors”) filed voluntary petitions (the “Bankruptcy Petitions”) for reorganization under Chapter 11 of the United States Bankruptcy Code (the “Bankruptcy Code”) in the United States Bankruptcy Court for the Southern District of Texas (the “Bankruptcy Court”). The Bankruptcy Court confirmed the Debtors’ joint plan of reorganization on September 9, 2016, and the Debtors’ subsequently emerged from bankruptcy on October 4, 2016 (the “Emergence Date”). Although the Company is no longer a debtor-in-possession, the Company was a debtor-in-possession through October 4, 2016. As such, the Company’s bankruptcy proceedings and related matters have been summarized below.
The Company was able to conduct normal business activities and pay associated obligations for the period following its bankruptcy filing and was authorized to pay and has paid certain pre-petition obligations, including employee wages and benefits, goods and services provided by certain vendors, transportation of the Company’s production, royalties and costs incurred on the Company’s behalf by other working interest owners. During the pendency of the Chapter 11 case, all transactions outside the ordinary course of business required the prior approval of the Bankruptcy Court.
Automatic Stay.
Subject to certain specific exceptions under the Bankruptcy Code, the Chapter 11 filings automatically stayed most judicial or administrative actions against the Company and efforts by creditors to collect on or otherwise exercise rights or remedies with respect to pre-petition claims. Absent an order from the Bankruptcy Court, substantially all of the Debtors’ pre-petition liabilities were subject to settlement under the Bankruptcy Code.
Plan of Reorganization.
In accordance with the plan of reorganization confirmed by the Bankruptcy Court (the “Plan”), the following significant transactions occurred upon the Company’s emergence from bankruptcy on October 4, 2016:
|
•
|
First Lien Credit Agreement.
All outstanding obligations under the senior secured revolving credit facility (the “senior credit facility”) were canceled, and claims under the senior credit facility received their proportionate share of (a)
$
|
|
•
|
Cash Collateral Account.
The Company deposited
$
|
|
•
|
Senior Secured Notes
. All outstanding obligations under the
|
|
•
|
General Unsecured Claims.
The Company’s general unsecured claims, including the
|
|
•
|
Building Note
. The Building Note with a principal amount of
$
|
F-12
SandRidge Energy, Inc. and Subsidiaries
Notes to Consolidated Financial Statements - (Continued)
|
•
|
|
2.
Fresh Start Accounting
Fresh Start Accounting.
Upon emergence from bankruptcy, the Company applied fresh start accounting to its financial statements because (i) the holders of existing voting shares of the Company prior to its emergence received less than 50% of the voting shares of the Company outstanding following its emergence from bankruptcy and (ii) the reorganization value of the Company’s assets immediately prior to confirmation of the plan of reorganization was less than the post-petition liabilities and allowed claims.
The Company elected to apply fresh start accounting effective October 1, 2016, to coincide with the timing of its normal fourth quarter reporting period, which resulted in SandRidge becoming a new entity for financial reporting purposes. The Company evaluated and concluded that events between October 1, 2016, and October 4, 2016, were immaterial and use of an accounting convenience date of October 1, 2016, was appropriate. As such, fresh start accounting is reflected in the accompanying consolidated balance sheet as of December 31, 2016, and related fresh start adjustments are included in the accompanying statement of operations for the period from January 1, 2016, through October 1, 2016 (the “Predecessor 2016 Period”). As a result of the application of fresh start accounting and the effects of the implementation of the Plan, the financial statements for the period after October 1, 2016, (the “Successor 2016 Period”) will not be comparable with the financial statements prior to that date. References to the “Successor” or the “Successor Company” relate to SandRidge subsequent to October 1, 2016. References to the “Predecessor” or “Predecessor Company” refer to SandRidge on and prior to October 1, 2016.
Reorganization Value.
Reorganization value represents the fair value of the Successor Company’s total assets and is intended to approximate the amount a willing buyer would pay for the assets immediately after restructuring. Under fresh start accounting, the Company allocated the reorganization value to its individual assets based on their estimated fair values.
The Company’s reorganization value is derived from an estimate of enterprise value. Enterprise value represents the estimated fair value of an entity’s long term debt and other interest-bearing liabilities and shareholders’ equity. In support of the Plan, the Company estimated the enterprise value of the Successor Company to be in the range of
$
1.04
billion
to
$
1.32
billion
, which was subsequently approved by the Bankruptcy Court. This valuation analysis was prepared using reserve information, development schedules, other financial information and financial projections, third-party real estate reports, and applying standard valuation techniques, including net asset value analysis, precedent transactions analyses and public comparable company analyses. Based on the estimates and assumptions used in determining the enterprise value, the Company estimated the enterprise value to be approximately
$
1.09
billion
.
Valuation of Oil and Gas Properties.
The Company’s principal assets are its oil and gas properties, which are accounted for under the Full Cost Accounting method as described in Note 3. With the assistance of valuation experts, the Company determined the fair value of its oil and gas properties based on the discounted cash flows expected to be generated from these assets. The computations were based on market conditions and reserves in place as of the bankruptcy emergence date.
The fair value analysis performed by valuation experts was based on the Company’s estimates of proved reserves as developed internally by the Company’s reserves engineers. Discounted cash flow models were prepared using the estimated future revenues and development and operating costs for all developed wells and undeveloped locations comprising the proved reserves. Future revenues were based upon forward strip oil and natural gas prices as of the emergence date, adjusted for differentials realized by the Company. Development and operating costs from proved reserves estimates were adjusted for inflation. A risk adjustment factor was applied to the proved undeveloped reserve category. The discounted cash flow models also included estimates not typically included in proved reserves such as depreciation and income tax expenses.
The risk adjusted after tax cash flows were discounted at
10
%
. This discount factor was derived from a weighted average cost of capital computation which utilized a blended expected cost of debt and expected returns on equity for similar industry participants.
From this analysis, the Company concluded the fair value of its proved reserves was
$
632.8
million
as of the Emergence Date. The Company also reviewed its undeveloped leasehold acreage and concluded that the fair value of undeveloped leasehold acreage was
$
113.9
million
based on analysis of comparable market transactions. These amounts are reflected in the Fresh Start Adjustments item number 14 below.
F-13
SandRidge Energy, Inc. and Subsidiaries
Notes to Consolidated Financial Statements - (Continued)
k as of the Emergence Date (in thousands, except per share amounts):
|
Enterprise value
|
$
|
|
|
|
|
Plus: Cash and cash equivalents
|
|
|
||
|
Less: Fair value of Building Note
|
(
|
)
|
||
|
Less: Asset retirement obligation
|
(
|
)
|
||
|
Less: Fair value of First Lien Exit Facility
|
(
|
)
|
||
|
Less: Fair value of Convertible Notes
|
(
|
)
|
||
|
Less: Fair value of warrants, including warrants held in reserve for settlement of general unsecured claims
|
(
|
)
|
||
|
Fair value of Successor common stock issued upon emergence
|
$
|
|
|
|
|
Shares issued upon emergence on October 4, 2016, including shares held in reserve for settlement of general unsecured claims
|
|
|
||
|
Per share value
|
$
|
|
|
|
|
Enterprise value
|
$
|
|
|
|
|
Plus: cash and cash equivalents
|
|
|
||
|
Plus: other working capital liabilities
|
|
|
||
|
Plus: other long-term liabilities
|
|
|
||
|
Reorganization value of Successor assets
|
$
|
|
|
|
Reorganization value and enterprise value were estimated using numerous projections and assumptions that are inherently subject to significant uncertainties and resolution of contingencies that are beyond our control. Accordingly, the estimates included in this report are not necessarily indicative of actual outcomes, and there can be no assurance that the estimates, projections or assumptions will be realized.
Consolidated Balance Sheet.
The adjustments included in the following consolidated balance sheet reflect the effects of the transactions contemplated by the Plan and carried out by the Company on the Emergence Date (reflected in the column “Reorganization Adjustments”) as well as fair value adjustments as a result of the adoption of fresh start accounting (reflected in the column “Fresh Start Adjustments”). The explanatory notes highlight methods used to determine fair values or other amounts of the assets and liabilities as well as significant assumptions.
F-14
SandRidge Energy, Inc. and Subsidiaries
Notes to Consolidated Financial Statements - (Continued)
|
Predecessor Company
|
Reorganization Adjustments
|
Fresh Start Adjustments
|
Successor Company
|
||||||||||||
|
ASSETS
|
|||||||||||||||
|
Current assets
|
|||||||||||||||
|
Cash and cash equivalents
|
$
|
|
|
$
|
(
|
)
|
(1)
|
$
|
|
|
$
|
|
|
||
|
Restricted cash - collateral
|
|
|
|
|
(2)
|
|
|
|
|
||||||
|
Restricted cash - other
|
|
|
|
|
(2)
|
|
|
|
|
||||||
|
Accounts receivable, net
|
|
|
|
|
(3)
|
|
|
|
|
||||||
|
Derivative contracts
|
|
|
|
|
(
|
)
|
(12)
|
|
|
||||||
|
Prepaid expenses
|
|
|
(
|
)
|
(4)
|
|
|
|
|
||||||
|
Other current assets
|
|
|
|
|
|
|
(13)
|
|
|
||||||
|
Total current assets
|
|
|
(
|
)
|
|
|
|
|
|||||||
|
Oil and natural gas properties, using full cost method of accounting
|
|||||||||||||||
|
Proved
|
|
|
|
|
(
|
)
|
(14)
|
|
|
||||||
|
Unproved
|
|
|
|
|
(
|
)
|
(14)
|
|
|
||||||
|
Less: accumulated depreciation, depletion and impairment
|
(
|
)
|
|
|
|
|
(14)
|
|
|
||||||
|
|
|
|
|
|
|
|
|
||||||||
|
Other property, plant and equipment, net
|
|
|
(
|
)
|
(
|
)
|
(15)
|
|
|
||||||
|
Derivative contracts
|
|
|
|
|
(
|
)
|
(12)
|
|
|
||||||
|
Other assets
|
|
|
(
|
)
|
(5)
|
|
|
|
|
||||||
|
Total assets
|
$
|
|
|
$
|
(
|
)
|
$
|
(
|
)
|
$
|
|
|
|||
F-15
SandRidge Energy, Inc. and Subsidiaries
Notes to Consolidated Financial Statements - (Continued)
|
Predecessor Company
|
Reorganization Adjustments
|
Fresh Start Adjustments
|
Successor Company
|
||||||||||||
|
LIABILITIES AND STOCKHOLDERS’ (DEFICIT) EQUITY
|
|||||||||||||||
|
Current liabilities
|
|||||||||||||||
|
Accounts payable and accrued expenses
|
$
|
|
|
$
|
(
|
)
|
(6)
|
$
|
|
|
$
|
|
|
||
|
Derivative contracts
|
|
|
|
|
|
|
(12)
|
|
|
||||||
|
Asset retirement obligations
|
|
|
|
|
|
|
(16)
|
|
|
||||||
|
Total current liabilities
|
|
|
(
|
)
|
|
|
|
|
|||||||
|
Long-term debt
|
|
|
|
|
(7)
|
|
|
(17)
|
|
|
|||||
|
Derivative contracts
|
|
|
|
|
|
|
(12)
|
|
|
||||||
|
Asset retirement obligations
|
|
|
|
|
(
|
)
|
(16)
|
|
|
||||||
|
Other long-term obligations
|
|
|
|
|
(8)
|
(
|
)
|
|
|
||||||
|
Liabilities subject to compromise
|
|
|
(
|
)
|
(9)
|
|
|
|
|
||||||
|
Total liabilities
|
|
|
(
|
)
|
|
|
|
|
|||||||
|
Equity
|
|||||||||||||||
|
SandRidge Energy, Inc. stockholders’ equity (deficit)
|
|||||||||||||||
|
Predecessor preferred stock
|
|
|
|
|
(
|
)
|
(18)
|
|
|
||||||
|
Predecessor common stock
|
|
|
—
|
|
(
|
)
|
(18)
|
—
|
|
||||||
|
Predecessor additional paid-in capital
|
|
|
—
|
|
(
|
)
|
(18)
|
—
|
|
||||||
|
Predecessor additional paid-in capital—stockholder receivable
|
(
|
)
|
|
|
(10)
|
|
|
|
|
||||||
|
Predecessor treasury stock, at cost
|
(
|
)
|
|
|
|
|
(18)
|
|
|
||||||
|
Successor common stock
|
—
|
|
|
|
(11)
|
—
|
|
|
|
||||||
|
Successor warrants
|
|
|
|
|
(11)
|
|
|
|
|
||||||
|
Successor additional paid-in capital
|
—
|
|
|
|
(11)
|
—
|
|
|
|
||||||
|
Accumulated deficit
|
(
|
)
|
|
|
(9)
|
|
|
(19)
|
|
|
|||||
|
Total SandRidge Energy, Inc. stockholders’ (deficit) equity
|
(
|
)
|
|
|
(
|
)
|
|
|
|||||||
|
Noncontrolling interest
|
(
|
)
|
|
|
|
|
(20)
|
|
|
||||||
|
Total stockholders’ (deficit) equity
|
(
|
)
|
|
|
(
|
)
|
|
|
|||||||
|
Total liabilities and stockholders’ equity (deficit)
|
$
|
|
|
$
|
(
|
)
|
$
|
(
|
)
|
$
|
|
|
|||
Reorganization Adjustments
|
1.
|
Reflects the net cash payments made upon emergence (in thousands):
|
|
Sources:
|
||||
|
Proceeds from Building Note
|
$
|
|
|
|
|
Total sources
|
$
|
|
|
|
|
Uses and transfers:
|
||||
|
Cash transferred to restricted accounts (collateral and general unsecured claims)
|
$
|
|
|
|
|
Payments and funding of escrow account related to professional fees
|
|
|
||
|
Payment on Senior Credit facility (principal and interest)
|
|
|
||
|
Repayment of Senior Secured Notes and Unsecured Notes
|
|
|
||
|
Payment of certain contract cures and other
|
|
|
||
|
Total uses and transfers
|
|
|
||
|
Net uses and transfers
|
$
|
(
|
)
|
|
F-16
SandRidge Energy, Inc. and Subsidiaries
Notes to Consolidated Financial Statements - (Continued)
|
2.
|
Funding of
$
|
|
3.
|
Accrual for future reimbursement of the unused portion of the professional fees escrow account and other receivables.
|
|
4.
|
Write-off of prepaid expenses primarily related to
$
|
|
5.
|
Application of a
$
|
|
6.
|
Includes a
$
|
|
7.
|
Principal balances of
$
|
|
8.
|
Reclassification of non-qualified deferred compensation plan and gas balancing liabilities from liabilities subject to compromise to other long term obligations, as these liabilities became obligations of the Successor.
|
|
9.
|
Liabilities subject to compromise were settled as follows in accordance with the Plan (in thousands):
|
|
Current maturities of long-term debt and accrued interest
|
$
|
|
|
|
|
Accounts payable and accrued expenses
|
|
|
||
|
Other long-term liabilities
|
|
|
||
|
Liabilities subject to compromise of the Predecessor
|
|
|
||
|
Cash payments at emergence
|
(
|
)
|
||
|
Cash proceeds from building mortgage
|
|
|
||
|
Write-off of prepaid accounts upon emergence
|
(
|
)
|
||
|
Accrual for future reimbursement from professional fees escrow account and other receivables
|
|
|
||
|
Total consideration given pursuant to the Plan:
|
||||
|
Fair value of equity issued
|
(
|
)
|
||
|
Principal value of long-term debt issued and reinstated at emergence
|
(
|
)
|
||
|
Reinstatement of liabilities subject to compromise as accounts payable and accrued expenses
|
(
|
)
|
||
|
Release of stockholder receivable
|
(
|
)
|
||
|
Application of deposit held by utility services
|
(
|
)
|
||
|
Gain on settlement of liabilities subject to compromise
|
$
|
|
|
|
|
10.
|
Release of a receivable from the Predecessor’s former director and officer as outlined in the Plan.
|
F-17
SandRidge Energy, Inc. and Subsidiaries
Notes to Consolidated Financial Statements - (Continued)
|
11.
|
The following table reconciles reorganization adjustments made to Successor common stock, warrants and additional paid in capital (in thousands):
|
|
Par value of 18.9 million shares of Common Stock issued to former holders of the Senior Secured Notes and Unsecured Notes (valued at $29.31 per share)
|
$
|
|
|
|
|
Fair value of warrants issued to holders of the Unsecured Notes(1)
|
|
|
||
|
Additional paid in capital - Common Stock
|
|
|
||
|
Additional paid in capital - premium on Convertible Notes(2)
|
|
|
||
|
Total Successor Company equity issued on Emergence Date
|
$
|
|
|
|
____________________
|
(1)
|
The fair value of the warrants was estimated using a Black-Scholes-Merton model with the following assumptions: implied stock price of the Successor Company; exercise price per share of
$
|
|
(2)
|
The fair value of the Convertible Notes was estimated using a Monte Carlo simulation with the following assumptions; the implied Successor Company stock price; expected volatility of
|
Fresh Start Adjustments
|
12.
|
Adjustments and reclassifications of derivative contracts based on their Emergence Date fair values, which were determined using the fair value methodology for commodity derivative contracts discussed in Note
7
.
|
|
13.
|
Fair value adjustment to other current assets to record assets held for sale at their anticipated sales prices.
|
|
14.
|
Fair value adjustments to oil and natural gas properties, including asset retirement obligation, associated inventory, unproved acreage and seismic. See above for detailed discussion of fair value methodology.
|
|
15.
|
Adjustments to other property, plant and equipment to record the assets at their respective fair values on the Emergence Date. A combination of the cost approach and income approach were utilized to determine the fair values of the Company’s headquarters and other properties located in downtown Oklahoma City, Oklahoma, and the cost approach was utilized to determine the fair value of all other property, plant and equipment.
|
|
16.
|
Fair value adjustments to the Company’s asset retirement obligations as a result of applying fresh start accounting. Upon implementation of fresh start accounting, the Company revalued these obligations based upon updates to wells’ productive lives and application of the Successor Company’s credit adjusted risk fee rate.
|
|
17.
|
Fair value adjustment to record premium on the Building Note.
|
|
18.
|
Cancellation of Predecessor Company’s common stock, preferred stock, treasury stock and paid-in capital.
|
|
19.
|
Adjustment to reset retained deficit to
|
|
20.
|
|
F-18
SandRidge Energy, Inc. and Subsidiaries
Notes to Consolidated Financial Statements - (Continued)
Reorganization Items
Reorganization items represent liabilities settled, net of amounts incurred subsequent to the Chapter 11 filing as a direct result of the Plan and are classified as gain on reorganization items, net in the accompanying consolidated statement of operations.
The following table summarizes reorganization items for the Predecessor 2016 Period (in thousands):
|
Unamortized long-term debt
|
$
|
|
|
|
|
Litigation claims
|
(
|
)
|
||
|
Rejections and cures of executory contracts
|
(
|
)
|
||
|
Ad valorem and franchise taxes
|
(
|
)
|
||
|
Legal and professional fees and expenses
|
(
|
)
|
||
|
Write off of director and officer insurance policy
|
(
|
)
|
||
|
Gain on accounts payable settlements
|
|
|
||
|
Loss on mortgage
|
(
|
)
|
||
|
Gain on preferred stock dividends
|
|
|
||
|
Fresh start valuation adjustments
|
(
|
)
|
||
|
Fair value of equity issued
|
(
|
)
|
||
|
Principal value of Convertible Notes issued
|
(
|
)
|
||
|
Gain on reorganization items, net
|
$
|
|
|
|
3
.
Summary of Significant Accounting Policies
Fresh Start Accounting.
Upon emergence from bankruptcy the Company adopted fresh start accounting. See Note
2
for further details.
F-19
SandRidge Energy, Inc. and Subsidiaries
Notes to Consolidated Financial Statements - (Continued)
F-20
SandRidge Energy, Inc. and Subsidiaries
Notes to Consolidated Financial Statements - (Continued)
multiplying total production for the quarter by a depletion rate. The depletion rate is determined by dividing the total unamortized cost base plus future development costs by net equivalent proved reserves at the beginning of the quarter.
Costs associated with unproved properties are excluded from the amortizable cost base until a determination has been made as to the existence of proved reserves. Unproved properties are reviewed at the end of each quarter to determine whether the costs incurred should be reclassified to the full cost pool and, thereby, subjected to amortization. The costs associated with unproved properties relate primarily to costs to acquire unproved acreage. Unproved leasehold costs are transferred to the amortization base upon determination of the existence of proved reserves or upon impairment of a lease. All items classified as unproved property are assessed, on an individual basis or as a group if properties are individually insignificant, on a quarterly basis for possible impairment or reduction in value. The assessment includes consideration of various factors, including, but not limited to, the following: intent to drill; remaining lease term; geological and geophysical evaluations; drilling results and activity; assignment of proved reserves; and economic viability of development if proved reserves are assigned. During any period in which these factors indicate an impairment, all or a portion of the associated leasehold costs are transferred to the full cost pool and become subject to amortization. Costs of seismic data are allocated to various unproved leaseholds and transferred to the amortization base with the associated leasehold costs on a specific project basis.
Under the full cost method of accounting, total capitalized costs of oil and natural gas properties, net of accumulated depreciation, depletion and impairment, less related deferred income taxes may not exceed an amount equal to the present value of future net revenues from proved reserves, discounted at 10% per annum, plus the lower of cost or fair value of unproved properties, plus estimated salvage value, less the related tax effects (the “ceiling limitation”). A ceiling limitation calculation is performed at the end of each quarter. If total capitalized costs, net of accumulated depreciation, depletion and impairment, less related deferred taxes are greater than the ceiling limitation, a write-down or impairment of the full cost pool is required. A write-down of the carrying value of the full cost pool is a non-cash charge that reduces earnings and impacts stockholders’ equity in the period of occurrence and typically results in lower depreciation and depletion expense in future periods. Once incurred, a write-down cannot be reversed at a later date.
The ceiling limitation calculation is prepared using the 12-month oil and natural gas average price for the most recent 12 months as of the balance sheet date and as adjusted for basis or location differentials, held constant over the life of the reserves (“net wellhead prices”). If applicable, these net wellhead prices would be further adjusted to include the effects of any fixed price arrangements for the sale of oil and natural gas. Derivative contracts that qualify and are designated as cash flow hedges are included in estimated future cash flows, although the Company historically has not designated any of its derivative contracts as cash flow hedges and has therefore not included its derivative contracts in estimating future cash flows. The future cash outflows associated with future development or abandonment of wells are included in the computation of the discounted present value of future net revenues for purposes of the ceiling limitation calculation.
F-21
SandRidge Energy, Inc. and Subsidiaries
Notes to Consolidated Financial Statements - (Continued)
were not currently being depreciated or depleted and on which exploration activities were in progress. Additionally, the Predecessor Company capitalized interest of
$
3.3
million
in
2015
on midstream and corporate assets which were under construction.
The Company accounts for natural gas production imbalances using the sales method, whereby it recognizes revenue on all natural gas sold to its customers notwithstanding the fact that its ownership may be more or less than the natural gas sold. Liabilities are recorded for imbalances greater than the Company’s proportionate share of remaining estimated natural gas reserves. The Company has recorded a liability for natural gas imbalance positions related to natural gas properties with insufficient proved reserves of
$
1.6
million
and
$
1.7
million
at
December 31, 2017
and
2016
, respectively. The Company includes the gas imbalance positions in other long-term obligations in the consolidated balance sheets.
During the year ended December 31, 2015, the Company recognized revenues and expenses generated from daywork and footage drilling contracts as the services were performed since the Company did not bear the risk of completion of the well. The Company received lump-sum fees for the mobilization of equipment and personnel. Mobilization fees received and costs incurred to mobilize a rig from one location to another were recognized at the time mobilization services were performed. Revenues and expenses related to drilling and services are included in other revenue and expense in the accompanying consolidated statements of operations for the year ended December 31, 2015.
In general, natural gas purchased and sold by the midstream business was priced at a published daily or monthly index price. Sales to wholesale customers typically incorporated a premium for managing their transmission and balancing requirements. Midstream services revenues were recognized upon delivery of natural gas to customers and/or when services were rendered, pricing was determined and collectability was reasonably assured. Revenues from third-party midstream services were presented on a gross basis, since the Company acted as a principal by taking ownership of the natural gas purchased and taking responsibility of fulfillment for natural gas volumes sold. Revenues and expenses related to midstream and marketing are included in other revenue and expense in the accompanying consolidated statements of operations for the year ended December 31, 2015.
F-22
SandRidge Energy, Inc. and Subsidiaries
Notes to Consolidated Financial Statements - (Continued)
The Company has elected an accounting policy in which interest and penalties on income taxes are presented as a component of the income tax provision, rather than as a component of interest expense. Interest and penalties resulting from the underpayment or the late payment of income taxes due to a taxing authority and interest and penalties accrued relating to income tax contingencies, if any, are presented, on a net of tax basis, as a component of the income tax provision.
Under the treasury method, the amount of unrecognized compensation expense related to unvested stock-based compensation grants or the proceeds that would be received if the warrants were exercised are assumed to be used to repurchase shares at the average market price.
A default by the Company under its credit facility constitutes a default under its commodity derivative contracts with counterparties that are lenders under the credit facility. The Company does not require collateral or other security from counterparties to support commodity derivative instruments. The Company has master netting agreements with all of its commodity derivative counterparties, which allow the Company to net its commodity derivative assets and liabilities for like commodities and derivative instruments with the same counterparty. As a result of the netting provisions, the Company’s maximum amount of loss under commodity derivative transactions due to credit risk is limited to the net amounts due from the counterparties under the commodity derivative contracts. The Company’s loss is further limited as any amounts due from a defaulting counterparty that is a lender under the credit facility can be offset against amounts owed, if any, to such counterparty under the Company’s credit facility.
F-23
SandRidge Energy, Inc. and Subsidiaries
Notes to Consolidated Financial Statements - (Continued)
The Company operates a substantial portion of its oil and natural gas properties. As the operator of a property, the Company makes full payment for costs associated with the property and seeks reimbursement from the other working interest owners in the property for their share of those costs. The Company’s joint interest partners consist primarily of independent oil and natural gas producers. If the oil and natural gas exploration and production industry in general was adversely affected, the ability of the joint interest partners to reimburse the Company could be adversely affected.
The purchasers of the Company’s oil, natural gas and NGL production consist primarily of independent marketers, major oil and natural gas companies and gas pipeline companies. The Company believes alternate purchasers are available in its areas of operations and does not believe the loss of any one purchaser would materially affect the Company’s ability to sell the oil, natural gas and NGLs it produces.
|
Sales
|
% of Revenue
|
|||||
|
December 31, 2017 - Successor
|
||||||
|
Targa Pipeline Mid-Continent West OK LLC
|
$
|
|
|
|
%
|
|
|
Plains Marketing, L.P.
|
$
|
|
|
|
%
|
|
|
Period from October 2, 2016 through December 31, 2016 - Successor
|
||||||
|
Targa Pipeline Mid-Continent West OK LLC
|
$
|
|
|
|
%
|
|
|
Plains Marketing, L.P.
|
$
|
|
|
|
%
|
|
|
Period from January 1, 2016 through October 1, 2016 - Predecessor
|
||||||
|
Plains Marketing, L.P.
|
$
|
|
|
|
%
|
|
|
Targa Pipeline Mid-Continent West OK LLC
|
$
|
|
|
|
%
|
|
|
December 31, 2015 - Predecessor
|
||||||
|
Plains Marketing, L.P.
|
$
|
|
|
|
%
|
|
|
Targa Pipeline Mid-Continent West OK LLC
|
$
|
|
|
|
%
|
|
Update (“ASU”) 2016-15, “Statement of Cash Flows (Topic 230): Classification of Certain Cash Receipts and Cash Payments”
with the objective of reducing the existing diversity in practice of classification on certain cash receipts and payments in the statement of cash flows. The guidance requires adoption by application of a retrospective method to each period presented. The amendments are effective for the Company on January 1, 2018, with early adoption permitted. The Company adopted the ASU
on April 1, 2017. The guidance had no impact on the consolidated financial statements and related disclosures.
The FASB Issued ASU 2017-01, “Business Combinations (Topic 805): Clarifying the Definition of a Business,” which
provides a new framework for determining whether transactions should be accounted for as acquisitions (or disposals) of assets
or as a business. The ASU is effective for the Company on January 1, 2018, and amendments should be applied prospectively on and after January 1, 2018. Early application is permitted for transactions for which the acquisition date occurs before the issuance date or effective date of the amendments, only when the transaction has not been reported in financial statements that have been issued or made available for issuance and for transactions in which a subsidiary is deconsolidated or a group of assets is derecognized that occur before the issuance date or effective date of the amendments, only when the transaction has not been reported in the financial statements that have been issued or made available for issuance. The Company applied this ASU for transactions effective after April 1, 2017 meeting the early application provisions above. The guidance had no impact to the Company’s consolidated financial statements and related disclosures upon adoption.
The FASB issued ASU 2017-09, “Compensation - Stock Compensation (Topic 718): Scope of Modification Accounting,” which provides guidance on determining which changes to the terms and conditions of share-based payment awards require an entity to apply modification accounting. The amendments in this ASU are effective for the Company on January 1, 2018, with early adoption permitted in any interim period. The ASU should be applied prospectively to an award modified on or after the adoption date. The Company early adopted this ASU on July 1, 2017. The guidance had no impact on the consolidated financial statements and related disclosures.
F-24
SandRidge Energy, Inc. and Subsidiaries
Notes to Consolidated Financial Statements - (Continued)
The FASB issued ASU 2014-09, “Revenue from Contracts with Customers (Topic 606),” which outlines a single comprehensive model for entities to use in accounting for revenue arising from contracts with customers. Its objective is to increase the usefulness of information in the financial statements regarding the nature, timing and uncertainty of revenues. In August 2015, the FASB issued ASU 2015-14, "Revenue from Contracts with Customers (Topic 606): Deferral of the Effective Date," which defers the effective date of ASU 2014-09 to January 1, 2018, for the Company, with early adoption permitted in 2017. The ASU must be adopted using either the retrospective transition method, which requires restating previously reported results or the cumulative effect (modified retrospective) transition method, which utilizes a cumulative-effect adjustment to retained earnings in the period of adoption to account for prior period effects rather than restating previously reported results. The Company adopted Topic 606 on January 1, 2018, using the modified retrospective transition method.
Subsequent to the issuance of ASU 2014-09, the FASB issued various clarifications and interpretive guidance to assist entities with implementation efforts, including guidance pertaining to the presentation of revenues on a gross basis (revenues presented separately from associated expenses) versus a net basis. Under this guidance, an entity generally shall record revenue on a gross basis if it controls a specified good or service before transferring it to a customer, whereas an entity shall record revenue on a net basis if its role is to arrange for another entity to provide the goods or services to a customer. Significant judgment may be required in some circumstances to determine whether gross or net presentation is appropriate.
The Company has reviewed its contracts with customers and determined that this ASU will have no material impact on its balance sheet or related consolidated statement of earnings, stockholders’ equity or cash flows; however, the Company’s quarterly disclosures will expand in 2018 upon adoption of this ASU. The Company has implemented a process to gather and provide the quarterly disclosures required by the ASU.
The FASB issued ASU 2016-16, “Income Taxes (Topic 740): Intra-Entity Transfers of Assets Other than Inventory” which removes the prohibition in Accounting Standards Codification (“ASC”) 740 against the immediate recognition of current and deferred income tax effects of intra-entity transfers of assets other than inventory. The amendments in this ASU are effective for the Company on January 1, 2018, with early adoption permitted on January 1, 2017. The ASU should be applied on a modified retrospective basis through a cumulative-effect adjustment directly to retained earnings as of the beginning of the period of adoption. The Company adopted the ASU on January 1, 2018. There was no impact to the Company’s consolidated financial statements and related disclosures upon adoption.
The FASB issued ASU 2017-05, “Other Income - Gains and Losses from the Derecognition of Nonfinancial Assets
(Subtopic: 610-20): Clarifying the Scope of Asset Derecognition Guidance and the Accounting for Partial Sales of Nonfinancial
Assets,” which helps filers determine the guidance applicable for gain/loss recognition subsequent to the adoption of ASU 2014-09, Revenue from Contracts with Customers. The amendments also clarify that the derecognition of all businesses except those related to conveyances of oil and gas rights or contracts with customers should be accounted for in accordance with the derecognition and deconsolidation guidance in Topic 810, Consolidation. The Company adopted the ASU on January 1, 2018, using the modified retrospective transition method. Under this transition method the Company may elect to apply this guidance retrospectively either to all contracts at the date of initial application or only to contracts that are not completed contracts at the date of initial application. The Company elected to evaluate only contracts that are not completed contracts. As there were no not completed contracts at January 1, 2018, there was no impact to the Company’s consolidated financial statements and related disclosures upon adoption.
Recent Accounting Pronouncements Not Yet Adopted.
The FASB issued ASU 2016-02, “Leases (Topic 842),” which requires companies to recognize the assets and liabilities for the rights and obligations of all leases with a term greater than 12 months (long-term) on the balance sheet. Leases to explore for or use minerals, oil and natural gas are not impacted by this guidance. In January 2018, the FASB issued ASU 2018-01, “Leases (Topic 842), Land Easement Practical Expedient for Transition to Topic 842.” This ASU permits an entity to continue to apply its current accounting policy for land easements that existed before the effective date of Topic 842. Once an entity adopts Topic 842, it would apply that Topic prospectively to all new (or modified) land easements to determine whether the arrangement contains a lease. Topic 842 requires adoption by application of a modified retrospective transition approach and is effective for the Company on January 1, 2019. Early adoption is permitted.
F-25
SandRidge Energy, Inc. and Subsidiaries
Notes to Consolidated Financial Statements - (Continued)
4
.
Supplemental Cash Flow Information
|
|
Successor
|
Predecessor
|
||||||||||||||
|
|
Year Ended December 31, 2017
|
Period from October 2, 2016 through December 31, 2016
|
Period from January 1, 2016 through October 1, 2016
|
Year Ended December 31, 2015
|
||||||||||||
|
Supplemental Disclosure of Cash Flow Information
|
||||||||||||||||
|
Cash paid for reorganization items
|
$
|
|
|
$
|
|
|
$
|
(
|
)
|
$
|
|
|
||||
|
Cash paid for interest, net of amounts capitalized
|
$
|
(
|
)
|
$
|
(
|
)
|
$
|
(
|
)
|
$
|
(
|
)
|
||||
|
Cash (paid) received for income taxes
|
$
|
|
|
$
|
|
|
$
|
(
|
)
|
$
|
(
|
)
|
||||
|
Supplemental Disclosure of Noncash Investing and Financing Activities
|
||||||||||||||||
|
Cumulative effect of adoption of ASU 2015-02
|
$
|
|
|
$
|
|
|
$
|
(
|
)
|
$
|
|
|
||||
|
Property, plant and equipment transferred in settlement of contract
|
$
|
|
|
$
|
|
|
$
|
|
|
$
|
|
|
||||
|
Change in accrued capital expenditures
|
$
|
(
|
)
|
$
|
|
|
$
|
|
|
$
|
|
|
||||
|
Equity issued for debt
|
$
|
(
|
)
|
$
|
(
|
)
|
$
|
(
|
)
|
$
|
(
|
)
|
||||
|
Preferred stock dividends paid in common stock
|
$
|
|
|
$
|
|
|
$
|
|
|
$
|
(
|
)
|
||||
|
Long-term debt issued, including derivative and net of discount, for asset acquisition and termination of gathering agreement
|
$
|
|
|
$
|
|
|
$
|
|
|
$
|
(
|
)
|
||||
5
.
Recent Transactions
In the third quarter of 2017, the Company entered into a
$
200.0
million
drilling participation agreement with a Counterparty to jointly develop new horizontal wells on a wellbore only basis within certain dedicated sections of its undeveloped leasehold acreage within the Meramec formation in Major and Woodward Counties in Oklahoma (the “NW STACK”). Under this agreement, the Counterparty is paying
90
%
of the net exploration and development costs, up to
$
100.0
million
in the first tranche, in exchange for an initial
80
%
net working interest in each new well, subject to certain reversionary hurdles, as shown in the table below. As a result, the Company is receiving a
20
%
net working interest after funding
10
%
of the exploration and development costs related to the subject wells. This will allow the Company to spend minimal additional capital while accelerating the delineation of its position in the NW STACK, realizing further efficiencies and holding additional acreage by production, potentially adding reserves. The Company operates all of the wells developed under this agreement and will retain sole discretion as to the number, location and schedule of wells drilled. The Counterparty will also have the option to fund a second
$
100.0
million
tranche, subject to mutual agreement.
|
Counterparty
|
SandRidge
|
|||
|
Development Costs
|
90% of Costs
|
10% of Costs
|
||
|
Initial Working Interest
|
80% of WI
|
20% of WI
|
||
|
Reversion If Counterparty Achieves 10% IRR
|
35% of WI
|
65% of WI
|
||
|
Reversion If Counterparty Achieves 15% IRR
|
11% of WI
|
89% of WI
|
||
F-26
SandRidge Energy, Inc. and Subsidiaries
Notes to Consolidated Financial Statements - (Continued)
6
.
Acquisitions and Divestitures
Successor Acquisitions and Divestitures
2017 Acquisitions
Acquisition of Properties.
On February 10, 2017, the Company acquired assets consisting of approximately
13,000
net
acres in Woodward County, Oklahoma for approximately
$
47.8
million
in cash, net of post-closing adjustments. Also included in the acquisition were working interests in
four
wells previously drilled on the acreage.
2017 Divestitures
2017 Property Divestitures.
In 2017, the Company divested various non-core oil and natural gas properties for
approximately
$
17.1
million
in cash. All of these divestitures were accounted for as adjustments to the full cost pool with no gain or loss recognized.
Predecessor Acquisitions and Divestitures
2016 Divestiture
Divestiture of West Texas Overthrust Properties and Release from Treating Agreement.
In January 2016, the Company paid
$
11.0
million
in cash and transferred ownership of substantially all of its oil and natural gas properties and midstream assets located in the Piñon field in the West Texas Overthrust (“WTO”) to Occidental Petroleum Corporation (“Occidental”) and was released from all past, current and future claims and obligations under an existing
30
year treating agreement between the companies. As of the date of the transaction, the Company had accrued approximately
$
111.9
million
for penalties associated with shortfalls in meeting its delivery requirements under the agreement since it became effective in late 2012. The Company recognized a loss of approximately
$
89.1
million
on the termination of the treating agreement and the cease-use of transportation agreements that supported production from the Piñon field and reduced its asset retirement obligations associated with its oil and natural gas properties by
$
34.1
million
.
2015 Acquisitions
Acquisition of Piñon Gathering Company, LLC
. In October 2015, the Company acquired all of the assets of and terminated a gathering agreement with PGC for
$
48.0
million
in cash and
$
78.0
million
principal amount of newly issued PGC Senior Secured Notes. PGC owned approximately
370
miles of gathering lines supporting the natural gas production from the Company's Piñon field in the WTO. The transaction resulted in the termination of the Company’s gas gathering agreement with PGC under which it was required to compensate PGC for any throughput shortfalls below a required minimum volume. The fair value of the consideration paid by the Company, including discount attributable to the PGC Senior Secured Notes, was approximately
$
98.3
million
and was allocated on a fair value basis between the assets acquired (approximately
$
47.3
million
) and a loss on the termination of the gathering contract (approximately
$
51.0
million
).
F-27
SandRidge Energy, Inc. and Subsidiaries
Notes to Consolidated Financial Statements - (Continued)
7
.
Fair Value Measurements
The Company measures and reports certain assets and liabilities on a fair value basis and has classified and disclosed its fair value measurements using the levels of the fair value hierarchy noted below. The carrying values of cash, restricted cash, accounts receivable, prepaid expenses, other current assets, accounts payable and accrued expenses and other current liabilities included in the unaudited condensed consolidated balance sheets approximated fair value at
December 31, 2017
, and
December 31, 2016
. As a result, these financial assets and liabilities are not discussed below. The fair values of property, plant and equipment and related impairments, which are calculated using Level 3 inputs, are discussed in Note
9
.
|
Level 1
|
|
Unadjusted quoted prices in active markets that are accessible at the measurement date for identical, unrestricted assets or liabilities.
|
|
Level 2
|
|
Quoted prices in markets that are not active, or inputs which are observable, either directly or indirectly, for substantially the full term of the asset or liability.
|
|
Level 3
|
|
Measurement based on prices or valuation models that require inputs that are both significant to the fair value measurement and less observable for objective sources (
i.e.,
supported by little or no market activity).
|
Assets and liabilities that are measured at fair value are classified based on the lowest level of input that is significant to the fair value measurement. The Company’s assessment of the significance of a particular input to the fair value measurement requires judgment, which may affect the valuation of the fair value of assets and liabilities and their placement within the fair value hierarchy levels. The determination of the fair values, stated below, considers the market for the Company’s financial assets and liabilities, the associated credit risk and other factors. The Company considers active markets as those in which transactions for the assets or liabilities occur in sufficient frequency and volume to provide pricing information on an ongoing basis. The Company has assets and liabilities classified in Level 1 and Level 2 of the hierarchy as of
December 31, 2017
and
2016
, as described below.
Level 1 Fair Value Measurements
Investments.
The fair value of investments, consisting of assets attributable to the Company’s non-qualified deferred compensation plan, is based on quoted market prices. Investments of
$
5.1
million
and
$
2.8
million
are included in other current assets at
December 31, 2017
and
December 31, 2016
, respectively, and investments of
$
4.8
million
are included in other assets at
December 31, 2016
, in the accompanying consolidated balance sheets. The Company’s non-qualified deferred compensation plan was terminated and all remaining investment balances were distributed to participants in January 2018.
Level 2 Fair Value Measurements
Commodity Derivative Contracts.
The fair values of the Company’s oil and natural gas fixed price swaps are based upon inputs that are either readily available in the public market, such as oil and natural gas futures prices, volatility factors and discount rates, or can be corroborated from active markets. Fair value is determined through the use of a discounted cash flow model or option pricing model using the applicable inputs discussed above. The Company applies a weighted average credit default risk rating factor for its counterparties or gives effect to its credit default risk rating, as applicable, in determining the fair value of these derivative contracts. Credit default risk ratings are based on current published credit default swap rates.
Mandatory Prepayment Feature - PGC Senior Secured Notes.
In conjunction with the acquisition of and termination of
a gathering agreement with PGC in October 2015, the Company issued the PGC Senior Secured Notes as discussed in Note
6
.
The PGC Senior Secured Notes were issued at a substantial discount which resulted in the treatment of the mandatory prepayment feature as an embedded derivative that met the criteria to be bifurcated from its host contract and accounted for separately from the PGC Senior Secured Notes. Prior to Chapter 11 filings, the mandatory prepayment feature was recorded at fair value each reporting period based upon values determined through the use of discounted cash flow models of the PGC Senior Secured Notes both (i) with the mandatory prepayment feature, and (ii) excluding the mandatory prepayment feature. Subsequent to the Chapter 11 filings in May 2016, the value of the mandatory prepayment feature of
$
2.5
million
was written off and is included in reorganization items in the accompanying consolidated statement of operations for the Predecessor 2016 Period.
Level 3 Fair Value Measurements
Debt Holder Conversion Feature
. The Predecessor Company’s Convertible Senior Unsecured Notes each contained a conversion option whereby, prior to Chapter 11 filings, the Convertible Senior Unsecured Notes holders had the option to convert
F-28
SandRidge Energy, Inc. and Subsidiaries
Notes to Consolidated Financial Statements - (Continued)
the notes into shares of Predecessor Company common stock. These conversion features were identified as embedded derivatives that met the criteria to be bifurcated from their host contracts and accounted for separately from the Convertible Senior Unsecured Notes. Subsequent to the Chapter 11 filings, the value of the debt holder conversion feature of
$
7.3
million
was written off and is included in reorganization items in the accompanying statement of operations for the Predecessor 2016 Period.
The fair values of the holder conversion features were determined using a binomial lattice model based on certain assumptions including (i) the Company’s stock price, (ii) risk-free rate, (iii) recovery rate, (iv) hazard rate and (v) expected volatility. The significant unobservable input used in the fair value measurement of the conversion features was the hazard rate, an estimate of default probability.
Th
e significant unobservable inputs and range and weighted average of these inputs used in the fair value measurement of the conversion features at
December 31, 2015
are included in the table below.
|
Unobservable Input
|
Range
|
Weighted Average
|
Fair Value
|
||||||||||
|
(In thousands)
|
|||||||||||||
|
Debt conversion feature hazard rate
|
|
%
|
–
|
|
%
|
|
%
|
$
|
|
|
|||
Fair Value - Recurring Measurement Basis
December 31, 2017
- Successor
|
|
Fair Value Measurements
|
Netting(1)
|
Assets/Liabilities at Fair Value
|
||||||||||||||||
|
|
Level 1
|
Level 2
|
Level 3
|
||||||||||||||||
|
Assets
|
|||||||||||||||||||
|
Commodity derivative contracts
|
$
|
|
|
$
|
|
|
$
|
|
|
$
|
(
|
)
|
$
|
|
|
||||
|
Investments
|
$
|
|
|
$
|
|
|
$
|
|
|
$
|
—
|
|
$
|
|
|
||||
|
$
|
|
|
$
|
|
|
$
|
|
|
$
|
(
|
)
|
$
|
|
|
|||||
|
Liabilities
|
|||||||||||||||||||
|
Commodity derivative contracts
|
$
|
|
|
$
|
|
|
$
|
|
|
$
|
(
|
)
|
$
|
|
|
||||
|
$
|
|
|
$
|
|
|
$
|
|
|
$
|
(
|
)
|
$
|
|
|
|||||
|
|
Fair Value Measurements
|
Netting(1)
|
Assets/Liabilities at Fair Value
|
||||||||||||||||
|
|
Level 1
|
Level 2
|
Level 3
|
||||||||||||||||
|
Assets
|
|||||||||||||||||||
|
Investments
|
$
|
|
|
$
|
|
|
$
|
|
|
$
|
—
|
|
$
|
|
|
||||
|
$
|
|
|
$
|
|
|
$
|
|
|
$
|
—
|
|
$
|
|
|
|||||
|
Liabilities
|
|||||||||||||||||||
|
Commodity derivative contracts
|
$
|
|
|
$
|
|
|
$
|
|
|
$
|
|
|
$
|
|
|
||||
|
$
|
|
|
$
|
|
|
$
|
|
|
$
|
|
|
$
|
|
|
|||||
____________________
F-29
SandRidge Energy, Inc. and Subsidiaries
Notes to Consolidated Financial Statements - (Continued)
Level 3 - Debt Holder Conversion Feature.
The table below sets forth a reconciliation of the Predecessor Company’s Level 3 fair value measurements for debt holder conversion features (in thousands):
|
Predecessor
|
||||
|
Period from January 1, 2016 through October 1, 2016
|
||||
|
Beginning balance
|
$
|
|
|
|
|
Gain on derivative holder conversion feature
|
(
|
)
|
||
|
Conversions
|
(
|
)
|
||
|
Write off of derivative holder conversion feature to reorganization items
|
(
|
)
|
||
|
Ending level 3 debt holder conversion feature balance
|
$
|
|
|
|
Prior to commencement of the Chapter 11 Proceedings, the fair values of the conversion features were determined quarterly with changes in fair value recorded as interest expense.
Fair Value of Financial Instruments - Long-Term Debt
The Successor Company measured the fair value of its previously outstanding non-interest bearing
0.00
%
Convertible Senior Subordinated Notes due 2020, (the “Convertible Notes”) using pricing that was readily available in the public market. The Successor Company measures the fair value of its
$
35.0
million
initial principal note, as amended in February 2017, which is secured by first priority mortgages on the Company’s real estate in Oklahoma City, Oklahoma (the “Building Note”) using a discounted cash flow analysis, which is classified as a Level 2 input in the fair value hierarchy.
The estimated fair values and carrying values of the Company’s long-term debt are as follows (in thousands):
|
December 31, 2017
|
December 31, 2016
|
||||||||||||||
|
|
Fair Value
|
Carrying Value
|
Fair Value
|
Carrying Value
|
|||||||||||
|
Convertible Notes
|
$
|
|
|
$
|
|
|
$
|
|
|
$
|
|
|
|||
|
Building Note
|
$
|
|
|
$
|
|
|
$
|
|
|
$
|
|
|
|||
See Note
12
for discussion of the Company’s long-term debt.
Fair Value of Non-Financial Assets and Liabilities
F-30
SandRidge Energy, Inc. and Subsidiaries
Notes to Consolidated Financial Statements - (Continued)
8
.
Accounts Receivable
|
|
December 31,
|
||||||
|
|
2017
|
2016
|
|||||
|
Oil, natural gas and NGL sales
|
$
|
|
|
$
|
|
|
|
|
Joint interest billing
|
|
|
|
|
|||
|
Oil and natural gas services
|
|
|
|
|
|||
|
Other
|
|
|
|
|
|||
|
Total accounts receivable
|
|
|
|
|
|||
|
Less: allowance for doubtful accounts
|
(
|
)
|
(
|
)
|
|||
|
Total accounts receivable, net
|
$
|
|
|
$
|
|
|
|
|
Successor
|
Predecessor
|
|||||||||||||||
|
|
Year Ended December 31, 2017
|
Period from October 2, 2016 through December 31, 2016
|
Period from January 1, 2016 through October 1, 2016
|
Year Ended December 31, 2015
|
||||||||||||
|
Beginning balance
|
$
|
|
|
$
|
|
|
$
|
|
|
$
|
|
|
||||
|
Additions charged to costs and expenses(1)
|
|
|
|
|
|
|
|
|
||||||||
|
Deductions(2)
|
(
|
)
|
|
|
(
|
)
|
(
|
)
|
||||||||
|
Impact of fresh start accounting
|
|
|
|
|
(
|
)
|
|
|
||||||||
|
Ending balance
|
$
|
|
|
$
|
|
|
$
|
|
|
$
|
|
|
||||
|
(1)
|
The Predecessor 2016 Period includes an addition for a joint interest account receivable after a determination that future collection was doubtful.
|
|
(2)
|
|
F-31
SandRidge Energy, Inc. and Subsidiaries
Notes to Consolidated Financial Statements - (Continued)
9
.
Property, Plant and Equipment
|
December 31,
|
|||||||
|
2017
|
2016
|
||||||
|
Oil and natural gas properties
|
|||||||
|
Proved
|
$
|
|
|
$
|
|
|
|
|
Unproved
|
|
|
|
|
|||
|
Total oil and natural gas properties
|
|
|
|
|
|||
|
Less accumulated depreciation, depletion and impairment
|
(
|
)
|
(
|
)
|
|||
|
Net oil and natural gas properties capitalized costs
|
|
|
|
|
|||
|
Land
|
|
|
|
|
|||
|
Electrical infrastructure
|
|
|
|
|
|||
|
Non-oil and natural gas equipment
|
|
|
|
|
|||
|
Buildings and structures
|
|
|
|
|
|||
|
Total
|
|
|
|
|
|||
|
Less accumulated depreciation and amortization
|
(
|
)
|
(
|
)
|
|||
|
Other property, plant and equipment, net
|
|
|
|
|
|||
|
Total property, plant and equipment, net
|
$
|
|
|
$
|
|
|
|
The net carrying value of the Company’s oil and natural gas properties was reduced by
$
319.1
million
during the Successor 2016 Period,
$
657.4
million
during the Predecessor 2016 Period and
$
4.5
billion
during 2015, as a result of quarterly full cost ceiling analyses in the respective periods.
No
full cost ceiling impairments were recorded in the 2017 period. See Note
10
for discussion of impairment of other property, plant and equipment.
The average rates used for depreciation and depletion of oil and natural gas properties were
$
7.92
per Boe in
2017
,
$
8.31
per Boe for the Successor 2016 Period,
$
6.05
per Boe in the Predecessor 2016 Period and
$
10.81
per Boe in
2015
.
The Company has approximately
$
10.6
million
in assets classified as held for sale in the other current assets line of the accompanying consolidated balance sheet at December 31, 2017. Approximately
$
9.3
million
of this total is related to one of the Company’s properties located in downtown Oklahoma City, OK, which was classified as held for sale in the fourth quarter of 2017 and is expected to be sold during the first half of 2018. The remaining balance largely consists of the Company’s remaining drilling and oilfield services assets. These assets had a carrying value of
$
6.9
million
which exceeded the net realizable value of
$
2.9
million
determined by expected sales prices obtained from third parties. As a result, the Company recorded an impairment of
$
4.0
million
for the year ended
December 31, 2017
. The Company disposed of approximately
$
1.7
million
of these assets during the year ended
December 31, 2017
, and recorded an insignificant gain on sale of assets which is included in other operating expenses in the accompanying consolidated statement of operations. The Company expects to dispose of the majority of the remaining assets within the next year.
F-32
SandRidge Energy, Inc. and Subsidiaries
Notes to Consolidated Financial Statements - (Continued)
Costs Excluded from Amortization
|
|
|
Year Cost Incurred
|
|||||||||||||||||
|
|
Total
|
2017
|
2016
|
2015
|
2014 and Prior
|
||||||||||||||
|
Property acquisition
|
$
|
|
|
$
|
|
|
$
|
|
|
$
|
|
|
$
|
|
|
||||
|
Exploration
|
|
|
|
|
|
|
|
|
|
|
|||||||||
|
Total costs incurred
|
$
|
|
|
$
|
|
|
$
|
|
|
$
|
|
|
$
|
|
|
||||
F-33
SandRidge Energy, Inc. and Subsidiaries
Notes to Consolidated Financial Statements - (Continued)
10
.
Impairment
As deemed necessary based on events in
2017
,
2016
and
2015
, the Company analyzed various property, plant and equipment for impairment by comparing the carrying values of these assets to their estimated fair values. Estimated fair values of drilling, midstream, electrical transmission and other assets were determined in accordance with the policies discussed in Note
3
.
|
Successor
|
Predecessor
|
||||||||||||||||
|
Year Ended December 31, 2017
|
Period from October 2, 2016 through December 31, 2016
|
Period from January 1, 2016 through October 1, 2016
|
Year Ended December 31, 2015
|
||||||||||||||
|
Full cost pool ceiling limitation(1)(2)
|
$
|
|
|
$
|
|
|
$
|
|
|
$
|
|
|
|||||
|
Drilling assets(3)(4)
|
|
|
|
|
|
|
|
|
|||||||||
|
Electrical infrastructure assets(5)
|
|
|
|
|
|
|
|
|
|||||||||
|
Midstream assets(6)
|
|
|
|
|
|
|
|
|
|||||||||
|
Other(7)
|
|
|
|
|
|
|
|
|
|||||||||
|
$
|
|
|
$
|
|
|
$
|
|
|
$
|
|
|
||||||
____________________
|
(1)
|
Impairment recorded in the Successor 2016 Period resulted from the application of fresh start accounting. Upon the application of fresh start accounting, the value of the Successor Company full cost pool was determined based upon forward strip oil and natural gas prices as of the Emergence Date. Because these prices were higher than the 12-month weighted average prices used in the full cost ceiling limitation calculation at December 31, 2016, the Successor Company incurred a ceiling test impairment.
|
|
(2)
|
Impairment recorded for the Predecessor Company in 2016 was due to full cost ceiling limitations recognized in each of the first three quarters of 2016. The impairments recorded in 2015 and the first two quarters of 2016 resulted primarily from the significant decrease in oil prices, and to a lesser extent, natural gas prices, that began in the latter half of 2014 and continued throughout 2015 and the first half of 2016. The impairment recorded in the third quarter of 2016 resulted primarily from downward revisions to forecasted reserves due to a decrease in projected Mid-Continent production volumes.
|
|
(3)
|
Impairment recorded in the year ended 2017 reflects the write-down of remaining drilling and oilfield services assets classified as held for sale to net realizable value.
|
|
(4)
|
Impairment recorded in the Predecessor 2016 Period and the year ended December 31, 2015, resulted from discontinued drilling operations in its Permian region which resulted in an impairment on certain drilling assets after determining their future use was limited.
|
|
(5)
|
Impairment in the Predecessor 2016 Period resulted from a decrease in projected Mid-Continent production volumes supporting the system’s usage.
|
|
(6)
|
Impairment in the Predecessor 2016 Period and the year ended December 31, 2015 resulted from the evaluation of certain midstream pipe inventory, natural gas compressors, gas treating plants and a carbon dioxide (“CO
2
”) compressor station after determining that their future use was limited.
|
|
(7)
|
|
F-34
11
.
Accounts Payable and Accrued Expenses
|
|
December 31,
|
||||||
|
|
2017
|
2016
|
|||||
|
Accounts payable and other accrued expenses
|
$
|
|
|
$
|
|
|
|
|
Accrued interest
|
|
|
|
|
|||
|
Production payable
|
|
|
|
|
|||
|
Payroll and benefits
|
|
|
|
|
|||
|
Drilling advances
|
|
|
|
|
|||
|
Total accounts payable and accrued expenses
|
$
|
|
|
$
|
|
|
|
12
.
Long-Term Debt
|
December 31,
|
December 31,
|
||||||
|
2017
|
2016
|
||||||
|
Credit facility
|
$
|
|
|
$
|
|
|
|
|
Convertible Notes
|
|
|
|
|
|||
|
Building Note
|
|
|
|
|
|||
|
Total debt
|
|
|
|
|
|||
|
Less: current maturities of long-term debt
|
|
|
|
|
|||
|
Long-term debt
|
$
|
|
|
$
|
|
|
|
On the Emergence Date, the Predecessor Company’s outstanding debt was canceled. See Note
1
for additional information regarding the bankruptcy proceedings.
Credit
Facility.
On February 10, 2017, the
$
425.0
million
reserve-based revolving credit facility (the “First Lien Exit Facility”) was refinanced and replaced by a new
$
600.0
million
credit facility (the “credit facility”). The borrowing base under the credit facility is
$
425.0
million
. This borrowing base was reconfirmed during the October 2017 semi-annual redetermination. The next borrowing base redetermination is scheduled for April 1, 2018. The credit facility matures on March 31, 2020. The outstanding borrowings under the credit facility bear interest based on a pricing grid tied to borrowing base utilization of (a) LIBOR plus an applicable margin that varies from
3.00
%
to
4.00
%
per annum, or (b) the base rate plus an applicable margin that varies from
2.00
%
to
3.00
%
per annum. Interest on base rate borrowings is payable quarterly in arrears and interest on LIBOR borrowings is payable every one, two, three or six months, at the election of the Company. Quarterly, the Company pays commitment fees assessed at annual rates of
0.50
%
on any available portion of the credit facility. The Company has the right to prepay loans under the credit facility at any time without a prepayment penalty, other than customary “breakage” costs with respect to LIBOR loans. Upon refinancing of the First Lien Exit Facility,
$
50.0
million
maintained in a restricted cash collateral account, as required by the terms of the First Lien Exit Facility, was released to the Company.
The credit facility is secured by (i) first-priority mortgages on at least
95
%
of the PV-9 valuation of all proved reserves included in the most recently delivered reserve report of the Company, (ii) a first-priority perfected pledge of substantially all of the capital stock owned by each credit party and equity interests in the Royalty Trusts that are owned by a credit party and (iii) a first-priority perfected security interest in substantially all the cash, cash equivalents, deposits, securities and other similar accounts, and other tangible and intangible assets of the credit parties (including but not limited to as-extracted collateral, accounts receivable, inventory, equipment, general intangibles, investment property, intellectual property, real property and the proceeds of the foregoing).
Beginning with the quarter ended June 30, 2017, the credit facility requires the Company to maintain (i) a maximum consolidated total net leverage ratio, measured as of the end of any fiscal quarter, of no greater than
3.50
to 1.00 and (ii) a minimum consolidated interest coverage ratio, measured as of the end of any fiscal quarter, of no less than
2.25
to 1.00. These financial covenants are subject to customary cure rights. The Company was in compliance with all applicable financial covenants under the credit facility as of
December 31, 2017
.
F-35
SandRidge Energy, Inc. and Subsidiaries
Notes to Consolidated Financial Statements - (Continued)
The credit facility also contains customary affirmative and negative covenants, including as to compliance with laws (including environmental laws, ERISA and anti-corruption laws), maintenance of required insurance, delivery of quarterly and annual financial statements, oil and gas engineering reports, maintenance and operation of property (including oil and gas properties), restrictions on the incurrence of liens, indebtedness, asset dispositions, fundamental changes, restricted payments and other customary covenants. The Company was in compliance with these covenants as of
December 31, 2017
.
The credit facility includes events of default relating to customary matters, including, among other things, nonpayment of principal, interest or other amounts; violation of covenants; incorrectness of representations and warranties in any material respect; cross-payment default and cross acceleration with respect to indebtedness in an aggregate principal amount of
$
25.0
million
or more; bankruptcy; judgments involving a liability of
$
25.0
million
or more that are not paid; and ERISA events. Many events of default are subject to customary notice and cure periods.
The Company had
no
amounts outstanding under the credit facility at
December 31, 2017
and
$
6.7
million
in outstanding letters of credit, which reduce availability under the credit facility on a dollar-for-dollar basis.
First Lien Exit Facility.
On the Emergence Date, the Company entered into the First Lien Exit Facility with the lenders party thereto and Royal Bank of Canada, as administrative agent and issuing lender.
The borrowing base under the First Lien Exit Facility was
$
425.0
million
. The First Lien Exit Facility was set to mature on February 4, 2020. The outstanding borrowings under the First Lien Exit Facility bore interest at a rate equal to, at the option of the Company, either (a) a base rate plus an applicable rate of
3.75
%
per annum or (b) LIBOR plus
4.75
%
per annum, subject to a
1.00
%
LIBOR floor. Interest on base rate borrowings was payable quarterly in arrears and interest on LIBOR borrowings was payable every one, two, three or six months, at the election of the Company. Quarterly, the Company was committed to pay fees assessed at annual rates of
0.50
%
on any available portion of the First Lien Exit Facility. The Company had the right to prepay loans under the First Lien Exit Facility at any time without a prepayment penalty, other than customary “breakage” costs with respect to LIBOR loans.
The First Lien Exit Facility contained certain financial covenants and customary affirmative and negative covenants. The Company was in compliance with all applicable covenants through the date it was refinanced.
Convertible Notes.
As discussed in Note 1, on the Emergence Date, pursuant to the terms of the Plan, the Company issued approximately
$
281.8
million
principal amount of Convertible Notes, which did not bear regular interest and were set to mature and mandatorily convert into shares of common stock in the Successor Company (“the Common Stock”) on October 4, 2020, unless repurchased, redeemed or converted prior to that date. The Convertible Notes were recorded at their fair value of
$
445.7
million
upon implementation of fresh start accounting. The resulting premium of
$
163.9
million
was deemed significant to the principal amount of the Convertible Notes, and as such, was recorded in additional paid in capital in the condensed consolidated balance sheet at December 31, 2016. The Company’s obligations pursuant to the Convertible Notes were fully and unconditionally guaranteed, jointly and severally, by each of the guarantors of the First Lien Exit Facility.
The Convertible Notes were initially convertible at a conversion rate of
0.05330841
shares of Common Stock per $1.00 principal amount of Convertible Notes, which represented, in the aggregate, approximately
15.0
million
shares of common stock. The conversion rate for the New Convertible Notes was subject to customary anti-dilution adjustments.
The Convertible Notes were convertible at the option of the holders at any time up to, and including, the business day immediately preceding the maturity date. Between the Emergence Date and December 31, 2016, approximately
$
13.0
million
in aggregate principal amount of the Convertible Notes was converted into approximately
0.7
million
shares of Common Stock following delivery of voluntary conversion notices by the holders of those Convertible Notes. Additionally, during the period from January 1, 2017 to February 9, 2017, approximately
$
5.1
million
in aggregate principal amount of the Convertible Notes was converted into approximately
0.3
million
shares of Common Stock following delivery of voluntary conversion notices by the holders of those Convertible Notes. The remaining
$
263.7
million
par value of outstanding Convertible Notes mandatorily converted into
14.1
million
shares of Common Stock upon the refinancing of the First Lien Exit Facility on February 10, 2017, after the determination by the Successor Company’s board of directors in good faith that: (a) the refinancing provided for terms that were materially more favorable to the Company and (b) causing a conversion was not the primary purpose of the refinancing.
Building Note
.
As discussed in Note
1
, on the Emergence Date, the Company entered into the Building Note, which had an initial principal amount of
$
35.0
million
. The Building Note was recorded at a fair value of
$
36.6
million
upon implementation of fresh start accounting. The resulting premium is being amortized to interest expense over the term of the Building Note. Interest is payable on the Building Note at
6
%
per annum for the first year following the Emergence Date,
8
%
per annum for the second year following the Emergence Date, and
10
%
thereafter through maturity. Interest costs were paid in kind and added to the Building
F-36
SandRidge Energy, Inc. and Subsidiaries
Notes to Consolidated Financial Statements - (Continued)
Note principal from the Emergence Date through May 11, 2017, which was
90
days after the refinancing or repayment of the First Lien Exit Facility. Interest became payable thereafter in cash. The Building Note matures on October 2, 2021 and became prepayable in whole or in part without premium or penalty upon the refinancing of the First Lien Exit Facility. Net proceeds of
$
26.8
million
received from the sale of the Building Note were subsequently remitted to unsecured creditors on the Emergence Date in accordance with the Plan.
Maturities of Long-Term Debt
13
.
Derivatives
The Company has not designated any of its derivative contracts as hedges for accounting purposes. The Company records all derivative contracts at fair value. Changes in derivative contract fair values are recognized in earnings.
Commodity Derivatives
The Company is exposed to commodity price risk, which impacts the predictability of its cash flows from the sale of oil and natural gas. The Company seeks to manage this risk through the use of commodity derivative contracts, which allow the Company to limit its exposure to commodity price volatility on a portion of its forecasted oil and natural gas sales. The Company has not designated any of its derivative contracts as hedges for accounting purposes and records all derivative contracts at fair value with changes in derivative contract fair values recognized in (gain) loss on derivative contracts in the condensed consolidated statements of operations. None of the Company’s commodity derivative contracts may be terminated prior to contractual maturity solely as a result of a downgrade in the credit rating of a party to the contract. Commodity derivative contracts are settled on a monthly basis. On a quarterly basis, the commodity derivative contract valuations are adjusted to the mark-to-market valuation. At
December 31, 2017
, the Company’s commodity derivative contracts consisted of fixed price swaps under which the Company receives a fixed price for the contract and pays a floating market price to the counterparty over a specified period for a contracted volume.
The Successor Company recorded (gain) loss on commodity derivative contracts of
$(
24.1
) million
and
$
25.7
million
for the year ended December 31,
2017
and the Successor 2016 Period, respectively, as reflected in the accompanying consolidated statements of operations, which includes net cash receipts upon settlement of
$
7.3
million
and
$
7.7
million
, respectively.
The Predecessor Company recorded loss (gain) on commodity derivative contracts of
$
4.8
million
and
$(
73.1
) million
for the Predecessor 2016 Period and the year ended December 31,
2015
, respectively, as reflected in the accompanying consolidated statements of operations, which includes net cash receipts upon settlement of
$
72.6
million
and
$
327.7
million
, respectively. The net receipts for the Predecessor 2016 Period include settlements of contracts prior to their contractual maturity (“early settlements”) after the Chapter 11 filings occurred, resulting in
$
17.9
million
of cash receipts.
Derivatives Agreements with Royalty Trusts.
During the year ended December 31, 2015, the Company was party to derivatives agreements with the Mississippian Trust I, Permian Trust and Mississippian Trust II to provide each of the Royalty Trusts with the economic effect of certain oil and natural gas derivative contracts entered into by the Company with third parties. The derivatives agreements with the Mississippian Trust I and the Mississippian Trust II contained commodity derivative contracts that covered volumes of oil and natural gas production through December 31, 2015, and the derivatives agreement with the Permian Trust contained commodity derivative contracts that covered volumes of oil production through March 31, 2015. All activity related to the contracts underlying the derivatives agreements with the Royalty Trusts have been included in the Company’s consolidated derivative disclosures.
F-37
SandRidge Energy, Inc. and Subsidiaries
Notes to Consolidated Financial Statements - (Continued)
Master Netting Agreements and the Right of Offset.
The Company has master netting agreements with all of its commodity derivative counterparties and has presented its derivative assets and liabilities with the same counterparty on a net basis by commodity type in the consolidated balance sheets. As a result of the netting provisions, the Company's maximum amount of loss under commodity derivative transactions due to credit risk is limited to the net amounts due from its counterparties. As of
December 31, 2017
, the counterparties to the Company’s open commodity derivative contracts consisted of
seven
financial institutions, all of which are also lenders under the Company’s credit facility. The Company is not required to post additional collateral under its commodity derivative contracts as all of the counterparties to the Company’s commodity derivative contracts share in the collateral supporting the Company’s credit facility.
December 31, 2017
|
Gross Amounts
|
Gross Amounts Offset
|
Amounts Net of Offset
|
Financial Collateral
|
Net Amount
|
||||||||||||||||
|
Assets
|
||||||||||||||||||||
|
Derivative contracts - current
|
$
|
|
|
$
|
(
|
)
|
$
|
|
|
$
|
|
|
$
|
|
|
|||||
|
Derivative contracts - noncurrent
|
|
|
|
|
|
|
|
|
|
|
||||||||||
|
Total
|
$
|
|
|
$
|
(
|
)
|
$
|
|
|
$
|
|
|
$
|
|
|
|||||
|
Liabilities
|
||||||||||||||||||||
|
Derivative contracts - current
|
$
|
|
|
$
|
(
|
)
|
$
|
|
|
$
|
(
|
)
|
$
|
|
|
|||||
|
Derivative contracts - noncurrent
|
|
|
|
|
|
|
(
|
)
|
|
|
||||||||||
|
Total
|
$
|
|
|
$
|
(
|
)
|
$
|
|
|
$
|
(
|
)
|
$
|
|
|
|||||
December 31, 2016
|
Gross Amounts
|
Gross Amounts Offset
|
Amounts Net of Offset
|
Financial Collateral
|
Net Amount
|
||||||||||||||||
|
Liabilities
|
||||||||||||||||||||
|
Derivative contracts - current
|
$
|
|
|
$
|
|
|
$
|
|
|
$
|
(
|
)
|
$
|
|
|
|||||
|
Derivative contracts - noncurrent
|
|
|
|
|
|
|
(
|
)
|
|
|
||||||||||
|
Total
|
$
|
|
|
$
|
|
|
$
|
|
|
$
|
(
|
)
|
$
|
|
|
|||||
Oil Price Swaps
|
Notional (MBbls)
|
Weighted Average
Fixed Price
|
|||||
|
January 2018 - December 2018
|
|
|
$
|
|
|
|
|
January 2019 - December 2019
|
|
|
$
|
|
|
|
Natural Gas Price Swaps
|
Notional (MMcf)
|
Weighted Average
Fixed Price
|
|||||
|
January 2018 - December 2018
|
|
|
$
|
|
|
|
F-38
SandRidge Energy, Inc. and Subsidiaries
Notes to Consolidated Financial Statements - (Continued)
Fair Value of Derivatives
|
December 31,
|
December 31,
|
|||||||||
|
Type of Contract
|
Balance Sheet Classification
|
2017
|
2016
|
|||||||
|
Derivative assets
|
||||||||||
|
Oil price swaps
|
Derivative contracts - current
|
$
|
|
|
$
|
|
|
|||
|
Natural gas price swaps
|
Derivative contracts - current
|
|
|
|
|
|||||
|
Oil price swaps
|
Derivative contracts - noncurrent
|
|
|
|
|
|||||
|
Natural gas price swaps
|
Derivative contracts - noncurrent
|
|
|
|
|
|||||
|
Derivative liabilities
|
||||||||||
|
Oil price swaps
|
Derivative contracts - current
|
(
|
)
|
(
|
)
|
|||||
|
Natural gas price swaps
|
Derivative contracts - current
|
|
|
(
|
)
|
|||||
|
Oil price swaps
|
Derivative contracts - noncurrent
|
(
|
)
|
(
|
)
|
|||||
|
Natural gas price swaps
|
Derivative contracts - noncurrent
|
|
|
(
|
)
|
|||||
|
Total net derivative contracts
|
$
|
(
|
)
|
$
|
(
|
)
|
||||
14
.
Asset Retirement Obligations
|
Successor
|
Predecessor
|
|||||||||||||||
|
Year Ended December 31, 2017
|
Period from October 2, 2016 through December 31, 2016
|
Period from January 1, 2016 through October 1, 2016
|
Year Ended December 31, 2015
|
|||||||||||||
|
Beginning balance
|
$
|
|
|
$
|
|
|
$
|
|
|
$
|
|
|
||||
|
Liability incurred upon acquiring and drilling wells
|
|
|
|
|
|
|
|
|
||||||||
|
Revisions in estimated cash flows(1)
|
(
|
)
|
|
|
|
|
|
|
||||||||
|
Liability settled or disposed in current period(2)
|
(
|
)
|
(
|
)
|
(
|
)
|
(
|
)
|
||||||||
|
Accretion
|
|
|
|
|
|
|
|
|
||||||||
|
Impact of fresh start accounting
|
|
|
|
|
|
|
|
|
||||||||
|
Ending balance
|
|
|
|
|
|
|
|
|
||||||||
|
Less: current portion
|
|
|
|
|
|
|
|
|
||||||||
|
Asset retirement obligations, net of current
|
$
|
|
|
$
|
|
|
$
|
|
|
$
|
|
|
||||
____________________
|
(1)
|
Revisions for the year ended December 31, 2017, the Successor 2016 Period and the year ended December 31, 2015 relate primarily to changes in estimated well lives and changes in oil and natural gas prices.
|
|
(2)
|
|
F-39
SandRidge Energy, Inc. and Subsidiaries
Notes to Consolidated Financial Statements - (Continued)
15
.
Commitments and Contingencies
Employee Termination Benefits.
Certain employees received termination benefits, including severance and accelerated stock vesting, upon separation of service from the Company during the years ended
December 31, 2017
,
2016
and
2015
. Employee termination benefits were
$
4.8
million
for the year ended
December 31, 2017
,
$
12.3
million
for the Successor 2016 Period and
$
18.4
million
for the Predecessor 2016 Period, primarily as a result of reductions in workforce. For the year ended December 31, 2015, employee termination benefits were
$
12.5
million
, primarily as a result of a reduction in workforce and certain executives’ separation from employment.
Risks and Uncertainties.
The Company’s revenue, profitability and future growth are substantially dependent upon the prevailing and future prices for oil and natural gas, which depend on numerous factors beyond the Company’s control such as overall oil and natural gas production and inventories in relevant markets, economic conditions, the global political environment, regulatory developments and competition from other energy sources. Oil and natural gas prices historically have been volatile, and may be subject to significant fluctuations in the future. The Company enters into commodity derivative arrangements in order to mitigate a portion of the effect of this price volatility on the Company’s cash flows. See Note
13
for the Company’s open oil and natural gas commodity derivative contracts.
The Company historically has depended on cash flows from operating activities and, as necessary, borrowings under its credit facility to fund its capital expenditures. Based on its cash balances, cash flows from operating activities and net borrowing availability under the credit facility, the Company expects to be able to fund its planned capital expenditures budget, debt service requirements and working capital needs for the next year; however, if oil or natural gas prices decline from current levels, they would have a material adverse effect on the Company’s financial position, results of operations, cash flows and quantities of oil, natural gas and NGL reserves that may be economically produced.
Litigation and Claims.
On October 14, 2016, Lisa West and Stormy Hopson filed an amended class action complaint in the United States District Court for the Western District of Oklahoma against SandRidge Exploration and Production, LLC, among other defendants. In their amended complaint, plaintiffs asserted various tort claims seeking relief for damages, including the reimbursement of past and future earthquake insurance premiums, resulting from seismic activity allegedly caused by the defendants’ operation of wastewater disposal wells. The court dismissed the plaintiffs’ amended complaint on May 12, 2017, but permitted the plaintiffs to file a second amended complaint. On July 18, 2017, the plaintiffs filed a second amended class action complaint making allegations substantially similar to those contained in the amended complaint that was previously dismissed. An estimate of reasonably possible losses associated with this action can not be made at this time. The Company has not established any reserves relating to this action.
16
.
Equity
Successor Equity
Common Stock.
As discussed in Note
1
, on the Emergence Date, the previously issued Predecessor Company common stock was canceled and an aggregate of approximately
18.9
million
shares of Common Stock, par value
$
0.001
per share, was issued to the holders of allowed claims, as defined in the Plan. Approximately
0.4
million
shares of Common Stock were reserved for future distributions under the Plan and approximately
0.1
million
of the reserved shares were issued during the year ended
December 31, 2017
. Additionally, from the Emergence Date through February 9, 2017, voluntary conversions of Convertible Notes resulted in the issuance of approximately
1.0
million
shares of Common Stock. The remaining balance of Convertible Notes converted to
14.1
million
shares of Common Stock upon refinancing of the First Lien Exit Facility. See Note
12
for further discussion of the Convertible Notes.
Shareholder Rights Plan.
On November 26, 2017, the Company’s Board adopted a short-term shareholder rights plan, which was further amended on January 22, 2018, (the “Rights Plan”). The Rights Plan will be triggered only if a person or group of persons exceeds beneficial ownership of
15
%
or more of the Company’s common stock. The Company intends to recommend the ratification of the Rights Plan for approval by its shareholders at the Company’s 2018 annual meeting of shareholders. If ratified by the shareholders, the Rights Plan will expire on November 26, 2018. If the Rights Plan is not ratified, then it will terminate and cease to be effective.
Warrants. A
s discussed in Note
1
, on the Emergence Date, the Company issued approximately
4.9
million
Series A Warrants,
4.5
million
of which were issued immediately upon emergence, and
2.1
million
Series B Warrants,
1.9
million
of which
F-40
SandRidge Energy, Inc. and Subsidiaries
Notes to Consolidated Financial Statements - (Continued)
were issued immediately upon emergence. Warrants not issued immediately upon emergence were held in reserve for the future settlement of general unsecured claims under the Plan. The Warrants were initially exercisable for
one
share of Common Stock per Warrant at initial exercise prices of
$
41.34
and
$
42.03
per share, respectively, subject to adjustments pursuant to the terms of the Warrants, to certain holders of general unsecured claims as defined in the Plan. Approximately
0.1
million
Series A Warrants and an insignificant amount of Series B Warrants were issued under the Plan during the year ended
December 31, 2017
. The Warrants are exercisable from the Emergence Date until October 4, 2022. The Warrants contain customary anti-dilution adjustments in the event of any stock split, reverse stock split, reclassification, stock dividend or other distributions.
Shares Withheld for Taxes.
The following table shows the number of shares withheld for taxes and the associated value of those shares (in thousands). These shares were accounted for as treasury stock when withheld, and then immediately retired.
|
Successor
|
||||||||
|
Year Ended December 31, 2017
|
Period from October 2, 2016 through December 31, 2016
|
|||||||
|
Number of shares withheld for taxes
|
|
|
|
|
||||
|
Value of shares withheld for taxes
|
$
|
|
|
$
|
|
|
||
Predecessor Equity
Preferred Stock.
As discussed in Note
1
, on the Emergence Date the Company’s authorized
7.0
%
and
8.5
%
convertible perpetual preferred stock was canceled and released under the Plan without receiving any recovery on account thereof.
Each outstanding share of convertible perpetual preferred stock was convertible at the holder’s option at any time into shares of the Company’s common stock at the specified conversion rate, subject to customary adjustments in certain circumstances.
Each holder was entitled to an annual dividend payable semi-annually in cash, common stock or a combination thereof, at the Company’s election. The Company could cause all outstanding shares of the convertible perpetual preferred stock to convert automatically into common stock at the prevailing conversion rate dependent on certain factors, including the Company’s stock trading above specified prices for a set period. The convertible perpetual preferred stock was not redeemable by the Company at any time. For the year ended December 31, 2015, approximately
0.2
million
shares were converted into approximately
3.0
million
shares of the Predecessor Company’s common stock.
The following table summarizes information about each series of the Predecessor Company’s convertible perpetual preferred stock outstanding at December 31, 2015:
|
Convertible Perpetual Preferred Stock
|
||||||||
|
|
|
|||||||
|
Liquidation preference per share
|
$
|
|
|
$
|
|
|
||
|
Annual dividend per share
|
$
|
|
|
$
|
|
|
||
|
Conversion rate per share to common stock
|
|
|
|
|
||||
Preferred Stock Dividends.
Prior to the Chapter 11 petition filings, dividends on the Company’s
8.5
%
and
7.0
%
convertible perpetual preferred stock could be paid in cash or with shares of the Company’s common stock at the Company’s election.
In the first quarter of 2016, prior to the February semi-annual dividend payment date, the Company announced the suspension of the semi-annual dividend on its
8.5
%
convertible perpetual preferred stock. The Company suspended payment of the cumulative dividend on its
7.0
%
convertible perpetual preferred stock during the third quarter of 2015. The Company ceased accruing dividends on its
8.5
%
and
7.0
%
convertible perpetual preferred stock as of May 16, 2016, in conjunction with the Chapter 11 petition filings.
F-41
SandRidge Energy, Inc. and Subsidiaries
Notes to Consolidated Financial Statements - (Continued)
|
Predecessor
|
||||||||
|
Period from January 1, 2016 through October 1, 2016
|
Year Ended December 31, 2015
|
|||||||
|
8.5% Convertible perpetual preferred stock
|
||||||||
|
Dividends paid in cash
|
$
|
|
|
$
|
|
|
||
|
Dividends satisfied in shares of common stock(1)
|
$
|
|
|
$
|
|
|
||
|
Accrued dividends at period end
|
$
|
|
|
$
|
|
|
||
|
Dividends in arrears
|
$
|
|
|
$
|
|
|
||
|
7.0% Convertible perpetual preferred stock
|
||||||||
|
Dividends paid in cash
|
$
|
|
|
$
|
|
|
||
|
Dividends satisfied in shares of common stock(2)
|
$
|
|
|
$
|
|
|
||
|
Accrued dividends at period end
|
$
|
|
|
$
|
|
|
||
|
Dividends in arrears
|
$
|
|
|
$
|
|
|
||
____________________
|
(1)
|
For the year ended
December 31, 2015
, the Company paid a semi-annual dividend by issuing approximately
|
|
(2)
|
For the year ended
December 31, 2015
, the Company paid a semi-annual dividend by issuing approximately
|
Paid and unpaid dividends included in the calculation of income available (loss applicable) to the Company’s common stockholders and the Company’s basic earnings (loss) per share calculation for the Predecessor 2016 Period and year ended December 31,
2015
, are presented in the accompanying consolidated statements of operations.
See Note
20
for discussion of the Company’s earnings (loss) per share calculation.
Common Stock.
As discussed in Note
1
, on the Emergence Date the Company’s authorized common stock was canceled and released under the Plan without receiving any recovery on account thereof.
In June 2015, the Company's stockholders approved an amendment to the Company's Certificate of Incorporation, to increase the number of shares of capital stock the Company is authorized to issue from
850.0
million
(
800.0
million
shares of common stock and
50.0
million
shares of preferred stock), par value
$
0.001
to
1.85
billion
(
1.80
billion
shares of common stock and
50.0
million
shares of preferred stock), par value
$
0.001
.
Prior to the Emergence Date, shares of Predecessor Company common stock held as assets in a trust for the Company’s non-qualified deferred compensation plan were accounted for as treasury shares. The Company had
2.1
million
shares of such common stock held in treasury at December 31, 2015. These shares were not included as outstanding shares of common stock for accounting purposes, and were canceled on the Emergence Date. No further matching contributions will be made to the non-qualified deferred compensation plan by the Successor Company.
Redemption of Senior Unsecured Notes.
During the year ended December 31, 2015, the Predecessor Company issued approximately
28.0
million
shares of common stock in exchange for
$
50.0
million
in Senior Unsecured Notes.
F-42
SandRidge Energy, Inc. and Subsidiaries
Notes to Consolidated Financial Statements - (Continued)
Conversions of Convertible Senior Unsecured Notes.
During the Predecessor 2016 Period and year ended December 31, 2015, the Company issued approximately
84.4
million
and
92.8
million
shares, respectively, of common stock upon the exercise of conversion options by holders of approximately
$
232.1
million
and
$
255.3
million
in par value, respectively, of the Convertible Senior Unsecured Notes. The Company recorded the issuance of common shares at fair value on the various dates the exchanges occurred.
See Note
17
for discussion of the Company’s share-based compensation.
Shares Withheld for Taxes.
The following table shows the number of shares withheld for taxes and the associated value of those shares (in thousands). These shares were accounted for as treasury stock when withheld, and then immediately retired.
|
Predecessor
|
||||||||||||
|
Period from January 1, 2016 through October 1, 2016
|
Year Ended December 31, 2015
|
Year Ended December 31, 2014
|
||||||||||
|
Number of shares withheld for taxes
|
|
|
|
|
|
|
||||||
|
Value of shares withheld for taxes
|
$
|
|
|
$
|
|
|
$
|
|
|
|||
17
.
Share-Based Compensation
As discussed in Note
1
, the Predecessor Company’s common stock was canceled and the Successor Company issued new Common Stock on the Emergence Date. Accordingly, the Predecessor Company's then existing share-based compensation awards were also canceled, which resulted in the recognition of
$
5.9
million
in previously unamortized expense related to these awards on the date of cancellation. Share based compensation for the Predecessor and Successor periods are not comparable.
Successor Share-Based Compensation
Omnibus Incentive Plan.
The SandRidge Energy, Inc. 2016 Omnibus Incentive Plan (the “Omnibus Incentive Plan”) became effective on the Emergence Date after the cancellation of the Predecessor Company’s share-based compensation awards. The Omnibus Incentive Plan authorizes the issuance of up to
4.6
million
shares of SandRidge Common Stock.
Persons eligible to receive awards under the Omnibus Incentive Plan include non-employee directors of the Company, employees of the Company or any of its affiliates, and certain consultants and advisors to the Company or any of its affiliates. The types of awards that may be granted under the Omnibus Incentive Plan include stock options, restricted stock, performance awards and other forms of awards granted or denominated in shares of Common Stock, as well as certain cash-based awards. At
December 31, 2017
, the Company had restricted stock awards, performance share units and performance units outstanding under the Omnibus Incentive Plan.
Forfeitures for these awards are recognized as they occur.
Restricted Stock Awards.
The Successor Company’s restricted stock awards are equity-classified awards and are valued based upon the market value of the Company’s Common Stock on the date of grant. During October 2016, awards for approximately
1.4
million
shares of restricted stock were granted under the Omnibus Incentive Plan. These restricted shares will vest over a
three
-year period. In 2017, awards for approximately
0.7
million
shares were granted, which will vest over a period of approximately
2.5
years.
The Successor Company recognized total share-based compensation expense related to its restricted stock awards of
$
16.6
million
and
$
6.6
million
, of which
$
2.0
million
and
$
0.3
million
were capitalized, for the year ended
December 31, 2017
and the Successor 2016 Period, respectively. Share-based compensation expense for the year ended
December 31, 2017
, includes
$
1.8
million
for the accelerated vesting of
0.1
million
restricted common stock awards. Additionally, share-based compensation expense for the Successor 2016 Period includes
$
4.3
million
for the accelerated vesting of
0.2
million
restricted common stock awards related to the Successor Company’s reduction in workforce during the fourth quarter of 2016.
F-43
SandRidge Energy, Inc. and Subsidiaries
Notes to Consolidated Financial Statements - (Continued)
|
Number of
Shares
|
Weighted-
Average Grant
Date Fair Value
|
|||||
|
(In thousands)
|
||||||
|
Unvested restricted shares outstanding at October 1, 2016
|
|
|
$
|
|
|
|
|
Granted
|
|
|
$
|
|
|
|
|
Vested
|
(
|
)
|
$
|
|
|
|
|
Forfeited / Canceled
|
(
|
)
|
$
|
|
|
|
|
Unvested restricted shares outstanding at December 31, 2016
|
|
|
$
|
|
|
|
|
Granted
|
|
|
$
|
|
|
|
|
Vested
|
(
|
)
|
$
|
|
|
|
|
Forfeited / Canceled
|
(
|
)
|
$
|
|
|
|
|
Unvested restricted shares outstanding at December 31, 2017
|
|
|
$
|
|
|
|
As of
December 31, 2017
, the Successor Company’s unrecognized compensation cost related to unvested restricted stock awards was
$
21.4
million
. The remaining weighted-average contractual period over which this compensation cost may be recognized is
1.8
years. The aggregate intrinsic value of restricted stock that vested during 2017 was approximately
$
16.0
million
based on the stock price at the time of vesting.
Performance Share Units.
In February 2017, the Company granted equity-classified awards in the form of performance share units, which will vest upon completion of the stated performance period from January 1, 2017 through June 30, 2019. The performance share units will be settled in Common Stock with
one
share of Common Stock being issued per performance share unit up to a maximum of approximately
0.4
million
shares of Common Stock, provided the required performance measures are met. The shares are valued based on the Company’s performance relative to certain performance and market conditions. For the year ended
December 31, 2017
, the Successor Company recognized total share-based compensation expense related to its performance share units of
$
1.4
million
, of which
$
0.2
million
was capitalized.
Successor Incentive-Based Compensation
Performance Units.
In October 2016, the Company granted liability-classified awards in the form of performance units, which will vest over a three-year period and will be settled in cash, provided the required performance measures are met. The performance units were issued at a value of
$
100
each and the value at vesting will be determined by annual scorecard results. At
December 31, 2017
, the liability related to performance units was
$
3.1
million
. Additionally, the Successor Company recognized total incentive-based compensation expense related to its performance units of
$
2.6
million
, of which
$
0.4
million
was capitalized for the year ended
December 31, 2017
.
F-44
SandRidge Energy, Inc. and Subsidiaries
Notes to Consolidated Financial Statements - (Continued)
Predecessor Share-Based Compensation
Restricted Common Stock Awards.
The Predecessor Company’s restricted common stock awards generally vested over a
four
-year period, subject to certain conditions, and were valued based upon the market value of the common stock on the date of grant.
The following table presents a summary of the Predecessor Company’s unvested restricted stock awards.
|
Number of
Shares
|
Weighted-
Average Grant
Date Fair Value
|
|||||
|
(In thousands)
|
||||||
|
Unvested restricted shares outstanding at December 31, 2014
|
|
|
$
|
|
|
|
|
Granted
|
|
|
$
|
|
|
|
|
Vested
|
(
|
)
|
$
|
|
|
|
|
Forfeited / Canceled
|
(
|
)
|
$
|
|
|
|
|
Unvested restricted shares outstanding at December 31, 2015
|
|
|
$
|
|
|
|
|
Granted
|
|
|
$
|
|
|
|
|
Vested
|
(
|
)
|
$
|
|
|
|
|
Forfeited / Canceled
|
(
|
)
|
$
|
|
|
|
|
Predecessor ending unvested restricted shares at October 1, 2016
|
|
|
$
|
|
|
|
18
.
Incentive and Deferred Compensation Plans
2017
Annual Incentive Plan.
The 2017 Annual Incentive Plan (“AIP”) incorporated quantitative performance measures, strategic qualitative goals and competitive target award levels for management and employees for the 2017 performance year. Potential payout percentages ranged from
0
%
to
200
%
of specified target levels based on actual performance. As of December 31, 2017, the Company had accrued approximately
$
10.8
million
for the AIP for all employees, including an accrual for specified members of management. Payments will be made based on actual performance as determined by the Board of Directors relative
to the targets specified in the plan in the first quarter of 2018.
Performance Incentive Plan.
In January 2016, the Company implemented a performance incentive plan. The plan replaced, on a prospective basis, the Company’s previous annual incentive plan, including long-term incentive awards, and provided for quarterly cash payments at a target percentage to participants based upon corporate performance goals with aggregate annual payout opportunity ranging from
0
%
to
200
%
. The first three quarterly cash payments were limited to no greater than target payouts with a cash make up payment for above target performance based on the Company’s annual performance results to be made in the first quarter of 2017. Under this plan, the Predecessor Company paid out approximately
$
17.8
million
during the first two quarters of 2016 and the Successor Company paid out approximately
$
7.1
million
during the fourth quarter of 2016 and approximately
$
15.8
million
during the first quarter of 2017.
401(k) Plan.
The Company maintains a 401(k) retirement plan for its employees. Under this plan, eligible employees may elect to defer a portion of their earnings up to the maximum allowed by Internal Revenue Service (“IRS”) regulations. For the year ended
December 31, 2017
, the Successor Company made matching contributions to the plan equal to
100
%
on the first
10
%
of employee deferred wages, excluding incentive compensation, totaling
$
3.6
million
. For the Successor 2016 Period, the Successor Company made matching cash contributions to the plan equal to
100
%
on the first
10
%
of employee deferred wages for the period totaling
$
0.9
million
. For the Predecessor 2016 Period, the Predecessor Company made matching cash contributions to the plan equal to
100
%
on the first
10
%
of employee deferred wages for the period tot
aling
$
4.9
million
. For the year ended
F-45
SandRidge Energy, Inc. and Subsidiaries
Notes to Consolidated Financial Statements - (Continued)
December 31, 2015
, the Predecessor Company made matching contributions to the plan through cash purcha
ses of Predecessor Company stock equal to
100
%
on the first
10
%
of employee deferred wages. Retirement plan expense for the years ended December 31,
2015
was approximately
$
7.9
million
. Participants in the plan are immediately
100
%
vested in the discretionary employee contributions and related earnings on those contributions. The Company's matching contributions and related earnings vest based on years of service, with full vesting occurring on the fourth anniversary of employment.
F-46
SandRidge Energy, Inc. and Subsidiaries
Notes to Consolidated Financial Statements - (Continued)
19
.
Income Taxes
|
|
Successor
|
Predecessor
|
||||||||||||||
|
|
Year Ended December 31, 2017
|
Period from October 2, 2016 through December 31, 2016
|
Period from January 1, 2016 through October 1, 2016
|
Year Ended December 31, 2015
|
||||||||||||
|
Current
|
||||||||||||||||
|
Federal
|
$
|
(
|
)
|
$
|
|
|
$
|
|
|
$
|
|
|
||||
|
State
|
(
|
)
|
|
|
|
|
|
|
||||||||
|
(
|
)
|
|
|
|
|
|
|
|||||||||
|
Deferred
|
||||||||||||||||
|
Federal
|
|
|
|
|
|
|
|
|
||||||||
|
State
|
|
|
|
|
|
|
|
|
||||||||
|
|
|
|
|
|
|
|
|
|||||||||
|
Total (benefit) provision
|
(
|
)
|
|
|
|
|
|
|
||||||||
|
Less: income tax provision attributable to noncontrolling interest
|
|
|
|
|
|
|
|
|
||||||||
|
Total (benefit) provision attributable to SandRidge Energy, Inc.
|
$
|
(
|
)
|
$
|
|
|
$
|
|
|
$
|
|
|
||||
|
Successor
|
Predecessor
|
|||||||||||||||
|
|
Year Ended December 31, 2017
|
Period from October 2, 2016 through December 31, 2016
|
Period from January 1, 2016 through October 1, 2016
|
Year Ended December 31, 2015
|
||||||||||||
|
Computed at federal statutory rate
|
$
|
|
|
$
|
(
|
)
|
$
|
|
|
$
|
(
|
)
|
||||
|
State taxes, net of federal benefit
|
(
|
)
|
(
|
)
|
|
|
(
|
)
|
||||||||
|
Non-deductible expenses
|
|
|
|
|
|
|
|
|
||||||||
|
Non-deductible debt costs
|
|
|
|
|
|
|
|
|
||||||||
|
Stock-based compensation
|
|
|
|
|
|
|
|
|
||||||||
|
Net effects of consolidating the non-controlling interests’ tax provisions
|
|
|
|
|
|
|
|
|
||||||||
|
Discharge of debt and other reorganization related items
|
|
|
|
|
|
|
|
|
||||||||
|
Return to provision adjustments (1)
|
|
|
|
|
|
|
|
|
||||||||
|
Impact of legislative changes
|
|
|
|
|
|
|
|
|
||||||||
|
Release of valuation allowance
|
(
|
)
|
|
|
|
|
|
|
||||||||
|
Change in valuation allowance
|
(
|
)
|
|
|
(
|
)
|
|
|
||||||||
|
Other
|
(
|
)
|
|
|
|
|
|
|
||||||||
|
Total (benefit) provision attributable to SandRidge Energy, Inc.
|
$
|
(
|
)
|
$
|
|
|
$
|
|
|
$
|
|
|
||||
____________________
|
(1)
|
Primarily related to the Company’s decision to file its 2016 income tax returns using an alternate method than previously estimated with respect to its Chapter 11 related transactions. See additional discussion with respect to Internal Revenue Code (“IRC”) Section 382 below.
|
Deferred income taxes are provided to reflect the future tax consequences of temporary differences between the tax basis of assets and liabilities and their reported amounts in the financial statements. The Company’s deferred tax assets have been reduced by a valuation allowance due to a determination made that it is more likely than not that some or all of the deferred assets will not be realized based on the weight of all available evidence. The Company continues to closely monitor and weigh all available evidence, including both positive and negative, in making its determination whether to maintain a valuation allowance. During the year ended
December 31, 2017
, the Company reduced the valuation allowance associated with deferred tax assets
F-47
SandRidge Energy, Inc. and Subsidiaries
Notes to Consolidated Financial Statements - (Continued)
related to alternative minimum tax (“AMT”) credits that became realizable as a result of a special tax election. Accordingly, the Company recorded an income tax benefit of
$
8.7
million
in the year ended December 31, 2017. As a result of the significant weight placed on the Company’s cumulative negative earnings position, the Company continued to maintain the full valuation allowance against its remaining net deferred tax asset at
December 31, 2017
. As of
December 31, 2017
,
2016
and
2015
, the balance of the valuation allowance was
$
0.5
billion
,
$
1.1
billion
, and
$
2.0
billion
, respectively.
|
|
December 31, 2017
|
December 31, 2016
|
|||||
|
Deferred tax liabilities
|
|||||||
|
Investments(1)
|
$
|
|
|
$
|
|
|
|
|
Total deferred tax liabilities
|
|
|
|
|
|||
|
Deferred tax assets
|
|||||||
|
Property, plant and equipment
|
|
|
|
|
|||
|
Derivative contracts
|
|
|
|
|
|||
|
Allowance for doubtful accounts
|
|
|
|
|
|||
|
Net operating loss carryforwards
|
|
|
|
|
|||
|
Compensation and benefits
|
|
|
|
|
|||
|
Tax Credits and other carryforwards
|
|
|
|
|
|||
|
Asset retirement obligations
|
|
|
|
|
|||
|
Other
|
|
|
|
|
|||
|
Total deferred tax assets
|
|
|
|
|
|||
|
Valuation allowance
|
(
|
)
|
(
|
)
|
|||
|
Net deferred tax liability
|
$
|
|
|
$
|
|
|
|
____________________
|
(1)
|
|
The “Tax Cuts and Jobs Act” (the “TCJA”) enacted in December 2017 includes significant changes to the taxation of business entities, most of which are effective for taxable years beginning after December 31, 2017. These changes include, among others, a permanent reduction to the corporate income tax rate from a maximum
35%
to a flat
21%
rate, expansion of expensing capital expenditures for a period of time, new limitations on the utilization of net operating losses, and limitations on the deduction of interest expense and executive compensation. Based on our analysis of the TCJA and guidance currently available we recorded an income tax expense of approximately
$
243.8
million
in the period ended December 31, 2017, which was completely offset by a decrease in the corresponding valuation allowance. The provisional amount primarily related to the remeasurement of our gross deferred tax assets and liabilities existing at December 31, 2017 at the appropriate tax rate expected to exist at the time of their reversal. We continue to evaluate the impact of the TCJA and while adjustments to certain deferred tax assets may occur in 2018 due to additional guidance or changes in estimates, we do not expect a material adjustment to our existing net deferred tax balance.
IRC Section 382 addresses company ownership changes and specifically limits the utilization of certain deductions and other tax attributes on an annual basis following an ownership change. As a result of the Chapter 11 reorganization and related transactions, the Company experienced an ownership change within the meaning of IRC Section 382 on October 4, 2016. The Company analyzed alternatives available within the IRC to taxpayers in Chapter 11 bankruptcy proceedings in order to minimize the impact of the October 4, 2016 ownership change on its tax attributes and previously planned to elect an available alternative upon filing its 2016 U.S. federal income tax return that would not subject existing tax attributes to an immediate IRC Section 382 limitation, but which would have resulted in a full limitation should a subsequent ownership change occur within two years of the emergent date ownership change. Alternatively, upon filing its 2016 U.S. federal income tax return, the Company elected a method that did subject tax attributes including net operating losses (“NOLs”) existing at October 4, 2016 to an annual limitation but provided more certainty with respect to the future availability of the Company’s existing NOLs. This limitation is expected to result in a significant portion of our NOL carryforwards expiring unused. As such, the Company’s deferred tax asset associated with NOLs and corresponding valuation allowance are materially less at December 31, 2017 compared to December 31, 2016. The election and resulting limitation did not result in an income tax expense as the Company’s net deferred tax asset had previously been reduced to
zero
by a valuation allowance. Additionally, the limitation did not result in a tax liability for the tax years ended December 31, 2016 or December 31, 2017.
F-48
SandRidge Energy, Inc. and Subsidiaries
Notes to Consolidated Financial Statements - (Continued)
As of
December 31, 2017
, the Company had approximately
$
4.7
million
of alternative minimum tax credits available that do not expire. However, due to a special tax election available, the AMT credits are reflected as a current receivable as of
December 31, 2017
. In addition, the Company had approximately
$
805.3
million
of federal net operating loss carryovers, net of NOLs expected to expire unused due to the 2016 IRC Section 382 limitation, that expire during the years
2025
through
2037
.
At
December 31, 2017
and
2016
, the Company had an insignificant liability for unrecognized tax benefits.
A reconciliation of the beginning and ending amount of unrecognized tax benefits is as follows (in thousands):
|
|
Successor
|
Predecessor
|
||||||||||
|
|
Year Ended December 31, 2017
|
Period from October 2, 2016 through December 31, 2016
|
Period from January 1, 2016 through October 1, 2016
|
|||||||||
|
Unrecognized tax benefit at January 1
|
$
|
|
|
$
|
|
|
$
|
|
|
|||
|
Changes to unrecognized tax benefits related to a prior period
|
|
|
|
|
|
|
||||||
|
Lapse of statute of limitations
|
(
|
)
|
|
|
|
|
||||||
|
Unrecognized tax benefit at December 31
|
$
|
|
|
$
|
|
|
$
|
|
|
|||
Consistent with its policy to record interest and penalties on income taxes as a component of the income tax provision, the Company has included insignificant amounts of accrued gross interest with respect to unrecognized tax benefits in its accompanying consolidated statements of operations during the years ended
December 31, 2017
,
2016
and
2015
. The Company expects a lapse in statute of limitation to eliminate its gross unrecognized tax benefits balance within the next
12
months
.
F-49
SandRidge Energy, Inc. and Subsidiaries
Notes to Consolidated Financial Statements - (Continued)
20
.
Earnings (Loss) per Share
As discussed in Note
1
, on the Emergence Date, the Predecessor Company’s then-authorized common stock was canceled and the new Common Stock and Warrants were issued.
|
Net Income (Loss)
|
Weighted Average Shares
|
Earnings (Loss) Per Share
|
||||||||
|
(In thousands, except per share amounts)
|
||||||||||
|
Year Ended December 31, 2017 (Successor)
|
||||||||||
|
Basic earnings per share
|
$
|
|
|
|
|
$
|
|
|
||
|
Effect of dilutive securities
|
||||||||||
|
Restricted stock awards
|
|
|
|
|
||||||
|
Performance share units(1)
|
|
|
|
|
||||||
|
Warrants(1)
|
|
|
|
|
||||||
|
Diluted earnings per share
|
$
|
|
|
|
|
$
|
|
|
||
|
Period from October 2, 2016 to December 31, 2016 (Successor)
|
||||||||||
|
Basic loss per share
|
$
|
(
|
)
|
|
|
$
|
(
|
)
|
||
|
Effect of dilutive securities
|
||||||||||
|
Restricted stock(2)
|
|
|
|
|
||||||
|
Warrants(2)
|
|
|
|
|
||||||
|
Convertible Notes(3)
|
|
|
|
|
||||||
|
Diluted loss per share
|
$
|
(
|
)
|
|
|
$
|
(
|
)
|
||
|
Period from January 1, 2016 to October 1, 2016 (Predecessor)
|
||||||||||
|
Basic earnings per share
|
$
|
|
|
|
|
$
|
|
|
||
|
Effect of dilutive securities
|
||||||||||
|
Restricted stock and units(4)
|
|
|
|
|
||||||
|
Diluted earnings per share
|
$
|
|
|
|
|
$
|
|
|
||
|
Year Ended December 31, 2015 (Predecessor)
|
||||||||||
|
Basic loss per share
|
$
|
(
|
)
|
|
|
$
|
(
|
)
|
||
|
Effect of dilutive securities
|
||||||||||
|
Restricted stock and units(4)
|
|
|
|
|
||||||
|
Convertible preferred stock (5)
|
|
|
|
|
||||||
|
Convertible senior unsecured notes(6)
|
—
|
|
—
|
|
||||||
|
Diluted loss per share
|
$
|
(
|
)
|
|
|
$
|
(
|
)
|
||
____________________
|
(1)
|
|
|
(2)
|
|
|
(3)
|
Potential common shares related to the Convertible Notes covering
|
|
(4)
|
|
|
(5)
|
Potential common shares related to the Predecessor Company’s then-outstanding
|
|
(6)
|
Potential common shares related to the Predecessor Company’s then-outstanding
|
F-50
SandRidge Energy, Inc. and Subsidiaries
Notes to Consolidated Financial Statements - (Continued)
21
.
Subsequent Events
Executive Team and Organizational Restructuring.
On February 8, 2018, the Company announced the departure of James Bennett, President and CEO, effective immediately, and Julian Bott, Chief Financial Officer, effective at the close of business on the date of filing this 2017 Annual Report with the SEC. Simultaneously, the Company announced the appointment of independent board member, Bill Griffin, as Interim President and Chief Executive Officer, and the appointment of Sylvia K. Barnes as an independent director, effective February 8, 2018, and the appointment of Chief Accounting Officer, Michael Johnson, as Interim Chief Financial Officer, effective upon the departure of Mr. Bott.
Additionally, on February 8, 2018, the Company announced its new strategic direction, which includes implementing changes in the organizational structure and a reduction in planned 2018 capital expenditures and general and administrative expenses.
Merger proposal.
On February 6, 2018, the Company received an unsolicited proposal from Midstates Petroleum Company, Inc. (“Midstates”) to combine SandRidge and Midstates in an all stock merger transaction. On February 7, 2018, the Company announced that its board of directors, in consultation with independent financial and legal advisers, will carefully review and evaluate Midstates’ proposal, taking into account the Company’s current strategic plan and standalone prospects.
Shareholder activism.
Subsequent to the announcement of the Bonanza Creek Energy, Inc. merger in November 2017
,
the Company has been actively engaged in ongoing discussions with its shareholders regarding the composition of the Company’s board of directors and the future direction of the Company. As a result of these discussions, the Company expects to incur significant additional costs related to shareholder activism including proxy fees charged by its independent financial adviser.
F-51
SandRidge Energy, Inc. and Subsidiaries
Notes to Consolidated Financial Statements - (Continued)
22
.
Supplemental Information on Oil and Natural Gas Producing Activities (Unaudited)
The supplemental information includes capitalized costs related to oil and natural gas producing activities; costs incurred in oil and natural gas property acquisition, exploration and development; and the results of operations for oil and natural gas producing activities. Supplemental information is also provided for oil, natural gas and NGL production and average sales prices; the estimated quantities of proved oil, natural gas and NGL reserves; the standardized measure of discounted future net cash flows associated with proved oil, natural gas and NGL reserves; and a summary of the changes in the standardized measure of discounted future net cash flows associated with proved oil, natural gas and NGL reserves.
Capitalized Costs Related to Oil and Natural Gas Producing Activities
|
Successor
|
Predecessor
|
|||||||||||
|
|
December 31,
|
December 31,
|
December 31,
|
|||||||||
|
|
2017
|
2016
|
2015
|
|||||||||
|
Oil and natural gas properties
|
||||||||||||
|
Proved
|
$
|
|
|
$
|
|
|
$
|
|
|
|||
|
Unproved
|
|
|
|
|
|
|
||||||
|
Total oil and natural gas properties
|
|
|
|
|
|
|
||||||
|
Less accumulated depreciation, depletion and impairment
|
(
|
)
|
(
|
)
|
(
|
)
|
||||||
|
Net oil and natural gas properties capitalized costs
|
$
|
|
|
$
|
|
|
$
|
|
|
|||
Costs Incurred in Oil and Natural Gas Property Acquisition, Exploration and Development
|
Successor
|
Predecessor
|
|||||||||||||||
|
|
Year Ended December 31, 2017
|
Period from October 2, 2016 through December 31, 2016
|
Period from January 1, 2016 through October 1, 2016
|
Year Ended December 31, 2015
|
||||||||||||
|
Acquisitions of properties
|
||||||||||||||||
|
Proved
|
$
|
|
|
$
|
|
|
$
|
|
|
$
|
|
|
||||
|
Unproved
|
|
|
|
|
|
|
|
|
||||||||
|
Exploration(1)
|
|
|
|
|
|
|
|
|
||||||||
|
Development
|
|
|
|
|
|
|
|
|
||||||||
|
Total cost incurred
|
$
|
|
|
$
|
|
|
$
|
|
|
$
|
|
|
||||
|
(1)
|
Includes 3-D seismic costs of
$
|
F-52
SandRidge Energy, Inc. and Subsidiaries
Notes to Consolidated Financial Statements - (Continued)
Results of Operations for Oil and Natural Gas Producing Activities
|
Successor
|
Predecessor
|
|||||||||||||||
|
Year Ended December 31, 2017
|
Period from October 2, 2016 through December 31, 2016
|
Period from January 1, 2016 through October 1, 2016
|
Year Ended December 31, 2015
|
|||||||||||||
|
Revenues
|
$
|
|
|
$
|
|
|
$
|
|
|
$
|
|
|
||||
|
Expenses
|
||||||||||||||||
|
Production costs
|
|
|
|
|
|
|
|
|
||||||||
|
Depreciation and depletion
|
|
|
|
|
|
|
|
|
||||||||
|
Impairment
|
|
|
|
|
|
|
|
|
||||||||
|
Total expenses
|
|
|
|
|
|
|
|
|
||||||||
|
Income (loss) before income taxes
|
|
|
(
|
)
|
(
|
)
|
(
|
)
|
||||||||
|
Income tax expense (benefit)(1)
|
|
|
(
|
)
|
(
|
)
|
(
|
)
|
||||||||
|
Results of operations for oil and natural gas producing activities (excluding corporate overhead and interest costs)
|
$
|
|
|
$
|
(
|
)
|
$
|
(
|
)
|
$
|
(
|
)
|
||||
|
(1)
|
Income tax expense (benefit) is hypothetical and is calculated by applying the Company’s statutory tax rate to income (loss) before income taxes attributable to our oil and natural gas producing activities, after giving effect to permanent differences and tax credits.
|
Oil, Natural Gas and NGL Reserve Quantities
Proved oil, natural gas and NGL reserves are those quantities, which, by analysis of geoscience and engineering data, can be estimated with reasonable certainty to be economically producible, based on oil, natural gas and NGL prices used to estimate reserves, from a given date forward from known reservoirs, and under existing economic conditions, operating methods, and government regulation prior to the time at which contracts providing the right to operate expire, unless evidence indicates that renewal is reasonably certain.
The term “reasonable certainty” implies a high degree of confidence that the quantities of oil, natural gas and NGLs actually recovered will equal or exceed the estimate. To achieve reasonable certainty, the Company’s engineers and independent petroleum consultants relied on technologies that have been demonstrated to yield results with consistency and repeatability. The technologies and economic data used to estimate the Company’s proved reserves include, but are not limited to, well logs, geologic maps, seismic data, well test data, production data, historical price and cost information and property ownership interests. The accuracy of the reserve estimates is dependent on many factors, including the following:
|
•
|
the quality and quantity of available data and the engineering and geological interpretation of that data;
|
|
•
|
estimates regarding the amount and timing of future costs, which could vary considerably from actual costs;
|
|
•
|
the accuracy of mandated economic assumptions; and
|
|
•
|
the judgment of the personnel preparing the estimates.
|
Proved developed reserves are proved reserves expected to be recovered through existing wells with existing equipment and operating methods or in which the cost of the required equipment is relatively minor compared with the cost of a new well. Proved undeveloped reserves are reserves that are expected to be recovered from new wells on undrilled acreage, or from existing wells where a relatively large major expenditure is required for recompletion.
The table below represents the Company’s estimate of proved oil, natural gas and NGL reserves attributable to the Company’s net interest in oil and natural gas properties, all of which are located in the continental United States, based upon the evaluation by the Company and its independent petroleum engineers of pertinent geoscience and engineering data in accordance
F-53
SandRidge Energy, Inc. and Subsidiaries
Notes to Consolidated Financial Statements - (Continued)
with the SEC’s regulations. Estimates of the substantial majority of the Company’s proved reserves have been prepared by independent reservoir engineers and geoscience professionals and are reviewed by members of the Company’s senior management with professional training in petroleum engineering to ensure that the Company consistently applies rigorous professional standards and the reserve definitions prescribed by the SEC.
Cawley, Gillespie & Associates, Inc. (“CG&A”), Ryder Scott Company, L.P. (“Ryder Scott”) and Netherland, Sewell & Associates, Inc. (“Netherland Sewell”), independent oil and natural gas consultants, prepared the estimates of proved reserves of oil, natural gas and NGLs attributable to the majority of the Company’s net interest in oil and natural gas properties as of the end of
2017
,
2016
and
2015
. CG&A, Ryder Scott and Netherland Sewell are independent petroleum engineers, geologists, geophysicists and petrophysicists and do not own an interest in the Company or its properties and are not employed on a contingent basis. The remaining proved reserves were based on Company estimates.
The Company believes the geoscience and engineering data examined provides reasonable assurance that the proved reserves are economically producible in future years from known reservoirs, and under existing economic conditions, operating methods and governmental regulations. Estimates of proved reserves are subject to change, either positively or negatively, as additional information is available and contractual and economic conditions change.
2017 Activity.
During 2017, the Company recorded extensions and discoveries of
19.4
MMBoe, primarily from successful drilling in its NW STACK play in the Mid-Continent area and its North Park Basin properties, sold
1.9
MMBoe of proved reserves, and recorded upward revisions of
10.9
MMBoe, primarily as a result of significantly higher commodity prices in 2017 and minor revisions due to well performance.
2016 Activity.
During 2016, on a pro forma combined basis, Predecessor Company and Successor Company recognized total downward revisions of prior estimates of approximately
105.4
MMBoe, predominantly from revisions of approximately
94.7
MMBoe due to well performance and
12.1
MMBoe due to a decrease in commodity prices. The negative revisions from well performance were from the Mid-Continent area and resulted from steeper than anticipated well production decline rates for Mississippian horizontal wells in areas with increased natural fracture density and that have been developed with three or more horizontal wells per section as inter-well pressure communication has had more impact on well performance than originally forecasted. Additionally, changing pressure conditions in the Company’s Mississippian wells producing with artificial lift have resulted in increased production decline rates that are now becoming more predictable on a large group of base wells as this population of wells has been producing for more than two years. Of the total performance revisions, approximately
85
%
were to gas and associated NGL reserves, with the revisions to gas mostly from changes made to late-life decline rates, and
15
%
were to oil reserves. Other decreases of reserves excluding production included the sale of WTO reserves of
24.6
MMBoe and
19.1
MMBoe of adjustment from change in accounting for Trusts. These decreases were partially offset by approximately
7.8
MMBoe of extensions due to successful drilling.
2015 Activity.
During 2015, the Company recognized additional oil, NGL and natural gas reserves from extensions and discoveries of
9.7
MMBbls,
9.3
MMBbls, and
160.9
Bcf, respectively, primarily due to successful drilling in the Mississippian formation in the Mid-Continent area. Acquisition of the North Park Basin assets, located in Jackson County, Colorado, in December 2015 added
27.6
MMBoe of reserves. These positive revisions were offset by (i) negative pricing revisions of approximately
54
MMBbls for oil,
36
MMBbls for NGLs and
687
Bcf for natural gas, due primarily to significantly lower commodity prices in 2015, and (ii) negative revisions of approximately
16
MMBbls for oil,
1
MMBbls for NGLs and
74
Bcf for natural gas primarily from well performance in the Mid-Continent.
F-54
SandRidge Energy, Inc. and Subsidiaries
Notes to Consolidated Financial Statements - (Continued)
|
Oil
|
NGL
|
Natural Gas
|
Total
|
||||||||
|
|
(MBbls)
|
(MBbls)
|
(MMcf)(1)
|
MBoe
|
|||||||
|
Proved developed and undeveloped reserves
|
|||||||||||
|
As of December 31, 2014(2) - Predecessor
|
|
|
|
|
|
|
|
|
|||
|
Revisions of previous estimates
|
(
|
)
|
(
|
)
|
(
|
)
|
(
|
)
|
|||
|
Acquisitions of new reserves
|
|
|
|
|
|
|
|
|
|||
|
Extensions and discoveries
|
|
|
|
|
|
|
|
|
|||
|
Production
|
(
|
)
|
(
|
)
|
(
|
)
|
(
|
)
|
|||
|
As of December 31, 2015(2) - Predecessor
|
|
|
|
|
|
|
|
|
|||
|
Adoption of ASU 2015-02
|
(
|
)
|
(
|
)
|
(
|
)
|
(
|
)
|
|||
|
Revisions of previous estimates
|
(
|
)
|
(
|
)
|
(
|
)
|
(
|
)
|
|||
|
Extensions and discoveries
|
|
|
|
|
|
|
|
|
|||
|
Sales of reserves in place
|
(
|
)
|
|
|
(
|
)
|
(
|
)
|
|||
|
Production
|
(
|
)
|
(
|
)
|
(
|
)
|
(
|
)
|
|||
|
As of October 1, 2016 - Predecessor
|
|
|
|
|
|
|
|
|
|||
|
|
|
||||||||||
|
|
|
||||||||||
|
Revisions of previous estimates
|
|
|
|
|
|
|
|
|
|||
|
Extensions and discoveries
|
|
|
|
|
|
|
|
|
|||
|
Production
|
(
|
)
|
(
|
)
|
(
|
)
|
(
|
)
|
|||
|
As of December 31, 2016 - Successor
|
|
|
|
|
|
|
|
|
|||
|
Revisions of previous estimates
|
|
|
|
|
|
|
|
|
|||
|
Acquisitions of new reserves
|
|
|
|
|
|
|
|
|
|||
|
Extensions and discoveries
|
|
|
|
|
|
|
|
|
|||
|
Sales of reserves in place
|
(
|
)
|
(
|
)
|
(
|
)
|
(
|
)
|
|||
|
Production
|
(
|
)
|
(
|
)
|
(
|
)
|
(
|
)
|
|||
|
As of December 31, 2017 - Successor
|
|
|
|
|
|
|
|
|
|||
|
Proved developed reserves
|
|
||||||||||
|
As of December 31, 2014 - Predecessor
|
|
|
|
|
|
|
|
|
|||
|
As of December 31, 2015 - Predecessor
|
|
|
|
|
|
|
|
|
|||
|
As of October 1, 2016 - Predecessor
|
|
|
|
|
|
|
|
|
|||
|
|
|
||||||||||
|
|
|
||||||||||
|
As of December 31, 2016 - Successor
|
|
|
|
|
|
|
|
|
|||
|
As of December 31, 2017 - Successor
|
|
|
|
|
|
|
|
|
|||
|
Proved undeveloped reserves
|
|
||||||||||
|
As of December 31, 2014 - Predecessor
|
|
|
|
|
|
|
|
|
|||
|
As of December 31, 2015 - Predecessor
|
|
|
|
|
|
|
|
|
|||
|
As of October 1, 2016 - Predecessor
|
|
|
|
|
|
|
|
|
|||
|
|
|
||||||||||
|
|
|
||||||||||
|
As of December 31, 2016 - Successor
|
|
|
|
|
|
|
|
|
|||
|
As of December 31, 2017 - Successor
|
|
|
|
|
|
|
|
|
|||
____________________
|
(1)
|
Natural gas reserves are computed at
14.65
pounds per square inch absolute and
60
degrees Fahrenheit.
|
|
(2)
|
Includes proved reserves attributable to noncontrolling interests as shown in the table below:
|
|
|
Predecessor
|
||||
|
December 31,
|
|||||
|
|
2015
|
2014
|
|||
|
Oil (MBbl)
|
|
|
|
|
|
|
NGL (MBbl)
|
|
|
|
|
|
|
Natural gas (MMcf)
|
|
|
|
|
|
F-55
SandRidge Energy, Inc. and Subsidiaries
Notes to Consolidated Financial Statements - (Continued)
Standardized Measure of Discounted Future Net Cash Flows (Unaudited)
The standardized measure of discounted cash flows and summary of the changes in the standardized measure computation from year to year are prepared in accordance with ASC Topic 932, Extractive Activities—Oil and Gas (“ASC Topic 932”). The assumptions underlying the computation of the standardized measure of discounted cash flows may be summarized as follows:
|
•
|
the standardized measure includes the Company’s estimate of proved oil, natural gas and NGL reserves and projected future production volumes based upon economic conditions;
|
|
•
|
pricing is applied based upon 12-month average market prices at
December 31, 2017
,
2016
, and
2015
adjusted for fixed or determinable contracts that are in existence at year-end.
|
|
Successor
|
Predecessor
|
|||||||||||
|
|
December 31,
|
December 31,
|
December 31,
|
|||||||||
|
|
2017
|
2016
|
2015
|
|||||||||
|
Oil (per barrel)
|
$
|
|
|
$
|
|
|
$
|
|
|
|||
|
NGL (per barrel)
|
$
|
|
|
$
|
|
|
$
|
|
|
|||
|
Natural gas (per Mcf)
|
$
|
|
|
$
|
|
|
$
|
|
|
|||
|
•
|
future development and production costs are determined based upon actual cost at year-end;
|
|
•
|
the standardized measure includes projections of future abandonment costs based upon actual costs at year-end; and
|
|
•
|
a discount factor of 10% per year is applied annually to the future net cash flows.
|
|
Successor
|
Predecessor
|
|||||||||||
|
December 31,
|
December 31,
|
December 31,
|
||||||||||
|
2017
|
2016
|
2015
|
||||||||||
|
Future cash inflows from production
|
$
|
|
|
$
|
|
|
$
|
|
|
|||
|
Future production costs
|
(
|
)
|
(
|
)
|
(
|
)
|
||||||
|
Future development costs(1)
|
(
|
)
|
(
|
)
|
(
|
)
|
||||||
|
Future income tax expenses
|
(
|
)
|
(
|
)
|
(
|
)
|
||||||
|
Undiscounted future net cash flows
|
|
|
|
|
|
|
||||||
|
10% annual discount
|
(
|
)
|
(
|
)
|
(
|
)
|
||||||
|
Standardized measure of discounted future net cash flows(2)
|
$
|
|
|
$
|
|
|
$
|
|
|
|||
|
(1)
|
Includes abandonment costs.
|
|
(2)
|
|
F-56
SandRidge Energy, Inc. and Subsidiaries
Notes to Consolidated Financial Statements - (Continued)
The following table represents the Company’s estimate of changes in the standardized measure of discounted future net cash flows from proved reserves (in thousands):
|
Successor
|
Predecessor
|
|||||||||||||||
|
Year Ended December 31, 2017
|
Period from October 2, 2016 through December 31, 2016
|
Period from January 1, 2016 through October 1, 2016
|
Year Ended December 31, 2015
|
|||||||||||||
|
Beginning present value
|
$
|
|
|
$
|
|
|
$
|
|
|
$
|
|
|
||||
|
Changes during the year
|
||||||||||||||||
|
Adoption of ASU 2015-02
|
|
|
|
|
(
|
)
|
|
|
||||||||
|
Revenues less production
|
(
|
)
|
(
|
)
|
(
|
)
|
(
|
)
|
||||||||
|
Net changes in prices, production and other costs
|
|
|
|
|
(
|
)
|
(
|
)
|
||||||||
|
Development costs incurred
|
|
|
|
|
|
|
|
|
||||||||
|
Net changes in future development costs
|
(
|
)
|
(
|
)
|
|
|
|
|
||||||||
|
Extensions and discoveries
|
|
|
|
|
|
|
|
|
||||||||
|
Revisions of previous quantity estimates
|
|
|
|
|
(
|
)
|
(
|
)
|
||||||||
|
Accretion of discount
|
|
|
|
|
|
|
|
|
||||||||
|
Net change in income taxes
|
|
|
|
|
|
|
|
|
||||||||
|
Purchases of reserves in-place
|
|
|
|
|
|
|
|
|
||||||||
|
Sales of reserves in-place
|
(
|
)
|
|
|
(
|
)
|
|
|
||||||||
|
Timing differences and other(1)
|
|
|
|
|
(
|
)
|
|
|
||||||||
|
Net change for the year
|
|
|
|
|
(
|
)
|
(
|
)
|
||||||||
|
Ending present value(2)
|
$
|
|
|
$
|
|
|
$
|
|
|
$
|
|
|
||||
____________________
|
(1)
|
The change in timing differences and other are related to revisions in the Company’s estimated time of production and development.
|
|
(2)
|
|
F-57
SandRidge Energy, Inc. and Subsidiaries
Notes to Consolidated Financial Statements - (Continued)
23
.
Quarterly Financial Results (Unaudited)
|
Successor
|
|||||||||||||||
|
First
Quarter
|
Second
Quarter
|
Third
Quarter
|
Fourth Quarter
|
||||||||||||
|
2017
|
|||||||||||||||
|
Total revenues
|
$
|
|
|
$
|
|
|
$
|
|
|
$
|
|
|
|||
|
Income (loss) from operations(1)(2)
|
$
|
|
|
$
|
|
|
$
|
(
|
)
|
$
|
(
|
)
|
|||
|
Net income (loss)(1)(2)
|
$
|
|
|
$
|
|
|
$
|
(
|
)
|
$
|
(
|
)
|
|||
|
Income available (loss applicable) to SandRidge Energy, Inc. common stockholders(1)(2)
|
$
|
|
|
$
|
|
|
$
|
(
|
)
|
$
|
(
|
)
|
|||
|
Income available (loss applicable) per share to SandRidge Energy, Inc. common stockholders
|
|||||||||||||||
|
Basic
|
$
|
|
|
$
|
|
|
$
|
(
|
)
|
$
|
(
|
)
|
|||
|
Diluted
|
$
|
|
|
$
|
|
|
$
|
(
|
)
|
$
|
(
|
)
|
|||
____________________
|
(1)
|
Includes (gain) loss on derivative contracts of
$(
|
|
(2)
|
Includes terminated merger costs of
$
|
|
Predecessor
|
Successor
|
|||||||||||||||||||
|
First
Quarter
|
Second
Quarter
|
Third
Quarter
|
Fourth
Quarter
|
Fourth
Quarter
|
||||||||||||||||
|
2016
|
||||||||||||||||||||
|
Total revenues
|
$
|
|
|
$
|
|
|
$
|
|
|
$
|
|
|
$
|
|
|
|||||
|
Loss from operations(1)(2)
|
$
|
(
|
)
|
$
|
(
|
)
|
$
|
(
|
)
|
$
|
|
|
$
|
(
|
)
|
|||||
|
Net (loss) income(1)(2)(3)
|
$
|
(
|
)
|
$
|
(
|
)
|
$
|
(
|
)
|
$
|
|
|
$
|
(
|
)
|
|||||
|
(Loss applicable) income available to SandRidge Energy, Inc. common stockholders(1)(2)(3)
|
$
|
(
|
)
|
$
|
(
|
)
|
$
|
(
|
)
|
$
|
|
|
$
|
(
|
)
|
|||||
|
(Loss applicable) income available per share to SandRidge Energy, Inc. common stockholders
|
||||||||||||||||||||
|
Basic
|
$
|
(
|
)
|
$
|
(
|
)
|
$
|
(
|
)
|
$
|
|
|
$
|
(
|
)
|
|||||
|
Diluted
|
$
|
(
|
)
|
$
|
(
|
)
|
$
|
(
|
)
|
$
|
|
|
$
|
(
|
)
|
|||||
____________________
|
(1)
|
Includes impairment of
$
|
|
(2)
|
Includes loss on settlement of contract of
$
|
|
(3)
|
|
F-58
SIGNATURES
Pursuant to the requirements of Section 13 or 15(d) of the Securities Exchange Act of 1934, the registrant has duly caused this report to be signed on its behalf by the undersigned, thereunto duly authorized.
|
SANDRIDGE ENERGY, INC.
|
||
|
By
|
/s/ W
ILLIAM (
B
ILL)
M. G
RIFFIN
|
|
|
William (Bill) M. Griffin,
|
||
|
President and Chief Executive Officer
|
||
|
February 22, 2018
|
||
KNOW ALL MEN BY THESE PRESENTS, that each person whose signature appears below constitutes and appoints Julian Bott, Philip T. Warman and Dustin Crawford, and each of them severally, his true and lawful attorney or attorneys-in-fact and agents, with full power to act with or without the others and with full power of substitution and resubstitution, to execute in his name, place and stead, in any and all capacities, any or all amendments to this report, and to file the same, with all exhibits thereto, and other documents in connection therewith, with the Securities and Exchange Commission, granting unto said attorneys-in-fact and agents and each of them, full power and authority to do and perform in the name of on behalf of the undersigned, in any and all capacities, each and every act and thing necessary or desirable to be done in and about the premises, to all intents and purposes and as fully as they might or could do in person, hereby ratifying, approving and confirming all that said attorneys-in-fact and agents or their substitutes may lawfully do or cause to be done by virtue hereof.
Pursuant to the requirements of the Securities Exchange Act of 1934, this report has been signed below by the following persons on behalf of the registrant and in the capacities and on the dates indicated.
|
Signature
|
|
Title
|
Date
|
|
/s/ WILLIAM (BILL) M. GRIFFIN
|
|
President, Chief Executive Officer and Director
(Principal Executive Officer)
|
February 22, 2018
|
|
William (Bill) M. Griffin
|
|||
|
/s/ JULIAN BOTT
|
|
Chief Financial Officer and Executive Vice President (Principal Financial Officer)
|
February 22, 2018
|
|
Julian Bott
|
|||
|
/s/ MICHAEL A. JOHNSON
|
|
Chief Accounting Officer and Senior Vice President
(Principal Accounting Officer)
|
February 22, 2018
|
|
Michael A. Johnson
|
|||
|
/s/ MICHAEL L. BENNETT
|
|
Director
|
February 22, 2018
|
|
Michael L. Bennett
|
|||
|
/s/ JOHN V. GENOVA
|
|
Chairman
|
February 22, 2018
|
|
John V. Genova
|
|||
|
/s/ SYLVIA K. BARNES
|
|
Director
|
February 22, 2018
|
|
Sylvia K. Barnes
|
|||
|
/s/ DAVID J. KORNDER
|
|
Director
|
February 22, 2018
|
|
David J. Kornder
|
|||
EXHIBIT INDEX
|
Incorporated by Reference
|
||||||
|
Exhibit
No.
|
Exhibit Description
|
Form
|
SEC
File No.
|
Exhibit
|
Filing Date
|
Filed
Herewith
|
|
2.1
|
8-K
|
001-33784
|
2.1
|
1/9/2014
|
||
|
2.2
|
8-A
|
001-33784
|
2.1
|
10/4/2016
|
||
|
2.3**
|
|
8-K
|
001-33784
|
2.1
|
11/15/2017
|
|
|
3.1
|
8-A
|
001-33784
|
3.1
|
10/4/2016
|
||
|
3.2
|
8-A
|
001-33784
|
3.2
|
10/4/2016
|
||
|
3.3
|
|
8-K
|
001-33784
|
3.1
|
11/27/2017
|
|
|
4.1
|
8-K
|
001-33784
|
4.1
|
10/7/2016
|
||
|
4.2
|
8-K
|
001-33784
|
10.6
|
10/7/2016
|
||
|
4.3
|
8-K
|
001-33784
|
10.3
|
10/7/2016
|
||
|
4.4
|
8-A
|
001-33784
|
10.1
|
10/4/2017
|
||
|
4.5
|
|
8-K
|
001-33784
|
4.1
|
11/27/2017
|
|
|
4.6
|
|
8-K
|
001-33784
|
4.1
|
1/23/2018
|
|
|
10.1†
|
8-K
|
001-33784
|
10.8
|
10/7/2016
|
||
|
10.1.1†
|
10-K
|
001-33784
|
10.1.1
|
3/3/2017
|
||
|
10.1.1.1†
|
|
10-Q
|
001-33784
|
10.1.1.1
|
11/3/2017
|
|
|
10.1.2†
|
10-K
|
001-33784
|
10.1.2
|
3/3/2017
|
||
|
10.1.2.1†
|
10-Q
|
001-33784
|
10.1.2.1
|
11/3/2017
|
||
|
10.1.3†
|
10-K
|
001-33784
|
10.1.3
|
3/3/2017
|
||
|
10.1.4†
|
10-K
|
001-33784
|
10.1.4
|
3/3/2017
|
||
|
10.1.4.1†
|
10-Q
|
001-33784
|
10.1.4.1
|
11/3/2017
|
||
|
10.1.5†
|
10-K
|
001-33784
|
10.1.5
|
3/3/2017
|
||
|
10.1.6†
|
|
10-Q
|
001-33784
|
10.1.6
|
8/7/2017
|
|
|
10.1.6.1†
|
|
10-Q
|
001-33784
|
10.1.6.1
|
11/3/2017
|
|
|
10.1.7†
|
|
*
|
||||
|
10.2.1†
|
10-K
|
001-33784
|
10.3.1
|
2/27/2015
|
||
|
10.2.2†
|
8-K
|
001-33784
|
10.1
|
8/5/2015
|
||
|
10.2.3†
|
10-K
|
001-33784
|
10.3.2
|
2/27/2015
|
||
|
10.2.4†
|
10-Q
|
001-33784
|
10.3.4
|
11/5/2015
|
||
|
10.2.5†
|
|
8-K
|
001-33784
|
10.1
|
2/9/2018
|
|
|
10.3†
|
8-K
|
001-33784
|
10.9
|
10/7/2016
|
||
|
10.4
|
8-K
|
001-33784
|
10.1
|
10/7/2016
|
||
|
10.5
|
8-K
|
001-33784
|
10.1
|
2/13/2017
|
||
|
10.6
|
10-K
|
001-33784
|
10.6
|
3/3/2017
|
||
|
10.7
|
8-K
|
001-33784
|
10.4
|
10/7/2016
|
||
|
10.8
|
8-K
|
001-33784
|
10.5
|
10/7/2016
|
||
|
10.9
|
8-K
|
001-33784
|
10.2
|
10/7/2016
|
||
|
10.9.1
|
10-K
|
001-33784
|
10.9
|
3/3/2017
|
||
|
10.10
|
8-K
|
001-33784
|
10.1
|
5/16/2016
|
||
|
10.11
|
|
8-K
|
001-33784
|
10.1
|
12/28/2017
|
|
|
21.1
|
*
|
|||||
|
23.1
|
*
|
|||||
|
23.2
|
*
|
|||||
|
23.3
|
*
|
|||||
|
23.4
|
*
|
|||||
|
31.1
|
*
|
|||||
|
31.2
|
*
|
|||||
|
32.1
|
*
|
|||||
|
99.1
|
*
|
|||||
|
99.2
|
*
|
|||||
|
99.3
|
*
|
|||||
|
101.INS
|
XBRL Instance Document - the instance document does not appear in the Interactive Data File because its XBRL tags are embedded within the Inline XBRL document.
|
*
|
||||
|
101.SCH
|
XBRL Taxonomy Extension Schema Document
|
*
|
||||
|
101.CAL
|
XBRL Taxonomy Extension Calculation Linkbase Document
|
*
|
||||
|
101.DEF
|
XBRL Taxonomy Extension Definition Document
|
*
|
||||
|
101.LAB
|
XBRL Taxonomy Extension Label Linkbase Document
|
*
|
||||
|
101.PRE
|
XBRL Taxonomy Extension Presentation Linkbase Document
|
*
|
||||
|
** Schedules have been omitted pursuant to Item 601(b)(2) of Regulation S-K. SandRidge Energy, Inc., Inc. hereby undertakes to furnish supplemental copies of any of the omitted schedules upon request by the U.S. Securities and Exchange Commission; provided, however, that SandRidge Energy, Inc. may request confidential treatment pursuant to Rule 24b-2 of the Securities Exchange Act of 1934, as amended, for any schedules so furnished.
|
||||||
|
† Management contract or compensatory plan or arrangement
|
||||||
TABLE OF CONTENTS
Part IItem 1. BusinessItem 1A. Risk FactorsItem 1B. Unresolved Staff CommentsItem 2. PropertiesItem 3. Legal ProceedingsItem 4. Mine Safety DisclosuresPart IIItem 5. Market For Registrant S Common Equity, Related Stockholder Matters and Issuer Purchases Of Equity SecuritiesItem 6. Selected Financial DataItem 7. Management S Discussion and Analysis Of Financial Condition and Results Of OperationsItem 7A. Quantitative and Qualitative Disclosures About Market RiskItem 8. Financial Statements and Supplementary DataItem 9. Changes in and Disagreements with Accountants on Accounting and Financial DisclosureItem 9A. Controls and ProceduresItem 9B. Other InformationPart IIIItem 10. Directors, Executive Officers and Corporate GovernanceItem 11. Executive CompensationItem 12. Security Ownership Of Certain Beneficial Owners and Management and Related Stockholder MattersItem 13. Certain Relationships and Related Transactions and Director IndependenceItem 14. Principal Accounting Fees and ServicesPart IVItem 15. Exhibits and Financial Statement SchedulesItem 16. Form 10-k Summary