SOLAREDGE TECHNOLOGIES, INC.
10-Ks and 10-Qs
|
|
|
|
|
|
|
|
|
|
|
|
|
|
|
|
|
|
|
|
|
|
|
|
|
|
|
|
|
UNITED STATES
SECURITIES AND EXCHANGE COMMISSION
WASHINGTON, D.C. 20549
FORM 10-K
|
|
☒ |
ANNUAL REPORT PURSUANT TO SECTION 13 OR 15(d) OF THE SECURITIES EXCHANGE ACT OF 1934
|
For the fiscal year ended December 31, 2017
OR
|
|
☐
|
TRANSITION REPORT PURSUANT TO SECTION 13 OR 15(d) OF THE SECURITIES EXCHANGE ACT OF 1934
|
For the transition period from _________ to __________
Commission File Number: 001-36894
SOLAREDGE TECHNOLOGIES, INC.
(Exact name of registrant as specified in its charter
)
|
Delaware
|
|
20-5338862
|
|
(State or other jurisdiction of
incorporation or organization)
|
|
(IRS Employer
Identification No.)
|
|
|
|
|
|
1 HaMada Street
|
|
|
|
Herziliya Pituach, Israel
|
|
4673335
|
|
(Address of Principal Executive Offices)
|
|
(Zip Code)
|
972 (9) 957-6620
Registrant’s telephone number, including area code
Securities registered pursuant to Section 12(b) of the Act:
|
Title of each class
|
|
Name of each exchange on which registered
|
|
Common stock, par value $0.0001 per share
|
|
NASDAQ (Global Select Market)
|
Securities registered pursuant to Section 12(g) of the Act: None
Indicate by check mark if the registrant is a well-known seasoned issuer, as defined in Rule 405 of the Securities Act.
Yes ☒ No ☐
Indicate by check mark if the registrant is not required to file reports pursuant to Section 13 or Section 15(d) of the Act.
Yes ☐ No ☒
Indicate by check mark whether the registrant: (1) has filed all reports required to be filed by Section 13 or 15(d) of the Securities Exchange Act of 1934 during the preceding 12 months (or for such shorter period that the registrant was required to file such reports), and (2) has been subject to such filing requirements for the past 90 days.
Yes
☒
No ☐
Indicate by check mark whether the registrant has submitted electronically and posted on its corporate Web site, if any, every Interactive Data File required to be submitted and posted pursuant to Rule 405 of Regulation S-T (§232.405 of this chapter) during the preceding 12 months (or for such shorter period that the registrant was required to submit and post such files).
Yes
☒
No ☐
Indicate by check mark if disclosure of delinquent filers pursuant to Item 405 of Regulation S-K (§229.405 of this chapter) is not contained herein, and will not be contained, to the best of registrant’s knowledge, in definitive proxy or information statements incorporated by reference in Part III of this Form 10-K or any amendment to this Form 10-K.
☒
Indicate by check mark whether the registrant is a large accelerated filer, an accelerated filer, a non-accelerated filer, or a smaller reporting company. See the definitions of “large accelerated filer,” “accelerated filer,” and “smaller reporting company” in Rule 12b-2 of the Exchange Act (check one):
|
☒
Large accelerated filer
|
|
☐ Accelerated filer
|
|
☐ Non-accelerated filer
(do not check if a
smaller reporting
company)
|
|
☐ Smaller reporting company
|
If an emerging growth company, indicate by check mark if the registrant has elected not to use the extended transition period for complying with any new or revised financial accounting standards provided pursuant to Section 13(a) of the Exchange Act. ☐
Indicate by check mark whether the registrant is a shell company (as defined in Rule 12b-2 of the Act).
Yes ☐ No ☒
The aggregate market value of the registrant’s voting and non-voting common stock held by non-affiliates of the registrant on June 30, 2017, the last business day of the registrant’s most recently completed second fiscal quarter was approximately $763,891,780 (assuming that the registrant’s only affiliates are its officers, directors and non-institutional 10% stockholders) based upon the closing market price on that date of $20.0 per share as reported on the Nasdaq Global Select Market.
As of February 11, 2018, there were 43,891,212 shares of the registrant’s common stock, par value of $0.0001 per share, outstanding.
DOCUMENTS INCORPORATED BY REFERENCE
The information required by Part III of this report, to the extent not set forth herein, is incorporated herein by reference from our definitive proxy statement relating to the Annual Meeting of Stockholders to be held in 2018, which definitive proxy statement shall be filed with the Securities and Exchange Commission within 120 days after the end of the annual period to which this report relates.
TABLE OF CONTENTS
Page
| PART I |
|
|
|
3
|
||
|
13
|
||
|
28
|
||
|
28
|
||
|
28
|
||
|
28
|
||
|
29
|
||
|
31
|
||
|
33
|
||
|
53
|
||
|
55
|
||
|
55
|
||
|
55
|
||
|
56
|
||
|
57
|
||
|
59
|
||
|
60
|
||
|
60
|
||
|
60
|
||
|
61
|
||
|
|
63
|
SPECIAL NOTE REGARDING FORWARD-LOOKING STATEMENTS
This Annual Report on Form 10-K and the documents incorporated herein by reference contain forward-looking statements that are based on our management’s expectations, estimates, projections, beliefs and assumptions and on information currently available to our management. The forward-looking statements are contained principally in “Item 1. Business,” “Item 1A. Risk Factors” “Item 7. Management’s Discussion and Analysis of Financial Condition and Results of Operations.” and “Item 7A. Quantitative and Qualitative Disclosures About Market Risk”. Forward-looking statements include information concerning our possible or assumed future results of operations, business strategies, technology developments, new product developments, financing and investment plans, dividend policy, competitive position, industry and regulatory environment, potential growth opportunities, and the effects of competition. Forward-looking statements include statements that are not historical facts and can be identified by terms such as “anticipate,” “believe,” “could,” “seek,” “estimate,” “expect,” “intend,” “may,” “plan,” “potential,” “predict,” “project,” “should,” “will,” “would,” or similar expressions and the negatives of those terms.
Forward-looking statements involve known and unknown risks, uncertainties and other factors that may cause our actual results, performance or achievements to be materially different from any future results, performance or achievements expressed or implied by the forward-looking statements. Given these uncertainties, you should not place undue reliance on forward-looking statements. Also, forward-looking statements represent our management’s beliefs and assumptions only as of the date of this filing. Important factors that could cause actual results to differ materially from our expectations include:
| · |
our limited history of profitability, which may not continue in the future;
|
| · |
our limited operating history, which makes it difficult to predict future results;
|
| · |
future demand for solar energy solutions;
|
| · |
changes to net metering policies or the reduction, elimination or expiration of government subsidies and economic incentives for on-grid solar energy applications;
|
| · |
changes in the U.S. trade environment, including the recent imposition of import tariffs;
|
| · |
federal, state, and local regulations governing the electric utility industry with respect to solar energy;
|
| · |
the retail price of electricity derived from the utility grid or alternative energy sources;
|
| · |
interest rates and supply of capital in the global financial markets in general and in the solar market specifically;
|
| · |
competition, including introductions of power optimizer, inverter and solar
photovoltaic (“
PV”) system monitoring products by our competitors;
|
| · |
developments in alternative technologies or improvements in distributed solar energy generation;
|
| · |
historic cyclicality of the solar industry and periodic downturns;
|
| · |
defects or performance problems in our products;
|
| · |
our ability to forecast demand for our products accurately and to match production with demand;
|
| · |
our dependence on ocean transportation to deliver our products in a cost-effective manner;
|
| · |
our dependence upon a small number of outside contract manufacturers;
|
| · |
capacity constraints, delivery schedules, manufacturing yields, and costs of our contract manufacturers and availability of components;
|
| · |
delays, disruptions, and quality control problems in manufacturing;
|
| · |
shortages, delays, price changes, or cessation of operations or production affecting our suppliers of key components;
|
1
| · |
business practices and regulatory compliance of our raw material suppliers;
|
| · |
performance of distributors and large installers in selling our products;
|
| · |
our customers’ financial stability, creditworthiness, and debt leverage ratio;
|
| · |
our ability to retain key personnel and attract additional qualified personnel;
|
| · |
our ability to effectively design, launch, market, and sell new generations of our products and services;
|
| · |
our ability to maintain our brand and to protect and defend our intellectual property;
|
| · |
our ability to retain, and events affecting, our major customers;
|
| · |
our ability to manage effectively the growth of our organization and expansion into new markets;
|
| · |
fluctuations in global currency exchange rates;
|
| · |
unrest, terrorism, or armed conflict in Israel;
|
| · |
general economic conditions in our domestic and international markets;
|
| · |
consolidation in the solar industry among our customers and distributors; and
|
| · |
other factors set forth under “Item 1A. Risk Factors.”
|
Except as required by law, we assume no obligation to update these forward-looking statements, or to update the reasons actual results could differ materially from those anticipated in these forward-looking statements, even if new information becomes available in the future.
2
Introduction
We have invented an intelligent inverter solution that has changed the way power is harvested and managed in a solar PV system. Our direct current (“DC”) optimized inverter system maximizes power generation at the individual PV module level while lowering the cost of energy produced by the solar PV system and providing comprehensive and advanced safety features. Our system consists of our power optimizers, inverters and cloud‑based monitoring platform and addresses a broad range of solar market segments, from residential solar installations to commercial and small utility‑scale solar installations. Since we began commercial shipments in 2010, we have shipped approximately 6.7 gigawatts (“GW”) of our DC optimized inverter systems and our products have been installed in solar PV systems in 121 countries.
Historically, the solar PV industry used traditional string and central inverter architectures to harvest PV solar power. However, traditional inverter architectures result in energy losses as well as systemic challenges in design flexibility, safety, and monitoring. More recently, microinverter technology was introduced in an attempt to resolve these challenges, but this technology has certain inherent limitations. We believe that our DC optimized inverter system, consisting of an inverter and distributed power optimizers, best addresses all of these challenges.
Our system allows for superior power harvesting and module management relative to traditional inverter systems by deploying power optimizers at each PV module while maintaining a competitive system cost by keeping the AC inversion and grid interaction centralized using a simplified DC‑AC inverter. The entire system is monitored through our cloud‑based monitoring platform that enables reduced system operation and maintenance (“O&M”) costs. Our system enables each PV module to operate at its own maximum power point (“MPP”), rather than a system‑wide average, enabling dynamic response to real‑world conditions, such as atmospheric conditions, PV module aging, soiling and shading and offering improved energy yield relative to traditional inverter systems. In addition to higher efficiency, our system’s installed cost per watt is competitive with traditional inverter systems of leading manufacturers and generally lower than comparable microinverter systems of leading manufacturers. Furthermore, our architecture allows for complex rooftop system designs and enhanced safety and reliability. Our technology and system architecture are protected by 121 awarded patents and 161 patent applications filed worldwide as of December 31, 2017.
We primarily sell our products indirectly to thousands of solar installers through large distributors and electrical equipment wholesalers and directly to large solar installers and engineering, procurement, and construction firms (“EPCs”). Our customers include leading providers of solar PV systems to residential and commercial end users, key solar distributors and electrical equipment wholesalers as well as several PV module manufacturers that offer PV modules with our power optimizer physically embedded into their modules.
We were founded in 2006 and began commercial shipments in 2010. As of December 31, 2017, we have shipped approximately 22.7 million power optimizers and 950,000 inverters. More than 560,000 installations, many of which may include multiple inverters, are currently connected to, and monitored through, our cloud‑based monitoring platform.
Limitations of Existing Technologies
A solar PV system consists of PV modules, which produce direct current (“DC”) power when exposed to sunlight; an inverter, which transforms the DC power into alternating current (“AC”) power that is required by the electricity grid; and associated cabling, fuse boxes and mounting hardware. Traditionally, solar PV systems connected strings of solar PV modules to one or more inverters for this energy conversion.
Traditional inverter architecture still constitutes the vast majority of the PV inverter market, especially for larger commercial and utility installations. However, traditional inverter architecture suffers from significant inefficiencies leading to suboptimal power generation. These challenges include:
| • |
Module mismatch.
Traditional inverter systems are unable to consistently produce maximum energy from PV modules. Each PV module in a system has a unique power production profile driven by differences in manufacturing and installation parameters. The architecture of traditional inverter systems does not allow each PV module to operate at its unique MPP. When PV modules are wired in series in a traditional inverter architecture, the entire string’s output is reduced, sometimes correlated directly to the output of the lowest‑performing PV module on the string. Output reduction can result from subtle variations in PV module composition, atmospheric conditions, soiling, individual PV module locations and orientations, or varying levels of PV module degradation over time.
|
3
| • |
Partial shading.
Many real‑world factors can cause a subset of the PV modules in a system to be partially shaded, which can significantly affect the power output of the entire string. For instance, electric wires, a chimney or even adjacent solar panels may cast a shadow during particular hours of the day, or debris may accumulate. This partial shading reduces the yield of a traditional solar PV system by decreasing, or in extreme cases eliminating, power output from the shaded modules. Overall losses to system production from such partial shading can range from small to substantial.
|
| • |
Dynamic maximum power point tracking loss.
The MPP of a PV module shifts constantly throughout the day as a result of atmospheric conditions. A traditional inverter system’s inability to coordinate output on a module‑by‑module basis makes it difficult for the system to respond dynamically to the shifting MPP. This inability to respond to the shifting MPP can reduce the potential power output of a traditional solar PV system by 3‑10%.
|
In addition to power losses, the traditional inverter architecture also has system design, installation and operational challenges, including:
| • |
Rooftop system design complexities.
A traditional inverter system requires each string to be of the same length, use the same type of PV modules and be positioned at the same angle toward the sun. Consequently, rooftop asymmetries and obstructions result in either wasted roof space or inefficient duplication of system components.
|
| • |
Safety hazards.
Traditional inverter systems cannot shut down the DC output voltage at the PV module level. The DC cables from these modules carry high voltages as long as the sun is shining, even when the traditional inverter or the grid connection has been shut down. This poses serious risks to installers, fire fighters and anyone else who performs work on or around the installation. Such safety hazards have recently prompted heightened safety installation and operation procedures and regulations in a growing number of geographies, compliance with which increases the cost of traditional PV systems.
|
| • |
No module level monitoring.
A traditional inverter system cannot track power output, temperature or any other attribute of a single PV module. Consequently, a system operator cannot perform remote diagnostics, track performance of PV system components or receive alerts about individual PV module status, and may be unaware of specific module‑level problems or breakdowns.
|
The first generation of module level power electronics (“MLPE”) was the microinverter. This technology scaled down the traditional inverter to a size and power appropriate to a single PV module. By creating control and monitoring at the module level, microinverters solved certain challenges of the traditional inverter system architecture. However, microinverter architecture has its own limitations, such as:
| • |
Higher initial cost per watt and limited economies of scale.
Microinverters perform all the functionality of the traditional inverter, but at each PV module, and consequently a microinverter system has a higher initial upfront cost of components relative to traditional inverter architecture. In addition, as every PV module must have its own microinverter, the cost per watt of a microinverter system does not decrease with scale. As such, microinverters are generally more expensive than traditional inverter systems on a cost per watt basis for residential installations and not economically viable relative to traditional inverter systems for large commercial and utility installations.
|
| • |
Grid Code Compliance.
With the growing penetration of solar energy, many utilities in individual U.S. states and Europe have adopted new sets of grid codes to preserve the stability of the electric grid. These grid codes require solar PV inverters to respond dynamically to variances in grid‑wide voltage, which typically requires inverter hardware and software to be reengineered. In most cases, adaptation to these new grid codes would require added costs and complexities, limiting the ability of microinverters to address some markets.
|
4
The SolarEdge Solution
Our DC optimized inverter system maximizes power generation at the individual PV module level while lowering the cost of energy produced by the solar PV system and providing comprehensive and advanced safety features. Our solution consists of our power optimizers, inverters and cloud‑based monitoring platform and addresses a broad range of solar market segments, from residential solar installations to commercial and small utility‑scale solar installations. Additional features and hardware that can be added to our solution includes a battery pack for storage of energy generated and a home energy automation system which enables greater savings for the system owner. We also recently announced the first inverter-integrated electric vehicle (EV) charger.
The key advantages of our solution include:
| • |
Maximized PV module power output.
Our power optimizers provide module‑level MPP tracking and real‑time adjustments of current and voltage to the optimal working point of each individual PV module. This enables each PV module to continuously produce its maximum power potential independent of other modules in the same string, thus minimizing module mismatch and partial shading losses. By performing these adjustments at a very high rate, our power optimizers also solve the dynamic MPP losses associated with traditional inverters. Independent testing from Photon Laboratories as well as tests performed by PV Evolution Labs according to the National Renewable Energy Laboratory shade test have confirmed that our technology provides power harvesting that is superior to traditional inverter systems.
|
| • |
Optimized architecture with economies of scale.
Our system shifts certain functions of the traditional inverter to our power optimizers while keeping the DC to AC function and grid interaction in our inverter. As a result, our inverter is smaller, more efficient, more reliable and less expensive than inverters used in traditional inverter systems. The cost savings that we have achieved on the inverter enable our system to be priced at a cost per watt that is comparable with traditional inverter systems of leading manufacturers. As a PV system grows in size, our inverter benefits from economies of scale, making our technology viable for large commercial and utility‑scale applications.
|
| • |
Enhanced system design flexibility.
Unlike a traditional inverter system that requires each string to be the same length, use the same type of PV modules and be positioned at the same angle toward the sun, our system allows significant design flexibility by enabling the installer to place PV modules in uneven string lengths and on multiple roof facets. This design flexibility:
|
| • |
increases the amount of the available roof that can be utilized for power production. Unlike traditional inverter systems, our system does not require each string to be the same length, use the same type of PV modules or be positioned at the same angle toward the sun. As a result, our system is significantly less prone to wasted roof space resulting from rooftop asymmetries and obstructions.
|
| • |
reduces the number of field change orders. For example, some installers use remote tools to estimate the size and configuration of an installation in connection with the customer acquisition process. This is especially common for high‑volume residential arrays, where an exhaustive survey of rooftop obstructions would be uneconomical. In some cases, installers discover that their preliminary design, based on remote tools, cannot be implemented due to unexpected shading or other obstructions. With traditional inverter system designs, an obstructed module may require a significant system redesign and a modification of the customer contract to take into account the changed system design. Our DC optimized inverter solution enables an installer to compensate or adjust for most obstructions without materially changing the original design or requiring a modification to the customer contract.
|
| • |
Reduced balance of system costs.
Our DC optimized inverter system allows significantly longer strings to be connected to the same inverter (as compared to a traditional inverter system). This minimizes the cost of cabling, fuse boxes and other ancillary electric components. These factors together result in easier installation with shorter design times and a lower initial cost per watt, while enabling larger installations per rooftop.
|
| • |
Continuous monitoring and control to reduce operation and maintenance costs.
Our cloud‑based monitoring platform provides full data visibility at the module level, string level, inverter level and system level. The data can be accessed remotely by any web‑enabled device, allowing comprehensive analysis, immediate fault detection and alerts. These monitoring features reduce O&M costs for the system owner by identifying and locating faults, enabling remote testing and reducing field visits.
|
| • |
Enhanced safety.
We have incorporated module‑level safety mechanisms in our system to protect installers, electricians and firefighters. Each power optimizer is configured to reduce output to 1 volt unless the power optimizer receives a fail‑safe signal from a functioning inverter. As a result, if the inverter is shut down (e.g., for system maintenance, due to malfunction, in the event of a fire or otherwise), the DC voltage throughout the system is reduced to a safe level. In recent years, new safety standards have been introduced in the U.S. and in Europe that require or encourage the installation of safety measures such as these. Our DC optimized inverters comply with the applicable safety requirements of the areas in which they are sold, providing incremental cost savings to installers by eliminating the need for additional hardware such as DC breakers, switches or fire‑proof ducts required by traditional inverter systems.
|
5
| • |
High reliability.
Solar PV systems are typically expected to operate for at least 25 years under harsh outdoor conditions. High reliability is critical and is facilitated by systems and components that have low heat generation, solid and stable materials, and an absence of moving parts. We have designed our system to meet these stringent requirements. Our power optimizers dissipate much less heat than microinverters because no DC‑AC inversion occurs at the module level. As a result, less heat is dissipated beneath the PV module, which improves lifetime expectancy and reliability of our power optimizers. Our power optimizers’ high switching frequency allows the use of ceramic capacitors with a low, fixed rate of aging and a proven life expectancy in excess of 25 years. Further, we use automotive‑grade application specific integrated circuits (“ASICs”) that embed many of the required electronics into the ASIC. This reduces the number of components and consequently the potential points of failure.
|
Our Products
Our basic solution consists of a DC power optimizer, an inverter and a cloud-based monitoring platform that operate as a single integrated system:
SolarEdge Power Optimizer.
Our DC power optimizer is a highly reliable and efficient DC‑to‑DC converter which is connected by installers to each PV module or embedded by PV module manufacturers into their modules as part of the manufacturing process. Our power optimizer increases energy output from the PV module to which it is connected by continuously tracking the MPP of each module and controlling its working point. The power optimizer’s ability to track the MPP of each PV module and its ability to increase or decrease its output voltage, enables the inverter’s input voltage to remain fixed under a large variety of string configurations. This feature enhances flexibility in PV system designs, enabling use of different string lengths in a single PV system connected to the same inverter, use of PV panels situated on multiple orientations connected to the same inverter and using varied PV module types in the same string. In addition, our power optimizers monitor the performance of each PV module and communicates this data to our inverter using our proprietary power line communication. In turn, the inverter transmits this information to our monitoring server. Each power optimizer is equipped with our proprietary safety mechanism which automatically reduces the output voltage of each power optimizer to 1V unless the power optimizer receives a fail‑safe signal from a functioning inverter. As a result, if the inverter is shut down (e.g., for system maintenance, due to malfunction, in the event of a fire or otherwise), the DC voltage throughout the system is reduced to a safe level.
Our power optimizers are designed to withstand high temperatures and harsh environmental conditions, and contain multiple bypass features that localize failures and enable continued system operation in the vast majority of cases of power optimizer failure. Our power optimizers are compatible with the vast majority of modules on the market today and carry a 25‑year product warranty. Our power optimizers are designed to be used with our inverters as well as third party inverters to provide power optimization. Monitoring and safety features can also be achieved with third party inverters by adding supplemental communications hardware. During fiscal 2015, 2016, the six months ended December 31, 2016, and the year ended December 31, 2017, revenues derived from the sale of power optimizers represented 48.8%, 50.0%, 48.0%, and 47.3% of total revenues, respectively.
SolarEdge Inverter.
Our DC‑to‑AC inverters contain sophisticated digital control technology with efficient power conversion architecture resulting in superior solar power harvesting and high reliability and are designed to work exclusively with our DC power optimizers. A proprietary power line communication receiver is integrated into each inverter, receiving data from our power optimizers, storing this data and transmitting it to our monitoring server when an internet connection exists. Since each string which is equipped with our power optimizers provides fixed input voltage to our inverter, the inverter is able to operate at its highest efficiency at all times and therefore is more cost‑efficient, energy efficient and reliable. Like our power optimizers, our inverters are designed to withstand harsh environmental conditions. Since the power rating of an inverter determines how many PV modules it can serve, larger installations require inverters with higher power ratings. We currently offer our second generation of inverters which come in two models: a one‑phase inverter designed to address the residential market (1 kilowatt (“kW”) to 11.4 kW) which includes our HD-Wave technology and our newly introduced inverter-integrated electric vehicle (EV) charger and a three‑phase inverter designed to address the residential market in certain European countries and the commercial market (4 kW to 100 kW). In June 2017, we introduced an extended commercial solution that consists of various inverters, sized 55kW, 82.5kW, and 100kW. These inverters are designed for commercial installations, reduce the number of required inverters and increase the system return on investment. The vast majority of our inverters are sold with a 12‑year warranty that is extendable to 20 or 25 years for an additional cost. During fiscal 2015, 2016, the six months ended December 31, 2016, and the year ended December 31, 2017, revenues derived from the sale of inverters represented 48.3%, 45.7%, 46.9%, and 47.9% of total revenues, respectively.
6
StorEdge® Solutions.
Our StorEdge solution is a DC coupled solution that is used to increase energy independence and maximize self-consumption for homeowners by utilizing a battery which is sold separately by third party manufacturers, to store and supply power as needed. The solution is based on a single inverter for both solar PV and storage. Our StorEdge solution is designed to provide smart energy functions such as maximizing self-consumption, Time-of-Use programming for desired hours of the day, and home energy backup solutions. To optimize self-consumption, the battery is charged and discharged to meet consumption needs and reduce the amount of power purchased from the grid. With a backup solution, unused solar PV power is stored in a battery and used during a power outage or when solar PV production is insufficient. When there is a power outage, a combination of solar PV power and battery is used to power important sources such as the refrigerator, communication devices, lighting, and AC outlets. Our proprietary monitoring platform provides visibility into battery status, solar PV production, and self-consumption, while offering easy maintenance with remote access to inverter and battery software. Existing SolarEdge systems can be upgraded to our StorEdge solution.
SolarEdge Monitoring Software.
Our cloud‑based monitoring platform collects power, voltage, current and system data sent from our inverters and power optimizers and allows users to view the data at the module level, string level, inverter level and system level from any browser or from most smart phones and tablets. The monitoring software continuously analyzes data and flags potential problems. The monitoring software includes features which are used on a routine basis by integrators, installers, maintenance staff, and system owners to improve a solar PV system’s performance by maximizing solar power harvesting and reducing O&M costs by increasing system up‑time and detecting PV module performance issues more effectively. Connection to the monitoring server is completed during installation by the installer. The installer then receives full access to system data through the monitoring software and can select the amount of data to be shared with the system owner.
Product Roadmap
Our products reflect the innovation focus and capabilities of our technology departments. Our product roadmap is divided into five categories: power optimizers, inverters, monitoring services, energy storage, and smart energy management.
Power Optimizers.
We currently sell our third generation power optimizer which was designed for fully automated assembly and which is based on our third generation ASIC. A key element of our reliability strategy, and a significant differentiator relative to our competitors, is our use of proprietary ASICs to control, among other things, our power optimizer’s power conversion, safety features, and PV module monitoring. Instead of using large numbers of discrete components, our power optimizer uses a single proprietary ASIC, thus reducing the total number of components in an electrical circuit and thereby improving reliability. In June 2017, we unveiled our fourth generation optimizer which uses fourth generation ASIC and incorporates a new safety mechanism for PV systems. In addition, we are also continuing to develop the necessary subsystems for the fifth generation ASIC which will be used in our fifth generation power optimizer. Each new ASIC generation reduces the number of components required and meaningfully improved the efficiency of the power optimizer. The efficiency improvement reduces the energy losses which in turn reduces the amount of heat dissipation. This enables design of a more cost-effective and usually smaller enclosure and also keeps the electronics cooler, thereby improving the power optimizer’s reliability.
Inverters.
Our inverter roadmap is intended to serve three purposes: (i) expand addressable market by developing new and larger inverters designed specifically for larger commercial installations and utility‑scale projects; (ii) improve the electronics to increase the total power throughput without changing the existing enclosure, thereby reducing the actual cost per watt and increasing economies of scale and (iii) improve ease of installation by integrating additional functionality required in certain installations in order to reduce costs of additional hardware and subcontractors’ labor costs. As part of our inverter roadmap, we plan to apply our HD-Wave technology to three-phase inverters and we are in the development process for doing so.
Monitoring Services.
Our cloud‑based monitoring platform is continuously growing by the amount of data aggregated. We are continuously developing tools to accommodate our growth and further enhance our service offering. Specifically, we plan to increase data compression in order to enable support for a rapidly increasing number of field systems while using low‑cost equipment. In addition, we plan to improve our reporting systems and enable users to obtain self‑generated customized reports. We also expect to expand algorithms that detect and pinpoint problems that can affect power production in field systems. We further plan to add more capabilities through our public application program interface to allow users to build and integrate our system into their own systems and to allow users to build and share useful applications based on monitoring data gathered by our software.
7
Energy Storage and Shifting.
SolarEdge is working to continue to expand its third-party battery compatibility for the residential market. For the commercial market, we plan to expand our StorEdge product offering to the commercial and industrial sector.
Smart Energy Management.
There are currently two separate energy technology industries that exist today, solar energy production and building automation technology. We believe that inverters will be taking on an expanded role in energy management and automation, and in conjunction with this assumption we are developing building automation products that can combine both of these industries. This line of products, when used with the SolarEdge solution, will be designed to allow system owners to increase self-consumption by shifting energy usage to match peak solar PV production as well as offer a convenient, wireless control option over various building and home devices. An example of this solution, would be using excess solar PV energy to heat water or the ability to remotely turn on or off certain power sources such as lighting or electrical appliances. The introduction of these products is dependent upon certification and region specific needs and as such, cannot yet be specified.
New Products or Product Categories
. We are evaluating opportunities to expand our product offerings and services to our customers. We may from time to time develop new products or services that are a natural extension of our existing business, or may engage in acquisitions of businesses or product lines with the potential to strengthen our market position, enable us to enter attractive markets, expand our technological capabilities, or provide synergy opportunities.
Sales and Marketing Strategy
Since commencing sales activities in early 2010, our strategy has been to focus on markets where electricity prices, irradiance and government policies make solar PV installations economically viable. Today, our products have been installed in over 120 countries, including the U.S., Canada, Germany, Italy, the Netherlands, the United Kingdom, Israel, Australia Japan, Singapore, India, Taiwan, South Africa, Belgium, France, and China.
We target our sales and marketing efforts to the largest distributors, electrical equipment wholesalers, EPC contractors and installers in each of the countries where we operate. In the U.S., Germany, Italy, the United Kingdom, and Australia, our products are carried and actively sold by most of the top solar PV distributors as well as the largest electrical distribution companies that are active in solar PV. We anticipate that an increasing percentage of solar PV equipment sales will also occur through electrical equipment wholesalers who sell to a broad range of electrical contractors, and we are focused on cultivating these global relationships. As of December 31, 2017, according to the data available on our monitoring portal, approximately 17,200 installers around the world have installed SolarEdge solar PV systems. We also sell our power optimizers to several PV module manufacturers that offer PV modules with our power optimizer physically embedded into their modules.
Additionally, we have a number of programs focused on educating installers and other industry professionals about our technology, and we use a combination of road shows, webinars, and partner trainings to show them how best to design, sell, and implement our technology in their projects.
Our Customers
We derive a significant portion of our revenues from key solar distributors, electrical equipment wholesalers and large installers in the U.S. and worldwide. In fiscal 2017 three of our customers represented 29.9 % of our revenues. Out of these three customers, Consolidated Electrical Distributors Inc. (CED), a leading electric-equipment wholesaler in the U.S., was our largest customer and accounted for 14.8% of our revenues. None of our other customers accounted for more than ten percent of our revenues in fiscal 2017.
Training and Customer Support
We offer our installer base a comprehensive package of customer support and training services which include pre‑sales support, ongoing trainings, and technical support before, during, and after installation. We also provide customized support programs to PV module manufacturers, large installers and distributors to help prioritize and track support issues, thereby enabling short cycle times for issue resolution. In 2017, we conducted approximately 160 training events in 17 countries, with an aggregate of approximately 4,100 attendees.
We offer a wide variety of training, including hands‑on and on‑demand video sessions and online product and training materials. We support our commercial system customers with design consulting throughout their sales process and installation. Our technical support organization includes local expert teams, call centers in the USA, Germany, Australia, Netherlands, Italy, the United Kingdom and Israel, and an online service portal. Our toll‑free call centers are open Monday through Friday from 9:00 a.m. to 8:00 p.m. in every region in which we sell our products. In addition, customers can open and track support cases 24/7 utilizing our online portal. All support cases are monitored via a customer relationship management system in order to ensure service, track closure of all customer issues and further improve our customer service. Our call centers have access to our cloud‑based monitoring platform database, which enables real‑time remote diagnostics.
8
Customer service and satisfaction has been a key component of our business and we expect it to continue to be integral to our success in the future. We maintain high levels of customer engagement through our call centers in California, Germany, and Israel. In addition to our call centers, we have field service engineers located in the geographies where we are active, and support our customers with commissioning of large projects, introduction of new technologies and features and on‑the‑job training of new installers. As of December 31, 2017, our customer support and training organization consisted of 184 employees worldwide.
Our Technology
We have drawn on our expertise in the fields of power electronics, magnetic design, mechanical and heat dissipation capabilities, control loops and algorithms and power line communications to design and develop what we believe to be the most advanced commercial solutions for harvesting power from solar PV systems. Our advanced technologies are explained in more detail below.
Power optimizers
Our power optimizers are DC/DC step up/step down (buck‑boost) converters designed and developed to operate in harsh outdoor environments at very high conversion efficiency. Our power optimizers include proprietary power electronics customized to efficiently convert power from the PV module to the inverter. The conversion topology and components are all designed for the power optimizer specifications and verified for consistent performance and reliability in numerous lab tests and simulations.
A key factor in the performance of our power optimizer is determined by the digital control algorithms and closed‑loop mechanism. The power optimizer’s control is built into our advanced ASIC which is responsible for all critical digital control functions of the power optimizer, including detailed power analysis, digital control of the power conversion subsystem and power line communications and networking. Since each power optimizer handles the power and voltage of a single module, we are able to reach a high degree of semiconductor integration by leveraging low cost silicon in standard semiconductor packages. As a result, much of the functionality of our power optimizer can be integrated into a standard ASIC instead of discrete electronic components, resulting in lower costs and higher reliability.
The ASIC performs the critical power analysis and power conversion control functions of the power optimizer. The power analysis function processes the status and working parameters at the power optimizer’s input and output and together with advanced digital control and state machine logic, controls the power conversion function. In addition, our digital control system uses technology that allows the solar PV installation to anticipate and adapt to changing operating conditions and protect against system anomalies.
Each power optimizer in the array is connected to the inverter by a power line communications networking link. Our power line communications link uses a proprietary networking technology that we developed utilizing the existing DC wiring between the power optimizers and the inverter to transmit and receive data between these devices.
Inverters
Our inverter is designed for single‑stage DC/AC conversion. Using our inverter in combination with the power optimizers will allow the control loop to maintain a fixed DC voltage level at its input thereby allowing for longer, uneven, and multi‑faceted strings while also enabling custom, cost–efficient, and reliable inverter design and component selection. All of the power components, as well as the main magnetic components for our inverters, can then be optimized for DC/AC inversion at high efficiency.
The digital control algorithms of our inverters are implemented using programmable digital signal processors which allow for flexibility and adaptation of control loops for various grids and for the requirements and standards of various grid operators across geographies. We have already implemented the control mechanisms necessary to support advanced grid codes and standards that are required to support high penetration of solar energy into the grid.
9
Manufacturing
We have designed our manufacturing processes to produce high quality products at competitive costs. The strategy is threefold: outsource, automate, and localize. We have outsourcing agreements with three of the world’s leading global electronics manufacturing service providers, Jabil Circuit, Inc., Celestica LLC and Flextronics Industrial Ltd. By using these contract manufacturers rather than building our own manufacturing infrastructure, we are able to access advanced manufacturing equipment, processes, skills and capacity on a “capital light” budget. Our contract manufacturers are responsible for funding the capital expenses incurred in connection with the manufacture of our products, except with regard to end-of-line testing equipment and other specific manufacturing equipment utilized in assembling our products or sub-components which are financed and owned by the company. We expect to continue this funding arrangement in the future, with respect to any expansions to such existing lines. Further, contracting with global providers such as Jabil, Celestica and Flextronics gives us added flexibility to manufacture certain products in China, closer to target markets in Asia and the North American west coast as well as other products in Romania and Hungary, closer to target markets in Europe and the North American east coast, potentially increasing responsiveness to customers while reducing costs and delivery times. In July 2017, we executed a long term lease agreement for 10,000 square meters in Israel, intended for the establishment of a manufacturing facility for the production of product prototypes, manufacturing and the development of proprietary manufacturing and testing equipment. The facility is under development.
We have developed propriety automated assembly lines for the manufacturing of our power optimizers. These assembly lines, currently operating in all of our manufacturing facilities enable the manufacturing of more than 4,000 optimizers per machine per day. We invest resources in additional automated assembly lines as well as in automated machinery for subassembly of certain components used in our products, and we own and are responsible for funding all of the capital expenses related thereto. The current and expected capital expenses associated with these automated assembly lines and other machinery are not significant and will be funded out of our cash flows. In addition, we are in the process of designing an automatic assembly line for the production of embedded optimizers.
We source our raw materials through various component manufacturers and invest resources in continued cost-reduction efforts as well as verifying second and third sources so as to limit dependence on sole suppliers.
Reliability and Quality Control
Our power optimizers are either connected to each PV module by installers, or embedded in each PV module by PV module manufacturers. Our power optimizers are designed to be as reliable as the PV module itself and capable of withstanding the same operating and environmental conditions.
Our reliability methodology includes a multi‑level plan with design analysis, sub‑system testing of critical components by Accelerated Life Testing, and integrative testing of design prototypes by Highly Accelerated Life Testing and large sample groups. As part of our reliability efforts, we subject components to industry standard conditions and tests including in accelerated life chambers that simulate burn‑in, thermal cycling, damp‑heat, and other stresses. We also conduct out of box audits (OBA) on our finished products, on-line reliability tests (ORT) are conducted on our inverters and we test complete products in stress tests and in the field. Our rigorous testing processes have helped us to develop highly reliable products.
In order to verify the quality of each of our products when it leaves the manufacturing plant, each component, sub‑assembly, and final product are tested multiple times during production. These tests include Automatic Optical Inspection, In‑Circuit Testing, Board‑ Functional Testing, Safety Testing, and Integrative Stress Testing. We employ a serial number‑driven manufacturing process auditing and traceability system that allows us to control production line activities, verify correct manufacturing processes and to achieve item‑specific traceability.
As a part of our quality and reliability approach, failed products from the field are returned and subjected to root cause analysis, the results of which are used to improve our product and manufacturing processes and design and further reduce our field failure rate.
Certifications
Our products and systems comply with the applicable regulatory requirements of the jurisdictions in which they are sold as well as all other major markets around the world. These include safety regulations, electromagnetic compatibility standards and grid compliance.
Research and Development
We devote substantial resources to research and development with the objective of developing new products and systems, adding new features to existing products and systems and reducing unit costs of our products and systems. Our development strategy is to identify features, products, and systems for both software and hardware that reduce the cost and improve the effectiveness of our solutions for our customers. We measure the effectiveness of our research and development by metrics including product unit cost, efficiency, reliability, power output, and ease of use.
10
We have a strong research and development team with wide‑ranging experience in power electronics, semiconductors, power line communications and networking, and software engineering. In addition, many members of our team have expertise in solar technologies. As of December 31, 2017, our research and development organization had a headcount of 367 employees. Our research and development expense, net totaled $22.0 million, $33.2 million, $20.3 million, and $55.0 million for fiscal 2015, 2016, the six months ended December 31, 2016, and the year ended December 31, 2017, respectively.
Intellectual Property
The success of our business depends, in part, on our ability to maintain and protect our proprietary technologies, information, processes, and know‑how. We rely primarily on patent, trademark, copyright and trade secrets laws in the U.S. and similar laws in other countries, confidentiality agreements and procedures and other contractual arrangements to protect our technology. As of December 31, 2017, we had 84 issued U.S. patents, 37 issued non‑U.S. patents, 83 patent applications pending for examination in the U.S., and 78 patent applications pending for examination in other countries, all of which are related to U.S. applications. A majority of our patents relate to DC power optimization and DC to AC conversion for alternative energy power systems, power system monitoring and control, and management systems. Our issued patents are scheduled to expire between 2024 and 2035. We continually assess opportunities to seek patent protection for those aspects of our technology, designs, and methodologies and processes that we believe provide significant competitive advantages.
We rely on trade secret protection and confidentiality agreements to safeguard our interests with respect to proprietary know‑how that is not patentable and processes for which patents are difficult to enforce. We believe that many elements of our manufacturing processes involve proprietary know‑how, technology, or data that are not covered by patents or patent applications, including technical processes, test equipment designs, algorithms, and procedures.
All of our research and development personnel are required to enter into confidentiality and proprietary information agreements with us. These agreements address intellectual property protection issues and require our employees to assign to us all of the inventions, designs, and technologies they develop during the course of employment with us.
Our customers and business partners are required to enter into confidentiality agreements before we disclose any sensitive aspects of our technology or business plans.
Competition
The markets for our products are competitive, and we compete with manufacturers of traditional inverters and manufacturers of other MLPE. The principal areas in which we compete with other companies include:
| • |
product and system performance and features;
|
| • |
total cost of ownership;
|
| • |
PV module compatibility and interoperability;
|
| • |
reliability and duration of product warranty;
|
| • |
customer service and support;
|
| • |
breadth of product line;
|
| • |
local sales and distribution capabilities;
|
| • |
compliance with applicable certifications and grid codes;
|
| • |
size and financial stability of operations; and
|
| • |
size of installed base.
|
Our DC optimized inverter system competes principally with products from traditional inverter manufacturers, such as SMA Solar Technology AG, ABB Ltd. and Huawei Technologies Co. Ltd. as well as from other new Chinese inverter manufacturers. In the North American residential market, we compete with traditional inverter manufacturers, as well as microinverter manufacturers such as Enphase Energy, Inc. In addition, several new entrants to the MLPE market, including low‑cost Asian manufacturers, have recently announced plans to ship or have already shipped similar products. We believe that our DC optimized inverter system offers significant technology and cost advantages that reflect a competitive differentiation over traditional inverter systems and microinverter technologies.
11
Government Incentives
U.S. federal, state, and local government bodies, as well as non-U.S. government bodies, provide incentives to owners, end users, distributors, and manufacturers of solar PV systems to promote solar electricity in the form of rebates, tax credits, and other financial incentives such as system performance payments, payments for renewable energy credits associated with renewable energy generation, and exclusion of solar PV systems from property tax assessments. The market for on‑grid applications, where solar power is used to supplement a customer’s electricity purchased from the utility network or sold to a utility under tariff, often depends in large part on the availability and size of these government subsidies and economic incentives, which vary by geographic market and from time to time. In general, the amount and availability of these incentives and subsidies to encourage the development of solar PV energy have been declining and are expected to continue to decline.
Import Tariffs
On January 22, 2018, a tariff was adopted in the U.S. on imported solar modules and cells, approving, with limited changes, the recommendation of the U.S. International Trade Commission that was announced on October 31, 2017. An initial 30% tariff was imposed on all imported solar modules and cells, with a gradual reduction over four years to 15%. These tariffs do not apply directly to our products. It is uncertain what effect, if any, these tariffs may have on the price of solar systems in the United States. If the price of solar systems in the U.S. increases, it would likely reduce the number of solar systems manufactured and sold, which in turn may decrease demand for our products.
Seasonality
The solar energy market is subject to seasonal and quarterly fluctuations affected by weather. For example, during the winter months in Europe and the northeastern U.S. where the climate is particularly cold and snowy, it is typical to see a decline in PV installations and this decline can impact the timing of orders for our products.
Employees
As of December 31, 2017, we had 1,007 full‑time employees. Of these full‑time employees, 367 were engaged in research and development, 210 in sales and marketing, 348 in operations and support, and 82 in general and administrative capacities. Of our employees, 606 were based in Israel, 143 were based in the U.S., 83 were based in China, 49 were based in Germany, and an additional 126 were based elsewhere.
None of our employees are represented by a labor union. We have not experienced any employment-related work stoppages, and we consider relations with our employees to be good.
Corporate Information
We were incorporated in Delaware in 2006. Our principal executive offices are located at 1 HaMada Street, Herziliya Pituach 4673335, Israel and our telephone number at this address is 972 (9) 957-6620. Our website is
www.solaredge.com
.
We file annual, quarterly and current reports, proxy statements and other documents with the Securities and Exchange Commission (the “SEC”), pursuant to the Securities Exchange Act of 1934 (the “Exchange Act”). You may read and copy any materials that we file with the SEC at the SEC’s Public Reference Room at 100 F Street N.E., Washington, D.C. 20549. You may obtain information on the operation of the Public Reference Room by calling the SEC at 1-800-732-0330. Our reports, proxy statements and other documents filed electronically with the SEC are available at the website maintained by the SEC at
www.sec.gov
.
We also make available, free of charge on the Investor Relations portion of our website at
www.solaredge.com
, our annual, quarterly, and current reports, and, if applicable, amendments to those reports, filed or furnished pursuant to Section 13(a) or 15(d) of the Exchange Act as soon as reasonably practicable after we electronically file such reports with, or furnish them to, the SEC. We also make available on the Investor Relations portion of our website at
www.solaredge.com
our earnings presentation and other important information, which we encourage you to review.
12
Risk factors which could cause actual results to differ from our expectations and which could negatively impact our financial condition and results of operations are discussed below and elsewhere in this Annual Report. The risks and uncertainties described below are not the only ones we face. If any of the risks or uncertainties described below or any additional risks and uncertainties actually occur, our business, results of operations and financial condition could be materially and adversely affected. In particular, forward-looking statements are inherently subject to risks and uncertainties, some of which cannot be predicted or quantified. See “Special Note Regarding Forward-Looking Statements.”
Risks Related to Our Business and Our Industry
We cannot be certain that we will sustain our current level of profitability in the future.
We achieved a net profit of $21.1 million, $76.6 million, $25.4 million, and $84.2 million in fiscal 2015, 2016, the six months ended December 31, 2016, and the year ended December 31, 2017, respectively. Our revenue growth may slow or revenue may decline for a number of possible reasons, many of which are outside our control, including a decline in demand for our products, increased competition, a decrease in the growth of the solar industry or our market share, or our failure to continue to capitalize on growth opportunities. If we fail to maintain sufficient revenue to support our operations, we may not be able to sustain profitability.
In addition, we expect to incur additional costs and expenses related to the continued development and expansion of our business, including in connection with marketing and developing our products, development of our own manufacturing facilities, expanding into new product markets and geographies, maintaining and enhancing our research and development operations and hiring additional personnel. We do not know whether our revenues will grow rapidly enough to absorb these costs, and our limited operating history makes it difficult to assess the extent of these expenses or their impact on our results of operations.
The rapidly evolving and competitive nature of our industry makes it difficult to evaluate our future prospects.
Our first full fiscal year of commercial shipments was 2011, and much of our growth has occurred in recent periods. This operating history, combined with the rapidly evolving and competitive nature of our industry, makes it difficult to evaluate our current business and future prospects. In addition, we have limited insight into emerging trends that may adversely affect our business, financial condition, results of operations and prospects. We have encountered and will continue to encounter risks and difficulties frequently experienced by growing companies in rapidly changing industries, including unpredictable and volatile revenues and increased expenses as we continue to grow our business. The viability and demand for solar energy solutions, and in turn, our products, may be affected by many factors outside of our control, including:
|
|
•
|
cost competitiveness, reliability and performance of solar PV systems compared to conventional and non-solar renewable energy sources and products;
|
|
|
•
|
availability and amount of government subsidies and incentives to support the development and deployment of solar energy solutions;
|
|
|
•
|
the extent to which the electric power industry and broader energy industries are deregulated to permit broader adoption of solar electricity generation;
|
|
|
•
|
prices of traditional carbon-based energy sources;
|
|
|
•
|
levels of investment by end-users of solar energy products, which tend to decrease when economic growth slows; and
|
|
|
•
|
the emergence, continuance or success of, or increased government support for, other alternative energy generation technologies and products.
|
If we do not manage these risks and overcome these difficulties successfully, our business and results of operations will suffer.
13
If demand for solar energy solutions does not continue to grow or grows at a slower rate than we anticipate, our business and results of operations will suffer.
Our solution is utilized in solar PV installations. As a result, our future success depends on continued demand for solar energy solutions and the ability of solar equipment vendors to meet this demand. The solar industry is an evolving industry that has experienced substantial changes in recent years, and we cannot be certain that consumers and businesses, with respect to distributed solar solutions, or utilities, with respect to utility-scale solar projects, will adopt solar PV systems as an alternative energy source at levels sufficient to grow our business. If demand for solar energy solutions fails to develop sufficiently, demand for our products will decrease, which would have an adverse impact on our ability to increase our revenue and grow our business.
The reduction, elimination or expiration of government subsidies and economic incentives for on-grid solar electricity applications could reduce demand for solar PV systems and harm our business.
Federal, state, local and foreign government bodies provide incentives to owners, end users, distributors, system integrators and manufacturers of solar PV systems to promote solar electricity in the form of rebates, tax credits and other financial incentives such as system performance payments, payments of renewable energy credits associated with renewable energy generation and exclusion of solar PV systems from property tax assessments. The market for on-grid applications, where solar power is used to supplement a customer’s electricity purchased from the utility network or sold to a utility under tariff, often depends in large part on the availability and size of government and economic incentives that vary by geographic market. Because our customers’ sales are typically into the on-grid market, the reduction, elimination or expiration of government subsidies and economic incentives for on-grid solar electricity may negatively affect the competitiveness of solar electricity relative to conventional and non-solar renewable sources of electricity, and could harm or halt the growth of the solar electricity industry and our business. For example, in August 2015, the United Kingdom’s Department of Energy and Climate Change (DECC) launched a consultation on the future of the Feed-in Tariffs (FITs) scheme, the consultation reduced the levels of FIT effective February 2016. Under the new FIT scheme UK solar installations have significantly dropped. These subsidies and incentives may expire on a particular date, end when the allocated funding is exhausted or be reduced or terminated as solar energy adoption rates increase or as a result of legal challenges, the adoption of new statutes or regulations or the passage of time. These reductions or terminations often occur without warning.
In addition, several jurisdictions have adopted renewable portfolio standards, which mandate that a certain portion of electricity delivered by utilities to customers come from a set of eligible renewable energy resources by a certain compliance date. Some programs further specify that a portion of the renewable energy quota must be from solar electricity. Under some programs, a utility can receive a “credit” for renewable energy produced by a third party by either purchasing the electricity directly from the producer or paying a fee to obtain the right to renewable energy generated but used by the generator or sold to another party. A renewable energy credit allows the utility to add this electricity to its renewable portfolio requirement total without actually expending the capital for generating facilities. However, there can be no assurances that such policies will continue. For example, in December 2015, Nevada's Public Utilities Commission increased the fixed service charge for net-metered solar customers and lowered compensation for net excess solar generation. Proposals to extend compliance deadlines, reduce targets or repeal standards have also been introduced in a number of states. Reduction or elimination of renewable portfolio standards or successful efforts to meet current standards could harm or halt the growth of the solar PV industry and our business.
Changes in the U.S. trade environment, including the recent imposition of import tariffs, could adversely affect the amount or timing of our revenues, results of operations or cash flows.
On January 22, 2018, a tariff on imported solar modules and cells was adopted in the United States. The approved taxation imposes an initial 30% tariff on all imported solar modules and cells, with a gradual reduction over four years to 15%. These tariffs do not apply directly to our products. However, these tariffs have created uncertainty in the industry concerning whether they will cause a material increase in the price of solar systems in the U.S. If the price of solar systems in the U.S. increases, the use of solar would become less economically feasible and would likely reduce the number of solar systems manufactured and sold, which in turn may decrease demand for our products. Such outcomes could adversely affect the amount or timing of our revenues, of operations or cash flows, and continuing uncertainty could cause sales volatility, price fluctuations or supply shortages or cause our customers to advance or delay their purchase of our products.
14
Changes to net metering policies may significantly reduce demand for electricity from solar PV systems and harm our business.
Our business benefits from favorable net metering policies in several U.S. states, Canadian provinces, and European countries in which our customers operate. Net metering allows a solar PV system owner to pay his or her local electric utility only for power usage net of production from the solar PV system, transforming the conventional relationship between customers and traditional utilities. System owners receive credit for the energy that the solar installation generates to offset energy usage at times when the solar installation is not generating energy. Under a net metering program, the customer typically pays for the net energy used or receives a credit against future bills at the retail rate if more energy is produced than consumed. In some locations, customers are also reimbursed by the electric utility for net excess generation on a periodic basis.
Most U.S. states have adopted some form of net metering. However, net metering programs have recently come under regulatory scrutiny in some U.S. states due to challenges alleging that net metering policies inequitably shift costs onto non-solar ratepayers by allowing solar ratepayers to sell electricity at rates that are too high for utilities to recoup their fixed costs. We cannot assure you that the programs will not be significantly modified going forward.
If the value of the credit that customers receive for net metering is significantly reduced, end-users may be unable to recognize the same level of cost savings associated with net metering that current end-users enjoy. The absence of favorable net metering policies or of net metering entirely, or the imposition of new charges that only or disproportionately affect end-users that use net metering would significantly limit demand for solar PV systems that are sold by our customers and could have a material adverse effect on our business, financial condition, results of operations and future growth.
Existing electric utility industry regulations, and changes to regulations, may present technical, regulatory, and economic barriers to the purchase and use of solar PV systems that may significantly reduce demand for our products or harm our ability to compete.
Federal, state, local and foreign government regulations and policies concerning the electric utility industry, and internal policies and regulations promulgated by electric utilities, heavily influence the market for electricity generation products and services. These regulations and policies often relate to electricity pricing and the interconnection of customer-owned electricity generation, and governments and utilities continuously modify these regulations and policies. These regulations and policies could deter purchases of renewable energy products, including solar PV systems sold by our customers. This could result in a significant reduction in the potential demand for our products. For example, utilities commonly charge fees to larger, industrial customers for disconnecting from the electric grid or for having the capacity to use power from the electric grid for back-up purposes. These fees could increase the cost to use solar PV systems sold by our customers and make them less desirable, thereby harming our business, prospects, financial condition and results of operations. In addition, depending on the region, electricity generated by solar PV systems competes most effectively with expensive peak-hour electricity from the electric grid, rather than the less expensive average price of electricity. Modifications to the utilities’ peak hour pricing policies or rate design, such as to a flat rate, could require the price of solar PV systems and their component parts to be lower in order to compete with the price of electricity from the electric grid.
Changes in current laws or regulations applicable to us or the imposition of new laws and regulations in the U.S., Europe, or other jurisdictions in which we do business could have a material adverse effect on our business, financial condition and results of operations. Any changes to government or internal utility regulations and policies that favor electric utilities could reduce the competitiveness of solar PV systems sold by our customers and cause a significant reduction in demand for our products and services. For example, regulators in certain U.S. states have been asked to consider proposals to assess fees on consumers purchasing energy from solar PV systems or imposing a new charge that would disproportionately impact solar PV system owners who utilize net metering, either of which would increase the cost of solar PV energy to those consumers and could reduce demand for our products. Any similar government or utility policies adopted in the future that discourage the growth of solar PV systems could reduce demand for our products and services and adversely impact our growth. In addition, changes in our products or changes in export and import laws and implementing regulations may create delays in the introduction of new products in international markets, prevent our customers from deploying our products internationally or, in some cases, prevent the export or import of our products to certain countries altogether. Any such event could have a material adverse effect on our business, financial condition, and results of operations.
A drop in the retail price of electricity derived from the utility grid or from alternative energy sources may harm our business, financial condition, results of operations, and prospects.
Decreases in the retail prices of electricity from the utility grid would make the purchase of solar PV systems less economically attractive and would likely lower sales of our products. The price of electricity derived from the utility grid could decrease as a result of:
•
construction of a significant number of new power generation plants, including plants utilizing natural gas, nuclear, coal, renewable energy, or other generation technologies;
15
•
relief of transmission constraints that enable local centers to generate energy less expensively;
•
reductions in the price of natural gas;
•
utility rate adjustment and customer class cost reallocation;
•
energy conservation technologies and public initiatives to reduce electricity consumption;
•
development of smart-grid technologies that lower the peak energy requirements of a utility generation facility;
| • |
development of new or lower-cost energy storage technologies that have the ability to reduce a customer’s averagecost of electricity by shifting load to off-peak times; and
|
•
development of new energy generation technologies that provide less expensive energy.
Moreover, technological developments in the solar components industry could allow our competitors and their customers to offer electricity at costs lower than those that can be achieved by us and our customers, which could result in reduced demand for our products.
If the cost of electricity generated by solar PV installations incorporating our systems is high relative to the cost of electricity from other sources, our business, financial condition, and results of operations may be harmed.
An increase in interest rates or tightening of the supply of capital in the global financial markets could make it difficult for end-users to finance the cost of a solar PV system and could reduce the demand for solar systems and thus demand for our products.
Many end-users depend on financing to fund the initial capital expenditure required to develop, build, or purchase a solar PV system. As a result, an increase in interest rates or a reduction in the supply of project debt financing or tax equity investments, could reduce the number of solar projects that receive financing or otherwise make it difficult for our customers or their customers, the end-users, to secure the financing necessary to develop, build, purchase, or install a solar PV system on favorable terms, or at all, and thus lower demand for our products which could limit our growth or reduce our net sales. In addition, we believe that a significant percentage of end-users install solar PV systems as an investment, funding the initial capital expenditure through financing. An increase in interest rates could lower such end-user’s return on investment on a solar PV system, increase equity return requirements or make alternative investments more attractive relative to solar PV systems, and, in each case, could cause such end-users to seek alternative investments.
The market for our products is highly competitive and we expect to face increased competition as new and existing competitors introduce power optimizer, inverter, and solar PV system monitoring products, which could negatively affect our results of operations and market share.
The market for solar PV solutions is highly competitive. We principally compete with traditional inverter manufacturers as well as microinverter manufacturers. Currently, our DC optimized inverter system competes with products from traditional inverter manufacturers, and microinverter manufacturers, as well as emerging technology companies offering alternative MLPE products. Several new entrants to the inverter and MLPE market including low-cost Asian manufacturers, have recently announced plans to ship or have already shipped products in markets in which we sell our products, including most recently, with respect to sales in Australia and in Europe. We expect competition to intensify as new and existing competitors enter the market.
Several of our existing and potential competitors are significantly larger, have greater financial, marketing, distribution, customer support, and other resources, are longer established, and have better brand recognition. Further, certain competitors may be able to develop new products more quickly than us, may partner with other competitors to provide combined technologies and competing solutions and may be able to develop products that are more reliable or that provide more functionality than ours. In addition, some of our competitors have the financial resources to offer competitive products at aggressive or below-market pricing levels, which could cause us to lose sales or market share or require us to lower prices for our products in order to compete effectively. If we have to reduce our prices by more than we anticipated, or if we are unable to offset any future reductions in our average selling prices by increasing our sales volume, reducing our costs and expenses or introducing new products, our revenues and gross profit would suffer.
16
Developments in alternative technologies or improvements in distributed solar energy generation may have a material adverse effect on demand for our offerings.
Significant developments in alternative technologies, such as advances in other forms of distributed solar PV power generation, storage solutions, such as batteries, the widespread use or adoption of fuel cells for residential or commercial properties or improvements in other forms of centralized power production, may have a material adverse effect on our business and prospects. Any failure by us to adopt new or enhanced technologies or processes, or to react to changes in existing technologies, could result in product obsolescence, the loss of competitiveness of our products, decreased revenue and a loss of market share to competitors.
Our industry has historically been cyclical and experienced periodic downturns.
Our future success partly depends on continued demand for solar PV systems in the end-markets we serve, including the residential and commercial sectors in the United States and Europe. The solar industry has historically been cyclical and has experienced periodic downturns which may affect the demand for equipment that we manufacture. The solar industry has undergone challenging business conditions in recent years, including downward pricing pressure for PV modules, mainly as a result of overproduction, and reductions in applicable governmental subsidies, contributing to demand decreases. Although the solar industry is experiencing a slow recovery, there is no assurance that the solar industry will not suffer significant downturns in the future, which will adversely affect demand for our solar products and our results of operations.
Defects or performance problems in our products could result in loss of customers, reputational damage, and decreased revenue, and we may face warranty, indemnity, and product liability claims arising from defective products.
Although our products meet our stringent quality requirements, they may contain undetected errors or defects, especially when first introduced or when new generations are released. Errors, defects, or poor performance can arise due to design flaws, defects in raw materials or components or manufacturing difficulties, which can affect both the quality and the yield of the product. Any actual or perceived errors, defects, or poor performance in our products could result in the replacement or recall of our products, shipment delays, rejection of our products, damage to our reputation, lost revenue, diversion of our engineering personnel from our product development efforts, and increases in customer service and support costs, all of which could have a material adverse effect on our business, financial condition, and results of operations.
Furthermore, defective components may give rise to warranty, indemnity, or product liability claims against us that exceed any revenue or profit we receive from the affected products. We offer a minimum 12-year limited warranty for our inverters and a 25-year limited warranty for our power optimizers. Our limited warranties cover defects in materials and workmanship of our products under normal use and service conditions. As a result, we bear the risk of warranty claims long after we have sold products and recognized revenue. While we do have accrued reserves for warranty claims, our estimated warranty costs for previously sold products may change to the extent future products are not compatible with earlier generation products under warranty. Our warranty accruals are based on our assumptions and we do not have a long history of making such assumptions. As a result, these assumptions could prove to be materially different from the actual performance of our systems, causing us to incur substantial unanticipated expense to repair or replace defective products in the future or to compensate customers for defective products. Our failure to accurately predict future claims could result in unexpected volatility in, and have a material adverse effect on, our financial condition.
If one of our products were to cause injury to someone or cause property damage, including as a result of product malfunctions, defects, or improper installation, then we could be exposed to product liability claims. We could incur significant costs and liabilities if we are sued and if damages are awarded against us. Further, any product liability claim we face could be expensive to defend and could divert management’s attention. The successful assertion of a product liability claim against us could result in potentially significant monetary damages, penalties or fines, subject us to adverse publicity, damage our reputation and competitive position, and adversely affect sales of our products. In addition, product liability claims, injuries, defects, or other problems experienced by other companies in the residential solar industry could lead to unfavorable market conditions for the industry as a whole, and may have an adverse effect on our ability to attract new customers, thus harming our growth and financial performance.
If we do not forecast demand for our products accurately, we may experience product shortages, delays in product shipment, excess product inventory, or difficulties in planning expenses, which will adversely affect our business and financial condition.
Our products are manufactured according to our estimates of customer demand, which requires us to make multiple forecasts and assumptions relating to demand from solar PV installers and distributors, their end customers, and general market conditions. Because we sell a large portion of our products to larger solar installers and various distributors, who in turn sell to local installers, who in turn sell to their end customers, the system owner, we have limited visibility as to end customer demand and it is difficult to forecast future end-user demand to plan our operations. If we overestimate demand for our products, or if purchase orders are cancelled or shipments are delayed, we may have excess inventory that we cannot sell. Conversely, if we underestimate demand, we may not have sufficient inventory to meet end customer demand or to ramp up production at our contract manufacturers in a timely manner, or we could incur additional costs, lose market share, damage relationships with our distributors and end customers and forego potential revenue opportunities. For example, in the quarter ended December 31, 2017, we had high customer demand and certain component shortages which forced us to shorten transportation time from our factories in China by using air freight rather than less expensive ocean freight.
17
We are dependent on ocean transportation to deliver our products in a cost efficient manner. If we are unable to use ocean transportation to deliver our products, our business and financial condition could be materially and adversely impacted.
We rely on commercial ocean transportation for the delivery of a large percentage of our products to our customers. We also rely on more expensive air transportation when ocean transportation is not available or compatible with the delivery time requirements of our customers or when we are unable to meet the growing volume demands of our customers and need to accelerate delivery times. Our ability to deliver our products via ocean transportation could be adversely impacted by shortages in available cargo capacity, changes by carriers and transportation companies in policies and practices, such as scheduling, pricing, payment terms and frequency of service or increases in the cost of fuel, taxes and labor, and other factors, such as labor strikes and work stoppages, not within our control. If we are unable to use ocean transportation and are required to substitute more expensive air transportation, our financial condition and results of operations could be materially and adversely impacted.
We depend upon a small number of outside contract manufacturers. Our operations could be disrupted if we encounter problems with these contract manufacturers.
We do not yet have internal manufacturing capabilities, and currently rely upon our contract manufacturers to build all of our products. One of our contract manufacturers is in the process of ramping up manufacturing. During this period, we mainly rely on one contract manufacturer. Any change in our relationship with our contract manufacturers or changes to contractual terms of our agreements with the contract manufacturers could adversely affect our financial condition and results of operations. Our reliance on a small number of contract manufacturers makes us vulnerable to possible capacity constraints and reduced control over component availability, delivery schedules, manufacturing yields and costs.
The revenues that our contract manufacturers generate from our orders represent a relatively small percentage of their overall revenues. As a result, fulfilling our orders may not be considered a priority in the event of constrained ability to fulfill all of their customer obligations in a timely manner. In addition, the facilities in which our products are manufactured are located outside of the U.S., currently in China, Romania and Hungary. The location of these facilities outside of key markets such as the U.S. increases shipping time, thereby causing a long lead time between manufacturing and delivery.
If any of our contract manufacturers were unable or unwilling to manufacture our products in required volumes and at high quality levels or renew existing terms under supply agreements, we would have to identify, qualify, and select acceptable alternative contract manufacturers. An alternative contract manufacturer may not be available to us when needed or may not be in a position to satisfy our quality or production requirements on commercially reasonable terms, including price. Any significant interruption in manufacturing would require us to reduce our supply of products to our customers or increase our shipping costs to make up for delays in manufacturing, which in turn could reduce our revenues, harm our relationships with our customers and damage our reputation with local installers and potential end-users, and cause us to forego potential revenue opportunities.
We may experience delays, disruptions, or quality control problems in our manufacturing operations.
Our product development, manufacturing, and testing processes are complex and require significant technological and production process expertise. Such processes involve a number of precise steps from design to production. Any change in our processes could cause one or more production errors, requiring a temporary suspension or delay in our production line until the errors can be researched, identified, and properly addressed and rectified. This may occur particularly as we introduce new products, modify our engineering and production techniques, and/or expand our capacity. In addition, our failure to maintain appropriate quality assurance processes could result in increased product failures, loss of customers, increased warranty reserve, increased production, and logistical costs and delays. Any of these developments could have a material adverse effect on our business, financial condition, and results of operations.
18
We depend on a limited number of suppliers for key components and raw materials in our products to adequately meet anticipated demand. Due to the limited number of such suppliers, any cessation of operations or production or any shortage, delay, price change, imposition of tariffs or duties, or other limitation on our ability to obtain the components and raw materials we use could result in sales delays, higher costs associated with air shipments, cancellations, and loss of market share.
We depend on limited or single source suppliers for certain key components and raw materials used to manufacture our products, making us susceptible to quality issues, shortages, and price changes. Any of these limited or single source suppliers could stop producing our components or supplying our raw materials, cease operations or be acquired by, or enter into exclusive arrangements with, one or more of our competitors. As a result, these suppliers could stop selling to us at commercially reasonable prices, or at all. Because there are a limited number of suppliers of solar PV system components and raw materials used to manufacture our products, it may be difficult to quickly identify alternate suppliers or to qualify alternative components or raw materials on commercially reasonable terms, and our ability to satisfy customer demand may be adversely affected. Transitioning to a new supplier or redesigning a product to accommodate a new component manufacturer would result in additional costs and delays. These outcomes could harm our business or financial performance.
Managing our supplier and contractor relationships is particularly difficult when we are introducing new products and when demand for our products is increasing, especially if demand increases more quickly than we expect.
Any interruption in the supply of limited source components or raw materials for our products would adversely affect our ability to meet scheduled product deliveries to our customers, could result in lost revenue or higher expenses associated with increased air shipments required to meet customer demand in a timely manner, and would harm our business.
Failure by our contract manufacturers or our component or raw material suppliers to use ethical business practices and comply with applicable laws and regulations may adversely affect our business.
We do not control our contract manufacturers or suppliers or their business practices. Accordingly, we cannot guarantee that they follow ethical business practices such as fair wage practices and compliance with environmental, safety, and other local laws. A lack of demonstrated compliance could lead us to seek alternative manufacturers or suppliers, which could increase our costs and result in delayed delivery of our products, product shortages, or other disruptions of our operations. Violation of labor or other laws by our manufacturers or suppliers or the divergence of a supplier’s labor or other practices from those generally accepted as ethical in the U.S. or other markets in which we do business could also attract negative publicity for us and harm our business.
Our results of operations may fluctuate from quarter to quarter, which could make our future performance difficult to predict and could cause our results of operations for a particular period to fall below expectations, resulting in a decline in the price of our common stock.
Our quarterly results of operations are difficult to predict and may fluctuate significantly in the future. We have experienced seasonal and quarterly fluctuations in the past as a result of seasonal fluctuations in our customers’ business. For example, our customers’ and end-users’ ability to install solar energy systems is affected by weather, as for example during the winter months in Europe and the northeastern U.S. Such installation delays can impact the timing of orders for our products. Further, given that we are operating in an industry that is affected by fluctuations as a result of economic factors such as tariff changes, the true extent of these fluctuations may have been masked by our recent growth rates and consequently may not be readily apparent from our historical results of operations and may be difficult to predict. Our financial performance, sales, working capital requirements, and cash flow may fluctuate, and our past quarterly results of operations may not be good indicators of future performance. Any substantial decrease in revenues would have an adverse effect on our financial condition, results of operations, cash flows, and stock price.
We rely on distributors and large installers to assist in selling our products, and the failure of these customers to perform as expected could reduce our future revenue.
We currently sell a substantial percentage of our products through distributors, who in turn sell to local installers, and through direct sales to large installers. We do not have exclusive arrangements with these third party distributors and large installers. Many of our distributors also market and sell products from our competitors, and all of our large installer customers also use products from our competitors. These distributors and large installers may terminate their relationships with us at any time and with little or no notice. Further, these distributors and large installers may fail to devote resources necessary to sell our products at the prices, in the volumes, and within the time frames that we expect, or may focus their marketing and sales efforts on products of our competitors. Termination of agreements with current distributors or large installers, failure by these distributors or large installers to perform as expected, or failure by us to cultivate new distributor or large installer relationships, could hinder our ability to expand our operations and harm our revenue and results of operations.
19
The loss of one or more members of our senior management team or other key personnel or our failure to attract additional qualified personnel may adversely affect our business and our ability to achieve our anticipated level of growth.
We depend on the continued services of our senior management team, including our chief executive officer and chief financial officer, and other key personnel, each of whom would be difficult to replace. The loss of any such personnel could have a material adverse effect on our business and ability to implement our business strategy. All of our employees, including our senior management, are free to terminate their employment relationships with us at any time. We do not maintain key-person insurance for any of our employees, including senior management.
Additionally, our ability to attract qualified personnel, including senior management and key technical personnel, is critical to the execution of our growth strategy. Competition for qualified senior management personnel and highly skilled individuals with technical expertise is extremely intense, and we face challenges identifying, hiring, and retaining qualified personnel in all areas of our business. In addition, integrating new employees into our team could prove disruptive to our operations, require substantial resources and management attention, and ultimately prove unsuccessful. Our failure to attract and retain qualified senior management and other key technical personnel could limit or delay our strategic efforts, which could have a material adverse effect on our business, financial condition, results of operations, and prospects.
If we fail to protect, or incur significant costs in defending our intellectual property and other proprietary rights, our business and results of operations could be materially harmed.
Our success depends to a significant degree on our ability to protect our intellectual property and other proprietary rights. We rely on a combination of patent, trademark, copyright, trade secret, and unfair competition laws, as well as confidentiality and license agreements and other contractual provisions, to establish and protect our intellectual property and other proprietary rights. We have applied for patents in the U.S., Europe, and China, some of which have been issued. We cannot guarantee that any of our pending applications will be approved or that our existing and future intellectual property rights will be sufficiently broad to protect our proprietary technology, and any failure to obtain such approvals or finding that our intellectual property rights are invalid or unenforceable could force us to, among other things, rebrand or re-design our affected products. In countries where we have not applied for patent protection or where effective intellectual property protection is not available to the same extent as in the U.S., we may be at greater risk that our proprietary rights will be misappropriated, infringed, or otherwise violated.
Third parties may assert that we are infringing upon their intellectual property rights, which could divert management’s attention, cause us to incur significant costs, and prevent us from selling or using the technology to which such rights relate.
Our competitors and other third parties hold numerous patents related to technology used in our industry. From time to time, we may also be subject to claims of intellectual property right infringement and related litigation, and, if we gain greater recognition in the market, we face a higher risk of being the subject of claims that we have violated others’ intellectual property rights. Regardless of their merit, responding to such claims can be time consuming, can divert management’s attention and resources and may cause us to incur significant expenses in litigation or settlement. While we believe that our products and technology do not infringe in any material respect upon any valid intellectual property rights of third parties, we cannot be certain that we would be successful in defending against any such claims. If we do not successfully defend or settle an intellectual property claim, we could be liable for significant monetary damages and could be prohibited from continuing to use certain technology, business methods, content, or brands. To avoid a prohibition, we could seek a license from the applicable third party, which could require us to pay significant royalties, increasing our operating expenses. If a license is not available at all or not available on reasonable terms, we may be required to develop or license a non-violating alternative, either of which could require significant effort and expense. If we cannot license or develop a non-violating alternative, we would be forced to limit or stop sales of our offerings and may be unable to effectively compete. Any of these results would adversely affect our business, financial condition, and results of operations.
We may become subject to claims for remuneration or royalties for assigned service invention rights by our employees, which could result in litigation and adversely affect our business.
We enter into agreements with our employees pursuant to which they agree that any inventions created in the scope of their employment or engagement are assigned to us or owned exclusively by us, depending on the jurisdiction, without the employee retaining any rights. A significant portion of our intellectual property has been developed by our employees in the course of their employment for us. Under the Israeli Patent Law, 5727-1967 (the “Patent Law”), inventions conceived by an employee during the scope of his or her employment with a company are regarded as “service inventions,” which belong to the employer, absent a specific agreement between the employee and employer giving the employee service invention rights. The Patent Law also provides that if there is no such agreement between an employer and an employee, the Israeli Compensation and Royalties Committee (the “Committee”), a body constituted under the Patent Law, shall determine whether the employee is entitled to remuneration for his or her inventions. Recent decisions by the Committee and the Israeli Supreme Court have created uncertainty in this area, as the Israeli Supreme Court held that employees may be entitled to remuneration for their service inventions despite having specifically waived any such rights. Further, the Committee has not yet determined the method for calculating this Committee-enforced remuneration. Although our employees have agreed that any rights related to their inventions are owned exclusively by us, we may face claims demanding remuneration in consideration for such acknowledgement. As a consequence of such claims, we could be required to pay additional remuneration or royalties to our current and/or former employees, or be forced to litigate such claims, which could negatively affect our business.
20
The loss of, or events affecting, one of our major customers could reduce our sales and have a material adverse effect on our business, financial condition, and results of operations.
For the year ended December 31, 2017, three of our major customers accounted for 29.9% of our revenues. Our next five largest customers for the year ended December 31, 2017 together accounted for 23.3% of our revenues. For the year ended December 31, 2017, our largest customer was Consolidated Electrical Distributors Inc. (CED), accounting for 14.8% of our revenues. Our customers’ decisions to purchase our products are influenced by a number of factors outside of our control, including retail energy prices and government regulation and incentives, among others. In addition, these customers may decide to no longer use our products and services for other reasons which may be out of our control. Although we have agreements with some of our largest customers, these agreements do not have long-term purchase commitments and are generally terminable by either party after a relatively short notice period. The loss of, or events affecting, one or more of these customers could have a material adverse effect on our business, financial condition, and results of operations. For example, in April 2017, one of our customers, Sungevity, filed for reorganization under Chapter 11 of the U.S. bankruptcy laws.
Consolidations in the solar industry among our current or potential customers or distributors may adversely affect our competitive position
.
There has been an increase in consolidation activity among distributors, large installers, and other strategic partners in the solar industry. For example, in July 2015, SunEdison (SUNEQ) announced its intention to purchase Vivint Solar for $2 billion, in March 2016, Vivint Solar announced it was terminating the merger due to SunEdison’s “willful breach of the merger agreement”. In June 2016, Tesla Motors (TSLA) announced that it had submitted a proposal to acquire all of the outstanding shares of common stock of SolarCity Corporation (SCTY). This trend could further increase our reliance on a small number of customers for a significant portion of our sales and may negatively impact our competitive position in the solar market.
Our planned expansion into new geographic markets or new product lines or services could subject us to additional business, financial, and competitive risks.
In the year ended December 31, 2017, we sold our products to approximately 230 direct customers in 48 countries, including the U.S., Canada, Belgium, France, Germany, Israel, Italy, the Netherlands, the United Kingdom, Australia, Japan, and China. We have in the past, and may in the future, evaluate opportunities to expand into new geographic markets and introduce new product offerings and services that are a natural extension of our existing business. We also may from time to time engage in acquisitions of businesses or product lines with the potential to strengthen our market position, enable us to enter attractive markets, expand our technological capabilities, or provide synergy opportunities. For example, we intend to continue introduce new products targeted at large commercial and utility-scale installations and to continue to expand into other international markets.
Our success operating in these new geographic or product markets, or in operating any acquired business, will depend on a number of factors, including our ability to develop solutions to address the requirements of the large commercial and utility-scale solar PV markets, timely qualification and certification of new products for large commercial and utility-scale solar PV installations, acceptance of power optimizers in solar PV markets in which they have not traditionally been used, our ability to manage increased manufacturing capacity and production, and our ability to identify and integrate any acquired businesses.
Further, we expect these new solar PV markets to have different characteristics from the markets in which we currently sell products, and our success will depend on our ability to adapt properly to these differences. These differences may include differing regulatory requirements, including tax laws, trade laws, labor regulations, tariffs, export quotas, customs duties, or other trade restrictions, limited or unfavorable intellectual property protection, international, political or economic conditions, restrictions on the repatriation of earnings, longer sales cycles, warranty expectations, product return policies and cost, performance and compatibility requirements. In addition, expanding into new geographic markets will increase our exposure to presently existing risks, such as fluctuations in the value of foreign currencies and difficulties and increased expenses in complying with U.S. and foreign laws, regulations and trade standards, including the Foreign Corrupt Practices Act of 1977, as amended (the “FCPA”).
Failure to develop and introduce these new products successfully or to otherwise manage the risks and challenges associated with our potential expansion into new product and geographic markets could adversely affect our revenues and our ability to sustain profitability.
21
If we fail to manage our recent and future growth effectively, we may be unable to execute our business plan, maintain high levels of customer service, or adequately address competitive challenges.
We have experienced significant growth in recent periods with our annual product sales growing rapidly from approximately 8,400 inverters and approximately 181,000 power optimizers in fiscal 2011 (the period beginning July 1, 2010 and ending June 30, 2011), our first full fiscal year of commercial shipments, to annual product sales exceeding 316,000 inverters and 7.3 million power optimizers in the year ended December 31, 2017. We intend to continue to expand our business significantly within existing and new markets. This growth has placed, and any future growth may place, a significant strain on our management, operational, and financial infrastructure. In particular, we will be required to expand, train, and manage our growing employee base and scale and otherwise improve our IT infrastructure in tandem with that headcount growth. Our management will also be required to maintain and expand our relationships with customers, suppliers, and other third parties and attract new customers and suppliers, as well as manage multiple geographic locations.
Our current and planned operations, personnel, IT, information systems, and other systems and procedures might be inadequate to support our future growth and may require us to make additional unanticipated investment in our infrastructure. Our success and ability to further scale our business will depend, in part, on our ability to manage these changes in a cost-effective and efficient manner. If we cannot manage our growth, we may be unable to take advantage of market opportunities, execute our business strategies, or respond to competitive pressures. This could also result in declines in quality or customer satisfaction, increased costs, difficulties in introducing new offerings, or other operational difficulties. Any failure to effectively manage growth could adversely impact our business and reputation.
Fluctuations in currency exchange rates may negatively impact our financial condition and results of operations.
Although our financial results are reported in U.S. dollars, 37.4% of our revenues in the year ended December 31, 2017 were generated in currencies other than the U.S. Dollar. In addition, a significant portion of our operating expenses are accrued in New Israeli Shekels (primarily related to payroll) and, to a lesser extent, the Euro and other currencies. Our profitability is affected by movements of the U.S. dollar against the Euro, and, to a lesser extent, the New Israeli Shekel and other currencies in which we generate revenues, incur expenses, and maintain cash balances. Foreign currency fluctuations may also affect the prices of our products. Our prices are denominated primarily in U.S. dollars. If there is a significant devaluation of a particular currency, the prices of our products will increase relative to the local currency and may be less competitive. Despite our efforts to minimize foreign currency risks, primarily by entering into forward-hedging transactions to sell Euro for U.S. dollars at a predefined rate, and maintaining cash balances in New Israeli Shekels, significant long-term fluctuations in relative currency values, in particular a significant change in the relative values of the Euro and, to a lesser extent, the New Israeli Shekel and other currencies, against the U.S. dollar could have an adverse effect on our profitability and financial condition.
From time to time, we enter into forward contracts to hedge the exchange impacts on assets and liabilities denominated in Israeli Shekels, Euros and other currencies. As of December 31, 2017, we entered into forward and put and call options contracts to sell Euros for U.S. dollars, which did not meet the requirement for hedge accounting, in the amount of €54 million. We use derivative financial instruments, such as foreign exchange forward contracts and put and call options, to mitigate the risk of changes in foreign exchange rates on accounts receivable and forecast cash flows denominated in certain foreign currencies. We may not be able to purchase derivative instruments adequate to fully insulate ourselves from foreign currency exchange risks.
Additionally, our hedging activities may also contribute to increased losses as a result of volatility in foreign currency markets. If foreign exchange currency markets continue to be volatile, such fluctuations in foreign currency exchange rates could materially and adversely affect our profit margins and results of operations in future periods. Also, the volatility in the foreign currency markets may make it difficult to hedge our foreign currency exposures effectively.
We may have exposure to greater than anticipated tax liabilities.
The determination of our worldwide provision for income taxes and other tax liabilities requires estimation and significant judgment, and there are many transactions and calculations where the ultimate tax determination is uncertain. Like many other multinational corporations, we are subject to tax in multiple jurisdictions, both in the U.S. and outside the U.S. Our determination of our tax liability is always subject to audit and review by applicable tax authorities. Any adverse outcome of any such audit or review could affect our business, and the ultimate tax outcome may differ from the amounts recorded in our financial statements and may materially affect our financial results in the periods for which such determination is made. While we have established reserves based on assumptions and estimates that we believe are reasonable to cover such eventualities, these reserves may prove to be insufficient.
22
In addition, our future income taxes could be adversely affected by earnings being lower than anticipated, or by the incurrence of losses, in jurisdictions that have lower statutory tax rates and higher than anticipated in jurisdictions that have higher statutory tax rates, by changes in the valuation of our deferred tax assets and liabilities, as a result of gains on our foreign exchange risk management program, or changes in tax laws, regulations, or accounting principles, as well as certain discrete items.
Various levels of government, such as U.S. federal and state legislatures, and international organizations, such as the Organization for Economic Co-operation and Development (“OECD”) and the European Union, are increasingly focused on tax reform and other legislative or regulatory action to increase tax revenue. Any such tax reform or other legislative or regulatory actions could increase our effective tax rate.
Any unauthorized access to, or disclosure or theft of personal information we gather, store, or use could harm our reputation and subject us to claims or litigation.
We receive, store, and use certain personal information of our customers, and the end-users of our customers’ solar PV systems, including names, addresses, e-mail addresses, credit information, and energy production statistics. We also store and use personal information of our employees. We take steps to protect the security, integrity, and confidentiality of the personal information we collect, store, and transmit, but there is no guarantee that inadvertent or unauthorized use or disclosure will not occur or that third parties will not gain unauthorized access to this information despite our efforts. Because techniques used to obtain unauthorized access or sabotage systems change frequently and generally are not identified until they are launched against a target, we and our suppliers or vendors may be unable to anticipate these techniques or to implement adequate preventative or mitigation measures.
Unauthorized use or disclosure of, or access to, any personal information maintained by us or on our behalf, whether through breach of our systems, breach of the systems of our suppliers or vendors by an unauthorized party, or through employee or contractor error, theft or misuse, or otherwise, could harm our business. If any such unauthorized use or disclosure of, or access to, such personal information were to occur, our operations could be seriously disrupted and we could be subject to demands, claims and litigation by private parties, and investigations, related actions, and penalties by regulatory authorities. In addition, we could incur significant costs in notifying affected persons and entities and otherwise complying with the multitude of foreign, federal, state, and local laws and regulations relating to the unauthorized access to, or use or disclosure of, personal information. Finally, any perceived or actual unauthorized access to, or use or disclosure of, such information could harm our reputation, substantially impair our ability to attract and retain customers, and have an adverse impact on our business, financial condition, and results of operations.
We could be adversely affected by any violations of the FCPA, the U.K. Bribery Act, and other foreign anti-bribery laws.
The FCPA generally prohibits companies and their intermediaries from making improper payments to foreign government officials for the purpose of obtaining or retaining business. Other countries in which we operate also have anti-bribery laws, some of which prohibit improper payments to government and non-government persons and entities. Our policies mandate compliance with these anti-bribery laws. However, we currently operate in and intend to further expand into, many parts of the world that have experienced governmental corruption to some degree and, in certain circumstances, strict compliance with anti-bribery laws may conflict with local customs and practices. In addition, due to the level of regulation in our industry, our entry into certain jurisdictions requires substantial government contact where norms can differ from U.S. standards. It is possible that our employees, subcontractors, agents, and partners may take actions in violation of our policies and anti-bribery laws. Any such violation, even if prohibited by our policies, could subject us to criminal or civil penalties or other sanctions, which could have a material adverse effect on our business, financial condition, cash flows, and reputation.
Third parties might attempt to gain unauthorized access to our network or seek to compromise our products and services.
From time to time, we face attempts by others to gain unauthorized access through the Internet or to introduce malicious software to our information technology (IT) systems. Additionally, malicious hackers may attempt to gain unauthorized access and corrupt the processes of hardware and software products that we manufacture and services we provide. We or our products may be a target of computer hackers, organizations or malicious attackers who attempt to gain access to our network or data centers or those of our customers or end users; steal proprietary information related to our business, products, employees, and customers; or interrupt our systems or those of our customers or others. From time to time, we encounter intrusions or attempts at gaining unauthorized access to our network. To date, none have resulted in any material adverse impact to our business or operations. While we seek to detect and investigate all unauthorized attempts and attacks against our network and products, and to
prevent their recurrence where practicable through changes to our internal processes and tools and/or changes to our products, we remain potentially vulnerable to additional known or unknown threats. In addition to intentional third-party cyber-security breaches, the integrity and confidentiality of Company and customer data may be compromised as a result of human error, product defects, or technological failures. Cyber-security breaches, whether successful or unsuccessful, and other IT system interruptions, including those resulting from human error and technological failures, could result in our incurring significant costs related to, for example, rebuilding internal systems, reduced inventory value, providing modifications to our products and services, defending against litigation, responding to regulatory inquiries or actions, paying damages, or taking other remedial steps with respect to third parties.
23
Risks Related to Operations in Israel
Conditions in Israel affect our operations and may limit our ability to develop, produce and sell our products.
Although we are incorporated in Delaware, our headquarters and research and development center are located in Israel. Accordingly, political, economic, and military conditions in Israel directly affect us. Israel has been involved in a number of armed conflicts and has been the target of terrorist activity. Ongoing state of hostility, varying in degree such as rocket fire from the Gaza Strip, including against civilian targets, has occurred on an irregular basis, disrupting day-to-day civilian activity and negatively affecting business conditions. Israel also faces threats from Hezbollah militants in Lebanon, and others. We cannot predict whether or when such armed conflicts or attacks may occur or the extent to which such events may impact us. Any future armed conflict, political instability or violence in the region may impede our ability to manage our business effectively or to engage in research and development, or may otherwise adversely affect our business or operations. In the event of war, we and our Israeli subcontractors and suppliers may cease operations, which may cause delays in the distribution and sale of our products. Some of our directors, executive officers, and employees in Israel are obligated to perform annual reserve duty in the Israeli military and are subject to being called for additional active duty under emergency circumstances. In the event that our principal executive office is damaged as a result of hostile action, or hostilities otherwise disrupting the ongoing operation of our offices, our ability to operate could be materially adversely affected.
Additionally, several countries, principally in the Middle East, restrict doing business with Israeli companies, and additional countries and groups may impose similar restrictions if hostilities in Israel or political instability in the region continue or increase. If recent regime changes and civil wars in neighboring states result in the establishment of fundamentalist Islamic regimes or governments more hostile to Israel, or if Egypt or Jordan abrogates its respective peace treaty with Israel, Israel could be subject to additional political, economic, and military confines, and our operations and ability to sell our products to countries in the region could be materially adversely affected. These restrictions may limit materially our ability to obtain manufactured components and raw materials or to sell our products.
Any hostilities involving Israel or the interruption or curtailment of trade between Israel and its present trading partners, or significant downturn in the economic or financial condition of Israel, could have a material adverse effect on our business, financial condition, and results of operations.
The tax benefits that are available to us under Israeli law require us to meet various conditions and may be terminated or reduced in the future, which could increase our costs and taxes.
Our Israeli subsidiary is eligible for certain tax benefits provided to “Benefited Enterprises” under the Israeli Law for the Encouragement of Capital Investments, 1959 (the “Investment Law”.) In order to remain eligible for the tax benefits for “Benefited Enterprises” we must continue to meet certain conditions stipulated in the Investment Law and its regulations, as amended. If these tax benefits are reduced, cancelled, or discontinued, our Israeli taxable income would be subject to regular Israeli corporate tax rates and we may be required to refund any tax benefits that we have already received, plus interest and penalties thereon. The standard corporate tax rate for Israeli companies was increased to 26.5% in 2014 and 2015 decreased to 25% in 2016 and decreased again to 24% as of January 1, 2017 and 23% as of January 1, 2018. Additionally, if we increase our activities outside of Israel through acquisitions, for example, our expanded activities might not be eligible for inclusion in future Israeli tax benefit programs. The Israeli government may furthermore independently determine to reduce, phase out, or eliminate entirely the benefit programs under the Investment Law, regardless of whether we then qualify for benefits under those programs at the time, which would also adversely affect our global tax rate and our results of operations.
It may be difficult to enforce a judgment of a U.S. court against our officers and directors, to assert U.S. securities laws claims in Israel, or to serve process on our officers and directors.
The majority of our directors and executive officers reside outside of the U.S., and most of our assets and most of the assets of these persons are located outside of the U.S. Consequently, a judgment obtained against any of these persons, including a judgment based on the civil liability provisions of the U.S. federal securities laws, may not be collectible in the U.S. It also may be difficult for you to effect service of process on these persons in the U.S. or to assert U.S. securities law claims in original actions instituted in Israel. Israeli courts may refuse to hear a claim based on an alleged violation of U.S. securities laws on the grounds that Israel is not the most appropriate forum in which to bring such a claim. In addition, even if an Israeli court hears a claim, it may determine that Israeli law and not U.S. law is applicable to the claim. If U.S. law is found to be applicable, the content of applicable U.S. law must be proven as a fact by expert witnesses, which can be a time consuming and costly process. Further, an Israeli court may not enforce a judgment awarded by a U.S. or other non-Israeli court. Certain matters of procedure will also be governed by Israeli law. There is little binding case law in Israel that addresses these matters. As a result of the difficulty associated with enforcing a judgment against any of these persons in Israel, you may not be able to obtain or enforce a judgment against many of our directors and executive officers.
24
Risks Related to the Ownership of Our Common Stock
We cannot assure you that our stock price will not decline or not be subject to significant volatility.
The trading price of our common stock has been volatile since our initial public offering. Since shares of our common stock were sold in our initial public offering in March 2015 at a price of $18.00 per share, during the year ended December 31, 2017, the reported high and low prices of our common stock has ranged from $12.25 to $39.9 per share. The price of our stock may change in response to fluctuations in our results of operations in future periods and also may change in response to other factors, including factors specific to companies in our industry, many of which are beyond our control. As a result, our share price may experience significant volatility and may not necessarily reflect the value of our expected performance. Among other factors that could affect our stock price are:
| · |
the addition or loss of significant customers;
|
| · |
changes in laws or regulations applicable to our industry, products or services;
|
| · |
speculation about our business in the press or the investment community;
|
| · |
price and volume fluctuations in the overall stock market;
|
| · |
volatility in the market price and trading volume of companies in our industry or companies that investors consider comparable;
|
| · |
share price and volume fluctuations attributable to inconsistent trading levels of our shares;
|
| · |
our ability to protect our intellectual property and other proprietary rights;
|
| · |
sales of our common stock by us or our significant stockholders, officers and directors;
|
| · |
the expiration of contractual lock-up agreements;
|
| · |
the development and sustainability of an active trading market for our common stock;
|
| · |
success of competitive products or services;
|
| · |
the public’s response to press releases or other public announcements by us or others, including our filings with the Securities and Exchange Commission (the “SEC”), announcements relating to litigation or significant changes to our key personnel;
|
| · |
the effectiveness of our internal controls over financial reporting;
|
| · |
changes in our capital structure, such as future issuances of debt or equity securities;
|
| · |
our entry into new markets;
|
| · |
tax developments in the U.S., Europe, or other markets;
|
| · |
strategic actions by us or our competitors, such as acquisitions or restructurings; and
|
| · |
changes in accounting principles.
|
25
Further, the stock markets have experienced extreme price and volume fluctuations that have affected and continue to affect the market prices of equity securities of many companies. These fluctuations often have been unrelated or disproportionate to the operating performance of those companies. In addition, the stock prices of many renewable energy companies have experienced wide fluctuations that have often been unrelated to the operating performance of those companies. These broad market and industry fluctuations, as well as general economic, political, and market conditions such as recessions, interest rate changes, or international currency fluctuations, may cause the market price of our common stock to decline. In the past, many companies that have experienced volatility in the market price of their stock have been subject to securities class action litigation. We may be the target of this type of litigation in the future. Securities litigation against us could result in substantial cost and divert our management’s attention from other business concerns, which could seriously harm our business.
The price of our common stock could decline if securities analysts or other third parties publish inaccurate or unfavorable research about us or if one or more of our analysts ceases to cover us or to regularly publish reports about us.
The trading of our common stock is likely to be influenced by the reports and research that industry or securities analysts publish about us, our business, our market, or our competitors. If one or more securities or industry analysts downgrades our common stock or publishes inaccurate or unfavorable research about our business, our stock price would likely decline. If one or more securities or industry analysts ceases to cover the Company or fails to regularly publish reports on us, we could lose visibility in the financial markets, which in turn could cause our stock price or trading volume to decline.
Provisions in our certificate of incorporation and by-laws may have the effect of delaying or preventing a change of control or changes in our management.
Our certificate of incorporation and by-laws contain provisions that could depress the trading price of our common stock by discouraging, delaying, or preventing a change of control of our Company or changes in our management that the stockholders of our Company may believe advantageous. These provisions include:
| · |
authorizing “blank check” preferred stock that our board of directors could issue to increase the number of outstanding shares to discourage a takeover attempt;
|
| · |
providing for a classified board of directors with staggered, three-year terms, which could delay the ability of stockholders to change the membership of a majority of our board of directors;
|
| · |
not providing for cumulative voting in the election of directors, which limits the ability of minority stockholders to elect director candidates;
|
| · |
limiting the ability of stockholders to call a special stockholder meeting;
|
| · |
prohibiting stockholders from acting by written consents;
|
| · |
establishing advance notice requirements for nominations for election to our board of directors or for proposing matters that can be acted upon by stockholders at stockholder meetings;
|
| · |
the removal of directors only for cause and only upon the affirmative vote of the holders of at least 66
2
/
3
% in voting power of all the then-outstanding shares of common stock of the Company entitled to vote thereon, voting together as a single class;
|
| · |
providing that our board of directors is expressly authorized to amend, alter, rescind or repeal our by-laws; and
|
| · |
requiring the affirmative vote of holders of at least 66
2
/
3
% of the voting power of all of the then outstanding shares of common stock, voting as a single class, to amend provisions of our certificate of incorporation relating to the management of our business, our board of directors, stockholder action by written consent, advance notification of stockholder nominations and proposals, calling special meetings of stockholders, forum selection and the liability of our directors, or to amend, alter, rescind, or repeal our by-laws.
|
In addition, we are governed by the provisions of Section 203 of the Delaware General Corporation Law (“DGCL”), which generally prohibits a Delaware corporation from engaging in a broad range of business combinations with any “interested” stockholder for a period of three years following the date on which the stockholder becomes an “interested” stockholder.
26
Our certificate of incorporation includes a forum selection clause, which could limit our stockholders’ ability to obtain a favorable judicial forum for disputes with us.
Our certificate of incorporation provides that, unless we consent in writing to the selection of an alternative forum, the sole and exclusive forum for any stockholder (including any beneficial owner) to bring (i) any derivative action or proceeding brought on our behalf, (ii) any action asserting a claim of breach of a fiduciary duty owed by any of our directors, officers, or employees to us or to our stockholders, (iii) any action asserting a claim arising pursuant to any provision of the DGCL or our certificate of incorporation or by-laws, or (iv) any action asserting a claim governed by the internal affairs doctrine, will be a state court located within the State of Delaware (or, if no state court located within the State of Delaware has jurisdiction, the federal district court for the District of Delaware); in all cases subject to the court’s having personal jurisdiction over the indispensable parties named as defendants. Any person or entity purchasing or otherwise acquiring any interest in shares of our capital stock is deemed to have notice of and consented to the foregoing provisions. This forum selection provision may limit our stockholders’ ability to obtain a favorable judicial forum for disputes with us. It is also possible that, notwithstanding the forum selection clause that is included in our certificate of incorporation, a court outside of Delaware
could rule that such a provision is inapplicable or unenforceable.
We do not intend to pay any cash dividends on our common stock in the foreseeable future.
We have never declared or paid any dividends on our common stock. We currently intend to retain any future earnings and do not expect to pay any dividends in the foreseeable future. Any future determination to declare cash dividends will be made at the discretion of our board of directors, subject to applicable laws and organizational documents, after taking into account our financial condition, results of operations, capital requirements, general business conditions, and other factors that our board of directors may deem relevant. As a result, capital appreciation in the price of our common stock, if any, may be your only source of gain on an investment in our common stock.
27
Not applicable.
Our corporate headquarters are located in Herzliya Pituach, Israel, in an office consisting of approximately 56,000 square feet of office, testing, and product design space. We have a ten‑year lease on our corporate headquarters, which expires on December 31, 2024. As our company has grown, to accommodate new employees we have leased additional office space adjacent to our corporate headquarters totaling 25,000 square feet, with leases that expire in 2020. We have also leased additional office space in Lod, Israel totaling 20,000 square feet with a lease that expires in 2018 and 18,000 square feet in Netanya, Israel with a lease that expires in 2019.
In addition to our corporate headquarters, we lease approximately 27,000 square feet of general office space in Fremont, California, under a lease that will expire on March 31, 2020. We also lease sales and support office space in Northern California, China, Germany, Netherlands, Italy, France, Australia, UK, Japan, Turkey, Romania, India, and Bulgaria.
We currently outsource all of our manufacturing to our manufacturing partners, and currently do not own any manufacturing facilities. In July 2017, we executed a long-term lease agreement for 107,000 square feet in Israel, intended for the establishment of a manufacturing facility. The facility is under development.
We believe that our existing properties are in good condition and are sufficient and suitable for the conduct of our business for the foreseeable future. To the extent our needs change as our business grows, we expect that additional space and facilities will be available on commercially reasonable terms.
In the normal course of business, we may from time to time be named as a party to various legal claims, actions and complaints. It is impossible to predict with certainty whether any resulting liability would have a material adverse effect on our financial position, results of operations or cash flows.
Not applicable
.
28
| ITEM 5. |
MARKET FOR REGISTRANT’S COMMON EQUITY, RELATED STOCKHOLDER MATTERS AND ISSUER PURCHASES OF EQUITY SECURITIES
|
Market Information
Our common stock, par value $0.0001 per share, began trading on the NASDAQ Global Select Market on March 26, 2015, where prices are quoted under the symbol “SEDG”.
Holders of Record
As of December 31, 2017, there were 29 holders of record of our common stock. Because many of our shares of common stock are held by brokers and other institutions on behalf of stockholders, we are unable to estimate the total number of stockholders represented by these record holders.
Price Range of Our Common Stock
The following table set for the high and low sales prices for our common stock for the periods indicated, in each case as regularly on the NASDAQ Global Select Market:
|
Price Range
|
||||||||
|
High
|
Low
|
|||||||
|
Fiscal Year 2016
|
||||||||
|
First Quarter (July 1 – September 30)
|
$
|
38.11
|
$
|
15.60
|
||||
|
Second Quarter (October 1 – December 31)
|
$
|
29.50
|
$
|
15.02
|
||||
|
Third Quarter (January 1 – March 31)
|
$
|
30.50
|
$
|
21.92
|
||||
|
Fourth Quarter (April – June 30)
|
$
|
28.80
|
$
|
17.10
|
||||
|
Six Months ended December 31, 2016
|
||||||||
|
First Quarter (July 1 – September 30)
|
$
|
20.54
|
$
|
14.41
|
||||
|
Second Quarter (October 1 – December 31)
|
$
|
17.34
|
$
|
11.35
|
||||
|
Fiscal Year 2017
|
||||||||
|
First Quarter (January 1 – March 31)
|
$
|
16.00
|
$
|
12.25
|
||||
|
Second Quarter (April 1 – June 30)
|
$
|
21.85
|
$
|
15.05
|
||||
|
Third Quarter (July 1 – September 30)
|
$
|
29.80
|
$
|
19.06
|
||||
|
Fourth Quarter (October 1 – December 31)
|
$
|
39.90
|
$
|
28.15
|
||||
Dividend Policy
We have never declared or paid any dividends on our capital stock. We currently intend to retain any future earnings and do not expect to pay any dividends in the foreseeable future. Any future determination to declare cash dividends will be made at the discretion of our board of directors, subject to applicable laws and organizational documents, after taking into account our financial condition, results of operations, capital requirements, general business conditions, and other factors that our board of directors may deem relevant.
Purchases of Equity Securities by the Issuer and Affiliated Purchases
There were no purchases of equity securities by the issuer and affiliated purchases during the year ended December 31, 2017.
29
Performance Graph
The following graph compares the cumulative total shareholder return on our common stock from March 26, 2015 (using the price of which our shares of common stock were initially sold to the public) to December 31, 2017 to that of the total return of the Nasdaq Composite Index ([INDEXNASDAQ.IXIC]) and the MAC Global Solar Energy Index (SUNIDX). The comparison illustrates the relative change in stock price since our initial public offering on March 26, 2015. This graph is furnished and not “filed” with the Securities and Exchange Commission or “soliciting material” under the Securities Exchange Act of 1934 and shall not be incorporated by reference into any such filings, irrespective of any general incorporation contained in such filing.
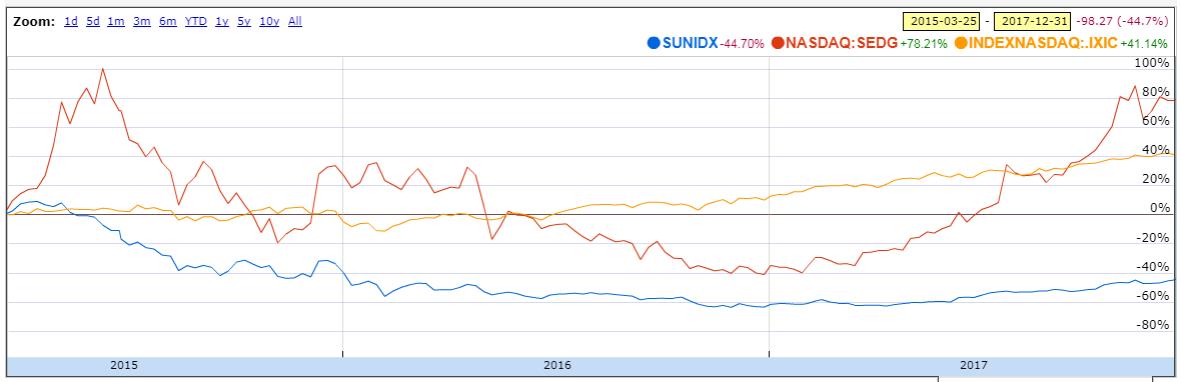
30
Change in Fiscal Year
In 2016, our Board of Directors approved the change to our fiscal year end from June 30 to December 31. We made this change to align our fiscal year end with other companies within our industry. We refer to the period beginning July 1, 2013 and ending June 30, 2014 as “fiscal 2014”, the period beginning July 1, 2014 and ending June 30, 2015 as “fiscal 2015”, the period beginning July 1, 2015 and ending June 30, 2016 as “fiscal 2016”, and the period beginning January 1, 2017 and ending December 31, 2017 as “fiscal 2017”. We previously filed a Form 10-KT to cover the transition period for the six-month period of July 1, 2016 through December 31, 2016.
Selected Financial Data
The selected consolidated statement of operations data for each of fiscal year ended June 30, 2015, June 30, 2016 as well as the six months ended December 31, 2016, the fiscal year ended December 31, 2017, and the selected consolidated balance sheet data as of June 30, 2016, the six months ended December 31, 2016, and the fiscal year ended December 31, 2017, are derived from our audited consolidated financial statements included elsewhere in this Annual Report. The selected consolidated statements of operations data for fiscal year ended June 30, 2013 and 2014 and the selected consolidated balance sheet data as of June 30, 2013, 2014, and 2015, are derived from our audited financial statements not included in this Annual Report. Our historical results are not necessarily indicative of our results to be expected in any future period. These selected financial data should be read together with our consolidated financial statements and the related notes, as well as the section captioned “Management’s Discussion and Analysis of Financial Condition and Results of Operations” appearing elsewhere in this Annual Report.
|
Fiscal Years Ended June 30,
|
Six Months Ended December 31,
|
Fiscal Year Ended December 31,
|
||||||||||||||||||||||
|
2013
|
2014
|
2015
|
2016
|
2016
|
2017
|
|||||||||||||||||||
|
(In thousands)
|
||||||||||||||||||||||||
|
Consolidated Statements of Operations Data:
|
||||||||||||||||||||||||
|
Revenues
|
$
|
79,035
|
$
|
133,217
|
$
|
325,078
|
$
|
489,843
|
$
|
239,997
|
$
|
607,045
|
||||||||||||
|
Cost of revenues
|
74,626
|
111,246
|
243,295
|
337,887
|
159,097
|
392,279
|
||||||||||||||||||
|
Gross profit
|
4,409
|
21,971
|
81,783
|
151,956
|
80,900
|
214,766
|
||||||||||||||||||
|
Operating expenses:
|
||||||||||||||||||||||||
|
Research and development, net
|
15,823
|
18,256
|
22,018
|
33,231
|
20,279
|
54,966
|
||||||||||||||||||
|
Sales and marketing
|
12,784
|
17,792
|
24,973
|
34,833
|
20,444
|
50,032
|
||||||||||||||||||
|
General and administrative
|
3,262
|
4,294
|
6,535
|
12,133
|
6,790
|
18,682
|
||||||||||||||||||
|
Total operating expenses
|
31,869
|
40,342
|
53,526
|
80,197
|
47,513
|
123,680
|
||||||||||||||||||
|
Operating income (loss)
|
(27,460
|
)
|
(18,371
|
)
|
28,257
|
71,759
|
33,387
|
91,086
|
||||||||||||||||
|
Financial income (expenses)
|
(612
|
)
|
(2,787
|
)
|
(5,077
|
)
|
471
|
(2,789
|
)
|
9,158
|
||||||||||||||
|
Other expenses
|
—
|
—
|
104
|
—
|
—
|
—
|
||||||||||||||||||
|
Income (loss) before taxes on income
|
(28,072
|
)
|
(21,158
|
)
|
23,076
|
72,230
|
30,598
|
100,244
|
||||||||||||||||
|
Taxes on income (tax benefit)
|
108
|
220
|
1,955
|
(4,379
|
)
|
5,217
|
16,072
|
|||||||||||||||||
|
Net income (loss)
|
$
|
(28,180
|
)
|
$
|
(21,378
|
)
|
$
|
21,121
|
$
|
76,609
|
$
|
25,381
|
$
|
84,172
|
||||||||||
|
Net basic earnings (loss) per share of common stock
|
$
|
(10.28
|
)
|
$
|
(7.64
|
)
|
$
|
0.30
|
$
|
1.92
|
$
|
0.62
|
$
|
1.99
|
||||||||||
|
Net diluted earnings (loss) per share of common stock
|
$
|
(10.28
|
)
|
$
|
(7.64
|
)
|
$
|
0.27
|
$
|
1.73
|
$
|
0.58
|
$
|
1.85
|
||||||||||
|
Weighted average number of shares used in computing net basic earnings (loss) per share of common stock
|
2,741,370
|
2,798,894
|
11,902,911
|
39,987,935
|
41,026,926
|
42,209,238
|
||||||||||||||||||
|
Weighted average number of shares used in computing net diluted earnings (loss) per share of common stock
|
2,741,370
|
2,798,894
|
15,269,448
|
44,376,075
|
43,839,342
|
45,425,307
|
||||||||||||||||||
31
|
As of June 30,
|
As of December 31,
|
|||||||||||||||||||||||
|
2013
|
2014
|
2015
|
2016
|
2016
|
2017
|
|||||||||||||||||||
|
(In thousands)
|
||||||||||||||||||||||||
|
Consolidated Balance Sheet Data:
|
||||||||||||||||||||||||
|
Cash and cash equivalents
|
$
|
13,142
|
$
|
9,754
|
$
|
144,750
|
$
|
74,032
|
$
|
104,683
|
$
|
163,163
|
||||||||||||
|
Available-for-sale marketable securities
|
-
|
-
|
-
|
111,609
|
118,727
|
180,384
|
||||||||||||||||||
|
Total assets
|
49,086
|
74,998
|
305,658
|
397,438
|
424,743
|
641,305
|
||||||||||||||||||
|
Total debt
|
12,823
|
20,244
|
-
|
-
|
-
|
-
|
||||||||||||||||||
|
Total stockholders’ equity (deficiency)
|
$
|
(115,014
|
)
|
$
|
(135,294
|
)
|
$
|
166,944
|
$
|
256,108
|
$
|
288,778
|
$
|
397,467
|
||||||||||
Key Operating Metrics
We regularly review a number of metrics, including the key operating metrics set forth in the table below, to evaluate our business, measure our performance, identify trends affecting our business, formulate projections, and make strategic decisions.
|
Fiscal Years Ended June 30,
|
Six Months Ended December 31,
|
Fiscal Year Ended December 31,
|
||||||||||||||
|
2015
|
2016
|
2016
|
2017
|
|||||||||||||
|
Inverters shipped
|
150,428
|
223,589
|
120,117
|
317,288
|
||||||||||||
|
Power optimizers shipped
|
3,533,528
|
5,738,546
|
2,904,858
|
7,367,921
|
||||||||||||
|
Megawatts shipped(1)
|
920
|
1,615
|
880
|
2,461
|
||||||||||||

| (1) |
Calculated based on the aggregate nameplate capacity of inverters shipped during the applicable period. Nameplate capacity is the maximum rated power output capacity of an inverter as specified by the manufacturer. See “Management’s Discussion and Analysis of Financial Condition and Results of Operations—Performance Measures”.
|
32
The following discussion and analysis of our financial condition and results of operations should be read in conjunction with the sections of this Annual Report on Form 10-K captioned “Selected Financial Data” and “Business” and our consolidated financial statements and the related notes to those statements included elsewhere in this Form 10-K. In addition to historical financial information, the following discussion and analysis contains forward‑looking statements that involve risks, uncertainties, and assumptions. Our actual results and timing of selected events may differ materially from those anticipated in these forward‑looking statements as a result of many factors, including those discussed under the sections of this Annual Report captioned “Special Note Regarding Forward‑Looking Statements” and “Risk Factors”.
Overview
We are a leading provider of intelligent inverter solutions that are changing the way power is harvested and managed in solar PV systems. Our DC optimized inverter solution maximizes power generation at the individual PV module level while lowering the cost of energy produced by the solar PV system. Our systems allow for superior power harvesting and module management by deploying power optimizers at each PV module while maintaining a competitive system cost by using a simplified DC‑AC inverter. Our systems are monitored through our cloud‑based monitoring platform that enables lower system operating and maintenance (“O&M”) costs. We believe that these benefits, along with our comprehensive and advanced safety features, are highly valued by our customers.
We are a leader in the global module-level power electronics (“MLPE”) market according to GTM Research, and as of December 31, 2017, we have shipped approximately 22.7 million power optimizers and 950,000 inverters. More than 560,000 installations, many of which may include multiple inverters, are currently connected to, and monitored through, our cloud‑based monitoring platform. As of December 31, 2017, we have shipped approximately 6.7 GW of our DC optimized inverter systems. Our products have sold in approximately 54 countries, and are installed in solar PV systems in 121 countries.
We primarily sell our products directly to large solar installers, EPCs, and indirectly to thousands of smaller solar installers through large distributors and electrical equipment wholesalers. Our sales strategy focuses on top‑tier customers in markets where electricity prices, irradiance (amount of sunlight), and government policies make solar PV installations economically viable. We also sell our power optimizers to several PV module manufacturers that offer PV modules with our power optimizer physically embedded into their modules.
In the year ended December 31, 2017, we sold our products to approximately 230 direct customers in 48 countries and as of December 31, 2017, approximately 355,000 indirect customers had registered with us through our cloud‑based monitoring platform. In the year ended December 31, 2017, one customer accounted for revenues of above 10% and our top three customers (all distributors) together represented 29.9% of our revenues.
We were founded in 2006 with the goal of addressing the lost power generation potential that is inherent in the use of traditional solar PV inverter technology, thereby increasing the return on investment in solar PV systems. The following is a chronology of some of our key milestones:
| • |
In 2012, we shipped our millionth power optimizer and increased our sales personnel presence in the U.S. market.
|
| • |
In 2013, we introduced our third generation power optimizer, based on our third generation ASIC, with a power rating of up to 700 watts and improved heat dissipation capabilities for high reliability and lower cost.
|
| • |
In March 2015, we completed our initial public offering and started to trade on the NASDAQ Global Select Market under the ticker SEDG.
|
| • |
In September 2015, we released information about the development of our new HD-Wave inverter technology.
|
| • |
In January 2016, we announced the immediate international availability of our StorEdge™ solution.
|
| • |
In February 2016, we shipped our ten millionth power optimizer.
|
33
| • |
In June 2016, we received the Intersolar Award in the Photovoltaics category for our HD-Wave technology inverter and began shipments of our HD-Wave inverter.
|
| • |
In May 2017, we unveiled our new S-Series power optimizer, an Intersolar Award Finalist in the Photovoltaics category.
|
| • |
In July 2017, we launched the world’s first inverter-integrated electric vehicle (EV) charger, supplementing grid power with PV power.
|
| • |
In September 2017, we approved an expansion for our residential offering in Australia with higher production of single-phase inverters and launched a line of three-phase inverters.
|
| • |
In September 2017, we released our DC optimized inverter solution in South Korea.
|
Our revenues were $325.1 million, $489.8 million, $240.0 million, and $607.0 million for fiscal 2015 and 2016, the six months ended December 31, 2016, and fiscal 2017, respectively. Gross margins were 25.2 %, 31.0%, 33.7%, and 35.4 %, for fiscal 2015 and 2016, the six months ended December 31, 2016, and fiscal 2017, respectively. Net profits were $21.1 million, $76.6 million, $25.4 million, and $84.2 million for fiscal 2015 and 2016, for the six months ended December 31, 2016, and fiscal 2017, respectively.
We continue to focus on our long‑term growth and profitability. We believe that our market opportunity is large and that the transition from traditional inverter architecture to DC optimized inverter architecture will continue as the architecture of choice for distributed solar installations globally. We believe that we are well positioned to benefit from this market trend. We intend to continue to invest in sales and marketing to acquire new customers in our existing markets, grow internationally and drive additional revenue. We also plan to expand our product offerings to further penetrate the large commercial and utility segments. We expect to continue to invest in research and development to enhance our product offerings and develop new, cost-effective solutions.
We believe that our strategy results in an efficient operating base with relatively low expenses that will enable profitability on lower revenues relative to our competitors. We believe that our sales and marketing, research and development, and general and administrative costs will decrease as a percentage of revenue in the long‑term as we continue to grow due to economies of scale. With this increased operating leverage, we expect our gross and operating margins to increase in the long‑term. We believe that it is too early to estimate the impact, if any, the newly adopted U.S. tariff imposed on all imported solar modules and cells, may have on the price of solar systems in the United States. If the price of solar systems in the U.S. increases, it may reduce the number of solar systems manufactured and sold, which in turn may decrease demand for our products
Performance Measures
In managing our business and assessing financial performance, we supplement the information provided by the financial statements with other operating metrics. These operating metrics are utilized by our management to evaluate our business, measure our performance, identify trends affecting our business, and formulate projections. We use metrics relating to yearly shipments (inverters shipped, power optimizers shipped, and megawatts shipped) to evaluate our sales performance and to track market acceptance of our products from year to year. We use metrics relating to monitoring (systems monitored and megawatts monitored) to evaluate market acceptance of our products and usage of our solution.
We provide the “megawatts shipped” metric, which is calculated based on nameplate capacity shipped, to show adoption of our system on a nameplate capacity basis. Nameplate capacity shipped is the maximum rated power output capacity of an inverter and corresponds to our financial results in that higher total capacities shipped are generally associated with higher total revenues. However, revenues increase with each additional unit, not necessarily each additional MW of capacity, sold. Accordingly, we also provide the “inverters shipped” and “power optimizers shipped” operating metrics.
34
Key Components of Our Results of Operations
The following discussion describes certain line items in our Consolidated Statements of Operations.
Revenues
We generate revenues from the sale of DC optimized inverter systems for solar PV installations which include power optimizers, inverters, and our cloud‑based monitoring platform. Our customer base includes distributors, large solar installers, wholesalers, EPCs, and PV module manufacturers.
Our revenues are affected by changes in the volume and average selling prices of our DC optimized inverter systems. The volume and average selling price of our systems is driven by the supply and demand for our products, changes in the product mix between our residential and commercial products, the customer mix between large and small customers, the geographical mix of our sales, sales incentives, end‑user government incentives, seasonality, and competitive product offerings.
Our revenue growth is dependent on our ability to expand our market share in each of the geographies in which we compete, expand our global footprint to new evolving markets, grow our production capabilities to meet demand, and to continue to develop and introduce new and innovative products that address the changing technology and performance requirements of our customers.
Cost of Revenues and Gross Profit
Cost of revenues consists primarily of product costs, including purchases from our contract manufacturers and other suppliers, as well as costs related to shipping, customer support, product warranty, personnel, depreciation of test and manufacturing equipment, hosting services for our cloud‑based monitoring platform, and other logistics services. Our product costs are affected by technological innovations, such as advances in semiconductor integration and new product introductions, economies of scale resulting in lower component costs, and improvements in production processes and automation. Some of these costs, primarily personnel and depreciation of test and manufacturing equipment, are not directly affected by sales volume.
We outsource our manufacturing to third‑party manufacturers and negotiate product pricing on a quarterly basis. Our third‑party manufacturers are responsible for funding the capital expenses incurred in connection with the manufacture of our products, except with regard to end-of-line testing equipment and the automated assembly lines for our power optimizers, as further described below (which resulted in capital expenditures of $5.2 million, $1.4 million and $13.6 million for fiscal 2016 for the six months ended December 31, 2016 and fiscal 2017, respectively). We expect to continue this funding arrangement in the future, with respect to any expansions to such existing lines. We also procure strategic and critical components from various approved vendors on behalf of our contract manufacturers. At times, higher than anticipated demand has exceeded the production capacities of these manufacturers. In 2014 and early 2015, for example, such production shortfalls, as well as shortages in the supply of certain raw materials, required us to use air freight, rather than less expensive ocean freight, to deliver the majority of our products. The expansion of current manufacturing sites by our contract manufacturers allowed us to reduce these expenses in fiscal 2015 as well as to build sufficient inventory to continue our growth without the need to ship substantial amounts of products by air. In 2016, we managed to continuously increase the efficiency of our supply chain, reduce our reliance on air freight to a minimum and use ocean freight for the majority of our shipments.
In 2017, global shortages in power components used in our products and in other industries, such as electrical motor drives and uninterrupted power systems (UPS) caused delays in our ongoing manufacturing. This phenomenon combined with increased demand for our products required us use expensive air shipments in order to meet our delivery schedule, which negatively affected our gross profit. We expect component shortages to continue to affect us in upcoming quarters, a combination of increased component safety stocks, qualification of additional suppliers, and increased capacity of our existing vendors coupled with continued expansion of the current manufacturing sites by our contract manufacturers, and the development and deployment of our proprietary automated assembly line (described below), will provide sufficient manufacturing capacity to meet our forecasted demands with lower shipment volumes of products by air freight.
We completed development of our first proprietary automated assembly line for our power optimizers and had 3 additional automated assembly lines deployed in the first half of 2017. We expect to continue to invest in additional automated assembly lines in the future. We have designed and are responsible for funding all of the capital expenses associated with existing and future automated assembly lines. The current and expected capital expenses associated with these automated assembly lines will be funded out of our cash flows.
Key components of our logistics supply channel consist of third party distribution centers in the U.S., Europe, Australia, and Japan. Finished goods are either shipped to our customers directly from our contract manufacturers or shipped to third-party distribution centers and then, finally, shipped to our customers.
35
Cost of revenues also includes our operations and support departments’ costs. The operations department is responsible for production management such as planning, procurement, supply chain, production methodologies, and machinery planning, logistics management and manufacturing support to our contract manufacturers, as well as the quality assurance of our products. Our support department provides customer and technical support at various levels through our call centers around the world as well as second and third-level support services which are provided by support personnel located in our headquarters. Our full‑time employee headcount in our operations and support departments has grown from 106 as of June 30, 2015 to 175 as of June 30, 2016, to 244 as of December 31, 2016, and to 348 as of December 31, 2017.
Gross profit may vary from quarter to quarter and is primarily affected by our average selling prices, product costs, product mix, customer mix, geographical mix, shipping method, warranty costs, and seasonality.
Operating Expenses
Operating expenses consist of research and development, sales and marketing, and general and administrative expenses. Personnel‑related costs are the most significant component of each of these expense categories and include salaries, benefits, payroll taxes, commissions, and stock‑based compensation. Our full‑time employee headcount in our research and development, sales and marketing, and general and administrative departments has grown from 334 as of June 30, 2015 to 434 as of June 30, 2016, to 475 as of December 31, 2016, and to 660 as of December 31, 2017. We expect to continue to hire significant numbers of new employees to support our growth. The timing of these additional hires could materially affect our operating expenses in any particular period, both in absolute dollars and as a percentage of revenue. We expect to continue to invest substantial resources to support our growth and anticipate that each of the following categories of operating expenses will increase in absolute dollar amounts for the foreseeable future.
Research and development expenses, net
Research and development expenses, net include personnel‑related expenses such as salaries, benefits, stock‑based compensation, and payroll taxes. Our research and development employees are engaged in the design and development of power electronics, semiconductors, software, and power line communications and networking. Our research and development expenses also include third‑party design and consulting costs, materials for testing and evaluation, ASIC development and licensing costs, depreciation expense, and other indirect costs. We devote substantial resources to ongoing research and development programs that focus on enhancements to and cost efficiencies in our existing products and timely development of new products that utilize technological innovation, thereby maintaining our competitive position.
Research and development expenses are presented net of the amount of any grants we receive for research and development in the period in which we receive the grant. We previously received grants and other funding from the Binational Industrial Research and Development Foundation and the Israel Innovation Authority (the IIA). Certain of those grants required us to pay royalties on sales of certain of our products, which were recorded as cost of revenues. As of December 31, 2017, no such royalty obligations remained.
Sales and marketing expenses
Sales and marketing expenses consist primarily of personnel‑related expenses such as salaries, sales commissions, benefits, payroll taxes, and stock‑based compensation. These expenses also include travel, fees of independent consultants, trade shows, marketing, costs associated with the operation of our sales offices, and other indirect costs. The expected increase in sales and marketing expenses is due to an expected increase in the number of sales and marketing personnel and the expansion of our global sales and marketing footprint, enabling us to increase our penetration of new markets. While most of our sales in fiscal 2012 (the period beginning July 1, 2011 and ending June 30, 2012) were in Europe, sales in the U.S. have grown steadily since fiscal 2012. Revenues generated in the U.S. represented 68.2 %, 66.8 %, and 57.5 % of our revenues in fiscal 2016, the six months ended December 31, 2016, and fiscal 2017, respectively. Sales in Europe, which represented most of our sales until fiscal 2013 (the period beginning July 1, 2012 and ending June 30, 2013) also increased and represented 22.7 %, 25.2 %, and 32.7 % of our revenues in fiscal 2016, in the six months ended December 31, 2016, and in fiscal 2017, respectively. We currently have a sales presence in the U.S., Canada, France, Germany, Italy, the Netherlands, the United Kingdom, Israel, Turkey, Japan, Australia, China, Sweden, Poland, India, and Belgium. We intend to continue to expand our sales presence to additional countries.
36
General and administrative expenses
General and administrative expenses consist primarily of salaries, employee benefits, payroll taxes, and stock‑based compensation related to our executives, finance, human resources, information technology, and legal organizations, travel expenses, facilities costs, fees for professional services, and registration fees related to being a publicly-traded company. Professional services consist of audit and legal costs, remuneration to board members, tax, insurance, information technology, and other costs. General and administrative expenses also include allowance for doubtful accounts in the event of uncollectable account receivables balances.
Non‑Operating Expenses
Financial income (expenses)
Financial income (expenses) consists primarily of interest income, interest expense, gains or losses from foreign currency fluctuations and hedging transactions, and gains or losses related to re‑measurement of warrants granted in relation to long‑term debt incurred by the Company in December 2012.
Interest income consists of interest from our investment in available for sale marketable securities.
Interest expense consists of interest and other charges paid to Silicon Valley Bank (“SVB”) in connection with our revolving line of credit which expired on December 31, 2016, and interest on our term loan from Kreos, which was fully repaid on January 26, 2015 (both described below).
Gains or losses related to re‑measurement of warrants granted in relation to long‑term debt incurred by the Company in December 2012 are not expected to occur in the future as the warrants were fully exercised on June 18, 2015.
Our functional currency is the U.S. Dollar. With respect to certain of our subsidiaries, the functional currency is the applicable local currency. Financial expenses, net is net of financial income which consists primarily of the effect of foreign exchange differences between the U.S. Dollar and the New Israeli Shekel, the Euro, and other currencies, related to our monetary assets and liabilities, and the realization of gain from hedging transactions.
Taxes on income
We are subject to income taxes in the countries where we operate.
From incorporation through the end of fiscal 2014, we experienced operating losses, and consequently, accumulated a significant amount of operating loss carryforwards in several jurisdictions. By the end of fiscal 2015, we fully utilized our unused operating loss carryforwards with respect to U.S. federal tax obligations. In fiscal 2016, we recorded net income tax expenses of $0.4 million for federal and state tax in the U.S, which consisted of $1.8 million current income tax expenses and $1.4 million deferred tax assets. In the six months ended December 31, 2016, we recorded net income tax expenses of $1.6 million for federal and state tax in the U.S, which consisted of $1.1 million current income tax expenses and $0.5 million deferred tax liabilities. In fiscal 2017, we recorded net income tax expenses of $19.8 million for federal and state tax in the U.S., which consists of $19.9 million current income tax expenses and $0.1 million deferred tax.
On
December 22, 2017, the Tax Cuts and Jobs Act of 2017 (the “TCJA”) was signed into law, making significant changes to the US income tax law. Changes include, but are not limited to, a corporate tax rate decrease from 35% to 21% for tax years beginning after December 31, 2017, the transition of U.S. international taxation from a worldwide tax system to a territorial system, and a one-time transition tax on the mandatory deemed repatriation of foreign earnings as of December 31, 2017. We have estimated our provision for income taxes in accordance with the TCJA and guidance available as of the date of this filing, and as a result, have recorded $19.2 million as additional income tax expense in the fourth quarter of 2017, the period in which the legislation was enacted.
The provisional amount related to the r
emeasurement of certain deferred tax assets and liabilities, based on the rates at which they are expected to reverse in the future, resulted in $0.5 million of additional expense.
The provisional amount related to t
he one-time transition tax on mandatory deemed repatriation of foreign earnings resulted in $18.7 million of additional expense, based on cumulative foreign earnings of $145.0 million.
We have determined that the $0.5 million of the deferred tax expense recorded in connection with the remeasurement of certain deferred tax assets and liabilities and the $18.7 million of current tax expense recorded in connection with the transition tax on the mandatory deemed repatriation of foreign earnings was a provisional amount and a reasonable estimate as of December 31, 2017. Additional work is necessary for a more detailed analysis of our deferred tax assets and liabilities and our historical foreign earnings, as well as potential correlative adjustments. Any subsequent adjustment to these amounts will be recorded to current tax expense in the quarter of 2018 when the analysis is complete.
37
Additionally, the TCJA requires certain Global Intangible Low Taxed Income (“GILTI”) earned by controlled foreign corporations (“CFCs”) to be included in the gross income of the CFCs’ U.S. shareholder. GAAP allows the Company to either: (i) treat taxes due on future U.S. inclusions in taxable income related to GILTI as a current-period expense when incurred (the “period cost method”); or (ii) factor such amounts into its measurement of deferred taxes (the “deferred method”). The GILTI tax rules will become effective for the 2018 tax year and therefore the Company has not made any adjustments related to the potential GILTI tax in its financial statements for the year ended December 31, 2017. The Company continues to evaluate the impact of the new GILTI tax rules and the application of ASC 740 on its financial statements.
SolarEdge Technologies Ltd., our Israeli subsidiary, is taxed under Israeli law. Income not eligible for benefits under the Investment Law is taxed at the corporate tax rate. The corporate tax rate in Israel was 26.5% in fiscal 2015 and 25% in fiscal 2016. Recent amendments of the Israeli Income Tax Ordinance decreased the corporate tax rate to 25% commencing on January 1, 2016, 24% starting January 1, 2017, and 23% starting January 1, 2018. However, our Israeli subsidiary elected tax year 2012 as a "Year of Election" for “Beneficiary Enterprise” under the Israeli Investment Law, which provides certain benefits, including tax exemptions and reduced tax rates. Income not eligible for Beneficiary Enterprise benefits is taxed at the then prevailing regular corporate tax rate. Upon meeting the requirements under the Israeli Investment Law, income derived from productive activity under the Beneficiary Enterprise status will be exempt from tax for two years from the year in which the Israeli subsidiary first generated taxable income, provided that 12 years have not passed from the beginning of the Year of Election. Because SolarEdge Technologies Ltd. used all of its losses carryforwards in the six months ended in December 31, 2016, the two-year tax exemption is expected to end on June 30, 2018. Capital gains derived by an Israeli company are subject to tax at the prevailing corporate tax rate.
In December 2016, the Economic Efficiency Law 2016 (Legislative Amendments for Applying the Economic Policy for the 2017 and 2018 Budget Years), which includes Amendment 73 to the Law for the Encouragement of Capital Investments ("the 2017 Amendment") was published. According to the 2017 Amendment, a preferred enterprise located in development area A (as defined therein and which details specific areas in development in Israel) will be subject to a tax rate of 7.5% instead of 9%, effective from January 1, 2017 and thereafter (the tax rate applicable to preferred enterprises located in other areas remains at 16%).
The Amendment also prescribes special tax tracks for technological enterprises, which are subject to rules that were issued by the Ministry of Finance. In such rules, a “Technological Preferred Enterprise refers to an enterprise whose total consolidated revenues of its parent company and all subsidiaries are less than NIS 10 billion. A Technological Preferred Enterprise, as defined in the 2017 Amendment, that is located in the central region of Israel, will be subject to tax at a rate of 12% on profits deriving from intellectual property (in development area A - a tax rate of 7.5%). SolarEdge Technologies Ltd. will be entitled to an effective tax at a rate of 14.02% under the 2017 Amendment.
Our subsidiaries are subject to taxes in each of the countries in which they operate. All of our products are developed and manufactured by our subsidiary, SolarEdge Technologies Ltd., which sells our products to its customers as well as to other entities in the SolarEdge group, which then sell them to their customers. All intercompany sales of products and services are paid for or reimbursed pursuant to transfer price policies established for each of the countries in which we operate, consistent with arm’s length profit levels.
Due to our history of losses from inception through the end of fiscal 2014, we have recorded a full valuation allowance on our deferred tax assets. In fiscal 2015, the first fiscal year in which we were profitable, we used a portion of our carryforward losses from previous years in Israel and California. In fiscal 2016, we continued being profitable, stopped recording valuation allowances, and started recording deferred tax assets in the amount of $5.0 million in Israel, most of which is related to operating loss carryforward. In the six months ended December 31, 2016, we utilized all of our operating loss carryforwards in Israel and became profitable for tax purposes. As of June 30, 2016, we are entitled to benefit from a 24 months tax exemption until June 30, 2018, as part of the Beneficiary Enterprise Tax Incentive Program extended by the Israeli government.
Results of Operations
The following tables set forth our consolidated statements of operations for the calendar years ended December 31, 2016 and 2017, the six months ended December 31, 2015 and 2016, and for the fiscal years ended June 30, 2015 and 2016. We have derived this data from our consolidated financial statements included elsewhere in this Annual Report. This information should be read in conjunction with our consolidated financial statements and related notes included elsewhere in this this Annual Report. The results of historical periods are not necessarily indicative of the results of operations for any future period.
38
Comparison of year ended December 31, 2016 (unaudited) and year ended December 31, 2017 (audited)
|
Year ended December 31,
|
2016 to 2017
|
|||||||||||||||
|
2016
(unaudited)
|
2017
|
Change
|
||||||||||||||
|
(In thousands)
|
||||||||||||||||
|
Revenues
|
$
|
489,954
|
$
|
607,045
|
$
|
117,091
|
23.9
|
%
|
||||||||
|
Cost of revenues
|
329,207
|
392,279
|
63,072
|
19.2
|
%
|
|||||||||||
|
Gross profit
|
160,747
|
214,766
|
54,019
|
33.6
|
%
|
|||||||||||
|
Operating expenses:
|
||||||||||||||||
|
Research and development, net
|
38,220
|
54,966
|
16,746
|
43.8
|
%
|
|||||||||||
|
Sales and marketing
|
38,200
|
50,032
|
11,832
|
31.0
|
%
|
|||||||||||
|
General and administrative
|
13,317
|
18,682
|
5,365
|
40.3
|
%
|
|||||||||||
|
Total operating expenses
|
89,737
|
123,680
|
33,943
|
37.8
|
%
|
|||||||||||
|
Operating income
|
71,010
|
91,086
|
20,076
|
28.3
|
%
|
|||||||||||
|
Financial income (expenses)
|
(1,287
|
)
|
9,158
|
10,445
|
N/A
|
|||||||||||
|
Income before taxes on income
|
69,723
|
100,244
|
30,521
|
43.8
|
%
|
|||||||||||
|
Taxes on income
|
6,270
|
16,072
|
9,802
|
156.3
|
%
|
|||||||||||
|
Net income
|
$
|
63,453
|
$
|
84,172
|
$
|
20,719
|
32.7
|
%
|
||||||||
Revenues
|
Year Ended
December 31, |
2016 to 2017 |
|||||||||||||||
|
2016
(unaudited)
|
2017
|
Change
|
||||||||||||||
|
(In thousands)
|
||||||||||||||||
|
Revenues
|
$
|
489,954
|
$
|
607,045
|
$
|
117,091
|
23.9
|
%
|
||||||||
Revenues increased by $117.1 million, or 23.9%, in 2017 as compared to 2016, primarily due to an increase in the number of systems sold
outside of the U.S. Specifically, non-U.S. revenues comprised 42.5% of our revenues in 2017 as compared to 34.0% in 2016, with significant growth in revenues coming from Germany and the Netherlands as well as from non-U.S. markets outside of Europe
. The number of power optimizers sold increased by approximately 1.4 million units, or 24.5%, from approximately 5.9 million units in 2016 to approximately 7.3 million units in 2017. The number of inverters sold increased by approximately 82,000 units, or 35.1%, from approximately 234,000 units in 2016 to approximately 316,000 units in 2017. While selling price per product remained relatively stable in 2017, our blended average selling price per watt for units shipped decreased by $0.029, or 10.2%, in 2017 as compared to 2016, primarily due to increased sales of our commercial products which are characterized with lower average selling price per watt and a change in our customer mix, which included larger portion of sales to distribution channels and large customers to whom we provide volume discounts.
39
Cost of Revenues and Gross Profit
|
Year Ended
December 31, |
2016 to 2017
|
|||||||||||||||
|
2016
(unaudited)
|
2017
|
Change
|
||||||||||||||
|
(In thousands)
|
||||||||||||||||
|
Cost of revenues
|
$
|
329,207
|
$
|
392 ,279
|
$
|
63,072
|
19.2
|
%
|
||||||||
|
Gross profit
|
$
|
160,747
|
$
|
214,766
|
$
|
54,019
|
33.6
|
%
|
||||||||
Cost of revenues increased by $63.1 million, or 19.2%, in 2017 as compared to 2016, primarily due to:
| · |
an increase in the volume of products sold;
|
| · |
increased warranty expenses and warranty accruals of $5.3 million associated with the rapid increase in our install base;
|
| · |
increased shipment and logistical costs of $11.1 million attributed, in part, to the growth in volumes shipped, and to an increase in air shipments caused by power component shortages; and
|
| · |
increased personnel-related costs of $8.9 million connected to the expansion of our operations and increased support headcount which is growing in parallel with our growing install base worldwide.
|
Gross profit as a percentage of revenue increased from 32.8% in 2016 to 35.4% in 2017, primarily due to:
| · |
reductions in per-unit production costs
that exceeded price erosion of our products;
|
| · |
increased efficiency in our supply chain;
|
| · |
lower costs associated with warranty product replacements; and
|
| · |
general economies of scale in our personnel-related costs and other costs associated with our support and operations departments.
|
Operating Expenses:
Research and Development, Net
|
Year Ended
December 31, |
2016 to 2017
|
|||||||||||||||
|
2016
(unaudited)
|
2017
|
Change
|
||||||||||||||
|
(In thousands)
|
||||||||||||||||
|
Research and development, net
|
$
|
38,220
|
$
|
54,966
|
$
|
16,746
|
43.8
|
%
|
||||||||
Research and development, net increased by $16.7 million, or 43.8%, in 2017 as compared to 2016, primarily due to:
| · |
an increase in personnel-related costs of $11.7 million as a result of an increased headcount of engineers. The increase in headcount reflects our continuing investment in enhancements of existing products as well as development associated with bringing new products to market;
|
| · |
expenses related to other directly related overhead costs that increased by $2.2 million;
|
| · |
expenses related to consultants and sub‑contractors that increased by $1.1 million;
|
| · |
depreciation expenses related to lab equipment that increased by $1.0 million; and
|
| · |
materials consumption for development, travel expenses and other expenses that increased by $0.7 million.
|
40
Sales and Marketing
|
Year Ended
December 31, |
2016 to 2017
|
|||||||||||||||
|
2016
(unaudited)
|
2017
|
Change
|
||||||||||||||
|
(In thousands)
|
||||||||||||||||
|
Sales and marketing
|
$
|
38,200
|
$
|
50,032
|
$
|
11,832
|
31.0
|
%
|
||||||||
Sales and marketing expenses increased by $11.8 million, or 31.0%, in 2017 as compared to 2016, primarily due to:
| · |
an increase in personnel-related costs of $9.0 million as a result of an increase in headcount supporting our growth in the U.S., Europe,
and Asia, as well as salary increases
;
|
| · |
expenses related to consultants and sub‑contractors that increased by $0.9 million;
|
| · |
expenses related to trade shows and marketing activities that increased by $0.8 million;
|
| · |
expenses related to other directly related overhead costs that increased by $0.7 million; and
|
| · |
expenses related to travel that increased by $0.4 million.
|
General and Administrative
|
Year Ended
December 31, |
2016 to 2017
|
|||||||||||||||
|
2016
(unaudited)
|
2017
|
Change
|
||||||||||||||
|
(In thousands)
|
||||||||||||||||
|
General and administrative
|
$
|
13,317
|
$
|
18,682
|
$
|
5,365
|
40.3
|
%
|
||||||||
General and administrative expenses increased by $5.4 million, or 40.3%, in 2017 as compared to 2016, primarily due to:
| · |
an increase in personnel-related costs of $2.5 million related to (i) higher headcount in the legal, finance, human resources, and information technology department, functions required of a fast-growing public company and (ii) increased expenses related to equity-based compensation and changes in management compensation;
|
| · |
legal expenses increased by $1.8 million mainly due to legal proceedings initiated by us during 2017 and settled by the end of 2017
;
|
| · |
costs related to the accrual of doubtful debts increased by $0.7 million; and
|
| · |
other overhead costs, costs related to being a public company and depreciation, all of which increased by $0.4 million.
|
Financial Income (Expenses)
|
Year Ended
December 31, |
2016 to 2017
|
|||||||||||||||
|
2016
(unaudited)
|
2017
|
Change
|
||||||||||||||
|
(In thousands)
|
||||||||||||||||
|
Financial Income (Expenses)
|
$
|
(1,287
|
)
|
$
|
9,158
|
$
|
10,445
|
N/A
|
||||||||
Financial income was $9.2 million in 2017 as compared to financial expenses of $1.3 million in 2016, primarily due to:
| · |
an increase of $10.6 million in foreign exchange fluctuations between the Euro and the New Israeli Shekel against the U.S. Dollar; and
|
| · |
an increase of $1.0 million in interest income,
net of accretion (amortization) of discount (premium) on marketable securities.
|
41
These increases in financial income were offset by decreases of $1.2 million in costs related to hedging transactions in 2017, as compared to 2016.
Taxes on Income
|
Year Ended
December 31, |
2016 to 2017
|
|||||||||||||||
|
2016
(unaudited)
|
2017
|
Change
|
||||||||||||||
|
(In thousands)
|
||||||||||||||||
|
Taxes on income
|
$
|
6,270
|
$
|
16,072
|
$
|
9,802
|
156.3
|
%
|
||||||||
Taxes on income increased by $9.8 million, or 156.3%, in 2017 as compared to 2016, primarily due to
| · |
a one-time transition tax of $18.7 million on the mandatory deemed repatriation of cumulative foreign earnings as of December 31, 2017;
|
| · |
an increase of $0.6 million in
current tax expenses;
|
| · |
an increase of $9.2 million in deferred tax assets (presented as tax income);
and
|
| · |
$0.3 million of income related to the previous year’s tax credit.
|
Net Income
|
Year Ended
December 31, |
2016 to 2017
|
|||||||||||||||
|
2016
(unaudited)
|
2017
|
Change
|
||||||||||||||
|
(In thousands)
|
||||||||||||||||
|
Net income
|
$
|
63,453
|
$
|
84,172
|
$
|
20,719
|
32.7
|
%
|
||||||||
As a result of the factors discussed above, net income increased by $20.7 million, or 32.7%, in 2017 as compared to 2016.
42
Comparison of the six months ended December 31, 2015 (unaudited) and the six months ended December 31, 2016
|
Six Months Ended December 31,
|
2015 to 2016
|
|||||||||||||||
|
2015
(unaudited) |
2016
|
Change
|
||||||||||||||
|
(In thousands)
|
||||||||||||||||
|
Revenues
|
$
|
239,886
|
$
|
239,997
|
$
|
111
|
0.0
|
%
|
||||||||
|
Cost of revenues
|
167,777
|
159,097
|
(8,680
|
)
|
(5.2
|
)%
|
||||||||||
|
Gross profit
|
72,109
|
80,900
|
8,791
|
12.2
|
%
|
|||||||||||
|
Operating expenses:
|
||||||||||||||||
|
Research and development, net
|
15,290
|
20,279
|
4,989
|
32.6
|
%
|
|||||||||||
|
Sales and marketing
|
17,077
|
20,444
|
3,367
|
19.7
|
%
|
|||||||||||
|
General and administrative
|
5,606
|
6,790
|
1,184
|
21.1
|
%
|
|||||||||||
|
Total operating expenses
|
37,973
|
47,513
|
9,540
|
25.1
|
%
|
|||||||||||
|
Operating income
|
34,136
|
33,387
|
(749
|
)
|
(2.2
|
)%
|
||||||||||
|
Financial expenses
|
1,031
|
2,789
|
1,758
|
170.5
|
%
|
|||||||||||
|
Income before taxes on income
|
33,105
|
30,598
|
(2,507
|
)
|
(7.6
|
)%
|
||||||||||
|
Taxes on income (tax benefit)
|
(5,432
|
)
|
5,217
|
10,649
|
N/A
|
|||||||||||
|
Net income
|
$
|
38,537
|
$
|
25,381
|
$
|
(13,156
|
)
|
(34.1
|
)%
|
|||||||
Six Months Ended December 31, 2016 vs. Six Months Ended December 31, 2015 (unaudited):
| · |
Revenues for the six-month period ended December 31, 2016 remained stable when compared to revenues in the same period in the prior year.
|
| · |
An increase of $8.8 million in gross profit principally due to:
|
| o |
Reductions in per unit production costs
|
| o |
Installation of automatic assembly line for optimizers and self-manufacturing of sub components
|
| o |
Lower costs associated with warranty product replacements
|
| o |
Cash received from our insurance company covering a bad debt from a former customer that declared bankruptcy
|
| · |
An increase of $9.5 million in operating expenses principally due to:
|
| o |
Increase in personnel-related costs to support (1) our continuing investment in enhancements of existing products as well as development associated with bringing new products to market; (2) our growth in the U.S., European, and other markets such as Australia and Japan; and (3) higher headcount in the legal, finance, human resources, and information technology department functions required of a fast-growing publicly-traded company
|
| · |
An increase of $1.8 million in financial
expenses mainly due to:
|
| o |
Foreign exchange fluctuations between the Euro and the New Israeli Shekel against the U.S. Dollar
|
| · |
An increase of $10.6 million in tax expenses
principally
due to:
|
| o |
A reversal of deferred tax assets recorded during fiscal 2016
|
| o |
Exhaustion of carry forwards of net operating loss balances related to our past losses
|
43
Comparison of fiscal year ended June 30, 2015 and fiscal year ended June 30, 2016
|
Fiscal Year Ended June 30,
|
2015 to 2016
|
|||||||||||||||
|
2015
|
2016
|
Change
|
||||||||||||||
|
(In thousands)
|
||||||||||||||||
|
Revenues
|
$
|
325,078
|
$
|
489,843
|
$
|
164,765
|
50.7
|
%
|
||||||||
|
Cost of revenues
|
243,295
|
337,887
|
94,592
|
38.9
|
%
|
|||||||||||
|
Gross profit
|
81,783
|
151,956
|
70,173
|
85.8
|
%
|
|||||||||||
|
Operating expenses:
|
||||||||||||||||
|
Research and development, net
|
22,018
|
33,231
|
11,213
|
50.9
|
%
|
|||||||||||
|
Sales and marketing
|
24,973
|
34,833
|
9,860
|
39.5
|
%
|
|||||||||||
|
General and administrative
|
6,535
|
12,133
|
5,598
|
85.7
|
%
|
|||||||||||
|
Total operating expenses
|
53,526
|
80,197
|
26,671
|
49.8
|
%
|
|||||||||||
|
Operating income
|
28,257
|
71,759
|
43,502
|
154.0
|
%
|
|||||||||||
|
Financial income (expenses)
|
(5,077
|
)
|
471
|
5,548
|
N/A
|
|||||||||||
|
Other expenses
|
104
|
-
|
(104
|
)
|
N/A
|
|||||||||||
|
Income before taxes on income
|
23,076
|
72,230
|
49,154
|
213.0
|
%
|
|||||||||||
|
Taxes on income (tax benefit)
|
1,955
|
(4,379
|
)
|
(6,334
|
)
|
N/A
|
||||||||||
|
Net income
|
$
|
21,121
|
$
|
76,609
|
$
|
55,488
|
262.7
|
%
|
||||||||
Revenues
|
Fiscal Year Ended
June 30, |
2015 to 2016 |
|||||||||||||||
|
2015
|
2016
|
Change
|
||||||||||||||
|
(In thousands)
|
||||||||||||||||
|
Revenues
|
$
|
325,078
|
$
|
489,843
|
$
|
164,765
|
50.7
|
%
|
||||||||
Revenues increased by $164.8 million, or 50.7%, in fiscal 2016 as compared to fiscal 2015, primarily due to an increase in the number of systems sold worldwide, with the U.S. being the largest market. The number of power optimizers sold increased by approximately 2.2 million units, or 62.1%, from approximately 3.5 million units in fiscal 2015 to approximately 5.7 million units in fiscal 2016. The number of inverters sold increased by approximately 72,000 units, or 47.4%, from approximately 152,000 units in fiscal 2015 to approximately 224,000 units in fiscal 2016. The increase in the number of units sold was mainly attributable to an increase in the number of systems sold in the U.S. market and certain countries in Europe. In general, our increase in revenues in fiscal 2016 was attributable to rapid expansion in the U.S. market. Our blended average selling price per watt for units shipped decreased by $0.048, or 13.5%, in fiscal 2016 as compared to fiscal 2015, primarily due to increased sales of our commercial products which are characterized with lower average selling price per watt and a change in our customer mix, which included larger portion of sales to distribution channels and large customers to whom we provide volume discounts.
44
Cost of Revenues and Gross Profit
|
Fiscal Year Ended
June 30, |
2015 to 2016 |
|||||||||||||||
|
2015
|
2016
|
Change
|
||||||||||||||
|
(In thousands)
|
||||||||||||||||
|
Cost of revenues
|
$
|
243,295
|
$
|
337,887
|
$
|
94,592
|
38.9
|
%
|
||||||||
|
Gross profit
|
$
|
81,783
|
$
|
151,956
|
$
|
70,173
|
85.8
|
%
|
||||||||
Cost of revenues increased by $94.6 million, or 38.9%, in fiscal 2016 as compared to fiscal 2015, primarily due to (i) an increase in the volume of products sold; (ii) an increase in personnel-related costs resulting from an increase in our operations and support headcount; (iii) increased warranty expenses associated with the increase in our install base; and (iv) an inventory write-off of $1.0 million related to unrecognized revenues from a customer that filed for bankruptcy. These increases were offset by reductions derived from increased efficiency in our supply chain including a decrease in shipping costs associated with the minimal use of air freight. Gross profit as a percentage of revenue increased from 25.2% fiscal 2015 to 31.0% in fiscal 2016 primarily due to reductions in per unit production costs, cost increased efficiency in our supply chain including the use of more ocean freight shipments rather than air shipments, lower costs associated with warranty product replacements, and general economies of scale in our personnel-related costs and other costs associated with our support and operations departments.
Operating Expenses:
Research and Development, Net
|
Fiscal Year Ended
June 30, |
2015 to 2016 |
|||||||||||||||
|
2015
|
2016
|
Change
|
||||||||||||||
|
(In thousands)
|
||||||||||||||||
|
Research and development, net
|
$
|
22,018
|
$
|
33,231
|
$
|
11,213
|
50.9
|
%
|
||||||||
Research and development, net increased by $11.2 million, or 50.9%, in fiscal 2016 as compared to fiscal 2015, primarily due to an increase in personnel-related costs of $8.0 million as a result of an increased headcount of engineers. The increase in headcount reflects our continuing investment in enhancements of existing products as well as development associated with bringing new products to market. Expenses related to consultants and sub‑contractors, other directly related overhead costs, depreciation related to lab equipment and materials consumption for development increased by $0.7 million, $0.7 million, $0.6 million, and $0.4 million, respectively, in fiscal 2016 as compared to fiscal 2015. In addition, grants received from the IIA decreased by $0.8 million in fiscal 2016 as compared to fiscal 2015.
Sales and Marketing
|
Fiscal Year Ended
June 30, |
2015 to 2016 |
|||||||||||||||
|
2015
|
2016
|
Change
|
||||||||||||||
|
(In thousands)
|
||||||||||||||||
|
Sales and marketing
|
$
|
24,973
|
$
|
34,833
|
$
|
9,860
|
39.5
|
%
|
||||||||
Sales and marketing expenses increased by $9.9 million, or 39.5%, in fiscal 2016 as compared to fiscal 2015, primarily due to an increase in personnel-related costs of $7.3 million as a result of an increase in headcount supporting our growth in the U.S. and Europe. In addition, expenses associated with our worldwide sales offices, travel and other directly related overhead costs, costs related to trade shows and marketing activities and the use of third party vendors, increased by $1.5 million, $0.9 million and $0.2 million, respectively, in fiscal 2016 as compared to fiscal 2015.
45
General and Administrative
|
Fiscal Year Ended
June 30, |
2015 to 2016 |
|||||||||||||||
|
2015
|
2016
|
Change
|
||||||||||||||
|
(In thousands)
|
||||||||||||||||
|
General and administrative
|
$
|
6,535
|
$
|
12,133
|
$
|
5,598
|
85.7
|
%
|
||||||||
General and administrative expenses increased by $5.6 million, or 85.7%, in fiscal 2016 as compared to fiscal 2015, primarily due to an increase in personnel-related costs of $3.3 million related to (i) higher headcount in the legal, finance, human resources, and information technology department functions required of a fast-growing public company and (ii) increased expenses related to equity-based compensation and changes in management compensation. In addition, costs related to accounting, tax, legal and information systems consulting, costs related to being a public company, travel and other directly related overhead costs and costs related to the accrual of doubtful debts increased by $0.9 million, $0.9 million, $0.3 million, and $0.2 million, respectively, in fiscal 2016 as compared to fiscal 2015.
Financial Income (Expenses)
|
Fiscal Year Ended
June 30, |
2015 to 2016 |
|||||||||||||||
|
2015
|
2016
|
Change
|
||||||||||||||
|
(In thousands)
|
||||||||||||||||
|
Financial Income (Expenses)
|
$
|
(5,077
|
)
|
$
|
471
|
$
|
5,548
|
N/A
|
||||||||
Financial income was $0.5 million in fiscal 2016 as compared to financial expenses of $5.1 million in fiscal 2015, primarily due to $6.7 expenses related to re-measurement of certain warrants granted to Kreos in relation to the Kreos Loan in fiscal 2015
, and expenses related to
interest expenses on a term loan received from Kreos Capital IV (Expert Fund) Limited (“Kreos”) in December 2012 (the “Kreos Loan”), and the revolving line of credit from SVB (described below)
as compared to no such expenses in fiscal 2016 due to full repayment of the Kreos Loan and exercise of the warrants by Kreos. Additionally,
income of $1.9 million generated from
hedging transactions
and foreign exchange fluctuations between the Euro and the New Israeli Shekel against the U.S. Dollar in fiscal 2015 as compared to $0.2 million in fiscal 2016, and
$0.7 million interest income, net of accretion (amortization) of discount (premium) on marketable securities and time deposits were generated in fiscal 2016 compared to $0.1 million in fiscal 2015.
Other expenses
|
Fiscal Year Ended
June 30, |
2015 to 2016 |
|||||||||||||||
|
2015
|
2016
|
Change
|
||||||||||||||
|
(In thousands)
|
||||||||||||||||
|
Other expenses
|
$
|
104
|
-
|
$
|
(104
|
)
|
N/A
|
|||||||||
Other expenses of $104 recorded in fiscal 2015 are related to the disposal of furniture and other equipment related to the move to our new offices in Israel.
Taxes on Income
|
Fiscal Year Ended
June 30, |
2015 to 2016 |
|||||||||||||||
|
2015
|
2016
|
Change
|
||||||||||||||
|
(In thousands)
|
||||||||||||||||
|
Taxes on income (tax benefit)
|
$
|
1,955
|
$
|
(4,379
|
)
|
$
|
(6,334
|
)
|
N/A
|
|||||||
Tax benefits were $4.4 million in fiscal 2016 compared to taxes on income of $2.0 million in fiscal 2015, primarily due to the recognizing of a $6.4 million deferred tax asset for the first time in fiscal 2016 and an increase of $0.1 million in current tax expenses for fiscal 2016 as compared to fiscal 2015.
Net Income
|
Fiscal Year Ended
June 30, |
2015 to 2016 |
|||||||||||||||
|
2015
|
2016
|
Change
|
||||||||||||||
|
(In thousands)
|
||||||||||||||||
|
Net income
|
$
|
21,121
|
$
|
76,609
|
$
|
55,488
|
262.7
|
%
|
||||||||
Net income was $76.6 million in fiscal 2016 as compared to a net income of $21.1 million in fiscal 2015.
46
Liquidity and Capital Resources
The following table shows our cash flows from operating activities, investing activities, and financing activities for the stated periods:
|
Fiscal Year ended June 30,
|
Six Months Ended December 31,
|
Fiscal Year ended December 31,
|
||||||||||||||
|
2015
|
2016
|
2016
|
2017
|
|||||||||||||
|
(In thousands)
|
||||||||||||||||
|
Net cash provided by operating activities
|
$
|
12,054
|
$
|
52,427
|
$
|
49,098
|
$
|
136,665
|
||||||||
|
Net cash used in investing activities
|
(13,937
|
)
|
(125,837
|
)
|
(19,747
|
)
|
(85,407
|
)
|
||||||||
|
Net cash provided by financing activities
|
136,953
|
2,779
|
1,284
|
7,240
|
||||||||||||
|
Increase (decrease) in cash and cash equivalents
|
$
|
135,070
|
$
|
(70,631
|
)
|
$
|
30,635
|
$
|
58,498
|
|||||||
As of December 31, 2017, our cash and cash equivalents were $163.2 million. This amount does not include
$
180.4
million invested in available for sale marketable securities and
$1.5 million of restricted cash (primarily held to secure letters of credit to vendors and bank guarantees securing office lease payments). On March 31, 2015, we consummated our initial public offering in which we sold 8,050,000 shares of our common stock at a price of $18.00 per share, resulting in net proceeds of $131.2 million, after deducting underwriting discounts and commissions and $3.6 million in offering expenses. As of December 31, 2017, we maintain the net proceeds received from our initial public offering
as well as cash provided by operating activities
in cash and cash equivalents and in available-for-sale marketable securities. Our principal uses of cash are funding our operations and other working capital requirements. As of December 31, 2017, we have open commitments for capital expenditures in an amount of approximately $23.3 million. These commitments reflect purchases of automated assembly lines and other machinery related to our manufacturing. We believe that cash provided by operating activities as well as our cash and cash equivalents will be sufficient to meet our anticipated cash needs for at least the next 12 months.
Operating Activities
During 2017, cash provided by operating activities was $136.7 million derived mainly from net income of $84.2 million that included $26.8 million of non-cash expenses. An increase of $63.0 million in trade payables and other accounts payable, $20.4 million warranty obligations, $14.1 million in deferred revenues and $9.4 million accruals for employees. This was offset by an increase of $38.1 million in trade receivables, $21.9 million in prepaid expenses and other accounts receivable, $15.7 million in inventories, and $5.5 million in deferred tax assets.
During the six months ended December 31, 2016, cash provided by operating activities was $49.1 million derived mainly from net income of $25.4 million that included $10.0 million of non-cash expenses. An increase of $7.2 million in warranty obligations, $3.0 million accruals for employees and $1.3 million in deferred revenues and a decrease of $14.0 million in inventories, $3.7 million in deferred tax assets and $1.6 million in trade receivables was offset by a decrease of $16.4 million in trade payables and other accounts payable and $0.3 million in lease incentive obligations and an increase of $0.4 million in prepaid expenses and other accounts receivable.
During fiscal 2016, cash provided by operating activities was $52.4 million derived mainly from net income of $76.6 million that included $13.5 million of non-cash expenses. An increase of $19.3 million in warranty obligations, $8.6 million in deferred revenues and $3.3 million accruals for employees and a decrease of $10.5 million in prepaid expenses and other receivables was offset by an increase of $37.3 million in trade receivables, $7.4 million in inventories, $6.4 million in deferred tax assets, and a decrease of $28.3 million in trade payables and other accounts payable.
During fiscal 2015, cash provided by operating activities was $12.1 million derived mainly from net income in the amount of $21.1 million that included $9.7 million of non-cash expenses. An increase of $46.3 million in trade payables and other accounts payable, $13.7 million in warranty obligations, $4.0 million in deferred revenues and $1.7 million in accruals for employees was offset by an increase of $48.5 million in inventories, $19.6 million in prepaid expenses and other receivables, and $16.3 million in trade receivables.
47
Investing Activities
During 2017, net cash used in investing activities was $85.4 million, of which $143.7 million was invested in available-for-sale marketable securities, $21.4 million related to capital investments in laboratory equipment, end of line testing equipment, automated assembly lines, manufacturing tools and leasehold improvements and $0.6 million related to an increase in restricted cash. This was offset by $80.3 million from the maturities of available-for-sale marketable securities.
During the six months ended December 31, 2016, net cash used in investing activities was $19.7 million, of which $40.9 million was invested in available-for-sale marketable securities, $11.0 million related to capital investments in laboratory equipment, end of line testing equipment, automated assembly lines, manufacturing tools and leasehold improvements and $0.6 million related to intangible assets investment. This was offset by $32.8 million from the maturities of available-for-sale marketable securities.
During fiscal 2016, net cash used in investing activities was $125.8 million, of which $118.5 million was invested in available-for-sale marketable securities, $15.7 million related to capital investments in laboratory equipment, end of line testing equipment, automated assembly lines, manufacturing tools and leasehold improvements and $0.8 million related to intangible assets investment. This was offset by $6.4 million from the maturities of available-for-sale marketable securities and a $2.8 million repayment of a security deposit held to secure payments under our previous office lease and the expiration of a letter of credit, which was issued by us to one of our contract manufacturers.
During fiscal 2015, net cash used in investing activities was $13.9 million, of which $11.8 million related to capital investments in laboratory equipment, end of line testing equipment, manufacturing tools and leasehold improvements, $2.0 million related to security deposits held to secure letters of credit to vendors and bank guarantees securing office lease payments, and $0.1 million related to an increase of long term deposits.
Financing Activities
During 2017, net cash provided by financing activities was $7.2 million, all of which is attributed to cash received from the exercise of employee and non-employee stock-base awards.
During the six months ended December 31, 2016, net cash provided by financing activities was $1.3 million, all of which is attributed to cash received from the exercise of employee and non-employee stock-base awards.
During fiscal 2016, net cash provided by financing activities was $2.8 million, of which $3.0 million related to cash received from the exercise of employee and non-employee stock options, offset by $0.2 million attributed to issuance costs related to our initial public offering.
During fiscal 2015, net cash provided by financing activities was $137.0 million, of which $131.4 million was net proceeds from our initial public offering, $24.7 million was net proceeds from our Series E convertible preferred stock issuance, $23.0 million was from short-term borrowings under our revolving line of credit with SVB, and $0.1 million was proceeds from exercise of employee stock options, offset by $36.3 million of repayment of the revolving line of credit with SVB, and $5.9 million of repayment of a term loan.
Debt Obligations
We had no outstanding indebtedness as of December 31, 2016 and 2017. In fiscal 2015, we financed our business in part through debt financing, as described below.
$40 Million Revolving Line of Credit
In February 2015, we amended and restated an agreement with SVB for a revolving line of credit, which permits aggregate borrowings of up to $40 million in an amount not to exceed 80% of the eligible accounts receivable and bears interest, payable monthly, at SVB’s prime rate plus a margin of 0.5% to 2.0%. The revolving line of credit terminated on December 31, 2016 and we had not made borrowings under this revolving line of credit with SVB.
Term Loan
On December 28, 2012, we entered into a term loan agreement with Kreos, providing for a term loan of up to $10 million, which was fully drawn on the closing date. The borrowings under the term loan were primarily used to finance working capital needs. On January 26, 2015, we repaid the entire outstanding balance of the Kreos term loan.
48
Interest on the term loan was payable monthly at a rate of 11.90% per year, compounded on a monthly basis. Principal was paid in 33 equal monthly installments from September 1, 2013 through May 1, 2016, the last of which was prepaid in advance pursuant to the terms of the term loan.
In connection with the term loan agreement, we granted Kreos 563,014 D‑1 Warrants to purchase Series D‑1 convertible preferred shares at an exercise price of $2.309. The D‑1 Warrants were exercised on June 18, 2015 and we issued to Kreos 154,768 shares of common stock.
Contractual Obligations
The following table summarizes our outstanding contractual obligations as of December 31, 2017:
|
Payment Due By Period
|
||||||||||||||||||||
|
Total
|
Less
Than 1 Year |
1 – 3
Years |
4 – 5
Years |
More
Than 5 Years |
||||||||||||||||
|
(In thousands)
|
||||||||||||||||||||
|
Operating leases(1)
|
$
|
23,333
|
$
|
4,520
|
$
|
6,895
|
$
|
4,984
|
$
|
6,934
|
||||||||||
|
Purchase commitments under agreements(2)
|
196,222
|
196,222
|
-
|
-
|
-
|
|||||||||||||||
|
Capital expenditures(3)
|
23,263
|
23,263
|
-
|
-
|
-
|
|||||||||||||||
|
Total
|
$
|
242,818
|
$
|
224,005
|
$
|
6,895
|
$
|
4,984
|
$
|
6,934
|
||||||||||
| (1) |
Represents future minimum lease commitments under non‑cancellable operating lease agreements through which we lease our operating facilities.
|
| (2) |
Represents non‑cancelable amounts associated with our manufacturing contracts. Such purchase commitments are based on our forecasted manufacturing requirements and typically provide for fulfillment within agreed‑upon or commercially standard lead‑times for the particular part or product. The timing and amounts of payments represent our best estimates and may change due to business needs and other factors.
|
| (3) |
Represents non‑cancelable amounts associated with purchases of automated assembly lines and other machinery related to our manufacturing.
|
Off‑Balance Sheet Arrangements
We did not have any off‑balance sheet arrangements in fiscal 2015, fiscal 2016, the six months ended December 31, 2016, or the year ended December 31, 2017.
Critical Accounting Policies and Significant Management Estimates
We prepare our consolidated financial statements in accordance with generally accepted accounting principles in the U.S. (“GAAP”). The preparation of consolidated financial statements also requires us to make estimates and assumptions that affect the reported amounts of assets, liabilities, revenues, costs and expenses, and related disclosures. We base our estimates on historical experience and on various other assumptions that we believe to be reasonable under the circumstances. Actual results could differ significantly from the estimates made by our management. To the extent that there are differences between our estimates and actual results, our future financial statement presentation, financial condition, results of operations, and cash flows will be affected. We believe that the accounting policies discussed below are critical to understanding our historical and future performance, as these policies relate to the more significant areas involving management’s judgments and estimates. Critical accounting policies and estimates are those that we consider the most important to the portrayal of our financial condition and results of operations because they require our most difficult, subjective or complex judgments, often as a result of the need to make estimates about the effects of matters that are inherently uncertain.
Revenue Recognition
We generate revenues from the sale of DC optimized inverter systems for solar PV installations which include our power optimizers, inverters, and cloud‑based monitoring platform. Our worldwide customer base includes large solar installers, distributors, EPCs, and PV module manufacturers. Our products are fully functional at the time of shipment to the customer and do not require production, modification, or customization. We recognize revenues when all of the following conditions are met: (i) persuasive evidence of an arrangement exists; (ii) delivery has occurred; (iii) the price is fixed or determinable; and (iv) collectability is reasonably assured. Provisions for rebates, sales incentives, and discounts to customers are accounted for as reductions in revenue in the same period that the related sales are recorded.
49
We generally sell our products to our customers pursuant to a customer’s standard purchase order and our customary terms and conditions. We do not offer rights to return our products other than for normal warranty conditions, and as such, revenue is recorded upon shipment of products to customers and transfer of title and risk of loss under standard commercial terms. We evaluate the creditworthiness of our customers to determine that appropriate credit limits are established prior to the acceptance and shipment of an order.
We provide our full web‑based monitoring platform free of charge and revenues associated with the service since that date are being recognized ratably over 25 years. In the absence of vendor‑specific objective evidence or third party comparable pricing for such service, management determines the revenue levels of this service based on the costs associated with providing the service plus appropriate margins that reflect management’s best estimate of the selling price. Since May 2013, these revenues were minimal and we do not expect this to become a significant source of revenue in the near future.
In May 2014, the Financial Accounting Standards Board (“FASB”) issued a new standard related to revenue recognition. Under the new standard, revenue is recognized when a customer obtains control of promised goods or services and is recognized in an amount that reflects the consideration which the entity expects to receive in exchange for those goods or services. In addition, the standard requires disclosure of the nature, amount, timing, and uncertainty of revenue and cash flows arising from contracts with customers. The guidance permits two methods of
modification
: retrospectively to each prior reporting period presented (full retrospective method), or retrospectively with the cumulative effect of initially applying the guidance recognized at the date of initial application (the cumulative catch-up transition method). We
will adopt
the new standard
as of January 1, 2018
using the modified retrospective method applied to those contracts which were not substantially completed as of January 1, 2018. The cumulative adjustment will decrease the Company’s retained earnings by $3,875 while increasing the Company’s deferred revenues by the same amount.
The most significant impact of the standard on the Company’s financial statements relates to advance payments received for performance obligations that extend for a period longer than one year. Applying the new standard, such performance obligations relate to warranty extensions, cloud-based monitoring, and other communication services.
Upon adoption, the financing component will result in interest expenses which will be included in the Company consolidated statement of operations to reflect the financial portion cost of the long term deferred revenue that is related to services.
Product Warranty
We provide a standard limited product warranty against defects in materials and workmanship under normal use and service conditions. Our standard warranty period is 25 years for our power optimizers, 12 years for our inverters, and 10 years for our storage interface. In certain cases, customers can purchase extended warranties for inverters that increase the warranty period to up to 25 years.
Our products are designed to meet the warranty periods and our reliability procedures cover component selection, design, accelerated life cycle tests, and end-of-manufacturing line testing. However, since our history in selling power optimizers and inverters is substantially shorter than the warranty period, the calculation of warranty provisions is inherently uncertain.
We accrue for estimated warranty costs at the time of sale based on anticipated warranty claims and actual historical warranty claims experience. Warranty provisions, computed on a per‑unit sold basis, are based on our best estimate of such costs and are included in our cost of revenues. The warranty obligation is determined based on actual and predicted failure rates of the products, cost of replacement and service and delivery costs incurred to correct a product failure. Our warranty obligation requires management to make assumptions regarding estimated failure rates and replacement costs.
In order to predict the failure rate of each of our products, we have established a reliability model based on the estimated mean time between failures (“MTBF”). The MTBF represents the average elapsed time predicted for each product unit between failures during operation. Applying the MTBF failure rate over our install base for each product type and generation allows us to predict the number of failed units over the warranty period and estimates the costs associated with the product warranty. Predicted failure rates are updated periodically based on data returned from the field and new product versions, as are replacement costs which are updated to reflect changes in our actual production costs for our products, subcontractors’ labor costs, and actual logistics costs.
50
Since the MTBF model does not take into account additional non‑systematic failures such as failures caused by workmanship or manufacturing or design‑related issues, and since warranty claims are at times opened for cases in which the error has been triggered by an improper installation, we have developed a supplemental model to predict such cases and recognize the associated expenses ratably over the expected claim period. This model, which is based on actual root cause analysis of returned products, identification of the causes of claims and time until each identified problem is revealed, allows us to better predict actual warranty expenses and is updated periodically based on our experience, taking into account the installed base of approximately 22.7 million power optimizers and approximately 948,000 inverters as of December 31, 2017.
If actual warranty costs differ significantly from these estimates, adjustments may be required in the future, which could adversely affect our gross profit and results of operations. Warranty obligations are classified as short-term and long-term warranty obligations based on the period in which the warranty is expected to be claimed. The warranty provision (short and long-term) was $51.2 million in fiscal 2016, $58.4 million as of December 31, 2016, and $78.8 million as of December 31, 2017.
Inventory Valuation
Our inventories comprise sellable finished goods, raw materials bought on behalf of our contract manufacturers, and faulty units returned under our warranty policy.
Sellable finished goods and raw material inventories are valued at the lower of cost or market, based on the moving average cost method. Certain factors could affect the realizable value of our inventories, including market and economic conditions, technological changes, existing product changes (mainly due to cost reduction activities), and new product introductions. We consider historic usage, expected demand, anticipated sales price, the effect of new product introductions, product obsolescence, product merchantability, and other factors when evaluating the value of inventories. Inventory write‑downs are equal to the difference between the cost of inventories and their estimated fair market value. Inventory write‑downs are recorded as cost of revenues in the accompanying statements of operations and were $2.5 million, $0.1 million, and $1.4 million, in fiscal 2016, the six months ended December 31, 2016, and in the year ended December 31, 2017, respectively.
Faulty products returned under our warranty policy are often refurbished and used as replacement units in warranty cases. Such products are written off upon receipt.
We do not believe that there is a reasonable likelihood that there will be a material change in future estimates or assumptions that we use to record inventory at the lower of cost or market. However, if estimates regarding customer demand are inaccurate or changes in technology affect demand for certain products in an unforeseen manner, we may be exposed to losses that could be material.
Stock‑Based Compensation Expense
We account for stock‑based compensation granted to employees, non‑employee directors, and independent contractors in accordance with ASC 718, “Compensation — Stock Compensation” and ASC 505‑50, “Equity‑Based Payments to Non‑Employees,” which require the measurement and recognition of compensation expense for all stock‑based payment awards based on fair value.
The fair value of each option award is estimated on the grant date using the Black‑Scholes‑Merton option‑pricing model. The stock‑based compensation expense, net of forfeitures, is recognized using a straight‑line basis over the requisite service period of the award, which is generally four years. Estimated forfeitures are based on actual historical pre‑vesting forfeitures.
We recognize compensation expenses for the value of its restricted stock unit (“RSU”) awards, based on the straight-line method over the requisite service period of each of the awards, net of estimated forfeitures. The fair value of each RSU is the market value as determined by the closing price of the common stock on the day of grant.
Key Assumptions
The Black‑Scholes‑Merton option‑pricing model requires the input of highly subjective assumptions, including the fair value of the underlying common stock, the expected volatility of the price of our common stock, the expected term of the option, risk‑free interest rates, and the expected dividend yield of our common stock. These estimates involve inherent uncertainties and the application of management’s judgment. If factors change and different assumptions are used, our stock‑based compensation expense could be materially different in the future. These assumptions are estimated as follows:
| • |
Fair value of our common stock.
Because our stock was not publicly traded prior to March 26, 2015, for periods prior to our initial public offering, we have estimated the fair value of our common stock by using, among other factors, third party valuations at the time of grant of the option, by considering a number of objective and subjective factors, including data from other comparable companies, issuance of convertible preferred stock to unrelated third parties, operating and financial performance, the lack of liquidity of capital stock, and general and industry-specific economic outlook. The fair value of the underlying common stock was determined by the management until such time as the Company’s common stock is listed on an established stock exchange or national market system. Since the completion of our initial public offering, we have valued our common stock by reference to the trading price of our common stock in the public market.
|
51
| • |
Expected term.
The expected term represents the period that our stock‑based awards are expected to be outstanding. For stock option awards that were granted at fair market value, we have based our expected term on the simplified method available under SAB 110, as we do not have sufficient historical experience for determining the expected term of the stock option awards granted. For stock option awards that were granted at fair market value prior to the time that our common stock traded in the public market, we use an expected term that we believe is appropriate under these circumstances, which does not produce a materially different result than determining the expected term for our stock options that were granted with an exercise price at least equal to the then current fair market value of our common stock.
|
| • |
Risk‑free rate.
The risk‑free interest rate is based on the yields of U.S. Treasury securities with maturities similar to the expected terms of the options for each option group.
|
| • |
Dividend yield.
We have never declared or paid any cash dividends and do not presently plan to pay cash dividends in the foreseeable future. Consequently, we used an expected dividend yield of zero.
|
| • |
Volatility.
The expected share price volatility for the shares was determined by examining the historical volatilities of a group of the Company’s industry peers, as there was insufficient trading history of the Company’s shares.
|
If any of the assumptions used in the Black‑Scholes‑Merton model change significantly, future stock‑based compensation awards for employees may differ materially compared with the awards granted previously.
The following table presents the assumptions used to estimate the fair value of options granted to employees during the periods presented:
|
Fiscal Year Ended June 30,
|
Six Months Ended December 31,
|
Year Ended December 31,
|
|||||
|
2015
|
2016
|
2016
|
2017
|
||||
|
Expected term (in years)
|
5.50 – 6.27 years
|
5.50 – 6.11 years
|
6.06 years
|
6.06 years
|
|||
|
Expected volatility
|
46. 5% - 55.1%
|
55.45% - 56.03%
|
55.33% - 55.34%
|
58.08%-58.10%
|
|||
|
Risk‑free rate
|
1.39% - 2.06%
|
1.39% - 1.97%
|
1.28% - 1.34%
|
2.14%-2.17%
|
|||
|
Dividend yield
|
0.00%
|
0.00%
|
0.00%
|
0.00%
|
|||
During fiscal 2015 and 2016, the six months ended December 31, 2016, and the year ended December 2017, we incurred non‑cash stock‑based compensation and employee stock purchase plan expenses of $2,956,000, $9,089,000, $6,600,000, and $17,564,000, respectively. We expect to continue to grant stock-based awards in the future, and to the extent that we do, our actual share‑based compensation expense for employees and consultants recognized will likely increase.
Income taxes:
We account for income taxes in accordance with ASC 740, “Income Taxes.” ASC 740, which prescribes the use of the liability method, whereby deferred tax asset and liability account balances are determined based on differences between financial reporting and tax bases of assets and liabilities, and are measured using the enacted tax rates that will be in effect when the differences are expected to reverse.
We account for uncertain tax positions in accordance with ASC 740. ASC 740-10 contains a two-step approach to recognizing and measuring uncertain tax positions. The first step is to evaluate the tax position taken or expected to be taken in a tax return by determining if the weight of available evidence indicates that it is more likely than not that, on an evaluation of the technical merits, the tax position will be sustained on audit, including resolution of any related appeals or litigation processes. The second step is to measure the tax benefit as the largest amount that is more than 50% (cumulative probability) likely to be realized upon ultimate settlement.
52
We are exposed to market risk in the ordinary course of our business. Market risk represents the risk of loss that may impact our financial position due to adverse changes in financial market prices and rates. Our market risk exposure is primarily a result of fluctuations in foreign currency exchange rates, customer concentrations, and interest rates. We do not hold or issue financial instruments for trading purposes.
Foreign Currency Exchange Risk
Approximately 21.8%, 24.0%, 27.7%, and 37.4% of our revenues for fiscal 2015, fiscal 2016, the six months ended December 31, 2016, and the year ended December 31, 2017, respectively, were earned in non‑U.S. dollar denominated currencies, principally the Euro. Our expenses are generally denominated in the currencies in which our operations are located, primarily the U.S. dollar and New Israeli Shekel, and to a lesser extent, the Euro. Our New Israeli Shekel‑denominated expenses consist primarily of personnel and overhead costs. Our consolidated results of operations and cash flows are, therefore, subject to fluctuations due to changes in foreign currency exchange rates and may be adversely affected in the future due to changes in foreign exchange rates. A hypothetical 10% change in foreign currency exchange rates between the Euro and the U.S. dollar would increase or decrease our net income by $17.7 million for the year ended December 31, 2017. A hypothetical 10% change in foreign currency exchange rates between the New Israeli Shekel and the U.S. dollar would increase or decrease our net income by $7.1 million for the year ended December 31, 2017.
For purposes of our consolidated financial statements, local currency assets and liabilities are translated at the rate of exchange to the U.S. dollar on the balance sheet date and local currency revenues and expenses are translated at the exchange rate as of the date of the transaction or at the average exchange rate to the U.S. dollar during the reporting period.
To date, we have used derivative financial instruments, specifically foreign currency forward contracts, to manage exposure to foreign currency risks by hedging a portion of our account receivable balances denominated in Euros expected to be paid within six months. Our foreign currency forward contracts are expected to mitigate exchange rate changes related to the hedged assets. We do not use derivative financial instruments for speculative or trading purposes.
We had cash and cash equivalents of $144.8 million, $74.0 million, $104.7 million, and $163.2 million at the end of fiscal 2015, 2016, December 31, 2016, and as of December 31, 2017, respectively, which was held for working capital purposes. In addition, we had
available-for-sale marketable securities with an estimated fair value of $
111.6 million, $118.7 million
and $
180.4
million on June 30, 2016, December 31, 2016 and December 31, 2017,
respectively.
We entered into forward contracts and put and call options, to hedge the exchange impacts on assets and liabilities denominated in other than the U.S. dollar. As of December 31, 2017, we had outstanding forward contracts and put and call options to sell Euros for U.S. dollars, in the amount of €54 million, that did not meet the requirement for hedge accounting. We use derivative financial instruments, such as foreign exchange forward contracts, to mitigate the risk of changes in foreign exchange rates on accounts receivable and forecast cash flows denominated in certain foreign currencies. We may not be able to purchase derivative instruments adequate to fully insulate ourselves from foreign currency exchange risks and over the past year we have incurred losses as a result of exchange rate fluctuations on exposures that have not been covered by our hedging strategy.
Additionally, our hedging activities may also contribute to increased losses as a result of volatility in foreign currency markets. If foreign exchange currency markets continue to be volatile, such fluctuations in foreign currency exchange rates could materially and adversely affect our profit margins and results of operations in future periods. Also, the volatility in the foreign currency markets may make it difficult to hedge our foreign currency exposures effectively.
Concentrations of Major Customers
Our trade accounts receivables potentially expose us to a concentration of credit risk with our major customers. For the year ended December 31, 2017, one major customer accounted for 14.8% of total revenues, and as of December 31, 2017, two major customers accounted for approximately 35.2% of our consolidated trade receivables balance. We currently do not foresee a credit risk associated with these receivables. In fiscal 2016, three major customers accounted for 32.5% of our total revenues, in the six months ended December 31, 2016, one major customer accounted for 11.2% of our total revenues.
53
Inflation
We do not believe that inflation had a material effect on our business, financial condition, or results of operations in the last three years. If our costs were to become subject to significant inflationary pressures, we may not be able to fully offset such higher costs through price increases. Our inability or failure to do so could harm our business, financial condition, and results of operations.
Commodity Price Risk
We are subject to risk from fluctuating market prices of certain commodity raw materials, including copper, which are used in our products. Prices of these raw materials may be affected by supply restrictions or other market factors from time to time, and we do not enter into hedging arrangements to mitigate commodity risk. Significant price changes for these raw materials could reduce our operating margins if we are unable to recover such increases from our customers, and could harm our business, financial condition, and results of operations.
54
| INDEX TO CONSOLIDATED FINANCIAL STATEMENTS | |
|
Consolidated Financial Statements
|
|
|
Reports of Independent Registered Public Accounting Firm
|
F-2
|
|
Consolidated Balance Sheets as of December 31, 2017 and 2016 and June 30, 2016
|
F-4
|
|
Consolidated Statements of Operations for the year ended December 31, 2017, the six months ended December 31, 2016, and the years ended June 30, 2016 and 2015
|
F-6
|
|
Consolidated Statements of Comprehensive Income for the year ended December 31, 2017, the six months ended December 31, 2016, and the years ended June 30, 2016 and 2015
|
F-7
|
|
Statements of Changes in Stockholders’ Equity for the year ended December 31, 2017, the six months ended December 31, 2016, and the years ended June 30, 2016 and 2015
|
F-8
|
|
Consolidated Statements of Cash Flows for the year ended December 31, 2017, the six months ended December 31, 2016, and the years ended June 30, 2016 and 2015
|
F-10
|
|
Notes to Consolidated Financial Statements
|
F-12
|
Unaudited Quarterly Results of Operations
The following table sets forth our unaudited quarterly consolidated statements of operations data for each of the fiscal years covered by the financial statements provided with this filing. The data presented below has been prepared on the same basis as the audited consolidated financial statements included elsewhere in this Annual Report and, in the opinion of management, reflects all adjustments, consisting only of normal recurring adjustments, necessary for a fair presentation of this data. This information should be read in conjunction with our consolidated financial statements and related notes included elsewhere in this Annual Report. The results of historical periods are not necessarily indicative of the results of operations for a full year or any future period.
|
Three Months Ending
|
||||||||||||||||||||||||||||||||||||||||
|
Sept. 30,
2015 |
Dec. 31,
2015 |
Mar. 31,
2016 |
June 30,
2016 |
Sept. 30,
2016 |
Dec. 31,
2016 |
Mar. 31,
2017 |
June 30,
2017 |
Sept. 30,
2017 |
Dec. 31,
2017 |
|||||||||||||||||||||||||||||||
|
(In thousands, unaudited)
|
||||||||||||||||||||||||||||||||||||||||
|
Revenues
|
$
|
115,054
|
$
|
124,832
|
$
|
125,205
|
$
|
124,752
|
$
|
128,484
|
$
|
111,513
|
$
|
115,054
|
$
|
136,099
|
$
|
166,552
|
$
|
189,340
|
||||||||||||||||||||
|
Cost of revenues
|
81,527
|
86,250
|
84,471
|
85,639
|
86,609
|
72,488
|
76,378
|
89,033
|
108,498
|
118,370
|
||||||||||||||||||||||||||||||
|
Gross profit
|
33,527
|
38,582
|
40,734
|
39,113
|
41,875
|
39,025
|
38,676
|
47,066
|
58,054
|
70,970
|
||||||||||||||||||||||||||||||
|
Operating expense
|
||||||||||||||||||||||||||||||||||||||||
|
Research and development, net
|
6,991
|
8,299
|
8,709
|
9,232
|
9,935
|
10,344
|
11,458
|
12,725
|
14,363
|
16,420
|
||||||||||||||||||||||||||||||
|
Sales and marketing
|
8,244
|
8,833
|
8,826
|
8,930
|
10,036
|
10,408
|
10,775
|
11,961
|
13,217
|
14,079
|
||||||||||||||||||||||||||||||
|
General and administrative
|
3,418
|
2,188
|
3,460
|
3,067
|
3,664
|
3,126
|
4,439
|
3,265
|
5,078
|
5,900
|
||||||||||||||||||||||||||||||
|
Total operating expenses
|
18,653
|
19,320
|
20,995
|
21,229
|
23,635
|
23,878
|
26,672
|
27,951
|
32,658
|
36,399
|
||||||||||||||||||||||||||||||
|
Operating income
|
14,874
|
19,262
|
19,739
|
17,884
|
18,240
|
15,147
|
12,004
|
19,115
|
25,396
|
34,571
|
||||||||||||||||||||||||||||||
|
Financial income (expenses)
|
(72
|
)
|
(959
|
)
|
2,029
|
(527
|
)
|
390
|
(3,179
|
)
|
1,410
|
3,595
|
2,666
|
1,487
|
||||||||||||||||||||||||||
|
Income before taxes on income
|
14,802
|
18,303
|
21,768
|
17,357
|
18,630
|
11,968
|
13,414
|
22,710
|
28,062
|
36,058
|
||||||||||||||||||||||||||||||
|
Taxes on income (tax benefit)
|
370
|
(5,802
|
)
|
969
|
84
|
3,014
|
2,203
|
(761
|
)
|
186
|
91
|
16,556
|
||||||||||||||||||||||||||||
|
Net income
|
$
|
14,432
|
$
|
24,105
|
$
|
20,799
|
$
|
17,273
|
$
|
15,616
|
$
|
9,765
|
$
|
14,175
|
$
|
22,524
|
$
|
27,971
|
$
|
19,502
|
||||||||||||||||||||
None.
Disclosure Controls and Procedures
Our management, with the participation of our chief executive officer and chief financial officer, evaluated the effectiveness of our disclosure controls and procedures pursuant to Rule 13a-15 under the Securities Exchange Act of 1934, as amended (the “Exchange Act”), as of December 31, 2017. In designing and evaluating the disclosure controls and procedures, management recognized that any controls and procedures, no matter how well designed and operated, can provide only reasonable assurance of achieving the desired control objectives. In addition, the design of disclosure controls and procedures must reflect the fact that there are resource constraints and that management is required to apply its judgment in evaluating the benefits of possible controls and procedures relative to their costs.
55
Based on that evaluation, our chief executive officer and chief financial officer concluded that our disclosure controls and procedures are effective to provide reasonable assurance that information we are required to disclose in reports that we file or submit under the Exchange Act is recorded, processed, summarized, and reported within the time periods specified in SEC rules and forms, and that such information is accumulated and communicated to our management, including our chief executive officer and chief financial officer, as appropriate, to allow timely decisions regarding required disclosure.
Management’s Report on Internal Control Over Financial Reporting
Our management is responsible for establishing and maintaining adequate internal control over financial reporting (as defined in Rules 13a-15(f) and 15d-15(f) under the Exchange Act) to provide reasonable assurance regarding the reliability of our financial reporting and the preparation of consolidated financial statements for external purposes in accordance with U.S. generally accepted accounting principles.
Management assessed our internal control over financial reporting as of December 31, 2017, the end of our 2017 year. Management based its assessment on criteria established in Internal Control—Integrated Framework issued by the Committee of Sponsoring Organizations of the Treadway Commission (2013 framework). Management’s assessment included evaluation of elements such as the design and operating effectiveness of key financial reporting controls, process documentation, accounting policies, and our overall control environment.
Based on this assessment, management has concluded that our internal control over financial reporting was effective as of the end of the year to provide reasonable assurance regarding the reliability of financial reporting and the preparation of consolidated financial statements for external reporting purposes in accordance with U.S. generally accepted accounting principles. We reviewed the results of management’s assessment with the Audit Committee of our Board of Directors.
Our independent registered public accounting firm, Kost Forer Gabbay & Kasierer, a member of Ernst & Young, independently assessed the effectiveness of the company’s internal control over financial reporting, as stated in the firm’s attestation report, which is incorporated by reference into Part II, Item 8 of this Form 10-K.
Our management, including our chief executive officer and chief financial officer, does not expect that our disclosure controls and procedures or our internal control over financial reporting will prevent or detect all errors and all fraud. A control system, no matter how well-designed and operated, can provide only reasonable, not absolute, assurance that the control system’s objectives will be met. The design of a control system must reflect the fact that there are resource constraints, and the benefits of controls must be considered relative to their costs. Further, because of the inherent limitations in all control systems, no evaluation of controls can provide absolute assurance that misstatements due to error or fraud will not occur or that all control issues and instances of fraud, if any, have been detected. The design of any system of controls is based in part on certain assumptions about the likelihood of future events, and there can be no assurance that any design will succeed in achieving its stated goals under all potential future conditions. Projections of any evaluation of the effectiveness of controls to future periods are subject to risks. Over time, controls may become inadequate because of changes in conditions or deterioration in the degree of compliance with policies or procedures.
Changes in Internal Control over Financial Reporting
There have been no changes in our internal control over financial reporting (as defined in Rule 13a-15(f) of the Exchange Act) that occurred during our most recent fiscal quarter that have materially affected, or are reasonably likely to materially affect, our internal control over financial reporting.
None.
56
Except as set forth below, the information required by Item 10 will be included under the captions “
Directors and Corporate Governance”, “The Board’s Role in Risk Oversight”, “Board Committees”, “Director Compensation”, “Compensation Committee Report”,
and “Section 16(a) Beneficial Ownership Reporting Compliance” in our definitive Proxy Statement for the 2018 Annual Meeting of Stockholders to be filed with the SEC within 120 days of the year ending December 31, 2017 (the "2018 Proxy Statement") and is incorporated herein by reference.
Our Executive Officers
|
Name
|
Age
(1)
|
Position(s) Held
|
||
|
Guy Sella
|
53
|
Chief Executive Officer and Chairman of the Board
|
||
|
Ronen Faier
|
46
|
Chief Financial Officer
|
||
|
Rachel Prishkolnik
|
49
|
Vice President, General Counsel & Corporate Secretary
|
||
|
Zvi Lando
|
53
|
Vice President, Global Sales
|
||
|
Lior Handelsman
|
44
|
Vice President, Marketing and Product Strategy
|
||
|
Yoav Galin
|
44
|
Vice President, Research & Development
|
||
|
Meir Adest
|
42
|
Vice President, Core Technologies
|
(1)
As of December 31, 2017.
Guy Sella
is a co‑founder of SolarEdge and has served as Chairman of the board of directors and Chief Executive Officer since 2006. Prior to founding SolarEdge, Mr. Sella was a partner at Star Ventures, a leading venture capital firm, where he led investments in several startups, including AeroScout, Inc. (acquired by Stanley Black & Decker, Inc.) and Vidyo, Inc. Previously, Mr. Sella acted as the director of technology for the Israeli National Security Council and as the secretary for the National Committee for Cyber Protection. Mr. Sella also served as the head of the Electronics Research Department (“ERD”), one of Israel’s national labs, which is tasked with developing innovative and complex systems. Mr. Sella holds a B.S. in Engineering from the Technion, Israel’s Institute of Technology in Haifa. Mr. Sella brings to our board of directors demonstrated senior leadership skills, expertise from years of experience in electronics industries, and historical knowledge of our Company from the time of its founding.
Ronen Faier
joined SolarEdge in 2011 as our Chief Financial Officer. Prior to joining SolarEdge, Mr. Faier served from 2008 to 2010 as the chief financial officer of Modu Ltd, a privately owned Israeli company, which entered into voluntary liquidation proceedings in Israel in December 2010. Between 2004 and 2007, Mr. Faier held several senior finance positions, including chief financial officer at M-Systems prior to its acquisition by SanDisk Corporation in 2006. Previously, Mr. Faier served as corporate controller of VocalTec Communications Ltd. Mr. Faier holds a CPA (Israel) license, an MBA (with Honors) from Tel Aviv University and a B.A. in Accounting and Economics from the Hebrew University in Jerusalem.
Rachel Prishkolnik
joined SolarEdge in 2010 as our Vice President, General Counsel and Corporate Secretary. Prior to joining SolarEdge, Mrs. Prishkolnik served as the vice president, general counsel & corporate secretary of Gilat Satellite Networks Ltd. At Gilat she held various positions beginning as legal counsel in 2001 and becoming corporate secretary in 2004 and vice president, general counsel in 2007. Prior to Gilat, she worked at the law firm of Jeffer, Mangels, Butler & Marmaro LLP in Los Angeles. Before that, Mrs. Prishkolnik worked at Kleinhendler & Halevy (currently GKH Law Offices) in Tel Aviv. Mrs. Prishkolnik holds an LLB law degree from the Faculty of Law at the Tel Aviv University and a B.A. from Wesleyan University in Connecticut. She is licensed to practice law and is a member of the Israeli Bar.
Zvi Lando
joined SolarEdge in 2009 as our Vice President, Global Sales. Mr. Lando had previously spent 16 years at Applied Materials, based in Santa Clara, California, where he held several positions, including process engineer for metal disposition and chemical vapor deposition systems, business manager for the Process Diagnostic and Control Group, vice president, and general manager of the Baccini Cell Systems Division in the Applied Materials Solar Business Group. Mr. Lando holds a BSc in Chemical Engineering from the Technion, Israel’s Institute of Technology in Haifa, and is the author of several publications in the field of chemical disposition.
Lior Handelsman
co‑founded SolarEdge in 2006 and currently serves as our Vice President, Marketing and Product Strategy where he is responsible for SolarEdge’s marketing activities, product management and business development. Previously, Mr. Handelsman served as Vice President, Product Strategy and Business Development, from 2009 through 2013 and Vice President, Product Development, from our founding through 2009. Mr. Handelsman also served as acting Vice President, Operations, from 2008 through 2010. Prior to co‑founding SolarEdge, Mr. Handelsman spent 11 years at the ERD, where he held several positions including research and development power electronics engineer, head of the ERD’s power electronics group and manager of several large-scale development projects and he was a branch head in his last position at the ERD. Mr. Handelsman holds a B.S. in Electrical Engineering (cum laude) and an MBA from the Technion, Israel’s Institute of Technology in Haifa.
57
Yoav Galin
co‑founded SolarEdge in 2006 and has served since our founding as our Vice President, Research & Development where he is responsible for leading the execution of our technology strategy, building and managing the technology team and overseeing research and development of SolarEdge’s innovative PV power harvesting products. Prior to joining SolarEdge, Mr. Galin served for 11 years at the ERD. During this period, Mr. Galin held various research and development and management positions, including his last position at the ERD where he led a project and its development team of over 30 hardware and software engineers. He was also responsible for overseeing the research and development of future technologies. Mr. Galin holds a B.S. in Electrical Engineering from Tel Aviv University.
Meir Adest
co‑founded SolarEdge in 2006 and has served since 2007 as our Vice President, Core Technologies where he is responsible for SolarEdge’s certification and long‑term reliability of SolarEdge products and research of future technologies. Prior to co‑founding SolarEdge, Mr. Adest spent 7 years at the ERD, where he held a number of positions, starting as an embedded software engineer for mission‑critical systems, progressing to the position of a software team leader, managing a large‑scale techno‑operational project, and finally managing a multi‑disciplinary section with approximately 25 hardware and software engineers. Mr. Adest holds a B.Sc in mathematics, physics, and computer science from the Hebrew University in Jerusalem.
Our Board of Directors
The following table sets forth certain information concerning our directors:
|
Name
|
Age
(1)
|
Position(s) Held
|
||
|
Guy Sella
|
53
|
Chief Executive Officer and Chairman of the Board
|
||
|
Dan Avida
|
54
|
Director*
|
||
|
Yoni Cheifetz
|
57
|
Director*
|
||
|
Marcel Gani
|
65
|
Director*
|
||
|
Doron Inbar
|
68
|
Director*
|
||
|
Avery More
|
63
|
Director*
|
||
|
Tal Payne
|
46
|
Director*
|
(1)
As of December 31, 2017.
*
Our board of directors has determined that this director is independent under the standards of the NASDAQ Global Select Market.
Guy Sella.
Please see Item 1 of Part I, “ITEM 1. Business—Executive Officers of the Registrant.”
Dan Avida
has served as a member of our board of directors since 2007. Mr. Avida is a partner at Opus Capital. Before joining Opus Capital in 2005, Mr. Avida served for four years as president and chief executive officer at Decru Inc., a pioneering storage security company that Mr. Avida co‑founded in 2001. Between 1989 and 1999 Mr. Avida was employed by Electronics for Imaging, Inc. (NASDAQ:EFII), where he held a number of positions and ultimately served as chairman and chief executive officer. Prior to Electronics for Imaging, Mr. Avida served as an officer in the Israel Defense Forces. Mr. Avida holds a B.Sc. in Computer Engineering (summa cum laude) from the Technion, the Israel Institute of Technology. Mr. Avida’s historical knowledge of our company and years of experience in working with innovative companies in the United States and Israel provide a valuable perspective to the board of directors.
Yoni Cheifetz
has served as a member of our board of directors since 2010. Since 2006, Mr. Cheifetz has served as a Partner at Lightspeed Venture Partners, where he focuses on investment activity in Israel in areas of interest, including the Internet, general media, mobile, communications, software, semiconductors and cleantech. Prior to joining Lightspeed Venture Partners, Mr. Cheifetz was a partner with Star Ventures from 2003 to 2006. Before joining Star Ventures, Mr. Cheifetz was a serial entrepreneur and the founder, CEO and Chairman of several privately held software companies most of which have been acquired. Mr. Chiefetz holds a B.Sc. in Applied Mathematics from Tel Aviv University and a M.Sc. in Applied Mathematics and Computer Science from the Weizmann Institute of Science. Mr. Cheifetz’s historical knowledge of our company and extensive experience in working with technology companies qualify him to serve as a member of our board of directors.
58
Marcel Gani
has served as a member of our board of directors since 2015. From 2005 to 2009, Mr. Gani lectured at Santa Clara University, where he taught classes on accounting and finance. In 1997, Mr. Gani joined Juniper Networks, Inc. where he served as chief financial officer and executive vice president from December 1997 to December 2004, and as chief of staff from January 2005 to March 2006. Prior to joining Juniper, Mr. Gani served as chief financial officer at various companies, including NVIDIA Corporation, Grand Junction Networks, Primary Access Corporation and Next Computers. Mr. Gani served as corporate controller at Cypress Semiconductor from 1991 to 1992. Prior to joining Cypress Semiconductor, Mr. Gani worked at Intel Corporation from 1978 to 1991. Mr. Gani holds a B.A. in Applied Mathematics from Ecole Polytechnique Federal and an M.B.A. from University of Michigan, Ann Arbor. Mr. Gani serves on the board of directors of Infinera, where he is a member of the audit committee and the chairman of the compensation committee. Mr. Gani brings valuable financial and business experience to our board through his years of experience as a chief financial officer with public companies and experience as a director of other public companies.
Doron Inbar
has served as a member of our board of directors since 2010. Mr Inbar has been a venture partner at Carmel Ventures, an Israeli‑based venture capital firm that invests primarily in early stage companies in the fields of software, communications, semiconductors, internet, media, and consumer electronics, since 2006. Previously, Mr. Inbar served as the president of ECI Telecom Ltd., a global telecom networking infrastructure provider, from November 1999 to December 2005 and its chief executive officer from February 2000 to December 2005. Mr. Inbar joined ECI Telecom Ltd. in 1983 and during his first eleven years with the company, served in various positions at its wholly‑owned U.S. subsidiary, ECI Telecom, Inc., in the U.S., including executive vice president and General Manager. In July 1994, Mr. Inbar returned to Israel to become vice president, corporate budget, control and subsidiaries of ECI Telecom Ltd. In June 1996, Mr. Inbar was appointed senior vice president and chief financial officer of ECI Telecom Ltd., and he became executive vice president of ECI Telecom Ltd. in January 1999. Mr. Inbar has served on the board of directors of Alvarion Ltd. (formerly NASDAQ: ALVR), a company that sells broadband wireless and Wi‑Fi products, from September 2009 until September 2013 and was a member of its audit and compensation committees and served as chairman of its nominating and governance committee. Mr. Inbar also served on the board of directors of Archimedes Global Ltd. from 2008 until 2017, a company which provides health insurance and health provision in Eastern Europe, and serves on the board of directors of MaccabiDent Ltd., the largest chain of dental service clinics in Israel. In 2012, Mr. Inbar joined the board of directors of Comverse Technology Inc. (formerly NASDAQ: CNSI), where he was a member of the audit committee and corporate governance committee until August 2016. Mr. Inbar served also as a board member and management consultant at Degania Medical Ltd., a medical device designer and manufacturer, and serves as a board member and management advisor to the board of Tzinorot Ltd. and Cellwize Wireless Technologies Ltd., a developer of innovative wireless solutions. Previously, Mr. Inbar served as chairman of the board of C‑nario Ltd., a global provider of digital signage software solutions, chairman of the board of Followap Ltd., which was sold to Neustar, Inc. in November 2006, and chairman of the board of Enure Networks Ltd. Mr. Inbar holds a B.A. in Economics and Business Administration from Bar‑Ilan University, Israel.
Avery More
has served as a member of our board of directors since 2006. Mr. More was the sole seed investor in the Company through his fund, ORR Partners I, L.P., and has participated in all successive rounds. Mr. More joined Menlo Ventures in 2013 as a venture partner, and focuses on investments in technology companies. Prior to joining Menlo Ventures, Mr. More was the president and chief executive officer of CompuCom Systems Inc. from 1989 to 1993. Mr. More currently serves on the board of directors of Vidyo, Inc., QualiSystems Ltd., Takipi, BuzzStream, AppDome, and Dome9. Mr. More has specific attributes that qualify him to serve as a member of our board of directors, including his historical knowledge of our company and his experience as a director of other private and public technology companies.
Tal Payne
has served as a member of our board of directors since 2015. Tal Payne brings over 15 years of financial management experience, serving as Chief Financial Officer in Check Point Software Technologies Ltd. (“Check Point”) since joining in 2008 and as Chief Financial and Operations Officer since 2015. Ms. Payne oversees Check Point’s global operations and finance, including investor relations, legal, treasury, purchasing and facilities. Prior to joining Check Point, Ms. Payne served as Chief Financial Officer at Gilat Satellite Networks, Ltd., where she held the role of Vice President of Finance for over five years. Ms. Payne began her career as a CPA in public accounting at PricewaterhouseCoopers. Ms. Payne holds a B.A. in Economics and Accounting and an Executive M.B.A., both from Tel Aviv University. Ms. Payne is a certified public accountant. Ms. Payne brings valuable financial and business experience to our board through her years of experience as a chief financial officer with publicly traded companies.
The information required by Item 11 will be included under the captions “
Executive Compensation”
in our 2018 Proxy Statement and is incorporated herein by reference.
59
| ITEM 12. |
SECURITY OWNERSHIP OF CERTAIN BENEFICIAL OWNERS AND MANAGEMENT AND RELATED STOCKHOLDER MATTERS
|
Except as set forth below, the information required by Item 12 will be included under the captions
“Security Ownership of Certain Beneficial Owners and Management”
in our 2018 Proxy Statement and is incorporated herein by reference.
Equity Compensation Plan Information
The following table summarizes information as of December 31, 2017, about shares of common stock that may be issued under our equity compensation plans.
|
Plan Category
|
Number of securities to be issued upon exercise of outstanding stock awards(a)
|
Weighted-average exercise price of outstanding stock awards
(b)
|
Number of securities remaining available for future issuance under equity compensation plans (excluding securities reflected in column (a))
(c)
|
|||||||||
|
Equity compensation plans approved by security holders
(1)
|
5,676,231
|
$
|
4.63
|
3,035,903
|
||||||||
|
Equity compensation plans not approved by security holders
|
—
|
—
|
—
|
|||||||||
|
Total
|
5,676,231
|
$
|
4.63
|
3,035,903
|
||||||||
______________________________
| (1) |
Includes in column (a) 3,005,562 shares of common stock issuable upon exercise of stock awards outstanding under the Company’s 2015 Global Incentive Plan, 2,670,669 shares of common stock issuable upon exercise of options outstanding under the Company’s 2007 Global Incentive Plan. Includes in column (c) 2,003,126 shares of common stock available for future issuance under the Company’s 2015 Global Incentive Plan and 1,032,777 shares of common stock available for future issuance under the Company’s Employee Stock Purchase Plan. Upon consummation of our initial public offering, the Company’s 2007 Global Incentive Plan was terminated and no further awards can be granted under this plan.
|
Employee Stock Purchase Plan
We have adopted an employee stock purchase plan (“ESPP”), pursuant to which our eligible employees and eligible employees of our subsidiaries may elect to have payroll deductions made during the offering period in an amount not exceeding 10% of the compensation which the employees receive on each pay day during the offering period. In the second quarter of calendar 2016, we started granting eligible employees the right to purchase our common stock under the ESPP. As of December 31, 2017, a total of 1,301,154 shares were reserved for issuance under the ESPP. The number of shares of common stock reserved for issuance under the ESPP will increase annually on January 1st, for ten years, by the lesser of 1% of the total number of shares of the Company’s common stock outstanding on December 31st of the preceding calendar year or 487,643 shares. Our board of directors may reduce the number of shares to be added to the share reserve for the ESPP in any particular year at their discretion. As of June 30, 2016, no shares of our common stock had yet been purchased under the ESPP. As of December 31, 2016 and 2017, 83,319 and 268,377 common stock shares had been purchased under the ESPP, respectively.
The information required by Item 13 will be included under the captions “
Transactions with Related Persons”
in our 2018 Proxy Statement and is incorporated herein by reference.
The information required by Item 14 will be included under the captions “
Audit and Related Fees
” in our 2018 Proxy Statement and is incorporated herein by reference.
60
Our Consolidated Financial Statements and Notes thereto are included in ITEM 8 of this Annual Report on Form 10-K. See Index to ITEM 8 for more detail.
All financial schedules have been omitted either because they are not applicable or because the required information is provided in our Consolidated Financial Statements and Notes thereto, included in ITEM 8 of this Annual Report on Form 10-K.
Index to Exhibits
|
Exhibit
No.
|
|
Description
|
|
Incorporation by Reference
|
|
Incorporated by reference to Exhibit 4.1 to Form S-8 (Registration No. 333-203193) filed with the SEC on April 2, 2015
|
||||
|
Incorporated by reference to Exhibit 4.2 to Form S-8 (Registration No. 333-203193) filed with the SEC on April 2, 2015
|
||||
|
Incorporated by reference to Exhibit 4.1 of Amendment No. 1 to Form S-1 (Registration No. 333-202159) filed with the SEC on March 11, 2015
|
||||
|
Incorporated by reference to Exhibit 10.2 of Amendment No. 1 to Form S-1 (Registration No. 333-202159) filed with the SEC on March 11, 2015
|
||||
|
Incorporated by reference to Exhibit 10.3 of Amendment No. 1 to Form S-1 (Registration No. 333-202159) filed with the SEC on March 11, 2015
|
||||
|
Incorporated by reference to Exhibit 10.3 of Amendment No. 1 to Form S-1 (Registration No. 333-202159) filed with the SEC on March 11, 2015
|
||||
|
Incorporated by reference to Exhibit 99.3 to Form S-8 (Registration No. 333-203193) filed with the SEC on April 2, 2015
|
||||
|
Incorporated by reference to Exhibit 99.1 to Form S-8 (Registration No. 333-203193) filed with the SEC on April 2, 2015
|
||||
|
Incorporated by reference to Exhibit 99.2 to Form S-8 (Registration No. 333-203193) filed with the SEC on April 2, 2015
|
||||
|
Incorporated by reference to Exhibit 10.10 to Form S-1 (Registration No. 333-202159) filed with the SEC on February 18, 2015
|
||||
|
Incorporated by reference to Exhibit 10.11 to Form S-1 (Registration No. 333-202159) filed with the SEC on February 18, 2015
|
61
† Management contract or compensatory plan or arrangement.
# Confidential treatment has been requested with respect to certain portions of this exhibit. Omitted portions have been filed separately with the Securities and Exchange Commission.
62
SOLAREDGE TECHNOLOGIES, INC.
AND ITS SUBSIDIARIES.
CONSOLIDATED FINANCIAL STATEMENTS
AS OF DECEMBER 31, 2017
AUDITED
INDEX
|
Page
|
|
|
F-2
|
|
|
F-4
|
|
|
F-6
|
|
|
F-7
|
|
|
F-8
|
|
|
F-10
|
|
|
F-12
|

|
Kost Forer Gabbay & Kasierer
144 Menachem Begin St.
Tel-Aviv 6492102, Israel
|
Tel: +972-3-6232525
Fax: +972-3-5622555
ey.com
|
To the Stockholders and the Board of Directors of
SOLAREDGE TECHNOLOGIES, INC.
Opinion on the Financial Statements
We have audited the accompanying consolidated balance sheets of SolarEdge Technologies, Inc. and subsidiaries (the “Company”) as
of December 31, 2017, December 31, 2016 and June 30, 2016 and
the related consolidated statements of operations, comprehensive income, changes in stockholders’ equity and cash flows for the year ended December 31, 2017, the period from July 1, 2016 to December 31, 2016, and each of the two fiscal years in the period ended June 30, 2016, and related notes (collectively referred to as the "financial statements"). In our opinion, the financial statements present fairly, in all material respects, the consolidated financial position of the Company as of December 31, 2017, December 31, 2016 and June 30, 2016, and the consolidated results of its operations and its cash flows for the year ended December 31, 2017, the period from July 1, 2016 to December 31, 2016, and each of the two fiscal years in the period ended June 30, 2016, in conformity with U.S. generally accepted accounting principles.
We also have audited, in accordance with the standards of the Public Company Accounting Oversight Board (United States) (PCAOB), the Company's internal control over financial reporting as of December 31, 2017, based on criteria established in Internal Control-Integrated Framework issued by the Committee of Sponsoring Organizations of the Treadway Commission (2013 framework) and our report dated
February 20, 2018
expressed an unqualified opinion thereon.
Basis for Opinion
These financial statements are the responsibility of the Company’s management. Our responsibility is to express an opinion on the Company's consolidated financial statements based on our audits. We are a public accounting firm registered with the PCAOB and are required to be independent with respect to the Company in accordance with the U.S. federal securities laws and the applicable rules and regulations of the Securities and Exchange Commission and the PCAOB.
We conducted our audits in accordance with the standards of the PCAOB. Those standards require that we plan and perform the audit to obtain reasonable assurance about whether the financial statements are free of material misstatement, whether due to error or fraud. Our audits included performing procedures to assess the risks of material misstatement of the financial statements, whether due to error or fraud, and performing procedures that respond to those risks. Such procedures included examining, on a test basis, evidence regarding the amounts and disclosures in the financial statements. Our audits also included evaluating the accounting principles used and significant estimates made by management, as well as evaluating the overall presentation of the financial statement. We believe that our audits provide a reasonable basis for our opinion.
/s/ Kost Forer Gabbay & Kasierer
Kost Forer Gabbay & Kasierer, a Member of Ernst & Young Global
We have served as the Company's auditor since 2007
|
Tel-Aviv, Israel
|
|
|
February 20, 2018
|
F - 2
|
|
Kost Forer Gabbay & Kasierer
144 Menachem Begin St.
Tel-Aviv 6492102, Israel
|
Tel: +972-3-6232525
Fax: +972-3-5622555
ey.com
|
REPORT OF INDEPENDENT REGISTERED PUBLIC ACCOUNTING FIRM
To the Stockholders and the Board of Directors of
SOLAREDGE TECHNOLOGIES, INC.
Opinion on Internal Control over Financial Reporting
We have audited SolarEdge Technologies, Inc. and its subsidiaries internal control over financial reporting as of December 31, 2017, based on criteria established in Internal Control - Integrated Framework issued by the Committee of Sponsoring Organizations of the Treadway Commission (2013 framework) (the COSO criteria). In our opinion, SolarEdge Technologies, Inc. and its subsidiaries (the "Company")
maintained, in all material respects, effective internal control over financial reporting as of December 31, 2017, based on the COSO criteria.
We also have audited, in accordance with the standards of the Public Company Accounting Oversight Board (United States) (PCAOB), the consolidated balance sheets of SolarEdge Technologies, Inc. and its subsidiaries as of
December 31, 2017, December 31, 2016, and June 30, 2016
and the related consolidated statements of operations, comprehensive income, changes in stockholders’ equity and cash flows for the year ended December 31, 2017, the period from July 1, 2016 to December 31, 2016, and each of the two fiscal years in the period ended June 30, 2016 and our report dated
February 20
, 2018 expressed an unqualified opinion thereon.
Basis for Opinion
The Company's management is responsible for maintaining effective internal control over financial reporting, and for its assessment of the effectiveness of internal control over financial reporting included in the accompanying Management’s Report on Internal Control Over Financial Reporting. Our responsibility is to express an opinion on the Company’s internal control over financial reporting based on our audit. We are a public accounting firm registered with the PCAOB and are required to be independent with respect to the Company in accordance with the U.S. federal securities laws and the applicable rules and regulations of the Securities and Exchange Commission and the PCAOB.
We conducted our audit in accordance with the standards of the PCAOB. Those standards require that we plan and perform the audit to obtain reasonable assurance about whether effective internal control over financial reporting was maintained in all material respects.
Our audit included obtaining an understanding of internal control over financial reporting, assessing the risk that a material weakness exists, testing and evaluating the design and operating effectiveness of internal control based on the assessed risk, and performing such other procedures as we considered necessary in the circumstances. We believe that our audit provides a reasonable basis for our opinion.
Definition and Limitations of Internal Control Over Financial Reporting
A company’s internal control over financial reporting is a process designed to provide reasonable assurance regarding the reliability of financial reporting and the preparation of financial statements for external purposes in accordance with generally accepted accounting principles. A company’s internal control over financial reporting includes those policies and procedures that (1) pertain to the maintenance of records that, in reasonable detail, accurately and fairly reflect the transactions and dispositions of the assets of the company; (2) provide reasonable assurance that transactions are recorded as necessary to permit preparation of financial statements in accordance with generally accepted accounting principles, and that receipts and expenditures of the company are being made only in accordance with authorizations of management and directors of the company; and (3) provide reasonable assurance regarding prevention or timely detection of unauthorized acquisition, use, or disposition of the company’s assets that could have a material effect on the financial statements.
Because of its inherent limitations, internal control over financial reporting may not prevent or detect misstatements. Also, projections of any evaluation of effectiveness to future periods are subject to the risk that controls may become inadequate because of changes in conditions, or that the degree of compliance with the policies or procedures may deteriorate.
/s/ Kost Forer Gabbay & Kasierer
Kost Forer Gabbay & Kasierer, a Member of Ernst & Young Global
|
Tel-Aviv, Israel
|
|
|
February 20, 2018
|
F - 3
SOLAREDGE TECHNOLOGIES, INC.
U.S. dollars in thousands (except share and per share data)
|
December 31,
|
December 31,
|
June 30,
|
||||||||||
|
2017
|
2016
|
2016
|
||||||||||
|
ASSETS
|
||||||||||||
|
CURRENT ASSETS:
|
||||||||||||
|
Cash and cash equivalents
|
$
|
163,163
|
$
|
104,683
|
$
|
74,032
|
||||||
|
Restricted cash
|
1,516
|
897
|
928
|
|||||||||
|
Marketable securities
|
77,264
|
74,465
|
59,163
|
|||||||||
|
Trade receivables, net
|
109,528
|
71,041
|
72,737
|
|||||||||
|
Prepaid expenses and other accounts receivable
|
42,223
|
21,347
|
21,340
|
|||||||||
|
Inventories
|
82,992
|
67,363
|
81,550
|
|||||||||
|
Total
current assets
|
476,686
|
339,796
|
309,750
|
|||||||||
|
LONG-TERM ASSETS:
|
||||||||||||
|
Marketable securities
|
103,120
|
44,262
|
52,446
|
|||||||||
|
Property, equipment and intangible assets, net
|
52,297
|
37,381
|
28,547
|
|||||||||
|
Prepaid expenses and lease deposits
|
862
|
489
|
399
|
|||||||||
|
Deferred tax assets, net
|
8,340
|
2,815
|
6,296
|
|||||||||
|
Total
long term assets
|
164,619
|
84,947
|
87,688
|
|||||||||
|
Total
assets
|
$
|
641,305
|
$
|
424,743
|
$
|
397,438
|
||||||
The accompanying notes are an integral part of the consolidated financial statements.
F - 4
SOLAREDGE TECHNOLOGIES, INC.
CONSOLIDATED BALANCE SHEETS
U.S. dollars in thousands (except share and per share data)
|
December 31,
|
December 31,
|
June 30,
|
||||||||||
|
2017
|
2016
|
2016
|
||||||||||
|
LIABILITIES AND STOCKHOLDERS’ EQUITY
|
||||||||||||
|
CURRENT LIABILITIES:
|
||||||||||||
|
Trade payables, net
|
$
|
69,488
|
$
|
34,001
|
$
|
48,481
|
||||||
|
Employees and payroll accruals
|
22,544
|
13,018
|
10,092
|
|||||||||
|
Warranty obligations
|
14,785
|
13,616
|
14,114
|
|||||||||
|
Deferred revenues
|
2,559
|
1,202
|
3,859
|
|||||||||
|
Accrued expenses and other accounts payables
|
20,378
|
8,648
|
10,725
|
|||||||||
|
Total
current liabilities
|
129,754
|
70,485
|
87,271
|
|||||||||
|
LONG-TERM LIABILITIES:
|
||||||||||||
|
Warranty obligations
|
64,026
|
44,759
|
37,078
|
|||||||||
|
Deferred revenues
|
31,453
|
18,660
|
14,684
|
|||||||||
|
Lease incentive obligation
|
1,765
|
2,061
|
2,297
|
|||||||||
|
Non-current tax liabilities
|
16,840
|
-
|
-
|
|||||||||
|
Total
long-term liabilities
|
114,084
|
65,480
|
54,059
|
|||||||||
|
COMMITMENTS AND CONTINGENT LIABILITIES
|
||||||||||||
|
STOCKHOLDERS’ EQUITY:
|
||||||||||||
|
Share capital
|
||||||||||||
|
Common stock of $0.0001 par value - Authorized: 125,000,000 shares as of December 31, 2017,
2016, and June 30, 2016; issued and outstanding: 43,812,601, 41,259,391, 40,889,922 shares
as of December 31, 2017 , 2016 and June 30, 2016, respectively.
|
4
|
4
|
4
|
|||||||||
|
Additional paid-in capital
|
331,902
|
307,098
|
299,214
|
|||||||||
|
Accumulated other comprehensive income (loss)
|
(611
|
)
|
(324
|
)
|
271
|
|||||||
|
Retained earnings (Accumulated deficit)
|
66,172
|
(18,000
|
)
|
(43,381
|
)
|
|||||||
|
Total
stockholders’ equity
|
397,467
|
288,778
|
256,108
|
|||||||||
|
Total
liabilities and stockholders’ equity
|
$
|
641,305
|
$
|
424,743
|
$
|
397,438
|
||||||
The accompanying notes are an integral part of the consolidated financial statements.
F - 5
SOLAREDGE TECHNOLOGIES, INC.
U.S. dollars in thousands (except share and per share data)
|
Year ended
December 31,
|
Six months ended December 31,
|
Year ended
June 30,
|
||||||||||||||
|
2017
|
2016
|
2016
|
2015
|
|||||||||||||
|
Revenues
|
$
|
607,045
|
$
|
239,997
|
$
|
489,843
|
$
|
325,078
|
||||||||
|
Cost of revenues
|
392,279
|
159,097
|
337,887
|
243,295
|
||||||||||||
|
Gross profit
|
214,766
|
80,900
|
151,956
|
81,783
|
||||||||||||
|
Operating expenses:
|
||||||||||||||||
|
Research and development, net
|
54,966
|
20,279
|
33,231
|
22,018
|
||||||||||||
|
Sales and marketing
|
50,032
|
20,444
|
34,833
|
24,973
|
||||||||||||
|
General and administrative
|
18,682
|
6,790
|
12,133
|
6,535
|
||||||||||||
|
Total
operating expenses
|
123,680
|
47,513
|
80,197
|
53,526
|
||||||||||||
|
Operating income
|
91,086
|
33,387
|
71,759
|
28,257
|
||||||||||||
|
Other expenses
|
-
|
-
|
-
|
104
|
||||||||||||
|
Financial income (expenses), net
|
9,158
|
(2,789
|
)
|
471
|
(5,077
|
)
|
||||||||||
|
Income before taxes on income
|
100,244
|
30,598
|
72,230
|
23,076
|
||||||||||||
|
Taxes on income (tax benefit)
|
16,072
|
5,217
|
(4,379
|
)
|
1,955
|
|||||||||||
|
Net income
|
$
|
84,172
|
$
|
25,381
|
$
|
76,609
|
$
|
21,121
|
||||||||
|
Net basic earnings per share of common stock
|
$
|
1.99
|
$
|
0.62
|
$
|
1.92
|
$
|
0.30
|
||||||||
|
Net diluted earnings per share of common stock
|
$
|
1.85
|
$
|
0.58
|
$
|
1.73
|
$
|
0.27
|
||||||||
|
Weighted average number of shares used in computing net basic earnings per share of common stock
|
42,209,238
|
41,026,926
|
39,987,935
|
11,902,911
|
||||||||||||
|
Weighted average number of shares used in computing net diluted earnings per share of common stock
|
45,425,307
|
43,839,342
|
44,376,075
|
15,269,448
|
||||||||||||
The accompanying notes are an integral part of the consolidated financial statements.
F - 6
SOLAREDGE TECHNOLOGIES, INC.
U.S. dollars in thousands (except share and per share data)
|
Year ended
December 31,
|
Six months ended December 31,
|
Year ended
June 30, |
||||||||||||||
|
2017
|
2016
|
2016
|
2015
|
|||||||||||||
|
Net income
|
$
|
84,172
|
$
|
25,381
|
$
|
76,609
|
$
|
21,121
|
||||||||
|
Other comprehensive income (loss):
|
||||||||||||||||
|
Available-for-sale securities:
|
||||||||||||||||
|
Changes in unrealized gains, net of tax benefit
|
(297
|
)
|
(193
|
)
|
56
|
-
|
||||||||||
|
Reclassification adjustments for losses included in net income
|
-
|
-
|
1
|
-
|
||||||||||||
|
Net change
|
(297
|
)
|
(193
|
)
|
57
|
-
|
||||||||||
|
Cash flow hedges:
|
||||||||||||||||
|
Changes in unrealized gains, net of tax expense
|
975
|
93
|
412
|
-
|
||||||||||||
|
Reclassification adjustments for gains, net of tax expense included in net income
|
(994
|
)
|
(317
|
)
|
(169
|
)
|
-
|
|||||||||
|
Net change
|
(19
|
)
|
(224
|
)
|
243
|
-
|
||||||||||
|
Foreign currency translation adjustments, net
|
29
|
(178
|
)
|
193
|
(161
|
)
|
||||||||||
|
Total other comprehensive income (loss)
|
(287
|
)
|
(595
|
)
|
493
|
(161
|
)
|
|||||||||
|
Comprehensive income
|
$
|
83,885
|
$
|
24,786
|
$
|
77,102
|
$
|
20,960
|
||||||||
The accompanying notes are an integral part of the consolidated financial statements.
F - 7
SOLAREDGE TECHNOLOGIES, INC.
U.S. dollars in thousands (except share data)
|
Convertible
Preferred stock
|
Common stock
|
Additional paid in
Capital
|
Accumulated
other comprehensive
Income (loss)
|
Retained earnings (Accumulated
Deficit)
|
Total stockholders’
equity
|
|||||||||||||||||||||||||||
|
Number
|
Amount
|
Number
|
Amount
|
|||||||||||||||||||||||||||||
|
Balance as of June 30, 2014
|
75,422,773
|
$
|
116,203
|
2,809,950
|
$
|
* -
|
$
|
5,878
|
$
|
(61
|
)
|
$
|
(141,111
|
)
|
$
|
(135,294
|
)
|
|||||||||||||||
|
Issuance of Common Stock upon exercise of employee stock options
|
-
|
-
|
34,898
|
* -
|
84
|
-
|
-
|
84
|
||||||||||||||||||||||||
|
Issuance of Series E Convertible Preferred stock, net of issuance expenses in the amount of $288
|
9,321,019
|
24,712
|
-
|
-
|
-
|
-
|
-
|
-
|
||||||||||||||||||||||||
|
Equity based compensation expenses to employees and non-employee consultants
|
-
|
-
|
-
|
-
|
2,956
|
-
|
-
|
2,956
|
||||||||||||||||||||||||
|
Conversion of convertible preferred stock into ordinary shares
|
(84,743,792
|
)
|
(140,915
|
)
|
28,247,923
|
3
|
140,912
|
-
|
-
|
140,915
|
||||||||||||||||||||||
|
Issuance of common stock in initial public offering, net of issuance expenses in an amount of $13,692
|
-
|
-
|
8,050,000
|
1
|
131,207
|
-
|
-
|
131,208
|
||||||||||||||||||||||||
|
Exercise of warrants into common stock
|
-
|
-
|
154,768
|
* -
|
6,115
|
-
|
-
|
6,115
|
||||||||||||||||||||||||
|
Change in accumulated other comprehensive loss related to foreign currency translation adjustments
|
-
|
-
|
-
|
-
|
-
|
(161
|
)
|
-
|
(161
|
)
|
||||||||||||||||||||||
|
Net income
|
-
|
-
|
-
|
-
|
-
|
-
|
21,121
|
21,121
|
||||||||||||||||||||||||
|
Balance as of June 30, 2015
|
-
|
$
|
-
|
39,297,539
|
$
|
4
|
$
|
287,152
|
$
|
(222
|
)
|
$
|
(119,990
|
)
|
$
|
166,944
|
||||||||||||||||
*
Represents an amount less than $1.
The accompanying notes are an integral part of the consolidated financial statements.
F - 8
SOLAREDGE TECHNOLOGIES, INC.
CONSOLIDATED STATEMENTS OF CHANGES IN STOCKHOLDERS’ EQUITY (Cont.)
U.S. dollars in thousands (except share data)
|
Convertible
Preferred stock
|
Common stock
|
Additional paid in
Capital
|
Accumulated
Other comprehensive
Income (loss)
|
Retained earnings (Accumulated
Deficit)
|
Total stockholders’
equity
|
|||||||||||||||||||||||||||
|
Number
|
Amount
|
Number
|
Amount
|
|||||||||||||||||||||||||||||
|
Balance as of June 30, 2015
|
-
|
$
|
-
|
39,297,539
|
$
|
4
|
$
|
287,152
|
$
|
(222
|
)
|
$
|
(119,990
|
)
|
$
|
166,944
|
||||||||||||||||
|
Issuance of Common Stock upon exercise of employee and non-employees stock-based awards
|
-
|
-
|
1,592,383
|
* -
|
2,973
|
-
|
-
|
2,973
|
||||||||||||||||||||||||
|
Equity based compensation expenses to employees and non-employee consultants
|
-
|
-
|
-
|
-
|
9,089
|
-
|
-
|
9,089
|
||||||||||||||||||||||||
|
Other comprehensive income adjustments
|
-
|
-
|
-
|
-
|
-
|
493
|
-
|
493
|
||||||||||||||||||||||||
|
Net income
|
-
|
-
|
-
|
-
|
-
|
-
|
76,609
|
76,609
|
||||||||||||||||||||||||
|
Balance as of June 30, 2016
|
-
|
$
|
-
|
40,889,922
|
$
|
4
|
$
|
299,214
|
$
|
271
|
$
|
(43,381
|
)
|
$
|
256,108
|
|||||||||||||||||
|
Issuance of Common Stock upon exercise of employee and non-employees stock-based awards
|
-
|
-
|
286,150
|
* -
|
349
|
-
|
-
|
349
|
||||||||||||||||||||||||
|
Issuance of Common stock under employee stock purchase plan
|
-
|
-
|
83,319
|
* -
|
935
|
-
|
-
|
935
|
||||||||||||||||||||||||
|
Equity based compensation expenses to employees and non-employee consultants
|
-
|
-
|
-
|
-
|
6,600
|
-
|
-
|
6,600
|
||||||||||||||||||||||||
|
Other comprehensive loss adjustments
|
-
|
-
|
-
|
-
|
-
|
(595
|
)
|
-
|
(595
|
)
|
||||||||||||||||||||||
|
Net income
|
-
|
-
|
-
|
-
|
-
|
-
|
25,381
|
25,381
|
||||||||||||||||||||||||
|
Balance as of December 31, 2016
|
-
|
$
|
-
|
41,259,391
|
$
|
4
|
$
|
307,098
|
$
|
(324
|
)
|
$
|
(18,000
|
)
|
$
|
288,778
|
||||||||||||||||
|
Issuance of Common Stock upon exercise of employee and non-employees stock-based awards
|
-
|
-
|
2,368,152
|
* -
|
4,854
|
-
|
-
|
4,854
|
||||||||||||||||||||||||
|
Issuance of Common stock under employee stock purchase plan
|
-
|
-
|
185,058
|
* -
|
2,386
|
-
|
-
|
2,386
|
||||||||||||||||||||||||
|
Equity based compensation expenses to employees and non-employee consultants
|
-
|
-
|
-
|
-
|
17,564
|
-
|
-
|
17,564
|
||||||||||||||||||||||||
|
Other comprehensive loss adjustments
|
-
|
-
|
-
|
-
|
-
|
(287
|
)
|
-
|
(287
|
)
|
||||||||||||||||||||||
|
Net income
|
-
|
-
|
-
|
-
|
-
|
-
|
84,172
|
84,172
|
||||||||||||||||||||||||
|
Balance as of December 31, 2017
|
-
|
$
|
-
|
43,812,601
|
$
|
4
|
$
|
331,902
|
$
|
(611
|
)
|
$
|
66,172
|
$
|
397,467
|
|||||||||||||||||
*
Represents an amount less than $1.
The accompanying notes are an integral part of the consolidated financial statements.
F - 9
SOLAREDGE TECHNOLOGIES, INC.
U.S. dollars in thousands
|
Year ended
December 31,
|
Six months ended December 31,
|
Year ended
June 30,
|
||||||||||||||
|
2017
|
2016
|
2016
|
2015
|
|||||||||||||
|
Cash flows provided by operating activities:
|
||||||||||||||||
|
Net income
|
$
|
84,172
|
$
|
25,381
|
$
|
76,609
|
$
|
21,121
|
||||||||
|
Adjustments to reconcile net income to net cash provided by operating activities:
|
||||||||||||||||
|
Depreciation and amortization of property, equipment and intangible assets
|
7,155
|
2,759
|
3,847
|
2,253
|
||||||||||||
|
Amortization of premium and accretion of discount on available-for-sale marketable securities
|
2,061
|
681
|
532
|
-
|
||||||||||||
|
Stock-based compensation
|
17,564
|
6,600
|
9,089
|
2,956
|
||||||||||||
|
Financial income, net related to term loan
|
-
|
-
|
-
|
(992
|
)
|
|||||||||||
|
Remeasurement of warrants to purchase convertible preferred stock
|
-
|
-
|
-
|
5,350
|
||||||||||||
|
Capital loss from disposal of property
|
-
|
-
|
-
|
104
|
||||||||||||
|
Changes in assets and liabilities:
|
||||||||||||||||
|
Inventories
|
(15,690
|
)
|
14,022
|
(7,356
|
)
|
(48,507
|
)
|
|||||||||
|
Prepaid expenses and other accounts receivable
|
(21,937
|
)
|
(367
|
)
|
10,542
|
(19,563
|
)
|
|||||||||
|
Trade receivables, net
|
(38,139
|
)
|
1,555
|
(37,271
|
)
|
(16,333
|
)
|
|||||||||
|
Deferred tax assets, net
|
(5,455
|
)
|
3,652
|
(6,380
|
)
|
-
|
||||||||||
|
Trade payables
|
35,455
|
(14,464
|
)
|
(32,200
|
)
|
41,111
|
||||||||||
|
Employees and payroll accruals
|
9,394
|
2,996
|
3,278
|
1,668
|
||||||||||||
|
Warranty obligations
|
20,436
|
7,183
|
19,313
|
13,698
|
||||||||||||
|
Deferred revenues
|
14,106
|
1,335
|
8,578
|
3,989
|
||||||||||||
|
Accrued expenses, other accounts payable and non-current tax liabilities
|
27,839
|
(1,999
|
)
|
3,934
|
2,530
|
|||||||||||
|
Lease incentive obligation
|
(296
|
)
|
(236
|
)
|
(88
|
)
|
2,669
|
|||||||||
|
Net cash provided by operating activities
|
136,665
|
49,098
|
52,427
|
12,054
|
||||||||||||
|
Cash flows from investing activities:
|
||||||||||||||||
|
Purchase of property and equipment
|
(21,382
|
)
|
(11,025
|
)
|
(15,690
|
)
|
(11,765
|
)
|
||||||||
|
Purchase of intangible assets
|
-
|
(600
|
)
|
(800
|
)
|
-
|
||||||||||
|
Decrease (increase) in restricted cash
|
(619
|
)
|
31
|
2,711
|
(2,038
|
)
|
||||||||||
|
Decrease (increase) in long-term lease deposit
|
-
|
(77
|
)
|
103
|
(134
|
)
|
||||||||||
|
Investment in available-for-sale marketable securities
|
(143,675
|
)
|
(40,858
|
)
|
(118,511
|
)
|
-
|
|||||||||
|
Maturities of available-for-sale marketable securities
|
80,269
|
32,782
|
6,350
|
-
|
||||||||||||
|
Net cash used in investing activities
|
$
|
(85,407
|
)
|
$
|
(19,747
|
)
|
$
|
(125,837
|
)
|
$
|
(13,937
|
)
|
||||
The accompanying notes are an integral part of the consolidated financial statements.
F - 10
SOLAREDGE TECHNOLOGIES, INC.
CONSOLIDATED STATEMENTS OF CASH FLOWS (Cont.)
U.S. dollars in thousands
|
Year ended
December 31,
|
Six months ended December 31,
|
Year ended
June 30,
|
||||||||||||||
|
2017
|
2016
|
2016
|
2015
|
|||||||||||||
|
Cash flows from financing activities:
|
||||||||||||||||
|
Proceeds from short term bank loan
|
-
|
-
|
-
|
23,000
|
||||||||||||
|
Repayment of short term bank loan
|
-
|
-
|
-
|
(36,326
|
)
|
|||||||||||
|
Repayments of term loan
|
-
|
-
|
-
|
(5,919
|
)
|
|||||||||||
|
Proceeds from issuance of Series E Convertible Preferred stock, net
|
-
|
-
|
-
|
24,712
|
||||||||||||
|
Proceeds from initial public offering, net
|
-
|
-
|
-
|
131,402
|
||||||||||||
|
Issuance costs related to initial public offering
|
-
|
-
|
(194
|
)
|
-
|
|||||||||||
|
Proceeds from issuance of shares under stock purchase plan and upon exercise of stock-based awards
|
7,240
|
1,284
|
2,973
|
84
|
||||||||||||
|
Net cash provided by financing activities
|
7,240
|
1,284
|
2,779
|
136,953
|
||||||||||||
|
Increase (decrease) in cash and cash equivalents
|
58,498
|
30,635
|
(70,631
|
)
|
135,070
|
|||||||||||
|
Cash and cash equivalents at the beginning of the period
|
104,683
|
74,032
|
144,750
|
9,754
|
||||||||||||
|
Effect of exchange rate differences on cash and cash equivalents
|
(18
|
)
|
16
|
(87
|
)
|
(74
|
)
|
|||||||||
|
Cash and cash equivalents at the end of the period
|
$
|
163,163
|
$
|
104,683
|
$
|
74,032
|
$
|
144,750
|
||||||||
|
Supplemental disclosure of non-cash investing and financing activities:
|
||||||||||||||||
|
Net change in accrued expenses and other accounts payable related to property and equipment additions
|
$
|
598
|
$
|
-
|
$
|
1,187
|
$
|
-
|
||||||||
|
Deferred issuance costs related to initial public offering
|
$
|
-
|
$
|
-
|
$
|
-
|
$
|
194
|
||||||||
|
Cashless exercise of warrants to purchase common stock
|
$
|
-
|
$
|
-
|
$
|
-
|
$
|
6,115
|
||||||||
|
Supplemental disclosure of cash flow information:
|
||||||||||||||||
|
Cash paid for interest
|
$
|
-
|
$
|
-
|
$
|
-
|
$
|
896
|
||||||||
|
Cash paid for income taxes
|
$
|
3,100
|
$
|
1,103
|
$
|
1,178
|
$
|
4,040
|
||||||||
The accompanying notes are an integral part of the consolidated financial statements.
F - 11
SOLAREDGE TECHNOLOGIES, INC.
U.S. dollars in thousands, except share data
| NOTE 1:- |
GENERAL
|
| a. |
SolarEdge Technologies, Inc. (the “Company”) and its subsidiaries design, develop, and sell an intelligent inverter solution designed to maximize power generation at the individual photovoltaic (“PV”) module level while lowering the cost of energy produced by the solar PV system and providing comprehensive and advanced safety features
.
The Company’s products consist mainly of (i) power optimizers designed to maximize energy output from each and every module through constant tracking of Maximum Power Point individually per module; (ii) inverters which convert direct current (DC) from the PV module to alternating current (AC); (iii) a related cloud-based monitoring platform that collects and processes information from the power optimizers and inverters of a solar PV system to enable customers and system owners, as applicable, to monitor and manage the solar PV systems; and (iv) a storage solution that is used to increase energy independence and maximize self-consumption for homeowners by utilizing a battery that is sold separately by third-party manufacturers, to store and supply power as needed (the “StorEdge solution”). The StorEdge solution is designed to provide smart energy functions such as maximizing self-consumption, Time-of-Use programming for desired hours of the day, and home energy backup solutions. In addition, the Company offers several communication and smart energy management solutions.
|
The Company and its subsidiaries sell their products worldwide through large distributors and electrical equipment wholesalers to smaller solar installers, as well as directly to large solar installers and engineering, procurement and construction firms (“EPCs”).
| b. |
Basis of presentation:
|
Effective December 31, 2016, the Company changed its fiscal year end from June 30 to December 31. This change was made in order to align the Company’s fiscal year end with other companies within the industry. As a result of this change, the consolidated financial statements include presentation of the six month transition period from July 1, 2016 through December 31, 2016. The Company refers to the period beginning July 1, 2015 and ending June 30, 2016 as “fiscal 2016” and the period beginning July 1, 2014 and ending June 30, 2015 as “fiscal 2015”.
| c. |
Initial Public Offering:
|
On March 31, 2015, the Company closed its initial public offering (“IPO”) whereby 8,050,000 shares of common stock were sold by the Company to the public (inclusive of 1,050,000 shares of common stock pursuant to the full exercise of an overallotment option granted to the underwriters). The aggregate net proceeds received by the Company from the offering were approximately $131,208, net of underwriting discounts and commissions and offering expenses. Upon the closing of the IPO, all shares of the Company’s outstanding convertible preferred stock automatically converted into 28,247,923 shares of common stock, and outstanding warrants to purchase convertible preferred stock automatically converted into warrants to purchase 187,671 shares of common stock (See Note 10).
F - 12
SOLAREDGE TECHNOLOGIES, INC.
NOTES TO CONSOLIDATED FINANCIAL STATEMENTS
U.S. dollars in thousands, except share data
| NOTE 1:- |
GENERAL (Cont.)
|
| d. |
For the year ended December 31, 2017 and the six months ended December 31, 2016, the Company had one major customer (customer with attributable revenues that represents more than 10% of total revenues) that accounted for approximately 14.8% and 11.2% of the Company’s consolidated revenues, respectively (see Note 20), and for the years ended June 30, 2016 and 2015, the Company had three and one major customers that accounted for approximately 32.5% and 24.6% of the Company’s consolidated revenues, respectively (see Note 20).
|
| e. |
The Company depends on three contract manufacturers and several limited or single source component suppliers. Reliance on these vendors makes the Company vulnerable to possible capacity constraints and reduced control over component availability, delivery schedules, manufacturing yields, and costs.
|
These contract manufacturers collectively accounted for
51.6
%, 61% and 69% of the Company’s total trade payables as of December 31, 2017, 2016 and June 30, 2016, respectively.
The Company has the right to offset its payables to one of its contract manufacturers against vendor non-trade receivables. As of December 31, 2017, a total of $3,180 of these receivables met the criteria for net recognition and were offset against the corresponding accounts payable balances for this contract manufacturer in the accompanying Consolidated Balance Sheets.
| NOTE 2:- |
SIGNIFICANT ACCOUNTING POLICIES
|
The consolidated financial statements are prepared according to United States generally accepted accounting principles (“U.S. GAAP”).
| a. |
Principles of consolidation:
|
The consolidated financial statements include the accounts of the Company and its subsidiaries. Intercompany transactions and balances including profits from intercompany sales not yet realized outside the Company have been eliminated upon consolidation.
F - 13
SOLAREDGE TECHNOLOGIES, INC.
NOTES TO CONSOLIDATED FINANCIAL STATEMENTS
U.S. dollars in thousands, except share data
| NOTE 2:- |
SIGNIFICANT ACCOUNTING POLICIES (Cont.)
|
| b. |
Use of estimates:
|
The preparation of financial statements, in conformity with U.S. GAAP requires management to make estimates and assumptions that affect the amounts reported in the financial statements and accompanying notes. The Company evaluates its assumptions on an ongoing basis, including those related to warranty obligation, inventory valuation, contingencies, share-based compensation cost, marketable securities, deferred tax assets and liabilities, intangible assets and estimates used in applying the revenue recognition policy. The Company’s management believes that the estimates, judgment, and assumptions used are reasonable based upon information available at the time they are made. These estimates, judgments, and assumptions can affect the reported amounts of assets and liabilities and disclosure of contingent assets and liabilities at the dates of the consolidated financial statements, and the reported amounts of revenue and expenses during the reporting periods. Actual results could differ from those estimates.
| c. |
Financial statements in U.S. dollars:
|
The functional currency of the Company and its subsidiaries (with the exception of Germany, Australia, and Japan) is the U.S. dollar, as the U.S. dollar is the currency of the primary economic environment in which the Company has operated and expects to continue to operate in the foreseeable future. Currently, the operations of these subsidiaries and the Company are primarily conducted in Israel, and a significant portion of its expenses are paid in U.S. dollars. Financing activities, including loans and cash investments are primarily made in U.S. dollars.
Accordingly, monetary accounts maintained in currencies other than the U.S. dollar are translated into U.S. dollars in accordance with Financial Accounting Standards Board Accounting Standards Codification (“ASC”) 830 (“Foreign Currency Matters”). All transaction gains and losses of the re-measurement of monetary balance sheet items are reflected in the statements of operations as financial income or expenses, as appropriate.
The financial statements of other Company’s subsidiaries whose functional currency is other than the U.S. dollar have been translated into U.S dollars. Assets and liabilities have been translated using the exchange rates in effect on the balance sheet date. Statements of operations amounts have been translated using the average exchange rate for the relevant periods.
The resulting translation adjustments are reported as a component of stockholders’ equity in accumulated other comprehensive income.
Accumulated other comprehensive loss related to foreign currency translation adjustments, net amounted to $178, $207, and $29 as of December 31, 2017 and 2016, and June 30, 2016, respectively.
F - 14
SOLAREDGE TECHNOLOGIES, INC.
NOTES TO CONSOLIDATED FINANCIAL STATEMENTS
U.S. dollars in thousands, except share data
| NOTE 2:- |
SIGNIFICANT ACCOUNTING POLICIES (Cont.)
|
| d. |
Basic and Diluted Net
Earnings
Per Share
:
|
Basic net earnings per share is computed by dividing the net earnings by the weighted-average number of shares of common stock outstanding during the period.
Diluted net earnings per share is computed by giving effect to all potential shares of common stock, including stock options and convertible preferred stock, to the extent dilutive, all in accordance with ASC No. 260, "Earnings Per Share."
The total weighted average number of shares related to the outstanding stock options, convertible preferred stock and warrants to purchase convertible preferred stock, excluded from the calculation of diluted net earnings per share due to their anti-dilutive effect was
197,516,
374,156, 16,208, and 20,565,747 for the
year ended December 31, 2017, the
six months ended December 31, 2016 and the years ended June 30, 2016 and 2015, respectively.
Basic and diluted earnings per share is presented in conformity with the two-class method for participating securities for the periods prior to their conversion. Under this method, the earnings per share for each class of shares are calculated assuming 100% of the Company’s earnings are distributed as dividends to each class of shares based on their contractual rights.
F - 15
SOLAREDGE TECHNOLOGIES, INC.
NOTES TO CONSOLIDATED FINANCIAL STATEMENTS
U.S. dollars in thousands, except share data
| NOTE 2:- |
SIGNIFICANT ACCOUNTING POLICIES (Cont.)
|
The following table presents the computation of basic and diluted net earnings per share for the periods presented (in thousands, except share and per share data):
|
Year ended
|
Six months Ended
|
Year ended June 30,
|
||||||||||||||
|
December 31, 2017
|
December 31, 2016
|
2016
|
2015
|
|||||||||||||
|
Net basic earnings (loss) per share of common stock:
|
||||||||||||||||
|
Numerator:
|
||||||||||||||||
|
Net income
|
$
|
84,172
|
$
|
25,381
|
$
|
76,609
|
$
|
21,121
|
||||||||
|
Dividends accumulated for the period
|
-
|
-
|
-
|
(17,550
|
)
|
|||||||||||
|
Net income available to shareholders of common stock
|
84,172
|
25,381
|
76,609
|
3,571
|
||||||||||||
|
Denominator:
|
||||||||||||||||
|
Shares used in computing net earnings per share of common stock, basic
|
42,209,238
|
41,026,926
|
39,987,935
|
11,902,911
|
||||||||||||
|
Net diluted earnings per share of common stock:
|
||||||||||||||||
|
Numerator:
|
||||||||||||||||
|
Net income
|
84,172
|
25,381
|
76,609
|
21,121
|
||||||||||||
|
Dividends accumulated for the period
|
-
|
-
|
-
|
(16,971
|
)
|
|||||||||||
|
Net income available to shareholders of common stock
|
84,172
|
25,381
|
76,609
|
4,150
|
||||||||||||
|
Denominator:
|
||||||||||||||||
|
Shares used in computing net earnings per share of common stock, basic
|
42,209,238
|
41,026,926
|
39,987,935
|
11,902,911
|
||||||||||||
|
Effect of stock-based awards
|
3,216,069
|
2,812,416
|
4,388,140
|
3,366,537
|
||||||||||||
|
Shares used in computing net earnings per share of common stock, diluted
|
45,425,307
|
43,839,342
|
44,376,075
|
15,269,448
|
||||||||||||
|
Basic net income per share
|
$
|
1.99
|
$
|
0.62
|
$
|
1.92
|
$
|
0.30
|
||||||||
|
Diluted net income per share
|
$
|
1.85
|
$
|
0.58
|
$
|
1.73
|
$
|
0.27
|
||||||||
F - 16
SOLAREDGE TECHNOLOGIES, INC.
NOTES TO CONSOLIDATED FINANCIAL STATEMENTS
U.S. dollars in thousands, except share data
| NOTE 2:- |
SIGNIFICANT ACCOUNTING POLICIES (Cont.)
|
| e. |
Cash and cash equivalents:
|
Cash equivalents are short-term, highly liquid investments that are readily convertible to cash, with original maturities of three months or less at the date acquired.
| f. |
Marketable Securities:
|
Marketable securities consist of corporate and governmental bonds. The Company determines the appropriate classification of marketable securities at the time of purchase and re-evaluates such designation at each balance sheet date. In accordance with FASB ASC No. 320 “Investments - Debt and Equity Securities”, the Company classifies marketable securities as available-for-sale. Available-for-sale securities are stated at fair value, with unrealized gains and losses reported in accumulated other comprehensive income (loss), a separate component of stockholders’ equity, net of taxes.
Realized gains and losses on sales of marketable securities, as determined on a specific identification basis, are included in financial income (expenses), net. The amortized cost of marketable securities is adjusted for amortization of premium and accretion of discount to maturity, both of which, together with interest, are included in financial income (expenses), net.
The Company classifies its marketable debt securities as either short-term or long-term based on each instrument’s underlying contractual maturity date. Marketable debt securities with maturities of 12 months or less are classified as short-term and marketable debt securities with maturities greater than 12 months are classified as long-term.
The Company recognizes an impairment charge when a decline in the fair value of its investments in debt securities below the cost basis of such securities is judged to be other-than-temporary. Factors considered in making such a determination include the duration and severity of the impairment, the reason for the decline in value, the potential recovery period, and the Company’s intent to sell, including whether it is more likely than not that the Company will be required to sell the investment before recovery of cost basis. If the Company does not intend to sell the security or it is not more likely than not that it will be required to sell the security before it recovers in value, the Company must estimate the net present value of cash flows expected to be collected. If the amortized cost exceeds the net present value of cash flows, such excess is considered a credit loss and an other-than-temporary impairment has occurred. For securities that are deemed other-than-temporarily impaired (“OTTI”), the amount of impairment is recognized in the statement of operations and is limited to the amount related to credit losses, while impairment related to other factors is recognized in other comprehensive income (loss). The Company did not recognize OTTI on its marketable securities during the year ended December 31, 2017, the six months ended December 31, 2016, and the years ended June 30, 2016 and 2015.
F - 17
SOLAREDGE TECHNOLOGIES, INC.
NOTES TO CONSOLIDATED FINANCIAL STATEMENTS
U.S. dollars in thousands, except share data
| NOTE 2:- |
SIGNIFICANT ACCOUNTING POLICIES (Cont.)
|
| g. |
Restricted cash:
|
Restricted cash is primarily invested in short-term bank deposits, which are primarily used to guarantee a letter of credit which has been issued to one of the Company’s major vendors, to the Company’s landlords for its office leases, and as security for the Company’s credit cards.
| h. |
Inventories:
|
Inventories are stated at the lower of cost or market value. Inventory reserves are provided to cover risks arising from slow-moving items or technological obsolescence.
The Company periodically evaluates the quantities on hand relative to historical, current, and projected sales volume. Based on this evaluation, an impairment charge is recorded when required to write-down inventory to its market value. Cost of finished goods and raw materials is determined using the moving average cost method.
| i. |
Property, equipment, and intangible assets:
|
Property and equipment:
Property and equipment are stated at cost, net of accumulated depreciation. Machinery & equipment in progress is the construction or development of property and equipment that have not yet been placed in service for the Company's intended use. Depreciation is calculated by the straight-line method over the estimated useful lives of the assets, at the following rates:
|
%
|
||
|
Computers and peripheral equipment
|
15 – 33 (mainly 33)
|
|
|
Office furniture and equipment
|
7
|
|
|
Machinery & equipment
|
7 – 20 (mainly 10)
|
|
|
Laboratory equipment
|
15 – 25 (mainly 15)
|
|
|
Vehicles
|
15
|
|
|
Leasehold improvements
|
over the shorter of the lease term or useful economic life
|
Intangible assets:
Intangible assets are stated at cost, net of accumulated amortization. Amortization is calculated by the straight-line method over the estimated useful lives of the assets (see Note 7).
F - 18
SOLAREDGE TECHNOLOGIES, INC.
NOTES TO CONSOLIDATED FINANCIAL STATEMENTS
U.S. dollars in thousands, except share data
| NOTE 2:- |
SIGNIFICANT ACCOUNTING POLICIES (Cont.)
|
| j. |
Impairment of long-lived assets:
|
The Company’s long-lived assets are reviewed for impairment in accordance with ASC 360 (“Property, Plants and Equipment”), whenever events or changes in circumstances indicate that the carrying amount of an asset (or asset group) may not be recoverable. Recoverability of assets to be held and used is measured by a comparison of the carrying amount of an asset (or asset group) to the future undiscounted cash flows expected to be generated by the assets (or asset group).
If such assets are considered to be impaired, the impairment to be recognized is measured by the amount by which the carrying amount of the assets exceeds their fair value. For the year ended December 31, 2017, the six months ended December 31, 2016, and the years ended June 30, 2016 and 2015, no impairment losses have been identified.
k.
Severance pay:
Pursuant to Israel’s Severance Pay Law, Israeli employees are entitled to severance pay equal to one month’s salary for each year of employment, or a portion thereof. The employees of the Company’s Israeli subsidiary have elected to be included under section 14 of the Severance Pay Law, 1963, under which these employees are entitled only to monthly deposits made in their name with insurance companies, at a rate of 8.33% of their monthly salary. These payments cause the Company to be released from any future obligation under the Israeli Severance Pay Law to make severance payments in respect of those employees; therefore, related assets and liabilities are not presented in the balance sheet.
For the year ended December 31, 2017, the six months ended December 31, 2016, and the years ended June 30, 2016 and 2015, the Company recorded $2,995, $1,131, $1,761, and $1,273 in severance expenses, respectively.
| l. |
Revenue recognition:
|
The Company and its subsidiaries generate their revenues mainly from the sale of power optimizers, inverters, and cloud-based monitoring services to distributors, installers and PV module manufacturers.
Revenues from product sales and related services are recognized in accordance with ASC 605 (“Revenue Recognition”) when persuasive evidence of an arrangement exists, delivery has occurred, the selling price is fixed or determinable, collectability is reasonably assured, and no significant obligations remain.
F - 19
SOLAREDGE TECHNOLOGIES, INC.
NOTES TO CONSOLIDATED FINANCIAL STATEMENTS
U.S. dollars in thousands, except share data
| NOTE 2:- |
SIGNIFICANT ACCOUNTING POLICIES (Cont.)
|
Persuasive evidence of an arrangement exists
. The Company’s customers mainly consist of distributors and installers (the “Customers”). The Company’s sales arrangements with Customers are pursuant to written documentation, either by a written contract or purchase order. The actual documentation used is dependent on the business practice with each Customer. Therefore, the Company determines that persuasive evidence of an arrangement exists with respect to a Customer when it has a written contract or a binding purchase order from the Customer.
Delivery has occurred
. Each item of written documentation relating to a sale arrangement that is agreed upon with the Customer specifically sets forth when risk of loss and title are being transferred (based on the agreed International Commercial terms, or “INCOTERMS”). Unless a different written arrangement with the Customer exists, the Company determines that risk of loss and title are transferred to the Customer when the applicable INCOTERMS are satisfied and thus delivery of its products has occurred.
The fee is fixed or determinable
. The Company does not provide any price protection, stock rotation, and/or right of return, and thus the Company considers all the Customers as end-users and the fee is considered fixed and determinable upon execution of the written documentation with the Customers.
Additionally, payments that are due within the normal course of the Company’s credit terms, which are currently no more than three months from the delivery date, are deemed to be fixed and determinable. Fees and arrangements with payment terms extending beyond customary payment terms are considered not to be fixed or determinable, in which case revenues are deferred and recognized when payments become due, provided that all other revenue recognition criteria have been met.
Collectability is reasonably assured
. The Company determines whether collectability is reasonably assured on a Customer-by-Customer basis pursuant to its credit review policy. The Company typically sells to Customers with whom it has a long-term business relationship and a history of successful collection. For a new Customer, or when an existing Customer substantially expands its commitments, the Company evaluates the Customer’s financial position, the number of years the Customer has been in business, the history of collection with the Customer, and the Customer’s ability to pay, and typically assigns a credit limit based on that review.
Provisions for rebates, sales incentives, and discounts to customers are accounted for as reductions in revenue in the same period the related sales are recorded.
The Company increases a credit limit only after it has established a successful collection history with the Customer. The Company recognizes revenue under a particular arrangement as Customer payments are actually received if it determines at any time that collectability is not reasonably assured under that arrangement based upon its credit review process, the Customer’s payment history, or information that comes to light about a Customer’s financial position. No material revenues were recognized by the Company under that arrangement.
F - 20
SOLAREDGE TECHNOLOGIES, INC.
NOTES TO CONSOLIDATED FINANCIAL STATEMENTS
U.S. dollars in thousands, except share data
| NOTE 2:- |
SIGNIFICANT ACCOUNTING POLICIES (Cont.)
|
Revenues related to cloud-based monitoring and communication services are recognized ratably on a straight-line basis over the estimated service period.
For multiple-element arrangements, the Company allocates revenue to all deliverables based on their relative selling prices. In such circumstances, the Company uses a hierarchy to determine the selling price to be used for allocating revenue to deliverables: (i) vendor-specific objective evidence of fair value (“VSOE”), (ii) third-party evidence of selling price (“TPE”), and (iii) best estimate of the selling price (“ESP”).
VSOE generally exists only when the Company sells the deliverable separately and is the price actually charged by the Company for that deliverable. ESPs reflect the Company’s best estimates of what the selling prices of elements would be if they were sold regularly on a stand-alone basis. The Company has allocated revenue between its deliverables based on their relative selling prices. Because the Company has neither VSOE nor TPE for its deliverables, the allocation of revenue has been based on the Company’s ESPs. Amounts allocated to the delivered elements are recognized at the time of sale provided the other conditions for revenue recognition have been met.
The Company’s process for determining its ESP considers multiple factors that may vary depending upon the unique facts and circumstances related to each deliverable.
Key factors considered by the Company in developing the ESPs for its products include prices charged by the Company for similar offerings, the Company’s historical pricing practices and product-specific business objectives.
Deferred revenues consist of deferred cloud-based monitoring services, communication services and advance payments received from Customers for the Company’s products, and warranty extensions services, and are classified as short-term and long-term deferred revenues based on the period in which revenues are expected to be recognized.
| m. |
Cost of revenues:
|
Cost of revenues sold includes the following: product costs consisting of purchases from contract manufacturers and other suppliers, indirect manufacturing costs, shipping and handling costs, support, warranty expenses and changes in warranty provision, provision for losses related to slow moving and dead inventory, personnel and logistics costs, and royalty expense payments to the Israel Innovation Authority (“IIA”) (see Note 2p).
| n. |
Shipping and handling costs:
|
Shipping and handling costs, which amounted to $29,693, $8,131, $21,922, and $26,931 for the year ended December 31, 2017, the six months ended December 31, 2016, and the years ended June 30, 2016 and 2015, respectively, are included in cost of revenues in the consolidated statements of operations. Shipping and handling costs include all costs associated with the distribution of finished products from the Company’s point of selling directly to its Customers.
F - 21
SOLAREDGE TECHNOLOGIES, INC.
NOTES TO CONSOLIDATED FINANCIAL STATEMENTS
U.S. dollars in thousands, except share data
| NOTE 2:- |
SIGNIFICANT ACCOUNTING POLICIES (Cont.)
|
| o. |
Warranty obligations:
|
The Company’s products include a 10-year limited warranty for StorEdge products, a minimum 12-year limited warranty for inverters, and a 25-year limited warranty for power optimizers. In certain cases, the Company provides extended warranties for inverters that bring the warranty period up to 25 years. The Company maintains reserves to cover the expected costs that could result from these warranties. The warranty liability is generally in the form of product replacement and associated costs. Warranty reserves are based on the Company’s best estimate of such costs and are included in cost of revenues. The reserve for the related warranty expenses is based on various factors including assumptions about the frequency of warranty claims on product failures, derived from results of accelerated lab testing, field monitoring, analysis of the history of product field failures, and the Company’s reliability estimates.
The Company has established a reliability measurement system based on the units’ estimated mean time between failure, or MTBF, a metric that equates to a steady-state failure rate per year for each product generation. The MTBF predicts the expected failure rate of each product within the Company's products installed base during the expected product warranted lifetime.
The Company performs accelerated life cycle testing, which simulates the service life of the product in a short period of time.
The accelerated life cycle tests incorporate test methodologies derived from standard tests used by solar module vendors to evaluate the period over which solar modules wear out. Corresponding replacement costs are updated periodically to reflect changes in the Company’s actual and estimated production costs for its products, rate of usage of refurbished units as a replacement of faulty units, and other costs related to logistic and subcontractors services associated with the replacement.
In addition, through the collection of actual field failure statistics, the Company has identified several additional failure causes that are not included in the MTBF calculations. Such causes, which mostly consist of design errors, workmanship errors caused during the manufacturing process and, to a lesser extent, replacement of non-faulty units by installers, are generating additional replacement costs to the replacement costs projected under the MTBF model. The Company identified each of those causes, its failure pattern and the relative ratio compared to the pattern of malfunctions identified under the MTBF and accrued additional provisions for the occurrence of such malfunctioning. For the major causes of failures, the Company evaluates the continuation of these occurrences and the appearance of potential additional malfunctioning cases beyond the MTBF pattern and accrues additional expenses accordingly.
Warranty obligations are classified as short-term and long-term obligations based on the period in which the warranty is expected to be claimed.
F - 22
SOLAREDGE TECHNOLOGIES, INC.
NOTES TO CONSOLIDATED FINANCIAL STATEMENTS
U.S. dollars in thousands, except share data
| NOTE 2:- |
SIGNIFICANT ACCOUNTING POLICIES (Cont.)
|
| p. |
Government grants:
|
Government grants received by the Company’s Israeli subsidiary relating to categories of operating expenditures are credited to the consolidated statements of operations during the period in which the expenditure to which they relate is charged. Royalty-bearing grants from the
IIA
for funding certain approved research and development projects are recognized at the time when the Company’s Israeli subsidiary is entitled to such grants, on the basis of the related costs incurred, and are included as a deduction from research and development expenses.
The Company recorded grants in the amount of $763 for the year ended June 30, 2015, which was deducted from research and development expenses.
No grants were recorded for the year ended December 31, 2017, the six months ended December 31, 2016, and for the year ended June 30, 2016.
| q. |
Research and development costs:
|
Research and development costs, net of grants received, are charged to the consolidated statement of operations as incurred.
| r. |
Concentrations of credit risks:
|
Financial instruments that potentially subject the Company to concentrations of credit risk consist principally of cash and cash equivalents, restricted cash, trade receivables, other accounts receivable, and marketable securities.
Cash and cash equivalents are mainly invested in major banks in the U.S., Israel, Australia, Japan, and Germany. Management believes that the financial institutions that hold the Company’s investments are financially sound and, accordingly, minimal credit risk exists with respect to these investments.
The Company’s marketable securities consist of corporate and governmental bonds.
The Company's marketable securities include investments in highly-rated corporate debentures (mainly of U.S., UK, France, Canada, and other countries) and governmental bonds. The financial institutions that hold the Company's marketable securities are major financial institutions located in the United States. Management believes that the Company's marketable securities portfolio is a diverse portfolio of highly-rated securities and the Company's investment policy limits the amount the Company may invest in each issuer, and accordingly, management believes that minimal credit risk exists from geographic or credit concentration with respect to these securities.
As of December 31, 2017, December 31, 2016, and June 30, 2016, the amortized cost of the Company’s marketable securities was $180,974, $118,950, and $111,514, respectively, and their stated market value was $180,384, $118,727, and $111,609, respectively, representing a net unrealized loss of $590, $223, and a net unrealized gain of $95, respectively.
F - 23
SOLAREDGE TECHNOLOGIES, INC.
NOTES TO CONSOLIDATED FINANCIAL STATEMENTS
U.S. dollars in thousands, except share data
| NOTE 2:- |
SIGNIFICANT ACCOUNTING POLICIES (Cont.)
|
The trade receivables of the Company are derived from sales to Customers located primarily in North America, Europe, and Australia.
The Company generally does not require collateral, however, in certain circumstances, the Company may require letters of credit, other collateral, or additional guarantees.
An allowance for doubtful accounts is determined with respect to specific debts that are doubtful of collection. The Company accrued $128, $226, and $235 as allowance for doubtful accounts as of December 31, 2017 and 2016 and June 30, 2016, respectively.
In addition, an accrual for rebates is allocated to specific debts. The Company accrued $17,428, $9,089, and $4,294 for rebates as of December 31, 2017 and 2016 and June 30, 2016, respectively.
As of December 31, 2017 and 2016 and June 30, 2016, the Company had two, one, and two major customers (customers with a balance that represents more than 10% of total trade receivables), respectively, which accounted in the aggregate for approximately 35.2%, 20.2%, and 34.4%, respectively, of the Company’s consolidated trade receivables.
The Company and its subsidiaries have no off-balance sheet concentration of credit risk except for certain derivative instruments as mentioned below.
s.
Fair value of financial instruments:
The following methods and assumptions were used by the Company in estimating the fair value of its financial instruments:
The carrying value of cash and cash equivalents, restricted cash, trade receivables, prepaid expenses and other accounts receivable, trade payables, employee and payroll accruals and accrued expenses, and other accounts payable approximate their fair values due to the short-term maturities of such instruments.
Assets measured at fair value on a recurring basis as of December 31, 2017, December 31, 2016, and June 30, 2016 are comprised of money market funds, foreign currency derivative contracts and marketable securities. (see Note 4)
The Company applies ASC 820 (“Fair Value Measurements and Disclosures”), with respect to fair value measurements of all financial assets and liabilities.
Fair value is an exit price, representing the amount that would be received to sell an asset or paid to transfer a liability in an orderly transaction between market participants. As such, fair value is a market-based measurement that should be determined based on assumptions that market participants would use in pricing an asset or a liability.
F - 24
SOLAREDGE TECHNOLOGIES, INC.
NOTES TO CONSOLIDATED FINANCIAL STATEMENTS
U.S. dollars in thousands, except share data
| NOTE 2:- |
SIGNIFICANT ACCOUNTING POLICIES (Cont.)
|
A three-tiered fair value hierarchy is established as a basis for considering such assumptions and for inputs used in the valuation methodologies in measuring fair value:
| Level 1- |
Observable inputs that reflect quoted prices (unadjusted) for identical assets or liabilities in active markets.
|
| Level 2- |
Include other inputs that are directly or indirectly observable in the marketplace.
|
| Level 3- |
Unobservable inputs which are supported by little or no market activity.
|
The fair value hierarchy also requires an entity to maximize the use of observable inputs and minimize the use of unobservable inputs when measuring fair value.
| t. |
Warrants to Purchase Convertible Preferred Stock:
|
The Company accounts for freestanding warrants to purchase shares of its convertible preferred stock as a liability on the balance sheets at fair value. The warrants to purchase convertible preferred stock are recorded as a liability because of a provision calling for minimum proceeds upon or after an “Exit Event”, as described in Note 10.
The fair value of warrants to purchase convertible preferred stock on the issuance date and on subsequent reporting dates was determined using a hybrid method utilizing the assumptions noted below. The fair value of the underlying preferred stock price was determined by the board of directors considering, among others, third party valuations. The valuation of the Company was performed using the hybrid method, a hybrid between the probability-weighted estimated return method (“PWERM”) and Option Pricing Method (“OPM”) estimating the probability-weighted value across multiple scenarios but using the OPM to estimate the allocation of value within one or more of those scenarios. The OPM was used to allocate the Company’s equity value between the preferred stock, common stock and warrants in a scenario of other liquidation events.
The expected terms of the warrants were based on the remaining contractual expiration period. The expected share price volatility for the shares was determined by examining the historical volatilities of a group of the Company’s industry peers as there was insufficient trading history of the Company’s shares. The risk-free interest rate was calculated using the average of the published interest rates for U.S. Treasury zero-coupon issues with maturities that approximate the expected term.
The dividend yield assumption was zero, as there is no history of dividend payments and the Company does not expect to pay any dividends in the foreseeable future.
F - 25
SOLAREDGE TECHNOLOGIES, INC.
NOTES TO CONSOLIDATED FINANCIAL STATEMENTS
U.S. dollars in thousands, except share data
| NOTE 2:- |
SIGNIFICANT ACCOUNTING POLICIES (Cont.)
|
The following assumptions were used to estimate the value of the warrants to purchase convertible preferred stock:
|
June 30,
|
||||
|
2014
|
||||
|
Expected volatility
|
45.0
|
%
|
||
|
Risk-free rate
|
0.09
|
%
|
||
|
Dividend yield
|
0
|
%
|
||
|
Expected term (in years)
|
1.21
|
|||
The warrants to purchase convertible preferred stock were subject to re-measurement to fair value at each balance sheet date and any change in fair value was recognized as a component of financial expenses, net, on the statements of operations.
The change in the fair value of warrants to purchase convertible preferred stock is summarized below:
|
Balance at
beginning
of period
|
Issuance of
warrants to purchase preferred stock |
Exercise of
warrants to purchase common stock (*) |
Change in fair value
|
Balance at
end of period |
||||||||||||||||
|
June 30, 2015
|
$
|
765
|
$
|
-
|
$
|
(6,115
|
)
|
$
|
5,350
|
$
|
-
|
|||||||||
| (*) |
Upon the closing of the IPO, all outstanding warrants to purchase convertible preferred stock automatically converted into warrants to purchase 187,671 shares of common stock (See Note 1c).
|
|
On June 18, 2015, the warrants were redeemed in a cashless exercise into 154,768 common shares. Immediately before the cashless exercise, the warrants were remeasured to fair value based on their intrinsic value which amounted to $6,115 (see Note 10).
|
| u. |
Accounting for stock-based compensation:
|
The Company accounts for stock-based compensation in accordance with ASC 718 (“Compensation-Stock Compensation”). ASC 718 requires companies to estimate the fair value of equity-based payment awards on the date of grant using an Option-Pricing Model (“OPM”). The value of the portion of the award that is ultimately expected to vest is recognized as an expense over the requisite service periods in the Company’s consolidated statements of operations.
F - 26
SOLAREDGE TECHNOLOGIES, INC.
NOTES TO CONSOLIDATED FINANCIAL STATEMENTS
U.S. dollars in thousands, except share data
| NOTE 2:- |
SIGNIFICANT ACCOUNTING POLICIES (Cont.)
|
The Company recognizes compensation expenses for the value of its awards granted based on the straight-line method over the requisite service period of each of the awards, net of estimated forfeitures. ASC 718 requires forfeitures to be estimated at the time of grant and revised, if necessary, in subsequent periods if actual forfeitures differ from those estimates. Estimated forfeitures are based on actual historical pre-vesting forfeitures (pursuant to the adoption of ASU 2016-09, the Company made a policy election to estimate the number of awards that are expected to vest).
The Company selected the Black-Scholes-Merton option pricing model as the most appropriate fair value method for its stock-option awards and Employee Stock Purchase Plan. The option-pricing model requires a number of assumptions, of which the most significant are the fair market value of the underlying common stock, expected stock price volatility, and the expected option term. Expected volatility for stock-option awards was calculated based upon certain peer companies that the Company considered to be comparable. Expected volatility for Employee Stock Purchase Plan was calculated based upon the Company’s stock prices. The expected option term represents the period of time that options granted are expected to be outstanding. The expected option term is determined based on the simplified method in accordance with SAB No. 110, as adequate historical experience is not available to provide a reasonable estimate. The simplified method will continue to apply until enough historical experience is available to provide a reasonable estimate of the expected term. The risk-free interest rate is based on the yield from U.S. treasury bonds with an equivalent term. The Company has not declared or paid any dividends on its common stock and does not expect to pay any dividends in the foreseeable future.
F - 27
SOLAREDGE TECHNOLOGIES, INC.
NOTES TO CONSOLIDATED FINANCIAL STATEMENTS
U.S. dollars in thousands, except share data
| NOTE 2:- |
SIGNIFICANT ACCOUNTING POLICIES (Cont.)
|
The fair value for options granted to employees and executive directors and Employee Stock Purchase Plan in the year ended December 31, 2017, the six months ended December 31, 2016, and the years ended June 30, 2016 and 2015 is estimated at the date of grant using a Black-Scholes-Merton option pricing model with the following assumptions:
|
Year ended
December 31, 2017
|
Six months ended December 31, 2016
|
Year Ended
June 30,
|
||||||||||||||
|
2016
|
2015
|
|||||||||||||||
|
Employee Stock Options
|
||||||||||||||||
|
Risk-free interest
|
2.14% - 2.17
|
%
|
1.28% - 1.34
|
%
|
1.39% - 1.97
|
%
|
1.39% - 2.06
|
%
|
||||||||
|
Dividend yields
|
0
|
%
|
0
|
%
|
0
|
%
|
0
|
%
|
||||||||
|
Volatility
|
58.08% - 58.10
|
%
|
55.33% - 55.34
|
%
|
55.45%-56.03
|
%
|
46.5%-55.1
|
%
|
||||||||
|
Expected option term in years
|
6.06
|
6.06
|
5.50-6.11
|
5.50-6.27
|
||||||||||||
|
Estimated forfeiture rate
|
0
|
%
|
0
|
%
|
10.3
|
%
|
12.5%-18.7
|
%
|
||||||||
|
Employee Stock Purchase Plan
|
||||||||||||||||
|
Risk-free interest
|
0.6% - 1.07
|
%
|
0.60
|
%
|
0.40
|
%
|
-
|
|||||||||
|
Dividend yields
|
0
|
%
|
0
|
%
|
0
|
%
|
-
|
|||||||||
|
Volatility
|
45.6% - 48.08
|
%
|
48.08
|
%
|
62.84
|
%
|
-
|
|||||||||
|
Expected term
|
6 months
|
6 months
|
6 months
|
-
|
||||||||||||
The following table set forth the parameters used in computation of the options compensation
to non-employee consultants in the year ended December 31, 2017, the six months ended December 31, 2016, and the years ended June 30, 2016 and 2015, using a Black-Scholes-Merton option pricing model with the following assumptions:
|
Year ended
December 31, 2017
|
Six months ended December 31, 2016
|
Year ended
June 30,
|
||||||||||||||
|
2016
|
2015
|
|||||||||||||||
|
Risk-free interest
|
2.12% - 2.42
|
%
|
1.16% - 2.45
|
%
|
1.15%-2.21
|
%
|
1.59%-2.58
|
%
|
||||||||
|
Dividend yields
|
0
|
%
|
0
|
%
|
0
|
%
|
0
|
%
|
||||||||
|
Volatility
|
61.21% - 62.62
|
%
|
55.33% - 58.57
|
%
|
55.37%-55.75
|
%
|
45.5%-56.2
|
%
|
||||||||
|
Contractual life in years
|
6-10
|
6 - 10
|
6.4-10
|
7.4-10
|
||||||||||||
The Company recognizes compensation expenses for the value of its restricted stock unit (“RSU”) awards, based on the straight-line method over the requisite service period of each of the awards, net of estimated forfeitures. The fair value of each RSU is the market value as determined by the closing price of the common stock on the day of grant.
F - 28
SOLAREDGE TECHNOLOGIES, INC.
NOTES TO CONSOLIDATED FINANCIAL STATEMENTS
U.S. dollars in thousands, except share data
| NOTE 2:- |
SIGNIFICANT ACCOUNTING POLICIES (Cont.)
|
| w. |
Income taxes:
|
The Company and its subsidiaries account for income taxes in accordance with ASC 740, “Income Taxes.” ASC 740 prescribes the use of the liability method, whereby deferred tax asset and liability account balances are determined based on differences between financial reporting and tax bases of assets and liabilities and are measured using the enacted tax rates that will be in effect when the differences are expected to reverse.
The Company accounts for uncertain tax positions in accordance with ASC 740. ASC 740-10 contains a two-step approach to recognizing and measuring uncertain tax positions. The first step is to evaluate the tax position taken or expected to be taken in a tax return by determining if the weight of available evidence indicates that it is more likely than not that, on an evaluation of the technical merits, the tax position will be sustained on audit, including resolution of any related appeals or litigation processes. The second step is to measure the tax benefit as the largest amount that is more than 50% (cumulative probability) likely to be realized upon ultimate settlement.
The Company record reserves for uncertain tax positions to the extent it is more likely than not that the tax position will be sustained on audit, based on the technical merits of the position.
| x. |
Derivative financial instruments:
|
The Company accounts for derivatives and hedging based on ASC 815 (“Derivatives and Hedging”). ASC 815 requires the Company to recognize all derivatives on the balance sheet at fair value. The accounting for changes in the fair value (i.e., gains or losses) of a derivative instrument depends on whether it has been designated and qualifies as part of a hedging relationship and further, on the type of hedging relationship.
To protect against the increase in value of forecasted foreign currency cash flows resulting from salary and lease payments of its Israeli facilities denominated in the Israeli currency, the New Israeli Shekel (“NIS”), the Company instituted a foreign currency cash flow hedging program. The Company hedges portions of the anticipated payroll and lease payments denominated in NIS for a period of one to twelve months with hedging contracts. These hedging contracts are designated as cash flow hedges, as defined by ASC 815 and are all effective hedges.
In accordance with ASC 815, for derivative instruments that are designated and qualify as a cash flow hedge (i.e. hedging the exposure to variability in expected future cash flows that is attributable to a particular risk), the effective portion of the gain or loss on the derivative instrument is reported as a component of other comprehensive income and reclassified into earnings in the same period or periods during which the hedged transaction affects earnings. Any gain or loss on a derivative instrument in excess of the cumulative change in the present value of future cash flows of the hedged item is recognized in current earnings during the period of change.
F - 29
SOLAREDGE TECHNOLOGIES, INC.
NOTES TO CONSOLIDATED FINANCIAL STATEMENTS
U.S. dollars in thousands, except share data
| NOTE 2:- |
SIGNIFICANT ACCOUNTING POLICIES (Cont.)
|
In addition to the above-mentioned cash flow hedges transactions, the Company also entered into derivative instrument arrangements to hedge the Company’s exposure to currencies other than the U.S. dollar. These derivative instruments are not designated as cash flow hedges, as defined by ASC 815, and therefore all gains and losses, resulting from fair value remeasurement, were recorded immediately in the statement of operations, as financial income (expenses).
As of December 31, 2017, the Company entered into forward contracts and put and call options to sell Euros for U.S. dollars in the amount of €54 million.
As of December 31, 2017, the Company had no derivative instruments that are designated as cash flow hedges.
As of December 31, 2016, the Company entered into forward contracts to sell U.S. dollars for NIS in the amount of $5,098. These hedging contracts do not contain any credit-risk-related contingency features. See Note 4 for information on the fair value of these hedging contracts.
As of December 31, 2016, the Company had no derivative instruments that are not designated as cash flow hedges.
As of June 30, 2016, the Company entered into forward contracts and put and call options to sell U.S. dollars for NIS and Euros for U.S. dollars in the amount of $17,693 and €30 million, respectively. These hedging contracts do not contain any credit-risk-related contingency features.
The fair value of derivative assets and derivative liabilities as of December 31, 2017 was $221 and $401, respectively, which was recorded at net amount in
accrued expenses and other accounts payable
in the consolidated balance sheets (see Note 13).
The fair value of derivative assets as of December 31, 2016 was $19, which was recorded in other accounts receivable and prepaid expenses in the consolidated balance sheets (see Note 13).
The fair value of derivative assets and derivative liabilities as of June 30, 2016 was $504 and $23, respectively, which was recorded at net amount in other accounts receivable and prepaid expenses in the consolidated balance sheets.
The Company recorded changes in the fair value (i.e., gains or losses) of the derivatives in the accompanying consolidated statements of cash flows as changes in operating activities.
F - 30
SOLAREDGE TECHNOLOGIES, INC.
NOTES TO CONSOLIDATED FINANCIAL STATEMENTS
U.S. dollars in thousands, except share data
| NOTE 2:- |
SIGNIFICANT ACCOUNTING POLICIES (Cont.)
|
| y. |
Comprehensive income:
|
The Company reports comprehensive income in accordance with ASC 220 (“Comprehensive Income”). ASC 220 establishes standards for the reporting and presentation of comprehensive income and its components in a full set of general purpose financial statements.
Total comprehensive income and the components of accumulated other comprehensive income are presented in the consolidated statements of stockholders’ equity. Accumulated other comprehensive income consists of foreign currency translation effects, unrealized gains and losses on available-for-sale marketable securities and hedging contracts.
| z. |
New accounting pronouncements not yet effective:
In May 2014, the FASB issued a new standard related to revenue recognition. Under the new standard, revenue is recognized when a customer obtains control of promised goods or services and is recognized in an amount that reflects the consideration which the entity expects to receive in exchange for those goods or services. In addition, the standard requires disclosure of the nature, amount, timing, and uncertainty of revenue and cash flow arising from contracts with customers. The guidance permits two methods of modification: retrospectively to each prior reporting period presented (full retrospective method), or retrospectively with the cumulative effect of initially applying the guidance recognized at the date of initial application (the modified retrospective method.). The Company will adopt the new standard, effective January 1, 2018, using the modified retrospective method applied to those contracts which were not substantially completed as of January 1, 2018. The cumulative adjustment will decrease the Company’s retained earnings by $3,875 while increasing the Company’s deferred revenues by the same amount.
|
The most significant impact of the standard on the Company’s financial statements relates to advance payments received for performance obligations that extend for a period greater than one year. Applying the new standard, such performance obligations related to warranty extension services, cloud-based monitoring, and other communication services are those that include a financial component.
Upon adoption, the financing component will result in interest expenses which will be included in the Company’s consolidated statement of operations to reflect the financial portion cost of the long-term deferred revenue that is related to such services.
F - 31
SOLAREDGE TECHNOLOGIES, INC.
NOTES TO CONSOLIDATED FINANCIAL STATEMENTS
U.S. dollars in thousands, except share data
| NOTE 2:- |
SIGNIFICANT ACCOUNTING POLICIES (Cont.)
|
In February 2016, the FASB issued ASU 2016-02, “Leases” (Topic 842), whereby lessees will be required to recognize for all leases at the commencement date a lease liability, which is a lessee‘s obligation to make lease payments arising from a lease, measured on a discounted basis, and a right-of-use asset, which is an asset that represents the lessee’s right to use, or control the use of, a specified asset for the lease term. Under the new guidance, lessor accounting is largely unchanged. A modified retrospective transition approach for leases existing at, or entered into after, the beginning of the earliest comparative period presented in the financial statements must be applied. The modified retrospective approach would not require any transition accounting for leases that expired before the earliest comparative period presented. Companies may not apply a full retrospective transition approach. ASU 2016-02 is effective for annual and interim periods beginning after December 15, 2018. Early application is permitted. The Company is evaluating the potential impact of this pronouncement.
In June 2016, the FASB issued ASU 2016-13, Financial Instruments - Credit Losses (Topic 326): Measurement of Credit Losses on Financial Instruments. ASU 2016-13 amends the impairment model to utilize an expected loss methodology in place of the currently used incurred loss methodology, which will result in the more timely recognition of losses. ASU 2016-13 also applies to employee benefit plan accounting, with an effective date of the first quarter of fiscal 2022. The Company is currently assessing the impact that adopting this new accounting standard will have on its consolidated financial statements, footnote disclosures, and employee benefit plans’ accounting.
In August 2016, the FASB issued ASU No. 2016-15, Statement of Cash Flows (Topic 230): Classification of Certain Cash Receipts and Cash Payments, which provides guidance with the intent of reducing diversity in practice in how certain cash receipts and cash payments are presented and classified in the statement of cash flows. ASU No. 2016-15 is effective for fiscal years beginning after December 15, 2017, including interim periods within those fiscal years with early adoption permitted, including adoption in an interim period. The Company will adopt the new standard effective January 1, 2018, and does not expect the adoption of this guidance to have a material impact on the Company’s consolidated financial statements.
In August 2016, the FASB issued ASU No. 2016-15, Statement of Cash Flows (Topic 230): Classification of Certain Cash Receipts and Cash Payments, which provides guidance with the intent of reducing diversity in practice in how certain cash receipts and cash payments are presented and classified in the statement of cash flows. ASU No. 2016-15 is effective for fiscal years beginning after December 15, 2017, including interim periods within those fiscal years with early adoption permitted, including adoption in an interim period. The Company will adopt the new standard effective January 1, 2018, and does not expect the adoption of this guidance to have a material impact on the Company’s consolidated financial statements.
F - 32
SOLAREDGE TECHNOLOGIES, INC.
NOTES TO CONSOLIDATED FINANCIAL STATEMENTS
U.S. dollars in thousands, except share data
| NOTE 2:- |
SIGNIFICANT ACCOUNTING POLICIES (Cont.)
|
In October 2016, the FASB issued Accounting Standards Update No. 2016-16, Income Taxes (Topic 740): Intra-Entity Transfers Other than Inventory (ASU 2016-16), which requires companies to recognize the income-tax consequences of an intra-entity transfer of an asset other than inventory when the transfer occurs, rather than when the asset has been sold to an outside party. The Company will adopt the new standard effective January 1, 2018 and does not expect the adoption of this guidance to have a material impact on the Company’s consolidated financial statements.
In November 2016, the FASB issued Accounting Standards Update No. 2016-18, Statement of Cash Flows (Topic 230): Restricted Cash (ASU 2016-18), which requires companies to include amounts generally described as restricted cash and restricted cash equivalents in cash and cash equivalents when reconciling beginning-of-period and end-of-period total amounts shown on the statement of cash flows. The Company will adopt the new standard effective January 1, 2018, and does not expect the adoption of this guidance to have a material impact on the Company’s consolidated financial statements.
In May 2017, the FASB issued ASU 2017-09, "Compensation – Stock Compensation (Topic 718): Scope of Modification Accounting." ASU 2017-09 was issued to provide clarity and reduce both 1) diversity in practice and 2) cost and complexity when applying the guidance in Topic 718 to a change in the terms or conditions of a share-based payment award. ASU 2017-09 provides guidance about which changes to the terms or conditions of a share-based payment award require an entity to apply modification accounting under Topic 718. The amendments in ASU 2017-09 are effective for fiscal years, and interim periods within those years, beginning after December 15, 2017. Early adoption is permitted, including adoption in any interim period. The amendments in ASU 2017-09 should be applied prospectively to an award modified on or after the adoption date. The Company will adopt the new standard effective January 1, 2018 and adoption of this standard is not expected to have a material impact on the consolidated financial statements.
In May 2017, the FASB issued ASU 2017-09, "Compensation – Stock Compensation (Topic 718): Scope of Modification Accounting." ASU 2017-09 was issued to provide clarity and reduce both 1) diversity in practice and 2) cost and complexity when applying the guidance in Topic 718 to a change in the terms or conditions of a share-based payment award. ASU 2017-09 provides guidance about which changes to the terms or conditions of a share-based payment award require an entity to apply modification accounting under Topic 718. The amendments in ASU 2017-09 are effective for fiscal years, and interim periods within those years, beginning after December 15, 2017. Early adoption is permitted, including adoption in any interim period. The amendments in ASU 2017-09 should be applied prospectively to an award modified on or after the adoption date. The Company will adopt the new standard effective January 1, 2018 and adoption of this standard is not expected to have a material impact on the consolidated financial statements.
In January 2018, the FASB released guidance on the accounting for tax on the global intangible low-taxed income ("GILTI") provisions of the Tax Cuts and Jobs Act (the "TCJA"). The GILTI provisions impose a tax on foreign income in excess of a deemed return on tangible assets of foreign corporations. The guidance indicates that either accounting for deferred taxes related to GILTI inclusions or to treat any taxes on GILTI inclusions as period cost are both acceptable methods subject to an accounting policy election. Due to the complexity of this new tax rule, the Company continues to evaluate this provision of the TCJA and whether such taxes are recorded as a current-period expense when incurred or whether such amount should be factored into a company’s measurement of its deferred taxes. As a result,
the Company
has
not included an estimate of the tax expense/benefit related to this item for the
year
ended December 31, 2017.
| aa. |
Recently issued and adopted pronouncements:
|
In July 2015, the FASB issued ASU No. 2015-11, Inventory (Topic 330): Simplifying the Measurement of Inventory (“ASU 2015-11”). The new standard applies only to inventory for which cost is determined by methods other than last-in, first-out or the retail inventory method, such as inventory measured using first-in, first-out, or average cost. Inventory within the scope of ASU 2015-11 is required to be measured at the lower of cost and net realizable value. Net realizable value is the estimated selling prices in the ordinary course of business, less reasonably predictable costs of completion, disposal, and transportation. The Company adopted ASU 2015-11 during the first quarter of 2017, which did not have a material impact on our results of operations, cash flows, or financial position.
F - 33
SOLAREDGE TECHNOLOGIES, INC.
NOTES TO CONSOLIDATED FINANCIAL STATEMENTS
U.S. dollars in thousands, except share data
| NOTE 3:- |
MARKETABLE SECURITIES
|
The following is a summary of available-for-sale marketable securities at December 31, 2017:
|
Amortized
cost
|
Gross unrealized
gains
|
Gross unrealized
losses
|
Fair
value
|
|||||||||||||
|
Available for-sale – matures within one year:
|
||||||||||||||||
|
Corporate bonds
|
$
|
68,392
|
$
|
1
|
$
|
(121
|
)
|
$
|
68,272
|
|||||||
|
Governmental bonds
|
9,019
|
-
|
(27
|
)
|
8,992
|
|||||||||||
|
77,411
|
1
|
(148
|
)
|
77,264
|
||||||||||||
|
Available for-sale – matures after one year:
|
||||||||||||||||
|
Corporate bonds
|
95,540
|
-
|
(380
|
)
|
95,160
|
|||||||||||
|
Governmental bonds
|
8,023
|
-
|
(63
|
)
|
7,960
|
|||||||||||
|
103,563
|
-
|
(443
|
)
|
103,120
|
||||||||||||
|
Total
|
$
|
180,974
|
$
|
1
|
$
|
(591
|
)
|
$
|
180,384
|
|||||||
The following is a summary of available-for-sale marketable securities at December 31, 2016:
|
Amortized
cost
|
Gross unrealized
gains
|
Gross unrealized
losses
|
Fair
value
|
|||||||||||||
|
Available for-sale – matures within one year:
|
||||||||||||||||
|
Corporate bonds
|
$
|
71,753
|
$
|
20
|
$
|
(54
|
)
|
$
|
71,719
|
|||||||
|
Governmental bonds
|
2,758
|
-
|
(12
|
)
|
2,746
|
|||||||||||
|
74,511
|
20
|
(66
|
)
|
74,465
|
||||||||||||
|
Available for-sale – matures after one year:
|
||||||||||||||||
|
Corporate bonds
|
39,435
|
3
|
(159
|
)
|
39,279
|
|||||||||||
|
Governmental bonds
|
5,004
|
-
|
(21
|
)
|
4,983
|
|||||||||||
|
44,439
|
3
|
(180
|
)
|
44,262
|
||||||||||||
|
Total
|
$
|
118,950
|
$
|
23
|
$
|
(246
|
)
|
$
|
118,727
|
|||||||
F - 34
SOLAREDGE TECHNOLOGIES, INC.
NOTES TO CONSOLIDATED FINANCIAL STATEMENTS
U.S. dollars in thousands, except share data
| NOTE 3:- |
MARKETABLE SECURITIES (Cont.)
|
The following is a summary of available-for-sale marketable securities at June 30, 2016:
|
Amortized
cost
|
Gross unrealized
gains
|
Gross unrealized
losses
|
Fair
value
|
|||||||||||||
|
Available for-sale – matures within one year:
|
||||||||||||||||
|
Corporate bonds
|
$
|
57,119
|
$
|
50
|
$
|
(11
|
)
|
$
|
57,158
|
|||||||
|
Governmental bonds
|
2,005
|
-
|
-
|
2,005
|
||||||||||||
|
59,124
|
50
|
(11
|
)
|
59,163
|
||||||||||||
|
Available for-sale – matures after one year:
|
||||||||||||||||
|
Corporate bonds
|
46,375
|
86
|
(31
|
)
|
46,430
|
|||||||||||
|
Governmental bonds
|
6,015
|
7
|
(6
|
)
|
6,016
|
|||||||||||
|
52,390
|
93
|
(37
|
)
|
52,446
|
||||||||||||
|
Total
|
$
|
111,514
|
$
|
143
|
$
|
(48
|
)
|
$
|
111,609
|
|||||||
The following table presents gross unrealized losses and fair values for those investments that were in an unrealized loss position as of December 31, 2017, December 31, 2016, and June 30, 2016 based on the investments maturity date:
|
Less than 12 months
|
12 months or greater
|
|||||||||||||||
|
Fair value
|
Gross unrealized losses
|
Fair value
|
Gross unrealized losses
|
|||||||||||||
|
As of
December 31, 2017
|
$
|
72,269
|
$
|
(148
|
)
|
$
|
103,116
|
$
|
(443
|
)
|
||||||
|
As of
December 31, 2016
|
$
|
51,124
|
$
|
(66
|
)
|
$
|
39,373
|
$
|
(180
|
)
|
||||||
|
As of
June 30, 2016
|
$
|
22,895
|
$
|
(11
|
)
|
$
|
20,070
|
$
|
(37
|
)
|
||||||
F - 35
SOLAREDGE TECHNOLOGIES, INC.
NOTES TO CONSOLIDATED FINANCIAL STATEMENTS
U.S. dollars in thousands, except share data
| NOTE 3:- |
MARKETABLE SECURITIES (Cont.)
|
As of December 31, 2017 and 2016 and June 30, 2016, management believes the unrealized losses are not other than temporary and therefore such unrealized losses were recorded in accumulated other comprehensive income (loss). The Company has no intent to sell these securities and it is more likely than not that the Company will not be required to sell these securities prior to the recovery of the entire amortized cost basis.
Proceeds from maturity of available-for-sale marketable securities during the year ended December 31, 2017, the six months ended December 31, 2016, and the year ended June 30, 2016 were $80,269, $32,782 and $6,350, respectively. The Company had no proceeds from sales of available-for-sale marketable securities during the year ended December 31, 2017, the six months ended December 31, 2016, and the year ended June 30, 2016, therefore no realized gains or losses from the sale of available-for sale marketable securities were recognized. The Company determines realized gains or losses on the sale of available-for-sale marketable securities based on a specific identification method.
| NOTE 4:- |
FAIR VALUE MEASUREMENTS
|
In accordance with ASC 820, the Company measures its cash equivalents, foreign currency derivative contracts, and marketable securities, at fair value using the market approach valuation technique.
Cash equivalents and marketable securities are classified within Level 1 or Level 2. This is because these assets are valued using quoted market prices or alternative pricing sources and models utilizing market observable inputs.
Foreign currency derivative contracts are classified within the Level 2 value hierarchy, as the valuation inputs are based on quoted prices and market observable data of similar instruments.
The following table sets forth the Company’s assets that were measured at fair value as of December 31, 2017 by level within the fair value hierarchy:
|
|
Balance as of
|
Fair value measurements
|
||||||||||||||
|
Description
|
December 31,
2017
|
Level 1
|
Level 2
|
Level 3
|
||||||||||||
|
Cash equivalents:
|
||||||||||||||||
|
Money market mutual funds
|
$
|
6,163
|
$
|
6,163
|
-
|
-
|
||||||||||
|
Derivative instruments liability
|
$
|
(180
|
)
|
-
|
$
|
(180
|
)
|
-
|
||||||||
|
Short-term marketable securities:
|
||||||||||||||||
|
Corporate bonds
|
$
|
68,272
|
-
|
$
|
68,272
|
-
|
||||||||||
|
Governmental bonds
|
$
|
8,992
|
-
|
$
|
8,992
|
-
|
||||||||||
|
Long-term marketable securities:
|
||||||||||||||||
|
Corporate bonds
|
$
|
95,160
|
-
|
$
|
95,160
|
-
|
||||||||||
|
Governmental bonds
|
$
|
7,960
|
-
|
$
|
7,960
|
-
|
||||||||||
F - 36
SOLAREDGE TECHNOLOGIES, INC.
NOTES TO CONSOLIDATED FINANCIAL STATEMENTS
U.S. dollars in thousands, except share data
| NOTE 4:- |
FAIR VALUE MEASUREMENTS (Cont.)
|
The following table sets forth the Company’s assets that were measured at fair value as of December 31, 2016 by level within the fair value hierarchy:
|
|
Balance as of
|
Fair value measurements
|
||||||||||||||
|
Description
|
December 31,
2016
|
Level 1
|
Level 2
|
Level 3
|
||||||||||||
|
Cash equivalents:
|
||||||||||||||||
|
Money market mutual funds
|
$
|
6,510
|
$
|
6,510
|
-
|
-
|
||||||||||
|
Derivative instruments asset
|
$
|
19
|
-
|
$
|
19
|
-
|
||||||||||
|
Short-term marketable securities:
|
||||||||||||||||
|
Corporate bonds
|
$
|
71,719
|
-
|
$
|
71,719
|
-
|
||||||||||
|
Governmental bonds
|
$
|
2,746
|
-
|
$
|
2,746
|
-
|
||||||||||
|
Long-term marketable securities:
|
||||||||||||||||
|
Corporate bonds
|
$
|
39,279
|
-
|
$
|
39,279
|
-
|
||||||||||
|
Governmental bonds
|
$
|
4,983
|
-
|
$
|
4,983
|
-
|
||||||||||
The following table sets forth the Company’s assets that were measured at fair value as of June 30, 2016 by level within the fair value hierarchy:
|
|
Balance as of
|
Fair value measurements
|
||||||||||||||
|
Description
|
June 30,
2016
|
Level 1
|
Level 2
|
Level 3
|
||||||||||||
|
Cash equivalents:
|
||||||||||||||||
|
Money market mutual funds
|
$
|
13,373
|
$
|
13,373
|
-
|
-
|
||||||||||
|
Derivative instruments asset
|
$
|
481
|
-
|
$
|
481
|
-
|
||||||||||
|
Short-term marketable securities:
|
||||||||||||||||
|
Corporate bonds
|
$
|
57,158
|
-
|
$
|
57,158
|
-
|
||||||||||
|
Governmental bonds
|
$
|
2,005
|
-
|
$
|
2,005
|
-
|
||||||||||
|
Long-term marketable securities:
|
||||||||||||||||
|
Corporate bonds
|
$
|
46,430
|
-
|
$
|
46,430
|
-
|
||||||||||
|
Governmental bonds
|
$
|
6,016
|
-
|
$
|
6,016
|
-
|
||||||||||
F - 37
SOLAREDGE TECHNOLOGIES, INC.
NOTES TO CONSOLIDATED FINANCIAL STATEMENTS
U.S. dollars in thousands, except share data
| NOTE 5:- |
PREPAID EXPENSES AND OTHER ACCOUNTS RECEIVABLE
|
|
December 31,
|
June 30,
|
|||||||||||
|
2017
|
2016
|
2016
|
||||||||||
|
Vendor non-trade receivables
(*)
|
$
|
33,719
|
$
|
15,209
|
$
|
15,375
|
||||||
|
Government authorities
|
3,421
|
2,585
|
2,727
|
|||||||||
|
Prepaid expenses and other
|
5,083
|
3,534
|
2,756
|
|||||||||
|
Foreign currency derivative contracts
|
-
|
19
|
482
|
|||||||||
|
$
|
42,223
|
$
|
21,347
|
$
|
21,340
|
|||||||
(*) Vendor non-trade receivables related to contract manufacturers
derive
from the sale of components to manufacturing vendors who manufacture products for the Company. The Company purchases these components directly from other suppliers. The Company does not reflect the sale of these components to the contract manufacturers in revenues (see also Note 14e).
| NOTE 6:- |
INVENTORIES
|
|
December 31,
|
June 30,
|
|||||||||||
|
2017
|
2016
|
2016
|
||||||||||
|
Raw materials
|
$
|
25,887
|
$
|
10,053
|
$
|
9,805
|
||||||
|
Finished goods
|
57,105
|
57,310
|
71,745
|
|||||||||
|
$
|
82,992
|
$
|
67,363
|
$
|
81,550
|
|||||||
The Company recorded inventory write-downs of $1,352, $113, $2,539, and $992 for the year ended December 31, 2017, the six months ended December 31, 2016, and for the years ended June 30, 2016 and 2015, respectively.
F - 38
SOLAREDGE TECHNOLOGIES, INC.
NOTES TO CONSOLIDATED FINANCIAL STATEMENTS
U.S. dollars in thousands, except share data
| NOTE 7:- |
PROPERTY AND EQUIPMENT AND INTANGIBLE ASSETS, NET
|
| a. |
Property and equipment:
|
|
As of
December 31,
|
As of
June 30,
|
|||||||||||
|
2017
|
2016
|
2016
|
||||||||||
|
Cost:
|
||||||||||||
|
Computers and peripheral equipment
|
$
|
9,872
|
$
|
6,053
|
$
|
5,190
|
||||||
|
Office furniture and equipment
|
1,785
|
1,505
|
1,289
|
|||||||||
|
Laboratory and testing equipment
|
13,732
|
9,589
|
8,590
|
|||||||||
|
Machinery and equipment
|
38,422
|
26,285
|
18,433
|
|||||||||
|
Leasehold improvements
|
7,536
|
5,898
|
5,450
|
|||||||||
|
Vehicles
|
39
|
13
|
13
|
|||||||||
|
71,386
|
49,343
|
38,965
|
||||||||||
|
Less - accumulated depreciation
|
20,204
|
13,221
|
11,134
|
|||||||||
|
Depreciated cost
|
$
|
51,182
|
$
|
36,122
|
$
|
27,831
|
||||||
Property in progress under construction and development with a cost basis of $8,783, $10,698, and $5,519 was included in Machinery and equipment as of December 31, 2017 and 2016 and June 30, 2016, respectively.
Depreciation expenses for the year ended December 31, 2017, the six months ended December 31, 2016, and for the years ended June 30, 2016 and 2015 were $7,011, $2,702, $3,763, and $2,253, respectively.
| b. |
Intangible assets:
|
On March 9, 2015, the Company and Beacon Power LLC, a Delaware limited liability company (“Beacon”) entered into a patent purchase agreement pursuant to which the Company agreed to purchase all rights in the patents. In July 2015, the Company completed the purchase of the patents for $800.
In October 2016, the Company and Accurate Solar Power, LLC, a limited liability corporation, entered into a patent purchase agreement, under which the Company agreed to purchase certain patents, provisional patent applications, and pending patent applications. The Company completed the purchase in return for total consideration of $600.
Intangible assets include an acquired patents with an original cost of $1,400 as of December 31, 2017 and December 31, 2016, and $800 as of June 30, 2016.
Accumulated amortization amounted to $285, $141, and $84 as of December 31, 2017, 2016 and June 30, 2016, respectively. The patents are amortized over a 10 year period.
Amortization expenses for the year ended December 31, 2017, for the six months ended December 31, 2016, and for the year ended June 30, 2016 were $144, $57, and $84, respectively.
F - 39
SOLAREDGE TECHNOLOGIES, INC.
NOTES TO CONSOLIDATED FINANCIAL STATEMENTS
U.S. dollars in thousands, except share data
| NOTE 8:- |
ACCRUED EXPENSES AND OTHER ACCOUNTS PAYABLE
|
|
As of
December 31,
|
As of
June 30,
|
|||||||||||
|
2017
|
2016
|
2016
|
||||||||||
|
Accrued expenses
|
$
|
14,863
|
$
|
4,209
|
$
|
5,615
|
||||||
|
Government authorities
|
1,905
|
1,568
|
1,406
|
|||||||||
|
Loss provision related to contractual inventory purchase obligations *
|
1,627
|
2,009
|
2,834
|
|||||||||
|
Other
|
1,983
|
862
|
870
|
|||||||||
|
$
|
20,378
|
$
|
8,648
|
$
|
10,725
|
|||||||
| * |
See also Note 14e.
|
| NOTE 9:- |
WARRANTY OBLIGATIONS
|
Changes in the Company’s product warranty liability for the year ended December 31, 2017, the six months ended December 31, 2016, and the year ended June 30, 2016 were as follows:
|
December 31,
|
June 30,
|
|||||||||||
|
2017
|
2016
|
2016
|
||||||||||
|
Balance, at beginning of year
|
$
|
58,375
|
$
|
51,192
|
$
|
31,879
|
||||||
|
Additions and adjustments to cost of revenues
|
34,650
|
13,749
|
28,848
|
|||||||||
|
Usage and current warranty expenses
|
(14,214
|
)
|
(6,566
|
)
|
(9,535
|
)
|
||||||
|
Balance, at end of year
|
78,811
|
58,375
|
51,192
|
|||||||||
|
Less current portion
|
(14,785
|
)
|
(13,616
|
)
|
(14,114
|
)
|
||||||
|
Long term portion
|
$
|
64,026
|
$
|
44,759
|
$
|
37,078
|
||||||
| NOTE 10:- |
TERM LOAN AND WARRANTS TO PURCHASE CONVERTIBLE PREFERRED STOCK
|
On December 28, 2012, (the “Agreement Date”), the Company entered into a loan facility agreement (the “Loan Agreement”) with a lender (the “Lender”), pursuant to which the Lender agreed to loan the Company up to $10,000. On the Agreement Date, the Company received a total of $10,000, less a $100 loan transaction fee paid to the Lender (the “Loan”). The Loan is for a period of 42 months and bears annual interest of 11.90%, which is to be paid monthly.
The principal of the loan is to be paid in 33 monthly payments, beginning in September 2013, except for the last loan payment which was paid in advance on the Agreement Date. Repayment of the Loan and payment of all other amounts owed to the Lender is paid in Euro.
F - 40
SOLAREDGE TECHNOLOGIES, INC.
NOTES TO CONSOLIDATED FINANCIAL STATEMENTS
U.S. dollars in thousands, except share data
| NOTE 10:- |
TERM LOAN AND WARRANTS TO PURCHASE CONVERTIBLE PREFERRED STOCK (Cont.)
|
In connection with the Loan Agreement, the Company granted the Lender 563,014 warrants to purchase Series D-1 convertible preferred stock at an exercise price of $2.309 (the “Warrants”). The Warrants were exercisable in whole or in part prior to earliest of (i) the tenth anniversary of the Agreement Date, or (ii) 12 months after a qualified initial public offering, or (iii) immediately prior to the consumption of a merger or sale of all or substantially all of the Company’s assets (“M&A Transaction”, and together with a qualified initial public offering, an “Exit Event”).
Upon the closing of the IPO, all outstanding warrants to purchase convertible preferred stock automatically converted into warrants to purchase 187,671 shares of common stock (See Note 1c).
In January 2015, the Company fully settled the amount borrowed from the Lender under the Term Loan.
On June 18, 2015, the Lender elected to exercise its cashless exercise rights under which the Company issued 154,768 shares of common stock. The fair value of the Warrants liability as of the exercise date in the amount of $6,115 was reclassified to stockholders’ equity (deficiency).
| NOTE 11:- |
REVOLVING CREDIT LINE
|
In June 2011, the Company entered into an agreement for a revolving line of credit from a Bank Lender (the "Bank Lender"), which, as amended to date, permits aggregate borrowings of up to $20,000 in an amount not to exceed 80% of the eligible trade receivables plus 65% of inventories in transit to customers and bears interest, payable monthly, at the Bank Lender’s prime rate plus a margin of 0.75% to 2.75%.
On February 17, 2015, the Company amended and restated the agreement with the Bank Lender for a revolving line of credit, which permits aggregate borrowings of up to $40,000 in an amount not to exceed 80% of the eligible accounts receivable and bears interest, payable monthly, at the Bank Lender’s prime rate plus a margin of 0.5% to 2.0%. As of December 31, 2016, the revolving line of credit was terminated and the Company had no outstanding borrowings related to this revolving line of credit.
As of June 30, 2016 and 2015, the Company met all its Bank Lender covenants.
As of December 31, 2016, June 30, 2016 and 2015, the Company had no outstanding borrowings related to this revolving line of credit. The revolving line of credit terminated on December 31, 2016.
F - 41
SOLAREDGE TECHNOLOGIES, INC.
NOTES TO CONSOLIDATED FINANCIAL STATEMENTS
U.S. dollars in thousands, except share data
NOTE 12:- ACCUMULATED OTHER COMPREHENSIVE INCOME (LOSS)
The following table summarizes the changes in accumulated balances of other comprehensive income, net of taxes, for the year ended December 31, 2017:
|
Unrealized gains (losses) on available-for-sale marketable securities
|
Unrealized gains (losses) on cash flow hedges
|
Unrealized gains (losses) on foreign currency translation
|
Total
|
|||||||||||||
|
Beginning balance
|
$
|
(136
|
)
|
$
|
19
|
$
|
(207
|
)
|
$
|
(324
|
)
|
|||||
|
Other comprehensive income (loss) before reclassifications
|
(297
|
)
|
975
|
29
|
707
|
|||||||||||
|
Gains
reclassified from accumulated other comprehensive income
|
-
|
(994
|
)
|
-
|
(994
|
)
|
||||||||||
|
Net current period other comprehensive income (loss)
|
(297
|
)
|
(19
|
)
|
29
|
(287
|
)
|
|||||||||
|
Ending balance
|
$
|
(433
|
)
|
$
|
-
|
$
|
(178
|
)
|
$
|
(611
|
)
|
|||||
The following table summarizes the changes in accumulated balances of other comprehensive loss, net of taxes, for the six months ended December 31, 2016:
|
Unrealized gains (losses) on available-for-sale marketable securities
|
Unrealized gains (losses) on cash flow hedges
|
Unrealized gains (losses) on foreign currency translation
|
Total
|
|||||||||||||
|
Beginning balance
|
$
|
57
|
$
|
243
|
$
|
(29
|
)
|
$
|
271
|
|||||||
|
Other comprehensive income (loss) before reclassifications
|
(193
|
)
|
93
|
(178
|
)
|
(278
|
)
|
|||||||||
|
G
ains reclassified from accumulated other comprehensive income
|
-
|
(317
|
)
|
-
|
(317
|
)
|
||||||||||
|
Net current period other comprehensive loss
|
(193
|
)
|
(224
|
)
|
(178
|
)
|
(595
|
)
|
||||||||
|
Ending balance
|
$
|
(136
|
)
|
$
|
19
|
$
|
(207
|
)
|
$
|
(324
|
)
|
|||||
F - 42
SOLAREDGE TECHNOLOGIES, INC.
NOTES TO CONSOLIDATED FINANCIAL STATEMENTS
U.S. dollars in thousands, except share dat
NOTE 12:- ACCUMULATED OTHER COMPREHENSIVE INCOME (LOSS) (Cont.)
The following table summarizes the changes in accumulated balances of other comprehensive income, net of taxes, for the year ended June 30, 2016:
|
Unrealized gains (losses) on available-for-sale marketable securities
|
Unrealized gains (losses) on cash flow hedges
|
Unrealized gains (losses) on foreign currency translation
|
Total
|
|||||||||||||
|
Beginning balance
|
$
|
-
|
$
|
-
|
$
|
(222
|
)
|
$
|
(222
|
)
|
||||||
|
Other comprehensive income (loss) before reclassifications
|
56
|
412
|
193
|
661
|
||||||||||||
|
Losses (gains) reclassified from accumulated other comprehensive income (loss)
|
1
|
(169
|
)
|
-
|
(168
|
)
|
||||||||||
|
Net current period other comprehensive income
|
57
|
243
|
193
|
493
|
||||||||||||
|
Ending balance
|
$
|
57
|
$
|
243
|
$
|
(29
|
)
|
$
|
271
|
|||||||
F - 43
SOLAREDGE TECHNOLOGIES, INC.
NOTES TO CONSOLIDATED FINANCIAL STATEMENTS
U.S. dollars in thousands, except share data
NOTE 12:- ACCUMULATED OTHER COMPREHENSIVE INCOME (LOSS) (Cont.)
The
following tables provides details about reclassifications out of accumulated other comprehensive income (loss):
|
Details about Accumulated Other Comprehensive
Loss Components |
Amount Reclassified from
Accumulated Other Comprehensive Loss |
Affected Line Item in the Statements of Operations
|
|||
|
Year ended
|
|||||
|
December 31, 2017
|
|||||
|
Unrealized gains on cash flow hedges
|
$
|
166
|
Cost of revenues
|
||
|
570
|
Research and development
|
||||
|
151
|
Sales and marketing
|
||||
|
153
|
General and administrative
|
||||
|
1,040
|
Total, before income taxes
|
||||
|
46
|
Income tax expense
|
||||
|
$
|
994
|
Total, net of income taxes
|
|||
|
Unrealized gains on available-for-sale marketable securities
|
$
|
-
|
Financial income, net
|
||
|
-
|
Income tax expense
|
||||
|
$
|
-
|
Total, net of income taxes
|
|||
|
$
|
994
|
Total, net of income taxes
|
|||
F - 44
SOLAREDGE TECHNOLOGIES, INC.
NOTES TO CONSOLIDATED FINANCIAL STATEMENTS
U.S. dollars in thousands, except share data
NOTE 12:- ACCUMULATED OTHER COMPREHENSIVE INCOME (LOSS) (Cont.)
|
Details about Accumulated Other Comprehensive
Loss Components |
Amount Reclassified from
Accumulated Other Comprehensive Loss |
Affected Line Item in the Statements of Operations
|
|||
|
Six months ended
|
|||||
|
December 31, 2016
|
|||||
|
Unrealized gains on cash flow hedges
|
$
|
47
|
Cost of revenues
|
||
|
227
|
Research and development
|
||||
|
58
|
Sales and marketing
|
||||
|
46
|
General and administrative
|
||||
|
378
|
Total, before income taxes
|
||||
|
61
|
Income tax expense
|
||||
|
$
|
317
|
Total, net of income taxes
|
|||
|
Unrealized gains on available-for-sale marketable securities
|
$
|
-
|
Financial income, net
|
||
|
-
|
Income tax expense
|
||||
|
$
|
-
|
Total, net of income taxes
|
|||
|
$
|
317
|
Total, net of income taxes
|
|||
F - 45
SOLAREDGE TECHNOLOGIES, INC.
NOTES TO CONSOLIDATED FINANCIAL STATEMENTS
U.S. dollars in thousands, except share data
NOTE 12:- ACCUMULATED OTHER COMPREHENSIVE INCOME (LOSS) (Cont.)
|
Details about Accumulated Other Comprehensive
Income Components |
Amount Reclassified from
Accumulated Other Comprehensive Income |
Affected Line Item in the Statements of Operations
|
|||
|
Year ended
|
|||||
|
June 30, 2016
|
|||||
|
Unrealized gains on cash flow hedges
|
$
|
30
|
Cost of revenues
|
||
|
115
|
Research and development
|
||||
|
33
|
Sales and marketing
|
||||
|
24
|
General and administrative
|
||||
|
202
|
Total, before income taxes
|
||||
|
33
|
Income tax expense
|
||||
|
$
|
169
|
Total, net of income taxes
|
|||
|
Unrealized losses on available-for-sale marketable securities
|
$
|
(1
|
)
|
Financial income, net
|
|
|
-
|
Income tax expense
|
||||
|
$
|
(1
|
)
|
Total, net of income taxes
|
||
|
$
|
168
|
Total, net of income taxes
|
|||
No amounts were reclassified from accumulated other comprehensive income for the year ended June 30, 2015.
F - 46
SOLAREDGE TECHNOLOGIES, INC.
NOTES TO CONSOLIDATED FINANCIAL STATEMENTS
U.S. dollars in thousands, except share data
NOTE 13:- DERIVATIVE INSTRUMENTS
The fair value of the Company’s outstanding derivative instruments is as follows:
|
As of December 31,
|
As of June 30,
|
|||||||||||
|
2017
|
2016
|
2016
|
||||||||||
|
Derivative assets:
|
||||||||||||
|
Derivatives not designated as cash flow hedging instruments:
|
||||||||||||
|
Foreign exchange option contracts
|
$
|
221
|
$
|
-
|
$
|
214
|
||||||
|
Derivatives designated as cash flow hedging instruments:
|
||||||||||||
|
Foreign exchange forward contracts
|
-
|
19
|
290
|
|||||||||
|
Total
|
$
|
221
|
$
|
19
|
$
|
504
|
||||||
|
Derivative liabilities
:
|
||||||||||||
|
Derivatives not designated as cash flow hedging instruments:
|
||||||||||||
|
Foreign exchange option contracts
|
$
|
(285
|
)
|
$
|
-
|
$
|
(23
|
)
|
||||
|
Foreign exchange forward contracts
|
(116
|
)
|
-
|
-
|
||||||||
|
Total
|
$
|
(401
|
)
|
$
|
-
|
$
|
(23
|
)
|
||||
The increase (decrease) in unrealized gains (losses) recognized in “accumulated other comprehensive income (loss)” on derivatives, net of tax effect, is as follows:
|
Year ended
December 31,
|
Six months ended
December 31,
|
Year ended June 30,
|
||||||||||||||
|
2017
|
2016
|
2016
|
2015
|
|||||||||||||
|
Derivatives designated as cash flow hedging instruments:
|
||||||||||||||||
|
Foreign exchange forward contracts
|
$
|
975
|
$
|
93
|
$
|
412
|
$
|
-
|
||||||||
|
Total
|
$
|
975
|
$
|
93
|
$
|
412
|
$
|
-
|
||||||||
F - 47
SOLAREDGE TECHNOLOGIES, INC.
NOTES TO CONSOLIDATED FINANCIAL STATEMENTS
U.S. dollars in thousands, except share data
NOTE 13:- DERIVATIVE INSTRUMENTS (Cont.)
The net (gains) losses reclassified from “accumulated other comprehensive income (loss)” into income (loss), are as follows:
|
Year ended
December 31,
|
Six months ended
December 31,
|
Year ended June 30,
|
||||||||||||||
|
2017
|
2016
|
2016
|
2015
|
|||||||||||||
|
Derivatives designated as cash flow hedging instruments:
|
||||||||||||||||
|
Foreign exchange forward contracts
|
$
|
994
|
$
|
(317
|
)
|
$
|
(169
|
)
|
$
|
-
|
||||||
|
Total
|
$
|
994
|
$
|
(317
|
)
|
$
|
(169
|
)
|
$
|
-
|
||||||
The Company recorded in the financial income (expenses), a net gain (loss) of $1,334, $(87), $(136), and $1,721 during the year ended December 2017, the six months ended December 31, 2016, and years ended June 30, 2016 and 2015, respectively, related to derivatives not qualified as hedging instruments.
| NOTE 14:- |
COMMITMENTS AND CONTINGENT LIABILITIES
|
| a. |
Lease commitments:
|
The Company and its subsidiaries lease their operating facilities under non-cancelable operating lease agreements, which expire over the next ten years, with the last ending in September 2027.
On July 10, 2017 the Company entered into a ten years lease agreement, intended for the establishment of a manufacturing facility and includes three extension period options. The Company accounts for this lease as an operating lease according to ASC 840 (“Leases”).
The future minimum lease commitments of the Company and its subsidiaries under various non-cancelable operating lease agreements in respect of premises, that are in effect as of December 31, 2017, are as follows:
|
2018
|
4,520
|
|||
|
2019
|
3,801
|
|||
|
2020
|
3,094
|
|||
|
2021
|
2,512
|
|||
|
2022
|
2,472
|
|||
|
2023 and thereafter
|
6,934
|
|||
|
$
|
23,333
|
F - 48
SOLAREDGE TECHNOLOGIES, INC.
NOTES TO CONSOLIDATED FINANCIAL STATEMENTS
U.S. dollars in thousands, except share data
| NOTE 14:- |
COMMITMENTS AND CONTINGENT LIABILITIES (Cont.)
|
Rent expenses for the year ended December 31, 2017, the six months ended December 31, 2016, and for the years ended June 30, 2016 and 2015
were approximately $3,449, $1,199, $2,238, and $1,714, respectively.
| b. |
Guarantees:
|
As of December 31, 2017, contingent liabilities exist regarding guarantees in the amount of $1,191, $58, and $184 in respect of office rent lease agreements, customs transactions and credit card limits, respectively.
| c. |
Governmental commitments:
|
The Company has received royalty-bearing grants sponsored by the Israeli government for the support of research and development activities. Through June 30, 2015, the Company had obtained grants from the
IIA
for certain of the Company’s research and development projects. The Company is obligated to pay royalties to the
IIA
, amounting to 4% in the first three years, and 4.5% thereafter, of the sales of the products and other related revenues (based on the dollar equivalent amount of the grant) generated from such projects, up to 100% of the grants received. The royalty payment obligations also bear interest at the LIBOR rate. The obligation to pay these royalties is contingent on actual sales of the applicable products and in the absence of such sales, no payment is required.
As of December 31, 2016, the aggregate contingent liability to the
IIA
with respect to royalty-bearing participation, net of royalties accrued, amounted to $1,022 out of which the Company already recorded a provision for royalties in the amount of $260. The total research and development grants that the Company has received from the
IIA
as of December 31, 2016 were $990. The accumulated interest as of December 31, 2016 was $32.
As of December 31, 2017, the Company redeemed its entire obligation to the
IIA
.
Royalty expenses relating to the
IIA
grants included in cost of revenues for the year ended December 31, 2017 and the six months ended December 31, 2016, amounted to $748 and $260, respectively.
As of June 30, 2016 and 2015, there have been no sales or revenues on which royalties are payables.
The Israeli Research and Development Law provides that know-how developed under an approved research and development program may not be transferred to third parties without the approval of the
IIA
. Such approval is not required for the sale or export of any products resulting from such research or development.
F - 49
SOLAREDGE TECHNOLOGIES, INC.
NOTES TO CONSOLIDATED FINANCIAL STATEMENTS
U.S. dollars in thousands, except share data
| NOTE 14:- |
COMMITMENTS AND CONTINGENT LIABILITIES (Cont.)
|
The
IIA
, under special circumstances, may approve the transfer of
IIA
-funded know-how outside Israel, in the following cases: (a) the grant recipient pays to the
IIA
a portion of the sale price paid in consideration for such
IIA
-funded know-how or in consideration for the sale of the grant recipient itself, as the case may be, which portion will not exceed six times the amount of the grants received plus interest (or three times the amount of the grant received plus interest, in the event that the recipient of the know-how has committed to retain the R&D activities of the grant recipient in Israel after the transfer); (b) the grant recipient receives know-how from a third party in exchange for its
IIA
-funded know-how; (c) such transfer of
IIA
-funded know-how arises in connection with certain types of cooperation in research and development activities; or (d) if such transfer of know-how arises in connection with a liquidation by reason of insolvency or receivership of the grant recipient.
| e. |
Contractual purchase obligations:
|
The Company has contractual obligations to purchase goods and raw materials. These contractual purchase obligations relate to inventories held by contract manufacturers and purchase orders initiated by the contract manufacturers, which cannot be canceled without penalty. The Company utilizes third parties to manufacture its products.
In addition, it acquires raw materials or other goods and services, including product components, by issuing to suppliers authorizations to purchase based on its projected demand and manufacturing needs. As of December 31, 2017, the Company had non-cancelable purchase obligations totaling approximately $196,222, out of which the Company already recorded a provision for loss in the amount of $1,627 (see also Note 8).
As of December 31, 2017, the Company had contractual obligations for capital expenditures totaling approximately $23,263. These commitments reflect purchases of automated assembly lines and other machinery related to the Company’s manufacturing.
| f. |
Legal claims:
|
From time to time, the Company may be involved in various claims and legal proceedings. The Company reviews the status of each matter and assesses its potential financial exposure. If the potential loss from any claim or legal proceeding is considered probable and the amount can be reasonably estimated, the Company accrues a liability for the estimated loss. These accruals are reviewed at least quarterly and adjusted to reflect the impact of negotiations, settlements, rulings, advice of legal counsel, and other information and events pertaining to a particular matter.
F - 50
SOLAREDGE TECHNOLOGIES, INC.
NOTES TO CONSOLIDATED FINANCIAL STATEMENTS
U.S. dollars in thousands, except share data
| NOTE 15:- |
LEASE INCENTIVE OBLIGATION
|
The Company has an operating lease agreement for building in Herzliya, Israel. In connection with this lease, the Company and its third party lessor (the "Lessor") agreed that the Lessor would pay approximately $2,938 for certain leasehold improvements on behalf of the Company.
As of December 31, 2017, the Company received in cash the entire amount of $2,938 from the Lessor in connection with such leasehold improvements. These leasehold improvements are accounted for as a lease incentive obligation, which is recorded under long-term liabilities, net of the current portion recorded in accrued expenses and other accounts payable under current liabilities. The lease incentive obligation is being amortized over the life of the lease and as a reduction to rent expense. As of December 31, 2017, the net amortized amount of lease incentive obligation is $2,049, out of which $1,765 was recorded under long-term liabilities.
| NOTE 16:- |
CONVERTIBLE PREFERRED STOCK
|
| a. |
Composition of convertible preferred stock of the Company:
|
|
Authorized
|
Issued and outstanding | |||||||||||||||||||||||
| Number of shares | ||||||||||||||||||||||||
|
December 31,
|
June 30,
|
December 31,
|
June 30,
|
|||||||||||||||||||||
|
2017
|
2016
|
2016
|
2017
|
2016
|
2016
|
|||||||||||||||||||
|
Stock of $0.0001 par value:
|
||||||||||||||||||||||||
|
Preferred stock
|
95,000,000
|
95,000,000
|
95,000,000
|
-
|
-
|
-
|
||||||||||||||||||
The Company issued Series A through E Preferred stock between the years 2006 and 2015. The Company classified the convertible preferred stock outside of stockholders’ equity (deficiency) as required by ASC 480-10-S99-3A and ASR 268, since the shares possessed deemed liquidation features that could trigger a distribution of cash or assets not solely within the Company’s control.
F - 51
SOLAREDGE TECHNOLOGIES, INC.
NOTES TO CONSOLIDATED FINANCIAL STATEMENTS
U.S. dollars in thousands, except share data
| NOTE 16:- |
CONVERTIBLE PREFERRED STOCK (Cont.)
|
| b. |
Prior to the consummation of the Company’s IPO on March 31, 2015, the Company had the following convertible preferred stock outstanding, all of which was converted into common stock following with the IPO on March 31, 2015 (see Note 1c) which resulted in classification of convertible preferred stock temporary equity in the amount of $140,915 into stockholders’ equity (deficiency):
|
|
Shares outstanding
|
Number of shares of Common Stock issued upon conversion
|
|||||||
|
Series A Preferred stock
|
15,558,830
|
5,186,276
|
||||||
|
Series B Preferred stock
|
18,760,196
|
6,253,398
|
||||||
|
Series C Preferred stock
|
15,984,655
|
5,328,217
|
||||||
|
Series D Preferred stock
|
16,024,251
|
5,341,416
|
||||||
|
Series D-1 Preferred stock
|
2,165,441
|
721,813
|
||||||
|
Series D-2 Preferred stock
|
2,598,528
|
866,175
|
||||||
|
Series D-3 Preferred stock
|
4,330,872
|
1,443,623
|
||||||
|
Series E Preferred stock
|
9,321,019
|
3,107,005
|
||||||
|
84,743,792
|
28,247,923
|
|||||||
| NOTE 17:- |
STOCK CAPITAL
|
| a. |
Composition of common stock capital of the Company:
|
| Authorized | Issued and outstanding | |||||||||||||||||||||||
| Number of shares | ||||||||||||||||||||||||
|
December 31,
|
June 30,
|
December 31,
|
June 30,
|
|||||||||||||||||||||
|
2017
|
2016
|
2016
|
2017
|
2016
|
2016
|
|||||||||||||||||||
|
Stock of $0.0001 par value:
|
||||||||||||||||||||||||
|
Common stock
|
125,000,000
|
125,000,000
|
125,000,000
|
43,812,601
|
41,259,391
|
40,889,922
|
||||||||||||||||||
| b. |
Common stock rights:
Common stock confers upon its holders the right to receive notice of, and to participate in, all general meetings of the Company, where each share of common stock shall have one vote for all purposes; to share equally, on a per share basis, in bonuses, profits, or distributions out of fund legally available therefor; and to participate in the distribution of the surplus assets of the Company in the event of liquidation of the Company.
|
F - 52
SOLAREDGE TECHNOLOGIES, INC.
NOTES TO CONSOLIDATED FINANCIAL STATEMENTS
U.S. dollars in thousands, except share data
NOTE 17:-
STOCK CAPITAL (Cont.)
| c. |
As a result of the reverse stock split, (i) every 3 shares of authorized, issued, and outstanding common stock was decreased to one share of authorized, issued, and outstanding common stock, (ii) the number of shares of common stock into which each outstanding warrant or option to purchase common stock is exercisable was proportionally decreased on a 1-for-3 basis, and (iii) all share prices and exercise prices were proportionately increased. All of the share numbers, share prices, and exercise prices have been adjusted within these consolidated financial statements, on a retroactive basis, to reflect this 1-for-3 reverse stock split.
|
| d. |
Stock option plans:
The Company’s 2007 Global Incentive Plan (the “2007 Plan”) was adopted by the board of directors on August 30, 2007. The 2007 Plan terminated upon the Company’s IPO on March 31, 2015 and no further awards may be granted thereunder. All outstanding awards will continue to be governed by their existing terms and 379,358 available options for future grant were transferred to the Company’s 2015 Global Incentive Plan (the “2015 Plan”) and are reserved for future issuances under the 2015 plan.
The 2015 Plan became effective upon the consummation of the IPO. The 2015 Plan provides for the grant of options, RSUs, and other share-based awards to directors, employees, officers, and consultants of the Company and its Subsidiaries. As of December 31, 2017, a total of 5,890,087 shares of common stock were reserved for issuance pursuant to stock awards under the 2015 Plan (the “Share Reserve”).
The Share Reserve will automatically increase on January 1st of each year during the term of the 2015 Plan, commencing on January 1st of the year following the year in which the 2015 Plan becomes effective, in an amount equal to 5% of the total number of shares of capital stock outstanding on December 31st of the preceding calendar year; provided, however, that the Company’s board of directors may determine that there will not be a January 1st increase in the Share Reserve in a given year or that the increase will be less than 5% of the shares of capital stock outstanding on the preceding December 31st.
The aggregate maximum number of shares of common stock that may be issued on the exercise of incentive stock options is 10,000,000. As of December 31, 2017, an aggregate of 2,003,126 options are still available for future grant under the 2015 Plan.
|
F - 53
SOLAREDGE TECHNOLOGIES, INC.
NOTES TO CONSOLIDATED FINANCIAL STATEMENTS
U.S. dollars in thousands, except share data
| NOTE 17:- |
STOCK CAPITAL (Cont.)
|
A summary of the activity in the share options granted to employees and members of the board of directors for the year ended December 31, 2017 and related information follows:
|
Weighted
|
||||||||||||||||
|
average
|
||||||||||||||||
|
Weighted
|
remaining
|
|||||||||||||||
|
Number
|
average
|
contractual
|
Aggregate
|
|||||||||||||
|
of
|
exercise
|
term
|
intrinsic
|
|||||||||||||
|
options
|
price
|
in years
|
Value
|
|||||||||||||
|
Outstanding as of December 31, 2016
|
4,864,469
|
5.05
|
6.24
|
39,585
|
||||||||||||
|
Granted
|
445,680
|
14.64
|
||||||||||||||
|
Exercised
|
(1,758,288
|
)
|
2.70
|
|||||||||||||
|
Forfeited or expired
|
(27,551
|
)
|
10.06
|
|||||||||||||
|
Outstanding as of December 31, 2017
|
3,524,310
|
7.40
|
6.35
|
106,251
|
||||||||||||
|
Vested and expected to vest as of December 31, 2017
|
3,442,470
|
7.32
|
6.34
|
104,050
|
||||||||||||
|
Exercisable as of December 31, 2017
|
2,406,369
|
5.58
|
5.64
|
76,931
|
||||||||||||
The aggregate intrinsic value in the tables above represents the total intrinsic value (the difference between the fair value of the Company’s common stock as of the last day of each period and the exercise price, multiplied by the number of in-the-money options) that would have been received by the option holders had all option holders exercised their options on the last day of each period.
The total intrinsic value of options exercised during the year ended December 31, 2017, the six months ended December 31, 2016, and the year ended June 30, 2016 was $44,625, $1,790, and $30,670, respectively.
The weighted average grant date fair values of options granted to employees and executive directors during the year ended December 31, 2017, the six months ended December 31, 2016, and the years ended June 30, 2016 and 2015 were $7.94, $8.86, $13.27, and $4.24, respectively.
F - 54
SOLAREDGE TECHNOLOGIES, INC.
NOTES TO CONSOLIDATED FINANCIAL STATEMENTS
U.S. dollars in thousands, except share data
| NOTE 17:- |
STOCK CAPITAL (Cont.)
|
The options outstanding as of December 31, 2017, have been separated into exercise price ranges as follows:
|
Options
|
Weighted
|
Options
|
Weighted
|
|||||||||||||||
|
outstanding
|
average
|
exercisable
|
average
|
|||||||||||||||
|
Range of
|
as of
|
remaining
|
as of
|
remaining
|
||||||||||||||
|
exercise
|
December 31,
|
contractual
|
December 31,
|
contractual
|
||||||||||||||
|
price
|
2017
|
Life in years
|
2017
|
Life in years
|
||||||||||||||
|
$
|
0.87 - $1.50
|
202,281
|
1.44
|
202,281
|
1.44
|
|||||||||||||
|
$
|
1.68 - $2.46
|
660,264
|
3.68
|
660,264
|
3.68
|
|||||||||||||
|
$
|
3.03 - $5.01
|
1,778,547
|
6.81
|
1,263,352
|
6.79
|
|||||||||||||
|
$
|
9.36
|
15,267
|
7.08
|
8,949
|
7.08
|
|||||||||||||
|
$
|
13.70 – $14.85
|
438,430
|
9.12
|
78,309
|
9.02
|
|||||||||||||
|
$
|
15.34 – $17.14
|
193,571
|
8.61
|
60,314
|
8.49
|
|||||||||||||
|
$
|
20.81 - $25.09
|
235,950
|
7.57
|
132,900
|
7.49
|
|||||||||||||
|
3,524,310
|
6.35
|
2,406,369
|
5.64
|
|||||||||||||||
A summary of the activity in the RSUs granted to employees and members of the board of directors for the year ended December 31, 2017, is as follows:
|
No. of
RSUs
|
Weighted average
grant date
fair value
|
|||||||
|
Unvested as of January 1, 2017
|
1,515,018
|
19.74
|
||||||
|
Granted
|
1,252,815
|
27.30
|
||||||
|
Vested
|
(547,104
|
)
|
20.07
|
|||||
|
Forfeited
|
(132,737
|
)
|
18.65
|
|||||
|
Unvested as of December 31, 2017
|
2,087,992
|
24.33
|
||||||
F - 55
SOLAREDGE TECHNOLOGIES, INC.
NOTES TO CONSOLIDATED FINANCIAL STATEMENTS
U.S. dollars in thousands, except share data
| NOTE 17:- |
STOCK CAPITAL (Cont.)
|
Options and RSUs issued to non-employee consultants:
The Company has granted options to purchase common shares and RSU’s to non-employee consultants as of December 31, 2017 as follows:
|
Options & RSU’s
|
|||||||||||||
|
outstanding
|
Exercisable
|
||||||||||||
|
as of
|
as of
|
||||||||||||
|
Issuance
|
December 31,
|
Exercise
|
December 31,
|
Exercisable
|
|||||||||
|
Date
|
2017
|
price
|
2017
|
Through
|
|||||||||
|
October 24, 2012
|
2,000
|
2.46
|
2,000
|
October 24, 2022
|
|||||||||
|
January 27, 2014
|
1,144
|
3.51
|
713
|
January 27, 2024
|
|||||||||
|
May 1, 2014
|
2,000
|
3.51
|
1,875
|
May 1, 2024
|
|||||||||
|
September 17, 2014
|
6,498
|
3.96
|
5,509
|
September 17, 2024
|
|||||||||
|
October 29, 2014
|
2,668
|
5.01
|
224
|
October 29, 2024
|
|||||||||
|
August 19, 2015
|
10,439
|
0.00
|
-
|
||||||||||
|
November 8, 2015
|
1,449
|
0.00
|
-
|
||||||||||
|
April 18, 2016
|
1,250
|
0.00
|
-
|
||||||||||
|
July 11, 2016
|
1,501
|
0.00
|
-
|
||||||||||
|
September 21, 2016
|
4,000
|
15.34
|
250
|
September 21, 2026
|
|||||||||
|
September 21, 2016
|
3,813
|
0.00
|
-
|
||||||||||
|
March 15, 2017
|
7,000
|
0.00
|
-
|
||||||||||
|
March 15, 2017
|
7,500
|
13.70
|
500
|
March 15, 2027
|
|||||||||
|
March 27, 2017
|
4,000
|
0.00
|
-
|
||||||||||
|
November 20, 2017
|
6,000
|
0.00
|
-
|
||||||||||
|
December 26, 2017
|
2,667
|
0.00
|
667
|
||||||||||
|
63,929
|
11,738
|
||||||||||||
The Company accounts for its options granted to non-employee consultants under the fair value method of ASC 505-50 (“Equity-Based Payments to Non-Employees”).
In connection with the grant of stock options to non-employee consultants, the Company recorded stock compensation expenses in
the year ended December 31, 2017, the six months ended December 31, 2016, and the years ended June 30,
2016 and 2015 in the amounts of $986, $66, $524, and $563, respectively.
| e. |
Employee Stock Purchase Plan (“ESPP”):
The Company adopted an Employee Stock Purchase Plan (the “ESPP”) effective upon the consummation of the IPO. As of December 31, 2017, a total of 1,301,154 shares were reserved for issuance under this plan. The number of shares of common stock reserved for issuance under the ESPP will increase automatically on January 1st of each year, for ten years, by the lesser of 1% of the total number of shares of the Company’s common stock outstanding on December 31st of the preceding calendar year or 487,643 shares.
However, the Company’s board of directors may reduce the amount of the increase in any particular year at their discretion, including a reduction to zero.
|
F - 56
SOLAREDGE TECHNOLOGIES, INC.
NOTES TO CONSOLIDATED FINANCIAL STATEMENTS
U.S. dollars in thousands, except share data
| NOTE 17:- |
STOCK CAPITAL (Cont.)
|
The ESPP is implemented through an offering every six months. According to the ESPP, eligible employees may use up to 10% of their salaries to purchase common stock shares up to an aggregate limit of $10 per participant for every six months plan. The price of an ordinary share purchased under the ESPP is equal to 85% of the lower of the fair market value of the ordinary share on the subscription date of each offering period or on the purchase date.
As of December 31, 2017, 268,377 common stock shares had been purchased under the ESPP.
As of December 31, 2017, 1,032,777 common stock shares were available for future issuance under the ESPP.
In accordance with ASC No. 718, the ESPP is compensatory and, as such, results in recognition of compensation cost.
| f. |
Stock-based compensation expense for employees and non-employee consultants:
|
The Company recognized stock-based compensation expenses related to stock options and RSUs granted to employees and non-employee consultants and ESPP in the consolidated statement of operations for the year ended December 31, 2017, the six months ended December 31, 2016, and for the years ended June 30, 2016 and 2015, as follows:
|
Year ended
December 31,
|
Six months ended
December 31,
|
Year ended
June 30,
|
||||||||||||||
|
2017
|
2016
|
2016
|
2015
|
|||||||||||||
|
Cost of revenues
|
$
|
2,250
|
$
|
871
|
$
|
945
|
$
|
442
|
||||||||
|
Research and development, net
|
5,703
|
2,061
|
2,364
|
635
|
||||||||||||
|
Selling and marketing
|
5,387
|
1,852
|
2,915
|
809
|
||||||||||||
|
General and administrative
|
4,224
|
1,816
|
2,820
|
1,070
|
||||||||||||
|
Total stock-based compensation expense
|
$
|
17,564
|
$
|
6,600
|
$
|
9,044
|
$
|
2,956
|
||||||||
As of December 31, 2017, there was a total unrecognized compensation expense of $56,867 related to non-vested equity-based compensation arrangements granted under the Company’s Plans. These expenses are expected to be recognized during the period from January 1, 2018 through November 30, 2021.
F - 57
SOLAREDGE TECHNOLOGIES, INC.
NOTES TO CONSOLIDATED FINANCIAL STATEMENTS
U.S. dollars in thousands, except share data
NOTE 18:-
INCOME TAXES
| a. |
Tax rates in U.S:
|
The Company is subject to U.S. federal tax at the rate of 34%.
On December 22, 2017, the TCJA was signed into law making significant changes to U.S. income tax law. Changes include, but are not limited to, a corporate tax rate decrease from 35% to 21% effective for tax years beginning after December 31, 2017, the transition of U.S. international taxation from a worldwide tax system to a territorial system, and a one-time transition tax on the mandatory deemed repatriation of cumulative foreign earnings as of December 31, 2017. The Company has calculated its best estimate of the impact of the TCJA in its year end income tax provision in accordance with its understanding of the TCJA and guidance available as of the date of this filing and as a result has recorded $19.2 million as an additional income tax expense in the fourth quarter of 2017, the period in which the legislation was enacted.
The provisional amount related to the remeasurement of certain deferred tax assets and liabilities based on the rates at which they are expected to reverse in the future was $0.5 million. Additional work is necessary to reflect the actual rate at which those deferred tax assets and liabilities expected to reverse.
The provisional amount related to the one-time transition tax on the mandatory deemed repatriation of foreign earnings was $18.7 million based on cumulative foreign earnings of $145 million. Additional work is necessary to do a more detailed analysis of historical foreign earnings as well as potential correlative adjustments. Any subsequent adjustment to these amounts will be recorded to current tax expense in the quarter of 2018 when the analysis is complete.
Additionally, the TCJA requires certain Global Intangible Low Taxed Income (“GILTI”) earned by controlled foreign corporations (“CFCs”) to be included in the gross income of the CFCs’ U.S. shareholder. GAAP allows the Company to either: (i) treat taxes due on future U.S. inclusions in taxable income related to GILTI as a current-period expense when incurred (the “period cost method”); or (ii) factor such amounts into its measurement of deferred taxes (the “deferred method”).
The GILTI tax rules will become effective for the 2018 tax year and therefore the Company has not made any adjustments related to the potential GILTI tax in its financial statements for the year ended December 31, 2017. The Company continues to evaluate the impact of the new GILTI tax rules and the application of ASC 740 on its financial statements.
| b. |
The Company’s German subsidiary is subject to German tax at the rate of 33%.
|
| c. |
Corporate tax in Israel:
|
Taxable income of Israeli companies is subject to corporate tax at the rate of 26.5% in the year
s
ended June 30, 2014 and 2015, and 25% in the year ended June 30, 2016 onwards.
The Israeli subsidiary is also eligible for tax benefits as further described in note 18k.
F - 58
SOLAREDGE TECHNOLOGIES, INC.
NOTES TO CONSOLIDATED FINANCIAL STATEMENTS
U.S. dollars in thousands, except share data
NOTE 18:-
INCOME TAXES (Cont.)
In December 2016, the Israeli Parliament approved the Economic Efficiency Law
2016
(Legislative Amendments for Applying the Economic Policy for the 2017 and 2018 Budget Years), which reduces the corporate income tax rate to 24% (instead of 25%) effective from January 1, 2017 and to 23% effective from January 1, 2018.
| d. |
Carryforward tax losses:
|
As of December 31, 2017, the Company has no federal or state carryforward tax losses.
As of December 31, 2017, the Israeli and German subsidiaries have no net carryforward tax losses.
| e. |
Deferred income taxes:
|
Deferred income taxes reflect the net tax effect of temporary differences between the carrying amounts of assets and liabilities for financial reporting purposes and the amounts used for income tax purposes.
The Company’s Israeli subsidiary’s tax-exempt profit from Benefited Enterprises is permanently reinvested, as the Company’s management and the Board of Directors has determined that the Company does not currently intend to distribute dividends. Therefore, deferred taxes have not been provided for such tax-exempt income. The Company intends to continue to reinvest these profits and does not currently foresee a need to distribute dividends out of such tax-exempt income.
Significant components of the Company’s deferred tax liabilities and assets are as follows:
|
December 31,
|
June 30,
|
|||||||||||
|
2017
|
2016
|
2016
|
||||||||||
|
Assets in respect of:
|
||||||||||||
|
Carryforward tax losses
|
$
|
-
|
$
|
-
|
$
|
4,186
|
||||||
|
Research and Development carryforward expenses- temporary differences
|
5,380
|
908
|
743
|
|||||||||
|
Stock based compensation
|
1,622
|
1,039
|
562
|
|||||||||
|
Other reserves
|
1,338
|
868
|
805
|
|||||||||
|
Deferred tax assets, net
|
$
|
8,340
|
$
|
2,815
|
$
|
6,296
|
||||||
F - 59
SOLAREDGE TECHNOLOGIES, INC.
NOTES TO CONSOLIDATED FINANCIAL STATEMENTS
U.S. dollars in thousands, except share data
NOTE 18:-
INCOME TAXES (Cont.)
The Company remeasured these non-current assets and liabilities at the applicable tax rate of 21% in accordance with the TCJA. The remeasurement resulted in a total decrease in these assets of $0.5 million.
| f. |
Uncertain tax positions:
|
As of December 31, 2017 and 2016, the Company’s Israeli subsidiary recognized a total liability for uncertain tax positions in the amount of $0.6 and $0.3 million, respectively.
| g. |
Income before taxes is comprised as follows:
|
|
Year Ended
December 31, 2017
|
Six months
ended
December 31, 2016
|
Year ended June 30,
|
||||||||||||||
|
2016
|
2015
|
|||||||||||||||
|
Domestic
|
$
|
7,461
|
$
|
3,165
|
$
|
3,758
|
$
|
2,830
|
||||||||
|
Foreign
|
92,783
|
27,433
|
68,472
|
20,246
|
||||||||||||
|
$
|
100,244
|
$
|
30,598
|
$
|
72,230
|
$
|
23,076
|
|||||||||
| h. |
Taxes on income (tax benefit) are comprised as follows:
|
|
Year ended December 31, 2017
|
Six months ended December 31, 2016
|
Year ended June 30,
|
||||||||||||||
|
2016
|
2015
|
|||||||||||||||
|
Domestic taxes:
|
||||||||||||||||
|
Current
|
19,
889
|
1,047
|
1,737
|
1,655
|
||||||||||||
|
Deferred
|
(42
|
)
|
507
|
(1,380
|
)
|
-
|
||||||||||
|
Foreign taxes:
|
||||||||||||||||
|
Current
|
1,639
|
518
|
263
|
300
|
||||||||||||
|
Deferred
|
(5,414
|
)
|
3,145
|
(4,999
|
)
|
-
|
||||||||||
|
$
|
16,072
|
$
|
5,217
|
$
|
(4,379
|
)
|
$
|
1,955
|
||||||||
| i. |
Reconciliation of theoretical tax expense to actual tax expense:
|
The differences between the statutory tax rate of the Company and the effective tax rate are primarily accounted for by the non-recognition of tax benefits from accumulated net carryforward tax losses among the Company and various subsidiaries due to uncertainty of the realization of such tax benefits.
F - 60
SOLAREDGE TECHNOLOGIES, INC.
NOTES TO CONSOLIDATED FINANCIAL STATEMENTS
U.S. dollars in thousands, except share data
NOTE 18:-
INCOME TAXES (Cont.)
A reconciliation between the theoretical tax expense, assuming all income is taxed at the statutory tax rate applicable to income of the Company, and the actual tax expense (benefit) as reported in the consolidated statements of operations is as follows:
|
Year ended
December 31,
|
Six months
ended
December 31,
|
Year ended June 30,
|
||||||||||||||
|
2017
|
2016
|
2016
|
2015
|
|||||||||||||
|
Income before taxes, as reported in the consolidated statements of operations
|
$
|
100,244
|
$
|
30,598
|
$
|
72,230
|
$
|
23,076
|
||||||||
|
Statutory tax rate
|
34
|
%
|
34
|
%
|
34
|
%
|
35
|
%
|
||||||||
|
Theoretical tax benefits on the above amount at the US statutory tax rate
|
34,083
|
10,403
|
24,558
|
8,077
|
||||||||||||
|
Income tax at rate other than the U.S. statutory tax rate
|
(34,734
|
)
|
(5,396
|
)
|
(30,229
|
)
|
(9,305
|
)
|
||||||||
|
Tax Cuts and Jobs Act of 2017
|
18,735
|
-
|
-
|
-
|
||||||||||||
|
Non-deductible expenses
|
(1,545
|
)
|
164
|
1,514
|
3,003
|
|||||||||||
|
Other individually immaterial income tax items
|
(467
|
)
|
46
|
(222
|
)
|
180
|
||||||||||
|
Actual tax expense (tax benefit)
|
$
|
16,072
|
$
|
5,217
|
$
|
(4,379
|
)
|
$
|
1,955
|
|||||||
| j. |
Tax assessments:
|
As of December 31, 2017, the Company and certain of its subsidiaries filed U.S. federal and various state and foreign income tax returns. The statute of limitations relating to the consolidated U.S. federal income tax return is closed for all tax years up to and including 2014.
The statute of limitations related to tax returns of the Company’s Israeli subsidiary is closed for all tax years up to and including 2012.
The statute of limitations related to tax returns of the Company’s German subsidiary is closed for all tax years up to and including 2014.
With respect to the Company’s Chinese, Australian, Canadian, Dutch, Japanese, UK, French, Italian, Bulgarian, Turkish, Belgian, Indian, Swedish, and Romanian subsidiaries, the statute of limitations related to its tax returns is open for all tax years since incorporation.
The Company believes that it has adequately provided for reasonably foreseeable outcomes related to tax audits and settlements. The final tax outcome of any Company tax audits could be different from that which is reflected in the Company’s income tax provisions and accruals. Such differences could have a material effect on the Company’s income tax provision and net income (loss) in the period in which such determination is made.
F - 61
SOLAREDGE TECHNOLOGIES, INC.
NOTES TO CONSOLIDATED FINANCIAL STATEMENTS
U.S. dollars in thousands, except share data
NOTE 18:-
INCOME TAXES (Cont.)
| k. |
Tax benefits for Israeli companies under the Law for the Encouragement of Capital Investments, 1959 (the “Investment Law”):
|
The Israeli subsidiary elected tax year 2012 as a "Year of Election" for “Beneficiary Enterprise” status under the Investment Law. According to the Investment Law, the Israeli subsidiary elected to participate in the alternative benefits program which provides certain benefits, including tax exemptions and reduced tax rates. Income not eligible for Beneficiary Enterprise benefits is taxed at a regular corporate tax rate (which depend on, inter alia, the geographic location in Israel). Upon meeting the requirements under the Investment Law,
undistributed income derived from Beneficiary Enterprise from productive activity will be exempt from tax for two years from the year in which the Israeli subsidiary first has taxable income, provided that 12 years have not passed from the beginning of the year of election. In the six months ended December 31, 2016, the Israeli subsidiary utilized all of its operating loss carryforwards in Israel and became profitable for tax purposes. As of December 31, 2017, the Israeli subsidiary is entitled to benefit from a two year tax exemption as part of the Beneficiary Enterprise regime.
If dividends are distributed out of tax-exempt profits, the Israeli subsidiary will then become liable for tax, with respect of the gross amount of the dividend at the rate applicable to its profits from the Beneficiary Enterprise in the year in which the income was earned, as if it had not chosen the alternative track of benefits.
The dividend recipient is subject to withholding tax at the rate of 15% applicable to dividends from Beneficiary enterprises, or such lower rate as may be provided in an applicable tax treaty. If the dividend is distributed during the tax benefits period or within twelve years thereafter. This limitation does not apply to a foreign investors' company. The Israeli subsidiary currently has no plans to distribute dividends and intends to retain future earnings to finance the development of its business.
Through December 31, 2017, the Israeli subsidiary had generated income under the provision of the Investment Law.
As of December 31, 2017, approximately $151
million was derived from tax exempt profits earned by the Israeli subsidiary “Beneficiary Enterprises.” The Company has determined that such tax-exempt income will not be distributed as dividends and intends to reinvest the amount of its tax exempt income earned by the Israeli subsidiary. Accordingly, no provision for deferred income taxes has been provided on income attributable to the Israeli subsidiary “Beneficiary Enterprises” as such income is essentially permanently reinvested.
If the Israeli subsidiary retained tax-exempt income is distributed, the income would be taxed at the applicable corporate tax rate which depend on the foreign ownership in each tax year, the tax rate can range between 10% (when foreign ownership exceeds 90%) to 25% (when foreign ownership exceeds 49%).
If the Israeli subsidiary retained tax-exempt income is distributed, the income would be taxed at the applicable corporate tax rate which depend on the foreign ownership in each tax year, the tax rate can range between 10% (when foreign ownership exceeds 90%) to 25% (when foreign ownership exceeds 49%).
F - 62
SOLAREDGE TECHNOLOGIES, INC.
NOTES TO CONSOLIDATED FINANCIAL STATEMENTS
U.S. dollars in thousands, except share data
NOTE 18:-
INCOME TAXES (Cont.)
Amendment to the Law for the Encouragement of Capital Investments, 1959 (Amendment 71):
On August 5, 2013, the Israeli Parliament issued the Law for Changing National Priorities (Legislative Amendments for Achieving Budget Targets for 2013 and 2014), 2013 which consists of Amendment 71 to the Law for the Encouragement of Capital Investments ("the Amendment"). According to the Amendment, the tax rate on preferred income from a preferred enterprise in 2014 and thereafter will be 16% (in development area A (as defined therein and which details specific areas in development in Israel) will be 9%).
The Amendment also prescribes that any dividends distributed to individuals or foreign residents from the preferred enterprise's earnings as above will be subject to tax at a rate of 20%.
Amendment to the Law for the Encouragement of Capital Investments, 1959 (Amendment 73):
In December 2016, the Economic Efficiency Law (Legislative Amendments for Applying the Economic Policy for the 2017 and 2018 Budget Years), 2016 which includes Amendment 73 to the Law for the Encouragement of Capital Investments ("the 2017 Amendment") was published. According to the 2017 Amendment, a preferred enterprise located in development area A will be subject to a tax rate of 7.5% instead of 9% effective from January 1, 2017 and thereafter (the tax rate applicable to preferred enterprises located in other areas remains at 16%).
The 2017 Amendment also prescribes special tax tracks for technological enterprises, which are subject to rules that were issued by the Ministry of Finance.
The new tax tracks under the 2017 Amendment are as follows:
According to the 2017 Amendment, preferred technological enterprise is an enterprise for which total consolidated revenues of its parent company and all subsidiaries are less than NIS 10 billion. A technological preferred enterprise, as defined in the Investment Law, which is located in the center of Israel will be subject to tax at a rate of 12% on profits deriving from intellectual property (in development area A - a tax rate of 7.5%).
Special preferred technological enterprise is an enterprise for which total consolidated revenues of its parent company and all subsidiaries exceed NIS 10 billion. Such enterprise will be subject to tax at a rate of 6% on profits deriving from intellectual property, regardless of the enterprise's geographical location.
F - 63
SOLAREDGE TECHNOLOGIES, INC.
NOTES TO CONSOLIDATED FINANCIAL STATEMENTS
U.S. dollars in thousands, except share data
NOTE 18:-
INCOME TAXES (Cont.)
Any dividends distributed deriving from income from the preferred technological enterprises or special preferred technological enterprise will be subject to tax at a rate of 20%. The 2017 Amendment further provides that, in certain circumstances, a dividend distributed to a foreign corporate shareholder, would be subject to tax at a rate of 4% (if the amount of foreign investors exceeds 90%).
The Israeli subsidiary is entitle to the above mentioned preferred technological enterprise benefits and will be subject to tax at a rate of 12% on profits deriving from intellectual property or 7.5% in development area A, under the 2017 Amendment.
Tax Benefits for Research and Development:
Israeli tax law (section 20a to the Israeli Tax Ordinance) allows, under certain conditions, a tax deduction for research and development expenses, including capital expenses, for the year in which they are paid. Such expenses must relate to scientific research in industry, agriculture, transportation, or energy, and must be approved by the relevant Israeli government ministry, determined by the field of research. Furthermore, the research and development must be for the promotion of the company’s business and carried out by or on behalf of the company seeking such tax deduction. However, the amount of such deductible expenses is reduced by the sum of any funds received through government grants for the finance of such scientific research and development projects. As for expenses incurred in scientific research that is not approved by the relevant Israeli government ministry, they will be deductible over a three-year period starting from the tax year in which they are paid.
| NOTE 19:- |
FINANCIAL EXPENSES (INCOME), NET
|
|
Year ended
December 31,
|
Six months
ended
December 31,
|
Year ended June 30,
|
||||||||||||||
|
2017
|
2016
|
2016
|
2015
|
|||||||||||||
|
Remeasurement of warrants to purchase convertible preferred stock
|
$
|
-
|
$
|
-
|
$
|
-
|
$
|
5,350
|
||||||||
|
Interest on term loan
|
-
|
-
|
-
|
579
|
||||||||||||
|
Other financial expenses related to term loan
|
-
|
-
|
-
|
373
|
||||||||||||
|
Expenses (income) related to hedging transaction
|
1,334
|
87
|
136
|
(1,721
|
)
|
|||||||||||
|
Interest on short- term loan
|
-
|
-
|
-
|
316
|
||||||||||||
|
Interest on marketable securities
|
(4,398
|
)
|
(1,504
|
)
|
(1,112
|
)
|
-
|
|||||||||
|
Amortization of marketable securities premium and accretion of discount, net
|
2,017
|
685
|
532
|
-
|
||||||||||||
|
Exchange rate loss (income), net, bank charges and other finance expenses
|
(8,111
|
)
|
3,521
|
(27
|
)
|
180
|
||||||||||
|
$
|
(9,158
|
)
|
$
|
2,789
|
$
|
(471
|
)
|
$
|
5,077
|
|||||||
F - 64
SOLAREDGE TECHNOLOGIES, INC.
NOTES TO CONSOLIDATED FINANCIAL STATEMENTS
U.S. dollars in thousands, except share data
| NOTE 20:- |
GEOGRAPHIC INFORMATION AND MAJOR CUSTOMER AND PRODUCT DATA
|
Summary information about geographic areas:
ASC 280 (“Segment Reporting”) establishes standards for reporting information about operating segments. Operating segments are defined as components of an enterprise about which separate financial information is available that is evaluated regularly by the chief operating decision maker in deciding how to allocate resources and in assessing performance. The Company manages its business on the basis of one reportable segment, and derives revenues from selling its products (see Note 1a for a brief description of the Company’s business).
The following is a summary of revenues within geographic areas:
|
Year ended
December 31,
|
Six months
ended
December 31,
|
Year ended June 30,
|
||||||||||||||
|
2017
|
2016
|
2016
|
2015
|
|||||||||||||
|
Revenues based on Customers’ location:
|
||||||||||||||||
|
United States
|
$
|
348,949
|
$
|
160,321
|
$
|
334,260
|
$
|
238,340
|
||||||||
|
Netherlands
|
70,067
|
23,099
|
36,377
|
21,349
|
||||||||||||
|
Europe (*)
|
128,295
|
37,500
|
74,830
|
44,104
|
||||||||||||
|
Rest of the World
|
59,734
|
19,077
|
44,376
|
21,285
|
||||||||||||
|
Total revenues
|
$
|
607,045
|
$
|
239,997
|
$
|
489,843
|
$
|
325,078
|
||||||||
(*) Except for Netherlands
Major customer data as a percentage of total revenues:
|
Year ended
December 31,
|
Six months
ended
December 31,
|
Year ended June 30,
|
||||||||||||||
|
2017
|
2016
|
2016
|
2015
|
|||||||||||||
|
Customer A
|
14.8
|
%
|
11.2
|
%
|
11.6
|
%
|
4.9
|
%
|
||||||||
|
Customer B
|
8.1
|
%
|
8.4
|
%
|
10.1
|
%
|
5.4
|
%
|
||||||||
|
Customer C
|
3.0
|
%
|
8.7
|
%
|
10.9
|
%
|
24.6
|
%
|
||||||||
The following is a summary of revenues by product family:
|
Year ended
December 31,
|
Six months
ended
December 31,
|
Year ended
June 30,
|
||||||||||||||
|
2017
|
2016
|
2016
|
2015
|
|||||||||||||
|
Inverters
|
$
|
290,632
|
$
|
112,585
|
$
|
223,756
|
$
|
156,984
|
||||||||
|
Optimizers
|
286,856
|
115,229
|
244,852
|
158,513
|
||||||||||||
|
Others
|
29,557
|
12,183
|
21,235
|
9,581
|
||||||||||||
|
Total revenues
|
$
|
607,045
|
$
|
239,997
|
$
|
489,843
|
$
|
325,078
|
||||||||
F - 65
SOLAREDGE TECHNOLOGIES, INC.
NOTES TO CONSOLIDATED FINANCIAL STATEMENTS
U.S. dollars in thousands, except share data
| NOTE 20:- |
GEOGRAPHIC INFORMATION AND MAJOR CUSTOMER AND PRODUCT DATA (Cont.)
|
Long-lived assets by geographic region:
|
As of December 31,
|
As of June 30,
|
|||||||||||
|
2017
|
2016
|
2016
|
||||||||||
|
Israel
|
$
|
43,273
|
$
|
35,055
|
$
|
26,751
|
||||||
|
U.S.
|
567
|
515
|
518
|
|||||||||
|
Europe
|
1,219
|
466
|
508
|
|||||||||
|
China
|
5,985
|
36
|
31
|
|||||||||
|
Other
|
138
|
50
|
23
|
|||||||||
|
Total long-lived assets*
|
$
|
51,182
|
$
|
36,122
|
$
|
27,831
|
||||||
| * |
Long-lived assets are comprised of property and equipment, net (marketable securities, prepaid expenses, and lease deposits, intangible assets and deferred tax assets are not included).
|
F - 66
Pursuant to the requirements of Section 13 or 15(d) of the Securities Exchange Act of 1934, as amended, the registrant has duly caused this report to be signed on its behalf by the undersigned, thereunto duly authorized.
|
SOLAREDGE TECHNOLOGIES, INC.
|
||
|
By:
|
/s/ Guy Sella
|
|
|
Name: Guy Sella
|
||
|
Title: Chief Executive Officer and Chairman
|
||
|
Date:
|
February 20, 2018
|
|
63
Know all persons by these presents, that each person whose signature appears below constitutes and appoints Guy Sella, Ronen Faier, and Rachel Prishkolnik, or any of them, as such person’s true and lawful attorney-in-fact and agent, with full power of substitution and resubstitution, for such person and in such
person’s
name, place, and stead, in any and all capacities, to sign any and all amendments to this Annual Report on Form 10-K, and to file the same, with all exhibits thereto, and other documents in connection therewith, with the Securities and Exchange Commission, granting unto said attorney-in-fact and agent, and each of them, full power and authority to do and perform each and every act and thing requisite and necessary to be done in connection therewith, as fully to all intents and purposes as such person might or could do in person, hereby ratifying and confirming all that said attorney-in-fact and agent, or any of them or their or such person’s substitute or substitutes, may lawfully do or cause to be done by virtue thereof.
Pursuant to the requirements of the Securities Exchange Act of 1934, as amended, this report has been signed by the following persons on behalf of the registrant and in the capacities and on the dates indicated below.
|
Signature
|
Title
|
Date
|
|
/s/ Guy Sella
Guy Sella |
Chief Executive Officer and Chairman
( Principal Executive Officer ) |
February 20, 2018
|
|
/s/ Ronen Faier
Ronen Faier |
Chief Financial Officer
( Principal Financial and Accounting Officer ) |
February 20, 2018
|
|
/s/ Dan Avida
Dan Avida |
Director
|
February 20, 2018
|
|
/s/ Yoni Cheifetz
Yoni Cheifetz |
Director
|
February 20, 2018
|
|
/s/ Marcel Gani
Marcel Gani |
Director
|
February 20, 2018
|
|
/s/ Doron Inbar
Doron Inbar |
Director
|
February 20, 2018
|
|
/s/ Avery More
Avery More |
Director
|
February 20, 2018
|
|
/s/ Tal Payne
Tal Payne |
Director
|
February 20, 2018
|
64
TABLE OF CONTENTS
Part IItem 1. BusinessItem 1A. Risk FactorsItem 1B. Unresolved Staff CommentsItem 2. PropertiesItem 3. Legal ProceedingsItem 4. Mine Safety DisclosuresPart IIItem 5. Market For Registrant S Common Equity, Related Stockholder Matters and Issuer Purchases Of Equity SecuritiesItem 6. Selected Financial DataItem 7. Management S Discussion and Analysis Of Financial Condition and Results Of OperationsItem 7A. Quantitative and Qualitative Disclosures About Market RiskItem 8. Financial Statements and Supplementary DataItem 9. Changes in and Disagreements with Accountants on Accounting and Financial DisclosureItem 9A. Controls and ProceduresItem 9B. Other InformationPart IIIItem 10. Directors, Executive Officers and Corporate GovernanceItem 11. Executive CompensationItem 12. Security Ownership Of Certain Beneficial Owners and Management and Related Stockholder MattersItem 13. Certain Relationships and Related Transactions, and Director IndependenceItem 14. Principal Accounting Fees and ServicesPart IVItem 15. Exhibits, Financial Statement SchedulesNote 1:- GeneralNote 1:- General (cont.)Note 2:- Significant Accounting PoliciesNote 2:- Significant Accounting Policies (cont.)Note 3:- Marketable SecuritiesNote 3:- Marketable Securities (cont.)Note 4:- Fair Value MeasurementsNote 4:- Fair Value Measurements (cont.)Note 5:- Prepaid Expenses and Other Accounts ReceivableNote 6:- InventoriesNote 7:- Property and Equipment and Intangible Assets, NetNote 8:- Accrued Expenses and Other Accounts PayableNote 9:- Warranty ObligationsNote 10:- Term Loan and Warrants To Purchase Convertible Preferred StockNote 10:- Term Loan and Warrants To Purchase Convertible Preferred Stock (cont.)Note 11:- Revolving Credit LineNote 12:- Accumulated Other Comprehensive Income (loss)Note 12:- Accumulated Other Comprehensive Income (loss) (cont.)Note 13:- Derivative InstrumentsNote 13:- Derivative Instruments (cont.)Note 14:- Commitments and Contingent LiabilitiesNote 14:- Commitments and Contingent Liabilities (cont.)Note 15:- Lease Incentive ObligationNote 16:- Convertible Preferred StockNote 16:- Convertible Preferred Stock (cont.)Note 17:- Stock CapitalNote 17:- Stock Capital (cont.)Note 18:- Income TaxesNote 18:- Income Taxes (cont.)Note 19:- Financial Expenses (income), NetNote 20:- Geographic Information and Major Customer and Product DataNote 20:- Geographic Information and Major Customer and Product Data (cont.)