UNITED STATES
SECURITIES AND EXCHANGE COMMISSION
WASHINGTON, D.C. 20549
FORM 20-F
(Mark One)
|
¨
|
|
REGISTRATION STATEMENT PURSUANT TO SECTION 12(b) OR (g) OF THE SECURITIES EXCHANGE ACT OF 1934
|
OR
|
x
|
|
ANNUAL REPORT PURSUANT TO SECTION 13 OR 15(d) OF THE SECURITIES EXCHANGE ACT OF 1934
|
For the fiscal year ended September 30, 2013
OR
|
¨
|
|
TRANSITION REPORT PURSUANT TO SECTION 13 OR 15(d) OF THE SECURITIES EXCHANGE ACT OF 1934
|
OR
|
¨
|
|
SHELL COMPANY REPORT PURSUANT TO SECTION 13 OR 15(d) OF THE SECURITIES EXCHANGE ACT OF 1934
|
Commission file number:
000-51576
Origin Agritech Limited
(Exact name of Registrant as specified in its charter)
Not Applicable
(Translation of Registrant’s name into English)
British Virgin Islands
(Jurisdiction of incorporation or organization)
No. 21 Sheng Ming Yuan Road, Changping District, Beijing 102206, China
(Address of principal executive offices)
Dr. Han Gengchen
No. 21 Sheng Ming Yuan Road, Changping District, Beijing 102206, China
Tel: (86-10) 5890-7588
Fax: (86-10) 5890-7577
(Name, Telephone, E-mail and/or Facsimile number and Address of Company Contact Person)
Securities registered or to be registered pursuant to Section 12(b) of the Act.
|
Title of each class
|
|
Name of each exchange on which registered
|
|
Ordinary Shares
|
|
The NASDAQ Global Select Market
|
Securities registered or to be registered pursuant to Section 12(g) of the Act.
None
(Title of Class)
Securities for which there is a reporting obligation pursuant to Section 15(d) of the Act.
None
(Title of Class)
Indicate the number of outstanding shares of each of the issuer’s classes of capital or common stock as of the close of the period (September 30, 2013) covered by the annual report: 22,905,926 ordinary shares.
Indicate by check mark if the registrant is a well-known seasoned issuer, as defined in Rule 405 of the Securities Act.
¨
Yes
x
No
If this report is an annual or transition report, indicate by check mark if the registrant is not required to file reports pursuant to Section 13 or 15(d) of the Securities Exchange Act of 1934.
¨
Yes
x
No
Indicate by check mark whether the registrant (1) has filed all reports required to be filed by Section 13 or 15(d) of the Securities Exchange Act of 1934 during the preceding 12 months (or for such shorter period that the registrant was required to file such reports), and (2) has been subject to such filing requirements for the past 90 days.
x
Yes
¨
No
Indicate by check mark whether the registrant has submitted electronically and posted on its corporate website, if any, every Interactive Data File required to be submitted and posted pursuant to Rule 405 c) Regulation S-T during the preceding 12 months (or for such shorter period that the registrant was required to submit and post such files).
x
Yes
¨
No
Indicate by check mark whether the registrant is a large accelerated filer, an accelerated filer, or a non-accelerated filer.
¨
Large accelerated filer
¨
Accelerated filer
x
Non-accelerated filer
Indicate by a check mark which basis of accounting the registrant has used to prepare the financial statements included in this filing:
|
U.S. GAAP
x
|
International Financial Reporting Standard as
|
Other
¨
|
|
|||
|
|
Issued by the International Accounting Standards
|
|
|
|||
|
|
|
Board
¨
|
|
|||
If “Other” has been checked in response to the previous question, indicate by check mark which financial statement item the registrant has elected to follow.
¨
Item 17
¨
Item 18
If this is an annual report, indicate by check mark whether the registrant is a shell company (as defined in Rule 12b-2 of the Exchange Act).
¨
Yes
x
No
ORIGIN AGRITECH LIMITED
TABLE OF CONTENTS
|
INTRODUCTION
|
|
||
|
|
|
|
|
|
PART I
|
|
|
5
|
|
Item 1.
|
|
Identity of Directors, Senior Management and Advisors
|
5
|
|
Item 2.
|
|
Offer Statistics and Expected Timetable
|
5
|
|
Item 3.
|
|
Key Information
|
5
|
|
Item 4.
|
|
Information on the Company
|
26
|
|
Item 4A
|
|
Unresolved Staff Comments
|
42
|
|
Item 5.
|
|
Operating and Financial Review and Prospects
|
42
|
|
Item 6.
|
|
Directors, Senior Management, and Employees
|
59
|
|
Item 7.
|
|
Major Shareholders and Related Party Transactions
|
66
|
|
Item 8.
|
|
Financial Information
|
68
|
|
Item 9.
|
|
The Offer and Listing
|
69
|
|
Item 10.
|
|
Additional Information
|
70
|
|
Item 11.
|
|
Quantitative and Qualitative Disclosures About Market Risk
|
76
|
|
Item 12.
|
|
Description of Securities Other than Equity Securities
|
76
|
|
|
|
|
|
|
PART II
|
|
|
77
|
|
Item 13.
|
|
Defaults, Dividend Arrearages, and Delinquencies
|
77
|
|
Item 14.
|
|
Material Modifications to the Rights of Security Holders and Use of Proceeds
|
77
|
|
Item 15.
|
|
Controls and Procedures
|
77
|
|
Item 16A.
|
|
Audit Committee Financial Expert
|
79
|
|
Item 16B.
|
|
Code of Ethics
|
79
|
|
Item 16C.
|
|
Principal Accountant Fees and Services
|
79
|
|
Item 16D.
|
|
Exemption from the Listing Standards for Audit Committees
|
80
|
|
Item 16E.
|
|
Purchases of Equity Securities by the Issuer and Affiliated Purchasers
|
80
|
|
Item 16F.
|
|
Change in registrant’s certifying accountant
|
80
|
|
Item 16G.
|
|
Corporate Governance
|
80
|
|
|
|
|
|
|
PART III
|
|
|
81
|
|
Item 17.
|
|
Financial Statements
|
81
|
|
Item 18.
|
|
Financial Statements
|
81
|
|
Item 19.
|
|
Exhibits
|
81
|
| 1 | ||
|
|
INTRODUCTION
Except where the context otherwise requires and for purposes of this Annual Report only:
|
|
·
|
“we,” “us,” “our company,” “our,” the “Company” and “Origin” refer to Origin Agritech Limited and, in the context of describing our operations, also include State Harvest Holdings Limited and the following, which are collectively described in this Annual Report as “our PRC Operating Companies”: Beijing Origin State Harvest Biotechnology Limited, or Origin Biotechnology (“
BioTech”)
and its subsidiary Shandong Kunfeng or Origin Kunfeng, Beijing Origin Seed Limited, or Beijing Origin, and its five subsidiaries, Changchun Origin Seed Technology Development Limited, or Changchun Origin, Henan Origin Cotton Technology Development Limited, or Henan Origin, Denong Zhengcheng Seed Limited, or Denong, Linze Origin Seed Limited, or Linze Origin, Xinjiang Originbo Seed Limited, or Xinjiang Origin.
|
|
|
|
|
|
|
·
|
“last year,” “fiscal year 2013,” “the year ended September 30, 2013” and “the fiscal year ended September 30, 2013” refer to the twelve months ended September 30, 2013, which is the period covered by this Annual Report;
|
|
|
|
|
|
|
·
|
all references to “Renminbi,” “RMB” or “yuan” are to the legal currency of China; all references to “U.S. dollars,” “dollars,” “$” or “US$” are to the legal currency of the United States. Any discrepancies in any table between totals and sums of the amounts listed are due to rounding. The translation of Renminbi amounts into United States dollar amounts has been made for the convenience of the reader. Such translation amounts should not be construed as representations that the Renminbi amounts could be readily converted into United States dollar amounts at that rate or any other rate;
|
|
|
|
|
|
|
·
|
“China” or “PRC” refers to the People’s Republic of China, excluding Taiwan, Hong Kong, and Macau;
|
|
|
|
|
|
|
·
|
“Hong Kong” refers to the Hong Kong Special Administrative Region of the People’s Republic of China; and
|
|
|
|
|
|
|
·
|
“shares” and “ordinary shares” refer to our ordinary shares, “preferred shares” refers to our preferred shares
|
FORWARD-LOOKING INFORMATION
This Annual Report on Form 20-F contains forward-looking statements that are based on our current expectations, assumptions, estimates, and projections about our company and industry. All statements other than statements of historical fact in this Annual Report are forward-looking statements. These forward-looking statements can be identified by words or phrases such as “may,” “will,” “expect,” “anticipate,” “estimate,” “plan,” “believe,” “is/are likely to” or other similar expressions. The forward-looking statements included in this Annual Report relate to, among others:
|
|
·
|
our goals and strategies, including how we implement our goals and strategies;
|
|
|
|
|
|
|
·
|
our expectations for our future business and product development, business prospects, results of business operations
or any seed production operations, and current financial condition;
|
|
|
|
|
|
|
·
|
expected changes in our margins and certain costs or expenditures, inclusive of changes in our product costs;
|
|
|
|
|
|
|
·
|
our future pricing strategies or pricing policies;
|
|
|
|
|
|
|
·
|
our ability to successfully anticipate market demand for crop seeds in our market and plan our volume and product mix accordingly;
|
|
|
|
|
|
|
·
|
our ability to integrate acquisitions into our growth strategies and to generate sufficient value to justify their acquisition and development cost;
|
| 2 | ||
|
|
|
|
·
|
our plans for development of seed or technology internally, including our ability to successfully develop and produce seeds, and receive regulatory approval for and distribute proprietary seed products;
|
|
|
|
|
|
|
·
|
our expectations regarding our need to produce seeds and other biotechnology under licenses from third parties, and production results of our contracted farming production base;
|
|
|
|
|
|
|
·
|
future development of agricultural biotechnology as a whole and the impact of genetically modified crop seeds in our industry;
|
|
|
|
|
|
|
·
|
address the scope and impact of the governing and regulatory policies and laws regarding genetically modified seed products in China, and our ability to apply for and receive necessary approvals and to develop, produce, market and distribute genetically modified crop seeds;
|
|
|
|
|
|
|
·
|
compliance with government registration and regulation;
|
|
|
|
|
|
|
·
|
our plans to license or co-develop any seed product or technology;
|
|
|
|
|
|
|
·
|
our plans regarding any future business combination or business acquisition;
|
|
|
|
|
|
|
·
|
PRC and other international government policies and regulations relating to the crop seed industry;
|
|
|
|
|
|
|
·
|
our plans to expand our business-level or corporate-level operations and product offerings;
|
|
|
|
|
|
|
·
|
likelihood of recurrence of accounting charges or impairments;
|
|
|
|
|
|
|
·
|
expected changes in our sources of revenues and income base from our business operations or other sources;
|
|
|
|
|
|
|
·
|
competition in the crop seed industry in China and other international markets;
|
|
|
|
|
|
|
·
|
future development of the crop seed industry in China and other international markets;
|
|
|
|
|
|
|
·
|
our plans for current staffing requirements, research and development and regional business focus;
|
|
|
|
|
|
|
·
|
our ability to successfully raise capital to accommodate company needs which are under acceptable terms, at an acceptable share price and at a reasonable cost; and
|
|
|
|
|
|
|
·
|
adequacy of our facilities or seed production for our future operations.
|
We believe it is important to communicate our expectations to our shareholders. However, there may be certain events in the future that we are not able to predict with accuracy or over which we have no control. The risk factors and cautionary language discussed in this Annual Report provide examples of risks, uncertainties and events that may cause actual results to differ materially from the expectations in these forward-looking statements, including among other things:
|
|
·
|
changing interpretations of Generally Accepted Accounting Principles and the adoption or use of International Accounting Standards in the future;
|
|
|
|
|
|
|
·
|
outcomes of PRC and international government reviews, inquiries, investigations and related litigations;
|
|
|
|
|
|
|
·
|
continued compliance with government regulations of PRC and other governments;
|
|
|
|
|
|
|
·
|
legislative and regulatory environments, requirements or changes adversely affecting the businesses in which we and our PRC operating companies are engaged;
|
|
|
|
|
|
|
·
|
fluctuations in our
customer demand;
|
|
|
|
|
|
|
·
|
management of the growth of our business and introduction of genetically modified products;
|
|
|
|
|
|
|
·
|
timing of approval, production, and market acceptance of new products, inclusive of our genetically modified products;
|
|
|
|
|
|
|
·
|
general economic conditions in the PRC and worldwide; and
|
|
|
|
|
|
|
·
|
geopolitical events and regulatory changes.
|
| 3 | ||
|
|
The forward-looking statements in this Annual Report involve various risks, assumptions, and uncertainties. Although we believe that our expectations expressed in these forward-looking statements are reasonable, we cannot be certain that our expectations will materialize. Our actual results could be materially different from our expectations. Important risks and factors that could cause our actual results to be materially different from our expectations are generally set forth in the risk factors included in this Annual Report.
This Annual Report also contains information relating to the crop seed market, which is based on various assumptions. The crop seed market may not grow at the rates we project, or at all. The failure of the markets in which we operate to grow at the projected rates may have a material adverse effect on our business and the market price of our shares. In addition, the relatively new and rapidly changing nature of the genetically modified crop seed industry subjects any projections or estimates relating to the growth prospects or future condition of our markets to significant uncertainties. Furthermore, if any one or more of the assumptions underlying the market data turns out to be incorrect, actual results may differ based on these assumptions.
The forward-looking statements made in this Annual Report relate only to events or information as of the date of the statements. Readers should read these statements in conjunction with the risk factors disclosed in this Annual Report.
All forward-looking statements included herein attributable to us or other parties or any person acting on our behalf are expressly qualified in their entirety by the cautionary statements contained or referred to in this section. Except to the extent required by applicable laws and regulations, we undertake no obligations to update these forward-looking statements to reflect events or circumstances after the date of this Annual Report or to reflect the occurrence of unanticipated events.
| 4 | ||
|
|
Not Applicable.
Not Applicable.
A.
Selected financial data
.
The following selected consolidated financial information was derived from our fiscal year end consolidated financial statements. The following information should be read in conjunction with those statements and Item 5, “Operating and Financial Review and Prospects.” Our summary consolidated statements of operations and comprehensive income data for the fiscal years ended September 30, 2011, 2012 and 2013 and our summary consolidated balance sheet data as of September 30, 2012 and 2013, as set forth below, are derived from, and are qualified in their entirety by reference to, our audited consolidated financial statements, including the notes thereto, which are included in this Annual Report. The summary statement of operations and comprehensive income data for the fiscal years ended September 30, 2009 and 2010 and the summary balance sheet data as of September 30, 2009, 2010 and 2011, set forth below are derived from our audited consolidated financial statements which are not included herein.
Our consolidated financial statements are prepared and presented in accordance with accounting principles generally accepted in the United States, or U.S. GAAP.
|
|
|
For the year ended
|
|
||||||||||
|
|
|
September 30,
|
|
||||||||||
|
|
|
(in thousands, except share data)
|
|
||||||||||
|
|
|
2009
|
|
2010
|
|
2011
|
|
2012
|
|
2013
|
|
||
|
|
|
RMB
|
|
RMB
|
|
RMB
|
|
RMB
|
|
RMB
|
|
USD(1)
|
|
|
Consolidated statement of income and comprehensive income data:
|
|
|
|
|
|
|
|
|
|
|
|
|
|
|
Net revenues
|
|
592,492
|
|
584,860
|
|
567,434
|
|
552,111
|
|
481,694
|
|
77,297
|
|
|
Cost of revenues
|
|
(392,842)
|
|
(353,587)
|
|
(371,591)
|
|
(387,783)
|
|
(315,082)
|
|
(50,561)
|
|
|
Gross profit
|
|
199,650
|
|
231,273
|
|
195,843
|
|
164,328
|
|
166,612
|
|
26,736
|
|
|
Selling and marketing
|
|
(55,648)
|
|
(52,227)
|
|
(56,831)
|
|
(56,437)
|
|
(55,375)
|
|
(8,886)
|
|
|
General and administrative
|
|
(64,833)
|
|
(78,708)
|
|
(86,748)
|
|
(77,585)
|
|
(66,153)
|
|
(10,615)
|
|
|
Research and development
|
|
(33,473)
|
|
(38,356)
|
|
(44,771)
|
|
(37,629)
|
|
(42,162)
|
|
(6,766)
|
|
|
Other income, net
|
|
1,991
|
|
2,340
|
|
5,120
|
|
3,852
|
|
15,241
|
|
2,446
|
|
|
Total operating expenses
|
|
(151,963)
|
|
(166,951)
|
|
(183,230)
|
|
(167,799)
|
|
(148,449)
|
|
(23,821)
|
|
|
Income (loss) from operations
|
|
47,687
|
|
64,322
|
|
12,613
|
|
(3,471)
|
|
18,163
|
|
2,915
|
|
|
Interest income
|
|
2,036
|
|
1,634
|
|
1,771
|
|
2,547
|
|
1,776
|
|
285
|
|
|
Interest expenses
|
|
(16,784)
|
|
(8,539)
|
|
(1,469)
|
|
(4,029)
|
|
(11,326)
|
|
(1,818)
|
|
|
Loss on repurchase of convertible notes
|
|
(51,101)
|
|
-
|
|
-
|
|
-
|
|
-
|
|
-
|
|
|
|
|
|
|
|
|
|
|
|
|
|
|
|
|
|
Equity in earnings / Gain on disposal of associated company
|
|
4,669
|
|
18,253
|
|
1,616
|
|
4,030
|
|
5,161
|
|
828
|
|
|
|
|
|
|
|
|
|
|
|
|
|
|
|
|
|
Loss on liquidation of subsidiary
|
|
-
|
|
-
|
|
(13,582)
|
|
-
|
|
-
|
|
-
|
|
|
Changes in the fair value of embedded derivatives
|
|
3,300
|
|
-
|
|
-
|
|
-
|
|
-
|
|
-
|
|
|
Income (loss) before income taxes
|
|
(10,193)
|
|
75,670
|
|
949
|
|
(923)
|
|
13,774
|
|
2,210
|
|
|
Income tax expense
|
|
(11,732)
|
|
(9,319)
|
|
(13,730)
|
|
(1,862)
|
|
(4,462)
|
|
(716)
|
|
|
Net income (loss) before non-controlling interests
|
|
(21,925)
|
|
66,351
|
|
(12,781)
|
|
(2,785)
|
|
9,312
|
|
1,494
|
|
|
Non-controlling interests
|
|
18,892
|
|
17,298
|
|
10,298
|
|
(1,351)
|
|
1,818
|
|
292
|
|
|
Net income (loss) attributable to Origin Agritech Limited
|
|
(40,817)
|
|
49,053
|
|
(23,079)
|
|
(1,434)
|
|
7,494
|
|
1,202
|
|
|
|
|
|
|
|
|
|
|
|
|
|
|
|
|
|
Net income (loss) per share:
|
|
|
|
|
|
|
|
|
|
|
|
|
|
|
Basic
|
|
(1.77)
|
|
2.12
|
|
(1.00)
|
|
(0.06)
|
|
0.32
|
|
0.05
|
|
|
Diluted
|
|
(1.77)
|
|
2.10
|
|
(1.00)
|
|
(0.06)
|
|
0.32
|
|
0.05
|
|
|
Shares used in computation:
|
|
|
|
|
|
|
|
|
|
|
|
|
|
|
Basic
|
|
23,013,692
|
|
23,189,464
|
|
23,351,615
|
|
23,382,812
|
|
23,259,127
|
|
23,259,127
|
|
|
Diluted
|
|
23,013,692
|
|
23,337,265
|
|
23,351,615
|
|
23,382,812
|
|
23,278,443
|
|
23,278,443
|
|
| 5 | ||
|
|
|
|
|
Sept 30
|
|
Sept 30
|
|
Sept 30
|
|
|
Sept 30
|
|
|
Sept 30
|
|
|||||
|
|
|
2009
|
|
2010
|
|
2011
|
|
|
2012
|
|
|
2013
|
|
|||||
|
|
|
|
|
|
|
|
|
(in thousands)
|
|
|
|
|
|
|
|
|
|
|
|
|
|
RMB
|
|
RMB
|
|
RMB
|
|
|
RMB
|
|
|
RMB
|
|
USD(1)
|
|
|||
|
Consolidated balance sheet data:
|
|
|
|
|
|
|
|
|
|
|
|
|
|
|
|
|
|
|
|
Cash and cash equivalents
|
|
|
121,255
|
|
|
299,672
|
|
|
129,942
|
|
|
152,789
|
|
|
131,978
|
|
21,467
|
|
|
Current working capital (2)
|
|
|
(33,533)
|
|
|
67,650
|
|
|
(21,753)
|
|
|
(46,153)
|
|
|
(67,436)
|
|
(10,969)
|
|
|
Total assets
|
|
|
824,544
|
|
|
935,011
|
|
|
818,382
|
|
|
975,437
|
|
|
1,158,072
|
|
188,366
|
|
|
Deferred revenues
|
|
|
18,280
|
|
|
23,111
|
|
|
19,812
|
|
|
23,243
|
|
|
22,069
|
|
3,590
|
|
|
Total current liabilities
|
|
|
546,822
|
|
|
596,611
|
|
|
532,571
|
|
|
605,195
|
|
|
751,978
|
|
122,314
|
|
|
Total liabilities
|
|
|
546,822
|
|
|
606,037
|
|
|
532,571
|
|
|
662,005
|
|
|
837,827
|
|
136,277
|
|
|
Non-controlling interests
|
|
|
51,389
|
|
|
57,089
|
|
|
26,774
|
|
|
52,385
|
|
|
54,203
|
|
8,816
|
|
|
Total Origin Agritech Limited shareholders’ equity
|
|
|
226,333
|
|
|
271,885
|
|
|
259,037
|
|
|
261,047
|
|
|
266,042
|
|
43,273
|
|
(1) Translation of Renminbi amounts into United States dollar amounts has been made for the convenience of the reader for the year ended September 30, 2013 and has been made at the exchange rate quoted by the closing rate by the State Administration of Foreign Exchange in China on September 30, 2013 of RMB6.1480 to US$1.00. Such translation amounts should not be construed as representations that the Renminbi amounts could be readily converted into United States dollar amounts at that rate or any other rate.
(2) Current working capital is the difference between total current assets and total current liabilities.
| 6 | ||
|
|
Exchange Rate Information
The conversion of Renminbi into U.S. dollars in this Annual Report is based on the statistics of the State Administration of Foreign Exchange with respect to our historical financial statements. The consolidated financial statements are presented in Renminbi as the reporting currency. The translation of Renminbi amounts into United States dollar amounts has been made for the convenience of the reader and has been made at the exchange rate quoted by the closing rate by the State Administration of Foreign Exchange in China on September 30, 2013 of RMB6.1480 to US$1.00. Such translation amounts should not be construed as representations that the Renminbi amounts could be readily converted into United States dollar amounts at that rate or any other rate. Unless otherwise noted, for the years ended September 30, 2009, 2010, 2011, 2012 and 2013, all translations from Renminbi to U.S. dollars in this Annual Report were made at RMB6.8290, RMB6.7011, RMB6.3549, RMB6.3410 and RMB 6.1480 per US $1.00, respectively, which were the prevailing year or period end closing rates for those periods. We make no representation that any Renminbi or U.S. dollar amounts could have been, or could be, converted into U.S. dollars or Renminbi, as the case may be, at any particular rate, the rates stated below, or at all. The PRC government imposes controls over its foreign currency reserves in part through direct regulation of the conversion of Renminbi into foreign exchange and through restrictions on foreign trade.
The following table sets forth information concerning exchange rates between the Renminbi and the U.S. dollar for the periods indicated. These rates are provided solely for your convenience and are not necessarily the exchange rates that we used in this Annual Report or will use in the preparation of our periodic reports or any other information to be provided to you.. The source of the rates is the State Administration of Foreign Exchange in China. At September 30, 2013 the closing exchange rate was RMB 6.1480 for one U.S. dollar.
|
|
|
Average (1)
|
|
High
|
|
Low
|
|
Period-end
|
|
||||
|
2009
|
|
|
6.8328
|
|
|
6.8527
|
|
|
6.8201
|
|
|
6.8262
|
|
|
2010
|
|
|
6.8120
|
|
|
6.8287
|
|
|
6.6936
|
|
|
6.7011
|
|
|
2011
|
|
|
6.4576
|
|
|
6.6349
|
|
|
6.3165
|
|
|
6.3549
|
|
|
2012
|
|
|
6.3189
|
|
|
6.3482
|
|
|
6.2787
|
|
|
6.3410
|
|
|
2013
|
|
|
6.2318
|
|
|
6.3449
|
|
|
6.1475
|
|
|
6.1480
|
|
|
April 2013
|
|
|
6.2471
|
|
|
6.2674
|
|
|
6.2208
|
|
|
6.2208
|
|
|
May 2013
|
|
|
6.1970
|
|
|
6.2152
|
|
|
6.1796
|
|
|
6.1796
|
|
|
June 2013
|
|
|
6.1718
|
|
|
6.1807
|
|
|
6.1598
|
|
|
6.1787
|
|
|
July 2013
|
|
|
6.1725
|
|
|
6.1807
|
|
|
6.1599
|
|
|
6.1788
|
|
|
August 2013
|
|
|
6.1708
|
|
|
6.1817
|
|
|
6.1666
|
|
|
6.1709
|
|
|
September 2013
|
|
|
6.1588
|
|
|
6.1729
|
|
|
6.1477
|
|
|
6.1480
|
|
|
October 2013
|
|
|
6.1393
|
|
|
6.1458
|
|
|
6.1330
|
|
|
6.1425
|
|
|
November 2013
|
|
|
6.1372
|
|
|
6.1482
|
|
|
6.1305
|
|
|
6.1325
|
|
|
December 2013
|
|
|
6.1160
|
|
|
6.1352
|
|
|
6.0969
|
|
|
6.0969
|
|
|
January 2014
|
|
|
6.1047
|
|
|
6.1109
|
|
|
6.0990
|
|
|
6.1008
|
|
(1) Annual averages are calculated from month-end rates. Monthly averages are calculated using the average of the daily rates during the month.
Not Applicable
C.
Reasons for the offer and use of proceeds
.
Not Applicable.
D.
Risk factors
.
Risks relating to our business
| 7 | ||
|
|
If we do not manage our ongoing growth successfully, our growth and chances for profitability may be hindered or impeded.
We continue to be a growth orientated company, with our primary focus on researching and developing our corn seeds and biotechnology, increasing distribution penetration, winning market share and expanding into new markets. Expansion is expected to create significant demands on our corporate administrative, operational, and financial personnel and other human resources and on our cash flow needs and the requirement for additional working capital. Our current resources may not be adequate to support our planned operations and expansion. These demands and ongoing industry factors, such as overproduction or government policy changes, may hinder our cash flow as our profit margins and sales may be adversely affected.
We require short-term financing to fund our working capital, especially due to the seasonal nature of our business.
The nature of the agricultural seed production industry involves expenses and revenues cycles that are seasonal in nature. In the third to fourth quarters of our fiscal year, we may face costs that are in excess of our cash flow sources. The advance payments we make to our seed producing farmers may exceed the amount of deposits we receive from our customers, the seed distributors and end users. The exact timing of these deposit payments is dependent on the Chinese lunar calendar, which varies from one calendar year to the next. As a result, we have customarily relied upon short term bridge loans to cover our expenses pending receipt of cash payment from farmers at the time of seed purchases. Although historically we have had access to sufficient financing to manage our cash flow cycles, we cannot be certain that we will be able to obtain sufficient debt financing on terms that are satisfactory to us to maintain consistent operating results given changing credit conditions worldwide and internal PRC policies. Downgrades in our credit rating, tightening of related credit facilities or financial markets or other limitations on our ability to access short-term financing would increase our interest costs and adversely affect our operating results and operations.
Because of the nature of our business, which has seasonal variation, it is likely that our future financial performance will fluctuate from period to period.
Our operating results likely will fluctuate due to a number of factors, many of which are beyond our control. Our quarterly and annual revenues and costs and expenses as a percentage of our revenues may be significantly different from their historical levels. Our operating results in future quarters may fall below expectations. The industry in which we operate is seasonal in nature. The sales season of corn and rice seeds lasts from October to June; the sales season of canola seeds lasts from July to September. We generally do not have significant sales revenues from July to September, which results in cyclical changes of our cash flow and operating activities. As a result, if we are unable to generate sufficient working capital from cash flow from operations and working capital facilities, we may encounter liquidity difficulties from the period of July through September, which may harm our operations. The seasonal nature of our business causes our operating results to fluctuate from quarter to quarter. Any unexpected seasonal or other fluctuations could cause the price of our common shares to fall. As a result, you may not rely on comparisons of our quarterly operating results as an indication of our future performance.
In addition, the future achievement and growth of our profits depends on our ability to secure sufficient orders from customers and sufficient seed production from the seed production farms. An adverse change in the seed market conditions may have material adverse effects on our operating results if we cannot adjust our operating and marketing strategy to respond to such changes. The results of our operations may be adversely affected by reduced orders and profit margins in the event of a slowdown in market demand, constraint on the market supply, an increase in business competition, a decrease in government subsidies to farmers, increased costs, or for other reasons. As such, there is a risk that we will not be able to achieve or maintain profitability or our historical results.
Aged inventory may result in an increase of our expenses and cause operating losses.
Due to the nature of the seed industry and our competition, we normally produce seeds according to our annualized production estimate that is developed at least one year before delivery to our customers. If our production plan is too aggressive, we could produce more seeds than the market demands, resulting in larger amounts of inventory that remain unsold, aged seeds. We may decide not to sell the aged seeds as crop seed products, taking into account factors, such as the quality of the seeds and commodity pricing. In that case, the aged inventory may be sold as common feed products at greatly reduced prices. Aged inventory could result in asset impairment risk, in which case we would suffer a loss and incur an increase in our cost of revenues and a decrease in gross profit.
| 8 | ||
|
|
If we are unable to match our production to customer demand, our business, financial condition and results of operations may be adversely affected.
We normally produce seeds according to an annualized production plan based on estimated customer demand, our assessment of industry wide inventory, and growing capacities that is developed before we sell and deliver crop seeds to distributors. Chinese farmers, the end users of our crop seeds, generally decide to purchase our products based on market prices, economic and weather conditions and other factors that we and our distributors may not be able to fully or accurately anticipate in advance. If we fail to accurately estimate the volume and types of products sought by farmers and otherwise adequately manage production amounts, which may also be adversely affected by weather conditions, we may produce more seeds than we are able to sell, resulting in excess inventory and aged seeds. On the other hand, if we underestimate demand, we may not be able to satisfy demand for our crop seeds, and thus damage our customer relations and end-user loyalty. Our failure to estimate farmers’ future needs and to match our production to the demand, overall industry inventory and competition may adversely affect our business, financial condition and results of operations. In addition, inadequate distributor liquidity could affect distributors’ ability to pay for our products and, therefore, affect our sales or our ability to collect on our receivables.
The successful development and commercialization of our biotech pipeline of products will be important for our growth.
We conduct our own research and development efforts for genetically modified seeds, referred to as GM, and we have entered into agreements with the Chinese Academy of Science and the China Agricultural Academy of Science in the PRC working on genetic modifications and other biotechnologies that give us the right to market the seeds and technologies they develop. We are also seeking other development and marketing arrangements with other entities in China and elsewhere. There can be no assurance that these efforts will produce improved seed varieties. Commercial success frequently depends on being the first company to enter a particular market. The length of time and the risk associated with breeding and biotech pipelines are similar and interlinked because both are required as a package for commercial success in markets where biotech traits are approved for growers. Regulatory requirements affect the development of our biotech products, including the GM crop testing of seeds containing the biotech traits, which could harm our business and results of operations if regulations are not satisfied. The testing procedures can be lengthy and costly, with no guarantee of success. It could have an adverse effect on our operations if our genetically modified products are unable to pass the safety evaluation of genetically modified agricultural organisms.
There has been a worldwide increase in the development and application of genetically modified agricultural products to enhance crop seed quality and increase crop yields. The production and commercial sales of genetically modified corn and rice seeds have not been allowed in China until only recently. Therefore, we continue to rely primarily upon traditional methods of creating crop seed hybrids to develop new seed products. As government policies change to allow more genetically modified seeds and demand develops for these products, we expect that we will produce more genetically modified products to meet customer demand to the extent we are able. There is a risk that our current steps to respond to the potential competitive threat posed by genetically modified agricultural products, including our research and development activities with respect to genetically modified crop seeds, may not enable us to compete successfully.
The potential uncertainty in the government regulation of genetic technology and genetically modified, or GM, agricultural products could have an adverse effect on our business.
We continue to undertake a transition from a conventional hybrid seed company to an agricultural biotechnology company. However, genetically modified seed products are controversial, and genetic modification has not yet been widely accepted in many countries in the world, including in China. Since the Chinese government approved the commercial planting of GM cotton in 1997, the government has only recently begun to approve GM crops for commercial cultivation. The relative novelty and the potential uncertainty in the government regulation of genetic technology could have an adverse effect on our business development strategy and hinder our ability to develop new seeds that we believe may provide us with better margins.
| 9 | ||
|
|
The government may never approve the commercialization of genetically modified corn, or it may ban commercialization and/or research of genetically modified corn, any of which would have an adverse impact on the future of the company.
With the successful approval for commercial use of genetically modified phytase corn, we continue to pursue the commercialization of phytase corn and the development of other seed biotechnology products. Even though we believe biotechnology is important in agricultural applications, we cannot predict whether or when the government will approve the full commercialization of genetically modified corn. The government may never approve the full commercialization of GM corn, and it may even ban any commercialization and/or research relating to genetically modified corn. Any of these actions would have an adverse impact on our future development, and we would not be able to recover our research and development costs spent in developing biotechnology products.
The degree of public acceptance or perceived public acceptance of our biotechnology products can affect our operations.
Although all of the genetically modified products must go through rigorous testing, some opponents of the technology consistently attempt to raise public concern about the potential for adverse effects of genetically modified seed products on human or animal health, other plants and the environment. The potential for the adventitious presence of commercial biotechnology traits in conventional seed, or in the grain or products produced from conventional or organic crops, is another factor that could affect the public’s acceptance of these traits. Public concern can affect the timing of, and whether we are able to obtain, government approvals. Even after approvals are granted, public concern may lead to increased regulation or legislation, which could affect our business and operations, and may adversely affect sales of our products to farmers, due to their concerns about available markets for the sale of crops or other products derived from biotechnology.
The global competition in biotechnology will affect our business.
We believe we are a leader in biotechnology in China since we have been conducting our proprietary biotechnology research program for many years and have built the first internal biotech research center among domestic Chinese crop seed companies. However, if and when multinational corporations engaged in the crop seed business expand into the agricultural market in China, they may have a greater portfolio of seed products and more advanced technologies than us. Major multinational competitors have a long history in the research and commercialization of their products, sophisticated marketing capabilities and strong intellectual property estates, all of which may give them competitive advantage over us. Any of these competitive advantages could cause our existing or future products to become less competitive or outdated, and adversely affect our product acceptance in the market place and our results of operations.
We are currently dependent on licensed seed products for the majority of our revenues. If we lose the right to produce and sell licensed seeds, we will lose substantial revenues and suffer substantial losses.
A substantial portion of our revenues are derived from licensed hybrid seeds instead our internally developed proprietary hybrid seeds. The majority of the licensed hybrid seeds that we sell have been developed and produced under our license agreements with the Corn Research Institute in Li County, Hebei Province (currently known as Shijiazhuang Liyu Technology Development Co., Ltd., and referred to as Liyu herein) and the Henan Agricultural University. If we are not able to develop and produce the licensed seed products, if the current license agreements are terminated, or if we are unable to renew some of these license agreements on commercially reasonable terms or at all, we will suffer a substantial loss of our product offerings and, consequently, our revenues will be substantially limited and our financial condition and results of operations may be adversely affected.
We have a relatively short operating history and are subject to the risks of any growing enterprise, any one of which could limit our growth and our product and market development.
As an expanding company and one that does not have a long operating history, it is difficult to predict how our business will develop over the long term. Accordingly, we are still facing all of the risks and uncertainties encountered by companies in the earlier stages of development and expansion, such as:
|
|
⋅
|
uncertain and continued market acceptance for our product extensions and our services;
|
|
|
⋅
|
evolving nature of the crop seed industry in the PRC, where significant consolidation may occur, leading to the formation of companies which may be better able to compete with us than is currently the case;
|
| 10 | ||
|
|
|
|
⋅
|
changing competitive conditions, technological advances or customer preferences could harm sales of our products or services;
|
|
|
⋅
|
maintaining our competitive position in the PRC and competing with Chinese and international companies, many of which have longer operating histories and greater resources than us;
|
|
|
⋅
|
maintaining our current licensing arrangements and entering into new ones to expand our product offerings;
|
|
|
⋅
|
continuing to offer commercially successful products to attract and retain a larger base of direct customers and ultimate users;
|
|
|
⋅
|
retaining access to the farmland we currently use for production of our products and obtaining access to additional farmland for expansion;
|
|
|
⋅
|
continuing our existing arrangements with production farms that grow our seed products and entering into new arrangements with additional production farms;
|
|
|
⋅
|
maintaining effective control of our costs and expenses; and
|
|
|
⋅
|
retaining our management and skilled technical staff and recruiting additional key employees.
|
If we are not able to meet the challenges of building our businesses and managing our growth, the likely result will be slowed growth, lower margins, additional operational costs and lower income.
Our success depends to a large extent upon the continued service of an executive officer and key employee and recruiting other skilled persons.
The loss of the services of Dr. Gengchen Han, our Chairman of the Board, Chief Executive Officer and President, would have an adverse effect on us and our PRC operating subsidiaries. The loss of the services of Dr. Han would be disruptive to our business plans and our overall operations. We believe that our overall future success depends upon our ability to attract and retain highly skilled managerial and marketing personnel and research and development persons. There is no assurance that we will be successful in attracting and retaining such personnel on terms acceptable to them. Inadequate personnel will limit our growth, and will be seen as a detriment to our prospects, leading potentially to a loss in value for investors.
Any diversion of management attention to matters related to acquisitions or any delays or difficulties encountered in connection with integrating acquired operations may have an adverse effect on our core business, results of operations, and/or financial condition.
We made several acquisitions involving seed and other related companies in the past and may complete other acquisitions in the future. We must integrate any acquired operations into our growth strategies to generate sufficient value to justify their cost. Acquisitions also present other challenges, including geographical coordination, personnel integration and retention of key management personnel, system integration and the unification of corporate culture. These efforts could divert management attention from our core business, cause a temporary interruption of or loss of momentum in our business and the loss of key personnel from the acquired companies. In addition, proposed acquisitions which are not consummated will cause us to incur substantial costs, none of which are generally recoverable.
From time to time we must evaluate whether or not to discontinue a line of business, which if discontinued could have an adverse impact on our financial position.
From time to time we evaluate whether or not to continue a particular line of business and during 2012 we implemented a restructuring program to eliminate our activities in agricultural chemicals and cotton seed development and distribution. Whenever a company undertakes to discontinue a line of business, there are expenses associated with the sale or closing of those related operations, which are reflected in the accounting for discontinued operations. The actual and accounting costs for discontinued operations may have an adverse effect on the financial position of the company in the period of discontinuance, which may result in an adverse market reaction and decline in our stock price.
| 11 | ||
|
|
We or our licensors may be subject to intellectual property infringement claims, which may force us to incur substantial legal expenses and, if determined adversely against us or our licensors, may materially disrupt our business.
We cannot be certain that our licensed or self-developed proprietary seed products do not or will not infringe the intellectual property rights held by third parties. We, or any of our licensors, may be subject to legal proceedings and claims from time to time related to the intellectual property of others. If we, or any of our licensors, are found to have violated the intellectual property rights of others, we may be required to pay damages and be enjoined from using such intellectual property, and we may incur new or additional licensing fees if we wish to continue using the infringing products, or be forced to develop or license alternative products. In addition, we may incur substantial expenses in defending against these third party infringement claims, regardless of their merit.
Efforts to protect our intellectual property rights and to defend against claims can increase our costs and may not always succeed. Any failures could adversely affect our sales and results of operations or restrict our ability to conduct our business.
Intellectual property rights are important to our business. We endeavor to obtain and protect our intellectual property rights where our products are produced. However, we may be unable to obtain protection for our intellectual property. Even if protection is obtained, competitors, growers or others in the chain of commerce may raise legal challenges to our rights or illegally infringe our rights, including through means that may be difficult to prevent, detect or defend. In addition, because of the rapid pace of technological change and the confidentiality of patent applications in some jurisdictions, competitors may be issued patents from applications that were unknown to us prior to issuance. These patents could reduce the value of our commercial or pipeline products or, to the extent they cover key technologies on which we have unknowingly relied, require that we obtain licenses at a financial cost to us or cease using the technology, no matter how valuable the patents may be to our business. We cannot assure you that we would be able to obtain such licenses on acceptable terms. Also, litigation may be necessary to enforce our intellectual property rights, protect our trade secrets or determine the validity and scope of the proprietary rights of others. There is a risk that the outcome of such potential litigation may not be in our favor. Such litigation may be costly and may divert management attention as well as consume other resources which could otherwise be devoted to our business. An adverse determination in any such litigation will impair our intellectual property rights and may harm our business, prospects and reputation. In addition, we have no insurance coverage against litigation costs due to lack of this kind of insurance being available in China, and we would have to bear all costs arising from such litigation to the extent we are unable to recover such costs from other parties. The occurrence of any of the foregoing may harm our business, results of operations and financial condition.
Finally, implementation of PRC intellectual property-related laws has historically been lacking, primarily because of the ambiguities in the PRC laws and the difficulties in enforcement. Accordingly, intellectual property rights and confidentiality protections in China may not be as effective as they are in the United States or other countries, which increases the risk that we may not be able to adequately protect our intellectual property.
Our business may not be profitable if we do not continue to identify and market products considered valuable by our customers.
To be profitable, our crop seed depends on recurring and sustained reorders by farmers in China. Reorder rates are inherently uncertain due to several factors, many of which are outside our control. These factors include changing customer preferences, competitive price pressures, our failure to develop acceptable new products, development of higher quality products by competitors, weather conditions and general economic conditions.
Our business focus on crop seed development and production does not permit us to spread our business risks among different businesses and, thus, a disruption in our seed production or the industry would harm us more immediately and directly.
Our crop seed business is the principal business activity of the Company. Therefore, our business opportunities, revenues and income could be more immediately and directly affected by disruptions from factors including drought and other natural disasters, epidemics, or widespread problems affecting the crop seed industry, such as limited farmer credit, payment disruptions or customer rejection of genetically modified crop seeds, among other things. If there is a disruption as described above, our revenues and income will be reduced, and our business operations may have to be scaled back.
| 12 | ||
|
|
We are dependent on revenues from our corn seed products and, therefore, our operating results could be disproportionately and negatively impacted if we are unable to sell a sufficient amount of corn seed at satisfactory margins.
Corn seed represents the principal source of revenues for the Company. For the fiscal year ended September 30, 2013, sales of our corn seed products comprised approximately of 80.40% our revenues, as compared to 75.48% for the fiscal year ended September 30, 2012. Our dependence on corn seed makes us particularly vulnerable to any negative market changes that might occur in this product line. In particular, if the demand for our corn seed products generally decreases or if the supply exceeds demand, then corn prices will be driven downwards and our margins will be negatively impacted, which would have an adverse effect on our business, results of operations and financial condition.
Failure to develop and market new products could impact the Company’s competitive position and have an adverse effect on the Company’s financial results.
The Company’s operating results are largely dependent on its ability to renew its pipeline of new seed products and services and to bring those products and services to the market. This ability could be adversely affected by difficulties or delays in product development such as the inability to identify viable new products, greater than anticipated development costs, technical difficulties, regulatory obstacles, competition, lack of demand, insufficient intellectual property protection, or lack of market acceptance of new products and services. Due to the lengthy development process, technological challenges and intense competition, there can be no assurance that any of the products the Company is currently developing, or could begin to develop in the future, will achieve substantial commercial success. Consequently, if we are not able to fund extensive research and development activities and deliver new products to the markets we serve on a timely basis, our growth and operations will be harmed. In addition, sales of the Company’s new products could cannibalize sales of some of its current products, offsetting the benefit of even a successful product introduction.
If we fail to introduce and commercialize new crop seed, we will not be able to recover research, development and cover our other costs.
We cannot guarantee the development and performance of new crop seed varieties, whether licensed or proprietary, or that they will meet our customers’ expectations. Farmers generally need time to learn about new seed varieties and how to plant and tend them. Their traditional planting experience may make it difficult for them to adapt to the new varieties. The process and timing for new seed products to gain market recognition and acceptance is long and uncertainties. If we fail to introduce and commercialize a new seed variety that meets the demand of farmers in China and to provide the proper education about the seeds to distributors, farmers and the public, we may not be able to generate sufficient sales to cover our costs or generate a financial return on our investment.
One or more of our distributors could engage in activities that are harmful to our brand and to our business.
Our crop seed products are sold primarily through distributors. The distributors are responsible for ensuring that our products have the appropriate licenses to be sold to farmers in the PRC provinces. If the distributors do not apply for and receive the appropriate licenses, their sales of our products in those provinces may be illegal, and we may be subject to government sanctions, including confiscation of illegal revenues and a fine of between two and three times the amount of such illegal revenues. Unlicensed sales in a province may also cause a delay for our other distributors in receiving a license from the authorities for that province, which could further adversely impact our sales in that province. In addition, distributors may sell our products under another brand that is licensed in a particular province if our product is not licensed there. If our products are sold under another brand, the purchasers will not be aware of our brand name, and we will be unable to cross-market other crop seed varieties or other products as effectively to these purchasers. Moreover, our ability to provide appropriate customer service to these purchasers will be negatively affected, and we may be unable to develop our local knowledge of the needs of these purchasers and their environment. If any of our distributors sell inferior crop seeds produced by other companies under our brand name, our brand and reputation could be harmed, which could make marketing of our branded crop seeds more difficult.
| 13 | ||
|
|
We may be exposed to product quality claims, which may cause us to incur substantial legal expenses and, if determined adversely against us, may cause us to pay significant damage awards.
The performance of our seeds depends on climate, geographical areas, cultivation method, farmers’ degree of knowledge and other factors in addition to genetic traits and the quality of our seeds. Natural disasters may also affect the performance of our seeds, particularly when farmers are not able to timely and effectively respond to those disasters. Furthermore, the cultivability of some farmland is deteriorating because of toxic and hazardous materials resulting from farmers’ overuse of chemical herbicides and pesticides and the fall-out from other sources of environmental pollution. These factors generally cause underproduction, but farmers may attribute underproduction to seed quality. We may be subject to legal proceedings and claims from time to time relating to our seed quality. The defense of these proceedings and claims can be both costly and time consuming and may significantly divert efforts and resources of our management personnel. An adverse determination in any such proceeding could subject us to significant liability and damage our market reputation and prevent us from achieving increased sales and market share. Protracted litigation could also result in our customers or potential customers deferring or limiting their purchase of our products.
Our revenues depend on the ability of a large number of small farmers to buy seed for cash because financing for purchases of this size and type is not available; therefore, if a substantial number of our customers become unable to pay for seed, our sales, revenues and operating results will decline.
We have a large and diversified customer base, with no single customer representing more than 1.5% of our revenues. The large customer base provides some protection to us against a loss of revenues due to the inability of a significant number of our customers to pay for seed that has been previously ordered. The unavailability of credit for farmers in the PRC, however, reduces the ability of those farmers to withstand the effects of difficult economic times. The lack of credit could prevent farmers from fulfilling their purchasing commitments to us with the result that we may suffer a lower amount of recognized revenues or our revenues and results of operations may be reduced.
Fluctuations in commodity prices can increase our costs and decrease our sales.
We purchase the crop seed that we sell from our production growers at market prices and retain the seed in inventory until it is sold. These purchases constitute a significant portion of the manufacturing costs for our seeds. We use hedging strategies to mitigate the risk of short-term changes in these prices, but we are unable to avoid the risk of medium and long-term changes in the market and overall availability of our seeds due to weather and production vagaries associated with growing plants. Additionally, we cannot predict with certainty the overall national inventory of competing crop seeds held by our competitors, which amount of seeds will have an impact on market prices and alternative product for farmers to choose from. Accordingly, increases in commodity prices may negatively affect our cost of goods sold or cause us to increase seed prices, which could adversely affect our sales. Farmers’ incomes are also affected by commodity prices; as a result, commodity prices could have a negative effect on their ability to purchase our products.
Price increases for energy costs and raw materials could have a significant impact on our ability to sustain and grow earnings.
Our production and distribution processes consume significant amounts of energy and raw materials, especially in connection with the transportation of our products where the costs are subject to worldwide supply and demand and other factors beyond the control of the Company. Significant variations in the cost of energy, which primarily reflect market prices for oil and raw materials, may affect the Company’s operating results from period to period though this has not been a factor in the past. When possible, the Company purchases raw materials through negotiated long-term contracts to minimize the impact of price fluctuations. The Company has taken actions to offset the effects of higher energy and raw material costs through selling price increases, productivity improvements and cost reduction programs. Success in offsetting higher raw material costs with price increases is largely influenced by competitive and economic conditions and could vary significantly depending on the market served. If the Company is not able to fully offset the effects of higher energy and raw material costs, it could have a significant impact on the Company’s financial results.
| 14 | ||
|
|
There are difficulties in managing our storage system, which may result in damage to our seeds in storage and, thus, operating losses.
Seed storage entails significant risks, including difficulties in managing the temperature and humidity of storage condition, any failure of which may result in damage to our seeds in storage and, thus, an impairment of our inventory and possible operating losses.
We have limited business insurance coverage in China.
PRC insurance companies do not offer extensive business insurance products. As a result, we have very limited business liability insurance, business disruption insurance, or product liability coverage for our operations in China. We have determined that the difficulties associated with acquiring such insurance on commercially acceptable terms make it impractical for us to obtain such coverage. Most likely we would bear the effects of any business disruption, litigation or natural disaster resulting in our incurring substantial costs and the diversion of our resources, and could adversely affect our operations and financial condition.
We rely on producing farmers for the production of our crop seed products of which the vast majority has been operating with us for a long period of time. Although our relationship with those farmers has been stable in the past, there are no assurances that those relationships will remain stable in the future. Instability of this kind could limit the amount of seed products available to us for sale to customers and threaten customer loyalty.
We believe we maintain a favorable relationship with the farmers in our seed production network. In addition, the fact that we rely on a large number of farmers to produce crop seeds means that not one or even several farmers can, acting independently, adversely affect our business. However, events such as a shift in pricing caused by an increase in the value of commodity food crops other than seed crops, increase in land prices or competition could disrupt our chain of supply. Any of these disruptions could limit the supply of seeds that we obtain in any given year, adversely affecting supply and thereby lowering revenues in the subsequent marketing season. Such disruption could also damage our distributor relationships and farmer loyalty to us if we cannot supply the quantity of seed expected by them.
We rely on license and technical service agreements for some of our seed products, and there is no assurance that we will be able to renew these agreements to retain access to these products.
We have multiple license agreements for designated seed products in relation to exclusive production and marketing within China. Some of the seeds we market under these arrangements have been and may in the future represent significant products for our business. Therefore, if we are not able to continue our current agreements or enter into new agreements in the future, our product offerings may be limited and our revenues adversely impacted.
Agreements between our subsidiaries may not reflect terms that would have resulted from arm’s length negotiations among unaffiliated third parties.
Agreements between our subsidiaries that have been entered into, including the technical services agreements, by and among Beijing Origin, Changchun Origin, Henan Origin and Origin Biotechnology, may not reflect terms that would have resulted from arm’s-length negotiations among unaffiliated third parties. These agreements relate to, among other things, the transfer of intellectual property rights and the provision of technical research, production and distribution services.
If our rights to lease land from farmers were subject to a dispute, or if their legality or validity were challenged, our operations could be disrupted.
PRC law provides for the registration of land ownership and land-use rights and for the issuance of certificates evidencing land ownership or the right to use land. The administrative system for registration of land ownership and land-use rights, however, is not well-developed in rural areas where most of our crop seed production bases are located. As a result, we generally are not able to verify through the land registry system the ownership or land-use rights of the parties from whom we have leased land. Despite our efforts to obtain representations from the farmers that they own the land, possess land-use rights or have the right to sub-contract the land-use right on behalf of the holder of such rights, there is nevertheless a risk that they have not legally and validly granted the right to use the land to us. Moreover, there is a risk that farmers may, in breach of the terms of the applicable leases, enter into leases with other third parties in respect of land-use rights which they have previously granted to us, or that they have not entered into leases with third parties before entering into leases with us.
| 15 | ||
|
|
There is a risk that the legality or validity of our leases will be subject to dispute or challenge in the future. If our leases become subject to a dispute or challenge, our operations on such land, especially our research and development on crop breeding, could be suspended and we could lose our rights to use such land which could adversely affect our business, financial condition and results of operations.
The introduction of other animal feeds in the future may dramatically reduce the consumption of corn, which may affect our corn seed sales.
Currently, an important use of our corn seed product is as animal feed sold to farmers. The corn is either used as delivered or is mixed with other feed products and additives. Thus far, there has not been an animal feed product that can be substituted for corn, which provides the same benefits. However, in the event that other animal feed capable of supplying the same nutrients at similar or lower prices is introduced to the market, farmers may be incentivized to switch to that product partially or completely depending on the efficacy and economics. In that event, our corn seed sales may be adversely impacted, and given the predominant position of corn seed as a percentage of our total sales, our sales and financial positions could be adversely affected.
Normal operation of the Company may be disrupted due to improper handling of safety procedures in various facilities.
We engage in operating and processing activities with machinery equipment that can result in serious accidents. If our procedures are not effective, or if an accident occurs, we could be subject to liabilities arising out of personal injury or death, our operations could be interrupted and we might have to shut down or abandon affected facilities. In particular, our new Xinjiang processing facilities have commenced formal operation only recently. Workers may not be as familiar with the operation of the equipment and technicians may not be able to respond to emergencies as effectively and expeditiously as those in other established facilities, therefore increasing the likelihood of serious accidents occurring. Accidents could cause us to expend significant amounts of remediate safety issues or to repair damaged facilities.
Risks relating to our industry
The Chinese agricultural market is highly competitive and our growth and results of operations may be adversely affected if we are unable to compete effectively.
The agricultural market in China is highly fragmented, largely regional and competitive, and we expect competition to increase and intensify over time within the sector. We face significant competition in our crop seed business. Our competitors may have greater financial, research and development resources than us. Competition may also result from consolidation or other market forces within the crop seed industry in China, the privatized crop seed producers that were operated by the local governments in China, large state-owned seed companies, and potential participation of large state owned companies in the seed industry. Our competitors may be better able to take advantage of industry consolidation and acquisition opportunities than us. The reform and restructuring of the previously state-owned seed enterprises will likely lead to the reallocation of market share in the seed industry, and our competitors may increase their market share by participating in the restructuring of the state-owned seed companies. Privatization will likely mean that these producers will need to develop more efficient and commercially viable business models in order to survive. In addition, the PRC government currently restricts foreign ownership of any domestic seed development and production business to no more than 49%. When and if such restrictions are lifted, multinational corporations engaged in the seed business may expand into the agricultural market in China. These companies have significantly greater financial, technological and other resources than us and may become our major competitors in China. With the changing industry dynamics, we could face increasing competition from existing and new seed suppliers, and from time to time, market changes could alter the supply/demand balance significantly for each selling season. If competition intensifies, our margins may be compressed by more competitive pricing in the short term and may also be compressed in the long term, and we may lose our market share and experience a negative impact on our margins, revenues and results of operations.
| 16 | ||
|
|
China’s commitments to the World Trade Organization may intensify competition
.
In connection with its accession to the World Trade Organization, China made various commitments including opening its markets to foreign products, allowing foreign companies to conduct distribution businesses within China, and reducing customs duties. Although the impact of these commitments in our business segment has not been significant to date, foreign companies may begin to produce competing seeds, both non-genetically modified and genetically modified and ship their products or establish manufacturing facilities in China. Competition from foreign companies may reduce our current profit margins, and hence our business results may suffer.
Natural or man-made disasters could damage seed production, which would cause us to suffer production losses and material reduction of revenues.
We produce our seeds using a network of producing farmers who plant the crops and harvest the seeds for use as crop seeds for the next growing season. As a result, the source of supply for our seeds is subject to all of the risks associated with any agricultural enterprise, including natural disasters such as widespread drought, flood, snowstorm, pestilence and plant diseases, and man-made disasters such as environmental contamination. Other man-made incidents may damage our products, such as arson or other acts that may adversely affect our crop seed inventory in the winter storage season. Furthermore, natural or man-made disasters may cause farmers to migrate from the farmland, which would decrease the number of end users of our products. While our use of a large number of farmers provides some protection against a widespread failure of any particular crop, the majority of our seed production farmers are located in Gansu, Sichuan, Hunan, and Xinjiang provinces, making them subject to risks that are somewhat local in nature.
We primarily rely on arrangements with farmers to produce our crop seed products. If we were unable to continue these arrangements or enter into new arrangements with other farmers, our total land acreage devoted to crop seed production would decrease and our growth would be inhibited.
We have access to over 7,000 hectares of farmland in several provinces mainly through contractual arrangements with farmers for seed production. These production agreements to produce crop seeds are typically one year in duration, covering one growing season. In the event that prices for other crops increase, these farmers may decide to farm other crops in breach of our seed production agreements with them. If we were unable to find new village collectives willing to produce crop seeds for us, our business and results of operations would be materially and adversely affected. Any of these disruptions could materially and adversely affect our supply of crop seeds and our revenues. Such disruptions could also damage distributor relationships and farmer loyalty if we cannot supply them with the quantities and varieties of seeds that they expect.
Crop seed prices and sales volumes may decrease in any given year with a corresponding reduction in sales and margins and results of operations.
Although we follow a branded product strategy to differentiate our products from our competitors, the crop seed market continues to behave largely as a commodity market in China. There could be periods of instability in the future during which commodity prices and sales volumes may fluctuate greatly. Commodity prices can be affected by general economic conditions, weather, disease and aspects of demand such as financing, competition and trade restrictions. As a result, the price that we are able to demand for our seeds is somewhat dependent on the size of the supply of our seeds in relation to total market supply and demand. The amount of revenues that we receive in any given year is subject to change. Because production decisions are made prior to the time when order volume or market price is known, it is possible that we will have too much or not enough products available, each with the attendant impact on revenues, margins and results of operations.
| 17 | ||
|
|
Prices of crop seed products in China may fluctuate due to changes in supply and demand.
The profitability of our operations is affected directly by the selling prices of our products. We benchmark the prices of our crop seed products against the prevailing domestic market prices of crop seed products of similar quality and attributes. The price of crop seed products in China may fluctuate greatly depending on the market in any giving year. If the general prices for crop seed products were to decline at a faster rate than our cost of sales or to increase at a slower rate than our cost of sales, our profit margins will decrease and our ability to generate operating results at historical levels will be adversely affected.
Risks relating to our business organization and structure
Three of our PRC operating subsidiaries are controlled subsidiaries through stock consignment agreements rather than by direct ownership of shares, the terms of which may have to be enforced, which would require us to incur extra costs, create uncertainty as to ownership of the operating businesses involved and risk the possible loss of rights.
Under PRC law, foreign entities are not currently permitted to own more than 49% of a seed production company. In order to address those restrictions, Origin, a non-Chinese entity that cannot directly own the shares of our PRC operating subsidiaries, namely, Beijing Origin, Changchun Origin, and Henan Origin will instead hold the right to control such shares in all respects, including voting, dividends, nomination of directors, and corporate management, through stock consignment agreements executed by the owners of the stock of these companies. In addition, if we engage in the research, production and sale of genetically modified seed products, then foreign entities are not currently permitted to own any portion of the seed production company, therefore we have to carefully structure our company.
There is the risk, however, that a consigning shareholder will not fulfill its obligations under the stock consignment agreement. In that event, we may need to resort to the PRC courts to have our rights under the applicable agreement enforced. Such enforcement will cause us to incur legal expenses. In addition, while a case is pending there will be uncertainty regarding our rights as to the three PRC operating subsidiaries involved. A PRC court may decide not to enforce the agreements in whole or in part. To the extent these agreements are neither observed nor enforced as intended, the PRC operating subsidiaries will not be controlled by us as intended, which will affect our enterprise value and restrict our ability to obtain the income and other rights of ownership associated with the consigned stock. It may also prevent the consolidation of our financial statements with the PRC operating subsidiaries, which would reduce the reported earnings of the consolidated companies. The uncertainty of ownership may also adversely affect the market value of our ordinary shares.
Whether or not a stock consignment agreement is terminated depends on the consensus of our Board and the consignees. Any such termination could result in a possible loss of certain rights or assets held by us without receiving fair value in return.
The stock consignment agreements relating to our control of the stock of our PRC operating subsidiaries (not including Origin Biotechnology) may be terminated after three years upon mutual agreement between us and the consignees. Three of the PRC consignees, Messrs. Han, Yuan and Yang, also serve or have served, as our officers and/or directors. These three persons own, in the aggregate, 8,488,122 shares of our ordinary stock. Holding this amount of stock will allow these officers to control or greatly influence the selection of directors and matters submitted to a vote of our shareholders, including voting to terminate the stock consignment agreements.
There are corporate protections in place designed to protect our interests, such as an independent Board of Directors, an audit committee comprised of independent directors that must approve insider transactions, a code of conduct requiring fair dealing with the Company, and the British Virgin Islands statutory provision that a disposition of more than 50% of the assets of a company must be approved by a majority of the shareholders. Moreover, if consigned stock is transferred to us as provided in the stock consignment agreements when the restrictions under PRC law are lifted, that stock will no longer be subject to the stock consignment agreements, and the termination of the stock consignment agreements would then have no effect on the ownership of that stock. However, if the stock consignment agreements are terminated, then we would lose our rights with respect to the consigned stock and the profits from the issuing corporation. Such a loss would impair the value of the Company and would reduce our ability to generate revenues.
| 18 | ||
|
|
Our senior executive officer has entered into an employment agreement with us which provides that he may be entitled to certain rights upon a change of control.
Dr. Gengchan Han, our Chairman of the Board, Chief Executive Officer and President has entered into an employment agreement which provides that he may terminate his employment with us as a result of a change of control. A change of control includes if any person other than us and/or any of our officers or directors as of the date of the employment agreement acquires our securities other than from the executive or his affiliates (in one or more transactions), having 51% or more of the total voting power of all of our securities then outstanding. If the executive terminates his employment agreement due to a change of control, we must continue to pay the executive all his compensation and benefits pursuant to the terms of his employment agreement upon the earlier of two years from the date of termination or through the term of the employment agreement. The employment agreement has a term of three years commencing on January 1, 2012.
Risks relating to doing business in China
If we do not comply with PRC regulations, we may not be able to operate our business or we may be fined, both of which would adversely affect our business, operations and revenues.
The PRC has many regulations relating to the seed business, including obtaining and maintaining operating licenses and permits. Seed products must be licensed and undergo a stringent review process before they may be sold in the PRC. Environmental regulation in the future may be potentially concerned with the development, growing and use of GM seed products. We believe we currently have all the necessary licenses for our business, and that we are in compliance with applicable laws and regulations. If we are not in compliance, we may be fined or lose the ability to sell a particular seed or operate our business altogether. If the fines are substantial or if our ability to sell or operate is withdrawn, this will result in additional costs or the loss of revenues and could prevent us from continuing as an operating business.
If we do not comply with applicable government regulations, we may be prohibited from continuing some or all of our operations, resulting in a reduction of growth and ultimately market share due to loss of competitive position.
Continuation of our business revenues depends on receiving approval from the PRC government to market new seed hybrids that we are developing and will develop. In addition, there may be circumstances under which the governmental approvals granted are subject to change without substantial advance notice, and it is possible that we could fail to obtain the approvals needed to expand our business. The failure to obtain or to maintain such approvals would limit the number and quality of products that we would be able to offer. This reduction in product offerings would cause a reduction in the growth previously experienced and over time would result in the loss of market share from the competitive pressures of seeds developed by others that would likely be better than our products.
The technical services agreements between Origin Biotechnology and the other operating subsidiaries may be subject to scrutiny by the PRC tax authorities for transfer pricing adjustments.
We could face adverse tax consequences if the PRC tax authorities determine that our technical service agreements between Origin Biotechnology and the other PRC operating subsidiaries, namely, Beijing Origin, Changchun Origin, and Henan Origin, were not entered into based on arm’s length negotiations. If the PRC tax authorities determine that these agreements were not entered into on an arm’s length basis, they may adjust our income and expenses for PRC tax purposes in the form of a transfer pricing adjustment. A transfer pricing adjustment could result in a reduction, for PRC tax purposes, of deductions recorded by the three PRC operating subsidiaries, which could adversely affect us by:
|
|
•
|
increasing the PRC operating subsidiaries’ tax liability without reducing Origin Biotechnology’s tax liability, which could further result in late payment fees and other penalties to our PRC operating subsidiaries for under-paid taxes; or
|
|
|
•
|
limiting Origin Biotechnology’s ability to maintain preferential tax treatment and government financial incentives, which, if the transfer pricing adjustment is significant, could result in Origin Biotechnology failing to qualify for those preferential tax treatments and government financial incentives.
|
As a result, any transfer pricing adjustment could have an adverse impact on our financial condition.
| 19 | ||
|
|
Deficient railway transportation capacity in China, particularly in the Northwestern area, may result in the increase of our transportation-related costs and thus adversely affect our business
Our seed products are transported throughout China each year by railway, which we believe is currently the most cost-efficient method. Much of our production is in the Northwest region of China. We believe the Chinese rails system, and in particular the Northwest railway, may not be able to provide sufficient capacity over time, at reasonable rates. As our volume of freight increases year by year, the seed products may have to be transported by other means if the railway cannot guarantee to carry the increasingly larger volume of freight. We have in the past and may in the future experience higher rail rates or the higher transportation costs of trucking our products. In such event, the production costs will increase correspondingly with the increase in transportation costs, which may adversely affect our business.
Our business benefits from certain PRC government subsidies for the agricultural sector. Expiration of, or changes to, these incentives could have a material adverse effect on our operating results.
The PRC government has in recent years reduced taxes and increased subsidies and other support across the agricultural industry. For instance, the government subsidizes farmers for their seed purchases, and has increased spending on rural infrastructure. Sales of agricultural products from producers to intermediaries or to farmers are exempt from PRC Value-Added Tax (“VAT”). The discontinuance of preferential treatments granted by the Chinese government to the seed industry and farmers could adversely affect our earnings.
In addition, subsidy policies may have an adverse effect on our ability to market our products. Farmers can buy crop seeds designated as “high-quality” at subsidized prices, however, the designation of seeds as “high-quality” is at the discretion of the local government. It is possible that this policy could result in preferential treatment for local seed producers, with locally produced seeds being designated as “high-quality” while ours are not designated as such. If such preferential treatment were to occur, the price for our seeds to farmers in those provinces would be higher than the subsidized local seeds, and our sales in that province could suffer, which could adversely affect our results of operations.
The discontinuation of any of the preferential tax treatments currently available to our PRC subsidiaries could materially increase our tax liabilities.
Prior to January 1, 2008, under applicable PRC tax laws, companies established in China were generally subject to a state and local enterprise income tax, or EIT, at rates of 30% and 3%, respectively. In addition, an enterprise qualified as a “high and new technology enterprise,” including agricultural companies, located in certain specified high-tech zones was entitled to a preferential state EIT rate of 15% and could enjoy an exemption from the state EIT for the first three years since its establishment and a 50% reduction of the state EIT for the succeeding three years. The qualification of a “high and new technology enterprise” was subject to an annual or biennial evaluation by the relevant government authority in China. Beijing Origin is entitled to a preferential tax rate of 15% as a new technology company. Additionally, Beijing Origin has recently received the “breed-produce-distribute” integrated crop seed license and is currently applying for more favorable tax rate.
In 2007, the National People’s Congress, enacted the Enterprise Income Tax Law, or the New EIT Law, and in December 2007, the State Council promulgated the implementing rules of the EIT Law, both of which became effective on January 1, 2008. The EIT Law significantly curtails tax incentives granted to foreign-invested enterprises under the previous tax law. The EIT Law, however, (i) reduces the top rate of enterprise income tax to 25%, (ii) permits companies to continue to enjoy their existing tax incentives, subject to certain transitional phase-out rules, and (iii) introduces new tax incentives, subject to various qualification criteria. Under the phase-out rules, enterprises established before the promulgation date of the EIT Law and which were granted preferential EIT treatment under the then effective tax laws or regulations may continue to enjoy their tax holidays until their expiration and will gradually transition to the uniform 25% EIT rate over a five-year transition period. In addition, the new technology enterprise qualification of our PRC subsidiaries is subject to a biennial re-assessment by the relevant PRC government authority. In the event the preferential tax treatment for our PRC subsidiaries is discontinued, the affected entity will become subject to the standard PRC enterprise income tax rate. There is no assurance that the local tax authorities will not, in the future, change their position and discontinue any of our preferential tax treatments, potentially with retroactive effect. The discontinuation of any of our preferential tax treatments could materially increase our tax obligations, and our application for more favorable tax rate based on our “breed-produce-distribute” integrated crop seed license may not be approved.
| 20 | ||
|
|
Under China’s Enterprise Income Tax Law, we may be classified as a “resident enterprise” of China. Such classification could result in unfavorable tax consequences to us and our non-PRC shareholders
Under the current Enterprise Income Tax Law, or the New EIT Law, an enterprise established outside of China with “de facto management bodies” within China is considered a “resident enterprise,” meaning that it can be treated in a manner similar to a Chinese enterprise for enterprise income tax purposes. The implementing rules of the EIT Law define de facto management as “substantial and overall management and control over the production and operations, personnel, accounting, and properties” of the enterprise. However, it is unclear how tax authorities will determine tax residency based on the facts of each case. If the PRC tax authorities determine that our British Virgin Islands holding company is a “resident enterprise” for PRC enterprise income tax purposes, a number of unfavorable PRC tax consequences could follow. First, we may be subject to enterprise income tax at a rate of 25% on our worldwide taxable income as well as PRC enterprise income tax reporting obligations. Second, under the EIT Law and its implementing rules dividends paid to holding companies outside of China which are “resident enterprises will be subject to a 10% withholding tax. It is possible that future guidance issued with respect to the new “resident enterprise” classification could be applied to our British Virgin Islands sub-holding company with similar consequences. Therefore, any dividends paid by our PRC subsidiaries may be subject to a 10% withholding obligation.
In addition to the uncertainty in how the new “resident enterprise” classification could apply, it is also possible that the rules may change in the future, possibly with retroactive effect.
Adverse changes in political and economic policies of the PRC, including its policy of reforming its economic system, could have an adverse effect on the growth of private businesses in the PRC such as ours.
Since the late 1970’s, the PRC has been reforming its economic system and changing from a planned economy based on governmental dictates and priorities to one that uses market forces to influence deployment of economic resources, labor and capital and to determine business endeavors. We cannot predict whether or not the government will continue to encourage economic liberalization and further loosens its control over the economy and encourage private enterprise. We also cannot predict the timing or extent of future economic reforms that may be proposed. Any re-imposition of planned economy regulation or similar kinds of restrictions could reduce the freedom of private businesses to operate in a profitable manner, restrict inflows of capital or stifle investor willingness to participate in the PRC economy. To the extent we need additional capital; any restrictions on foreign ownership, foreign investment and repatriation of profits will hamper our ability to find capital outside of the PRC.
A return to profit repatriation controls may limit our ability to pay dividends and expand our business, and may reduce the attractiveness of investing in PRC business opportunities.
PRC law allows enterprises owned by foreign investors to remit to other countries their current account items, such as profits, dividends and bonuses earned in the PRC, and the remittance does not require prior approval by the State Administration of Foreign Exchange, or SAFE, upon the proper production of qualified commercial vouchers or legal documents as required by the regulations. However, dividend payments are subject to prior satisfaction of corporate and withholding tax obligations, corporate reserve requirements and board determined social benefit allocations. SAFE regulations generally require extensive documentation and reporting about other kinds of payments to be transmitted outside of China, some of which is burdensome and slows payments. If there is a return to payment restrictions and reporting, the ability of a PRC company to attract investors will be reduced.
Also, our investors may not be able to obtain the benefits of the profits of the business generated in the PRC for other reasons. Relevant PRC laws and regulations permit payment of dividends only from accumulated profits, if any, determined in accordance with PRC accounting standards and regulations. Each of our subsidiaries and our affiliated entities in China is required to set aside at least 10% of its after-tax profits each year, if any, to fund a statutory reserve until such reserve reaches 50% of its registered capital, and to further set aside a portion of its after-tax profits to fund the employee welfare fund at the discretion of the shareholders’ meeting or the board. These reserves are not distributable as cash dividends. In addition, the PRC tax authorities may require us to adjust our taxable income under the contractual arrangements we currently have in place in a manner that would materially and adversely affect our subsidiary’s ability to pay dividends and other distributions to us. Any limitation on the ability of our subsidiary and our affiliated entity to distribute dividends or other payments to us could materially limit our ability to grow, make investments or acquisitions that could be beneficial to our businesses or otherwise fund and conduct our business.
| 21 | ||
|
|
Pursuant to PRC enterprise income tax law, dividends payable by a foreign-invested enterprise, or FIE, including Origin Biotechnology, from sources in the PRC to its foreign investors are subject to a 10% withholding tax, unless any such foreign investor’s jurisdiction of incorporation has a tax treaty with China that provides for a different withholding arrangement. No such treaty currently exists with the British Virgin Islands. Prior to 2008, dividend payments to foreign investors made by FIEs were exempt from PRC withholding tax.
Any fluctuations in exchange rates may adversely affect your investment.
The value of the Renminbi against the U.S. dollar and other currencies may fluctuate and is affected by, among other things, changes in political and economic conditions. Because our earnings and cash from operations are denominated in Renminbi, as the reporting currency, fluctuations in exchange rates between U.S. dollars and Renminbi will affect our balance sheet and earnings per share when stated in U.S. dollars. The translation of Renminbi amounts into United States dollar amounts has been made for the convenience of the reader. Such translation amounts should not be construed as representations that the Renminbi amounts could be readily converted into United States dollar amounts at that rate or any other rate. The appreciation or depreciation in the value of the Renminbi relative to the U.S. dollar would affect our financial results when reported in U.S. dollar terms without giving effect to any underlying change in our business or results of operations. Fluctuations in the exchange rate will affect the relative value of any dividend we issue which will be exchanged into U.S. dollars, the value of any U.S. dollar denominated investments we make in the future and any earnings on such investments.
There are government regulations that limit or prohibit foreign investment in the PRC, which may restrict our growth.
Notwithstanding the general restriction on foreign investment in the seed industry in the PRC, our corporate structure currently enables us to receive foreign investment. Our continued ability to receive foreign investment may be important to our ability to continue to expand our business rapidly and to manage that expansion effectively. We cannot be certain that a change in the regulations allowing us to receive foreign investment will not occur. In the event of such a change, our plan to expand our business could be disrupted.
PRC regulations relating to offshore investment activities by PRC residents may increase the administrative burden we face and create regulatory uncertainties that could restrict our overseas and cross-border investment activity. Failure by our shareholders who are PRC residents to make any required applications and filings pursuant to such regulations may prevent us from being able to distribute profits, if any, and could expose us and our PRC resident shareholders to liability under PRC law.
SAFE promulgated regulations that require registration with local SAFE offices in connection with direct or indirect offshore investment by PRC residents, including PRC individual residents and PRC corporate entities. These regulations apply to our shareholders who are PRC residents and also apply to our prior and future offshore acquisitions. In particular, the SAFE regulations require PRC residents to file with competent SAFE offices information about offshore companies in which they have directly or indirectly invested and to make follow-up filings in connection with certain material transactions involving such offshore companies, such as increases or decreases in investment amount, transfers or exchanges of shares, mergers or divisions, long-term equity or debt investments, or external guarantees or other material events that do not involve return investment.
The SAFE regulations required prior registration of direct or indirect investments previously made by PRC residents in offshore companies. If a PRC resident with a direct or indirect stake in an offshore parent company fails to make the required SAFE registration, the PRC subsidiaries of such offshore parent company may be prohibited from making distributions of profit to the offshore parent and from paying the offshore parent proceeds from any reduction in capital, share transfer or liquidation in respect of the PRC subsidiaries. Further, failure to comply with various SAFE registration requirements described above could result in liability under PRC law for foreign exchange evasion.
| 22 | ||
|
|
We believe our major shareholders who are PRC residents, or whose shares are beneficially owned by PRC residents, have completed foreign exchange registration with the local foreign exchange bureau according to these SAFE regulations. However, with these regulations there is uncertainty concerning the reconciliation of the new regulations with other approval requirements, it is unclear how the regulations, and any future legislation concerning offshore or cross-border transactions, will be interpreted, amended and implemented by the relevant government authorities. We cannot assure you that all of our shareholders who are PRC residents will comply with our request to make or obtain any applicable registrations or approvals required by the regulations or other related legislation. The failure or inability of our PRC resident shareholders to receive any required approvals or make any required registrations may subject us to fines and legal sanctions, restrict our overseas or cross-border investment activities, limit our PRC subsidiary to make distributions or pay dividends or affect our ownership structure. As a result, our business operations and our ability to distribute a dividend to you could be adversely affected.
The PRC legal system has inherent uncertainties that could limit the legal protections available to you.
Nearly all of our assets and all of our operations are in the PRC. The PRC legal system is based on written statutes. Prior court decisions may be cited for reference but are not binding on subsequent cases and have limited precedential value. Since 1979, the PRC legislative bodies have promulgated laws and regulations dealing with such economic matters as foreign investment, corporate organization and governance, commerce, taxation and trade. However, because these laws and regulations are relatively new, and because of the limited volume of published decisions and their non-binding nature, the interpretation and enforcement of these laws and regulations involve uncertainties. The laws in the PRC differ from the laws in the United States and may afford less protection to our non-PRC shareholders.
You may experience difficulties in effecting service of legal process, enforcing foreign judgments or bringing original actions in the PRC based on United States judgments against us, our subsidiaries, officers and directors.
We are incorporated in the British Virgin Islands and our PRC operating subsidiaries are formed under PRC law. Substantially all of our assets are located in the PRC. In addition, most of our directors and executive officers reside within the PRC, and substantially all of the assets of these persons are located within the PRC. It may not be possible to affect service of process within the United States or elsewhere outside the PRC upon our directors, or executive officers and experts, including effecting service of process with respect to matters arising under United States federal securities laws or applicable state securities laws. The PRC does not have treaties providing for the reciprocal recognition and enforcement of judgments of courts with the United States and many other countries. As a result, recognition and enforcement in the PRC of judgments of a court in the United States or many other jurisdictions in relation to any matter, including securities laws, may be difficult or impossible. Furthermore, an original action may be brought in the PRC against our assets and our subsidiaries, our directors and executive officers and experts only if the actions are not required to be arbitrated by PRC law and only if the facts alleged in the complaint give rise to a cause of action under PRC law. In connection with any such original action, a PRC court may award civil liability, including monetary damages.
A reversion in the Chinese government’s policy of favoring state owned enterprise including seed companies at the expanse of privately owned companies may disadvantage our competitive position in the industry.
In China, state owned enterprises including state owned seed companies typically enjoy preferential policy treatments such as more favorable access to capital, tax breaks and subsidies at various levels of governments. These treatments have created barrier of entry protecting state companies at the expense of private ones, both domestic and international. Despite the reform of the Chinese seed industry in 2008 and the anticipated market-driven industry consolidation going forward, any reversion in the Chinese government’s policy to protect state owned seed companies may again pose competitive challenges to non-state owned companies such as Origin.
| 23 | ||
|
|
We may be subject to contingent tax liabilities.
On December 20, 2004, Chardan China Acquisition Corp., or Chardan, entered into a stock purchase agreement with State Harvest, and all the shareholders of State Harvest for Chardan’s acquisition of State Harvest. In connection with the acquisition, Chardan formed its wholly-owned subsidiary, Origin Agritech. On November 8, 2005, Chardan merged with and into Origin Agritech for the purpose of re-domestication out of the United States. The re-domestication merger was achieved by a one-for-one exchange of all the outstanding common stock of Chardan for ordinary common shares of Origin Agritech, and the assumption of all the rights and obligations of Chardan by Origin Agritech. Immediately after the re-domestication merger, Origin Agritech acquired all the common equity of State Harvest by the issuance of shares and payments of cash consideration to the shareholders of State Harvest or their designee. We may be subject to contingent tax liabilities in connection with the above share exchange transaction. As of September 30, 2013, such contingent tax liabilities could be within the range of RMB39.06 million to RMB64.22 million. We do not expect to incur tax liabilities at the high end of the range based on the annual assessment.
In 2009, we reviewed the contingent tax position. On September 23, 2010, the Company filed a revised 2005 tax return to the United States Internal Revenue Service, or IRS, to modify and supplement the previously filed tax return regarding this tax liability. The IRS has not responded to the tax filing as of the date of the filing of this report. While the timeline for the IRS to question on the tax return is generally three years, this matter may take a prolonged period of time to resolve depending on the return time for IRS and the necessity, if any, of future appeals or re-evaluation.
We may become a passive foreign investment company, which could result in adverse U.S. tax consequences to U.S. holders.
Depending upon the value of our shares and the composition of our assets and income over time, we could be classified as a passive foreign investment company, or PFIC, by the IRS, for U.S. federal income tax purposes. If we were classified as a PFIC in any taxable year in which you hold our shares and you are a U.S. investor, you would generally be taxed at higher ordinary income rates, rather than lower capital gain rates, when we dispose of those shares at a gain in a later year, even if we are not a PFIC in that year. In addition, a portion of the tax imposed on your gain would be increased by an interest charge. Moreover, if we were classified as a PFIC in any taxable year, you would not be able to benefit from any preferential tax rate with respect to any dividend distribution that you may receive from us in that year or any later year. Finally, you would also be subject to special U.S. tax reporting requirements.
Based on our understanding and current assessment, we believe that we were not a PFIC for the taxable year 2013. However, there can be no assurance that we will not be a PFIC for the taxable year and/or later taxable years, as PFIC status is re-tested each year and depends on the facts in such year. For example, we would be a PFIC for the taxable year 2013 if the sum of our average market capitalization, which is our share price multiplied by the total number of our outstanding shares, and our liabilities over that taxable year is not more than twice the value of our cash, cash equivalents, and other assets that produce, or are held for the production of, passive income. We could also be a PFIC for any taxable year if the gross income that we and our subsidiaries earn from passive investments is substantial in comparison with the gross income from our business operations. While we will continue to examine our PFIC status, we cannot assure you that we will not be a PFIC for any future taxable year.
Risks relating to our shares
Voting concentration by executive officers, directors and other of our affiliates may limit investors’ ability to influence the outcome of director elections and other matters requiring shareholder approval.
Two of our executive officer and/or directors, Messrs. Han and Yang, together own 5,620,807 our issued and outstanding ordinary shares. These two major shareholders may maintain significant control over the outcome of some corporate transactions or other matters submitted to our shareholders for approval, including the election of directors and the approval of other business transactions. This level of ownership could have the effect of delaying or preventing a change in our control or discouraging a potential acquirer from attempting to obtain control of us, which in turn could have an adverse effect on the market price of our ordinary shares or prevent shareholders from realizing a premium over the market price for their ordinary shares. In addition, if these major shareholders choose to dispose of a material portion of our ordinary shares they hold, the prevailing market price of our securities may decline.
| 24 | ||
|
|
Certain provisions in our organizational documents may discourage our acquisition by a third party, which could limit your opportunity to sell your shares at a premium.
Our memorandum and articles of association include provisions that could limit the ability of others to acquire control of us. Under those provisions, our board of directors has the power to issue preferred shares with such rights attaching to them as they decide and this power could be used in a manner that would delay, defer or prevent a change of control of us. These provisions could have the effect of depriving you of the opportunity to sell your shares at a premium over prevailing market prices by discouraging third parties from seeking to acquire control of us in a tender offer or similar transactions.
We qualify as a foreign private issuer and, as a result, are subject to reduced requirements with respect to the reporting of financial statements and other material events to our shareholders and the SEC.
As a foreign private issuer, we are obligated to file an Annual Report with audited financial statements and Form 6-K reports with the United States Securities and Exchange Commission, or the SEC, at such times as we release information to the public either voluntarily or pursuant to the laws of the British Virgin Islands or the PRC. Therefore, the regularity of financial and other information will be less than would be applicable to a domestic United States registered company under the rules and regulations of the SEC. Investors may not receive information on a timely basis, which could increase their risk of investment in us.
Because we are a foreign private issuer, we have elected to follow British Virgin Islands law in connection with compliance under the NASDAQ Marketplace Rules, which restrict the application of the NASDAQ corporate governance requirements.
The NASDAQ Marketplace Rules permit foreign private issuers to elect not to be governed by all the corporate governance rules. We have elected to avail ourselves of the exemption provided by NASDAQ, and we have elected to be governed by only the British Virgin Island laws and the terms of our memorandum and articles, which for example do not require us to hold an annual meeting each year. Consequently, investors may not have the ability to express their opinion on our business and the actions of directors through the voting process for directors. In other respects, we do follow the NASDAQ Marketplace Rules, such as having a nominations and compensation committee, but these are voluntary and may be eliminated at any time.
Leverage and debt service obligations may adversely affect our cash flows.
We currently have short-term borrowings of approximately RMB 222 million (US$36.02million) and long-term borrowings of RMB65 million (US$10.54 million). The degree to which we are leveraged could, among other things:
|
|
·
|
require us to dedicate a portion of our near term cash flows from operations and other capital resources to debt service;
|
|
|
·
|
make it difficult for us to obtain necessary financing in the future for working capital, acquisitions or other purposes on favorable terms, if at all;
|
|
|
·
|
make us more vulnerable to industry downturns and competitive pressures; and
|
|
|
·
|
limit our flexibility in planning for, or reacting to changes in, our business.
|
Our ability to meet our debt service obligations will depend upon our future performance, which will be subject to financial, business and other factors affecting our operations, many of which are beyond our control.
Future sales by us or our existing shareholders could depress the market price of our ordinary shares.
If we or our existing shareholders sell a large number of shares of our ordinary stock, or if we sell additional securities that are convertible into ordinary stock, the market price of our ordinary stock could decline significantly. Further, even the perception in the public market that we or our existing shareholders might sell shares of ordinary stock could depress the market price of our ordinary stock.
| 25 | ||
|
|
Our auditor, like other independent registered public accounting firms operating in China, is not permitted to be subject to inspection by Public Company Accounting Oversight Board, and as such, investors may be deprived of the benefits of such inspection.
The independent registered public accounting firm that issues the audit reports included in our annual reports filed with the SEC, as an auditor of companies that are traded publicly in the United States and a firm registered with the Public Company Accounting Oversight Board (United States), or PCAOB, is required by the laws of the United States to undergo regular inspections by PCAOB to assess its compliance with the laws of the United States and professional standards. Because our auditor is located in China, a jurisdiction where PCAOB is currently unable to conduct inspections without the approval of the PRC authorities, our auditor, like other independent registered public accounting firms operating in China, is currently not inspected by PCAOB. Inspections of other firms that PCAOB has conducted outside of China have identified deficiencies in those firms’ audit procedures and quality control procedures, which may be addressed as part of the inspection process to improve future audit quality. The inability of PCAOB to conduct inspections of independent registered public accounting firms operating in China makes it more difficult to evaluate the effectiveness of our auditor’s audit procedures or quality control procedures. As a result, investors may be deprived of the benefits of PCAOB inspections.
On May 24, 2013, the PCAOB announced that it has entered into a Memorandum of Understanding (“MOU”) on Enforcement Cooperation with the China Securities Regulatory Commission (the “CSRC”) and the Ministry of Finance (the “MOF”).
The MOU establishes a cooperative framework between the parties for the production and exchange of audit documents relevant to investigations in both countries’ respective jurisdictions. More specifically, it provides a mechanism for the parties to request and receive from each other assistance in obtaining documents and information in furtherance of their investigative duties.
In addition to developing an enforcement MOU, the PCAOB has been engaged in continuing discussions with the CSRC and MOF to permit joint inspections in China of audit firms that are registered with the PCAOB and audit Chinese companies that trade on U.S. exchanges.
A.
History and development of the Company
.
Origin was first incorporated in the British Virgin Islands on February 10, 2005, and is governed by the BVI Business Companies Act, 2004, or BCA, by re-registration on July 10, 2006.
Chardan China Acquisition Corp., the predecessor of Origin, was a blank check company organized as a corporation under the laws of the State of Delaware on December 5, 2003. Chardan was formed for the purpose of effecting a business combination with companies having operations based in China and significant growth potential. Initially, Chardan’s efforts were limited to organizational activities, completion of its initial public offering and the evaluation of possible business combination opportunities.
On December 20, 2004, Chardan entered into a stock purchase agreement, referred to as the Stock Purchase Agreement, with State Harvest, a company incorporated in the British Virgin Islands on October 6, 2004, and all the shareholders of State Harvest. On February 10, 2005, Chardan formed a wholly-owned subsidiary under the laws of the British Virgin Islands, under the name “Origin Agritech Limited” to effect a stock acquisition of State Harvest. Pursuant to the terms and conditions of the Stock Purchase Agreement, Chardan merged into Origin for the purpose of re-domestication out of the United States, and immediately thereafter, Origin acquired all of the issued and outstanding stock of State Harvest, which acquisition included three controlled affiliated operating companies, namely, Beijing Origin, Changchun Origin, and Henan Origin. These three controlled operating companies are organized under the laws of the PRC.
On December 5, 2005, Origin commenced redemption of outstanding callable warrants that had been assumed in the transaction with Chardan. The warrants were exercisable into ordinary shares of Origin at $5.00 per warrant. Approximately 8,043,752 of the 8,050,000 warrants were exercised through the redemption date of January 9, 2006, and the balance of the outstanding warrants was paid $0.01 per warrant and all the warrants were extinguished. The gross proceeds received upon exercise of the warrants were approximately $40 million, of which $15 million was used to satisfy the outstanding obligations of Origin to the shareholders of State Harvest under the Stock Purchase Agreement, and the remainder used as working capital and for other corporate purposes. After the redemption of the warrants, Origin had approximately 23,472,910 ordinary shares issued.
| 26 | ||
|
|
On June 26, 2007, our common shares began trading on the NASDAQ Global Select Market, where they continue to be traded. Prior to trading on that market, our common shares had been listed on the Nasdaq Global Market from November 8, 2005 to June 25, 2007.
As part of our efforts to expand our operations, we have made the following investments and acquisitions:
|
|
·
|
In January 2006, Beijing Origin and Jilin Jinong Hi-tech Limited jointly established Jilin Changrong, with Beijing Origin holding 34.77% of Jilin Changrong. In April 2007, Beijing Origin acquired an additional 9.18% equity interest in Jilin Changrong for RMB22.04 million.
In December 2009, Beijing Origin acquired an additional 10% stake in Jilin Changrong for RMB24.00 million bringing Beijing Origin’s total direct ownership to 53.95% and our combined direct and indirect ownership to 61.66%.
Jilin Changrong engages in the research, development, production, sale and distribution of hybrid corn in the northeast region of China; On July 4, 2011, Jilin Changrong was liquidated and now no longer exists as an entity. Origin will continue to hold 17.94% of the Jinong Hi-tech.
|
|
|
·
|
In January 2006, Beijing Origin acquired a 52.21% controlling interest in Denong. In October 2006, Beijing Origin acquired an additional 42.42% equity interest in Denong, and together with a 2.99% equity interest acquired in December 2006, with a 0.25% equity interest acquired in January 2010, with a 0.71% equity interest acquired in July 2012, Beijing Origin now has a total ownership of approximately 98.58%, for which it paid total consideration of approximately RMB94.76 million. Denong is a developer, producer and marketer of hybrid rice, corn and canola, principally in the southwest region of China.
|
|
|
·
|
In October 2006, Beijing Origin acquired a 19% interest in Biocentury, a company engaged in GM cotton research, seed production, and marketing in China, for RMB16.7 million.
After acquiring a 7% interest in 2004 and an 8% interest in 2005, Beijing Origin held 34% of Biocentury.
In May 2010, Beijing Origin divested its 34% interest in Biocentury, for RMB60.0 million.
|
|
|
·
|
In June 2010, Origin Biotechnology acquired an 80% interest in Shandong
Kunfeng, a company engaged in agricultural chemical production and marketing in China, for RMB14.96 million. In April 2012, Shandong Kunfeng completed its restructuring and terminated its chemical production and marketing business and became a wholly owned subsidiary.
|
|
|
·
|
In July 2011, Xinjiang Origin was established by Beijing Origin and Xinjiang Jinbo Seed ("Jinbo"), which is affiliated with the Fifth Agricultural Construction Division of the Xinjiang Production and Construction Corps (“XPCC 5
th
Division”). Beijing Origin holds a 51% ownership stake of the RMB100 million registered capital investment as of September 30, 2013. In September 2013, the 49% ownership of Xinjiang Origin was transferred from Jinbo to the State-owned Asset Management Company of XPCC 5
th
Division. Xinjiang Origin mainly engages in producing, processing, packaging, and selling high-quality seed products in China.
|
.
Our principal executive offices are located at No. 21 Sheng Ming Yuan Road, Changping District, Beijing 102206, China, and our telephone number is (86-10) 5890-7588.
From 2011 to date, our capital expenditures consisted primarily of construction and purchase of plant and equipment, which are located in the PRC and financed mainly by bank borrowing. The table below sets forth the amount of our capital expenditures for the periods shown:
|
For the year ended
September 30, |
|
For the year ended
September 30, |
|
For the year ended
September 30, |
|
For the year ended
September 30, |
|
|
2011
|
|
2012
|
|
2013
|
|
2013
|
|
|
RMB
|
|
RMB
|
|
RMB
|
|
USD
|
|
|
56.33 million
|
|
104.21 million
|
|
78.85 million
|
|
12.83 million
|
|
| 27 | ||
|
|
B.
Business overview
.
Overview
Origin Agritech Limited, along with its subsidiaries, is a leading agricultural biotechnology company serving China. We specialize in crop seed breeding, genetic improvement, and the production, processing, distribution of seeds as well as related technical services. Staffed by 607 employees (excluding Xinjiang Origin) as of September 30, 2013, Origin operates 10 breeding stations, 5 production and processing centers, and 4 marketing centers nationwide with sales centers located in key crop-planting regions.
We built China’s first in-house agricultural biotechnology research center in 2005 and have been leading the development of biotechnology among crop seed companies in China since then. In 2009, the Company’s phytase corn was the first transgenic corn to receive the Bio-Safety Certificate from China’s Ministry of Agriculture. Over many years of proprietary development and collaboration with leading research institutes, Origin has established a robust seed product and germplasm pipeline, including products with glyphosate tolerance and pest resistance (Bt) traits.
The Company’s main products include hybrid varieties of corn, rice and canola seeds, which represented 100% of our sales in fiscal year 2013. Hybrid corn seeds remain our strongest product line, generating 80% of our sales in fiscal year 2013, compared with 75% and 74% in fiscal year 2012 and 2011, respectively. In 2012 we completed corporate restructuring to discontinue our cotton seed and agricultural chemicals businesses. Our focus remains on the production of high-quality seed products, whether proprietary or licensed.
We employ 172 production personnel and maintain seed conditioning plants in 5 production centers nationwide. Our main production facilities are located in Gansu province and Xinjiang province. Our Xinjiang Origin facility started trial production in September 2012 and has successfully produced
approximately 8,000 metric tons of corn seed from 20,000 mu (unit of area equivalent to 0.164 of an acre) cornfield during the 2013 harvest season.
We believe that we are the leading, technology-focused crop seed company serving China. We have sought to broaden our usage and penetration of our latest plant breeding techniques, modern biotechnology, and innovative information and research management to develop and deliver high-yield seeds to the Chinese farming customer base. Our goal is to lead the industry by providing farmers with unique enabling technology and services, producing and protecting higher crop yields. Our activities include the specialization in the research and development, production, and sales and marketing of crop seeds (corn, rice, and canola) throughout the PRC. We have pursued genetically modified research. In November 2009, our genetically modified phytase corn received notification of the Bio-Safety Certificate from PRC’s Ministry of Agriculture.
This was the world’s first genetically modified phytase corn and also the first genetically modified corn seed product in China. We are also actively pursuing the approval of other GM seed products including glyphosate resistant corn and bacillus thuringiensis, or BT, Corn. Our focus remains in the production of high-quality seed products, whether proprietary or licensed..
During the last several years, we have continued to develop our established plant genetic engineering technology platforms, including transforming herbicide tolerance, insect resistance, nitrogen efficiency, and drought stress tolerance traits into corn inbred lines. Of note, we made significant strides in developing our exclusive insect resistance and phytase products, respectively. In November 2009, our genetically modified phytase corn received the Bio-Safety Certificate from PRC’S Ministry of Agriculture. We seek to utilize modern biotechnology in China more effectively and hope to further expand our product distribution beyond China in the future.
We plan to use China’s emerging technology base to take advantage of operations within China. In particular, from time to time we enter and further develop cooperative agreements with publicly funded research institutes in China. In exchange for providing funding to these institutes, we receive rights, which are frequently exclusive rights, to market any seeds developed by these institutes. When a seed is ready to be marketed, we negotiate with the institute to establish an arrangement by which we are permitted to sell the newly developed seeds in exchange for the payment of certain fees to the institute. We believe that these cooperative ventures allow us to access new products without expending substantial costs for our own research and development.
| 28 | ||
|
|
Our business model draws from existing and new technologies by utilizing both conventional breeding and advances in biotechnology. We aim to build upon our current hybrid base where we have accumulated parental seeds with advantageous traits optimized to local soil conditions. We have over 100 total products, both licensed and proprietary in the market. We began to develop our own proprietary hybrid seed varieties in 1998, and, as of September 2013, we had 35 proprietary corn seed products, 14 proprietary rice seed products
and 5 proprietary canola seed products that are in commercial production and distribution.
The following table illustrates the change in the number of seed varieties for corn, rice and canola seeds we sold over the past five years.
Varieties of Seed Products:
|
Year
|
|
Varieties of Seed Products
|
|
||||||||||
|
|
|
Corn
|
|
Rice
|
|
Canola
|
|
Total
|
|
||||
|
2009
|
|
|
46
|
|
|
53
|
|
|
7
|
|
|
106
|
|
|
2010
|
|
|
45
|
|
|
55
|
|
|
7
|
|
|
107
|
|
|
2011
|
|
|
45
|
|
|
57
|
|
|
11
|
|
|
113
|
|
|
2012
|
|
|
47
|
|
|
59
|
|
|
13
|
|
|
119
|
|
|
2013
|
|
|
57
|
|
|
36
|
|
|
12
|
|
|
105
|
|
The following table illustrates the total revenues for each of our seed varieties:
|
Year
|
|
Revenues*
|
|
|||||||
|
|
|
Corn
|
|
Rice
|
|
Canola
|
|
|||
|
|
|
RMB
|
|
RMB
|
|
RMB
|
|
|||
|
Year ended September 30, 2009
|
|
|
414,625,462
|
|
|
125,134,572
|
|
|
42,747,377
|
|
|
Year ended September 30, 2010
|
|
|
428,863,503
|
|
|
84,211,605
|
|
|
38,515,030
|
|
|
Year ended September 30, 2011
|
|
|
419,467,551
|
|
|
91,778,481
|
|
|
16,833,211
|
|
|
Year ended September 30, 2012
|
|
|
416,728,491
|
|
|
88,138,728
|
|
|
19,935,031
|
|
|
Year ended September 30, 2013
|
|
|
387,220,403
|
|
|
72,706,629
|
|
|
21,766,774
|
|
* Substantially all of our revenues are derived from sales in China.
Research and Development
Developments in the science of genetics have allowed seed producers to create entirely new species of plants, rather than merely new varieties of existing species. Compared with conventional varieties, the obvious advantages of these new species, known as GM varieties, are higher yield, better quality and increased disease-resistance and herbicide tolerance. Farmers plant GM varieties to save time and cost, while also reducing field labor. GM corn, soybean and cotton have been widely used in the United States and many other countries to guard against insect damage and to increase yield. Since receiving the Chinese government approval in 1997, cotton that has been genetically modified to guard against damage from borer insects is now widely planted and accepted in China. The Chinese market has widely accepted GM cotton and the PRC Ministry of Agriculture has approved GM corn and rice traits. We believe that GM food crop seeds will be approved by the PRC government for production and sale and will be accepted in the Chinese market over time.
Utilizing our existing hybrid seed product line, we seek to further increase crop yield and produce higher quality seeds with the addition of GM traits. We commenced our own biotechnology research program in 2000 with a goal of having technology in place to produce GM products when demand for these products is sufficiently high. In 2005, we built an internal research and development center in China for GM crop seeds, which we believe was the first such facility to be utilized by a Chinese crop seed company. Our key focus remains on biotechnology for GM varieties of corn, which has accelerated significantly. We currently employ people who are primarily engaged in genetic transformation, molecular biomarker testing and genetic mapping activities. Our development efforts go beyond our internal biotechnology center, as this unit serves as a central hub to connect with other research facilities throughout China. We are collaborating with the Chinese Academy of Sciences, Peking University and China Academy of Agriculture Science in the field of biotechnology. These co-operations help enhance our research capabilities and will help enable us to develop and commercialize our products. We have established several plant genetic engineering technology platforms, which incorporate increased herbicide tolerance, insect resistance, nitrogen efficiency, and drought stress tolerance traits into corn inbred lines. The GM traits and products we are working on now include increased herbicide tolerance, insect resistance, nitrogen efficiency, and drought stress tolerance in corn. We developed phytase GM corn, the first genetically modified corn seed product in China. Notwithstanding our obtaining the Bio-Safety Certificate from the Chinese government, there can be no assurance that GM products generally will be approved in China, and we expect that the introduction and acceptance of GM products will be cautious.
| 29 | ||
|
|
In addition to biotechnology, our internal research and development also invests considerable effort in the conventional breeding of hybrid crop seed and we currently have 10 breeding stations across the country. For our total research and development activities, we employed 126 full time research personnel in this area as of September 30, 2013.
In order to maintain our position as a quality producer of advanced products and develop new seed products through our biotechnology programs, we have targeted to invest approximate 8% of our revenue into research and development activities. The table below shows the amount and percentage of sales we have spent on research and development for the following periods.
|
For the year ended
|
|
|
For the year ended
|
|
|
For the year ended
|
|
|
For the year
|
|
||||
|
September 30,
|
|
|
September 30,
|
|
|
September 30,
|
|
|
ended September 30
|
|
||||
|
2010
|
|
|
2011
|
|
|
2012
|
|
|
2013
|
|
||||
|
RMB’000
|
38,355
|
|
|
RMB’000
|
44,771
|
|
|
RMB’000
|
37,629
|
|
|
RMB’000
|
42,162
|
|
|
(US$’000
|
5,724)
|
|
|
(US$’000
|
7,045)
|
|
|
(US$’000
|
5,934)
|
|
|
(US$’000
|
6,766)
|
|
|
% sales
|
6.56
|
%
|
|
|
7.89
|
%
|
|
|
6.82
|
%
|
|
|
8.75
|
%
|
The company has received government funding for research and development activities. Such funding was received in the fiscal years of 2011, 2012 and 2013 in the amounts of RMB nil, RMB 1.55 million and RMB 16.11 million respectively.
Seasonality
Because we are an agricultural seed production company, we experience several aspects of seasonality in our operations and revenues. The seasonal nature of our business causes our operating results to fluctuate from quarter to quarter.
The sales season of corn and rice seeds lasts from October to June; the sales season of canola seeds lasts from July to September. Historically, in the third to fourth quarters of our fiscal year, we face costs that are in excess of our cash flow sources. The advance payments we make to our seed producing farmers may exceed the amount of deposits we receive from our customers, the seed distributors and end users. The exact timing of these deposit payments is dependent on the Chinese lunar calendar, which varies from one calendar year to the next.
To mitigate the impact on cash flow, we customarily have relied upon short term bridge loans to cover our expenses pending receipt of the cash payments from farmers at the time of their seed purchases.
Commercial Production
We produce most of our hybrid seeds by contracting with local farmers in China to whom we provide parental seeds and technical support. Currently, we have 172 production personnel (excludes Xinjiang Origin)
and seed conditioning plants located in Gansu, Jilin, Henan, Sichuan as well as Beijing, with our main production facilities in Gansu province. We also started seed production in the new plant of Xinjiang Origin in Xinjiang province,
which will mainly produce, process, package, and sell high-quality hybrid corn seeds. The facilities of Xinjiang Origin, along with the seed production land of the Fifth Agricultural Construction Division, deploy modern technologies and full mechanization throughout the entire production process from land preparation and seeding to product packaging. The processing facility employs advanced corn husker system, which is one of the largest corn husker systems in the world. The production base uses modern drip irrigation systems and advanced farming equipment for corn seed production.
These production centers work to supply these parental seeds to our producer-farmers, who plant, grow and harvest the hybrid to produce seeds for us. This network of local farmers who produce our seeds is an important element of our strategy to produce an increasing number of products with consistent quality. We are the first Chinese seed company to obtain the ISO9001-2000 certification by the China Certification Center for Quality Mark. With a strict seed quality control system, we have sufficient processing capability and advanced equipment to allow us to operate efficiently and maintain a high quality of seed products. By employing these practices, we have achieved product quality on par with that of our foreign competitors and that is consistently well received by our customers.
| 30 | ||
|
|
According to the sales plan we develop for each year, before the growing season, we choose the planting area according to the trait of the seed variety, and enter into a seed booking production agreements with the local farmers. Under the agreement, we provide the producer-farmers with the parental seed, as well as the technical support in the course of farming. After the growing season, we purchase the seeds that meet our quality specifications from the farmers.
National Marketing and Distribution
We have our own sales organization consisting of 170 employees who oversee all aspects of our distribution and retail sale network and promote our sales within the distribution chain. In addition, these individuals provide high-level technical service to our end customers.
We have established a nationwide distribution network consisting of over 2,800 first-level direct distributors and over 80,000 second-level distributors and retailers, who receive our products through first level dealers. The retailers sell them to farmers who are our end consumers. This distribution network covers almost all the provinces and regions of the PRC and allows us to effectively distribute to approximately 200 million farms throughout China.
.
The terms of our distributor agreements provide for territorial exclusivity for a distributor on a designated product, usually on a county-wide basis. To enforce exclusivity and monitor product locations, we assign a code to each distributor and mark all packaging sent to the distributor with this code. Careful monitoring of territorial integrity and enforcement of contractual penalties, which may include termination of distribution rights and cancellation of discounts on prices, provides stability and profitability within the distribution network and aims to provide quality services and product availability. We enjoy a positive reputation with our distributors for our implementation and enforcement of this exclusive distribution system. Distributors buy our seeds at a wholesale price established by us and are required to make payments to us prior to delivery.
Distributors that place orders and make deposits on orders for sales to be made the following year at least two months prior to delivery are generally offered a discount. At the end of the annual sales season, we set a discounted final sales price. The discounted final sales price results from the fact that the PRC government sets the price for agricultural commodities after we have sold our seeds to distributors. Seed prices fluctuate with agricultural commodity prices. This correlation is particularly strong for seeds that can be consumed as food and grown as seeds, such as corn. For example, if the price for corn for consumption increases, the price for corn seeds will increase as well. Once the PRC government has set the price for agricultural commodities, we negotiate with distributors the final price for our seeds which reflects the price the distributors sold our seeds to farmers and includes any season discount we may offer to such distributors. If the final price is lower than the preliminary price previously offered by us, we will return the difference to our distributors. Although the final price could technically be higher than the preliminary price, we have never experienced such a result. As a result of our discount policy, we cannot set the final price of our seeds to distributors prior to the end of their selling season to farmers. Selling seasons vary among distributors from region to region and from year to year, and generally start in October and end in June of the following year for most of our products. We deliver our products and receive payments on a relatively predictable schedule. First, we request and generally receive a cash deposit, followed by a further pre-payment of the expected sales price. Then, we deliver products to our customers and receive confirmation of delivery. Finally, we set the final sales price of our delivered products to a customer based on the total volume of product delivered to that customer.
| 31 | ||
|
|
The specific terms of the distributor agreements vary depending on negotiations and the nature of the distributor and its prospective territory. There usually is an initial payment made by the distributors to the Company for the distribution right which is applied in whole or in part to future orders, depending upon compliance with the terms of the agreement. The agreement also delineates pricing adherence requirements and permissible discounting sales, territory, ordering and supply obligations, returns, market support and other regular business terms and dispute resolution provisions. No one distributor accounts for more than 1.5% of our sales.
On an annual basis, our sales team assists distributors in writing monthly sales plans. These sales plans are then submitted to us 30 days prior to the required seed delivery dates. Every year during the harvest season, we invite farmers and others in the seed distribution chain to attend production demonstrations in cooperation with local villages and seed distributors. At these demonstrations, our teams show their hybrid seeds, explain planting techniques, discuss industry best practices and disseminate promotional materials. These marketing and production demonstrations help create new demand, not only in each village where demonstrations are held, but also in nearby villages, for both the current season and for succeeding years.
Our technical service department has a 24-hour toll-free telephone number available for our producer-farmers and distributors, through which they can obtain solutions to specific technical problems. In addition, customers can report issues of seed piracy. If on-site help is required, we generally dispatch a technical assistant to arrive on location within 48 hours of a call. We also enlist the help of our distributors to provide help and advice to farmers. We believe that our focus on customer service and technical support have helped us to build brand identity and loyalty and have contributed to our total sales volume.
We publish a seasonal newspaper, “Technology and Service,” reaching up to thirty million farmers, which addresses technical issues, shares success stories and further promotes the Origin brand. Origin maintains a database of over 15,000,000 farmers to track buying habits and contact information.
Product and technical service brochures are provided throughout the distribution network and have proved to be a valuable tool in promoting the sale of our crop seed products and the recognition of the Origin brand. Our slogan, “When buying seed, quality is paramount — trust Origin,” appears on all promotional material, helping to build the brand in all the local markets.
Six years ago, three of our rice hybrids were approved to be sold in Vietnam. The approval process in Vietnam takes two years. We began exporting products across the border at the end of year 2007 in small quantities. As Vietnam shares a border with China, we are able to use standard transportation, such as trucks, and deliver our products to selected distributors though an agent. We are also currently exploring sales channels to other countries in Southeast Asia and the Middle East and we will continue to expand the market in Vietnam.
Intellectual Property
Our intellectual property includes trademarks and patents relating to our seed products. All of the intellectual property has been registered for IP protection in China (or is the subject of a pending application), and is used in connection with our seed products packaging, production and distribution. Although we do not require our distributors to pay any license fee for the seed products, the value of the intellectual property has been reflected in selling price directly. Our intellectual property is crucial to our business, and bears directly on our ability to generate revenues.
We currently have four Chinese patents registered with the State Intellectual Property Office (“SIPO”) of China. One of the patents relating to the method of producing hybrid corn seed is jointly owned by Henan Agriculture University and Beijing Origin.
Also, we have applied for six additional patents, and the applications have been accepted and are now being reviewed by SIPO.
In addition, we currently have thirty two Chinese trademarks registered with the Trademark Office of China’s State Administration for Industry and Commerce (“SAIC”), including one trademark owned by Origin Kunfeng. Also, we have applied for fifteen additional trademarks, and the applications have been accepted and are now being reviewed by the Trademark Office of China’s SAIC.
| 32 | ||
|
|
As of September 2013, we had 35 proprietary corn seed products, 14 proprietary rice seed products and 5 proprietary canola seed product that are in commercial production and distribution.
Licensed Seed Products
In addition to the development of our own proprietary seeds, we have licenses to distribute seeds developed by independent research and development institutions which have no commercialization ability or distribution channels of their own. Currently, we have licenses to distribute twenty two varieties of corn seed, twenty two varieties of rice seed and seven varieties of canola seed.
Under a typical license agreement, one of our PRC Operating Companies will obtain a license for a designated product for exclusive production and marketing within China. The license fees vary in their method of determination, but generally they are either a percentage of revenues from the sale of the variety or a flat fee arrangement. None of our license agreements results in a payment in excess of 1.5% of our revenues. Beijing Origin has these types of agreements with China Academy of Sciences Microbiology Institute, Shijiazhuang Liyu Technology Development Co., Ltd.(Liyu) in Hebei Province, Henan Puyang Agricultural Academy, Tieling Agricultural Academy, Liaoning Benxi Agricultural Academy, Sichuang Agricultural Academy, Corn Research Institution of Beijing Agricultural Forestry Academy, Huafeng Seed Limited, Liaocheng Huafeng Corn Breeding Research Institution, Food Corn Research Institution of Yunnan Agricultural Academy, Henan Agriculture University, Hubei Province Shiyan Agricultural Sciences Institute, China Rice Research Institution, among others. These agreements generally have no fixed term or termination date. The agreements may be terminated for breach by either party. We may terminate the agreements at any time, in effect, by not producing seeds there under, without penalty.
We have joint development agreements with Liyu under which we and Liyu are coordinating to develop several varieties of corn seeds. Under these development agreements, we have developed and produced seven varieties of corn seeds, which together have represented a substantial amount of sales in each fiscal year since 2005 as illustrated in the following chart for the three fiscal years ended September 30, 2011, 2012 and 2013:
|
Varieties of
Corn Seeds |
|
2011 Sales
|
|
|
2012 Sales
|
|
|
2013 Sales
|
|
|
LinAo1
|
|
4.41
|
%
|
|
3.71
|
%
|
|
3.31
|
%
|
|
AoYu 17
|
|
0.90
|
%
|
|
0.64
|
%
|
|
0.71
|
%
|
|
Liyu 16
|
|
16.81
|
%
|
|
22.07
|
%
|
|
29.81
|
%
|
|
Liyu 26
|
|
0.38
|
%
|
|
0.26
|
%
|
|
0.06
|
%
|
|
Liyu 35
|
|
12.81
|
%
|
|
17.15
|
%
|
|
13.07
|
%
|
|
Liyu 37
|
|
0.38
|
%
|
|
4.23
|
%
|
|
4.14
|
%
|
|
Total
|
|
35.69
|
%
|
|
48.06
|
%
|
|
50.10
|
%
|
We have exclusive rights to produce and market the seeds developed under the agreements until the agreements are terminated. Liyu has agreed that it will not develop any derivative hybrids from these seeds. Moreover, Liyu will pay the government fees to protect our exclusive rights. The agreement has no termination date, hence it continues until both parties jointly agree to terminate or either party breaches the agreement.
In addition to the exclusive license agreements set forth above, we also have non-exclusive license agreements. The non-exclusive license fees tend to be lower than the typical exclusive license fees. Those licensors that lack production ability or distribution channels of their own grant us the right to produce, distribute and propagate the covered variety of seeds, provide us with technical materials and instructions, supervise seed quality and evaluate growing areas. We are responsible for undertaking all the propagation costs and maintaining quality standards. So far, Beijing Origin has entered into these types of agreements with Henan Agriculture University for YuYu 22 and now Shijiazhuang Liyu Technology Development Co., Ltd. for Li Yu 37. The agreements may be terminated for breach by either party. We may terminate the agreements at any time by not producing seeds there under, without penalty.
| 33 | ||
|
|
With regards to the licensed GM varieties, we have entered into a strategic cooperation agreement with the China Academy of Agriculture Science, or CAAS, to work on biotechnology research and development. That agreement gives us the right to produce and sell the GM crop varieties that are developed in connection with this arrangement, subject to our obligation to reimburse certain of CAAS’ expenses.
Except what was discussed immediately above, no other licensed seed product represented more than 10% of our sales in the fiscal years ended September 30, 2011, 2012, and 2013. In addition, except as disclosed above, no one licensor is responsible for a seed product or group of seed products that represents more than 1.5% of our revenues during the same periods.
The Chinese Crop Seed Market
The Chinese agricultural sector is primarily made up of small, family-oriented farms. Increasingly, corn is becoming an important crop in China because it has a number of uses, including the use as livestock feed, source of industrial products and a source of fuel in the form of ethanol. In addition, rice is an important human food crop and canola is used to produce cooking oil.
The Chinese agricultural seed industry is fragmented, with the corn seed market in particular being served by approximately 5,000 small, local seed suppliers. Most of these seed companies were established in the 1960s and 1970s by local county governments to address Chinese central government agricultural initiatives. They were designed at the time to provide service and support to local farmers. These local seed providers usually sell varieties of agricultural seeds that have been grown in their respective locales for years.
Improved seed products have been generally available in China through large multinational suppliers, the largest being Pioneer Hi-Bred International, Inc., or Pioneer, Monsanto Company, or Monsanto, and Syngenta AG, or Syngenta, each of which established operations in China more than a decade ago. Their products, however, are limited to those developed through traditional plant and seed selection.
Our business strategy focuses on meeting the needs of small Chinese farmers and includes the following elements:
|
|
(i)
|
producing and distributing high-quality seed products, initially under third-party licenses and, over time, increasingly internally developed proprietary seeds, to deliver superior value to our distributor-customers and their farmer-customers;
|
|
|
(ii)
|
devising a process for obtaining regulatory approvals for new crop seeds (a Chinese legal requirement) that is efficient and effective;
|
|
|
(iii)
|
establishing a broad network of producer-farmers in several regions to participate in the seed development process and to produce approved crop seeds for commercial distribution;
|
|
|
(iv)
|
creating an effective distribution system using a relatively small network of primary distributors, only one in each county with exclusive territories, with which we can deal directly and efficiently which, in turn, develop their own secondary distribution network to reach out directly to the consumer- farmers. This distribution network is not only a means for securing and fulfilling orders, but acts as a conduit for our marketing and technical support activities;
|
|
|
(v)
|
relying on a number of marketing activities to retain existing customers and attract new ones. These marketing activities include:
|
|
|
-
|
a demonstration program that provides technical assistance to customers regarding the correct seed choice and proper cultivation methods;
|
|
|
-
|
a database of over 15 million customers that we use to keep repeat sales at a high level, an important component of revenue growth; and
|
|
|
(vi)
|
delivering service and technical support to customers throughout the growing season for its products. End-user customers can contact us through a dedicated call center that handles up to 1,000 calls per day. Field service representatives are dispatched within 48 hours of a customer’s request for help.
|
| 34 | ||
|
|
The average lifespan of a typical product in our industry is five to seven years. After this period, the product begins to lose potency and develops material genetic weaknesses that make the product significantly less attractive in the marketplace. New hybrids are approved every year and the speed at which technology changes is partially driven by the amount of high quality hybrids produced in the local region for the local seed type. One product may dominate a particular region for a three to five year time period, and then the dominance may shift depending on the available seeds for the local soil types.
Competition
We face competition at three primary levels, including large Chinese companies, small local seed companies, and large multinational hybrid and GM seed producers. Currently, we believe that we can compete effectively with each of these competitors and that we can continue to do so in the future. Each of these groups of competitors is discussed in turn below.
Larger Domestic Seed Companies.
While there are six seed companies that control approximately 25% of the corn seed market of China, we believe we may possess the most competitive technology base, including the capability to develop and commercialize genetically modified seeds. However, there is little public information in this regard, and as a result other companies’ internal research pipelines remain unclear. Much of the genetically-modified product research remains at the academic level. The majority of the largest crop seed companies have been in existence for considerably longer periods of time than we have, and though they have sophisticated breeding techniques, are somewhat entrenched in their ways. Some of these larger entities are evolved state owned enterprises and some stayed as state-owned entities. We compete within this group on the basis of our consistent product quality, brand identity, customer and technical support, enforcement of our intellectual property rights and a pipeline of proprietary products.
Smaller Local Seed Companies.
The local seed companies in China are the legacy of the centrally planned agricultural economy that was predominant in China until recently. Most of these were affiliated with county governments, which played a role in determining what crops would be grown and by whom. As was often the case with planned economies, these extensions of the bureaucracy had no profit motive, and no incentive to improve efficiencies, increase sales or innovate with new products. Market expansion was limited by the tight geographic boundaries within which they were designed to operate.
The majority of these local companies lack the scale and the resources to compete with us in a number of ways. They lack access to the improved, proprietary hybrids. For the most part they do not have effective marketing, advertising, technical support or customer service operations. The majority of our recent growth has come from acquiring customers from these operations. We believe that the existing trend will continue, and that eventually some of these smaller, local distributors can be integrated into our distribution network.
Multinational Seed Companies.
At the opposite end of the competitive spectrum from the local seed companies are the large multinational companies, including Pioneer, Monsanto and Syngenta. These companies present a formidable competitive threat because of their financial resources, the high quality of their seed products, and biotechnological capabilities. However, the unique aspects of the Chinese crop seed market, which distinguish it from the market in Western countries, have proven a significant hurdle for market success for these very large companies, even though they have come to the market through joint ventures formed with existing Chinese seed companies.
| 35 | ||
|
|
The principal difference between the Chinese and Western seed markets is that in China a large number of low volume sales are made to local farmers, while in the West, relatively few sales of very large volumes make up the majority of product sales. As a result, success in the Chinese seed market depends on marketing and distributing effectively to a very large number of small customers. Relatively few Chinese companies have achieved any degree of success in doing so, and the international competitors only have limited success after many years of trying and heavy investment.
These multinationals rely heavily on GM seed products in oversea markets. Our market research indicates that most of the superior products that the multinationals have to offer are genetically modified. GM seed products have only begun to be accepted in China, and the extent of this acceptance is not yet determinable. To date, phytase corn and Bt Rice are the only genetically modified major food crop seed products that have received approval for sale in China. The limited GM seed approval therefore currently limits their competitive advantage.
Should GM seed products become approved by the government on a larger scale and begin to gain broader acceptance in the market, as we expect they will in the future, the large biotech companies would become more serious competitors. However, they will also continue to face numerous obstacles in competing with us, including the significant lead time associated with obtaining approval of a new seed (usually at least six years) and the need to establish effective sales, marketing and distribution networks to manage the large volume of small purchases that is characteristic of the Chinese market.
Government Regulation
We operate our business mainly in China under a legal regime that consists, at the national level, of the State Council, which is the highest authority of the executive branch of the PRC central government, and several ministries and agencies under its leadership, including:
|
|
⋅
|
Ministry of Agriculture and its local authorities;
|
|
|
⋅
|
Ministry of Commerce and its local authorities;
|
|
|
⋅
|
State Administration of Foreign Exchange and its local authorities;
|
|
|
⋅
|
State Administration of Industry and Commence and its local authorities;
|
|
|
⋅
|
State Environmental Protection Administration; and
|
|
|
⋅
|
State Administration of Taxation, and the Local Taxation Bureau.
|
The following sets forth a summary of the significant regulations or requirements that affect our business activities in China and our shareholders’ right to receive dividends and other distributions from us.
Seed Law and Other Relevant Regulations
Participation in the crop seed business is a highly regulated activity in the PRC. In July 2000, China enacted its Seed Law, which became effective on December 1, 2000. The Seed Law was revised in August 2004. The Seed Law sets forth provisions concerning the development, government approval, production, and distribution of crop seeds. Various provinces have enacted regulations to implement the Seed Law. In September 2011, the Ministry of Agriculture published and implemented the Administrative Measures on Production and Business Operation Permission of Crop Seeds.
Under the Seed Law and the new adopted administrative measures, for a company to engage in the seed business, it must obtain two licenses. One is the production license, which is issued at the provincial level, entitling the holder to engage in seed production in that province. The production license specifies the types of seeds that may be produced, the location of the production of the seeds, and the term of the production license. The second is a license to distribute seeds. Generally, a distribution license is issued by the government at the county level or above. A seed company must obtain a provincial-level license to distribute major crop seeds in that province. In addition, a national level license is necessary for a seed company to distribute seeds nationwide. Among other standards, the amount of the licensee’s registered capital determines if the distribution license is issued at the national or local level and the new adopted administrative measures have increased the registered capital requirements significantly.
| 36 | ||
|
|
|
|
⋅
|
to obtain a national distribution license, the licensee must have a registered capital of at least RMB100 million. More importantly, the new adopted administrative measures now requires the licensee to meet various qualitative and quantitative measures to prove the capability of vertically integrated operations of crop seed breeding, established seed production base, and well-organized distribution and service system.
|
|
|
⋅
|
to obtain a provincial license to distribute hybrid seed varieties, the licensee must have a registered capital of at least RMB30 million; and
|
|
|
⋅
|
to obtain a provincial license to distribute non-hybrid seed varieties, the licensee must have a registered capital of at least RMB5 million.
|
A separate license is required to import and export seeds. To obtain this license, the applicant must have a minimum registered capital of RMB30 million.
In September 2012, the MOA issued the first group of Breed-Produce-Distribute Vertically-Integrated Crop Seed Distribution Licenses (BPDVI License) based on the new administrative measures. Beijing Origin was included as a licensee among the first 32 crop seed companies that received the BPDVI License.
In addition to the license(s) needed to engage in the seed production and distribution business, each seed must undergo a stringent regulatory review before it may be sold in China. A seed production company cannot receive a license to engage in seed production, regardless of the level of its registered capital, until it has secured rights to an approved seed product.
The testing of seeds for approval can be conducted at the provincial level or the national level. However, seeds that have been approved at the provincial level can only be distributed in the province in which the approval was issued. An approval at the national level means the approved seed can be distributed nationwide.
The procedure for provincial examination and approval requires the applicant to:
|
|
⋅
|
submit the application to the provincial variety authorization committee;
|
|
|
⋅
|
undergo two growing seasons of monitored growth in at least five different locations in the province. Seeds submitted for testing are planted together with control seeds, which is typically the most popular seed with farmers in the testing locations. Only seeds that have an increased yield of 8% or higher versus the control seeds and that rank in the top six among all seeds then being tested are cleared to proceed to the second year of testing, during which the results of the initial test season must be confirmed; and
|
|
|
⋅
|
go through one successful growing season of trial production, also in at least five different locations. If successful, a provincial examination certificate is granted and a public announcement is made.
|
The procedure for national examination and approval requires the applicant to:
|
|
⋅
|
submit the application to the national variety authorization committee;
|
|
|
⋅
|
complete two growing seasons of monitored production in at least five different locations. Only seeds that have 8% or higher yield compared to control seeds and that also rank in the top six among all seeds being tested in that cycle can proceed to the second year of testing; and
|
|
|
⋅
|
complete one successful growing season of trial production in at least five different locations.
|
Seeds developed outside of China must also follow the above procedures before they can be distributed in China.
The ability to process an application for approval is an important element of success, especially in view of the long timeframe associated with obtaining approval after the seed has been developed. Failures and delays in getting the approvals on a timely basis can seriously disrupt the planning that is critical to successful commercial production. A minimum of six years - three to obtain approval and three to develop the first crop of seed for commercial distribution - is required to bring a seed to the market after it has been developed. Because of our extensive network of seed-producing farmers, we have consistently been able to bring new products to the market within a short period of time. Other seed companies often take an additional season or more to bring an approved product to the market. This loss of an entire growing season can be a significant disadvantage for other companies.
| 37 | ||
|
|
Genetically Modified Organisms Safety Regulations
GM products continue to be controversial in China, and, to date, very few GM products have been approved. There are public concerns regarding the potential for adverse effects of GM products on human health. In May 2001, the State Council of China enacted the Agricultural Genetically Modified Organisms Safety Regulation. The Ministry of Agriculture enacted the Agricultural Genetically Modified Organisms Safety Assessment Approach which became effective in July 1996 and was revised in March 2002. These enactments set forth provisions concerning the classification, testing, safety evaluation and identification of GM crop seeds.
Considering the degree of risk faced by humans, animals, plants, micro-organisms and the ecological environment, agricultural genetically modified organisms are divided into the following four levels:
Safety level I: no danger;
Safety level II: low danger;
Safety level III: moderately dangerous;
Safety level IV: highly dangerous.
Agricultural genetically modified organisms testing generally goes through three stages including an intermediate test, environmental release and production test. When finished with the production test, a company can apply for the Safety Certificate of agricultural genetically modified organisms.
Due to the fact that we are engaged in the GM seed business in China, we must comply with the Seed Law as well as the GM regulations described above.
Foreign Ownership Restrictions
Currently, China restricts foreign ownership of businesses in the seed industry. A foreign invested enterprises, or FIE that is engaged in the breeding of new varieties, development, production, marketing, distribution and sale of food crop seeds is limited to 49% foreign ownership pursuant to the Regulation on the Approval and Registration of Foreign Investment Enterprises in Agricultural Seed Industry (effective on September 8, 1997) and
the Foreign Investment Industrial Guidance Catalogue (effective on December 1, 2007).
In addition to restrictions in the conventional seed business, China forbids FIEs from engaging in the development production and distribution of genetically modified corn seeds pursuant to the Foreign Investment Industrial Guidance Catalogue distributed by the Ministry of Commence of China in 2007. Furthermore, FIEs need to obtain government approvals to engage in the breeding of GM research and testing pursuant to the Agricultural Genetically Modified Organisms Safety Regulation.
Tax
Origin and State Harvest are both tax-exempted companies organized in the British Virgin Islands.
Our PRC Operating Company Subsidiaries are organized in the PRC and governed by PRC laws. PRC enterprise income tax, or EIT, is calculated based on taxable income determined under PRC accounting principles.
Under the New EIT law, effective January 1, 2008, FIEs and domestic companies are now subject to a uniform EIT rate of 25% and the tax exemption, reduction and preferential treatments which were applicable only to FIEs were ended. However, any enterprises established before the promulgation of the New EIT law in 2008 that were entitled to preferential tax treatments for a fixed period continued to be entitled to such preferential tax treatment until the expiration of those periods.
The applicable tax rate of the PRC New EIT to Beijing Origin is 15% since January 1, 2008, because Beijing Origin has been approved as new technology enterprises and enjoys the reduced New EIT rate of 15% while our other operating companies are subject to the New EIT at a uniform rate of 25%. The preferential treatments in EIT to Xinjiang Origin is 2 years of exemption and 3 years of half reduction (counting from the year the Company makes a profits, it can exempted from EIT in first two years and it should only pay for half of EIT from the third to fifth years). Xinjiang Origin recorded a profit in 2012 so entitled for the treatment.
Pursuant to the Provisional Regulation of China on Value Added Tax, or VAT, and their implementing rules, all entities and individuals that are engaged in the sale of goods, the provision of repairs and replacement services and the importation of goods in China are generally required to pay VAT at a rate of 17% of the gross sales proceeds received, less any deductible VAT already paid or borne by the taxpayer. Pursuant to the Notice of the Ministry of Finance and the State Taxation Administration on Exempting the Value Added Tax for Agricultural Material, self-produced agricultural products sold by agricultural producers shall be exempt from VAT. Pursuant to an approval document received from Beijing Haidian District State Tax Bureau, Beijing Origin has been entitled to exemption from VAT since August 1, 2001. Denong has also been exempted from VAT since January 1, 2006.
| 38 | ||
|
|
Dividend Distribution
Under PRC law, FIEs in China, including Origin Agritech may pay dividends only out of their accumulated profits, if any, determined in accordance with PRC accounting principles. In addition, FIEs in China are required to set aside at least 10% of their after-tax profit based on PRC accounting standards each year for their general reserves until the accumulative amount of such reserves reaches 50% of registered capital. These reserves are not distributable as cash dividends. The Board of Directors of a FIE has the discretion to allocate a portion of its after-tax profits to staff welfare and bonus funds, and expansion (development) funds which may not be distributed to equity owners except in the event of liquidation. The amount set aside as of September 30, 2012 and 2013 were RMB24,789 and RMB24,789 respectively. We are currently in compliance with all applicable PRC laws and regulations relating to our business.
C.
Organizational structure
.
Origin Agritech is a holding company with no operations of its own. We conduct our operations in China primarily through our PRC Operating Companies. The following diagram illustrates our current organizational structure:
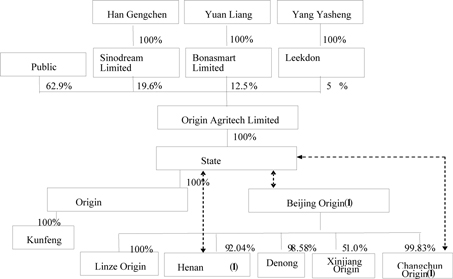
| (1) | We do not have any ownership interest in Beijing Origin, Henan Origin, Changchun Origin, Denong, Linze Origin and Xinjiang Origin. Through State Harvest, we have entered into a series of stock consignment agreements with their respective shareholders. Gengchen Han (our Chairman and Chief Executive Officer), Liang Yuan, and Yasheng Yang (Vice Chairman of the Board), currently own 34.4%, 25.8%, and 28.68% of Beijing Origin, respectively. |
| 39 | ||
|
|
The table below lists each of our group companies, their place of incorporation and their percentage of ownership interest:
|
|
|
Place of incorporation
|
|
Percentage
|
|
Name
|
|
(or establishment)/operation
|
|
of ownership
|
|
|
|
|
|
|
|
State Harvest
|
|
British Virgin Islands
|
|
100% owned by Origin
|
|
|
|
|
|
|
|
Origin Biotechnology
|
|
Haidian District, Beijing, PRC
|
|
100% owned by State Harvest
|
|
|
|
|
|
|
|
Beijing
Origin
|
|
Haidian District, Beijing, PRC
|
|
97.96% controlled by State Harvest
|
|
|
|
|
|
|
|
Henan
Origin
|
|
Zhengzhou
, Henan
Province, PRC
|
|
92.04% owned by Beijing Origin
|
|
|
|
|
|
|
|
Changchun
Origin
|
|
Changchun
, Jilin
Province, PRC
|
|
99.83% owned by Beijing Origin
|
|
|
|
|
|
|
|
Denong
|
|
Chengdu
, Sichuan
Province, PRC
|
|
98.58% owned by Beijing Origin
|
|
|
|
|
|
|
|
Linze Origin
|
|
Linze
, Gansu
Province, PRC
|
|
100% owned by Beijing Origin
|
|
|
|
|
|
|
|
Shandong
Kunfeng
|
|
Jinan
, Shandong
Province, PRC
|
|
100% owned by Beijing Biotechnology
|
|
|
|
|
|
|
|
Xinjiang Origin
|
|
Jinbo
City, Xinjiang Province, PRC
|
|
51% owned by Beijing Origin
|
Stock Consignment Agreements
As discussed above in “Foreign Ownership Restrictions,” under Chinese law, foreign ownership of businesses engaged in the breeding of new varieties, development, production, marketing, distribution and sale of hybrid food crop seeds is limited to 49% pursuant to the Regulation on the Approval and Registration of Foreign Investment Enterprises in Agricultural Seed Industry and The Foreign Investment Industrial Guidance Catalogue. State Harvest, as a non-Chinese corporation, may not directly own more than 49% of any of the PRC Operating Companies. However, Chinese law does not forbid the owner of stock to consign rights associated with the stock, as long as the owner does not transfer title to the stock. Moreover, if we engage in the research and development of genetically modified seed products, then foreign entities are not currently permitted to own any of the seed production company.
To gain control over the PRC Operating Companies (other than Origin Biotechnology, which is not subject to the 49% ownership restriction and which State Harvest entirely owns), State Harvest entered into a series of stock consignment agreements with shareholders of those companies or, in the case of Denong and Xinjiang Origin, with Beijing Origin, the parent of those entities. These agreements consign to State Harvest or Beijing Origin all of the rights of ownership of the shares involved other than legal title, effectively transferring the control of the shares subject to the agreements to State Harvest. Those rights include the right to manage in all respects the shares held in title by the shareholders that are parties to them, including all shareholder rights to call meetings of shareholders, to submit shareholder proposals, to elect directors, to vote the shares on all matters and to exercise all other rights of a shareholder in respect of the shares consigned. More specifically, the consignment agreements include giving the right to select, replace and increase the number of the directors and supervisors, recommend new directors and supervisory personnel and to exercise management rights, controlling rights and decision-making power over the shares of the subject company. Additionally, the shares of the PRC operating companies are pledged.
Each title holder of these shares has agreed not to interfere with State Harvest’s or Beijing Origin’s exercise of its rights and to cooperate fully and promptly to permit them to exercise its authority over the consigned shares. This includes all limitations on the ability of the consignee to transfer or dispose of the shares to someone other than to the consignee, give guarantees using the shares, consign the shares to another, alter the ownership proportion in any way, dispose of any rights in the ownership of the shares, and agree to any debt or restructuring of the shares. The consignee has the right to take all action in respect of the consigned shares to avoid any damage or infringement of its rights, including in the event of the consigning shareholder’s bankruptcy. The consignee, under the agreements, has virtually all of the property rights of the consigned shares, including the profits, interests, dividends, bonuses and residual assets, except for legal title. If in the future any stock subject to the consignment agreements can be legally transferred to State Harvest then, without further action by the consignee, it shall be transferred to the consignee in whole or in part for no additional consideration to the consigning shareholder.
| 40 | ||
|
|
The stock consignment agreements also provide that if and when the restriction on foreign ownership of food production companies to 49% is removed or the allowed ownership percentage is increased, the consigned shares will then be transferred to the consignee. If not, the consignment agreements continue in full force and govern the consignee’s rights over the shares.
The agreements are subject to force majeure limitations. The term of the agreements is initially three years, but they are automatically renewed indefinitely until both the consignee and the consignor agree to terminate. There is no unilateral right of termination except in the event of a breach, in which event the non-breaching party may cancel the consignment agreement after notice and a reasonable cure period has passed and the breach continues. The consigning shareholders have warranted their authority to enter into the agreements and that the consignee has the exclusive right to control the shares that are subject to the consignment agreements. The agreements are binding on the successors, assignors and heirs of the respective consigning shareholders.
The importance of the stock consignment agreements is that, under U.S. GAAP, the consignee corporation may consolidate the financial reporting of those PRC Operating Companies whose shares are subject to stock consignment agreements in the manner of wholly and majority owned subsidiaries and enjoy the economic benefits of such subsidiaries. Each stock consignment agreement is subject to enforceability and other limitations of the laws and rules of PRC. The consignee may not transfer the consignment agreement, except as permitted by PRC law. However, we may transfer our interest in the intermediate consignee corporation without limitation. If there is non-performance by the shareholder or some or all of an agreement is unenforceable, we and the consignee may lose the benefits of the agreements and suffer severe economic loss as a result. No assurance can be given that the consignee will be able to enforce its rights vis-à-vis the consigning shareholders in the courts of the PRC, and we are not aware of any cases where these types of stock consignment agreements have been interpreted by PRC courts.
We believe that these agreements are enforceable under current PRC law. However, none of these kinds of agreements have yet been subject to judicial review or interpretation. The consignment agreements provide that if there is any interpretation of the terms by a PRC court, the agreements should be construed in such a way as to give the consignee as much of the full and actual ownership and full beneficial rights and benefits of the consigned stock as is possible, so as to approximate full ownership under all applicable law.
In the event that the consignment agreement is not enforced or is terminated because of a breach by the consignee that is not cured, the right to the underlying stock would be lost and the economic rights would be terminated. However, such a termination would not terminate the separate agreements entered into by Beijing Origin, Henan Origin and Changchun Origin to transfer technology from those companies to Origin Biotechnology, so even in the event of a termination of a consignment agreement, the consignee would continue to own the applicable PRC entity’s technology and intellectual property through Origin Biotechnology, its wholly owned subsidiary (see “Technical Service Agreements” below). Also, the termination of one shareholder’s consignment agreement does not cause the termination of any of the other consignment agreements, so it would only result in a reduction in consigned shares under the consignee’s control.
The following is a table of the parties to the consignment agreements:
|
PRC Operating Company
|
|
Consigning Owner
|
|
% of Shares
Consigned |
|
|
|
Beijing Origin
|
|
Gengchen Han
|
|
34.4
|
%
|
|
|
|
|
Yasheng Yang
|
|
28.68
|
%
|
|
|
|
|
Liang Yuan
|
|
25.8
|
%
|
|
|
|
|
Yuping Zhao
|
|
3.99
|
%
|
|
|
|
|
Weidong Zhang
|
|
3.13
|
%
|
|
|
|
|
Weicheng Chen
|
|
1.96
|
%
|
|
|
|
|
|
|
97.96
|
%
|
|
|
Changchun Origin
|
|
Beijing Origin
|
|
99.0
|
%
|
|
|
|
|
Gengchen Han
|
|
1.0
|
%
|
|
|
|
|
|
|
100.0
|
%
|
|
|
Henan Origin
|
|
Beijing Origin
|
|
90.0
|
%
|
|
|
|
|
Yingli Zhang
|
|
4.08
|
%
|
|
|
|
|
Yasheng Yang
|
|
3.88
|
%
|
|
|
|
|
|
|
97.96
|
%
|
|
| 41 | ||
|
|
Technical Service Agreements
All of the intellectual property rights of Beijing Origin, Changchun Origin and Henan Origin have been transferred to Origin Biotechnology pursuant to technical service agreements with each of these respective entities dated December 25, 2004. The purpose of this arrangement was to permit better management and licensing of the intellectual property that the three assignors have developed. Under the technical service agreements, Origin Biotechnology will provide technical research and production and distribution services to Beijing Origin, Changchun Origin, and Henan Origin. These services include support in the research and development of agricultural seeds, analysis of breeding technologies, environment and feasibility suggestions, technical tutorials and breeding field supervision, market analysis and seed promotion, insect prevention and technical education to distributors and farmers. The fees payable under the agreements are variable, depending on differing formulae for different categories of seeds, and are to be charged on the sales of certain seed products in each fiscal year. These agreements are considered intra-company transactions.
D.
Property, plant and equipment
.
Our principal executive offices are located in the Changping District in Beijing where we own approximately 10,320 square meters of office space, and the right to use approximately 19,250 square meters of land. The land uses right, and the property, plant, and equipment of our headquarters in Beijing currently secures a loan of RMB 65 million. This loan was extended by
China Construction Bank
.
We own or lease manufacturing facilities, laboratories, seed production and other agricultural facilities, office space, warehouses, research stations and breeding centers in Gansu, Henan, Liaoning, Jilin, Inner Mongolia, Yunnan, Jiangsu, Shanxi, Sichuan, Hainan, Hubei, Anhui, Hunan, Jiangxi and Xinjiang provinces, and in the Tongzhou District of Beijing. These facilities include approximately
457
,000 square meters of land
, including
additional
200,000
square meters of land in
Bole
,
Xinjiang
P
rovince
,
and approximately
22
,
500
square meters of office. The leased facilities are rented at regular commercial rates, and management believes other facilities are available at competitive rates should it be required to change locations or add facilities.
We believe that our existing facilities are adequate to conduct our current and foreseeable future business operations.
Not Applicable
The following discussion of our financial results of operations and condition is based upon and should be read in conjunction with our consolidated financial statements and their related notes included in this Annual Report on Form 20-F. This report contains forward-looking statements within the meaning of Section 27A of the Securities Act of 1933 and Section 21E of the Securities Exchange Act of 1934, including, without limitation, statements regarding our expectations, beliefs, intentions or future strategies that are signified by the words “expect,” “anticipate,” “intend,” “believe,” or similar language. All forward-looking statements included in this Annual Report are based on information available to us on the date hereof, and we assume no obligation to update any such forward-looking statements. Actual results could differ materially from those projected in these forward-looking statements. In evaluating our business, you should carefully consider the information provided under the caption “Risk Factors” in this Annual Report on Form 20-F. We caution you that our businesses and financial performance are subject to substantial risks and uncertainties.
| 42 | ||
|
|
A.
Operating Results
.
Performance Overview
Fiscal year 2013 was the first year after the corporate-wide restructuring program carried out during fiscal year 2012, and as a result the Company’s financial performance has turned around significantly despite headwinds we faced in the seed industry and the impact of unfavorable weather in the Northeastern China region. Operating profit for fiscal year 2013 was RMB18.16 million (US$2.92 million), representing a significant turnaround from the operating loss of RMB3.47 million for fiscal year 2012. The turnaround of the operating profit was despite the fact that revenues declined 13% from RMB 552.11 million in the fiscal year 2012 to RMB481.69 million (US$77.30 million) in the fiscal year 2013.
Year-over-Year Comparison of Operating Performance
|
|
|
2013 (RMB million)
|
|
2012 (RMB million)
|
|
Year-over-Year Growth
|
|
|||
|
Revenues
|
|
|
481.69
|
|
|
552.11
|
|
|
(13)
|
%
|
|
Gross Profit
|
|
|
166.61
|
|
|
164.33
|
|
|
1
|
%
|
|
Operating Expense
|
|
|
148.45
|
|
|
167.80
|
|
|
(12)
|
%
|
|
Operating Profit (loss)
|
|
|
18.16
|
|
|
(3.47)
|
|
|
n/a
|
|
Revenue decline was mainly due to the discontinued cotton and agricultural chemical businesses and lower sales for the Company’s corn and rice seed businesses. Excluding the cotton and agricultural chemical businesses, revenues decreased by 8% from RMB 524.80 million to RMB 481.69 million (US$77.30 million), mainly due to a 5% lower of sales volume and 3% price decline. Increasing competition in the seed markets and unfavorable weather for our Northeast operations were among the headwinds we faced during fiscal year 2013. Industry competition increased as the inventory in the seed market in China has reached historically high levels before the 2013 planting season.
Overall Analysis
Total revenues for the fiscal year ended September 30, 2013 were RMB481.69 million (US$77.30 million), a decrease of 13% from RMB552.11 million during the fiscal year ended September 30, 2012. Overall, the year-over-year decrease in revenues was mainly due to the divestment of the cotton and pesticide businesses, and the drop in sales volume of corn and rice as a result of increasing competition in the crop seed market and unfavorable weather for our Northeast operations in fiscal year 2013.
Corn seed products remained our strongest product line, accounting for 80% of our overall sales. Total revenues from corn seeds were RMB387.60 million (US$62.20 million) in fiscal year 2013, compared with RMB416.73 million in the fiscal year ended September 2012. Revenues from rice product line for the year ended September 30, 2013 decreased by approximately 18% to RMB72.71 million (US$11.66 million) from RMB88.14 million in the fiscal year ended September 30, 2012. Sales of canola seeds increased by 9% to RMB21.77 million (US$3.49 million) in fiscal year 2013 compared to RMB19.94 million in fiscal year 2012. With the divestment of the cotton and pesticide businesses in fiscal year 2012, the revenue from those businesses was nil for the fiscal year 2013 from RMB27.09 million in the year ended September 2012.
Operating expenses for the fiscal year ended September 30, 2013 were RMB148.45 million (US$ 23.82 million), representing a decrease of 12% from RMB167.80 million in the fiscal year 2012, which was mainly because our expense control efforts helped to lower the operating expenses despite the increase in doubtful receivables allowance and shipping expenses.
Operating income for the fiscal year ended September 30, 2013 was RMB18.16 million (US$2.92 million), compared to the operating loss of RMB3.47 million for the fiscal year ended September 30, 2012. The increase in operating results was mainly due to our improvement in gross profit and expenses control effort.
Net income for the fiscal year ended September 30, 2013 was RMB7.49 million (US$1.20 million), representing a significant improvement from the net loss of RMB1.43 million for the fiscal year ended September 30, 2012. The year-over-year improvement was mainly due to the improvement in operating performance of the core businesses and rigorous expense management.
| 43 | ||
|
|
Net income per share was RMB0.32 or US$0.05 for the fiscal year 2013, compared with net loss of RMB(0.06) in fiscal year 2012.
As of September 30, 2012 and 2013, we had approximately RMB152.79 million and RMB131.98 million (US$21.47 million), respectively, in cash and cash equivalents. Total borrowings as of September 30, 2012 and 2013 were RMB 74 million and RMB 286.32 million (US$46.57 million), respectively. During fiscal year 2013, Net cash used in operating activities was RMB 146.11 million (US$23.77 million), down from cash inflow of RMB82.71 million for the fiscal year ended September 30, 2012, as inventory balance increased significantly year-over-year. Net cash used in investing activities was RMB68.28 million (US$11.10 million) for the fiscal year ended September 30, 2013 compared with RMB143.38 million for the fiscal year ended September 30, 2012.
Net cash provided by financing activities was RMB191.69 million (US$31.18 million) for the fiscal year ended September 30, 2013 compared with RMB83.40 million for the fiscal year ended September 30, 2012. The increase in borrowing was mainly related to the operations of Beijing and Linze Origin, which had RMB205.00 million (US$33.34 million) bank loan for settlement of seed purchases and RMB69.02 (US$11.22 million) for new corn seed processing plant construction in Xinjiang.
Research and Development Activities
Origin was built on its strong R&D platform and we strongly believe a commitment to R&D is essential to the growth of the Company. During fiscal year 2013, we continue to make significant progress both in our conventional hybrid crop seed development programs and biotechnology R&D activities.
Key developments for Origin’s GM corn seeds:
Phytase: Four commercial hybrids with phytase traits have completed the variety production test and are pending the variety approval from the Chinese government.
Glyphosate Tolerance: One GM glyphosate tolerance event (the unique DNA recombination event that took place in one plant cell) passed Phase 4 – Production Test and is waiting for the Phase 5 Safety Certificate. Two more glyphosate tolerance events are being submitted for Phase 3 - Environment Release Test. In addition, more than one thousand events are undergoing Phase 1 - Laboratory Research;
Bacillus Thuringiensis (Bt): Two insect tolerant events are going through Phase 2 - Intermediate Test. Over two hundred events are undergoing Phase 1 - Laboratory Research;
Glyphosate + Bacillus Thuringiensis (Bt): Three events of the Company’s glyphosate and insect tolerant traits have advanced into Phase 3 – Environment Release Test. More than 4,500 events of the stacked traits (inserting more than one gene in a seed via biotechnology) are being screened in Phase 1 - Laboratory Research.
Hybrid Corn Seed Development Program:
In addition to GM crop seeds, Origin has a large R&D program developing conventional hybrid crop seeds. In China, new hybrid seed varieties need to go through an official approval process prior to sales. This approval process typically involves three to four years of registration trials and normally proceeds according to the following sequential steps:
Pre-Registration —> Registration Trial 1 —> Registration Trial 2 —> Field Demo —> Approval
Each step leading up to Approval takes approximately one year unless it needs to be repeated. In some localities Registration Trial 2 and Field Demo are treated as one and the same step.
During fiscal year 2013, we have more than 45 tests going through different stages of the approval process. As the results of multiyear testing, we received registration approval for seven of our new varieties.
| 44 | ||
|
|
Research and Development Outlook
With the continued growth of the Chinese economy, demand for higher levels of food production and agricultural products have increased substantially. This demand is being driven by consumer demand for high-quality food products, increasing usage of agricultural products as bio-fuels, and dwindling arable land. The Chinese central government has taken a series of measures to deal with these issues. One of the approaches has been the approval of GM plant varieties. Compared with conventional varieties, the advantages of GM varieties include higher yield, higher quality and increased disease and weed resistance. Farmers plant GM varieties to save time and cost, while reducing the amount of field work. GM corn, soybean, and cotton have been widely used in the United States and in many other developed countries to guard against insect damage and to increase crop yields. A 10% to 15% increase in crop yields with the successful application of biotechnology has been routinely reported by Monsanto and Syngenta. According to the U.S. Department of Agriculture, the planted area for GM corn increased from 160,000 hectares in 1996 to almost 20 million hectares in 2006 in the United States. Since receiving approval from the Chinese government, cotton has been genetically modified to guard against damage from insects, such as the borer, and these varieties are now widely planted throughout China. GM cotton is widely accepted in the Chinese market. The Chinese authorities have taken preliminary steps in approving GM crop seed research and commercialization to meet the increasing demand for agricultural food products, as evidenced by the approval of our phytase corn and BT rice seed. We expect the Chinese authorities to continue in this direction, albeit with caution.
In the past several years, our focus on biotechnology research has continued to accelerate significantly. We initially were approved for the first GM corn seed crop in China. Our glyphosate-tolerant gene has been approved to advance to the next phase of development. We seek to become the leader in biotechnology and GM product commercialization in China. We expect that GM crop seeds will eventually gain wide acceptance in China and for this reason we have begun biotechnology seed development and invested in genetic modification programs that focus on improving yields, product quality, and insect resistance and disease tolerance for corn seeds and other crop seeds. The development of these biotechnology attributes remains a cornerstone of our business strategy. As a result, a significant proportion of our management resources are dedicated to building these capabilities across the firm for the introduction into the PRC domestic crop seed market.
During the past few years, we have established several plant genetic engineering technology platforms. These include introducing traits such as herbicide tolerance, insect resistance, nitrogen efficiency, and drought stress tolerance into inbred corn lines. We seek to efficiently utilize modern biotechnology in China and aim to expand beyond China in the future.
Currently, we possess exclusive rights to five genetic traits in various stages of testing and development. We have continued to build our technology platform based upon cooperative relationships with top universities and research institutes in China. These cooperative arrangements allow us to limit our own risk exposure and fixed cost structure and maximize our flexibility in developing applicable technology.
Under government regulations, a registrant company must follow the following procedures prior to registration and marketing GM crops in China. Each step (except laboratory research) has an associated reporting and approval process established by the Ministry of Agriculture, the clearance of which is necessary in order to proceed:
|
1.
|
Laboratory Research: defined by genetic manipulations and research work conducted under a control system within laboratory
|
|
2.
|
Intermediate Testing Phase: a small-scale test conducted under a regulated control system
|
|
3.
|
Environmental Release Test: a medium-scale test conducted under natural condition by taking relatively secure measures
|
|
4.
|
Production Test: a relatively large-scale test before production and application
|
|
5.
|
Obtaining the safety certificate on genetically modified organisms
|
Since we are considered a domestic company, we can proceed through all five phases of the GM approval in China, while international entities are restricted to only phrase one, and currently forbidden to proceed to phases two through five. We have already had several of our products submitted to testing in phases two through four, and one product has completed the five-step process. We are the first company to obtain approval to produce and sell GM corn seeds in China.
| 45 | ||
|
|
If GM seed products were to be approved by the government on a broader scale and begin to gain widespread acceptance in the market, which we expect will occur in the future, large international biotech companies could likely become more serious competitors. However, they may continue to face numerous obstacles in competing with us in China. Foreign companies are currently prohibited from developing or producing genetically modified plant seeds, breeding livestock and poultry, or producing aquatic seed according to
Catalog Guiding Foreign Investment Industries
(distributed by Ministry of Commence of China). As a result, we believe we will continue to be in a strong competitive position in the genetically modified segment of the seed market when it becomes meaningful and legally permissible to do so.
As part of our internal efforts, we developed genetic markers to enhance the selection of disease resistance corn lines to accelerate the breeding process. In addition, we continued to utilize our previously implemented data mining infrastructure to search for stable and high-yielding hybrids. Our business model draws from existing and new technologies using both conventional breeding and advancement in biotechnology. We aim to build upon our current hybrid base where we have accumulated parental seeds with advantageous traits optimized to local soil conditions. We have a total of approximately 125 products in the market, including both licensed and proprietary products. We began to develop our own proprietary hybrid seed varieties in 1998. As of September 2013, we had 35 proprietary corn seed products, 14 proprietary rice seed products and 5 proprietary canola seed product that were in commercial production and distribution.
Our accomplishments with hybrid crop seeds provide a foundation to launch into a range of GM products. Our agronomists and technical support provide a platform for us to educate farmers on the benefits of GM products. Our accumulated germplasm from conventional breeding techniques forms a basis to transform our genetic traits. Our high-end processing, production, and quality control will continue to ensure high-quality seed production. Our nationwide footprint and comprehensive data mining infrastructure allow for the matching of products with their most appropriate locations throughout China.
Key factors affecting our growth, operating results and financial condition
We expect our future growth, operating results and financial condition to be driven and affected by a number of factors and trends including but not limited to:
|
•
|
our ability to strategically manage our growth and expansion, organically or through mergers and acquisitions. If we do not manage our growth effectively, our growth may slow down and we may not be able to achieve or maintain profitability;
|
|
|
|
|
•
|
our ability to fit acquisitions into our growth strategies to generate sufficient value to justify their cost;
|
|
•
|
our ability to develop new products through research and development;
|
|
||
|
•
|
our ability to evaluate our business lines and take action to discontinue aspects of our business as well as to take cost savings measures for the future growth of the company;
|
|
||
|
•
|
our ability to partner or joint venture for the creation of more advanced bio-technology products;
|
|||
|
•
|
market fluctuations in the demand for and supply of crop seeds in China and our ability to anticipate market demand and adjust our volume and product mix to maximize revenues and maintain sufficiently high margins to achieve and maintain profitability;
|
|
•
|
our ability to continue to license or acquire crop seeds from third party developers and our ability to develop proprietary crop seeds;
|
|
•
|
our ability to continue to effectively market and distribute our core products through active agronomic assistance;
|
|
•
|
future consolidations in the crop seed industry in China that may give rise to new or strengthened competitors;
|
| 46 | ||
|
|
|
•
|
the possibility that the crop seed industry in China may favor genetically modified seeds over hybrid seeds, and our ability to develop, produce, market, and sell such products;
|
|
•
|
the possibility of major natural disasters in China, which may have an adverse impact on our business and results of operation, as there is currently no agriculture insurance available in China against natural disasters;
|
|
•
|
the Chinese government’s continuing support for the growth and development of the agriculture sector;
|
|
•
|
the impact of regulation affecting our industry;
|
|
•
|
our benefits from certain government incentives including tax incentives, the expiration of which, or changes to which, could have an adverse effect on our operating results;
|
|
•
|
the possibility that excess supply of one or more of our products in our markets may drive down prices and reduce our margins, especially if we are unable to sufficiently differentiate our products from those of our competitors thereby enabling us to charge higher prices; and
|
|
•
|
our ability to correctly estimate growers’ future needs, and match our product varieties and production levels to meet those needs.
|
Revenues
The most significant factor that affects our sale of crop seeds in China is the demand for and supply of crop seeds in China. As a result, the price we are able to set for our seeds is mainly dependent on the aggregate supply of crop seeds from us and our competitors in relation to crop seed demand in any growing season. Any potential fluctuation in the demand and supply of seeds in China may cause significant volatility in the pricing of crop seeds in China and, as a consequence, in our operating results and financial condition. In addition, because decisions relating to our production volume are made before we know the volume of seed orders and the market price for such orders, we face the risk of either over-supplying the market or under-supplying the market, which could materially and adversely affect our revenues, operating results and ability to achieve or maintain profitability.
Deferred revenues
Because of our revenues recognition policy, we sometimes carry sizeable deferred revenues on our balance sheet. These deferred revenues reflect the value of our canola seeds delivered after evidence of a sale arrangement is confirmed, delivery to the customer is made and full pre-payment from the customer is received, but before the final sales price is fixed and determined. This aspect of our revenues recognition policy does not have a significant effect when deferred revenues in the periods being compared maintain approximately the same proportion to overall sales. However, when the proportion of our sales classified as deferred revenues varies significantly from year to year, as sometimes occurs, our revenues and earnings as reported in our financial statements may not accurately reflect our operating activities.
Cost of revenues
Our cost of revenues consists of expenses directly related to our crop seed sales. These expenses are primarily made up of the purchase prices for seeds, depreciation and amortization, shipping and handling costs, salary and compensation, license fees, supplies, and write-down of inventories.
Purchase price for seeds
. The purchase price for seeds consists of the price we pay to farmers for the seeds they grow for us. The purchase price for seeds is the largest component of our cost of revenues and is likely to be the most variable element of our cost of revenues.
| 47 | ||
|
|
Depreciation and amortization
. Depreciation consists of depreciation of property, plant and equipment. Amortization consists of amortization of our seed license fees.
Shipping and handling
. Shipping and handling costs include costs associated with product delivery and handling costs related to transportation of goods from suppliers to factories and from factories to factories.
Salary and compensation
. Salary and compensation expenses include wages, bonuses and other benefits, including welfare benefits. Salary and compensation included in our cost of revenues related to our production personnel. We expect that our salary and compensation expenses will increase in the future in conjunction with our intended growth.
License fees.
License fees consist of royalty fees paid to independent research and development institutions.
Supplies
. Supplies consist of items needed for production and packing costs for the seeds we produce.
Write-down of Inventories.
Any excess of the cost over the net realizable value of the inventories is recognized as a provision for diminution in the value of inventories. Net realizable value is the estimated selling price in the normal course of business less the estimated costs to completion and the estimated expenses and related taxes necessary to make the sale.
Operating expenses, net
Our operating expenses, net consist of general and administrative expenses, research and development expenses, selling and marketing expenses and other income, net. Our operating expenses, net declined for the fiscal year ended September 30, 2013 compared to fiscal year 2012, mainly due to the cost control efforts and the divestment of the cotton and pesticide businesses.
General and administrative expenses
. General and administrative expenses primarily consist of salary and compensation, depreciation and amortization, legal fees, professional expenses and other expenses, including travel and other general business expenses and office supplies.
Research and development expenses
. Our research and development expenses primarily consist of salary and compensation expenses of personnel engaged in the research and development of our proprietary crop seeds and genetically modified products, travelling expenses, depreciation of plant and equipments, rent and development efforts and the expenses paid to certain research institutes to carrying research projects on behalf of Origin during the period.
Selling and marketing expenses
. Our selling and marketing expenses primarily consist of salary and compensation for our sales and marketing personnel, advertisement and promotion expenses, transportation expenses and related marketing expenses.
Equity award plans and award agreements
Our equity based awards are granted under the 2005 and 2009 Performance Equity Plans. We adopted the 2005 Plan in November 2005, under which we may issue equity based awards for up to 1,500,000 ordinary shares to our directors, officers, employees, individual consultants and advisors. On April 22, 2010, our company adopted the 2009 Performance Equity Plan, under which we may issue equity based awards for up to 1,500,000 ordinary shares to our directors, officers, employees, individual consultants and advisors. There are equity awards currently outstanding for 120,000 ordinary shares under the 2005 Plan and for 840,000 ordinary shares under the 2009 Plan.
On December 28, 2012 and March 22, 2013, the compensation committee of the Board of Directors approved the substitution of restricted stock for outstanding grants under Tranche 3 and Tranche 4 that no longer offer the kind of incentive opportunity originally sought for valued employees (total 21 employees) given the fall in the market price of the ordinary shares of the Company during the recent years.
The revised terms of the stock options were accounted for as a modification in accordance with ASC 718-20. For the purpose of determining the amount of any incremental share-based compensation cost that may have resulted from the modification of the exercise prices, the Company compared the fair value of modified awards and that of the original awards, both estimated at the date of the modification and determined that none of the modifications required the recognition of additional share-based payment expense.
| 48 | ||
|
|
As of September 30, 2013, all option based awards had an exercise price within the range of $1.44 to $12.23, and the awards expire 5 years from the date of grant and either vest immediately or vest over a period of 1 to 5 years, depending on the award. We recorded a total stock-based compensation expense of RMB4,637,507 for the fiscal year ended September 30, 2011, and RMB3,327,622 for the fiscal year ended September 30, 2012, and RMB1,892,595 (US$307,839) for the fiscal year ended September 30, 2013.
Critical Accounting Policies
The discussion and analysis of our financial condition and results of operations is based upon our consolidated financial statements, which have been prepared in accordance with U.S. GAAP. The preparation of those financial statements requires us to make estimates and judgments that affect the reported amount of assets and liabilities, revenues and expenses and related disclosure of contingent assets and liabilities at the date of our financial statements. Actual results may differ from these estimates under different assumptions or conditions.
Critical accounting policies are those that reflect significant judgments or uncertainties, and potentially result in materially different results under different assumptions and conditions. We have described below what we believe are our most critical accounting policies that involve a high degree of judgment and the methods of their application. For a description of all of our significant accounting policies, see Note 2 to our consolidated financial statements.
Revenues
We derive revenues primarily from the sale of various crop seeds, including corn, rice and canola seeds in China. We recognize revenues when pervasive evidence of a sales arrangement exists, products have been delivered, the price is fixed and determinable, collectability is reasonably assured, and the right of return has expired. Accordingly, we defer revenues recognition until all sale return privileges lapse, which generally occurs in May or June, and until the selling price has been finalized by our management and confirmation has been issued to the customer, which generally occurs at the end of our selling season. We sometimes carry a sizeable deferred revenues that reflects the value of our crop seeds delivered after evidence of a sales arrangement is confirmed, delivery to the customer is made and pre-payments from the customer are received, but before the final sales price is fixed and determined at the end of the selling season. This aspect of our revenues recognition policy does not have a significant effect when deferred revenues in the periods being compared remain approximately the same proportion to overall sales. However, when the proportion of our sales classified as deferred revenues varies significantly from year to year, as sometimes occurs, our revenues and earnings as reported in our financial statements may not exactly reflect our operating activities.
Impairment of long-lived assets
We incurred net losses for two of the last three fiscal years. However, losses incurred in fiscal year 2011 were mainly due to Loss on liquidation of Jilin Changrong of RMB 13.6 million. At the group level, these losses incurred on a non-recurring basis. All major operating entities in the Company have made operating profits in the last three years.
We perform the Goodwill Impairment Test on an annual basis. This process is conducted at the reporting unit level, defined as the lowest level of the Company, i.e., business units, subsidiaries, operating units, divisions, etc. As of September 30, 2013, the remaining goodwill on the books was exclusively arising from the acquisition of Denong. We conducted the annual Goodwill Impairment Test for the year ended September 30, 2013. Specifically, the profits forecast in next five years were our key assumption for fair value evaluation. Assuming the revenues would maintain 5%-10% growth rate, the gross profit margin is consistently above 20% for each year, and net income would also be positive for next five years, the fair value of Denong is positive and exceeds its carrying value by 17%. Therefore, goodwill was not considered to be impaired as of September 30, 2013.
| 49 | ||
|
|
Since we are an expanding company with a short operating history, accordingly, we face some potential events and uncertainties encountered by companies in the earlier stages of development and expansion, such as: (1) continuing market acceptance for our product extensions and our services; (2) changing competitive conditions, technological advances or customer preferences that could harm sales of our products or services; (3) maintaining effective control of our costs and expenses. If we are not able to meet the challenge of building our businesses and managing our growth, the likely result would be slowed growth, lower margins, additional operational costs and lower income, and a risk of goodwill impairment charge in future filings.
Write-down of Inventories
Our inventories are stated at the lower of cost or market value. Any excess of the cost over the net realizable value of the inventories is recognized as a provision for reduction in the value of inventories.
We assess the write-downs of inventories using three criteria: 1) the quality of seeds according to standards promulgated by the PRC government on the germination percentage and purity level of seeds; 2) a comparison of the inventory unit cost with the market selling price and subsequent write-down of those inventories where the unit cost exceeds its expected net selling price; and 3) evaluation of the unsold balance of the existing inventory that cannot be sold in the coming three years, based on sales forecasts and marketing plan.
We have assessed the product quality, unsold quantity and the amount unit cost exceed the selling price performed by our quality inspectors and sales staff on an annual basis, and accordingly, determined the inventory write-downs based on the assessment results. We believe that the current methodologies on impairment assessment are adequate to address the risks of inventory write-downs. For fiscal year 2013, we had a write down of RMB38.56 million (US$6.27 million) compared to fiscal year 2012, and RMB12.98 million for fiscal year 2011.
Due to the nature of the seed industry, we normally produce seeds according to our annualized production that is developed at least one year before delivery to our customers. If our production plan is too aggressive, we could produce more seeds than the market demands, resulting in aged seeds. We may decide not to sell the aged seeds as crop seed products, taking into account factors such as the quality of the seeds and commodity pricing. In that case, the aged inventory may be sold as common feed products at greatly reduced prices. Aged inventory could result in asset impairment risk, in which case we would suffer a risk of additional inventory write-downs.
Income taxes
We record a valuation allowance to reduce our deferred tax assets to the amount that we believe to be more likely than not to be realized. In the event that we were to determine that we would be able to realize our deferred tax assets in the future, in excess of their recorded amount, an adjustment to our deferred tax assets would increase income in the period such determination was made.
Likewise, should we determine that we would not be able to realize all or part of our net deferred tax assets in the future, an adjustment to our deferred tax assets would be charged to income in the period such determination was made.
The Company adopted FASB Accounting Standard Codification (“ASC”) 740. The Company’s policy on classification of all interest and penalties related to unrecognized tax benefits, if any, as a component of income tax provisions.
Stock-based compensation
We adopted FASB ASC 718-10, to measure our issued share options based on the grant-date fair value of the options and recognized as compensation expense over the requisite service period, with a corresponding addition to equity. We adopt the Black-Scholes Model to value the fair value of the share options.
| 50 | ||
|
|
Results of Operations
Fiscal Year Ended September 30, 2013 Compared To Fiscal Year Ended September 30, 2012
Revenues and Gross Margin
Our revenues for the fiscal year 2013 were RMB481.69 million (US$77.30 million), a decline of 12.75% compared with RMB552.11 million in fiscal year 2012. Overall, the year-over-year decrease in revenues was mainly due to the divestiture of the cotton and pesticide businesses in last year and the sales drop of corn and rice
as a result of increasing competition in the crop seed market and unfavorable weather conditions in Northeastern China
.
The table below lists the change in both revenues and gross margins exclusive scrap sales, between fiscal year 2013 and fiscal year 2012
|
Items
|
|
Revenues
|
|
|
Gross Margin
|
|
|
||||||||||
|
|
|
Year ended
|
|
Year ended
|
|
|
|
|
Year ended
|
|
|
Year ended
|
|
|
Change in
|
|
|
|
|
|
September 30,
|
|
September 30,
|
|
|
|
|
September 30,
|
|
|
September 30,
|
|
|
percentage
|
|
|
|
|
|
2013
|
|
2012
|
|
Change
|
|
|
2013
|
|
|
2012
|
|
|
point
|
|
|
|
|
|
RMB’000
|
|
RMB’000
|
|
|
|
|
|
|
|
|
|
|
|
|
|
|
Hybrid Corn seeds
|
|
381,820
|
|
406,839
|
|
(6.1)
|
%
|
|
38.6
|
%
|
|
35.6
|
%
|
|
3.0
|
%
|
|
|
Hybrid Rice seeds
|
|
72,707
|
|
86,542
|
|
(16.0)
|
%
|
|
24.9
|
%
|
|
29.5
|
%
|
|
(4.6)
|
%
|
|
|
Hybrid Canola seeds
|
|
21,766
|
|
19,935
|
|
9.2
|
%
|
|
52.7
|
%
|
|
52.0
|
%
|
|
0.7
|
%
|
|
|
Hybrid Cotton seeds
|
|
-
|
|
7,086
|
|
n/a
|
|
|
|
|
|
122.5
|
%
|
|
n/a
|
|
|
|
Pesticides
|
|
-
|
|
19,832
|
|
n/a
|
|
|
|
|
|
(11.9)
|
%
|
|
n/a
|
|
|
|
Other
|
|
-
|
|
215
|
|
n/a
|
|
|
|
|
|
n/a
|
|
|
n/a
|
|
|
|
Total normal sales
|
|
476,293
|
|
540,449
|
|
(11.9)
|
%
|
|
37.2
|
%
|
|
34.7
|
%
|
|
2.5
|
%
|
|
Exclusive of scrap sales, revenues from our hybrid corn seeds decreased by 6.1% to RMB381.82 million (US$61.27 million) in fiscal year 2013 from RMB406.84 million in fiscal year 2012,
this year-over-year decrease was mainly a result of increasing competition in the corn seed market and unfavorable weather for our Northeast operations.
Gross margin of our corn products increased by 3.0% in fiscal year 2013 compared with fiscal year 2012, which was mainly due to the decline in average unit purchase cost of seed as a result of higher seed production yield
for one of our key production centers
in this year.
Non-scrap revenues from our hybrid rice seeds decreased by 16.0% to RMB72.71 million (US$11.67 million) in fiscal year 2013 from RMB86.54 million in fiscal year 2012,
which was mainly due to lower sales volume for one product as a result of increasing competition in the rice seed market
. Gross margin of our rice products decreased by 4.60% in fiscal year 2013 compared with fiscal year 2012 was as a result of an increase in raw material cost
caused by lower seed production yield in this year
. Non-scrap revenues from our canola seeds increased by 9.20% to RMB21.77 million (US$3.49 million) in fiscal year 2013 compared with RMB19.94 million in fiscal year 2012.
Cost of Revenues
Our cost of revenues for fiscal year 2013 was RMB 315.08 million (US$50.56 million), a decrease of 18.75% compared with RMB387.78 million in fiscal year 2012. This decrease was mainly due to the decline in average unit purchase cost of seed as a result of higher seed production yield in this year.
Gross margin
Our gross margin was 34.59% in fiscal year 2013 compared with 29.76% in fiscal year 2012. This increase was mainly due to the decline in average unit purchase cost of seed as a result of higher seed production yield.
| 51 | ||
|
|
Operating expenses
Our operating expenses for fiscal year 2013 decreased to RMB148.45 million (US$23.82 million) from RMB167.80 million in fiscal year 2012. Lower operating expense for fiscal year 2013 was mainly due to a decrease in costs previously associated with the pesticide and cotton business, which are no longer applicable after the divestiture. Corporate restructuring and expenses control efforts also helped to lower the operating expenses despite the increase in doubtful receivable allowance and higher shipping expenses.
Selling and marketing
Selling and marketing expenses for fiscal year 2013 were RMB55.38 million (US$8.89 million), which was in line with RMB56.44 million in fiscal year 2012. Lower expenses were due to lower performance based bonus largely offset the higher shipping costs caused with the production of Xinjiang Origin.
General and administrative
General and administrative expenses (“G&A”) decreased to RMB 66.15 million (US$10.62 million) in fiscal year 2013 from RMB77.59 million in fiscal year 2012, which
was due to the lower in share based compensation, entertainment and the divesture of pesticide and cotton business in last year.
Research and development
Research and development expenses (“R&D”) increased to RMB42.16 million (US$6.77 million) in fiscal year 2013 from RMB37.63 million in fiscal year 2012.
The increase was mainly due to higher staff compensation and land rental for research.
Other income
Other income increased to RMB15.24 million (US$2.45 million) in fiscal year 2013 from RMB3.85 million in fiscal year 2012. The increase was mainly due to both the rental income and disposal of house amounted to approximately RMB 10 million (US$1.63 million) in this year.
Income from operations
As a result of the impact of the components described above, income from operations were RMB 18.16 million (US$2.92 million) in fiscal year 2013 compared with operating loss RMB3.47 million in fiscal year 2012. The increase in operating results was mainly due to improvement in gross profit and expenses control measures adopted since last year.
Interest expense
Interest expense increased by RMB7.30 million (US$1.19 million) to RMB11.33 million (US$1.82 million) for the fiscal year 2013 from RMB4.03 million a year ago. This increase was mainly due to higher bank loans from the Beijing, Linze and Xinjiang entities in this year.
Share of net income of equity investments
This represents investment income from the 30% equity investment,
Shijiazhuang Liyu Technology Development Co., Ltd.
Income taxes
Income taxes for fiscal year 2013 were RMB4.46 million (US$0.72 million) compared with RMB 1.86 million for fiscal year 2012. We incurred a deferred tax expense of RMB1.76 million (US$0.28 million), mainly due to
utilization of the tax losses of Denong this year. The deferred tax asset is composed primarily of net operating loss carried forwards. The valuation allowance was based upon management’s conclusions, among other considerations and estimates of future earnings based on information currently available. It was more likely than not that the future tax benefits would be realized.
| 52 | ||
|
|
The standard enterprise income tax rate was 25% for 2013 and 2012. However, our PRC Operating Company, Beijing Origin is entitled to a preferential tax rate of 15%. For fiscal years ended September 30, 2012 and 2013, its effect of the preferential tax treatment was 10%. The preferential treatments in EIT to Xinjiang Origin is 2 years of exemption and 3 years of half reduction (counting from the year the Company makes a profits, it can exempted from EIT in first two years and it should only pay for half of EIT from the third to fifth years). Xinjiang Origin recorded a profit in 2012, so it started to enjoy the EIT exemption in 2012.
Net income
Net income for the fiscal year ended September 30, 2013 were RMB 7.49 million (US$1.21 million), representing a significant improvement from the net loss of RMB1.43 million during the fiscal year ended September 30, 2012. The year-over-year improvement was mainly due to the improvement in operating performance of core businesses.
Fiscal Year Ended September 30, 2012 Compared to Fiscal Year Ended September 30, 2011
Revenues and Gross Margin
Our revenues for the fiscal year 2012 were RMB 552.11 million (US$87.07 million), a slight decline of 2.70% compared with RMB567.43 million in fiscal year 2011. Overall, the slight year-over-year decrease in revenues was mainly due to the liquidation of Jilin Changrong and the divestiture of the cotton and pesticide businesses in 2011; while revenues in the core businesses increased year-over-year.
The table below lists the change in the revenues and gross margins exclusive scrap sales, between fiscal year 2012 and fiscal year 2011:
|
Items
|
|
Revenues
|
|
|
Gross Margin
|
|
|
||||||||||
|
|
|
Year ended
|
|
Year ended
|
|
|
|
|
Year ended
|
|
|
Year ended
|
|
|
Change in
|
|
|
|
|
|
September 30,
|
|
September 30,
|
|
|
|
|
September 30,
|
|
|
September 30,
|
|
|
Percentage
|
|
|
|
|
|
2012
|
|
2011
|
|
Change
|
|
|
2012
|
|
|
2011
|
|
|
point
|
|
|
|
|
|
RMB’000
|
|
RMB’000
|
|
|
|
|
|
|
|
|
|
|
|
|
|
|
Hybrid Corn seeds
|
|
406,839
|
|
409,134
|
|
(0.56)
|
%
|
|
35.53
|
%
|
|
40.26
|
%
|
|
(4.73)
|
%
|
|
|
Hybrid Rice seeds
|
|
86,542
|
|
90,309
|
|
(4.17)
|
%
|
|
29.47
|
%
|
|
32.41
|
%
|
|
(2.94)
|
%
|
|
|
Hybrid Canola seeds
|
|
19,935
|
|
16,833
|
|
18.43
|
%
|
|
52.01
|
%
|
|
58.67
|
%
|
|
(6.66)
|
%
|
|
|
Hybrid Cotton seeds
|
|
7,086
|
|
18,920
|
|
(62.55)
|
%
|
|
122.45
|
%
|
|
11.23
|
%
|
|
111.25
|
%
|
|
|
Pesticides
|
|
19,832
|
|
20,615
|
|
(3.80)
|
%
|
|
(11.88)
|
%
|
|
19.69
|
%
|
|
(31.57)
|
%
|
|
|
Other
|
|
215
|
|
2,572
|
|
(91.64)
|
%
|
|
n/a
|
|
|
n/a
|
|
|
n/a
|
|
|
|
Total normal sales
|
|
540,449
|
|
558,383
|
|
(3.21)
|
%
|
|
34.74
|
%
|
|
38.08
|
%
|
|
(3.34)
|
%
|
|
Exclusive of scrap sales, revenues from our hybrid corn seeds decreased by 0.56% to RMB406.84 million (US$64.16 million) in fiscal year 2012 from RMB409.13 million in fiscal year 2011. Gross margin of our corn products decreased by 4.73% in fiscal year 2012 compared with fiscal year 2011, mainly due to the increase in inventory provision and higher seed purchasing price this year. Excluding inventory provision of RMB22.07 million, the gross margin for corn products was 38.87% for fiscal year 2012, compared to 40.52% for fiscal year 2011. Higher seed purchasing prices were mainly a result of lower seed production yield for one of our key products. We believe this lower yield problem was at least partially fixed and yield has returned to a historical level during the 2012 production season. Hence, seed purchasing prices are expected to decline for the fiscal year 2013 sales season.
Non-scrap revenues from our hybrid rice seeds decreased by 4.17% to RMB86.54 million (US$13.65 million) in fiscal year 2012 from RMB90.31 million in fiscal year 2011. Gross margin of our rice products decreased by 2.94% in fiscal year 2012 compared with fiscal year 2011 as a result of an increase in raw material cost. Non-scrap revenues from our canola seeds increased by 18.43% to RMB19.94 million (US$3.14 million) in fiscal year 2012 compared with RMB16.83 million in fiscal year 2011. Since canola seeds are sold during the off season, a substantial amount of the canola seed sales still presented as deferred revenues on our balance sheet. Non-scrap revenues from cotton seeds decreased by 62.55% to RMB7.09 million (US$1.12 million) in fiscal year 2012 from RMB18.92 million in fiscal year 2011, due to the divestment of Biocentury Transgene earlier in 2010. The Company has begun to focus less on cotton sales and more on other main crop seeds, and selling a higher portion of our seed inventories at higher prices.
| 53 | ||
|
|
Cost of Revenues
Our cost of revenues for fiscal year 2012 was RMB 387.78 million (US$61.16 million), an increase of 4.36% compared with RMB371.59 million in fiscal year 2011. This increase was mainly due to the rise in inventory provisions and higher seed purchasing prices.
Gross margin
Our gross margin was 29.76% in fiscal year 2012 compared with 34.51% in fiscal year 2011. This decline was mainly due to an increase in inventory provisions and increase in seed purchase prices. Excluding inventory provisions, the gross margin was 35.90% in fiscal year 2012 compared with 37.93% in fiscal year 2011. Higher selling prices were not able to offset rising seed purchase prices. Higher seed purchasing prices were mainly a result of lower seed production yield for one of our key products.
Operating expenses
Our operating expenses for fiscal year 2012 decreased to RMB167.80 million (US$26.46 million) from RMB183.23 million in fiscal year 2011. Lower operating expense for fiscal year 2012 was mainly due to a decrease in costs previously associated with Jilin Changrong, which are no longer applicable after the divestiture. Corporate restructuring and cost control efforts also helped to lower the operating expenses despite the increase in severance payments, higher doubtful receivable allowance, higher marketing expenses and shipping expenses.
Selling and marketing
Selling and marketing expenses for fiscal year 2012 were RMB56.44 million (US$8.90 million), which was in line with RMB56.83 million in fiscal year 2011. Lower expenses due to Jilin Changrong’s divestiture largely offset the higher advertising and shipping costs.
General and administrative
General and administrative expenses (“G&A”) decreased to RMB77.59 million (US$12.24 million) in fiscal year 2012 from RMB86.75 million in fiscal year 2011.
Divestiture of Jilin Changrong was the main reason for lower G&A expenses. Excluding the costs associated with Jilin Changrong in fiscal year 2011 and Changchun Origin in fiscal year 2012, G&A expenses increased by 7.7% from RMB68.26 million in fiscal year 2011 to RMB 73.54 million (US$11.60 million ) in fiscal year 2012. The increase was mainly due to higher stuff compensation and severance payments.
Research and development
Research and development expenses (“R&D”) decreased to RMB37.63 million (US$5.93 million) in fiscal year 2012 from RMB44.77 million in fiscal year 2011.
Divestiture of Jilin Changrong was the main reason for the lower R&D expenses. Excluding the costs associated with Jilin Changrong in fiscal year 2011 and Changchun Origin in fiscal year 2012, the R&D expenses increased by 17% to RMB 37.63 million ( US$ 5.93 million ) in fiscal year 2012 from RMB 32.18 million in fiscal year 2011. The increase was mainly due to higher stuff compensation and addition of research personnel.
| 54 | ||
|
|
Income from operations
As a result of the impact of the components described above, loss from operations were RMB 3.47 million (US$0.55 million) in fiscal year 2012 compared with operating profit RMB12.61 million in fiscal year 2011. The decrease in operating results was mainly due to lower contribution from the Changchun Origin subsidiary in fiscal year 2012, compared to the contribution from Jilin Changrong in fiscal year 2011. The impact of Jilin Changrong liquidation and contribution of Changchun Origin to the operation profits and net profits attributable to Origin have already been discussed above.
Interest expense
Interest expense increased by RMB2.56 million (US$0.41 million) to RMB4.03 million (US$0.64 million) in fiscal year 2012 from RMB1.47 million a year ago. This increase was mainly due to higher bank loans from the Linze and Xinjinag entities this year.
Share of net income of equity investments
This represents investment income from the 30% equity investment,
Shijiazhuang Liyu Technology Development Co., Ltd.
Loss on liquidation of a subsidiary
The represented the loss of RMB13.58 million (US$2.14 million) from the disposal of our subsidiary Jilin Changrong in fiscal year 2011.
Income taxes
Income taxes for fiscal year 2012 were RMB1.86 million (US$0.29 million) compared with RMB 13.73 million for fiscal year 2011. We incurred a deferred tax expense of RMB1.27 million (US$0.20 million), mainly due to the tax losses of Denong used this year. The deferred tax asset is composed primarily of net operating loss carried forwards. The valuation allowance was based upon management’s conclusions, among other considerations and estimates of future earnings based on information currently available. It was more likely than not that the future tax benefits would be realized.
The standard enterprise income tax rate was 25% for 2012 and 2011. However, our PRC Operating Company, Beijing Origin is entitled to a preferential tax rate of 15%. For fiscal years ended September 30, 2011 and 2012, the effect of the preferential tax treatment was 10%.
Net Loss
Net loss for the fiscal year ended September 30, 2012 were RMB1.43 million (US$0.23 million), representing a significant improvement from the net loss of RMB23.08 million during the fiscal year ended September 30, 2011. The year-over-year improvement was mainly due to the improvement in operating performance of core businesses.
B.
Liquidity and Capital Resources
.
As of September 30, 2011, 2012 and 2013, we had approximately RMB
129.94
million , RMB
152.79
million and RMB131.98 million (US$21.47 million), respectively, in cash and cash equivalents. Our cash and cash equivalents primarily consisted of cash on hand and short term liquid investments with maturities of three months or less deposited with banks and other financial institutions. We believe our working capital is sufficient to meet our present requirements.
We financed our operations through cash generated from operating activities and bank borrowings. As of September 30, 2013, we had a total short-term borrowings of RMB221.50 million and long-term borrowings of RMB64.82 million. The weighted average interest rate was 6.56%, 7.04% and 6.26% for fiscal year 2011, 2012 and 2013, respectively. Please see Note 13 to our consolidated financial statement for the details of bank borrowing.
| 55 | ||
|
|
The following table shows our cash flows with respect to operating activities, investing activities and financing activities for the 12 months ended September 30, 2009, 2010, 2011, 2012 and September 30, 2013.
|
Item
|
|
September 30
|
|
||||||||||
|
(In thousands)
|
|
|
|
|
|
|
|
|
|
|
|
|
|
|
|
|
2009
|
|
2010
|
|
2011
|
|
2012
|
|
2013
|
|
2013
|
|
|
|
|
RMB
|
|
RMB
|
|
RMB
|
|
RMB
|
|
RMB
|
|
US$
|
|
|
Net cash provided by (used in) operating activities
|
|
208,883
|
|
298,604
|
|
37,457
|
|
82,713
|
|
(146,109)
|
|
(23,769)
|
|
|
|
|
|
|
|
|
|
|
|
|
|
|
|
|
|
Net cash provided by (used in) investing activities
|
|
(15,891)
|
|
15,105
|
|
(154,390)
|
|
(143,383)
|
|
(68,279)
|
|
(11,097)
|
|
|
|
|
|
|
|
|
|
|
|
|
|
|
|
|
|
Net cash provided by (used in) financing activities
|
|
(175,933)
|
|
(136,359)
|
|
(55,736)
|
|
83,400
|
|
191,687
|
|
31,178
|
|
|
|
|
|
|
|
|
|
|
|
|
|
|
|
|
|
Net (decrease) increase in cash and cash equivalents
|
|
16,969
|
|
177,350
|
|
(172,669)
|
|
22,730
|
|
(22,701)
|
|
(3,688)
|
|
|
|
|
|
|
|
|
|
|
|
|
|
|
|
|
|
Cash and cash equivalents, beginning of year
|
|
102,263
|
|
121,255
|
|
299,672
|
|
129,942
|
|
152,789
|
|
24,852
|
|
|
|
|
|
|
|
|
|
|
|
|
|
|
|
|
|
Effect of exchange rate changes on cash and cash equivalents
|
|
1,933
|
|
1,067
|
|
2,939
|
|
117
|
|
1,890
|
|
303
|
|
|
|
|
|
|
|
|
|
|
|
|
|
|
|
|
|
Cash and cash equivalents, end of year
|
|
121,255
|
|
299,672
|
|
129,942
|
|
152,789
|
|
131,978
|
|
21,467
|
|
Operating activities:
Net cash used in operating activities was RMB146.11 million (US$23.77 million) for the fiscal year ended September 30, 2013, compared with
net cash provided
by RMB82.71 million for the fiscal year ended September 30, 2012. This decrease was primarily because the inventory increased by RMB226.83 million (US$36.90 million) and the decrease in advance from customers by RMB 63.47 million (US$ 10.32 million).
Net cash provided by operating activities was RMB82.71 million (US$13.04 million) for the fiscal year ended September 30, 2012, compared with RMB37.46 million for the fiscal year ended September 30, 2011. This increase was primarily due to the decrease in net loss to RMB1.43 million (US$0.23 million), the decrease in other current assets by RMB 48.65 million (US$ 7.67 million), and the increase in advances from customers by RMB37.11 million (US$5.85 million).
Investing activities:
Net cash used in investing activities was RMB68.28 million (US$11.10 million) for the fiscal year ended September 30, 2013, compared with
RMB143.38
million for the fiscal year ended September 30, 2012. The decrease was mainly because most purchase related to the buildings and plants in Xinjiang and Linze was completed in fiscal year 2012.
| 56 | ||
|
|
Net cash used in investing activities was RMB143.38 million (US$22.61 million) for the fiscal year ended September 30, 2012. Net cash used in investing activities was RMB154.39 million for the fiscal year ended September 30, 2011.The investment in Linze subsidiary and liquidation of the Jilin Changrong of RMB 154.98 million; and the investment in Xinjiang Origin of RMB 146.70 million represented the major investment for fiscal year 2011 and 2012, respectively.
Financing activities:
Net cash provided by financing activities was RMB191.69 million (US$31.18 million) for the fiscal year ended September 30, 2013. Net cash
provided by
financing activities was RMB83.40 million for the fiscal year ended September 30, 2012. This increase was mainly due to the net proceeds from borrowing of RMB 212.32 million (US$34.54 million).
Net cash provided by financing activities was RMB83.40 million (US$13.15 million) for the fiscal year ended September 30, 2012. Net cash used in financing activities was RMB55.74 million for the fiscal year ended September 30, 2011. This was mainly due to the net proceeds from borrowing of RMB54 million (US$8.52 million) and a capital injection for a newly established subsidiary from non-controlling interests of RMB29.40 million (US$4.64 million).
Due to the cyclical nature of cash flow inherent in our business, the majority of cash flow from operations is received during the second half of the calendar year, which corresponds to the fourth quarter and the subsequent first quarter of our fiscal year. We use bank credit facilities to cover cash outflow related to operating expenses during the portion of the year when sales receipts are low revenues. We believe we can generate sufficient cash flows from operating activities and can access sufficient borrowing capacity from local banks to satisfy our seasonal liquidity needs.
The nature of our business involves cycles in expenses and revenues that are not always in phase. Most often in the third to fourth quarters of our fiscal year, we may face costs that are in excess of our cash flow sources during that period. Whether that occurs, and to what extent it occurs, depends on the amount of deposits received from customers compared with the advanced payments made by us to our seed producing farmers and the final payment for seed procurement. The exact timing of these payments is determined by the Chinese lunar calendar, which varies from one calendar year to the next. As a result, in some years our working capital needs are greater than in others. This aspect of the business is the reason we have customarily relied upon short term bridge loans to cover our expenses pending receipt of cash payment from farmers at the time of seed purchases. We, on a consolidated basis, have had access to sufficient financing in the past to manage these cash flow cycles. We have consistently repaid our short-term borrowings at or before maturity.
Relevant PRC laws and regulations permit payments of dividends by our PRC operating companies only out of their retained earnings, if any, as determined in accordance with PRC accounting standards and regulations. In addition, the statutory general reserve fund requires that annual appropriations of 10% of net after-tax income be set aside prior to payment of any dividends. As a result of these and other restrictions under PRC laws and regulations, our PRC Operating Companies are restricted in their ability to transfer a portion of their net assets to us either in the form of dividends, loans or advances.
Even though we currently do not require any such dividends, loans or advances from our PRC Operating Companies, we may in the future require additional cash resources from our PRC Operating Companies due to changes in business conditions, to fund future acquisitions or developments, or merely to declare and pay dividends or distributions to our shareholders, although we currently have no intention to do so.
C.
Research and Development, Patents and Licenses, etc.
We focus our research and development efforts on agro-biotechnology, crop breeding and the development of new crop seeds. In November 2001, we established a seed research and development center in Tongzhou, Beijing, which conducts research and development of commercial crop breeding. In September 2005, we established the “Origin Life Science Research Center” in Zhong Guan Cun, Beijing, the principal activities of which include crop gene engineering, molecular marker-assisted breeding, and molecular identification. We also have ten breeding stations located in different regions with seven being used for corn, three for rice and canola.
| 57 | ||
|
|
We have established technological cooperative relationships with five universities and sixteen research institutes in China, including Beijing University, China Agricultural University, Chinese Academy of Sciences, and Henan Agriculture University. We employ 126 full-time research personnel.
Our research and development expenditures were RMB 33.47 million, RMB 38.36 million, RMB 44.77 million, RMB37.63 million, and RMB42.16 million for fiscal years ended September 30, 2009, 2010, 2011, 2012 and 2013, respectively. Our continued increase in research and development spending is a result of our further efforts in the research and development of self-developed seed varieties and biotechnology traits both through joint development and in-house efforts.
The company has received government funding for research and development activities. Such funding was received in the fiscal years 2011, 2012 and 2013 in the amounts of RMB nil, RMB 1.55 million and RMB 16.11 million, respectively.
D.
Trend Information
.
Other than as disclosed elsewhere in this Annual Report, we are not aware of any trends, uncertainties, demands, commitments or events in the period from October 1, 2012 to September 30, 2013 that were reasonably likely to have a material effect on our net revenues, income, profitability, liquidity or capital resources, or that caused the disclosed financial information to be not necessarily indicative of future operating results or financial conditions, or that had the trends relating to the current-year increases in expenses and reduction in revenues and profits.
E.
Off-balance Sheet Arrangements
.
We do not have any off-balance sheet guarantees, interest rate swap transactions or foreign currency forward contracts or outstanding derivative financial instruments. We do not engage in trading activities involving non-exchange traded contracts.
F.
Tabular Disclosure of Commitments and Contingencies
.
We have various contractual obligations that will affect our liquidity. The following table sets forth our contractual obligations as of September 30, 2013.
|
|
|
Payments due by period
|
|
||||||||
|
Contractual Obligations
|
|
Total
|
|
Less than
1 year |
|
1-3
years |
|
3-5 years
|
|
More than
5 years |
|
|
Capital Commitment (1)
|
|
29,573
|
|
29,573
|
|
-
|
|
-
|
|
-
|
|
|
Short term Debt Obligations (2)
|
|
221,500
|
|
221,500
|
|
-
|
|
-
|
|
-
|
|
|
Long term Debt Obligations (2)
|
|
64,819
|
|
-
|
|
57,796
|
|
7,023
|
|
-
|
|
|
Interest on Debt Obligations
|
|
20,060
|
|
10,869
|
|
6,730
|
|
2,461
|
|
-
|
|
|
Purchase Obligations
|
|
-
|
|
-
|
|
-
|
|
-
|
|
-
|
|
|
Capital (Finance) Lease Obligations
|
|
-
|
|
-
|
|
-
|
|
-
|
|
-
|
|
|
Operating Lease Obligations
|
|
14,890
|
|
2,533
|
|
3,155
|
|
2,126
|
|
7,076
|
|
|
Other Long-Term Liabilities Reflected on the Company’s Balance Sheet under the GAAP of the primary financial statements
|
|
-
|
|
-
|
|
-
|
|
-
|
|
-
|
|
|
Total
|
|
350,842
|
|
264,475
|
|
67,681
|
|
11,610
|
|
7,076
|
|
(1) Includes capital commitments for purchase of plant, building construction, equipment and technology use rights.
(2) Represents bank loans from China Merchants Bank Beijing Branch, China Construction Bank Beijing Branch, Agricultural Development Bank of China Linze Branch, Agricultural Bank of China Linze Branch and Xinjiang Branch as well as China Construction Bank (Asia).
| 58 | ||
|
|
We identified the existence of potential contingent tax liabilities arising from our reverse merger in November 2005. We determined that these contingent tax liabilities were more likely than not to occur. As of December 31, 2005, we estimated such contingent tax liabilities to be in the range of RMB39.06 million (US$4.84 million) to RMB64.22 million (US$7.96 million). Consequently, RMB39.06 million (US$4.84 million) was included in income tax payable on our balance sheet and was charged to equity because such liabilities were part of the recapitalization in connection with our reverse merger. We did not expect to incur tax liabilities at the higher end of the range based on our annual assessment.
In 2009, we reviewed the contingent tax position. On September 23, 2010, the Company filed a revised 2005 tax return to the United States Internal Revenue Service, or IRS, to modify and supplement the previously filed tax return regarding this tax liability. The IRS has not responded to the tax filing as of the date of the filing of this report. While the timeline for the IRS to question on the tax return is generally three years, this matter may take a prolonged period of time to resolve depending on the return time for IRS and the necessity, if any, of future appeals or re-evaluation.
G.
Safe Harbor
.
Except for historical facts and financial data, the information included in Items 5.A through 5.D and 5.F is deemed to be a “forward looking statement” as that term is defined in the statutory safe harbors. The safe harbor provided in Section 27A of the Securities Act and Section 21E of the Exchange Act shall apply to all forward-looking information provided in this Item 5.
A.
Directors and Senior Management
.
The following table sets forth certain information regarding our directors and executive officers as of September 30, 2013.
|
Name
|
|
Age
|
|
Position
|
|
|
|
|
|
|
|
|
|
Gengchen Han
|
|
58
|
|
Chairman of the Board, President and Chief Executive Officer
|
|
|
Yasheng Yang
|
|
51
|
|
Vice Chairman of the Board
|
|
|
James Kang
|
|
54
|
|
Independent Director
|
|
|
Min Tang
|
|
60
|
|
Independent Director
|
|
|
Yingqi Xia
|
|
60
|
|
Independent Director
|
|
|
Michael W. Trimble
|
|
56
|
|
Independent Director
|
|
|
Larry Kenneth Cordell
|
|
56
|
|
Independent Director
|
|
|
James Chen
|
|
48
|
|
Chief Financial Officer
|
|
Dr. Gengchen Han
is the Chairman, President and Chief Executive Officer of Origin. Dr. Han is also the Executive Chairman of Beijing Origin and its affiliated companies, a position that he has held since founding the business in 1997. Dr. Han was the Co-Chief Executive Officer and Chief Executive Officer of the Company from its inception in 1997 until January 1, 2009. Dr. Han has more than 20 years of experience in research and development of hybrid seed products, particularly corn seed. From 1982 until 1984, Dr. Han was a lecturer at the Henan Agriculture University. From 1984 to 1987, Dr. Han received his Ph.D. degree in Plant Breeding and Cytogenics from Iowa State University. From 1989 until 1990 he worked for the International Maize and Wheat Improvement Center, or CIMMYT, in Mexico. He worked for Pioneer Hi-bred International from 1990 to 1996; his positions there included Regional Technical Coordinator for Asia/Pacific and Regional Supervisor for China Business.
Mr. Yasheng Yang
is Vice Chairman of the Board. Mr. Yang previously served as President, Vice Chairman, and Chief Operating Officer of Origin from 2005 to 2007. He is also an executive officer of each of our PRC Operating Companies since 1998, where he is principally responsible for advertising and marketing, and serves as President of BioCentury Transgene. Prior to joining Beijing Origin, from 1995 to 1997, he worked in the Fujian province government as an officer, where he specialized in the areas of technology, medicine and education.
| 59 | ||
|
|
Dr. Min Tang
has been a director of Origin since January 2009. Dr. Tang is currently the Executive Vice Chairperson of China Social Entrepreneur Foundation, a social development and entrepreneurship education initiative. Previously, Dr. Tang sat as the Deputy Secretary General of the China Development Research Foundation in charge of financial reform, energy conservation, and social development for the Development Research Center reporting to the State Council of China. Prior to his position, Dr. Tang worked in Asia Development Bank for 18 years. From 2000-2007, he was the Chief Economist of Asian Development Bank Resident Mission in China. Dr. Tang received his masters and PhD. degree in Economics from University of Illinois at Urbana Champaign, USA.
Dr. Michael W. Trimble
has been a director of Origin since May 2006. Dr. Trimble is the founder of Trimble Genetics International LLC, or Trimble Genetics, and has been the President of Trimble Genetics since 2001. Trimble Genetics is a plant genetics research company that has expanded business and research relationships to include activities in North America, South America, Asia, Europe, the Middle East and Africa. Dr. Trimble is a leader in plant genetics research with over thirty years of experience in crop breeding and the agricultural seed industry. Dr. Trimble is an inventor of numerous patents in the field of plant genetics. Dr. Trimble graduated with a Ph.D. degree from the University of Minnesota and also completed graduate programs at Purdue University and Iowa State University.
Dr. Yingqi Xia
has been a director of Origin since January 2010. Dr. Xia sits as the Chairman of Beijing Expert Association. Previously, Dr. Xia has worked as the Executive Deputy Director of Zhong Guan Cun Science Park, the largest high-tech zone in China, as the Division Chief for the World Bank Department in the Ministry of Finance in the People’s Republic of China and in the Chinese Embassy to the United States. Prior to this, Dr. Xia received his PhD. degree from University of Ottawa, Canada.
Dr. Y. James Kang
has been a director of Origin since January 2010. Dr. Kang is a Professor and Distinguished University Scholar in the Department of Pharmacology and Toxicology at the University Of Louisville School Of Medicine. He is also a National One-Thousand Talents Theme Professor and the Director of Regenerative Medicine Research Center at Sichuan University West China Hospital in China. Dr. Kang has also been serving as the President and CEO of InnoRem, Inc. and the President of International Organization of Life Science and Biotechnology. Prior to this, Dr. Kang received his PhD. Degree from Iowa State University and completed his postdoctoral fellow training at Cornell University Medical College in New York
.
Mr. Larry Kenneth Cordell
was appointed to Origin’s Board of Directors and became the Audit Committee Chair, effective January 1, 2012. Mr. Cordell served as Chairman, President and CEO at UAP Holdings (“UAPH”) when the company was acquired by Agrium Inc. through a tender offer in May, 2008. Prior to its acquisition, UAPH was the largest independent distributor of agricultural inputs and professional non-crop products in the United States and Canada. Prior to UAPH, he held executive positions at FMC Agricultural Products, where he last served as its Global Herbicide Director. Mr. Cordell started his career at Rohm and Haas.
Mr. Cordell currently
serves as Chief Executive Officer of Pinnacle Agriculture Distribution, a privately held crop input distributor in the United States. He also holds Board of Director positions with Momentive Performance Material Holdings and Taminco, both of which are privately held specialty chemical manufacturers.
Dr. Z. James Chen
has been appointed as Chief Financial Officer of Origin since January 2012. Prior to Origin, Dr. Chen served as an Investment Manager at Abu Dhabi Investment Authority (ADIA) and he worked as an equity research analyst at Morgan Joseph and BB&T Capital Markets. Dr. Chen also worked as a Product Manager at Celanese and as a License Product Technology Manager at Univation Technologies, a joint venture between ExxonMobil and Dow Chemical. Dr. Chen received his Ph.D. Degree in Chemical Engineering from the University of Connecticut and his M.B.A degree from New York University.
B. Compensation.
The aggregate cash compensation paid to our directors and executive officers as a group was RMB7.23 million (US$1.17 million) for the twelve months ended September 30, 2013. Options granted are stated in the chart found below.
| 60 | ||
|
|
2005 Performance Equity Plan
On November 8, 2005 the company adopted the 2005 Performance Equity Plan, under which we are able to issue equity awards with the right to acquire up to 1,500,000 ordinary shares to our directors, officers, employees, individual consultants and advisors. The main purpose of the plan was to provide an existing structure and renewable benefit plan for senior management and directors and others providing services to the company. We had outstanding awards for 120,000 ordinary shares under the 2005 Plan at September 30, 2013.
2009 Performance Equity Plan
On April 22, 2010, our company adopted the 2009 Performance Equity Plan, under which we are able to issue equity awards with the right to acquire up to 1,500,000 ordinary shares to our directors, officers, employees, individual consultants and advisors. The main purpose of the plan was to provide an existing structure and renewable benefit plan for senior management and directors and others providing services to the company. We had outstanding awards for 840,000 ordinary shares under the 2009 Plan at September 30, 2013.
Those awards held by the current directors and officers are listed below.
|
Name
|
|
Ordinary
Shares Underlying Outstanding Option |
|
|
Exercise
Price |
|
Grant Date
|
|
Expiration Date
|
|
|
Gengchen Han
|
|
20,000
|
|
$
|
12.23/Share
|
|
January 4, 2010
|
|
January 3, 2015
|
|
|
|
|
20,000
|
|
$
|
10.84/Share
|
|
January 3, 2011
|
|
January 2, 2016
|
|
|
|
|
120,000
|
|
$
|
2.55/Share
|
|
January 3, 2012
|
|
January 2,2017
|
|
|
|
|
120,000
|
|
$
|
1.44/Share
|
|
January 2, 2013
|
|
January 1,2018
|
|
|
Yasheng Yang
|
|
5,000
|
|
$
|
12.23/Share
|
|
January 4, 2010
|
|
January 3, 2015
|
|
|
|
|
5,000
|
|
$
|
10.84/Share
|
|
January 3, 2011
|
|
January 3, 2016
|
|
|
|
|
5,000
|
|
$
|
2.55/Share
|
|
January 3, 2012
|
|
January 2,2017
|
|
|
|
|
5,000
|
|
$
|
1.44/Share
|
|
January 2, 2013
|
|
January 1,2018
|
|
|
Michael Trimble
|
|
5,000
|
|
$
|
12.23/Share
|
|
January 4, 2010
|
|
January 3, 2015
|
|
|
|
|
5,000
|
|
$
|
10.84/Share
|
|
January 3, 2011
|
|
January 2, 2016
|
|
|
|
|
5,000
|
|
$
|
2.55/Share
|
|
January 3, 2012
|
|
January 2,2017
|
|
|
|
|
5,000
|
|
$
|
1.44/Share
|
|
January 2, 2013
|
|
January 1,2018
|
|
|
Min Tang
|
|
10,000
|
|
$
|
12.23/Share
|
|
January 4, 2010
|
|
January 3, 2015
|
|
|
|
|
5,000
|
|
$
|
10.84/Share
|
|
January 3, 2011
|
|
January 2, 2016
|
|
|
|
|
5,000
|
|
$
|
2.55/Share
|
|
January 3, 2012
|
|
January 2,2017
|
|
|
|
|
5,000
|
|
$
|
1.44/Share
|
|
January 2, 2013
|
|
January 1,2018
|
|
|
Yingqi Xia
|
|
5,000
|
|
$
|
12.23/Share
|
|
January 4, 2010
|
|
January 3, 2015
|
|
|
|
|
5,000
|
|
$
|
10.84/Share
|
|
January 3, 2011
|
|
January 2, 2016
|
|
|
|
|
5,000
|
|
$
|
2.55/Share
|
|
January 3, 2012
|
|
January 2,2017
|
|
|
|
|
5,000
|
|
$
|
1.44/Share
|
|
January 2, 2013
|
|
January 1,2018
|
|
|
Y. James Kang
|
|
5,000
|
|
$
|
12.23/Share
|
|
January 4, 2010
|
|
January 3, 2015
|
|
|
|
|
5,000
|
|
$
|
10.84/Share
|
|
January 3, 2011
|
|
January 2, 2016
|
|
|
|
|
5,000
|
|
$
|
2.55/Share
|
|
January 3, 2012
|
|
January 2,2017
|
|
|
|
|
5,000
|
|
$
|
1.44/Share
|
|
January 2, 2013
|
|
January 1,2018
|
|
|
Larry Kenneth Cordell
|
|
5,000
|
|
$
|
2.55/Share
|
|
January 3, 2012
|
|
January 2,2017
|
|
|
|
|
5,000
|
|
$
|
1.44/Share
|
|
January 2, 2013
|
|
January 1,2018
|
|
|
James Chen
|
|
200,000
|
|
$
|
2.55/Share
|
|
January 3, 2012
|
|
January 2,2017
|
|
|
|
|
200,000
|
|
$
|
1.44/Share
|
|
January 2, 2013
|
|
January 1,2018
|
|
| 61 | ||
|
|
C.
Board Practices
.
Terms of directors and executive officers
Our directors are not subject to a term of office and hold office until the next annual meeting of shareholders or until such director’s earlier resignation, removal from office, death or incapacity. Any vacancy on the board of directors resulting from death, resignation, removal or other cause and any newly created directorship resulting from any increase in the authorized number of directors between meetings of shareholders may be filled either by the affirmative vote of a majority of all the directors then in office (even if less than a quorum) or by a resolution of shareholders.
Our officers are appointed by the board of directors and hold office until their successors are duly elected and qualified, but may be removed at any time, with or without cause, by resolution of directors. Any vacancy occurring in any office may be filled by resolution of directors.
Employment Agreements
Dr. Han entered into a renewal of his employment agreement with us. The agreement currently has a term of three years commencing on January 1, 2012. Dr. Han is entitled to insurance benefits, five weeks’ vacation, a car and reimbursement of business expenses and, if necessary, relocation expenses. The agreement is terminable by Origin for death, disability and cause. Dr. Han may terminate the agreement and his employment for good reason, which includes Origin’s breach, the executive’s loss of his seat on the board of directors, and change of control. In the event of termination for good reason or without cause, the executive will receive compensation and benefits under his employment agreement through the earlier of two years from the date of termination or through the term of the agreement. The agreements contain provisions for the protection of confidential information and a three-year non-competition period within China.
Board committees
Our board of directors has established an Audit Committee, a Compensation Committee and a Nominations Committee.
Audit Committee
The members of our Audit Committee are Larry Kenneth Cordell (chairman), Min Tang, and Yingqi Xia. Our board of directors has determined that all of our Audit Committee members are independent directors within the meaning of Nasdaq Marketplace Rule 4200(a)(15) and meet the criteria for independence set forth in Rule 10A-3(b)(1) of the Securities Exchange Act of 1934.
The board of directors has determined that each of Messrs. Larry Kenneth Cordell, Min Tang, and Yingqi Xia has an understanding of Generally Accepted Accounting Principles and financial statements, the ability to assess the general application of such principles in connection with our financial statements, including estimates, accruals and reserves, experience in analyzing or evaluating financial statements of similar breadth and complexity as our financial statements, an understanding of internal controls and procedures for financial reporting and an understanding of Audit Committee functions.
The board of directors believes that Mr. Cordell qualifies as an “audit committee financial expert” within the meaning of all applicable rules. The board of directors believes that Mr. Cordell has financial expertise from his degrees in business, his activities as a chief executive officer and chief financial officer of various companies, and his consulting activities in the areas of accounting, corporate finance, capital formation and corporate financial analysis.
| 62 | ||
|
|
We adopted an Audit Committee charter, amended by the board of directors at the board meeting held on August 16, 2007, under which the Audit Committee is responsible for reviewing the scope, planning and staffing of the audit and preparation of our financial statements. This includes consultation with management, the auditors and other consultants and professionals involved in the preparation of the financial statements and reports. The Audit Committee is responsible for performing oversight of our relationship with our independent auditor. The Audit Committee also has a general compliance oversight role in assuring that our directors, officers and management comply with our code of ethics, reviews and approves related party transactions, deals with complaints regarding accounting, internal controls and auditing matters, and oversees compliance with accounting and legal requirements applicable to us.
Pursuant to the terms of its charter, as amended, the Audit Committee’s responsibilities include, among other things:
| · | annually reviewing and reassessing the adequacy of the Audit Committee’s formal charter; |
| ⋅ |
reviewing our annual audited financial statements with our management and our independent auditors and the adequacy of our internal accounting controls;
|
| · | reviewing analyses prepared by management and independent auditors concerning significant financial reporting issues and judgments made in connection with the preparation of our financial statements; |
| ⋅ |
engagement of the independent auditor;
|
| · | reviewing the independence of the independent auditors; |
| ⋅ |
reviewing our auditing and accounting principles and practices with the independent auditor and reviewing major changes to our auditing and accounting principles and practices as suggested by the independent auditor or our management;
|
| · | appointment of the independent auditor; |
| ⋅ |
approving professional services provided by the independent auditors, including the range of audit and non-audit fees; and
|
The Audit Committee makes pre-approval of the services to be provided by our independent auditors. The Audit Committee also reviews and recommends to the board of directors whether or not to approve transactions between us and any officer or director that occurs outside the ordinary course of business.
Compensation Committee
The members of our Compensation Committee are Yingqi Xia (chairman), Min Tang, and James Kang. The Compensation Committee also administers our equity award plans, including the authority to make and modify awards under the 2005 and 2009 Performance Equity Plans. The current charter of the Compensation Committee, which was adopted March 16, 2007, provides that the committee is responsible for:
| · | reviewing and making recommendations to our board of directors regarding our compensation policies and forms of compensation provided to our directors, officers and other senior employees; |
| ⋅ |
reviewing and determining performance-based awards and compensation for our officers and other employees;
|
| · | reviewing and determining share-based compensation (including the 2005 and 2009 Performance Equity Plan) for our directors, officers, employees and consultants; |
| ⋅ |
administering our equity incentive plans (including the 2005 and 2009 Performance Equity Plans) in accordance with the terms thereof; and
|
| · | such other matters that are specifically delegated to the Compensation Committee by our board of directors from time to time. |
Nominating Committee
Our Nominating Committee consists of Michael W. Trimble (chairman), Larry Kenneth Cordell, and Yingqi Xia. The Nominating Committee is responsible for overseeing the selection of persons to be nominated to serve on our board of directors. The Nominating Committee will identify, evaluate and recommend candidates to become members of the Board of Directors with the goal of creating a balance of knowledge and experience. The Nominating Committee is not a fully independent committee.
| 63 | ||
|
|
Pursuant to a vote by the board of directors taken at a board meeting held March 16, 2007, the Nominating Committee charter was amended. Pursuant to the terms of its charter, as amended, the Nominating Committee’s responsibilities include, among other things:
| · | actively seeking and evaluating qualified individuals to become new directors as needed; |
·
reviewing current directors’ suitability when their terms expire or one has a significant change in status;
| · | making recommendations with respect to succession planning for the co-chief executive officer and other officers; and |
·
such other matters that are specifically delegated to the Nominating Committee by our board of directors from time to time.
Summary of Significant Differences in Corporate Governance Practices for Purposes of Rule 5615 of the NASDAQ Marketplace Rules
We are incorporated under the laws of the British Virgin Islands. Our ordinary shares are registered with the SEC and are listed on the NASDAQ Global Select Market. As a result, our corporate governance framework is subject to laws of the British Virgin Islands, or BVI, and the securities laws and regulations of the United States.
Under Rule 5615 of the Nasdaq Marketplace Rules, a foreign private issuer may follow its home country practice in lieu of the requirements of the Nasdaq Marketplace Rules. Rule 5605 requires U.S. domestic listed companies have a majority of independent directors on its board of directors. We are not required to have a majority of independent directors on our board of directors under BVI laws. However, currently, five of our nine directors are independent directors under applicable NASDAQ rules.
Under Rule 5605 a U.S. domestic listed company is required to have a nominations committee and compensation committee. We are not required to have such committees under the BVI laws, however, we do have these two committees, and follow the Nasdaq Marketplace rules in the independence requirements.
Under Rule 5620, a U.S. domestic issuer must solicit proxies and provide proxy statements for all meetings of shareholders. There are no such mandatory requirements under BVI laws, and therefore, we are not required to hold an annual meeting of the shareholders. There were no specific items that our board of directors requested the shareholders to vote on.
Under Rule 5635, a US domestic listed company is required to obtain shareholder approval of equity award plans and issuances of equity securities in excess of certain amounts when at less than market or book value. There are no such mandatory requirements under BVI law. We do not plan to get shareholder approval for future increases in the 2005 Plan, 2009 Plan or any other equity award plan approved by the directors in the future or for issuances of equity securities that exceed 20% of the outstanding shares of the Company if they are sold at less than market or book value.
We have filed documentation with NASDAQ exempting the company under those provisions that BVI law does not require.
D.
Employees
.
We had 856, 656, and 607 employees as of September 30, 2011, 2012 and 2013, respectively, excluding Xinjiang Origin. The number of employees changed during the 2012 fiscal year due to the restructuring discussed else wherein this report. Substantially all of our employees are located in China. The following table sets forth the number of our employees categorized by our areas of operations and as a percentage of our workforce as of September 30, 2013:
| 64 | ||
|
|
|
Areas of Operations
|
|
Number of
Employees |
|
Percentage of
Total |
|
|
Research and Development
|
|
126
|
|
20.8
|
%
|
|
Sales and Marketing
|
|
170
|
|
28.0
|
%
|
|
Production
|
|
172
|
|
28.3
|
%
|
|
Quality Control
|
|
32
|
|
5.3
|
%
|
|
Others
|
|
107
|
|
17.6
|
%
|
|
Total
|
|
607
|
|
100.0
|
%
|
We offer our employees additional annual merit-based bonuses in accordance with the overall performance of our company, his or her department and the individual. We are required by applicable PRC regulations to contribute amounts approximate to 20%, 7.7%, 9.7%, 1%, 0.6% and 0.7%, of our employees’ aggregate salary to a pension contribution plan, a medical insurance plan, a housing fund, an unemployment insurance plan, a personal injury insurance plan and a maternity insurance plan, respectively, for our employees.
Our employees are not covered by any collective bargaining agreement. We believe that we have a good relationship with our employees.
Xinjiang Origin started the construction of its corn seed processing facility in fiscal year 2012. It
had 57 and 71 employees as of September 30, 2012 and 2013, respectively.
E.
Share ownership
.
The following table sets forth information with respect to the beneficial ownership of our ordinary shares as of September 30, 2013, by each of our directors and executive officers who beneficially own our ordinary shares, and other principal shareholders.
|
|
|
Shares Beneficially Owned
( * ) |
|
||
|
|
|
Number
|
|
Percentage of
Total |
|
|
Directors and Executive Officers:
|
|
|
|
|
|
|
Gengchen Han,
Chairman of the Board, Chief Executive Officer
(1) (2)
|
|
4,483,827
|
|
19.57
|
%
|
|
Yasheng Yang,
Vice Chairman of the Board and Director
(1) (3)
|
|
1,136,980
|
|
4.96
|
%
|
|
James Kang,
Director
(1)(4)
|
|
|
|
|
|
|
Min Tang,
Director
(1)(5)
|
|
|
|
|
|
|
Yingqi Xia, Director (1)(6)
|
|
|
|
|
|
|
Michael W. Trimble
Director
(7)
|
|
75,000
|
|
0.02
|
%
|
|
Larry Kenneth Cordell,
Director
(1)(8)
|
|
|
|
|
|
|
James Chen,
CFO
(1)(9)
|
|
186,313
|
|
0.81
|
%
|
|
Principal Shareholders:
|
|
|
|
|
|
|
Liang Yuan(10)
|
|
2,867,315
|
|
12.52
|
%
|
* Beneficial ownership and percentage is determined in accordance with Rule 13d-3 under the Securities Exchange Act of 1934, as amended.
| (1) | The business address of each of the individuals is c/o 21 Shengmingyuan Road, Changping District, Beijing PRC 102206. See Item 6B. “Directors, Senior Management, and Employees – Compensation” for discussion of option included in the table granted under the 2005 Performance Equity Plan and 2009 Performance Equity Plan. |
(2)
The shares reported in the above table are held by Dr. Han through a personal holding company, Sinodream Limited, a company formed under the laws of the British Virgin Islands of which he is the sole shareholder, officer and director. Therefore, Dr. Han will have voting and dispositive authority over all the shares. Excludes 280,000 shares that may be acquired under stock options held by Dr. Han.
| 65 | ||
|
|
| (3) | The shares reported in the above table are held by Mr. Yang through a personal holding Company, Leekdon Limited, a company formed under the laws of the British Virgin Islands of which he is the sole shareholder, officer and director. Therefore, Mr. Yang will have voting and dispositive authority over all the shares. Excludes20,000 shares that may be acquired under stock options held by Mr. Yang. |
(4)
Excludes 20,000 shares that may be acquired under stock options by Mr. Kang.
| (5) | Excludes 25,000 shares that may be acquired under stock options by Mr. Tang |
(6)
Excludes 25,000 shares that may be acquired under stock options by Mr. Xia
| (7) | The business address of Mr. Trimble is 6159 Brandywine Drive, Johnston, IA 50131. Excludes 20,000 shares that may be acquired under stock options held by Mr. Trumble. |
(8)
Excludes 10,000 shares that may be acquired under stock options held by Mr. Cordell
| (9) | Excludes 400,000 shares that may be acquired under stock options held by Mr. Chen. |
(10)
The shares reported in the above table are held by Mr. Yuan through a personal holding company, Bonasmart Limited, a company formed under the laws of the British Virgin Islands of which he is the sole shareholder, officer and director. Therefore, Mr. Yuan will have voting and dispositive authority over all the shares. Excludes 45,000 shares that may be acquired under stock options held by Mr. Yuan, which relate to his former employment with the company.
None of the above shareholders have voting rights that differ from the voting rights of other shareholders.
A substantial number of the ordinary shares are held in “street name,” and the company believes that a large portion of these shares represent holdings of non-United States shareholders through brokers in non-United States jurisdictions. Because these holdings are in street name, the company cannot determine the actual number or jurisdictions in which these shares are held.
A.
Major shareholders
.
Please refer to Item 6.E “Directors, Senior Management and Employees — Share Ownership.”
B.
Related party transactions
.
Stock Consignment Agreements
In order to comply with PRC regulations, we operate our business in China through our PRC Operating companies. We have entered into stock consignment agreements with our PRC Operating Companies other than Origin Biotechnology. The following is a summary of the material provisions of these agreements, which are also discussed under Item 4.C of this Annual Report.
The stock consignment agreements give the consignee corporation, State Harvest, control over the shares of the three PRC Operating Companies. The agreements give State Harvest the right to manage in all respects the shares held in title by the shareholders, including all shareholder rights to call meetings of shareholders, to submit shareholder proposals, to elect directors, to vote the shares on all matters and to exercise all other rights of a shareholder in respect of the consigned shares. More specifically, the consignment agreements give State Harvest the right to select, replace and increase the number of the directors, supervisors and recommend new director and supervisor persons, and to exercise management rights, controlling rights and decision-making power over the shares of the PRC Operating Companies. The shareholders agreed not to interfere with State Harvest’s exercise of its rights and to cooperate fully and promptly to permit State Harvest to exercise its authority over the consigned shares. This includes all limitations on the ability of each consignee to transfer or dispose of the shares other than to State Harvest, give guarantees using the shares, consign the shares to another, alter their ownership proportions in any way, dispose of any rights in the ownership of the shares, agree to any debt, waive rights or restructure the shares. State Harvest has the right to take all action in respect of the consigned shares to avoid any damage or infringement of its rights, including in the event of the consigning shareholder’s bankruptcy. State Harvest, under the consignment agreements, has all rights in the consigned shares, including rights to profits, interest, dividends, bonuses and residual assets. If in the future any stock subject to the consignment agreements can be legally transferred to State Harvest, then without further action or payment by State Harvest, it shall be transferred to State Harvest in whole or in part for no additional consideration to the consigning shareholder. The term of each consignment agreement is initially three years, but is automatically renewed indefinitely until both consigners and the consignee agree to terminate. For more information about the stock consignment agreements, See Item 8.01 “Other Events” of our Form 8-K filed with the Securities and Exchange Commission on August 8, 2005. Shares in the PRC operating companies are pledged under these stock consignment agreements.
| 66 | ||
|
|
Technical Service Agreements
As part of the reorganization of our PRC Operating Companies in late 2004 and early 2005, all of the intellectual property rights of Beijing Origin, Changchun Origin and Henan Origin have been and will continue to be transferred to Origin Biotechnology pursuant to technology service agreements dated December 25, 2004. The purpose of this was to permit the better management and licensing of the intellectual property that the three assignors have developed. Under the technology service agreements, Origin Biotechnology will provide technical research and production and distribution services for the seeds produced by the group. These services will include support in the research and development of agricultural seeds, analysis of breeding technologies, environment and feasibility suggestions, technical tutorials and breeding field supervision, market analysis and seed promotion, insect prevention and technical education to distributors and farmers. The initial term is for three years, but the agreements are automatically renewed unless both parties agree to a termination. The fees payable under the agreements are variable, depending on differing formulae for different categories of seeds. Generally, the fees will be as follows: RMB1.2 per kilogram of corn sold by the party receiving the technical services; RMB6 per kilogram of rice sold by the party receiving the technical services. The fees are to be confirmed and paid at the end of each growing season and only charged fees on the sales related to the seed rights owned by Origin Biotechnology.
Corn Originator Agreement
Beijing Origin entered into this agreement with Trimble Genetics International LLC, or Trimble Genetics, a plant genetics research company. Michael W. Trimble, one of our directors, is the founder and president of Trimble Genetics and currently owns 100% of its equity interest. Under this agreement, Beijing Origin hires Trimble Genetics as its agent to test, promote, license and collect research fees on hybrids involving inbred lines of corn developed by Beijing Origin. Trimble Genetics retains fifty percent of such research fees and pays the remaining fifty percent to Beijing Origin. This agreement is immaterial in amount or significance.
Corn Inbred and Hybrid Transfer and Use Agreement
Beijing Origin entered into this agreement with Trimble Genetics on September 6, 2002. Under this agreement, Trimble Genetics provides corn inbreds and hybrids to Beijing Origin for experimental testing purposes. The agreement applies to all corn inbreds and hybrids transferred from Trimble Genetics to Beijing Origin previously, currently or in the future. If a hybrid from the testing proves to be marketable, the parties will negotiate a license agreement. If for any reason, it is not possible to conclude a license agreement, Beijing Origin agrees to return all remnant inbred seed and to destroy any inbreds or hybrids that may have originated from the material provided by Trimble Genetics. Up to the date of this Annual Report, we have not made any payment or incurred any payment liability to Trimble Genetics under this agreement.
New Corn Seed Liyu 35 Joint Development Agreement
Beijing Origin entered into three Joint Development agreements with Liyu on March 30, 2006 to jointly develop a new hybrid corn seed, Liyu 35. The proprietary right to the seed developed under this agreement belongs to Liyu but Beijing Origin has exclusive production and marketing rights to this variety of seed. The agreement has no fixed term or termination date, but the agreement automatically terminates if the seeds produced by Beijing Origin are less than 3 million kilograms for three consecutive years, subject to limited exceptions. The fees payable by Beijing Origin represent a percentage of revenues from the sale of the varieties and plus a flat fee.
| 67 | ||
|
|
Joint Development Agreements
Beijing Origin is a party to three joint development agreements with Corn Research Institute of Li County in Hebei Province, China, to develop new hybrid corn seeds. Corn Research Institute of Li County was incorporated as Liyu on May 2004, of which a 30% equity interest was owned by Yang Yasheng, one of our major shareholders and directors. Yang Yasheng transferred his 30% interest to Beijing Origin on September 2004. On March 11, 2004, Corn Research Institute of Li County, Liyu and Beijing Origin entered into an agreement pursuant to which all the rights and obligations of Corn Research Institute of Li County under the three joint development agreements were assumed by Liyu after the dissolution of Corn Research Institute of Li County. In accordance with these joint development agreements, the parties agreed to jointly develop six varieties of new corn hybrid seeds, Liyu 26, Liyu 16, Liyu 6, Liyu 15, Li 168, and Liyu 35. The proprietary rights to the varieties of seeds developed under these agreements belongs to Corn Research Institute of Li County, now Liyu but Beijing Origin has exclusive right to production and marketing of these seeds. The fees payable by Beijing Origin represent a percentage of revenues from the sale of the varieties, and plus a flat fee with respect to Liyu 26 and Liyu 16. The agreements have no fixed term or termination date. The agreements may be terminated for breach by either party. We may terminate the agreements at any time, in effect, by not producing seeds, without penalty.
Trait Licensing GMO Agreement
In May 2011 Origin Agritech entered into a licensing agreement to develop GMO traits in high-yielding corn varieties incorporating the glyphosate-resistant and Bt- traits of our products, which are protected by patents issued in the PRC and the United States.
Xinjiang Origin
In May 2011 Beijing Origin established Xinjiang Origin for seed production and distribution. Beijing Origin invested RMB 51 million for a 51% ownership of Xinjiang Origin.
Technology Transfer Agreement
Beijing Origin, or its predecessor, entered into this agreement with Henan Agriculture University in 1998. Henan Agriculture University currently owns a 2.04% equity interest in Beijing Origin. Under this agreement, the proprietary right to the new variety of seed, Yuyu 22, belongs to Henan Agriculture University. Beijing Origin has the right to propagate, produce and sell the new corn variety. The fee payable under this agreement is RMB20 per mu (unit of area equivalent to 0.164 of an acre) of seed production area per year. There is no fixed term or termination date of this agreement.
C.
Interests of experts and counsel
.
Not applicable.
A.
Consolidated statements and other financial information
.
We have appended consolidated financial statements filed as part of this Annual Report. See Item 18 “Financial Statements.”
Legal Proceedings
We may from time to time be subject to various legal or administrative proceedings, either as plaintiff or defendant, arising in the ordinary course of our business. Except otherwise disclosed in this report, we are not currently a party to, nor are we aware of, any legal proceeding, investigation or claim that, in the view of our management, is likely to materially and adversely affect our business, financial position or results of operations.
| 68 | ||
|
|
Dividend Policy
We have never declared or paid any dividends, nor do we have any present plan to pay any cash dividends on our ordinary shares in the foreseeable future. We currently intend to retain most, if not all, of our available funds and any future earnings to operate and expand our business.
Our board of directors may by resolution authorize payment of dividends if the directors are satisfied, on reasonable grounds, that Origin will, immediately after the distribution of dividends, satisfy the solvency test as stipulated in Section 56 of the BVI Business Companies Act and any of our applicable contractual obligations. Even if our board of directors decides to pay dividends, the form, frequency and amount will depend upon our future operations and earnings, capital requirements and surplus, general financial condition, contractual restrictions and other factors that the board of directors may deem relevant.
B.
Significant changes
.
No significant changes since September 30, 2013
A.
Offering and listing details
.
Our ordinary shares traded on the OTC BB under the symbol CAQC as the common stock of our predecessor, Chardan until November 8, 2005, when Chardan merged with Origin for the purpose of redomestication out of the United States. On November 8, 2005, Origin’s ordinary shares were approved to be listed on the then Nasdaq National Market under the ticker symbol of SEED. On June 26, 2007, Origin’s ordinary shares were approved for listing on the NASDAQ Global Select Market, where they continue to trade under the SEED ticker symbol.
The following table provides the historical high and low trading prices for Origin’s ordinary shares for the periods indicated below.
|
|
|
Nasdaq
|
|
||
|
|
|
Price per Share
|
|
||
|
|
|
High
|
|
Low
|
|
|
Annual Market Prices
|
|
|
|
|
|
|
Year 2009 (until September 30 2009)
|
|
6.46
|
|
1.7
|
|
|
Year 2010 (until September 30, 2010)
|
|
15.02
|
|
4.40
|
|
|
Year 2011(until September 30 2011)
|
|
11.31
|
|
2.33
|
|
|
Year 2012 (until September 30, 2012)
|
|
4.49
|
|
1.30
|
|
|
Year 2013 (until September 30, 2013)
|
|
1.89
|
|
1.34
|
|
|
|
|
|
|
|
|
|
Quarterly Market Prices
|
|
|
|
|
|
|
|
|
|
|
|
|
|
First Quarter 2012 ended December 31, 2011
|
|
3.14
|
|
2.10
|
|
|
Second Quarter 2012 ended March 31, 2012
|
|
4.49
|
|
2.24
|
|
|
Third Quarter 2012, ended June 30, 2012
|
|
2.48
|
|
1.30
|
|
|
Fourth Quarter 2012, ended September 30, 2012
|
|
1.87
|
|
1.30
|
|
|
|
|
|
|
|
|
|
First Quarter 2013, ended December 31, 2012
|
|
1.54
|
|
1.36
|
|
|
Second Quarter 2013, ended March 31, 2013
|
|
1.89
|
|
1.44
|
|
|
Third Quarter 2013, ended June 30, 2013
|
|
1.81
|
|
1.39
|
|
|
Fourth Quarter 2013, ended September 30, 2013
|
|
1.69
|
|
1.34
|
|
|
Monthly Market Prices
|
|
NASDAQ
Price per Share |
|
||
|
|
|
High
|
|
Low
|
|
|
Jul-13
|
|
1.69
|
|
1.39
|
|
|
Aug-13
|
|
1.55
|
|
1.34
|
|
|
Sep-13
|
|
1.45
|
|
1.34
|
|
|
Oct-13
|
|
2.39
|
|
1.32
|
|
|
Nov-13
|
|
1.88
|
|
1.60
|
|
|
Dec-13
|
|
1.81
|
|
1.17
|
|
| 69 | ||
|
|
B.
Plan of distribution
.
Not applicable.
C.
Markets
.
See Item 9.A above.
D.
Selling shareholders
.
Not applicable.
E.
Dilution
.
Not applicable.
F.
Expenses of the issue
.
Not applicable.
A.
Share capital
.
Not applicable.
B.
Memorandum and articles of association
.
We incorporate by reference into this Annual Report the description of our amended and restated memorandum and articles of association contained in our 20-F annual report, as amended, initially filed with the Commission on July 14, 2006.
C.
Material contracts
.
We have not entered into any material contracts other than in the ordinary course of business and other than those described in Item 4, “Information on the Company,” Item 7, “Major Shareholders and Related Party Transactions,” filed (or incorporated by reference) as exhibits to this Annual Report or otherwise described or referenced in this Annual Report.
D.
Exchange controls
.
British Virgin Islands
There are no material exchange controls restrictions on payment of dividends, interest or other payments to the holders of our ordinary or preferred shares or on the conduct of our operations in the BVI, where we are incorporated. There are no material BVI laws that impose any material exchange controls on us or that affect the payment of dividends, interest or other payments to nonresident holders of our ordinary or preferred shares. BVI law and our amended and restated memorandum and articles of association impose no material limitations on the right of non-residents or foreign owners to hold or vote our ordinary or preferred shares.
| 70 | ||
|
|
China
China’s government imposes control over the convertibility of Renminbi into foreign currencies. Under the current unified floating exchange rate system, the China Foreign Exchange Transaction Center, authorized by the People’s Bank of China, publishes a daily exchange rate for Renminbi, or the PBOC Exchange Rate, based on the weighted average of quotations from all the market makers in the inter-bank foreign exchange market before open quotation. Financial institutions authorized to deal in foreign currency may enter into foreign exchange transactions at exchange rates within an authorized range above or below the PBOC Exchange Rate according to market conditions.
Pursuant to the Foreign Exchange Control Regulations issued by the State Council on January 29, 1996 and effective as of April 1, 1996 (and amended on January 14, 1997) and the Administration of Settlement, Sale and Payment of Foreign Exchange Regulations which came into effect on July 1, 1996 regarding foreign exchange control, or the Regulations, conversion of Renminbi into foreign exchange by foreign investment enterprises for current account items, including the distribution of dividends and profits to foreign investors of joint ventures, is permissible upon the proper production of qualified commercial vouchers or legal documents as required by the Regulations. Foreign investment enterprises are permitted to remit foreign exchange from their foreign exchange bank account in China upon the proper production of, inter alia, the board resolutions declaring the distribution of the dividend and payment of profits. Conversion of Renminbi into foreign currencies and remittance of foreign currencies for capital account items, including direct investment, loans, and security investment, is still subject to the approval of SAFE, or any authorized local branches, or the Branches, in each such transaction. On January 14, 1997, the State Council amended the Foreign Exchange Control Regulations and added, among other things, an important provision as Article 5 which provides that the State shall not impose restrictions on recurring international payments and transfers under current accounts.
Under the Regulations, foreign investment enterprises are required to open and maintain separate foreign exchange accounts for capital account items (but not for other items). In addition, foreign investment enterprises may only buy, sell and/or remit foreign currencies at those banks authorized to conduct foreign exchange business upon the production of valid commercial documents and, in the case of capital account item transactions, document approval from SAFE or the Branches.
Currently, foreign investment enterprises are required to apply to SAFE for “foreign exchange registration certificates for foreign investment enterprises.” With such foreign exchange registration certificates (which are granted to foreign investment enterprises upon fulfilling specified conditions and which are subject to review and renewal by SAFE or its Branches on an annual basis) or with the foreign exchange sales notices from SAFE (which are obtained on a transaction-by-transaction basis), FIEs may open foreign exchange bank accounts (the advance examination and approval for the opening of foreign exchange current accounts has been cancelled according to the Notice of SAFE on Adjusting Policies Concerning the Administration of Foreign Exchange Current Accounts, which came into effect on May 1, 2006) and enter into foreign exchange transactions at banks authorized to conduct foreign exchange business to obtain foreign exchange for their needs.
E.
Taxation
.
The following is a general summary of certain material British Virgin Islands and U.S. federal income tax considerations. The discussion is not intended to be, nor should it be construed as, legal or tax advice to any existing or prospective shareholder. The discussion is based on laws and relevant interpretations thereof in effect as of the date hereof, all of which are subject to change or different interpretations, possibly with retroactive effect. The discussion does not address United States state or local tax laws, or tax laws of jurisdictions other than the British Virgin Islands and the United States.
British Virgin Islands Taxation
The British Virgin Islands, or BVI, does not impose a withholding tax on dividends paid by us to holders of our ordinary or preferred shares, nor does the BVI levy any capital gains or income taxes on us.
Further, a holder of our ordinary or preferred shares who is not a resident of the BVI is exempt from the BVI income tax on dividends paid with respect to the ordinary or preferred shares. Holders of ordinary or preferred shares are not subject to the BVI income tax on gains realized on the sale or disposition of the ordinary or preferred shares.
| 71 | ||
|
|
Our ordinary and preferred shares are not subject to transfer taxes, stamp duties or similar charges in the BVI. However, as a business company, we are required to pay the BVI government an annual license fee based on the number of shares we are authorized to issue.
There is no income tax treaty or convention currently in effect between the United States and the BVI.
United States federal income taxation
This discussion describes the material U.S. federal income tax consequences of the purchase, ownership and disposition of our ordinary shares. This discussion does not address any aspect of U.S. federal gift or estate tax, or the state, local or foreign tax consequences of an investment in our ordinary shares. This discussion applies to you only if you hold and beneficially own our ordinary shares as capital assets for tax purposes. This discussion does not apply to you if you are a member of a class of holders subject to special rules, such as:
| · | dealers in securities or currencies; |
| ⋅ |
traders in securities that elect to use a mark-to-market method of accounting for securities holdings;
|
| · | banks or other financial institutions; |
| ⋅ |
insurance companies;
|
| · | tax-exempt organizations; |
| ⋅ |
partnerships and other entities treated as partnerships for U.S. federal income tax purposes or persons holding ordinary shares through any such entities;
|
| · | persons that hold ordinary shares as part of a hedge, straddle, constructive sale, conversion transaction or other integrated investment; |
| ⋅ |
U.S. Holders (as defined below) whose functional currency for tax purposes is not the U.S. dollar;
|
| · | persons liable for alternative minimum tax; or |
| ⋅ |
persons who actually or constructively own 10% or more of the total combined voting power of all classes of our shares (including ordinary shares) entitled to vote.
|
This discussion is based on the U.S. Internal Revenue Code of 1986, as amended, which we refer to in this discussion as the Code, its legislative history, existing and proposed regulations promulgated thereunder, published rulings and court decisions, all as currently in effect. These laws are subject to change, possibly on a retroactive basis. In addition, this discussion relies on our assumptions regarding the value of our shares and the nature of our business over time.
You should consult your own tax advisor concerning the particular U.S. federal income tax consequences to you of the purchase, ownership and disposition of our ordinary shares, as well as the consequences to you arising under the laws of any other taxing jurisdiction.
For purposes of the U.S. federal income tax discussion below, you are a “U.S. Holder” if you beneficially own ordinary shares and are:
| · | a citizen or resident of the United States for U.S. federal income tax purposes; |
| ⋅ |
a corporation, or other entity taxable as a corporation, that was created or organized in or under the laws of the United States or any political subdivision thereof;
|
| · | an estate the income of which is subject to U.S. federal income tax regardless of its source; or |
| ⋅ |
a trust if (a) a court within the United States is able to exercise primary supervision over its administration and one or more U.S. persons have the authority to control all substantial decisions of the trust, or (b) the trust has a valid election in effect to be treated as a U.S. person.
|
If you are not a U.S. person, please refer to the discussion below under “Non-U.S. Holders.”
For U.S. federal income tax purposes, income earned through a foreign or domestic partnership or other flow-through entity is attributed to its owners. Accordingly, if a partnership or other flow-through entity holds ordinary shares, the tax treatment of the holder will generally depend on the status of the partner or other owner and the activities of the partnership or other flow-through entity.
| 72 | ||
|
|
U.S. Holders
Dividends on ordinary shares
We do not anticipate paying dividends on our ordinary shares or indirectly on our ordinary shares in the foreseeable future. See “Dividend policy.”
Subject to the “Passive Foreign Investment Company” discussion below, if we do make distributions and you are a U.S. Holder, the gross amount of any distributions you receive on your ordinary shares will generally be treated as dividend income if the distributions are made from our current or accumulated earnings and profits, calculated according to U.S. federal income tax principles. Dividends will generally be subject to U.S. federal income tax as ordinary income on the day you actually or constructively receive such income. However, if you are an individual and have held your ordinary shares for a sufficient period of time, dividend distributions on our ordinary shares will generally constitute qualified dividend income taxed at a preferential rate as long as our ordinary shares continue to be readily tradable on the NASDAQ Global Select Market and certain other conditions apply. You should consult your own tax adviser as to the rate of tax that will apply to you with respect to dividend distributions, if any, you receive from us.
We do not intend to calculate our earnings and profits according to U.S. tax accounting principles. Accordingly, distributions on our ordinary shares, if any, will generally be taxed to you as dividend distributions for U.S. tax purposes. Even if you are a corporation, you will not be entitled to claim a dividends-received deduction with respect to distributions you receive from us. Dividends generally will constitute foreign source passive income for U.S. foreign tax credit limitation purposes.
Sales and other dispositions of ordinary shares
Subject to the “Passive Foreign Investment Company” discussion below, when you sell or otherwise dispose of ordinary shares, you will generally recognize capital gain or loss in an amount equal to the difference between the amount realized on the sale or other disposition and your adjusted tax basis in the ordinary shares, both as determined in U.S. dollars. Your adjusted tax basis will generally equal the amount you paid for the ordinary shares. Any gain or loss you recognize will be long-term capital gain or loss if your holding period in our ordinary shares is more than one year at the time of disposition. If you are an individual, any such long-term capital gain will be taxed at preferential rates. Your ability to deduct capital losses will be subject to various limitations.
Passive Foreign Investment Company
If we were a PFIC, in any taxable year in which you hold our ordinary shares, as a U.S. Holder, you would generally be subject to adverse U.S. tax consequences, in the form of increased tax liabilities and special U.S. tax reporting requirements.
We will be classified as a PFIC in any taxable year if either: (1) the average percentage value of our gross assets during the taxable year that produce passive income or are held for the production of passive income is at least 50% of the value of our total gross assets or (2) 75% or more of our gross income for the taxable year is passive income (such as certain dividends, interest or royalties). For purposes of the first test: (1) any cash, cash equivalents, and cash invested in short-term, interest-bearing debt instruments or bank deposits that is readily convertible into cash, will generally count as producing passive income or held for the production of passive income and (2) the average value of our gross assets is calculated based on our market capitalization. We will be treated as owning our proportionate share of the assets and earning our proportionate share of the income of any other corporation in which we own, directly or indirectly, 25% or more (by value) of the stock.
We believe that we were not a PFIC for the taxable year 2013. However, there can be no assurance that we will not be a PFIC for the taxable year 2013 and/or later taxable years, as PFIC status is re-tested each year and depends on the facts in such year. For example, we would be a PFIC for the taxable year 2013 if the sum of our average market capitalization, which is our share price multiplied by the total number of our outstanding shares, and our liabilities over that taxable year was not more than twice the value of our cash, cash equivalents, and other assets producing passive income or held for production of passive income. We could also be a PFIC for any taxable year if the gross income that we and our subsidiaries earn from passive investments is substantial in comparison with the gross income from our business operations.
| 73 | ||
|
|
If we were a PFIC, you would generally be subject to additional taxes and interest charges on certain “excess distributions” we make and on any gain realized on the disposition or deemed disposition of your ordinary shares, regardless of whether we continue to be a PFIC in the year in which you receive an “excess distribution” or dispose of or are deemed to dispose of your ordinary shares. Distributions in respect of your ordinary shares during a taxable year would generally constitute “excess distributions” if, in the aggregate, they exceed 125% of the average amount of distributions in respect of your ordinary shares over the three preceding taxable years or, if shorter, the portion of your holding period before such taxable year.
To compute the tax on “excess distributions” or any gain, (1) the “excess distribution” or the gain would be allocated ratably to each day in your holding period, (2) the amount allocated to the current year and any tax year before we became a PFIC would be taxed as ordinary income in the current year, (3) the amount allocated to other taxable years would be taxable at the highest applicable marginal rate in effect for that year, and (4) an interest charge at the rate for underpayment of taxes for any period described under (3) above would be imposed with respect to any portion of the “excess distribution” or gain that is allocated to such period. In addition, if we were a PFIC, no distribution that you receive from us would qualify for taxation at the preferential rate discussed in the “Dividends on ordinary shares” section above.
If we were a PFIC in any year, and if you are a U.S. Holder, you would be required to make an annual return on IRS Form 8621 regarding your ordinary shares. However, we do not intend to generate, or share with you, information that you might need to properly complete IRS Form 8621. You should consult with your own tax adviser regarding reporting requirements with regard to your ordinary shares.
If we were a PFIC in any year, you would generally be able to avoid the “excess distribution” rules described above by making a timely so-called “mark-to-market” election with respect to your ordinary shares provided our ordinary shares are “marketable.” Our ordinary shares will be “marketable” as long as they remain regularly traded on the NASDAQ Global Select Market. If you made this election in a timely fashion, you would generally recognize as ordinary income or ordinary loss the difference between the fair market value of your ordinary shares on the first day of any taxable year and their value on the last day of that taxable year. Any ordinary income resulting from this election would generally be taxed at ordinary income rates and would not be eligible for the reduced rate of tax applicable to qualified dividend income. Any ordinary losses would be limited to the extent of the net amount of previously included income as a result of the mark-to-market election, if any. Your basis in the ordinary shares would be adjusted to reflect any such income or loss. You should consult with your own tax adviser regarding potential advantages and disadvantages to you of making a “mark-to-market” election with respect to your ordinary shares. Separately, if we were a PFIC in any year, you would be able to avoid the “excess distribution” rules by making a timely election to treat us as a so-called “Qualified Electing Fund”, or QEF. You would then generally be required to include in gross income for any taxable year (1) as ordinary income, your pro rata share of our ordinary earnings for the taxable year, and (2) as long-term capital gain, your pro rata share of our net capital gain for the taxable year. However, we do not intend to provide you with the information you would need to make or maintain a QEF election and you will, therefore, not be able to make or maintain such an election with respect to your ordinary shares.
Non-U.S. Holders
If you beneficially own ordinary shares and are not a U.S. Holder for U.S. federal income tax purposes, or a Non-U.S. Holder, you generally will not be subject to U.S. federal income tax or withholding on dividends received from us with respect to ordinary shares unless that income is considered effectively connected with your conduct of a U.S. trade or business and, if an applicable income tax treaty so requires, as a condition for you to be subject to U.S. federal income tax with respect to income from your ordinary shares, such dividends are attributable to a permanent establishment that you maintain in the United States. You generally will not be subject to U.S. federal income tax, including withholding tax, on any gain realized upon the sale or exchange of ordinary shares, unless:
| · | that gain is effectively connected with the conduct of a U.S. trade or business and, if an applicable income tax treaty so requires as a condition for you to be subject to U.S. federal income tax with respect to income from your ordinary shares, such gain is attributable to a permanent establishment that you maintain in the United States; or |
| 74 | ||
|
|
| · | you are a nonresident alien individual and are present in the United States for at least 183 days in the taxable year of the sale or other disposition and either (1) your gain is attributable to an office or other fixed place of business that you maintain in the United States or (2) you have a tax home in the United States. |
If you are engaged in a U.S. trade or business, unless an applicable tax treaty provides otherwise, the income from your ordinary shares, including dividends and the gain from the disposition of ordinary shares, that is effectively connected with the conduct of that trade or business will generally be subject to the rules applicable to U.S. Holders discussed above. In addition, if you are a corporation, you may be subject to an additional branch profits tax at a rate of 30% or any lower rate under an applicable tax treaty.
U.S. information reporting and backup withholding rules
In general, dividend payments with respect to the ordinary shares and the proceeds received on the sale or other disposition of those ordinary shares may be subject to information reporting to the IRS and to backup withholding (currently imposed at a rate of 28%). Backup withholding will not apply, however, if you (1) are a corporation or come within certain other exempt categories and, when required, can demonstrate that fact or (2) provide a taxpayer identification number, certify as to no loss of exemption from backup withholding and otherwise comply with the applicable backup withholding rules. To establish your status as an exempt person, you will generally be required to provide certification on IRS Form W-9, W-8BEN or W-8ECI, as applicable. Any amounts withheld from payments to you under the backup withholding rules will be allowed as a refund or a credit against your U.S. federal income tax liability, provide that you furnish the required information to the IRS.
HOLDERS OF OUR ORDINARY SHARES SHOULD CONSULT WITH THEIR OWN TAX ADVISORS REGARDING THE APPLICATION OF THE U.S. FEDERAL INCOME TAX LAWS TO THEIR PARTICULAR SITUATIONS AS WELL AS ANY TAX CONSEQUENCES RESULTING FROM PURCHASING, HOLDING OR DISPOSING OF THE ORDINARY SHARES, INCLUDING THE APPLICABILITY AND EFFECT OF THE TAX LAWS OF ANY STATE, LOCAL OR FOREIGN JURISDICTION AND INCLUDING ESTATE, GIFT, AND INHERITANCE LAWS.
F.
Dividends and paying agents
.
Not applicable.
G.
Statement by experts
.
Not applicable.
H.
Documents on display
.
We have filed this Annual Report on Form 20-F with the SEC under the Securities Exchange Act of 1934, as amended, or the Exchange Act. Statements made in this Annual Report as to the contents of any document referred to are not necessarily complete. With respect to each such document filed as an exhibit to this Annual Report, reference is made to the exhibit for a more complete description of the matter involved, and each such statement shall be deemed qualified in its entirety by such reference.
We are subject to the informational requirements of the Exchange Act as a foreign private issuer and file reports and other information with the SEC. Reports and other information filed by us with the SEC, including this Annual Report on Form 20-F, may be inspected and copied at the public reference room of the SEC at 450 Fifth Street N.W. Washington D.C. 20549.
You can also obtain copies of this Annual Report on Form 20-F by mail from the Public Reference Section of the SEC, 450 Fifth Street, N.W., Washington D.C. 20549, at prescribed rates. Additionally, copies of this material may be obtained from the SEC’s Internet site at http://www.sec.gov. The SEC’s telephone number is 1-800-SEC-0330.
| 75 | ||
|
|
I.
Subsidiaries information
.
See Item 4. Information on the Company, Subpart C – Organizational Structure.
Interest rate risk
Our exposure to market rate risk for changes in interest rates relates primarily to the interest income generated by excess cash invested in short term money market accounts and certificates of deposit. We have not used derivative financial instruments in our investment portfolio. Interest earning instruments carry a degree of interest rate risk. We have not been exposed nor do we anticipate being exposed to material risks due to changes in interest rates. However, our future interest income may fall short of expectations due to changes in interest rates.
Foreign currency risk
Substantially all our revenues and expenses are denominated in Renminbi and a substantial portion of our cash is kept in Renminbi, but a portion of our cash is also kept in U.S. dollars. Although we believe that, in general, our exposure to foreign exchange risks should be limited, the value of our shares will be affected by the foreign exchange rate between U.S. dollars and Renminbi. For example, to the extent that we need to convert U.S. dollars into Renminbi for our operational needs and the Renminbi appreciates against the U.S. dollar at that time, our financial position and the price of our shares may be adversely affected. Conversely, if we decide to convert our Renminbi into U.S. dollars for the purpose of declaring dividends on our shares or otherwise and the U.S. dollar appreciates against the Renminbi, the U.S. dollar equivalent of our earnings in China would be reduced.
We have recorded RMB1.71 million (US$0.28 million) of foreign exchange loss in our net income for the twelve months ended September 30, 2013, due to fluctuations in the currency exchange rate. The PRC government may further readjust the current rate at which Renminbi-U.S. dollar exchanges are exchanged, as well as re-evaluate its policy of using a fixed-rate regime to a basket of currencies govern foreign currency transactions, although the PRC government has not committed itself to take any such action currently. Since we have not engaged in any hedging activities, we may experience economic loss as a result of any foreign currency exchange rate fluctuations.
In recent years, China has not experienced significant inflation, and thus inflation has not had a significant effect on our business during the past three years. According to the China Statistical Bureau, China’s overall national inflation rate, as represented by the general consumer price index, was approximately3.6%, 5.5%, 2.8% and 3.1% in the fiscal year ended September 30, 2010, 2011, 2012 and 2013 respectively. Sustained or increased inflation in China could have an adverse impact on China’s economy, which could affect demand for our products or services or increase our cost of services or operating expenses. As we have not previously operated during a period of significant inflation, we cannot predict with confidence the effect that such inflation may have on our business.
Not Applicable.
| 76 | ||
|
|
Not Applicable.
The rights of securities holders have not been materially changed during the period covered by this Annual Report.
(a) Disclosure Controls and Procedures: As of September 30, 2013 (the “Evaluation Date”), the Company conducted an evaluation (under the supervision and participation of the Company’s management including the Chief Executive Officer and the Chief Financial Officer, pursuant to Rule 13a-15 promulgated under the Securities Exchange Act of 1934, as amended (the “Exchange Act”) of the effectiveness of the design and operation of the Company's disclosure controls and procedures. We have determined those controls are effective as of September 30, 2013.
(b)
Report of Origin’s Management on Internal Control over Financial Reporting:
Origin’s Board of Directors and management are responsible for establishing and maintaining adequate internal control over financial reporting. The Company’s internal control system is designed to provide reasonable assurance to the Company’s management and Board of Directors regarding the reliability of financial reporting and the preparation and fair presentation of its published consolidated financial statements.
All internal control systems, no matter how well designed, have inherent limitations. Therefore, even those systems determined to be effective may not provide or detect misstatements and can only provide reasonable assurances with respect to financial statement preparation and presentation. Also, projections of any evaluation of effectiveness to future periods are subject to the risk that controls may become inadequate because of changes in conditions, or that the degree of compliance with the policies or procedures may deteriorate.
Origin’s management assessed the effectiveness of the Company’s internal control over financial reporting as of September 30, 2013. In making this assessment, it used the criteria established in Internal Control - Integrated Framework (1992) issued by the Committee of Sponsoring Organizations of the Treadway Commission (COSO). Based on the evaluation under these criteria, the management hasn’t identified material weakness in the Company’s internal control over financial statement closing process, as a result, the management concluded that the Company’s internal control over financial reporting was effective.
(c)
Attestation report of the registered public accounting firm
.
BDO China Shu Lun Pan Certified Public Accountants LLP, our independent registered public accounting firm, has audited our internal control over financial reporting as of September 30, 2013, and has issued an attestation report set forth below.
| 77 | ||
|
|
REPORT OF INDEPENDENT REGISTERED PUBLIC ACCOUNTING FIRM
To the Board of Directors and Shareholders of
Origin Agritech Limited
We have audited the internal control over financial reporting of Origin Agritech Limited and its subsidiaries and variable interest entities (the “Company”) as of September 30, 2013, based on criteria established in Internal Control - Integrated Framework (1992) issued by the Committee of Sponsoring Organizations of the Treadway Commission (the “COSO criteria”).
The Company’s management is responsible for maintaining effective internal control over financial reporting and for its assessment of the effectiveness of internal control over financial reporting, included in the accompanying Item 15(b), Report of Origin’s Management on Internal Control over Financial Reporting.
Our responsibility is to express an opinion on the Company’s internal control over financial reporting based on our audit.
We conducted our audit in accordance with the standards of the Public Company Accounting Oversight Board (United States).
Those standards require that we plan and perform the audit to obtain reasonable assurance about whether effective internal control over financial reporting was maintained in all material respects.
Our audit included obtaining an understanding of internal control over financial reporting, assessing the risk that a material weakness exists, and testing and evaluating the design and operating effectiveness of internal control based on the assessed risk.
Our audit also included performing such other procedures as we considered necessary in the circumstances.
We believe that our audit provides a reasonable basis for our opinion.
A company’s internal control over financial reporting is a process designed to provide reasonable assurance regarding the reliability of financial reporting and the preparation of financial statements for external purposes in accordance with generally accepted accounting principles.
A company’s internal control over financial reporting includes those policies and procedures that (1) pertain to the maintenance of records that, in reasonable detail, accurately and fairly reflect the transactions and dispositions of the assets of the company; (2) provide reasonable assurance that transactions are recorded as necessary to permit preparation of financial statements in accordance with generally accepted accounting principles, and that receipts and expenditures of the company are being made only in accordance with authorizations of management and directors of the company; and (3) provide reasonable assurance regarding prevention or timely detection of unauthorized acquisition, use, or disposition of the company’s assets that could have a material effect on the financial statements.
Because of its inherent limitations, internal control over financial reporting may not prevent or detect misstatements.
Also, projections of any evaluation of effectiveness to future periods are subject to the risk that controls may become inadequate because of changes in conditions, or that the degree of compliance with the policies or procedures may deteriorate.
In our opinion, the Company maintained, in all material respects, effective internal control over financial reporting as of September 30, 2013, based on the COSO criteria.
We also have audited, in accordance with the standards of the Public Company Accounting Oversight Board (United States), the consolidated balance sheets of Origin Agritech Limited and its subsidiaries and variable interest entities as of September 30, 2012 and 2013, and the related consolidated statements of income and comprehensive income, equity, and cash flows for the years ended September 30, 2011, 2012 and 2013 and our report dated January 22, 2014 expressed an unqualified opinion thereon.
/s/ BDO China Shu Lun Pan Certified Public Accountants LLP
BDO China Shu Lun Pan Certified Public Accountants LLP
Shenzhen, The People’s Republic of China
January 22, 2014
| 78 | ||
|
|
Changes in Internal Control over Financial Reporting
There were no changes in our internal controls over financial reporting that occurred during the period covered by this annual report on Form 20-F that have materially affected, or are reasonably likely to materially affect, our internal control over financial reporting.
The board of directors believes that Larry Kenneth Cordell, a member of our Audit Committee, meets the criteria for an “audit committee financial expert” as established by the SEC and is an independent director.
Mr. Cordell will not be deemed an “expert” for any purpose, including, without limitation, for purposes of Section 11 of the Securities Act of 1933, as amended, as a result of being designated or identified as an audit committee financial expert. The designation or identification of Mr. Cordell as an audit committee financial expert does not impose on him any duties, obligations or liability that are greater than the duties, obligations and liability imposed on him as a member of our Audit Committee and board of directors in the absence of such designation or identification. The designation or identification of Mr. Cordell as an audit committee financial expert does not affect the duties, obligations or liability of any other member of our Audit Committee or board of directors and Mr. Cordell is independent.
On January 18, 2007, our board of directors adopted a code of ethics for senior executive and financial officers, including our chief executive officer and our principal financial officer (i) to promote the honest and ethical conduct of our senior executive and financial officers, including the ethical handling of actual or apparent conflicts of interest between personal and professional relationships, (ii) to promote full, fair, accurate, timely and understandable disclosure in periodic reports required to be filed with or submitted to the SEC and in other public communications by us; (iii) to promote compliance with all applicable laws, rules and regulations that apply to us and our senior executive and financial officers; (iv) to deter wrongdoing; and (v) to promote prompt internal reporting of breaches of, and accountability for adherence to, this code. A copy of the code of ethics is filed as an exhibit to this Annual Report by incorporation by reference.
On January 18, 2007, our board of directors also adopted a code of conduct for our employees, including directors and officers. The purpose of this code of conduct is to provide a summary of certain of our key policies and procedures and to help ensure lawful and ethical conduct. A copy of the code of conduct is filed as an exhibit to this Annual Report by incorporation by reference.
(a)
Audit Fees.
The aggregate fees billed for the fiscal year ended September 30, 2013, for professional services rendered by BDO China Shu Lun Pan Certified Public Accountants LLP for the audits of internal controls over financial reporting and the financial statements for the fiscal year ended September 30, 2013 were RMB2.12 million (US$0.35 million).
The aggregate fees billed for the fiscal year ended September 30, 2012, for professional services rendered by BDO China Shu Lun Pan Certified Public Accountants LLP and BDO Limited (our principal independent accountants of the Company who reported on the financial statements for the fiscal year ended September 30, 2010) for the audit of internal controls over financial reporting and the financial statements for the fiscal years ended September 30, 2012 were US$0.43 million and US$0.03 million, respectively.
(b)
Audit - Related Fees.
The aggregate fees billed for the year ended September 30, 2012 and 2013 for professional services rendered by BDO China Shu Lun Pan Certified Public Accountants LLP for the performance of agree-upon procedures for the quarterly financial statements during the year ended September 30, 2012 and 2013 were US$0.03 million and US$0.03 million respectively.
| 79 | ||
|
|
(c)
Tax Fees.
We did not enter into any engagement during the fiscal years ended September 30, 2012 or 2013 for professional services rendered by our principal accountant for tax compliance, tax advice or tax planning.
(d)
All Other Fees.
No fees were billed in either of the last two fiscal years for products and services provided by our principal accountant, other than the services reported in paragraphs (a) through (b) of this Item 16C for the fiscal years ended September 30, 2012 and 2013.
(e)Audit Committee Pre-Approval Policies and Procedures.
Our Audit Committee pre-approves all auditing services and permitted non-audit services to be performed for us by our independent auditor, including the fees and terms thereof (subject to the de minimums exceptions for non-audit services described in Section 10A(i)(l)(B) of the Exchange Act that are approved by our Audit Committee prior to the completion of the audit).
(f)
Not applicable.
We have not been granted an exemption from the applicable listing standards for the Audit Committee of our board of directors.
None.
Not Applicable.
As a foreign private issuer (“FPI”) whose securities are listed the NASDAQ Global Market, we are permitted to follow certain home country corporate governance practices instead of the requirements of the NASDAQ Marketplace Rules (the “NASDAQ Rules”) pursuant to NASDAQ Rule 5615, which provides for such exemption to compliance with the NASDAQ Rule 5600 Series. We have provided to NASDAQ the necessary documentation to afford the Company these exemptions. See Item 6, Subpart C – Summary of Significant Differences in Corporate Governance Procedures for purposes of Rule 5615 of the NASDAQ Marketplace Rules.
| 80 | ||
|
|
We have provided financial statements pursuant to Item 18.
The following financial statements are filed as part of this annual report on Form 20-F.
|
·
|
Origin Agritech Limited’s consolidated financial statements
(Page F-1 to F-38)
|
|
|
|
|
·
|
Shijiazhuang Liyu Technology Development Co., Ltd.’s financial statements as required under Rule 3-09 of Regulation S-X
(Page F-39 to F-54)
|
Index to Exhibits
|
Exhibit
|
|
|
|
Number
|
|
Description
|
|
1.1
|
|
Memorandum and Articles of Association of Origin Agritech Limited re-registered under the new Business Companies Act of the British Virgin Islands as of July 10, 2006 (Incorporated by reference to Exhibit 1.1 of our Annual Report 20-F (file no. 000-51576) filed with the Securities and Exchange Commission on July 14, 2006.
|
|
|
|
|
|
4.1
|
|
2005 Performance Equity Plan (Incorporated by reference to Annex D of the proxy statement/prospectus included in our Registration Statement S-4/A (file no. 333-124709) filed with the Securities and Exchange Commission on September 27, 2005).
|
|
|
|
|
|
4.2
|
|
2009 Performance Equity Plan (Incorporated by reference to Exhibit 4.1 of our Registration Statement on Form S-8 (file no. 333-166226) filed with the Securities and Exchange Commission on April 22, 2010).
|
|
|
|
|
|
4.3
|
|
Technical Service Agreement between Origin Biotechnology and Beijing Origin (Incorporated by reference to Exhibit 10.14 of our Registration Statement S-4/A (file no. 333-124709) filed with the Securities and Exchange Commission on August 22, 2005).
|
|
|
|
|
|
4.4
|
|
Technical Service Agreement between Origin Biotechnology and Henan Origin (Incorporated by reference to Exhibit 10.15 of our Registration Statement S-4/A (file no. 333-124709) filed with the Securities and Exchange Commission on August 22, 2005).
|
|
|
|
|
|
4.5
|
|
Technical Service Agreement between Origin Biotechnology and Changchun Origin (Incorporated by reference to Exhibit 10.16 of our Registration Statement S-4/A (file no. 333-124709) filed with the Securities and Exchange Commission on August 22, 2005).
|
|
|
|
|
|
4.6
|
|
Form of Stock Consignment Agreement (Incorporated by reference to Exhibit 10.17 of our Registration Statement S-4/A (file no. 333-124709) filed with the Securities and Exchange Commission on August 22, 2005).
|
|
|
|
|
|
4.7
|
|
Technology Transfer Agreement between Henan Agriculture University and Beijing Origin (YuYu22) (Incorporated by reference to Exhibit 10.27 of our Registration Statement S-4/A (file no. 333-124709) filed with the Securities and Exchange Commission on August 22, 2005).
|
|
|
|
|
|
4.8
|
|
Joint Development agreement with Corn Research Institute of Li County (1st Agreement) (Incorporated by reference to Exhibit 10.28 of our Registration Statement S-4/A (file no. 333-124709) filed with the Securities and Exchange Commission on August 22, 2005).
|
| 81 | ||
|
|
|
4.9
|
|
Joint Development Agreement with Corn Research Institute of Li County (2nd Agreement) (Incorporated by reference to Exhibit 10.29 of our Registration Statement S-4/A (file no. 333-124709) filed with the Securities and Exchange Commission on September 16, 2005).
|
|
|
|
|
|
4.10
|
|
Form Equity Transfer Agreement between Beijing Origin and shareholders of Denong Zhengcheng Seed Co., Ltd. pursuant to which Beijing Origin acquired 52.21% equity interest in Denong Zhengcheng Seed Co., Ltd. dated as of January 16, 2006 (Incorporated by reference to Exhibit 4.16 of our Annual Report 20-F (file no. 000-51576 ) filed with the Securities and Exchange Commission on July 14, 2006),
|
|
|
|
|
|
4.11
|
|
Equity Transfer Agreement between Beijing Origin and Jilin Academy of Agriculture Science dated as of December 6, 2005 (Incorporated by reference to Exhibit 4.17 of our Annual Report 20-F (file no. 000-51576) filed with the Securities and Exchange Commission on July 14, 2006).
|
|
|
|
|
|
4.12
|
|
Equity Transfer Agreement between Beijing Origin and China National Center for Biotechnology Development dated as of December 28, 2004 (Incorporated by reference to Exhibit 4.18 of our Annual Report 20-F (file no. 000-51576 ) filed with the Securities and Exchange Commission on July 14, 2006)
|
|
|
|
|
|
4.13
|
|
New Corn Seed Liyu 35 Joint Development Agreement between Beijing Origin and Shijiazhuang Liyu Technology Development Co., Ltd. dated as of March 30, 2006 (Incorporated by reference to Exhibit 4.20 of our Annual Report 20-F (file no. 000-51576 ) filed with the Securities and Exchange Commission on July 14, 2006).
|
|
|
|
|
|
4.14
|
|
Joint Development Agreement between Beijing Origin and Corn Research Institute of Li County dated January 31, 2002 (Incorporated by reference to Exhibit 4.21 of our Annual Report 20-F (file no. 000-51576) filed with the Securities and Exchange Commission on July 14, 2006).
|
|
|
|
|
|
4.15
|
|
Joint Development Agreement between Beijing Origin and Corn Research Institute of Li County dated January 9, 2003 (Incorporated by reference to Exhibit 4.22 of our Annual Report 20-F (file no. 000-51576) filed with the Securities and Exchange Commission on July 14, 2006).
|
|
|
|
|
|
8.1*
|
|
List of Subsidiaries
|
|
|
|
|
|
11.1
|
|
Code of Ethics (Incorporated by reference to Exhibit 11.1 of our Annual Report 20-F (file no. 000-51576) filed with the Securities and Exchange Commission on February 15, 2007).
|
|
|
|
|
|
11.2
|
|
Code of Conduct (Incorporated by reference to Exhibit 11.2 of our Annual Report 20-F (file no. 000-51576) filed with the Securities and Exchange Commission on February 15, 2007).
|
|
|
|
|
|
12.1*
|
|
CEO Certification Pursuant to Rule 13a-14(a) (17 CFR 240.13a-14(a)) (17 CFR 240.13a-14(a)) or Rule 15d-1(a) (17 CFR 240.15d-14(a))
|
|
|
|
|
|
12.2*
|
|
CFO Certification Pursuant to Rule 13a-14(a) (17 CFR 240.13a-14(a)) or Rule 15d-1(a) (17 CFR 240.15d-14(a))
|
|
|
|
|
|
13.1*
|
|
CEO Certification Pursuant to Section 906 of the Sarbanes-Oxley Act of 2002
|
|
|
|
|
|
13.2*
|
|
CFO Certification Pursuant to Section 906 of the Sarbanes-Oxley Act of 2002
|
| 82 | ||
|
|
|
15.1*
|
|
Consent of BDO China Shu Lun Pan Certified Public Accountants LLP Limited to incorporation of its reports on the Registrant’s consolidated financial statements for fiscal years ended 2011,2012 and 2013 and the effectiveness of the Registrant’s internal control over financial reporting as of September 30, 2013, and
Shijiazhuang Liyu Technology Development Co., Ltd.’s financial statements for fiscal years ended 2011, 2012 and 2013
into Registrant's Registration Statements on Forms S-8 (#333-145865 and #333-166226)
|
|
*
|
Filed herewith.
|
SIGNATURE
The registrant hereby certifies that it meets all of the requirements for filing on Form 20-F and that it has duly caused and authorized the undersigned to sign this Annual Report on its behalf.
|
Date: January 22, 2014
|
ORIGIN AGRITECH LIMITED
|
|
|
|
|
|
||
|
|
/s/Gengchen Han
|
|
|
|
|
Name:
|
Gengchen Han
|
|
|
|
Title:
|
Chief Executive Officer
|
|
| 83 | ||
|
|
ORIGIN AGRITECH LIMITED
INDEX TO CONSOLIDATED FINANCIAL STATEMENTS
|
CONTENTS
|
|
PAGE
|
|
|
|
|
|
REPORT OF INDEPENDENT REGISTERED PUBLIC ACCOUNTING FIRM
|
|
F - 2
|
|
|
|
|
|
CONSOLIDATED BALANCE SHEETS AS OF SEPTEMBER 30, 2012 AND 2013
|
|
F - 3
|
|
|
|
|
|
CONSOLIDATED STATEMENTS OF INCOME AND COMPREHENSIVE INCOME FOR THE YEARS ENDED SEPTEMBER 30, 2011, 2012 AND 2013
|
|
F - 4
|
|
|
|
|
|
CONSOLIDATED STATEMENTS OF EQUITY FOR THE YEARS ENDED SEPTEMBER 30, 2011, 2012 AND 2013
|
|
F - 5
|
|
|
|
|
|
CONSOLIDATED STATEMENTS OF CASH FLOWS FOR THE YEARS ENDED SEPTEMBER 30, 2011, 2012 AND 2013
|
|
F - 6
|
|
|
|
|
|
NOTES TO CONSOLIDATED FINANCIAL STATEMENTS
|
|
F - 8
|
| F-1 | ||
|
|
REPORT OF INDEPENDENT REGISTERED PUBLIC ACCOUNTING FIRM
To the Board of Directors and Shareholders of
Origin Agritech Limited
We have audited the accompanying consolidated balance sheets of Origin Agritech Limited and its subsidiaries and variable interest entities (the “Company”) as of September 30, 2012 and 2013 and the related consolidated statements of income and comprehensive income, equity and cash flows for the years ended September 30, 2011, 2012 and 2013.
These financial statements are the responsibility of the Company’s management.
Our responsibility is to express an opinion on these financial statements based on our audits.
We conducted our audits in accordance with the standards of the Public Company Accounting Oversight Board (United States).
Those standards require that we plan and perform the audit to obtain reasonable assurance about whether the financial statements are free of material misstatement.
An audit includes examining, on a test basis, evidence supporting the amounts and disclosures in the financial statements, assessing the accounting principles used and significant estimates made by management, as well as evaluating the overall financial statement presentation.
We believe that our audits provide a reasonable basis for our opinion.
In our opinion, the consolidated financial statements referred to above present fairly, in all material respects, the consolidated financial position of the Company as of September 30, 2012 and 2013, and the results of its operations and its cash flows for the years ended September 30, 2011, 2012 and 2013, in conformity with accounting principles generally accepted in the United States of America.
We also have audited, in accordance with the standards of the Public Company Accounting Oversight Board (United States), the Company’s internal control over financial reporting as of September 30, 2013, based on criteria established in Internal Control – Integrated Framework (1992) issued by the Committee of Sponsoring Organizations of the Treadway Commission (COSO) and our report dated January
22
, 2014 expressed an unqualified opinion thereon.
/s/ BDO China Shu Lun Pan Certified Public Accountants LLP
BDO China Shu Lun Pan Certified Public Accountants LLP
Shenzhen, the People’s Republic of China
January 22, 2014
| F-2 | ||
|
|
ORIGIN AGRITECH LIMITED
(In thousands, except number of share and per share data)
|
|
|
September 30,
|
|
||||
|
|
|
2012
|
|
2013
|
|
2013
|
|
|
|
|
RMB
|
|
RMB
|
|
US$
|
|
|
ASSETS
|
|
|
|
|
|
|
|
|
Current Assets
|
|
|
|
|
|
|
|
|
Cash and cash equivalents
|
|
152,789
|
|
131,978
|
|
21,467
|
|
|
Accounts receivable, less allowance for doubtful amounts of RMB6,752 and RMB12,110 as of September 30, 2012 and 2013, respectively (note 4)
|
|
7,065
|
|
1,949
|
|
317
|
|
|
Due from related parties (note 3)
|
|
2,082
|
|
3,400
|
|
553
|
|
|
Advances to suppliers (note 5)
|
|
7,802
|
|
9,768
|
|
1,589
|
|
|
Advances to growers
|
|
88,194
|
|
58,473
|
|
9,511
|
|
|
Inventories (note 6)
|
|
282,544
|
|
470,811
|
|
76,580
|
|
|
Income tax recoverable (note 18)
|
|
2,159
|
|
1,163
|
|
189
|
|
|
Other current assets (note 7)
|
|
16,407
|
|
7,000
|
|
1,139
|
|
|
Total current assets
|
|
559,042
|
|
684,542
|
|
111,345
|
|
|
Restricted cash (note 13)
|
|
-
|
|
14,350
|
|
2,334
|
|
|
Land use rights, net (note 8)
|
|
32,318
|
|
33,205
|
|
5,401
|
|
|
Plant and equipment, net (note 9)
|
|
317,085
|
|
354,735
|
|
57,699
|
|
|
Equity investments (note 10)
|
|
22,433
|
|
24,894
|
|
4,049
|
|
|
Goodwill (note 2)
|
|
11,973
|
|
11,973
|
|
1,947
|
|
|
Acquired intangible assets, net (note 11)
|
|
25,585
|
|
23,117
|
|
3,760
|
|
|
Deferred income tax assets (note 18)
|
|
1,755
|
|
-
|
|
-
|
|
|
Other assets (note 12)
|
|
5,246
|
|
11,256
|
|
1,831
|
|
|
Total assets
|
|
975,437
|
|
1,158,072
|
|
188,366
|
|
|
LIABILITIES AND EQUITY
|
|
|
|
|
|
|
|
|
Current liabilities
|
|
|
|
|
|
|
|
|
Short-term borrowings (note 13)
|
|
35,000
|
|
205,000
|
|
33,344
|
|
|
Current portion of long-term borrowings (note 13)
|
|
4,000
|
|
16,500
|
|
2,684
|
|
|
Accounts payable
|
|
5,031
|
|
4,590
|
|
747
|
|
|
Due to growers
|
|
4,304
|
|
37,875
|
|
6,161
|
|
|
Due to related parties (note 3)
|
|
2,769
|
|
1,530
|
|
249
|
|
|
Advances from customers
|
|
435,044
|
|
371,571
|
|
60,438
|
|
|
Deferred revenues
|
|
23,243
|
|
22,069
|
|
3,590
|
|
|
Income tax payable (note 18; note 21)
|
|
39,060
|
|
39,060
|
|
6,353
|
|
|
Other payables and accrued expenses (note 14)
|
|
56,744
|
|
53,783
|
|
8,748
|
|
|
Total current liabilities
|
|
605,195
|
|
751,978
|
|
122,314
|
|
|
Long-term borrowings (note 13)
|
|
35,000
|
|
64,819
|
|
10,543
|
|
|
Other long-term liability (note 15)
|
|
21,810
|
|
21,030
|
|
3,420
|
|
|
Total liabilities
|
|
662,005
|
|
837,827
|
|
136,277
|
|
|
Commitments and contingencies (note 21)
|
|
|
|
|
|
|
|
|
|
|
|
|
|
|
|
|
|
Shareholders’ equity:
|
|
|
|
|
|
|
|
|
Preferred stock (no par value; 1,000,000 shares authorized, none issued)
|
|
-
|
|
-
|
|
-
|
|
|
Common stock (no par value; 60,000,000 shares authorized, 23,881,663
and 24,016,163 shares issued as of September 30, 2012 and 2013; 23,382,812 and 22,905,926 shares outstanding as of September 30, 2012 and 2013, respectively) |
|
-
|
|
-
|
|
-
|
|
|
Additional paid-in capital
|
|
397,671
|
|
399,564
|
|
64,991
|
|
|
Accumulated deficit
|
|
(100,967)
|
|
(93,473)
|
|
(15,204)
|
|
|
Treasury stock at cost (498,851 and 1,110,237 shares as of September 30, 2012 and 2013, respectively) (note 17)
|
|
(29,377)
|
|
(35,659)
|
|
(5,800)
|
|
|
Accumulated other comprehensive loss
|
|
(6,280)
|
|
(4,390)
|
|
(714)
|
|
|
Total Origin Agritech Limited shareholders’ equity
|
|
261,047
|
|
266,042
|
|
43,273
|
|
|
|
|
|
|
|
|
|
|
|
Non-controlling interests
|
|
52,385
|
|
54,203
|
|
8,816
|
|
|
Total equity
|
|
313,432
|
|
320,245
|
|
52,089
|
|
|
|
|
|
|
|
|
|
|
|
Total liabilities and equity
|
|
975,437
|
|
1,158,072
|
|
188,366
|
|
The accompanying notes are an integral part of these consolidated financial statements.
| F-3 | ||
|
|
ORIGIN AGRITECH LIMITED
(In thousands, except number of share and per share data)
|
|
|
Year ended September 30,
|
|
||||||
|
|
|
2011
|
|
2012
|
|
2013
|
|
2013
|
|
|
|
|
RMB
|
|
RMB
|
|
RMB
|
|
US$
|
|
|
Revenues
|
|
567,434
|
|
552,111
|
|
481,694
|
|
77,297
|
|
|
Cost of revenues
|
|
(371,591)
|
|
(387,783)
|
|
(315,082)
|
|
(50,561)
|
|
|
|
|
|
|
|
|
|
|
|
|
|
Gross profit
|
|
195,843
|
|
164,328
|
|
166,612
|
|
26,736
|
|
|
Operating expenses
|
|
|
|
|
|
|
|
|
|
|
Selling and marketing
|
|
(56,831)
|
|
(56,437)
|
|
(55,375)
|
|
(8,886)
|
|
|
General and administrative
|
|
(86,748)
|
|
(77,585)
|
|
(66,153)
|
|
(10,615)
|
|
|
Research and development
|
|
(44,771)
|
|
(37,629)
|
|
(42,162)
|
|
(6,766)
|
|
|
Other income, net
|
|
5,120
|
|
3,852
|
|
15,241
|
|
2,446
|
|
|
|
|
|
|
|
|
|
|
|
|
|
Total operating expenses, net
|
|
(183,230)
|
|
(167,799)
|
|
(148,449)
|
|
(23,821)
|
|
|
|
|
|
|
|
|
|
|
|
|
|
Income (loss) from operations
|
|
12,613
|
|
(3,471)
|
|
18,163
|
|
2,915
|
|
|
|
|
|
|
|
|
|
|
|
|
|
Interest expense
|
|
(1,469)
|
|
(4,029)
|
|
(11,326)
|
|
(1,818)
|
|
|
Share of net income of equity investments
|
|
1,616
|
|
4,030
|
|
5,161
|
|
828
|
|
|
Loss on liquidation of a subsidiary
|
|
(13,582)
|
|
-
|
|
-
|
|
-
|
|
|
Interest income
|
|
1,771
|
|
2,547
|
|
1,776
|
|
285
|
|
|
|
|
|
|
|
|
|
|
|
|
|
Income (loss) before income taxes
|
|
949
|
|
(923)
|
|
13,774
|
|
2,210
|
|
|
|
|
|
|
|
|
|
|
|
|
|
Income tax expense (note 18)
|
|
|
|
|
|
|
|
|
|
|
Current
|
|
(6,991)
|
|
(589)
|
|
(2,707)
|
|
(434)
|
|
|
Deferred
|
|
(6,739)
|
|
(1,273)
|
|
(1,755)
|
|
(282)
|
|
|
Income tax expense
|
|
(13,730)
|
|
(1,862)
|
|
(4,462)
|
|
(716)
|
|
|
|
|
|
|
|
|
|
|
|
|
|
Net income (loss)
|
|
(12,781)
|
|
(2,785)
|
|
9,312
|
|
1,494
|
|
|
Less: Net income (loss) attributable to non-controlling interests
|
|
10,298
|
|
(1,351)
|
|
1,818
|
|
292
|
|
|
|
|
|
|
|
|
|
|
|
|
|
Net income (loss) attributable to Origin Agritech Limited
|
|
(23,079)
|
|
(1,434)
|
|
7,494
|
|
1,202
|
|
|
|
|
|
|
|
|
|
|
|
|
|
Other comprehensive income (loss)
|
|
|
|
|
|
|
|
|
|
|
Net income (loss)
|
|
(12,781)
|
|
(2,785)
|
|
9,312
|
|
1,494
|
|
|
Foreign currency translation difference
|
|
2,939
|
|
117
|
|
1,890
|
|
303
|
|
|
Comprehensive income (loss)
|
|
(9,842)
|
|
(2,668)
|
|
11,202
|
|
1,797
|
|
|
Less: Comprehensive income (loss) attributable to non-controlling
interests |
|
10,298
|
|
(1,351)
|
|
1,818
|
|
292
|
|
|
Comprehensive income (loss) attributable to Origin Agritech
Limited |
|
(20,140)
|
|
(1,317)
|
|
9,384
|
|
1,505
|
|
|
|
|
|
|
|
|
|
|
|
|
|
Net income (loss) attributable to Origin Agritech Limited per
share - basic (note 19) |
|
(1.00)
|
|
(0.06)
|
|
0.32
|
|
0.05
|
|
|
|
|
|
|
|
|
|
|
|
|
|
Net income (loss) attributable to Origin Agritech Limited per
share - diluted (note 19) |
|
(1.00)
|
|
(0.06)
|
|
0.32
|
|
0.05
|
|
|
|
|
|
|
|
|
|
|
|
|
|
Shares used in calculating basic net income (loss) per share
|
|
23,351,615
|
|
23,382,812
|
|
23,259,127
|
|
23,259,127
|
|
|
|
|
|
|
|
|
|
|
|
|
|
Shares used in calculating diluted net income (loss) per share
|
|
23,351,615
|
|
23,382,812
|
|
23,278,443
|
|
23,278,443
|
|
The accompanying notes are an integral part of these consolidated financial statements.
| F-4 | ||
|
|
ORIGIN AGRITECH LIMITED
CONSOLIDATED STATEMENTS OF EQUITY
(In thousands, except number of share and per share data)
|
|
|
Equity attributable to Origin Agritech Limited
|
|
|
|
|
|
||||||||||
|
|
|
|
|
|
|
|
|
Retained
|
|
Accumulated
|
|
|
|
|
|
|
|
|
|
|
|
|
|
|
Additional
|
|
Earnings
|
|
Other
|
|
|
|
Non-
|
|
|
|
|
|
|
Common stock
|
|
Paid-in
|
|
(Deficit)
|
|
Comprehensive
|
|
Treasury
|
|
controlling
|
|
Total
|
|
||
|
|
|
Shares
|
|
Amount
|
|
Capital
|
|
|
|
Income (Loss)
|
|
Stock
|
|
Interest
|
|
Equity
|
|
|
|
|
|
|
RMB
|
|
RMB
|
|
RMB
|
|
RMB
|
|
RMB
|
|
RMB
|
|
RMB
|
|
|
|
|
|
|
|
|
|
|
|
|
|
|
|
|
|
|
|
|
|
Balance as of
September 30, 2010 |
|
23,292,412
|
|
-
|
|
387,052
|
|
(76,454)
|
|
(9,336)
|
|
(29,377)
|
|
57,089
|
|
328,974
|
|
|
|
|
|
|
|
|
|
|
|
|
|
|
|
|
|
|
|
|
|
Net income (loss) for the year
|
|
-
|
|
-
|
|
-
|
|
(23,079)
|
|
-
|
|
-
|
|
10,298
|
|
(12,781)
|
|
|
Issuance of common
stock upon exercise of share options |
|
90,400
|
|
-
|
|
2,654
|
|
-
|
|
-
|
|
-
|
|
-
|
|
2,654
|
|
|
Share-based compensation
expense |
|
-
|
|
-
|
|
4,638
|
|
-
|
|
-
|
|
-
|
|
-
|
|
4,638
|
|
|
New subsidiary
established |
|
-
|
|
-
|
|
-
|
|
-
|
|
-
|
|
-
|
|
19,600
|
|
19,600
|
|
|
Liquidation of a subsidiary
|
|
-
|
|
-
|
|
-
|
|
-
|
|
-
|
|
-
|
|
(48,123)
|
|
(48,123)
|
|
|
Dividend paid to non-
controlling interests |
|
-
|
|
-
|
|
-
|
|
-
|
|
-
|
|
-
|
|
(12,090)
|
|
(12,090)
|
|
|
Translation adjustment
|
|
-
|
|
-
|
|
-
|
|
-
|
|
2,939
|
|
-
|
|
-
|
|
2,939
|
|
|
|
|
|
|
|
|
|
|
|
|
|
|
|
|
|
|
|
|
|
Balance as of
September 30, 2011 |
|
23,382,812
|
|
-
|
|
394,344
|
|
(99,533)
|
|
(6,397)
|
|
(29,377)
|
|
26,774
|
|
285,811
|
|
|
|
|
|
|
|
|
|
|
|
|
|
|
|
|
|
|
|
|
|
Net loss for the year
|
|
-
|
|
-
|
|
-
|
|
(1,434)
|
|
-
|
|
-
|
|
(1,351)
|
|
(2,785)
|
|
|
Share-based
compensation expense |
|
-
|
|
-
|
|
3,327
|
|
-
|
|
-
|
|
-
|
|
-
|
|
3,327
|
|
|
Capital injection from a non-
controlling shareholder |
|
-
|
|
-
|
|
-
|
|
-
|
|
-
|
|
-
|
|
29,400
|
|
29,400
|
|
|
Disposal of non-controlling
interest in a subsidiary |
|
-
|
|
-
|
|
-
|
|
-
|
|
-
|
|
-
|
|
(2,438)
|
|
(2,438)
|
|
|
Translation adjustments
|
|
-
|
|
-
|
|
-
|
|
-
|
|
117
|
|
-
|
|
-
|
|
117
|
|
|
Balance as of
September 30, 2012 |
|
23,382,812
|
|
-
|
|
397,671
|
|
(100,967)
|
|
(6,280)
|
|
(29,377)
|
|
52,385
|
|
313,432
|
|
|
|
|
|
|
|
|
|
|
|
|
|
|
|
|
|
|
|
|
|
Net income for the year
|
|
-
|
|
-
|
|
-
|
|
7,494
|
|
-
|
|
-
|
|
1,818
|
|
9,312
|
|
|
Issuance of restricted
share |
|
134,500
|
|
-
|
|
-
|
|
-
|
|
-
|
|
-
|
|
-
|
|
|
|
|
Share repurchased
|
|
(611,386)
|
|
-
|
|
-
|
|
-
|
|
-
|
|
(6,282)
|
|
-
|
|
(6,282)
|
|
|
Share-based
compensation expense |
|
-
|
|
-
|
|
1,893
|
|
-
|
|
-
|
|
-
|
|
-
|
|
1,893
|
|
|
Translation adjustments
|
|
-
|
|
-
|
|
-
|
|
-
|
|
1,890
|
|
-
|
|
-
|
|
1,890
|
|
|
Balance as of
September 30, 2013 |
|
22,905,926
|
|
-
|
|
399,564
|
|
(93,473)
|
|
(4,390)
|
|
(35,659)
|
|
54,203
|
|
320,245
|
|
|
|
|
|
|
|
|
|
|
|
|
|
|
|
|
|
|
|
|
|
In US$ @ 6.1480
|
|
|
|
-
|
|
64,991
|
|
(15,204)
|
|
(714)
|
|
(5,800)
|
|
8,816
|
|
52,089
|
|
The accompanying notes are an integral part of these consolidated financial statements.
| F-5 | ||
|
|
ORIGIN AGRITECH LIMITED
(In thousands)
|
|
|
Year ended September 30,
|
|
||||||
|
|
|
2011
|
|
2012
|
|
2013
|
|
2013
|
|
|
|
|
RMB
|
|
RMB
|
|
RMB
|
|
US$
|
|
|
|
|
|
|
|
|
|
|
|
|
|
Operating activities:
|
|
|
|
|
|
|
|
|
|
|
Net income (loss) attributable to Origin Agritech Limited
|
|
(23,079)
|
|
(1,434)
|
|
7,494
|
|
1,202
|
|
|
Adjustments to reconcile net income (loss) to net cash
|
|
|
|
|
|
|
|
|
|
|
provided by operating activities:
|
|
|
|
|
|
|
|
|
|
|
Depreciation and amortization
|
|
23,307
|
|
19,541
|
|
28,164
|
|
4,581
|
|
|
Loss (gain) on disposal of plant and equipment
|
|
6,252
|
|
1,401
|
|
(4,505)
|
|
(723)
|
|
|
Gain on disposal of a land use right
|
|
-
|
|
(825)
|
|
-
|
|
-
|
|
|
Gain on disposal of an equity investment
|
|
(1)
|
|
-
|
|
-
|
|
-
|
|
|
Loss on disposal of Kunfeng’s assets
|
|
-
|
|
1,814
|
|
-
|
|
-
|
|
|
Loss on liquidation of a subsidiary
|
|
13,583
|
|
-
|
|
-
|
|
-
|
|
|
Impairment on receivables
|
|
1,872
|
|
4,038
|
|
5,358
|
|
872
|
|
|
Inventory write down
|
|
12,978
|
|
27,453
|
|
38,561
|
|
6,272
|
|
|
Deferred income tax assets
|
|
6,739
|
|
1,273
|
|
1,755
|
|
282
|
|
|
Non-controlling interests
|
|
10,298
|
|
(1,351)
|
|
1,818
|
|
292
|
|
|
Share-based compensation expense
|
|
4,638
|
|
3,327
|
|
1,893
|
|
308
|
|
|
Share of net income of equity investments
|
|
(1,616)
|
|
(4,030)
|
|
(5,161)
|
|
(828)
|
|
|
Changes in operating assets and liabilities:
|
|
|
|
|
|
|
|
|
|
|
Accounts receivable, net
|
|
1,560
|
|
(4,486)
|
|
(242)
|
|
(39)
|
|
|
Due from related parties
|
|
(76)
|
|
3,101
|
|
(1,318)
|
|
(214)
|
|
|
Advances to growers
|
|
(37,932)
|
|
(9,571)
|
|
29,721
|
|
4,834
|
|
|
Advances to suppliers
|
|
(8,432)
|
|
4,616
|
|
(27)
|
|
(4)
|
|
|
Inventories
|
|
15,175
|
|
(102,230)
|
|
(226,828)
|
|
(36,895)
|
|
|
Income tax recoverable
|
|
590
|
|
(4)
|
|
996
|
|
162
|
|
|
Other current assets
|
|
4
|
|
48,648
|
|
9,574
|
|
1,557
|
|
|
Other assets
|
|
(3,010)
|
|
14,394
|
|
3,135
|
|
510
|
|
|
Accounts payable
|
|
(3,220)
|
|
(709)
|
|
(441)
|
|
(72)
|
|
|
Due to growers
|
|
(34,239)
|
|
(3,643)
|
|
33,571
|
|
5,460
|
|
|
Due to related parties
|
|
984
|
|
1,041
|
|
(1,239)
|
|
(202)
|
|
|
Advances from customers
|
|
49,136
|
|
37,111
|
|
(63,473)
|
|
(10,324)
|
|
|
Deferred revenues
|
|
(3,299)
|
|
3,431
|
|
(1,174)
|
|
(191)
|
|
|
Income tax payable
|
|
4,113
|
|
-
|
|
-
|
|
-
|
|
|
Other long-term liabilities
|
|
(7,003)
|
|
21,810
|
|
(780)
|
|
(127)
|
|
|
Other payables and accrued expenses
|
|
8,135
|
|
17,997
|
|
(2,961)
|
|
(482)
|
|
|
|
|
|
|
|
|
|
|
|
|
|
Net cash provided by (used in) operating activities
|
|
37,457
|
|
82,713
|
|
(146,109)
|
|
(23,769)
|
|
The accompanying notes are an integral part of these consolidated financial statements.
| F-6 | ||
|
|
ORIGIN AGRITECH LIMITED
CONSOLIDATED STATEMENTS OF CASH FLOWS - Continued
(In thousands)
|
|
|
Year ended September 30,
|
|
||||||
|
|
|
2011
|
|
2012
|
|
2013
|
|
2013
|
|
|
|
|
RMB
|
|
RMB
|
|
RMB
|
|
US$
|
|
|
|
|
|
|
|
|
|
|
|
|
|
Investing activities:
|
|
|
|
|
|
|
|
|
|
|
Dividends received
|
|
2,467
|
|
2,100
|
|
2,700
|
|
439
|
|
|
Purchase of plant and equipment
|
|
(56,332)
|
|
(104,214)
|
|
(63,282)
|
|
(10,284)
|
|
|
Liquidation of a subsidiary
|
|
(67,980)
|
|
-
|
|
-
|
|
-
|
|
|
Additional capital injection to an equity investment
|
|
(600)
|
|
-
|
|
-
|
|
-
|
|
|
Proceeds from disposal of land use right
|
|
-
|
|
1,140
|
|
-
|
|
-
|
|
|
Proceeds from disposal of plant and equipment
|
|
-
|
|
5,495
|
|
7,875
|
|
1,281
|
|
|
Deposits for purchase of acquired technology and land
use rights |
|
(1,280)
|
|
-
|
|
(5,781)
|
|
(940)
|
|
|
Deposits for purchase of plant and equipment
|
|
(11,468)
|
|
(43,874)
|
|
(5,470)
|
|
(890)
|
|
|
Purchase of land use rights
|
|
-
|
|
(431)
|
|
(1,829)
|
|
(298)
|
|
|
Purchase of intangible assets
|
|
(19,197)
|
|
(3,599)
|
|
(2,492)
|
|
(405)
|
|
|
Net cash provided by (used in) investing activities
|
|
(154,390)
|
|
(143,383)
|
|
(68,279)
|
|
(11,097)
|
|
|
|
|
|
|
|
|
|
|
|
|
|
Financing activities:
|
|
|
|
|
|
|
|
|
|
|
Restricted cash
|
|
-
|
|
-
|
|
(14,350)
|
|
(2,334)
|
|
|
Proceeds from short-term borrowings
|
|
20,000
|
|
105,000
|
|
274,000
|
|
44,567
|
|
|
Repayment of short-term borrowings
|
|
(85,900)
|
|
(90,000)
|
|
(99,000)
|
|
(16,103)
|
|
|
Proceeds from long-term borrowings
|
|
-
|
|
39,000
|
|
37,319
|
|
6,070
|
|
|
Repurchase of common stock
|
|
-
|
|
-
|
|
(6,282)
|
|
(1,022)
|
|
|
Capital injection from a non-controlling shareholder
|
|
19,600
|
|
29,400
|
|
-
|
|
-
|
|
|
Dividends paid to non-controlling shareholders
|
|
(12,090)
|
|
-
|
|
-
|
|
-
|
|
|
Proceeds from exercise of share options
|
|
2,654
|
|
-
|
|
-
|
|
-
|
|
|
Net cash provided by (used in) financing activities
|
|
(55,736)
|
|
83,400
|
|
191,687
|
|
31,178
|
|
|
|
|
|
|
|
|
|
|
|
|
|
Net increase (decrease) in cash and cash equivalents
|
|
(172,669)
|
|
22,730
|
|
(22,701)
|
|
(3,688)
|
|
|
Cash and cash equivalents, beginning of year
|
|
299,672
|
|
129,942
|
|
152,789
|
|
24,852
|
|
|
Effect of exchange rate changes on cash and cash equivalents
|
|
2,939
|
|
117
|
|
1,890
|
|
303
|
|
|
Cash and cash equivalents, end of year
|
|
129,942
|
|
152,789
|
|
131,978
|
|
21,467
|
|
|
|
|
|
|
|
|
|
|
|
|
|
Supplemental disclosures of cash flow information:
|
|
|
|
|
|
|
|
|
|
|
Income taxes paid
|
|
6,990
|
|
589
|
|
1,711
|
|
278
|
|
|
|
|
|
|
|
|
|
|
|
|
|
Interest paid
|
|
1,469
|
|
4,029
|
|
11,326
|
|
1,842
|
|
|
|
|
|
|
|
|
|
|
|
|
|
Supplemental disclosure of non-cash investing activities:
|
|
|
|
|
|
|
|
|
|
|
Disposal of assets in lieu of payment for liabilities
|
|
-
|
|
1,814
|
|
-
|
|
-
|
|
|
Other current assets to be received from liquidation of a
subsidiary |
|
45,236
|
|
-
|
|
-
|
|
-
|
|
The accompanying notes are an integral part of these consolidated financial statements.
| F-7 | ||
|
|
ORIGIN AGRITECH LIMITED
NOTES TO CONSOLIDATED FINANCIAL STATEMENTS
FOR THE YEAR ENDED SEPTEMBER 30, 2011, 2012 AND 2013
(In thousands, except number of share, per share data and unless otherwise stated)
NOTES TO CONSOLIDATED FINANCIAL STATEMENTS
FOR THE YEAR ENDED SEPTEMBER 30, 2011, 2012 AND 2013
(In thousands, except number of share, per share data and unless otherwise stated)
|
1.
|
ORGANIZATION AND PRINCIPAL ACTIVITIES
|
Origin Agritech Limited (“Agritech”), incorporated under the laws of the British Virgin Islands, and its subsidiaries and variable interest entities (together, the “Company”) are principally engaged in hybrid crop seed development, production and distribution. As of September 30, 2013, details of the Company’s subsidiaries and variable interest entities are as follows:
|
|
|
Date of
|
|
Place of
|
|
Percentage
|
|
|
|
|
|
|
|
Incorporation
|
|
Incorporation
|
|
of
|
|
|
Principal
|
|
|
Name
|
|
or Establishment
|
|
or Establishment
|
|
Ownership
|
|
|
Activity
|
|
|
|
|
|
|
|
|
|
|
|
|
|
|
Subsidiaries:
|
|
|
|
|
|
|
|
|
|
|
|
State Harvest Holdings
Limited (“State Harvest”) |
|
October 6, 2004
|
|
British Virgin
Islands |
|
100
|
%
|
|
Investment holding
|
|
|
|
|
|
|
|
|
|
|
|
|
|
|
Beijing Origin State Harvest
Biotechnology Limited (“BioTech”) |
|
December 1, 2004
|
|
People’s Republic of
China (“PRC”) |
|
100
|
%
|
|
Hybrid seed
technology development |
|
|
|
|
|
|
|
|
|
|
|
|
|
|
Shandong Kunfeng Biochemical
Limited (“Kunfeng”) |
|
June 14, 2006
|
|
PRC
|
|
100
|
%
|
|
Agricultural chemical
producer |
|
|
|
|
|
|
|
|
|
|
|
|
|
|
Variable interest entity:
|
|
|
|
|
|
|
|
|
|
|
|
Beijing Origin Seed Limited
(note (i)) (“Beijing Origin”) |
|
December 26, 1997
|
|
PRC
|
|
-
|
|
|
Hybrid crop seed
development, production and distribution |
|
|
|
|
|
|
|
|
|
|
|
|
|
|
Subsidiaries held by Beijing Origin:
|
|
|
|
|
|
|
|
|
|
|
|
Henan Origin Cotton Technology
Development Limited (note (i)) (“Henan Cotton”) |
|
March 2, 2001
|
|
PRC
|
|
92.04
|
%
|
|
Hybrid crop seed
development, production and distribution |
|
|
|
|
|
|
|
|
|
|
|
|
|
|
Changchun Origin Seed Technology
Development Limited (note (i)) (“Changchun Origin”) |
|
April 29, 2003
|
|
PRC
|
|
99.83
|
%
|
|
Hybrid crop seed
development, production and distribution |
|
|
|
|
|
|
|
|
|
|
|
|
|
|
Linze Origin Seed Limited (note (i))
|
|
November 18, 2008
|
|
PRC
|
|
100
|
%
|
|
Hybrid crop seed
development, production and distribution |
|
|
|
|
|
|
|
|
|
|
|
|
|
|
Xinjiang Originbo Seed Company
Limited (“Xinjiang Origin”) (note (i)) |
|
July 13, 2011
|
|
PRC
|
|
51
|
%
|
|
Hybrid crop seed
development, production and distribution |
|
|
|
|
|
|
|
|
|
|
|
|
|
|
Denong Zhengcheng Seed Limited
(“Denong”) |
|
June 21, 2000
|
|
PRC
|
|
98.58
|
%
|
|
Hybrid seed development,
production and distribution |
|
Note (i):
Beijing Origin Seed Limited, Henan Origin Cotton Technology Development Limited, Changchun Origin Seed Technology Development Limited, Linze Origin Seed Limited and Xinjiang Originbo Seed Company Limited are collectively referred to as “Beijing Origin”.
| F-8 | ||
|
|
ORIGIN AGRITECH LIMITED
NOTES TO CONSOLIDATED FINANCIAL STATEMENTS
FOR THE YEAR ENDED SEPTEMBER 30, 2011, 2012 AND 2013
(In thousands, except number of share, per share data and unless otherwise stated)
NOTES TO CONSOLIDATED FINANCIAL STATEMENTS
FOR THE YEAR ENDED SEPTEMBER 30, 2011, 2012 AND 2013
(In thousands, except number of share, per share data and unless otherwise stated)
|
1.
|
ORGANIZATION AND PRINCIPAL ACTIVITIES - Continued
|
The Share Exchange Transaction
On December 20, 2004, Chardan China Acquisition Corp. (“Chardan”) entered into a Stock Purchase Agreement with State Harvest, and all the stockholders of State Harvest for Chardan’s acquisition of State Harvest. For the acquisition, Chardan formed its wholly owned subsidiary, Agritech. On November 8, 2005, the closing date of the acquisition (the “Closing Date”), Chardan merged with and into Agritech for the purpose of re-domestication out of the United States. The re-domestication merger was achieved by a one-for-one exchange of all the outstanding common shares of Chardan for common shares of Agritech and the assumption of all the rights and obligations of Chardan by Origin Agritech, including assumption of the outstanding warrants of Chardan. Immediately after the re-domestication merger, Agritech acquired all the common stock of State Harvest by the issuance of shares and payments of cash consideration to the then shareholders of State Harvest (“State Harvest Shareholders”) or their designee, making it a wholly owned subsidiary (the “Share Exchange Transaction”). State Harvest Shareholders and their designee were paid an aggregate of US$
10,000
in cash, using the funds held in the trust account of Chardan, and was issued an aggregate of
10,000,000
shares of Agritech common stock for all the outstanding common stock of State Harvest. The Share Exchange Transaction was accounted for as a reverse acquisition in which State Harvest was deemed to be the accounting acquirer and Agritech the legal acquirer. The payments of the cash consideration are accounted for as a deemed distribution.
Of the cash portion of the purchase price, US$
250
has been held back for one year by Agritech to secure certain indemnification obligations of State Harvest Shareholders and their designee. Other than the issuance of the above-mentioned
10,000,000
shares, Agritech has issued
200,000
shares to a financial advisor in connection with the Share Exchange Transaction.
As a result of the Share Exchange Transaction the historical consolidated financial statements of the Company for the periods prior to the Closing Date are those of State Harvest and its majority owned subsidiaries and its variable interest entity, Beijing Origin and all references to the consolidated financial statements of the Company apply to the historical consolidated financial statements of State Harvest, its majority owned subsidiary and Beijing Origin prior to the Closing Date and the consolidated financial statements of Agritech and its majority owned subsidiaries and Beijing Origin subsequent to the Closing Date. The Company’s equity components are stated in terms of State Harvest before the Closing Date, with an adjustment to reflect the effects of the reverse acquisition on the equity components at the Closing Date.
As Chardan was a non-operating public shell company before the Share Exchange Transaction, no goodwill has been recorded in connection with the Share Exchange Transaction and the costs incurred in connection with such transaction have been charged directly to equity as there was sufficient equity to absorb the costs. The net book value of acquired assets and liabilities pursuant to the Share Exchange Transaction is as follows:
|
|
|
RMB
|
|
|
Net assets acquired:
|
|
|
|
|
Cash
|
|
163,517
|
|
|
|
|
|
|
|
Other current assets
|
|
6,201
|
|
|
Due to State Harvest Shareholders and their designee
|
|
(2,022)
|
|
|
Other payables and accrued expenses
|
|
(965)
|
|
|
|
|
|
|
|
|
|
166,731
|
|
|
Less: Transaction costs paid in cash
|
|
(14,430)
|
|
|
Tax effect of the Share Exchange Transaction
|
|
(39,060)
|
|
|
|
|
113,241
|
|
| F-9 | ||
|
|
ORIGIN AGRITECH LIMITED
NOTES TO CONSOLIDATED FINANCIAL STATEMENTS
FOR THE YEAR ENDED SEPTEMBER 30, 2011, 2012 AND 2013
(In thousands, except number of share, per share data and unless otherwise stated)
NOTES TO CONSOLIDATED FINANCIAL STATEMENTS
FOR THE YEAR ENDED SEPTEMBER 30, 2011, 2012 AND 2013
(In thousands, except number of share, per share data and unless otherwise stated)
|
|
1.
|
ORGANIZATION AND PRINCIPAL ACTIVITIES - Continued
|
Additional purchase price payments would be made to State Harvest Shareholders and their designee, up to an aggregate of US$
15,000
if either of the following occurs during any fiscal year of Agritech after the Closing Date until December 31, 2008 (or June 30, 2009 if the fiscal year is changed to a July 1–June 30 fiscal year) from funds generated in the additional financing or from operational earnings as described below:
|
|
(1)
|
If Agritech receives at least US$
40,000 in gross proceeds in additional financing as a result (i) of the call of the issued and outstanding public warrants assumed by Agritech at the closing; (ii) Agritech’s successful completion of a follow-on offering; or (iii) a private investment into Agritech by a strategic investor (“Financing Adjustment”), then Agritech will pay an additional US$15,000 to State Harvest Shareholders and their designee; or
|
|
|
(2)
|
If Origin generates net positive cash flow of US$2,000 or more on a consolidated basis (“Earnings Adjustment”), then State Harvest Shareholders and their designee will be entitled to receive 75% of the net positive cash flow up to a maximum of US$7,500 per fiscal year and US$15,000 in the aggregate.
|
If both an Earnings Adjustment and a Financing Adjustment occur, the maximum aggregate amount to be paid to State Harvest Shareholders from one or both adjustments is US$
15,000
.
As of September 30, 2006, Agritech received US$
40,218
(equivalent to approximately RMB
324,584
) in gross proceeds as a result of the call of the issued and outstanding warrants assumed by Agritech on the Closing Date. Accordingly, Agritech paid an additional US$
15,000
(equivalent to approximately RMB
120,981
) to State Harvest Shareholders and their designee. The payments of the additional purchase price are accounted for as a deemed distribution.
As a part of the Share Exchange Transaction, Agritech assumed
4,025,000
shares of common stock,
8,050,000
Redeemable Common Stock Purchase Warrants (“Warrants”) and
350,000
Unit Purchase Options (“UPO”) issued by Chardan. There was no re-measurement required for these assumed Warrants and UPO because such assumption is part of the recapitalization in connection with the Share Exchange Transaction. All Warrants and UPO have been either exercised or expired as of September 30, 2011.
As further additional purchase price, certain State Harvest Shareholders and their designee will be issued an aggregate of
1,500,000
shares of common stock of Agritech for any of the next four years if, on a consolidated basis, Agritech generates after-tax profits (excluding after-tax operating profits from any subsequent acquisitions of securities that have a dilutive effect and before the expenses of this transaction and director and employee option expense) of at least the following amounts:
|
|
|
After-tax profit
|
|
|
|
|
US$
|
|
|
Twelve months ended June 30,
|
|
|
|
|
2006
|
|
11,000
|
|
|
2007
|
|
16,000
|
|
|
2008
|
|
21,000
|
|
|
2009
|
|
29,000
|
|
Although the outcome for the twelve months ended June 30, 2006 has been achieved, the Board decided that the
1,500,000
shares of common stock will not be issued upon a waiver signed by those certain State Harvest Shareholders and their designee but they do not waive or modify in any respect other additional stock purchase price.
The management considered the after-tax profits has not been achieved for the twelve months ended June 30, 2007, 2008 and 2009.
| F-10 | ||
|
|
ORIGIN AGRITECH LIMITED
NOTES TO CONSOLIDATED FINANCIAL STATEMENTS
FOR THE YEAR ENDED SEPTEMBER 30, 2011, 2012 AND 2013
(In thousands, except number of share, per share data and unless otherwise stated)
|
|
1.
|
ORGANIZATION AND PRINCIPAL ACTIVITIES - Continued
|
Reorganization of State Harvest prior to the Share Exchange Transaction
On December 1, 2004, State Harvest established BioTech, a wholly-owned foreign enterprise (“WOFE”) under the laws of the PRC with an operating period of
20
years.
Under PRC law, foreign entities are not currently permitted to own more than
49%
of a seed production company. In order to address those restrictions, State Harvest conducts substantially all of its business through contractual agreements with its variable interest entity (“VIE”), Beijing Origin. These agreements are summarized in the following paragraphs.
Stock Consignment Agreements
As discussed above in “Foreign Ownership Restrictions,” under Chinese law, foreign ownership of businesses engaged in the breeding of new varieties, development, production, marketing, distribution and sale of hybrid food crop seeds is limited to 49% pursuant to the Regulation on the Approval and Registration of Foreign Investment Enterprises in Agricultural Seed Industry and The Foreign Investment Industrial Guidance Catalogue. State Harvest, as a non-Chinese corporation, may not directly own more than
49%
of any of the PRC Operating Companies. However, Chinese law does not forbid the owner of stock to consign rights associated with the stock, as long as the owner does not transfer title to the stock. To gain control over the PRC Operating Companies, State Harvest entered into a series of stock consignment agreements with shareholders of those companies.
State Harvest has been assigned
97.96
% voting rights by the shareholders of Beijing Origin through a consignment agreement which includes the following terms: (1) The shares of Beijing Origin cannot be transferred without the approval of State Harvest; (2) State Harvest has the right to appoint all directors and senior management personnel of Beijing Origin and (3) The shareholder rights including voting rights require the transfer of the shares of Beijing Origin to State Harvest or any party designated by State Harvest within three years upon the removal of the PRC legal restriction.
Technical Service Agreements
Beijing Origin entered into Technical Service Agreements with BioTech dated December 25, 2004. Under these agreements, BioTech shall provide, with its own technical research resource and team, technical services for the production and distribution of agricultural seeds during the period of the agreements. In return, Beijing Origin is required to pay BioTech service fee calculated according to the weight of corn, rice and cotton seeds sold by the Beijing Origin.
Through the contractual agreements described above, State Harvest is deemed the sole beneficiary of Beijing Origin resulting in Beijing Origin being deemed a subsidiary of State Harvest under the requirements of Financial Accounting Standards Board (“FASB”) Accounting Standard Codification (“ASC”) 810-10-05 (former Financial Interpretation 46 (Revised) “Consolidation of Variable Interest Entities” (FIN 46(R))). The agreements described above provided for effective control of Beijing Origin to be transferred to State Harvest at December 25, 2004. Neither State Harvest nor BioTech had any operating activity prior to entering into the consignment agreements with Beijing Origin. In substance, State Harvest has substantially all the same shareholders of Beijing Origin. This transaction has been accounted for on a basis similar to reorganization between entities under common control. Accordingly, State Harvest’s consolidated financial statements are prepared by including the consolidated financial statements of Beijing Origin through December 24, 2004, and subsequently the Company’s consolidated financial statements include the financial statements of State Harvest, its majority owned subsidiary and Beijing Origin through the date of the Share Exchange Transaction.
| F-11 | ||
|
|
ORIGIN AGRITECH LIMITED
NOTES TO CONSOLIDATED FINANCIAL STATEMENTS
FOR THE YEAR ENDED SEPTEMBER 30, 2011, 2012 AND 2013
(In thousands, except number of share, per share data and unless otherwise stated)
|
|
1.
|
ORGANIZATION AND PRINCIPAL ACTIVITIES - Continued
|
Risks in relation to the VIE structure
Three of our PRC operating subsidiaries are controlled subsidiaries through stock consignment agreements rather than by direct ownership of shares, the terms of which may have to be enforced, which would require us to incur extra costs, create uncertainty as to ownership of the operating businesses involved and risk the possible loss of rights. There is the risk, however, that a consigning shareholder will not fulfill its obligations under the stock consignment agreement. In that event, we may need to resort to the PRC courts to have our rights under the applicable agreement enforced. Such enforcement will cause us to incur legal expenses. In addition, while a case is pending there will be uncertainty regarding our rights as to the three PRC operating subsidiaries involved. In addition, a PRC court may decide not to enforce the agreements in whole or in part. To the extent these agreements are neither observed nor enforced as intended, the PRC operating subsidiaries will not be controlled by us as intended, which will affect our enterprise value and restrict our ability to obtain the income and other rights of ownership associated with the consigned stock. It may also prevent the consolidation of our financial statements with the PRC operating subsidiaries, which would reduce the reported earnings of the consolidated companies. The uncertainty of ownership may also adversely affect the market value of our ordinary shares.
Whether or not a stock consignment agreement is terminated depends on the consensus of our Board and the consignees. Any such termination could result in a possible loss of certain rights or assets held by us without receiving fair value in return. The stock consignment agreements relating to our control of the stock of our PRC operating subsidiaries may be terminated after three years upon mutual agreement between us and the consignees. Holding this amount of stock will allow these officers to control or greatly influence the selection of directors and matters submitted to a vote of our shareholders, including voting to terminate the stock consignment agreements.
There are corporate protections in place designed to protect our interests, such as an independent Board of Directors, an audit committee comprised of independent directors that must approve insider transactions, a code of conduct requiring fair dealing with the Company, and the British Virgin Islands statutory provision that a disposition of more than
50
% of the assets of a company must be approved by a majority of the shareholders. Moreover, if consigned stock is transferred to us as provided in the stock consignment agreements when the restrictions under PRC law are lifted, that stock will no longer be subject to the stock consignment agreements, and the termination of the stock consignment agreements would then have no effect on the ownership of that stock. However, if the stock consignment agreements are terminated, then we would lose our rights with respect to the consigned stock and the profits from the issuing corporation. Such a loss would impair the value of the Company and would reduce our ability to generate revenues.
The revenues of the Company has been generated from VIE and its subsidiaries for the year ended September 30, 2011, 2012 and 2013 are
96.63
%,
96.41
% and
100
%, respectively. VIE and its subsidiaries also account for
96.41
% and
95.30
% of the total assets of the Company as at September 30, 2012 and 2013 respectively.
|
|
2.
|
SUMMARY OF SIGNIFICANT ACCOUNTING POLICIES
|
Principles of consolidation
The consolidated financial statements of the Company are prepared in accordance with accounting principles generally accepted in the United States of America (“US GAAP”); include the assets, liabilities, revenues, expenses and cash flows of all subsidiaries and variable interest entities. Intercompany balances, transactions and cash flows are eliminated on consolidation.
| F-12 | ||
|
|
ORIGIN AGRITECH LIMITED
NOTES TO CONSOLIDATED FINANCIAL STATEMENTS
FOR THE YEAR ENDED SEPTEMBER 30, 20
11
, 201
2
AND 201
3
(In thousands, except number of share, per share data and unless otherwise stated)
|
|
2.
|
SUMMARY OF SIGNIFICANT ACCOUNTING POLICIES - Continued
|
Convenience translation into United States dollars
The consolidated financial statements are presented in Renminbi. The translation of Renminbi amounts into United States dollar amounts has been made for the convenience of the reader and has been made at the exchange rate quoted by the middle rate by the State Administration of Foreign Exchange in China on September 30, 2013 of RMB
6.1480
to US$1.00. Such translation amounts should not be construed as representations that the Renminbi amounts could be readily converted into United States dollar amounts at that rate or any other rate.
Use of estimates
The preparation of the consolidated financial statements in conformity with US GAAP requires management to make estimates and assumptions that affect the reported amounts of assets and liabilities and disclosure of contingent assets and liabilities at the date of the consolidated financial statements and the reported amounts of revenues and expenses during the reporting period. Estimates are adjusted to reflect actual experience when necessary. Significant accounting estimates reflected in the Company’s consolidated financial statements include inventory valuation,
account receivable valuation,
useful lives of plant and equipment and acquired intangible assets, the valuation allowance for deferred income tax assets. Actual results could differ from those estimates.
Cash and cash equivalents
Cash and cash equivalents consist of cash on hand, cash accounts, interest bearing savings accounts, time certificates of deposit and debt securities with a maturities of three months or less when purchased.
Inventories
Inventories are stated at the lower of cost, determined by weighted-average method, or market. Work-in-progress and finished goods inventories consist of raw materials, direct labor and overhead associated with the manufacturing process.
Land use rights, net
Land use rights are recorded at cost less accumulated amortization. Amortization is provided over the term of the land use right agreements on a straight-line basis for the beneficial period.
Plant and equipment, net
Plant and equipment are recorded at cost less accumulated depreciation and amortization. Maintenance and repairs are charged to expense as incurred. Depreciation is calculated on a straight-line basis over the following estimated useful lives:
|
|
Plant and building
|
20
-
40
years
|
|
|
Machinery and equipment
|
10
-
15
years
|
|
|
Furniture and office equipment
|
5
-
8
years
|
|
|
Motor vehicles
|
5
-
10
years
|
|
|
Leasehold improvements
|
Shorter of the useful lives or the lease term
|
The Company constructs certain of its facilities. In addition to costs under construction contracts, external costs directly related to the construction of such facilities, including duty and tariff, and equipment installation and shipping costs, are capitalized. Depreciation is recorded at the time assets are placed in service.
| F-13 | ||
|
|
ORIGIN AGRITECH LIMITED
NOTES TO CONSOLIDATED FINANCIAL STATEMENTS
FOR THE YEAR ENDED SEPTEMBER 30, 20
11
, 201
2
AND 201
3
(In thousands, except number of share, per share data and unless otherwise stated)
|
|
2.
|
SUMMARY OF SIGNIFICANT ACCOUNTING POLICIES - Continued
|
Leases
Leases are classified at the inception date as either a capital lease or an operating lease. For the lessee, a lease is a capital lease if any of the following conditions exist: a) ownership is transferred to the lessee by the end of the lease term, b) there is a bargain purchase option, c) the lease term is at least 75% of the property’s estimated remaining economic life or d) the present value of the minimum lease payments at the beginning of the lease term is 90% or more of the fair value of the leased property to the lessor at the inception date. A capital lease is accounted for as if there was an acquisition of an asset and an incurrence of an obligation at the inception of the lease. All other leases are accounted for as operating leases. The Company has no capital leases for any of the periods presented.
Goodwill
Goodwill represents the excess of aggregate purchase price over the fair value of net assets acquired in a business combination. Goodwill is not amortized, but instead tested for impairment at least annually or more frequently if certain circumstances indicate a possible impairment may exist. The Company adopted FASB ASC 350-10 and performs its annual impairment review of goodwill on September 30 of each year. Management evaluates the recoverability of goodwill using a two-step impairment test approach at the reporting unit level, which is determined to be the enterprise level. In the first step, the fair value of the reporting unit is compared to its carrying value including goodwill. Second, if the carrying amount of the reporting unit exceeds its fair value, an impairment loss is recognized for any excess of the carrying amount of the goodwill over the implied fair value of the goodwill. The implied fair value of goodwill is determined by allocating the fair value of the reporting unit in a manner similar to a business combination.
The carrying amount of the goodwill at September 30, 2012 and 2013 represents the cost arising from the business combinations in previous years and no impairment on goodwill was recognized for any of the periods presented for the Company. The movement for goodwill is as follow:
|
|
|
September 30,
|
|
||||
|
|
|
2011
|
|
2012
|
|
2013
|
|
|
|
|
RMB
|
|
RMB
|
|
RMB
|
|
|
|
|
|
|
|
|
|
|
|
Balance at beginning of year
|
|
16,665
|
|
11,973
|
|
11,973
|
|
|
Additions
|
|
-
|
|
-
|
|
-
|
|
|
Written off
|
|
(4,692)
|
|
-
|
|
-
|
|
|
|
|
|
|
|
|
|
|
|
|
|
11,973
|
|
11,973
|
|
11,973
|
|
Acquired intangible assets, net
Acquired intangible assets primarily consist of purchased technology rights and distribution network and are stated at cost less accumulated amortization. Amortization is calculated on a straight-line basis over the estimated useful lives of these assets and recorded in operating expenses. Amortization is calculated on a straight-line basis over the following estimated useful lives for the main acquired intangible assets:
|
|
Technology rights for licensed seeds
|
3
-
20
years
|
|
|
Distribution network
|
6
-
14
years
|
|
|
Trademark
|
Indefinite
|
Trademarks, which have indefinite live, are not amortized, but are reviewed for impairment at least annually, at year end date, or earlier upon the occurrence of certain triggering events.
| F-14 | ||
|
|
ORIGIN AGRITECH LIMITED
NOTES TO CONSOLIDATED FINANCIAL STATEMENTS
FOR THE YEAR ENDED SEPTEMBER 30, 20
11
, 201
2
AND 201
3
(In thousands, except number of share, per share data and unless otherwise stated)
|
|
2.
|
SUMMARY OF SIGNIFICANT ACCOUNTING POLICIES - Continued
|
Valuation of long-lived asset
The Company reviews the carrying value of long-lived assets to be held and used, including other intangible assets subject to amortization, when events and circumstances warrants such a review. The carrying value of a long-lived asset is considered impaired when the anticipated undiscounted cash flow from such asset is separately identifiable and is less than its carrying value. In that event, a loss is recognized based on the amount by which the carrying value exceeds the fair market value of the long-lived asset and intangible assets. Fair market value is determined primarily using the anticipated cash flows discounted at a rate commensurate with the risk involved. Losses on long-lived assets and intangible assets to be disposed are determined in a similar manner, except that fair market values are reduced for the cost to dispose.
Revenue recognition
The Company derives its revenues primarily from the sale of various branded conventional seeds and branded seeds with biotechnology traits.
Revenue is recognized when pervasive evidence of an arrangement exists, products have been delivered, the price is fixed or determinable, collectability is reasonably assured and the right of return has expired. The Company generally determines the final selling price after a period the goods are delivered to the customers. Accordingly, the Company defers revenues recognition until the selling price has been finalized with the customers.
The estimated amounts of revenues billed in excess of revenues recognized are recorded as deferred revenues.
Government subsidies
A government subsidy is not recognized until there is reasonable assurance that: (a) the enterprise will comply with the conditions attached to the grant; and (b) the grant will be received.
When the Company received the government subsidies but the conditions attached to the grants have not been fulfilled, such government subsidies are deferred and recorded under other payables and accrued expenses, and other long-term liability. The reclassification of short-term or long-term liabilities is depended on the management’s expectation of when the conditions attached to the grant can be fulfilled.
The Company received several financial supports from various levels of the government. In fiscal years 2012 and 2013, the Company received government subsidies of RMB
14,000
and RMB nil respectively for plant and equipment projects; RMB
10,900
and RMB nil respectively for land use right; and RMB
3,640
and RMB
16,105
for R&D and others. Government subsidies recognized as other income in the statement of income for the year ended September 30, 2011, 2012 and 2013, were RMB nil, RMB
3,846
and RMB
4,759
, respectively.
Cost of revenues
Cost of revenues consists of expenses directly related to sales, including the purchase prices and development costs for seeds and, during the fiscal years ended September 30, 2012 and 2013, agricultural chemical products, depreciation and amortization, impairment of inventory, shipping and handling costs, salary and compensation, supplies, license fees, and rent.
Research and development costs
Research and development costs relating to the development of new products and processes, including significant improvements and refinements to existing products, are expensed as incurred.
| F-15 | ||
|
|
ORIGIN AGRITECH LIMITED
NOTES TO CONSOLIDATED FINANCIAL STATEMENTS
FOR THE YEAR ENDED SEPTEMBER 30, 20
11
, 201
2
AND 201
3
(In thousands, except number of share, per share data and unless otherwise stated)
|
|
2.
|
SUMMARY OF SIGNIFICANT ACCOUNTING POLICIES - Continued
|
Advertising costs
Advertising costs are expensed when incurred and included in selling and marketing expenses. For the years ended September 30, 2011, 2012 and 2013, advertising costs were RMB7,034, RMB9,102 and RMB
8,666
, respectively.
Shipping and handling cost
The Company includes shipping and handling costs as either cost of goods sold or selling and administrative expenses depending on the nature of the expenses. Shipping and handling costs which relate to transportation of products to customers’ locations is charged to selling and marketing expenses and shipping and handling which relate to the transportation of goods to factories from suppliers and from one factory to another is charged to cost of revenues.
For the years ended September 30, 2011, 2012 and 2013, shipping and handling cost included in selling and marketing expenses were RMB
10,503
, RMB
11,446
, and RMB
13,313
, respectively.
Allowance for doubtful account
The Company regularly monitors and assesses the risk of not collecting amounts owed to the Company by customers. This evaluation is based upon a variety of factors including: an analysis of amounts current and past due along with relevant history and facts particular to the customer. Based upon the results of this analysis, the Company records an allowance for doubtful accounts for this risk.
Income taxes
Deferred income taxes are recognized for the future tax consequences of temporary differences between the tax bases of assets and liabilities and their reported amounts in the consolidated financial statements, net of operating loss carry forwards and credits. Deferred tax assets are reduced by a valuation allowance when, in the opinion of management, it is more likely than not that some portion or all of the deferred tax assets will not be realized. Current income taxes are provided for in accordance with the laws of the relevant tax authorities.
The Company adopted FASB ASC 740-10. The Company’s policy on classification of all interest and penalties related to unrecognized tax benefits, if any, as a component of income tax provisions.
Foreign currency translation
The functional currency of the Company excluding Agritech and State Harvest is Renminbi. Monetary assets and liabilities denominated in currencies other than Renminbi are translated into Renminbi at the rates of exchange ruling at the balance sheet date. Transactions in currencies other than Renminbi are converted into Renminbi at the applicable rates of exchange prevailing the transactions occurred. Transaction gains and losses are recognized in the consolidated statements of income and comprehensive income.
The functional currency of Agritech and State Harvest are maintained in United State dollars. Assets and liabilities are translated at the exchange rates at the balance sheet date, equity accounts are translated at historical exchange rates and revenues, expenses, gains and losses are translated using the average rate for the period. Translation adjustments are reported as cumulative translation adjustments and are shown as a separate component of other comprehensive (loss)/income. The Company has chosen Renminbi as its reporting currency.
| F-16 | ||
|
|
ORIGIN AGRITECH LIMITED
NOTES TO CONSOLIDATED FINANCIAL STATEMENTS
FOR THE YEAR ENDED SEPTEMBER 30, 20
11
, 201
2
AND 201
3
(In thousands, except number of share, per share data and unless otherwise stated)
|
|
2.
|
SUMMARY OF SIGNIFICANT ACCOUNTING POLICIES - Continued
|
Comprehensive income
Comprehensive income is defined to include all changes in equity except those resulting from investments by owners and distributions to owners. Comprehensive income for the years has been disclosed within the consolidated statements of income and comprehensive income for presentational purpose of the disclosure of comprehensive income attributable to Agritech and the non-controlling interests respectively.
Income per share
Basic income per share is computed by dividing net income by the weighted average number of common shares outstanding during the years. Diluted income per share gives effect to all dilutive potential common shares outstanding during the years. The weighted average number of common shares outstanding is adjusted to include the number of additional common shares that would have been outstanding if the dilutive potential common shares had been issued. In computing the dilutive effect of potential common shares, the average stock price for the period is used in determining the number of treasury shares assumed to be purchased with the proceeds from the exercise of options.
Share-based compensation
The Company adopts FASB ASC 718-10. ASC 718-10 requires that share-based payment transactions with employees, such as share options, be measured based on the grant-date fair value of the equity instrument issued and recognized as compensation expense over the requisite service period, with a corresponding addition to equity. Under this method, compensation cost related to employee share options or similar equity instruments is measured at the grant date based on the fair value of the award and is recognized over the period during which an employee is required to provide service in exchange for the award, which generally is the vesting period.
Fair value measurement
The Company adopted FASB ASC 820-10, and which defines fair value, establishes a framework for measuring fair value in GAAP, and expands disclosures about fair value measurements. ASC 820-10 does not require any new fair value measurements, but provides guidance on how to measure fair value by providing a fair value hierarchy used to classify the source of the information.
ASC 820-10 establishes a three-level valuation hierarchy of valuation techniques based on observable and unobservable inputs, which may be used to measure fair value and include the following:
Level 1 - Quoted prices in active markets for identical assets or liabilities.
Level 2 - Inputs other than Level 1 that are observable, either directly or indirectly, such as quoted prices for similar assets or liabilities; quoted prices in markets that are not active; or other inputs that are observable or can be corroborated by observable market data for substantially the full term of the assets or liabilities.
Level 3 - Unobservable inputs that are supported by little or no market activity and that are significant to the fair value of the assets or liabilities.
Classification within the hierarchy is determined based on the lowest level of input that is significant to the fair value measurement.
| F-17 | ||
|
|
ORIGIN AGRITECH LIMITED
NOTES TO CONSOLIDATED FINANCIAL STATEMENTS
FOR THE YEAR ENDED SEPTEMBER 30, 20
11
, 201
2
AND 201
3
(In thousands, except number of share, per share data and unless otherwise stated)
|
|
2.
|
SUMMARY OF SIGNIFICANT ACCOUNTING POLICIES - Continued
|
Recently issued accounting pronouncements
In December 2011, the FASB issued ASU 2011-11,
Balance Sheet (Topic 210): disclosures about Offsetting Assets and Liabilities,
which requires entities to disclose both gross and net information about both instruments and transactions eligible for offset in the statement of financial position and instruments and transactions subject to an agreement similar to a master netting agreement. The objective of the disclosure is to facilitate comparison between those entities that prepare their financial statements on the basis of U.S. GAAP and those entities that prepare their financial statements on the basis of International Financial Reporting Standards (“IFRS”). This ASU is effective for fiscal years, and interim periods within those years, beginning on or after January 1, 2013. Retrospective presentation for all comparative periods presented is required. The Company believes that its adoption of ASU 2011-11 will not have any material impact on its consolidated financial statements.
In October 2012, the FASB issued ASU 2012-04,
Technical Corrections and Improvements,
which makes certain technical corrections and “conforming fair value amendments” to the FASB Accounting Standards Codification. The amendments affect various codification topics and apply to all reporting entities within the scope of those topics. These provisions of the amendment are effective upon issuance, except for amendments that are subject to transition guidance, which will be effective for fiscal periods beginning after December 15, 2012. The Company believes that its adoption of ASU 2012-04 will not have any material impact on its consolidated financial statements.
In January 2013, the FASB issued ASU 2013-01,
Balance Sheet (Topic 220): Clarifying the Scope of Disclosures about Offsetting Assets and Liabilities,
which clarifies that ordinary trade receivables and receivables are not in the scope of ASU 2011-11. ASU 2011-11 applies only to derivatives, repurchase agreements and reverse purchase agreements, and securities borrowing and securities lending transactions that are either offset in accordance with specific criteria contained in the Codification or subject to a master netting arrangement or similar agreement. The effective date is the same as the effective date of ASU 2011-11, i.e., effective for fiscal years, and interim periods within those years, beginning on or after January 1, 2013. The Company believes that its adoption of ASU 2013-01 will not have any material impact on its consolidated financial statements.
In February 2013, the FASB issued ASU 2013-02,
Comprehensive Income (Topic 220): Reporting of Amounts Reclassified Out of Accumulated Other Comprehensive Income.
This ASU requires an entity to provide information about the amounts reclassified out of accumulated other comprehensive income by component. In addition, an entity is required to present, either on the face of the statement where net income is presented or in the notes, significant amounts reclassified. The amendments do not change the current requirements for reporting net income or other comprehensive income in financial statements. However, the amendments require an entity to provide information about the amounts reclassified out of accumulated other comprehensive income by component. In addition, an entity is required to present, either on the face of the statement where net income is presented or in the notes, significant amounts reclassified. This ASU is effective prospectively for reporting periods beginning after December 15, 2012. The Company believes that its adoption of ASU 2013-02 will not have any material impact on its consolidated financial statements.
| F-18 | ||
|
|
ORIGIN AGRITECH LIMITED
NOTES TO CONSOLIDATED FINANCIAL STATEMENTS
FOR THE YEAR ENDED SEPTEMBER 30, 20
11
, 201
2
AND 201
3
(In thousands, except number of share, per share data and unless otherwise stated)
|
|
2.
|
SUMMARY OF SIGNIFICANT ACCOUNTING POLICIES - Continued
|
Recently issued accounting pronouncements - Continued
In July 2013, the FASB issued ASU 2013-11,
Income Tax (Topic 740):
Presentation of an Unrecognized Tax Benefit When a Net Operating Loss Carry forward, a Similar Tax Loss, or a Tax Credit Carry forward Exists.
This ASU provides guidance on the financial statement presentation of an unrecognized tax benefit when a net operating loss carry forward, a similar tax loss, or a tax credit carry forward exists. An unrecognized tax benefit, or a portion of an unrecognized tax benefit, should be presented in the financial statements as a reduction to a deferred tax asset for a net operating loss carry forward, a similar tax loss, or a tax credit carry forward, except as follows. To the extent a net operating loss carry forward, a similar tax loss, or a tax credit carry forward is not available at the reporting date under the tax law of the applicable jurisdiction to settle any additional income taxes that would result from the disallowance of a tax position or the tax law of the applicable jurisdiction does not require the entity to use, and the entity does not intend to use, the deferred tax asset for such purpose, the unrecognized tax benefit should be presented in the financial statements as a liability and should not be combined with deferred tax assets. The amendments in this Update are effective for fiscal years, and interim periods within those years, beginning after December 15, 2013. The Company believes that its adoption of ASU 2013-11 will not have any material impact on its consolidated financial statements.
| F-19 | ||
|
|
ORIGIN AGRITECH LIMITED
NOTES TO CONSOLIDATED FINANCIAL STATEMENTS
FOR THE YEAR ENDED SEPTEMBER 30, 2011, 2012 AND 2013
(In thousands, except number of share, per share data and unless otherwise stated)
NOTES TO CONSOLIDATED FINANCIAL STATEMENTS
FOR THE YEAR ENDED SEPTEMBER 30, 2011, 2012 AND 2013
(In thousands, except number of share, per share data and unless otherwise stated)
|
|
3.
|
RELATED PARTY BALANCES AND TRANSACTIONS
|
(1)
Related party relationships
|
|
Name of related parties
|
|
Relationship
|
|
|
Jinong
|
|
Being a cost investment of the Company (note 10)
|
|
|
Liyu
|
|
Being an equity investment of the Company (note 10)
|
|
|
Henan Agriculture University
|
|
Being the non-controlling interest of Beijing Origin
|
|
|
Beijing Shihui Agriculture Ltd.
|
|
Being owned
by close family members of CEO
|
|
|
Agriculture Institute in Neijiang city
|
|
Being the non-controlling interest of Denong
|
|
|
T
he Fifth Agricultural Construction Division of the Xinjiang Production and Construction Corps
(“XPCC 5th Division”)
|
|
Being the non-controlling interest of Xinjiang Origin
|
(2)
Due from related parties
|
|
|
September 30,
|
|
||
|
|
|
2012
|
|
2013
|
|
|
|
|
RMB
|
|
RMB
|
|
|
|
|
|
|
|
|
|
Henan Agriculture University (note (i))
|
|
2,082
|
|
2,000
|
|
|
Agriculture Institute in Neijiang city (note (ii))
|
|
-
|
|
500
|
|
|
Beijing Shihui Agriculture Ltd. (note (iii))
|
|
-
|
|
900
|
|
|
|
|
|
|
|
|
|
|
|
2,082
|
|
3,400
|
|
|
|
Note (i):
|
The balance as of September 30, 2013 represented the advance from Origin to SK Wu Research Institute (through Henan Agriculture University) for its research operation, which is jointly sponsored by the provincial government of Henan Province and Origin.
|
|
|
|
|
|
|
Note (ii):
|
The balance as of September 30, 2013 represented the advance from
Denong to
Agriculture Institute in Neijiang city, Sichuan Province for its research operation.
|
|
|
|
|
|
|
Note (iii):
|
The balance as of September 30, 2013 represented the advance to Beijing Shihui Agriculture Ltd. for providing the network maintenance and software development services for the Company,
which was on an arm’s length basis, and the services have not been completed as of September 30, 2013
|
(3)
Due to related parties
|
|
|
September 30,
|
|
||
|
|
|
2012
|
|
2013
|
|
|
|
|
RMB
|
|
RMB
|
|
|
|
|
|
|
|
|
|
XPCC 5th Division
|
|
950
|
|
54
|
|
|
Companies controlled by the Company’s directors
|
|
1,366
|
|
1,325
|
|
|
Ex-shareholders of State Harvest
|
|
156
|
|
151
|
|
|
Liyu
|
|
297
|
|
-
|
|
|
|
|
|
|
|
|
|
|
|
2,769
|
|
1,530
|
|
| F-20 | ||
|
|
ORIGIN AGRITECH LIMITED
NOTES TO CONSOLIDATED FINANCIAL STATEMENTS
FOR THE YEAR ENDED SEPTEMBER 30, 2011, 2012 AND 2013
(In thousands, except number of share, per share data and unless otherwise stated)
NOTES TO CONSOLIDATED FINANCIAL STATEMENTS
FOR THE YEAR ENDED SEPTEMBER 30, 2011, 2012 AND 2013
(In thousands, except number of share, per share data and unless otherwise stated)
3.
RELATED PARTY BALANCES AND TRANSACTIONS - Continued
(4)
Transactions with related parties
(a)
Sales to
|
|
|
Year ended
|
|
||||
|
|
|
September 30,
|
|
||||
|
|
|
2011
|
|
2012
|
|
2013
|
|
|
|
|
RMB
|
|
RMB
|
|
RMB
|
|
|
|
|
|
|
|
|
|
|
|
Jinong
|
|
2,000
|
|
8,319
|
|
-
|
|
(b)
Purchases from
|
|
|
Year ended
|
|
||||
|
|
|
September 30,
|
|
||||
|
|
|
2011
|
|
2012
|
|
2013
|
|
|
|
|
RMB
|
|
RMB
|
|
RMB
|
|
|
|
|
|
|
|
|
|
|
|
Liyu
|
|
90
|
|
-
|
|
-
|
|
|
XPCC 5th Division
|
|
-
|
|
2,788
|
|
-
|
|
|
Jinong
|
|
-
|
|
25,984
|
|
-
|
|
|
|
|
|
|
|
|
|
|
|
|
|
90
|
|
28,772
|
|
-
|
|
(c)
Technology usage fees charged by
|
|
|
Year ended
September 30, |
|
||||
|
|
|
2011
|
|
2012
|
|
2013
|
|
|
|
|
RMB
|
|
RMB
|
|
RMB
|
|
|
|
|
|
|
|
|
|
|
|
Liyu
|
|
5,953
|
|
9,541
|
|
14,665
|
|
|
Non-controlling interests of Denong
|
|
602
|
|
-
|
|
-
|
|
|
|
|
|
|
|
|
|
|
|
|
|
6,555
|
|
9,541
|
|
14,665
|
|
The above amounts related to technology usage fees paid to certain related party research centers for the exclusive right to use certain seed technologies.
(d)
Rental expense paid for plant and equipment
|
|
|
Year ended
September 30, |
|
||||
|
|
|
2011
|
|
2012
|
|
2013
|
|
|
|
|
RMB
|
|
RMB
|
|
RMB
|
|
|
|
|
|
|
|
|
|
|
|
Jinong
|
|
468
|
|
-
|
|
-
|
|
| F-21 | ||
|
|
ORIGIN AGRITECH LIMITED
NOTES TO CONSOLIDATED FINANCIAL STATEMENTS
FOR THE YEAR ENDED SEPTEMBER 30, 2011, 2012 AND 2013
(In thousands, except number of share, per share data and unless otherwise stated)
NOTES TO CONSOLIDATED FINANCIAL STATEMENTS
FOR THE YEAR ENDED SEPTEMBER 30, 2011, 2012 AND 2013
(In thousands, except number of share, per share data and unless otherwise stated)
3.
RELATED PARTY BALANCES AND TRANSACTIONS - Continued
(e)
Research & Development expenses
|
|
|
Year ended
September 30, |
|
||||
|
|
|
2011
|
|
2012
|
|
2013
|
|
|
|
|
RMB
|
|
RMB
|
|
RMB
|
|
|
|
|
|
|
|
|
|
|
|
Holding company of Jinong
|
|
5,000
|
|
-
|
|
-
|
|
(f)
Dividend received from
|
|
|
Year ended
September 30, |
|
||||
|
|
|
2011
|
|
2012
|
|
2013
|
|
|
|
|
RMB
|
|
RMB
|
|
RMB
|
|
|
|
|
|
|
|
|
|
|
|
Liyu
|
|
2,467
|
|
2,100
|
|
2,700
|
|
(g)
Dividend paid to
|
|
|
Year ended
September 30, |
|
||||
|
|
|
2011
|
|
2012
|
|
2013
|
|
|
|
|
RMB
|
|
RMB
|
|
RMB
|
|
|
|
|
|
|
|
|
|
|
|
Jinong
|
|
10,050
|
|
-
|
|
-
|
|
|
|
4.
|
ACCOUNTS RECEIVABLE
|
Accounts receivable consists of trade receivables resulting from sales of products during the normal course of business.
Allowance for doubtful account is as follows:
|
|
|
Year ended
September 30, |
|
||||
|
|
|
2011
|
|
2012
|
|
2013
|
|
|
|
|
RMB
|
|
RMB
|
|
RMB
|
|
|
|
|
|
|
|
|
|
|
|
Balance at beginning of year
|
|
842
|
|
2,714
|
|
6,752
|
|
|
Additions
|
|
1,872
|
|
4,038
|
|
5,358
|
|
|
|
|
|
|
|
|
|
|
|
Balance at end of year
|
|
2,714
|
|
6,752
|
|
12,110
|
|
| F-22 | ||
|
|
ORIGIN AGRITECH LIMITED
NOTES TO CONSOLIDATED FINANCIAL STATEMENTS
FOR THE YEAR ENDED SEPTEMBER 30, 2011, 2012 AND 2013
(In thousands, except number of share, per share data and unless otherwise stated)
NOTES TO CONSOLIDATED FINANCIAL STATEMENTS
FOR THE YEAR ENDED SEPTEMBER 30, 2011, 2012 AND 2013
(In thousands, except number of share, per share data and unless otherwise stated)
|
5
.
|
ADVANCES TO SUPPLIERS
|
Advances to suppliers consist of the following:
|
|
|
September 30,
|
|||
|
|
|
2012
|
|
2013
|
|
|
|
|
RMB
|
|
RMB
|
|
|
|
|
|
|
|
|
|
Purchases of materials
|
|
2,357
|
|
1,665
|
|
|
Prepayments for advertisement
|
|
620
|
|
4,636
|
|
|
Prepayments for transportation fee
|
|
928
|
|
2
|
|
|
Prepayments for operating lease
|
|
186
|
|
134
|
|
|
Prepayments for testing fee
|
|
134
|
|
307
|
|
|
Utility deposit
|
|
977
|
|
785
|
|
|
Deposits for research and development fee
|
|
1,050
|
|
1,416
|
|
|
Prepayment for seed usage fee
|
|
574
|
|
198
|
|
|
Others
|
|
976
|
|
625
|
|
|
|
|
7,802
|
|
9,768
|
|
Advances to suppliers mainly represent deposits paid but related materials and services have not been provided to the Company.
Inventories consist of the following:
|
|
|
September 30,
|
|
||
|
|
|
2012
|
|
2013
|
|
|
|
|
RMB
|
|
RMB
|
|
|
|
|
|
|
|
|
|
Work in progress and supplies
|
|
266,632
|
|
436,251
|
|
|
Finished goods
|
|
43,459
|
|
86,861
|
|
|
Provision
|
|
(27,547)
|
|
(52,301)
|
|
|
|
|
282,544
|
|
470,811
|
|
As of September 30, 2012 and 2013, goods already delivered to customers but still recorded in finished goods, amounted to RMB
10,959
and RMB
11,376
, respectively. As the Company does not recognize revenues until the selling prices of respective goods have been finalized with the customers, goods delivered to customers as mentioned above will only be transferred to cost of revenues when related revenues is recognized.
Provision for inventories is as below:
|
|
|
Years ended
September 30, |
|
||
|
|
|
2012
|
|
2013
|
|
|
|
|
RMB
|
|
RMB
|
|
|
|
|
|
|
|
|
|
Balance at beginning of year
|
|
21,253
|
|
27,547
|
|
|
Additions
|
|
27,453
|
|
38,561
|
|
|
Write-off
|
|
(21,159)
|
|
(13,807)
|
|
|
|
|
|
|
|
|
|
Balance at end of year
|
|
27,547
|
|
52,301
|
|
| F-23 | ||
|
|
ORIGIN AGRITECH LIMITED
NOTES TO CONSOLIDATED FINANCIAL STATEMENTS
FOR THE YEAR ENDED SEPTEMBER 30, 2011, 2012 AND 2013
(In thousands, except number of share, per share data and unless otherwise stated)
7.
OTHER CURRENT ASSETS
Other current assets consist of the following:
|
|
|
September 30,
|
|
||
|
|
|
2012
|
|
2013
|
|
|
|
|
RMB
|
|
RMB
|
|
|
|
|
|
|
|
|
|
Advances to staff for business use
|
|
8,368
|
|
5,277
|
|
|
Deposits for rental
|
|
3,999
|
|
312
|
|
|
Deposits for land use right
|
|
2,805
|
|
167
|
|
|
Others
|
|
1,235
|
|
1,244
|
|
|
|
|
|
|
|
|
|
|
|
16,407
|
|
7,000
|
|
|
|
8.
|
LAND USE RIGHTS, NET
|
Land use rights, net consist of the following:
|
|
|
September 30,
|
|
||
|
|
|
2012
|
|
2013
|
|
|
|
|
RMB
|
|
RMB
|
|
|
|
|
|
|
|
|
|
Land use rights
|
|
36,399
|
|
38,228
|
|
|
Accumulated amortization
|
|
(4,081)
|
|
(5,023)
|
|
|
|
|
|
|
|
|
|
Land use rights, net
|
|
32,318
|
|
33,205
|
|
Land use rights with net values of RMB
2,546
and RMB
14,676
have been pledged as collateral for bank loans as of September 30, 2012 and 2013.
Amortization expenses for the years ended September 30, 2011, 2012 and 2013 were RMB
502
, RMB
892
and RMB
942
, respectively.
|
9
.
|
PLANT AND EQUIPMENT, NET
|
Plant and equipment, net consist of the following:
|
|
|
September 30,
|
|
||
|
|
|
2012
|
|
2013
|
|
|
|
|
RMB
|
|
RMB
|
|
|
|
|
|
|
|
|
|
Plant and building
|
|
155,343
|
|
252,842
|
|
|
Machinery and equipment
|
|
73,824
|
|
144,939
|
|
|
Furniture and office equipment
|
|
11,536
|
|
12,168
|
|
|
Motor vehicles
|
|
10,194
|
|
11,773
|
|
|
Leasehold improvements
|
|
212
|
|
-
|
|
|
|
|
|
|
|
|
|
Total
|
|
251,109
|
|
421,722
|
|
|
Accumulated depreciation
|
|
(66,000)
|
|
(82,284)
|
|
|
Construction in progress
|
|
131,976
|
|
15,297
|
|
|
|
|
|
|
|
|
|
Plant and equipment, net
|
|
317,085
|
|
354,735
|
|
| F-24 | ||
|
|
ORIGIN AGRITECH LIMITED
NOTES TO CONSOLIDATED FINANCIAL STATEMENTS
FOR THE YEAR ENDED SEPTEMBER 30, 20
11
, 201
2
AND 201
3
(In thousands, except number of share, per share data and unless otherwise stated)
|
9
.
|
PLANT AND EQUIPMENT, NET - Continued
|
Included in plant and building with net values of RMB
35,570
and RMB191,729 have been pledged for bank loans as of September 30, 2012 and 2013.
The depreciation expenses for the years ended September 30, 2011, 2012 and 2013 were RMB
16,235
, RMB
1
2,803, and RMB22,262, respectively.
Construction in progress mainly refers to the new office buildings, production lines and other production facilities under construction.
|
|
10.
|
|
EQUITY INVESTMENTS
|
Equity investments consist of the following:
|
|
|
September 30,
|
|
||
|
|
|
2012
|
|
2013
|
|
|
|
|
RMB
|
|
RMB
|
|
|
|
|
|
|
|
|
|
Equity method investment
|
|
3,712
|
|
6,173
|
|
|
Cost method investment
|
|
18,721
|
|
18,721
|
|
|
|
|
22,433
|
|
24,894
|
|
Liyu
The Company owns 30% equity interest in Liyu and accounts for the investment in Liyu under the equity method. For the years ended September 30, 2011, 2012 and 2013, the Company recorded its pro-rata share of earnings in Liyu of RMB
2,954
, RMB
4,030
and RMB
5,161
respectively. The Company also received dividends of RMB
2,467
, RMB
2,100
and RMB
2,700
respectively from Liyu for each of the years ended September 30, 2011, 2012 and 2013. The dividend received was accounted for as a reduction in equity investments.
A summary of the financial information of
Liyu
is set forth below:
|
Balance sheets:
|
|
September 30,
|
|
||
|
|
|
2012
|
|
2013
|
|
|
|
|
RMB
|
|
RMB
|
|
|
|
|
|
|
|
|
|
Current assets
|
|
14,091
|
|
15,187
|
|
|
Non-current assets
|
|
5,783
|
|
8,296
|
|
|
Total assets
|
|
19,874
|
|
23,483
|
|
|
Current and total liabilities
|
|
(7,275)
|
|
(2,678)
|
|
|
Total shareholders’ equity
|
|
12,599
|
|
20,805
|
|
|
|
|
Year ended
|
|
||||
|
Operating results:
|
|
September 30,
|
|
||||
|
|
|
2011
|
|
2012
|
|
2013
|
|
|
|
|
RMB
|
|
RMB
|
|
RMB
|
|
|
|
|
|
|
|
|
|
|
|
Revenue
|
|
19,027
|
|
19,038
|
|
27,125
|
|
|
Income from operations
|
|
11,304
|
|
11,818
|
|
16,653
|
|
|
Net income
|
|
9,845
|
|
13,434
|
|
17,206
|
|
| F-25 | ||
|
|
ORIGIN AGRITECH LIMITED
NOTES TO CONSOLIDATED FINANCIAL STATEMENTS
FOR THE YEAR ENDED SEPTEMBER 30, 20
11
, 201
2
AND 201
3
(In thousands, except number of share, per share data and unless otherwise stated)
10.
EQUITY INVESTMENTS - Continued
Jinong
|
|
11.
|
ACQUIRED INTANGIBLE ASSETS, NET
|
Acquired intangible assets, net consist of the following:
|
|
|
September 30,
|
|
||
|
|
|
2012
|
|
2013
|
|
|
|
|
RMB
|
|
RMB
|
|
|
|
|
|
|
|
|
|
Technology rights for licensed seeds
|
|
78,323
|
|
80,602
|
|
|
Distribution network
|
|
6,739
|
|
6,739
|
|
|
Others
|
|
4,763
|
|
4,976
|
|
|
|
|
|
|
|
|
|
|
|
89,825
|
|
92,317
|
|
|
Accumulated amortization
|
|
(59,926)
|
|
(64,886)
|
|
|
Impairment provision
|
|
(4,314)
|
|
(4,314)
|
|
|
|
|
|
|
|
|
|
Acquired intangible assets, net
|
|
25,585
|
|
23,117
|
|
Amortization expenses for the years ended September 30, 2011, 2012 and 2013 were RMB
8,870
, RMB
5,846
and RMB
4,960
, respectively.
No impairment provision has been charged for the years ended September 30, 2011, 2012 and 2013.
Amortization expense on these intangible assets for each of the next five years is as follows:
|
Year ending September 30,
|
|
RMB
|
|
|
|
|
|
2014
|
|
4,127
|
|
2015
|
|
3,184
|
|
2016
|
|
2,721
|
|
2017
|
|
1,792
|
|
2018
|
|
1,520
|
|
|
|
|
|
Total
|
|
13,344
|
The Company enters into technology transfer and usage agreements with strategic partners and pays up-front fees for the exclusive rights to certain seed technologies. Technology rights amortized over an average usage period of
5
years and charged to general and administrative expenses.
| F-26 | ||
|
|
ORIGIN AGRITECH LIMITED
NOTES TO CONSOLIDATED FINANCIAL STATEMENTS
FOR THE YEAR ENDED SEPTEMBER 30, 2011, 2012 AND 2013
(In thousands, except number of share, per share data and unless otherwise stated)
12.
OTHER ASSETS
Other assets consist of the following:
|
|
|
September 30,
|
|
||
|
|
|
2012
|
|
2013
|
|
|
|
|
RMB
|
|
RMB
|
|
|
|
|
|
|
|
|
|
Prepaid lease
|
|
2,232
|
|
2,080
|
|
|
Deposits for purchase of plant and equipment
|
|
2,977
|
|
5,145
|
|
|
Deposits for purchase of seed usage right
|
|
-
|
|
4,000
|
|
|
Others
|
|
37
|
|
31
|
|
|
|
|
|
|
|
|
|
|
|
5,246
|
|
11,256
|
|
13.
BORROWINGS
|
|
|
September 30,
|
|
||
|
|
|
2012
|
|
2013
|
|
|
|
|
RMB
|
|
RMB
|
|
|
|
|
|
|
|
|
|
Short-term borrowings
|
|
35,000
|
|
205,000
|
|
|
|
|
|
|
|
|
|
Current portion of long-term borrowings
|
|
4,000
|
|
16,500
|
|
|
|
|
|
|
|
|
|
Long-term borrowings
|
|
35,000
|
|
64,819
|
|
As of September 30, 2013, short-term borrowings were comprised of secured and unsecured bank loans of RMB
65,000
and RMB
140,000
, respectively. Secured bank loan of RMB
65,000
with an annual interest rate of
6.3
%
represented the bank borrowing under Beijing Origin, which was secured by a land use right of RMB
2,485
(note 8) and plant and equipment of RMB
34,610
(note 9).
On the other hand, unsecured
short-term
bank loans of RMB
30,000
represented the bank borrowings with an annual interest rate of
6.9
%, under Beijing Origin.
This loan was guaranteed by CEO of the Company. While, the rest of unsecured short-term bank loans, amounting to RMB
110,000
, under Linze Origin were guaranteed by Beijing Origin. The annual interest rates of these loans were ranged from
6.0
% to
7.216
%.
As of September 30, 2013, long-term borrowings were comprised of secured and unsecured bank loans of RMB
46,319
and RMB
35,000
, respectively. Secured bank loan of
RMB
34,023
represented the bank borrowing under Xinjiang Origin, which was secured by a land use right of
RMB
12,191
(note 8) and plant and equipment of
RMB
157,119
(note 9). The annual interest rate
was
6.72
%.
While, the rest of secured long-term bank loan of RMB12,296 with an annual interest rate of 2.567%, represented bank borrowing under Origin Agritech Limited, which was secured by Beijing Origin’s restricted cash amounting of RMB14,350.
On the other hand, unsecured
long-term
bank loans of RMB35,000
, with an annual interest rate from
7.04
% to
7.315
%,
represented the bank borrowings under
Xinjiang Origin, which were guaranteed by Beijing Origin
and Xinjiang
AiBiHu Agricultural Industrial Commercial Enterprise
, which is an affiliate of XPCC 5th Division
.
The
current portion of the loan amounted to RMB
16,500
, which will be due within one year, is presented as “current portion of long-term borrowing” on the consolidated balance sheet as of September 30, 2013.
| F-27 | ||
|
|
ORIGIN AGRITECH LIMITED
NOTES TO CONSOLIDATED FINANCIAL STATEMENTS
FOR THE YEAR ENDED SEPTEMBER 30, 20
11
, 201
2
AND 201
3
(In thousands, except number of share, per share data and unless otherwise stated)
13. BORROWINGS - Continued
As of September 30, 2012, short-term borrowings were comprised of secured and unsecured bank loans of RMB
5,000
and RMB
30,000
, respectively. Secured bank loan of RMB
5,000
represented the bank borrowing under Beijing Origin, which has been supported by a land use right of RMB
2,546
(note 8) and plant and equipment of RMB
35,570
(note 9). The annual interest rate is
6.888
%.
On the other hand, unsecured bank loans of RMB
30,000
represented the bank borrowings with annual interest rate of
7.216
%, which were under Linze Origin. The loans have been guaranteed by Beijing Origin.
As of September 30, 2012, long-term borrowings were comprised of unsecured bank loans of RMB
39,000
under Xinjiang Origin, which have been guaranteed by Beijing Origin with annual interest rates ranged from
7.040
% to
7.315
%. The current portion of the loan amounted to RMB
4,000
, which will be due within one year, is presented as “current portion of long-term borrowing” on the consolidated balance sheet as of September 30, 2012.
Interest expense and weighted average interest rate for the years ended September 30, 2011, 2012 and 2013 were RMB
1,469
and
6.56
%, RMB
4,029
and
7.04
%, RMB
11,326
and
6.26
%, respectively.
14.
OTHER PAYABLES AND ACCRUED EXPENSES
Other payables and accrued expenses consist of:
|
|
|
September 30,
|
|
||
|
|
|
2012
|
|
2013
|
|
|
|
|
RMB
|
|
RMB
|
|
|
|
|
|
|
|
|
|
Payable for purchase of plant and equipment
|
|
10,158
|
|
2,458
|
|
|
Payable for purchase of land use rights
|
|
1,050
|
|
920
|
|
|
Payable for purchase of construction-in-progress
|
|
1,443
|
|
2,214
|
|
|
Professional fee payable
|
|
2,028
|
|
2,170
|
|
|
Salaries and bonus payable
|
|
18,966
|
|
12,481
|
|
|
Accrued interest
|
|
1,813
|
|
1,826
|
|
|
Accrued compensation expenses
|
|
36
|
|
-
|
|
|
Other taxes payable
|
|
782
|
|
821
|
|
|
Deposits from growers
|
|
3,425
|
|
4,084
|
|
|
Deposits from others
|
|
1,046
|
|
1,753
|
|
|
Payable for labor union, housing fund and education expenses
|
|
1,657
|
|
761
|
|
|
Loans from employees of Denong (note i)
|
|
310
|
|
310
|
|
|
Loans from third parties (note ii)
|
|
3,600
|
|
3,600
|
|
|
Deferred government subsidies
|
|
6,840
|
|
15,911
|
|
|
Others
|
|
3,590
|
|
4,474
|
|
|
|
|
56,744
|
|
53,783
|
|
|
|
Note (i):
|
RMB310 were borrowed from employees of Denong with interest free, unsecured and have no fixed repayment terms at the years ended September 30, 2012 and 2013, respectively.
|
|
|
Note (ii):
|
RMB3,600 was borrowed from third party companies with interest free, unsecured and have no fixed repayment terms at the years ended September 30, 2012 and 2013, respectively.
|
| F-28 | ||
|
|
ORIGIN AGRITECH LIMITED
NOTES TO CONSOLIDATED FINANCIAL STATEMENTS
FOR THE YEAR ENDED SEPTEMBER 30, 20
11
, 201
2
AND 201
3
(In thousands, except number of share, per share data and unless otherwise stated)
15.
OTHER LONG-TERM LIABILITY
In prior year, the Company received government subsidies from the local PRC government for plant and equipment projects of RMB
14
million (US$
2.21
million) and land use right of RMB
10.90
million (US$
1.72
million). The non-current portion of such government subsidies are recorded as long-term liability for, which will be amortized over the estimated useful lives related to the plant and equipment and land use right.
16.
SHARE OPTION PLANS
On November 8, 2005, the Company adopted the 2005 Performance Equity Plan (the “2005 Plan”) which allows the Company to offer a variety of incentive awards to employees to acquire up to
1,500,000
ordinary shares under the 2005 Plan. On April 22, 2010, the Company adopted the 2009 Performance Equity Plan and is authorized to issue equity based awards for up to
1,500,000
ordinary shares to the Company’s employees and senior managements. The main purpose of the two plans is to provide an existing structure and renewable benefit plan for senior management and directors, employees and consultants.
Under the terms of the 2005 Plan, on November 8, 2005, options to purchase
974,000
ordinary shares at the price of US$
8.75
per share were granted (“Tranche 1”), which all expired on
November 8, 2010
; on October 22, 2007 the Company granted its employees options to purchase
20,000
ordinary shares at the price of US$
9.27
which all expired on
October 22, 2012
(“Tranche 2”); on
March 28, 2008
the Company granted its employees options to purchase
381,000
ordinary shares at the price of US$
5.30
(“Tranche 3”); on
June 16, 2008
the Company granted its employees options to purchase
10,000
ordinary shares at the price of US$
6.64
(“Tranche 4”); and on
January 4, 2010
the Company granted its employees options to purchase
125,000
ordinary shares at the price of US$
12.23
(“Tranche 5”). Under the terms of the 2009 Plan, on
January 3, 2011
, the Company granted its employees options to purchase
120,000
ordinary shares at the price of US$
10.84
(“Tranche 6”); and on
January 3, 2012,
the Company granted its employees options to purchase
365,000
ordinary shares at the price of US$
2.55
(“Tranche 7”), and on
January 2, 2013
, the Company granted its employees options to purchase
360,000
ordinary shares at the price of US$
1.44
(“Tranche 8”) Subject to the modifications discussed below, all the options have an expiration date that is
5
years from the date of grant and vest immediately or over a period of
1
to
5
years. As of September 30, 2013, there were
120,000
shares under the 2005 Plan allocated to awards and there were
840,000
shares under the 2009 Plan allocated to awards.
After the adjusted awards, all the option awards have an exercise price of $
1.44
to $
12.23
and expire
5
years from the date of grant and vest immediately or over a period of
1
to
5
years.
On December 28, 2012 and March 22, 2013, the compensation committee of the Board of Directors approved the substitution of restricted stock for outstanding grants under Tranche 3 and Tranche 4 that no longer offer the kind of incentive opportunity originally sought for valued employees (total 21 employees) given the fall in the market price of the ordinary shares of the Company during recent years. The revised terms of the stock options were accounted for as a modification in accordance with ASC 718-20. For the purpose of determining the amount of any incremental share-based compensation cost that may have resulted from the modification of the exercise prices, the Company compared the fair value of modified awards and that of the original awards, both estimated at the date of the modification and determined that none of the modifications required the recognition of additional share-based payment expense.
During the fiscal years ended September 30, 2012 and 2013, no options were exercised.
For the options outstanding at September 30, 2012 and 2013, the weighted average remaining contractual lives are
3.07
and
3.27
years, respectively.
| F-29 | ||
|
|
ORIGIN AGRITECH LIMITED
NOTES TO CONSOLIDATED FINANCIAL STATEMENTS
FOR THE YEAR ENDED SEPTEMBER 30, 2011, 2012 AND 2013
(In thousands, except number of share, per share data and unless otherwise stated)
16.
SHARE OPTION PLANS - Continued
A summary of the share option activity under the 2005 and 2009 Plans is as follows:
|
|
|
Tranche 2
|
|
Tranche 3
|
|
Tranche 4
|
|
Tranche 5
|
|
Tranche 6
|
|
Tranche 7
|
|
Tranche 8
|
|
|
|
|
|
|
|
|
|
|
|
|
|
|
|
|
|
|
|
|
|
October 22,
|
|
March 28,
|
|
June 16,
|
|
January 4,
|
|
January 3,
|
|
January 3,
|
|
January 2,
|
|
|
Grant date
|
|
2007
|
|
2008
|
|
2008
|
|
2010
|
|
2011
|
|
2012
|
|
2013
|
|
|
|
|
|
|
|
|
|
|
|
|
|
|
|
|
|
|
|
Options outstanding as of
October 1, 2011 |
|
5,000
|
|
130,167
|
|
10,000
|
|
120,000
|
|
120,000
|
|
-
|
|
-
|
|
|
Number of options granted
|
|
-
|
|
-
|
|
-
|
|
-
|
|
-
|
|
365,000
|
|
-
|
|
|
Options exercised
|
|
-
|
|
-
|
|
-
|
|
-
|
|
-
|
|
-
|
|
-
|
|
|
Options expired
|
|
-
|
|
(5,667)
|
|
-
|
|
-
|
|
(5,000)
|
|
-
|
|
-
|
|
|
|
|
|
|
|
|
|
|
|
|
|
|
|
|
|
|
|
Options outstanding as of
September 30, 2012 |
|
5,000
|
|
124,500
|
|
10,000
|
|
120,000
|
|
115,000
|
|
365,000
|
|
-
|
|
|
Number of options granted
|
|
-
|
|
-
|
|
-
|
|
-
|
|
-
|
|
-
|
|
360,000
|
|
|
Options cancelled/expired
|
|
(5,000)
|
|
(124,500)
|
|
(10,000)
|
|
-
|
|
-
|
|
-
|
|
-
|
|
|
Outstanding as of September
30, 2013 |
|
-
|
|
-
|
|
-
|
|
120,000
|
|
115,000
|
|
365,000
|
|
360,000
|
|
|
|
|
|
|
|
|
|
|
|
|
|
|
|
|
|
|
|
Options vested and exercisable
|
|
|
|
|
|
|
|
|
|
|
|
|
|
|
|
|
At September 30, 2012
|
|
5,000
|
|
124,500
|
|
10,000
|
|
120,000
|
|
115,000
|
|
365,000
|
|
-
|
|
|
|
|
|
|
|
|
|
|
|
|
|
|
|
|
|
|
|
At September 30, 2013
|
|
-
|
|
-
|
|
-
|
|
120,000
|
|
115,000
|
|
365,000
|
|
360,000
|
|
|
|
|
|
|
|
|
|
|
|
|
|
|
|
|
|
|
|
Weighted average fair value
at the grant date (USD) |
|
4.55
|
|
2.69
|
|
3.42
|
|
7.20
|
|
6.08
|
|
1.45
|
|
0.76
|
|
The fair value of each option granted is estimated on the date of grant using the Black-Scholes Option Pricing Model:
|
|
|
Tranche
|
|
|
Tranche
|
|
|
Tranche
|
|
|
Tranche
|
|
|
Tranche
|
|
|
Tranche
|
|
|
Tranche
|
|
|
|
|
2
|
|
|
3*
|
|
|
4
|
|
|
5
|
|
|
6
|
|
|
7
|
|
|
8
|
|
|
|
|
|
|
|
|
|
|
|
|
|
|
|
|
|
|
|
|
|
|
|
|
|
Exercise price (USD)
|
|
9.27
|
|
|
5.30
|
|
|
6.64
|
|
|
12.23
|
|
|
10.84
|
|
|
2.55
|
|
|
1.44
|
|
|
Average risk-free interest rate
|
|
4.08
|
%
|
|
2.51
|
%
|
|
3.73
|
%
|
|
1.66
|
%
|
|
1.03
|
%
|
|
0.40
|
%
|
|
0.37
|
%
|
|
Expected option life (year)
|
|
3.8
|
|
|
2.7
|
|
|
2.9
|
|
|
3
|
|
|
3
|
|
|
3
|
|
|
3
|
|
|
Volatility rate
|
|
60.86
|
%
|
|
78.17
|
%
|
|
77.27
|
%
|
|
92.81
|
%
|
|
88.03
|
%
|
|
90.30
|
%
|
|
81.98
|
%
|
|
Dividend yield
|
|
-
|
|
|
-
|
|
|
-
|
|
|
-
|
|
|
-
|
|
|
-
|
|
|
-
|
|
*
Tranche 3 consists of different vesting structures. The expected option life and fair value presented above are weighted average numbers.
The aggregate intrinsic value as of September 30, 2012 and 2013 is USD nil and USD nil respectively.
| F-30 | ||
|
|
ORIGIN AGRITECH LIMITED
NOTES TO CONSOLIDATED FINANCIAL STATEMENTS
FOR THE YEAR ENDED SEPTEMBER 30, 2011, 2012 AND 2013
(In thousands, except number of share, per share data and unless otherwise stated)
16. SHARE OPTION PLANS - Continued
The Company recorded share-based compensation expense of RMB
4,638
, RMB
3,327
and RMB
1,893
for the years ended September 30, 2011, 2012 and 2013 respectively. As of September 30, 2012 and 2013, there were RMB
769
and RMB
385
of total unrecognized compensation expense related to non-vested share-based compensation arrangement under the Plan. The unrecognized compensation expense is expected to be recognized over a weighted-average period of
0.26
year.
|
|
17.
|
TREASURY STOCK
|
During the year ended September 30, 2007, the Company repurchased
498,851
common stock of the Company with a total cost of RMB
29,377
under the approval of the Board of Directors. In February 2013, the board of directors approved a share repurchase program for open market and negotiated transactions for a 12 month period in the amount of $
5
million, under which
611,386
shares with a total cost of RMB
6,282
were bought in the NASDAQ market during the year ended September 30, 2013, in compliance with US securities laws. The Company recorded the entire purchase price of the treasury stock as a reduction of equity.
|
|
18.
|
INCOME TAXES
|
Agritech and its subsidiary, State Harvest are incorporated in the British Virgin Islands and are subject to taxation under the laws of the British Virgin Islands. State Harvest’s subsidiary and State Harvest’s variable interest entity, Beijing Origin and its majority owned subsidiaries (together, the “PRC entities”) were incorporated in the PRC and governed by the PRC laws.
The applicable tax rate of the PRC Enterprise Income Tax (“EIT”) was changed from
33
% to
25
% on January 1, 2008, according to the Corporate Income Tax Law. The preferential tax rate previously enjoyed by the PRC entities is gradually transitioned to the new standard rate of
25
% over a five-year transitional period. In addition, article 28 of the new tax law stated that the income tax rate of a “high technology” company (high-tech status) is to remain at
15
%.
Preferential tax treatment of Beijing Origin as “high technology” company (High-tech Status)
from October 28, 2011 to October 27, 2014
has been agreed with the relevant tax authorities. Beijing Origin is entitled to a preferential tax rate of
15
% which is subject to annual review. As a result of these preferential tax treatments, the reduced tax rates applicable to Beijing Origin Seed Limited for 2011, 2012 and 2013 are
15
%.
Xinjiang Origin is entitled to a preferential tax of 2 years exemption and 3 years of half EIT.
Had all the above tax holidays and concessions not been available, the tax charges would have been higher by RMB
5,226
, RMB
2,012
and RMB4,055, and the basic net income (loss) per share would have been lower (higher) by RMB(0.23), RMB(0.16) and RMB0.17 for the years ended September 30, 2011, 2012 and 2013, respectively. The diluted net income (loss) per share for the years ended September 30, 2011, 2012 and 2013 would have been lower (higher) by RMB (0.23), RMB (0.16) and RMB0.17, respectively.
| F-31 | ||
|
|
ORIGIN AGRITECH LIMITED
NOTES TO CONSOLIDATED FINANCIAL STATEMENTS
FOR THE YEAR ENDED SEPTEMBER 30, 2011, 2012 AND 2013
(In thousands, except number of share, per share data and unless otherwise stated)
NOTES TO CONSOLIDATED FINANCIAL STATEMENTS
FOR THE YEAR ENDED SEPTEMBER 30, 2011, 2012 AND 2013
(In thousands, except number of share, per share data and unless otherwise stated)
|
|
18.
|
INCOME TAXES - Continued
|
The Company’s liability for income taxes includes the liability for unrecognized tax benefits, interest and penalties which relate to tax years still subject to review by taxing authorities. Audit periods remain open for review until the statute of limitations has passed. The completion of review or the expiration of the statute of limitations for a given audit period could result in an adjustment to the Company’s liability for income taxes. Any such adjustment could be material to the Company’s results of operations for any given quarterly or annual period based, in part, upon the results of operations for the given period. Until September 30, 2013, the management considered that the Company had no uncertain tax positions affected its consolidated financial position and results of operations or cash flow other than for the contingent US tax liabilities mentioned under note 21. The Company will continue to evaluate for the uncertain position in future. The estimated interest costs have been provided in the Company’s financial statements up to the year ended September 30, 2013. The Company’s uncertain tax positions are related to tax years that remain subject to examination by the relevant tax authorities and the major one is the China tax authority.
The open tax years for examinations in China are 5 years.
The provision for income taxes expenses consists of the following:
|
|
|
Year ended
|
|
||||
|
|
|
September 30,
|
|
||||
|
|
|
2011
|
|
2012
|
|
2013
|
|
|
|
|
RMB
|
|
RMB
|
|
RMB
|
|
|
|
|
|
|
|
|
|
|
|
Current
|
|
6,991
|
|
589
|
|
2,707
|
|
|
Deferred
|
|
6,739
|
|
1,273
|
|
1,755
|
|
|
|
|
|
|
|
|
|
|
|
|
|
13,730
|
|
1,862
|
|
4,462
|
|
The principal components of the deferred income tax assets are as follows:
|
|
|
September 30,
|
|
||
|
|
|
2012
|
|
2013
|
|
|
|
|
RMB
|
|
RMB
|
|
|
|
|
|
|
|
|
|
Non-current deferred tax assets:
|
|
|
|
|
|
|
Net operating loss carry forward
|
|
33,265
|
|
19,117
|
|
|
Impairment on inventory
|
|
5,772
|
|
10,946
|
|
|
Others
|
|
6,929
|
|
8,755
|
|
|
|
|
|
|
|
|
|
Non-current deferred income tax assets
|
|
45,966
|
|
38,818
|
|
|
Valuation allowances
|
|
(44,211)
|
|
(38,818)
|
|
|
|
|
|
|
|
|
|
Net non-current deferred income tax assets
|
|
1,755
|
|
-
|
|
The Company did not have any significant temporary differences relating to deferred tax liabilities as of September 30, 2012 and 2013.
A significant portion of the deferred tax assets recognized relates to net operating loss and credit carry forwards. The Company operates through the PRC entities and the valuation allowance is considered on each individual basis.
| F-32 | ||
|
|
ORIGIN AGRITECH LIMITED
NOTES TO CONSOLIDATED FINANCIAL STATEMENTS
FOR THE YEAR ENDED SEPTEMBER 30, 2011, 2012 AND 2013
(In thousands, except number of share, per share data and unless otherwise stated)
NOTES TO CONSOLIDATED FINANCIAL STATEMENTS
FOR THE YEAR ENDED SEPTEMBER 30, 2011, 2012 AND 2013
(In thousands, except number of share, per share data and unless otherwise stated)
|
|
18.
|
INCOME TAXES - Continued
|
The net operating loss attributable to those PRC entities can only be carried forward for a maximum period of five years. Tax losses of non-PRC entities can be carried forward indefinitely.
The expiration period of unused tax losses is as follows:
|
|
|
Year ended
|
|
||
|
|
|
September 30,
|
|
||
|
|
|
2012
|
|
2013
|
|
|
|
|
RMB
|
|
RMB
|
|
|
|
|
|
|
|
|
|
Calendar year ending,
|
|
|
|
|
|
|
2013
|
|
15,747
|
|
12,836
|
|
|
2014
|
|
-
|
|
-
|
|
|
2015
|
|
10,997
|
|
10,997
|
|
|
2016
|
|
54,491
|
|
15,141
|
|
|
2017
|
|
77,399
|
|
24,807
|
|
|
2018
|
|
-
|
|
14,067
|
|
|
|
|
|
|
|
|
|
|
|
158,634
|
|
77,848
|
|
Reconciliation between total income tax expenses and the amount computed by applying the statutory income tax rate to income before taxes is as follows:
|
|
|
Year ended
September 30, |
|
||||
|
|
|
2011
|
|
2012
|
|
2013
|
|
|
|
|
%
|
|
%
|
|
%
|
|
|
|
|
|
|
|
|
|
|
|
Statutory rate
|
|
25
|
|
25
|
|
25
|
|
|
Effect of preferential tax treatment
|
|
(550)
|
|
218
|
|
(30)
|
|
|
Effect of different tax jurisdiction
|
|
307
|
|
(156)
|
|
10
|
|
|
Permanent book-tax difference
|
|
403
|
|
1,757
|
|
(4)
|
|
|
Change in valuation allowance
|
|
998
|
|
(2,078)
|
|
76
|
|
|
Utilization of tax loss previously not recognized
|
|
-
|
|
-
|
|
(43)
|
|
|
Under/(Over) provision in prior year
|
|
256
|
|
32
|
|
(2)
|
|
|
|
|
|
|
|
|
|
|
|
Effective income tax rate
|
|
1,439
|
|
(202)
|
|
32
|
|
| F-33 | ||
|
|
ORIGIN AGRITECH LIMITED
NOTES TO CONSOLIDATED FINANCIAL STATEMENTS
FOR THE YEAR ENDED SEPTEMBER 30, 2011, 2012 AND 2013
(In thousands, except number of share, per share data and unless otherwise stated)
19.
INCOME (LOSS) PER SHARE
The following table sets forth the computation of basic and diluted income (loss) per share for the
years indicated:
|
|
|
Year ended
September 30, |
|
||||
|
|
|
2011
|
|
2012
|
|
2013
|
|
|
|
|
RMB
|
|
RMB
|
|
RMB
|
|
|
|
|
|
|
|
|
|
|
|
Net income (loss) (numerator),
basic and diluted |
|
(23,079)
|
|
(1,434)
|
|
7,494
|
|
|
|
|
|
|
|
|
|
|
|
Shares (denominator):
|
|
|
|
|
|
|
|
|
Common stock outstanding
|
|
23,382,812
|
|
23,382,812
|
|
22,905,926
|
|
|
Weighted average common stock outstanding
used in computing basic income per share |
|
23,351,615
|
|
23,382,812
|
|
23,259,127
|
|
|
|
|
|
|
|
|
|
|
|
Add: Share options
|
|
-
|
|
-
|
|
19,316
|
|
|
Weighted average common stock outstanding
used in computing diluted income per share |
|
23,351,615
|
|
23,382,812
|
|
23,278,443
|
|
|
|
|
|
|
|
|
|
|
|
Net income (loss) per share-basic
|
|
(1.00)
|
|
(0.06)
|
|
0.32
|
|
|
|
|
|
|
|
|
|
|
|
Net income (loss) per share-diluted
|
|
(1.00)
|
|
(0.06)
|
|
0.32
|
|
As of September 30, 2013, the effect of conversion and exercise of the Company’s outstanding options are included as their effect is dilutive. As of September 30, 2011 and 2012, the effect of the outstanding options was anti-dilutive.
20.
EMPLOYEE BENEFIT PLAN AND PROFIT APPROPRIATION
Full time employees of the PRC entities participate in a government mandated multi-employer defined contribution plan pursuant to which certain pension benefits, medical care, unemployment insurance, employee housing fund and other welfare benefits are provided to employees. Chinese labor regulations require the Company to accrue for these benefits based on certain percentages of the employees’ salaries. The total provisions for such employee benefits were RMB
12,752
, RMB
13,476
, and RMB
15,184
for the years ended September 30, 2011, 2012 and 2013, respectively.
Pursuant to the laws applicable to the PRC, domestic PRC entities must make appropriations from after-tax profit to non-distributable reserves funds including: (i) the statutory surplus reserve and; (ii) the statutory public welfare fund. Subject to the limits of
50
% of the entity’s registered capital, the statutory surplus reserve fund requires annual appropriations of
10
% of after-tax profit (as determined under accounting principles generally accepted in the PRC (“PRC GAAP”) at each year-end). The Company’s wholly foreign owned subsidiary, BioTech, however subject to the law applicable to foreign invested enterprises in the PRC, was required annual appropriation of the general reserve fund, no less than
10
% of after-tax profit (as determined under PRC GAAP at each year-end). These reserve funds can only be used for specific purposes of enterprise expansion and staff welfare and are not distributable as cash dividends.
No appropriation has been made for the years ended September 30, 2011, 2012 and 2013.
There was no after-tax profit recorded in the PRC statutory accounts for 2013 and 2012. On the other hand, the amount set aside as of September 30, 2012 and 2013 were RMB
24,789
and RMB
24,789
.
| F-34 | ||
|
|
ORIGIN AGRITECH LIMITED
NOTES TO CONSOLIDATED FINANCIAL STATEMENTS
FOR THE YEAR ENDED SEPTEMBER 30, 2011, 2012 AND 2013
(In thousands, except number of share, per share data and unless otherwise stated)
21.
COMMITMENTS AND CONTINGENCIES
(a)
Capital commitments
As of September 30, 2012 and 2013, capital commitments for the purchase of long-term assets are as follows:
|
|
|
September 30,
|
|
||
|
|
|
2012
|
|
2013
|
|
|
|
|
RMB
|
|
RMB
|
|
|
|
|
|
|
|
|
|
Equipment
|
|
25,615
|
|
17,417
|
|
|
Plant and building construction
|
|
8,773
|
|
156
|
|
|
Technology usage right
|
|
-
|
|
12,000
|
|
|
Project of gene modification
|
|
2,000
|
|
-
|
|
|
|
|
|
|
|
|
|
|
|
36,388
|
|
29,573
|
|
(b)
Operating lease
The Company leased certain land use rights for seed development and office premises under non-cancellable leases. Rental expenses under operating leases for the years ended September 30, 2011, 2012 and 2013 were RMB
5,310
, RMB
3,773
and RMB
4,568
respectively.
As of September 30, 2013, the Company was obligated under operating leases requiring minimum rental as follows:
|
|
|
RMB
|
|
|
Year ending September 30,
|
|
|
|
|
|
|
|
|
|
2014
|
|
2,533
|
|
|
2015
|
|
1,784
|
|
|
2016
|
|
1,371
|
|
|
2017
|
|
1,065
|
|
|
2018
|
|
1,061
|
|
|
Thereafter
|
|
7,076
|
|
|
|
|
|
|
|
|
|
14,890
|
|
The Company assesses the contingent tax liabilities that may arise from the Share Exchange Transaction (note 1) and considers such contingent tax liabilities are more-likely-than-not. As of September 30, 2012 and 2013, contingent tax liabilities of RMB
39,059
including late payment penalty and interest was included in the income tax payable in the accompanying consolidated balance sheet. The contingent tax was charged to the equity because the assumption of such liabilities by the Company was part of the recapitalization in connection with the Share Exchange Transaction. The Company does not expect to incur tax liabilities at the higher end of the range which were estimated to be in the range RMB
39,059
to RMB
64,218
, based on the information currently available.
| F-35 | ||
|
|
ORIGIN AGRITECH LIMITED
NOTES TO CONSOLIDATED FINANCIAL STATEMENTS
FOR THE YEAR ENDED SEPTEMBER 30, 2011, 2012 AND 2013
(In thousands, except number of share, per share data and unless otherwise stated)
21.
COMMITMENTS AND CONTINGENCIES - Continued
(c)
Contingent tax liabilities - Continued
In 2009, we reviewed the contingent tax position. On September 23, 2010, the Company filed a revised 2005 tax return to the United States Internal Revenue Service, or IRS, to modify and supplement the previously filed tax return regarding this tax liability. The IRS has not responded to the tax filing as of the date of the filing of this report. While the timeline for the IRS to question on the tax return is generally three years, this matter may take a prolonged period of time to resolve depending on the return time for IRS and the necessity, if any, of future appeals or re-evaluation.
No material changes have occurred as of September 30, 2013.
22.
FAIR VALUE OF FINANCIAL INSTRUMENTS
The carrying amounts of cash and cash equivalents, accounts receivable, accounts payable and borrowings are reasonable estimates of their fair value. All the financial instruments are for trade purposes. No level 2 or 3 fair value assessment has been made.
23.
SEGMENT AND GEOGRAPHIC INFORMATION
The Company’s main products include hybrid corn and rice seeds, which have been organized as one reporting segment since they have similar nature and production procedures, with similar economic characteristics. The Company’s chief operating decision maker, the Chief Executive Officer, receives and reviews the result of the operation for all products as a whole when making decisions about allocating resources and assessing performance of the Company. In accordance with FASB ASC 280-10, the Company is not required to report the segment information for the products.
Substantially
all of the Company’s sales and all of the Company’s long-lived assets are located in the PRC.
The Company had no customers which accounted for
10
% or more of the Company’s revenues for any of the years presented in the consolidated financial statements.
24.
OPERATING RISK
Concentrations of credit risk
Financial instruments that subject the Company to concentrations of credit risk consist primarily of cash and cash equivalents. The Company maintains its cash and cash equivalents with high-quality institutions. Generally these deposits may be redeemed upon demand and therefore bear minimal risk.
Interest risk
The interest rates and terms of repayment of bank and other borrowings ranged from
2.57
% to
7.32
%, which are fixed at the inception of the borrowings. Other financial assets and liabilities do not have material interest rate risk.
Liquidity risk
We believe our working capital is sufficient to meet our present requirements. We may, however, require additional cash due to changing business conditions or other future developments, including any investments or acquisitions we may decide to pursue. In the long-term, we intend to rely primarily on cash flow from operations and additional borrowings from banks to meet our anticipated cash needs. If our anticipated cash flow is insufficient to meet our requirements, we may also seek to sell additional equity, debt or equity-linked securities.
| F-36 | ||
|
|
ORIGIN AGRITECH LIMITED
NOTES TO CONSOLIDATED FINANCIAL STATEMENTS
FOR THE YEAR ENDED SEPTEMBER 30, 20
11
, 201
2
AND 201
3
(In thousands, except number of share, per share data and unless otherwise stated)
24. OPERATING RISK - Continued
Country risk
The Company has significant investments in the PRC. The operating results of the Company may be adversely affected by changes in the political and social conditions in the PRC and by changes in Chinese government policies with respect to laws and regulations, anti-inflationary measures, currency conversion and remittance abroad, and rates and methods taxation, among other things. There can be no assurance; however, those changes in political and other conditions will not result in any adverse impact.
|
|
25.
|
CONDENSED FINANCIAL INFORMATION OF THE PARENT COMPANY
|
The condensed financial statements of Origin Agritech Limited (the “parent company”) have been prepared in accordance with accounting principles generally accepted in the United States of America. Under the PRC laws and regulations, the Company’s PRC subsidiaries are restricted in their ability to transfer certain of their net assets to the parent company in the form of dividend payments, loans or advances. The amounts restricted include paid-in capital, capital surplus and statutory reserves, as determined pursuant to PRC generally accepted accounting principles, totaling RMB
109,651
and RMB
109,651
as of September 30, 2012 and 2013, respectively.
The following represents condensed unconsolidated financial information of the parent company only:
CONDENSED BALANCE SHEET
|
|
|
September 30
|
|
||
|
|
|
2012
|
|
2013
|
|
|
|
|
RMB
|
|
RMB
|
|
|
|
|
|
|
|
|
|
ASSETS
|
|
|
|
|
|
|
Current assets
|
|
|
|
|
|
|
Cash and cash equivalents
|
|
1,991
|
|
4,332
|
|
|
Other receivables
|
|
3
|
|
3
|
|
|
Acquired intangible assets, net
|
|
-
|
|
-
|
|
|
Due from inter-companies
|
|
129,807
|
|
125,319
|
|
|
Total current assets
|
|
131,801
|
|
129,654
|
|
|
Investment in unconsolidated subsidiaries
|
|
170,383
|
|
189,216
|
|
|
Total assets
|
|
302,184
|
|
318,870
|
|
|
|
|
|
|
|
|
|
LIABILITIES AND EQUITY
|
|
|
|
|
|
|
Current liabilities
|
|
|
|
|
|
|
Due to related parties
|
|
1,506
|
|
1,460
|
|
|
Other payables and accrued expenses
|
|
572
|
|
13
|
|
|
Income tax payable
|
|
39,059
|
|
39,059
|
|
|
Total current liabilities
|
|
41,137
|
|
40,532
|
|
|
Long-term loan
|
|
-
|
|
12,296
|
|
|
Total liabilities
|
|
41,137
|
|
52,828
|
|
|
Total stockholders’ equity
|
|
261,047
|
|
266,042
|
|
|
Total liabilities and stockholders’ equity
|
|
302,184
|
|
318,870
|
|
| F-37 | ||
|
|
ORIGIN AGRITECH LIMITED
NOTES TO CONSOLIDATED FINANCIAL STATEMENTS
FOR THE YEAR ENDED SEPTEMBER 30, 2011, 2012 AND 2013
(In thousands, except number of share, per share data and unless otherwise stated)
|
|
25.
|
CONDENSED FINANCIAL INFORMATION OF THE PARENT COMPANY - Continued
|
CONDENSED STATEMENT OF INCOME AND COMPREHENSIVE INCOME
|
|
|
Year ended September 30,
|
|
||||
|
|
|
2011
|
|
2012
|
|
2013
|
|
|
|
|
RMB
|
|
RMB
|
|
RMB
|
|
|
|
|
|
|
|
|
|
|
|
Cost of revenues
|
|
(21)
|
|
-
|
|
-
|
|
|
Operating expenses
|
|
|
|
|
|
|
|
|
Selling and marketing
|
|
(29)
|
|
-
|
|
-
|
|
|
General and administrative
|
|
(11,596)
|
|
(7,475)
|
|
(5,694)
|
|
|
Research and development
|
|
(32)
|
|
-
|
|
-
|
|
|
Other income, net
|
|
-
|
|
1,595
|
|
296
|
|
|
Loss from operations
|
|
(11,678)
|
|
(5,880)
|
|
(5,398)
|
|
|
Equity in earnings of unconsolidated subsidiaries
|
|
(11,402)
|
|
4,446
|
|
13,044
|
|
|
Interest income
|
|
1
|
|
-
|
|
-
|
|
|
Interest expense
|
|
-
|
|
-
|
|
(152)
|
|
|
Profit (loss) before income taxes
|
|
(23,079)
|
|
(1,434)
|
|
7,494
|
|
|
Income tax expense
|
|
-
|
|
-
|
|
-
|
|
|
Net profit (loss)
|
|
(23,079)
|
|
(1,434)
|
|
7,494
|
|
CONDENSED STATEMENT OF CASH FLOWS
|
|
Year ended September 30,
|
|
||||
|
|
2011
|
|
2012
|
|
2013
|
|
|
|
RMB
|
|
RMB
|
|
RMB
|
|
|
|
|
|
|
|
|
|
|
Net cash used in operating activities
|
(3,745)
|
|
(2,137)
|
|
(1,666)
|
|
|
Net cash provided by financing activities
|
7,292
|
|
3,327
|
|
7,907
|
|
|
Net increase in cash and cash equivalents
|
3,547
|
|
1,190
|
|
6,241
|
|
|
Cash and cash equivalents, beginning of year
|
4,995
|
|
1,099
|
|
1,991
|
|
|
Effect of exchange rate changes on cash and cash equivalents
|
(7,443)
|
|
(298)
|
|
(3,900)
|
|
|
Cash and cash equivalents, end of year
|
1,099
|
|
1,991
|
|
4,332
|
|
BASIS OF PRESENTATION
The condensed financial information has been prepared using the same accounting policies as set out in the Company’s consolidated financial statements except that the parent company has used equity method to account for its investments in subsidiaries.
| F-38 | ||
|
|
SHIJIAZHUANG LIYU TECHNOLOGY DEVELOPMENT CO., LTD.
INDEX TO FINANCIAL STATEMENTS
|
CONTENTS
|
|
PAGE
|
|
|
|
|
|
REPORT OF INDEPENDENT REGISTERED PUBLIC ACCOUNTING FIRM
|
|
F
-
40
|
|
|
|
|
|
BALANCE SHEETS AS OF SEPTEMBER 30, 2012 AND 2013
|
|
F
-
41
|
|
|
|
|
|
STATEMENTS OF INCOME AND COMPREHENSIVE INCOME FOR THE YEARS ENDED SEPTEMBER 30, 2011, 2012 AND 2013
|
|
F
-
42
|
|
|
|
|
|
STATEMENTS OF EQUITY FOR THE YEARS ENDED SEPTEMBER 30, 2011, 2012 AND 2013
|
|
F - 43
|
|
|
|
|
|
STATEMENTS OF CASH FLOWS FOR THE YEARS ENDED SEPTEMBER 30, 2011, 2012 AND 2013
|
|
F
-
44
|
|
|
|
|
|
NOTES TO FINANCIAL STATEMENTS
|
|
F
-
45
|
| F-39 | ||
|
|
REPORT OF INDEPENDENT REGISTERED PUBLIC ACCOUNTING FIRM
To the Board of Directors and Shareholders of
Shijiazhuang Liyu Technology Development Co., Ltd.
We have audited the accompanying balance sheets of Shijiazhuang Liyu Technology Development Co., Ltd. (the “Company”) as of September 30, 2012 and 2013 and the related statements of income and comprehensive income, equity and cash flows for the years ended September 30, 2011, 2012 and 2013.
These financial statements are the responsibility of the Company’s management.
Our responsibility is to express an opinion on these financial statements based on our audits.
We conducted our audits in accordance with the standards of the Public Company Accounting Oversight Board (United States).
Those standards require that we plan and perform the audit to obtain reasonable assurance about whether the financial statements are free of material misstatement.
An audit includes consideration of internal control over financial reporting as a basis for designing audit procedures that are appropriate in the circumstances, but not for the purpose of expressing an opinion on the effectiveness of the Company’s internal control over financial reporting.
Accordingly, we express no such opinion.
An audit also includes examining, on a test basis, evidence supporting the amounts and disclosures in the financial statements, assessing the accounting principles used and significant estimates made by management, as well as evaluating the overall financial statement presentation.
We believe that our audits provide a reasonable basis for our opinion.
In our opinion, the financial statements referred to above present fairly, in all material respects, the financial position of the Company as of September 30, 2012 and 2013, and the results of its operations and its cash flows for the years ended September 30, 2011, 2012 and 2013, in conformity with accounting principles generally accepted in the United States of America.
/s/ BDO China Shu Lun Pan Certified Public Accountants LLP
BDO China Shu Lun Pan Certified Public Accountants LLP
Shenzhen, The People’s Republic of China
January
22
, 2014
| F-40 | ||
|
|
SHIJIAZHUANG LIYU TECHNOLOGY DEVELOPMENT CO., LTD.
BALANCE SHEETS
(In thousands, except number of share and per share data)
|
|
|
September 30,
|
|
|||||||
|
|
|
2012
|
|
2013
|
|
2013
|
|
|||
|
|
|
RMB
|
|
RMB
|
|
US$
|
|
|||
|
ASSETS
|
|
|
|
|
|
|
|
|
|
|
|
Current Assets
|
|
|
|
|
|
|
|
|
|
|
|
Cash and cash equivalents
|
|
|
13,701
|
|
|
12,294
|
|
|
2,000
|
|
|
Accounts receivable, less allowance for doubtful amounts of RMB520 and RMB520 as of September 30, 2012 and 2013, respectively (note 4)
|
|
|
7
|
|
|
1,321
|
|
|
215
|
|
|
Amount due from related party (note 3)
|
|
|
297
|
|
|
-
|
|
|
-
|
|
|
Advances to suppliers (note 5)
|
|
|
84
|
|
|
1,572
|
|
|
255
|
|
|
Other receivable
|
|
|
2
|
|
|
-
|
|
|
-
|
|
|
Total current assets
|
|
|
14,091
|
|
|
15,187
|
|
|
2,470
|
|
|
Plant and equipment, net (note 6)
|
|
|
2,550
|
|
|
6,737
|
|
|
1,096
|
|
|
Equity investments (note 7)
|
|
|
433
|
|
|
958
|
|
|
156
|
|
|
Intangible assets, net
|
|
|
1
|
|
|
1
|
|
|
-
|
|
|
Other assets (note 8)
|
|
|
2,799
|
|
|
600
|
|
|
97
|
|
|
Total assets
|
|
|
19,874
|
|
|
23,483
|
|
|
3,819
|
|
|
|
|
|
|
|
|
|
|
|
|
|
|
LIABILITIES AND EQUITY
|
|
|
|
|
|
|
|
|
|
|
|
Current liabilities
|
|
|
|
|
|
|
|
|
|
|
|
Deferred revenue
|
|
|
4,814
|
|
|
2,673
|
|
|
435
|
|
|
Amount due to related party (note 3)
|
|
|
1,460
|
|
|
-
|
|
|
-
|
|
|
Other payables and accrued expenses (note 9)
|
|
|
1,001
|
|
|
5
|
|
|
1
|
|
|
Total current liabilities
|
|
|
7,275
|
|
|
2,678
|
|
|
436
|
|
|
|
|
|
|
|
|
|
|
|
|
|
|
Commitments and contingencies (note 12)
|
|
|
|
|
|
|
|
|
|
|
|
|
|
|
|
|
|
|
|
|
|
|
|
Shareholders’ equity:
|
|
|
|
|
|
|
|
|
|
|
|
Paid-in capital
|
|
|
3,000
|
|
|
3,000
|
|
|
488
|
|
|
Retained earnings
|
|
|
9,599
|
|
|
17,805
|
|
|
2,895
|
|
|
Total shareholders’ equity
|
|
|
12,599
|
|
|
20,805
|
|
|
3,383
|
|
|
|
|
|
|
|
|
|
|
|
|
|
|
Total liabilities and equity
|
|
|
19,874
|
|
|
23,483
|
|
|
3,819
|
|
The accompanying notes are an integral part of these financial statements.
| F-41 | ||
|
|
SHIJIAZHUANG LIYU TECHNOLOGY DEVELOPMENT CO., LTD.
STATEMENTS OF INCOME AND COMPREHENSIVE INCOME
(In thousands, except number of share and per share data)
|
|
|
Year ended September 30,
|
|
||||||||||
|
|
|
2011
|
|
2012
|
|
2013
|
|
2013
|
|
||||
|
|
|
RMB
|
|
RMB
|
|
RMB
|
|
US$
|
|
||||
|
Revenue
|
|
|
19,027
|
|
|
19,038
|
|
|
27,125
|
|
|
4,412
|
|
|
Cost of sales
|
|
|
(5,892)
|
|
|
(5,542)
|
|
|
(8,100)
|
|
|
(1,318)
|
|
|
Gross profit
|
|
|
13,135
|
|
|
13,496
|
|
|
19,025
|
|
|
3,094
|
|
|
|
|
|
|
|
|
|
|
|
|
|
|
|
|
|
Operating expenses
|
|
|
|
|
|
|
|
|
|
|
|
|
|
|
Selling expense
|
|
|
(298)
|
|
|
(339)
|
|
|
(472)
|
|
|
(77)
|
|
|
General and administrative expense
|
|
|
(1,625)
|
|
|
(1,380)
|
|
|
(1,936)
|
|
|
(315)
|
|
|
Other income, net
|
|
|
92
|
|
|
41
|
|
|
36
|
|
|
6
|
|
|
|
|
|
|
|
|
|
|
|
|
|
|
|
|
|
Total operating expenses, net
|
|
|
(1,831)
|
|
|
(1,678)
|
|
|
(2,372)
|
|
|
(386)
|
|
|
|
|
|
|
|
|
|
|
|
|
|
|
|
|
|
Income from operations
|
|
|
11,304
|
|
|
11,818
|
|
|
16,653
|
|
|
2,708
|
|
|
Share of net income (loss) of equity investments
|
|
|
(13)
|
|
|
132
|
|
|
525
|
|
|
85
|
|
|
Interest income
|
|
|
19
|
|
|
32
|
|
|
28
|
|
|
5
|
|
|
|
|
|
|
|
|
|
|
|
|
|
|
|
|
|
Income before income taxes
|
|
|
11,310
|
|
|
11,982
|
|
|
17,206
|
|
|
2,798
|
|
|
|
|
|
|
|
|
|
|
|
|
|
|
|
|
|
Income tax benefit (expense) (note 10)
|
|
|
(1,465)
|
|
|
1,452
|
|
|
-
|
|
|
-
|
|
|
|
|
|
|
|
|
|
|
|
|
|
|
|
|
|
Net income and comprehensive income
|
|
|
9,845
|
|
|
13,434
|
|
|
17,206
|
|
|
2,798
|
|
The accompanying notes are an integral part of these financial statements.
| F-42 | ||
|
|
SHIJIAZHUANG LIYU TECHNOLOGY DEVELOPMENT CO., LTD.
STATEMENTS OF EQUITY
(In thousands, except number of share and per share data)
|
|
|
Paid-in
|
|
Retained
|
|
Total
|
|
|||
|
|
|
Capital
|
|
Earnings
|
|
Equity
|
|
|||
|
|
|
RMB
|
|
RMB
|
|
RMB
|
|
|||
|
|
|
|
|
|
|
|
|
|
|
|
|
Balance as of September 30, 2010
|
|
|
1,000
|
|
|
1,320
|
|
|
2,320
|
|
|
Net income for the year
|
|
|
-
|
|
|
9,845
|
|
|
9,845
|
|
|
Capital injection
|
|
|
2,000
|
|
|
-
|
|
|
2,000
|
|
|
Dividend paid
|
|
|
-
|
|
|
(8,000)
|
|
|
(8,000)
|
|
|
Balance as of September 30, 2011
|
|
|
3,000
|
|
|
3,165
|
|
|
6,165
|
|
|
Net income for the year
|
|
|
-
|
|
|
13,434
|
|
|
13,434
|
|
|
Dividend paid
|
|
|
-
|
|
|
(7,000)
|
|
|
(7,000)
|
|
|
Balance as of September 30, 2012
|
|
|
3,000
|
|
|
9,599
|
|
|
12,599
|
|
|
Net income for the year
|
|
|
-
|
|
|
17,206
|
|
|
17,206
|
|
|
Dividend paid
|
|
|
-
|
|
|
(9,000)
|
|
|
(9,000)
|
|
|
Balance as of September 30, 2013
|
|
|
3,000
|
|
|
17,805
|
|
|
20,805
|
|
|
|
|
|
|
|
|
|
|
|
|
|
|
In US$ @ 6.1480
|
|
|
488
|
|
|
2,895
|
|
|
3,383
|
|
The accompanying notes are an integral part of these financial statements.
| F-43 | ||
|
|
SHIJIAZHUANG LIYU TECHNOLOGY DEVELOPMENT CO., LTD.
STATEMENTS OF CASH FLOWS
(In thousands)
|
|
|
Year ended September 30,
|
|
||||||||||
|
|
|
2011
|
|
2012
|
|
2013
|
|
2013
|
|
||||
|
|
|
RMB
|
|
RMB
|
|
RMB
|
|
US$
|
|
||||
|
|
|
|
|
|
|
|
|
|
|
|
|
|
|
|
Operating activities:
|
|
|
|
|
|
|
|
|
|
|
|
|
|
|
Net income
|
|
|
9,845
|
|
|
13,434
|
|
|
17,206
|
|
|
2,798
|
|
|
Adjustments to reconcile net income to net cash
provided by operating activities: |
|
|
|
|
|
|
|
|
|
|
|
|
|
|
Depreciation and amortization
|
|
|
282
|
|
|
291
|
|
|
433
|
|
|
70
|
|
|
Loss on disposal of plant and equipment
|
|
|
11
|
|
|
10
|
|
|
1
|
|
|
-
|
|
|
Share of net loss (income) of equity investments
|
|
|
13
|
|
|
(132)
|
|
|
(525)
|
|
|
(85)
|
|
|
Changes in operating assets and liabilities:
|
|
|
|
|
|
|
|
|
|
|
|
|
|
|
Accounts receivable, net
|
|
|
515
|
|
|
(7)
|
|
|
(1,314)
|
|
|
(214)
|
|
|
Amount due from related party
|
|
|
(90)
|
|
|
(207)
|
|
|
297
|
|
|
48
|
|
|
Advances to suppliers
|
|
|
363
|
|
|
1,032
|
|
|
(1,488)
|
|
|
(242)
|
|
|
Other receivable
|
|
|
(73)
|
|
|
71
|
|
|
2
|
|
|
-
|
|
|
Other assets
|
|
|
(1,677)
|
|
|
(1,122)
|
|
|
2,199
|
|
|
358
|
|
|
Deferred revenues
|
|
|
(11,444)
|
|
|
(1,037)
|
|
|
(2,141)
|
|
|
(348)
|
|
|
Amount due to related party
|
|
|
560
|
|
|
900
|
|
|
(1,460)
|
|
|
(237)
|
|
|
Other payables and accrued expenses
|
|
|
(193)
|
|
|
1,000
|
|
|
(996)
|
|
|
(162)
|
|
|
|
|
|
|
|
|
|
|
|
|
|
|
|
|
|
Net cash provided by (used in) operating activities
|
|
|
(1,888)
|
|
|
14,233
|
|
|
12,214
|
|
|
1,986
|
|
|
|
|
|
|
|
|
|
|
|
|
|
|
|
|
|
Investing activities:
|
|
|
|
|
|
|
|
|
|
|
|
|
|
|
Purchase of plant and equipment
|
|
|
(88)
|
|
|
(620)
|
|
|
(4,621)
|
|
|
(751)
|
|
|
Proceeds from disposal of plant and equipment
|
|
|
-
|
|
|
80
|
|
|
-
|
|
|
-
|
|
|
Net cash used in investing activities
|
|
|
(88)
|
|
|
(540)
|
|
|
(4,621)
|
|
|
(751)
|
|
|
|
|
|
|
|
|
|
|
|
|
|
|
|
|
|
Financing activities:
|
|
|
|
|
|
|
|
|
|
|
|
|
|
|
Capital injection from shareholder
|
|
|
2,000
|
|
|
-
|
|
|
-
|
|
|
-
|
|
|
Dividends paid to shareholders
|
|
|
(8,000)
|
|
|
(7,000)
|
|
|
(9,000)
|
|
|
(1,464)
|
|
|
Net cash used in financing activities
|
|
|
(6,000)
|
|
|
(7,000)
|
|
|
(9,000)
|
|
|
(1,464)
|
|
|
|
|
|
|
|
|
|
|
|
|
|
|
|
|
|
Net increase (decrease) in cash and cash equivalents
|
|
|
(7,976)
|
|
|
6,693
|
|
|
(1,407)
|
|
|
(229)
|
|
|
Cash and cash equivalents, beginning of year
|
|
|
14,984
|
|
|
7,008
|
|
|
13,701
|
|
|
2,229
|
|
|
Cash and cash equivalents, end of year
|
|
|
7,008
|
|
|
13,701
|
|
|
12,294
|
|
|
2,000
|
|
|
|
|
|
|
|
|
|
|
|
|
|
|
|
|
|
Supplemental disclosures of cash flow information:
|
|
|
|
|
|
|
|
|
|
|
|
|
|
|
Income taxes paid
|
|
|
1,465
|
|
|
-
|
|
|
-
|
|
|
-
|
|
|
|
|
|
|
|
|
|
|
|
|
|
|
|
|
|
Interest paid
|
|
|
-
|
|
|
-
|
|
|
-
|
|
|
-
|
|
The accompanying notes are an integral part of these financial statements.
| F-44 | ||
|
|
SHIJIAZHUANG LIYU TECHNOLOGY DEVELOPMENT CO., LTD.
NOTES TO FINANCIAL STATEMENTS
FOR THE YEAR ENDED SEPTEMBER 30, 2011, 2012 AND 2013
(In thousands, except number of share, per share data and unless otherwise stated)
|
|
1.
|
ORGANIZATION AND PRINCIPAL ACTIVITIES
|
Shijiazhuang Liyu Technology Development Co., Ltd. (the “Company”), located in the Development District of Shijiazhuang city, Hebei Province, was incorporated under the laws of the People’s Republic of China in 2003, which is principally engaged in crop seed research and development.
|
|
2.
|
SUMMARY OF SIGNIFICANT ACCOUNTING POLICIES
|
Basis of preparation
The financial statements of the Company are prepared in accordance with accounting principles generally accepted in the United States of America (“US GAAP”); include the assets, liabilities, revenues, expenses and cash flows of the Company.
Convenience translation into United States dollars
The financial statements are presented in Renminbi. The translation of Renminbi amounts into United States dollar amounts has been made for the convenience of the reader and has been made at the exchange rate quoted by the middle rate by the State Administration of Foreign Exchange in China on September 30, 2013 of RMB6.1480 to US$1.00. Such translation amounts should not be construed as representations that the Renminbi amounts could be readily converted into United States dollar amounts at that rate or any other rate.
Use of estimates
The preparation of the financial statements in conformity with US GAAP requires management to make estimates and assumptions that affect the reported amounts of assets and liabilities at the date of the financial statements and the reported amounts of revenues and expenses during the reporting period. Estimates are adjusted to reflect actual experience when necessary. Significant accounting estimates reflected in the Company’s financial statements include account receivable valuation, and useful lives of plant and equipment and acquired intangible assets. Actual results could differ from those estimates.
Cash and cash equivalents
Cash and cash equivalents consist of cash on hand, cash accounts and interest bearing savings accounts.
Plant and equipment, net
Plant and equipment are recorded at cost less accumulated depreciation and amortization. Maintenance and repairs are charged to expense as incurred. Depreciation is calculated on a straight-line basis over the following estimated useful lives:
|
|
Plant and building
|
23 years
|
|
|
Furniture and office equipment
|
5 years
|
|
|
Motor vehicles
|
8 years
|
| F-45 | ||
|
|
SHIJIAZHUANG LIYU TECHNOLOGY DEVELOPMENT CO., LTD.
NOTES TO FINANCIAL STATEMENTS
FOR THE YEAR ENDED SEPTEMBER 30, 2011, 2012 AND 2013
(In thousands, except number of share, per share data and unless otherwise stated)
2.
SUMMARY OF SIGNIFICANT ACCOUNTING POLICIES - Continued
Leases
Leases are classified at the inception date as either a capital lease or an operating lease. For the lessee, a lease is a capital lease if any of the following conditions exist: a) ownership is transferred to the lessee by the end of the lease term, b) there is a bargain purchase option, c) the lease term is at least 75% of the property’s estimated remaining economic life or d) the present value of the minimum lease payments at the beginning of the lease term is 90% or more of the fair value of the leased property to the lessor at the inception date. A capital lease is accounted for as if there was an acquisition of an asset and an incurrence of an obligation at the inception of the lease. All other leases are accounted for as operating leases. The Company has no capital leases for any of the periods presented.
Acquired Intangible assets, net
Acquired intangible assets primarily consist of purchased trademark and are stated at cost less accumulated amortization. Amortization is calculated on a straight-line basis over the estimated useful lives of these assets and recorded in operating expenses. Amortization is calculated on a straight-line basis over the following estimated useful lives for the main acquired intangible assets:
|
|
Trademark
|
5 years
|
Valuation of long-lived asset
The Company reviews the carrying value of long-lived assets to be held and used, including other intangible assets subject to amortization, when events and circumstances warrants such a review. The carrying value of a long-lived asset is considered impaired when the anticipated undiscounted cash flow from such asset is separately identifiable and is less than its carrying value. In that event, a loss is recognized based on the amount by which the carrying value exceeds the fair market value of the long-lived asset and intangible assets. Fair market value is determined primarily using the anticipated cash flows discounted at a rate commensurate with the risk involved. Losses on long-lived assets and intangible assets to be disposed are determined in a similar manner, except that fair market values are reduced for the cost to dispose.
Revenue recognition
Substantially all of the Company’s revenue are derived from the technology usage fee.
Revenue is recognized in the statement of income when earned.
The technology usage agreements contain the conditions to be fulfilled, the fee is considered earned when the conditions attached to the agreements are being fulfilled, otherwise, the amounts received in advance from the customers are deferred and recorded as “deferred revenue” under current liabilities in the balance sheet.
Cost of revenues
Cost of revenues consists of expenses directly related to sales, including rent, breeding auxiliary materials, supplies and salary and compensation, during the fiscal years ended September 30, 2011, 2012 and 2013.
Research and development costs
Research and development costs relating to the development or improvement of new products (variety of crop seeds) and processes, are expensed as incurred.
For the years ended September 30, 2011, 2012 and 2013, research and development costs were RMB5,892, RMB5,542 and RMB8,100, respectively.
| F-46 | ||
|
|
SHIJIAZHUANG LIYU TECHNOLOGY DEVELOPMENT CO., LTD.
NOTES TO FINANCIAL STATEMENTS
FOR THE YEAR ENDED SEPTEMBER 30, 2011, 2012 AND 2013
(In thousands, except number of share, per share data and unless otherwise stated)
2.
SUMMARY OF SIGNIFICANT ACCOUNTING POLICIES - Continued
Allowance for doubtful account
The Company regularly monitors and assesses the risk of not collecting amounts owed to the Company by customers. This evaluation is based upon a variety of factors including: an analysis of amounts current and past due along with relevant history and facts particular to the customer. Based upon the results of this analysis, the Company records allowance for uncollectible accounts for this risk.
Income taxes
Current tax is based on the profit or loss from ordinary activities adjusted for items that are non-assessable or disallowable for income tax purposes and is calculated using tax rates that have been enacted or substantively enacted at the end of reporting period.
Any tax paid by the Company during the year is recorded.
The Company follows FASB ASC 740,
Income Taxes
, which requires the recognition of deferred tax assets and liabilities for the expected future tax consequences of events that have been included in the financial statements or tax returns. Under this method, deferred income taxes are recognized for the tax consequences in future years of differences between the tax bases of assets and liabilities and their financial reporting amounts at each period end based on enacted tax laws and statutory tax rates, applicable to the periods in which the differences are expected to affect taxable income. Valuation allowances are established, when necessary, to reduce deferred tax assets to the amount expected to be realized.
The Company also adopts FASB ASC 740-10-25 to provide criteria for the recognition, measurement, presentation and disclosure of uncertain tax position. The Company must recognize the tax benefit from an uncertain tax position only if it is more likely than not that the tax position will be sustained on examination by the taxing authorities, based on the technical merits of the position. The tax benefits recognized in the financial statements from such a position are measured based on the largest benefit that has a greater than 50% likelihood of being realized upon ultimate resolution. The Company did not recognize any additional liability for uncertain tax positions as a result of the implementation of FASB ASC 740-10-25.
Recently issued accounting pronouncements
In December 2011, the FASB issued ASU 2011-11,
Balance Sheet (Topic 210): disclosures about Offsetting Assets and Liabilities
, which requires entities to disclose both gross and net information about both instruments and transactions eligible for offset in the statement of financial position and instruments and transactions subject to an agreement similar to a master netting agreement. The objective of the disclosure is to facilitate comparison between those entities that prepare their financial statements on the basis of U.S. GAAP and those entities that prepare their financial statements on the basis of International Financial Reporting Standards (“IFRS”). This ASU is effective for fiscal years, and interim periods within those years, beginning on or after January 1, 2013. Retrospective presentation for all comparative periods presented is required. The Company believes that its adoption of ASU 2011-11 will not have any material impact on its consolidated financial statements.
In October 2012, the FASB issued ASU 2012-04,
Technical Corrections and Improvements
, which makes certain technical corrections and “conforming fair value amendments” to the FASB Accounting Standards Codification. The amendments affect various codification topics and apply to all reporting entities within the scope of those topics. These provisions of the amendment are effective upon issuance, except for amendments that are subject to transition guidance, which will be effective for fiscal periods beginning after December 15, 2012. The Company believes that its adoption of ASU 2012-04 will not have any material impact on its consolidated financial statements.
| F-47 | ||
|
|
SHIJIAZHUANG LIYU TECHNOLOGY DEVELOPMENT CO., LTD.
NOTES TO FINANCIAL STATEMENTS
FOR THE YEAR ENDED SEPTEMBER 30, 2011, 2012 AND 2013
(In thousands, except number of share, per share data and unless otherwise stated)
|
|
2.
|
SUMMARY OF SIGNIFICANT ACCOUNTING POLICIES - Continued
|
In January 2013, the FASB issued ASU 2013-01,
Balance Sheet (Topic 220): Clarifying the Scope of Disclosures about Offsetting Assets and Liabilities
, which clarifies that ordinary trade receivables and receivables are not in the scope of ASU 2011-11. ASU 2011-11 applies only to derivatives, repurchase agreements and reverse purchase agreements, and securities borrowing and securities lending transactions that are either offset in accordance with
specific criteria contained in the Codification or subject to a master netting arrangement or similar agreement. The effective date is the same as the effective date of ASU 2011-11, i.e., effective for fiscal years, and interim periods within those years, beginning on or after January 1, 2013. The Company believes that its adoption of ASU 2013-01 will not have any material impact on its consolidated financial statements.
In February 2013, the FASB issued ASU 2013-02,
Comprehensive Income (Topic 220): Reporting of Amounts Reclassified Out of Accumulated Other Comprehensive Income
. This ASU requires an entity to provide information about the amounts reclassified out of accumulated other comprehensive income by component. In addition, an entity is required to present, either on the face of the statement where net income is presented or in the notes, significant amounts reclassified. The amendments do not change the current requirements for reporting net income or other comprehensive income in financial statements. However, the amendments require an entity to provide information about the amounts reclassified out of accumulated other comprehensive income by component. In addition, an entity is required to present, either on the face of the statement where net income is presented or in the notes, significant amounts reclassified. This ASU is effective prospectively for reporting periods beginning after December 15, 2012. The Company believes that its adoption of ASU 2013-02 will not have any material impact on its consolidated financial statements.
In July 2013, the FASB issued ASU 2013-11,
Income Tax (Topic 740): Presentation of an Unrecognized Tax Benefit When a Net Operating Loss Carry forward, a Similar Tax Loss, or a Tax Credit Carry forward Exists
. This ASU provides guidance on the financial statement presentation of an unrecognized tax benefit when a net operating loss carry forward, a similar tax loss, or a tax credit carry forward exists. An unrecognized tax benefit, or a portion of an unrecognized tax benefit, should be presented in the financial statements as a reduction to a deferred tax asset for a net operating loss carry forward, a similar tax loss, or a tax credit carry forward, except as follows. To the extent a net operating loss carry forward, a similar tax loss, or a tax credit carry forward is not available at the reporting date under the tax law of the applicable jurisdiction to settle any additional income taxes that would result from the disallowance of a tax position or the tax law of the applicable jurisdiction does not require the entity to use, and the entity does not intend to use, the deferred tax asset for such purpose, the unrecognized tax benefit should be presented in the financial statements as a liability and should not be combined with deferred tax assets. The amendments in this Update are effective for fiscal years, and interim periods within those years, beginning after December 15, 2013. The Company believes that its adoption of ASU 2013-11 will not have any material impact on its consolidated financial statements.
| F-48 | ||
|
|
SHIJIAZHUANG LIYU TECHNOLOGY DEVELOPMENT CO., LTD.
NOTES TO FINANCIAL STATEMENTS
FOR THE YEAR ENDED SEPTEMBER 30, 2011, 2012 AND 2013
(In thousands, except number of share, per share data and unless otherwise stated)
|
3.
|
RELATED PARTY BALANCES AND TRANSACTIONS
|
|
|
(1)
|
Related party relationships
|
|
Name of related parties
|
|
Relationship
|
|
Shijiazhuang High-Tech Zone Yuanshen Science and Technology Co., Ltd. (“Shijiazhuang Yuanshen”)
|
|
Being an equity investment of the Company (note 7)
|
|
Beijing Origin Seed Limited
|
|
Being a shareholder of the Company
|
|
|
(2)
|
Due from related party
|
|
|
|
September 30,
|
|
||||
|
|
|
2012
|
|
2013
|
|
||
|
|
|
RMB
|
|
RMB
|
|
||
|
|
|
|
|
|
|
|
|
|
Beijing Origin Seed Limited
|
|
|
297
|
|
|
-
|
|
|
|
(3)
|
Due to related party
|
|
|
|
September 30,
|
|
||||
|
|
|
2012
|
|
2013
|
|
||
|
|
|
RMB
|
|
RMB
|
|
||
|
|
|
|
|
|
|
|
|
|
Shijiazhuang Yuanshen
|
|
|
1,460
|
|
|
-
|
|
|
|
(4)
|
Transactions with related parties
|
|
|
(a)
|
Sales to
|
|
|
|
Year ended
September 30, |
|
|||||||
|
|
|
2011
|
|
2012
|
|
2013
|
|
|||
|
|
|
RMB
|
|
RMB
|
|
RMB
|
|
|||
|
|
|
|
|
|
|
|
|
|
|
|
|
Beijing Origin Seed Limited
|
|
|
90
|
|
|
-
|
|
|
-
|
|
|
|
(b)
|
Technology usage fee received from
|
|
|
|
Year ended
September 30, |
|
|||||||
|
|
|
2011
|
|
2012
|
|
2013
|
|
|||
|
|
|
RMB
|
|
RMB
|
|
RMB
|
|
|||
|
|
|
|
|
|
|
|
|
|
|
|
|
Beijing Origin Seed Limited
|
|
|
5,953
|
|
|
9,541
|
|
|
14,665
|
|
|
Shijiazhuang Yuanshen
|
|
|
-
|
|
|
-
|
|
|
1,460
|
|
|
|
|
|
|
|
|
|
|
|
|
|
|
|
|
|
5,953
|
|
|
9,541
|
|
|
16,125
|
|
| F-49 | ||
|
|
SHIJIAZHUANG LIYU TECHNOLOGY DEVELOPMENT CO., LTD.
NOTES TO FINANCIAL STATEMENTS
FOR THE YEAR ENDED SEPTEMBER 30, 2011, 2012 AND 2013
(In thousands, except number of share, per share data and unless otherwise stated)
|
3.
|
RELATED PARTY BALANCES AND TRANSACTIONS - Continued
|
|
|
(c)
|
Dividend paid to
|
|
|
|
Year ended
September 30, |
|
|||||||
|
|
|
2011
|
|
2012
|
|
2013
|
|
|||
|
|
|
RMB
|
|
RMB
|
|
RMB
|
|
|||
|
|
|
|
|
|
|
|
|
|
|
|
|
Beijing Origin Seed Limited
|
|
|
2,467
|
|
|
2,100
|
|
|
2,700
|
|
|
|
4.
|
ACCOUNTS RECEIVABLE
|
Accounts receivable consists of trade receivables resulting from the technology usage fee charged to the customers during the normal course of business.
Allowance for doubtful account is as follows:
|
|
|
Year ended
September 30, |
|
||||
|
|
|
2011
|
|
2012
|
|
2013
|
|
|
|
|
RMB
|
|
RMB
|
|
RMB
|
|
|
|
|
|
|
|
|
|
|
|
Balance at beginning of year
|
|
520
|
|
520
|
|
520
|
|
|
Additions
|
|
-
|
|
-
|
|
-
|
|
|
|
|
|
|
|
|
|
|
|
Balance at end of year
|
|
520
|
|
520
|
|
520
|
|
|
|
5.
|
ADVANCES TO SUPPLIERS
|
Advances to suppliers consist of the following:
|
|
|
September 30,
|
|
||
|
|
|
2012
|
|
2013
|
|
|
|
|
RMB
|
|
RMB
|
|
|
|
|
|
|
|
|
|
Prepaid rental
|
|
-
|
|
1,272
|
|
|
Others
|
|
84
|
|
300
|
|
|
|
|
|
|
|
|
|
|
|
84
|
|
1,572
|
|
| F-50 | ||
|
|
SHIJIAZHUANG LIYU TECHNOLOGY DEVELOPMENT CO., LTD.
NOTES TO FINANCIAL STATEMENTS
FOR THE YEAR ENDED SEPTEMBER 30, 2011, 2012 AND 2013
(In thousands, except number of share, per share data and unless otherwise stated)
6.
PLANT AND EQUIPMENT, NET
Plant and equipment, net consist of the following:
|
|
|
September 30,
|
|
||||
|
|
|
2012
|
|
2013
|
|
||
|
|
|
RMB
|
|
RMB
|
|
||
|
|
|
|
|
|
|
|
|
|
Plant and building
|
|
|
1,890
|
|
|
4,896
|
|
|
Furniture and office equipment
|
|
|
636
|
|
|
759
|
|
|
Motor vehicles
|
|
|
1,132
|
|
|
2,614
|
|
|
|
|
|
|
|
|
|
|
|
Total
|
|
|
3,658
|
|
|
8,269
|
|
|
Accumulated depreciation
|
|
|
(1,108)
|
|
|
(1,532)
|
|
|
|
|
|
|
|
|
|
|
|
Plant and equipment, net
|
|
|
2,550
|
|
|
6,737
|
|
The depreciation expenses for the years ended September 30, 2011, 2012 and 2013 were RMB
282
, RMB
291
, and RMB
433
, respectively.
|
7.
|
EQUITY INVESTMENTS
|
Equity investments consist of the following:
|
|
|
September 30,
|
|
||
|
|
|
2012
|
|
2013
|
|
|
|
|
RMB
|
|
RMB
|
|
|
|
|
|
|
|
|
|
Equity method investment
|
|
433
|
|
958
|
|
Shijiazhuang High-Tech Zone Yuanshen Science and Technology Co., Ltd.
The Company owns 30% equity interest in Shijiazhuang Yuanshen and accounts for the investment under the equity method. For the years ended September 30, 2011, 2012 and 2013, the Company recorded its pro-rata share of earnings (loss) in Shijiazhuang Yuanshen of RMB(13), RMB132 and RMB525, respectively.
|
8.
|
OTHER ASSETS
|
Other assets consist of the following:
|
|
|
September 30,
|
|
||
|
|
|
2012
|
|
2013
|
|
|
|
|
RMB
|
|
RMB
|
|
|
|
|
|
|
|
|
|
Deposit for purchase of plant and equipment
|
|
2,799
|
|
600
|
|
| F-51 | ||
|
|
SHIJIAZHUANG LIYU TECHNOLOGY DEVELOPMENT CO., LTD.
NOTES TO FINANCIAL STATEMENTS
FOR THE YEAR ENDED SEPTEMBER 30, 2011, 2012 AND 2013
(In thousands, except number of share, per share data and unless otherwise stated)
|
9.
|
OTHER PAYABLES AND ACCRUED EXPENSES
|
Other payables and accrued expenses consist of:
|
|
|
September 30,
|
|
||
|
|
|
2012
|
|
2013
|
|
|
|
|
RMB
|
|
RMB
|
|
|
|
|
|
|
|
|
|
Rental payable
|
|
1,001
|
|
-
|
|
|
Others
|
|
1
|
|
5
|
|
|
|
|
1,001
|
|
5
|
|
|
10.
|
INCOME TAXES
|
The Company was incorporated in the PRC and governed by the PRC laws.
The applicable tax rate of the PRC EIT was changed from
33
% to
25
% on January 1, 2008, according to the PRC EIT Law.
In addition, Article 28 of the new tax law stated that the income tax rate of a “high technology” company (high-tech status) is to remain at
15
%.
Preferential tax treatment of the Company as “high technology” company (High-tech Status) has been agreed with the relevant PRC Tax Authorities. The Company is entitled to a preferential tax rate of
15
% which is subject to annual review.
In accordance with Section 27 of PRC EIT Law and Article 86 of the related Implementation Regulations, the Company is engaged in the business of “breeding of new varieties of crops”, which is entitled to EIT exemption that subject to the validation and approval from the PRC Tax Authority.
The Company’s provision for income taxes benefit (expense) for the years ended September 30, 2011, 2012 and 2013 were RMB(1,465), RMB1,452 and RMB nil, respectively, only consist of current tax benefit (expense).
The Company did not have any significant temporary differences relating to deferred tax assets/ liabilities as of September 30, 2012 and 2013.
Reconciliation between total income tax expenses (benefit) and the amount computed by applying the statutory income tax rate to income before taxes is as follows:
|
|
Year ended
September 30, |
||||||
|
|
|
2011
|
|
2012
|
|
2013
|
|
|
|
|
%
|
|
%
|
|
%
|
|
|
|
|
|
|
|
|
|
|
|
Statutory rate
|
|
25
|
|
25
|
|
25
|
|
|
Effect of preferential tax treatment
|
|
(10)
|
|
(10)
|
|
(10)
|
|
|
Effect of income for which no income tax is chargeable
|
|
(1)
|
|
(15)
|
|
(15)
|
|
|
Over provision in prior year
|
|
(1)
|
|
(12)
|
|
-
|
|
|
|
|
|
|
|
|
|
|
|
Effective income tax rate
|
|
13
|
|
(12)
|
|
-
|
|
| F-52 | ||
|
|
SHIJIAZHUANG LIYU TECHNOLOGY DEVELOPMENT CO., LTD.
NOTES TO FINANCIAL STATEMENTS
FOR THE YEAR ENDED SEPTEMBER 30, 2011, 2012 AND 2013
(In thousands, except number of share, per share data and unless otherwise stated)
|
10.
|
INCOME TAXES - Continued
|
The Company performed self-assessment on the liability for unrecognized tax benefits, interests and penalties, which relate to the tax years still subject to review by taxing authorities. Audit periods remain open for review until the statute of limitations has passed, which in the PRC is usually 5 years. The completion of review or the expiration of the statute of limitations for a given audit period could result in an adjustment to the Company’s liability for income taxes. Any such adjustment could be material to the Company’s results of operations for any given annual period based, in part, upon the results of operations for the given period. As of September 30, 2012 and 2013, management considered that the Company had no uncertain tax positions affecting its financial position and results of operations or cash flows, and will continue to evaluate for any uncertain position in future. There is no estimated interest cost and penalty provided in the Company’s financial statements for the years ended September 30, 2011, 2012 and 2013, respectively. The Company’s tax positions related to open tax years are subject to examination by the relevant tax authorities and the major one is the China Tax Authority.
|
11
|
EMPLOYEE BENEFIT PLAN AND PROFIT APPROPRIATION
|
Full time employees of the PRC entities participate in a government mandated multi-employer defined contribution plan pursuant to which certain pension benefits, medical care, unemployment insurance, employee housing fund and other welfare benefits are provided to employees. Chinese labor regulations require the Company to accrue for these benefits based on certain percentages of the employees’ salaries. The total provisions for such employee benefits were RMB59, and RMB85 and RMB148 for the years ended September 30, 2011, 2012 and 2013, respectively.
Pursuant to the laws applicable to the PRC, domestic PRC entities must make appropriations from after-tax profit to non-distributable reserves funds including: (i) the statutory surplus reserve and; (ii) the statutory public welfare fund. Subject to the limits of 50% of the entity’s registered capital, the statutory surplus reserve fund requires annual appropriations of 10% of after-tax profit (as determined under accounting principles generally accepted in the PRC (“PRC GAAP”) at each year-end). These reserve funds can only be used for specific purposes of enterprise expansion and staff welfare and are not distributable as cash dividends.
The appropriation has been made for the years ended September 30, 2011, 2012 and 2013 were RMB336, RMB nil and RMB nil.
On the other hand, the amount set aside as of September 30, 2012 and 2013 were RMB1,500 and RMB1,500, respectively.
|
12.
|
COMMITMENTS AND CONTINGENCIES
|
|
|
(a)
|
Capital commitments
|
As of September 30, 2012 and 2013, the Company’s capital commitments for the purchase of long-term assets are RMB806 and RMB nil, respectively.
|
|
(b)
|
Operating lease
|
The Company leased certain land use rights for seed development and office premises under non-cancellable leases. Rental expenses under operating leases for the years ended September 30, 2011, 2012 and 2013 were RMB4,705, RMB4,611 and RMB5,356 respectively.
The Company has no future minimum lease payments under non-cancellable operating leases as of September 30, 2012 and 2013.
|
13.
|
FAIR VALUE OF FINANCIAL INSTRUMENTS
|
The carrying amounts of cash and cash equivalents and accounts receivable are reasonable estimates of their fair value. All the financial instruments are for trade purposes. No level 2 or 3 fair value assessment has been made.
| F-53 | ||
|
|
SHIJIAZHUANG LIYU TECHNOLOGY DEVELOPMENT CO., LTD.
NOTES TO FINANCIAL STATEMENTS
FOR THE YEAR ENDED SEPTEMBER 30, 2011, 2012 AND 2013
(In thousands, except number of share, per share data and unless otherwise stated)
|
14.
|
OPERATING RISK
|
Concentrations of credit risk
Financial instruments that subject the Company to concentrations of credit risk consist primarily of cash and cash equivalents. The Company maintains its cash and cash equivalents with high-quality institutions. Generally these deposits may be redeemed upon demand and therefore bear minimal risk.
Concentrations of customers
A substantial percentage of the Company’s revenues are made from a shareholder, Beijing Origin, approximated to 31%, 49% and 54% of total revenue for the years ended September 30, 2011, 2012 and 2013, respectively. If our major customers experience a decline in the demand for their products as a result of the prevailing economic environment or other factors, the technology usage fee we receive could be reduced, which would adversely impact our revenues and operating results.
Liquidity risk
We believe our working capital is sufficient to meet our present requirements. We may, however, require additional cash due to changing business conditions or other future developments, including any investments or acquisitions we may decide to pursue. In the long-term, we intend to rely primarily on cash flow from operations to meet our anticipated cash needs. If our anticipated cash flow is insufficient to meet our requirements, we may also seek to sell additional equity, debt or equity-linked securities.
Country risk
The Company has significant investments in the PRC. The operating results of the Company may be adversely affected by changes in the political and social conditions in the PRC and by changes in Chinese government policies with respect to laws and regulations, anti-inflationary measures, currency conversion and remittance abroad, and rates and methods taxation, among other things. There can be no assurance; however, those changes in political and other conditions will not result in any adverse impact.
| F-54 | ||
|
|
TABLE OF CONTENTS
Part IItem 1. Identity Of Directors, Senior Management and AdvisorsItem 2. Offer Statistics and Expected TimetableItem 3. Key InformationItem 4. Information on The CompanyItem 4A. Unresolved Staff CommentsItem 5. Operating and Financial Review and ProspectsItem September 30Item 6. Directors, Senior Management and EmployeesItem 7. Major Shareholders and Related Party TransactionsItem 8. Financial InformationItem 9. The Offer and ListingItem 10. Additional InformationItem 11. Quantitative and Qualitative Disclosures About Market RiskItem 12. Description Of Securities Other Than Equity SecuritiesPart IIItem 13. Defaults, Dividend Arrearages and DelinquenciesItem 14. Material Modifications To The Rights Of Security Holders and Use Of ProceedsItem 15. Controls and ProceduresItem 16A. Audit Committee Financial ExpertItem 16B. Code Of EthicsItem 16C. Principal Accountant Fees and ServicesItem 16D. Exemptions From The Listing Standards For Audit CommitteesItem 16E. Purchases Of Equity Securities By The Issuer and Affiliated PurchasersItem 16F. Change in Registrant S Certifying AccountantItem 16G. Corporate GovernancePart IIIItem 17. Financial StatementsItem 18. Financial StatementsItem 19. Exhibits