UNITED STATES
SECURITIES AND EXCHANGE COMMISSION
Washington, D.C. 20549
FORM 10-K
x
ANNUAL REPORT PURSUANT TO SECTION 13 OR 15(d) OF THE SECURITIES EXCHANGE ACT OF 1934
For the fiscal year ended
July 28, 2018
OR
¨
TRANSITION REPORT PURSUANT TO SECTION 13 OR 15(d) OF THE SECURITIES EXCHANGE ACT OF 1934
For the transition period from to
Commission file number: 001-38291
STITCH FIX, INC.
(Exact name of registrant as specified in its charter)
|
Delaware
|
27-5026540
|
|
(State or other jurisdiction of incorporation or organization)
|
(I.R.S. Employer Identification No.)
|
1 Montgomery Street, Suite 1500
San Francisco, California 94104
(Address of principal executive offices and zip code)
Registrant’s telephone number, including area code: (415) 882-7765
|
Securities registered pursuant to Section 12(b) of the Act:
|
||
|
Title of Each Class
|
Name of Each Exchange on Which Registered
|
|
|
Class A common stock, par value $0.00002 per share
|
Nasdaq Stock Market LLC (Nasdaq Global Select Market)
|
|
Securities registered pursuant to Section 12(g) of the Act:
None
Indicate by check mark if the registrant is a well-known seasoned issuer, as defined in Rule 405 of the Securities Act.
YES
¨
NO
x
Indicate by check mark if the registrant is not required to file reports pursuant to Section 13 or Section 15(d) of the Act.
YES
¨
NO
x
Indicate by check mark whether the registrant (1) has filed all reports required to be filed by Section 13 or 15(d) of the Securities Exchange Act of 1934 during the preceding 12 months (or for such shorter period that the registrant was required to file such reports), and (2) has been subject to such filing requirements for the past 90 days. YES
x
NO
¨
Indicate by check mark whether the registrant has submitted electronically every Interactive Data File required to be submitted pursuant to Rule 405 of Regulation S-T (§232.405 of this chapter) during the preceding 12 months (or for such shorter period that the registrant was required to submit such files). YES
x
NO
¨
Indicate by check mark if disclosure of delinquent filers pursuant to Item 405 of Regulation S-K is not contained herein, and will not be contained, to the best of registrant’s knowledge, in definitive proxy or information statements incorporated by reference in Part III of this Form 10-K or any amendment to this Form 10-K.
x
Indicate by check mark whether the registrant is a large accelerated filer, an accelerated filer, a non-accelerated filer, a smaller reporting company or an emerging growth company. See the definitions of “large accelerated filer,” “accelerated filer,” “smaller reporting company” and “emerging growth company” in Rule 12b-2 of the Exchange Act.
|
Large accelerated filer
¨
|
Accelerated filer
¨
|
|
|
Non-accelerated filer
x
|
Smaller reporting company
¨
|
|
|
Emerging growth company
¨
|
||
If an emerging growth company, indicate by check mark if the registrant has elected not to use the extended transition period for complying with any new or revised financial accounting standards provided pursuant to Section 13(a) of the Exchange Act.
¨
Indicate by check mark whether the registrant is a shell company (as defined in Rule 12b-2 of the Act). YES
¨
NO
x
The aggregate market value of the voting and non-voting common equity held by non-affiliates of the registrant was approximately
$199.1 million
as of January 27, 2018, the last day of the registrant’s most recently completed second fiscal quarter, based upon the closing sale price of the registrant’s Class A common stock on the Nasdaq Global Select Market reported for January 26, 2018. Excludes an aggregate of
62,907,730
shares of the registrant’s common stock held by officers, directors and affiliated stockholders as of January 27, 2018. For purposes of determining whether a stockholder was an affiliate of the registrant at January 27, 2018, the registrant assumed that a stockholder was an affiliate of the registrant if such stockholder (i) beneficially owned 10% or more of the registrant’s capital stock, as determined based on public filings, and/or (ii) was an executive officer or director, or was affiliated with an executive officer or director, of the registrant at January 27, 2018. Exclusion of such shares should not be construed to indicate that any such person possesses the power, direct or indirect, to direct or cause the direction of the management or policies of the registrant or that such person is controlled by or under common control with the registrant.
As of
September 27, 2018
, the number of outstanding shares of the registrant’s Class A common stock, par value $0.00002 per share, was
38,513,396
, and the number of outstanding shares of the registrant’s Class B common stock, par value $0.00002 per share, was
60,619,532
.
DOCUMENTS INCORPORATED BY REFERENCE
Portions of the registrant’s definitive Proxy Statement for the 2018 Annual Meeting of Stockholders to be filed with the U.S. Securities and Exchange Commission pursuant to Regulation 14A not later than 120 days after the end of the fiscal year covered by this Annual Report on Form 10-K are incorporated by reference in Part III, Items 10-14 of this Annual Report on Form 10-K.
Table of Contents
|
Page
Number
|
||||
Unless the context suggests otherwise, references in this Annual Report on Form 10-K (the “Annual Report”) to “Stitch Fix,” the “Company,” “we,” “us” and “our” refer to Stitch Fix, Inc. and, where appropriate, its subsidiaries.
3
SPECIAL NOTE REGARDING FORWARD-LOOKING STATEMENTS
This Annual Report contains forward-looking statements that involve risks, uncertainties and assumptions that, if they never materialize or prove incorrect, could cause our results to differ materially from those expressed or implied by such forward-looking statements. The statements contained in this Annual Report that are not purely historical are forward-looking statements within the meaning of Section 27A of the Securities Act of 1933, as amended, or the Securities Act, and Section 21E of the Securities Exchange Act of 1934, as amended, or the Exchange Act. Forward-looking statements are often identified by the use of words such as, but not limited to, "anticipate," "believe," "can," "continue," "could," "estimate," "expect," "intend," "may," "might," "plan," "project," "seek," "should," "target," "will," "would" and similar expressions or variations intended to identify forward-looking statements. These statements are based on the beliefs and assumptions of our management, which are in turn based on information currently available to management. Such forward-looking statements are subject to risks, uncertainties and other important factors that could cause actual results and the timing of certain events to differ materially from future results expressed or implied by such forward-looking statements. Factors that could cause or contribute to such differences include, but are not limited to, those discussed in the section titled "Risk Factors
"
included under Part I, Item 1A below. Furthermore, such forward-looking statements speak only as of the date of this report. Except as required by law, we undertake no obligation to update any forward-looking statements to reflect events or circumstances after the date of such statements.
Overview
Stitch Fix is transforming the way people find what they love, one client at a time and one Fix at a time.
Stitch Fix was inspired by the vision of a client-first, client-centric new way of retail. What people buy and wear matters. When we serve our clients well, we help them discover and define their styles, we find jeans that fit and flatter their bodies, we reduce their anxiety and stress when getting ready in the morning, we give them confidence in job interviews and on first dates and we give them time back in their lives to invest in themselves or spend with their families. Most of all, we are fortunate to play a small part in our clients looking, feeling and ultimately being their best selves.
We are reinventing the shopping experience by delivering one-to-one personalization to our clients through the combination of data science and human judgment. This combination drives a better client experience and a more powerful business model than either element could deliver independently.
Since our founding in 2011, we have helped millions of clients discover and buy what they love through personalized shipments of apparel, shoes and accessories, hand selected by Stitch Fix stylists and delivered to our clients’ homes. We call each of these shipments a Fix. Clients can choose to schedule automatic shipments or order a Fix on demand after they fill out a style profile on our website or mobile app. For each Fix, we charge clients a styling fee that is credited toward items they purchase. Alternatively, select clients may purchase an annual Style Pass, which offers unlimited styling for the year for a $49 fee that is also credited towards items they purchase. After receiving a Fix, our clients purchase the items they want to keep and return the other items, if any, at no additional charge. In addition, our Extras feature allows clients to select items such as socks, bras, underwear and other intimates that are then added to the five items their stylist selects for their Fix.
Stitch Fix was founded with a focus on Women’s apparel. In our first few years, we were able to gain a deep understanding of our clients and merchandise and build the capability to listen to our clients, respond to feedback and deliver the experience of personalization. More recently, we have extended those capabilities into Petite, Maternity, Men’s, Plus and Kids apparel, as well as shoes and accessories. Our stylists leverage our data science and apply their own judgment to hand select apparel, shoes and accessories for our clients from a broad range of merchandise.
We are successful when we are able to help clients find what they love again and again, creating long-term, trusted relationships. Our clients share personal information with us, including detailed style, size, fit and price preferences, as well as unique inputs, such as how often they dress for certain occasions or which parts of their bodies they like to flaunt or cover up. Our clients are motivated to share these personal details with us and provide us with ongoing feedback because they recognize that doing so will result in more personalized and successful experiences. This feedback also creates a valuable network effect by helping us to better serve other clients. As of
July 28, 2018
, we had
2,742,000
active clients. See the section titled “Management’s Discussion and Analysis of Financial Condition and Results of Operations—Key Metrics” for information on how we define and calculate active clients.
The very human experience that we deliver is powered by data science. Our data science capabilities consist of our rich data set and our proprietary algorithms, which fuel our business by enhancing the client experience and driving business model efficiencies. The vast majority of our client data is provided directly and explicitly by the client, rather than inferred, scraped or obtained from other sources. We also gather extensive merchandise data, such as inseam, pocket shape, silhouette and fit. This large and growing data set provides the foundation for proprietary algorithms that we use throughout our business, including those that predict purchase behavior, forecast demand, optimize inventory and enable us to design new apparel. We believe our data science capabilities give us a significant competitive advantage, and as our data set grows, our algorithms become more powerful.
4
Our stylists leverage our data science through a custom-built, web-based styling application that provides recommendations from our broad selection of merchandise. Our stylists then apply their judgment to select what they believe to be the best items for each Fix. Our stylists provide a personal touch, offer styling advice and context to each item selected and help us develop long-term relationships with our clients.
We offer merchandise across multiple price points and styles from established and emerging brands, as well as our own private labels, which we call Exclusive Brands. Many of our brand partners also design and supply items exclusively for our clients.
In October 2018, we announced that we are planning to launch operations in the United Kingdom, or UK, by the end of our fiscal year 2019.
Industry Overview
Technology is Driving Transformation Across Industries
Technological innovation has profoundly impacted how consumers discover and purchase products, forcing businesses to adapt to engage effectively with consumers. We believe that new business models that embrace these changes and truly focus on the consumer will be the winners in this changing environment.
The Apparel, Shoes and Accessories Market is Massive but Many Retailers have Failed to Adapt to Changing Consumer Behavior
The U.S. apparel, shoes and accessories market is large, but we believe many brick-and-mortar retailers have failed to adapt to evolving consumer preferences. Euromonitor, a consumer market research company, estimated that the U.S. apparel, footwear and accessories market was $342 billion in calendar 2017. Euromonitor expects this market to grow to $406 billion by calendar 2022, a compound annual growth rate, or CAGR, of 3.5%.
Historically, brick-and-mortar retailers have been the primary source of apparel, shoes and accessories sales in the United States. Over time, brick-and-mortar retail has changed and the era of salespersons who know each customer on a personal level has passed. We believe many of today’s consumers view the traditional retail experience as impersonal, time-consuming and inconvenient. This has led to financial difficulties, bankruptcies and store closures for many major department stores, specialty retailers and retail chains.
eCommerce is Growing, but has Further Depersonalized the Shopping Experience
The internet has created new opportunities for consumers to shop for apparel. eCommerce continues to take market share from brick-and-mortar retail. Euromonitor estimated that the eCommerce portion of the U.S. apparel, footwear and accessories market was $70 billion in calendar 2017. Euromonitor expects the eCommerce portion of this market to grow to $133 billion by calendar 2022, a CAGR of 13.8%. This represents an expansion of eCommerce penetration of the U.S. apparel, footwear and accessories market from 20.4% of $342 billion in calendar 2017 to 32.7% of $406 billion in calendar 2022.
The first wave of eCommerce companies prioritized low price and fast delivery. This transaction-focused model is well suited for commoditized products and when consumers already know what they want. However, we believe eCommerce companies often fall short when consumers do not know what they want and price and delivery speed are not the primary decision drivers. There is an overwhelming selection of apparel, shoes and accessories available to consumers online, and searches and filters are poor tools when it comes to finding items that fit one’s style, figure and occasion. eCommerce companies also lack the critical personal touchpoints necessary to help consumers find what they love, further depersonalizing the shopping experience.
Personalization is the Next Wave
To be relevant today, retailers must find a way to connect with consumers on a personal level and fit conveniently into their lifestyles. Personalization in retail can be difficult and nuanced, as consumers consider many factors that can be difficult to articulate, including style, size, fit, feel and occasion. We believe that an intelligent combination of data science and human judgment is required to deliver the personalized retail experience that consumers seek.
Competition
The retail apparel industry is highly competitive. Our competitors include eCommerce companies that market apparel, shoes and accessories, local, national and global department stores, specialty retailers, discount chains, independent retail stores and the online offerings of these traditional retail competitors. Additionally, we experience competition for consumer discretionary spending from other product and experiential categories.
We compete primarily on the basis of client experience, brand, product selection, quality, convenience and price. We believe that we are able to compete effectively because we offer clients a personalized and fun shopping experience that our competitors are unable to match. See Part I, Item1A “Risk Factors—Our industry is highly competitive and if we do not compete effectively our operating results could be adversely affected” for more information.
Our Service
Stitch Fix combines data science and human judgment to deliver one-to-one personalization to our clients at scale. We help millions of clients discover and buy what they love through data-driven, personalized, hand-selected shipments of apparel, shoes and accessories.
5
Our Data Science Advantage
Our data science capabilities fuel our business. These capabilities consist of our rich and growing set of detailed client and merchandise data and our proprietary algorithms. We use data science throughout our business, including to style our clients, predict purchase behavior, forecast demand, optimize inventory and design new apparel.
Our data set is particularly powerful because:
|
•
|
the vast majority of our client data is provided directly and explicitly by the client, rather than inferred, scraped or obtained from other sources;
|
|
•
|
our clients are motivated to provide us with relevant personal data, both at initial signup and over time as they use our service, because they trust it will improve their Fixes; and
|
|
•
|
our merchandise data tracks dimensions that enable us to predict purchase behavior and deliver more personalized Fixes.
|
On average, each client directly provides us with over 90 meaningful data points through his or her style profile, including detailed style, size, fit and price preferences, as well as unique inputs such as how often he or she dresses for certain occasions or which parts of his or her body the client likes to flaunt or cover up. Over time, through their feedback on Fixes they receive, clients share additional information about their preferences as well as detailed data about both the merchandise they keep and return. Historically, over 85% of our shipments have resulted in direct client feedback. This feedback loop drives important network effects, as our client-provided data informs not only our personalization capabilities for the specific client, but also helps us better serve other clients. In 2018, we introduced Style Shuffle, an interactive mobile and web-based game in which participants rate an assortment of Stitch Fix merchandise, providing additional data to strengthen our understanding of client tastes and style preferences.
We believe our proprietary merchandise data set is differentiated from other retailers. We encode each of our SKUs with many information attributes to help our algorithms make better recommendations for our clients. The information we store for each SKU includes:
|
•
|
basic data, such as brand, size, color, pattern, silhouette and material;
|
|
•
|
|
|
•
|
nuanced descriptors, such as how appropriate the piece is for a client that prefers preppy clothing or whether it is appropriate for a formal event; and
|
|
•
|
client feedback, such as how the item fit a 5’10” client or how popular the piece is with young mothers.
|
Our algorithms use our data set to match merchandise to each of our clients. For every combination of client and merchandise, we compute the probability the client will keep that item based on her and other clients’ preferences and purchase history as well as the attributes and past performance of the merchandise.
Pairing Data Science with Human Judgment
The combination of data science and human judgment drives a better client experience and a more powerful business model than either element could deliver independently. Our advanced data science capabilities harness the power of our data for our stylists by generating predictive recommendations to streamline our stylists’ individualized curation process. Stylists add a critical layer of contextual, human decision making that augments and improves our algorithms’ selections and ultimately produces a better, more personalized Fix for each client.
Our Differentiated Value Proposition
Our Value Proposition to Clients
Our clients love our service for many reasons. We help clients find apparel, shoes and accessories that they love in a way that is convenient and fun. We save our clients time by doing the shopping, delivering Fixes right to their homes, allowing them to try on merchandise in the comfort of their homes and in the context of their own closets and making the return process simple. Our expert styling service connects each client to a professional who will understand her fashion needs, hand select items personalized to her and offer her ongoing style advice. Clients also value the quality and diversity of our merchandise as we deliver the familiar brands they know, offer items they can’t find anywhere else and expand their fashion palette by exposing them to new brands and styles they might not have tried if they shopped for themselves. We often hear from clients that we have helped them find the perfect pair of jeans or discover a dress silhouette they never would have selected for themselves. In these situations, not only is our service more convenient, it is in fact more effective at helping clients find what they love. We proudly style men, women and kids across ages, sizes, tastes, geographies and price preferences.
Our Value Proposition to Brand Partners
We believe that we are a preferred channel and a powerful growth opportunity for our brand partners. Unlike many sales channels, we do not rely on discounts or promotions. Also, by introducing our clients to brands they may not have shopped for, we help our brand partners reach clients they may not have otherwise reached. Further, we provide our brand partners with insights based on client feedback that help our brand partners improve and evolve their merchandise to better meet consumer demand.
6
Our Strengths
Since we were founded in 2011, we have shipped millions of Fixes to clients throughout the United States. We have achieved this success due to our following key strengths:
|
•
|
our rich client and merchandise data;
|
|
•
|
our expert data science team and proprietary and predictive algorithms;
|
|
•
|
our team of
3,900
+ stylists;
|
|
•
|
our unique combination of data science and human judgment; and
|
|
•
|
our superior business model.
|
Our Strategy
We aim to transform the way people find what they love. We plan to achieve this goal by continuing to:
|
•
|
expand our relationships with existing clients;
|
|
•
|
acquire new clients; and
|
|
•
|
expand our addressable market.
|
How it Works
The Fix
A Fix is a Stitch Fix-branded box containing a combination of apparel, shoes and accessories personally selected for a client by her Stitch Fix stylist and delivered to the client for her to try on in the comfort of her own home. She can keep some, all or none of the items in the Fix and easily return any items in a postage-prepaid bag provided in the Fix. One of our stylists individually selects each item in a Fix for a client from a broad range of merchandise recommended to the stylist by our algorithms. These algorithmic recommendations are based on the client’s personal style profile, her own order behavior, the aggregate historical behavior of our client base and the aggregate historical data we have collected on each item of merchandise we have available.
We have numerous touch points with our clients. Before a client receives his or her first Fix, he or she shares the following information with us:
|
•
|
Style profile
. Upon registering, each client fills out a style profile on either our website or mobile application. The style profile allows us to introduce ourselves to a client, initiate a dialogue and start gathering data.
|
|
•
|
Personal note to stylist
. Each client can share a personal note with his or her stylist when placing a Fix order or after receiving a Fix. For example, a client might request shoes for a friend’s wedding or shorts for an upcoming vacation. These personal notes enable us to better personalize a Fix.
|
After completing her initial style profile, a client chooses her preferred order frequency and can select the exact date by which she wants to receive her Fix. We currently offer two types of Fix scheduling:
|
•
|
Auto-ship
. A client can elect to auto-ship Fixes every two to three weeks, monthly, bi-monthly or quarterly.
|
|
•
|
On-demand
. Our on-demand option allows clients to schedule a one-time Fix at any time, either instead of or in addition to utilizing the auto-ship option. An on-demand client is prompted to schedule her next Fix each time she checks out, but is not obligated to do so.
|
We recognize that our clients have different needs, so our Fix frequency options are another way that we personalize the client experience. Each client can increase or decrease the Fix frequency at any time, and can also easily reschedule any given shipment to better accommodate her needs. Each Fix is delivered to the client’s address of choice.
In February 2018, we launched Extras, a feature that allows clients to select items such as socks, bras, underwear and other intimates that are then added to the five items their stylist selects for their Fix.
In addition to a personalized selection of apparel, shoes and accessories, each Fix also includes a personal note from the stylist and a style card to provide clients with outfit ideas for each item.
Once a client decides which items she wishes to keep she can easily check out and pick the delivery date for her next Fix via our website or mobile application.
During the checkout process, each client is invited to provide feedback about the fit, price, style and quality of the items received. Historically, over 85% of shipments have resulted in direct client feedback. This feedback informs both our algorithms and stylists to improve each future Fix. In 2018, we introduced Style Shuffle, an interactive mobile and web-based game in which participants rate an assortment of Stitch Fix merchandise, providing additional data to strengthen our understanding of client tastes and style preferences.
7
We charge clients a $20 styling fee for each Fix, which is credited toward the merchandise purchased. For our Style Pass clients, we charge a $49 annual fee, which provides unlimited styling for the year and is credited toward the merchandise purchased over the course of the year. If the client chooses to keep all items chosen for them by their stylist, she receives a 25% discount on the entire shipment. The client can return the items she does not want or exchange items for a different size if available, using the postage-prepaid bag delivered in her Fix. We request that clients return items to us that they do not wish to purchase within three calendar days of receiving a Fix.
Our Merchandise, Brand Partners and Exclusive Brands
The breadth of our merchandise selection is essential to our success. Our algorithms filter over one thousand SKUs to recommend a subset of relevant merchandise to our stylists, who leverage the information to select the merchandise for a client’s Fix. We source merchandise from brand partners and also create our own merchandise to serve unmet client needs. We offer apparel, shoes and accessories across a range of price points. We currently serve our clients in the following categories: Women’s, Petite, Maternity, Men’s, Plus and Kids, and our merchandise addresses a diverse range of styles.
Brand Partners
We partner with established and emerging brands across multiple price points and styles. With many of our brand partners, we develop third-party branded items exclusively sold to Stitch Fix clients. This exclusivity allows our clients to discover personally recommended products that are unavailable elsewhere.
Exclusive Brands
We also design and bring to market our own styles, which we refer to as Exclusive Brands, in order to target specific client needs that are unmet by what our merchandising team can source in the market. We use data science to identify and develop the new products for our Exclusive Brands. We then pair our data with the expertise of our design teams to bring these new products to market. We expect our product development efforts will yield better products for our clients as we acquire more data and feedback.
Exclusive Brands are a meaningful part of our business and we expect them to be a permanent part of our portfolio. However, we do not have specific targets for the merchandise mix provided by our brand partners and our Exclusive Brands, and expect it will fluctuate over time. We will continue to develop products when we identify opportunities or gaps in the market.
Sourcing
We purchase merchandise directly from our brand partners, who are responsible for the entire manufacturing process.
For the production of our Exclusive Brands, we contract with merchandise vendors, who are responsible for the entire manufacturing process. Some of these vendors operate their own manufacturing facilities and others subcontract the manufacturing to other parties. Our vendors agree to our standard vendor terms, which govern our business relationship. Although we do not have long-term agreements with our vendors, we have long-standing relationships with a diverse base of vendors that we believe to be mutually satisfactory.
All of our Exclusive Brand merchandise is produced according to our specifications, and we require that all of our vendors comply with applicable law and observe strict standards of conduct. We have hired independent firms that conduct audits of the working conditions at the factories producing our Exclusive Brands. If an audit reveals potential problems, we require that the vendor institute corrective action plans to bring the factory into compliance with our standards, or we may discontinue our relationship with the vendor. We require that all new factories producing Exclusive Brand merchandise for us be audited before Stitch Fix production begins.
Inventory Management and Fulfillment
We have five fulfillment centers located in California, Arizona, Texas, Pennsylvania and Indiana and intend to establish a sixth fulfillment center in the UK.
In our fulfillment centers, our algorithms increase efficiencies in processes such as allocation, batch picking, transportation, shipping, returns and ongoing process improvement. We have a reverse logistics operation to manage returned merchandise. Our specialist returns teams in our dedicated return intake areas accept, process and reallocate returns to our inventory so the merchandise can be selected for another Fix. Our expertise in inventory management allows us to turn inventory quickly, which drives working capital efficiency.
Seasonality
Seasonality in our business does not follow that of traditional retailers, such as typical concentration of revenue in the holiday quarter. For example, in the three months ended January 27, 2018 and January 28, 2017, we experienced lower quarter over quarter growth rates due to slower active client growth during the holiday season.
Intellectual Property
We protect our intellectual property through a combination of trademarks, domain names, copyrights, trade secrets and patents, as well as contractual provisions and restrictions on access to our proprietary technology. Our principal trademark assets include the trademarks “Stitch Fix” and “Fix,” which are registered in the United States and some foreign jurisdictions, our logos and taglines, and multiple private label apparel and accessory brand names. We have applied to register or registered many of our trademarks in the United States
8
and other jurisdictions, and we will pursue additional trademark registrations to the extent we believe they would be beneficial and cost-effective.
We have one patent issued and six patent applications pending in the United States. We also have four patent applications filed in the People’s Republic of China. Our issued patent will expire in 2035. We intend to pursue additional patent protection to the extent we believe it would be beneficial and cost-effective.
We are the registered holder of multiple domestic and international domain names that include “stitchfix” and similar variations. We also hold domain registrations for many of our private-label brand names and other related trade names and slogans.
Our proprietary algorithm technologies, other than those incorporated into a patent application, are protected by trade secret laws.
In addition to the protection provided by our intellectual property rights, we enter into confidentiality and proprietary rights agreements with our employees, consultants, contractors and business partners. Our employees are also subject to invention assignment agreements. We further control the use of our proprietary technology and intellectual property through provisions in both our client terms of use on our website and in our vendor terms and conditions.
Government Regulation
As with all retailers and companies operating on the internet, we are subject to a variety of U.S. federal and state laws governing the processing of payments, consumer protection, the privacy of consumer information and other laws regarding unfair and deceptive trade practices.
Apparel, shoes and accessories sold by us are also subject to regulation in the United States by governmental agencies, including the Federal Trade Commission and the Consumer Products Safety Commission. These regulations relate principally to product labeling, licensing requirements, flammability testing and product safety. We are also subject to environmental laws, rules and regulations. Similarly, apparel, shoes and accessories sold by us are also subject to import regulations in the United States and other countries concerning the use of wildlife products for commercial and non-commercial trade, including the U.S. Fish and Wildlife Service. We do not estimate any significant capital expenditures for environmental control matters either in the current fiscal year or in the near future.
We are also subject to regulations relating to our supply chain. For example, the California Transparency in Supply Chains Act requires retail sellers that do business in California to disclose their efforts to eradicate slavery and human trafficking in their supply chains. We require our suppliers to adhere to labor and workplace standards and to warrant that any products sent to us were made in compliance with all applicable laws, including laws prohibiting child labor, forced labor and unsafe working conditions. Although we have not suffered any material restriction from doing business in the past due to government regulation, significant impediments may arise in the future as we expand product offerings.
Employees
As of
July 28, 2018
, we had over
6,600
employees, including over
3,900
stylists,
1,700
fulfillment center employees,
270
client experience employees,
180
engineers and
100
data scientists. As of such date, over
87%
of our employees and
45%
of our management team identified as female. None of our employees is represented by a labor union. We have not experienced any work stoppages, and we consider our relations with our employees to be good.
Information About Segment and Geographic Revenue
Information about segment and geographic revenue is set forth in "Segment Information" in Note 2 of the Notes to Consolidated Financial Statements included in Item 8, Financial Statements and Supplementary Data, of this Form 10-K.
Corporate and Available Information
We were incorporated in Delaware in 2011 under the name rack habit inc. We changed our name to Stitch Fix, Inc. in October 2011. Our principal executive offices are located at 1 Montgomery Street, Suite 1500, San Francisco, California 94104, and our telephone number is (415) 882-7765. Our website is located at www.stitchfix.com, and our investor relations website is located at https://investors.stitchfix.com.
We file or furnish electronically with the U.S. Securities and Exchange Commission (the “SEC”) annual reports on Form 10-K, quarterly reports on Form 10-Q, current reports on Form 8-K and amendments to those reports filed or furnished pursuant to Section 13(a) or 15(d) of the Exchange Act. We make copies of these reports available free of charge through our investor relations website as soon as reasonably practicable after we file or furnish them with the SEC. All materials we file with the SEC are available at the SEC’s Public Reference Room at 100 F Street, NE, Washington, DC 20549. Information on the operation of the Public Reference Room can be obtained by calling the SEC at 1-800-SEC-0330.
Information contained on or accessible through our websites is not incorporated into, and does not form a part of, this Annual Report or any other report or document we file with the SEC, and any references to our websites are intended to be inactive textual references only.
9
Risks Related to Our Business
We have a short operating history in an evolving industry and, as a result, our past results may not be indicative of future operating performance.
We have a short operating history in a rapidly evolving industry that may not develop in a manner favorable to our business. Our relatively short operating history makes it difficult to assess our future performance. You should consider our business and prospects in light of the risks and difficulties we may encounter.
Our future success will depend in large part upon our ability to, among other things:
|
•
|
cost-effectively acquire new clients and engage with existing clients;
|
|
•
|
increase consumer awareness of our brand and maintain our reputation;
|
|
•
|
successfully expand our offering and geographic reach;
|
|
•
|
anticipate and respond to changing style trends and consumer preferences;
|
|
•
|
manage our inventory effectively;
|
|
•
|
anticipate and respond to macroeconomic changes;
|
|
•
|
compete effectively;
|
|
•
|
avoid interruptions in our business from information technology downtime, cybersecurity breaches or labor stoppages;
|
|
•
|
effectively manage our growth;
|
|
•
|
continue to enhance our personalization capabilities;
|
|
•
|
hire, integrate and retain talented people at all levels of our organization;
|
|
•
|
maintain the quality of our technology infrastructure;
|
|
•
|
develop new features to enhance the client experience; and
|
|
•
|
retain our existing merchandise vendors and attract new vendors.
|
If we fail to address the risks and difficulties that we face, including those associated with the challenges listed above as well as those described elsewhere in this “Risk Factors” section, our business and our operating results will be adversely affected.
If we fail to effectively manage our growth, our business, financial condition and operating results could be harmed.
To effectively manage our growth, we must continue to implement our operational plans and strategies, improve and expand our
infrastructure of people and information systems and expand, train and manage our employee base. Since our inception, we have rapidly increased our employee headcount to support the growth of our business. We added a significant number of employees during 2018 and expect to continue growing in 2019. We have expanded across all areas of our business. To support continued growth, we must effectively integrate, develop and motivate a large number of new employees while maintaining our corporate culture. The risks associated with a rapidly growing workforce will be particularly acute as we expand internationally, as we are less familiar with the labor markets outside of the United States, and if we choose to expand into new merchandise categories.
We are also required to manage numerous relationships with various vendors and other third parties. Further growth of our operations, vendor base, fulfillment centers, information technology systems or internal controls and procedures may not be adequate to support our operations. For example, in October 2018, we announced our plans to enter the UK, which will involve working with international vendors, establishing offices and fulfillment centers in the UK and complying with UK and European Union, or EU, laws and regulations. Our launch of Stitch Fix Kids in July 2018 also required us to increase our vendor base, expand our fulfillment center operations and evaluate compliance with additional regulatory requirements, among other things. If we are unable to manage the growth of our organization effectively, our business, financial condition and operating results may be adversely affected.
Our continued growth depends on attracting new clients.
Our success depends on our ability to attract new clients in a cost-effective manner. To expand our client base, we must appeal to and acquire clients who have historically used other means to purchase apparel, shoes and accessories, such as traditional brick-and-mortar apparel retailers or the websites of our competitors. We reach new clients through paid marketing, referral programs, organic word of mouth and other methods of discovery, such as mentions in the press or internet search engine results. Starting in calendar year 2017, we began to increase our paid marketing expenses by investing more in digital marketing and launching our first television advertising campaigns. We expect to increase our spending on these and other paid marketing channels in the future and cannot be certain that these efforts will yield more clients or be as cost effective. Moreover, new clients may not purchase from us as frequently or spend as much
10
with us as existing clients, and the revenue generated from new clients may not be as high as the revenue generated from our existing clients. These factors may harm our growth prospects and our business could be adversely affected.
We rely on consumer discretionary spending and may be adversely affected by economic downturns and other macroeconomic conditions or trends.
Our business and operating results are subject to global economic conditions and their impact on consumer discretionary spending. Some of the factors that may negatively influence consumer spending include high levels of unemployment, higher consumer debt levels, reductions in net worth and declines in asset values and related market uncertainty, home foreclosures and reductions in home values, fluctuating interest rates and credit availability, fluctuating fuel and other energy costs, fluctuating commodity prices and general uncertainty regarding the overall future political and economic environment. Economic conditions in certain regions may also be affected by natural disasters, such as hurricanes, tropical storms and wildfires. Consumer purchases of discretionary items, including the merchandise that we offer, generally decline during periods of economic uncertainty, when disposable income is reduced or when there is a reduction in consumer confidence.
Adverse economic changes could reduce consumer confidence, and thereby could negatively affect our operating results. In challenging and uncertain economic environments, we cannot predict when macroeconomic uncertainty may arise, whether or when such circumstances may improve or worsen or what impact such circumstances could have on our business.
We expect to increase our paid marketing to help grow our business, but these efforts may not be successful or cost effective.
Promoting awareness of our service is important to our ability to grow our business, drive client engagement and attract new clients. We believe that much of the growth in our client base during our first five years originated from referrals, organic word of mouth and other methods of discovery, as our marketing efforts and expenditures were relatively limited. More recently, we increased our paid marketing initiatives and intend to continue to do so. Our marketing efforts currently include client referrals, affiliate programs, partnerships, display advertising, television, print, radio, video, content, direct mail, social media, email, mobile "push" communications, search engine optimization and keyword search campaigns. We have limited experience marketing our services using some of these methods and our efforts may be unsuccessful. Our marketing initiatives may become increasingly expensive and generating a meaningful return on those initiatives may be difficult. Even if we successfully increase revenue as a result of our paid marketing efforts, it may not offset the additional marketing expenses we incur
.
We currently obtain a significant number of visits to our websites via organic search engine results. Search engines frequently change the algorithms that determine the ranking and display of results of a user’s search, which could reduce the number of organic visits to our websites, in turn reducing new client acquisition and adversely affecting our operating results.
Social networks are important as a source of new clients and as a means by which to connect with current clients, and their importance may be increasing. We may be unable to effectively maintain a presence within these networks, which could lead to lower than anticipated brand affinity and awareness, and in turn could adversely affect our operating results.
With respect to our email marketing efforts, if we are unable to successfully deliver emails to our clients or if clients do not engage with our emails, whether out of choice, because those emails are marked as low priority or spam or for other reasons, our business could be adversely affected.
We may be unable to maintain a high level of engagement with our clients and increase their spending with us, which could harm our business, financial condition or operating results.
A high proportion of our revenue comes from repeat purchases by existing clients, especially those existing clients who are highly engaged and purchase a significant amount of merchandise from us. If existing clients no longer find our service and merchandise appealing, they may make fewer purchases and may stop using our service. Even if our existing clients continue to find our service and merchandise appealing, they may decide to receive fewer Fixes and purchase less merchandise over time as their demand for new apparel declines. Additionally, if clients who receive Fixes most frequently and purchase a significant amount of merchandise from us were to make fewer purchases or stop using our service, our financial results could be negatively affected. A decrease in the number of our clients or a decrease in their spending on the merchandise we offer could negatively impact our operating results. Further, we believe that our future success will depend in part on our ability to increase sales to our existing clients over time and, if we are unable to do so, our business may suffer.
Compromises of our data security could cause us to incur unexpected expenses and may materially harm our reputation and operating results.
In the ordinary course of our business, we and our vendors collect, process and store certain personal information and other data relating to individuals, such as our clients and employees, including client payment card information. We rely substantially on commercially available systems, software, tools and monitoring to provide security for our processing, transmission and storage of personal information and other confidential information. There can be no assurance, however, that we or our vendors will not suffer a data compromise, that hackers or other unauthorized parties will not gain access to personal information or other data, including payment card data or confidential business information, or that any such data compromise or access will be discovered in a timely fashion. The techniques used to obtain unauthorized access or to sabotage systems change frequently and generally are not identified until they are launched against a target, and we and our vendors may be unable to anticipate these techniques or to implement adequate preventative measures. In addition, our
11
employees, contractors, vendors or other third parties with whom we do business may attempt to circumvent security measures in order to misappropriate such personal information, confidential information or other data, or may inadvertently release or compromise such data.
Compromise of our data security or of third parties with whom we do business, failure to prevent or mitigate the loss of personal or business information and delays in detecting or providing prompt notice of any such compromise or loss could disrupt our operations, damage our reputation and subject us to litigation, government action or other additional costs and liabilities that could adversely affect our business, financial condition and operating results.
Our industry is highly competitive and if we do not compete effectively our operating results could be adversely affected.
The retail apparel industry is highly competitive. We compete with eCommerce companies that market the same or similar merchandise and services that we offer, local, national and global department stores, specialty retailers, discount chains, independent retail stores and the online offerings of these traditional retail competitors. Additionally, we experience competition for consumer discretionary spending from other product and experiential categories. We believe our ability to compete depends on many factors within and beyond our control, including:
|
•
|
effectively differentiating our service and value proposition from those of our competitors;
|
|
•
|
attracting new clients and engaging with existing clients;
|
|
•
|
our direct relationships with our clients and their willingness to share personal information with us;
|
|
•
|
further developing our data science capabilities;
|
|
•
|
maintaining favorable brand recognition and effectively marketing our services to clients;
|
|
•
|
delivering merchandise that each client perceives as personalized to him or her;
|
|
•
|
the amount, diversity and quality of brands and merchandise that we or our competitors offer;
|
|
•
|
our ability to expand and maintain appealing Exclusive Brands and exclusive-to-Stitch Fix merchandise;
|
|
•
|
the price at which we are able to offer our merchandise;
|
|
•
|
the speed and cost at which we can deliver merchandise to our clients and the ease with which they can use our services to return merchandise; and
|
|
•
|
anticipating and quickly responding to changing apparel trends and consumer shopping preferences.
|
Many of our current competitors have, and potential competitors may have, longer operating histories, larger fulfillment infrastructures, greater technical capabilities, faster shipping times, lower-cost shipping, larger databases, more purchasing power, higher profiles, greater financial, marketing, institutional and other resources and larger customer bases than we do. These factors may allow our competitors to derive greater revenue and profits from their existing customer bases, acquire customers at lower costs or respond more quickly than we can to new or emerging technologies, changes in apparel trends and consumer shopping behavior and changes in supply conditions. These competitors may engage in more extensive research and development efforts, enter or expand their presence in the personalized retail market, undertake more far-reaching marketing campaigns and adopt more aggressive pricing policies, which may allow them to build larger customer bases or generate revenue from their existing customer bases more effectively than we do. If we fail to execute on any of the above better than our competitors, our operating results may be adversely affected.
If we are unable to develop and introduce new merchandise offerings or expand into new markets in a timely and cost-effective manner, our business, financial condition and operating results could be negatively impacted.
The largest portion of our revenue today comes from the sale of Women’s apparel. From 2015 to 2017, we expanded our merchandise offering into categories including Petite, Maternity, Men’s and Plus, began offering different product types including shoes and accessories and expanded the number of brands we offer. In 2018, we also launched our Premium Brands, Extras and Kids offerings. In October 2018, we announced our intention to enter the UK market. We continue to explore additional offerings to serve our existing clients, attract new clients and expand our geographic scope.
New offerings may not have the same success, or gain traction as quickly, as our current offerings. If the merchandise we offer is not accepted by our clients or does not attract new clients, or if we are not able to attract clients in new markets such as the UK, our sales may fall short of expectations, our brand and reputation could be adversely affected and we may incur expenses that are not offset by sales. If the launch of a new category or in a new geography requires investments greater than we expect, our operating results could be adversely affected. Also, our business may be adversely affected if we are unable to attract brands and other merchandise vendors that produce sufficient high quality, appropriately priced and on-trend merchandise. For example, vendors in the UK may not be familiar with our company or brand, which may make it difficult for us to obtain the merchandise we seek or be able to purchase products at an appropriate price.
12
Our current merchandise offerings have a range of margin profiles and we believe new offerings will also have a broad range of margin profiles that will affect our operating results. New businesses generally contribute lower margins and imported merchandise may be subject to tariffs or duties that lower margins. Additionally, as we enter into new categories and markets, we may not have as high of purchasing power as we do in our current offerings, which could increase our costs of goods sold and further reduce our margins. Expansion of our merchandise offerings and geographic scope may also strain our management and operational resources, specifically the need to hire and manage additional merchandise buyers to source new merchandise and to allocate new categories across our distribution network. We may also face greater competition in specific categories or regions from companies that are more focused on these areas. For example, when we launch in the UK, we will compete with existing businesses that have been providing similar services in the region and may be more familiar with trends and customer preferences in that market. Also, our recent entry into the Kids’ category means we now compete with a number of additional companies that have been in the Kids’ category for a longer period of time and may have more experience in children’s clothing. If any of the above were to occur, it could damage our reputation, limit our growth and have an adverse effect on our operating results.
Expansion of our operations internationally will require management attention and resources, involves additional risks and may be unsuccessful.
In October 2018, we announced plans to enter the UK market, and we may choose to expand to other international markets in the future. We have no experience with operating internationally or selling our merchandise outside of the United States, and when we expand internationally we will need to adapt to different local cultures, standards, laws and policies. The business model we employ and the merchandise we currently offer may not appeal to consumers outside of the United States. Furthermore, to succeed with clients in international locations, such as the UK, we will need to locate fulfillment centers in foreign markets and hire local employees, and we will have to invest in these facilities and employees before proving we can successfully run foreign operations. We may not be successful in expanding into international markets or in generating revenue from foreign operations for a variety of reasons, including:
|
•
|
localization of our merchandise offerings, including translation into foreign languages and adaptation for local practices;
|
|
•
|
different consumer demand dynamics, which may make our model and the merchandise we offer less successful compared to the United States;
|
|
•
|
competition from local incumbents that understand the local market and may operate more effectively;
|
|
•
|
regulatory requirements, taxes, trade laws, trade sanctions and economic embargoes, tariffs, export quotas, custom duties or other trade restrictions or any unexpected changes thereto;
|
|
•
|
laws and regulations regarding anti-bribery and anti-corruption compliance;
|
|
•
|
differing labor regulations where labor laws may be more advantageous to employees as compared to the United States and result in increased labor costs;
|
|
•
|
more stringent regulations relating to privacy and data security and access to, or use of, commercial and personal information, particularly in Europe;
|
|
•
|
changes in a specific country’s or region’s political or economic conditions; and
|
|
•
|
risks resulting from changes in currency exchange rates.
|
If we invest substantial time and resources to establish and expand our operations internationally and are unable to do so successfully and in a timely manner, our operating results would suffer.
We may not be able to sustain our revenue growth rate and we may not be profitable in the future.
Our recent revenue growth and past profitability should not be considered indicative of our future performance. Our rate of revenue growth has varied in recent periods. Specifically, our revenue increased by
25.5%
in
2018
compared to
2017
,
33.8%
in
2017
from
2016
, and
113.0%
in
2016
from
2015
. As we grow our business, our revenue growth rates may slow in future periods due to a number of reasons, which may include slowing demand for our merchandise and service, increasing competition, a decrease in the growth rate of our overall market and our failure to capitalize on growth opportunities, as well as the maturation of our business.
Moreover, our expenses have increased in recent periods, and we expect expenses to increase substantially in the near term, particularly as we make significant investments in our marketing initiatives, expand our geographic markets, operations and infrastructure, develop and introduce new merchandise offerings and hire additional personnel. We may not always pursue short-term profits but are often focused on long-term growth, which may impact our financial results. In addition, in connection with operating as a public company, we are incurring additional significant legal, accounting and other expenses that we did not incur as a private company. If our revenue does not increase to offset increases in our operating expenses, we may not be profitable in future periods.
We must successfully gauge apparel trends and changing consumer preferences.
Our success is, in large part, dependent upon our ability to identify apparel trends, predict and gauge the tastes of our clients and provide a service that satisfies client demand in a timely manner. However, lead times for many of our purchasing decisions may make it difficult
13
for us to respond rapidly to new or changing apparel trends or client acceptance of merchandise chosen by our merchandising buyers. We generally enter into purchase contracts significantly in advance of anticipated sales and frequently before apparel trends are confirmed by client purchases. In the past, we have not always predicted our clients’ preferences and acceptance levels of our merchandise with accuracy. Further, we use our data science to predict our clients’ preferences and gauge demand for our merchandise, and there is no guarantee that our data science and algorithms will accurately anticipate client demand and tastes. Our planned entry into the UK will also require us to become familiar with different apparel trends and customer preferences. In addition, consumer shopping behavior may continue to evolve and we may need to adapt our service to such changes. To the extent we misjudge the market for the service we offer or fail to execute on trends and deliver attractive merchandise to clients, our sales will decline and our operating results will be adversely affected.
If we are unable to manage our inventory effectively, our operating results could be adversely affected.
To ensure timely delivery of merchandise, we generally enter into purchase contracts well in advance of a particular season and often before apparel trends are confirmed by client purchases. As a result, we are vulnerable to demand and pricing shifts and to suboptimal selection and timing of merchandise purchases
.
In the past, we have not always predicted our clients’ preferences and acceptance levels of our trend items with accuracy, which has resulted in significant inventory write offs and lower gross margins. Furthermore, we do not use the same liquidation methods as traditional retailers, such as markdowns. We rely on our merchandising team to order styles and products that our clients will purchase and we rely on our data science to inform the levels of inventory we purchase, including when to reorder items that are selling well and when to write off items that are not selling well. If our merchandise team does not predict client demand and tastes well or if our algorithms do not help us reorder the right products or write off the right products timely, we may not effectively manage our inventory and our operating results could be adversely affected.
Our business depends on a strong brand and we may not be able to maintain our brand and reputation.
We believe that maintaining the Stitch Fix brand and reputation is critical to driving client engagement and attracting clients and merchandise vendors. Building our brand will depend largely on our ability to continue to provide our clients with valued personal styling services and high-quality merchandise, which we may not do successfully. Client complaints or negative publicity about our styling services, merchandise, delivery times or client support, especially on social media platforms, could harm our reputation and diminish client use of our services, the trust that our clients place in Stitch Fix and vendor confidence in us.
Our brand depends in part on effective client support, which requires significant personnel expense. Failure to manage or train our client support representatives properly or inability to handle client complaints effectively could negatively affect our brand, reputation and operating results.
If we fail to cost-effectively promote and maintain the Stitch Fix brand, our business, financial condition and operating results may be adversely affected.
If we fail to attract and retain key personnel, effectively manage succession or hire, develop and motivate our employees, our business, financial condition and operating results could be adversely affected.
Our success, including our ability to anticipate and effectively respond to changing style trends and deliver a personalized styling experience, depends in part on our ability to attract and retain key personnel on our executive team and in our merchandising, algorithms, engineering, marketing, styling and other organizations.
We do not have long-term employment or non-competition agreements with any of our personnel. Senior employees have left Stitch Fix in the past and others may in the future, which we cannot necessarily anticipate and whom we may not be able to promptly replace. The loss of one or more of our key personnel or the inability to promptly identify a suitable successor to a key role could have an adverse effect on our business. In particular, our Founder and Chief Executive Officer has unique and valuable experience leading our company from its inception through today. If she were to depart or otherwise reduce her focus on Stitch Fix, our business may be disrupted. We do not currently maintain key-person life insurance policies on any member of our senior management team and other key employees.
We also face significant competition for personnel, particularly in the San Francisco Bay Area where our headquarters are located. To attract top talent, we have had to offer, and believe we will need to continue to offer, competitive compensation and benefits packages before we can validate the productivity of those employees. We may also need to increase our employee compensation levels in response to competition. We cannot be sure that we will be able to attract, retain and motivate a sufficient number of qualified personnel in the future, or that the compensation costs of doing so will not adversely affect our operating results. Additionally, we may not be able to hire new employees quickly enough to meet our needs. If we fail to effectively manage our hiring needs or successfully integrate new hires, our efficiency, ability to meet forecasts and maintain employee morale, productivity and retention could suffer, which may have an adverse effect on our business, financial condition and operating results.
If we fail to effectively manage our stylists, our business, financial condition and operating results could be adversely affected.
More than
3,900
of our employees are stylists, who work remotely and on a part-time basis for us and are paid hourly. They track and report the time they spend working for us. These employees are classified as nonexempt under federal and state law. If we fail to effectively manage our stylists, including by ensuring accurate tracking and reporting of their hours worked and proper processing of their hourly wages, then we may face claims alleging violations of wage and hour employment laws, including, without limitation, claims of back
14
wages, unpaid overtime pay and missed meal and rest periods. Any such employee litigation could be attempted on a class or representative basis. Such litigation can be expensive and time-consuming regardless of whether the claims against us are valid or whether we are ultimately determined to be liable, and could divert management’s attention from our business. We could also be adversely affected by negative publicity, litigation costs resulting from the defense of these claims and the diversion of time and resources from our operations.
Our business, including our costs and supply chain, is subject to risks associated with sourcing, manufacturing and warehousing.
We currently source nearly all of the merchandise we offer from third-party vendors, many of whom use manufacturers in the same geographic region, and as a result we may be subject to price fluctuations or demand disruptions. Our operating results would be negatively impacted by increases in the cost of our merchandise, and we have no guarantees that costs will not rise. In addition, as we expand into new categories, product types and geographies, we expect that we may not have strong purchasing power in these new areas, which could lead to higher costs than we have historically seen in our current categories. We may not be able to pass increased costs on to clients, which could adversely affect our operating results.
The fabrics used by our vendors are made of raw materials including petroleum-based products and cotton. Significant price fluctuations or shortages in petroleum, cotton or other raw materials could significantly increase our cost of goods sold. Moreover, in the event of a significant disruption in the supply of the fabrics or raw materials used in the manufacture of the merchandise we offer, our vendors might not be able to locate alternative suppliers of materials of comparable quality at an acceptable price. For example, natural disasters have in the past increased raw material costs, impacting pricing with certain of our vendors, and caused shipping delays for certain of our merchandise. In addition, the labor costs to produce our products may fluctuate. Any delays, interruption, damage to or increased costs in the manufacture of the merchandise we offer could result in higher prices to acquire the merchandise, or non-delivery of merchandise altogether, and could adversely affect our operating results.
In addition, we cannot guarantee that merchandise we receive from vendors will be of sufficient quality or free from damage, or that such merchandise will not be damaged during shipping, while stored in one of our fulfillment centers or when returned by customers. While we take measures to ensure merchandise quality and avoid damage, including evaluating vendor product samples, conducting inventory inspections and inspecting returned product, we cannot control merchandise while it is out of our possession or prevent all damage while in our fulfillment centers. We may incur additional expenses and our reputation could be harmed if clients and potential clients believe that our merchandise is not of high quality or may be damaged.
If we are unable to acquire new merchandise vendors or retain existing merchandise vendors, our operating results may be harmed.
We offer merchandise from hundreds of established and emerging brands. In order to continue to attract and retain quality merchandise brands, we must help merchandise vendors increase their sales and offer them a high-quality, cost-effective fulfillment process.
If we do not continue to acquire new merchandise vendors or retain our existing merchandise vendors on acceptable commercial terms, we may not be able to maintain a broad selection of products for our clients, and our operating results may suffer.
In addition, our Exclusive Brands are sourced from third-party vendors and contract manufacturers. The loss of one of our Exclusive Brand vendors, or our inability to source any additional vendors needed for our Exclusive Brands, could require us to source Exclusive Brand merchandise from another vendor or manufacturer, which could cause inventory delays, impact our clients’ experiences and otherwise harm our operating results.
Any failure by us or our vendors to comply with product safety, labor or other laws, or our standard vendor terms and conditions, or to provide safe factory conditions for our or their workers, may damage our reputation and brand and harm our business.
The merchandise we sell to our clients is subject to regulation by the Federal Consumer Product Safety Commission, the Federal Trade Commission and similar state and international regulatory authorities. As a result, such merchandise could in the future be subject to recalls and other remedial actions. Product safety, labeling and licensing concerns may result in us voluntarily removing selected merchandise from our inventory. Such recalls or voluntary removal of merchandise can result in, among other things, lost sales, diverted resources, potential harm to our reputation and increased client service costs and legal expenses, which could have a material adverse effect on our operating results. Our entry into children’s clothing with Stitch Fix Kids also requires us to comply with additional product safety, labeling and other regulations and requirements, which result in increased operational and compliance costs and may adversely affect our operating results.
Some of the merchandise we sell may expose us to product liability claims and litigation or regulatory action relating to personal injury or environmental or property damage. Although we maintain liability insurance, we cannot be certain that our coverage will be adequate for liabilities actually incurred or that insurance will continue to be available to us on economically reasonable terms or at all. In addition, some of our agreements with our vendors may not indemnify us from product liability for a particular vendor’s merchandise or our vendors may not have sufficient resources or insurance to satisfy their indemnity and defense obligations.
We purchase our merchandise from numerous domestic and international vendors. Our standard vendor terms and conditions require vendors to comply with applicable laws. We have hired independent firms that conduct audits of the working conditions at the factories producing our Exclusive Brand products. If an audit reveals potential problems, we require that the vendor institute corrective action plans to bring the factory into compliance with our standards, or we may discontinue our relationship with the vendor. Failure of our vendors to comply with applicable laws and regulations and contractual requirements could lead to litigation against us, resulting in
15
increased legal expenses and costs. In addition, the failure of any such vendors to provide safe and humane factory conditions and oversight at their facilities could damage our reputation with clients or result in legal claims against us.
We may incur significant losses from fraud.
We have in the past incurred and may in the future incur losses from various types of fraud, including stolen credit card numbers, claims that a client did not authorize a purchase, merchant fraud and clients who have closed bank accounts or have insufficient funds in open bank accounts to satisfy payments. In addition to the direct costs of such losses, if the fraud is related to credit card transactions and becomes excessive, it could result in us paying higher fees or losing the right to accept credit cards for payment. In addition, under current credit card practices, we are typically liable for fraudulent credit card transactions. Our failure to adequately prevent fraudulent transactions could damage our reputation, result in litigation or regulatory action and lead to expenses that could substantially impact our operating results.
We are subject to payment-related risks.
We accept payments online via credit and debit cards, which subjects us to certain regulations and fraud, and we may in the future offer new payment options to clients that would be subject to additional regulations and risks. We pay interchange and other fees in connection with credit card payments, which may increase over time and adversely affect our operating results. While we use a third party to process payments, we are subject to payment card association operating rules and certification requirements, including the Payment Card Industry Data Security Standard and rules governing electronic funds transfers. If we fail to comply with applicable rules and regulations, we may be subject to fines or higher transaction fees and may lose our ability to accept online payments or other payment card transactions. If any of these events were to occur, our business, financial condition and operating results could be adversely affected.
System interruptions that impair client access to our website or other performance failures in our technology infrastructure could damage our business.
The satisfactory performance, reliability and availability of our website, mobile application, internal applications and technology infrastructure are critical to our business. We rely on our website and mobile application to engage with our clients and sell them merchandise. We also rely on a host of internal custom-built applications to run critical business functions, such as styling, merchandise purchasing, warehouse operations and order fulfillment. In addition, we rely on a variety of third-party, cloud-based solution vendors for key elements of our technology infrastructure. These systems are vulnerable to damage or interruption and we have experienced interruptions in the past. For example, in February 2017, as a result of an outage with Amazon Web Services, where much of our technology infrastructure is hosted, we experienced disruptions in applications that support our warehouse operations and order fulfillment that caused a temporary slowdown in the number of Fix shipments we were able to make. Interruptions may be caused by a variety of incidents, including human error, our failures to update or improve our proprietary systems, cyber attacks, fire, flood, power loss or telecommunications failures. Any failure or interruption of our website, mobile application, internal business applications or our technology infrastructure could harm our ability to serve our clients, which would adversely affect our business and operating results.
Our use of personal information and other data subjects us to privacy laws and obligations, and our failure to comply with such obligations could harm our business.
We collect and maintain significant amounts of personal information and other data relating to our clients and employees. Numerous laws, rules and regulations in the United States and internationally, including the EU’s General Data Protection Regulation, or the GDPR, govern privacy and the collection, use and protection of personal information. These laws, rules and regulations evolve frequently and may be inconsistent from one jurisdiction to another or may be interpreted to conflict with our practices. Any failure or perceived failure by us or any third parties with which we do business to comply with these laws, rules and regulations, or with other obligations to which we may be or become subject, may result in actions against us by governmental entities, private claims and litigation, fines, penalties or other liabilities. Any such action would be expensive to defend, damage our reputation and adversely affect our business and operating results. For example, in May 2018, the GDPR went into effect in the EU. The GDPR imposed more stringent data protection requirements and provides greater penalties for noncompliance than previous data protection laws. Further, following a referendum in June 2016 in which voters in the UK approved an exit from the EU, the UK government has initiated a process to leave the EU, or Brexit. Brexit has created uncertainty with regard to the regulation of data protection in the UK. In particular, it is uncertain whether the UK will enact data protection laws or regulations designed to be consistent with the GDPR and how data transfers to and from the UK will be regulated. Similarly, in June 2018, the State of California legislature passed the California Consumer Privacy Act of 2018, or CCPA, which would require us to make new disclosures to consumers about our data collection, use and sharing practices. The CCPA also allows consumers to opt out of certain data sharing with third parties, and provides a new cause of action for data breaches. As currently enacted, the act takes effect on January 1, 2020. Additionally, the Federal Trade Commission and many state attorneys general are interpreting federal and state consumer protection laws as imposing standards for the online collection, use, dissemination and security of data.
16
Unfavorable changes or failure by us to comply with evolving internet and eCommerce regulations could substantially harm our business and operating results.
We are subject to general business regulations and laws as well as regulations and laws specifically governing the internet and eCommerce. These regulations and laws may involve taxes, privacy and data security, consumer protection, the ability to collect and/or share necessary information that allows us to conduct business on the internet, marketing communications and advertising, content protection, electronic contracts or gift cards. Furthermore, the regulatory landscape impacting internet and eCommerce businesses is constantly evolving. For example, in 2010, California’s Automatic Renewal Law went into effect, requiring companies to adhere to enhanced disclosure requirements when entering into automatically renewing contracts with consumers. As a result, a wave of consumer class action lawsuits was brought against companies that offer online products and services on a subscription or recurring basis. Any failure, or perceived failure, by us to comply with any of these laws or regulations could result in damage to our reputation, lost business and proceedings or actions against us by governmental entities or others, which could impact our operating results.
Material weaknesses in our internal control over financial reporting may cause us to fail to timely and accurately report our financial results or result in a material misstatement of our financial statements.
As of
July 28, 2018
, we had a material weakness in our internal control over financial reporting, as defined in the standards established by the Sarbanes-Oxley Act of 2002, (the “Sarbanes-Oxley Act”). A material weakness is a deficiency, or a combination of deficiencies, in internal control over financial reporting such that there is a reasonable possibility that a material misstatement of our financial statements will not be prevented or detected on a timely basis.
The material weakness identified in our internal control over financial reporting primarily related to our accounting and proprietary systems used in our financial reporting process not having the proper level of controls. Specifically, our systems lacked controls over access, program change management and computer operations that are needed to ensure access to financial data is adequately restricted to appropriate personnel. As a result of this material weakness, we have initiated and will continue to implement remediation measures including, but not limited to, engaging external consultants to conduct a review of processes that involve financial data within our accounting and proprietary systems. This review, which is ongoing, includes the identification of potential risks, documentation of processes and recommendations for improvements.
We are still in the process of completing the remediation of the material weakness related to our accounting and proprietary systems. However, we cannot assure you that the steps we are taking will be sufficient to remediate our material weakness or prevent future material weaknesses or significant deficiencies from occurring.
If we identify future material weaknesses in our internal controls over financial reporting or fail to meet the demands placed upon us as a public company, including the requirements of the Sarbanes-Oxley Act, we may be unable to accurately report our financial results or report them within the timeframes required by law or stock exchange regulations. Failure to comply with Section 404 of the Sarbanes-Oxley Act could also potentially subject us to sanctions or investigations by the SEC or other regulatory authorities. If additional material weaknesses exist or are discovered in the future, and we are unable to remediate any such material weakness, our reputation, financial condition and operating results could suffer.
Shipping is a critical part of our business and any changes in our shipping arrangements or any interruptions in shipping could adversely affect our operating results.
We currently rely on two major vendors for our shipping. If we are not able to negotiate acceptable pricing and other terms with these entities or they experience performance problems or other difficulties, it could negatively impact our operating results and our clients’ experience. In addition, our ability to receive inbound inventory efficiently and ship merchandise to clients may be negatively affected by inclement weather, fire, flood, power loss, earthquakes, labor disputes, acts of war or terrorism and similar factors. For example, strikes at major international shipping ports have in the past impacted our supply of inventory from our vendors. In addition, as a result of Hurricane Harvey in September 2017, one of our shipping vendors was unable to deliver Fixes to certain affected areas for several weeks, resulting in delivery delays and Fix cancellations. We are also subject to risks of damage or loss during delivery by our shipping vendors. If our merchandise is not delivered in a timely fashion or is damaged or lost during the delivery process, our clients could become dissatisfied and cease using our services, which would adversely affect our business and operating results.
Our operating results could be adversely affected by natural disasters, public health crises, political crises or other catastrophic events.
Our principal offices and one of our fulfillment centers are located in the San Francisco Bay Area, which has a history of earthquakes, and are thus vulnerable to damage. We also operate offices and fulfillment centers in other regions. Natural disasters, such as earthquakes, hurricanes, tornadoes, floods and other adverse weather and climate conditions; unforeseen public health crises, such as pandemics and epidemics; political crises, such as terrorist attacks, war and other political instability; or other catastrophic events, whether occurring in the United States or internationally, could disrupt our operations in any of our offices and fulfillment centers or the operations of one or more of our third-party providers or vendors. In particular, these types of events could impact our merchandise supply chain, including our ability to ship merchandise to clients from or to the impacted region, and could impact our ability or the ability of third parties to operate our sites and ship merchandise. In addition, these types of events could negatively impact consumer spending in the impacted regions. To the extent any of these events occur, our business and operating results could be adversely affected.
17
If we cannot successfully protect our intellectual property, our business would suffer.
We rely on trademark, copyright, trade secrets, patents, confidentiality agreements and other practices to protect our brands, proprietary information, technologies and processes. Our principal trademark assets include the registered trademarks "Stitch Fix" and "Fix," multiple private label clothing and accessory brand names and our logos and taglines. Our trademarks are valuable assets that support our brand and consumers’ perception of our services and merchandise. We also hold the rights to the "stitchfix.com" internet domain name and various other related domain names, which are subject to internet regulatory bodies and trademark and other related laws of each applicable jurisdiction. If we are unable to protect our trademarks or domain names in the United States, the UK or in other jurisdictions in which we may ultimately operate, our brand recognition and reputation would suffer, we would incur significant expense establishing new brands and our operating results would be adversely impacted.
We currently have one patent issued and six patent applications pending in the United States. We also have four patent applications filed in the People’s Republic of China. The patent we own and those that may be issued in the future may not provide us with any competitive advantages or may be challenged by third parties, and our patent applications may never be granted. Even if issued, there can be no assurance that these patents will adequately protect our intellectual property or survive a legal challenge, as the legal standards relating to the validity, enforceability and scope of protection of patent and other intellectual property rights are uncertain. Our limited patent protection may restrict our ability to protect our technologies and processes from competition. We primarily rely on trade secret laws to protect our technologies and processes, including the algorithms we use throughout our business. Others may independently develop the same or similar technologies and processes, or may improperly acquire and use information about our technologies and processes, which may allow them to provide a service similar to ours, which could harm our competitive position.
We may be required to spend significant resources to monitor and protect our intellectual property rights, and the efforts we take to protect our proprietary rights may not be sufficient.
We may be accused of infringing intellectual property rights of third parties.
We are also at risk of claims by others that we have infringed their copyrights, trademarks or patents, or improperly used or disclosed their trade secrets. The costs of supporting any litigation or disputes related to these claims can be considerable, and we cannot assure you that we will achieve a favorable outcome of any such claim. If any such claims are valid, we may be compelled to cease our use of such intellectual property and pay damages, which could adversely affect our business. Even if such claims are not valid, defending them could be expensive and distracting, adversely affecting our operating results.
We could be required to collect additional sales taxes or be subject to other tax liabilities that may increase the costs our clients would have to pay for our offering and adversely affect our operating results.
In general, we have not historically collected state or local sales, use or other similar taxes in any jurisdictions in which we do not have a tax nexus, in reliance on court decisions or applicable exemptions that restrict or preclude the imposition of obligations to collect such taxes with respect to online sales of our products. In addition, we have not historically collected state or local sales, use or other similar taxes in certain jurisdictions in which we do have a physical presence, in reliance on applicable exemptions. On June 21, 2018, the U.S. Supreme Court decided, in
South Dakota v. Wayfair, Inc.
, that state and local jurisdictions may, at least in certain circumstances, enforce a sales and use tax collection obligation on remote vendors that have no physical presence in such jurisdiction. A number of states have already begun, or have positioned themselves to begin, requiring sales and use tax collection by remote vendors and/or by online marketplaces. The details and effective dates of these collection requirements vary from state to state. We are in the process of determining how and when our collection practices will need to change in the relevant jurisdictions. It is possible that one or more jurisdictions may assert that we have liability for periods for which we have not collected sales, use or other similar taxes, and if such an assertion or assertions were successful it could result in substantial tax liabilities, including for past sales taxes and penalties and interest, which could materially adversely affect our business, financial condition and operating results
.
Federal income tax reform could have unforeseen effects on our financial condition and results of operations
.
The Tax Cuts and Jobs Act, or the Tax Act, was enacted on December 22, 2017, and contains many significant changes to U.S. federal tax laws. The Tax Act requires complex computations that were not previously provided for under U.S. tax law. We have provided for an estimated effect of the Tax Act in our financial statements. The Tax Act requires significant judgments to be made in interpretation of the law and significant estimates in the calculation of the provision for income taxes. However, additional guidance may be issued by the Internal Revenue Service, or IRS, the Department of the Treasury, or other governing body that may significantly differ from our interpretation of the law, which may result in a material adverse effect on our business, cash flow, results of operations or financial conditions. As we complete our analysis of the Tax Act, we may make adjustments to provisional amounts that we have recorded that may materially impact our provision for income taxes and effective tax rate in the period in which the adjustments are made.
We may be subject to additional tax liabilities, which could adversely affect our operating results.
We are subject to income- and non-income-based taxes in the United States
under federal, state and local jurisdictions. The governing tax laws and applicable tax rates vary by jurisdiction and are subject to interpretation, which
tax authorities may disagree with upon review or audit across open examination periods. Various tax authorities may disagree with tax positions we take and if any such tax authority were to successfully challenge one or more of our tax positions, the results could have a material effect on our operating results
18
Further, the ultimate amount of tax payable in a given financial statement period may be materially impacted by sudden or unforeseen changes in tax laws, changes in the mix and level of earnings by taxing jurisdictions, or changes to existing accounting rules or regulations. For example, on July 24, 2018, the Ninth Circuit Court of Appeals issued an opinion in
Altera Corp. v. Commissioner
requiring related parties in an intercompany cost-sharing arrangement to share expenses related to stock-based compensation. On August 7, 2018, the opinion was withdrawn to allow time for a reconstituted panel to confer. We are monitoring this case and any impact the final opinion could have on our financial statements.
The determination of our overall provision for income and other taxes is inherently uncertain as it requires significant judgment around complex transactions and calculations. As a result, fluctuations in our ultimate tax obligations may differ materially from amounts recorded in our financial statements and could adversely affect our business, financial condition and operating results in the periods for which such determination is made
.
Changes in U.S. tax or tariff policy regarding apparel produced in other countries could adversely affect our business.
A predominant portion of the apparel we sell is originally manufactured in countries other than the United States. The U.S. government has at times indicated a willingness to significantly change existing trade policies. This exposes us to risks of disruption and cost increases in our established patterns for sourcing our merchandise, and creates increased uncertainties in planning our sourcing strategies and forecasting our margins. Changes in U.S. tariffs, quotas, trade relationships or tax provisions could reduce the supply of goods available to us or increase our cost of goods. Although such changes would have implications across the entire industry, we may fail to effectively adapt and to manage the adjustments in strategy that would be necessary in response to those changes. In addition to the general uncertainty and overall risk from potential changes in U.S. laws and policies, as we make business decisions in the face of uncertainty as to potential changes, we may incorrectly anticipate the outcomes, miss out on business opportunities or fail to effectively adapt our business strategies and manage the adjustments that are necessary in response to those changes. These risks could adversely affect our revenues, reduce our profitability and negatively impact our business.
We may require additional capital to support business growth, and this capital might not be available or may be available only by diluting existing stockholders.
We intend to continue making investments to support our business growth and may require additional funds to support this growth and respond to business challenges, including the need to develop our services, expand our inventory, enhance our operating infrastructure, expand the markets in which we operate and potentially acquire complementary businesses and technologies. Accordingly, we may need to engage in equity or debt financings to secure additional funds. If we raise additional funds through further issuances of equity or convertible debt securities, our existing stockholders could suffer significant dilution, and any new equity securities we issue could have rights, preferences and privileges superior to those of holders of our Class A common stock. Any debt financing secured by us in the future could involve restrictive covenants relating to our capital-raising activities and other financial and operational matters, which may make it more difficult for us to obtain additional capital and to pursue business opportunities. In addition, we may not be able to obtain additional financing on terms favorable to us, if at all. If we are unable to obtain adequate financing or financing on terms satisfactory to us, when we require it, our ability to continue to support our business growth and to respond to business challenges could be significantly limited, and our business and prospects could fail or be adversely affected.
Our failure to adequately and effectively staff our fulfillment centers, through third parties or with our own employees, could adversely affect our client experience and operating results.
We currently receive and distribute merchandise at five fulfillment centers in the United States, one of which is operated by a third party. We also intend to open a sixth fulfillment center in the UK in connection with our entry into the UK market, which will be operated by the same third party that we use in the United States. If we or our third-party partner are unable to adequately staff our fulfillment centers to meet demand or if the cost of such staffing is higher than historical or projected costs due to mandated wage increases, regulatory changes, international expansion or other factors, our operating results could be harmed. In addition, operating fulfillment centers comes with potential risks, such as workplace safety issues and employment claims for the failure or alleged failure to comply with labor laws or laws respecting union organizing activities. Furthermore, if we fail to comply with wage and hour laws for our nonexempt employees, many of whom work in our fulfillment centers, we could be subject to legal risk, including claims for back wages, unpaid overtime pay and missed meal and rest periods, which could be on a class or representative basis. Any such issues may result in delays in shipping times, reduced packing quality or costly litigation, and our reputation and operating results may be harmed.
By using a third-party operator for some of our fulfillment centers, we also face additional risks associated with not having complete control over operations at those fulfillment centers. Any deterioration in the financial condition or operations of that third party, or the loss of the relationship with that third party, would have significant impact on our operations.
Some of our software and systems contain open source software, which may pose particular risks to our proprietary applications.
We use open source software in the applications we have developed to operate our business and will use open source software in the future. We may face claims from third parties demanding the release or license of the open source software or derivative works that we developed from such software (which could include our proprietary source code) or otherwise seeking to enforce the terms of the applicable open source license. These claims could result in litigation and could require us to purchase a costly license, publicly release the affected portions of our source code or cease offering the implicated solutions unless and until we can re-engineer them to avoid infringement. In addition, our use of open source software may present additional security risks because the source code for open source software is
19
publicly available, which may make it easier for hackers and other third parties to determine how to breach our website and systems that rely on open source software. Any of these risks could be difficult to eliminate or manage and, if not addressed, could have an adverse effect on our business and operating results.
Adverse litigation judgments or settlements resulting from legal proceedings in which we may be involved could expose us to monetary damages or limit our ability to operate our business.
We have in the past and may in the future become involved in private actions, collective actions, investigations and various other legal proceedings by clients, employees, suppliers, competitors, government agencies or others. The results of any such litigation, investigations and other legal proceedings are inherently unpredictable and expensive. Any claims against us, whether meritorious or not, could be time consuming, result in costly litigation, damage our reputation, require significant amounts of management time and divert significant resources. If any of these legal proceedings were to be determined adversely to us, or we were to enter into a settlement arrangement, we could be exposed to monetary damages or limits on our ability to operate our business, which could have an adverse effect on our business, financial condition and operating results.
If we are unable to make acquisitions and investments, or successfully integrate them into our business, our business could be harmed.
As part of our business strategy, we may acquire other companies or businesses. However, we may not be able to find suitable acquisition candidates, and we may not be able to complete acquisitions on favorable terms, if at all. Acquisitions involve numerous risks, any of which could harm our business and negatively affect our operating results, including:
|
•
|
difficulties in integrating the technologies, operations, existing contracts and personnel of an acquired company;
|
|
•
|
difficulties in supporting and transitioning clients and suppliers, if any, of an acquired company;
|
|
•
|
diversion of financial and management resources from existing operations or alternative acquisition opportunities;
|
|
•
|
failure to realize the anticipated benefits or synergies of a transaction;
|
|
•
|
failure to identify all of the problems, liabilities or other shortcomings or challenges of an acquired company or technology, including issues related to intellectual property, regulatory compliance practices, revenue recognition or other accounting practices, or employee or client issues;
|
|
•
|
risks of entering new markets in which we have limited or no experience;
|
|
•
|
potential loss of key employees, clients, vendors and suppliers from either our current business or an acquired company’s business;
|
|
•
|
inability to generate sufficient revenue to offset acquisition costs;
|
|
•
|
additional costs or equity dilution associated with funding the acquisition; and
|
|
•
|
possible write-offs or impairment charges relating to acquired businesses.
|
Risks Relating to Ownership of Our Class A Common Stock
The market price of our Class A common stock may be volatile or may decline steeply or suddenly regardless of our operating performance and we may not be able to meet investor or analyst expectations. You may lose all or part of your investment.
The market price of our Class A common stock may fluctuate or decline significantly in response to numerous factors, many of which are beyond our control, including:
|
•
|
actual or anticipated fluctuations in our client base, the level of client engagement, revenue or other operating results;
|
|
•
|
variations between our actual operating results and the expectations of securities analysts, investors and the financial community;
|
|
•
|
any forward-looking financial or operating information we may provide to the public or securities analysts, any changes in this information or our failure to meet expectations based on this information;
|
|
•
|
actions of securities analysts who initiate or maintain coverage of us, changes in financial estimates by any securities analysts who follow our company or our failure to meet these estimates or the expectations of investors;
|
|
•
|
whether investors or securities analysts view our stock structure unfavorably, particularly our dual-class structure and the significant voting control of our executive officers, directors and their affiliates;
|
|
•
|
additional shares of our Class A common stock being sold into the market by us or our existing stockholders, or the anticipation of such sales;
|
|
•
|
announcements by us or our competitors of significant products or features, technical innovations, acquisitions, strategic partnerships, joint ventures or capital commitments;
|
20
|
•
|
changes in operating performance and stock market valuations of companies in our industry, including our vendors and competitors;
|
|
•
|
price and volume fluctuations in the overall stock market, including as a result of trends in the economy as a whole;
|
|
•
|
lawsuits threatened or filed against us;
|
|
•
|
developments in new legislation and pending lawsuits or regulatory actions, including interim or final rulings by judicial or regulatory bodies; and
|
|
•
|
other events or factors, including those resulting from war or incidents of terrorism, or responses to these events.
|
In addition, extreme price and volume fluctuations in the stock markets have affected and continue to affect many eCommerce and other technology companies’ stock prices. Often, their stock prices have fluctuated in ways unrelated or disproportionate to the companies’ operating performance. In the past, stockholders have filed securities class action litigation following periods of market volatility. If we were to become involved in securities litigation, it could subject us to substantial costs, divert resources and the attention of management from our business and seriously harm our business.
Moreover, because of these fluctuations, comparing our operating results on a period-to-period basis may not be meaningful. You should not rely on our past results as an indication of our future performance. This variability and unpredictability could also result in our failing to meet the expectations of industry or financial analysts or investors for any period. If our revenue or operating results fall below the expectations of analysts or investors or below any forecasts we may provide to the market, or if the forecasts we provide to the market are below the expectations of analysts or investors, the price of our Class A common stock could decline substantially. Such a stock price decline could occur even when we have met any previously publicly stated revenue or earnings forecasts that we may provide.
An active trading market for our Class A common stock may not be sustained
.
Our Class A common stock is currently listed on the Nasdaq Global Select Market, or Nasdaq, under the symbol “SFIX” and trades on that market and others. We cannot assure you that an active trading market for our Class A common stock will be sustained. Accordingly, we cannot assure you of the liquidity of any trading market, your ability to sell your shares of our Class A common stock when desired or the prices that you may obtain for your shares.
Future sales of shares by existing stockholders could cause our stock price to decline.
If our existing stockholders sell or indicate an intention to sell, substantial amounts of our Class A common stock in the public market, the trading price of our Class A common stock could decline. In addition, shares underlying any outstanding options and restricted stock units will become eligible for sale if exercised or settled, as applicable, and to the extent permitted by the provisions of various vesting agreements and Rule 144 of the Securities Act. All the shares of Class A and Class B common stock subject to stock options and restricted stock units outstanding and reserved for issuance under our 2011 Equity Incentive Plan, as amended, and our 2017 Incentive Plan have been registered on Form S-8 under the Securities Act and such shares are eligible for sale in the public markets, subject to Rule 144 limitations applicable to affiliates. If these additional shares are sold, or if it is perceived that they will be sold in the public market, the trading price of our Class A common stock could decline.
The dual class structure of our common stock concentrates voting control with our executive officers, directors and their affiliates, and may depress the trading price of our Class A common stock.
Our Class B common stock has ten votes per share and our Class A common stock has one vote per share. As a result, the holders of our Class B common stock, including our directors and executive officers and their affiliates, will be able to exercise considerable influence over matters requiring stockholder approval, including the election of directors and approval of significant corporate transactions, such as a merger or other sale of our company or our assets, even if their stock holdings represent less than 50% of the outstanding shares of our capital stock. This concentration of ownership will limit the ability of other stockholders to influence corporate matters and may cause us to make strategic decisions that could involve risks to you or that may not be aligned with your interests. This control may adversely affect the market price of our Class A common stock.
In addition, in July 2017, FTSE Russell and Standard & Poor’s announced that they would cease to allow most newly public companies utilizing dual or multi-class capital structures to be included in their indices. Affected indices include the Russell 2000 and the S&P 500, S&P MidCap 400 and S&P SmallCap 600, which together make up the S&P Composite 1500. Under the announced policies, our dual class capital structure makes us ineligible for inclusion in any of these indices and, as a result, mutual funds, exchange-traded funds and other investment vehicles that attempt to passively track these indices will not be investing in our stock. These policies are new and it is unclear what effect, if any, they will have on the valuations of publicly traded companies excluded from the indices, but it is possible that they may depress these valuations compared to those of other similar companies that are included.
21
If securities or industry analysts either do not publish research about us or publish inaccurate or unfavorable research about us, our business or our market, or if they change their recommendations regarding our common stock adversely, the trading price or trading volume of our Class A common stock could decline.
The trading market for our Class A common stock is influenced in part by the research and reports that securities or industry analysts may publish about us, our business, our market or our competitors. If one or more of the analysts initiate research with an unfavorable rating or downgrade our Class A common stock, provide a more favorable recommendation about our competitors or publish inaccurate or unfavorable research about our business, our Class A common stock price would likely decline. If any analyst who may cover us were to cease coverage of us or fail to regularly publish reports on us, we could lose visibility in the financial markets, which in turn could cause the trading price or trading volume of our Class A common stock to decline.
We do not currently intend to pay dividends on our Class A common stock and, consequently, your ability to achieve a return on your investment will depend on appreciation of the value of our Class A common stock.
We have never declared or paid cash dividends on our capital stock. We currently intend to retain any future earnings to finance the operation and expansion of our business, and we do not expect to pay any cash dividends on our Class A common stock in the foreseeable future. As a result, any investment return our Class A common stock will depend upon increases in the value for our Class A common stock, which is not certain.
Future securities sales and issuances could result in significant dilution to our stockholders and impair the market price of our Class A common stock.
We may issue additional equity securities in the future. We also issue common stock to our employees and others under our incentive plans. As of
September 27, 2018
,
58,806,498
of our
99,132,928
shares outstanding were held by directors, executive officers and other affiliates. Future issuances of shares of our Class A common stock or the conversion of a substantial number of shares of our Class B common stock, or the perception that these sales or conversions may occur, could depress the market price of our Class A common stock and result in dilution to existing holders of our Class A common stock. Also, to the extent outstanding options to purchase our shares of our Class A or Class B common stock are exercised or options or other stock-based awards are issued or become vested, there will be further dilution. The amount of dilution could be substantial depending upon the size of the issuances or exercises. Furthermore, we may issue additional equity securities that could have rights senior to those of our Class A common stock. As a result, holders of our Class A common stock bear the risk that future issuances of debt or equity securities may reduce the value of our Class A common stock and further dilute their ownership interest.
The requirements of being a public company may strain our resources, result in more litigation and divert management’s attention.
As a public company, we are subject to the reporting requirements of the Securities Exchange Act of 1934, as amended, or the Exchange Act, the Sarbanes-Oxley Act, the Dodd-Frank Wall Street Reform and Consumer Protection Act, or the Dodd-Frank Act, the listing requirements of the Nasdaq and other applicable securities rules and regulations. Complying with these rules and regulations has increased and will continue to increase our legal and financial compliance costs, make some activities more difficult, time consuming or costly and increase demand on our systems and resources. To address these challenges, we recently expanded our finance and accounting teams. The Exchange Act requires, among other things, that we file annual, quarterly and current reports with respect to our business and operating results. The Sarbanes-Oxley Act requires, among other things, that we maintain effective disclosure controls and procedures and internal control over financial reporting. We are required to disclose changes made in our internal control and procedures on a quarterly basis. In order to maintain and, if required, improve our disclosure controls and procedures and internal control over financial reporting to meet this standard, significant resources and management oversight may be required. As a result, management’s attention may be diverted from other business concerns, which could adversely affect our business and operating results. We may need to hire additional employees or engage outside consultants to comply with these requirements, which will increase our costs and expenses.
In addition, changing laws, regulations and standards relating to corporate governance and public disclosure are creating uncertainty for public companies, increasing legal and financial compliance costs and making some activities more time consuming. These laws, regulations and standards are subject to varying interpretations, in many cases due to their lack of specificity, and, as a result, their application in practice may evolve over time as new guidance is provided by regulatory and governing bodies. This could result in continuing uncertainty regarding compliance matters and higher costs necessitated by ongoing revisions to disclosure and governance practices. We intend to invest resources to comply with evolving laws, regulations and standards, and this investment may result in increased general and administrative expenses and a diversion of management’s time and attention from revenue-generating activities to compliance activities. If our efforts to comply with new laws, regulations and standards differ from the activities intended by regulatory or governing bodies due to ambiguities related to their application and practice, regulatory authorities may initiate legal proceedings against us and our business may be adversely affected.
These new rules and regulations may make it more expensive for us to obtain director and officer liability insurance and, in the future, we may be required to accept reduced coverage or incur substantially higher costs to obtain coverage. These factors could also make it more difficult for us to attract and retain qualified members of our board of directors, particularly to serve on our audit committee and compensation committee, and qualified executive officers.
22
By disclosing information in filings required of a public company, our business and financial condition are more visible, which we believe may result in threatened or actual litigation, including by competitors and other third parties. If those claims are successful, our business could be seriously harmed. Even if the claims do not result in litigation or are resolved in our favor, the time and resources needed to resolve them could divert our management’s resources and seriously harm our business.
Delaware law and provisions in our amended and restated certificate of incorporation and amended and restated bylaws could make a merger, tender offer or proxy contest difficult, thereby depressing the trading price of our Class A common stock.
Our amended and restated certificate of incorporation and amended and restated bylaws contain provisions that could depress the trading price of our Class A common stock by acting to discourage, delay or prevent a change of control of our company or changes in our management that the stockholders of our company may deem advantageous. These provisions include the following:
|
•
|
establish a classified board of directors so that not all members of our board of directors are elected at one time;
|
|
•
|
permit the board of directors to establish the number of directors and fill any vacancies and newly-created directorships;
|
|
•
|
provide that directors may only be removed for cause;
|
|
•
|
require super-majority voting to amend some provisions in our certificate of incorporation and bylaws;
|
|
•
|
authorize the issuance of “blank check” preferred stock that our board of directors could use to implement a stockholder rights plan;
|
|
•
|
eliminate the ability of our stockholders to call special meetings of stockholders;
|
|
•
|
prohibit stockholder action by written consent, which requires all stockholder actions to be taken at a meeting of our stockholders;
|
|
•
|
provide that the board of directors is expressly authorized to make, alter or repeal our bylaws;
|
|
•
|
restrict the forum for certain litigation against us to Delaware;
|
|
•
|
reflect the dual class structure of our common stock; and
|
|
•
|
establish advance notice requirements for nominations for election to our board of directors or for proposing matters that can be acted upon by stockholders at annual stockholder meetings.
|
Any provision of our amended and restated certificate of incorporation or amended and restated bylaws that has the effect of delaying or deterring a change in control could limit the opportunity for our stockholders to receive a premium for their shares of our common stock, and could also affect the price that some investors are willing to pay for our Class A common stock.
Our amended and restated certificate of incorporation provides that the Court of Chancery of the State of Delaware and the federal district courts of the United States are the exclusive forums for substantially all disputes between us and our stockholders, which could limit our stockholders’ ability to obtain a favorable judicial forum for disputes with us or our directors, officers or employees.
Our amended and restated certificate of incorporation provides that the Court of Chancery of the State of Delaware is the exclusive forum for:
|
•
|
any derivative action or proceeding brought on our behalf;
|
|
•
|
any action asserting a breach of fiduciary duty;
|
|
•
|
any action asserting a claim against us arising under the Delaware General Corporation Law, our amended and restated certificate of incorporation or our amended and restated bylaws; and
|
|
•
|
any action asserting a claim against us that is governed by the internal affairs doctrine.
|
Our amended and restated certificate of incorporation further provides that the federal district courts of the United States will be the exclusive forum for resolving any complaint asserting a cause of action arising under the Securities Act.
These exclusive-forum provisions may limit a stockholder’s ability to bring a claim in a judicial forum that it finds favorable for disputes with us or our directors, officers or other employees, which may discourage lawsuits against us and our directors, officers and other employees. We are currently subject to a stockholder derivative action regarding the validity of the federal exclusive forum provision. If a court were to find either exclusive-forum provision in our amended and restated certificate of incorporation to be inapplicable or unenforceable in an action, we may incur additional costs associated with resolving the dispute in other jurisdictions, which could seriously harm our business.
23
None.
Our corporate headquarters are located in San Francisco, California and comprise approximately
134,000
square feet of space. We also operate a photography studio in San Francisco that is approximately
19,200
square feet. Our current leases on these facilities, entered into in
January 2016
and
February 2016
, respectively, expire in
May 2028
and
May 2021
, respectively.
We lease an additional
36,200
square feet of office space in Texas, where our client experience team is based, and
3,300
square feet of space for an engineering office in Pennsylvania.
We also lease and operate four fulfillment centers, comprising a total of approximately
1,478,000
square feet, at which we receive merchandise from vendors, ship products to clients and receive and process returns from clients. These facilities are located in California, Arizona, Texas and Pennsylvania. Our fifth fulfillment center in Indiana, representing approximately
400,000
square feet, is leased and operated by a third-party logistics contractor. In August 2018, we signed a letter of intent with a third-party logistics contractor to lease and operate a fulfillment center in Leicester, England.
In addition, we own approximately
24,000
square feet of space in Pennsylvania that houses the apparel manufacturing assets we acquired in October 2017.
We believe our facilities, including our planned expansions, are sufficient for our current needs.
We are not party to any material legal proceedings at this time. From time to time, we may become involved in various legal proceedings that arise in the ordinary course of business. We have in the past and may in the future become involved in private actions, collective actions, investigations and various other legal proceedings by clients, employees, suppliers, competitors, government agencies, stockholders or others. We evaluate any claims and lawsuits with respect to their potential merits, our potential defenses and counter claims, and the expected effect on us of defending the claims and a potential adverse result. However, the results of any litigation, investigations and other legal proceedings are inherently unpredictable and expensive. Any claims against us, whether meritorious or not, could be time consuming, result in costly litigation, damage our reputation, require significant amounts of management time and divert significant resources. If any legal proceedings were to be determined adversely to us, or we were to enter into a settlement arrangement, we could be exposed to monetary damages or limits on our ability to operate our business, which could have an adverse effect on our business, financial condition and operating results.
None.
24
Market Information for Common Stock
Our Class A common stock, par value $0.00002 per share, is listed on the Nasdaq Global Select Market, under the symbol “SFIX” and began trading on November 17, 2017. Prior to that date, there was no public trading market for our Class A common stock. There is no public trading market for our Class B common stock, par value $0.00002 per share.
The following table sets forth on a per-share basis the high and low intraday sales prices of our Class A common stock, as reported on the Nasdaq Global Select Market, for the periods indicated:
|
For the Fiscal Year Ended July 28, 2018
|
||||||||
|
High
|
Low
|
|||||||
|
Quarterly period ended October 28, 2017
|
n/a
|
|
n/a
|
|
||||
|
Quarterly period ended January 27, 2018 (from November 17, 2017)
|
$
|
30.07
|
|
$
|
14.48
|
|
||
|
Quarterly period ended April 28, 2018
|
$
|
26.00
|
|
$
|
18.00
|
|
||
|
Quarterly period ended July 28, 2018
|
$
|
35.45
|
|
$
|
18.02
|
|
||
Holders of Record
As of the close of business on
September 27, 2018
, there were
47
stockholders of record of our Class A common stock and
59
stockholders of record of our Class B common stock. The actual number of holders of our Class A and Class B common stock is greater than the number of record holders, and includes stockholders who are beneficial owners, but whose shares are held in street name by brokers or other nominees. The number of holders of record presented here also does not include stockholders whose shares may be held in trust by other entities.
Dividend Policy
We have never declared or paid cash dividends on our capital stock. We currently intend to retain all available funds and future earnings, if any, to fund the development and expansion of our business, and we do not anticipate paying any cash dividends in the foreseeable future. Any future determination regarding the declaration and payment of dividends, if any, will be at the discretion of our board of directors and will depend on then-existing conditions, including our financial condition, operating results, contractual restrictions, capital requirements, business prospects and other factors our board of directors may deem relevant.
Cumulative Stock Performance Graph
The following graph compares the cumulative total return to stockholders on our Class A common stock relative to the cumulative total returns of the Standard and Poor's Retail Select Industry Index (S&P Retail Select Industry) and Nasdaq Composite Index (Nasdaq Composite). An investment of $100 (with reinvestment of all dividends) is assumed to have been made in our Class A common stock and in each index on November 17, 2017, the date our Class A common stock began trading on the Nasdaq, and its relative performance is tracked through
July 28, 2018
. The comparisons are based on historical data and are not indicative of, nor intended to forecast, the future performance of our Class A common stock.
25
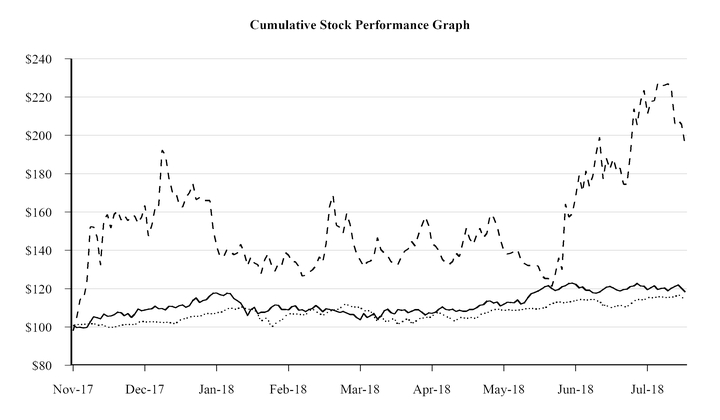
|
__________
|
S&P Retail Select Industry
|
…………
|
Nasdaq Composite
|
– – – – – –
|
Stitch Fix, Inc.
|
The following table assumes an investment of $100 (with reinvestment of all dividends) to have been made in our Class A common stock and in each index on November 17, 2017, the date our Class A common stock began trading on the Nasdaq, and indicates the cumulative total return to stockholders on our Class A common stock and the cumulative total return of each index at our fiscal year end of
July 28, 2018
:
|
(in dollars)
|
November 17, 2017
|
July 28, 2018
|
||||||
|
S&P Retail Select Industry
|
$
|
100.00
|
|
$
|
118.27
|
|
||
|
Nasdaq Composite
|
$
|
100.00
|
|
$
|
114.07
|
|
||
|
Stitch Fix, Inc.
|
$
|
100.00
|
|
$
|
194.79
|
|
||
The information under “Cumulative Stock Performance Graph” is not deemed to be “soliciting material” or “filed” with the SEC or subject to Regulation 14A or 14C, or to the liabilities of Section 18 of the Exchange Act, and is not to be incorporated by reference in any filing of Stitch Fix under the Securities Act or the Exchange Act, whether made before or after the date of this Annual Report and irrespective of any general incorporation language in those filings.
Unregistered Sales of Equity Securities
None.
Issuer Purchases of Equity Securities
None.
The following selected consolidated financial and other data should be read in conjunction with, and are qualified by reference to, “Management’s Discussion and Analysis of Financial Condition and Results of Operations,” and our audited consolidated financial statements and the accompanying notes included elsewhere in this Annual Report. The consolidated statements of operations data for the fiscal years ended
July 28, 2018
,
July 29, 2017
, and
July 30, 2016
, and the consolidated balance sheet data as of
July 28, 2018
, and
26
July 29, 2017
, are derived from the audited consolidated financial statements that are included elsewhere in this Annual Report. The consolidated statements of operations data for the fiscal years ended
August 1, 2015
, and
August 2, 2014
, as well as the consolidated balance sheet data as of
July 30, 2016
,
August 1, 2015
, and
August 2, 2014
, are derived from audited consolidated financial statements that are not included in this Annual Report. We have included, in our opinion, all adjustments, consisting only of normal recurring adjustments, that we consider necessary for a fair presentation of the financial information set forth in those statements. Our historical results are not necessarily indicative of the results to be expected in any period in the future.
|
For the Fiscal Year Ended
|
||||||||||||||||||||
|
(in thousands, except per share data)
|
July 28, 2018
|
July 29, 2017
|
July 30, 2016
|
August 1, 2015
|
August 2, 2014
|
|||||||||||||||
|
Revenue, net
|
$
|
1,226,505
|
|
$
|
977,139
|
|
$
|
730,313
|
|
$
|
342,803
|
|
$
|
73,227
|
|
|||||
|
Cost of goods sold
|
690,483
|
|
542,718
|
|
407,064
|
|
198,054
|
|
47,425
|
|
||||||||||
|
Gross profit
|
536,022
|
|
434,421
|
|
323,249
|
|
144,749
|
|
25,802
|
|
||||||||||
|
Selling, general and administrative expenses
(1)(2)
|
492,998
|
|
402,781
|
|
259,021
|
|
108,562
|
|
30,242
|
|
||||||||||
|
Operating income
|
43,024
|
|
31,640
|
|
64,228
|
|
36,187
|
|
(4,440
|
)
|
||||||||||
|
Remeasurement of preferred stock warrant liability
|
(10,685
|
)
|
18,881
|
|
3,019
|
|
2,938
|
|
1,534
|
|
||||||||||
|
Other income, net
|
(1,004
|
)
|
(42
|
)
|
(13
|
)
|
(2
|
)
|
336
|
|
||||||||||
|
Income (loss) before income taxes
|
54,713
|
|
12,801
|
|
61,222
|
|
33,251
|
|
(6,310
|
)
|
||||||||||
|
Provision for income taxes
|
9,813
|
|
13,395
|
|
28,041
|
|
12,322
|
|
23
|
|
||||||||||
|
Net income (loss) and comprehensive income (loss)
|
$
|
44,900
|
|
$
|
(594
|
)
|
$
|
33,181
|
|
$
|
20,929
|
|
$
|
(6,333
|
)
|
|||||
|
Net income (loss) attributable to common stockholders:
(3)
|
||||||||||||||||||||
|
Basic
|
$
|
35,541
|
|
$
|
(594
|
)
|
$
|
8,211
|
|
$
|
4,573
|
|
$
|
(6,333
|
)
|
|||||
|
Diluted
|
$
|
27,285
|
|
$
|
(594
|
)
|
$
|
9,496
|
|
$
|
5,318
|
|
$
|
(6,333
|
)
|
|||||
|
Earnings (loss) per share attributable to common stockholders:
(3)
|
||||||||||||||||||||
|
Basic
|
$
|
0.47
|
|
$
|
(0.02
|
)
|
$
|
0.36
|
|
$
|
0.22
|
|
$
|
(0.34
|
)
|
|||||
|
Diluted
|
$
|
0.34
|
|
$
|
(0.02
|
)
|
$
|
0.34
|
|
$
|
0.21
|
|
$
|
(0.34
|
)
|
|||||
|
Weighted-average shares used to compute earnings per share attributable to common stockholders:
(3)
|
||||||||||||||||||||
|
Basic
|
75,947,759
|
|
24,973,931
|
|
22,729,890
|
|
20,705,313
|
|
18,893,197
|
|
||||||||||
|
Diluted
|
81,288,418
|
|
24,973,931
|
|
27,882,844
|
|
25,452,912
|
|
18,893,197
|
|
||||||||||
|
Other Financial and Operating Data
|
||||||||||||||||||||
|
Adjusted EBITDA
(4)
|
$
|
53,566
|
|
$
|
60,578
|
|
$
|
72,582
|
|
$
|
42,126
|
|
$
|
(3,791
|
)
|
|||||
|
Non-GAAP net income (loss)
(4)
|
$
|
38,424
|
|
$
|
30,680
|
|
$
|
41,010
|
|
$
|
29,033
|
|
$
|
(4,422
|
)
|
|||||
|
Active clients (as of period end)
(5)
|
2,742
|
|
2,194
|
|
1,674
|
|
867
|
|
261
|
|
||||||||||
(1)
Includes stock-based compensation expense of
$15.4 million
,
$3.5 million
,
$1.9 million
,
$0.7 million
and
$0.2 million
for
2018
,
2017
,
2016
,
2015
and
2014
, respectively.
(2)
Includes compensation expense related to certain stock sales by current and former employees of
$21.3 million
and
$4.8 million
for
2017
and
2016
, respectively.
(3)
See Note 11 to our consolidated financial statements included elsewhere in this Annual Report on Form 10-K for an explanation of the calculations of our basic and diluted earnings (loss) per share attributable to common stockholders and the weighted average number of shares used in the computation of the per share amounts.
(4)
See the section titled “Management’s Discussion and Analysis of Financial Condition and Results of Operations—Key Metrics” for information regarding our use of adjusted EBITDA and non-GAAP net income (loss), and their reconciliation to net income (loss).
(5)
See the section titled “Management’s Discussion and Analysis of Financial Condition and Results of Operations—Key Metrics” for information on how we define and calculate active clients.
|
(in thousands)
|
July 28, 2018
|
July 29, 2017
|
July 30, 2016
|
August 1, 2015
|
August 2, 2014
|
|||||||||||||||
|
Consolidated Balance Sheet Data:
|
||||||||||||||||||||
|
Cash and cash equivalents
|
$
|
297,516
|
|
$
|
110,608
|
|
$
|
91,488
|
|
$
|
68,449
|
|
$
|
34,636
|
|
|||||
|
Total assets
|
481,585
|
|
257,205
|
|
191,600
|
|
111,600
|
|
46,145
|
|
||||||||||
|
Working capital
(1)
|
274,774
|
|
63,844
|
|
63,199
|
|
41,615
|
|
28,684
|
|
||||||||||
|
Convertible preferred stock
|
—
|
|
42,222
|
|
42,222
|
|
42,222
|
|
42,222
|
|
||||||||||
|
Total stockholders' equity (deficit)
|
315,072
|
|
61,861
|
|
49,947
|
|
8,539
|
|
(12,945
|
)
|
||||||||||
(1)
Working capital for all periods presented above is defined as current assets less current liabilities.
27
You should read the following discussion and analysis of our financial condition and results of operations together with our audited consolidated financial statements and related notes thereto included in Part II, Item 8 of this Annual Report on Form 10-K, or Annual Report. We use a 52- or 53-week fiscal year, with our fiscal year ending on the Saturday that is closest to July 31 of that year. Each fiscal year generally consists of four 13-week fiscal quarters, with each fiscal quarter ending on the Saturday that is closest to the last day of the last month of the quarter. Each of the fiscal years ended
July 28, 2018
,
July 29, 2017
, and
July 30, 2016
, included 52 weeks of operations. Throughout this Annual Report, all references to quarters and years are to our fiscal quarters and fiscal years unless otherwise noted.
In addition, this discussion contains forward-looking statements that reflect our plans, estimates and beliefs, and involve risks and uncertainties. Our actual results and the timing of certain events could differ materially from those anticipated in or implied by these forward-looking statements as a result of several factors, including those discussed in the section titled “Risk Factors” included under Part I, Item 1A and elsewhere in this Annual Report. See “Special Note Regarding Forward-Looking Statements” in this Annual Report.
Overview
Stitch Fix is transforming the way people find what they love, one client at a time and one Fix at a time.
We are reinventing the shopping experience by delivering one-to-one personalization to our clients through the combination of data science and human judgment. This combination drives a better client experience and a more powerful business model than either element could deliver independently. Our stylists hand select items from a broad range of merchandise. Stylists pair their own judgment with our analysis of client and merchandise data to provide a personalized shipment of apparel, shoes and accessories suited to each client’s needs. We call each of these unique shipments a Fix. Our clients may choose to schedule automatic shipments that arrive every two to three weeks or on a monthly, bi-monthly or quarterly cadence, or schedule a Fix on demand. Clients can increase or decrease their desired Fix frequency at any time, and can select the exact date by which they want to receive a Fix. After receiving a Fix, our clients purchase the items they want to keep and return the other items. Historically, we have charged clients a $20 styling fee that is credited towards the merchandise purchased. If the client chooses to keep all items in a Fix, she receives a 25% discount on her entire purchase. We also provide select clients with an alternative to paying a $20 styling fee per Fix, known as Style Pass. Style Pass clients pay a $49 annual fee for unlimited styling that is credited towards merchandise purchases.
In February 2018, we launched Extras, a new feature that allows clients to select items such as socks, bras, underwear and other intimates that are then added to the five items their stylist selects for their Fix. In July 2018, we launched Stitch Fix Kids in time for back-to-school season. In addition, in October 2018, we announced our plan to launch in the United Kingdom, or UK.
The very human experience that we deliver is powered by data science. Our data science capabilities consist of our rich data set and our proprietary algorithms, which fuel our business by enhancing the client experience and driving business model efficiencies. The vast majority of our client data is provided directly and explicitly by our clients, rather than inferred, scraped or obtained from other sources. We also gather extensive merchandise data, such as inseam, pocket shape, silhouette and fit.
This large and growing data set provides the foundation for proprietary algorithms that we use throughout our business, including those that predict purchase behavior, forecast demand, optimize inventory and enable us to design new apparel. We believe our data science capabilities give us a significant competitive advantage, and as our data set grows, our algorithms become more powerful.
Our stylists leverage our data science through a custom-built, web-based styling application that provides recommendations from our broad selection of merchandise. Our stylists then apply their judgment to select what they believe to be the best items for each Fix. Our stylists provide a personal touch, offer styling advice and context to each item selected, and help us develop long-term relationships with our clients. Our stylists are U.S.-based employees, most of whom work part-time and remotely.
We maintain a broad range of product offerings to serve our clients. We offer both merchandise sourced from brand partners and our own Exclusive Brands. We use our data to inform the merchandise we buy and develop to best suit our clients.
We reach clients through a combination of word of mouth, referrals, advertising and other marketing efforts. We invest in marketing with the goal of attracting new clients, improving engagement with current clients and expanding our client closet share over time. As we continue to expand our marketing efforts, we plan to remain disciplined in measuring the return on advertising spend.
We believe our success in serving clients has resulted in our rapid and profitable growth. We have achieved positive cash flows from operations on an annual basis since 2014, while continuing to make meaningful investments to drive growth. For the
fiscal year ended
July 28, 2018
, we reported
$1.2 billion
of revenue representing year-over-year growth of
25.5%
from the
fiscal year ended
July 29, 2017
, compared to year-over-year growth of
33.8%
from the
fiscal year ended
July 30, 2016
, to the
fiscal year ended
July 29, 2017
. As of
July 28, 2018
,
July 29, 2017
, and
July 30, 2016
, we had active clients of
2,742,000
,
2,194,000
and
1,674,000
, respectively, representing year-over-year growth of
25.0%
and
31.1%
, respectively.
Net income for the
fiscal year ended
July 28, 2018
, was
$44.9 million
, an increase of
$45.5 million
from the
fiscal year ended
July 29, 2017
. Net loss for the
fiscal year ended
July 29, 2017
, was
$0.6 million
, a decrease of
$33.8 million
from the
fiscal year ended
July 30, 2016
. Included in net income for the
fiscal year ended
July 28, 2018
, was a
$10.7 million
gain on remeasurement of our preferred stock
28
warrant liability prior to our initial public offering, or IPO, and a
$6.7 million
remeasurement expense on our net deferred tax assets related to the Tax Cuts and Jobs Act, or the Tax Act, which was enacted on December 22, 2017. Included in net income for the
fiscal year ended
July 29, 2017
, was a
$21.3 million
compensation expense related to certain stock sales by current and former employees and a
$18.9 million
loss on remeasurement of our preferred stock warrant liability. Included in net income for the
fiscal year ended
July 29, 2016
, was a
$4.8 million
compensation expense related to certain stock sales by current and former employees and a
$3.0 million
loss on remeasurement of our preferred stock warrant liability.
Key Metrics
We report our financial results in accordance with generally accepted accounting principles in the United States, or GAAP. However, management believes that certain non-GAAP financial measures provide users of our financial information with additional useful information in evaluating our performance. Management believes that excluding certain items that may vary substantially in frequency and magnitude period-to-period from net income (loss) and earnings (loss) per share, or EPS, provides useful supplemental measures that assist in evaluating our ability to generate earnings and to more readily compare these metrics between past and future periods. Management also believes that adjusted EBITDA is frequently used by investors and securities analysts in their evaluations of companies, and that this supplemental measure facilitates comparisons between companies. We believe free cash flow is an important metric because it represents a measure of how much cash from operations we have available for discretionary and non-discretionary items after the deduction of capital expenditures. These non-GAAP financial measures may be different than similarly titled measures used by other companies. For instance, we do not exclude stock-based compensation expense from adjusted EBITDA or non-GAAP net income. Stock-based compensation is an important part of how we attract and retain our employees, and we consider it to be a real cost of running the business.
Our non-GAAP financial measures should not be considered in isolation from, or as substitutes for, financial information prepared in accordance with GAAP. There are several limitations related to the use of our non-GAAP financial measures as compared to the closest comparable GAAP measures. Some of these limitations include:
|
•
|
our non-GAAP net income, adjusted EBITDA and non-GAAP EPS – diluted measures exclude compensation expense that we recognized related to certain stock sales by current and former employees;
|
|
•
|
our non-GAAP net income and non-GAAP EPS – diluted measures exclude the impact of the remeasurement of our net deferred tax assets following the adoption of the Tax Act;
|
|
•
|
our non-GAAP net income, adjusted EBITDA and non-GAAP EPS – diluted measures exclude the remeasurement of the preferred stock warrant liability, which is a non-cash expense incurred in the periods prior to the completion of our IPO;
|
|
•
|
adjusted EBITDA also excludes the recurring, non-cash expenses of depreciation and amortization of property and equipment and, although these are non-cash expenses, the assets being depreciated and amortized may have to be replaced in the future;
|
|
•
|
adjusted EBITDA does not reflect our tax provision, which reduces cash available to us; and
|
|
•
|
free cash flow does not represent the total residual cash flow available for discretionary purposes and does not reflect our future contractual commitments.
|
Adjusted EBITDA
We define adjusted EBITDA as net income (loss) excluding other (income), net, provision for income taxes, depreciation and amortization, and, when present, the remeasurement of preferred stock warrant liability and compensation expense related to certain stock sales by current and former employees. The following table presents a reconciliation of net income (loss), the most comparable GAAP financial measure, to adjusted EBITDA for each of the periods presented:
|
For the Fiscal Year Ended
|
||||||||||||
|
(in thousands)
|
July 28, 2018
|
July 29, 2017
|
July 30, 2016
|
|||||||||
|
Adjusted EBITDA reconciliation:
|
||||||||||||
|
Net income (loss)
|
$
|
44,900
|
|
$
|
(594
|
)
|
$
|
33,181
|
|
|||
|
Add (deduct):
|
||||||||||||
|
Other income, net
|
(1,004
|
)
|
(42
|
)
|
(13
|
)
|
||||||
|
Provision for income taxes
|
9,813
|
|
13,395
|
|
28,041
|
|
||||||
|
Depreciation and amortization
|
10,542
|
|
7,655
|
|
3,544
|
|
||||||
|
Remeasurement of preferred stock warrant liability
|
(10,685
|
)
|
18,881
|
|
3,019
|
|
||||||
|
Compensation expense related to certain stock sales by current and former employees
|
—
|
|
21,283
|
|
4,810
|
|
||||||
|
Adjusted EBITDA
|
$
|
53,566
|
|
$
|
60,578
|
|
$
|
72,582
|
|
|||
29
Non-GAAP Net Income
We define non-GAAP net income as net income (loss) excluding, when present, the remeasurement of preferred stock warrant liability, compensation expense related to certain stock sales by current and former employees, and the related tax impact of those items, as well as the remeasurement of our net deferred tax assets in relation to the adoption of the Tax Act. The following table presents a reconciliation of net income (loss), the most comparable GAAP financial measure, to non-GAAP net income for each of the periods presented:
|
For the Fiscal Year Ended
|
||||||||||||
|
(in thousands)
|
July 28, 2018
|
July 29, 2017
|
July 30, 2016
|
|||||||||
|
Non-GAAP net income reconciliation:
|
||||||||||||
|
Net income (loss)
|
$
|
44,900
|
|
$
|
(594
|
)
|
$
|
33,181
|
|
|||
|
Add (deduct):
|
||||||||||||
|
Remeasurement of preferred stock warrant liability
|
(10,685
|
)
|
18,881
|
|
3,019
|
|
||||||
|
Compensation expense related to certain stock sales by current and former employees
|
—
|
|
21,283
|
|
4,810
|
|
||||||
|
Tax impact of non-GAAP adjustments
|
—
|
|
(8,890
|
)
|
—
|
|
||||||
|
Impact of Tax Act
(1)
|
4,209
|
|
—
|
|
—
|
|
||||||
|
Non-GAAP net income
|
$
|
38,424
|
|
$
|
30,680
|
|
$
|
41,010
|
|
|||
(1)
The U.S. government enacted comprehensive tax legislation in December 2017. This resulted in a net charge of
$4.2 million
for the
fiscal year ended
July 28, 2018
, due to the remeasurement of our net deferred tax assets for the reduction in tax rate from 35% to 21%. The adjustment to non-GAAP net income only includes this transitional impact. It does not include the ongoing impacts of the lower U.S. statutory rate on current year earnings.
30
Non-GAAP Earnings Per Share - Diluted
We define non-GAAP EPS as diluted EPS excluding, when present, the per share impact of the remeasurement of preferred stock warrant liability, compensation expense related to certain stock sales by current and former employees, and the related tax impact of those items, as well as the per share impact of the remeasurement of our net deferred tax assets in relation to the adoption of the Tax Act. The following table presents a reconciliation of EPS attributable to common stockholders - diluted, the most comparable GAAP financial measure, to non-GAAP EPS attributable to common stockholders - diluted for each of the periods presented:
|
For the Fiscal Year Ended
|
||||||||||||
|
(in dollars)
|
July 28, 2018
|
July 29, 2017
|
July 30, 2016
|
|||||||||
|
Non-GAAP earnings per share - diluted reconciliation:
|
||||||||||||
|
Earnings (loss) per share attributable to common stockholders - diluted
|
$
|
0.34
|
|
$
|
(0.02
|
)
|
$
|
0.34
|
|
|||
|
Per share impact of the remeasurement of preferred stock warrant
liability (1) |
—
|
|
0.36
|
|
0.08
|
|
||||||
|
Per share impact of compensation expense related to certain stock
sales by current and former employees |
—
|
|
0.40
|
|
0.12
|
|
||||||
|
Per share impact from tax effect of non-GAAP adjustments
|
—
|
|
(0.17
|
)
|
—
|
|
||||||
|
Per share impact from Tax Act
(2)
|
0.05
|
|
—
|
|
—
|
|
||||||
|
Non-GAAP earnings per share attributable to common stockholders - diluted
|
$
|
0.39
|
|
$
|
0.57
|
|
$
|
0.54
|
|
|||
(1)
For the
fiscal year ended
July 28, 2018
, the preferred stock warrant liability was dilutive and included in earnings per share attributable to common stockholders - diluted. Therefore, it is not an adjustment to arrive at non-GAAP EPS - diluted.
(2)
The U.S. government enacted comprehensive tax legislation in December 2017. This resulted in a net charge of
$4.2 million
for the
fiscal year ended
July 28, 2018
, due to the remeasurement of our net deferred tax assets for the reduction in tax rate from 35% to 21%. The adjustment to non-GAAP net income only includes this transitional impact. It does not include the ongoing impacts of the lower U.S. statutory rate on current year earnings.
Free Cash Flow
We define free cash flow as cash flow from operations reduced by purchases of property and equipment that are included in cash flow from investing activities. The following table presents a reconciliation of cash flows from operating activities, the most comparable GAAP financial measure, to free cash flow for each of the periods presented:
|
For the Fiscal Year Ended
|
||||||||||||
|
(in thousands)
|
July 28, 2018
|
July 29, 2017
|
July 30, 2016
|
|||||||||
|
Free cash flow reconciliation:
|
||||||||||||
|
Cash flows from operating activities
|
$
|
72,178
|
|
$
|
38,624
|
|
$
|
45,116
|
|
|||
|
Deduct:
|
||||||||||||
|
Purchase of property and equipment
|
(16,565
|
)
|
(17,130
|
)
|
(15,238
|
)
|
||||||
|
Free cash flow
|
$
|
55,613
|
|
$
|
21,494
|
|
$
|
29,878
|
|
|||
|
Cash flows used in investing activities
|
$
|
(16,565
|
)
|
$
|
(17,130
|
)
|
$
|
(15,238
|
)
|
|||
|
Cash flows from (used in) financing activities
|
$
|
134,795
|
|
$
|
(3,028
|
)
|
$
|
499
|
|
|||
Active Clients
We believe that the number of active clients is a key indicator of our growth and the overall health of our business. We define an active client as a client who checked out a Fix in the preceding 12-month period, measured as of the last date of that period. A client checks out a Fix when she indicates what items she is keeping through our mobile application or on our website. We had
2,742,000
,
2,194,000
and
1,674,000
active clients as of
July 28, 2018
,
July 29, 2017
, and
July 30, 2016
, respectively, representing year-over-year growth of
25.0%
and
31.1%
, respectively.
Factors Affecting Our Performance
Client Acquisition and Engagement
To grow our business, we must continue to acquire clients and successfully engage them. We believe that implementing broad-based marketing strategies that increase our brand awareness has the potential to strengthen Stitch Fix as a national consumer brand, help us acquire new clients and drive revenue growth. As our business has achieved a greater scale and we are able to support a large and growing client base, we have increased our investments in marketing to take advantage of more marketing channels to efficiently acquire clients. For example, we recently significantly increased our advertising spend, from
$70.5 million
and
$25.0 million
for the fiscal years ended
July 29, 2017
, and
July 30, 2016
, respectively, to
$102.1 million
for the
fiscal year ended
July 28, 2018
, to support the growth of our business. We expect to continue to make significant marketing investments to grow our business. We currently utilize both digital and
31
offline channels to attract new visitors to our website or mobile app and subsequently convert them into clients. Our current marketing efforts include client referrals, affiliate programs, partnerships, display advertising, television, print, radio, video, content, direct mail, social media, email, mobile “push” communications, search engine optimization and keyword search campaigns.
To successfully acquire clients and increase engagement, we must also continue to improve the diversity of our offering. These efforts may include broadening our brand partnerships and expanding into new categories, product types, price points and geographies. For example, in July 2018 we launched Stitch Fix Kids, expanding our client and vendor base, and in October 2018, we announced our intention to launch in the UK, expanding our geographic scope.
Investment in our Operations and Infrastructure
To grow our client base and enhance our offering, we will incur additional expenses. We intend to leverage our data science and deep understanding of our clients’ needs to inform investments in operations and infrastructure. We anticipate that our expenses will increase as we continue to hire additional personnel and further advance our technological and data science capabilities. Moreover, we intend to make capital investments in our inventory, fulfillment centers and office space and logistics infrastructure as we launch new categories, expand internationally and drive operating efficiencies. We expect to increase our spending on these investments in the future and cannot be certain that these efforts will grow our client base or be cost-effective. However, we believe these strategies will yield positive returns in the long term.
Inventory Management
We leverage our data science to buy and manage our inventory, including merchandise assortment and fulfillment center optimization. To ensure sufficient availability of merchandise, we generally enter into purchase orders well in advance and frequently before apparel trends are confirmed by client purchases. As a result, we are vulnerable to demand and pricing shifts and availability of merchandise at time of purchase. We incur inventory write-offs and changes in inventory reserves that impact our gross margins. Because our merchandise assortment directly correlates to client success, we may at times optimize our inventory to prioritize long-term client success over short-term gross margin impact. Moreover, our inventory investments will fluctuate with the needs of our business. For example, entering new categories such as our recent launch of Stitch Fix Kids or adding new fulfillment centers will require additional investments in inventory.
Merchandise Mix
We offer apparel, shoes and accessories across categories, brands, product types and price points. We currently serve our clients in the following categories: Women’s, Petite, Maternity, Men’s, Plus and Kids. We carry a mix of third-party branded merchandise, including premium brands, and our own Exclusive Brands. We also offer a wide variety of product types, including denim, dresses, blouses, skirts, shoes, jewelry and handbags. We sell merchandise across a broad range of price points and may further broaden our price point offerings in the future.
While changes in our merchandise mix have not caused significant fluctuations in our gross margin to date, categories, brands, product types and price points do have a range of margin profiles. For example, our Exclusive Brands have generally contributed higher margin, shoes have generally contributed lower margin, and new categories, such as Kids, tend to initially have lower margins. Shifts in merchandise mix driven by client demand may result in fluctuations in our gross margin from period to period.
Components of Results of Operations
Revenue
We generate revenue from the sale of merchandise. We charge a $20 nonrefundable upfront fee, referred to as a “styling fee,” that is credited towards any merchandise purchased in the Fix. We deduct discounts, sales tax and estimated refunds to arrive at net revenue, which we refer to as revenue throughout the report. In December 2017, we launched Style Pass to provide select clients with an alternative to paying a $20 styling fee per Fix. Style Pass clients pay a $49 nonrefundable annual fee for unlimited styling that is credited towards merchandise purchases. We expect our revenue to increase in absolute dollars as we grow our business, although our revenue growth rate may continue to slow in future periods.
Cost of Goods Sold
Cost of goods sold consists of the costs of merchandise, expenses for shipping to and from clients and inbound freight, inventory write-offs and changes in our inventory reserve, payment processing fees and packaging materials costs. We expect our cost of goods sold to fluctuate as a percentage of revenue primarily due to how we manage our inventory and merchandise mix. Our classification of cost of goods sold may vary from other companies in our industry and may not be comparable.
Selling, General and Administrative Expenses
Selling, general and administrative expenses consist primarily of compensation and benefits costs, including stock-based compensation expense, for our employees including our stylist, fulfillment center operations, data analytics, merchandising, engineering, client experience, marketing and corporate personnel. Selling, general and administrative expenses also include marketing and advertising costs, third-party logistics costs, facility costs for our fulfillment centers and offices, professional service fees, information technology costs and depreciation and amortization expense. We expect our selling, general and administrative expenses to increase in absolute dollars
32
and to fluctuate as a percentage of revenue due to the anticipated growth of our business, increased marketing investments and additional costs associated with being a public company. Our classification of selling, general and administrative expenses may vary from other companies in our industry and may not be comparable.
Remeasurement of Preferred Stock Warrant Liability
We estimate the fair value of the preferred stock warrant liability at the end of each reporting period and recognize changes in the fair value through our statement of operations. In connection with our IPO, all warrants were automatically exercised for no consideration, therefore we do not expect to have preferred stock warrant liability in future periods.
Provision for Income Taxes
Our provision for income taxes consists of an estimate of federal and state income taxes based on enacted federal and state tax rates, as adjusted for allowable credits, deductions and uncertain tax positions.
Results of Operations
Comparison of the
Fiscal Years Ended
July 28, 2018
,
July 29, 2017
and
July 30, 2016
The following table sets forth our results of operations for the periods indicated:
|
For the Fiscal Year Ended
|
2018 vs. 2017
|
2017 vs. 2016
|
||||||||||||||||
|
(in thousands)
|
July 28, 2018
|
July 29, 2017
|
July 30, 2016
|
% Change
|
% Change
|
|||||||||||||
|
Revenue, net
|
$
|
1,226,505
|
|
$
|
977,139
|
|
$
|
730,313
|
|
25.5
|
%
|
33.8
|
%
|
|||||
|
Cost of goods sold
|
690,483
|
|
542,718
|
|
407,064
|
|
27.2
|
%
|
33.3
|
%
|
||||||||
|
Gross profit
|
536,022
|
|
434,421
|
|
323,249
|
|
23.4
|
%
|
34.4
|
%
|
||||||||
|
Selling, general and administrative expenses
|
492,998
|
|
402,781
|
|
259,021
|
|
22.4
|
%
|
55.5
|
%
|
||||||||
|
Operating income
|
43,024
|
|
31,640
|
|
64,228
|
|
36.0
|
%
|
(50.7
|
)%
|
||||||||
|
Remeasurement of preferred stock warrant liability
|
(10,685
|
)
|
18,881
|
|
3,019
|
|
(156.6
|
)%
|
525.4
|
%
|
||||||||
|
Other income, net
|
(1,004
|
)
|
(42
|
)
|
(13
|
)
|
*
|
|
223.1
|
%
|
||||||||
|
Income before income taxes
|
54,713
|
|
12,801
|
|
61,222
|
|
327.4
|
%
|
(79.1
|
)%
|
||||||||
|
Provision for income taxes
|
9,813
|
|
13,395
|
|
28,041
|
|
(26.7
|
)%
|
(52.2
|
)%
|
||||||||
|
Net income (loss)
|
$
|
44,900
|
|
$
|
(594
|
)
|
$
|
33,181
|
|
*
|
|
(101.8
|
)%
|
|||||
* Not meaningful
The following table sets forth the components of our results of operations as a percentage of revenue:
|
For the Fiscal Year Ended
|
|||||||||
|
July 28, 2018
|
July 29, 2017
|
July 30, 2016
|
|||||||
|
Revenue, net
|
100.0
|
%
|
100.0
|
%
|
100.0
|
%
|
|||
|
Cost of goods sold
|
56.3
|
%
|
55.5
|
%
|
55.7
|
%
|
|||
|
Gross margin
|
43.7
|
%
|
44.5
|
%
|
44.3
|
%
|
|||
|
Selling, general and administrative expenses
|
40.2
|
%
|
41.2
|
%
|
35.5
|
%
|
|||
|
Operating income
|
3.5
|
%
|
3.3
|
%
|
8.8
|
%
|
|||
|
Remeasurement of preferred stock warrant liability
|
(0.9
|
)%
|
1.9
|
%
|
0.4
|
%
|
|||
|
Other income, net
|
(0.1
|
)%
|
—
|
%
|
—
|
%
|
|||
|
Income before income taxes
|
4.5
|
%
|
1.4
|
%
|
8.4
|
%
|
|||
|
Provision for income taxes
|
0.8
|
%
|
1.4
|
%
|
3.8
|
%
|
|||
|
Net income (loss)
|
3.7
|
%
|
—
|
%
|
4.6
|
%
|
|||
Revenue and Gross Margin
Revenue in the
fiscal year ended
July 28, 2018
, increased by
$249.4 million
, or
25.5%
, from revenue in the
fiscal year ended
July 29, 2017
. The increase in revenue was primarily attributable to a
25.0%
increase in active clients from
July 29, 2017
, to
July 28, 2018
, which drove increased sales of merchandise.
Gross margin for the
fiscal year ended
July 28, 2018
, decreased by
0.8%
compared with the
fiscal year ended
July 29, 2017
. The decrease was primarily attributable to an increase in inventory shrink, shipping expense and expansion into new categories, partially offset by a decrease in inventory obsolescence reserves due to improved inventory management.
33
Revenue in the
fiscal year ended
July 29, 2017
, increased by $246.8 million, or 33.8%, from revenue in the
fiscal year ended
July 30, 2016
. The increase in revenue was primarily attributable to a 31.1% increase in active clients, which drove increased sales of merchandise.
Gross margin increased by 0.2% in the
fiscal year ended
July 29, 2017
, from 44.3% in
fiscal year ended
July 30, 2016
. The increase was primarily attributable to improved inventory management.
Selling, General and Administrative Expenses
Selling, general and administrative expenses increased by
$90.2 million
, or
22.4%
, during the
fiscal year ended
July 28, 2018
, compared with the
fiscal year ended
July 29, 2017
. The increase was primarily related to higher compensation and benefits expense and stock-based compensation expense due to increased headcount as we continue to invest in technology talent and higher advertising spend as we expanded our advertising initiatives, partially offset by improvements in variable labor.
Selling, general and administrative expenses in the
fiscal year ended
July 29, 2017
, increased by $143.8 million, or 55.5%, from the
fiscal year ended
July 30, 2016
. The increase in selling, general and administrative expenses was primarily attributable to an increase in compensation and benefits expenses as we increased our headcount, including a $16.5 million increase related to compensation expense recognized for certain stock sales by current and former employees. In addition, the increase was driven by higher marketing spend as we expanded our television, online and radio advertising initiatives.
Remeasurement of Preferred Stock Warrant Liability
The change in the preferred stock warrant liability was due to a change in the underlying fair value of our preferred stock until the conversion of our preferred stock warrants into Class B common stock as part of our IPO.
Provision for Income Taxes
The following table summarizes our effective tax rate from income for the periods presented:
|
For the Fiscal Year Ended
|
||||||||||||
|
(in thousands)
|
July 28, 2018
|
July 29, 2017
|
July 30, 2016
|
|||||||||
|
Income before income taxes
|
$
|
54,713
|
|
$
|
12,801
|
|
$
|
61,222
|
|
|||
|
Provisions for income taxes
|
9,813
|
|
13,395
|
|
28,041
|
|
||||||
|
Effective tax rate
|
17.9
|
%
|
104.6
|
%
|
45.8
|
%
|
||||||
We are subject to income taxes in the United States. Our effective tax rate and provision for income taxes decreased from the
fiscal year ended
July 29, 2017
, to the
fiscal year ended
July 28, 2018
, primarily due to stock-based compensation deductions, analysis of our 2016 through 2018 qualified activities for U.S. and California research and development tax credits, and a decrease in the nondeductible remeasurement of the preferred stock warrant liability. These tax benefits were partially offset by tax charges for the remeasurement of our net deferred tax assets associated with the enactment of the Tax Act, which reduced the corporate tax rate from 35% to 21%.
Our effective tax rate and provision for income taxes increased from the
fiscal year ended
July 30, 2016
, to
fiscal year ended
July 29, 2017
, primarily due to an increase in the nondeductible remeasurement of the preferred stock warrant liability.
34
Quarterly Results of Operations
The following tables set forth our unaudited quarterly consolidated statements of operations for each of the quarters indicated. The information for each quarter has been prepared on a basis consistent with our audited consolidated financial statements included in this Annual Report and reflect, in the opinion of management, all adjustments of a normal, recurring nature that are necessary for a fair presentation of the financial information contained in those statements. Our historical results are not necessarily indicative of the results that may be expected for the full year or any other period in the future. The following quarterly financial information should be read in conjunction with our audited consolidated financial statements and related notes included in this Annual Report.
|
Quarter Ended
|
||||||||||||||||||||||||||||||||
|
(in thousands, except per share data)
|
July 28, 2018
|
April 28, 2018
|
January 27, 2018
|
October 28, 2017
|
July 29, 2017
|
April 29, 2017
|
January 28, 2017
|
October 29, 2016
|
||||||||||||||||||||||||
|
Revenue, net
|
$
|
318,295
|
|
$
|
316,741
|
|
$
|
295,906
|
|
$
|
295,563
|
|
$
|
258,285
|
|
$
|
245,075
|
|
$
|
237,775
|
|
$
|
236,004
|
|
||||||||
|
Cost of goods sold
|
176,877
|
|
178,535
|
|
168,523
|
|
166,548
|
|
146,047
|
|
139,692
|
|
131,053
|
|
125,926
|
|
||||||||||||||||
|
Gross profit
|
141,418
|
|
138,206
|
|
127,383
|
|
129,015
|
|
112,238
|
|
105,383
|
|
106,722
|
|
110,078
|
|
||||||||||||||||
|
Selling, general and administrative expenses
|
133,302
|
|
128,454
|
|
111,771
|
|
119,471
|
|
112,028
|
|
101,368
|
|
105,835
|
|
83,550
|
|
||||||||||||||||
|
Operating income
|
8,116
|
|
9,752
|
|
15,612
|
|
9,544
|
|
210
|
|
4,015
|
|
887
|
|
26,528
|
|
||||||||||||||||
|
Remeasurement of preferred stock warrant liability
|
—
|
|
—
|
|
(1,614
|
)
|
(9,071
|
)
|
3,374
|
|
12,858
|
|
1,146
|
|
1,503
|
|
||||||||||||||||
|
Other income, net
|
(760
|
)
|
(209
|
)
|
(18
|
)
|
(17
|
)
|
(17
|
)
|
(12
|
)
|
(6
|
)
|
(7
|
)
|
||||||||||||||||
|
Income (loss) before income taxes
|
8,876
|
|
9,961
|
|
17,244
|
|
18,632
|
|
(3,147
|
)
|
(8,831
|
)
|
(253
|
)
|
25,032
|
|
||||||||||||||||
|
Provision (benefit) for income taxes
|
(9,408
|
)
|
474
|
|
13,603
|
|
5,144
|
|
1,360
|
|
732
|
|
(486
|
)
|
11,789
|
|
||||||||||||||||
|
Net income (loss) and comprehensive income (loss)
|
$
|
18,284
|
|
$
|
9,487
|
|
$
|
3,641
|
|
$
|
13,488
|
|
$
|
(4,507
|
)
|
$
|
(9,563
|
)
|
$
|
233
|
|
$
|
13,243
|
|
||||||||
|
Net income attributable to common stockholders:
|
||||||||||||||||||||||||||||||||
|
Basic
|
$
|
18,244
|
|
$
|
9,458
|
|
$
|
3,036
|
|
$
|
3,915
|
|
$
|
(4,507
|
)
|
$
|
(9,563
|
)
|
$
|
—
|
|
$
|
3,595
|
|
||||||||
|
Diluted
|
$
|
18,246
|
|
$
|
9,459
|
|
$
|
1,653
|
|
$
|
1,347
|
|
$
|
(4,507
|
)
|
$
|
(9,563
|
)
|
$
|
—
|
|
$
|
4,055
|
|
||||||||
|
Earnings (loss) per share attributable to common stockholders:
|
||||||||||||||||||||||||||||||||
|
Basic
|
$
|
0.19
|
|
$
|
0.10
|
|
$
|
0.04
|
|
$
|
0.15
|
|
$
|
(0.18
|
)
|
$
|
(0.38
|
)
|
$
|
—
|
|
$
|
0.15
|
|
||||||||
|
Diluted
|
$
|
0.18
|
|
$
|
0.09
|
|
$
|
0.02
|
|
$
|
0.04
|
|
$
|
(0.18
|
)
|
$
|
(0.38
|
)
|
$
|
—
|
|
$
|
0.14
|
|
||||||||
|
Weighted-average shares used to compute earnings per share attributable to common stockholders:
|
||||||||||||||||||||||||||||||||
|
Basic
|
98,019,577
|
|
97,055,573
|
|
82,439,351
|
|
26,329,495
|
|
25,708,011
|
|
25,094,602
|
|
24,742,682
|
|
24,349,434
|
|
||||||||||||||||
|
Diluted
|
102,782,006
|
|
101,847,521
|
|
87,954,656
|
|
33,262,082
|
|
25,708,011
|
|
25,094,602
|
|
24,742,682
|
|
28,940,058
|
|
||||||||||||||||
|
Other Financial and Operating Data:
|
||||||||||||||||||||||||||||||||
|
Adjusted EBITDA
|
$
|
11,120
|
|
$
|
12,402
|
|
$
|
18,230
|
|
$
|
11,814
|
|
$
|
2,445
|
|
$
|
6,050
|
|
$
|
24,094
|
|
$
|
27,989
|
|
||||||||
|
Non-GAAP net income (loss)
|
$
|
17,763
|
|
$
|
9,487
|
|
$
|
6,757
|
|
$
|
4,417
|
|
$
|
(1,133
|
)
|
$
|
3,295
|
|
$
|
13,772
|
|
$
|
14,746
|
|
||||||||
|
Non-GAAP earnings (loss) per share attributable to common stockholders - diluted
|
$
|
0.17
|
|
$
|
0.09
|
|
$
|
0.07
|
|
$
|
0.04
|
|
$
|
(0.04
|
)
|
$
|
0.03
|
|
$
|
0.42
|
|
$
|
0.16
|
|
||||||||
|
Active clients (as of period end)
|
2,742
|
|
2,688
|
|
2,508
|
|
2,396
|
|
2,194
|
|
2,074
|
|
1,920
|
|
1,847
|
|
||||||||||||||||
35
The following table provides a reconciliation of net income (loss) to adjusted EBITDA:
|
Quarter Ended
|
||||||||||||||||||||||||||||||||
|
(in thousands)
|
July 28, 2018
|
April 28, 2018
|
January 27, 2018
|
October 28, 2017
|
July 29, 2017
|
April 29, 2017
|
January 28, 2017
|
October 29, 2016
|
||||||||||||||||||||||||
|
Adjusted EBITDA reconciliation:
|
||||||||||||||||||||||||||||||||
|
Net income (loss)
|
$
|
18,284
|
|
$
|
9,487
|
|
$
|
3,641
|
|
$
|
13,488
|
|
$
|
(4,507
|
)
|
$
|
(9,563
|
)
|
$
|
233
|
|
$
|
13,243
|
|
||||||||
|
Add (deduct):
|
||||||||||||||||||||||||||||||||
|
Other income, net
|
(760
|
)
|
(209
|
)
|
(18
|
)
|
(17
|
)
|
(17
|
)
|
(12
|
)
|
(6
|
)
|
(7
|
)
|
||||||||||||||||
|
Provision (benefit) for income taxes
|
(9,408
|
)
|
474
|
|
13,603
|
|
5,144
|
|
1,360
|
|
732
|
|
(486
|
)
|
11,789
|
|
||||||||||||||||
|
Depreciation and amortization
|
3,004
|
|
2,650
|
|
2,618
|
|
2,270
|
|
2,235
|
|
2,035
|
|
1,924
|
|
1,461
|
|
||||||||||||||||
|
Remeasurement of preferred stock warrant liability
|
—
|
|
—
|
|
(1,614
|
)
|
(9,071
|
)
|
3,374
|
|
12,858
|
|
1,146
|
|
1,503
|
|
||||||||||||||||
|
Compensation expense related to certain stock sales by current and former employees
|
—
|
|
—
|
|
—
|
|
—
|
|
—
|
|
—
|
|
21,283
|
|
—
|
|
||||||||||||||||
|
Adjusted EBITDA
|
$
|
11,120
|
|
$
|
12,402
|
|
$
|
18,230
|
|
$
|
11,814
|
|
$
|
2,445
|
|
$
|
6,050
|
|
$
|
24,094
|
|
$
|
27,989
|
|
||||||||
The following table provides a reconciliation of net income (loss) to non-GAAP net income (loss):
|
Quarter Ended
|
||||||||||||||||||||||||||||||||
|
(in thousands)
|
July 28, 2018
|
April 28, 2018
|
January 27, 2018
|
October 28, 2017
|
July 29, 2017
|
April 29, 2017
|
January 28, 2017
|
October 29, 2016
|
||||||||||||||||||||||||
|
Non-GAAP net income reconciliation:
|
||||||||||||||||||||||||||||||||
|
Net income (loss)
|
$
|
18,284
|
|
$
|
9,487
|
|
$
|
3,641
|
|
$
|
13,488
|
|
$
|
(4,507
|
)
|
$
|
(9,563
|
)
|
$
|
233
|
|
$
|
13,243
|
|
||||||||
|
Add (deduct):
|
||||||||||||||||||||||||||||||||
|
Remeasurement of preferred stock warrant liability
|
—
|
|
—
|
|
(1,614
|
)
|
(9,071
|
)
|
3,374
|
|
12,858
|
|
1,146
|
|
1,503
|
|
||||||||||||||||
|
Compensation expense related to certain stock sales by current and former employees
|
—
|
|
—
|
|
—
|
|
—
|
|
—
|
|
—
|
|
21,283
|
|
—
|
|
||||||||||||||||
|
Tax impact of non-GAAP adjustments
|
—
|
|
—
|
|
—
|
|
—
|
|
—
|
|
—
|
|
(8,890
|
)
|
—
|
|
||||||||||||||||
|
Impact of Tax Act
(1)
|
(521
|
)
|
—
|
|
4,730
|
|
—
|
|
—
|
|
—
|
|
—
|
|
—
|
|
||||||||||||||||
|
Non-GAAP net income (loss)
|
$
|
17,763
|
|
$
|
9,487
|
|
$
|
6,757
|
|
$
|
4,417
|
|
$
|
(1,133
|
)
|
$
|
3,295
|
|
$
|
13,772
|
|
$
|
14,746
|
|
||||||||
(1)
The U.S. government enacted comprehensive tax legislation in December 2017. This resulted in a net charge of
$4.7 million
for the three months ended January 27, 2018 and a net benefit of
$0.5 million
for the three months ended July 28, 2018, due to the remeasurement of our net deferred tax assets for the reduction in tax rate from 35% to 21%. The adjustment to non-GAAP net income only includes this transitional impact. It does not include the ongoing impacts of the lower U.S. statutory rate on current year earnings.
36
The following table provides a reconciliation of earnings per share - diluted to non-GAAP earnings per share - diluted:
|
Quarter Ended
|
||||||||||||||||||||||||||||||||
|
(in dollars)
|
July 28, 2018
|
April 28, 2018
|
January 27, 2018
|
October 28, 2017
|
July 29, 2017
|
April 29, 2017
|
January 28, 2017
|
October 29, 2016
|
||||||||||||||||||||||||
|
Non-GAAP earnings per share - diluted reconciliation:
|
||||||||||||||||||||||||||||||||
|
Earnings (loss) per share attributable to common stockholders - diluted
|
$
|
0.18
|
|
$
|
0.09
|
|
$
|
0.02
|
|
$
|
0.04
|
|
$
|
(0.18
|
)
|
$
|
(0.38
|
)
|
$
|
—
|
|
$
|
0.14
|
|
||||||||
|
Per share impact of the remeasurement of preferred stock warrant liability
(1)
|
—
|
|
—
|
|
—
|
|
—
|
|
0.14
|
|
0.41
|
|
0.04
|
|
0.02
|
|
||||||||||||||||
|
Per share impact of compensation expense related to certain stock sales by current and former employees
|
—
|
|
—
|
|
—
|
|
—
|
|
—
|
|
—
|
|
0.66
|
|
—
|
|
||||||||||||||||
|
Per share impact from tax effect of non-GAAP adjustments
|
—
|
|
—
|
|
—
|
|
—
|
|
—
|
|
—
|
|
(0.28
|
)
|
—
|
|
||||||||||||||||
|
Per share impact from Tax Act
(2)
|
(0.01
|
)
|
—
|
|
0.05
|
|
—
|
|
—
|
|
—
|
|
—
|
|
—
|
|
||||||||||||||||
|
Non-GAAP earnings (loss) per share attributable to common stockholders - diluted
|
$
|
0.17
|
|
$
|
0.09
|
|
$
|
0.07
|
|
$
|
0.04
|
|
$
|
(0.04
|
)
|
$
|
0.03
|
|
$
|
0.42
|
|
$
|
0.16
|
|
||||||||
(1)
For fiscal 2018, the preferred stock warrant liability was dilutive and included in earnings per share attributable to common stockholders - diluted. Therefore, it is not an adjustment to arrive at non-GAAP EPS - diluted.
(2)
The U.S. government enacted comprehensive tax legislation in December 2017. This resulted in a net charge of
$4.7 million
for the three months ended January 27, 2018 and a net benefit of
$0.5 million
for the three months ended July 28, 2018, due to the remeasurement of our net deferred tax assets for the reduction in tax rate from 35% to 21%. The adjustment to non-GAAP net income only includes this transitional impact. It does not include the ongoing impacts of the lower U.S. statutory rate on current year earnings.
The following table sets forth components of results of operations as a percentage of revenue:
|
Quarter Ended
|
||||||||||||||||||||||||
|
July 28, 2018
|
April 28, 2018
|
January 27, 2018
|
October 28, 2017
|
July 29, 2017
|
April 29, 2017
|
January 28, 2017
|
October 29, 2016
|
|||||||||||||||||
|
Revenue, net
|
100.0
|
%
|
100.0
|
%
|
100.0
|
%
|
100.0
|
%
|
100.0
|
%
|
100.0
|
%
|
100.0
|
%
|
100.0
|
%
|
||||||||
|
Cost of goods sold
|
55.6
|
%
|
56.4
|
%
|
57.0
|
%
|
56.3
|
%
|
56.5
|
%
|
57.0
|
%
|
55.1
|
%
|
53.4
|
%
|
||||||||
|
Gross profit
|
44.4
|
%
|
43.6
|
%
|
43.0
|
%
|
43.7
|
%
|
43.5
|
%
|
43.0
|
%
|
44.9
|
%
|
46.6
|
%
|
||||||||
|
Selling, general and administrative expenses
|
41.9
|
%
|
40.6
|
%
|
37.8
|
%
|
40.5
|
%
|
43.4
|
%
|
41.4
|
%
|
44.5
|
%
|
35.4
|
%
|
||||||||
|
Operating income
|
2.5
|
%
|
3.0
|
%
|
5.2
|
%
|
3.2
|
%
|
0.1
|
%
|
1.6
|
%
|
0.4
|
%
|
11.2
|
%
|
||||||||
|
Remeasurement of preferred stock warrant liability
|
—
|
%
|
—
|
%
|
(0.6
|
)%
|
(3.1
|
)%
|
1.3
|
%
|
5.2
|
%
|
0.5
|
%
|
0.6
|
%
|
||||||||
|
Other income, net
|
(0.2
|
)%
|
(0.1
|
)%
|
—
|
%
|
—
|
%
|
—
|
%
|
—
|
%
|
—
|
%
|
—
|
%
|
||||||||
|
Income (loss) before income taxes
|
2.7
|
%
|
3.1
|
%
|
5.8
|
%
|
6.3
|
%
|
(1.2
|
)%
|
(3.6
|
)%
|
(0.1
|
)%
|
10.6
|
%
|
||||||||
|
Provision (benefit) for income taxes
|
(3.0
|
)%
|
0.1
|
%
|
4.6
|
%
|
1.7
|
%
|
0.5
|
%
|
0.3
|
%
|
(0.2
|
)%
|
5.0
|
%
|
||||||||
|
Net income (loss) and comprehensive income (loss)
|
5.7
|
%
|
3.0
|
%
|
1.2
|
%
|
4.6
|
%
|
(1.7
|
)%
|
(3.9
|
)%
|
0.1
|
%
|
5.6
|
%
|
||||||||
Our quarterly revenue increased for all periods presented primarily due to increases in active clients. Our growth rate fluctuated from quarter to quarter and we expect that it will continue to do so because of a variety of factors, including the success of our marketing initiatives, our ability to match merchandise to client demand, the launch of new categories and product types, seasonality and economic cycles that influence retail apparel purchase trends. Seasonality in our business does not follow that of traditional retailers, such as typical concentration of revenue in the holiday quarter. For example, in the three months ended
January 27, 2018
, we experienced a lower quarter over quarter growth rate due to slower active client growth during the holiday season. Additionally, while we expect our revenue base to continue to expand, our revenue may increase at a lower rate as compared to our prior periods.
Our quarterly gross profit increased for all periods presented, except for the three months ended
January 27, 2018
,
April 29, 2017
, and
January 28, 2017
. Our gross profit decreased in the three months ended
January 27, 2018
, as compared to the three months ended
October 28, 2017
, due to higher than expected clearance on fall goods following an extended summer season. Our gross profit decreased
37
in the three months ended
April 29, 2017
, as compared to the three months ended
January 28, 2017
, primarily due to an increase in the inventory provision as a result of a higher balance of inventory. Our gross profit decreased in the three months ended
January 28, 2017
, as compared to the three months ended
October 29, 2016
, due to slower revenue growth over the holidays and increased inventory write-offs.
Our selling, general and administrative expenses increased for all periods presented, except for the three months ended
January 27, 2018
, and
April 29, 2017
, primarily due to increased compensation and benefits as a result of growth in headcount and higher marketing expenses as we continued to grow our business. In addition, our selling, general and administrative expenses in the three months ended
January 28, 2017
, was impacted by a compensation expense of $21.3 million, related to certain stock sales by current and former employees, which were discrete transactions and consequently led to a decrease in selling, general and administrative expenses from the three months ended
January 28, 2017
, to the three months ended
April 29, 2017
. Excluding this discrete transaction, our selling, general and administrative expenses increased significantly in the three months ended
April 29, 2017
, due to increased marketing expenses as we expanded our television, online and radio advertising initiatives. The decrease in selling, general and administrative expenses from the three months ended
October 28, 2017
, to the three months ended
January 27, 2018
, was primarily related to an increase in advertising spend due to certain marketing initiatives during the three months ended
October 28, 2017
, that did not reoccur the following quarter.
We had net income for all periods presented except for the three months ended
July 29, 2017
and
April 29, 2017
. Our net loss in the three months ended
July 29, 2017
and
April 29, 2017
, was driven by the
$3.4 million
and
$12.9 million
expense, respectively, related to the remeasurement of the preferred stock warrant liability due to increases in the underlying fair value of our preferred stock. In addition, our net income for the three months ended
January 28, 2017
, was impacted by the discrete transaction mentioned above.
We had positive adjusted EBITDA for all periods presented. We had positive non-GAAP net income for all periods presented except for the three months ended
July 29, 2017
. The decline in the three months ended
April 29, 2017
, and
July 29, 2017
, for both adjusted EBITDA and non-GAAP net income (loss) was primarily due to increased headcount and increased marketing expenses as we expanded our television, online and radio advertising initiatives.
Liquidity and Capital Resources
Sources of Liquidity
Our principal sources of liquidity since inception have been our cash flows from operations, as well as the net proceeds we received through private sales of equity securities and our IPO. We have had positive and growing cash flows from operations since 2014. As of
July 28, 2018
, we had raised an aggregate of
$169.6 million
of equity capital including proceeds from our IPO. We had
$297.5 million
of cash and
$12.9 million
of restricted cash as of
July 28, 2018
.
Our primary use of cash includes operating costs such as merchandise purchases, compensation and benefits, marketing and other expenditures necessary to support our business growth. We have been able to fund these costs through our cash flows from operations since 2014 and expect to continue to do so. We believe our existing cash balances and cash flows from operations will be sufficient to meet our working capital and capital expenditure needs for at least the next 12 months.
Cash Flows
The following table summarizes our cash flows for the periods indicated and our cash and working capital balances as of the end of the period (in thousands):
|
For the Fiscal Year Ended
|
||||||||||||
|
(in thousands)
|
July 28, 2018
|
July 29, 2017
|
July 30, 2016
|
|||||||||
|
Net cash provided by operating activities
|
$
|
72,178
|
|
$
|
38,624
|
|
$
|
45,116
|
|
|||
|
Net cash used in investing activities
|
(16,565
|
)
|
(17,130
|
)
|
(15,238
|
)
|
||||||
|
Net cash provided by (used in) financing activities
|
134,795
|
|
(3,028
|
)
|
499
|
|
||||||
|
Net increase in cash and restricted cash
|
$
|
190,408
|
|
$
|
18,466
|
|
$
|
30,377
|
|
|||
Cash provided by operating activities
During the
fiscal year ended
July 28, 2018
, cash provided by operating activities was
$72.2 million
, which consisted of net income of
$44.9 million
, adjusted by non-cash charges of
$23.9 million
and a change of
$3.4 million
in our net operating assets and liabilities. The non-cash charges were largely driven by
$15.4 million
of stock-based compensation expense,
$10.5 million
of depreciation and amortization and a
$6.6 million
increase in deferred tax expense primarily related to a remeasurement of our net deferred tax assets under the Tax Act, partially offset by
$10.7 million
related to the remeasurement of the preferred stock warrant liability. The change in our net operating assets and liabilities was primarily due to an increase of
$35.5 million
in accounts payable related to the increased business activity, substantially offset by an increase of
$19.4 million
in our inventory balance due to increased inventory purchases to support our growth.
During
the
fiscal year ended
July 29, 2017
, cash provided by operating activities was $38.6 million, which was primarily due to net loss
of $0.6 million and non-cash expenses of $36.6 million. The non-cash expenses were largely driven by $18.9 million in expenses related
38
to the remeasurement of the preferred stock warrant liability, a $13.2 million non-cash compensation expense related to stock-based compensation and certain stock sales by the then-current and former employees, $7.7 million of depreciation and amortization and a $3.6 million increase in our inventory reserve, partially offset by a $6.7 million increase in our deferred tax asset.
During the
fiscal year ended
July 30, 2016
, cash provided by operating activities was $45.1 million, which was primarily due to net income of $33.2 million and non-cash expenses of $13.2 million. The non-cash expenses were largely driven by a $4.8 million non-cash compensation expense related to a stock sale by an employee, a $5.9 million increase in our inventory reserve and $3.5 million of depreciation and amortization, partially offset by a $5.9 million increase in our deferred tax asset.
Cash used in investing activities
During the
fiscal year ended
July 28, 2018
, cash used in investing activities was
$16.6 million
, due to the purchase of property and equipment primarily related to the expansion of our fulfillment centers and offices as well as continued investment in our proprietary systems.
During the
fiscal year ended
July 29, 2017
and
July 30, 2016
, cash used in investing activities was $17.1 million and $15.2 million, respectively, due to the purchase of property and equipment primarily related to the expansion of our fulfillment centers and offices.
Cash (used in) provided by financing activities
During the
fiscal year ended
July 28, 2018
, cash provided by financing activities was
$134.8 million
, which was primarily due to the net proceeds from our IPO.
During the
fiscal year ended
July 29, 2017
, cash used in financing activities was $3.0 million, which was primarily due to $3.6 million for the repurchase of our common stock in a tender offer and $1.9 million in deferred payments for offering costs, partially offset by $2.3 million in proceeds from the issuance of common stock upon exercise of stock options.
During
fiscal year ended
July 30, 2016
, cash provided by financing activities was $0.5 million, which was primarily due to proceeds from the exercise of stock options.
Contractual Obligations and Other Commitments
The following table summarizes our contractual obligations as of
July 28, 2018
:
|
Payments Due by Period
|
||||||||||||||||||||
|
(in thousands)
|
Total
|
Less than 1 year
|
1 - 3 years
|
3 - 5 years
|
More than 5 years
|
|||||||||||||||
|
Operating leases
|
$
|
149,656
|
|
$
|
19,756
|
|
$
|
38,669
|
|
$
|
32,072
|
|
$
|
59,159
|
|
|||||
|
Purchase commitments
(1)
|
234,065
|
|
234,057
|
|
8
|
|
—
|
|
—
|
|
||||||||||
|
Unrecognized tax benefits
(2)
|
—
|
|
—
|
|
—
|
|
—
|
|
—
|
|
||||||||||
|
Total
|
$
|
383,721
|
|
$
|
253,813
|
|
$
|
38,677
|
|
$
|
32,072
|
|
$
|
59,159
|
|
|||||
(1)
Represents estimated open purchase orders to purchase inventory in the normal course of business.
(2)
Due to the uncertainty with respect to the timing of future cash flows associated with our
$5.5 million
of unrecognized tax benefits at
July 28, 2018
, we are unable to make reasonably reliable estimates of the period of cash settlement with the respective taxing authorities. Therefore, the related balances have not been included in the table above.
Off-Balance Sheet Arrangements
We have not entered any off-balance sheet arrangements and do not have any holdings in variable interest entities.
Critical Accounting Policies and Estimates
Our consolidated financial statements are prepared in accordance with GAAP. The preparation of our financial statements requires us to make assumptions and estimates about future events and apply judgments that affect the reported amounts of assets, liabilities, revenues and expenses and the related disclosures. We base our estimates on historical experience and other assumptions that we believe to be reasonable under the circumstances. Actual results may differ from these estimates. The critical accounting policies, estimates and judgments that we believe to have the most significant impacts to our consolidated financial statements are described below.
Inventory
Inventory consists of finished goods, which are recorded at the lower of cost or net realizable value using the specific identification method. We establish a reserve for excess and slow-moving inventory we expect to write off based on historical trends. In addition, we estimate and accrue shrinkage and damage as a percentage of revenue based on historical trends. Inventory shrinkage and damage estimates are made to reduce the inventory value for lost, stolen or damaged items. If actual experience differs significantly from our estimates, our operating results could be adversely affected.
39
Stock-Based Compensation
We grant stock options to our employees, consultants and members of our board of directors and recognize stock-based compensation expense based on the fair value of stock options at grant date. We estimate the fair value of stock options using the Black-Scholes option-pricing model. This model requires us to use certain estimates and assumptions such as:
|
•
|
Fair value of our common stock-estimated using the methodology as discussed below in
Common Stock Valuation
;
|
|
•
|
Expected volatility of our common stock-based on the volatility of comparable publicly traded companies;
|
|
•
|
Expected term of our stock options-as we do not have sufficient historical experience for determining the expected term of the stock option awards granted, we base our expected term on the simplified method, generally calculated as the mid-point between the vesting date and the end of the contractual term;
|
|
•
|
Expected dividend yield-as we have not paid and do not anticipate paying dividends on our common stock, our expected dividend yield is 0%; and
|
|
•
|
Risk-free interest rates-based on the U.S. Treasury zero coupon notes in effect at the grant date with maturities equal to the expected terms of the options granted.
|
If any of the assumptions used in the Black-Scholes option-pricing model changes significantly, stock-based compensation for future awards may differ materially compared with the awards granted previously.
We record stock-based compensation expense net of estimated forfeitures so that expense is recorded for only those stock options that we expect to vest. We estimate forfeitures based on our historical forfeiture of stock options adjusted to reflect future changes in facts and circumstances, if any. We will revise our estimated forfeiture rate if actual forfeitures differ from our initial estimates.
We have granted certain option awards that contain both service and performance conditions. The service condition for such awards is satisfied ratably over the 24-month period following the fourth anniversary of the grant date. The performance condition for such awards was satisfied if we consummated an IPO, within 12 months of the grant date. Expense related to awards which contain both service and performance conditions is recognized using the accelerated attribution method. Since an IPO is not deemed probable until such event occurs, no compensation cost related to the performance condition was recognized prior to the consummation of our IPO in November 2017. Subsequently, we recorded stock-based compensation expense of $0.5 million related to periods prior to the IPO.
Common Stock Valuations
Prior to our IPO in November 2017, the valuation of our common stock was determined based on the guidelines outlined in the American Institute of Certified Public Accountants Accounting & Valuation Guide, Valuation of Privately-Held-Company Equity Securities Issued as Compensation.
We considered objective and subjective factors to determine our best estimate of the fair value of our common stock including the following factors:
|
•
|
contemporaneous valuations of our common stock by an independent valuation specialist;
|
|
•
|
the prices, rights, preferences and privileges of our convertible preferred stock relative to the common stock;
|
|
•
|
the prices of our common stock in sale transactions;
|
|
•
|
our operating and financial performance and projections;
|
|
•
|
the likelihood of achieving a liquidity event, such as an IPO given internal company and external market condition;
|
|
•
|
the lack of marketability of our common stock;
|
|
•
|
the market multiples of comparable publicly traded companies; and
|
|
•
|
macroeconomic conditions and outlook.
|
In 2016 and through the three months ended October 29, 2016, the equity value of our business was determined using the market approach. The market approach estimates the fair value of a company by applying market multiples of comparable publicly traded companies in the same industry or similar lines of business. The selection of our comparable industry peer companies requires us to make significant judgments as to the comparability of these companies to us. We considered several factors including business description, business size, market share, revenue model, development stage and historical operating results. The equity value was then allocated to the common stock using the Option Pricing Method, or OPM. The OPM treats common shares and preferred shares as call options on the total equity value of a company, with exercise prices based on the value thresholds at which the allocation among the various holders of a company’s securities changes. Under this method, the common shares have value only if the funds available for distribution to stockholders exceed the value of the preferred shares liquidation preferences at the time of the liquidity event, such as a strategic sale or a merger.
Starting in the three months ended January 28, 2017, we began using a hybrid method, which is an application of the Probability Weighted Expected Return Method, or PWERM, in which at least one of the scenarios includes an OPM analysis. In our application of the hybrid
40
method a discrete IPO scenario was weighted with an OPM analysis (intended to represent exit scenarios other than the defined IPO scenario). For the IPO scenario, our enterprise value was estimated using a market approach. The market approach estimated the fair value of our company by applying market multiples derived from companies that recently completed IPO transactions. We then applied an appropriate weighting to the results of each scenario to determine the per share fair value of our common stock. The determination of the weighting requires significant judgment including our overall expectations for a possible IPO.
Subsequent to the completion of our IPO in November 2017, the fair value of our common stock is based on observable market prices.
Remeasurement of Preferred Stock Warrant Liability
Our preferred stock warrants are classified as liabilities and recorded at fair value at the end of each reporting period with the change in fair value recorded in the statements of operations. We estimate the fair value of our preferred stock using a methodology and assumptions that are consistent with those used in estimating the fair value of our common stock discussed above. We continued to remeasure these warrants until they were exercised for no consideration in connection with our IPO.
Income Taxes
We are subject to income taxes in the United States. We compute our provision for income taxes using the asset and liability method, under which deferred tax assets and liabilities are recognized for the expected future tax consequences of temporary differences between the financial reporting and tax bases of assets and liabilities and for tax credit carryforwards. Deferred tax assets and liabilities are measured using the currently enacted tax rates that are expected to apply to taxable income for the years in which those tax assets and liabilities are expected to be realized or settled.
Significant judgment is required in determining our uncertain tax positions. We continuously review issues raised in connection with all ongoing examinations and open tax years to evaluate the adequacy of our tax liabilities. We evaluate uncertain tax positions under a two-step approach. The first step is to evaluate the uncertain tax position for recognition by determining if the weight of available evidence indicates that it is more likely than not that the position will be sustained upon examination based on its technical merits. The second step is, for those positions that meet the recognition criteria, to measure the tax benefit as the largest amount that is more than 50% likely of being realized. We believe our recorded tax liabilities are adequate to cover all open tax years based on our assessment. This assessment relies on estimates and assumptions and involves significant judgments about future events. To the extent that our view as to the outcome of these matters changes, we will adjust income tax expense in the period in which such determination is made. We classify interest and penalties related to income taxes as income tax expense.
Revenue Recognition
While our revenue recognition does not involve significant judgment, it represents an important accounting policy. Revenue is recognized net of sales taxes, discounts and estimated refunds. We generate revenue when clients purchase merchandise, at which point we apply the nonrefundable upfront styling fee against the price of merchandise purchased. If none of the items within the Fix are purchased, we recognize the nonrefundable upfront styling fee as revenue at that time. For Style Pass clients, we recognize revenue at the earlier of the time the annual Style Pass fee is applied against the price of merchandise purchased or the expiry of the annual period. If a client exchanges an item, we recognize revenue at the time the client receives the new item. Sales tax collected from clients is not considered revenue and is included in accrued liabilities until remitted to the taxing authorities. Discounts are recorded as a reduction to revenue when merchandise is purchased. We record a refund reserve based on our historical refund patterns.
We sell gift cards to clients and establish a liability based on the face value of such gift cards. The liability is relieved and we recognize revenue upon redemption by our clients. For unredeemed gift cards, we will recognize revenue when the likelihood of gift card redemption becomes remote. To date, we have not recognized any revenue related to unredeemed gift cards as we are unable to determine whether the possibility of redemption has become remote.
Recent Accounting Pronouncements
For recent accounting pronouncements, please see "Significant Accounting Policies" in Note 2 of the Notes to Consolidated Financial Statements included in this Annual Report.
41
Interest Rate Risk
We had
$175.2 million
in cash equivalents as of
July 28, 2018
, which consisted of highly liquid investments placed in money market funds. These investments are valued at their original purchase prices plus interest accrued at the stated rate. These interest-earning instruments carry a degree of interest rate risk; to date, however, fluctuations in our interest income have not been significant. In 2018, interest income on these investments was
$0.2 million
.
A hypothetical 10% change in interest rates during any of the periods presented would not have had a material impact on our consolidated financial statements.
42
STITCH FIX, INC.
INDEX TO CONSOLIDATED FINANCIAL STATEMENTS
|
Page
Number
|
||
|
Consolidated Financial Statements:
|
||
43
REPORT OF INDEPENDENT REGISTERED PUBLIC ACCOUNTING FIRM
To the Board of Directors and Stockholders of Stitch Fix, Inc.:
Opinion on the Financial Statements
We have audited the accompanying consolidated balance sheets of Stitch Fix, Inc. and subsidiaries (the "Company") as of July 28, 2018 and July 29, 2017, and the related consolidated statements of operations and comprehensive income (loss), convertible preferred stock and stockholders' equity, and cash flow for each of the fiscal years ended July 28, 2018, July 29, 2017 and July 30, 2016, and the related notes (collectively referred to as the “financial statements”). In our opinion, the financial statements present fairly, in all material respects, the financial position of the Company as of July 28, 2018 and July 29, 2017, and the results of its operations and its cash flow for each of the fiscal years ended July 28, 2018, July 29, 2017 and July 30, 2016, in conformity with accounting principles generally accepted in the United States of America.
Basis for Opinion
These financial statements are the responsibility of the Company's management. Our responsibility is to express an opinion on the Company's financial statements based on our audits. We are a public accounting firm registered with the Public Company Accounting Oversight Board (United States) (PCAOB) and are required to be independent with respect to the Company in accordance with the U.S. federal securities laws and the applicable rules and regulations of the Securities and Exchange Commission and the PCAOB.
We conducted our audits in accordance with the standards of the PCAOB. Those standards require that we plan and perform the audit to obtain reasonable assurance about whether the financial statements are free of material misstatement, whether due to error or fraud. The Company is not required to have, nor were we engaged to perform, an audit of its internal control over financial reporting. As part of our audits, we are required to obtain an understanding of internal control over financial reporting but not for the purpose of expressing an opinion on the effectiveness of the Company’s internal control over financial reporting. Accordingly, we express no such opinion.
Our audits included performing procedures to assess the risks of material misstatement of the financial statements, whether due to error or fraud, and performing procedures that respond to those risks. Such procedures included examining, on a test basis, evidence regarding the amounts and disclosures in the financial statements. Our audits also included evaluating the accounting principles used and significant estimates made by management, as well as evaluating the overall presentation of the financial statements. We believe that our audits provide a reasonable basis for our opinion.
/s/ Deloitte & Touche LLP
San Francisco, California
October 3, 2018
We have served as the Company's auditor since 2014.
44
Stitch Fix, Inc.
(In thousands, except share and per share amounts)
|
July 28, 2018
|
July 29, 2017
|
|||||||
|
Assets
|
||||||||
|
Current assets:
|
||||||||
|
Cash and cash equivalents
|
$
|
297,516
|
|
$
|
110,608
|
|
||
|
Restricted cash
|
250
|
|
250
|
|
||||
|
Inventory, net
|
85,092
|
|
67,592
|
|
||||
|
Prepaid expenses and other current assets
|
34,148
|
|
19,312
|
|
||||
|
Total current assets
|
417,006
|
|
197,762
|
|
||||
|
Property and equipment, net
|
34,169
|
|
26,733
|
|
||||
|
Deferred tax assets
|
14,107
|
|
19,991
|
|
||||
|
Restricted cash, net of current portion
|
12,600
|
|
9,100
|
|
||||
|
Other long-term assets
|
3,703
|
|
3,619
|
|
||||
|
Total assets
|
$
|
481,585
|
|
$
|
257,205
|
|
||
|
Liabilities, Convertible Preferred Stock and Stockholders’ Equity
|
||||||||
|
Current liabilities:
|
||||||||
|
Accounts payable
|
$
|
79,782
|
|
$
|
44,238
|
|
||
|
Accrued liabilities
|
43,037
|
|
46,363
|
|
||||
|
Preferred stock warrant liability
|
—
|
|
26,679
|
|
||||
|
Gift card liability
|
6,814
|
|
5,190
|
|
||||
|
Deferred revenue
|
8,870
|
|
7,150
|
|
||||
|
Other current liabilities
|
3,729
|
|
4,298
|
|
||||
|
Total current liabilities
|
142,232
|
|
133,918
|
|
||||
|
Deferred rent, net of current portion
|
15,288
|
|
11,781
|
|
||||
|
Other long-term liabilities
|
8,993
|
|
7,423
|
|
||||
|
Total liabilities
|
166,513
|
|
153,122
|
|
||||
|
Commitments and contingencies (Note 7)
|
|
|
||||||
|
Convertible preferred stock, $0.00002 par value – zero and 60,577,280 shares authorized as of July 28, 2018 and July 29, 2017, respectively; zero and 59,511,055 shares issued and outstanding as of July 28, 2018 and July 29, 2017, respectively; aggregate liquidation preference of $42,389 as of July 29, 2017
|
—
|
|
42,222
|
|
||||
|
Stockholders’ equity:
|
||||||||
|
Preferred stock, $0.00002 par value – 20,000,000 and zero shares authorized as of July 28, 2018 and
July 29, 2017, respectively; zero shares issued and outstanding as of July 28, 2018 and July 29, 2017 |
—
|
|
—
|
|
||||
|
Class A common stock, $0.00002 par value – 2,000,000,000 and zero shares authorized as of
July 28, 2018 and July 29, 2017, respectively; 35,756,628 and zero shares issued and outstanding as of July 28, 2018 and July 29, 2017, respectively |
1
|
|
—
|
|
||||
|
Class B common stock, $0.00002 par value – 100,000,000 shares authorized as of July 28, 2018 and
July 29, 2017; 63,043,233 and 26,834,535 shares issued and outstanding as of July 28, 2018 and July 29, 2017, respectively (1) |
1
|
|
1
|
|
||||
|
Additional paid-in capital
|
235,312
|
|
27,002
|
|
||||
|
Retained earnings
|
79,758
|
|
34,858
|
|
||||
|
Total stockholders’ equity
|
315,072
|
|
61,861
|
|
||||
|
Total liabilities, convertible preferred stock and stockholders’ equity
|
$
|
481,585
|
|
$
|
257,205
|
|
||
(1)
Shares authorized, issued and outstanding as of July 29, 2017 includes common stock prior to our initial public offering. See Note 1 for additional details.
The accompanying notes are an integral part of these consolidated financial statements.
45
Stitch Fix, Inc.
(In thousands, except share and per share amounts)
|
For the Fiscal Year Ended
|
||||||||||||
|
July 28, 2018
|
July 29, 2017
|
July 30, 2016
|
||||||||||
|
Revenue, net
|
$
|
1,226,505
|
|
$
|
977,139
|
|
$
|
730,313
|
|
|||
|
Cost of goods sold
|
690,483
|
|
542,718
|
|
407,064
|
|
||||||
|
Gross profit
|
536,022
|
|
434,421
|
|
323,249
|
|
||||||
|
Selling, general and administrative expenses
|
492,998
|
|
402,781
|
|
259,021
|
|
||||||
|
Operating income
|
43,024
|
|
31,640
|
|
64,228
|
|
||||||
|
Remeasurement of preferred stock warrant liability
|
(10,685
|
)
|
18,881
|
|
3,019
|
|
||||||
|
Other income, net
|
(1,004
|
)
|
(42
|
)
|
(13
|
)
|
||||||
|
Income before income taxes
|
54,713
|
|
12,801
|
|
61,222
|
|
||||||
|
Provision for income taxes
|
9,813
|
|
13,395
|
|
28,041
|
|
||||||
|
Net income (loss) and comprehensive income (loss)
|
$
|
44,900
|
|
$
|
(594
|
)
|
$
|
33,181
|
|
|||
|
Net income (loss) attributable to common stockholders:
|
||||||||||||
|
Basic
|
$
|
35,541
|
|
$
|
(594
|
)
|
$
|
8,211
|
|
|||
|
Diluted
|
$
|
27,285
|
|
$
|
(594
|
)
|
$
|
9,496
|
|
|||
|
Earnings (loss) per share attributable to common stockholders:
|
||||||||||||
|
Basic
|
$
|
0.47
|
|
$
|
(0.02
|
)
|
$
|
0.36
|
|
|||
|
Diluted
|
$
|
0.34
|
|
$
|
(0.02
|
)
|
$
|
0.34
|
|
|||
|
Weighted-average shares used to compute earnings per share attributable to common stockholders:
|
||||||||||||
|
Basic
|
75,947,759
|
|
24,973,931
|
|
22,729,890
|
|
||||||
|
Diluted
|
81,288,418
|
|
24,973,931
|
|
27,882,844
|
|
||||||
The accompanying notes are an integral part of these consolidated financial statements.
46
Stitch Fix, Inc.
Consolidated Statements of Convertible Preferred Stock and Stockholders’ Equity
(In thousands, except share amounts)
|
Convertible
Preferred Stock |
Common Stock
|
Additional
Paid-In
Capital
|
Retained
Earnings
|
Total
Stockholders'
Equity
|
|||||||||||||||||||||||
|
Shares
|
Amount
|
Shares
|
Amount
|
||||||||||||||||||||||||
|
Balance as of August 1, 2015
|
59,511,055
|
|
$
|
42,222
|
|
24,933,448
|
|
$
|
—
|
|
$
|
2,711
|
|
$
|
5,828
|
|
$
|
8,539
|
|
||||||||
|
Compensation expense related to a stock sale by an employee
|
—
|
|
—
|
|
—
|
|
—
|
|
4,810
|
|
—
|
|
4,810
|
|
|||||||||||||
|
Issuance of common stock upon exercise of stock options, net of amount related to early exercised options of $85
|
—
|
|
—
|
|
939,986
|
|
—
|
|
351
|
|
—
|
|
351
|
|
|||||||||||||
|
Vesting of early exercised options
|
—
|
|
—
|
|
—
|
|
—
|
|
1,095
|
|
—
|
|
1,095
|
|
|||||||||||||
|
Stock-based compensation expense
|
—
|
|
—
|
|
—
|
|
—
|
|
1,908
|
|
—
|
|
1,908
|
|
|||||||||||||
|
Excess tax benefit related to stock-based compensation
|
—
|
|
—
|
|
—
|
|
—
|
|
63
|
|
—
|
|
63
|
|
|||||||||||||
|
Net income
|
—
|
|
—
|
|
—
|
|
—
|
|
—
|
|
33,181
|
|
33,181
|
|
|||||||||||||
|
Balance as of July 30, 2016
|
59,511,055
|
|
$
|
42,222
|
|
25,873,434
|
|
$
|
—
|
|
$
|
10,938
|
|
$
|
39,009
|
|
$
|
49,947
|
|
||||||||
|
Compensation expense related to certain stock sales by current and former employees
|
—
|
|
—
|
|
—
|
|
—
|
|
9,699
|
|
—
|
|
9,699
|
|
|||||||||||||
|
Issuance of common stock upon exercise of stock options, net of amount related to early exercised options of $642
|
—
|
|
—
|
|
1,462,434
|
|
—
|
|
1,704
|
|
—
|
|
1,704
|
|
|||||||||||||
|
Vesting of early exercised options
|
—
|
|
—
|
|
—
|
|
1
|
|
890
|
|
—
|
|
891
|
|
|||||||||||||
|
Repurchase of common stock
|
—
|
|
—
|
|
(501,333
|
)
|
—
|
|
—
|
|
(3,557
|
)
|
(3,557
|
)
|
|||||||||||||
|
Stock-based compensation
|
—
|
|
—
|
|
—
|
|
—
|
|
3,709
|
|
—
|
|
3,709
|
|
|||||||||||||
|
Excess tax benefit related to stock-based compensation
|
—
|
|
—
|
|
—
|
|
—
|
|
62
|
|
—
|
|
62
|
|
|||||||||||||
|
Net income
|
—
|
|
—
|
|
—
|
|
—
|
|
—
|
|
(594
|
)
|
(594
|
)
|
|||||||||||||
|
Balance as of July 29, 2017
|
59,511,055
|
|
$
|
42,222
|
|
26,834,535
|
|
$
|
1
|
|
$
|
27,002
|
|
$
|
34,858
|
|
$
|
61,861
|
|
||||||||
|
Issuance of Class A common stock upon initial public offering, net of offering costs
|
—
|
|
—
|
|
9,175,557
|
|
—
|
|
127,033
|
|
—
|
|
127,033
|
|
|||||||||||||
|
Issuance of Class B common stock upon conversion of convertible preferred stock
|
(59,511,055
|
)
|
(42,222
|
)
|
59,511,055
|
|
1
|
|
42,221
|
|
—
|
|
42,222
|
|
|||||||||||||
|
Reclassification of warrant liability to additional paid-in capital upon the initial public offering
|
—
|
|
—
|
|
1,066,225
|
|
—
|
|
15,994
|
|
—
|
|
15,994
|
|
|||||||||||||
|
Issuance of Class B common stock upon exercise of stock options
|
—
|
|
—
|
|
2,192,430
|
|
—
|
|
6,384
|
|
—
|
|
6,384
|
|
|||||||||||||
|
Issuance of Class A restricted stock units, net of tax withholdings
|
—
|
|
—
|
|
39,538
|
|
—
|
|
(596
|
)
|
—
|
|
(596
|
)
|
|||||||||||||
|
Repurchase of Class B common stock related to early exercised options
|
—
|
|
—
|
|
(19,479
|
)
|
—
|
|
—
|
|
—
|
|
—
|
|
|||||||||||||
|
Vesting of early exercised options
|
—
|
|
—
|
|
—
|
|
—
|
|
988
|
|
—
|
|
988
|
|
|||||||||||||
|
Stock-based compensation
|
—
|
|
—
|
|
—
|
|
—
|
|
16,286
|
|
—
|
|
16,286
|
|
|||||||||||||
|
Net income
|
—
|
|
—
|
|
—
|
|
—
|
|
—
|
|
44,900
|
|
44,900
|
|
|||||||||||||
|
Balance as of July 28, 2018
|
—
|
|
$
|
—
|
|
98,799,861
|
|
$
|
2
|
|
$
|
235,312
|
|
$
|
79,758
|
|
$
|
315,072
|
|
||||||||
The accompanying notes are an integral part of these consolidated financial statements.
47
Stitch Fix, Inc.
(In thousands)
|
For the Fiscal Year Ended
|
||||||||||||
|
July 28, 2018
|
July 29, 2017
|
July 30, 2016
|
||||||||||
|
Cash Flows from Operating Activities
|
||||||||||||
|
Net income
|
$
|
44,900
|
|
$
|
(594
|
)
|
$
|
33,181
|
|
|||
|
Adjustments to reconcile net income to net cash provided by operating activities:
|
||||||||||||
|
Deferred income taxes
|
6,588
|
|
(6,728
|
)
|
(5,869
|
)
|
||||||
|
Remeasurement of preferred stock warrant liability
|
(10,685
|
)
|
18,881
|
|
3,019
|
|
||||||
|
Inventory reserves
|
1,916
|
|
3,591
|
|
5,941
|
|
||||||
|
Compensation expense related to certain stock sales by current and former employees
|
—
|
|
9,699
|
|
4,810
|
|
||||||
|
Stock-based compensation expense
|
15,403
|
|
3,545
|
|
1,850
|
|
||||||
|
Excess tax benefit related to stock-based compensation expense
|
—
|
|
(62
|
)
|
(63
|
)
|
||||||
|
Depreciation and amortization
|
10,542
|
|
7,655
|
|
3,544
|
|
||||||
|
Loss on disposal of property and equipment
|
155
|
|
—
|
|
—
|
|
||||||
|
Change in operating assets and liabilities:
|
||||||||||||
|
Inventory
|
(19,416
|
)
|
(26,375
|
)
|
(26,509
|
)
|
||||||
|
Prepaid expenses and other assets
|
(17,307
|
)
|
(7,596
|
)
|
(9,504
|
)
|
||||||
|
Accounts payable
|
35,502
|
|
7,841
|
|
10,192
|
|
||||||
|
Accrued liabilities
|
(3,595
|
)
|
17,748
|
|
10,904
|
|
||||||
|
Deferred revenue
|
1,720
|
|
2,719
|
|
1,574
|
|
||||||
|
Gift card liability
|
1,624
|
|
1,993
|
|
1,530
|
|
||||||
|
Other liabilities
|
4,831
|
|
6,307
|
|
10,516
|
|
||||||
|
Net cash provided by operating activities
|
72,178
|
|
38,624
|
|
45,116
|
|
||||||
|
Cash Flows from Investing Activities
|
||||||||||||
|
Purchase of property and equipment
|
(16,565
|
)
|
(17,130
|
)
|
(15,238
|
)
|
||||||
|
Net cash used in investing activities
|
(16,565
|
)
|
(17,130
|
)
|
(15,238
|
)
|
||||||
|
Cash Flows from Financing Activities
|
||||||||||||
|
Proceeds from initial public offering, net of underwriting discounts paid
|
129,046
|
|
—
|
|
—
|
|
||||||
|
Proceeds from the exercise of stock options
|
5,788
|
|
2,346
|
|
436
|
|
||||||
|
Excess tax benefit related to stock-based compensation expense
|
—
|
|
62
|
|
63
|
|
||||||
|
Repurchase of Class B common stock related to early exercised options
|
(39
|
)
|
(3,557
|
)
|
—
|
|
||||||
|
Payment of deferred offering costs
|
—
|
|
(1,879
|
)
|
—
|
|
||||||
|
Net cash provided by (used in) financing activities
|
134,795
|
|
(3,028
|
)
|
499
|
|
||||||
|
Net increase in cash and restricted cash
|
190,408
|
|
18,466
|
|
30,377
|
|
||||||
|
Cash and restricted cash at beginning of period
|
119,958
|
|
101,492
|
|
71,115
|
|
||||||
|
Cash and restricted cash at end of period
|
$
|
310,366
|
|
$
|
119,958
|
|
$
|
101,492
|
|
|||
|
Components of cash and restricted cash
|
||||||||||||
|
Cash
|
$
|
297,516
|
|
$
|
110,608
|
|
$
|
91,488
|
|
|||
|
Restricted cash – current portion
|
250
|
|
250
|
|
1,391
|
|
||||||
|
Restricted cash – long-term portion
|
12,600
|
|
9,100
|
|
8,613
|
|
||||||
|
Total cash and restricted cash
|
$
|
310,366
|
|
$
|
119,958
|
|
$
|
101,492
|
|
|||
|
Supplemental Disclosure
|
||||||||||||
|
Cash paid for income taxes
|
$
|
10,071
|
|
28,023
|
|
39,387
|
|
|||||
|
Supplemental Disclosure of Non-Cash Investing and Financing Activities:
|
||||||||||||
|
Purchases of property and equipment included in accounts payable and accrued liabilities
|
$
|
795
|
|
$
|
111
|
|
$
|
2,177
|
|
|||
|
Capitalized stock-based compensation
|
$
|
883
|
|
$
|
164
|
|
$
|
58
|
|
|||
|
Leasehold improvements paid by landlord
|
$
|
—
|
|
$
|
—
|
|
$
|
249
|
|
|||
|
Vesting of early exercised options
|
$
|
988
|
|
$
|
891
|
|
$
|
1,095
|
|
|||
|
Conversion of preferred stock upon initial public offering
|
$
|
42,222
|
|
$
|
—
|
|
$
|
—
|
|
|||
|
Reclassification of preferred stock warrant liability upon initial public offering
|
$
|
15,994
|
|
$
|
—
|
|
$
|
—
|
|
|||
|
Deferred offering costs included in accrued liabilities
|
$
|
—
|
|
$
|
508
|
|
$
|
—
|
|
|||
|
Deferred offering costs paid in prior year
|
$
|
1,879
|
|
$
|
—
|
|
$
|
—
|
|
|||
The accompanying notes are an integral part of these consolidated financial statements.
48
STITCH FIX, INC.
NOTES TO CONSOLIDATED FINANCIAL STATEMENTS
|
1.
|
Description of Business
|
Stitch Fix, Inc. (“we,” “our,” “us” or “the Company”) delivers one-to-one personalization to our clients through the combination of data science and human judgment. Our stylists hand select items from a broad range of merchandise. Stylists pair their own judgment with our analysis of client and merchandise data to provide a personalized shipment of apparel, shoes and accessories suited to each client’s needs. We call each of these unique shipments a Fix. After receiving a Fix, our clients purchase the items they want to keep and return the other items. We are incorporated in Delaware and have operations in the United States and the United Kingdom.
Initial Public Offering
On November 16, 2017, we completed an initial public offering, or IPO. In connection with the IPO, we authorized
two
new classes of common stock: Class A common stock and Class B common stock. The rights of the holders of Class A and Class B common stock are identical, except with respect to voting, conversion and transfer rights. Each share of Class A common stock is entitled to
one
vote per share and each share of Class B common stock is entitled to
ten
votes per share. Each share of Class B common stock is convertible at any time at the option of the stockholder into
one
share of Class A common stock and has no expiration date. The Class B common stock automatically converts to Class A common stock upon transfers or any sale. In the IPO, we issued and sold
8,000,000
shares of our Class A common stock at a public offering price of
$15.00
per share. We received
$110.4 million
in net proceeds after deducting
$6.2 million
of underwriting discounts and
$3.4 million
in offering costs. Upon the closing of the IPO, all of the then-outstanding shares of common stock were reclassified into Class B common stock, all of the outstanding shares of convertible preferred stock automatically converted into
59,511,055
shares of Class B common stock and all of the outstanding preferred stock warrants were automatically exercised into
1,066,225
shares of Class B common stock. Subsequent to the closing of the IPO, there were
no
shares of preferred stock or preferred stock warrants outstanding.
In December 2017, we issued an additional
1,175,557
shares of Class A common stock at a price of
$15.00
per share following the underwriters’ exercise of their option to purchase additional shares and received
$16.7 million
in net proceeds after deducting underwriting discounts and expenses.
|
2.
|
Significant Accounting Policies
|
Basis of Presentation
The consolidated financial statements and accompanying notes have been prepared in accordance with accounting principles generally accepted in the United States (“GAAP”). The consolidated financial statements include the accounts of Stitch Fix, Inc. and our wholly owned subsidiaries. All intercompany balances and transactions have been eliminated in consolidation.
Our fiscal year is a 52-week or 53-week period ending on the Saturday closest to July 31. The fiscal years ended
July 28, 2018
(“
2018
”),
July 29, 2017
(“
2017
”), and
July 30, 2016
, (“
2016
”) each consisted of 52 weeks.
Segment Information
We have
one
operating segment and
one
reportable segment as our chief operating decision maker, who is our Chief Executive Officer, reviews financial information on a consolidated basis for purposes of allocating resources and evaluating financial performance. All long-lived assets are located in the United States and all revenue is attributed to the United States.
Use of Estimates
The preparation of consolidated financial statements in conformity with GAAP requires management to make estimates and assumptions that affect the reported amounts in our consolidated financial statements and accompanying footnotes. Significant estimates and assumptions are used for inventory, stock-based compensation expense, common stock valuation and remeasurement of preferred stock warrant liability prior to IPO, income taxes and revenue recognition. Actual results could differ from those estimates and such differences may be material to the consolidated financial statements.
Cash and Cash Equivalents
Cash consists of bank deposits and amounts in transit from banks for client credit card and debit card transactions that will process in less than seven days. Cash equivalents consist of investments in short-term, highly liquid money market funds.
Restricted Cash
Restricted cash represents cash balances held in segregated accounts collateralizing letters of credit for our leased properties as of
July 28, 2018
, and
July 29, 2017
.
49
Inventory, net
Inventory consists of finished goods which are recorded at the lower of cost or net realizable value using the specific identification method. The cost of inventory consists of merchandise costs and in-bound freight costs. We establish a reserve for excess and slow-moving inventory we expect to write off based on historical trends. In addition, we estimate and accrue for shrinkage and damage as a percentage of revenue based on historical trends. Inventory shrinkage and damage estimates are made to reduce the inventory value for lost, stolen or damaged items.
The inventory reserve, which reduces inventory in our consolidated balance sheets, was
$17.6 million
and
$15.7 million
as of
July 28, 2018
, and
July 29, 2017
, respectively.
Property and Equipment, net
Property and equipment, net is recorded at cost less accumulated depreciation and amortization. Depreciation and amortization is recorded on a straight-line basis over the estimated useful lives of the respective assets. Repair and maintenance costs are expensed as incurred.
The estimated useful lives of our assets are as follows:
|
Estimated useful life
|
||
|
Computer equipment and capitalized software
|
3 years
|
|
|
Office furniture and equipment
|
5 years
|
|
|
Buildings
|
25 years
|
|
|
Leasehold improvements
|
Shorter of lease term or estimated useful life
|
|
We capitalize eligible costs to develop our proprietary systems, website and mobile app. Capitalization of such costs begins when the preliminary project stage is completed and it is probable that the project will be completed and the software will be used to perform the function intended. A subsequent addition, modification or upgrade to internal-use software is capitalized to the extent that it enhances the software’s functionality or extends its useful life. Costs related to design or maintenance are expensed as incurred.
Deferred Offering Costs
Deferred offering costs, which consist of direct incremental legal, consulting, banking and accounting fees relating to the IPO were capitalized and offset against proceeds upon the consummation of the IPO, which became effective on November 21, 2017.
In December 2017, we issued additional shares of Class A common stock following the underwriters’ exercise of their option to purchase additional shares. The related deferred offering costs were capitalized and offset against proceeds upon issuance of the shares.
Impairment of Long-Lived Assets
We review our long-lived assets for impairment whenever events or changes in circumstances indicate the carrying amount of an asset may not be recoverable. Recoverability of assets held and used is measured by comparison of the carrying amount of an asset to the future undiscounted cash flows expected to be generated from the use of the asset and its eventual disposition. If such assets are considered to be impaired, the impairment to be recognized is measured as the amount by which the carrying amount exceeds the fair value of the impaired assets. Assets to be disposed of are reported at the lower of their carrying amount or fair value less cost to sell. We have not recorded an impairment of long-lived assets since inception.
Preferred Stock Warrant Liability
We recorded our preferred stock warrants as current liabilities in the consolidated balance sheets at their estimated fair value because the warrants were exercisable at any time by the holders for cash at a purchase price per share equal to the lowest price per share at which we had sold shares of a specific series of our preferred stock or a number of shares of equivalent value as determined by a specified calculation. At initial recognition, we recorded these warrants at their estimated fair value. The liability associated with these warrants was subject to remeasurement at each balance sheet date, with changes in fair value recorded as remeasurement of preferred stock warrant liability in the consolidated statements of operations.
In November 2017, in connection with our IPO, the preferred stock warrants were automatically exercised into Class B common stock and the preferred stock warrant liability was reclassified to additional paid-in capital.
Revenue Recognition
We generate revenue from the sale of merchandise in a Fix. Clients create an online account on our website or mobile app, complete a style profile and order a Fix to be delivered on a specified date.
Each Fix represents an offer made by us to the client to purchase merchandise. The client is charged a nonrefundable
$20
upfront styling fee before the Fix is shipped. As an alternative to the styling fee, we offer select clients the option to purchase a Style Pass. Style Pass clients pay a
$49
nonrefundable annual fee for unlimited Fixes that is credited towards merchandise purchases. If the offer to purchase merchandise is accepted, we charge the client the order amount for the accepted merchandise, net of the upfront styling fee or Style Pass annual fee. For each Fix, acceptance occurs when the client checks out the merchandise on our website or mobile app. We offer a
25%
discount to clients that purchase all of the items in the Fix.
50
Both our styling fee and Style Pass arrangements consist of one unit of account, which is the sale of merchandise. The upfront styling fee is not a separate deliverable as there is no stand-alone value related to the styling activity. Similarly, the right to receive multiple options under Style Pass does not provide the customer with material stand-alone value. Both the upfront styling fee and Style Pass annual fee are included in deferred revenue until all revenue recognition criteria are met.
We recognize revenue when the following criteria are met: (1) persuasive evidence of an arrangement exists; (2) delivery has occurred; (3) the selling price is fixed or determinable; and (4) collectability is reasonably assured. These criteria are met when the client accepts or rejects the offer to purchase merchandise. Upon acceptance, the total amount of the order, including the upfront styling fee, is recognized as revenue. If none of the items within the Fix are accepted, the upfront styling fee is recognized as revenue at that time. The Style Pass annual fee is recognized at the earlier of the time at which a client accepts and applies the Style Pass fee to an offer to purchase merchandise or upon expiry of the annual period. Under Style Pass arrangements, if a client does not accept any items within the Fix, the annual fee will continue to be deferred until it is applied to a future purchase or upon expiry of the annual period. If a client would like to exchange an item, we recognize revenue at the time the client receives the new item, as that is when all revenue recognition criteria are met.
We deduct discounts, sales tax and estimated refunds to arrive at net revenue. Sales tax collected from clients is not considered revenue and is included in accrued liabilities until remitted to the taxing authorities. Discounts are recorded as a reduction to revenue when the order is accepted. We record a refund reserve based on our historical refund patterns. Our refund reserve, which was included in accrued liabilities in the consolidated balance sheets, was
$2.3 million
and
$1.6 million
as of
July 28, 2018
, and
July 29, 2017
, respectively.
Deferred revenue related to upfront styling fees and exchanges totaled
$7.8 million
and
$7.2 million
as of
July 28, 2018
, and
July 29, 2017
, respectively. Deferred revenue related to Style Pass annual fees totaled
$1.1 million
as of
July 28, 2018
; the Company did not offer Style Pass prior to fiscal year 2018. Deferred shipping costs related to Fixes shipped at period end but not checked out were
$1.4 million
and
$1.3 million
as of
July 28, 2018
, and
July 29, 2017
, respectively, and are included within prepaid expenses and other current assets in the consolidated balance sheets.
We sell gift cards to clients and establish a liability based upon the face value of such gift cards. We reduce the liability and recognize revenue upon the redemption of the gift card. If a gift card is not redeemed, we will recognize revenue when the likelihood of its redemption becomes remote. We have not recognized any revenue related to unredeemed gift cards as we are unable to determine whether the likelihood of redemption has become remote.
Cost of Goods Sold
Cost of goods sold consists of the costs of merchandise, expenses for shipping to and from clients and inbound freight, inventory write-offs and changes in our inventory reserve, payment processing fees and packaging material costs.
Selling, General and Administrative Expenses
Selling, general and administrative expenses consist primarily of compensation and benefits costs, including stock-based compensation expense, for our employees including our stylist, fulfillment center operations, data analytics, merchandising, engineering, client experience, marketing and corporate personnel. Selling, general and administrative expenses also include marketing and advertising, third-party logistics costs, facility costs for our fulfillment centers and offices, professional services fees, information technology and depreciation and amortization.
Advertising Expenses
Costs associated with the production of advertising, such as writing, copy, printing and other production costs are expensed as incurred. Costs associated with communicating advertising on television and radio are expensed the first time the advertisement is run. Online advertising costs are expensed as incurred. Advertising costs totaled
$102.1 million
,
$70.5 million
and
$25.0 million
for
2018
,
2017
and
2016
, respectively, and are included within selling, general and administrative expenses in the consolidated statements of operations.
Marketing Programs
We have a client referral program under which we issue credits for future purchases to clients when the referral results in a new client who has ordered a Fix. We record a liability at the time of issuing the credit and reduce the liability upon application of the credit to a client’s purchase. Our liability for client referral credits amounted to
$2.7 million
and
$2.3 million
as of
July 28, 2018
, and
July 29, 2017
, respectively. We also have an affiliate program under which we make cash payments to lifestyle or fashion bloggers or others who refer clients in high volumes. Amounts related to both of these programs are included within selling, general and administrative expenses in the consolidated statements of operations.
51
Leases
We recognize rent expense over the term of the lease, starting when the property is made available for use to us by the landlord. When a lease contains a predetermined fixed rent escalation, we recognize the related rent expense on a straight-line basis and record the difference between the recognized rent expense and the amounts paid under the lease as deferred rent included in other current liabilities and deferred rent, net of current portion, on the consolidated balance sheets. We also receive tenant allowances upon entering into certain leases, which are recorded as a liability and amortized using the straight-line method as a reduction to rent expense over the term of the lease.
Income Taxes
We account for income taxes using the asset and liability method, under which deferred tax assets and liabilities are recognized for the expected future tax consequences of temporary differences between the financial reporting and tax bases of assets and liabilities and for operating losses and tax credit carryforwards. Deferred tax assets and liabilities are measured using the currently enacted tax rates that apply to taxable income in effect for the years in which they are expected to be realized or settled.
We believe that it is more likely than not that forecasted income and potential income from tax planning strategies, together with future reversals of existing taxable temporary differences and results of recent operations, will be sufficient to fully recover the deferred tax assets. In the event that we determine all or part of the net deferred tax assets are not realizable in the future, we would record a valuation allowance.
We recognize tax benefits from uncertain tax positions only if it is more likely than not that the tax position will be sustained on examination by the taxing authorities, based on the technical merits of the position. The tax benefits recognized in the consolidated financial statements from such positions are then measured based on the largest benefit that has a greater than 50% likelihood of being realized upon ultimate settlement. We recognize interest and penalties related to unrecognized tax benefits, if any, as income tax expense.
Stock-Based Compensation Expense
We measure stock-based compensation expense associated with option awards made to employees and members of our board of directors based on the estimated fair values of the awards at grant date using the Black-Scholes option-pricing model. For options with service conditions only, stock-based compensation expense is recognized, net of forfeitures, over the requisite service period using the straight-line method such that an expense is only recognized for those awards that we expect to vest. Forfeitures are estimated at the time of grant and revised, if necessary, in subsequent periods if actual forfeitures differ from those estimates.
We have granted certain option awards that contain both service and performance conditions. The service condition for such awards is satisfied ratably over the
24
-month period following the fourth anniversary of the grant date. The performance condition for such awards was satisfied if we consummated an IPO within
12
months of the grant date. Expense related to awards which contain both service and performance conditions is recognized using the accelerated attribution method. Since an IPO is not deemed probable until such event occurs, no compensation cost related to the performance condition was recognized prior to the consummation of our IPO in November 2017. Subsequently, we recorded stock-based compensation expense of
$0.5 million
related to periods prior to the IPO.
For stock options granted to non-employees, we determined that the estimated fair value of the stock options is more readily measurable than the fair value of the services received. The fair value of stock options granted to non-employees is calculated at each grant date and re-measured at each reporting date using the Black-Scholes option-pricing model and the resulting change in value, if any, is recognized in our consolidated statements of operations for the periods in which the related services are rendered.
Comprehensive Income (Loss)
Comprehensive income (loss) represents net income (loss) for the period plus the results of certain other changes to stockholders’ equity. Our net income (loss) was equal to our comprehensive income (loss) for
2018
,
2017
and
2016
.
Concentration of Credit Risks
The majority of our cash is held by three financial institutions within the United States. Our cash balances held by these institutions may exceed federally insured limits. The associated risk of concentration for cash is mitigated by banking with credit-worthy institutions. No client accounted for greater than 10% of total revenue, net for
2018
,
2017
and
2016
.
Recently Adopted Accounting Pronouncements
In July 2015, the Financial Accounting Standards Board, or FASB, issued Accounting Standards Update, or ASU, No. 2015-11,
Inventory: Simplifying the Measurement of Inventory (Topic 330)
. The new guidance replaces the current inventory measurement requirement of using the lower of cost or market with the lower of cost or net realizable value. We early adopted this standard beginning in 2017, which had no impact on our consolidated financial statements.
In November 2016, the FASB issued ASU No. 2016-18,
Statement of Cash Flows: Restricted Cash (Topic 230)
, or ASU 2016-18. ASU 2016-18 requires that the statement of cash flows explain the change during the period in the total cash, cash equivalents and restricted cash. We early adopted this standard beginning in 2017 and have retroactively adjusted the consolidated statements of cash flows for all periods presented.
52
In March 2016, the FASB issued ASU No. 2016-09,
Compensation – Stock Compensation: Improvements to Employee Share-Based Payment Accounting (Topic 718)
or ASU 2016-09, which simplifies the accounting and reporting of share-based payment transactions, including adjustments to how excess tax benefits and payments for tax withholdings should be classified and provides the election to eliminate the estimate for forfeitures. Upon adoption, ASU 2016-09 requires that excess tax benefits for share-based payments be recorded as a reduction of income tax expense and reflected within operating cash flows, rather than being recorded within equity and reflected within financing cash flows. ASU 2016-09 also permits the repurchase of more of an employee’s shares for tax withholding purposes without triggering liability accounting, clarifies that all cash payments made on an employee’s behalf for withheld shares should be presented as a financing activity on the Company’s statement of cash flows, and provides an accounting policy election to account for forfeitures as they occur. We adopted this standard in our first fiscal quarter of 2018.
We made an accounting policy election to continue to estimate forfeitures.
All excess tax benefits and tax deficiencies related to share-based payment awards are now reflected in the consolidated statement of operations and comprehensive income as a component of the provision for income taxes on a prospective basis, whereas they were recognized in equity under the previous guidance. Additionally, excess tax benefits related to share-based payment awards are now reflected in operating activities, along with other income tax related cash flows, in our consolidated statement of cash flows on a prospective basis. The adoption did not have a material impact on our consolidated financial statements.
Recently Issued Accounting Pronouncements
In May 2014, the FASB issued ASU No. 2014-09,
Revenue from Contracts with Customers (Topic 606
), or ASU 2014-09, which amended the existing FASB Accounting Standards Codification. ASU 2014-09 establishes a principle for recognizing revenue upon the transfer of promised goods or services to customers, in an amount that reflects the expected consideration received in exchange for those goods or services and also provides guidance on the recognition of costs related to obtaining and fulfilling customer contracts. The new guidance may be applied retrospectively to each prior period presented or retrospectively with the cumulative effect recognized as of the date of adoption (“modified retrospective method”).
We will adopt the standard in the first quarter of fiscal 2019 under the modified retrospective approach. Under the new standard, we will begin to recognize revenue from estimated unredeemed gift cards over the expected customer redemption period rather than waiting until the likelihood of redemption becomes remote. Further, we expect to recognize revenue related to exchanges upon shipment by us, rather than upon receipt by the customer. In the first fiscal quarter of 2019, the Company will record a cumulative catch-up adjustment resulting in an increase to opening retained earnings, net of tax, of approximately
$2.5 million
, comprised primarily of the impact from the change in revenue recognition related to gift cards.
In February 2016, the FASB issued ASU No. 2016-02,
Leases (Topic 842)
, or ASU 2016-02, which requires lessees to record most leases on their balance sheets but recognize the expenses on their income statements in a manner similar to current practice. ASU 2016-02 states that a lessee would recognize a lease liability for the obligation to make lease payments and a right-to-use asset for the right to use the underlying asset for the lease term. We expect to adopt this standard in our first fiscal quarter of 2020. We are currently evaluating the impact that this standard will have on our consolidated financial statements but we expect that it will result in a substantial increase in our long-term assets and liabilities.
In October 2016, the FASB issued ASU No. 2016-16
, Income Taxes: Intra-Entity Transfers of Assets Other Than Inventory (Topic 740)
, which amends existing guidance on the recognition of current and deferred income tax impacts for intra-entity asset transfers other than inventory. This amendment may be applied on a modified retrospective basis. We expect to adopt this standard in fiscal year 2019 and are currently evaluating the impact that it will have on our consolidated financial statements.
In June 2018, the FASB issued ASU No. 2018-07
, Compensation—Stock Compensation (Topic 718): Improvements to Nonemployee Share-Based Payment Accounting
, or ASU 2018-07. Under this ASU, the accounting for awards issued to nonemployees will be similar to the accounting for employee awards. This includes allowing for the measurement of awards at the grant date and recognition of awards with performance conditions when those conditions are probable, both of which are earlier than under current guidance for nonemployee awards. We expect to adopt this standard in our first fiscal quarter of 2020. We are currently evaluating the impact that this standard will have on our consolidated financial statements.
|
3.
|
Fair Value Measurements
|
We disclose and recognize the fair value of our assets and liabilities using a hierarchy that prioritizes the inputs to valuation techniques used to measure fair value. Fair value is defined as the price that would be received to sell an asset or paid to transfer a liability (an exit price) in an orderly transaction between market participants at the measurement date. The guidance establishes three levels of the fair value hierarchy as follows:
Level 1
: Inputs are unadjusted, quoted prices in active markets for identical assets or liabilities at the measurement date;
Level 2
: Inputs are observable, unadjusted quoted prices in active markets for similar assets or liabilities, unadjusted quoted prices for identical or similar assets or liabilities in markets that are not active, or other inputs that are observable or can be corroborated by observable market data for substantially the full term of the related assets or liabilities; and
53
Level 3
: Unobservable inputs that are significant to the measurement of the fair value of the assets or liabilities that are supported by little or no market data.
Our financial instruments consist of cash and cash equivalents, accounts payable, accrued liabilities and the preferred stock warrant liability. At
July 28, 2018
, we had cash equivalents of
$175.2 million
which consisted of money market funds with maturities of less than three months. At
July 28, 2018
, and
July 29, 2017
, the carrying values of cash and cash equivalents, accounts payable and accrued liabilities approximated fair value due to their short-term maturities. In November 2017, in connection with our IPO, all outstanding preferred stock warrants were automatically exercised into shares of Class B common stock. As a result, we remeasured and reclassified the preferred stock warrant liability to additional paid-in capital upon the closing of the IPO. As of
July 28, 2018
, the Company did not have any financial instruments measured at fair value.
The following table sets forth our financial instruments that were measured at fair value on a recurring basis based on the fair value hierarchy as of
July 29, 2017
:
|
July 29, 2017
|
||||||||||||||||
|
(in thousands)
|
Level 1
|
Level 2
|
Level 3
|
Total
|
||||||||||||
|
Financial Liabilities:
|
||||||||||||||||
|
Preferred stock warrant liability
|
—
|
|
—
|
|
26,679
|
|
26,679
|
|
||||||||
|
Total
|
$
|
—
|
|
$
|
—
|
|
$
|
26,679
|
|
$
|
26,679
|
|
||||
There were no transfers of financial assets or liabilities into or out of Level 1, Level 2 or Level 3 for
2018
or
2017
. The key assumptions used in the Black-Scholes option-pricing model for the valuation of the preferred stock warrant liability upon remeasurement were as follows:
|
July 29, 2017
|
||||
|
Expected term (in years)
|
2.0
|
|
||
|
Fair value of underlying shares
|
$
|
25.09
|
|
|
|
Volatility
|
43.8
|
%
|
||
|
Risk free interest rate
|
1.3
|
%
|
||
|
Dividend yield
|
—
|
%
|
||
Generally, increases or decreases in the fair value of the underlying convertible preferred stock would result in a directionally similar impact in the fair value measurement of the associated warrant liability.
The following table sets forth a summary of the changes in the fair value of the preferred stock warrant liability:
|
(in thousands)
|
For the Fiscal Year Ended July 28, 2018
|
|||
|
Balance at July 29, 2017
|
$
|
26,679
|
|
|
|
Change in fair value
|
(10,685)
|
|||
|
Reclassification of warrant liability to additional paid-in capital upon the initial public offering
|
(15,994)
|
|||
|
Ending balance at July 28, 2018
|
$
|
—
|
|
|
54
|
4.
|
Property and Equipment, net
|
Property and equipment, net consisted of the following:
|
(in thousands)
|
July 28, 2018
|
July 29, 2017
|
||||||
|
Computer equipment
|
$
|
2,920
|
|
$
|
5,086
|
|
||
|
Office furniture and equipment
|
9,829
|
|
4,514
|
|
||||
|
Leasehold improvements
|
16,091
|
|
14,693
|
|
||||
|
Capitalized software
|
24,982
|
|
11,481
|
|
||||
|
Construction in progress
|
356
|
|
1,618
|
|
||||
|
Building and land
|
402
|
|
—
|
|
||||
|
Total property and equipment
|
54,580
|
|
37,392
|
|
||||
|
Less: accumulated depreciation and amortization
|
(20,411
|
)
|
(10,659
|
)
|
||||
|
Property and equipment, net
|
$
|
34,169
|
|
$
|
26,733
|
|
||
Depreciation and amortization expense for
2018
,
2017
and
2016
was
$10.5 million
,
$7.7 million
and
$3.5 million
, respectively.
|
5.
|
Accrued Liabilities
|
Accrued liabilities consisted of the following:
|
(in thousands)
|
July 28, 2018
|
July 29, 2017
|
||||||
|
Compensation and related benefits
|
$
|
10,680
|
|
$
|
9,632
|
|
||
|
Advertising
|
10,456
|
|
9,995
|
|
||||
|
Sales taxes
|
7,066
|
|
3,702
|
|
||||
|
Shipping and freight
|
4,801
|
|
3,390
|
|
||||
|
Accrued accounts payable
|
4,567
|
|
4,814
|
|
||||
|
Inventory purchases
|
506
|
|
11,186
|
|
||||
|
Other
|
4,961
|
|
3,644
|
|
||||
|
Total accrued liabilities
|
$
|
43,037
|
|
$
|
46,363
|
|
||
|
6.
|
Preferred Stock Warrant Liability
|
In 2012 and 2013, in connection with financing arrangements, we issued warrants to purchase shares of our convertible preferred stock. For one of the financing arrangements, we issued warrants to purchase
375,230
shares of Series Seed convertible preferred stock at an exercise price of
$0.1066
per share and
66,265
shares of Series A convertible preferred stock at an exercise price of
$0.22636
per share. For the second financing arrangement, we issued warrants for the purchase of, at the warrant holder’s option, either (a)
624,730
shares of Series A-1 convertible preferred stock at an exercise price of
$0.2401
per share or (b)
308,315
shares of Series B convertible preferred stock at an exercise price of
$0.486516
per share. Prior to their automatic exercise in connection with the IPO, the warrants were exercisable for and expired
ten
years from the date of issuance. In November 2017, in connection with our IPO, the preferred stock warrants were automatically exercised into shares of common stock and the preferred stock warrant liability was reclassified to additional paid-in capital.
|
7.
|
Commitments and Contingencies
|
Leases
We have entered into various lease arrangements for our corporate offices and fulfillment centers. Such leases generally have original lease terms between
five
and
eight
years. We had security deposits totaling
$1.3 million
and
$1.3 million
as of
July 28, 2018
, and
July 29, 2017
, respectively. We have letters of credit totaling
$12.9 million
and
$9.4 million
as of
July 28, 2018
, and
July 29, 2017
, respectively, which are collateralized by time deposits.
55
A schedule of the future minimum rental commitments under our non-cancelable operating lease agreements with an initial or remaining term in excess of one year as of
July 28, 2018
, is as follows:
|
(in thousands)
|
July 28, 2018
|
|||
|
2019
|
$
|
18,652
|
|
|
|
2020
|
19,646
|
|
||
|
2021
|
19,024
|
|
||
|
2022
|
17,127
|
|
||
|
2023
|
14,945
|
|
||
|
Thereafter
|
59,159
|
|
||
|
Total
|
$
|
148,553
|
|
|
At one fulfillment center, the Company recognizes contingent rent in excess of its minimum lease payments. Contingent rental amounts are determined based on additional square footage utilized in excess of the Company’s contractual minimum commitments.
Total rent expense classified within selling, general and administrative expenses in the consolidated statements of operations was
$18.2 million
,
$16.6 million
and
$11.1 million
for
2018
,
2017
and
2016
, respectively.
Future minimum rental commitments as of
July 28, 2018
have not been reduced by sublease rentals of
$3.0 million
due to the Company under
non-cancelable
subleases through fiscal 2021.
Contingencies
We record a loss contingency when it is probable that a liability has been incurred and the amount of the loss can be reasonably estimated. We also disclose material contingencies when we believe a loss is not probable but reasonably possible. Accounting for contingencies requires us to use judgment related to both the likelihood of a loss and the estimate of the amount or range of loss. Although we cannot predict with assurance the outcome of any litigation or tax matters, we do not believe there are currently any such actions that, if resolved unfavorably, would have a material impact on our operating results, financial position or cash flows.
Indemnifications
In the ordinary course of business, we may provide indemnifications of varying scope and terms to vendors, directors, officers and other parties with respect to certain matters. We have not incurred any material costs as a result of such indemnifications and have not accrued any liabilities related to such obligations in our consolidated financial statements.
|
8.
|
Convertible Preferred Stock
|
Prior to the IPO, the Company’s convertible preferred stock consisted of the following as of
July 29, 2017
, and
July 30, 2016
(in thousands, except share data):
|
|
|
Net
Carrying
Value
|
|
|||||||||||
|
Shares
Authorized
|
Shares
Outstanding
|
Liquidation
Preference
|
||||||||||||
|
(in thousands, except share data)
|
||||||||||||||
|
Series Seed
|
|
7,457,785
|
|
7,082,555
|
|
|
$
|
754
|
|
$
|
754
|
|
||
|
Series A
|
|
11,715,050
|
|
11,648,785
|
|
|
2,602
|
|
2,637
|
|
||||
|
Series A-1
|
|
9,571,715
|
|
8,946,985
|
|
|
2,147
|
|
2,147
|
|
||||
|
Series B
|
|
24,358,445
|
|
24,358,445
|
|
|
11,756
|
|
11,851
|
|
||||
|
Series C
|
|
7,474,285
|
|
7,474,285
|
|
|
24,963
|
|
25,000
|
|
||||
|
Total
|
|
60,577,280
|
|
59,511,055
|
|
|
$
|
42,222
|
|
$
|
42,389
|
|
||
Upon the closing of the IPO, all of the outstanding shares of convertible preferred stock automatically converted into
59,511,055
shares of Class B common stock. As of
July 28, 2018
, the Company is authorized to issue
20,000,000
shares of preferred stock, with a
$0.00002
par value. There are currently
no
outstanding shares of preferred stock as of
July 28, 2018
.
Prior to the IPO, the significant provisions of the convertible preferred stock were as follows:
Dividends
- The holders of convertible preferred stock were entitled to receive, on a pari passu basis, non-cumulative dividends prior and in preference to any declaration or payment of any dividends to the holders of common stock, when and if declared by the board of directors, at annual rates equal to
6%
of original issue price per share for Series Seed, Series A, Series A-1, Series B and Series C convertible
56
preferred stock, as adjusted for stock splits, stock dividends, reclassifications or the like. Holders of convertible preferred stock were also entitled to participate in dividends on the common stock on an as-converted basis. No dividends have been declared by the board of directors or paid since inception.
Conversion
- At the option of the holder, each share of convertible preferred stock was convertible into fully paid and non-assessable shares of common stock. As of
July 29, 2017
, and
July 30, 2016
, each share of convertible preferred stock was convertible into
one
share of common stock, subject to adjustment for stock splits, stock dividends and the like. The conversion price of each series of convertible preferred stock was subject to weighted-average adjustment if we issued additional shares of common stock after the applicable original issue date of such series of convertible preferred stock without consideration or for consideration per share less than the conversion price for such series of convertible preferred stock, subject to customary exceptions. Each share of preferred stock automatically converted into the number of shares of common stock into which such shares were convertible at the then-applicable conversion ratio upon (i) the closing of the sale of shares of common stock in a public offering resulting in gross proceeds of at least
$30,000,000
and the listing of our common stock on the Nasdaq Global Select Market, or (ii) the consent of the holders of a majority of the outstanding convertible preferred stock, voting as a single class on an as-converted basis.
Liquidation
- In the event of any voluntary or involuntary liquidation, dissolution or winding up of Stitch Fix, Inc. (a “liquidation event”), holders of convertible preferred stock were entitled to receive, prior and in preference to holders of common stock, an amount equal to the greater of (i) the applicable original issue price for each series of convertible preferred stock (
$0.1066
,
$0.22636
,
$0.2401
,
$0.486516
and
$3.344798
per share for Series Seed, Series A, Series A-1, Series B and Series C, respectively, as adjusted for stock splits, stock dividends and the like), plus any declared and unpaid dividends and (ii) the amount per share that would have been payable if all shares of convertible preferred stock were converted into common stock subject to the applicable conversion rights. If upon occurrence of such an event, the assets and funds to be distributed among the holders of convertible preferred stock were insufficient to permit the payment to such holders, our entire assets and funds legally available for distribution would have been distributed
ratably among the holders. Upon completion of the distribution to the holders of the convertible preferred stock, all remaining legally available assets would have been distributed ratably to the holders of common stock. A liquidation event would have been deemed to have occurred (unless waived by the holders of the majority of the outstanding shares of convertible preferred stock) upon (i) a consolidation, reorganization or merger of the Company, other than any consolidation, reorganization or merger in which the Company’s stockholders of record as of immediately prior to such transaction would continue to hold a majority of the voting power of the surviving company of such transaction, (ii) a transfer of shares of the Company representing a majority of the voting power of the Company, other than for equity financing purposes or (iii) a sale, lease, exclusive license or other disposition of all or substantially all of the assets of the Company.
Voting
- Each share of convertible preferred stock was entitled to the number of votes equal to the number of shares of common stock into which such share could be converted on the record date for the vote or consent of the stockholders, except as otherwise required by law or other provisions of the Company's Certificate of Incorporation, as amended, or Certificate of Incorporation, and generally had voting rights and powers equal to the voting rights and powers of the common stockholders. For so long as at least
3,250,000
shares of Series B convertible preferred stock, as adjusted for stock splits, stock dividends and the like, remained outstanding, the holders of Series B convertible preferred stock, voting as a separate class, were entitled to elect one member of the board of directors. For so long as at least
950,000
shares of Series Seed convertible preferred stock, as adjusted for stock splits, stock dividends and the like, remain outstanding, the holders of Series Seed convertible preferred stock, voting as a separate class, were entitled to elect one member of the board of directors. The holders of Common Stock, voting as a separate class, were entitled to elect two members of the board of directors. The holders of convertible preferred stock and common stock, voting as a single class on an as-converted basis, were entitled to elect all remaining members of the board of directors.
Protective Provisions
- For so long as at least
2,000,000
shares of convertible preferred stock, as adjusted for stock splits, stock dividends and the like, remained outstanding, the holders of convertible preferred stock had certain protective provisions whereby the Company could not, without the written consent or affirmative vote of the holders of the majority of outstanding shares of convertible preferred stock, voting together as a single class on an as-converted basis (i) authorize or designate any new class or series of stock or any other securities convertible into equity securities of the Company ranking on a parity with or senior to the convertible preferred stock in respect to redemption rights, liquidation preference, voting or dividend rights, or increase the authorized or designated number of any such class or series; (ii) redeem or repurchase stock, pay or declare dividends or make other distributions in respect of stock, subject to certain exceptions; (iii) consummate a transaction that would have been a liquidation event, or other merger or consolidation or enter into any agreement by the Company or its stockholders regarding a liquidation event or other merger or consolidation; (iv) amend, alter or repeal any provision of the Certificate of Incorporation or the Amended and Restated Bylaws of the Company; (v) increase or decrease the authorized number of members of the board of directors; (vi) increase or decrease the authorized number of shares of common stock or convertible preferred stock or any series thereof; (vii) consummate or enter into any transaction with the Company’s executive officers or their affiliates, subject to certain exceptions; or (viii) create, permit the creation of or hold capital stock in any direct or indirect subsidiary that was not wholly owned by the Company.
The holders of Series A, Series B and Series C convertible preferred stock each had additional protective provisions whereby the Company could not, so long as
1,221,780
shares,
2,435,835
shares and
747,430
shares, respectively, as adjusted for stock splits, stock dividends and the like, remained outstanding, without the written consent or voting approval of the holders of a majority of the then-outstanding shares of the respective series of convertible preferred stock, take any action that: (i) amended, altered or repealed any
powers, preferences
57
or rights of such series of convertible preferred stock, so as to affect them adversely and in a manner disproportionate to other series of preferred stock; or (ii) increased or decreased the authorized number of shares of such series of convertible preferred stock.
Other
- We classified our convertible preferred stock outside of stockholders’ equity because the shares contained certain liquidation features that were not solely within our control. During
2017
and
2016
, we did not adjust the carrying value of the convertible preferred stock to the deemed liquidation value of such shares as a qualifying liquidation event was not probable.
|
9.
|
Stockholders’ Equity
|
2011 Equity Incentive Plan
In 2011, we adopted the 2011 Equity Incentive Plan (the “2011 Plan”). The 2011 Plan provided for the granting of stock-based awards to employees, directors and non-employees under terms and provisions established by the board of directors. The number of shares authorized for issuance under the 2011 Plan was
23,223,374
and
20,364,297
as of
July 29, 2017
, and
July 30, 2016
, respectively, of which
2,023,424
and
3,101,370
were available for grant, respectively.
The 2011 Plan allowed for the grant of incentive stock options or nonqualified stock options as well as restricted stock units, restricted stock and stock appreciation rights. As of
July 28, 2018
, we had only granted incentive and nonqualified stock options under the 2011 Plan. Effective upon our IPO, the 2011 Plan was replaced by the 2017 Incentive Plan.
2017 Incentive Plan
In November 2017, our board of directors and stockholders adopted our 2017 Incentive Plan (the “2017 Plan”). The remaining shares available for issuance under the 2011 Plan became reserved for issuance under the 2017 Plan. The 2017 Plan provides for the grant of incentive stock options to employees, including employees of any parent or subsidiary, and for the grant of nonstatutory stock options, stock appreciation rights, restricted stock awards, restricted stock unit awards, performance stock awards, performance cash awards and other forms of stock awards to employees, directors and consultants, including employees and consultants of our subsidiaries. As of
July 28, 2018
, the number of shares authorized for issuance under the 2017 Plan was
28,423,374
,of which
3,743,623
were available for grant.
Employee stock options generally vest
25%
on the first anniversary of the grant date with the remaining vesting ratably over the next three years. Options generally expire after
10
years.
Stock option activity under the 2011 Plan and 2017 Plan is as follows:
|
Options Outstanding
|
||||||||||||||||
|
Shares Available for Grant
|
Number of
Options
|
Weighted-
Average
Exercise
Price
|
Weighted-
Average
Remaining
Contractual
Life (in Years)
|
Aggregate
Intrinsic
Value
(in thousands)
|
||||||||||||
|
Balance – July 29, 2017
|
2,023,424
|
|
10,218,912
|
|
$
|
7.12
|
|
8.53
|
$
|
166,670
|
|
|||||
|
Authorized
|
5,200,000
|
|
—
|
|
||||||||||||
|
Granted
|
(4,820,596
|
)
|
2,180,789
|
|
21.57
|
|
||||||||||
|
Exercised
|
—
|
|
(2,194,168
|
)
|
2.33
|
|
||||||||||
|
Cancelled
|
1,340,795
|
|
(1,153,373
|
)
|
7.16
|
|
||||||||||
|
Balance – July 28, 2018
|
3,743,623
|
|
9,052,160
|
|
$
|
11.74
|
|
8.23
|
$
|
160,856
|
|
|||||
|
Options vested and exercisable - July 28, 2018
|
2,361,520
|
|
$
|
4.30
|
|
6.65
|
$
|
59,539
|
|
|||||||
|
Options vested and expected to vest - July 28, 2018
|
8,046,527
|
|
$
|
11.20
|
|
8.01
|
$
|
147,367
|
|
|||||||
The weighted-average grant date fair value of options granted during
2018
,
2017
and
2016
was
$8.40
,
$9.11
and
$1.99
per share, respectively. The total grant date fair value of options that vested during
2018
,
2017
and
2016
was
$8.5 million
,
$2.6 million
and
$1.5 million
, respectively. The aggregate intrinsic value of options exercised during
2018
,
2017
and
2016
was
$59.6 million
,
$17.4 million
and
$3.5 million
, respectively.
The aggregate intrinsic value is the difference between the current fair value of the underlying common stock and the exercise price for in-the-money stock options.
Employee restricted stock units are granted under the 2017 Plan and generally vest
25%
on the first anniversary of the grant date with the remaining vesting ratably over the next three years.
58
The following table summarizes the restricted stock unit, or RSU, award activity under the 2017 Plan:
|
Unvested RSU's
|
|||||||||||||
|
Class A Common Stock
|
Weighted-
Average
Grant Date
Fair Value
|
Weighted-
Average
Remaining
Contractual
Life (in Years)
|
Aggregate
Intrinsic
Value
(in thousands)
|
||||||||||
|
Unvested at July 29, 2017
|
—
|
|
—
|
|
|||||||||
|
Granted
|
2,639,807
|
|
$
|
21.34
|
|
||||||||
|
Vested
|
(39,538
|
)
|
19.38
|
|
|||||||||
|
Forfeited
|
(167,943
|
)
|
18.28
|
|
|||||||||
|
Unvested at July 28, 2018
|
2,432,326
|
|
$
|
21.58
|
|
3.50
|
$
|
71,778
|
|
||||
|
Expected to vest - July 28, 2018
|
2,018,344
|
|
$
|
21.57
|
|
3.50
|
$
|
59,561
|
|
||||
Stock-Based Compensation Expense
Stock-based compensation expense for options granted to employees was
$15.4 million
,
$3.4 million
and
$1.6 million
for
2018
,
2017
and
2016
,
respectively
. Stock-based compensation expense for options granted to non-employees was less than
$0.1 million
in
2018
. Stock-based compensation expense for options granted to non-employees was
$0.2 million
and
$0.3 million
for
2017
and
2016
, respectively. The income tax benefit related to stock-based compensation was
$4.7 million
,
$1.3 million
and
$0.6 million
for 2018, 2017 and 2016, respectively. Stock-based compensation expense is included in selling, general and administrative expenses in our consolidated statements of operations.
As of
July 28, 2018
, the total unrecognized compensation expense related to unvested options and RSU's, net of estimated forfeitures, was
$97.7 million
, which we expect to recognize over an estimated weighted average period of
3.1
years.
In determining the fair value of the stock-based awards, we use the Black-Scholes option-pricing model and assumptions discussed below. Each of these inputs is subjective and generally requires significant judgment.
Fair Value of Common Stock
-
As of
July 28, 2018
, the fair value of the shares of common stock underlying our stock options has been determined based on market prices. Prior to our IPO on November 16, 2017, the fair value of the shares of common stock underlying our stock options was determined by the board of directors. As there was no public market for our common stock, the board of directors determined the fair value of the common stock on the stock option grant date by considering a number of objective and subjective factors, including third-party valuations of our common stock, sales of our common stock, operating and financial performance, the lack of marketability of our common stock and general macroeconomic conditions.
Expected Term
-
The expected term represents the period that our stock options are expected to be outstanding and is determined using the simplified method (generally calculated as the mid-point between the vesting date and the end of the contractual term).
Expected Volatility
-
The expected volatility was estimated based on the average volatility for publicly traded companies that we considered comparable, over a period equal to the expected term of the stock option grants.
Risk-Free Interest Rate
-
The risk-free interest rate is based on the U.S. Treasury zero coupon notes in effect at the time of grant for periods corresponding with the expected term of the option.
Expected Dividend
-
We have not paid dividends on our common stock and do not anticipate paying dividends on our common stock; therefore, we use an expected dividend yield of
zero
.
The fair value of stock options granted to employees was estimated at the grant date using the Black-Scholes option-pricing model with the following assumptions:
|
For the Fiscal Year Ended
|
|||||||||
|
July 28, 2018
|
July 29, 2017
|
July 30, 2016
|
|||||||
|
Expected term (in years)
|
5.4 - 6.6
|
|
5.1 - 7.7
|
|
5.4 - 6.9
|
|
|||
|
Volatility
|
41.4 - 43.5%
|
|
42.6 - 46.0%
|
|
44.3 - 47.9%
|
|
|||
|
Risk free interest rate
|
1.9 - 3.0%
|
|
1.3 -2.3%
|
|
1.1 -1.9%
|
|
|||
|
Dividend yield
|
—
|
%
|
—
|
%
|
—
|
%
|
|||
In July 2017, options to purchase an aggregate of
1,097,463
shares of common stock which had both a service-based condition and a liquidity event-related performance condition were granted to certain members of our executive management team. Such options vest ratably over the
24
-month period following the fourth anniversary of the grant date, subject to an IPO occurring within
12
months of the grant date and the option holder’s continuous service through each vesting date. The aggregate grant-date fair value of such option awards
59
was
$14.0
million.
Since an IPO is not deemed probable until such event occurs, no compensation cost related to the performance condition was recognized prior to the consummation of our IPO in November 2017. Subsequently, we recorded stock-based compensation expense of
$0.5 million
related to periods prior to the IPO.
Early Exercise of Employee Options
We allow certain employees to exercise options granted under the 2011 Plan prior to vesting in exchange for shares of restricted common stock subject to a right of repurchase that lapses according to the original option vesting schedule. The proceeds from the exercise of options are recorded in other current liabilities and other long-term liabilities in our consolidated balance sheets at the time the options are exercised and reclassified to common stock and additional paid-in capital as our repurchase right lapses. Upon termination of employment, any unvested shares are subject to repurchase by us at the original purchase price.
We did not issue any shares upon exercise of unvested stock options during
2018
. We issued
111,557
and
42,500
shares of common stock during
2017
and
2016
, respectively, upon exercise of unvested stock options. As of
July 28, 2018
,
July 29, 2017
, and
July 30, 2016
there were
160,417
,
702,144
and
1,699,147
shares of common stock, respectively, held by employees subject to repurchase at an aggregate price of
$0.2 million
,
$1.2 million
and
$1.5 million
, respectively.
Sales of Our Stock
In April 2016, an employee sold an aggregate of
268,095
shares of our common stock for a total of
$6.0 million
to an existing investor. The purchase price was in excess of the fair value of such shares. As a result, during 2016, we recorded the excess of the purchase price above fair value of
$4.8 million
as compensation expense with a corresponding credit to additional paid-in capital.
In November 2016, we initiated a cash tender offer which was completed in December 2016 for the purchase of our common stock, including shares underlying then-unexercised vested options, at a purchase price of
$22.61
per share. To be eligible to participate in the tender offer, employees must have received equity grants with vesting start dates on or before October 31, 2014. Such employees could elect to sell up to
10%
of their total vested holdings. The total number of tendered shares was
526,620
for total cash consideration of
$11.9 million
. The purchase price per share in the tender offer was in excess of the fair value of our common stock at the time of the transaction. As a result, during 2017, we recorded the excess of the purchase price above fair value of
$8.3 million
as compensation expense.
In January 2017, two of our former employees sold
554,799
shares of our common stock for a total of
$12.5 million
to existing
investors
. In addition, an employee sold
85,000
shares of our Series C convertible preferred stock for a total purchase price of
$1.9 million
to an existing investor. The purchase price was in excess of the fair value of such shares. During 2017, we recorded
$13.0 million
as compensation expense related to these transactions.
|
10.
|
Income Taxes
|
The components of income (loss) before income taxes are as follows:
|
For the Fiscal Year Ended
|
||||||||||||
|
(in thousands)
|
July 28, 2018
|
July 29, 2017
|
July 30, 2016
|
|||||||||
|
Income (loss) before income taxes
|
||||||||||||
|
U.S.
|
$
|
56,978
|
|
$
|
12,801
|
|
$
|
61,222
|
|
|||
|
Foreign
|
(2,265
|
)
|
—
|
|
—
|
|
||||||
|
Total
|
$
|
54,713
|
|
$
|
12,801
|
|
$
|
61,222
|
|
|||
60
The components of the provision for income tax expense are as follows:
|
For the Fiscal Year Ended
|
||||||||||||
|
(in thousands)
|
July 28, 2018
|
July 29, 2017
|
July 30, 2016
|
|||||||||
|
Current:
|
||||||||||||
|
Federal
|
$
|
2,732
|
|
$
|
17,027
|
|
$
|
29,204
|
|
|||
|
State
|
493
|
|
3,096
|
|
4,706
|
|
||||||
|
Total current
|
3,225
|
|
20,123
|
|
33,910
|
|
||||||
|
Deferred:
|
||||||||||||
|
Federal
|
7,917
|
|
(6,009
|
)
|
(5,458
|
)
|
||||||
|
State
|
(1,329
|
)
|
(719
|
)
|
(411
|
)
|
||||||
|
Total deferred
|
6,588
|
|
(6,728
|
)
|
(5,869
|
)
|
||||||
|
Provision for income taxes
|
$
|
9,813
|
|
$
|
13,395
|
|
$
|
28,041
|
|
|||
The reconciliation of our effective tax rate to the statutory federal rate is as follows:
|
For the Fiscal Year Ended
|
|||||||||||||||||||||
|
(in thousands, except percentages)
|
July 28, 2018
|
July 29, 2017
|
July 30, 2016
|
||||||||||||||||||
|
Tax at federal statutory rate
|
$
|
14,752
|
|
27.0
|
%
|
$
|
4,481
|
|
35.0
|
%
|
$
|
21,428
|
|
35.0
|
%
|
||||||
|
State taxes, net of federal effect
|
(755
|
)
|
(1.4
|
)%
|
1,270
|
|
9.9
|
%
|
2,386
|
|
3.9
|
%
|
|||||||||
|
Remeasurement of preferred stock warrant liability
|
(2,881
|
)
|
(5.3
|
)%
|
6,608
|
|
51.6
|
%
|
1,057
|
|
1.7
|
%
|
|||||||||
|
Stock-based compensation
|
(5,454
|
)
|
(9.9
|
)%
|
229
|
|
1.8
|
%
|
—
|
|
0.0
|
%
|
|||||||||
|
Tax Act impact
|
6,670
|
|
12.2
|
%
|
—
|
|
0.0
|
%
|
—
|
|
0.0
|
%
|
|||||||||
|
Research and development credits
|
(2,146
|
)
|
(3.9
|
)%
|
—
|
|
0.0
|
%
|
—
|
|
0.0
|
%
|
|||||||||
|
Uncertain tax positions
|
2,846
|
|
5.1
|
%
|
23
|
|
0.2
|
%
|
52
|
|
0.1
|
%
|
|||||||||
|
Return to provision
|
(3,891
|
)
|
(7.1
|
)%
|
—
|
|
0.0
|
%
|
45
|
|
0.1
|
%
|
|||||||||
|
Nondeductible compensation
|
—
|
|
0.0
|
%
|
—
|
|
0.0
|
%
|
1,684
|
|
2.8
|
%
|
|||||||||
|
Other
|
672
|
|
1.2
|
%
|
784
|
|
6.1
|
%
|
1,389
|
|
2.2
|
%
|
|||||||||
|
Effective tax rate
|
$
|
9,813
|
|
17.9
|
%
|
$
|
13,395
|
|
104.6
|
%
|
$
|
28,041
|
|
45.8
|
%
|
||||||
The components of net deferred tax assets are as follows:
|
(in thousands)
|
July 28, 2018
|
July 29, 2017
|
July 30, 2016
|
|||||||||
|
Deferred tax assets:
|
||||||||||||
|
Inventory reserve and uniform capitalization
|
$
|
7,504
|
|
$
|
13,378
|
|
$
|
9,262
|
|
|||
|
Deferred rent
|
202
|
|
4,858
|
|
3,736
|
|
||||||
|
Accruals and reserves
|
8,274
|
|
6,215
|
|
3,054
|
|
||||||
|
Research and development credits
|
754
|
|
—
|
|
—
|
|
||||||
|
Stock-based compensation
|
2,210
|
|
308
|
|
195
|
|
||||||
|
Deferred revenue
|
739
|
|
616
|
|
272
|
|
||||||
|
Other
|
404
|
|
175
|
|
438
|
|
||||||
|
Gross deferred tax assets
|
20,087
|
|
25,550
|
|
16,957
|
|
||||||
|
Deferred tax liabilities:
|
||||||||||||
|
Depreciation and amortization
|
(5,860
|
)
|
(5,407
|
)
|
(3,522
|
)
|
||||||
|
Other
|
(120
|
)
|
(152
|
)
|
(234
|
)
|
||||||
|
Gross deferred tax liabilities
|
(5,980
|
)
|
(5,559
|
)
|
(3,756
|
)
|
||||||
|
Net deferred tax assets
|
$
|
14,107
|
|
$
|
19,991
|
|
$
|
13,201
|
|
|||
On December 22, 2017, the U.S. government enacted the Tax Cuts and Jobs Act, or the Tax Act, which significantly changed U.S. tax law. The Tax Act contains several key tax provisions including the reduction of the corporate income tax rate from 35% to 21%, as well as a variety of other changes including the acceleration of expensing of certain business assets and reductions in the amount of executive pay that could qualify as a tax deduction. The federal statutory tax rate reduction was effective January 1, 2018. The Company has a fiscal year end, which subjects us to transitional tax rate rules. Due to the tax rate reduction being effective beginning after December 31, 2017, for the year ended
July 28, 2018
, we applied a blended U.S. statutory rate of
26.96%
due to the tax rate reduction. Additionally, we remeasured our net deferred tax assets, which resulted in an increase in income tax expense of
$6.7 million
.
61
On December 22, 2017, the Securities and Exchange Commission issued Staff Accounting Bulletin No. 118, Income Tax Accounting Implications of the Tax Act, or SAB 118, which provides guidance on accounting for the Tax Act’s impact and allows registrants to record provisional amounts during a measurement period not to extend beyond one year of the enactment date. During the
fiscal year ended
July 28, 2018
, we recorded an amount of
$6.7 million
due to the remeasurement of our net deferred tax assets for the reduction in U.S. statutory tax rate.
We had a federal net operating loss carryforward of
$0.3 million
for the year ended
July 29, 2017
. These losses were fully utilized in the year ended
July 28, 2018
. We had state net operating loss carryforwards of
$0.2 million
and
$0.5 million
as of
July 28, 2018
, and
July 29, 2017
, respectively. If not utilized, these losses will begin to expire in 2033. As of
July 28, 2018
, we had California research and development tax credit carryforwards of
$1.5 million
which are not subject to expiration.
Uncertain Tax Positions
A reconciliation of our unrecognized tax benefits is as follows:
|
(in thousands)
|
July 28, 2018
|
July 29, 2017
|
July 30, 2016
|
|||||||||
|
Balance at the beginning of the year
|
$
|
1,052
|
|
$
|
846
|
|
$
|
481
|
|
|||
|
Increase related to prior period tax positions
|
2,334
|
|
—
|
|
—
|
|
||||||
|
Decrease related to prior period tax positions
|
(241
|
)
|
(36
|
)
|
—
|
|
||||||
|
Increase related to current year tax positions
|
2,358
|
|
242
|
|
365
|
|
||||||
|
Balance at the end of the year
|
$
|
5,503
|
|
$
|
1,052
|
|
$
|
846
|
|
|||
The amount of unrecognized tax benefits relating to our tax positions is subject to change based on future events including, but not limited to, the settlements of ongoing audits and/or the expiration of applicable statutes of limitations. Although the outcomes and timing of such events are highly uncertain, we anticipate that the balance of the liability for unrecognized tax benefits and related deferred tax assets will decrease by
$0.4 million
during the next twelve months due to lapses of applicable statutes of limitation. Our liability for uncertain tax positions as of
July 28, 2018
, includes
$4.7 million
related to amounts that would impact our current and future tax expense.
We recognize interest related to uncertain tax positions in our provision for income taxes. We file U.S. federal and various state and local income tax returns, including the state of California.
We are subject to U.S. federal, state or local income tax examinations for all prior years
.
|
11.
|
Earnings (Loss) Per Share Attributable to Common Stockholders
|
Basic and diluted net income (loss) per share attributable to common stockholders is presented in conformity with the two-class method required for participating securities. We consider convertible preferred stock and early exercised share options to be participating securities. In connection with the IPO, we established two classes of authorized common stock: Class A common stock and Class B common stock. As a result, all then-outstanding shares of common stock were converted into shares of Class B common stock upon effectiveness of the IPO. The rights of the holders of Class A and Class B common stock are identical, except with respect to voting, conversion and transfer rights. Each share of Class A common stock is entitled to one vote per share and each share of Class B common stock is entitled to ten votes per share. Each share of Class B common stock is convertible at any time at the option of the stockholder into one share of Class A common stock.
Undistributed earnings allocated to participating securities are subtracted from net income (loss) in determining net income (loss) attributable to common stockholders. Basic earnings per share, or EPS, attributable to common stockholders is computed by dividing the net income (loss) attributable to common stockholders by the weighted-average number of common shares outstanding during the period. All participating securities are excluded from basic weighted-average common shares outstanding.
For the calculation of diluted earnings per share EPS, net income (loss) attributable to common stockholders for basic EPS is adjusted by the effect of dilutive securities. Diluted net income (loss) per share attributable to common stockholders is computed by dividing the net income (loss) attributable to common stockholders by the weighted-average number of common shares outstanding, including all potentially dilutive common shares. The undistributed earnings are allocated based on the contractual participation rights of the Class A and Class B common shares as if the earnings for the year have been distributed. As the liquidation and dividend rights are identical, the undistributed earnings are allocated on a proportionate basis. The computation of the diluted net income (loss) per share of Class A common stock assumes the conversion of Class B common stock, while diluted net income (loss) per share of Class B common stock does not assume the conversion of Class A common stock as Class A common stock is not convertible into Class B common stock.
62
A reconciliation of the numerator and denominator used in the calculation of the basic and diluted EPS attributable to common stockholders is as follows (in thousands except share and per share amounts):
|
July 28, 2018
|
July 29, 2017
|
July 30, 2016
|
||||||||||||||
|
(in thousands except share and per share amounts)
|
Class A
|
Class B
|
Class B
|
Class B
|
||||||||||||
|
Numerator:
|
||||||||||||||||
|
Net income (loss)
|
$
|
7,650
|
|
$
|
37,250
|
|
$
|
(594
|
)
|
$
|
33,181
|
|
||||
|
Less: noncumulative dividends to preferred stockholders
|
(131
|
)
|
(637
|
)
|
—
|
|
(2,533
|
)
|
||||||||
|
Less: undistributed earnings to participating securities
|
(1,464
|
)
|
(7,127
|
)
|
—
|
|
(22,437
|
)
|
||||||||
|
Net income (loss) attributable to common stockholders - basic
|
6,055
|
|
29,486
|
|
(594
|
)
|
8,211
|
|
||||||||
|
Less: change in fair value of preferred stock warrant liability (net of tax)
|
(10,685
|
)
|
(10,685
|
)
|
—
|
|
—
|
|
||||||||
|
Add: adjustments to undistributed earnings to participating securities
|
2,429
|
|
2,015
|
|
—
|
|
1,285
|
|
||||||||
|
Reallocation of undistributed earnings as a result of conversion of Class B to Class A shares
|
29,486
|
|
—
|
|
—
|
|
—
|
|
||||||||
|
Reallocation of undistributed earnings to Class B shares
|
—
|
|
2,122
|
|
—
|
|
—
|
|
||||||||
|
Net income (loss) attributable to common stockholders - diluted
|
$
|
27,285
|
|
$
|
22,938
|
|
$
|
(594
|
)
|
$
|
9,496
|
|
||||
|
Denominator:
|
||||||||||||||||
|
Weighted-average shares of common stock - basic
|
12,940,593
|
|
63,007,166
|
|
24,973,931
|
|
22,729,890
|
|
||||||||
|
Conversion of Class B to Class A common shares outstanding
|
63,007,166
|
|
—
|
|
—
|
|
—
|
|
||||||||
|
Effect of dilutive stock options and restricted stock units
|
5,021,692
|
|
5,011,712
|
|
—
|
|
5,152,954
|
|
||||||||
|
Effect of potentially dilutive preferred stock warrants
|
318,967
|
|
318,967
|
|
—
|
|
—
|
|
||||||||
|
Weighted-average shares of common stock - diluted
|
81,288,418
|
|
68,337,845
|
|
24,973,931
|
|
27,882,844
|
|
||||||||
|
Earnings (loss) per share attributable to common stockholders:
|
||||||||||||||||
|
Basic
|
$
|
0.47
|
|
$
|
0.47
|
|
$
|
(0.02
|
)
|
$
|
0.36
|
|
||||
|
Diluted
|
$
|
0.34
|
|
$
|
0.34
|
|
$
|
(0.02
|
)
|
$
|
0.34
|
|
||||
The following common stock equivalents were excluded from the computation of diluted earnings (loss) per share for the periods presented because including them would have been antidilutive:
|
July 28, 2018
|
July 29, 2017
|
July 30, 2016
|
|||||||
|
Convertible preferred stock
|
—
|
|
59,511,055
|
|
59,511,055
|
|
|||
|
Preferred stock warrants
|
—
|
|
1,066,225
|
|
1,066,225
|
|
|||
|
Restricted stock units
|
2,276,994
|
|
—
|
|
—
|
|
|||
|
Stock options to purchase Class A common stock
|
1,271,152
|
|
—
|
|
—
|
|
|||
|
Stock options to purchase Class B common stock
|
3,689,369
|
|
5,675,447
|
|
105,993
|
|
|||
|
Total
|
7,237,515
|
|
66,252,727
|
|
60,683,273
|
|
|||
|
12.
|
Subsequent Events
|
On August 16, 2018 we signed a letter of intent (LOI) with a third-party logistics contractor to lease and operate a fulfillment center in Leicester, England. The LOI commits the Company to a
two
year contract for logistics services at the Leicester fulfillment center that could be terminated after
18
months, with
six
months' notice. Under the terms of the LOI, nonperformance by the Company could result in an estimated termination payment of between
$5.0 million
and
$10.0 million
.
63
None.
Evaluation of Disclosure Controls and Procedures
Our management, with the participation of our Chief Executive Officer and Chief Financial Officer, has evaluated the effectiveness of our disclosure controls and procedures (as defined in Rules 13a-15(e) and 15d-15(e) under the Securities Exchange Act of 1934, as amended), as of the end of the period covered by this Annual Report.
Based on the evaluation of our disclosure controls and procedures as of
July 28, 2018
, our Chief Executive Officer and Chief Financial Officer concluded that, as a result of the material weakness in our internal control, our disclosure controls and procedures were not effective as of
July 28, 2018
.
Management’s Report on Internal Control Over Financial Reporting
This Annual Report does not include a report of management’s assessment regarding internal control over financial reporting or an attestation report of our registered public accounting firm due to a transition period established by SEC rules for newly public companies.
Material Weakness in Internal Control Over Financial Reporting
As of
July 28, 2018
, we have a material weakness in our internal control over financial reporting relating to the accounting and proprietary systems used in our financial reporting process not having the proper level of controls. Specifically, our systems lacked controls over access, program change management and computer operations that are needed to ensure access to financial data is adequately restricted to appropriate personnel.
A material weakness, as defined in the standards established by the Sarbanes-Oxley Act of 2002, (the “Sarbanes-Oxley Act”), is a deficiency, or a combination of deficiencies, in internal control over financial reporting such that there is a reasonable possibility that a material misstatement of our annual or interim financial statements will not be prevented or detected on a timely basis.
Management’s Plan to Remediate the Material Weakness
As a result of this material weakness, we have initiated and will continue to implement remediation measures including, but not limited to, engaging external consultants to conduct a review of processes that involve financial data within our accounting and proprietary systems. This review includes identification of potential risks, documentation of processes and recommendations for improvement. We are still in the process of completing the remediation of the previously identified material weakness.
The initiatives we are implementing to remediate the material weakness are subject to continued management review supported by confirmation and testing, as well as audit committee oversight. We will continue to implement measures to remedy our internal control deficiencies in order to meet the deadline imposed by Section 404 of the Sarbanes-Oxley Act. However, we cannot be certain that the measures we have taken or may take in the future will ensure that we will establish and maintain adequate controls over our financial processes and reporting in the future.
Notwithstanding the material weakness, our management has concluded that the financial statements included elsewhere in this Annual Report present fairly, in all material respects, our financial position, results of operations and cash flows in conformity with GAAP.
If we fail to fully remediate the material weakness or fail to maintain effective internal controls in the future, it could result in a material misstatement of our financial statements that would not be prevented or detected on a timely basis, which could cause investors to lose confidence in our financial information or cause our stock price to decline. Our independent registered public accounting firm has not assessed the effectiveness of our internal control over financial reporting, which may increase the risk that weaknesses or deficiencies in our internal control over financial reporting go undetected.
Changes in Internal Control
Other than the changes intended to remediate the material weakness noted above, there were no changes in our internal control over financial reporting during the fiscal quarter ended
July 28, 2018
, that have materially affected, or are reasonably likely to materially affect, our internal control over financial reporting.
Limitations on Effectiveness of Controls and Procedures
In designing and evaluating the disclosure controls and procedures and internal control over financial reporting, management recognizes that any controls and procedures, no matter how well designed and operated, can provide only reasonable assurance of achieving the desired control objectives. In addition, the design of disclosure controls and procedures and internal control over financial reporting must reflect the fact that there are resource constraints and that management is required to apply judgment in evaluating the benefits of possible controls and procedures relative to their costs.
64
None.
Information required by this item regarding directors and director nominees, executive officers, the board of directors and its committees, certain corporate governance matters and compliance with Section 16(a) of the Exchange Act is incorporated by reference to the information set forth in the definitive proxy statement for our
2018
Annual Meeting of Stockholders, or the
2018
Proxy Statement.
We have adopted a written code of business conduct and ethics, or the Code of Conduct, that applies to all of our employees, officers and directors, including our principal executive officer, principal financial officer and principal accounting officer. The Code of Conduct is available on our corporate website at https://investors.stitchfix.com/ under “Documents” under the section entitled “Governance.” If we make any substantive amendments to our Code of Conduct or grant any of our directors or executive officers any waiver, including any implicit waiver, from a provision of our Code of Conduct, we will disclose the nature of the amendment or waiver on our website or in a Current Report on Form 8-K.
Information required by this item regarding executive compensation is incorporated by reference to the information set forth in our
2018
Proxy Statement.
Information required by this item regarding security ownership of certain beneficial owners and management and securities authorized for issuance under our equity compensation plans is incorporated by reference to the information set forth in our
2018
Proxy Statement.
Information required by this item regarding certain relationships and related transactions and director independence is incorporated by reference to the information set forth in our
2018
Proxy Statement.
Information required by this item regarding principal accounting fees and services is incorporated by reference to the information set forth in our
2018
Proxy Statement.
(a) The following documents are filed as part of this Annual Report:
(1) The financial statements are filed as part of this Annual Report under "Item 8. Financial Statements and Supplementary Data."
(2) The financial statement schedules are omitted because they are either not applicable or the information required is presented in the financial statements and notes thereto under "Item 8. Financial Statements and Supplementary Data."
(3) The exhibits listed in the following Exhibit Index are filed, furnished or incorporated by reference as part of this Annual Report.
65
Exhibit Index
|
Incorporation by Reference
|
||||||||||||
|
Exhibit
Number
|
Description
|
Form
|
File No.
|
Exhibit
|
Filing Date
|
Filed or Furnished Herewith
|
||||||
|
3.1
|
8-K
|
001-38291
|
3.1
|
11/21/2017
|
||||||||
|
3.2
|
8-K
|
001-38291
|
3.2
|
11/21/2017
|
||||||||
|
4.1
|
S-1/A
|
333-221014
|
4.1
|
11/6/2017
|
||||||||
|
4.2
|
S-8
|
333-221650
|
4.6
|
11/17/2017
|
||||||||
|
10.1
|
S-1
|
333-221014
|
10.1
|
10/19/2017
|
||||||||
|
10.2+
|
S-1
|
333-221014
|
10.2
|
10/19/2017
|
||||||||
|
10.3+
|
S-1
|
333-221014
|
10.3
|
10/19/2017
|
||||||||
|
10.4+
|
X
|
|||||||||||
|
10.5+
|
S-1/A
|
333-221014
|
10.5
|
11/6/2017
|
||||||||
|
10.6+
|
S-1/A
|
333-221014
|
10.6
|
11/6/2017
|
||||||||
|
10.7+
|
S-1
|
333-221014
|
10.7
|
10/19/2017
|
||||||||
|
10.8+
|
S-1
|
333-221014
|
10.8
|
10/19/2017
|
||||||||
|
10.9+
|
S-1
|
333-221014
|
10.9
|
10/19/2017
|
||||||||
|
10.10+
|
S-1
|
333-221014
|
10.10
|
10/19/2017
|
||||||||
|
10.11+
|
S-1
|
333-221014
|
10.11
|
10/19/2017
|
||||||||
|
10.12+
|
S-1
|
333-221014
|
10.13
|
10/19/2017
|
||||||||
|
10.13+
|
S-1
|
333-221014
|
10.16
|
10/19/2017
|
||||||||
|
10.14+
|
X
|
|||||||||||
|
10.15
|
S-1/A
|
333-221014
|
10.12
|
11/6/2017
|
||||||||
|
10.16
|
10-Q
|
001-38291
|
10.1
|
3/13/2018
|
||||||||
|
10.17
|
10-Q
|
001-38291
|
10.2
|
3/13/2018
|
||||||||
66
|
10.18
|
8-K
|
001-38291
|
10.1
|
2/2/2018
|
||||||||
|
10.19
|
10-Q
|
001-38291
|
10.2
|
6/8/2018
|
||||||||
|
10.20#
|
S-1
|
333-221014
|
10.14
|
10/19/2017
|
||||||||
|
10.21#
|
10-Q
|
001-38291
|
10.4
|
6/8/2018
|
||||||||
|
10.22#
|
10-Q
|
001-38291
|
10.3
|
6/8/2018
|
||||||||
|
21.1
|
X
|
|||||||||||
|
23.1
|
X
|
|||||||||||
|
31.1
|
X
|
|||||||||||
|
31.2
|
X
|
|||||||||||
|
32.1†
|
X
|
|||||||||||
|
101.INS
|
XBRL Instance Document
|
X
|
||||||||||
|
101.SCH
|
XBRL Taxonomy Extension Schema Document
|
X
|
||||||||||
|
101.CAL
|
XBRL Taxonomy Extension Calculation Linkbase Document
|
X
|
||||||||||
|
101.DEF
|
XBRL Taxonomy Extension Definition Linkbase Document
|
X
|
||||||||||
|
101.LAB
|
XBRL Taxonomy Extension Label Linkbase Document
|
X
|
||||||||||
|
101.PRE
|
XBRL Taxonomy Extension Presentation Linkbase Document
|
X
|
||||||||||
+ Indicates management contract or compensatory plan.
# Confidential treatment has been granted for portions of this exhibit. These portions have been omitted from the registration statement and submitted separately to the SEC.
† The certification attached as Exhibit 32.1 accompanying this Annual Report on Form 10-K is not deemed filed with the Securities and Exchange Commission and is not to be incorporated by reference into any filing of Stitch Fix, Inc. under the Securities Act of 1933, as amended, or the Securities Exchange Act of 1934, as amended, whether made before or after the date of this Annual Report on Form 10-K, irrespective of any general incorporation language contained in such filing.
67
None.
68
SIGNATURES
Pursuant to the requirements of Section 13 or 15(d) of the Securities Exchange Act of 1934, as amended, the registrant has duly caused this Annual Report to be signed on its behalf by the undersigned, thereunto duly authorized
.
|
Stitch Fix, Inc.
|
|||||||
|
Date: October 3, 2018
|
By:
|
/s/ Paul Yee
|
|||||
|
Paul Yee
|
|||||||
|
Chief Financial Officer
|
|||||||
|
(Principal Financial and Accounting Officer)
|
|||||||
69
POWER
OF
ATTORNEY
KNOW ALL PERSONS BY THESE PRESENTS, that each person whose signature appears below constitutes and appoints Katrina Lake, Paul Yee and Scott Darling, and each of them, as his or her true and lawful attorneys-in-fact and agents, with full power of substitution for him or her, and in his or her name in any and all capacities, to sign any and all amendments to this Annual Report on Form 10-K, and to file the same, with exhibits thereto and other documents in connection therewith, with the U.S. Securities and Exchange Commission, granting unto said attorneys-in-fact and agents, and each of them, full power and authority to do and perform each and every act and thing requisite and necessary to be done therewith, as fully to all intents and purposes as he or she might or could do in person, hereby ratifying and confirming all that said attorneys-in-fact and agents, and either of them, his or her substitute or substitutes, may lawfully do or cause to be done by virtue hereof.
Pursuant to the requirements of the Securities Exchange Act of 1934, as amended, this report has been signed below by the following persons on behalf of the registrant and in the capacities and on the dates indicated.
|
Name
|
Title
|
Date
|
||
|
/s/ Katrina Lake
|
Founder, Chief Executive Officer and Director
|
October 3, 2018
|
||
|
Katrina Lake
|
(
Principal Executive Officer
)
|
|||
|
/s/ Paul Yee
|
Chief Financial Officer
|
October 3, 2018
|
||
|
Paul Yee
|
(
Principal Financial and Accounting Officer
)
|
|||
|
/s/ Steven Anderson
|
Director
|
October 3, 2018
|
||
|
Steven Anderson
|
||||
|
/s/ J. William Gurley
|
Director
|
October 3, 2018
|
||
|
J. William Gurley
|
||||
|
/s/ Marka Hansen
|
Director
|
October 3, 2018
|
||
|
Marka Hansen
|
||||
|
/s/ Kirsten Lynch
|
Director
|
October 3, 2018
|
||
|
Kirsten Lynch
|
||||
|
/s/ Sharon McCollam
|
Director
|
October 3, 2018
|
||
|
Sharon McCollam
|
||||
70
TABLE OF CONTENTS
Part IItem 1. BusinessItem Measurements, Such As Length, Width, Diameter Of Sleeve Opening and Distance From Collar To First Button;Item 1A. Risk FactorsItem 1B. Unresolved Staff CommentsItem 2. PropertiesItem 3. Legal ProceedingsItem 4. Mine Safety DisclosuresPart IIItem 5. Market For Registrant S Common Equity, Related Stockholder Matters and Issuer Purchases Of Equity SecuritiesItem 6. Selected Consolidated and Other Financial DataItem 7. Management S Discussion and Analysis Of Financial Condition and Results Of OperationsItem 7A. Quantitative and Qualitative Disclosures About Market RiskItem 8. Financial Statements and Supplementary DataItem 9. Changes in and Disagreements with Accountants on Accounting and Financial DisclosureItem 9A. Controls and ProceduresItem 9B. Other InformationPart IIIItem 10. Directors, Executive Officers and Corporate GovernanceItem 11. Executive CompensationItem 12. Security Ownership Of Certain Beneficial Owners and Management and Related Stockholder MattersItem 13. Certain Relationships and Related Transactions, and Director IndependenceItem 14. Principal Accounting Fees and ServicesPart IVItem 15. Exhibits, Financial Statement SchedulesItem 16. Form 10-k Summary