SIMMONS FIRST NATIONAL CORP
10-Ks and 10-Qs
|
|
|
|
|
|
|
|
|
|
|
|
|
|
|
|
|
|
|
|
|
|
|
|
|
|
|
|
|
|
|
|
|
|
|
|
|
|
|
|
|
|
|
|
|
|
|
|
|
|
|
|
|
|
|
|
|
|
|
UNITED STATES
SECURITIES AND EXCHANGE COMMISSION
Washington, D.C. 20549
FORM 10-K
(Mark One)
|
x
|
Annual Report Pursuant to Section 13 or 15(d) of the Exchange Act of 1934
|
For the fiscal year ended: December 31, 2014
or
|
o
|
Transition Report Pursuant to Section 13 or 15(d) of the Securities Exchange Act of 1934
|
Commission file number 0-6253
SIMMONS FIRST NATIONAL CORPORATION
(Exact name of registrant as specified in its charter)
|
Arkansas
|
71-0407808
|
|
(State or other jurisdiction of
|
(I.R.S. employer
|
|
incorporation or organization)
|
identification No.)
|
|
501 Main Street, Pine Bluff, Arkansas
|
71601
|
|
(Address of principal executive offices)
|
(Zip Code)
|
(870) 541-1000
(Registrant's telephone number, including area code)
Securities registered pursuant to Section 12(b) of the Act:
|
Common Stock, $0.01 par value
|
The NASDAQ Global Select Market
®
|
|
(Title of each class)
|
(Name of each exchange on which registered)
|
Securities registered pursuant to Section 12(g) of the Act: None
Indicate by check mark if the registrant is a well-known seasoned issuer, as defined in Rule 405 of the Securities Act.
o
Yes
x
No
Indicate by check mark if the registrant is not required to file reports pursuant to Section 13 or Section 15(d) of the Act.
o
Yes
x
No
Indicate by check mark whether the registrant (1) has filed all reports required to be filed by Section 13 or 15(d) of the Securities Exchange Act of 1934 during the preceding 12 months (or for such shorter period that the registrant was required to file such reports), and (2) has been subject to such filing requirements for the past 90 days.
x
Yes
o
No
Indicate by check mark whether the registrant has submitted electronically and posted on its corporate Web site, if any, every Interactive Data File required to be submitted and posted pursuant to Rule 405 of Regulation S-T (§ 232.405 of this chapter) during the preceding 12 months (or for such shorter period that the registrant was required to submit and post such files).
x
Yes
o
No
Indicate by check mark if disclosure of delinquent filers pursuant to Item 405 of Regulation S-K is not contained herein, and will not be contained, to the best of registrant's knowledge in definitive proxy or in information statements incorporated by reference in Part III of this Form 10-K or any amendment to this Form 10-K.
x
Indicate by check mark whether the registrant is a large accelerated filer, an accelerated filer, or a non-accelerated filer, or a smaller reporting company. See definitions of “large accelerated filer,” accelerated filer” and “smaller reporting company” in Rule 12b-2 of the Exchange Act. (Check one):
|
Large accelerated filer
o
|
Accelerated filer
x
|
|
Non-accelerated filer
o
(Do not check if a smaller reporting company)
|
Smaller reporting company
o
|
Indicate by check mark whether the registrant is a shell company (as defined in Rule 12b-2 of the Act.).
o
Yes
x
No
The aggregate market value of the Registrant’s Common Stock, par value $0.01 per share, held by non-affiliates on June 30, 2014, was $585,950,357 based upon the last trade price as reported on the NASDAQ Global Select Market® of $39.39.
The number of shares outstanding of the Registrant's Common Stock as of February 28, 2015, was 29,836,794.
Part III is incorporated by reference from the Registrant's Proxy Statement relating to the Annual Meeting of Shareholders to be held on June 18, 2015.
1
Introduction
The Company has chosen to combine our Annual Report to Shareholders with our Form 10-K, which is a document that U.S. public companies file with the Securities and Exchange Commission every year. Many readers are familiar with “Part II” of the Form 10-K, as it contains the business information and financial statements that were included in the financial sections of our past Annual Reports. These portions include information about our business that we believe will be of interest to investors. We hope investors will find it useful to have all of this information available in a single document.
The Securities and Exchange Commission allows us to report information in the Form 10-K by “incorporated by reference” from another part of the Form 10-K, or from the proxy statement. You will see that information is “incorporated by reference” in various parts of our Form 10-K.
A more detailed table of contents for the entire Form 10-K follows:
FORM 10-K INDEX
CAUTIONARY NOTE REGARDING FORWARD-LOOKING STATEMENTS
Certain statements contained in this Annual Report may not be based on historical facts and are “forward-looking statements” within the meaning of Section 27A of the Securities Act of 1933, as amended, and Section 21E of the Securities Exchange Act of 1934, as amended. These forward-looking statements may be identified by reference to a future period(s) or by the use of forward-looking terminology, such as “anticipate,” “estimate,” “expect,” “foresee,” “believe,” “may,” “might,” “will,” “would,” “could” or “intend,” future or conditional verb tenses, and variations or negatives of such terms. These forward-looking statements include, without limitation, those relating to the Company’s future growth, revenue, assets, asset quality, profitability and customer service, critical accounting policies, net interest margin, non-interest revenue, market conditions related to the Company’s stock repurchase program, allowance for loan losses, the effect of certain new accounting standards on the Company’s financial statements, income tax deductions, credit quality, the level of credit losses from lending commitments, net interest revenue, interest rate sensitivity, loan loss experience, liquidity, capital resources, market risk, earnings, effect of pending litigation, acquisition strategy, legal and regulatory limitations and compliance and competition.
These forward-looking statements involve risks and uncertainties, and may not be realized due to a variety of factors, including, without limitation: the effects of future economic conditions, governmental monetary and fiscal policies, as well as legislative and regulatory changes; the risks of changes in interest rates and their effects on the level and composition of deposits, loan demand and the values of loan collateral, securities and interest sensitive assets and liabilities; the costs of evaluating possible acquisitions and the risks inherent in integrating acquisitions; the effects of competition from other commercial banks, thrifts, mortgage banking firms, consumer finance companies, credit unions, securities brokerage firms, insurance companies, money market and other mutual funds and other financial institutions operating in our market area and elsewhere, including institutions operating regionally, nationally and internationally, together with such competitors offering banking products and services by mail, telephone, computer and the Internet; the failure of assumptions underlying the establishment of reserves for possible loan losses, fair value for covered loans, covered other real estate owned and FDIC indemnification asset; and those factors set forth under Item 1A. Risk-Factors of this report and other cautionary statements set forth elsewhere in this report. Many of these factors are beyond our ability to predict or control. In addition, as a result of these and other factors, our past financial performance should not be relied upon as an indication of future performance.
We believe the expectations reflected in our forward-looking statements are reasonable, based on information available to us on the date hereof. However, given the described uncertainties and risks, we cannot guarantee our future performance or results of operations and you should not place undue reliance on these forward-looking statements. We undertake no obligation to update or revise any forward-looking statements, whether as a result of new information, future events or otherwise, and all written or oral forward-looking statements attributable to us are expressly qualified in their entirety by this section.
|
ITEM
1.
|
BUSINESS
|
Company Overview
Simmons First National Corporation (the “Company”) is a financial holding company registered under the Bank Holding Company Act of 1956, as amended. The Company is headquartered in Arkansas with total assets of $4.6 billion, loans of $2.7 billion, deposits of $3.9 billion and equity capital of $494 million as of December 31, 2014. We conduct banking operations through more than 100 branches, or “financial centers,” located in communities throughout Arkansas, Missouri, and Kansas.
We seek to build shareholder value by (i) focusing on strong asset quality, (ii) maintaining strong capital (iii) managing our liquidity position, (iv) improving our operational efficiency (v) opportunistically growing our business, both organically and through acquisitions of financial institutions.
Subsidiary Bank
Our subsidiary bank, Simmons First National Bank (“Simmons Bank” or “lead bank”), is a national bank which has been in operation since 1903. Simmons First Trust Company N.A., a wholly-owned subsidiary of Simmons Bank, performs the trust and fiduciary business operations for Simmons Bank. Simmons First Investment Group, Inc., a wholly-owned subsidiary of Simmons Bank, is a broker-dealer registered with the SEC and a member of the Financial Industry Regulatory Authority and performs the broker-dealer and retail investment operations for Simmons Bank. Simmons First Capital Management, Inc., a wholly-owned subsidiary of Simmons Bank, is a Registered Investment Advisor. Simmons First Insurance Services, Inc., is an insurance agency providing life, auto, home, business and commercial insurance coverage.
3
Simmons Bank and its subsidiaries provide complete banking services to individuals and businesses throughout the market areas they serve. Simmons Bank offers consumer, real estate and commercial loans, checking, savings and time deposits. We have also developed through our experience and scale and through acquisitions, specialized products and services that are in addition to those offered by the typical community bank. Those products include credit cards, trust services, investments, agricultural finance lending, equipment lending, insurance, consumer finance and SBA lending.
Community Bank Strategy
Historically, we utilized separately chartered community banks, supported by our lead bank to provide full service banking products and services across our footprint. On March 5, 2014, we announced the planned consolidation of our six smaller subsidiary banks into Simmons First National Bank. Three banks, Jonesboro, Searcy and Hot Springs, were merged into Simmons Bank in May 2014. The remaining three banks, Lake Village, Russellville and El Dorado, were merged into Simmons Bank in August 2014. We made the decision to consolidate in order to effectively meet the increased regulatory burden facing banks, to reduce certain operating costs and more efficiently perform operational duties. After the charter consolidation, Simmons Bank operates as four separate regions. Below is a listing of our regions:
|
Region
|
Headquarters
|
|
South Arkansas Region
|
Pine Bluff, Arkansas
|
|
Central/Northeast Arkansas Region
|
Little Rock, Arkansas
|
|
Northwest Arkansas Region
|
Rogers, Arkansas
|
|
Kansas/Missouri Region
|
Springfield, Missouri
|
Growth Strategy
Over the past 25 years, as we have expanded our markets and services, our growth strategy has evolved and diversified. From 1989 through 1991, in addition to our internal branching expansion, we acquired nine branches from the Resolution Trust Corporation, the federal agency that oversaw the sale or liquidation of assets of closed savings and loans institutions.
From 1995 to 2005, our strategic focus was on creating geographic diversification throughout Arkansas, driven primarily by acquisitions of other banking institutions. During this period we completed acquisitions of nine financial institutions and a total of 20 branches from five other banking institutions, some of which allowed us to enter key growth markets such as Conway, Hot Springs, Russellville, Searcy and Northwest Arkansas. In 2005, we initiated a de novo branching strategy to enter selected new Arkansas markets and to complement our presence in existing markets. From 2005 to 2008, we opened 12 new financial centers, a regional headquarters in Northwest Arkansas and a corporate office in Little Rock. We substantially completed our de novo branching strategy in 2008.
In late 2007, as we anticipated deteriorating economic conditions, we concentrated on maintaining our strong asset quality, building capital and improving our liquidity position. We intensified our focus on loan underwriting and on monitoring our loan portfolio in order to maintain asset quality, which is well above our peer group and the industry average. From late 2007 to December 31, 2009, our liquidity position (net overnight funds sold) improved by approximately $150 million as a result of a strategic initiative to introduce deposit products that grew our core deposits in transaction and savings accounts and improved our deposit mix. Transaction and savings deposits increased from 48% of total deposits as of December 31, 2007, to 62% of total deposits as of December 31, 2009, to 63% of total deposits as of December 31, 2010, to 67% of total deposits as of December 31, 2011 and to 70% of total deposits as of December 31, 2012.
In December 2009, we completed a secondary stock offering by issuing a total of 3,047,500 shares of common stock, including the over-allotment, at a price of $24.50 per share, less underwriting discounts and commissions. The net proceeds of the offering after deducting underwriting discounts and commissions and offering expenses were approximately $70.5 million. The additional capital positioned us to take advantage of unprecedented acquisition opportunities through FDIC-assisted transactions of failed banks.
In 2010, we expanded outside the borders of Arkansas by acquiring two failed institutions through FDIC-assisted transactions. The first was a $100 million failed bank located in Springfield, Missouri and the second was a $400 million failed thrift located in Olathe, Kansas. On both transactions, we entered into a loss share agreement with the FDIC, which provides significant protection of 80% of covered assets. As part of the acquisitions, we recognized a pre-tax bargain purchase gain of $3.0 million and $18.3 million, respectively, on the Missouri and Kansas transactions.
In 2012, we acquired two additional failed institutions through FDIC-assisted transactions. The first was a $300 million failed bank located in St. Louis, Missouri and the second was a $200 million failed bank located in Sedalia, Missouri. On both transactions, we again entered into a loss share agreement with the FDIC to provide 80% protection of a significant portion of the assets. As part of the acquisitions, we recognized a pre-tax bargain purchase gain of $1.1 million and $2.3 million, respectively, on the Missouri transactions.
4
In 2013, we completed the acquisition of Metropolitan National Bank (“Metropolitan” or “MNB”) from Rogers Bancshares, Inc. (“RBI”). The purchase was completed through an auction of the MNB stock by the U. S. Bankruptcy Court as a part of the Chapter 11 proceeding of RBI. MNB, which was headquartered in Little Rock, Arkansas, served central and northwest Arkansas and had total assets of $950 million. Upon completion of the acquisition, MNB and our Rogers, Arkansas chartered bank, Simmons First Bank of Northwest Arkansas were merged into our lead bank. As an in market acquisition, MNB had significant branch overlap with our existing branch footprint. We completed the systems conversion for MNB on March 21, 2014 and simultaneously closed 27 branch locations that had overlapping footprints with other locations. We continue to actively pursue additional acquisition opportunities that meet our strategic guidelines regarding mergers and acquisitions.
On August 31, 2014, we completed the acquisition of Delta Trust & Banking Corporation (“Delta Trust”), including its wholly-owned bank subsidiary Delta Trust & Bank. Also headquartered in Little Rock, Delta Trust had total assets of $420 million. The acquisition further expanded Simmons Bank's presence in south, central and northwest Arkansas and allows us the opportunity to provide services that have not previously been offered with the addition of Delta Trust's insurance agency and securities brokerage service. We merged Delta Trust & Bank into Simmons Bank and completed the systems conversion on October 24, 2014. At that time, we also closed 4 branch locations with overlapping footprints.
On March 4, 2014 the Company filed a shelf registration statement with the Securities and Exchange Commission (“SEC”). Subsequently, on June 18, 2014, we filed Amendment No. 1 to the shelf registration statement. When declared effective, the shelf registration statement, will allow us to raise capital from time to time, up to an aggregate of $300 million, through the sale of common stock, preferred stock, stock warrants, stock rights or a combination thereof, subject to market conditions. Specific terms and prices are determined at the time of any offering under a separate prospectus supplement that the Company is required to file with the SEC at the time of the specific offering.
Acquisition Strategy
We intend to focus our near term acquisition strategy on traditional acquisitions. We believe that the challenging economic environment combined with more restrictive bank regulatory reforms will cause many financial institutions to seek merger partners in the near to intermediate future. We also believe our community banking philosophy, access to capital and successful acquisition history position us as a purchaser of choice for community banks seeking a strong partner.
We expect that our primary geographic target area for acquisitions will continue to be Arkansas and its contiguous states. Our priority will be to focus on acquisitions that would complement our current footprint in the Arkansas, Kansas, Missouri and Tennessee markets. The senior management teams of both our parent company and lead bank have had extensive experience during the past twenty-five years in acquiring banks, branches and deposits and post-acquisition integration of operations. We believe this experience positions us to successfully acquire and integrate banks.
With respect to negotiated community bank acquisitions:
|
·
|
We have historically retained the target institution’s senior management and have provided them with an appealing level of autonomy post-integration. We intend to continue to pursue negotiated community bank acquisitions and we believe that our history with respect to such acquisitions has positioned us as an acquirer of choice for community banks.
|
|
·
|
We encourage acquired community banks, their boards and associates to maintain their community involvement, while empowering the banks to offer a broader array of financial products and services. We believe this approach leads to enhanced profitability after the acquisition.
|
Loan Risk Assessment
As part of our ongoing risk assessment, the Company has an Asset Quality Review Committee of management that meets quarterly to review the adequacy of the allowance for loan losses. The Committee reviews the status of past due, non-performing and other impaired loans, reserve ratios, and additional performance indicators for its subsidiary bank. The appropriateness of the allowance for loan losses is determined based upon the aforementioned performance factors, and provision adjustments are made accordingly.
The Board of Directors reviews the adequacy of its allowance for loan losses on a monthly basis giving consideration to past due loans, non-performing loans, other impaired loans, and current economic conditions. Our loan review department monitors loan information monthly. In addition, the loan review department prepares an analysis of the allowance for loan losses for each bank region twice a year, and reports the results to our Enterprise Risk Committee. In order to verify the accuracy of the monthly analysis of the allowance for loan losses, the loan review department performs a detailed review of each region’s loan files on a semi-annual basis. Additionally, we have instituted a Special Asset Committee for the purpose of reviewing criticized loans in regard to collateral adequacy, workout strategies and proper reserve allocations.
The Simmons Bank Board of Directors has delegated oversight of all acquired assets (covered and not covered by FDIC loss share agreements) to the Acquired Asset Loan Committee, comprised of the Corporate CEO, President and an Executive Vice President, along with several Simmons Bank executives. The Board authorizes the Committee to transact loan origination, renewal and workout procedures relative to FDIC-assisted and traditional acquisitions.
5
Competition
There is significant competition among commercial banks in our various market areas. In addition, we also compete with other providers of financial services, such as savings and loan associations, credit unions, finance companies, securities firms, insurance companies, full service brokerage firms and discount brokerage firms. Some of our competitors have greater resources and, as such, may have higher lending limits and may offer other services that we do not provide. We generally compete on the basis of customer service and responsiveness to customer needs, available loan and deposit products, the rates of interest charged on loans, the rates of interest paid for funds, and the availability and pricing of trust and brokerage services.
Principal Offices and Available Information
Our principal executive offices are located at 501 Main Street, Pine Bluff, Arkansas 71601, and our telephone number is (870) 541-1000. We also have corporate offices in Little Rock, Arkansas. We maintain a website at
http://www.simmonsfirst.com
. On this website under the section “Investor Relations”, we make our filings with the Securities and Exchange Commission available free of charge, along with other Company news and announcements.
Employees
As of January 31, 2015, the Company and its subsidiaries had approximately 1,331 full time equivalent employees. None of the employees is represented by any union or similar groups, and we have not experienced any labor disputes or strikes arising from any such organized labor groups. We consider our relationship with our employees to be good.
Executive Officers of the Company
The following is a list of all executive officers of the Company. The Board of Directors elects executive officers annually.
|
NAME
|
AGE
|
POSITION
|
YEARS SERVED
|
|||
|
George A. Makris, Jr.
|
58
|
Chairman and Chief Executive Officer
|
2
|
|||
|
David L. Bartlett
|
63
|
President and Chief Banking Officer
|
18
|
|||
|
Robert A. Fehlman
|
50
|
Senior Executive Vice President, Chief Financial Officer and Treasurer
|
26
|
|||
|
Marty D. Casteel
|
63
|
Executive Vice President
|
26
|
|||
|
David W. Garner
|
45
|
Executive Vice President, Controller and Chief Accounting Officer
|
17
|
|||
|
Susan F. Smith
|
53
|
Executive Vice President/Corporate Strategy and Performance and Secretary
|
17
|
|||
|
Tina M. Groves
|
45
|
Executive Vice President and Chief Risk Officer
|
9
|
|||
|
Patrick A. Burrow
|
61
|
Executive Vice President and General Counsel
|
0
|
|||
|
Stephen C. Massanelli
|
59
|
Executive Vice President/Organizational Development
|
0
|
6
Board of Directors of the Company
The following is a list of the Board of Directors of the Company as of December 31, 2014, along with their principal occupation.
|
NAME
|
PRINCIPAL OCCUPATION
|
|
George A. Makris, Jr.
(1)
|
Chairman and Chief Executive Officer
|
|
Simmons First National Corporation
|
|
|
David L. Bartlett
|
President and Chief Banking Officer
|
|
Simmons First National Corporation
|
|
|
William E. Clark, II
|
Chairman and Chief Executive Officer
|
|
Clark Contractors, LLC
|
|
|
Steven A. Cossé
|
President and Chief Executive Officer (retired) and Director
|
|
Murphy Oil Corporation
|
|
|
Edward Drilling
|
President
|
|
AT&T Arkansas
|
|
|
Sharon L. Gaber
|
Provost and Vice Chancellor for Academic Affairs
|
|
University of Arkansas
|
|
|
Eugene Hunt
|
Attorney
|
|
Hunt Law Firm
|
|
|
W. Scott McGeorge
|
President
|
|
Pine Bluff Sand and Gravel Company
|
|
|
Harry L. Ryburn
|
Orthodontist (retired)
|
|
Robert L. Shoptaw
|
Chairman of the Board
|
|
Arkansas Blue Cross and Blue Shield
|
|
(1)
|
Mr. Makris was elected as CEO – Elect on August 13, 2012, effective January 1, 2013. He succeeded J. Thomas May as Chairman and Chief Executive Officer upon Mr. May’s retirement on December 31, 2013. Mr. Makris has served on the Board of Directors of the Company since 1997 and served as chairman of the Company’s Audit & Security Committee from 2007 until his resignation upon his election to CEO – Elect. Prior to his election, he served as President of M. K. Distributors, Inc.
|
SUPERVISION AND REGULATION
The Company
The Company, as a bank holding company, is subject to both federal and state regulation. Under federal law, a bank holding company generally must obtain approval from the Board of Governors of the Federal Reserve System ("FRB") before acquiring ownership or control of the assets or stock of a bank or a bank holding company. Prior to approval of any proposed acquisition, the FRB will review the effect on competition of the proposed acquisition, as well as other regulatory issues.
The federal law generally prohibits a bank holding company from directly or indirectly engaging in non-banking activities. This prohibition does not include loan servicing, liquidating activities or other activities so closely related to banking as to be a proper incident thereto. Bank holding companies, including Simmons First National Corporation, which have elected to qualify as financial holding companies, are authorized to engage in financial activities. Financial activities include any activity that is financial in nature or any activity that is incidental or complimentary to a financial activity.
As a financial holding company, we are required to file with the FRB an annual report and such additional information as may be required by law. From time to time, the FRB examines the financial condition of the Company and its subsidiaries. The FRB, through civil and criminal sanctions, is authorized to exercise enforcement powers over bank holding companies (including financial holding companies) and non-banking subsidiaries, to limit activities that represent unsafe or unsound practices or constitute violations of law.
7
We are subject to certain laws and regulations of the state of Arkansas applicable to financial and bank holding companies, including examination and supervision by the Arkansas Bank Commissioner. Under Arkansas law, a financial or bank holding company is prohibited from owning more than one subsidiary bank, if any subsidiary bank owned by the holding company has been chartered for less than five years and, further, requires the approval of the Arkansas Bank Commissioner for any acquisition of more than 25% of the capital stock of any other bank located in Arkansas. No bank acquisition may be approved if, after such acquisition, the holding company would control, directly or indirectly, banks having 25% of the total bank deposits in the state of Arkansas, excluding deposits of other banks and public funds.
Federal legislation allows bank holding companies (including financial holding companies) from any state to acquire banks located in any state without regard to state law, provided that the holding company (1) is adequately capitalized, (2) is adequately managed, (3) would not control more than 10% of the insured deposits in the United States or more than 30% of the insured deposits in such state, and (4) such bank has been in existence at least five years if so required by the applicable state law.
Subsidiary Banks
During the fourth quarter of 2010, the Company realigned the regulatory oversight for its affiliate banks in order to create efficiencies through regulatory standardization. We operated as a multi-bank holding company and over the years, have acquired several banks. In accordance with the corporate strategy, in place at that time, of leaving the bank structure unchanged, each acquired bank stayed intact as did its regulatory structure. As a result, the Company’s eight affiliate banks were regulated by the Arkansas State Bank Department, the Federal Reserve, the FDIC, and/or the Office of the Comptroller of the Currency (“OCC”).
Following the regulatory realignment, the lead bank remained a national bank regulated by the OCC while the other affiliate banks became state member banks with the Arkansas State Bank Department as their primary regulator and the Federal Reserve as their federal regulator. Because of the overlap in footprint, during the fourth quarter of 2013 we merged Simmons First Bank of Northwest Arkansas into Simmons Bank in conjunction with our acquisition of Metropolitan, reducing the number of affiliate state member banks to six. On March 5, 2014, we announced the planned consolidation of our six smaller subsidiary banks into Simmons Bank. After the subsidiary banks were merged into the lead bank, the OCC remained Simmons Bank’s primary regulator.
The lending powers of our subsidiary bank are generally subject to certain restrictions, including the amount, which may be lent to a single borrower. Simmons Bank is a member of the FDIC, which provides insurance on deposits of each member bank up to applicable limits by the Deposit Insurance Fund. For this protection, Simmons Bank pays a statutory assessment to the FDIC each year.
Federal law substantially restricts transactions between banks and their affiliates. As a result, our subsidiary bank is limited in making extensions of credit to the Company, investing in the stock or other securities of the Company and engaging in other financial transactions with the Company. Those transactions that are permitted must generally be undertaken on terms at least as favorable to the bank as those prevailing in comparable transactions with independent third parties.
Potential Enforcement Action for Bank Holding Companies and Banks
Enforcement proceedings seeking civil or criminal sanctions may be instituted against any bank, any financial or bank holding company, any director, officer, employee or agent of the bank or holding company, which is believed by the federal banking agencies to be violating any administrative pronouncement or engaged in unsafe and unsound practices. In addition, the FDIC may terminate the insurance of accounts, upon determination that the insured institution has engaged in certain wrongful conduct or is in an unsound condition to continue operations.
Risk-Weighted Capital Requirements for the Company and the Subsidiary Banks
Since 1993, banking organizations (including financial holding companies, bank holding companies and banks) were required to meet a minimum ratio of Total Capital to Total Risk-Weighted Assets of 8%, of which at least 4% must be in the form of Tier 1 Capital. A well-capitalized institution is one that has at least a 10% "total risk-based capital" ratio. For a tabular summary of our risk-weighted capital ratios, see "Management's Discussion and Analysis of Financial Condition and Results of Operations – Capital" and Note 20, Stockholders’ Equity, of the Notes to Consolidated Financial Statements.
8
A banking organization's qualifying total capital consists of two components: Tier 1 Capital and Tier 2 Capital. Tier 1 Capital is an amount equal to the sum of common shareholders' equity, hybrid capital instruments (instruments with characteristics of debt and equity) in an amount up to 25% of Tier 1 Capital, certain preferred stock and the minority interest in the equity accounts of consolidated subsidiaries. For bank holding companies and financial holding companies, goodwill (net of any deferred tax liability associated with that goodwill) may not be included in Tier 1 Capital. Identifiable intangible assets may be included in Tier 1 Capital for banking organizations, in accordance with certain further requirements. At least 50% of the banking organization's total regulatory capital must consist of Tier 1 Capital.
Tier 2 Capital is an amount equal to the sum of the qualifying portion of the allowance for loan losses, certain preferred stock not included in Tier 1, hybrid capital instruments (instruments with characteristics of debt and equity), certain long-term debt securities and eligible term subordinated debt, in an amount up to 50% of Tier 1 Capital. The eligibility of these items for inclusion as Tier 2 Capital is subject to certain additional requirements and limitations of the federal banking agencies.
Under the risk-based capital guidelines, balance sheet assets and certain off-balance sheet items, such as standby letters of credit, are assigned to one of four-risk weight categories (0%, 20%, 50%, or 100%), according to the nature of the asset, its collateral or the identity of the obligor or guarantor. The aggregate amount in each risk category is adjusted by the risk weight assigned to that category to determine weighted values, which are then added to determine the total risk-weighted assets for the banking organization. For example, an asset, such as a commercial loan, assigned to a 100% risk category, is included in risk-weighted assets at its nominal face value, but a loan secured by a one-to-four family residence is included at only 50% of its nominal face value. The applicable ratios reflect capital, as so determined, divided by risk-weighted assets, as so determined. For information regarding upcoming changes to risk-based capital guidelines, see “Basel III Capital Rules” later in this section.
Federal Deposit Insurance Corporation Improvement Act
The Federal Deposit Insurance Corporation Improvement Act ("FDICIA"), enacted in 1991, requires the FDIC to increase assessment rates for insured banks and authorizes one or more "special assessments," as necessary for the repayment of funds borrowed by the FDIC or any other necessary purpose. As directed in FDICIA, the FDIC has adopted a transitional risk-based assessment system, under which the assessment rate for insured banks will vary according to the level of risk incurred in the bank's activities. The risk category and risk-based assessment for a bank is determined from its classification, pursuant to the regulation, as well capitalized, adequately capitalized or undercapitalized.
FDICIA substantially revised the bank regulatory provisions of the Federal Deposit Insurance Act and other federal banking statutes, requiring federal banking agencies to establish capital measures and classifications. Pursuant to the regulations issued under FDICIA, a depository institution will be deemed to be well capitalized if it significantly exceeds the minimum level required for each relevant capital measure; adequately capitalized if it meets each such measure; undercapitalized if it fails to meet any such measure; significantly undercapitalized if it is significantly below any such measure; and critically undercapitalized if it fails to meet any critical capital level set forth in regulations. The federal banking agencies must promptly mandate corrective actions by banks that fail to meet the capital and related requirements in order to minimize losses to the FDIC. The FDIC and OCC advised the Company that the subsidiary banks have been classified as well capitalized under these regulations.
The federal banking agencies are required by FDICIA to prescribe standards for banks and bank holding companies (including financial holding companies) relating to operations and management, asset quality, earnings, stock valuation and compensation. A bank or bank holding company that fails to comply with such standards will be required to submit a plan designed to achieve compliance. If no plan is submitted or the plan is not implemented, the bank or holding company would become subject to additional regulatory action or enforcement proceedings.
A variety of other provisions included in FDICIA may affect the operations of the Company and the subsidiary banks, including new reporting requirements, revised regulatory standards for real estate lending, "truth in savings" provisions, and the requirement that a depository institution give 90 days prior notice to customers and regulatory authorities before closing any branch.
Dodd-Frank Wall Street Reform and Consumer Protection Act
On July 21, 2010, the President signed into law the Dodd-Frank Wall Street Reform and Consumer Protection Act (“Dodd-Frank Act”), which significantly changes the regulation of financial institutions and the financial services industry. The Dodd-Frank Act includes provisions affecting large and small financial institutions alike, including several provisions that profoundly affect how community banks, thrifts, and small bank and thrift holding companies are regulated in the future. Among other things, these provisions abolish the Office of Thrift Supervision and transfer its functions to the other federal banking agencies, relax rules regarding interstate branching, allow financial institutions to pay interest on business checking accounts, and impose new capital requirements on bank and thrift holding companies.
9
The Dodd-Frank Act requires that the amount of any interchange fee charged by a debit card issuer with respect to a debit card transaction must be reasonable and proportional to the cost incurred by the issuer. Effective October 1, 2011, the FRB set the interchange rate cap at $0.21 per transaction plus five basis points multiplied by the value of the transaction. While the restrictions on interchange fees do not apply to banks that, together with their affiliates, have assets of less than $
10 billion
, the rule has affected the competitiveness of debit cards issued by smaller banks. If our bank subsidiary exceeds $10 billion in total assets, then it will become subject to the interchange rate limits of larger banks which may negatively impact our interchange revenue.
The Dodd-Frank Act also established the Bureau of Consumer Financial Protection (the “CFPB”) as an independent entity within the Federal Reserve, which will be given the authority to promulgate consumer protection regulations applicable to all entities offering consumer financial services or products, including banks. Additionally, the Dodd-Frank Act includes a series of provisions covering mortgage loan origination standards affecting, among other things, originator compensation, minimum repayment standards, and pre-payment penalties. The Dodd-Frank Act contains numerous other provisions affecting financial institutions of all types, many of which may have an impact on our operating environment in substantial and unpredictable ways.
Because many of the regulations required to implement the Dodd-Frank Act have been only recently issued, or have not yet been issued, the statute’s effect on the financial services industry in general, and on us in particular, is uncertain at this time. The Dodd-Frank Act is likely to affect our cost of doing business, however, and may limit or expand the scope of our permissible activities and affect the competitive balance within our industry and market areas. Our management continues to actively review the provisions of the Dodd-Frank Act and to assess its probable impact on our business, financial condition, and results of operations. However, given the sweeping nature of the Dodd-Frank Act and other federal government initiatives, we expect that the Company’s regulatory compliance costs will increase over time.
FDIC Deposit Insurance and Assessments
Our customer deposit accounts are insured up to applicable limits by the FDIC’s Deposit Insurance Fund (“DIF) up to $250,000 per separately insured depositor.
The Dodd-Frank Act, which was signed into law on July 21, 2010, changed how the FDIC calculates deposit insurance premiums payable by insured depository institutions. The Dodd-Frank Act directs the FDIC to amend its assessment regulations so that future assessments will generally be based upon a depository institution’s average total consolidated assets minus the average tangible equity of the insured depository institution during the assessment period, whereas assessments were previously based on the amount of an institution’s insured deposits. The minimum deposit insurance fund rate will increase from 1.15% to 1.35% by September 30, 2020, and the cost of the increase will be borne by depository institutions with assets of $10 billion or more. If our bank subsidiary exceeds $10 billion in total assets, then it will become subject to the assessment rates assigned to larger banks which may result in higher deposit insurance premiums.
The Dodd-Frank Act also provides the FDIC with discretion to determine whether to pay rebates to insured depository institutions when its deposit insurance reserves exceed certain thresholds. Previously, the FDIC was required to give rebates to depository institutions equal to the excess once the reserve ratio exceeded 1.50%, and was required to rebate 50% of the excess over 1.35% but not more than 1.5% of insured deposits. The FDIC adopted a final rule on February 7, 2011 that implemented these provisions of the Dodd-Frank Act.
Basel III Capital Rules
In July 2013, the Federal Reserve published final rules (the “Basel III Capital Rules”) implementing Basel III and establishing a new comprehensive capital framework for U.S. banks. The Basel III Capital Rules substantially revise the risk-based capital requirements applicable to bank holding companies and depository institutions compared to the current U.S. risk-based capital rules.
The Basel III Capital Rules define the components of capital and address other issues affecting the numerator in banking institutions’ regulatory capital ratios. The rules also address risk weights and other issues affecting the denominator in banking institutions’ regulatory capital ratios and replace the existing risk-weighting approach with a more risk-sensitive approach.
10
The Basel III Capital Rules expand the risk-weighting categories from the current four Basel I-derived categories (0%, 20%, 50% and 100%) to a much larger and more risk-sensitive number of categories, depending on the nature of the assets, generally ranging from 0% for U.S. government and agency securities, to 600% for certain equity exposures, and resulting in higher risk weights for a variety of asset categories, including many residential mortgages and certain commercial real estate.
The final rules include a new common equity Tier 1 capital to risk-weighted assets ratio of 4.5% and a common equity Tier 1 capital conservation buffer of 2.5% of risk-weighted assets. The rules also raise the minimum ratio of Tier 1 capital to risk-weighted assets from 4.0% to 6.0% and require a minimum leverage ratio of 4.0%. The Basel III Capital Rules are effective for the Company and its subsidiary bank on January 1, 2015, with full compliance with all of the final rule’s requirements phased in over a multi-year schedule. Management believes that, as of December 31, 2014, the Company and its subsidiary bank meet all capital adequacy requirements under the Basel III Capital Rules on a fully phased-in basis if such requirements were currently effective.
Pending Legislation
Because of concerns relating to competitiveness and the safety and soundness of the banking industry, Congress often considers a number of wide-ranging proposals for altering the structure, regulation, and competitive relationships of the nation’s financial institutions. We cannot predict whether or in what form any proposals will be adopted or the extent to which our business may be affected.
|
ITEM
1A.
|
RISK FACTORS
|
Risks Related to Our Industry
Our business may be adversely affected by conditions in the financial markets and general economic conditions.
From 2007 through 2009, the United States was in a recession. Although there are some indicators of improvement, business activity across a wide range of industries and regions has been greatly reduced and local governments and many businesses are having difficulty due to the lack of consumer spending, the lack of liquidity in the credit markets and high unemployment.
Market conditions have also led to the failure or merger of a number of prominent financial institutions. Financial institution failures or near-failures have resulted in further losses as a consequence of defaults on securities issued by them and defaults under contracts entered into with such entities as counterparties. Furthermore, declining asset values, defaults on mortgages and consumer loans, and the lack of market and investor confidence, as well as other factors, have all combined to increase credit default swap spreads, to cause rating agencies to lower credit ratings, and to otherwise increase the cost and decrease the availability of liquidity, despite very significant declines in Federal Reserve borrowing rates and other government actions. Some banks and other lenders have suffered significant losses and have become reluctant to lend, even on a secured basis, due to the increased risk of default and the impact of declining asset values on the value of collateral. The foregoing has significantly weakened the strength and liquidity of some financial institutions worldwide.
The Company’s financial performance generally, and in particular the ability of borrowers to pay interest on and repay principal of outstanding loans and the value of collateral securing those loans, is highly dependent upon the business environment in the states where we operate, and in the United States as a whole. A favorable business environment is generally characterized by, among other factors, economic growth, efficient capital markets, low inflation, high business and investor confidence and strong business earnings. Unfavorable or uncertain economic and market conditions can be caused by: declines in economic growth, business activity or investor or business confidence; limitations on the availability or increases in the cost of credit and capital; increases in inflation or interest rates; natural disasters; or a combination of these or other factors.
The business environment in the states where we operate could continue to deteriorate. There can be no assurance that these business and economic conditions will improve in the near term. The continuation of these conditions could adversely affect the credit quality of our loans and our results of operations and financial condition.
Recent legislative and regulatory initiatives to address difficult market and economic conditions may not stabilize the U.S. banking system.
In response to the financial crisis affecting the banking system and financial markets, the Dodd-Frank Act was enacted in 2010, as well as several programs that have been initiated by the U.S. Treasury, the FRB, and the FDIC to stabilize the financial system.
11
Some of the provisions of recent legislation and regulation that may adversely impact the Company include: the Durbin Amendment to the Dodd-Frank Act which mandates a limit to debit card interchange fees and Regulation E amendments to the EFTA regarding overdraft fees. These provisions may limit the type of products we offer, the methods by which we offer them, and the prices at which they are offered. These provisions may also increase our costs in offering these products.
The newly created CFPB has unprecedented authority over the regulation of consumer financial products and services. The CFPB has broad rule-making, supervisory and examination authority, as well as expanded data collecting and enforcement powers. The scope and impact of the CFPB's actions cannot be determined at this time, which creates significant uncertainty for the Company and the financial services industry in general.
These new laws, regulations, and changes may increase our costs of regulatory compliance. They may significantly affect the markets in which we do business, the markets for and value of our investments, and our ongoing operations, costs, and profitability. The future impact of the many provisions in the Dodd-Frank Act and other legislative and regulatory initiatives on the Company's business and results of operations will depend upon regulatory interpretation and rulemaking that will be undertaken over the next several months and years. As a result, we are unable to predict the ultimate impact of the Dodd-Frank Act or of other future legislation or regulation, including the extent to which it could increase costs or limit our ability to pursue business opportunities in an efficient manner, or otherwise adversely affect our business, financial condition and results of operations.
Difficult market conditions have adversely affected our industry.
The financial markets have continued to experience significant volatility. In some cases, the financial markets have produced downward pressure on stock prices and credit availability for certain issuers without regard to those issuers’ underlying financial strength. If financial market volatility worsens, or if there are more disruptions in the financial markets, including disruptions to the United States or international banking systems, there can be no assurance that we will not experience an adverse effect, which may be material, on our ability to access capital and on our business, financial condition and results of operations.
Risks Related to Our Business
Our concentration of banking activities in Arkansas, Missouri and Kansas, including our real estate loan portfolio, makes us more vulnerable to adverse conditions in the particular local markets in which we operate.
Our subsidiary bank operates primarily within the states of Arkansas, Missouri and Kansas, where the majority of the buildings and properties securing our loans and the businesses of our customers are located. Our financial condition, results of operations and cash flows are subject to changes in the economic conditions in these four states, the ability of our borrowers to repay their loans, and the value of the collateral securing such loans. We largely depend on the continued growth and stability of the communities we serve for our continued success. Declines in the economies of these communities or the states, in general could adversely affect our ability to generate new loans or to receive repayments of existing loans, and our ability to attract new deposits, thus adversely affecting our net income, profitability and financial condition.
The ability of our borrowers to repay their loans could also be adversely impacted by the significant changes in market conditions in the region or by changes in local real estate markets, including deflationary effects on collateral value caused by property foreclosures. This could result in an increase in our charge-offs and provision for loan losses. Either of these events would have an adverse impact on our results of operations.
A significant decline in general economic conditions caused by inflation, recession, unemployment, acts of terrorism or other factors beyond our control could also have an adverse effect on our financial condition and results of operations. In addition, because multi-family and commercial real estate loans represent the majority of our real estate loans outstanding, a decline in tenant occupancy due to such factors or for other reasons could adversely impact the ability of our borrowers to repay their loans on a timely basis, which could have a negative impact on our results of operations.
Deteriorating credit quality, particularly in our credit card portfolio, may adversely impact us.
We have a significant consumer credit card portfolio. Although we experienced a decreased amount of net charge-offs in our credit card portfolio in 2014 and 2013, the amount of net charge-offs could worsen. While we continue to experience a better performance with respect to net charge-offs than the national average in our credit card portfolio, our net charge-offs were 1.27% of our average outstanding credit card balances for the year ended December 31, 2014, compared to 1.33% of the average outstanding balances for the year ended on December 31, 2013. The current economic situation could adversely affect consumers in a more delayed fashion compared to commercial businesses in general. Increasing unemployment and diminished asset values may prevent our credit card customers from repaying their credit card balances which could result in an increased amount of our net charge-offs that could have a material adverse effect on our unsecured credit card portfolio.
12
Changes to consumer protection laws may impede our origination or collection efforts with respect to credit card accounts, change account holder use patterns or reduce collections, any of which may result in decreased profitability of our credit card portfolio.
Credit card receivables that do not comply with consumer protection laws may not be valid or enforceable under their terms against the obligors of those credit card receivables. Federal and state consumer protection laws regulate the creation and enforcement of consumer loans, including credit card receivables. For instance, the federal Truth in Lending Act was amended by the “Credit Card Accountability, Responsibility and Disclosure Act of 2009,” or the “Credit CARD Act,” which, among other things:
|
·
|
prevents any increases in interest rates and fees during the first year after a credit card account is opened, and increases at any time on interest rates on existing credit card balances, unless (i) the minimum payment on the related account is 60 or more days delinquent, (ii) the rate increase is due to the expiration of a promotional rate, (iii) the account holder fails to comply with a negotiated workout plan or (iv) the increase is due to an increase in the index rate for a variable rate credit card;
|
|
·
|
requires that any promotional rates for credit cards be effective for at least six months;
|
|
·
|
requires 45 days notice for any change of an interest rate or any other significant changes to a credit card account;
|
|
·
|
empowers federal bank regulators to promulgate rules to limit the amount of any penalty fees or charges for credit card accounts to amounts that are “reasonable and proportional to the related omission or violation;” and
|
|
·
|
requires credit card companies to mail billing statements 21 calendar days before the due date for account holder payments.
|
As a result of the Credit CARD Act and other consumer protection laws and regulations, it may be more difficult for us to originate additional credit card accounts or to collect payments on credit card receivables, and the finance charges and other fees that we can charge on credit card account balances may be reduced. Furthermore, account holders may choose to use credit cards less as a result of these consumer protection laws. Each of these results, independently or collectively, could reduce the effective yield on revolving credit card accounts and could result in decreased profitability of our credit card portfolio.
Our growth and expansion strategy may not be successful, and our market value and profitability may suffer.
We have historically employed, as important parts of our business strategy, growth through acquisition of banks and, to a lesser extent, through branch acquisitions and
de novo
branching. Any future acquisitions, including any FDIC-assisted transactions, in which we might engage will be accompanied by the risks commonly encountered in acquisitions. These risks include, among other risks:
|
·
|
credit risk associated with the acquired bank’s loans and investments;
|
|
·
|
difficulty of integrating operations and personnel; and
|
|
·
|
potential disruption of our ongoing business.
|
We anticipate that in addition to opportunities to acquire other banks in privately negotiated transactions, we may also have opportunities to bid to acquire the assets and liabilities of failed banks in FDIC-assisted transactions, although those opportunities are occurring less frequently. These acquisitions involve risks similar to acquiring existing banks. Because FDIC-assisted acquisitions are structured in a manner that would not allow us the time normally associated with due diligence investigations prior to committing to purchase the target bank or preparing for integration of an acquired bank, we may face additional risks in FDIC-assisted transactions. These risks include, among other things:
|
·
|
loss of customers of the failed bank;
|
|
·
|
strain on management resources related to collection and management of problem loans; and
|
|
·
|
problems related to integration of personnel and operating systems.
|
In addition to pursuing the acquisition of existing viable financial institutions or the acquisition of assets and liabilities of failed banks in FDIC-assisted transactions, as opportunities arise we may also continue to engage in
de novo
branching to further our growth strategy.
De novo
branching and growing through acquisition involve numerous risks, including the following:
13
|
·
|
the inability to obtain all required regulatory approvals;
|
|
·
|
the significant costs and potential operating losses associated with establishing a de novo branch or a new bank;
|
|
·
|
the inability to secure the services of qualified senior management;
|
|
·
|
the local market may not accept the services of a new bank owned and managed by a bank holding company headquartered outside of the market area of the new bank;
|
|
·
|
the risk of encountering an economic downturn in the new market;
|
|
·
|
the inability to obtain attractive locations within a new market at a reasonable cost; and
|
|
·
|
the additional strain on management resources and internal systems and controls.
|
We expect that competition for suitable acquisition candidates, whether such candidates are viable banks or are the subject of an FDIC-assisted transaction, will be significant. We may compete with other banks or financial service companies that are seeking to acquire our acquisition candidates, many of which are larger competitors and have greater financial and other resources. We cannot assure you that we will be able to successfully identify and acquire suitable acquisition targets on acceptable terms and conditions. Further, we cannot assure you that we will be successful in overcoming these risks or any other problems encountered in connection with acquisitions and
de novo
branching. Our inability to overcome these risks could have an adverse effect on our ability to achieve our business and growth strategy and maintain or increase our market value and profitability.
Our recent results do not indicate our future results and may not provide guidance to assess the risk of an investment in our common stock.
We may not be able to sustain our historical rate of growth or be able to expand our business. Various factors, such as economic conditions, regulatory and legislative considerations and competition, may also impede or prohibit our ability to expand our market presence. We may also be unable to identify advantageous acquisition opportunities or, once identified, enter into transactions to make such acquisitions. If we are not able to successfully grow our business, our financial condition and results of operations could be adversely affected.
Our cost of funds may increase as a result of general economic conditions, interest rates and competitive pressures.
Our cost of funds may increase as a result of general economic conditions, fluctuations in interest rates and competitive pressures. We have traditionally obtained funds principally through local deposits as we have a base of lower cost transaction deposits. Our costs of funds and our profitability and liquidity are likely to be adversely affected, if we have to rely upon higher cost borrowings from other institutional lenders or brokers to fund loan demand or liquidity needs. Also, changes in our deposit mix and growth could adversely affect our profitability and the ability to expand our loan portfolio.
We may not be able to raise the additional capital we need to grow and, as a result, our ability to expand our operations could be materially impaired.
Federal and state regulatory authorities require us and our subsidiary banks to maintain adequate levels of capital to support our operations. Many circumstances could require us to seek additional capital, such as:
|
·
|
faster than anticipated growth;
|
|
·
|
reduced earning levels;
|
|
·
|
operating losses;
|
|
·
|
changes in economic conditions;
|
|
·
|
revisions in regulatory requirements; or
|
|
·
|
additional acquisition opportunities.
|
Our ability to raise additional capital will largely depend on our financial performance, and on conditions in the capital markets which are outside our control. If we need additional capital but cannot raise it on terms acceptable to us, our ability to expand our operations or to engage in acquisitions could be materially impaired.
Accounting standards periodically change and the application of our accounting policies and methods may require management to make estimates about matters that are uncertain.
The regulatory bodies that establish accounting standards, including, among others, the Financial Accounting Standards Board and the SEC, periodically revise or issue new financial accounting and reporting standards that govern the preparation of our consolidated financial statements. The effect of such revised or new standards on our financial statements can be difficult to predict and can materially impact how we record and report our financial condition and results of operations.
14
In addition, our management must exercise judgment in appropriately applying many of our accounting policies and methods so they comply with generally accepted accounting principles. In some cases, management may have to select a particular accounting policy or method from two or more alternatives. In some cases, the accounting policy or method chosen might be reasonable under the circumstances and yet might result in our reporting materially different amounts than would have been reported if we had selected a different policy or method. Accounting policies are critical to fairly presenting our financial condition and results of operations and may require management to make difficult, subjective or complex judgments about matters that are uncertain.
The Federal Reserve Board’s source of strength doctrine could require that we divert capital to our subsidiary bank instead of applying available capital towards planned uses, such as engaging in acquisitions or paying dividends to shareholders.
The FRB’s policies and regulations require that a bank holding company, including a financial holding company, serve as a source of financial strength to its subsidiary banks, and further provide that a bank holding company may not conduct operations in an unsafe or unsound manner. It is the FRB’s policy that a bank holding company should stand ready to use available resources to provide adequate capital to its subsidiary banks during periods of financial stress or adversity, such as during periods of significant loan losses, and that such holding company should maintain the financial flexibility and capital-raising capacity to obtain additional resources for assisting its subsidiary banks if such a need were to arise.
A bank holding company’s failure to meet its obligations to serve as a source of strength to its subsidiary banks will generally be considered to be an unsafe and unsound banking practice or a violation of the FRB’s regulations, or both. Accordingly, if the financial condition of our subsidiary banks were to deteriorate, we could be compelled to provide financial support to our subsidiary banks at a time when, absent such FRB policy, we may not deem it advisable to provide such assistance. Under such circumstances, there is a possibility that we may not either have adequate available capital or feel sufficiently confident regarding our financial condition, to enter into acquisitions, pay dividends, or engage in other corporate activities.
We may incur environmental liabilities with respect to properties to which we take title.
A significant portion of our loan portfolio is secured by real property. In the course of our business, we may own or foreclose and take title to real estate and could become subject to environmental liabilities with respect to these properties. We may become responsible to a governmental agency or third parties for property damage, personal injury, investigation and clean-up costs incurred by those parties in connection with environmental contamination, or may be required to investigate or clean-up hazardous or toxic substances, or chemical releases at a property. The costs associated with environmental investigation or remediation activities could be substantial. If we were to become subject to significant environmental liabilities, it could have a material adverse effect on our results of operations and financial condition.
Our management has broad discretion over the use of proceeds from future stock offerings.
Although we generally indicate our intent to use the proceeds from stock offerings for general corporate purposes, including funding internal growth and selected future acquisitions, our Board of Directors retains significant discretion with respect to the use of the proceeds from possible future offerings. If we use the funds to acquire other businesses, there can be no assurance that any business we acquire will be successfully integrated into our operations or otherwise perform as expected.
A breach in the security of our systems could disrupt our business, result in the disclosure of confidential information, damage our reputation and create significant financial and legal exposure for us.
Our businesses are dependent on our ability and the ability of our third party service providers to process, record and monitor a large number of transactions. If the financial, accounting, data processing or other operating systems and facilities fail to operate properly, become disabled, experience security breaches or have other significant shortcomings, our results of operations could be materially adversely affected.
Although we and our third party service providers devote significant resources to maintain and upgrade our systems and processes that are designed to protect the security of computer systems, software, networks and other technology assets and the confidentiality, integrity and availability of information belonging to us and our customers, there is no assurance that our security systems and those of our third party service providers will provide absolute security. Financial services institutions and companies engaged in data processing have reported breaches in the security of their websites or other systems, some of which have involved sophisticated and targeted attacks intended to obtain unauthorized access to confidential information, destroy data, disable or degrade service, or sabotage systems, often through the introduction of computer viruses or malware, cyber-attacks and other means. Despite our efforts and those of our third party service providers to ensure the integrity
15
Risks Related to Owning Our Stock
The holders of our subordinated debentures have rights that are senior to those of our shareholders. If we defer payments of interest on our outstanding subordinated debentures or if certain defaults relating to those debentures occur, we will be prohibited from declaring or paying dividends or distributions on, and from making liquidation payments with respect to our common stock.
We have subordinated debentures issued in connection with trust preferred securities. Payments of the principal and interest on the trust preferred securities are unconditionally guaranteed by us. The subordinated debentures are senior to our shares of common stock. As a result, we must make payments on the subordinated debentures (and the related trust preferred securities) before any dividends can be paid on our common stock and, in the event of our bankruptcy, dissolution or liquidation, the holders of the debentures must be satisfied before any distributions can be made to the holders of our common stock. We have the right to defer distributions on the subordinated debentures (and the related trust preferred securities) for up to five years, during which time no dividends may be paid to holders of our capital stock. If we elect to defer or if we default with respect to our obligations to make payments on these subordinated debentures, this would likely have a material adverse effect on the market value of our common stock. Moreover, without notice to or consent from the holders of our common stock, we may issue additional series of subordinated debt securities in the future with terms similar to those of our existing subordinated debt securities or enter into other financing agreements that limit our ability to purchase or to pay dividends or distributions on our capital stock.
We may be unable to, or choose not to, pay dividends on our common stock.
We cannot assure you of our ability to continue to pay dividends. Our ability to pay dividends depends on the following factors, among others:
|
·
|
We may not have sufficient earnings since our primary source of income, the payment of dividends to us by our subsidiary banks, is subject to federal and state laws that limit the ability of those banks to pay dividends;
|
|
·
|
FRB policy requires bank holding companies to pay cash dividends on common stock only out of net income available over the past year and only if prospective earnings retention is consistent with the organization’s expected future needs and financial condition; and
|
|
·
|
Our Board of Directors may determine that, even though funds are available for dividend payments, retaining the funds for internal uses, such as expansion of our operations, is a better strategy.
|
If we fail to pay dividends, capital appreciation, if any, of our common stock may be the sole opportunity for gains on an investment in our common stock. In addition, in the event our subsidiary banks become unable to pay dividends to us, we may not be able to service our debt or pay our other obligations or pay dividends on our common stock. Accordingly, our inability to receive dividends from our subsidiary banks could also have a material adverse effect on our business, financial condition and results of operations and the value of your investment in our common stock.
There may be future sales of additional common stock or preferred stock or other dilution of our equity, which may adversely affect the value of our common stock.
We are not restricted from issuing additional common stock or preferred stock, including any securities that are convertible into or exchangeable for, or that represent the right to receive, common stock or preferred stock or any substantially similar securities. The value of our common stock could decline as a result of sales by us of a large number of shares of common stock or preferred stock or similar securities in the market or the perception that such sales could occur.
Anti-takeover provisions could negatively impact our shareholders.
Provisions of our articles of incorporation and by-laws and federal banking laws, including regulatory approval requirements, could make it more difficult for a third party to acquire us, even if doing so would be perceived to be beneficial to our shareholders. The combination of these provisions effectively inhibits a non-negotiated merger or other business combination, which, in turn, could adversely affect the market price of our common stock. These provisions could also discourage proxy contests and make it more difficult for holders of our common stock to elect directors other than the candidates nominated by our Board of Directors.
16
|
ITEM
1B.
|
UNRESOLVED STAFF COMMENTS
|
There are currently no unresolved Commission staff comments.
|
ITEM
2.
|
PROPERTIES
|
The principal offices of the Company and the lead bank consist of an eleven-story office building and adjacent office space located in the central business district of the city of Pine Bluff, Arkansas. We have additional corporate offices located in Little Rock, Arkansas.
The Company and its subsidiaries own or lease additional offices in the states of Arkansas, Missouri and Kansas. The Company and Simmons Bank conduct financial operations from over 100 branches, or “financial centers”, located in communities throughout Arkansas, Missouri and Kansas.
|
ITEM
3.
|
LEGAL PROCEEDINGS
|
The Company and/or its subsidiaries have various unrelated legal proceedings, most of which involve loan foreclosure activity pending, which, in the aggregate, are not expected to have a material adverse effect on the financial position of the Company and its subsidiaries.
|
ITEM
5.
|
MARKET FOR REGISTRANT’S COMMON EQUITY, RELATED STOCKHOLDER MATTERS AND ISSUER PURCHASES OF EQUITY SECURITIES
|
Our common stock is listed on the NASDAQ Global Select Market under the symbol “SFNC.” Set forth below are the high and low sales prices for our common stock as reported by the NASDAQ Global Select Market for each quarter of the fiscal years ended December 31, 2014 and 2013. Also set forth below are dividends declared per share in each of these periods:
|
Price Per
Common Share
|
Quarterly
Dividends
|
|||||||||||
|
High
|
Low
|
Share
|
||||||||||
|
2014
|
||||||||||||
|
1st quarter
|
$
|
38.80
|
$
|
32.01
|
$
|
0.22
|
||||||
|
2nd quarter
|
43.22
|
34.62
|
0.22
|
|||||||||
|
3rd quarter
|
41.82
|
37.35
|
0.22
|
|||||||||
|
4th quarter
|
42.43
|
37.60
|
0.22
|
|||||||||
|
2013
|
||||||||||||
|
1st quarter
|
$
|
26.25
|
$
|
24.11
|
$
|
0.21
|
||||||
|
2nd quarter
|
26.55
|
23.16
|
0.21
|
|||||||||
|
3rd quarter
|
31.50
|
24.06
|
0.21
|
|||||||||
|
4th quarter
|
38.54
|
29.64
|
0.21
|
|||||||||
On February 18, 2015, the closing price for our common stock as reported on the NASDAQ was $39.44. As of February 18, 2015, there were 1,268 shareholders of record of our common stock.
The timing and amount of future dividends are at the discretion of our Board of Directors and will depend upon our consolidated earnings, financial condition, liquidity and capital requirements, the amount of cash dividends paid to us by our subsidiaries, applicable government regulations and policies and other factors considered relevant by our Board of Directors. Our Board of Directors anticipates that we will continue to pay quarterly dividends in amounts determined based on the factors discussed above. However, there can be no assurance that we will continue to pay dividends on our common stock at the current levels or at all.
Our principal source of funds for dividend payments to our stockholders is distributions, including dividends, from our subsidiary bank, which is subject to restrictions tied to such institution’s earnings. Under applicable banking laws, the declaration of dividends by Simmons Bank in any year, in excess of its net profits, as defined, for that year, combined with its retained net profits of the preceding two years, must be approved by the Office of the Comptroller of the Currency. At December 31, 2014, approximately $10.0 million was available for the payment of dividends by Simmons Bank without regulatory approval. For further discussion of restrictions on the payment of dividends, see "Quantitative and Qualitative Disclosures About Market Risk – Liquidity and Market Risk Management," and Note 20, Stockholders’ Equity, of Notes to Consolidated Financial Statements.
17
Stock Repurchase
The Company made no purchases of its common stock during the three months ended or during the year ended December 31, 2014. During 2013, we repurchased 419,564 shares of stock with a weighted average repurchase price of $25.89 per share. Under the current stock repurchase plan, we can repurchase an additional 154,136 shares.
Performance Graph
The performance graph below compares the cumulative total shareholder return on the Company’s Common Stock with the cumulative total return on the equity securities of companies included in the NASDAQ Bank Stock Index, the NASDAQ Composite Index and the S&P 500 Stock Index. The graph assumes an investment of $100 on December 31, 2009 and reinvestment of dividends on the date of payment without commissions. The performance graph represents past performance and should not be considered to be an indication of future performance.
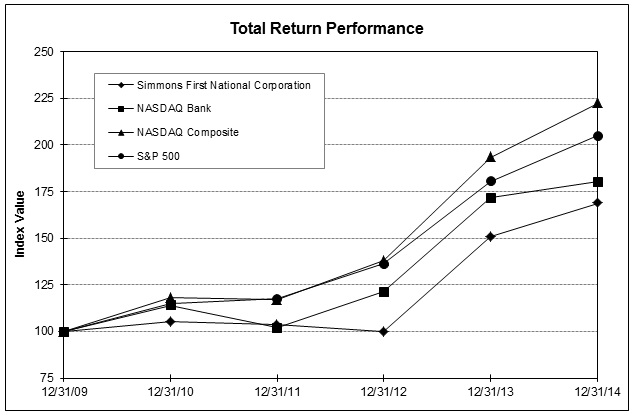
|
Period Ending
|
||||||||||||||||||||||||
|
Index
|
12/31/09
|
12/31/10
|
12/31/11
|
12/31/12
|
12/31/13
|
12/31/14
|
||||||||||||||||||
|
Simmons First National Corporation
|
100.00
|
105.38
|
103.65
|
99.90
|
150.84
|
168.72
|
||||||||||||||||||
|
NASDAQ Bank
|
100.00
|
114.16
|
102.17
|
121.26
|
171.86
|
180.31
|
||||||||||||||||||
|
NASDAQ Composite
|
100.00
|
118.15
|
117.22
|
138.02
|
193.47
|
222.16
|
||||||||||||||||||
|
S&P 500
|
100.00
|
115.06
|
117.49
|
136.30
|
180.44
|
205.14
|
||||||||||||||||||
18
|
ITEM
6.
|
SELECTED CONSOLIDATED FINANCIAL DATA
|
The following table sets forth selected consolidated financial data concerning the Company and is qualified in its entirety by the detailed information and consolidated financial statements, including notes thereto, included elsewhere in this report. The income statement, balance sheet and per common share data as of and for the years ended December 31, 2014, 2013, 2012, 2011, and 2010, were derived from consolidated financial statements of the Company, which were audited by BKD, LLP. Results from past periods are not necessarily indicative of results that may be expected for any future period.
Management believes that certain non-GAAP measures, including diluted core earnings per share, tangible book value, the ratio of tangible common equity to tangible assets, tangible stockholders’ equity and return on average tangible equity, may be useful to analysts and investors in evaluating the performance of our Company. We have included certain of these non-GAAP measures, including cautionary remarks regarding the usefulness of these analytical tools, in this table. The selected consolidated financial data set forth below should be read in conjunction with the financial statements of the Company and related notes thereto and "Management's Discussion and Analysis of Financial Condition and Results of Operations" included elsewhere in this report.
|
Years Ended December 31
|
||||||||||||||||||||
|
(In thousands, except per share & other data)
|
2014
|
2013
|
2012
|
2011
|
2010
|
|||||||||||||||
|
Income statement data:
|
||||||||||||||||||||
|
Net interest income
|
$
|
171,064
|
$
|
130,850
|
$
|
113,517
|
$
|
108,660
|
$
|
101,949
|
||||||||||
|
Provision for loan losses
|
7,245
|
4,118
|
4,140
|
11,676
|
14,129
|
|||||||||||||||
|
Net interest income after provision for loan losses
|
163,819
|
126,732
|
109,377
|
96,984
|
87,820
|
|||||||||||||||
|
Non-interest income
|
62,192
|
40,616
|
48,371
|
53,465
|
77,874
|
|||||||||||||||
|
Non-interest expense
|
175,721
|
134,812
|
117,733
|
114,650
|
111,263
|
|||||||||||||||
|
Income before taxes
|
50,290
|
32,536
|
40,015
|
35,799
|
54,431
|
|||||||||||||||
|
Provision for income taxes
|
14,602
|
9,305
|
12,331
|
10,425
|
17,314
|
|||||||||||||||
|
Net income
|
$
|
35,688
|
$
|
23,231
|
$
|
27,684
|
$
|
25,374
|
$
|
37,117
|
||||||||||
|
Per share data:
|
||||||||||||||||||||
|
Basic earnings
|
2.11
|
1.42
|
1.64
|
1.47
|
2.16
|
|||||||||||||||
|
Diluted earnings
|
2.11
|
1.42
|
1.64
|
1.47
|
2.15
|
|||||||||||||||
|
Diluted core earnings (non-GAAP)
(1)
|
2.29
|
1.69
|
1.59
|
1.45
|
1.51
|
|||||||||||||||
|
Book value
|
27.38
|
24.89
|
24.55
|
23.70
|
23.01
|
|||||||||||||||
|
Tangible book value (non-GAAP)
(2)
|
20.15
|
19.13
|
20.66
|
20.09
|
19.36
|
|||||||||||||||
|
Dividends
|
0.88
|
0.84
|
0.80
|
0.76
|
0.76
|
|||||||||||||||
|
Basic average common shares outstanding
|
16,878,766
|
16,339,335
|
16,908,904
|
17,309,488
|
17,204,200
|
|||||||||||||||
|
Diluted average common shares outstanding
|
16,922,026
|
16,352,167
|
16,911,363
|
17,317,850
|
17,264,900
|
|||||||||||||||
|
Balance sheet data at period end:
|
||||||||||||||||||||
|
Assets
|
4,643,354
|
4,383,100
|
3,527,489
|
3,320,129
|
3,316,432
|
|||||||||||||||
|
Investment securities
|
1,082,870
|
957,965
|
687,483
|
697,656
|
613,662
|
|||||||||||||||
|
Total loans
|
2,736,634
|
2,404,935
|
1,922,119
|
1,737,844
|
1,915,064
|
|||||||||||||||
|
Allowance for loan losses (excluding covered loans)
|
29,028
|
27,442
|
27,882
|
30,108
|
26,416
|
|||||||||||||||
|
Goodwill & other intangible assets
|
130,621
|
93,501
|
64,365
|
62,184
|
63,068
|
|||||||||||||||
|
Non-interest bearing deposits
|
889,260
|
718,438
|
576,655
|
532,259
|
428,750
|
|||||||||||||||
|
Deposits
|
3,860,718
|
3,697,567
|
2,874,163
|
2,650,397
|
2,608,769
|
|||||||||||||||
|
Long-term debt
|
114,682
|
117,090
|
89,441
|
89,898
|
133,394
|
|||||||||||||||
|
Subordinated debt & trust preferred
|
20,620
|
20,620
|
20,620
|
30,930
|
30,930
|
|||||||||||||||
|
Stockholders’ equity
|
494,319
|
403,832
|
406,062
|
407,911
|
397,371
|
|||||||||||||||
|
Tangible stockholders’ equity (non GAAP)
(2)
|
363,698
|
310,331
|
341,697
|
345,727
|
334,303
|
|||||||||||||||
|
Capital ratios at period end:
|
||||||||||||||||||||
|
Stockholders’ equity to total assets
|
10.65
|
%
|
9.21
|
%
|
11.51
|
%
|
12.29
|
%
|
11.98
|
%
|
||||||||||
|
Tangible common equity to tangible assets (non-GAAP)
(3)
|
8.06
|
%
|
7.24
|
%
|
9.87
|
%
|
10.61
|
%
|
10.28
|
%
|
||||||||||
|
Tier 1 leverage ratio
|
8.77
|
%
|
9.22
|
%
|
10.81
|
%
|
11.86
|
%
|
11.33
|
%
|
||||||||||
|
Tier 1 risk-based ratio
|
13.43
|
%
|
13.02
|
%
|
19.08
|
%
|
21.58
|
%
|
20.05
|
%
|
||||||||||
|
Total risk-based capital ratio
|
14.50
|
%
|
14.10
|
%
|
20.34
|
%
|
22.83
|
%
|
21.30
|
%
|
||||||||||
|
Dividend payout
|
41.71
|
%
|
59.15
|
%
|
48.78
|
%
|
51.70
|
%
|
35.35
|
%
|
||||||||||
19
|
Years Ended December 31
|
||||||||||||||||||||
|
2014
|
2013
|
2012
|
2011
|
2010
|
||||||||||||||||
|
Annualized performance ratios:
|
||||||||||||||||||||
|
Return on average assets
|
0.80
|
%
|
0.64
|
%
|
0.83
|
%
|
0.77
|
%
|
1.19
|
%
|
||||||||||
|
Return on average equity
|
8.11
|
%
|
5.33
|
%
|
6.77
|
%
|
6.25
|
%
|
9.69
|
%
|
||||||||||
|
Return on average tangible equity (non-GAAP)
(2) (4)
|
10.99
|
%
|
6.36
|
%
|
8.05
|
%
|
7.54
|
%
|
11.71
|
%
|
||||||||||
|
Net interest margin
(5)
|
4.47
|
%
|
4.21
|
%
|
3.93
|
%
|
3.85
|
%
|
3.78
|
%
|
||||||||||
|
Efficiency ratio
(6)
|
69.88
|
%
|
71.28
|
%
|
70.17
|
%
|
67.86
|
%
|
65.28
|
%
|
||||||||||
|
Balance sheet ratios:
(7)
|
||||||||||||||||||||
|
Nonperforming assets as a percentage of period-end assets
|
1.25
|
%
|
1.69
|
%
|
1.29
|
%
|
1.18
|
%
|
1.12
|
%
|
||||||||||
|
Nonperforming loans as a percentage of period-end loans
|
0.63
|
%
|
0.53
|
%
|
0.74
|
%
|
1.02
|
%
|
0.83
|
%
|
||||||||||
|
Nonperforming assets as a percentage of period-end loans & OREO
|
2.76
|
%
|
4.10
|
%
|
2.74
|
%
|
2.44
|
%
|
2.18
|
%
|
||||||||||
|
Allowance/to nonperforming loans
|
223.31
|
%
|
297.89
|
%
|
231.62
|
%
|
186.14
|
%
|
190.17
|
%
|
||||||||||
|
Allowance for loan losses as a percentage of period-end loans
|
1.41
|
%
|
1.57
|
%
|
1.71
|
%
|
1.91
|
%
|
1.57
|
%
|
||||||||||
|
Net charge-offs (recoveries) as a percentage of average loans
|
0.30
|
%
|
0.27
|
%
|
0.40
|
%
|
0.49
|
%
|
0.71
|
%
|
||||||||||
|
Other data
|
||||||||||||||||||||
|
Number of financial centers
|
109
|
131
|
92
|
84
|
85
|
|||||||||||||||
|
Number of full time equivalent employees
|
1,338
|
1,343
|
1,068
|
1,083
|
1,075
|
|||||||||||||||
|
(1)
|
Diluted core earnings (net income excluding nonrecurring items) is a non-GAAP measure. The following nonrecurring items were excluded in the calculation of diluted core earnings per share (non-GAAP). In 2014, the Company reported a $0.27 decrease in EPS from merger related costs primarily from its Delta Trust acquisition, a $0.03 EPS decrease from change-in-control payments related to Delta Trust and a $0.02 EPS decrease from charter consolidation costs. Also in 2014, the Company recorded a $0.04 EPS increase from the sale of its merchant services business and a $0.10 EPS increase from the gains on sale of premises held for sale, net of the closing costs of the former branches. In 2013, the Company recorded a $0.25 decrease in EPS from merger related costs from its Metropolitan National Bank acquisition and a $0.02 decrease in EPS from the closing costs of 7 underperforming branches. In 2012, the Company recorded a $0.05 increase in EPS from the FDIC assisted transactions of Truman Bank and Excel Bank. In 2011, the Company recorded a $0.04 increase in EPS from the sale of MasterCard stock. Also in 2011, the Company recorded a $0.01 decrease in EPS from the closing cost of a branch and a $0.01 EPS decrease from merger related costs from an FDIC-assisted acquisition. In 2010, the Company recorded a net $0.65 increase in EPS from FDIC-assisted acquisitions (bargain purchase gains, merger related costs, gains from disposition of investment securities and costs from disposition of FHLB borrowings). Also in 2010, the Company recorded a $0.01 decrease in EPS from costs to close nine branches.
|
|
(2)
|
Because of our significant level of intangible assets, total goodwill and core deposit premiums, management believes a useful calculation for investors in their analysis of our Company is tangible book value per share (non-GAAP). This non-GAAP calculation eliminates the effect of goodwill and acquisition related intangible assets and is calculated by subtracting goodwill and intangible assets from total stockholders’ equity, and dividing the resulting number by the common stock outstanding at period end. The following table reflects the reconciliation of this non-GAAP measure to the GAAP presentation of book value for the periods presented above:
|
|
Years Ended December 31
|
||||||||||||||||||||
|
($ in thousands, except per share data)
|
2014
|
2013
|
2012
|
2011
|
2010
|
|||||||||||||||
|
Stockholders’ equity
|
$
|
494,319
|
$
|
403,832
|
$
|
406,062
|
$
|
407,911
|
$
|
397,371
|
||||||||||
|
Less: Intangible assets
|
||||||||||||||||||||
|
Goodwill
|
108,095
|
78,529
|
60,605
|
60,605
|
60,605
|
|||||||||||||||
|
Other intangibles
|
22,526
|
14,972
|
3,760
|
1,579
|
2,463
|
|||||||||||||||
|
Tangible stockholders’ equity (non-GAAP)
|
$
|
363,698
|
$
|
310,331
|
$
|
341,697
|
$
|
345,727
|
$
|
334,303
|
||||||||||
|
Book value per share
|
$
|
27.38
|
$
|
24.89
|
$
|
24.55
|
$
|
23.70
|
$
|
23.01
|
||||||||||
|
Tangible book value per share (non-GAAP)
|
$
|
20.15
|
$
|
19.13
|
$
|
20.66
|
$
|
20.09
|
$
|
19.36
|
||||||||||
|
Shares outstanding
|
18,052,488
|
16,226,256
|
16,542,778
|
17,212,317
|
17,271,594
|
|||||||||||||||
|
(3)
|
Tangible common equity to tangible assets ratio is tangible stockholders’ equity (non-GAAP) divided by total assets less goodwill and other intangible assets as and for the periods ended presented above.
|
|
(4)
|
Return on average tangible equity is a non-GAAP measure that removes the effect of goodwill and intangible assets, as well as the amortization of intangibles, from the return on average equity. This non-GAAP measure is calculated as net income, adjusted for the tax-effected effect of intangibles, divided by average tangible equity.
|
|
(5)
|
Fully taxable equivalent (assuming an income tax rate of 39.225%).
|
|
(6)
|
The efficiency ratio is total non-interest expense less foreclosure expense and amortization of intangibles, divided by the sum of net interest income on a fully taxable equivalent basis plus total non-interest income less security gains, net of tax. For the year ended December 31, 2014, this calculation excludes merger related costs of $7.5 million from non-interest expense. For the year ended December 31, 2013, this calculation excludes merger related costs of $6.4 million from non-interest expense. For the year ended December 31, 2012, this calculation excludes the gain on FDIC-assisted transactions of $3.4 million from total non-interest income and excludes merger related costs of $1.9 million from non-interest expense. For the year ended December 31, 2011, this calculation excludes the $1.1 million gain on sale of MasterCard stock. For the year ended December 31, 2010, this calculation excludes the gain on FDIC-assisted transactions of $21.3 million from total non-interest income and excludes merger related costs of $2.6 million from non-interest expense.
|
|
(7)
|
Excludes all loans acquired and excludes foreclosed assets acquired, covered by FDIC loss share agreements, except for their inclusion in total assets.
|
20
|
ITEM
7.
|
MANAGEMENT'S DISCUSSION AND ANALYSIS OF FINANCIALCONDITION AND RESULTS OF OPERATIONS
|
Critical Accounting Policies
Overview
We follow accounting and reporting policies that conform, in all material respects, to generally accepted accounting principles and to general practices within the financial services industry. The preparation of financial statements in conformity with generally accepted accounting principles requires management to make estimates and assumptions that affect the amounts reported in the financial statements and accompanying notes. While we base estimates on historical experience, current information and other factors deemed to be relevant, actual results could differ from those estimates.
We consider accounting estimates to be critical to reported financial results if (i) the accounting estimate requires management to make assumptions about matters that are highly uncertain and (ii) different estimates that management reasonably could have used for the accounting estimate in the current period, or changes in the accounting estimate that are reasonably likely to occur from period to period, could have a material impact on our financial statements.
The accounting policies that we view as critical to us are those relating to estimates and judgments regarding (a) the determination of the adequacy of the allowance for loan losses, (b) acquisition accounting and valuation of covered loans and related indemnification asset, (c) the valuation of goodwill and the useful lives applied to intangible assets, (d) the valuation of employee benefit plans and (e) income taxes.
Allowance for Loan Losses on Loans Not Covered by Loss Share
The allowance for loan losses is management’s estimate of probable losses in the loan portfolio. Loan losses are charged against the allowance when management believes the uncollectability of a loan balance is confirmed. Subsequent recoveries, if any, are credited to the allowance.
Prior to the fourth quarter of 2012, we measured the appropriateness of the allowance for loan losses in its entirety using (a)ASC 450-20 which includes quantitative (historical loss rates) and qualitative factors (management adjustment factors) such as (1) lending policies and procedures, (2) economic outlook and business conditions, (3) level and trend in delinquencies, (4) concentrations of credit and (5) external factors and competition; which are combined with the historical loss rates to create the baseline factors that are allocated to the various loan categories; (b) specific allocations on impaired loans in accordance with ASC 310-10; and (c) the unallocated amount.
The unallocated amount was evaluated on the loan portfolio in its entirety and was based on additional factors, such as (1) trends in volume, maturity and composition, (2) national, state and local economic trends and conditions, (3) the experience, ability and depth of lending management and staff and (4) other factors and trends that will affect specific loans and categories of loans, such as a heightened risk in agriculture, credit card and commercial real estate loan portfolios.
As of December 31, 2012, we refined our allowance calculation. As part of the refinement process, we evaluated the criteria previously applied to the entire loan portfolio, and used to calculate the unallocated portion of the allowance, and applied those criteria to each specific loan category. For example, the impact of national, state and local economic trends and conditions was evaluated by and allocated to specific loan categories.
After this refinement, the allowance is calculated monthly based on management’s assessment of several factors such as (1) historical loss experience based on volumes and types, (2) volume and trends in delinquencies and nonaccruals, (3) lending policies and procedures including those for loan losses, collections and recoveries, (4) national, state and local economic trends and conditions, (5) concentrations of credit within the loan portfolio, (6) the experience, ability and depth of lending management and staff and (7) other factors and trends that will affect specific loans and categories of loans. We establish general allocations for each major loan category. This category also includes allocations to loans which are collectively evaluated for loss such as credit cards, one-to-four family owner occupied residential real estate loans and other consumer loans. General reserves have been established, based upon the aforementioned factors and allocated to the individual loan categories. Allowances are accrued for probable losses on specific loans evaluated for impairment for which the basis of each loan, including accrued interest, exceeds the discounted amount of expected future collections of interest and principal or, alternatively, the fair value of loan collateral. Any immaterial residual reserves are distributed among the loan portfolio categories based on their percent composition of the entire portfolio.
21
Acquisition Accounting, Acquired Loans
We account for our acquisitions under ASC Topic 805,
Business Combinations
, which requires the use of the purchase method of accounting. All identifiable assets acquired, including loans, are recorded at fair value. No allowance for loan losses related to the acquired loans is recorded on the acquisition date as the fair value of the loans acquired incorporates assumptions regarding credit risk. Loans acquired are recorded at fair value in accordance with the fair value methodology prescribed in ASC Topic 820, exclusive of the shared-loss agreements with the FDIC. The fair value estimates associated with the loans include estimates related to expected prepayments and the amount and timing of undiscounted expected principal, interest and other cash flows.
We evaluate loans acquired in accordance with the provisions of ASC Topic 310-20,
Nonrefundable Fees and Other Costs
. The fair value discount on these loans is accreted into interest income over the weighted average life of the loans using a constant yield method. These loans are not considered to be impaired loans. We evaluate purchased impaired loans in accordance with the provisions of ASC Topic 310-30, Loans and Debt Securities Acquired with Deteriorated Credit Quality. Purchased loans are considered impaired if there is evidence of credit deterioration since origination and if it is probable that not all contractually required payments will be collected.
We evaluate all of the loans purchased in conjunction with its FDIC-assisted transactions in accordance with the provisions of ASC Topic 310-30. All loans acquired in the FDIC transactions, both covered and not covered, were deemed to be impaired loans. All loans acquired, whether or not covered by FDIC loss share agreements, are considered impaired if there is evidence of credit deterioration since origination and if it is probable that not all contractually required payments will be collected.
For impaired loans accounted for under ASC Topic 310-30, we continue to estimate cash flows expected to be collected on pools of loans sharing common risk characteristics, which are treated in the aggregate when applying various valuation techniques. We evaluate at each balance sheet date whether the present value of our pools of loans determined using the effective interest rates has decreased significantly and if so, recognize a provision for loan loss in our consolidated statement of income. For any significant increases in cash flows expected to be collected, we adjust the amount of accretable yield recognized on a prospective basis over the pool’s remaining life.
Covered Loans and Related Indemnification Asset
Because the FDIC will reimburse us for losses incurred on certain acquired loans, an indemnification asset is recorded at fair value at the acquisition date. The indemnification asset is recognized at the same time as the indemnified loans, and measured on the same basis, subject to collectability or contractual limitations. The shared-loss agreements on the acquisition date reflect the reimbursements expected to be received from the FDIC, using an appropriate discount rate, which reflects counterparty credit risk and other uncertainties.
The shared-loss agreements continue to be measured on the same basis as the related indemnified loans, as prescribed by ASC Topic 805. Deterioration in the credit quality of the loans (immediately recorded as an adjustment to the allowance for loan losses) would immediately increase the basis of the shared-loss agreements, with the offset recorded through the consolidated statement of income. Increases in the credit quality or cash flows of loans (reflected as an adjustment to yield and accreted into income over the remaining life of the loans) decrease the basis of the shared-loss agreements, with such decrease being accreted into income over 1) the same period or 2) the life of the shared-loss agreements, whichever is shorter. Loss assumptions used in the basis of the indemnified loans are consistent with the loss assumptions used to measure the indemnification asset. Fair value accounting incorporates into the fair value of the indemnification asset an element of the time value of money, which is accreted back into income over the life of the shared-loss agreements.
Upon the determination of an incurred loss the indemnification asset will be reduced by the amount owed by the FDIC. A corresponding, claim receivable is recorded until cash is received from the FDIC. For further discussion of our acquisition and loan accounting, see Note 5, Loans Acquired, in the accompanying Notes to Consolidated Financial Statements included elsewhere in this report.
Goodwill and Intangible Assets
Goodwill represents the excess of the cost of an acquisition over the fair value of the net assets acquired. Other intangible assets represent purchased assets that also lack physical substance but can be separately distinguished from goodwill because of contractual or other legal rights or because the asset is capable of being sold or exchanged either on its own or in combination with a related contract, asset or liability. We perform an annual goodwill impairment test, and more than annually if circumstances warrant, in accordance with ASC Topic 350,
Intangibles – Goodwill and Other
, as amended by ASU 2011-08 –
Testing Goodwill for Impairment
. ASC Topic 350 requires that goodwill and intangible assets that have indefinite lives be reviewed for impairment at least annually, or more frequently if certain conditions occur. Impairment losses on recorded goodwill, if any, will be recorded as operating expenses.
Income Taxes
We are subject to the federal income tax laws of the United States, and the tax laws of the states and other jurisdictions where we conduct business. Due to the complexity of these laws, taxpayers and the taxing authorities may subject these laws to different interpretations. Management must make conclusions and estimates about the application of these innately intricate laws, related regulations, and case law. When preparing the Company’s income tax returns, management attempts to make reasonable interpretations of the tax laws. Taxing authorities have the ability to challenge management’s analysis of the tax law or any reinterpretation management makes in its ongoing assessment of facts and the developing case law. Management assesses the reasonableness of its effective tax rate quarterly based on its current estimate of net income and the applicable taxes expected for the full year. On a quarterly basis, management also reviews circumstances and developments in tax law affecting the reasonableness of deferred tax assets and liabilities and reserves for contingent tax liabilities.
22
2014 Overview
Our net income for the year ended December 31, 2014 was $35.7 million and diluted earnings per share were $2.11, compared to net income of $23.2 million and $1.42 diluted earnings per share in 2013. Net income for both 2014 and 2013 included several significant nonrecurring items that impacted net income, mostly related to our acquisitions. Excluding all nonrecurring items, core earnings for the year ended December 31, 2014 was $38.7 million, or $2.29 diluted core earnings per share, compared to $27.6 million, or $1.69 diluted core earnings per share in 2013. Diluted core earnings per share increased by $0.60, or 35.5%. See Reconciliation of Non-GAAP Measures and Table 21 – Reconciliation of Core Earnings (non-GAAP) for additional discussion of non-GAAP measures.
On November 25, 2013, we closed the transaction to acquire Metropolitan National Bank (“Metropolitan” or “MNB”), headquartered in Little Rock, Arkansas. During the first quarter of 2014 we completed the system integration and branch consolidation associated with the Metropolitan acquisition. As a result of the MNB combination and in concert with the systems conversion, we closed 27 branches with footprints that overlap other branches. We also entered into a definitive agreement and plan of merger with Delta Trust & Banking Corporation (“Delta Trust”), also headquartered in Little Rock, including its wholly-owned bank subsidiary Delta Trust & Bank. We finalized our acquisition of Delta Trust on August 31, 2014, and completed the systems conversion on October 24, 2014.
The Metropolitan and Delta Trust franchises, headquartered in Little Rock, fit nicely into our footprint by expanding our presence in central and northwest Arkansas, the two leading growth market in our home state. Both banks have a rich history of providing exemplary customer service to the communities in which they have served. With the operational system conversions of Metropolitan and Delta Trust with our flagship institution, Simmons First National Bank (“Simmons Bank”), we are able to provide customers with innovative products, exceptional customer service and convenience throughout the combined service area.
During the second quarter of 2014, we entered into a definitive agreement and plan of merger with Community First Bancshares, Inc. (“Community First”), headquartered in Union City, Tennessee, including its wholly-owned bank subsidiary First State Bank (“First State”). During the second quarter we also entered into a definitive agreement and plan of merger with Liberty Bancshares, Inc. (“Liberty”), headquartered in Springfield, Missouri, including its wholly-owned bank subsidiary Liberty Bank. We completed both of these transactions on February 27, 2015. These two acquisitions will add approximately $1.9 billion in loans, $2.4 billion in deposits and $3.0 billion in total assets to our balance sheet in the first quarter of 2015, increasing our combined company to approximately $7.6 billion in total assets.
We are very pleased with the core earnings results in 2014. We reported record core earnings and record core earnings per share for 2014. As a result of acquisitions and efficiency initiatives in recent reporting periods, we have and will continue to recognize one-time revenue and expense items which may skew our short-term core business results but provide long-term performance benefits. Our focus continues to be improvement in core operating income.
We are also pleased with the positive trends in our balance sheet, as reflected in our organic loan growth of over 12% during the past year as well as our growth from acquisitions, which enabled us to produce a net interest margin of 4.47%.
Stockholders’ equity as of December 31, 2014 was $494.3 million, book value per share was $27.38 and tangible book value per share was $20.15. Our ratio of stockholders’ equity to total assets was 10.7% and the ratio of tangible stockholders’ equity to tangible assets was 8.1% at December 31, 2014. The Company’s Tier I leverage ratio of 8.8%, as well as our other regulatory capital ratios, remain significantly above the “well capitalized”. See Table 18 – Risk-Based Capital for regulatory capital ratios.
We believe our stock, even after the recent market increase in our stock value, continues to be an excellent investment. We increased our quarterly dividend from $0.22 to $0.23 per share, beginning with the first quarter of 2015. On an annual basis, the $0.92 per share dividend results in a return in excess of 2.1%, based on our recent stock price.
Total loans, including loans acquired, were $2.7 billion at December 31, 2014, an increase of $332 million, or 13.8%, from the same period in 2013. Acquired loans increased by $21 million, net of discounts, while legacy loans (all loans excluding acquired loans) grew $311 million, or 17.9%. Excluding the $98 million in loan balances that migrated from acquired loans, legacy loans grew $213 million, or 12.2%. We are encouraged by the continued growth in our legacy loan portfolio throughout 2014. We have had very good legacy loan growth again this year, particularly from the new lenders we have attracted in our targeted growth markets. Their production has exceeded our expectations for 2013 and 2014.
23
Despite the continued challenges in the economy, we continue to have good asset quality. The allowance for loan losses as a percent of total loans was 1.41% at December 31, 2014. Non-performing loans equaled 0.63% of total loans. Non-performing assets were 1.25% of total assets. The allowance for loan losses was 223% of non-performing loans. The Company’s net charge-offs for 2014 were 0.30% of total loans. Excluding credit cards, net charge-offs for 2014 were 0.22% of total loans.
Total assets were $4.6 billion at December 31, 2014 compared to $4.4 billion at December 31, 2013, an increase of $260 million primarily due to the Delta Trust acquisition.
Subsidiary Bank Consolidation
We have completed the consolidation of our subsidiary banks into Simmons First National Bank (“Simmons Bank”), headquartered in Pine Bluff, Arkansas. We announced in March our plans to consolidate our seven subsidiary banks into a single banking organization, Simmons Bank. We completed the first phase by consolidating three subsidiary banks into Simmons Bank in May 2014 and completed the final phase by consolidating the remaining three subsidiary banks into Simmons Bank in August 2014. The elimination of the separate bank charters will increase the Company's efficiency and assist us in more effectively meeting the increased regulatory burden currently facing banking institutions. There are many operational functions that we previously performed separately for each of our seven banks; with the consolidation, these tasks will only need to be performed once.
We believe our customers will experience a positive impact from this change. All of our banking and financial services will continue to be available in the same locations as before the consolidation. Our local management and Community Boards of Directors are committed to maintaining our nearby and neighborly service and this change will allow them more opportunity to meet the needs of our customers and the communities we serve.
Net Interest Income
Net interest income, our principal source of earnings, is the difference between the interest income generated by earning assets and the total interest cost of the deposits and borrowings obtained to fund those assets. Factors that determine the level of net interest income include the volume of earning assets and interest bearing liabilities, yields earned and rates paid, the level of non-performing loans and the amount of non-interest bearing liabilities supporting earning assets. Net interest income is analyzed in the discussion and tables below on a fully taxable equivalent basis. The adjustment to convert certain income to a fully taxable equivalent basis consists of dividing tax-exempt income by one minus the combined federal and state income tax rate of 39.225%.
The FRB sets various benchmark rates, including the Federal Funds rate, and thereby influences the general market rates of interest, including the deposit and loan rates offered by financial institutions. The FRB target for the Federal Funds rate, which is the cost to banks of immediately available overnight funds, has remained unchanged at 0.00% - 0.25% since December 16, 2008. Our loan portfolio is significantly affected by changes in the prime interest rate. The prime interest rate, which is the rate offered on loans to borrowers with strong credit, has remained unchanged at 3.25% since December 16, 2008.
Our practice is to limit exposure to interest rate movements by maintaining a significant portion of earning assets and interest bearing liabilities in short-term repricing. Historically, approximately 70% of our loan portfolio and approximately 80% of our time deposits have repriced in one year or less. These historical percentages are consistent with our current interest rate sensitivity.
For the year ended December 31, 2014, net interest income on a fully taxable equivalent basis was $177.9 million, an increase of $42.1 million, or 31.0%, from the same period in 2013. The increase in net interest income was the result of a $43.8 million increase in interest income and a $1.7 million increase in interest expense.
The increase in interest income primarily resulted from a $35.9 million increase in interest income on loans, consisting of legacy loans and acquired loans. The increase in loan volume during 2014 generated $36.1 million of additional interest income, while a 1 basis point decline in yield resulted in a $0.2 million decrease in interest income. The interest income increase from loan volume was primarily due to our Metropolitan and Delta Trust acquisitions; however, a significant portion of the increase in loan interest income can be attributed to our legacy loan growth of $311 million, or 17.9%, during 2014.
24
Included in interest income is the additional yield accretion recognized as a result of updated estimates of the cash flows of our acquired loans, as discussed in Note 5, Loans Acquired, in the accompanying Notes to Consolidated Financial Statements included elsewhere in this report. Each quarter, we estimate the cash flows expected to be collected from the acquired loans, and adjustments may or may not be required. The cash flows estimate has increased based on payment histories and reduced loss expectations of the loans. This resulted in increased interest income that is spread on a level-yield basis over the remaining expected lives of the loans. For loans covered by FDIC loss sharing agreements, the increases in expected cash flows also reduce the amount of expected reimbursements under the loss sharing agreements, which are recorded as indemnification assets. The estimated adjustments to the indemnification assets are amortized on a level-yield basis over the remainder of the loss sharing agreements or the remaining expected life of the loan pools, whichever is shorter, and are recorded in non-interest expense.
For the year ended December 31, 2014, the adjustments increased interest income by an additional $7.5 million and decreased non-interest income by an additional $2.4 million compared to 2013. The net increase to 2014 pre-tax income was $5.1 million from 2013. Because these adjustments will be recognized over the estimated remaining lives of the loan pools and the remainder of the loss sharing agreements, respectively, they will impact future periods as well. The current estimate of the remaining accretable yield adjustment that will positively impact interest income is $17.0 million and the remaining adjustment to the indemnification assets that will reduce non-interest income is $10.6 million. Of the remaining adjustments, we expect to recognize $9.1 million of interest income and a $7.9 million reduction of non-interest income for a net addition to pre-tax income of approximately $1.2 million in 2015. The accretable yield adjustments recorded in future periods will change as we continue to evaluate expected cash flows from the acquired loan pools.
Our net interest margin was 4.47% for the year ended December 31, 2014, up 26 basis points from 2013. Our margin has been strengthened from the impact of the accretable yield adjustments discussed above. Also, the acquisition of loans, along with our ability to stabilize the size of our legacy loan portfolio, has allowed us to increase our level of higher yielding assets over 2013. Conversely, while keeping us prepared to benefit from rising interest rates, our high levels of liquidity continue to compress our margin.
Our net interest margin was 4.21% and 3.93% for the years ended December 31, 2013 and 2012, respectively.
25
Tables 1 and 2 reflect an analysis of net interest income on a fully taxable equivalent basis for the years ended December 31, 2014, 2013 and 2012, respectively, as well as changes in fully taxable equivalent net interest margin for the years 2014 versus 2013 and 2013 versus 2012.
|
Table 1:
|
Analysis of Net Interest Income
|
(FTE =Fully Taxable Equivalent)
|
Years Ended December 31
|
||||||||||||
|
(In thousands)
|
2014
|
2013
|
2012
|
|||||||||
|
Interest income
|
$
|
185,035
|
$
|
143,113
|
$
|
129,134
|
||||||
|
FTE adjustment
|
6,840
|
4,951
|
4,705
|
|||||||||
|
Interest income - FTE
|
191,875
|
148,064
|
133,839
|
|||||||||
|
Interest expense
|
13,971
|
12,263
|
15,617
|
|||||||||
|
Net interest income - FTE
|
$
|
177,904
|
$
|
135,801
|
$
|
118,222
|
||||||
|
Yield on earning assets - FTE
|
4.83
|
%
|
4.59
|
%
|
4.45
|
%
|
||||||
|
Cost of interest bearing liabilities
|
0.44
|
%
|
0.48
|
%
|
0.66
|
%
|
||||||
|
Net interest spread - FTE
|
4.39
|
%
|
4.11
|
%
|
3.79
|
%
|
||||||
|
Net interest margin - FTE
|
4.47
|
%
|
4.21
|
%
|
3.93
|
%
|
||||||
|
Table 2:
|
Changes in Fully Taxable Equivalent Net Interest Margin
|
|
(In thousands)
|
2014 vs. 2013
|
2013 vs. 2012
|
||||||
|
Increase due to change in earning assets
|
$
|
39,750
|
$
|
24,120
|
||||
|
Increase (decrease) due to change in earning asset yields
|
4,061
|
(9,895
|
)
|
|||||
|
Increase due to change in interest rates paid on interest bearing liabilities
|
1,163
|
3,289
|
||||||
|
(Decrease) increase due to change in interest bearing liabilities
|
(2,871
|
)
|
65
|
|||||
|
Increase in net interest income
|
$
|
42,103
|
$
|
17,579
|
||||
26
Table 3 shows, for each major category of earning assets and interest bearing liabilities, the average (computed on a daily basis) amount outstanding, the interest earned or expensed on such amount and the average rate earned or expensed for each of the years in the three-year period ended December 31, 2014. The table also shows the average rate earned on all earning assets, the average rate expensed on all interest bearing liabilities, the net interest spread and the net interest margin for the same periods. The analysis is presented on a fully taxable equivalent basis. Nonaccrual loans were included in average loans for the purpose of calculating the rate earned on total loans.
|
Table 3:
|
Average Balance Sheets and Net Interest Income Analysis
|
|
Years Ended December 31
|
||||||||||||||||||||||||||||||||||||
|
2014
|
2013
|
2012
|
||||||||||||||||||||||||||||||||||
|
(In thousands)
|
Average
Balance
|
Income/
Expense
|
Yield/
Rate
(%)
|
Average
Balance
|
Income/
Expense
|
Yield/
Rate
(%)
|
Average
Balance
|
Income/
Expense
|
Yield/
Rate
(%)
|
|||||||||||||||||||||||||||
|
ASSETS
|
||||||||||||||||||||||||||||||||||||
|
Earning assets:
|
||||||||||||||||||||||||||||||||||||
|
Interest bearing balances due from banks
|
$
|
388,045
|
$
|
857
|
0.22
|
$
|
470,651
|
$
|
1,127
|
0.24
|
$
|
524,224
|
$
|
1,220
|
0.23
|
|||||||||||||||||||||
|
Federal funds sold
|
3,663
|
27
|
0.74
|
4,186
|
19
|
0.45
|
3,107
|
7
|
0.23
|
|||||||||||||||||||||||||||
|
Investment securities - taxable
|
735,637
|
8,624
|
1.17
|
464,319
|
5,553
|
1.20
|
474,375
|
5,321
|
1.12
|
|||||||||||||||||||||||||||
|
Investment securities - non-taxable
|
328,310
|
17,541
|
5.34
|
315,445
|
12,647
|
4.01
|
208,056
|
12,060
|
5.8
|
|||||||||||||||||||||||||||
|
Mortgage loans held for sale
|
16,038
|
695
|
4.33
|
13,108
|
467
|
3.56
|
17,959
|
637
|
3.55
|
|||||||||||||||||||||||||||
|
Assets held in trading accounts
|
6,938
|
17
|
0.25
|
8,607
|
29
|
0.34
|
7,539
|
48
|
0.64
|
|||||||||||||||||||||||||||
|
Loans
|
2,497,272
|
164,114
|
6.57
|
1,947,778
|
128,222
|
6.58
|
1,773,581
|
114,546
|
6.45
|
|||||||||||||||||||||||||||
|
Total interest earning assets
|
3,975,903
|
191,875
|
4.83
|
3,224,094
|
148,064
|
4.59
|
3,008,841
|
133,839
|
4.45
|
|||||||||||||||||||||||||||
|
Non-earning assets
|
502,198
|
382,408
|
327,322
|
|||||||||||||||||||||||||||||||||
|
Total assets
|
$
|
4,478,101
|
$
|
3,606,502
|
$
|
3,336,163
|
||||||||||||||||||||||||||||||
|
LIABILITIES AND STOCKHOLDERS’ EQUITY
|
||||||||||||||||||||||||||||||||||||
|
Liabilities:
|
||||||||||||||||||||||||||||||||||||
|
Interest bearing liabilities:
|
||||||||||||||||||||||||||||||||||||
|
Interest bearing transaction and savings deposits
|
$
|
1,886,217
|
$
|
3,057
|
0.16
|
$
|
1,490,457
|
$
|
2,461
|
0.17
|
$
|
1,308,171
|
$
|
2,682
|
0.21
|
|||||||||||||||||||||
|
Time deposits
|
1,040,979
|
6,022
|
0.58
|
859,913
|
5,938
|
0.69
|
861,004
|
7,943
|
0.92
|
|||||||||||||||||||||||||||
|
Total interest bearing deposits
|
2,927,196
|
9,079
|
0.31
|
2,350,370
|
8,399
|
0.36
|
2,169,175
|
10,625
|
0.49
|
|||||||||||||||||||||||||||
|
Federal funds purchased and securities sold under agreements to repurchase
|
110,644
|
269
|
0.24
|
93,574
|
219
|
0.23
|
91,444
|
310
|
0.34
|
|||||||||||||||||||||||||||
|
Other borrowings
|
118,256
|
3,986
|
3.37
|
87,089
|
3,001
|
3.45
|
89,861
|
3,354
|
3.73
|
|||||||||||||||||||||||||||
|
Subordinated debentures
|
20,620
|
637
|
3.09
|
20,620
|
644
|
3.12
|
28,268
|
1,328
|
4.7
|
|||||||||||||||||||||||||||
|
Total interest bearing liabilities
|
3,176,716
|
13,971
|
0.44
|
2,551,653
|
12,263
|
0.48
|
2,378,748
|
15,617
|
0.66
|
|||||||||||||||||||||||||||
|
Non-interest bearing liabilities:
|
||||||||||||||||||||||||||||||||||||
|
Non-interest bearing deposits
|
820,490
|
588,374
|
518,243
|
|||||||||||||||||||||||||||||||||
|
Other liabilities
|
40,727
|
30,557
|
29,985
|
|||||||||||||||||||||||||||||||||
|
Total liabilities
|
4,037,933
|
3,170,584
|
2,926,976
|
|||||||||||||||||||||||||||||||||
|
Stockholders’ equity
|
440,168
|
435,918
|
409,187
|
|||||||||||||||||||||||||||||||||
|
Total liabilities and stockholders’ equity
|
$
|
4,478,101
|
$
|
3,606,502
|
$
|
3,336,163
|
||||||||||||||||||||||||||||||
|
Net interest spread
|
4.39
|
4.11
|
3.79
|
|||||||||||||||||||||||||||||||||
|
Net interest margin
|
$
|
177,904
|
4.47
|
$
|
135,801
|
4.21
|
$
|
118,222
|
3.93
|
|||||||||||||||||||||||||||
27
|
Table 4:
|
Volume/Rate Analysis
|
|
Years Ended December 31
|
||||||||||||||||||||||||
|
2014 over 2013
|
2013 over 2012
|
|||||||||||||||||||||||
|
(In thousands, on a fully
taxable equivalent basis)
|
Volume
|
Yield/
Rate
|
Total
|
Volume
|
Yield/
Rate
|
Total
|
||||||||||||||||||
|
Increase (decrease) in
|
||||||||||||||||||||||||
|
Interest income
|
||||||||||||||||||||||||
|
Interest bearing balances due from banks
|
$
|
(188
|
)
|
$
|
(82
|
)
|
$
|
(270
|
)
|
$
|
(128
|
)
|
$
|
35
|
$
|
(93
|
)
|
|||||||
|
Federal funds sold
|
(2
|
)
|
10
|
8
|
2
|
10
|
12
|
|||||||||||||||||
|
Investment securities - taxable
|
3,183
|
(112
|
)
|
3,071
|
(115
|
)
|
347
|
232
|
||||||||||||||||
|
Investment securities - non-taxable
|
535
|
4,359
|
4,894
|
5,024
|
(4,437
|
)
|
587
|
|||||||||||||||||
|
Mortgage loans held for sale
|
116
|
112
|
228
|
(173
|
)
|
3
|
(170
|
)
|
||||||||||||||||
|
Assets held in trading accounts
|
(5
|
)
|
(7
|
)
|
(12
|
)
|
6
|
(25
|
)
|
(19
|
)
|
|||||||||||||
|
Loans (including loans acquired)
|
36,111
|
(219
|
)
|
35,892
|
19,504
|
(5,828
|
)
|
13,676
|
||||||||||||||||
|
Total
|
39,750
|
4,061
|
43,811
|
24,120
|
(9,895
|
)
|
14,225
|
|||||||||||||||||
|
Interest expense
|
||||||||||||||||||||||||
|
Interest bearing transaction and savings accounts
|
642
|
(46
|
)
|
596
|
344
|
(565
|
)
|
(221
|
)
|
|||||||||||||||
|
Time deposits
|
1,135
|
(1,051
|
)
|
84
|
(10
|
)
|
(1,995
|
)
|
(2,005
|
)
|
||||||||||||||
|
Federal funds purchased and securities sold under agreements to repurchase
|
42
|
8
|
50
|
7
|
(98
|
)
|
(91
|
)
|
||||||||||||||||
|
Other borrowings
|
1,052
|
(67
|
)
|
985
|
(101
|
)
|
(252
|
)
|
(353
|
)
|
||||||||||||||
|
Subordinated debentures
|
-
|
(7
|
)
|
(7
|
)
|
(305
|
)
|
(379
|
)
|
(684
|
)
|
|||||||||||||
|
Total
|
2,871
|
(1,163
|
)
|
1,708
|
(65
|
)
|
(3,289
|
)
|
(3,354
|
)
|
||||||||||||||
|
Increase (decrease) in net interest income
|
$
|
36,879
|
$
|
5,224
|
$
|
42,103
|
$
|
24,185
|
$
|
(6,606
|
)
|
$
|
17,579
|
|||||||||||
Provision for Loan Losses
The provision for loan losses represents management's determination of the amount necessary to be charged against the current period's earnings in order to maintain the allowance for loan losses at a level considered appropriate in relation to the estimated risk inherent in the loan portfolio. The level of provision to the allowance is based on management's judgment, with consideration given to the composition, maturity and other qualitative characteristics of the portfolio, historical loan loss experience, assessment of current economic conditions, past due and non-performing loans and net loan loss experience. It is management's practice to review the allowance on a monthly basis, and, after considering the factors previously noted, to determine the level of provision made to the allowance.
The provision for loan losses for 2014, 2013 and 2012, was $7.2 million, $4.1 million and $4.1 million, respectively. The increase in the provision level was primarily due to our growing legacy portfolio, as well as to the migration of acquired loans previously protected by a credit mark, with no allowance, into our legacy portfolio, thus requiring coverage by the allowance. See Allowance for Loan Losses section for additional information.
28
Non-Interest Income
Total non-interest income was $62.2 million in 2014, compared to $40.6 million in 2013 and $48.4 million in 2012. Non-interest income for 2014 increased $21.6 million, or 53.1%, from 2013.
As previously discussed in the Net Interest Income section, there was a $2.4 million decrease in non-interest income from 2013 to 2014 due to reductions of the indemnification assets resulting from increased cash flows expected to be collected from the FDIC covered loan portfolios.
During 2014 we recognized pre-tax net gains of $7.8 million from the sale of several branch locations. These branches were closed in March as part of our initial branch right sizing strategy related to the November 2013 acquisition of Metropolitan. We are very pleased with the market demand for our former branch facilities, allowing us to negotiate quick sales on the majority of these non-earning assets during 2014.
We also recorded a $1.0 million gain from the sale of our merchant services business during the second quarter of 2014. The sale of this service business became necessary as the chip technology in debit and credit cards comes to fruition. The new contract we have with our vendor serves to eliminate most of our risk while providing our customers with service and support from experts in their field. While our revenue from these services will decline, so will our support expenses. We believe that by selling our merchant services and entering into a third-party contract we have mitigated our risk with a neutral financial impact.
Included in 2013 non-interest income was a $193,000 nonrecurring loss on sale of securities liquidated from the Truman and Excel acquisition portfolios, and included in 2012 non-interest income was $3.4 million of nonrecurring bargain purchase gains on the Truman and Excel.
Non-interest income is principally derived from recurring fee income, which includes service charges, trust fees and debit and credit card fees. Non-interest income also includes income on the sale of mortgage loans, investment banking income, premiums on sale of student loans, income from the increase in cash surrender values of bank owned life insurance, gains (losses) from sales of securities and gains (losses) related to FDIC-assisted transactions and covered assets.
Table 5 shows non-interest income for the years ended December 31, 2014, 2013 and 2012, respectively, as well as changes in 2014 from 2013 and in 2013 from 2012.
|
Table 5:
|
Non-Interest Income
|
|
|
|
|||||||||||||||||||||||||||
|
Years Ended December 31
|
2014
Change from
|
2013
Change from
|
||||||||||||||||||||||||||
|
(In thousands)
|
2014
|
2013
|
2012
|
2013
|
2012
|
|||||||||||||||||||||||
|
Trust income
|
$
|
7,111
|
$
|
5,842
|
$
|
5,473
|
$
|
1,269
|
21.72
|
%
|
$
|
369
|
6.74
|
%
|
||||||||||||||
|
Service charges on deposit accounts
|
25,650
|
18,815
|
16,808
|
6,835
|
36.33
|
2,007
|
11.94
|
|||||||||||||||||||||
|
Other service charges and fees
|
3,574
|
2,997
|
2,961
|
577
|
19.25
|
36
|
1.22
|
|||||||||||||||||||||
|
Mortgage lending income
|
5,342
|
4,592
|
5,997
|
750
|
16.33
|
(1,405
|
)
|
-23.43
|
||||||||||||||||||||
|
Investment banking income
|
1,070
|
1,811
|
2,038
|
(741
|
)
|
-40.92
|
(227
|
)
|
-11.14
|
|||||||||||||||||||
|
Debit and credit card fees
|
22,866
|
17,833
|
17,045
|
5,033
|
28.22
|
788
|
4.62
|
|||||||||||||||||||||
|
Bank owned life insurance income
|
1,843
|
1,319
|
1,463
|
524
|
39.73
|
(144
|
)
|
-9.84
|
||||||||||||||||||||
|
Gain on FDIC-assisted transactions
|
-
|
-
|
3,411
|
-
|
-
|
(3,411
|
)
|
-100.00
|
||||||||||||||||||||
|
Net (loss) gain on assets covered by FDIC loss share agreements
|
(20,316
|
)
|
(16,188
|
)
|
(9,793
|
)
|
(4,128
|
)
|
25.50
|
(6,395
|
)
|
65.30
|
||||||||||||||||
|
Net gain on sale of premises held for sale
|
7,780
|
-
|
-
|
7,780
|
100.00
|
-
|
-
|
|||||||||||||||||||||
|
Other income
|
7,264
|
3,746
|
2,966
|
3,518
|
93.91
|
780
|
26.30
|
|||||||||||||||||||||
|
Gain (loss) on sale of securities
|
8
|
(151
|
)
|
2
|
159
|
-105.30
|
(153
|
)
|
7650.00
|
|||||||||||||||||||
|
Total non-interest income
|
$
|
62,192
|
$
|
40,616
|
$
|
48,371
|
$
|
21,576
|
53.12
|
%
|
$
|
(7,755
|
)
|
-16.03
|
%
|
|||||||||||||
Recurring fee income (service charges, trust fee and debit and credit card fees) for 2014 was $59.2 million, an increase of $13.7 million, or 30.15%, when compared with the 2013 amounts. Service charges on deposits accounts increased $6.8 million, or 36.3%. While some of the service charge income increase was due to paper statement fees implemented during 2013, the majority of these increases were due to the additions of accounts from the Metropolitan and Delta Trust acquisitions. Debit and credit card fees increased $5.0 million, or 28.2%, due primarily to higher transaction volume. Trust income increased by $1.3 million, or 21.7%, due primarily to growth in our personal trust and investor management client base.
29
Recurring fee income for 2013 was $45.5 million, an increase of $3.2 million, or 7.6%, when compared with the 2012 amounts. Service charges on deposits accounts increased $2.0 million due primarily to fees on accounts added through acquisitions and paper statement fees implemented during 2013. Debit and credit card fees increased $0.8 million due primarily to a higher volume of debit and credit card transactions.
Mortgage lending income increased by $750,000, or 16.3%, in 2014 compared to 2013, as the mortgage market improved significantly during the last half of 2014, following significant decreases in the previous quarters of 2014, when compared to 2013. Mortgage lending income decreased by $1.4 million, or 23.4%, in 2013 compared to 2012, primarily due to a market driven increase in mortgage rates leading to substantially lower residential refinancing volume.
Investment banking income decreased by $741,000, or 40.9%, in 2014 compared to 2013. Investment banking income decreased by $227,000, or 11.1%, in 2013 compared to 2012. The decreases were primarily due to an industry-wide decline in dealer-bank activities.
Net loss on assets covered by FDIC loss share agreements increased by $4.1 million in 2014 compared to 2013. As previously described, due to the increase in cash flows expected to be collected from the FDIC-covered loan portfolios, an additional $2.2 million of amortization, a reduction of non-interest income, was recorded during 2014 as compared to 2013, related to reductions of expected reimbursements under the loss sharing agreements with the FDIC, which are recorded as indemnification assets. Income from the normal accretion of the FDIC indemnification assets, net of amortization of the FDIC true-up liability, decreased by $1.2 million from the previous year. Net loss on assets covered by FDIC loss share agreements increased by $6.4 million in 2013 compared to 2012.
Other non-interest income for 2014 increased by $11.3 million from 2013. Included in the increase were the $7.8 million gains from the sale of closed branch locations and the $1.0 million gain from the sale of our merchant services business. The remainder of the increase was primarily due to increased gains on sale of foreclosed assets and recoveries on Metropolitan loans that were charged off prior to acquisition. Other non-interest income for 2013 increased by $780,000 from 2012, primarily due to increased gains on sale of foreclosed assets.
We recorded $8,000 in net realized gains on sale of securities during 2014, with $151,000 in net realized losses on sale of securities during 2013. As part of our acquisition strategy related to Truman and Excel, we liquidated much of the acquired investment portfolios, resulting in net realized losses of $193,000 in 2013. We recorded $2,000 in net realized gains on sale of securities in 2012.
Non-Interest Expense
Non-interest expense consists of salaries and employee benefits, occupancy, equipment, foreclosure losses and other expenses necessary for the operation of the Company. Management remains committed to controlling the level of non-interest expense, through the continued use of expense control measures that have been installed. We utilize an extensive profit planning and reporting system involving all subsidiaries. Based on a needs assessment of the business plan for the upcoming year, monthly and annual profit plans are developed, including manpower and capital expenditure budgets. These profit plans are subject to extensive initial reviews and monitored by management on a monthly basis. Variances from the plan are reviewed monthly and, when required, management takes corrective action intended to ensure financial goals are met. We also regularly monitor staffing levels at Simmons Bank to ensure productivity and overhead are in line with existing workload requirements.
Non-interest expense for 2014 was $175.7 million, an increase of $40.9 million or 30.4%, from 2013. This increase includes approximately $7.5 million of merger related costs during 2014 for our acquisition of Delta Trust and costs that carried over into 2014 from our 2013 acquisition of Metropolitan. Also included in non-interest expense are merger related costs of $6.4 million in 2013, primarily attributed to the acquisition of Metropolitan.
During May and August of 2014 we completed our charter consolidation by consolidating our six remaining subsidiary banks into Simmons Bank and incurred $0.6 million of charter consolidation costs, mostly related to systems conversions. We also recorded $4.7 million in branch rightsizing costs during 2014, primarily associated with the closure and maintenance of eleven legacy Simmons branches. These branches, along with sixteen former Metropolitan branches, were closed in March 2014 as part of our initial branch right sizing strategy related to the November 2013 acquisition of Metropolitan. Included in 2014 non-interest expense was $0.9 million of change-in-control payments related to the Delta Trust acquisition.
Normalizing for the nonrecurring merger related costs, change-in-control payments, branch right sizing expenses and charter consolidation costs, non-interest expense increased $34.2 million, or 26.8% in 2014 from 2013, primarily due to the incremental operating expenses of the acquired Metropolitan and Delta Trust locations. See the Reconciliation of Non-GAAP Measures section for details of the nonrecurring items.
30
Non-interest expense for 2013 was $134.8 million, an increase of $17.1 million or 14.51%, from 2012. This increase includes approximately $6.4 million of merger related costs for our acquisition of Metropolitan and $0.6 million of one-time expenses related to the closure of six branch locations during 2013. Also included in non-interest expense are merger related costs of $1.9 million in 2012. Normalizing for these merger related and branch closure costs, non-interest expense increased by 10.3% in 2013 from 2012. This increase is primarily the result of normal operating expenses for the Metropolitan, Excel and Truman acquisitions. See the Reconciliation of Non-GAAP Measures section for details of the nonrecurring items
Salaries and employee benefits increased to $89.2 million in 2014 from $74.1 million in 2013, an increase of $15.1 million, or 20.4%. Occupancy expense increased to $12.8 million in 2014 from $10.0 million in 2013, an increase of $2.8 million, or 27.9%. Furniture and fixture expense increased to $9.3 million in 2014 from $7.6 million in 2013, an increase of $1.7 million, or 22.3%. These increases, along with the increases in several other operating expense categories, were a result of the Metropolitan and Delta Trust acquisitions.
Deposit insurance expense during 2014 increased to $3.4 million from $2.5 million in 2013, an increase of $0.9 million, or 35.1%. Deposit insurance expense during 2013 increased to $2.5 million from $2.1 million in 2012, an increase of $0.4 million, or 19.0%. These increases are directly attributable to our growth in total assets.
Amortization of intangibles recorded for the years ended December 31, 2014, 2013 and 2012, was $2.0 million, $0.6 million and $0.3 million, respectively. The current year increase is the result of core deposit intangible and other intangible assets recorded as the result of the Delta Trust acquisition and a full year of amortization expense related to the core deposit intangible from the Metropolitan acquisition. The Company’s estimated amortization expense for each of the following five years is: 2015 – $2.741 million; 2016 – $2.615 million; 2017– $2.615 million; 2018 – $2.512 million; and 2019 – $2.202 million;. The estimated amortization expense decreases as intangible assets fully amortize in future years.
Table 6 below shows non-interest expense for the years ended December 31, 2014, 2013 and 2012, respectively, as well as changes in 2014 from 2013 and in 2013 from 2012.
|
Table 6:
|
Non-Interest Expense
|
|
2014
|
2013
|
|||||||||||||||||||||||||||
|
Years Ended December 31
|
Change from
|
Change from
|
||||||||||||||||||||||||||
|
(In thousands)
|
2014
|
2013
|
2012
|
2013
|
2012
|
|||||||||||||||||||||||
|
Salaries and employee benefits
|
$
|
89,210
|
$
|
74,078
|
$
|
66,999
|
$
|
15,132
|
20.43
|
%
|
$
|
7,079
|
10.57
|
%
|
||||||||||||||
|
Occupancy expense, net
|
12,833
|
10,034
|
8,603
|
2,799
|
27.90
|
1,431
|
16.63
|
|||||||||||||||||||||
|
Furniture and equipment expense
|
9,325
|
7,623
|
6,882
|
1,702
|
22.33
|
741
|
10.77
|
|||||||||||||||||||||
|
Other real estate and foreclosure expense
|
4,507
|
1,337
|
992
|
3,170
|
237.10
|
345
|
34.78
|
|||||||||||||||||||||
|
Deposit insurance
|
3,354
|
2,482
|
2,086
|
872
|
35.13
|
396
|
18.98
|
|||||||||||||||||||||
|
Merger related costs
|
7,470
|
6,376
|
1,896
|
1,094
|
17.16
|
4,480
|
236.29
|
|||||||||||||||||||||
|
Other operating expenses
|
||||||||||||||||||||||||||||
|
Professional services
|
7,516
|
4,473
|
4,851
|
3,043
|
68.03
|
(378
|
)
|
-7.79
|
||||||||||||||||||||
|
Postage
|
3,383
|
2,531
|
2,488
|
852
|
33.66
|
43
|
1.73
|
|||||||||||||||||||||
|
Telephone
|
2,957
|
2,323
|
2,391
|
634
|
27.29
|
(68
|
)
|
-2.84
|
||||||||||||||||||||
|
Credit card expenses
|
8,699
|
6,869
|
6,906
|
1,830
|
26.64
|
(37
|
)
|
-0.54
|
||||||||||||||||||||
|
Operating supplies
|
1,964
|
1,511
|
1,419
|
453
|
29.98
|
92
|
6.48
|
|||||||||||||||||||||
|
Amortization of intangibles
|
1,979
|
600
|
347
|
1,379
|
229.83
|
253
|
72.91
|
|||||||||||||||||||||
|
Branch right sizing expense
|
4,721
|
641
|
-
|
4,080
|
636.51
|
641
|
100.00
|
|||||||||||||||||||||
|
Other expense
|
17,803
|
13,934
|
11,873
|
3,869
|
27.77
|
2,061
|
17.36
|
|||||||||||||||||||||
|
Total non-interest expense
|
$
|
175,721
|
$
|
134,812
|
$
|
117,733
|
$
|
40,909
|
30.35
|
%
|
$
|
17,079
|
14.51
|
%
|
||||||||||||||
Income Taxes
The provision for income taxes for 2014 was $14.6 million, compared to $9.3 million in 2013 and $12.3 million in 2012. The effective income tax rates for the years ended 2014, 2013 and 2012 were 29.0%, 28.6% and 30.8%, respectively.
31
Loan Portfolio
Our legacy loan portfolio, excluding loans acquired, averaged $1.866 billion during 2014 and $1.661 billion during 2013. As of December 31, 2014, total loans, excluding loans acquired, were $2.054 billion, compared to $1.743 billion on December 31, 2013, an increase of $311.1 million, or 17.8%. This organic loan growth in 2014 represents a significant improvement over recent years. This marks the third consecutive year that we have seen annual growth in our legacy loan portfolio. The most significant components of the loan portfolio were loans to businesses (commercial loans, commercial real estate loans and agricultural loans) and individuals (consumer loans, credit card loans and single-family residential real estate loans).
When we make a credit decision on an acquired loan not covered by FDIC loss share as a result of the loan maturing or renewing, the outstanding balance of that loan migrates from loans acquired to legacy loans. Our legacy loan growth from December 31, 2013 to December 31, 2014 included $98.3 million in balances that migrated from acquired loans during the period. These migrated loan balances are included in the legacy loan balances as of December 31, 2014. Excluding the migrated balances from the growth calculation, our legacy loans have grown at a 12.2% rate during 2014.
We seek to manage our credit risk by diversifying the loan portfolio, determining that borrowers have adequate sources of cash flow for loan repayment without liquidation of collateral, obtaining and monitoring collateral, providing an appropriate allowance for loan losses and regularly reviewing loans through the internal loan review process. The loan portfolio is diversified by borrower, purpose and industry and, in the case of credit card loans, which are unsecured, by geographic region. We seek to use diversification within the loan portfolio to reduce credit risk, thereby minimizing the adverse impact on the portfolio, if weaknesses develop in either the economy or a particular segment of borrowers. Collateral requirements are based on credit assessments of borrowers and may be used to recover the debt in case of default. We use the allowance for loan losses as a method to value the loan portfolio at its estimated collectable amount. Loans are regularly reviewed to facilitate the identification and monitoring of deteriorating credits.
Consumer loans consist of credit card loans, student loans and other consumer loans. Consumer loans were $288.8 million at December 31, 2014, or 14.1% of total loans, compared to $309.7 million, or 17.8% of total loans at December 31, 2013. The decrease in consumer loans was in student loans, a valuable business line eliminated from the private sector by Government legislation after the 2009 – 2010 school year. Since that time we continued to service our remaining student loans internally until the loans paid off, while searching for a suitable buyer. During the second quarter of 2014 we sold substantially our entire student loan portfolio at par, and are now completely out of the student loan business.
The credit card portfolio balance at December 31, 2014, increased by $445,000, or 0.2%, when compared to the same period in 2013. Our credit card portfolio has remained a stable source of lending for several years.
Real estate loans consist of construction loans, single family residential loans and commercial loans. Real estate loans were $1.352 billion at December 31, 2014, or 65.8% of total loans, compared to $1.165 billion, or 66.9% of total loans at December 31, 2013, an increase of $187.3 million, or 16.1%. Our construction and development (“C&D”) loans increased by $35.5 million, or 24.2%, single family residential loans increased by $63.3 million, or 16.1%, and commercial real estate (“CRE”) loans increased by $88.5 million, or 14.1%. Considering the continuing challenges in the economy, we believe it is important to note that we have no significant concentrations in our real estate loan portfolio mix. Our C&D loans represent only 8.9% of our loan portfolio and CRE loans (excluding C&D) represent 34.8% of our loan portfolio, both of which compare very favorably to our peers.
Commercial loans consist of non-real estate loans related to businesses and agricultural loans. Commercial loans were $407.5 million at December 31, 2014, or 19.8% of total loans, compared to the $263.2 million, or 15.1% of total loans at December 31, 2013, an increase of $144.3 million, or 54.8%.
32
|
Table 7:
|
Loan Portfolio
|
|
Years Ended December 31
|
||||||||||||||||||||
|
(In thousands)
|
2014
|
2013
|
2012
|
2011
|
2010
|
|||||||||||||||
|
Consumer
|
||||||||||||||||||||
|
Credit cards
|
$
|
185,380
|
$
|
184,935
|
$
|
185,536
|
$
|
189,970
|
$
|
190,329
|
||||||||||
|
Student loans
|
-
|
25,906
|
34,145
|
47,419
|
61,305
|
|||||||||||||||
|
Other consumer
|
103,402
|
98,851
|
105,319
|
109,211
|
118,581
|
|||||||||||||||
|
Total consumer
|
288,782
|
309,692
|
325,000
|
346,600
|
370,215
|
|||||||||||||||
|
Real Estate
|
||||||||||||||||||||
|
Construction
|
181,968
|
146,458
|
138,132
|
109,825
|
153,772
|
|||||||||||||||
|
Single family residential
|
455,563
|
392,285
|
356,907
|
355,094
|
364,442
|
|||||||||||||||
|
Other commercial
|
714,797
|
626,333
|
568,166
|
536,372
|
548,360
|
|||||||||||||||
|
Total real estate
|
1,352,328
|
1,165,076
|
1,063,205
|
1,001,291
|
1,066,574
|
|||||||||||||||
|
Commercial
|
||||||||||||||||||||
|
Commercial
|
291,820
|
164,329
|
141,336
|
141,422
|
150,501
|
|||||||||||||||
|
Agricultural
|
115,658
|
98,886
|
93,805
|
85,728
|
86,171
|
|||||||||||||||
|
Total commercial
|
407,478
|
263,215
|
235,141
|
227,150
|
236,672
|
|||||||||||||||
|
Other
|
5,133
|
4,655
|
5,167
|
4,728
|
10,003
|
|||||||||||||||
|
Total loans, excluding loans acquired, before allowance for loan losses
|
$
|
2,053,721
|
$
|
1,742,638
|
$
|
1,628,513
|
$
|
1,579,769
|
$
|
1,683,464
|
||||||||||
Table 8 reflects the remaining maturities and interest rate sensitivity of loans, excluding all loans acquired, at December 31, 2014.
|
Table 8:
|
Maturity and Interest Rate Sensitivity of Loans
|
|
Over 1
|
||||||||||||||||
|
year
|
||||||||||||||||
|
1 year
|
through
|
Over
|
||||||||||||||
|
(In thousands)
|
or less
|
5 years
|
5 years
|
Total
|
||||||||||||
|
Consumer
|
$
|
240,244
|
$
|
45,108
|
$
|
3,430
|
$
|
288,782
|
||||||||
|
Real estate
|
668,098
|
646,067
|
38,163
|
1,352,328
|
||||||||||||
|
Commercial
|
268,735
|
137,260
|
1,483
|
407,478
|
||||||||||||
|
Other
|
864
|
942
|
3,327
|
5,133
|
||||||||||||
|
Total
|
$
|
1,177,941
|
$
|
829,377
|
$
|
46,403
|
$
|
2,053,721
|
||||||||
|
Predetermined rate
|
$
|
673,295
|
$
|
826,407
|
$
|
46,403
|
$
|
1,546,105
|
||||||||
|
Floating rate
|
504,646
|
2,970
|
-
|
507,616
|
||||||||||||
|
Total
|
$
|
1,177,941
|
$
|
829,377
|
$
|
46,403
|
$
|
2,053,721
|
||||||||
Loans Acquired
On August 31, 2014, we completed the acquisition of Delta Trust, and issued 1,629,515 shares of the Company’s common stock valued at approximately $65.0 million as of August 29, 2014, plus $2.4 million in cash in exchange for all outstanding shares of Delta Trust common stock. Included in the acquisition were loans with a fair value of $311.7 million and foreclosed assets with a fair value of $1.8 million.
On November 25, 2013, we completed the acquisition of Metropolitan, in which the Company purchased all the stock of Metropolitan for $53.6 million in cash. The acquisition was conducted in accordance with the provisions of Section 363 of the United States Bankruptcy Code. Included in the acquisition were loans with a fair value of $457.4 million and foreclosed assets with a fair value of $42.9 million.
On September 30, 2013 we acquired a $9.8 million credit card portfolio for a premium of $1.3 million.
33
On September 14, 2012, the Company acquired certain assets and assumed substantially all of the deposits and certain other liabilities of Truman in an FDIC-assisted transaction that generated a pre-tax bargain-purchase gain of $1.1 million. On October 19, 2012, the Company acquired certain assets and assumed certain deposits and other liabilities of Excel in an FDIC-assisted transaction that generated a pre-tax purchase gain of $2.3 million. In 2010, we acquired substantially all of the assets and assumed substantially all of the deposits and certain other liabilities of two other failed banks in FDIC-assisted transactions. Loans comprise the majority of the assets acquired. The majority of the loans acquired, along with the majority of the foreclosed assets acquired, are subject to loss share agreements with the FDIC whereby Simmons Bank is indemnified against 80% of losses. These loans and foreclosed assets, as well as the related indemnification asset from the FDIC, are presented as covered assets in the accompanying consolidated financial statements.
A summary of the covered assets, along with the acquired loans and foreclosed assets held for sale that are not covered under FDIC loss share agreements, are reflected in Table 9 below:
|
Table 9:
|
Loans Acquired
|
|
(In thousands)
|
December 31,
2014
|
December 31,
2013
|
||||||
|
Loans acquired, covered by FDIC loss share (net of discount and allowance)
|
$
|
106,933
|
$
|
146,653
|
||||
|
Foreclosed assets covered by FDIC loss share
|
11,793
|
20,585
|
||||||
|
FDIC indemnification asset
|
22,663
|
48,791
|
||||||
|
Total covered assets
|
$
|
141,389
|
$
|
216,029
|
||||
|
Loans acquired, not covered by FDIC loss share (net of discount)
|
$
|
575,980
|
$
|
515,644
|
||||
|
Foreclosed assets acquired, not covered by FDIC loss share
|
33,053
|
45,459
|
||||||
|
Total assets acquired, not covered by FDIC loss share
|
$
|
609,033
|
$
|
561,103
|
||||
Approximately $730.0 million of the loans acquired in the Metropolitan and Delta Trust acquisitions were evaluated and are being accounted for in accordance with ASC Topic 310-20,
Nonrefundable Fees and Other Costs
. The fair value discount is being accreted into interest income over the weighted average life of the loans using a constant yield method. These loans are not considered to be impaired loans. We evaluated the remaining loans purchased in conjunction with the acquisitions of Metropolitan and Delta Trust for impairment in accordance with the provisions of ASC Topic 310-30,
Loans and Debt Securities Acquired with Deteriorated Credit Quality
. Purchased loans are considered impaired if there is evidence of credit deterioration since origination and if it is probable that not all contractually required payments will be collected.
We evaluated all of the loans purchased in conjunction with the acquisition of Truman, Excel and our previous FDIC-assisted transactions in accordance with the provisions of ASC Topic 310-30. All loans acquired in the FDIC transactions, both covered and not covered, were deemed to be impaired loans. Because some pools evaluated by the Company, covered by loss share agreements, were determined to have experienced impairment in the estimated credit quality or cash flows during 2014, the Company recorded a provision to establish a $1.0 million allowance for loan losses for covered purchased impaired loans. See Note 2 and Note 5 of the Notes to Consolidated Financial Statements for further discussion of loans acquired.
Asset Quality
A loan is considered impaired when it is probable that we will not receive all amounts due according to the contractual terms of the loans. Impaired loans include non-performing loans (loans past due 90 days or more and nonaccrual loans) and certain other loans identified by management that are still performing.
Non-performing loans are comprised of (a) nonaccrual loans, (b) loans that are contractually past due 90 days and (c) other loans for which terms have been restructured to provide a reduction or deferral of interest or principal, because of deterioration in the financial position of the borrower. Simmons Bank recognizes income principally on the accrual basis of accounting. When loans are classified as nonaccrual, generally, the accrued interest is charged off and no further interest is accrued. Loans, excluding credit card loans, are placed on a nonaccrual basis either: (1) when there are serious doubts regarding the collectability of principal or interest, or (2) when payment of interest or principal is 90 days or more past due and either (i) not fully secured or (ii) not in the process of collection. If a loan is determined by management to be uncollectible, the portion of the loan determined to be uncollectible is then charged to the allowance for loan losses.
34
Credit card loans are classified as impaired when payment of interest or principal is 90 days past due. Litigation accounts are placed on nonaccrual until such time as deemed uncollectible. Credit card loans are generally charged off when payment of interest or principal exceeds 180 days past due, but are turned over to the credit card recovery department, to be pursued until such time as they are determined, on a case-by-case basis, to be uncollectible.
Total non-performing assets, excluding all loans acquired and foreclosed assets covered by FDIC loss share agreements, decreased by $16.2 million from December 31, 2013, to December 31, 2014. Foreclosed assets held for sale (legacy and acquired, not covered) decreased by $19.9 million, as we were able to rid ourselves of several significant non-performing assets through liquidation in 2014. Nonaccrual loans increased by $5.8 million during 2014, primarily CRE loans. Total non-performing loans increased by $3.8 million from December 31, 2013 to December 31, 2014. We remain aggressive in the identification, quantification and resolution of problem loans.
Total non-performing assets, excluding all loans acquired and foreclosed assets covered by FDIC loss share agreements, increased by $28.5 million from December 31, 2012, to December 31, 2013. The increase in non-performing assets is related to the Metropolitan acquisition, in which we acquired $42.9 million in non-covered foreclosed assets. Total non-performing loans decreased by $2.9 million from December 31, 2012 to December 31, 2013, while foreclosed assets held for sale, excluding all acquired foreclosed assets, decreased by $2.2 million during the period.
Total non-performing assets, excluding all loans acquired and foreclosed assets covered by FDIC loss share agreements, increased by $6.5 million from December 31, 2011, to December 31, 2012. The increase in non-performing assets is related to the Truman and Excel transactions, in which we acquired $13.6 million in non-covered foreclosed assets, with $11.8 million remaining at December 31, 2012. Normalizing for the acquired non-covered foreclosed assets, our non-performing assets decreased $5.2 million, primarily related to charge-offs of two credits with specific reserves. As a result of these credit charge-offs, non-performing assets, including TDRs and the acquired non-covered foreclosed assets , as a percent of total assets were 1.61% at December 31, 2012, compared to 1.52% at December 31, 2011.
From time to time, certain borrowers are experiencing declines in income and cash flow. As a result, many borrowers are seeking to reduce contractual cash outlays, the most prominent being debt payments. In an effort to preserve our net interest margin and earning assets, we are open to working with existing customers in order to maximize the collectability of the debt.
When we restructure a loan to a borrower that is experiencing financial difficulty and grant a concession that we would not otherwise consider, a troubled debt restructuring results and the Company classifies the loan as a TDR. The Company grants various types of concessions, primarily interest rate reduction and/or payment modifications or extensions, with an occasional forgiveness of principal.
Under ASC Topic 310-10-35,
Subsequent Measurement
, a TDR is considered to be impaired, and an impairment analysis must be performed. We assess the exposure for each modification, either by collateral discounting or by calculation of the present value of future cash flows, and determine if a specific allocation to the allowance for loan losses is needed.
Once an obligation has been restructured because of such credit problems, it continues to be considered a TDR until paid in full; or, if an obligation yields a market interest rate and no longer has any concession regarding payment amount or amortization, then it is not considered a TDR at the beginning of the calendar year after the year in which the improvement takes place. During 2013, we had several large TDRs yielding a market interest rate that no longer had any concession regarding payment amount or amortization. Because those loans are no longer considered TDRs, our TDR balance declined to $3.2 million at December 31, 2014, compared to $10.2 million at December 31, 2013. The majority of our TDRs are in the CRE portfolio.
We return TDRs to accrual status only if (1) all contractual amounts due can reasonably be expected to be repaid within a prudent period, and (2) repayment has been in accordance with the contract for a sustained period, typically at least six months.
We continue to maintain good asset quality, compared to the industry. The allowance for loan losses as a percent of total loans was 1.41% as of December 31, 2014. Non-performing loans equaled 0.63% of total loans. Non-performing assets were 1.25% of total assets. The allowance for loan losses was 223% of non-performing loans. Our net charge-offs to total loans for 2014 were 0.30%. Excluding credit cards, the net charge-offs to total loans were 0.20%. Net credit card charge-offs to total credit card loans for 2014 were 1.27%, compared to 1.33% in 2013.
35
We do not own any securities backed by subprime mortgage assets, and offer no mortgage loan products that target subprime borrowers.
Table 10 presents information concerning non-performing assets, including nonaccrual and restructured loans and other real estate owned (excluding all loans acquired and excluding other real estate covered by FDIC loss share agreements).
|
Table 10:
|
Non-performing Assets
|
|
Years Ended December 31
|
||||||||||||||||||||
|
(In thousands, except ratios)
|
2014
|
2013
|
2012
|
2011
|
2010
|
|||||||||||||||
|
Nonaccrual loans
(1)
|
$
|
12,038
|
$
|
6,261
|
$
|
9,123
|
$
|
12,907
|
$
|
11,186
|
||||||||||
|
Loans past due 90 days or more (principal or interest payments):
|
||||||||||||||||||||
|
Government guaranteed student loans
(2)
|
-
|
2,264
|
2,234
|
2,483
|
1,736
|
|||||||||||||||
|
Other loans
|
961
|
687
|
681
|
785
|
969
|
|||||||||||||||
|
Total loans past due 90 days or more
|
961
|
2,951
|
2,915
|
3,268
|
2,705
|
|||||||||||||||
|
Total non-performing loans
|
12,999
|
9,212
|
12,038
|
16,175
|
13,891
|
|||||||||||||||
|
Other non-performing assets:
|
||||||||||||||||||||
|
Foreclosed assets held for sale
|
11,803
|
19,361
|
21,556
|
22,887
|
23,204
|
|||||||||||||||
|
Acquired foreclosed assets held for sale, not covered
|
33,053
|
45,459
|
11,796
|
-
|
-
|
|||||||||||||||
|
Other non-performing assets
|
97
|
75
|
221
|
-
|
109
|
|||||||||||||||
|
Total other non-performing assets
|
44,953
|
64,895
|
33,573
|
22,887
|
23,313
|
|||||||||||||||
|
Total non-performing assets
|
$
|
57,952
|
$
|
74,107
|
$
|
45,611
|
$
|
39,062
|
$
|
37,204
|
||||||||||
|
Performing TDRs
|
$
|
2,233
|
$
|
9,497
|
$
|
11,015
|
$
|
11,391
|
$
|
19,426
|
||||||||||
|
Allowance for loan losses to non-performing loans
|
223
|
%
|
298
|
%
|
232
|
%
|
186
|
%
|
190
|
%
|
||||||||||
|
Non-performing loans to total loans
|
0.63
|
0.53
|
0.74
|
1.02
|
0.83
|
|||||||||||||||
|
Non-performing loans to total loans (excluding government guaranteed student loans)
(2)
|
0.63
|
0.40
|
0.60
|
0.87
|
0.72
|
|||||||||||||||
|
Non-performing assets to total assets
(3)
|
1.25
|
1.69
|
1.29
|
1.18
|
1.12
|
|||||||||||||||
|
Non-performing assets to total assets (excluding government guaranteed student loans)
(2) (3)
|
1.25
|
1.64
|
1.23
|
1.10
|
1.07
|
|||||||||||||||
|
(1)
|
Includes nonaccrual TDRs of approximately $1.0 million, $0.7 million, $3.1 million, $5.2 million and $2.1 million at December 31, 2014, 2013, 2012, 2011 and 2010, respectively.
|
|
(2)
|
Student loans past due 90 days or more are included in non-performing loans. Student loans are guaranteed by the federal government and will be purchased at 97% of principal and accrued interest when they exceed 270 days past due; therefore, non-performing ratios have been calculated excluding these loans.
|
|
(3)
|
Excludes all loans acquired and excludes other real estate acquired, covered by FDIC loss share agreements, except for their inclusion in total assets.
|
There was no interest income on the nonaccrual loans recorded for the years ended December 31, 2013, 2012 and 2011.
At December 31, 2014, impaired loans, net of government guarantees and acquired loans, were $14.7 million compared to $18.3 million at December 31, 2013. On an ongoing basis, management evaluates the underlying collateral on all impaired loans and allocates specific reserves, where appropriate, in order to absorb potential losses if the collateral were ultimately foreclosed.
36
Allowance for Loan Losses
Overview
The allowance for loan losses is a reserve established through a provision for loan losses charged to expense, which represents management’s best estimate of probable losses that have been incurred within the existing portfolio of loans. The allowance, in the judgment of management, is necessary to reserve for estimated loan losses and risks inherent in the loan portfolio. The Company’s allowance for loan loss methodology includes allowance allocations calculated in accordance with ASC Topic 310-10,
Receivables
, and allowance allocations calculated in accordance with ASC Topic 450-20,
Loss Contingencies
. Accordingly, the methodology is based on our internal grading system, specific impairment analysis, qualitative and quantitative factors.
As mentioned above, allocations to the allowance for loan losses are categorized as either specific allocations or general allocations.
Specific Allocations
A loan is considered impaired when it is probable that we will not receive all amounts due according to the contractual terms of the loan, including scheduled principal and interest payments. For a collateral dependent loan, our evaluation process includes a valuation by appraisal or other collateral analysis. This valuation is compared to the remaining outstanding principal balance of the loan. If a loss is determined to be probable, the loss is included in the allowance for loan losses as a specific allocation. If the loan is not collateral dependent, the measurement of loss is based on the difference between the expected and contractual future cash flows of the loan.
General Allocations
The general allocation is calculated monthly based on management’s assessment of several factors such as (1) historical loss experience based on volumes and types, (2) volume and trends in delinquencies and nonaccruals, (3) lending policies and procedures including those for loan losses, collections and recoveries, (4) national, state and local economic trends and conditions, (5) concentrations of credit within the loan portfolio, (6) the experience, ability and depth of lending management and staff and (7) other factors and trends that will affect specific loans and categories of loans. We establish general allocations for each major loan category. This category also includes allocations to loans which are collectively evaluated for loss such as credit cards, one-to-four family owner occupied residential real estate loans and other consumer loans.
Reserve for Unfunded Commitments
In addition to the allowance for loan losses, we have established a reserve for unfunded commitments, classified in other liabilities. This reserve is maintained at a level sufficient to absorb losses arising from unfunded loan commitments. The adequacy of the reserve for unfunded commitments is determined monthly based on methodology similar to our methodology for determining the allowance for loan losses. Net adjustments to the reserve for unfunded commitments are included in other non-interest expense.
37
|
Table 11:
|
Allowance for Loan Losses
|
|
(In thousands)
|
2014
|
2013
|
2012
|
2011
|
2010
|
|||||||||||||||
|
Balance, beginning of year
|
$
|
27,442
|
$
|
27,882
|
$
|
30,108
|
$
|
26,416
|
$
|
25,016
|
||||||||||
|
Loans charged off
|
||||||||||||||||||||
|
Credit card
|
3,188
|
3,263
|
3,516
|
4,703
|
5,321
|
|||||||||||||||
|
Other consumer
|
1,638
|
1,561
|
1,198
|
1,890
|
2,471
|
|||||||||||||||
|
Real estate
|
2,684
|
1,628
|
4,095
|
3,165
|
9,564
|
|||||||||||||||
|
Commercial
|
1,044
|
382
|
543
|
1,411
|
1,246
|
|||||||||||||||
|
Total loans charged off
|
8,554
|
6,834
|
9,352
|
11,169
|
18,602
|
|||||||||||||||
|
Recoveries of loans previously charged off
|
||||||||||||||||||||
|
Credit card
|
896
|
901
|
858
|
979
|
1,035
|
|||||||||||||||
|
Other consumer
|
470
|
591
|
575
|
604
|
884
|
|||||||||||||||
|
Real estate
|
1,566
|
592
|
1,383
|
981
|
3,657
|
|||||||||||||||
|
Commercial
|
326
|
192
|
170
|
621
|
297
|
|||||||||||||||
|
Total recoveries
|
3,258
|
2,276
|
2,986
|
3,185
|
5,873
|
|||||||||||||||
|
Net loans charged off
|
5,296
|
4,558
|
6,366
|
7,984
|
12,729
|
|||||||||||||||
|
Provision for loan losses
|
6,882
|
4,118
|
4,140
|
11,676
|
14,129
|
|||||||||||||||
|
Balance, end of year
|
$
|
29,028
|
$
|
27,442
|
$
|
27,882
|
$
|
30,108
|
$
|
26,416
|
||||||||||
|
Net charge-offs to average loans
(1)
|
0.30
|
%
|
0.27
|
%
|
0.40
|
%
|
0.49
|
%
|
0.71
|
%
|
||||||||||
|
Allowance for loan losses to period-end loans
(1)
|
1.41
|
%
|
1.57
|
%
|
1.71
|
%
|
1.91
|
%
|
1.57
|
%
|
||||||||||
|
Allowance for loan losses to net charge-offs
(1)
|
548.11
|
%
|
602.06
|
%
|
438.05
|
%
|
377.10
|
%
|
207.53
|
%
|
||||||||||
|
(1)
|
Excludes all acquired loan
|
Provision for Loan Losses
The amount of provision added to the allowance each year was based on management's judgment, with consideration given to the composition of the portfolio, historical loan loss experience, assessment of current economic conditions, past due and non-performing loans and net loss experience. It is management's practice to review the allowance on a monthly basis, and after considering the factors previously noted, to determine the level of provision made to the allowance.
Allowance for Loan Losses Allocation
Prior to the fourth quarter of 2012, we measured the appropriateness of the allowance for loan losses in its entirety using (a)ASC 450-20 which includes quantitative (historical loss rates) and qualitative factors (management adjustment factors) such as (1) lending policies and procedures, (2) economic outlook and business conditions, (3) level and trend in delinquencies, (4) concentrations of credit and (5) external factors and competition; which are combined with the historical loss rates to create the baseline factors that are allocated to the various loan categories; (b) specific allocations on impaired loans in accordance with ASC 310-10; and (c) the unallocated amount.
The unallocated amount was evaluated on the loan portfolio in its entirety and was based on additional factors, such as (1) trends in volume, maturity and composition, (2) national, state and local economic trends and conditions, (3) the experience, ability and depth of lending management and staff and (4) other factors and trends that will affect specific loans and categories of loans, such as a heightened risk in agriculture, credit card and commercial real estate loan portfolios.
As of December 31, 2012, we refined our allowance calculation. As part of the refinement process, we evaluated the criteria previously applied to the entire loan portfolio, and used to calculate the unallocated portion of the allowance, and applied those criteria to each specific loan category. For example, the impact of national, state and local economic trends and conditions was evaluated by and allocated to specific loan categories.
As a result of this refined allowance calculation, the Company allocated (i) $1.8 million previously included as unallocated allowance to its credit card portfolio segment, (ii) $5.3 million previously included as unallocated allowance to its real estate portfolio segment, including (a) $3.2 million to commercial real estate and (b) $2.1 million to 1-4 family real estate and (iii) $1.6 million previously included as unallocated allowance to its commercial portfolio segment, including (a) $1.3 million to agricultural and (b) $0.3 million to other commercial. These allocations totaling $8.7 million were previously included in our unallocated allowance prior to the fourth quarter of 2012.
38
The Company may also consider additional qualitative factors in future periods for allowance allocations, including, among other factors, (1) seasoning of the loan portfolio, (2) the offering of new loan products, (3) specific industry conditions affecting portfolio segments and (4) the Company’s expansion into new markets. As a result of the refined allowance calculation, the allocation of our allowance may not be comparable with periods prior to December 31, 2012.
Our allocation of the allowance for loan losses remained relatively unchanged from December 31, 2010 to December 31, 2011 in each loan category, including the allocation to credit card loans. Annualized net credit card charge-offs to credit card loans decreased from 2.37% at December 31, 2010 to 2.06% at December 31, 2011. Although we continued to have minimal credit card losses compared to the industry, credit card loans are unsecured loans. The economic downturn could adversely affect consumers in a more delayed fashion compared to commercial business in general. Increasing unemployment and diminished asset values could prevent our credit card customers from repaying their credit card balances which could result in an increased amount of our net charge-offs that could have a significant adverse effect on our unsecured credit card portfolio.
The unallocated allowance for loan losses for December 31, 2011, was based on our concerns over the uncertainty of the national economy and the economy in Arkansas, Missouri and Kansas. The impact of market pricing in the poultry, timber and catfish industries in Arkansas remained uncertain. We were also cautious regarding the continued softening of the real estate market, specifically in the Northwest Arkansas region. The housing industry remained one of the weakest links for economic recovery. Although the unemployment rate in Arkansas, Missouri and Kansas was lagging behind the national average, it remained at historically high levels. We actively monitor the status of these industries and economic factors as they relate to our loan portfolio and make changes to the allowance for loan losses as necessary. Based on our analysis of loans and external uncertainties, we believe the allowance for loan losses in its entirety was appropriate for the year ended December 31, 2011.
The following table sets forth the sum of the amounts of the allowance for loan losses attributable to individual loans within each category, or loan categories in general and, prior to December 31, 2012, the unallocated allowance. As previously discussed, we refined our allowance calculation during 2012 such that we no longer maintain unallocated allowance. The table also reflects the percentage of loans in each category to the total loan portfolio, excluding loans acquired, for each of the periods indicated. These allowance amounts have been computed using the Company’s internal grading system, specific impairment analysis, qualitative and quantitative factor allocations. The amounts shown are not necessarily indicative of the actual future losses that may occur within individual categories. We had no allocation of our allowance to loans acquired for any of the periods presented.
|
Table 12:
|
Allocation of Allowance for Loan Losses
|
|
December 31
|
||||||||||||||||||||||||||||||||||||||||
|
2014
|
2013
|
2012
|
2011
|
2010
|
||||||||||||||||||||||||||||||||||||
|
(In thousands)
|
Allowance
Amount
|
% of
loans
(1)
|
Allowance
Amount
|
% of
loans
(1)
|
Allowance
Amount
|
% of
loans
(1)
|
Allowance
Amount
|
% of
loans
(1)
|
Allowance
Amount
|
% of
loans
(1)
|
||||||||||||||||||||||||||||||
|
Credit cards
|
$
|
5,445
|
9.1
|
%
|
$
|
5,430
|
10.6
|
%
|
$
|
7,211
|
11.4
|
%
|
$
|
5,513
|
12.0
|
%
|
$
|
5,549
|
11.3
|
%
|
||||||||||||||||||||
|
Other consumer
|
1,427
|
5.0
|
%
|
1,758
|
7.2
|
%
|
1,574
|
8.6
|
%
|
1,638
|
9.9
|
%
|
1,703
|
10.7
|
%
|
|||||||||||||||||||||||||
|
Real estate
|
15,161
|
65.9
|
%
|
16,885
|
66.9
|
%
|
15,453
|
65.3
|
%
|
10,117
|
63.4
|
%
|
9,692
|
63.4
|
%
|
|||||||||||||||||||||||||
|
Commercial
|
6,962
|
19.8
|
%
|
3,205
|
15.1
|
%
|
3,446
|
14.4
|
%
|
2,063
|
14.4
|
%
|
2,277
|
14.1
|
%
|
|||||||||||||||||||||||||
|
Other
|
33
|
0.2
|
%
|
164
|
0.2
|
%
|
198
|
0.3
|
%
|
209
|
0.3
|
%
|
255
|
0.5
|
%
|
|||||||||||||||||||||||||
|
Unallocated
|
-
|
-
|
-
|
10,568
|
6,940
|
|||||||||||||||||||||||||||||||||||
|
Total
|
$
|
29,028
|
100.0
|
%
|
$
|
27,442
|
100.0
|
%
|
$
|
27,882
|
100.0
|
%
|
$
|
30,108
|
100.0
|
%
|
$
|
26,416
|
100.0
|
%
|
||||||||||||||||||||
|
(1)
|
Percentage of loans in each category to total loans, excluding loans acquired.
|
39
Investments and Securities
Our securities portfolio is the second largest component of earning assets and provides a significant source of revenue. Securities within the portfolio are classified as either held-to-maturity, available-for-sale or trading.
Held-to-maturity securities, which include any security for which management has the positive intent and ability to hold until maturity, are carried at historical cost, adjusted for amortization of premiums and accretion of discounts. Premiums and discounts are amortized and accreted, respectively, to interest income using the constant yield method over the period to maturity. Interest and dividends on investments in debt and equity securities are included in income when earned.
Available-for-sale securities, which include any security for which management has no immediate plans to sell, but which may be sold in the future, are carried at fair value. Realized gains and losses, based on amortized cost of the specific security, are included in other income. Unrealized gains and losses are recorded, net of related income tax effects, in stockholders' equity. Premiums and discounts are amortized and accreted, respectively, to interest income, using the constant yield method over the period to maturity. Interest and dividends on investments in debt and equity securities are included in income when earned.
Our philosophy regarding investments is conservative based on investment type and maturity. Investments in the portfolio primarily include U.S. Treasury securities, U.S. Government agencies, mortgage-backed securities and municipal securities. Our general policy is not to invest in derivative type investments or high-risk securities, except for collateralized mortgage-backed securities for which collection of principal and interest is not subordinated to significant superior rights held by others.
Held-to-maturity and available-for-sale investment securities were $777.6 million and $305.3 million, respectively, at December 31, 2014, compared to the held-to-maturity amount of $745.7 million and available-for-sale amount of $212.3 million at December 31, 2013. Based on our level of pledging and our history of holding securities to maturity, our strategy sets portfolio targets of approximately 75% held-to-maturity and 25% available-for-sale.
As of December 31, 2014, $418.9 million, or 53.9%, of the held-to-maturity securities were invested in U.S. Treasury securities and obligations of U.S. government agencies, 83.3% of which will mature in less than five years. In the available-for-sale securities, $276.8 million, or 90.7%, were in U.S. Treasury and U.S. government agency securities, 85.5% of which will mature in less than five years.
In order to reduce our income tax burden, $328.3 million, or 42.2%, of the held-to-maturity securities portfolio, as of December 31, 2014, was invested in tax-exempt obligations of state and political subdivisions. In the available-for-sale securities, there was $6.5 million invested in tax-exempt obligations of state and political subdivisions. Most of the state and political subdivision debt obligations are non-rated bonds and represent relatively small, Arkansas and Texas issues, which are evaluated on an ongoing basis. There are no securities of any one state or political subdivision issuer exceeding ten percent of our stockholders' equity at December 31, 2014.
We had approximately $29.7 million, or 3.83% of the held-to-maturity portfolio invested in mortgaged-backed securities at December 31, 2014. In the available-for-sale securities, approximately $1.6 million, or 0.51% were invested in mortgaged-backed securities. Securities with limited marketability, such as stock in the Federal Reserve Bank and the Federal Home Loan Bank, are carried at cost and are reported as other available for sale securities.
As of December 31, 2014, the held-to-maturity investment portfolio had gross unrealized gains of $8.0 million and gross unrealized losses of $5.0 million.
We had $199,000 of gross realized gains and $191,000 of realized losses from the sale of available for sale securities during the year ended December 31, 2014. We had $151,000 of gross realized gains and $302,000 of realized losses from the sale of available for sale securities during the year ended December 31, 2013. As part of its acquisition strategy related to Truman and Excel, we liquidated the acquired mortgage-backed securities, resulting in $193,000 of net realized losses during 2013. There were $2,000 of realized gains from the sale of available for sale securities and no realized losses during the year ended December 31, 2012.
Trading securities, which include any security held primarily for near-term sale, are carried at fair value. Gains and losses on trading securities are included in other income. Our trading account is established and maintained for the benefit of investment banking. The trading account is typically used to provide inventory for resale and is not used to take advantage of short-term price movements.
Declines in the fair value of held-to-maturity and available-for-sale securities below their cost that are deemed to be other than temporary are reflected in earnings as realized losses. In estimating other-than-temporary impairment losses, management considers, among other things, (i) the length of time and the extent to which the fair value has been less than cost, (ii) the financial condition and near-term prospects of the issuer and (iii) the intent and ability of the Company to retain its investment in the issuer for a period of time sufficient to allow for any anticipated recovery in fair value.
40
The unrealized losses on our investment securities were caused by interest rate increases. The contractual terms of those investments do not permit the issuer to settle the securities at a price less than the amortized cost bases of the investments. Because we do not intend to sell the investments and it is not more likely than not that we will be required to sell the investments before recovery of their amortized cost bases, which may be maturity, we do not consider those investments to be other-than-temporarily impaired at December 31, 2014.
Management has the ability and intent to hold the securities classified as held to maturity until they mature, at which time we expect to receive full value for the securities. Furthermore, as of December 31, 2014, management also had the ability and intent to hold the securities classified as available-for-sale for a period of time sufficient for a recovery of cost. The unrealized losses are largely due to increases in market interest rates over the yields available at the time the underlying securities were purchased. The fair value is expected to recover as the bonds approach their maturity date or repricing date or if market yields for such investments decline. Management does not believe any of the securities are impaired due to reasons of credit quality. Accordingly, as of December 31, 2014, management believes the impairments detailed in the table below are temporary.
Table 13 presents the carrying value and fair value of investment securities for each of the years indicated.
|
Table 13:
|
Investment Securities
|
|
Years Ended December 31
|
||||||||||||||||||||||||||||||||
|
2014
|
2013
|
|||||||||||||||||||||||||||||||
|
(In thousands)
|
Amortized
Cost
|
Gross
Unrealized
|
Gross
Unrealized
|
Estimated
Fair
Value
|
Amortized
Cost
|
Gross
Unrealized
|
Gross
Unrealized
|
Estimated
Fair
|
||||||||||||||||||||||||
|
Held-to-Maturity
|
||||||||||||||||||||||||||||||||
|
U.S. Government agencies
|
$
|
418,914
|
$
|
929
|
$
|
(4,055
|
)
|
$
|
415,788
|
$
|
395,198
|
$
|
50
|
$
|
(10,535
|
)
|
$
|
384,713
|
||||||||||||||
|
Mortgage-backed securities
|
29,743
|
56
|
(411
|
)
|
29,388
|
34,425
|
17
|
(442
|
)
|
34,000
|
||||||||||||||||||||||
|
State and political subdivisions
|
328,310
|
7,000
|
(573
|
)
|
334,737
|
315,445
|
2,165
|
(5,498
|
)
|
312,112
|
||||||||||||||||||||||
|
Other securities
|
620
|
-
|
-
|
620
|
620
|
-
|
-
|
620
|
||||||||||||||||||||||||
|
Total
|
$
|
777,587
|
$
|
7,985
|
$
|
(5,039
|
)
|
$
|
780,533
|
$
|
745,688
|
$
|
2,232
|
$
|
(16,475
|
)
|
$
|
731,445
|
||||||||||||||
|
Available-for-Sale
|
||||||||||||||||||||||||||||||||
|
U.S. Treasury
|
$
|
4,000
|
$
|
1
|
$
|
(9
|
)
|
$
|
3,992
|
$
|
4,001
|
$
|
-
|
$
|
(16
|
)
|
$
|
3,985
|
||||||||||||||
|
U.S. Government agencies
|
275,381
|
15
|
(2,580
|
)
|
272,816
|
183,781
|
8
|
(5,572
|
)
|
178,217
|
||||||||||||||||||||||
|
Mortgage-backed securities
|
1,579
|
-
|
(7
|
)
|
1,572
|
1,735
|
156
|
-
|
1,891
|
|||||||||||||||||||||||
|
State and political subdivisions
|
6,536
|
7
|
(3
|
)
|
6,540
|
7,860
|
4
|
(3
|
)
|
7,861
|
||||||||||||||||||||||
|
Other securities
|
19,985
|
386
|
(8
|
)
|
20,363
|
19,840
|
484
|
(1
|
)
|
20,323
|
||||||||||||||||||||||
|
Total
|
$
|
307,481
|
$
|
409
|
$
|
(2,607
|
)
|
$
|
305,283
|
$
|
217,217
|
$
|
652
|
$
|
(5,592
|
)
|
$
|
212,277
|
||||||||||||||
41
Table 14 reflects the amortized cost and estimated fair value of securities at December 31, 2014, by contractual maturity and the weighted average yields (for tax-exempt obligations on a fully taxable equivalent basis, assuming a 39.225% tax rate) of such securities. Expected maturities will differ from contractual maturities because borrowers may have the right to call or prepay obligations, with or without call or prepayment penalties.
|
Table 14:
|
Maturity Distribution of Investment Securities
|
|
December 31, 2014
|
||||||||||||||||||||||||||||||||
|
|
|
Total
|
||||||||||||||||||||||||||||||
|
(In thousands)
|
1 year
or less
|
Over
1 year
|
Over
5 years
|
Over
10 years
|
No fixed
maturity
|
Amortized
Cost
|
Par
Value
|
Fair
Value
|
||||||||||||||||||||||||
|
Held-to-Maturity
|
||||||||||||||||||||||||||||||||
|
U.S. Government agencies
|
$ | - | $ | 349,071 | $ | 69,843 | $ | - | $ | - | $ | 418,914 | $ | 420,757 | $ | 415,788 | ||||||||||||||||
|
Mortgage-backed securities
|
- | 10 | 136 | 29,597 | - | 29,743 | 30,082 | 29,388 | ||||||||||||||||||||||||
|
State and political subdivisions
|
23,069 | 66,074 | 63,667 | 175,500 | - | 328,310 | 329,647 | 334,737 | ||||||||||||||||||||||||
|
Other securities
|
- | - | - | 620 | - | 620 | 620 | 620 | ||||||||||||||||||||||||
|
Total
|
$ | 23,069 | $ | 415,155 | $ | 133,646 | $ | 205,717 | $ | - | $ | 777,587 | $ | 781,106 | $ | 780,533 | ||||||||||||||||
|
Percentage of total
|
3.0 | % | 53.4 | % | 17.1 | % | 26.5 | % | - | 100.0 | % | |||||||||||||||||||||
|
Weighted average yield
|
2.8 | % | 1.4 | % | 3.2 | % | 5.2 | % | - | 2.8 | % | |||||||||||||||||||||
|
Available-for-Sale
|
||||||||||||||||||||||||||||||||
|
U.S. Government agencies
|
$ | - | $ | 232,577 | $ | 42,804 | $ | - | $ | - | $ | 275,381 | $ | 275,405 | $ | 272,816 | ||||||||||||||||
|
U.S. Government treasury
|
- | 4,000 | - | - | - | 4,000 | 4,000 | 3,992 | ||||||||||||||||||||||||
|
Mortgage-backed securities
|
- | 29 | - | 1,550 | - | 1,579 | 1,622 | 1,572 | ||||||||||||||||||||||||
|
State and political subdivisions
|
3,267 | 3,066 | 203 | - | - | 6,536 | 6,518 | 6,540 | ||||||||||||||||||||||||
|
Other securities
|
- | 519 | 254 | - | 19,212 | 19,985 | 20,231 | 20,363 | ||||||||||||||||||||||||
|
Total
|
$ | 3,267 | $ | 240,191 | $ | 43,261 | $ | 1,550 | $ | 19,212 | $ | 307,481 | $ | 307,776 | $ | 305,283 | ||||||||||||||||
|
Percentage of total
|
1.1 | % | 78.1 | % | 14.1 | % | 0.5 | % | 6.2 | % | 100.0 | % | ||||||||||||||||||||
|
Weighted average yield
|
2.9 | % | 0.9 | % | 1.3 | % | 2.1 | % | 1.0 | % | 1.0 | % | ||||||||||||||||||||
Deposits
Deposits are our primary source of funding for earning assets and are primarily developed through our network of over 100 financial centers. We offer a variety of products designed to attract and retain customers with a continuing focus on developing core deposits. Our core deposits consist of all deposits excluding time deposits of $100,000 or more and brokered deposits. As of December 31, 2014, core deposits comprised 88.8% of our total deposits.
We continually monitor the funding requirements at each subsidiary bank along with competitive interest rates in the markets it serves. Because of our community banking philosophy, subsidiary bank executives in the local markets establish the interest rates offered on both core and non-core deposits. This approach ensures that the interest rates being paid are competitively priced for each particular deposit product and structured to meet the funding requirements. We believe we are paying a competitive rate when compared with pricing in those markets.
We manage our interest expense through deposit pricing and do not anticipate a significant change in total deposits. We believe that additional funds can be attracted and deposit growth can be accelerated through deposit pricing if it experiences increased loan demand or other liquidity needs. We also utilize brokered deposits as an additional source of funding to meet liquidity needs.
42
Our total deposits as of December 31, 2014 were $3.861 billion, an increase of $163.2 million, or 4.4%, from $3.698 billion at December 31, 2013. We have continued our strategy to move more volatile time deposits to less expensive, revenue enhancing transaction accounts throughout 2014. Non-interest bearing transaction accounts increased $170.8 million to $889.3 million at December 31, 2014, compared to $718.4 million at December 31, 2013. Interest bearing transaction and savings accounts were $2.006 billion at December 31, 2014, a $143.6 million increase compared to $1.863 billion on December 31, 2013. Total time deposits decreased approximately $151.3 million to $965.2 million at December 31, 2014, from $1.117 million at December 31, 2013. In an attempt to utilize some of our excess liquidity, we have priced deposits in a manner to encourage a reduction in non-relationship time deposits. We had $7.4 million and $16.8 million of brokered deposits at December 31, 2014 and 2013, respectively.
Table 15 reflects the classification of the average deposits and the average rate paid on each deposit category which is in excess of 10 percent of average total deposits for the three years ended December 31, 2014.
|
Table 15:
|
Average Deposit Balances and Rates
|
|
December 31
|
||||||||||||||||||||||||
|
2014
|
2013
|
2012
|
||||||||||||||||||||||
|
(In thousands)
|
Average
Amount
|
Average
Rate
Paid
|
Average
Amount
|
Average
Rate
Paid
|
Average
Amount
|
Average
Rate
Paid
|
||||||||||||||||||
|
Non-interest bearing transaction accounts
|
$
|
820,490
|
-
|
$
|
588,374
|
-
|
$
|
518,243
|
-
|
|||||||||||||||
|
Interest bearing transaction and savings deposits
|
1,886,217
|
0.16
|
%
|
1,490,457
|
0.17
|
%
|
1,308,171
|
0.21
|
%
|
|||||||||||||||
|
Time deposits
|
||||||||||||||||||||||||
|
$100,000 or more
|
470,798
|
0.66
|
%
|
372,830
|
0.72
|
%
|
368,437
|
0.95
|
%
|
|||||||||||||||
|
Other time deposits
|
570,181
|
0.51
|
%
|
487,083
|
0.67
|
%
|
492,567
|
0.90
|
%
|
|||||||||||||||
|
Total
|
$
|
3,747,886
|
0.24
|
%
|
$
|
2,938,744
|
0.29
|
%
|
$
|
2,687,418
|
0.40
|
%
|
||||||||||||
The Company's maturities of large denomination time deposits at December 31, 2014 and 2013 are presented in table 16.
|
Table 16:
|
Maturities of Large Denomination Time Deposits
|
|
Time Certificates of Deposit
($100,000 or more)
|
||||||||||||||||
|
2014
|
2013
|
|||||||||||||||
|
(In thousands)
|
Balance
|
Percent
|
Balance
|
Percent
|
||||||||||||
|
Maturing
|
||||||||||||||||
|
Three months or less
|
$
|
122,008
|
28.1
|
%
|
$
|
123,384
|
24.4
|
%
|
||||||||
|
Over 3 months to 6 months
|
76,613
|
17.6
|
%
|
107,033
|
21.2
|
%
|
||||||||||
|
Over 6 months to 12 months
|
108,591
|
25.0
|
%
|
192,468
|
38.1
|
%
|
||||||||||
|
Over 12 months
|
127,085
|
29.3
|
%
|
81,897
|
16.2
|
%
|
||||||||||
|
Total
|
$
|
434,297
|
100.0
|
%
|
$
|
504,782
|
100.00
|
%
|
||||||||
43
Fed Funds Purchased and Securities Sold under Agreements to Repurchase
Federal funds purchased and securities sold under agreements to repurchase were $110.6 million at December 31, 2014, as compared to $107.9 million at December 31, 2013.
We have historically funded our growth in earning assets through the use of core deposits, large certificates of deposits from local markets, FHLB borrowings and Federal funds purchased. Management anticipates that these sources will provide necessary funding in the foreseeable future.
Other Borrowings and Subordinated Debentures
Our total debt was $135.3 million and $137.7 million at December 31, 2014 and 2013, respectively. The outstanding long-term debt balance for December 31, 2014 includes $71.6 million in FHLB long-term advances, $43.1 million in notes payable and $20.6 million of trust preferred securities. The outstanding long-term debt balance for December 31, 2013 includes $71.1 million in FHLB long-term advances, $46.0 million in notes payable and $20.6 million of trust preferred securities.
We decreased our total debt by $2.4 million during 2014, due to $2.9 million in principal payments on our notes payable. During 2013 we added $46.0 million of notes payable, unsecured debt from corresponded banks used as partial funding for our Metropolitan acquisition. These notes carry a 3.25% floating rate to be repaid in three years or less.
Aggregate annual maturities of long-term debt at December 31, 2014 are presented in table 17.
|
Table 17:
|
|
|
(In thousands)
|
Year
|
Annual
Maturities
|
||||
|
2015
|
$
|
15,056
|
||||
|
2016
|
55,176
|
|||||
|
2017
|
21,952
|
|||||
|
2018
|
6,550
|
|||||
|
2019
|
2,742
|
|||||
|
Thereafter
|
33,826
|
|||||
|
Total
|
$
|
135,302
|
||||
Capital
Overview
At December 31, 2014, total capital reached $494.3 million. Capital represents shareholder ownership in the Company – the book value of assets in excess of liabilities. At December 31, 2014, our equity to asset ratio was 10.6% compared to 9.2% at year-end 2013. The increase is primarily a result of increased earnings, organic and from the Metropolitan and Delta Trust acquisitions.
Capital Stock
On February 27, 2009, at a special meeting, our shareholders approved an amendment to the Articles of Incorporation to establish 40,040,000 authorized shares of preferred stock, $0.01 par value. The aggregate liquidation preference of all shares of preferred stock cannot exceed $80,000,000. As of December 31, 2014, no preferred stock has been issued.
On March 4, 2014 the Company filed a shelf registration statement with the Securities and Exchange Commission (“SEC”). Subsequently, on June 18, 2014, we filed Amendment No. 1 to the shelf registration statement. When declared effective, the shelf registration statement, will allow us to raise capital from time to time, up to an aggregate of $300 million, through the sale of common stock, preferred stock, stock warrants, stock rights or a combination thereof, subject to market conditions. Specific terms and prices are determined at the time of any offering under a separate prospectus supplement that the Company is required to file with the SEC at the time of the specific offering.
44
Stock Repurchase
During 2007, the Company approved a stock repurchase program which authorized the repurchase of up to 700,000 shares of common stock. On July 23, 2012, we announced the substantial completion of the existing stock repurchase program and the adoption by our Board of Directors of a new stock repurchase program. The current program authorizes the repurchase of up to 850,000 additional shares of Class A common stock, or approximately 5% of the shares outstanding. The shares are to be purchased from time to time at prevailing market prices, through open market or unsolicited negotiated transactions, depending upon market conditions. Under the repurchase program, there is no time limit for the stock repurchases, nor is there a minimum number of shares that we intend to repurchase. We may discontinue purchases at any time that management determines additional purchases are not warranted. We intend to use the repurchased shares to satisfy stock option exercises, payment of future stock awards and dividends and general corporate purposes.
During 2013, we repurchased 419,564 shares of stock with a weighted average repurchase price of $25.89 per share. Under the current stock repurchase plan, an additional 154,136 shares are available for repurchase. As a result of our announced acquisition of Metropolitan National Bank, we suspended stock repurchases in August of 2013. We had no stock repurchases during 2014.
Cash Dividends
We declared cash dividends on our common stock of $0.88 per share for the twelve months ended December 31, 2014, compared to $0.84 per share for the twelve months ended December 31, 2013. The timing and amount of future dividends are at the discretion of our Board of Directors and will depend upon our consolidated earnings, financial condition, liquidity and capital requirements, the amount of cash dividends paid to us by our subsidiaries, applicable government regulations and policies and other factors considered relevant by our Board of Directors. Our Board of Directors anticipates that we will continue to pay quarterly dividends in amounts determined based on the factors discussed above. However, there can be no assurance that we will continue to pay dividends on our common stock at the current levels or at all. See Item 5, Market for Registrant’s Common Equity and Related Stockholder Matters, for additional information regarding cash dividends.
Parent Company Liquidity
The primary liquidity needs of the Parent Company are the payment of dividends to shareholders and the funding of debt obligations. The primary sources for meeting these liquidity needs are the current cash on hand at the parent company and the future dividends received from subsidiary banks. Payment of dividends by the subsidiary banks is subject to various regulatory limitations. See Item 7A, Liquidity and Qualitative Disclosures About Market Risk, for additional information regarding the parent company’s liquidity.
Risk-Based Capital
Our subsidiaries are subject to various regulatory capital requirements administered by the federal banking agencies. Failure to meet minimum capital requirements can initiate certain mandatory and possibly additional discretionary actions by regulators that, if undertaken, could have a direct material effect on our financial statements. Under capital adequacy guidelines and the regulatory framework for prompt corrective action, we must meet specific capital guidelines that involve quantitative measures of our assets, liabilities and certain off-balance-sheet items as calculated under regulatory accounting practices. Our capital amounts and classifications are also subject to qualitative judgments by the regulators about components, risk weightings and other factors.
Quantitative measures established by regulation to ensure capital adequacy require us to maintain minimum amounts and ratios (set forth in the table below) of total and Tier 1 capital (as defined in the regulations) to risk-weighted assets (as defined) and of Tier 1 capital (as defined) to average assets (as defined). Management believes that, as of December 31, 2014, we meet all capital adequacy requirements to which we are subject.
45
As of the most recent notification from regulatory agencies, the subsidiaries were well capitalized under the regulatory framework for prompt corrective action. To be categorized as well capitalized, the Company and subsidiaries must maintain minimum total risk-based, Tier 1 risk-based and Tier 1 leverage ratios as set forth in the table. There are no conditions or events since that notification that management believes have changed the institutions’ categories.
Our risk-based capital ratios at December 31, 2014 and 2013 are presented in table 18 below:
|
Table 18:
|
Risk-Based Capital
|
|
December 31
|
||||||||
|
(In thousands, except ratios)
|
2014
|
2013
|
||||||
|
Tier 1 capital
|
||||||||
|
Stockholders’ equity
|
$
|
494,319
|
$
|
403,832
|
||||
|
Trust preferred securities
|
20,000
|
20,000
|
||||||
|
Goodwill and other intangible assets
|
(112,545
|
)
|
(75,501
|
)
|
||||
|
Unrealized gain on available-for-sale securities, net of income taxes
|
1,336
|
3,002
|
||||||
|
Total Tier 1 capital
|
403,110
|
351,333
|
||||||
|
Tier 2 capital
|
||||||||
|
Qualifying unrealized gain on available-for-sale equity securities
|
2
|
45
|
||||||
|
Qualifying allowance for loan losses
|
32,073
|
28,967
|
||||||
|
Total Tier 2 capital
|
32,075
|
29,012
|
||||||
|
Total risk-based capital
|
$
|
435,185
|
$
|
380,345
|
||||
|
Risk weighted assets
|
$
|
3,002,270
|
$
|
2,697,630
|
||||
|
Ratios at end of year
|
||||||||
|
Tier 1 leverage ratio
|
8.77
|
%
|
9.22
|
%
|
||||
|
Tier 1 risk-based capital ratio
|
13.43
|
%
|
13.02
|
%
|
||||
|
Total risk-based capital ratio
|
14.50
|
%
|
14.10
|
%
|
||||
|
Minimum guidelines
|
||||||||
|
Tier 1 leverage ratio
|
4.00
|
%
|
4.00
|
%
|
||||
|
Tier 1 risk-based capital ratio
|
4.00
|
%
|
4.00
|
%
|
||||
|
Total risk-based capital ratio
|
8.00
|
%
|
8.00
|
%
|
||||
|
Well capitalized guidelines
|
||||||||
|
Tier 1 leverage ratio
|
5.00
|
%
|
5.00
|
%
|
||||
|
Tier 1 risk-based capital ratio
|
6.00
|
%
|
6.00
|
%
|
||||
|
Total risk-based capital ratio
|
10.00
|
%
|
10.00
|
%
|
||||
Regulatory Capital Changes
In July 2013, the Company’s primary federal regulator, the Federal Reserve, published final rules (the “Basel III Capital Rules”) establishing a new comprehensive capital framework for U.S. banks. The rules implement the Basel Committee’s December 2010 framework known as “Basel III” for strengthening international capital standards. The Basel III Capital Rules substantially revise the risk-based capital requirements applicable to bank holding companies and depository institutions compared to the current U.S. risk-based capital rules.
The Basel III Capital Rules define the components of capital and address other issues affecting the numerator in banking institutions’ regulatory capital ratios. The rules also address risk weights and other issues affecting the denominator in banking institutions’ regulatory capital ratios and replace the existing risk-weighting approach with a more risk-sensitive approach.
46
The Basel III Capital Rules expand the risk-weighting categories from the current four Basel I-derived categories (0%, 20%, 50% and 100%) to a much larger and more risk-sensitive number of categories, depending on the nature of the assets, generally ranging from 0% for U.S. government and agency securities, to 600% for certain equity exposures, and resulting in higher risk weights for a variety of asset categories, including many residential mortgages and certain commercial real estate.
The final rules include a new common equity Tier 1 capital to risk-weighted assets ratio of 4.5% and a common equity Tier 1 capital conservation buffer of 2.5% of risk-weighted assets. The rules also raise the minimum ratio of Tier 1 capital to risk-weighted assets from 4.0% to 6.0% and require a minimum leverage ratio of 4.0%. The Basel III Capital Rules are effective for the Company and its subsidiary bank on January 1, 2015, with full compliance with all of the final rule’s requirements phased in over a multi-year schedule. Management believes that, as of December 31, 2014, the Company and Simmons Bank would meet all capital adequacy requirements under the Basel III Capital Rules on a fully phased-in basis if such requirements were currently effective.
Off-Balance Sheet Arrangements and Aggregate Contractual Obligations
In the normal course of business, the Company enters into a number of financial commitments. Examples of these commitments include but are not limited to long-term debt financing, operating lease obligations, unfunded loan commitments and letters of credit.
Our long-term debt at December 31, 2014, includes notes payable, FHLB long-term advances and trust preferred securities, all of which we are contractually obligated to repay in future periods.
Operating lease obligations entered into by the Company are generally associated with the operation of a few of our financial centers located throughout the states of Arkansas, Kansas and Missouri. Our financial obligation on these locations is considered immaterial due to the limited number of financial centers that operate under an agreement of this type. Historically, we have purchased all of our automated teller machines (“ATMs”) and depreciated them over their estimated lives. In December 2012, we entered into a five-year operating lease agreement with our service provider to replace and maintain all outdated ATMs and the related operating software.
Commitments to extend credit and letters of credit are legally binding, conditional agreements generally having fixed expiration or termination dates. These commitments generally require customers to maintain certain credit standards and are established based on management’s credit assessment of the customer. The commitments may expire without being drawn upon. Therefore, the total commitment does not necessarily represent future funding requirements.
The funding requirements of the Company's most significant financial commitments at December 31, 2014 are shown in table 19.
|
Table 19:
|
Funding Requirements of Financial Commitments
|
|
Payments due by period
|
||||||||||||||||||||
|
(In thousands)
|
Less than
1 Year
|
1-3
Years
|
3-5
Years
|
Greater than
5 Years
|
Total
|
|||||||||||||||
|
Long-term debt
|
$
|
15,056
|
$
|
77,128
|
$
|
9,292
|
$
|
33,826
|
$
|
135,302
|
||||||||||
|
ATM lease commitments
|
942
|
1,884
|
942
|
-
|
3,768
|
|||||||||||||||
|
Credit card loan commitments
|
480,653
|
-
|
-
|
-
|
480,653
|
|||||||||||||||
|
Other loan commitments
|
439,053
|
-
|
-
|
-
|
439,053
|
|||||||||||||||
|
Letters of credit
|
16,217
|
-
|
-
|
-
|
16,217
|
|||||||||||||||
47
Reconciliation of Non-GAAP Measures
We have $130.6 million and $93.5 million total goodwill and other intangible assets for the periods ended December 31, 2014 and December 31, 2013, respectively. Because of our high level of intangible assets, management believes a useful calculation is return on tangible equity (non-GAAP). This non-GAAP calculation for the twelve months ended December 31, 2014, 2013, 2012, 2011 and 2010, which is similar to the GAAP calculation of return on average stockholders’ equity, is presented in table 20.
|
Table 20:
|
Return on Tangible Equity
|
|
(In thousands, except ratios)
|
2014
|
2013
|
2012
|
2011
|
2010
|
|||||||||||||||
|
Twelve months ended
|
||||||||||||||||||||
|
Return on average stockholders’ equity: (A/C)
|
8.11
|
%
|
5.33
|
%
|
6.77
|
%
|
6.25
|
%
|
9.69
|
%
|
||||||||||
|
Return on average tangible equity - (non-GAAP): (A+B)/(C-D)
|
10.99
|
%
|
6.36
|
%
|
8.05
|
%
|
7.54
|
%
|
11.71
|
%
|
||||||||||
|
(A) Net income
|
$
|
35,688
|
$
|
23,231
|
$
|
27,684
|
$
|
25,374
|
$
|
37,117
|
||||||||||
|
(B) Amortization of intangibles, net of taxes
|
1,203
|
365
|
212
|
537
|
478
|
|||||||||||||||
|
(C) Average stockholders' equity
|
440,168
|
435,918
|
409,187
|
406,093
|
383,141
|
|||||||||||||||
|
(D) Average goodwill and other intangible assets
|
104,498
|
64,709
|
62,499
|
62,631
|
62,125
|
|||||||||||||||
The table below presents computations of core earnings (net income excluding nonrecurring items {gain from the sale of MasterCard stock and merchant services, gains on FDIC-assisted transactions and the related merger costs, liquidation gains and losses from FDIC-assisted transactions and traditional acquisitions, merger related costs, change-in-control payments, charter consolidation costs and the one-time costs of branch right sizing}) and diluted core earnings per share (non-GAAP). Nonrecurring items are included in financial results presented in accordance with generally accepted accounting principles (GAAP).
We believe the exclusion of these nonrecurring items in expressing earnings and certain other financial measures, including “core earnings,” provides a meaningful base for period-to-period and company-to-company comparisons, which management believes will assist investors and analysts in analyzing the core financial measures of the Company and predicting future performance. This non-GAAP financial measure is also used by management to assess the performance of the Company’s business because management does not consider these nonrecurring items to be relevant to ongoing financial performance. Management and the Board of Directors utilize “core earnings” (non-GAAP) for the following purposes:
• Preparation of the Company’s operating budgets
• Monthly financial performance reporting
• Monthly “flash” reporting of consolidated results (management only)
• Investor presentations of Company performance
We believe the presentation of “core earnings” on a diluted per share basis, “diluted core earnings per share” (non-GAAP), provides a meaningful base for period-to-period and company-to-company comparisons, which management believes will assist investors and analysts in analyzing the core financial measures of the Company and predicting future performance. This non-GAAP financial measure is also used by management to assess the performance of the Company’s business, because management does not consider these nonrecurring items to be relevant to ongoing financial performance on a per share basis. Management and the Board of Directors utilize “diluted core earnings per share” (non-GAAP) for the following purposes:
• Calculation of annual performance-based incentives for certain executives
• Investor presentations of Company performance
We believe that presenting these non-GAAP financial measures will permit investors and analysts to assess the performance of the Company on the same basis as that applied by management and the Board of Directors.
“Core earnings” and “diluted core earnings per share” (non-GAAP) have inherent limitations and are not required to be uniformly applied and are not audited. To mitigate these limitations, we have procedures in place to identify and approve each item that qualifies as nonrecurring to ensure that the Company’s “core” results are properly reflected for period-to-period comparisons. Although these non-GAAP financial measures are frequently used by stakeholders in the evaluation of a company, they have limitations as analytical tools and should not be considered in isolation or as a substitute for analyses of results as reported under GAAP. In particular, a measure of earnings that excludes nonrecurring items does not represent the amount that effectively accrues directly to stockholders (i.e., nonrecurring items are included in earnings and stockholders’ equity).
48
During 2014, we recorded after-tax merger related costs of $4.5 million, primarily related to the Delta Trust acquisition, resulting in a nonrecurring charge of $0.27 to diluted earnings per share. During the first quarter of 2014, we closed eleven legacy Simmons branches as part of the initial branch right sizing strategy of the Metropolitan acquisition. Our total after-tax cost of branch right sizing was $2.9 million in 2014, resulting in a nonrecurring charge of $0.17 to diluted earnings per share.
Also during 2014 we recognized $4.7 million in net after-tax gains from the sale of former branch locations, primarily the legacy Simmons and acquired Metropolitan closures, contributing $0.27 to diluted earnings per share.
During the second quarter of 2014, we recorded an after-tax gain of $608,000 from the sale of our merchant services business, contributing $0.04 to diluted earnings per share. We incurred after-tax costs of $396,000 and $538,000, respectively, for charter consolidations and change-in-control payments during the year, resulting in a nonrecurring charge of $0.05 to diluted earnings per share.
During the third and fourth quarter of 2013, we recorded after-tax merger related costs of $3.9 million related to the Metropolitan acquisition, resulting in a nonrecurring charge of $0.25 to diluted earnings per share. During the third and fourth quarters, we closed seven underperforming branches at a cost of $390,000 after-tax, resulting in a nonrecurring charge of $0.02 to diluted earnings per share.
Also, as part of our 2012 acquisition strategy, we sold many of the investment securities from Excel and Truman, resulting in an after- tax loss of $117,000.
During the third quarter of 2012, we recorded an after-tax bargain purchase gain of $681,000 on the FDIC-assisted acquisition of Truman, along with merger related costs of $495,000, after tax. These nonrecurring items related to Truman contributed $0.01 to diluted earnings per share.
During the fourth quarter of 2012, we recorded an after-tax bargain purchase gain of $1.4 million on the FDIC-assisted acquisition of Excel, along with merger related costs of $657,000, after tax. Also, as part of our acquisition strategy, FHLB advances were paid off resulting in a $106,000 pre-payment expense, after tax. These nonrecurring items related to Excel contributed $0.04 to diluted earnings per share.
During the second quarter of 2011, we recorded an after-tax gain of $688,000 on the sale of MasterCard stock, contributing $0.04 to diluted earnings per share. Also during the second quarter, as a result of our right sizing initiative, we recorded a nonrecurring charge of $0.01 to diluted earnings per share.
During the first and second quarters of 2011, we recorded after-tax merger related costs of $217,000 on the FDIC-assisted acquisition of Security Savings Bank in Olathe, Kansas (“SSB”), resulting in a nonrecurring charge of $0.01 to diluted earnings per share.
During the fourth quarter of 2010, we recorded an after-tax bargain purchase gain of $18.3 million on the FDIC-assisted acquisition of SSB, along with merger related costs of $1.2 million, after tax. Also, as part of our acquisition strategy, the investment portfolio was liquidated resulting in an after-tax gain of $193,000, and FHLB advances were paid off resulting in a $361,000 pre-payment expense, after tax. These nonrecurring items related to SSB contributed $0.56 to diluted earnings per share.
During the second quarter of 2010, we recorded an after tax bargain purchase gain of $1.8 million on the FDIC-assisted acquisition of Southwest Community Bank in Springfield, Missouri (“SWCB”), along with merger related costs of $351,000. These nonrecurring items related to SWCB contributed $0.09 to diluted earnings per share. Also during the second quarter of 2010, as a result of our branch right sizing initiative, we recorded a nonrecurring charge of $0.01 to diluted earnings per share.
49
See table 21 below for the reconciliation of non-GAAP financial measures, which exclude nonrecurring items for the periods presented.
|
Table 21:
|
Reconciliation of Core Earnings (non-GAAP)
|
|
(In thousands, except share data)
|
2014
|
2013
|
2012
|
2011
|
2010
|
|||||||||||||||
|
Twelve months ended
|
||||||||||||||||||||
|
Net Income
|
$
|
35,688
|
$
|
23,231
|
$
|
27,684
|
$
|
25,374
|
$
|
37,117
|
||||||||||
|
Nonrecurring items
|
||||||||||||||||||||
|
Gain on sale of MasterCard stock
|
-
|
-
|
-
|
(1,132
|
)
|
-
|
||||||||||||||
|
Gain on sale of merchant services
|
(1,000
|
)
|
||||||||||||||||||
|
Gain on FDIC-assisted transactions
|
-
|
-
|
(3,411
|
)
|
-
|
(21,314
|
)
|
|||||||||||||
|
Merger related costs
|
7,470
|
6,376
|
1,896
|
357
|
2,611
|
|||||||||||||||
|
Change-in-control payments
|
885
|
-
|
-
|
-
|
-
|
|||||||||||||||
|
Loss (gain) from sale of securities
|
-
|
193
|
-
|
-
|
(317
|
)
|
||||||||||||||
|
FHLB prepayment penalties
|
-
|
-
|
175
|
-
|
594
|
|||||||||||||||
|
Branch right sizing
|
(3,059
|
)
|
641
|
-
|
141
|
372
|
||||||||||||||
|
Charter consolidation costs
|
652
|
-
|
-
|
-
|
-
|
|||||||||||||||
|
Tax effect (39.225%)
(1)
|
(
1,929
|
)
|
(2,829
|
)
|
526
|
248
|
6,978
|
|||||||||||||
|
Net nonrecurring items
|
3,019
|
4,381
|
(814
|
)
|
(386
|
)
|
(11,076
|
)
|
||||||||||||
|
Core earnings (non-GAAP)
|
$
|
38,707
|
$
|
27,612
|
$
|
26,870
|
$
|
24,988
|
$
|
26,041
|
||||||||||
|
Diluted earnings per share
|
$
|
2.11
|
$
|
1.42
|
$
|
1.64
|
$
|
1.47
|
$
|
2.15
|
||||||||||
|
Nonrecurring items
|
||||||||||||||||||||
|
Gain on sale of MasterCard stock
|
-
|
-
|
-
|
(0.07
|
)
|
-
|
||||||||||||||
|
Gain on sale of merchant services
|
(0.06
|
)
|
-
|
-
|
-
|
-
|
||||||||||||||
|
Gain on FDIC-assisted transactions
|
-
|
-
|
(0.21
|
)
|
-
|
(1.23
|
)
|
|||||||||||||
|
Merger related costs
|
0.44
|
0.39
|
0.12
|
0.02
|
0.15
|
|||||||||||||||
|
Change-in-control payments
|
0.05
|
-
|
-
|
-
|
-
|
|||||||||||||||
|
Loss (gain) from sale of securities
|
-
|
0.01
|
-
|
-
|
(0.02
|
)
|
||||||||||||||
|
FHLB prepayment penalties
|
-
|
-
|
0.01
|
-
|
0.03
|
|||||||||||||||
|
Branch right sizing
|
(0.16
|
)
|
0.04
|
-
|
0.01
|
0.02
|
||||||||||||||
|
Charter consolidation costs
|
0.04
|
-
|
-
|
-
|
-
|
|||||||||||||||
|
Tax effect (39.225%)
(1)
|
(0.13
|
)
|
(0.17
|
)
|
0.03
|
0.02
|
0.41
|
|||||||||||||
|
Net nonrecurring items
|
0.18
|
0.27
|
(0.05
|
)
|
(0.02
|
)
|
(0.64
|
)
|
||||||||||||
|
Diluted core earnings per share (non-GAAP)
|
$
|
2.29
|
$
|
1.69
|
$
|
1.59
|
$
|
1.45
|
$
|
1.51
|
||||||||||
|
(1)
|
For 2010, effective tax rate of 39.225%, adjusted for additional fair value deduction related to the donation of a closed branch with a fair value significantly higher than its book value.
|
50
Quarterly Results
Selected unaudited quarterly financial information for the last eight quarters is shown in table 22.
|
Table 22:
|
Quarterly Results
|
|
Quarter
|
||||||||||||||||||||
|
(In thousands, except per share data)
|
First
|
Second
|
Third
|
Fourth
|
Total
|
|||||||||||||||
|
2014
|
||||||||||||||||||||
|
Net interest income
|
$
|
41,545
|
$
|
40,428
|
$
|
41,772
|
$
|
47,319
|
$
|
171,064
|
||||||||||
|
Provision for loan losses
|
908
|
1,602
|
1,128
|
3,607
|
7,245
|
|||||||||||||||
|
Non-interest income
|
9,198
|
15,388
|
16,035
|
21,571
|
62,192
|
|||||||||||||||
|
Non-interest expense
|
44,551
|
39,842
|
44,354
|
46,974
|
175,721
|
|||||||||||||||
|
Net income
|
4,352
|
9,908
|
8,788
|
12,640
|
35,688
|
|||||||||||||||
|
Basic earnings per share
|
0.27
|
0.60
|
0.52
|
0.72
|
2.11
|
|||||||||||||||
|
Diluted earnings per share
|
0.27
|
0.60
|
0.52
|
0.72
|
2.11
|
|||||||||||||||
|
2013
|
||||||||||||||||||||
|
Net interest income
|
$
|
30,075
|
$
|
29,582
|
$
|
31,564
|
$
|
39,629
|
$
|
130,850
|
||||||||||
|
Provision for loan losses
|
919
|
1,034
|
1,081
|
1,084
|
4,118
|
|||||||||||||||
|
Non-interest income
|
11,313
|
11,273
|
10,313
|
7,717
|
40,616
|
|||||||||||||||
|
Non-interest expense
|
31,912
|
30,319
|
30,903
|
41,678
|
134,812
|
|||||||||||||||
|
Net income
|
5,937
|
6,576
|
6,932
|
3,786
|
23,231
|
|||||||||||||||
|
Basic earnings per share
|
0.36
|
0.40
|
0.43
|
0.23
|
1.42
|
|||||||||||||||
|
Diluted earnings per share
|
0.36
|
0.40
|
0.43
|
0.23
|
1.42
|
|||||||||||||||
|
ITEM
7A.
|
QUANTITATIVE AND QUALITATIVE DISCLOSURES ABOUT MARKET RISK
|
Liquidity and Market Risk Management
Parent Company
The Company has leveraged its investment in Simmons Bank, its subsidiary bank, and depends upon the dividends paid to it, as the sole shareholder of the subsidiary bank, as a principal source of funds for dividends to shareholders, stock repurchases and debt service requirements. At December 31, 2014, undivided profits of Simmons Bank were approximately $198.9 million, of which approximately $10.0 million was available for the payment of dividends to the Company without regulatory approval. In addition to dividends, other sources of liquidity for the Company are the sale of equity securities and the borrowing of funds.
Subsidiary Bank
Generally speaking, the Company's subsidiary bank, Simmons Bank, relies upon net inflows of cash from financing activities, supplemented by net inflows of cash from operating activities, to provide cash used in investing activities. Typical of most banking companies, significant financing activities include: deposit gathering; use of short-term borrowing facilities, such as federal funds purchased and repurchase agreements; and the issuance of long-term debt. The subsidiary bank’s primary investing activities include loan originations and purchases of investment securities, offset by loan payoffs and investment maturities.
Liquidity represents an institution's ability to provide funds to satisfy demands from depositors and borrowers by either converting assets into cash or accessing new or existing sources of incremental funds. A major responsibility of management is to maximize net interest income within prudent liquidity constraints. Internal corporate guidelines have been established to constantly measure liquid assets as well as relevant ratios concerning earning asset levels and purchased funds. The management and board of directors of the subsidiary bank monitor these same indicators and make adjustments as needed.
51
At December 31, 2014, after consolidation of our subsidiary banks, Simmons Bank and total corporate liquidity remains strong.
Liquidity Management
The objective of our liquidity management is to access adequate sources of funding to ensure that cash flow requirements of depositors and borrowers are met in an orderly and timely manner. Sources of liquidity are managed so that reliance on any one funding source is kept to a minimum. Our liquidity sources are prioritized for both availability and time to activation.
Our liquidity is a primary consideration in determining funding needs and is an integral part of asset/liability management. Pricing of the liability side is a major component of interest margin and spread management. Adequate liquidity is a necessity in addressing this critical task. There are five primary and secondary sources of liquidity available to the Company. The particular liquidity need and timeframe determine the use of these sources.
The first source of liquidity available to the Company is Federal funds. Federal funds, primarily from downstream correspondent banks, are available on a daily basis and are used to meet the normal fluctuations of a dynamic balance sheet. In addition, the Company and the Bank have approximately $81 million in Federal funds lines of credit from upstream correspondent banks that can be accessed, when needed. In order to ensure availability of these upstream funds, we have a plan for rotating the usage of the funds among the upstream correspondent banks, thereby providing approximately $40 million in funds on a given day. Historical monitoring of these funds has made it possible for us to project seasonal fluctuations and structure our funding requirements on a month-to-month basis.
A second source of liquidity is the retail deposits available through our network of financial centers throughout Arkansas, Kansas and Missouri. Although this method can be a somewhat more expensive alternative to supplying liquidity, this source can be used to meet intermediate term liquidity needs.
Third, Simmons Bank has lines of credits available with the Federal Home Loan Bank. While we use portions of those lines to match off longer-term mortgage loans, we also use those lines to meet liquidity needs. Approximately $701 million of these lines of credit are currently available, if needed.
Fourth, we use a laddered investment portfolio that ensures there is a steady source of intermediate term liquidity. These funds can be used to meet seasonal loan patterns and other intermediate term balance sheet fluctuations. Approximately 28% of the investment portfolio is classified as available-for-sale. We also use securities held in the securities portfolio to pledge when obtaining public funds.
Fifth, we have a network of correspondent banks from which we can access debt to meet liquidity needs, as was demonstrated by the $46 million of unsecured debt issued in the fourth quarter of 2013 for partial funding of the Metropolitan acquisition.
Finally, we have the ability to access large deposits from both the public and private sector to fund short-term liquidity needs.
We believe the various sources available are ample liquidity to satisfy our current short-term, intermediate-term and long-term operations.
Market Risk Management
Market risk arises from changes in interest rates. We have risk management policies to monitor and limit exposure to market risk. In asset and liability management activities, policies designed to minimize structural interest rate risk are in place. The measurement of market risk associated with financial instruments is meaningful only when all related and offsetting on- and off-balance-sheet transactions are aggregated, and the resulting net positions are identified.
52
Interest Rate Sensitivity
Interest rate risk represents the potential impact of interest rate changes on net income and capital resulting from mismatches in repricing opportunities of assets and liabilities over a period of time. A number of tools are used to monitor and manage interest rate risk, including simulation models and interest sensitivity gap analysis. Management uses simulation models to estimate the effects of changing interest rates and various balance sheet strategies on the level of the Company’s net income and capital. As a means of limiting interest rate risk to an acceptable level, management may alter the mix of floating and fixed-rate assets and liabilities, change pricing schedules and manage investment maturities during future security purchases.
The simulation model incorporates management’s assumptions regarding the level of interest rates or balance changes for indeterminate maturity deposits for a given level of market rate changes. These assumptions have been developed through anticipated pricing behavior. Key assumptions in the simulation models include the relative timing of prepayments, cash flows and maturities. These assumptions are inherently uncertain and, as a result, the model cannot precisely estimate net interest income or precisely predict the impact of a change in interest rates on net income or capital. Actual results will differ from simulated results due to the timing, magnitude and frequency of interest rate changes and changes in market conditions and management strategies, among other factors.
As of December 31, 2014, the model simulations projected that 100 and 200 basis point increases in interest rates would result in positive variances in net interest income of 0.60% and 1.31%, respectively, relative to the base case over the next 12 months, while decreases in interest rates of 100 basis points would result in a negative variance in net interest income of -9.03% relative to the base case over the next 12 months. The likelihood of a decrease in interest rates in excess of 50 basis points as of December 31, 2014 is considered remote given current interest rate levels. These are good faith estimates and assume that the composition of our interest sensitive assets and liabilities existing at each year-end will remain constant over the relevant twelve month measurement period and that changes in market interest rates are instantaneous and sustained across the yield curve regardless of duration of pricing characteristics of specific assets or liabilities. Also, this analysis does not contemplate any actions that we might undertake in response to changes in market interest rates. We believe these estimates are not necessarily indicative of what actually could occur in the event of immediate interest rate increases or decreases of this magnitude. As interest-bearing assets and liabilities reprice in different time frames and proportions to market interest rate movements, various assumptions must be made based on historical relationships of these variables in reaching any conclusion. Since these correlations are based on competitive and market conditions, we anticipate that our future results will likely be different from the foregoing estimates, and such differences could be material.
The table below presents our sensitivity to net interest income at December 31, 2014.
|
Table 23:
|
Net Interest Income Sensitivity
|
|
Interest Rate Scenario
|
% Change from Base
|
|||
|
Up 200 basis points
|
1.31 | % | ||
|
Up 100 basis points
|
0.60 | % | ||
|
Down 100 basis points
|
-9.03 | % | ||
53
|
ITEM
8.
|
CONSOLIDATED FINANCIAL STATEMENTS AND SUPPLEMENTARY DATA
|
INDEX
|
Report of Independent Registered Public Accounting Firm
|
|
|
Note:
|
Supplementary Data may be found in Item 7 “Management’s Discussion and Analysis of Financial Condition and Results of Operations – Quarterly Results” on page 51 hereof.
|
54
Management’s
Report on Internal Control Over Financial Reporting
The management of Simmons First National Corporation (the “Company”) is responsible for establishing and maintaining adequate internal control over financial reporting. The Company’s internal control over financial reporting is a process designed under the supervision of the Company’s Chief Executive Officer and Chief Financial Officer to provide reasonable assurance regarding the reliability of financial reporting and the preparation of the Company’s financial statements for external purposes in accordance with generally accepted accounting principles.
As of December 31, 2014, management assessed the effectiveness of the Company’s internal control over financial reporting based on the criteria for effective internal control over financial reporting established in
Internal Control - Integrated Framework (1992 edition) issued by the Committee of Sponsoring Organizations of the Treadway Commission (COSO)
. This assessment excluded internal control over financial reporting for the operations of Delta Trust & Bank (“Delta Trust”) of Little Rock, Arkansas, as allowed by the SEC for current year acquisitions. Delta Trust was acquired on August 31, 2014 and represented 9.6% of assets at December 31, 2014 and its banking operations represented 3.2% of total consolidated revenue for the year ended December 31, 2014. Based on this assessment, management determined that the Company maintained effective internal control over financial reporting as of December 31, 2014, based on the specified criteria.
BKD, LLP, the independent registered public accounting firm that audited the consolidated financial statements of the Company included in this Annual Report on Form 10-K, has issued an attestation report on the effectiveness of the Company’s internal control over financial reporting as of December 31, 2014. The report, which expresses an unqualified opinion on the effectiveness of the Company’s internal control over financial reporting as of December 31, 2014, immediately follows.
55
REPORT
OF INDEPENDENT REGISTERED PUBLIC ACCOUNTING FIRM
Audit Committee, Board of Directors and Stockholders
Simmons First National Corporation
Pine Bluff, Arkansas
We have audited Simmons First National Corporation’s internal control over financial reporting as of December 31, 2014, based on criteria established in
Internal Control-Integrated Framework (1992 edition) issued by the Committee of Sponsoring Organizations of the Treadway Commission (COSO)
. The Company’s management is responsible for maintaining effective internal control over financial reporting and for its assessment of the effectiveness of internal control over financial reporting, included in the accompanying
Management’s Report on Internal Control over Financial Reporting
. Our responsibility is to express an opinion on the Company’s internal control over financial reporting based on our audit.
We conducted our audit in accordance with the standards of the Public Company Accounting Oversight Board (United States). Those standards require that we plan and perform the audit to obtain reasonable assurance about whether effective internal control over financial reporting was maintained in all material respects. Our audit included obtaining an understanding of internal control over financial reporting, assessing the risk that a material weakness exists and testing and evaluating the design and operating effectiveness of internal control based on the assessed risk. Our audit also included performing such other procedures as we considered necessary in the circumstances. We believe that our audit provides a reasonable basis for our opinion.
A company’s internal control over financial reporting is a process designed to provide reasonable assurance regarding the reliability of financial reporting and the preparation of financial statements for external purposes in accordance with generally accepted accounting principles. A company’s internal control over financial reporting includes those policies and procedures that (1) pertain to the maintenance of records that, in reasonable detail, accurately and fairly reflect the transactions and dispositions of the assets of the company; (2) provide reasonable assurance that transactions are recorded as necessary to permit preparation of financial statements in accordance with generally accepted accounting principles, and that receipts and expenditures of the company are being made only in accordance with authorizations of management and directors of the company; and (3) provide reasonable assurance regarding prevention or timely detection of unauthorized acquisition, use or disposition of the company’s assets that could have a material effect on the financial statements.
Because of its inherent limitations, internal control over financial reporting may not prevent or detect misstatements. Also, projections of any evaluation of effectiveness to future periods are subject to the risk that controls may become inadequate because of changes in conditions or that the degree of compliance with the policies or procedures may deteriorate.
As permitted, the Company excluded the operations of Delta Trust & Bank of Little Rock, Arkansas, a financial institution acquired on August 31, 2014, from the scope of management's report on internal control over financial reporting. As such, this entity has also been excluded from the scope of our audit of internal control over financial reporting.
In our opinion, Simmons First National Corporation maintained, in all material respects, effective internal control over financial reporting as of December 31, 2014, based on criteria established in
Internal Control-Integrated Framework (1992 edition) issued by the Committee of Sponsoring Organizations of the Treadway Commission (COSO).
We have also audited, in accordance with the standards of the Public Company Accounting Oversight Board (United States), the consolidated financial statements of Simmons First National Corporation and our report dated March 16, 2015, expressed an unqualified opinion thereon.
|
BKD, LLP
/s/ BKD, LLP
|
Pine Bluff, Arkansas
March 16, 2015
56
REPORT
OF INDEPENDENT REGISTERED PUBLIC ACCOUNTING FIRM
Audit Committee, Board of Directors and Stockholders
Simmons First National Corporation
Pine Bluff, Arkansas
We have audited the accompanying consolidated balance sheets of Simmons First National Corporation as of December 31, 2014, and 2013, and the related consolidated statements of income, comprehensive income, cash flows, and stockholders’ equity for each of the years in the three-year period ended December 31, 2014. The Company’s management is responsible for these financial statements. Our responsibility is to express an opinion on these financial statements based on our audits.
We conducted our audits in accordance with the standards of the Public Company Accounting Oversight Board (United States). Those standards require that we plan and perform the audits to obtain reasonable assurance about whether the financial statements are free of material misstatement. Our audits included examining, on a test basis, evidence supporting the amounts and disclosures in the financial statements, assessing the accounting principles used and significant estimates made by management and evaluating the overall financial statement presentation. We believe that our audits provide a reasonable basis for our opinion.
In our opinion, the consolidated financial statements referred to above present fairly, in all material respects, the financial position of Simmons First National Corporation as of December 31, 2014, and 2013, and the results of its operations and its cash flows for each of the years in the three-year period ended December 31, 2014, in conformity with accounting principles generally accepted in the United States of America.
We have also audited, in accordance with the standards of the Public Company Accounting Oversight Board (United States), Simmons First National Corporation’s internal control over financial reporting as of December 31, 2014, based on criteria established in
Internal Control-Integrated Framework (1992 edition) issued by the Committee of Sponsoring Organizations of the Treadway Commission (COSO)
and our report dated March 16, 2015, expressed an unqualified opinion on the effectiveness of the Company’s internal control over financial reporting.
|
BKD, LLP
/s/ BKD, LLP
|
Pine Bluff, Arkansas
March 16, 2015
57
Simmons
First National Corporation
December 31, 2014 and 2013
|
(In thousands, except share data)
|
2014
|
2013
|
||||||
|
ASSETS
|
||||||||
|
Cash and non-interest bearing balances due from banks
|
$
|
54,347
|
$
|
69,827
|
||||
|
Interest bearing balances due from banks
|
281,562
|
469,553
|
||||||
|
Cash and cash equivalents
|
335,909
|
539,380
|
||||||
|
Investment securities
|
1,082,870
|
957,965
|
||||||
|
Mortgage loans held for sale
|
21,265
|
9,494
|
||||||
|
Assets held in trading accounts
|
6,987
|
8,978
|
||||||
|
Loans:
|
||||||||
|
Legacy loans
|
2,053,721
|
1,742,638
|
||||||
|
Allowance for loan losses
|
(29,028
|
)
|
(27,442
|
)
|
||||
|
Loans acquired, not covered by FDIC loss share (net of discount)
|
575,980
|
515,644
|
||||||
|
Loans acquired, covered by FDIC loss share (net of discount and allowance)
|
106,933
|
146,653
|
||||||
|
Net loans
|
2,707,606
|
2,377,493
|
||||||
|
FDIC indemnification asset
|
22,663
|
48,791
|
||||||
|
Premises and equipment
|
122,246
|
119,614
|
||||||
|
Premises held for sale
|
6,846
|
19,466
|
||||||
|
Foreclosed assets not covered by FDIC loss share
|
44,856
|
64,820
|
||||||
|
Foreclosed assets covered by FDIC loss share
|
11,793
|
20,585
|
||||||
|
Interest receivable
|
16,774
|
15,654
|
||||||
|
Bank owned life insurance
|
77,592
|
60,384
|
||||||
|
Goodwill
|
108,095
|
78,529
|
||||||
|
Other intangible assets
|
22,526
|
14,972
|
||||||
|
Other assets
|
55,326
|
46,975
|
||||||
|
Total assets
|
$
|
4,643,354
|
$
|
4,383,100
|
||||
|
LIABILITIES AND STOCKHOLDERS’ EQUITY
|
||||||||
|
Deposits:
|
||||||||
|
Non-interest bearing transaction accounts
|
$
|
889,260
|
$
|
718,438
|
||||
|
Interest bearing transaction accounts and savings deposits
|
2,006,271
|
1,862,618
|
||||||
|
Time deposits
|
965,187
|
1,116,511
|
||||||
|
Total deposits
|
3,860,718
|
3,697,567
|
||||||
|
Federal funds purchased and securities sold under agreements to repurchase
|
110,586
|
107,887
|
||||||
|
Other borrowings
|
114,682
|
117,090
|
||||||
|
Subordinated debentures
|
20,620
|
20,620
|
||||||
|
Accrued interest and other liabilities
|
42,429
|
36,104
|
||||||
|
Total liabilities
|
4,149,035
|
3,979,268
|
||||||
|
Stockholders’ equity:
|
||||||||
|
Preferred stock, $0.01 par value; 40,040,000 shares authorized and unissued at December 31,
2014 and 2013
|
-
|
-
|
||||||
|
Common stock, Class A, $0.01 par value; 60,000,000 shares authorized; 18,052,488 and 16,226,256 shares issued and outstanding at December 31, 2014 and 2013, respectively
|
181
|
162
|
||||||
|
Surplus
|
156,568
|
88,095
|
||||||
|
Undivided profits
|
338,906
|
318,577
|
||||||
|
Accumulated other comprehensive loss
|
(1,336
|
)
|
(3,002
|
)
|
||||
|
Total stockholders’ equity
|
494,319
|
403,832
|
||||||
|
Total liabilities and stockholders’ equity
|
$
|
4,643,354
|
$
|
4,383,100
|
||||
See Notes to Consolidated Financial Statements.
58
Simmons
First National Corporation
Years Ended December 31, 2014, 2013 and 2012
|
(In thousands, except per share data)
|
2014
|
2013
|
2012
|
|||||||||
|
INTEREST INCOME
|
||||||||||||
|
Loans
|
$
|
164,082
|
$
|
128,171
|
$
|
114,501
|
||||||
|
Federal funds sold
|
27
|
19
|
7
|
|||||||||
|
Investment securities
|
19,357
|
13,300
|
12,721
|
|||||||||
|
Mortgage loans held for sale
|
695
|
467
|
637
|
|||||||||
|
Assets held in trading accounts
|
17
|
29
|
48
|
|||||||||
|
Interest bearing balances due from banks
|
857
|
1,127
|
1,220
|
|||||||||
|
TOTAL INTEREST INCOME
|
185,035
|
143,113
|
129,134
|
|||||||||
|
INTEREST EXPENSE
|
||||||||||||
|
Deposits
|
9,079
|
8,399
|
10,625
|
|||||||||
|
Federal funds purchased and securities sold under agreements to repurchase
|
269
|
219
|
310
|
|||||||||
|
Other borrowings
|
3,986
|
3,001
|
3,354
|
|||||||||
|
Subordinated debentures
|
637
|
644
|
1,328
|
|||||||||
|
TOTAL INTEREST EXPENSE
|
13,971
|
12,263
|
15,617
|
|||||||||
|
NET INTEREST INCOME
|
171,064
|
130,850
|
113,517
|
|||||||||
|
Provision for loan losses
|
7,245
|
4,118
|
4,140
|
|||||||||
|
NET INTEREST INCOME AFTER PROVISION FOR LOAN LOSSES
|
163,819
|
126,732
|
109,377
|
|||||||||
|
NON-INTEREST INCOME
|
||||||||||||
|
Trust income
|
7,111
|
5,842
|
5,473
|
|||||||||
|
Service charges on deposit accounts
|
25,650
|
18,815
|
16,808
|
|||||||||
|
Other service charges and fees
|
3,574
|
2,997
|
2,961
|
|||||||||
|
Mortgage lending income
|
5,342
|
4,592
|
5,997
|
|||||||||
|
Investment banking income
|
1,070
|
1,811
|
2,038
|
|||||||||
|
Debit and credit card fees
|
22,866
|
17,833
|
17,045
|
|||||||||
|
Bank owned life insurance income
|
1,843
|
1,319
|
1,463
|
|||||||||
|
Gain (loss) on sale of securities, net
|
8
|
(151
|
)
|
2
|
||||||||
|
Gain on FDIC-assisted transactions
|
-
|
-
|
3,411
|
|||||||||
|
Net (loss) gain on assets covered by FDIC loss share agreements
|
(20,316
|
)
|
(16,188
|
)
|
(9,793
|
)
|
||||||
|
Other income
|
15,044
|
3,746
|
2,966
|
|||||||||
|
TOTAL NON-INTEREST INCOME
|
62,192
|
40,616
|
48,371
|
|||||||||
|
NON-INTEREST EXPENSE
|
||||||||||||
|
Salaries and employee benefits
|
89,210
|
74,078
|
66,999
|
|||||||||
|
Occupancy expense, net
|
12,833
|
10,034
|
8,603
|
|||||||||
|
Furniture and equipment expense
|
9,325
|
7,623
|
6,882
|
|||||||||
|
Other real estate and foreclosure expense
|
4,507
|
1,337
|
992
|
|||||||||
|
Deposit insurance
|
3,354
|
2,482
|
2,086
|
|||||||||
|
Merger related costs
|
7,470
|
6,376
|
1,896
|
|||||||||
|
Other operating expenses
|
49,022
|
32,882
|
30,275
|
|||||||||
|
TOTAL NON-INTEREST EXPENSE
|
175,721
|
134,812
|
117,733
|
|||||||||
|
INCOME BEFORE INCOME TAXES
|
50,290
|
32,536
|
40,015
|
|||||||||
|
Provision for income taxes
|
14,602
|
9,305
|
12,331
|
|||||||||
|
NET INCOME
|
$
|
35,688
|
$
|
23,231
|
$
|
27,684
|
||||||
|
BASIC EARNINGS PER SHARE
|
$
|
2.11
|
$
|
1.42
|
$
|
1.64
|
||||||
|
DILUTED EARNINGS PER SHARE
|
$
|
2.11
|
$
|
1.42
|
$
|
1.64
|
||||||
See Notes to Consolidated Financial Statements.
Consolidated Statements of Comprehensive Income
Years Ended December 31, 2014, 2013 and 2012
|
(In thousands)
|
2014
|
2013
|
2012
|
|||||||||
|
NET INCOME
|
$
|
35,688
|
$
|
23,231
|
$
|
27,684
|
||||||
|
OTHER COMPREHENSIVE INCOME
|
||||||||||||
|
Unrealized holding gains (losses) arising during the period on available-for-sale securities
|
2,749
|
(5,513
|
)
|
(297
|
)
|
|||||||
|
Less: Reclassification adjustment for realized gains (losses) included in net income
|
8
|
(151
|
)
|
2
|
||||||||
|
Other comprehensive income (loss), before tax effect
|
2,741
|
(5,362
|
)
|
(299
|
)
|
|||||||
|
Less: Tax effect of other comprehensive income (loss)
|
1,075
|
(2,103
|
)
|
(117
|
)
|
|||||||
|
TOTAL OTHER COMPREHENSIVE INCOME (LOSS)
|
1,666
|
(3,259
|
)
|
(182
|
)
|
|||||||
|
COMPREHENSIVE INCOME
|
$
|
37,354
|
$
|
19,972
|
$
|
27,502
|
||||||
See Notes to Consolidated Financial Statements.
60
Simmons
First National Corporation
Years Ended December 31, 2014, 2013 and 2012
|
(In thousands)
|
2014
|
2013
|
2012
|
|||||||||
|
OPERATING ACTIVITIES
|
||||||||||||
|
Net income
|
$
|
35,688
|
$
|
23,231
|
$
|
27,684
|
||||||
|
Items not requiring (providing) cash:
|
||||||||||||
|
Depreciation and amortization
|
7,933
|
6,127
|
5,516
|
|||||||||
|
Provision for loan losses
|
7,245
|
4,118
|
4,140
|
|||||||||
|
(Gain) loss on sale of investment securities
|
(8
|
)
|
151
|
(2
|
)
|
|||||||
|
Net accretion of investment securities and assets not covered by FDIC loss share
|
(8,711
|
)
|
(1,233
|
)
|
(283
|
)
|
||||||
|
Stock-based compensation expense
|
1,423
|
1,417
|
1,388
|
|||||||||
|
Net accretion on assets covered by FDIC loss share
|
(1,497
|
)
|
(5,878
|
)
|
(2,807
|
)
|
||||||
|
Gain on FDIC-assisted transactions
|
-
|
-
|
(3,411
|
)
|
||||||||
|
Gain on sale of premises and equipment, net of impairment
|
(
4,630
|
)
|
-
|
-
|
||||||||
|
Deferred income taxes
|
(9,029
|
)
|
(4,618
|
)
|
485
|
|||||||
|
Bank owned life insurance income
|
(1,843
|
)
|
(1,319
|
)
|
(1,463
|
)
|
||||||
|
Changes in:
|
||||||||||||
|
Interest receivable
|
359
|
(1,097
|
)
|
596
|
||||||||
|
Mortgage loans held for sale
|
(11,771
|
)
|
15,873
|
(2,391
|
)
|
|||||||
|
Assets held in trading accounts
|
1,991
|
(2,754
|
)
|
1,317
|
||||||||
|
Other assets
|
(17,313
|
)
|
6,047
|
1,961
|
||||||||
|
Accrued interest and other liabilities
|
6,511
|
(3,032
|
)
|
3,054
|
||||||||
|
Income taxes payable
|
5,272
|
(944
|
)
|
298
|
||||||||
|
Net cash provided by operating activities
|
11,620
|
36,089
|
36,082
|
|||||||||
|
INVESTING ACTIVITIES
|
||||||||||||
|
Net (originations) collections of loans
|
(83,825
|
)
|
(90,977
|
)
|
(48,502
|
)
|
||||||
|
Net collections of loans covered by FDIC loss share
|
55,361
|
78,305
|
83,460
|
|||||||||
|
Proceeds from sale of student loans
|
22,136
|
-
|
-
|
|||||||||
|
Proceeds from sale of premises held for sale
|
30,055
|
-
|
-
|
|||||||||
|
Purchases of premises and equipment, net
|
(
11,293
|
)
|
(4,772
|
)
|
(2,268
|
)
|
||||||
|
Proceeds from sale of foreclosed assets held for sale
|
26,900
|
18,832
|
8,322
|
|||||||||
|
Proceeds from sale of foreclosed assets held for sale, covered by FDIC loss share
|
14,328
|
16,274
|
14,560
|
|||||||||
|
Proceeds from sale of available-for-sale securities
|
20,609
|
44,662
|
2,576
|
|||||||||
|
Proceeds from maturities of available-for-sale securities
|
194,423
|
165,606
|
347,205
|
|||||||||
|
Purchases of available-for-sale securities
|
(265,835
|
)
|
(89,986
|
)
|
(336,924
|
)
|
||||||
|
Proceeds from maturities of held-to-maturity securities
|
403,186
|
112,359
|
713,362
|
|||||||||
|
Purchases of held-to-maturity securities
|
(413,020
|
)
|
(273,924
|
)
|
(683,820
|
)
|
||||||
|
Purchases of bank owned life insurance
|
(7,826
|
)
|
(7,000
|
)
|
(25
|
)
|
||||||
|
Net cash proceeds received in FDIC-assisted transactions
|
-
|
-
|
76,586
|
|||||||||
|
Cash received on FDIC loss share
|
15,700
|
14,530
|
12,471
|
|||||||||
|
Purchases of credit card loans
|
-
|
(10,999
|
)
|
-
|
||||||||
|
Cash paid in business combinations, net of cash received
|
11,343
|
35,485
|
-
|
|||||||||
|
Net cash provided by investing activities
|
12,242
|
8,395
|
187,003
|
|||||||||
|
FINANCING ACTIVITIES
|
||||||||||||
|
Net change in deposits
|
(192,211
|
)
|
(14,103
|
)
|
(173,379
|
)
|
||||||
|
Dividends paid
|
(15,359
|
)
|
(13,707
|
)
|
(13,495
|
)
|
||||||
|
Net change in other borrowed funds
|
(13,385
|
)
|
(8,988
|
)
|
(8,922
|
)
|
||||||
|
Repayment of subordinated debentures
|
-
|
-
|
(10,310
|
)
|
||||||||
|
Net change in fed funds purchased and securities sold under agreements to repurchase
|
(8,401
|
)
|
3,809
|
(32,144
|
)
|
|||||||
|
Net shares issued under stock compensation plans
|
2,023
|
936
|
323
|
|||||||||
|
Repurchase of common stock
|
-
|
(10,848
|
)
|
(17,567
|
)
|
|||||||
|
Net cash used in financing activities
|
(227,333
|
)
|
(42,901
|
)
|
(255,494
|
)
|
||||||
|
(DECREASE) INCREASE IN CASH EQUIVALENTS
|
(203,471
|
)
|
1,583
|
(32,409
|
)
|
|||||||
|
CASH AND CASH EQUIVALENTS, BEGINNING OF YEAR
|
539,380
|
537,797
|
570,206
|
|||||||||
|
CASH AND CASH EQUIVALENTS, END OF YEAR
|
$
|
335,909
|
$
|
539,380
|
$
|
537,797
|
||||||
See Notes to Consolidated Financial Statements.
Consolidated Statements of Stockholders’ Equity
Years Ended December 31, 2014, 2013 and 2012
|
(In thousands, except share data)
|
Common
Stock
|
Surplus
|
Accumulated
Other
Comprehensive
Income (Loss)
|
Undivided
Profits
|
Total
|
|||||||||||||||
|
Balance, December 31, 2011
|
$
|
172
|
$
|
112,436
|
$
|
439
|
$
|
294,864
|
$
|
407,911
|
||||||||||
|
Comprehensive income:
|
||||||||||||||||||||
|
Net income
|
-
|
-
|
-
|
27,684
|
27,684
|
|||||||||||||||
|
Change in unrealized appreciation on available-for-sale securities, net of income taxes of ($117)
|
-
|
-
|
(182
|
)
|
-
|
(182
|
)
|
|||||||||||||
|
Comprehensive income
|
27,502
|
|||||||||||||||||||
|
Stock issued as bonus shares – 51,245 shares
|
-
|
191
|
-
|
-
|
191
|
|||||||||||||||
|
Vesting bonus shares
|
-
|
1,305
|
-
|
-
|
1,305
|
|||||||||||||||
|
Stock issued for employee stock purchase plan – 5,103 shares
|
-
|
132
|
-
|
-
|
132
|
|||||||||||||||
|
Stock granted under stock-based compensation plans
|
-
|
83
|
-
|
-
|
83
|
|||||||||||||||
|
Repurchase of common stock – (725,887 shares)
|
(7
|
)
|
(17,560
|
)
|
-
|
-
|
(17,567
|
)
|
||||||||||||
|
Cash dividends – $0.80 per share
|
-
|
-
|
-
|
(13,495
|
)
|
(13,495
|
)
|
|||||||||||||
|
Balance, December 31, 2012
|
165
|
96,587
|
257
|
309,053
|
406,062
|
|||||||||||||||
|
Comprehensive income:
|
||||||||||||||||||||
|
Net income
|
-
|
-
|
-
|
23,231
|
23,231
|
|||||||||||||||
|
Change in unrealized appreciation on available-for-sale securities, net of income taxes of ($2,103)
|
-
|
-
|
(3,259
|
)
|
-
|
(3,259
|
)
|
|||||||||||||
|
Comprehensive income
|
19,972
|
|||||||||||||||||||
|
Stock issued as bonus shares – 75,006 shares
|
1
|
228
|
-
|
-
|
229
|
|||||||||||||||
|
Vesting bonus shares, net of forfeitures – (829 shares)
|
-
|
1,390
|
-
|
-
|
1,390
|
|||||||||||||||
|
Stock issued for employee stock purchase plan – 5,244 shares
|
-
|
126
|
-
|
-
|
126
|
|||||||||||||||
|
Exercise of stock options – 24,290 shares
|
-
|
604
|
-
|
-
|
604
|
|||||||||||||||
|
Stock granted under stock-based compensation plans
|
-
|
27
|
-
|
-
|
27
|
|||||||||||||||
|
Securities exchanged under stock option plan – (669 shares)
|
-
|
(23
|
)
|
-
|
-
|
(23
|
)
|
|||||||||||||
|
Repurchase of common stock – (419,564 shares)
|
(4
|
)
|
(10,844
|
)
|
-
|
-
|
(10,848
|
)
|
||||||||||||
|
Cash dividends – $0.84 per share
|
-
|
-
|
-
|
(13,707
|
)
|
(13,707
|
)
|
|||||||||||||
|
Balance, December 31, 2013
|
162
|
88,095
|
(3,002
|
)
|
318,577
|
403,832
|
||||||||||||||
|
Comprehensive income:
|
||||||||||||||||||||
|
Net income
|
-
|
-
|
-
|
35,688
|
35,688
|
|||||||||||||||
|
Change in unrealized depreciation on available-for-sale securities, net of income taxes of $1,075
|
-
|
-
|
1,666
|
-
|
1,666
|
|||||||||||||||
|
Comprehensive income
|
37,354
|
|||||||||||||||||||
|
Stock issued as bonus shares – 133,880 shares
|
1
|
441
|
-
|
-
|
442
|
|||||||||||||||
|
Vesting bonus shares, net of forfeitures – (1,560 shares)
|
-
|
1,423
|
-
|
-
|
1,423
|
|||||||||||||||
|
Stock issued for employee stock purchase plan – 4,897 shares
|
-
|
118
|
-
|
-
|
118
|
|||||||||||||||
|
Exercise of stock options – 64,720 shares
|
2
|
1,674
|
-
|
-
|
1,676
|
|||||||||||||||
|
Securities exchanged under stock option plan – (5,220 shares)
|
-
|
(213
|
)
|
-
|
-
|
(213
|
)
|
|||||||||||||
|
Stock issued for Delta Trust & Bank acquisition – 1,629,515 shares
|
16
|
65,030
|
-
|
-
|
65,046
|
|||||||||||||||
|
Cash dividends – $0.88 per share
|
-
|
-
|
-
|
(15,359
|
)
|
(15,359
|
)
|
|||||||||||||
|
Balance, December 31, 2014
|
$
|
181
|
$
|
156,568
|
$
|
(1,336
|
)
|
$
|
338,906
|
$
|
494,319
|
|||||||||
See Notes to Consolidated Financial Statements.
62
Simmons
First National Corporation
Notes to Consolidated Financial Statements
|
NOTE 1:
|
NATURE OF OPERATIONS AND SUMMARY OF SIGNIFICANT ACCOUNTING POLICIES
|
Nature of Operations
Simmons First National Corporation (the “Company”) is primarily engaged in providing a full range of banking services to individual and corporate customers through its subsidiaries and their branch banks with offices in Arkansas, Missouri and Kansas. The Company is subject to competition from other financial institutions. The Company also is subject to the regulation of certain federal and state agencies and undergoes periodic examinations by those regulatory authorities.
Operating Segments
The Company consolidated its subsidiary banks in to one bank during 2014, and is organized on a regional basis upon which management makes decisions regarding how to allocate resources and assess performance. Each of the regions provides a group of similar community banking services, including such products and services as loans; time deposits, checking and savings accounts; personal and corporate trust services; credit cards; investment management; and securities and investment services. The individual regions have similar operating and economic characteristics and have been reported as one aggregated operating segment.
Use of Estimates
The preparation of financial statements in conformity with accounting principles generally accepted in the United States of America requires management to make estimates and assumptions that affect the reported amounts of assets and liabilities and disclosure of contingent assets and liabilities at the date of the financial statements and the reported amounts of revenues and expenses during the reporting period. Actual results could differ from those estimates.
Material estimates that are particularly susceptible to significant change relate to the determination of the allowance for loan losses, the valuation of real estate acquired in connection with foreclosures or in satisfaction of loans and the valuation of covered loans and related indemnification asset. In connection with the determination of the allowance for loan losses and the valuation of foreclosed assets, management obtains independent appraisals for significant properties.
Principles of Consolidation
The consolidated financial statements include the accounts of Simmons First National Corporation and its subsidiaries. Significant intercompany accounts and transactions have been eliminated in consolidation.
Reclassifications
Various items within the accompanying consolidated financial statements for previous years have been reclassified to provide more comparative information. These reclassifications had no effect on net earnings.
Cash Equivalents
The Company considers all liquid investments with original maturities of three months or less to be cash equivalents. For purposes of the consolidated statements of cash flows, cash and cash equivalents are considered to include cash and non-interest bearing balances due from banks, interest bearing balances due from banks and federal funds sold and securities purchased under agreements to resell.
Investment Securities
Held-to-maturity securities, which include any security for which the Company has the positive intent and ability to hold until maturity, are carried at historical cost adjusted for amortization of premiums and accretion of discounts. Premiums and discounts are amortized and accreted, respectively, to interest income using the constant yield method over the period to maturity.
63
Available-for-sale securities, which include any security for which the Company has no immediate plan to sell but which may be sold in the future, are carried at fair value. Realized gains and losses, based on specifically identified amortized cost of the individual security, are included in other income. Unrealized gains and losses are recorded, net of related income tax effects, in stockholders' equity. Premiums and discounts are amortized and accreted, respectively, to interest income using the constant yield method over the period to maturity.
Trading securities, which include any security held primarily for near-term sale, are carried at fair value. Gains and losses on trading securities are included in other income.
The Company applies accounting guidance related to recognition and presentation of other-than-temporary impairment under ASC Topic 320-10. When the Company does not intend to sell a debt security, and it is more likely than not, the Company will not have to sell the security before recovery of its cost basis, it recognizes the credit component of an other-than-temporary impairment of a debt security in earnings and the remaining portion in other comprehensive income. For held-to-maturity debt securities, the amount of an other-than-temporary impairment recorded in other comprehensive income for the noncredit portion of a previous other-than-temporary impairment is amortized prospectively over the remaining life of the security on the basis of the timing of future estimated cash flows of the security.
As a result of this guidance, the Company’s consolidated statements of income reflect the full impairment (that is, the difference between the security’s amortized cost basis and fair value) on debt securities that the Company intends to sell or would more likely than not be required to sell before the expected recovery of the amortized cost basis. For available-for-sale and held-to-maturity debt securities that management has no intent to sell and believes that it more likely than not will not be required to sell prior to recovery, only the credit loss component of the impairment is recognized in earnings, while the noncredit loss is recognized in accumulated other comprehensive income. The credit loss component recognized in earnings is identified as the amount of principal cash flows not expected to be received over the remaining term of the security as projected based on cash flow projections.
Mortgage Loans Held For Sale
Mortgage loans held for sale are carried at the lower of cost or fair value, determined using an aggregate basis. Write-downs to fair value are recognized as a charge to earnings at the time the decline in value occurs. Forward commitments to sell mortgage loans are acquired to reduce market risk on mortgage loans in the process of origination and mortgage loans held for sale. The forward commitments acquired by the Company for mortgage loans in process of origination are not mandatory forward commitments. These commitments are structured on a best efforts basis; therefore, the Company is not required to substitute another loan or to buy back the commitment if the original loan does not fund. Typically, the Company delivers the mortgage loans within a few days after the loans are funded. These commitments are derivative instruments and their fair values at December 31, 2014 and 2013 are not material. Gains and losses resulting from sales of mortgage loans are recognized when the respective loans are sold to investors. Gains and losses are determined by the difference between the selling price and the carrying amount of the loans sold, net of discounts collected or paid. Fees received from borrowers to guarantee the funding of mortgage loans held for sale are recognized as income or expense when the loans are sold or when it becomes evident that the commitment will not be used.
Loans
Loans that management has the intent and ability to hold for the foreseeable future or until maturity or pay-offs are reported at their outstanding principal adjusted for any loans charged off, the allowance for loan losses and any unamortized deferred fees or costs on originated loans and unamortized premiums or discounts on purchased loans.
For loans amortized at cost, interest income is accrued based on the unpaid principal balance. Loan origination fees, net of certain direct origination costs, as well as premiums and discounts, are deferred and amortized as a level yield adjustment over the respective term of the loan.
The accrual of interest on loans, except on certain government guaranteed loans, is discontinued at the time the loan is 90 days past due unless the credit is well-secured and in process of collection. Past due status is based on contractual terms of the loan. In all cases, loans are placed on nonaccrual or charged off at an earlier date if collection of principal or interest is considered doubtful.
Discounts and premiums on purchased residential real estate loans are amortized to income using the interest method over the remaining period to contractual maturity, adjusted for anticipated prepayments. Discounts and premiums on purchased consumer loans are recognized over the expected lives of the loans using methods that approximate the interest method.
64
For discussion of the Company’s accounting for acquired loans, see Acquisition Accounting, Covered Loans and Related Indemnification Asset later in this section.
Allowance for Loan Losses
The allowance for loan losses is management’s estimate of probable losses in the loan portfolio. Loan losses are charged against the allowance when management believes the uncollectability of a loan balance is confirmed. Subsequent recoveries, if any, are credited to the allowance.
Allocations to the allowance for loan losses are categorized as either general reserves or specific reserves.
The general reserve is calculated monthly based on management’s assessment of several factors such as (1) historical loss experience based on volumes and types, (2) volume and trends in delinquencies and nonaccruals, (3) lending policies and procedures including those for loan losses, collections and recoveries, (4) national, state and local economic trends and conditions, (5) concentrations of credit within the loan portfolio, (6) the experience, ability and depth of lending management and staff and (7) other factors and trends that will affect specific loans and categories of loans. The Company establishes general allocations for each major loan category and risk rating. This category also includes allocations to loans which are collectively evaluated for loss such as credit cards, one-to-four family owner occupied residential real estate loans and other consumer loans. General reserves have been established, based upon the aforementioned factors and allocated to the individual loan categories.
Specific reserves are provided on loans that are considered impaired when it is probable that we will not receive all amounts due according to the contractual terms of the loan, including scheduled principal and interest payments. This includes loans that are delinquent 90 days or more, nonaccrual loans and certain other loans identified by management. Certain other loans identified by management consist of performing loans where management expects that the Company will not receive all amounts due according to the contractual terms of the loan, including scheduled principal and interest payments. Specific reserves are accrued for probable losses on specific loans evaluated for impairment for which the basis of each loan, including accrued interest, exceeds the discounted amount of expected future collections of interest and principal or, alternatively, the fair value of loan collateral. Accrual of interest is discontinued and interest accrued and unpaid is removed at the time such amounts are delinquent 90 days unless management is aware of circumstances which warrant continuing the interest accrual. Interest is recognized for nonaccrual loans only upon receipt and only after all principal amounts are current according to the terms of the contract.
Prior to December 31, 2012, the Company measured the appropriateness of the allowance for loan losses in its entirety using (a)ASC 450-20 which includes quantitative (historical loss rates) and qualitative factors (management adjustment factors) such as (1) lending policies and procedures, (2) economic outlook and business conditions, (3) level and trend in delinquencies, (4) concentrations of credit and (5) external factors and competition; which were combined with the historical loss rates to create the baseline factors that were allocated to the various loan categories; (b) specific allocations on impaired loans in accordance with ASC 310-10; and (c) the unallocated amount.
The unallocated amount was evaluated on the loan portfolio in its entirety and was based on additional factors, such as (1) trends in volume, maturity and composition, (2) national, state and local economic trends and conditions, (3) the experience, ability and depth of lending management and staff and (4) other factors and trends that will affect specific loans and categories of loans, such as a heightened risk in agriculture, credit card and commercial real estate loan portfolios.
As of December 31, 2012, the Company refined its allowance calculation. As part of the refinement process, management evaluated the criteria previously applied to the entire loan portfolio, and used to calculate the unallocated portion of the allowance, and applied those criteria to each specific loan category. This included the impact of national, state and local economic trends, external factors and competition, economic outlook and business conditions and other factors and trends that will affect specific loans and categories of loans. As a result of the refined allowance calculation, the allocation of the Company’s allowance for loan losses may not be comparable with periods prior to December 31, 2012.
Management’s evaluation of the allowance for loan losses is inherently subjective as it requires material estimates. The actual amounts of loan losses realized in the near term could differ from the amounts estimated in arriving at the allowance for loan losses reported in the financial statements.
Reserve for Unfunded Commitments
In addition to the allowance for loan losses, the Company has established a reserve for unfunded commitments, classified in other liabilities. This reserve is maintained at a level sufficient to absorb losses arising from unfunded loan commitments. The adequacy of the reserve for unfunded commitments is determined monthly based on methodology similar to the Company’s methodology for determining the allowance for loan losses. Net adjustments to the reserve for unfunded commitments are included in other non-interest expense.
65
Acquisition Accounting, Acquired Loans
The Company accounts for its acquisitions under ASC Topic 805,
Business Combinations
, which requires the use of the purchase method of accounting. All identifiable assets acquired, including loans, are recorded at fair value. No allowance for loan losses related to the acquired loans is recorded on the acquisition date as the fair value of the loans acquired incorporates assumptions regarding credit risk. Loans acquired are recorded at fair value in accordance with the fair value methodology prescribed in ASC Topic 820, exclusive of the shared-loss agreements with the FDIC. The fair value estimates associated with the loans include estimates related to expected prepayments and the amount and timing of undiscounted expected principal, interest and other cash flows.
The Company evaluates loans acquired in accordance with the provisions of ASC Topic 310-20,
Nonrefundable Fees and Other Costs
. The fair value discount on these loans is accreted into interest income over the weighted average life of the loans using a constant yield method. These loans are not considered to be impaired loans. The Company evaluates purchased impaired loans in accordance with the provisions of ASC Topic 310-30, Loans and Debt Securities Acquired with Deteriorated Credit Quality. Purchased loans are considered impaired if there is evidence of credit deterioration since origination and if it is probable that not all contractually required payments will be collected.
The Company evaluates all of the loans purchased in conjunction with its FDIC-assisted transactions in accordance with the provisions of ASC Topic 310-30. All loans acquired in the FDIC transactions, both covered and not covered, were deemed to be impaired loans. All loans acquired, whether or not covered by FDIC loss share agreements, are considered impaired if there is evidence of credit deterioration since origination and if it is probable that not all contractually required payments will be collected.
For impaired loans accounted for under ASC Topic 310-30, the Company continues to estimate cash flows expected to be collected on pools of loans sharing common risk characteristics, which are treated in the aggregate when applying various valuation techniques. The Company evaluates at each balance sheet date whether the present value of our pools of loans determined using the effective interest rates has decreased significantly and if so, recognize a provision for loan loss in our consolidated statement of income. For any significant increases in cash flows expected to be collected, the Company adjusts the amount of accretable yield recognized on a prospective basis over the pool’s remaining life.
Covered Loans and Related Indemnification Asset
Because the FDIC will reimburse us for losses incurred on certain acquired loans, an indemnification asset is recorded at fair value at the acquisition date. The indemnification asset is recognized at the same time as the indemnified loans, and measured on the same basis, subject to collectability or contractual limitations. The shared-loss agreements on the acquisition date reflect the reimbursements expected to be received from the FDIC, using an appropriate discount rate, which reflects counterparty credit risk and other uncertainties.
The shared-loss agreements continue to be measured on the same basis as the related indemnified loans, as prescribed by ASC Topic 805. Deterioration in the credit quality of the loans (immediately recorded as an adjustment to the allowance for loan losses) would immediately increase the basis of the shared-loss agreements, with the offset recorded through the consolidated statement of income. Increases in the credit quality or cash flows of loans (reflected as an adjustment to yield and accreted into income over the remaining life of the loans) decrease the basis of the shared-loss agreements, with such decrease being accreted into income over 1) the same period or 2) the life of the shared-loss agreements, whichever is shorter. Loss assumptions used in the basis of the indemnified loans are consistent with the loss assumptions used to measure the indemnification asset. Fair value accounting incorporates into the fair value of the indemnification asset an element of the time value of money, which is accreted back into income over the life of the shared-loss agreements.
Upon the determination of an incurred loss the indemnification asset will be reduced by the amount owed by the FDIC. A corresponding, claim receivable is recorded until cash is received from the FDIC. For further discussion of our acquisition and loan accounting, see Note 2, Acquisitions, and Note 5, Loans Acquired.
Premises and Equipment
Depreciable assets are stated at cost less accumulated depreciation. Depreciation is charged to expense using the straight-line method over the estimated useful lives of the assets. Leasehold improvements are capitalized and amortized by the straight-line method over the terms of the respective leases or the estimated useful lives of the improvements, whichever is shorter.
66
Premises Held for Sale
The Company records premises held for sale at the lower of (1) cost less accumulated depreciation or (2) fair value less estimated selling expenses. These assets are assessed for impairment at the time they are reclassified as held for sale and periodically thereafter.
Foreclosed Assets Held For Sale
Assets acquired by foreclosure or in settlement of debt and held for sale are valued at estimated fair value as of the date of foreclosure, and a related valuation allowance is provided for estimated costs to sell the assets. Management evaluates the value of foreclosed assets held for sale periodically and increases the valuation allowance for any subsequent declines in fair value. Changes in the valuation allowance are charged or credited to other expense.
Goodwill and Intangible Assets
Goodwill represents the excess of the cost of an acquisition over the fair value of the net assets acquired. Other intangible assets represent purchased assets that also lack physical substance but can be separately distinguished from goodwill because of contractual or other legal rights or because the asset is capable of being sold or exchanged either on its own or in combination with a related contract, asset or liability. The Company performs an annual goodwill impairment test, and more frequently if circumstances warrant, in accordance with ASC Topic 350,
Intangibles – Goodwill and Other
. ASC Topic 350 requires that goodwill and intangible assets that have indefinite lives be reviewed for impairment annually, or more frequently if certain conditions occur. Intangible assets with finite lives are amortized over the estimated life of the asset, and are reviewed for impairment whenever events or changes in circumstances indicated that the carrying value may not be recoverable. Impairment losses, if any, will be recorded as operating expenses.
Derivative Financial Instruments
The Company may enter into derivative contracts for the purposes of managing exposure to interest rate risk to meet the financing needs of its customers. The Company records all derivatives on the balance sheet at fair value. Historically, the Company’s policy has been not to invest in derivative type investments, but, in an effort to meet the financing needs of its customers, the Company has entered into six fair value hedges. Fair value hedges include interest rate swap agreements on fixed rate loans. For derivatives designated as hedging the exposure to changes in the fair value of the hedged item, the gain or loss is recognized in earnings in the period of change together with the offsetting loss or gain of the hedging instrument. The fair value hedges are considered to be highly effective and any hedge ineffectiveness was deemed not material. The notional amount of the loans being hedged was $14.6 million at December 31, 2014, and $9.1 million at December 31, 2013.
Securities Sold Under Agreements to Repurchase
The Company sells securities under agreements to repurchase to meet customer needs for sweep accounts. At the point funds deposited by customers become investable, those funds are used to purchase securities owned by the Company and held in its general account with the designation of Customers’ Securities. A third party maintains control over the securities underlying overnight repurchase agreements. The securities involved in these transactions are generally U.S. Treasury or Federal Agency issues. Securities sold under agreements to repurchase generally mature on the banking day following that on which the investment was initially purchased and are treated as collateralized financing transactions which are recorded at the amounts at which the securities were sold plus accrued interest. Interest rates and maturity dates of the securities involved vary and are not intended to be matched with funds from customers.
Bankcard Fee Income
Periodic bankcard fees, net of direct origination costs, are recognized as revenue on a straight-line basis over the period the fee entitles the cardholder to use the card.
Income Taxes
The Company accounts for income taxes in accordance with income tax accounting guidance in ASC Topic 740,
Income Taxes
. The income tax accounting guidance results in two components of income tax expense: current and deferred. Current income tax expense reflects taxes to be paid or refunded for the current period by applying the provisions of the enacted tax law to the taxable income or excess of deductions over revenues. The Company determines deferred income taxes using the liability (or balance sheet) method. Under this method, the net deferred tax asset or liability is based on the tax effects of the differences between the book and tax bases of assets and liabilities, and enacted changes in tax rates and laws are recognized in the period in which they occur.
67
Deferred income tax expense results from changes in deferred tax assets and liabilities between periods. Deferred tax assets are recognized if it is more likely than not, based on the technical merits, that the tax position will be realized or sustained upon examination. The term more likely than not means a likelihood of more than 50 percent; the terms examined and upon examination also include resolution of the related appeals or litigation processes, if any. A tax position that meets the more-likely-than-not recognition threshold is initially and subsequently measured as the largest amount of tax benefit that has a greater than 50 percent likelihood of being realized upon settlement with a taxing authority that has full knowledge of all relevant information. The determination of whether or not a tax position has met the more-likely-than-not recognition threshold considers the facts, circumstances and information available at the reporting date and is subject to management’s judgment. Deferred tax assets are reduced by a valuation allowance if, based on the weight of evidence available, it is more likely than not that some portion or all of a deferred tax asset will not be realized.
The Company files consolidated income tax returns with its subsidiaries.
Earnings Per Share
Basic earnings per share are computed based on the weighted average number of shares outstanding during each year. Diluted earnings per share are computed using the weighted average common shares and all potential dilutive common shares outstanding during the period.
The computation of per share earnings is as follows:
|
(In thousands, except per share data)
|
2014
|
2013
|
2012
|
|||||||||
|
Net Income
|
$
|
35,688
|
$
|
23,231
|
$
|
27,684
|
||||||
|
Average common shares outstanding
|
16,879
|
16,339
|
16,909
|
|||||||||
|
Average common share stock options outstanding
|
43
|
13
|
2
|
|||||||||
|
Average diluted common shares
|
16,922
|
16,352
|
16,911
|
|||||||||
|
Basic earnings per share
|
$
|
2.11
|
$
|
1.42
|
$
|
1.64
|
||||||
|
Diluted earnings per share
|
$
|
2.11
|
$
|
1.42
|
$
|
1.64
|
||||||
Stock options to purchase 84,780 and 141,050 shares, respectively, for the years ended December 31, 2013 and 2012, were not included in the earnings per share calculation because the exercise price exceeded the average market price. There were no such shares for the year ended December 31, 2014.
Stock-Based Compensation
The Company has adopted various stock-based compensation plans. The plans provide for the grant of incentive stock options, nonqualified stock options, stock appreciation rights and bonus stock awards. Pursuant to the plans, shares are reserved for future issuance by the Company, upon exercise of stock options or awarding of bonus shares granted to directors, officers and other key employees.
In accordance with ASC Topic 718,
Compensation – Stock Compensation
, the fair value of each option award is estimated on the date of grant using the Black-Scholes option-pricing model that uses various assumptions. This model requires the input of highly subjective assumptions, changes to which can materially affect the fair value estimate. For additional information, see Note 12, Employee Benefit Plans.
Subsequent Events (Acquisitions)
Community First Bancshares, Inc.
On May 6, 2014, the Company announced that it had entered into a definitive agreement and plan of merger (“Community First Agreement”) with Community First Bancshares, Inc. (“Community First”), headquartered in Union City, Tennessee, including its wholly-owned bank subsidiary First State Bank (“First State”). The Company received regulatory approval for the merger from the Federal Reserve on February 12, 2015 and completed the acquisition on February 27, 2015. The Company issued approximately 6,624,000 shares of common stock valued at approximately $271.3 million for all outstanding shares of Community First common stock and 30,852 shares of Simmons senior non-cumulative Series A perpetual preferred stock in exchange for all of Community First Series C preferred stock.
68
Prior to the acquisition, Community First conducted banking business from 31 branches located throughout Tennessee. As of December 31, 2014, Community First had approximately $1.9 billion in assets, $1.1 billion in loans and $1.5 billion in deposits. Upon closing, Community First was merged into the Company.
Due to the timing of the acquisition and the number of assets and liabilities assumed, the Company is continuing to determine their preliminary fair values and the purchase price allocation. The Company expects to finalize the analysis of the acquired assets and liabilities over the next few months and within one year of the acquisition.
Liberty Bancshares, Inc.
On May 27, 2014, the Company announced that it had entered into a definitive agreement and plan of merger (“Liberty Agreement”) with Liberty Bancshares, Inc. (“Liberty”), headquartered in Springfield, Missouri, including its wholly-owned bank subsidiary Liberty Bank. The Company received regulatory approval for the merger from the Federal Reserve on February 12, 2015 and completed the acquisition on February 27, 2015. The Company issued approximately 5,247,187 shares of common stock valued at approximately $214.9 million for all outstanding shares of Liberty common stock.
Liberty conducted banking business from 24 branches located in southwest Missouri, including five in Springfield, Missouri. As of December 31, 2014, Liberty had approximately $1.1 billion in assets, $787 million in loans and $895 million in deposits. Upon closing, Liberty was merged into the Company.
Due to the timing of the acquisition and the number of assets and liabilities assumed, the Company is continuing to determine their preliminary fair values and the purchase price allocation. The Company expects to finalize the analysis of the acquired assets and liabilities over the next few months and within one year of the acquisition.
69
|
NOTE 2:
|
ACQUISITIONS
|
Delta Trust & Banking Corporation
On August 31, 2014, the Simmons First National Corporation completed the acquisition of Delta Trust & Banking Corporation (“Delta Trust”), headquartered in Little Rock, Arkansas, including its wholly-owned bank subsidiary Delta Trust & Bank (“DTB”). Simmons issued 1,629,515 shares of its common stock valued at approximately $65.0 million as of August 29, 2014, plus $2.4 million in cash in exchange for all outstanding shares of Delta Trust common stock.
Prior to the acquisition, Delta Trust conducted banking business from 9 branches located in central, south and northwest Arkansas. Including the effects of the purchase accounting adjustments, the Company acquired approximately $417 million in assets, approximately $312 million in loans including loan discounts and approximately $355 million in deposits. The Company completed the systems conversion and merged DTB into Simmons Bank on October 24, 2014.
A summary, at fair value, of the assets acquired and liabilities assumed in the Delta Trust transaction, as of the acquisition date, is as follows:
|
(In thousands)
|
Acquired from
Delta Trust
|
Fair Value
Adjustments
|
Fair
Value
|
|||||||||
|
Assets Acquired
|
||||||||||||
|
Cash and due from banks
|
$
|
13,739
|
$
|
-
|
$
|
13,739
|
||||||
|
Investment securities
|
62,410
|
(37
|
)
|
62,373
|
||||||||
|
Loans acquired, not covered by FDIC loss share
|
326,829
|
(15,149
|
)
|
311,680
|
||||||||
|
Allowance for loan losses
|
(6,008
|
)
|
6,008
|
-
|
||||||||
|
Foreclosed assets not covered by FDIC loss share
|
3,262
|
(1,471
|
)
|
1,791
|
||||||||
|
Premises and equipment
|
4,405
|
(433
|
)
|
3,972
|
||||||||
|
Bank owned life insurance
|
7,530
|
-
|
7,530
|
|||||||||
|
Goodwill
|
822
|
(822
|
)
|
-
|
||||||||
|
Core deposit intangible
|
-
|
4,318
|
4,318
|
|||||||||
|
Other intangibles
|
137
|
5,003
|
5,140
|
|||||||||
|
Deferred tax asset
|
1,859
|
558
|
2,417
|
|||||||||
|
Other assets
|
5,807
|
(1,381
|
)
|
4,426
|
||||||||
|
Total assets acquired
|
$
|
420,792
|
$
|
(3,406
|
)
|
$
|
417,386
|
|||||
|
Liabilities Assumed
|
||||||||||||
|
Deposits:
|
||||||||||||
|
Non-interest bearing transaction accounts
|
$
|
63,259
|
$
|
-
|
$
|
63,259
|
||||||
|
Interest bearing transaction accounts and savings deposits
|
200,596
|
-
|
200,596
|
|||||||||
|
Time deposits
|
91,507
|
-
|
91,507
|
|||||||||
|
Total deposits
|
355,362
|
-
|
355,362
|
|||||||||
|
Fed funds purchased
|
11,100
|
-
|
11,100
|
|||||||||
|
Other borrowings
|
11,106
|
(129
|
)
|
10,977
|
||||||||
|
Accrued interest and other liabilities
|
1,528
|
-
|
1,528
|
|||||||||
|
Total liabilities assumed
|
379,096
|
(129
|
)
|
378,967
|
||||||||
|
Equity
|
41,696
|
(41,696
|
)
|
-
|
||||||||
|
Total equity assumed
|
41,696
|
(41,696
|
)
|
-
|
||||||||
|
Total liabilities and equity assumed
|
$
|
420,792
|
$
|
(41,825
|
)
|
$
|
378,967
|
|||||
|
Net assets acquired
|
38,419
|
|||||||||||
|
Purchase price
|
67,441
|
|||||||||||
|
Goodwill
|
$
|
29,022
|
||||||||||
The following is a description of the methods used to determine the fair values of significant assets and liabilities presented in the Delta Trust acquisition above.
Cash and due from banks and interest bearing balances due from banks
– The carrying amount of these assets is a reasonable estimate of fair value based on the short-term nature of these assets.
70
Investment securities
– Investment securities were acquired with an adjustment to fair value based upon quoted market prices. This adjustment is primarily the result of marking the held-to-maturity securities to fair value.
Loans acquired
– Fair values for loans were based on a discounted cash flow methodology that considered factors including the type of loan and related collateral, classification status, fixed or variable interest rate, term of loan and whether or not the loan was amortizing, and current discount rates. The discount rates used for loans are based on current market rates for new originations of comparable loans and include adjustments for liquidity concerns. The discount rate does not include a factor for credit losses as that has been included in the estimated cash flows. Loans were grouped together according to similar characteristics and were treated in the aggregate when applying various valuation techniques.
Foreclosed assets held for sale
– These assets are presented at the estimated present values that management expects to receive when the properties are sold, net of related costs of disposal.
Premises and equipment
– Bank premises and equipment were acquired with an adjustment to fair value, which represents the difference between the Company’s current analysis of property values completed in connection with the acquisition and book value acquired.
Bank owned life insurance
– Bank owned life insurance is carried at its current cash surrender value, which is the most reasonable estimate of fair value.
Goodwill
– The consideration paid as a result of the acquisition exceeded the fair value of the assets acquired, resulting in an intangible asset, goodwill, of $29.0 million.
Core deposit intangible
– This intangible asset represents the value of the relationships that Delta Trust had with its deposit customers. The fair value of this intangible asset was estimated based on a discounted cash flow methodology that gave appropriate consideration to expected customer attrition rates, cost of the deposit base and the net maintenance cost attributable to customer deposits.
Other intangibles
– These intangible assets represent the value of the relationships that Delta Trust’s investment subsidiary, insurance subsidiary and trust department had with their customers. The fair value of these intangible assets was estimated based on a combination of discounted cash flow methodology and a market valuation approach.
Deferred tax asset
– The deferred tax asset is based on 39.225% of fair value adjustments related to the acquired assets and assumed liabilities and on a calculation of future tax benefits. The Company also recorded Delta Trust’s remaining deferred tax assets and liabilities as of the acquisition date.
Other assets
– The fair value adjustment results from certain assets whose value was estimated to be less than book value, such as certain prepaid assets, receivables and other miscellaneous assets.
Deposits
– The fair values used for the demand and savings deposits that comprise the transaction accounts acquired, by definition equal the amount payable on demand at the acquisition date. The Company performed a fair value analysis of the estimated weighted average interest rate of Delta Trust’s certificates of deposits compared to the current market rates. Based on the results of the analysis, the estimated fair value adjustment was immaterial.
Federal funds purchased
– The carrying amount of federal funds purchased is a reasonable estimate of fair value based on the short-term nature of these liabilities.
Other borrowings
– The fair value of Federal Home Loan Bank borrowings is estimated based on borrowing rates currently available to the Company for borrowings with similar terms and maturities.
The purchase price allocation and certain fair value measurements remain preliminary due to the timing of the acquisition and due to the number of assets acquired and liabilities assumed. Management will continue to review the estimated fair values of loans, foreclosed assets, property and equipment, intangible assets, and other assets and liabilities, and to evaluate the assumed tax positions. The Company expects to finalize its analysis of the acquired loans along with the other acquired assets and assumed liabilities in this transaction over the next few months, within one year of the acquisition. Therefore, adjustments to the estimated amounts and carrying values may occur. See Note 5, Loans Acquired, for discussion regarding subsequent evaluation of future cash flows.
71
The Company’s operating results for 2014 include the operating results of the acquired assets and assumed liabilities of Delta Trust subsequent to the acquisition date. This acquisition is not considered significant to the Company’s financial statements, and thus no proforma information is presented.
Metropolitan National Bank
On November 25, 2013, Simmons First National Corporation completed the acquisition of Metropolitan National Bank (“Metropolitan” or “MNB”), with its principal office located in Little Rock, Arkansas, pursuant to a Stock Purchase Agreement between the Company and Rogers Bancshares, Inc. (“RBI”), in which the Company purchased all the stock of Metropolitan for $53.6 million in cash. The acquisition was conducted in accordance with the provisions of Section 363 of the United States Bankruptcy Code. As part of the acquisition, Metropolitan was merged into the Company’s wholly-owned subsidiary, Simmons First National Bank (“Simmons Bank” or “lead bank”). The Company recorded $6.6 million of pre-tax merger costs related to the acquisition.
Prior to the acquisition, Metropolitan conducted banking business from 45 branches located in central and northwest Arkansas. Including the effects of the purchase accounting adjustments, the Company acquired approximately $884 million in assets, approximately $457 million in loans, net of discounts, and $838 million of deposits.
A summary, at fair value, of the assets acquired and liabilities assumed in the Metropolitan transaction, as of the acquisition date, is as follows:
|
(In thousands)
|
Acquired from
RBI
|
Fair Value
Adjustments
|
Fair
Value
|
|||||||||
|
Assets Acquired
|
||||||||||||
|
Cash and due from banks
|
$
|
12,026
|
$
|
-
|
$
|
12,026
|
||||||
|
Interest bearing balances due from banks
|
77,059
|
-
|
77,059
|
|||||||||
|
Investment securities
|
235,160
|
(2,259
|
)
|
232,901
|
||||||||
|
Loans acquired, not covered by FDIC loss share
|
494,839
|
(37,467
|
)
|
457,372
|
||||||||
|
Allowance for loan losses
|
(19,025
|
)
|
19,025
|
-
|
||||||||
|
Foreclosed assets not covered by FDIC loss share
|
64,397
|
(21,455
|
)
|
42,942
|
||||||||
|
Premises and equipment
|
74,753
|
(22,575
|
)
|
52,178
|
||||||||
|
Core deposit intangible
|
-
|
9,844
|
9,844
|
|||||||||
|
Deferred tax asset
|
-
|
30,699
|
30,699
|
|||||||||
|
Other assets
|
5,646
|
(1,327
|
)
|
4,319
|
||||||||
|
Total assets acquired
|
944,855
|
(25,515
|
)
|
919,340
|
||||||||
|
Liabilities Assumed
|
||||||||||||
|
Deposits:
|
||||||||||||
|
Non-interest bearing transaction accounts
|
150,259
|
-
|
150,259
|
|||||||||
|
Interest bearing transaction accounts and savings deposits
|
341,410
|
-
|
341,410
|
|||||||||
|
Time deposits
|
345,326
|
512
|
345,838
|
|||||||||
|
Total deposits
|
836,995
|
512
|
837,507
|
|||||||||
|
Fed funds purchased and other borrowings
|
36,637
|
-
|
36,637
|
|||||||||
|
Accrued interest and other liabilities
|
9,443
|
77
|
9,520
|
|||||||||
|
Total liabilities assumed
|
883,075
|
589
|
883,664
|
|||||||||
|
Equity
|
61,780
|
(61,780
|
)
|
-
|
||||||||
|
Total equity assumed
|
61,780
|
(61,780
|
)
|
-
|
||||||||
|
Total liabilities and equity assumed
|
$
|
944,855
|
$
|
(61,191
|
)
|
$
|
883,664
|
|||||
|
Net assets acquired
|
35,676
|
|||||||||||
|
Purchase price
|
53,600
|
|||||||||||
|
Goodwill
|
$
|
17,924
|
||||||||||
The following is a description of the methods used to determine the fair values of significant assets and liabilities presented in the Metropolitan acquisition above.
Cash and due from banks and interest bearing balances due from banks
–
The carrying amount of these assets is a reasonable estimate of fair value based on the short-term nature of these assets.
Investment securities – Investment securities were acquired with a $2.3 million adjustment to fair value based upon quoted market prices. This adjustment is primarily the result of marking the held-to-maturity securities to fair value.
72
Loans acquired
– Fair values for loans were based on a discounted cash flow methodology that considered factors including the type of loan and related collateral, classification status, fixed or variable interest rate, term of loan and whether or not the loan was amortizing, and current discount rates. The discount rates used for loans are based on current market rates for new originations of comparable loans and include adjustments for liquidity concerns. The discount rate does not include a factor for credit losses as that has been included in the estimated cash flows. Loans were grouped together according to similar characteristics and were treated in the aggregate when applying various valuation techniques.
Foreclosed assets held for sale
– These assets are presented at the estimated present values that management expects to receive when the properties are sold, net of related costs of disposal.
Premises and equipment
– Bank premises and equipment were acquired with a $22.6 million adjustment to fair value. This represents the difference between current appraisals completed in connection with the acquisition and book value acquired.
Goodwill
– The consideration paid as a result of the acquisition exceeded the fair value of the assets acquired, resulting in an intangible asset, goodwill, of $17.9 million.
Core deposit intangible
–
This intangible asset represents the value of the relationships that Metropolitan had with its deposit customers. The fair value of this intangible asset was estimated based on a discounted cash flow methodology that gave appropriate consideration to expected customer attrition rates, cost of the deposit base and the net maintenance cost attributable to customer deposits.
Deferred tax asset
– The deferred tax asset is based on 39.225% of fair value adjustments related to the acquired assets and assumed liabilities and on a calculation of future tax benefits. Metropolitan had a full valuation allowance against its deferred tax asset on the acquisition date, since it was more-likely-than-not that it would not be realized based on negative evidence which included substantial historical operating losses and a lack of future taxable income projections. Metropolitan had approximately $72.8 million in net operating loss carryforward of which approximately $34.0 is expected to be utilized by the Company under Internal Revenue Code (IRC) Section 382 limitation calculations. The Company also recorded Metropolitan’s remaining deferred tax assets and liabilities along with the deferred taxes associated with the purchase price adjustments offset by any IRC Section 382 limitations related to built-in losses.
Other assets
– The fair value adjustment results from certain assets whose value was estimated to be less than book value, such a certain prepaid assets, receivables and intangible assets.
Deposits
– The fair values used for the demand and savings deposits that comprise the transaction accounts acquired, by definition equal the amount payable on demand at the acquisition date. The $512,000 fair value adjustment applied to time deposits results from the estimated weighted average interest rate of Metropolitan’s certificates of deposits being slightly above the current market rates.
Federal funds purchased and other borrowings
– The carrying amount of these liabilities is a reasonable estimate of fair value based on the short-term nature of these liabilities.
Accrued interest and other liabilities
– The fair value used represents the adjustment of certain estimated liabilities from Metropolitan.
During 2014 the Company finalized its analysis of the acquired loans along with the other acquired assets and assumed liabilities in this transaction.
The Company’s operating results for 2014 and 2013 include the operating results of the acquired assets and assumed liabilities of Metropolitan subsequent to the acquisition date. Due to the significant fair value adjustments recorded and the fact Metropolitan was acquired under bankruptcy proceedings, historical results are not believed to be relevant to the Company’s results, and thus no pro forma information is presented.
73
FDIC-Assisted Transactions
Truman Bank
On September 14, 2012, the Company, through its wholly-owned subsidiary, Simmons First National Bank (“Simmons Bank” or “lead bank”), entered into a purchase and assumption agreement with loss share arrangements and a separate loan sale agreement with the FDIC to purchase substantially all of the assets and to assume substantially all of the deposits and certain other liabilities of Truman Bank of St. Louis, Missouri (“Truman”), with four branches in the St. Louis metro area. The Company recognized a pre-tax gain of $1.1 million on this transaction and incurred pre-tax merger related costs of $815,000.
A summary, at fair value, of the assets acquired and liabilities assumed in the Truman transaction, as of the acquisition date, is as follows:
|
(In thousands)
|
Acquired from
the FDIC
|
Fair Value
Adjustments
|
Fair
Value
|
|||||||||
|
Assets Acquired
|
||||||||||||
|
Cash and due from banks
|
$
|
22,467
|
$
|
-
|
$
|
22,467
|
||||||
|
Cash received from FDIC
|
10,495
|
-
|
10,495
|
|||||||||
|
Federal funds sold
|
12,338
|
-
|
12,338
|
|||||||||
|
Investment securities
|
23,540
|
-
|
23,540
|
|||||||||
|
Loans acquired, covered by FDIC loss share
|
87,620
|
(30,479
|
)
|
57,141
|
||||||||
|
Loans acquired, not covered by FDIC loss share
|
89,360
|
(15,965
|
)
|
73,395
|
||||||||
|
Foreclosed assets covered by FDIC loss share
|
20,723
|
(5,607
|
)
|
15,116
|
||||||||
|
Foreclosed assets not covered by FDIC loss share
|
10,314
|
(2,563
|
)
|
7,751
|
||||||||
|
FDIC indemnification asset
|
-
|
26,723
|
26,723
|
|||||||||
|
Premises and equipment
|
1,390
|
-
|
1,390
|
|||||||||
|
Core deposit intangible
|
-
|
1,191
|
1,191
|
|||||||||
|
Other assets
|
1,478
|
149
|
1,627
|
|||||||||
|
Total assets acquired
|
279,725
|
(26,551
|
)
|
253,174
|
||||||||
|
Liabilities Assumed
|
||||||||||||
|
Deposits:
|
||||||||||||
|
Non-interest bearing transaction accounts
|
22,275
|
-
|
22,275
|
|||||||||
|
Interest bearing transaction accounts and savings deposits
|
70,705
|
-
|
70,705
|
|||||||||
|
Time deposits
|
135,573
|
-
|
135,573
|
|||||||||
|
Total deposits
|
228,553
|
-
|
228,553
|
|||||||||
|
Fed funds purchased and other borrowings
|
21,456
|
-
|
21,456
|
|||||||||
|
Payable to FDIC
|
1,285
|
-
|
1,285
|
|||||||||
|
Accrued interest and other liabilities
|
403
|
357
|
760
|
|||||||||
|
Total liabilities assumed
|
$
|
251,697
|
$
|
357
|
252,054
|
|||||||
|
Pre-tax gain on FDIC-assisted transaction
|
$
|
1,120
|
||||||||||
Excel Bank
On October 19, 2012, the Company, through the lead bank, entered into a purchase and assumption agreement with loss share arrangements with the FDIC to purchase certain assets and to assume substantially all of the deposits and certain other liabilities of Excel Bank of Sedalia, Missouri (“Excel”), with three branches in the Kansas City metro area and one branch in the St. Louis metro area. The Company recognized a pre-tax gain of $2.3 million on this transaction and incurred pre-tax merger related costs of $1.1 million.
74
A summary, at fair value, of the assets acquired and liabilities assumed in the Excel transaction, as of the acquisition date, is as follows:
|
(In thousands)
|
Acquired from
the FDIC
|
Fair Value
Adjustments
|
Fair
Value
|
|||||||||
|
Assets Acquired
|
||||||||||||
|
Cash and due from banks
|
$
|
18,622
|
$
|
-
|
$
|
18,622
|
||||||
|
Cash received from FDIC
|
13,845
|
-
|
13,845
|
|||||||||
|
Federal funds sold
|
104
|
-
|
104
|
|||||||||
|
Investment securities
|
8,583
|
-
|
8,583
|
|||||||||
|
Loans acquired, covered by FDIC loss share
|
111,807
|
(33,660
|
)
|
78,147
|
||||||||
|
Loans acquired, not covered by FDIC loss share
|
26,528
|
(5,376
|
)
|
21,152
|
||||||||
|
Foreclosed assets covered by FDIC loss share
|
6,671
|
(3,558
|
)
|
3,113
|
||||||||
|
Foreclosed assets not covered by FDIC loss share
|
8,265
|
(2,404
|
)
|
5,861
|
||||||||
|
FDIC indemnification asset
|
-
|
26,218
|
26,218
|
|||||||||
|
Premises and equipment
|
2,582
|
-
|
2,582
|
|||||||||
|
Core deposit intangible
|
-
|
1,337
|
1,337
|
|||||||||
|
Other assets
|
972
|
-
|
972
|
|||||||||
|
Total assets acquired
|
197,979
|
(17,443
|
)
|
180,536
|
||||||||
|
Liabilities Assumed
|
||||||||||||
|
Deposits:
|
||||||||||||
|
Non-interest bearing transaction accounts
|
19,372
|
-
|
19,372
|
|||||||||
|
Interest bearing transaction accounts and savings deposits
|
55,082
|
-
|
55,082
|
|||||||||
|
Time deposits
|
94,138
|
-
|
94,138
|
|||||||||
|
Total deposits
|
168,592
|
-
|
168,592
|
|||||||||
|
FHLB borrowings
|
8,010
|
183
|
8,193
|
|||||||||
|
FDIC true-up provision
|
-
|
328
|
328
|
|||||||||
|
Accrued interest and other liabilities
|
426
|
706
|
1,132
|
|||||||||
|
Total liabilities assumed
|
$
|
177,028
|
$
|
1,217
|
178,245
|
|||||||
|
Pre-tax gain on FDIC-assisted transaction
|
$
|
2,291
|
||||||||||
The following is a description of the methods used to determine the fair values of significant assets and liabilities presented in the FDIC-assisted transactions above.
Cash and due from banks, cash received from FDIC and Federal funds sold
– The carrying amount of these assets is a reasonable estimate of fair value based on the short-term nature of these assets. The $10.5 million cash received from the FDIC for Truman and $13.8 million for Excel is the first pro-forma cash settlement received from the FDIC on Monday following the closing weekend. The $1.3 million payable to the FDIC for Truman is the excess amount received from the settlement.
Investment securities
– Investment securities were acquired from the FDIC at fair market value. The fair values provided by the FDIC were reviewed and considered reasonable based on Simmons Bank’s understanding of the market conditions, based on actual balances transferred compared to pro-forma balances.
Loans acquired
– Fair values for loans were based on a discounted cash flow methodology that considered factors including the type of loan and related collateral, classification status, fixed or variable interest rate, term of loan and whether or not the loan was amortizing, and current discount rates. The discount rates used for loans are based on current market rates for new originations of comparable loans and include adjustments for liquidity concerns. The discount rate does not include a factor for credit losses as that has been included in the estimated cash flows. Loans were grouped together according to similar characteristics and were treated in the aggregate when applying various valuation techniques.
Foreclosed assets held for sale
– These assets are presented at the estimated present values that management expects to receive when the properties are sold, net of related costs of disposal.
FDIC indemnification asset
– This loss sharing asset is measured separately from the related covered assets as it is not contractually embedded in the covered assets and is not transferable with the covered assets should Simmons Bank choose to dispose of them. Fair value was estimated using projected cash flows related to the loss sharing agreements based on the expected reimbursements for losses and the applicable loss sharing percentages. These cash flows were discounted to reflect the uncertainty of the timing and receipt of the loss-sharing reimbursement from the FDIC.
75
Core deposit intangible
–
This intangible asset represents the value of the relationships that Truman and Excel had with their deposit customers. The fair value of this intangible asset was estimated based on a discounted cash flow methodology that gave appropriate consideration to expected customer attrition rates, cost of the deposit base and the net maintenance cost attributable to customer deposits.
Deposits
– The fair values used for the demand and savings deposits that comprise the transaction accounts acquired, by definition equal the amount payable on demand at the acquisition date. Even though deposit rates were above market, because Simmons Bank reset deposit rates to current market rates, there was no fair value adjustment recorded for time deposits.
Federal funds purchased and other borrowings, and payable to the FDIC
– The carrying amount of these liabilities is a reasonable estimate of fair value based on the short-term nature of these liabilities. The $1.3 million payable to the FDIC for Truman is the excess amount from the first pro-forma cash settlement received from the FDIC on Monday following the closing weekend.
FHLB borrowings
– The fair value of Federal Home Loan Bank (“FHLB”) borrowings is estimated based on borrowing rates currently available to the Company for borrowings with similar terms and maturities. Included in the Excel acquisition were FHLB borrowed funds with a fair value totaling $8.2 million. The Company did not need these advances to meet its liquidity needs, and redeemed the advances during the fourth quarter of 2012.
FDIC true-up provision
– The purchase and assumption agreements for Truman and Excel allow for the FDIC to recover a portion of the funds previously paid out under the indemnification agreement in the event losses fail to reach the expected loss level under a claw back provision (“true-up provision”). A true-up is scheduled to occur in the calendar month in which the tenth anniversary of the respective closing occurs. If the threshold is not met, the assuming institution is required to pay the FDIC 50 percent of the excess, if any, within 45 days following the true-up.
The value of the true-up provision liability is calculated as the present value of the estimated payment to the FDIC in the tenth year using the formula provided in the agreements. The result of the calculation is based on the net present value of expected future cash payments to be made by Simmons Bank to the FDIC at the conclusion of the loss share agreements. The discount rate used was based on current market rates. The expected cash flows were calculated in accordance with the loss share agreements and are based primarily on the expected losses on the covered assets. The value of the true-up provision is included in accrued interest and other liabilities on the balance sheet. Calculations in accordance with the agreement resulted in no true-up provision to be recorded for Truman as of the acquisition date.
In connection with the Truman and Excel acquisitions, Simmons Bank and the FDIC share in the losses on assets covered under the loss share agreements. The FDIC will reimburse Simmons Bank for 80% of all losses on covered assets. The loss sharing agreements entered into by Simmons Bank and the FDIC in conjunction with the purchase and assumption agreements require that Simmons Bank follow certain servicing procedures as specified in the loss share agreements or risk losing FDIC reimbursement of covered asset losses. Additionally, to the extent that actual losses incurred by Simmons Bank under the loss share agreements are less than expected, Simmons Bank may be required to reimburse the FDIC under the clawback provisions of the loss share agreements. At December 31, 2013 and 2012, the covered loans and covered other real estate owned and the related FDIC indemnification asset (collectively, the “covered assets”) were reported at the net present value of expected future amounts to be paid or received.
Purchased loans acquired in a business combination, including loans purchased in the Truman and Excel acquisitions (both covered and not covered), are recorded at estimated fair value on their purchase date with no carryover of the related allowance for loan and lease losses. Purchased loans are accounted for in accordance with ASC Topic 310-30
, Loans and Debt Securities Acquired with Deteriorated Credit Quality,
accounting guidance for certain loans or debt securities acquired in a transfer, when the loans have evidence of credit deterioration since origination and it is probable at the date of acquisition that the acquirer will not collect all contractually required principal and interest payments. The difference between contractually required payments and the cash flows expected to be collected at acquisition is referred to as the non-accretable difference. Subsequent decreases to the expected cash flows will generally result in a provision for loan and lease losses. Subsequent increases in cash flows result in a reversal of the provision for loan and lease losses to the extent of prior charges and an adjustment in accretable yield, recognized on a prospective basis over the loan’s or pool’s remaining life, which will have a positive impact on interest income.
76
The Bank acquired approximately $1.4 million and $2.6 million of the real estate, banking facilities, furniture and equipment of Truman and Excel, respectively, as part of the purchase and assumption agreements, and assumed existing leases on the other banking facilities.
|
NOTE 3:
|
INVESTMENT SECURITIES
|
The amortized cost and fair value of investment securities that are classified as held-to-maturity and available-for-sale are as follows:
|
Years Ended December 31
|
||||||||||||||||||||||||||||||||
|
2014
|
2013
|
|||||||||||||||||||||||||||||||
|
(In thousands)
|
Amortized
Cost
|
Gross
Unrealized
Gains
|
Gross
Unrealized
(Losses)
|
Estimated
Fair
Value
|
Amortized
Cost
|
Gross
Unrealized
Gains
|
Gross
Unrealized
(Losses)
|
Estimated
Fair
Value
|
||||||||||||||||||||||||
|
Held-to-Maturity
|
||||||||||||||||||||||||||||||||
|
U.S. Government agencies
|
$
|
418,914
|
$
|
929
|
$
|
(4,055
|
)
|
$
|
415,788
|
$
|
395,198
|
$
|
50
|
$
|
(10,535
|
)
|
$
|
384,713
|
||||||||||||||
|
Mortgage-backed securities
|
29,743
|
56
|
(411
|
)
|
29,388
|
34,425
|
17
|
(442
|
)
|
34,000
|
||||||||||||||||||||||
|
State and political subdivisions
|
328,310
|
7,000
|
(573
|
)
|
334,737
|
315,445
|
2,165
|
(5,498
|
)
|
312,112
|
||||||||||||||||||||||
|
Other securities
|
620
|
-
|
-
|
620
|
620
|
-
|
-
|
620
|
||||||||||||||||||||||||
|
Total
|
$
|
777,587
|
$
|
7,985
|
$
|
(5,039
|
)
|
$
|
780,533
|
$
|
745,688
|
$
|
2,232
|
$
|
(16,475
|
)
|
$
|
731,445
|
||||||||||||||
|
Available-for-Sale
|
||||||||||||||||||||||||||||||||
|
U.S. Treasury
|
$
|
4,000
|
$
|
1
|
$
|
(9
|
)
|
$
|
3,992
|
$
|
4,001
|
$
|
-
|
$
|
(16
|
)
|
$
|
3,985
|
||||||||||||||
|
U.S. Government agencies
|
275,381
|
15
|
(2,580
|
)
|
272,816
|
183,781
|
8
|
(5,572
|
)
|
178,217
|
||||||||||||||||||||||
|
Mortgage-backed securities
|
1,579
|
-
|
(7
|
)
|
1,572
|
1,735
|
156
|
-
|
1,891
|
|||||||||||||||||||||||
|
State and political subdivisions
|
6,536
|
7
|
(3
|
)
|
6,540
|
7,860
|
4
|
(3
|
)
|
7,861
|
||||||||||||||||||||||
|
Other securities
|
19,985
|
386
|
(8
|
)
|
20,363
|
19,840
|
484
|
(1
|
)
|
20,323
|
||||||||||||||||||||||
|
Total
|
$
|
307,481
|
$
|
409
|
$
|
(2,607
|
)
|
$
|
305,283
|
$
|
217,217
|
$
|
652
|
$
|
(5,592
|
)
|
$
|
212,277
|
||||||||||||||
Securities with limited marketability, such as stock in the Federal Reserve Bank and the Federal Home Loan Bank, are carried at cost and are reported as other available-for-sale securities in the table above.
Certain investment securities are valued at less than their historical cost. Total fair value of these investments at December 31, 2014 and 2013, was $680.5 million and $715.3 million, which is approximately 62.8% and 75.8%, respectively, of the Company’s combined available-for-sale and held-to-maturity investment portfolios.
77
|
Less Than 12 Months
|
12 Months or More
|
Total
|
||||||||||||||||||||||
|
(In thousands)
|
Estimated
Fair
Value
|
Gross
Unrealized
Losses
|
Estimated
Fair
Value
|
Gross
Unrealized
Losses
|
Estimated
Fair
Value
|
Gross
Unrealized
Losses
|
||||||||||||||||||
|
December 31, 2014
|
||||||||||||||||||||||||
|
Held-to-Maturity
|
||||||||||||||||||||||||
|
U.S. Government agencies
|
$
|
265,591
|
$
|
2,500
|
$
|
84,398
|
$
|
1,555
|
$
|
349,989
|
$
|
4,055
|
||||||||||||
|
Mortgage-backed securities
|
10,077
|
67
|
14,250
|
344
|
24,327
|
411
|
||||||||||||||||||
|
State and political subdivisions
|
57,607
|
444
|
8,976
|
129
|
66,583
|
573
|
||||||||||||||||||
|
Total
|
$
|
333,275
|
$
|
3,011
|
$
|
107,624
|
$
|
2,028
|
$
|
440,899
|
$
|
5,039
|
||||||||||||
|
Available-for-Sale
|
||||||||||||||||||||||||
|
U.S. Treasury
|
$
|
3,992
|
$
|
9
|
$
|
-
|
$
|
-
|
$
|
3,992
|
$
|
9
|
||||||||||||
|
U.S. Government agencies
|
171,114
|
1,472
|
61,195
|
1,108
|
232,309
|
2,580
|
||||||||||||||||||
|
Mortgage-backed securities
|
1,542
|
7
|
-
|
-
|
1,542
|
7
|
||||||||||||||||||
|
State and political subdivisions
|
1,005
|
3
|
-
|
-
|
1,005
|
3
|
||||||||||||||||||
|
Other securities
|
764
|
8
|
-
|
-
|
764
|
8
|
||||||||||||||||||
|
Total
|
$
|
178,417
|
$
|
1,499
|
$
|
61,195
|
$
|
1,108
|
$
|
239,612
|
$
|
2,607
|
||||||||||||
|
December 31, 2013
|
||||||||||||||||||||||||
|
Held-to-Maturity
|
||||||||||||||||||||||||
|
U.S. Government agencies
|
$
|
258,474
|
$
|
6,405
|
$
|
114,339
|
$
|
4,130
|
$
|
372,814
|
$
|
10,535
|
||||||||||||
|
Mortgage-backed securities
|
32,053
|
442
|
-
|
-
|
32,053
|
442
|
||||||||||||||||||
|
State and political subdivisions
|
130,457
|
5,311
|
4,466
|
187
|
134,923
|
5,498
|
||||||||||||||||||
|
Total
|
$
|
420,984
|
$
|
12,158
|
$
|
118,805
|
$
|
4,317
|
$
|
539,790
|
$
|
16,475
|
||||||||||||
|
Available-for-Sale
|
||||||||||||||||||||||||
|
U.S. Government agencies
|
$
|
3,985
|
$
|
16
|
$
|
-
|
$
|
-
|
$
|
3,985
|
$
|
16
|
||||||||||||
|
Mortgage-backed securities
|
111,662
|
2,682
|
56,396
|
2,890
|
168,058
|
5,572
|
||||||||||||||||||
|
State and political subdivisions
|
2,921
|
3
|
-
|
-
|
2,921
|
3
|
||||||||||||||||||
|
Other securities
|
573
|
1
|
-
|
-
|
573
|
1
|
||||||||||||||||||
|
Total
|
$
|
119,141
|
$
|
2,702
|
$
|
56,396
|
$
|
2,890
|
$
|
175,537
|
$
|
5,592
|
||||||||||||
These declines primarily resulted from the rate for these investments yielding less than current market rates. Based on evaluation of available evidence, management believes the declines in fair value for these securities are temporary. Management does not have the intent to sell these securities and management believes it is more likely than not the Company will not have to sell these securities before recovery of their amortized cost basis less any current period credit losses.
Declines in the fair value of held-to-maturity and available-for-sale securities below their cost that are deemed to be other than temporary are reflected in earnings as realized losses. In estimating other-than-temporary impairment losses, management considers, among other things, (i) the length of time and the extent to which the fair value has been less than cost, (ii) the financial condition and near-term prospects of the issuer, and (iii) the intent and ability of the Company to retain its investment in the issuer for a period of time sufficient to allow for any anticipated recovery in fair value.
Management has the ability and intent to hold the securities classified as held to maturity until they mature, at which time the Company expects to receive full value for the securities. Furthermore, as of December 31, 2014, management also had the ability and intent to hold the securities classified as available-for-sale for a period of time sufficient for a recovery of cost. The unrealized losses are largely due to increases in market interest rates over the yields available at the time the underlying securities were purchased. The fair value is expected to recover as the bonds approach their maturity date or repricing date or if market yields for such investments decline. Management does not believe any of the securities are impaired due to reasons of credit quality. Accordingly, as of December 31, 2014, management believes the impairments detailed in the table above are temporary. Should the impairment of any of these securities become other than temporary, the cost basis of the investment will be reduced and the resulting loss recognized in net income in the period the other-than-temporary impairment is identified.
78
Income earned on the above securities for the years ended December 31, 2014, 2013 and 2012, is as follows:
|
(In thousands)
|
2014
|
2013
|
2012
|
|||||||||
|
Taxable
|
||||||||||||
|
Held-to-maturity
|
$
|
5,839
|
$
|
3,314
|
$
|
3,107
|
||||||
|
Available-for-sale
|
2,785
|
2,239
|
2,214
|
|||||||||
|
Non-taxable
|
||||||||||||
|
Held-to-maturity
|
10,625
|
7,682
|
7,395
|
|||||||||
|
Available-for-sale
|
108
|
65
|
5
|
|||||||||
|
Total
|
$
|
19,357
|
$
|
13,300
|
$
|
12,721
|
||||||
The amortized cost and estimated fair value by maturity of securities are shown in the following table. Securities are classified according to their contractual maturities without consideration of principal amortization, potential prepayments or call options. Accordingly, actual maturities may differ from contractual maturities.
|
Held-to-Maturity
|
Available-for-Sale
|
|||||||||||||||
|
(In thousands)
|
Amortized
Cost
|
Fair
Value
|
Amortized
Cost
|
Fair
Value
|
||||||||||||
|
One year or less
|
$
|
23,068
|
$
|
23,126
|
$
|
3,268
|
$
|
3,268
|
||||||||
|
After one through five years
|
415,154
|
412,294
|
240,190
|
238,298
|
||||||||||||
|
After five through ten years
|
133,646
|
134,639
|
43,260
|
42,575
|
||||||||||||
|
After ten years
|
205,719
|
210,474
|
1,549
|
1,542
|
||||||||||||
|
Other securities
|
-
|
-
|
19,214
|
19,600
|
||||||||||||
|
Total
|
$
|
777,587
|
$
|
780,533
|
$
|
307,481
|
$
|
305,283
|
||||||||
The carrying value, which approximates the fair value, of securities pledged as collateral, to secure public deposits and for other purposes, amounted to $520.4 million at December 31, 2014 and $587.9 million at December 31, 2013. The book value of securities sold under agreements to repurchase amounted to $93.5 million and $102.8 million for December 31, 2014 and 2013, respectively.
There were $199,000 of gross realized gains and $191,000 of realized losses from the sale of available for sale securities during the year ended December 31, 2014. There were $151,000 of gross realized gains and $302,000 of realized losses from the sale of available for sale securities during the year ended December 31, 2013. As part of its acquisition strategy related to Truman and Excel, the Company liquidated the acquired mortgage-backed securities, resulting in $193,000 of net realized losses during 2013. There were $2,000 of realized gains from the sale of available for sale securities and no realized losses during the year ended December 31, 2012. The income tax expense/benefit related to security gains/losses was 39.225% of the gross amounts.
The state and political subdivision debt obligations are primarily non-rated bonds and represent small, Arkansas and Texas issues, which are evaluated on an ongoing basis.
79
|
NOTE 4:
|
LOANS AND ALLOWANCE FOR LOAN LOSSES
|
At December 31, 2014, the Company’s loan portfolio was $2.74 billion, compared to $2.40 billion at December 31, 2013. The various categories of loans are summarized as follows:
|
(In thousands)
|
2014
|
2013
|
||||||
|
Consumer:
|
||||||||
|
Credit cards
|
$
|
185,380
|
$
|
184,935
|
||||
|
Student loans
|
-
|
25,906
|
||||||
|
Other consumer
|
103,402
|
98,851
|
||||||
|
Total consumer
|
288,782
|
309,692
|
||||||
|
Real estate:
|
||||||||
|
Construction
|
181,968
|
146,458
|
||||||
|
Single family residential
|
455,563
|
392,285
|
||||||
|
Other commercial
|
714,797
|
626,333
|
||||||
|
Total real estate
|
1,352,328
|
1,165,076
|
||||||
|
Commercial:
|
||||||||
|
Commercial
|
291,820
|
164,329
|
||||||
|
Agricultural
|
115,658
|
98,886
|
||||||
|
Total commercial
|
407,478
|
263,215
|
||||||
|
Other
|
5,133
|
4,655
|
||||||
|
Loans
|
2,053,721
|
1,742,638
|
||||||
|
Loans acquired, not covered by FDIC loss share (net of discount)
|
575,980
|
515,644
|
||||||
|
Loans acquired, covered by FDIC loss share
(net of discount and allowance)
|
106,933
|
146,653
|
||||||
|
Total loans
|
$
|
2,736,634
|
$
|
2,404,935
|
||||
Loan Origination/Risk Management
– The Company seeks to manage its credit risk by diversifying its loan portfolio, determining that borrowers have adequate sources of cash flow for loan repayment without liquidation of collateral; obtaining and monitoring collateral; providing an adequate allowance for loans losses by regularly reviewing loans through the internal loan review process. The loan portfolio is diversified by borrower, purpose and industry. The Company seeks to use diversification within the loan portfolio to reduce its credit risk, thereby minimizing the adverse impact on the portfolio, if weaknesses develop in either the economy or a particular segment of borrowers. Collateral requirements are based on credit assessments of borrowers and may be used to recover the debt in case of default. Furthermore, factors that influenced the Company’s judgment regarding the allowance for loan losses consists of a five-year historical loss average segregated by each primary loan sector. On an annual basis, historical loss rates are calculated for each sector.
Consumer
– The consumer loan portfolio consists of credit card loans, student loans and other consumer loans. The Company no longer originates or services student loans. Credit card loans are diversified by geographic region to reduce credit risk and minimize any adverse impact on the portfolio. Although they are regularly reviewed to facilitate the identification and monitoring of creditworthiness, credit card loans are unsecured loans, making them more susceptible to be impacted by economic downturns resulting in increasing unemployment. Other consumer loans include direct and indirect installment loans and overdrafts. Loans in this portfolio segment are sensitive to unemployment and other key consumer economic measures.
Real estate
– The real estate loan portfolio consists of construction loans, single family residential loans and commercial loans. Construction and development loans (“C&D”) and commercial real estate loans (“CRE”) can be particularly sensitive to valuation of real estate. Commercial real estate cycles are inevitable. The long planning and production process for new properties and rapid shifts in business conditions and employment create an inherent tension between supply and demand for commercial properties. While general economic trends often move individual markets in the same direction over time, the timing and magnitude of changes are determined by other forces unique to each market. CRE cycles tend to be local in nature and longer than other credit cycles. Factors influencing the CRE market are traditionally different from those affecting residential real estate markets; thereby making predictions for one market based on the other difficult. Additionally, submarkets within commercial real estate – such as office, industrial, apartment, retail and hotel – also experience different cycles, providing an opportunity to lower the overall risk through diversification across types of CRE loans. Management realizes that local demand and supply conditions will also mean that different geographic areas will experience cycles of different amplitude and length. The Company monitors these loans closely and has no significant concentrations in its real estate loan portfolio.
80
Commercial
– The commercial loan portfolio includes commercial and agricultural loans, representing loans to commercial customers and farmers for use in normal business or farming operations to finance working capital needs, equipment purchase or other expansion projects. Collection risk in this portfolio is driven by the creditworthiness of the underlying borrowers, particularly cash flow from customers’ business or farming operations. The Company continues its efforts to keep loan terms short, reducing the negative impact of upward movement in interest rates. Term loans are generally set up with a one or three year balloon, and the Company has recently instituted a pricing mechanism for commercial loans. It is standard practice to require personal guaranties on all commercial loans, particularly as they relate to closely-held or limited liability entities.
Nonaccrual and Past Due Loans
– Loans are considered past due if the required principal and interest payments have not been received as of the date such payments were due. Loans are placed on nonaccrual status when, in management’s opinion, the borrower may be unable to meet payment obligations as they become due, as well as when required by regulatory provisions. Loans may be placed on nonaccrual status regardless of whether or not such loans are considered past due. When interest accrual is discontinued, all unpaid accrued interest is reversed. Interest income is subsequently recognized only to the extent cash payments are received in excess of principal due. Loans are returned to accrual status when all the principal and interest amounts contractually due are brought current and future payments are reasonably assured.
Nonaccrual loans, excluding loans acquired, at December 31, 2014 and 2013, segregated by class of loans, are as follows:
|
(In thousands)
|
2014
|
2013
|
||||||
|
Consumer:
|
||||||||
|
Credit cards
|
$
|
197
|
$
|
290
|
||||
|
Other consumer
|
405
|
677
|
||||||
|
Total consumer
|
602
|
967
|
||||||
|
Real estate:
|
||||||||
|
Construction
|
4,863
|
116
|
||||||
|
Single family residential
|
4,010
|
2,957
|
||||||
|
Other commercial
|
1,522
|
1,726
|
||||||
|
Total real estate
|
10,395
|
4,799
|
||||||
|
Commercial:
|
||||||||
|
Commercial
|
585
|
378
|
||||||
|
Agricultural
|
456
|
117
|
||||||
|
Total commercial
|
1,041
|
495
|
||||||
|
Total
|
$
|
12,038
|
$
|
6,261
|
||||
81
An age analysis of past due loans, excluding loans acquired, segregated by class of loans, is as follows:
|
(In thousands)
|
Gross
30-89 Days
Past Due
|
90 Days
or More
Past Due
|
Total
Past Due
|
Current
|
Total
Loans
|
90 Days
Past Due &
Accruing
|
||||||||||||||||||
|
December 31, 2014
|
||||||||||||||||||||||||
|
Consumer:
|
||||||||||||||||||||||||
|
Credit cards
|
$
|
687
|
$
|
457
|
$
|
1,144
|
$
|
184,236
|
$
|
185,380
|
$
|
-
|
||||||||||||
|
Other consumer
|
1,349
|
447
|
1,796
|
101,606
|
103,402
|
223
|
||||||||||||||||||
|
Total consumer
|
2,036
|
904
|
2,940
|
285,842
|
288,782
|
223
|
||||||||||||||||||
|
Real estate:
|
||||||||||||||||||||||||
|
Construction
|
760
|
570
|
1,330
|
180,638
|
181,968
|
177
|
||||||||||||||||||
|
Single family residential
|
4,913
|
2,213
|
7,126
|
448,437
|
455,563
|
248
|
||||||||||||||||||
|
Other commercial
|
1,987
|
847
|
2,834
|
711,963
|
714,797
|
-
|
||||||||||||||||||
|
Total real estate
|
7,660
|
3,630
|
11,290
|
1,341,038
|
1,352,328
|
425
|
||||||||||||||||||
|
Commercial:
|
||||||||||||||||||||||||
|
Commercial
|
381
|
354
|
735
|
291,085
|
291,820
|
-
|
||||||||||||||||||
|
Agricultural
|
119
|
109
|
228
|
115,430
|
115,658
|
40
|
||||||||||||||||||
|
Total commercial
|
500
|
463
|
963
|
406,515
|
407,478
|
40
|
||||||||||||||||||
|
Other
|
-
|
-
|
-
|
5,133
|
5,133
|
-
|
||||||||||||||||||
|
Total
|
$
|
10,196
|
$
|
4,997
|
$
|
15,193
|
$
|
2,038,528
|
$
|
2,053,721
|
$
|
688
|
||||||||||||
|
December 31, 2013
|
||||||||||||||||||||||||
|
Consumer:
|
||||||||||||||||||||||||
|
Credit cards
|
$
|
712
|
$
|
520
|
$
|
1,232
|
$
|
183,703
|
$
|
184,935
|
$
|
230
|
||||||||||||
|
Student loans
|
627
|
2,264
|
2,891
|
23,015
|
25,906
|
2,264
|
||||||||||||||||||
|
Other consumer
|
911
|
458
|
1,369
|
97,482
|
98,851
|
185
|
||||||||||||||||||
|
Total consumer
|
2,250
|
3,242
|
5,492
|
304,200
|
309,692
|
2,679
|
||||||||||||||||||
|
Real estate:
|
||||||||||||||||||||||||
|
Construction
|
583
|
30
|
613
|
145,845
|
146,458
|
-
|
||||||||||||||||||
|
Single family residential
|
2,793
|
1,114
|
3,907
|
388,378
|
392,285
|
94
|
||||||||||||||||||
|
Other commercial
|
1,019
|
1,533
|
2,552
|
623,781
|
626,333
|
82
|
||||||||||||||||||
|
Total real estate
|
4,395
|
2,677
|
7,072
|
1,158,004
|
1,165,076
|
176
|
||||||||||||||||||
|
Commercial:
|
||||||||||||||||||||||||
|
Commercial
|
357
|
376
|
733
|
163,596
|
164,329
|
96
|
||||||||||||||||||
|
Agricultural
|
42
|
37
|
79
|
98,807
|
98,886
|
-
|
||||||||||||||||||
|
Total commercial
|
399
|
413
|
812
|
262,403
|
263,215
|
96
|
||||||||||||||||||
|
Other
|
-
|
-
|
-
|
4,655
|
4,655
|
-
|
||||||||||||||||||
|
Total
|
$
|
7,044
|
$
|
6,332
|
$
|
13,376
|
$
|
1,729,262
|
$
|
1,742,638
|
$
|
2,951
|
||||||||||||
Impaired Loans
– A loan is considered impaired when it is probable that the Company will not receive all amounts due according to the contractual terms of the loans, including scheduled principal and interest payments. This includes loans that are delinquent 90 days or more, nonaccrual loans and certain other loans identified by management. Certain other loans identified by management consist of performing loans with specific allocations of the allowance for loan losses. Impaired loans are carried at the present value of estimated future cash flows using the loan’s existing rate, or the fair value of the collateral if the loan is collateral dependent.
Impairment is evaluated in total for smaller-balance loans of a similar nature and on an individual loan basis for other loans. Impaired loans, or portions thereof, are charged-off when deemed uncollectible.
82
Impaired loans, net of government guarantees and excluding loans acquired, segregated by class of loans, are as follows:
|
(In thousands)
|
Unpaid
Contractual
Principal
Balance
|
Recorded
Investment
With No
Allowance
|
Recorded
Investment
With
Allowance
|
Total
Recorded
Investment
|
Related
Allowance
|
Average
Investment in
Impaired
Loans
|
Interest
Income
Recognized
|
|||||||||||||||||||||
|
December 31, 2014
|
||||||||||||||||||||||||||||
|
Consumer:
|
||||||||||||||||||||||||||||
|
Credit cards
|
$
|
197
|
$
|
197
|
$
|
-
|
$
|
197
|
$
|
6
|
$
|
425
|
$
|
20
|
||||||||||||||
|
Other consumer
|
604
|
610
|
9
|
619
|
118
|
780
|
34
|
|||||||||||||||||||||
|
Total consumer
|
801
|
807
|
9
|
816
|
124
|
1,205
|
54
|
|||||||||||||||||||||
|
Real estate:
|
||||||||||||||||||||||||||||
|
Construction
|
7,400
|
7,020
|
-
|
7,020
|
599
|
4,334
|
189
|
|||||||||||||||||||||
|
Single family residential
|
4,442
|
3,948
|
377
|
4,325
|
899
|
4,291
|
187
|
|||||||||||||||||||||
|
Other commercial
|
1,955
|
1,446
|
36
|
1,482
|
268
|
6,789
|
296
|
|||||||||||||||||||||
|
Total real estate
|
13,797
|
12,414
|
413
|
12,827
|
1,756
|
15,413
|
672
|
|||||||||||||||||||||
|
Commercial:
|
||||||||||||||||||||||||||||
|
Commercial
|
1,227
|
566
|
-
|
566
|
102
|
630
|
27
|
|||||||||||||||||||||
|
Agricultural
|
501
|
460
|
-
|
460
|
83
|
234
|
10
|
|||||||||||||||||||||
|
Total commercial
|
1,728
|
1,026
|
-
|
1,026
|
185
|
864
|
38
|
|||||||||||||||||||||
|
Total
|
$
|
16,236
|
$
|
14,247
|
$
|
422
|
$
|
14,669
|
$
|
2,065
|
$
|
17,482
|
$
|
764
|
||||||||||||||
|
December 31, 2013
|
||||||||||||||||||||||||||||
|
Consumer:
|
||||||||||||||||||||||||||||
|
Credit cards
|
$
|
520
|
$
|
520
|
$
|
-
|
$
|
520
|
$
|
16
|
$
|
518
|
$
|
15
|
||||||||||||||
|
Other consumer
|
925
|
878
|
32
|
910
|
171
|
993
|
41
|
|||||||||||||||||||||
|
Total consumer
|
1,445
|
1,398
|
32
|
1,430
|
187
|
1,511
|
56
|
|||||||||||||||||||||
|
Real estate:
|
||||||||||||||||||||||||||||
|
Construction
|
3,251
|
2,036
|
1,171
|
3,207
|
371
|
3,692
|
152
|
|||||||||||||||||||||
|
Single family residential
|
4,497
|
2,306
|
1,645
|
3,951
|
745
|
3,754
|
155
|
|||||||||||||||||||||
|
Other commercial
|
10,328
|
6,868
|
2,319
|
9,187
|
564
|
11,924
|
491
|
|||||||||||||||||||||
|
Total real estate
|
18,076
|
11,210
|
5,135
|
16,345
|
1,680
|
19,370
|
798
|
|||||||||||||||||||||
|
Commercial:
|
||||||||||||||||||||||||||||
|
Commercial
|
547
|
383
|
78
|
461
|
80
|
613
|
25
|
|||||||||||||||||||||
|
Agricultural
|
117
|
80
|
-
|
80
|
13
|
85
|
3
|
|||||||||||||||||||||
|
Total commercial
|
664
|
463
|
78
|
541
|
93
|
698
|
28
|
|||||||||||||||||||||
|
Total
|
$
|
20,185
|
$
|
13,071
|
$
|
5,245
|
$
|
18,316
|
$
|
1,960
|
$
|
21,579
|
$
|
882
|
||||||||||||||
At December 31, 2014, and December 31, 2013, impaired loans, net of government guarantees and excluding loans acquired, totaled $14.7 million and $18.3 million, respectively. Allocations of the allowance for loan losses relative to impaired loans were $2.1 million and $2.0 million at December 31, 2014 and 2013, respectively. Approximately $0.8 million, $0.9 million and $1.8 million of interest income was recognized on average impaired loans of $17.5 million, $21.6 million and $34.8 million for 2014, 2013 and 2012, respectively. Interest recognized on impaired loans on a cash basis during 2014, 2013 and 2012 was not material.
Included in certain impaired loan categories are troubled debt restructurings (“TDRs”). When the Company restructures a loan to a borrower that is experiencing financial difficulty and grants a concession that it would not otherwise consider, a “troubled debt restructuring” results and the Company classifies the loan as a TDR. The Company grants various types of concessions, primarily interest rate reduction and/or payment modifications or extensions, with an occasional forgiveness of principal.
Under ASC Topic 310-10-35 –
Subsequent Measurement
, a TDR is considered to be impaired, and an impairment analysis must be performed. The Company assesses the exposure for each modification, either by collateral discounting or by calculation of the present value of future cash flows, and determines if a specific allocation to the allowance for loan losses is needed.
83
Once an obligation has been restructured because of such credit problems, it continues to be considered a TDR until paid in full; or, if an obligation yields a market interest rate and no longer has any concession regarding payment amount or amortization, then it is not considered a TDR at the beginning of the calendar year after the year in which the improvement takes place. The Company returns TDRs to accrual status only if (1) all contractual amounts due can reasonably be expected to be repaid within a prudent period, and (2) repayment has been in accordance with the contract for a sustained period, typically at least six months.
The following table presents a summary of troubled debt restructurings, excluding loans acquired, segregated by class of loans.
|
Accruing TDR Loans
|
Nonaccrual TDR Loans
|
Total TDR Loans
|
||||||||||||||||||||||
|
(Dollars in thousands)
|
Number
|
Balance
|
Number
|
Balance
|
Number
|
Balance
|
||||||||||||||||||
|
December 31, 2014
|
||||||||||||||||||||||||
|
Real estate:
|
||||||||||||||||||||||||
|
Construction
|
-
|
$
|
-
|
1
|
$
|
391
|
1
|
$
|
391
|
|||||||||||||||
|
Single-family residential
|
2
|
393
|
1
|
3
|
3
|
396
|
||||||||||||||||||
|
Other commercial
|
3
|
1,840
|
1
|
614
|
4
|
2,454
|
||||||||||||||||||
|
Total real estate
|
5
|
2,233
|
3
|
1,008
|
8
|
3,241
|
||||||||||||||||||
|
Total
|
5
|
$
|
2,233
|
3
|
$
|
1,008
|
8
|
$
|
3,241
|
|||||||||||||||
|
December 31, 2013
|
||||||||||||||||||||||||
|
Real estate:
|
||||||||||||||||||||||||
|
Construction
|
1
|
$
|
988
|
-
|
$
|
-
|
1
|
$
|
988
|
|||||||||||||||
|
Single-family residential
|
4
|
862
|
-
|
-
|
4
|
862
|
||||||||||||||||||
|
Other commercial
|
9
|
6,974
|
1
|
608
|
10
|
7,582
|
||||||||||||||||||
|
Total real estate
|
14
|
8,824
|
1
|
608
|
15
|
9,432
|
||||||||||||||||||
|
Commercial:
|
||||||||||||||||||||||||
|
Commercial
|
1
|
39
|
1
|
60
|
2
|
99
|
||||||||||||||||||
|
Agricultural
|
1
|
635
|
-
|
-
|
1
|
635
|
||||||||||||||||||
|
Total commercial
|
2
|
674
|
1
|
60
|
3
|
734
|
||||||||||||||||||
|
Total
|
16
|
$
|
9,498
|
2
|
$
|
668
|
18
|
$
|
10,166
|
|||||||||||||||
The following table presents loans that were restructured as TDRs during the years ended December 31, 2014 and 2013, excluding loans acquired, segregated by class of loans.
|
Modification Type
|
||||||||||||||||||||||||
|
(Dollars in thousands)
|
Number of
Loans
|
Balance Prior
to TDR
|
Balance at
December 31
|
Change in
Maturity
Date
|
Change in
Rate
|
Financial Impact
on Date of
Restructure
|
||||||||||||||||||
|
Year Ended December 31, 2014
|
||||||||||||||||||||||||
|
Real estate:
|
||||||||||||||||||||||||
|
Other commercial
|
2
|
$
|
1,427
|
$
|
1,427
|
$
|
396
|
1,031
|
$
|
-
|
||||||||||||||
|
Total real estate
|
2
|
1,427
|
1,427
|
396
|
1,031
|
-
|
||||||||||||||||||
|
Commercial:
|
||||||||||||||||||||||||
|
Commercial
|
1
|
598
|
-
|
-
|
-
|
-
|
||||||||||||||||||
|
Total commercial
|
1
|
598
|
-
|
-
|
-
|
-
|
||||||||||||||||||
|
Total
|
3
|
$
|
2,025
|
$
|
1,427
|
$
|
396
|
$
|
1,031
|
$
|
-
|
|||||||||||||
|
Year Ended December 31, 2013
|
||||||||||||||||||||||||
|
Real estate:
|
||||||||||||||||||||||||
|
Single family residential
|
1
|
$
|
321
|
$
|
311
|
$
|
-
|
$
|
311
|
$
|
-
|
|||||||||||||
|
Total real estate
|
1
|
321
|
311
|
-
|
311
|
-
|
||||||||||||||||||
|
Total
|
1
|
$
|
321
|
$
|
311
|
$
|
-
|
$
|
311
|
$
|
-
|
|||||||||||||
84
During year ended December 31, 2014, the Company modified three loans with a total recorded investment of $2,025,000 prior to modification which were deemed troubled debt restructuring. The restructured loans were modified by various terms, including changing the maturity date and deferring amortized principal payments. Based on the fair value of the collateral, no specific reserve was determined necessary for these loans. Also, there was no immediate financial impact from the restructuring of these loans, as it was not considered necessary to charge-off interest or principal on the date of restructure. During the year ended December 31, 2014, one of the restructured loans with a prior balance of $598,000 was paid off.
During the year ended December 31, 2013, the Company modified a total of one loan with a recorded investment of $321,000 prior to modification which was deemed troubled debt restructuring. The restructured loan was modified by lowering of the interest rate. Based on the fair value of the collateral, no specific reserve was determined necessary for this loan. Also, there was no immediate financial impact from the restructuring of this loan, as it was not considered necessary to charge-off interest or principal on the date of restructure.
There were no loans for which a payment default occurred during the years ended December 31, 2014 and 2013, and that had been modified as a TDR within 12 months or less of the payment default, excluding loans acquired. We define a payment default as a payment received more than 90 days after its due date.
Credit Quality Indicators
– As part of the on-going monitoring of the credit quality of the Company’s loan portfolio, management tracks certain credit quality indicators including trends related to (i) the weighted-average risk rating of commercial and real estate loans, (ii) the level of classified commercial and real estate loans, (iii) net charge-offs, (iv) non-performing loans (see details above) and (v) the general economic conditions in the States of Arkansas, Kansas and Missouri.
The Company utilizes a risk rating matrix to assign a risk rate to each of its commercial and real estate loans. Loans are rated on a scale of 1 to 8. A description of the general characteristics of the 8 risk ratings is as follows:
|
·
|
Risk Rate 1 – Pass (Excellent)
– This category includes loans which are virtually free of credit risk. Borrowers in this category represent the highest credit quality and greatest financial strength.
|
|
·
|
Risk Rate 2 – Pass (Good)
- Loans under this category possess a nominal risk of default. This category includes borrowers with strong financial strength and superior financial ratios and trends. These loans are generally fully secured by cash or equivalents (other than those rated "excellent”).
|
|
·
|
Risk Rate 3 – Pass (Acceptable – Average)
- Loans in this category are considered to possess a normal level of risk. Borrowers in this category have satisfactory financial strength and adequate cash flow coverage to service debt requirements. If secured, the perfected collateral should be of acceptable quality and within established borrowing parameters.
|
|
·
|
Risk Rate 4 – Pass (Monitor)
- Loans in the Watch (Monitor) category exhibit an overall acceptable level of risk, but that risk may be increased by certain conditions, which represent "red flags". These "red flags" require a higher level of supervision or monitoring than the normal "Pass" rated credit. The borrower may be experiencing these conditions for the first time, or it may be recovering from weakness, which at one time justified a harsher rating. These conditions may include: weaknesses in financial trends; marginal cash flow; one-time negative operating results; non-compliance with policy or borrowing agreements; poor diversity in operations; lack of adequate monitoring information or lender supervision; questionable management ability/stability.
|
|
·
|
Risk Rate 5 – Special Mention
- A loan in this category has potential weaknesses that deserve management's close attention. If left uncorrected, these potential weaknesses may result in deterioration of the repayment prospects for the asset or in the institution's credit position at some future date. Special Mention loans are not adversely classified (although they are "criticized") and do not expose an institution to sufficient risk to warrant adverse classification. Borrowers may be experiencing adverse operating trends, or an ill-proportioned balance sheet. Non-financial characteristics of a Special Mention rating may include management problems, pending litigation, a non-existent, or ineffective loan agreement or other material structural weakness, and/or other significant deviation from prudent lending practices.
|
|
·
|
Risk Rate 6 – Substandard
- A Substandard loan is inadequately protected by the current sound worth and paying capacity of the borrower or of the collateral pledged, if any. Loans so classified must have a well-defined weakness, or weaknesses, that jeopardize the liquidation of the debt. The loans are characterized by the distinct possibility that the Company will sustain some loss if the deficiencies are not corrected. This does not imply ultimate loss of the principal, but may involve burdensome administrative expenses and the accompanying cost to carry the loan.
|
85
|
·
|
Risk Rate 7 – Doubtful
- A loan classified Doubtful has all the weaknesses inherent in a substandard loan except that the weaknesses make collection or liquidation in full (on the basis of currently existing facts, conditions, and values) highly questionable and improbable. Doubtful borrowers are usually in default, lack adequate liquidity, or capital, and lack the resources necessary to remain an operating entity. The possibility of loss is extremely high, but because of specific pending events that may strengthen the asset, its classification as loss is deferred. Pending factors include: proposed merger or acquisition; liquidation procedures; capital injection; perfection of liens on additional collateral; and refinancing plans. Loans classified as Doubtful are placed on nonaccrual status.
|
|
·
|
Risk Rate 8 – Loss
- Loans classified Loss are considered uncollectible and of such little value that their continuance as bankable assets is not warranted. This classification does not mean that the loans has absolutely no recovery or salvage value, but rather it is not practical or desirable to defer writing off this basically worthless loan, even though partial recovery may be affected in the future. Borrowers in the Loss category are often in bankruptcy, have formally suspended debt repayments, or have otherwise ceased normal business operations. Loans should be classified as Loss and charged-off in the period in which they become uncollectible.
|
Loans acquired, including loans covered by FDIC loss share agreements, are evaluated using this internal grading system. Loans acquired through FDIC-assisted transactions are accounted for in pools. All of the non-covered loan pools accounted for under ASC Topic 310-30 were considered satisfactory (Risk Ratings 1 – 4) at December 31, 2014 and December 31, 2013, respectively. Loans acquired in the Metropolitan and Delta Trust acquisitions are evaluated individually and include purchased credit impaired loans of $22.3 million and $27.4 million that are accounted for under ASC Topic 310-30 and are classified as substandard (Risk Rating 6) as of December 31, 2014 and December 31, 2013, respectively. Of the remaining loans acquired in the Metropolitan and Delta Trust transactions and accounted for under ASC Topic 310-20, $16.6 million and $31.2 million were classified (Risk Ratings 6, 7 and 8 – see classified loans discussion below) at December 31, 2014 and 2013, respectively. Loans acquired, covered by loss share agreements, have additional protection provided by the FDIC. During the 2014 quarterly impairment testing on the estimated cash flows of the credit impaired loans, the Company established that some of the pools covered by loss share from our FDIC-assisted transactions had experienced material projected credit deterioration. As a result, the Company established a $1.0 million allowance for loan losses on covered loans by recording a provision for loan losses of $0.4 million (net of FDIC-loss share adjustments) during the period ended December 31, 2014. See Note 5, Loans Acquired, for further discussion of the acquired loans, loan pools and loss sharing agreements.
Purchased credit impaired loans are loans that showed evidence of deterioration of credit quality since origination and for which it is probable, at acquisition, that the Company will be unable to collect all amounts contractually owed. Their fair value was initially based on the estimate of cash flows, both principal and interest, expected to be collected or estimated collateral values if cash flows are not estimable, discounted at prevailing market rates of interest. The difference between the undiscounted cash flows expected at acquisition and the fair value at acquisition is recognized as interest income on a level-yield method over the life of the loan. Contractually required payments for interest and principal that exceed the undiscounted cash flows expected at acquisition are not recognized as a yield adjustment. Increases in expected cash flows subsequent to the initial investment are recognized prospectively through adjustment of the yield on the loan over its remaining life. Decreases in expected cash flows are recognized as impairment.
Classified loans for the Company include loans in Risk Ratings 6, 7 and 8. Loans may be classified, but not considered impaired, due to one of the following reasons: (1) The Company has established minimum dollar amount thresholds for loan impairment testing. Loans rated 6 – 8 that fall under the threshold amount are not tested for impairment and therefore are not included in impaired loans. (2) Of the loans that are above the threshold amount and tested for impairment, after testing, some are considered to not be impaired and are not included in impaired loans. Total classified loans, excluding covered and non-covered loans acquired in FDIC-assisted transactions, were $82.1 million and $94.5 million as of December 31, 2014 and December 31, 2013, respectively.
86
The following table presents a summary of loans by credit risk rating, segregated by class of loans.
|
(In thousands)
|
Risk Rate
1-4
|
Risk Rate
5
|
Risk Rate
6
|
Risk Rate
7
|
Risk Rate
8
|
Total
|
||||||||||||||||||
|
December 31, 2014
|
||||||||||||||||||||||||
|
Consumer:
|
||||||||||||||||||||||||
|
Credit cards
|
$
|
184,923
|
$
|
-
|
$
|
457
|
$
|
-
|
$
|
-
|
$
|
185,380
|
||||||||||||
|
Other consumer
|
102,515
|
5
|
839
|
43
|
-
|
103,402
|
||||||||||||||||||
|
Total consumer
|
287,438
|
5
|
1,296
|
43
|
-
|
288,782
|
||||||||||||||||||
|
Real estate:
|
||||||||||||||||||||||||
|
Construction
|
176,825
|
84
|
5,059
|
-
|
-
|
181,968
|
||||||||||||||||||
|
Single family residential
|
446,040
|
1,776
|
7,665
|
82
|
-
|
455,563
|
||||||||||||||||||
|
Other commercial
|
698,329
|
7,074
|
9,394
|
-
|
-
|
714,797
|
||||||||||||||||||
|
Total real estate
|
1,321,194
|
8,934
|
22,118
|
82
|
-
|
1,352,328
|
||||||||||||||||||
|
Commercial:
|
||||||||||||||||||||||||
|
Commercial
|
271,017
|
1,544
|
19,248
|
11
|
-
|
291,820
|
||||||||||||||||||
|
Agricultural
|
115,106
|
20
|
532
|
-
|
-
|
115,658
|
||||||||||||||||||
|
Total commercial
|
386,123
|
1,564
|
19,780
|
11
|
-
|
407,478
|
||||||||||||||||||
|
Other
|
5,133
|
-
|
-
|
-
|
-
|
5,133
|
||||||||||||||||||
|
Loans acquired, not covered by FDIC loss share
|
535,728
|
1,435
|
36,958
|
1,854
|
5
|
575,980
|
||||||||||||||||||
|
Loans acquired, covered by FDIC loss share
|
106,933
|
-
|
-
|
-
|
-
|
106,933
|
||||||||||||||||||
|
Total
|
$
|
2,642,549
|
$
|
11,938
|
$
|
80,152
|
$
|
1,990
|
$
|
5
|
$
|
2,736,634
|
||||||||||||
|
(In thousands)
|
Risk Rate
1-4
|
Risk Rate
5
|
Risk Rate
6
|
Risk Rate
7
|
Risk Rate
8
|
Total
|
||||||||||||||||||
|
December 31, 2013
|
||||||||||||||||||||||||
|
Consumer:
|
||||||||||||||||||||||||
|
Credit cards
|
$
|
184,415
|
$
|
-
|
$
|
520
|
$
|
-
|
$
|
-
|
$
|
184,935
|
||||||||||||
|
Student loans
|
23,642
|
-
|
2,264
|
-
|
-
|
25,906
|
||||||||||||||||||
|
Other consumer
|
97,655
|
2
|
1,121
|
56
|
17
|
98,851
|
||||||||||||||||||
|
Total consumer
|
305,712
|
2
|
3,905
|
56
|
17
|
309,692
|
||||||||||||||||||
|
Real estate:
|
||||||||||||||||||||||||
|
Construction
|
142,213
|
71
|
4,174
|
-
|
-
|
146,458
|
||||||||||||||||||
|
Single family residential
|
383,934
|
1,412
|
6,939
|
-
|
-
|
392,285
|
||||||||||||||||||
|
Other commercial
|
600,045
|
7,597
|
18,691
|
-
|
-
|
626,333
|
||||||||||||||||||
|
Total real estate
|
1,126,192
|
9,080
|
29,804
|
-
|
-
|
1,165,076
|
||||||||||||||||||
|
Commercial:
|
||||||||||||||||||||||||
|
Commercial
|
162,118
|
200
|
2,001
|
10
|
-
|
164,329
|
||||||||||||||||||
|
Agricultural
|
98,761
|
-
|
125
|
-
|
-
|
98,886
|
||||||||||||||||||
|
Total commercial
|
260,879
|
200
|
2,126
|
10
|
-
|
263,215
|
||||||||||||||||||
|
Other
|
4,655
|
-
|
-
|
-
|
-
|
4,655
|
||||||||||||||||||
|
Loans acquired, not covered by FDIC loss share
|
457,097
|
-
|
58,547
|
-
|
-
|
515,644
|
||||||||||||||||||
|
Loans acquired, covered by FDIC loss share
|
146,653
|
-
|
-
|
-
|
-
|
146,653
|
||||||||||||||||||
|
Total
|
$
|
2,301,188
|
$
|
9,282
|
$
|
94,382
|
$
|
66
|
$
|
17
|
$
|
2,404,935
|
||||||||||||
87
Net (charge-offs)/recoveries for the years ended December 31, 2014 and 2013, excluding loans acquired, segregated by class of loans, were as follows:
|
(In thousands)
|
2014
|
2013
|
||||||
|
Consumer:
|
||||||||
|
Credit cards
|
$
|
(2,292
|
)
|
$
|
(2,362
|
)
|
||
|
Student loans
|
(38
|
)
|
(69
|
)
|
||||
|
Other consumer
|
(1,130
|
)
|
(901
|
)
|
||||
|
Total consumer
|
(3,460
|
)
|
(3,332
|
)
|
||||
|
Real estate:
|
||||||||
|
Construction
|
(356
|
)
|
(105
|
)
|
||||
|
Single family residential
|
(595
|
)
|
(256
|
)
|
||||
|
Other commercial
|
(167
|
)
|
(675
|
)
|
||||
|
Total real estate
|
(1,118
|
)
|
(1,036
|
)
|
||||
|
Commercial:
|
||||||||
|
Commercial
|
(704
|
)
|
(157
|
)
|
||||
|
Agricultural
|
(14
|
)
|
(33
|
)
|
||||
|
Total commercial
|
(718
|
)
|
(190
|
)
|
||||
|
Total
|
$
|
(5,296
|
)
|
$
|
(4,558
|
)
|
||
Allowance for Loan Losses
Allowance for Loan Losses
– The allowance for loan losses is a reserve established through a provision for loan losses charged to expense, which represents management’s best estimate of probable losses that have been incurred within the existing portfolio of loans. The allowance, in the judgment of management, is necessary to reserve for estimated loan losses and risks inherent in the loan portfolio. The Company’s allowance for loan loss methodology includes allowance allocations calculated in accordance with ASC Topic 310-10,
Receivables
, and allowance allocations calculated in accordance with ASC Topic 450-20,
Loss Contingencies
. Accordingly, the methodology is based on the Company’s internal grading system, specific impairment analysis, qualitative and quantitative factors.
As mentioned above, allocations to the allowance for loan losses are categorized as either specific allocations or general allocations.
A loan is considered impaired when it is probable that the Company will not receive all amounts due according to the contractual terms of the loan, including scheduled principal and interest payments. For a collateral dependent loan, the Company’s evaluation process includes a valuation by appraisal or other collateral analysis. This valuation is compared to the remaining outstanding principal balance of the loan. If a loss is determined to be probable, the loss is included in the allowance for loan losses as a specific allocation. If the loan is not collateral dependent, the measurement of loss is based on the difference between the expected and contractual future cash flows of the loan.
The general allocation is calculated monthly based on management’s assessment of several factors such as (1) historical loss experience based on volumes and types, (2) volume and trends in delinquencies and nonaccruals, (3) lending policies and procedures including those for loan losses, collections and recoveries, (4) national, state and local economic trends and conditions, (5) concentrations of credit within the loan portfolio, (6) the experience, ability and depth of lending management and staff and (7) other factors and trends that will affect specific loans and categories of loans. The Company establishes general allocations for each major loan category. This category also includes allocations to loans which are collectively evaluated for loss such as credit cards, one-to-four family owner occupied residential real estate loans and other consumer loans.
As of December 31, 2012, the Company refined its allowance calculation. As part of the refinement process, management evaluated the criteria previously applied to the entire loan portfolio, and used to calculate the unallocated portion of the allowance, and applied those criteria to each specific loan category. This included the impact of national, state and local economic trends, external factors and competition, economic outlook and business conditions and other factors and trends that will affect specific loans and categories of loans. As a result of the refined allowance calculation, the allocation of the Company’s allowance for loan losses may not be comparable with periods prior to December 31, 2012.
88
The following table details activity in the allowance for loan losses, excluding loans acquired, by portfolio segment for the year ended December 31, 2014. Allocation of a portion of the allowance to one category of loans does not preclude its availability to absorb losses in other categories.
|
(In thousands)
|
Commercial
|
Real
Estate
|
Credit
Card
|
Other
Consumer
and Other
|
Unallocated
|
Total
|
||||||||||||||||||
|
December 31, 2014
(1)
|
||||||||||||||||||||||||
|
Balance, beginning of year
|
$
|
3,205
|
$
|
16,885
|
$
|
5,430
|
$
|
1,922
|
$
|
-
|
$
|
27,442
|
||||||||||||
|
Provision for loan losses
(1)
|
4,475
|
(606
|
)
|
2,307
|
706
|
-
|
6,882
|
|||||||||||||||||
|
Charge-offs
|
(1,044
|
)
|
(2,684
|
)
|
(3,188
|
)
|
(1,638
|
)
|
-
|
(8,554
|
)
|
|||||||||||||
|
Recoveries
|
326
|
1,566
|
896
|
470
|
-
|
3,258
|
||||||||||||||||||
|
Net charge-offs
|
(718
|
)
|
(1,118
|
)
|
(2,292
|
)
|
(1,168
|
)
|
-
|
(5,296
|
)
|
|||||||||||||
|
Balance, end of year
(1)
|
$
|
6,962
|
$
|
15,161
|
$
|
5,445
|
$
|
1,460
|
$
|
-
|
$
|
29,028
|
||||||||||||
|
Period-end amount allocated to:
|
||||||||||||||||||||||||
|
Loans individually evaluated for impairment
|
$
|
185
|
$
|
1,756
|
$
|
6
|
$
|
118
|
$
|
-
|
$
|
2,065
|
||||||||||||
|
Loans collectively evaluated for impairment
|
6,777
|
13,405
|
5,439
|
1,342
|
-
|
26,963
|
||||||||||||||||||
|
Balance, end of year
|
$
|
6,962
|
$
|
15,161
|
$
|
5,445
|
$
|
1,460
|
$
|
-
|
$
|
29,028
|
||||||||||||
|
December 31, 2013
|
||||||||||||||||||||||||
|
Balance, beginning of year
|
$
|
3,446
|
$
|
15,453
|
$
|
7,211
|
$
|
1,772
|
$
|
-
|
$
|
27,882
|
||||||||||||
|
Provision for loan losses
|
(51
|
)
|
2,468
|
581
|
1,120
|
-
|
4,118
|
|||||||||||||||||
|
Charge-offs
|
(382
|
)
|
(1,628
|
)
|
(3,263
|
)
|
(1,561
|
)
|
-
|
(6,834
|
)
|
|||||||||||||
|
Recoveries
|
192
|
592
|
901
|
591
|
-
|
2,276
|
||||||||||||||||||
|
Net charge-offs
|
(190
|
)
|
(1,036
|
)
|
(2,362
|
)
|
(970
|
)
|
-
|
(4,558
|
)
|
|||||||||||||
|
Balance, end of year
|
$
|
3,205
|
$
|
16,885
|
$
|
5,430
|
$
|
1,922
|
$
|
-
|
$
|
27,442
|
||||||||||||
|
Period-end amount allocated to:
|
||||||||||||||||||||||||
|
Loans individually evaluated for impairment
|
$
|
93
|
$
|
1,680
|
$
|
16
|
$
|
171
|
$
|
-
|
$
|
1,960
|
||||||||||||
|
Loans collectively evaluated for impairment
|
3,112
|
15,205
|
5,414
|
1,751
|
-
|
25,482
|
||||||||||||||||||
|
Balance, end of year
|
$
|
3,205
|
$
|
16,885
|
$
|
5,430
|
$
|
1,922
|
$
|
-
|
$
|
27,442
|
||||||||||||
|
(1)
|
Provision for loan losses of $363,000 attributable to acquired loans, covered by FDIC loss share, was excluded from this table (total provision for loan losses for 2014 is $7,245,000). The gross provision for loans losses on covered loans was $954,000, offset by a $591,000 adjustment to the FDIC indemnification asset. The total allowance for loan losses at December 31, 2014, including $954,000 for covered loans, was $29,982,000.
|
89
Activity in the allowance for loan losses for the year ended December 31, 2012 was as follows:
|
December 31, 2012
|
||||||||||||||||||||||||
|
Balance, beginning of year
|
$
|
2,063
|
$
|
10,117
|
$
|
5,513
|
$
|
1,847
|
$
|
10,568
|
$
|
30,108
|
||||||||||||
|
Provision for loan losses
|
1,756
|
8,048
|
4,356
|
548
|
(10,568
|
)
|
4,140
|
|||||||||||||||||
|
Charge-offs
|
(543
|
)
|
(4,095
|
)
|
(3,516
|
)
|
(1,198
|
)
|
-
|
(9,352
|
)
|
|||||||||||||
|
Recoveries
|
170
|
1,383
|
858
|
575
|
-
|
2,986
|
||||||||||||||||||
|
Net charge-offs
|
(373
|
)
|
(2,712
|
)
|
(2,658
|
)
|
(623
|
)
|
-
|
(6,366
|
)
|
|||||||||||||
|
Balance, end of year
|
$
|
3,446
|
$
|
15,453
|
$
|
7,211
|
$
|
1,772
|
$
|
-
|
$
|
27,882
|
The Company’s recorded investment in loans, excluding loans acquired, as of December 31, 2014 and 2013 related to each balance in the allowance for loan losses by portfolio segment on the basis of the Company’s impairment methodology is as follows:
|
(In thousands)
|
Commercial
|
Real
Estate
|
Credit
Card
|
Other
Consumer
and Other
|
Total
|
|||||||||||||||
|
December 31, 2014
|
||||||||||||||||||||
|
Loans individually evaluated for impairment
|
$
|
1,026
|
$
|
12,827
|
$
|
197
|
$
|
619
|
$
|
14,669
|
||||||||||
|
Loans collectively evaluated for impairment
|
406,452
|
1,339,501
|
185,183
|
107,916
|
2,039,052
|
|||||||||||||||
|
Balance, end of period
|
$
|
407,478
|
$
|
1,352,328
|
$
|
185,380
|
$
|
108,535
|
$
|
2,053,721
|
||||||||||
|
December 31, 2013
|
||||||||||||||||||||
|
Loans individually evaluated for impairment
|
$
|
541
|
$
|
16,345
|
$
|
520
|
$
|
910
|
$
|
18,316
|
||||||||||
|
Loans collectively evaluated for impairment
|
262,674
|
1,148,731
|
184,415
|
128,502
|
1,724,322
|
|||||||||||||||
|
Balance, end of period
|
$
|
263,215
|
$
|
1,165,076
|
$
|
184,935
|
$
|
129,412
|
$
|
1,742,638
|
||||||||||
90
|
NOTE 5:
|
LOANS ACQUIRED
|
During the third quarter of 2014, the Company evaluated $308.2 million of net loans ($316.1 million gross loans less $7.9 million discount) purchased in conjunction with the acquisition of Delta Trust, described in Note 2, Acquisitions, in accordance with the provisions of ASC Topic 310-20,
Nonrefundable Fees and Other Costs
. The fair value discount is being accreted into interest income over the weighted average life of the loans using a constant yield method. These loans are not considered to be impaired loans. The Company evaluated the remaining $3.5 million of net loans ($10.7 million gross loans less $7.2 million discount) purchased in conjunction with the acquisition of Delta Trust for impairment in accordance with the provisions of ASC Topic 310-30,
Loans and Debt Securities Acquired with Deteriorated Credit Quality
. Purchased loans are considered impaired if there is evidence of credit deterioration since origination and if it is probable that not all contractually required payments will be collected.
During the fourth quarter of 2013, the Company evaluated $429.0 million of net loans ($442.0 million gross loans less $13.0 million discount) purchased in conjunction with the acquisition of Metropolitan, described in Note 2, Acquisitions, in accordance with the provisions of ASC Topic 310-20. The fair value discount is being accreted into interest income over the weighted average life of the loans using a constant yield method. These loans are not considered to be impaired loans. The Company evaluated the remaining $28.4 million of net loans ($52.8 million gross loans less $24.5 million discount) purchased in conjunction with the acquisition of Metropolitan for impairment in accordance with the provisions of ASC Topic 310-30. Purchased loans are considered impaired if there is evidence of credit deterioration since origination and if it is probable that not all contractually required payments will be collected.
The Company evaluated all of the loans purchased in conjunction with its previous FDIC-assisted transactions in accordance with the provisions of ASC Topic 310-30. All loans acquired in the FDIC transactions, both covered and not covered, were deemed to be impaired loans. All loans acquired, whether or not covered by FDIC loss share agreements, are considered impaired if there is evidence of credit deterioration since origination and if it is probable that not all contractually required payments will be collected. See Note 2, Acquisitions and Note 5, Loans Acquired, for further discussion of loans acquired.
The following table reflects the carrying value of all acquired loans as of December 31, 2014 and 2013:
|
Loans Acquired
At December 31,
|
||||||||
|
(in thousands)
|
2014
|
2013
|
||||||
|
Consumer:
|
||||||||
|
Credit cards
|
$
|
-
|
$
|
8,116
|
||||
|
Other consumer
|
8,514
|
15,242
|
||||||
|
Total consumer
|
8,514
|
23,358
|
||||||
|
Real estate:
|
||||||||
|
Construction
|
46,911
|
29,936
|
||||||
|
Single family residential
|
175,970
|
87,861
|
||||||
|
Other commercial
|
390,877
|
449,285
|
||||||
|
Total real estate
|
613,758
|
567,082
|
||||||
|
Commercial:
|
||||||||
|
Commercial
|
56,134
|
71,857
|
||||||
|
Agricultural
|
4,507
|
-
|
||||||
|
Total commercial
|
60,641
|
71,857
|
||||||
|
Total loans acquired
(1)
|
$
|
682,913
|
$
|
662,297
|
||||
|
(1)
|
Loans acquired include $106.9 million (net of $1.0 million allowance) and $146.7 million of loans covered by FDIC loss share agreements at December 31, 2014 and 2013, respectively.
|
91
Nonaccrual acquired loans, excluding loans and loans covered by loss share accounted for under ASC Topic 310-30, at December 31, 2014, segregated by class of loans, are as follows (see Note 4, Loans an Allowance for Loan Losses, for discussion of nonaccrual loans):
|
(In thousands)
|
2014
|
|||
|
Consumer:
|
||||
|
Other consumer
|
$ |
29
|
||
|
Total consumer
|
29
|
|||
|
Real estate:
|
||||
|
Construction
|
105
|
|||
|
Single family residential
|
2,018
|
|||
|
Other commercial
|
271
|
|||
|
Total real estate
|
2,394
|
|||
|
Commercial:
|
||||
|
Commercial
|
291
|
|||
|
Agricultural
|
3
|
|||
|
Total commercial
|
294
|
|||
|
Total
|
$
|
2,717
|
||
An age analysis of past due acquired loans, excluding loans covered by loss share, at December 31, 2014, segregated by class of loans, is as follows (see Note 4, Loans an Allowance for Loan Losses, for discussion of past due loans):
|
(In thousands)
|
Gross
30-89 Days
Past Due
|
90 Days
or More
Past Due
|
Total
Past Due
|
Current
|
Total
Loans
|
90 Days
Past Due &
Accruing
|
||||||||||||||||||
|
December 31, 2014
|
||||||||||||||||||||||||
|
Consumer:
|
||||||||||||||||||||||||
|
Other consumer
|
$
|
70
|
$
|
34
|
$
|
104
|
$
|
8,407
|
$
|
8,511
|
$
|
5
|
||||||||||||
|
Total consumer
|
70
|
34
|
104
|
8,407
|
8,511
|
5
|
||||||||||||||||||
|
Real estate:
|
||||||||||||||||||||||||
|
Construction
|
292
|
105
|
397
|
36,450
|
36,847
|
-
|
||||||||||||||||||
|
Single family residential
|
3,804
|
2,906
|
6,710
|
138,383
|
145,093
|
594
|
||||||||||||||||||
|
Other commercial
|
1,415
|
5,994
|
7,409
|
326,759
|
334,168
|
-
|
||||||||||||||||||
|
Total real estate
|
5,511
|
9,005
|
14,516
|
501,592
|
516,108
|
594
|
||||||||||||||||||
|
Commercial:
|
||||||||||||||||||||||||
|
Commercial
|
110
|
421
|
531
|
46,730
|
47,261
|
-
|
||||||||||||||||||
|
Agricultural
|
-
|
-
|
-
|
4,100
|
4,100
|
-
|
||||||||||||||||||
|
Total commercial
|
110
|
421
|
531
|
50,830
|
51,361
|
-
|
||||||||||||||||||
|
Other
|
-
|
-
|
-
|
-
|
-
|
|||||||||||||||||||
|
Total
|
$
|
5,691
|
$
|
9,460
|
$
|
15,151
|
$
|
560,829
|
$
|
575,980
|
$
|
599
|
||||||||||||
92
The following table presents a summary of acquired loans, excluding loans covered by loss share, at December 31, 2014, by credit risk rating, segregated by class of loans (see Note 4, Loans an Allowance for Loan Losses, for discussion of loan risk rating).
|
(In thousands)
|
Risk Rate
1-4
|
Risk Rate
5
|
Risk Rate
6
|
Risk Rate
7
|
Risk Rate
8
|
Total
|
||||||||||||||||||
|
December 31, 2014
|
||||||||||||||||||||||||
|
Consumer:
|
||||||||||||||||||||||||
|
Other consumer
|
$
|
8,479
|
$
|
-
|
$
|
32
|
$
|
-
|
$
|
-
|
$
|
8,511
|
||||||||||||
|
Total consumer
|
8,479
|
-
|
32
|
-
|
-
|
8,511
|
||||||||||||||||||
|
Real estate:
|
||||||||||||||||||||||||
|
Construction
|
27,430
|
78
|
9,339
|
-
|
-
|
36,847
|
||||||||||||||||||
|
Single family residential
|
135,240
|
683
|
7,311
|
1,854
|
5
|
145,093
|
||||||||||||||||||
|
Other commercial
|
317,965
|
605
|
15,598
|
-
|
-
|
334,168
|
||||||||||||||||||
|
Total real estate
|
480,635
|
1,366
|
32,248
|
1,854
|
5
|
516,108
|
||||||||||||||||||
|
Commercial:
|
||||||||||||||||||||||||
|
Commercial
|
43,585
|
69
|
3,607
|
-
|
-
|
47,261
|
||||||||||||||||||
|
Agricultural
|
3,030
|
-
|
1,070
|
-
|
-
|
4,100
|
||||||||||||||||||
|
Total commercial
|
46,615
|
69
|
4,677
|
-
|
-
|
51,361
|
||||||||||||||||||
|
Total
|
$
|
535,729
|
$
|
1,435
|
$
|
36,957
|
$
|
1,854
|
$
|
5
|
$
|
575,980
|
||||||||||||
Loans acquired as a part of the Metropolitan and Delta Trust transactions were individually evaluated and recorded at estimated fair value, including estimated credit losses, at the time of acquisition. The loans acquired in FDIC assisted transactions were grouped into pools based on common risk characteristics and the pools were recorded at their estimated fair values, which incorporated estimated credit losses at the acquisition date. These loans and loan pools are systematically reviewed by the Company to determine the risk of losses that may exceed those identified at the time of the acquisition. Techniques used in determining risk of loss are similar to the Company’s legacy loan portfolio, with most focus being placed on those loans which include the larger loan relationships and those loans which exhibit higher risk characteristics.
The following is a summary of the non-covered loans acquired in the Delta acquisition on August 31, 2014, as of the date of acquisition.
|
(in thousands)
|
Not Impaired
|
Impaired
|
||||||
|
Contractually required principal and interest at acquisition
|
$ | 316,103 | $ | 10,726 | ||||
|
Non-accretable difference (expected losses and foregone interest)
|
- | (7,023 | ) | |||||
|
Cash flows expected to be collected at acquisition
|
316,103 | 3,703 | ||||||
|
Accretable yield
|
(7,949 | ) | (177 | ) | ||||
|
Basis in acquired loans at acquisition
|
$ | 308,154 | $ | 3,526 | ||||
The following is a summary of the non-covered loans acquired in the Metropolitan acquisition on November 25, 2013, as of the date of acquisition.
|
(in thousands)
|
Not Impaired
|
Impaired
|
||||||
|
Contractually required principal and interest at acquisition
|
$ | 442,009 | $ | 52,830 | ||||
|
Non-accretable difference (expected losses and foregone interest)
|
- | (21,962 | ) | |||||
|
Cash flows expected to be collected at acquisition
|
442,009 | 30,868 | ||||||
|
Accretable yield
|
(12,989 | ) | (2,516 | ) | ||||
|
Basis in acquired loans at acquisition
|
$ | 429,020 | $ | 28,352 | ||||
93
The following is a summary of the covered impaired loans acquired in the acquisitions during 2012, as of the dates of a
cquisition:
|
(in thousands)
|
Truman
|
Excel
|
||||||
|
Contractually required principal and interest at acquisition
|
$
|
90,227
|
$
|
121,850
|
||||
|
Non-accretable difference (expected losses and foregone interest)
|
(25,308
|
)
|
(29,258
|
)
|
||||
|
Cash flows expected to be collected at acquisition
|
64,919
|
92,592
|
||||||
|
Accretable yield
|
(7,778
|
)
|
(14,445
|
)
|
||||
|
Basis in acquired loans at acquisition
|
$
|
57,141
|
$
|
78,147
|
||||
The following is a summary of the non-covered impaired loans acquired in the acquisitions during 2012, as of the dates of acquisition.
|
(in thousands)
|
Truman
|
Excel
|
||||||
|
Contractually required principal and interest at acquisition
|
$
|
99,065
|
$
|
30,048
|
||||
|
Non-accretable difference (expected losses and foregone interest)
|
(12,248
|
)
|
(5,170
|
)
|
||||
|
Cash flows expected to be collected at acquisition
|
86,817
|
24,878
|
||||||
|
Accretable yield
|
(13,422
|
)
|
(3,726
|
)
|
||||
|
Basis in acquired loans at acquisition
|
$
|
73,395
|
$
|
21,152
|
||||
As of the respective acquisition dates, the estimates of contractually required payments receivable, including interest, for all covered and non-covered loans acquired in the Delta Trust, Metropolitan, Truman and Excel transactions were $836.0 million. The cash flows expected to be collected as of the acquisition dates for these loans were $742.1 million, including interest. These amounts were determined based upon the estimated remaining life of the underlying loans, which includes the effects of estimated prepayments.
The amount of the estimated cash flows expected to be received from the acquired loan pools and purchased credit impaired loans in excess of the fair values recorded for the loan pools and the purchased credit impaired loans is referred to as the accretable yield. The accretable yield is recognized as interest income over the estimated lives of the loans. Each quarter, the Company estimates the cash flows expected to be collected from the acquired loan pools and purchased credit impaired loans, and adjustments may or may not be required. This has resulted in increased interest income that is spread on a level-yield basis over the remaining expected lives of the loan pools. Because these particular loan pools are covered by FDIC loss share, the increases in expected cash flows also reduce the amount of expected reimbursements under the loss sharing agreements with the FDIC, which are recorded as indemnification assets. The estimated adjustments to the indemnification assets are amortized on a level-yield basis over the remainder of the loss sharing agreements or the remaining expected lives of the loan pools, whichever is shorter.
The impact of the adjustments on the Company’s financial results for the years ended December 31, 2014 and 2013 is shown below:
|
(In thousands)
|
2014
|
2013
|
||||||
|
Impact on net interest income
|
$
|
26,400
|
$
|
18,905
|
||||
|
Non-interest income
|
(20,540
|
)
|
(18,106
|
)
|
||||
|
Net impact to pre-tax income
|
5,860
|
799
|
||||||
|
Net impact, net of taxes
|
$
|
3,561
|
$
|
486
|
||||
Because these adjustments will be recognized over the remaining lives of the loan pools and the remainder of the loss sharing agreements, respectively, they will impact future periods as well. The current estimate of the remaining accretable yield adjustment that will positively impact interest income is $17.0 million and the remaining adjustment to the indemnification assets that will reduce non-interest income is $10.6 million. Of the remaining adjustments, the Company expects to recognize $9.1 million of interest income and a $7.9 million reduction of non-interest income for a net addition to pre-tax income of approximately $1.2 million during 2015. The accretable yield adjustments recorded in future periods will change as the Company continues to evaluate expected cash flows from the acquired loan pools.
94
Changes in the carrying amount of the accretable yield for all purchased impaired loans were as follows for the years ended December 31, 2014, 2013 and 2012.
|
(in thousands)
|
Accretable
Yield
|
Carrying
Amount of
Loans
|
||||||
|
Balance, January 1, 2012
|
$
|
42,833
|
$
|
158,075
|
||||
|
Additions
|
39,371
|
229,835
|
||||||
|
Accretion
|
(24,138
|
)
|
24,138
|
|||||
|
Payments and other reductions, net
|
-
|
(118,442
|
)
|
|||||
|
Balance, December 31, 2012
|
58,066
|
293,606
|
||||||
|
Additions
|
2,516
|
28,352
|
||||||
|
Accretable yield adjustments
|
17,380
|
-
|
||||||
|
Accretion
|
(36,577
|
)
|
36,577
|
|||||
|
Payments and other reductions, net
|
-
|
(123,750
|
)
|
|||||
|
Balance, December 31, 2013
|
41,385
|
234,785
|
||||||
|
Additions
|
177
|
3,526
|
||||||
|
Accretable yield adjustments
|
9,104
|
-
|
||||||
|
Accretion
|
(30,031
|
)
|
30,031
|
|||||
|
Payments and other reductions, net
|
-
|
(99,122
|
)
|
|||||
|
Balance, December 31, 2014
|
$
|
20,635
|
$
|
169,098
|
||||
Purchased impaired loans on the FDIC-assisted transactions are evaluated in pools with similar characteristics. Because some pools evaluated by the Company, covered by loss share agreements, were determined to have experienced impairment in the estimated credit quality or cash flows during 2014, the Company recorded a provision to establish a $1.0 million allowance for loan losses for covered purchased impaired loans. For Metropolitan and Delta Trust, purchased impaired loans are evaluated on an individual borrower basis. No loans, not covered by loss share, evaluated by the Company were determined to have experienced further impairment. Therefore, there were no allowances for loan losses related to the non-covered purchased impaired loans at December 31, 2014 or 2013.
The purchase and assumption agreements for the FDIC-assisted acquisitions allow for the FDIC to recover a portion of the funds previously paid out under the indemnification agreement in the event losses fail to reach the expected loss level under a claw back provision (“true-up provision”). The amount of the true-up provision for each acquisition is measured and recorded at Day 1 fair values. It is calculated as the difference between management’s estimated losses on covered loans and covered foreclosed assets and the loss threshold contained in each loss share agreement, multiplied by the applicable clawback provisions contained in each loss share agreement. This true-up amount, which is payable to the FDIC upon termination of the applicable loss share agreement, is then discounted back to net present value. To the extent that actual losses on covered loans and covered foreclosed assets are less than estimated losses, the applicable true-up provision payable to the FDIC upon termination of the loss share agreements will increase. To the extent that actual losses on covered loans and covered foreclosed assets are more than estimated losses, the applicable true-up provision payable to the FDIC upon termination of the loss share agreements will decrease.
95
The following table presents a summary of the changes in the FDIC true-up provision for years ended December 31, 2014, 2013 and 2012, which is included in other assets on the balance sheet.
|
(in thousands)
|
FDIC True-up Provision
|
|||
|
Balance, January 1, 2012
|
$
|
3,419
|
||
|
FDIC true-up provision recorded on new acquisitions
|
328
|
|||
|
Amortization expense
|
138
|
|||
|
Adjustments related to changes in expected losses
|
969
|
|||
|
Balance, December 31, 2012
|
4,854
|
|||
|
Amortization expense
|
160
|
|||
|
Adjustments related to changes in expected losses
|
1,754
|
|||
|
Balance, December 31, 2013
|
6,768
|
|||
|
Amortization expense
|
168
|
|||
|
Adjustments related to changes in expected losses
|
1,372
|
|||
|
Balance, December 31, 2014
|
$
|
8,308
|
||
|
NOTE 6:
|
GOODWILL AND OTHER INTANGIBLE ASSETS
|
Goodwill is tested annually, or more often than annually, if circumstances warrant, for impairment. If the implied fair value of goodwill is lower than its carrying amount, goodwill impairment is indicated, and goodwill is written down to its implied fair value. Subsequent increases in goodwill value are not recognized in the financial statements. Goodwill totaled $108.1 million at December 31, 2014 and $78.5 million at December 31, 2013. The Company recorded $29.0 million of goodwill during 2014 as a result of its Delta Trust acquisition. The Company recorded $17.9 million of goodwill during 2013 as a result of its Metropolitan acquisition. Goodwill impairment was neither indicated nor recorded in 2014, 2013 or 2012.
Core deposit premiums are amortized over a ten year period and are periodically evaluated, at least annually, as to the recoverability of their carrying value. Core deposit premiums of $4.3 million were recorded in 2014 as part of the Delta Trust acquisition. Core deposit premiums of $9.8 million were recorded in 2013 as part of the Metropolitan acquisition.
The Delta Trust acquisition included some significant lines of business related to investments, trust and insurance. The Company recorded $5.1 million of intangible assets related to those acquired lines of business during the third quarter of 2014. These intangible assets are being amortized over various periods ranging from 10 to 15 years.
On September 30, 2013, the Company acquired a credit card portfolio and recorded Purchased Credit Card Relationships (“PCCR’s”) of $2.1 million. This intangible asset is being amortized over a five year period.
96
The Company’s goodwill and other intangibles (carrying basis and accumulated amortization) at December 31, 2014 and 2013 were as follows:
|
(In thousands)
|
2014
|
2013
|
||||||
|
Goodwill
|
$
|
108,095
|
$
|
78,529
|
||||
|
Core deposit premiums:
|
||||||||
|
Gross carrying amount
|
18,318
|
15,245
|
||||||
|
Accumulated amortization
|
(2,386
|
)
|
(2,237
|
)
|
||||
|
Core deposit premiums, net
|
15,932
|
13,008
|
||||||
|
Purchased credit card relationships:
|
||||||||
|
Gross carrying amount
|
2,068
|
2,068
|
||||||
|
Accumulated amortization
|
(517
|
)
|
(104
|
)
|
||||
|
Purchased credit card relationships, net
|
1,551
|
1,964
|
||||||
|
Books of business intangible:
|
||||||||
|
Gross carrying amount
|
5,140
|
-
|
||||||
|
Accumulated amortization
|
(97
|
)
|
-
|
|||||
|
Books of business intangible, net
|
5,043
|
-
|
||||||
|
Other intangible assets, net
|
22,526
|
14,972
|
||||||
|
Total goodwill and other intangible assets
|
$
|
130,621
|
$
|
93,501
|
||||
Core deposit premium amortization expense recorded for the years ended December 31, 2014, 2013 and 2012 was $1.4 million, $600,000 and $347,000, respectively. The Company’s estimated remaining amortization expense on core deposit premiums as of December 31, 2014 is as follows:
|
(In thousands)
|
Year
|
Amortization
Expense
|
|||
|
2015
|
$
|
1,943
|
|||
|
2016
|
1,817
|
||||
|
2017
|
1,817
|
||||
|
2018
|
1,817
|
||||
|
2019
|
1,817
|
||||
|
Thereafter
|
6,721
|
||||
|
Total
|
$
|
15,932
|
|||
PCCR amortization expense recorded for the year ended December 31, 2014 was $414,000 and $104, 000 for the year ended December 31, 2013. There was no PCCR amortization expense recorded for the year ended December 31, 2012. The Company’s estimated remaining amortization expense on PCCR’s as of December 31, 2014 is as follows:
|
(In thousands)
|
Year
|
Amortization
Expense
|
|||
|
2015
|
$
|
414
|
|||
|
2016
|
414
|
||||
|
2017
|
414
|
||||
|
2018
|
309
|
||||
|
Total
|
$
|
1,551
|
|||
97
Book of business amortization expense recorded for the year ended December 31, 2014 was $151,000. There was no book of business amortization expense recorded for years ended December 31, 2013 or 2012. The Company’s estimated remaining amortization expense on its books of business as of December 31, 2014 is as follows:
|
(In thousands)
|
Year
|
Amortization
Expense
|
|||
|
2015
|
$
|
385
|
|||
|
2016
|
385
|
||||
|
2017
|
385
|
||||
|
2018
|
385
|
||||
|
2019
|
385
|
||||
|
Thereafter
|
3,118
|
||||
|
Total
|
$
|
5,043
|
|||
|
NOTE 7:
|
TIME DEPOSITS
|
Time deposits included approximately $434,297,000 and $504,782,000 of certificates of deposit of $100,000 or more, at December 31, 2014 and 2013, respectively. Brokered deposits were $7,427,000 and $16,805,000 at December 31, 2014 and 2013, respectively. Maturities of all time deposits are as follows: 2015 – $689,638,000; 2016 – $194,508,000; 2017 – $63,125,000; 2018 – $9,412,000; 2019 – $8,460,000 and $44,000 thereafter.
Deposits are the Company's primary funding source for loans and investment securities. The mix and repricing alternatives can significantly affect the cost of this source of funds and, therefore, impact the interest margin.
|
NOTE 8:
|
INCOME TAXES
|
The provision (benefit) for income taxes for the years ended December 31 is comprised of the following components:
|
(In thousands)
|
2014
|
2013
|
2012
|
|||||||||
|
Income taxes currently payable
|
$
|
23,631
|
$
|
13,923
|
$
|
11,846
|
||||||
|
Deferred income taxes
|
(9,029
|
)
|
(4,618
|
)
|
485
|
|||||||
|
Provision for income taxes
|
$
|
14,602
|
$
|
9,305
|
$
|
12,331
|
||||||
98
The tax effects of temporary differences between the tax basis of assets and liabilities and their financial reporting amounts that give rise to deferred income tax assets and liabilities, and their approximate tax effects, are as follows as of December 31, 2014 and 2013:
|
(In thousands)
|
2014
|
2013
|
||||||
|
Deferred tax assets:
|
||||||||
|
Loans acquired
|
$
|
16,925
|
$
|
14,456
|
||||
|
FDIC true-up liability
|
2,792
|
2,918
|
||||||
|
Allowance for loan losses
|
11,749
|
11,307
|
||||||
|
Valuation of foreclosed assets
|
14,167
|
14,053
|
||||||
|
Tax NOLs from acquisition
|
11,819
|
11,819
|
||||||
|
Deferred compensation payable
|
1,536
|
1,263
|
||||||
|
Vacation compensation
|
1,456
|
1,148
|
||||||
|
Accumulated depreciation
|
1,937
|
4,939
|
||||||
|
Loan interest
|
1,693
|
767
|
||||||
|
Accrued pension and profit sharing
|
1,793
|
1,682
|
||||||
|
Accrued equity and other compensation
|
3,356
|
579
|
||||||
|
Acquired securities
|
2,568
|
2,643
|
||||||
|
Accrued merger related costs
|
2,464
|
1,032
|
||||||
|
Unrealized loss on available-for-sale securities
|
862
|
1,938
|
||||||
|
Other
|
2,283
|
15
|
||||||
|
Gross deferred tax assets
|
77,400
|
70,559
|
||||||
|
Deferred tax liabilities:
|
||||||||
|
Goodwill and other intangible amortization
|
(16,953
|
)
|
(6,803
|
)
|
||||
|
FDIC acquired assets
|
(4,377
|
)
|
(14,524
|
)
|
||||
|
Deferred loan fee income and expenses, net
|
(1,515
|
)
|
(2,697
|
)
|
||||
|
FHLB stock dividends
|
(1,160
|
)
|
(1,115
|
)
|
||||
|
Limitations under IRC Sec 382
|
(11,169
|
)
|
(13,812
|
)
|
||||
|
Other
|
(1,478
|
)
|
(1,376
|
)
|
||||
|
Gross deferred tax liabilities
|
(36,652
|
)
|
(40,327
|
)
|
||||
|
Net deferred tax asset, included in other assets
|
$
|
40,748
|
$
|
30,232
|
||||
A reconciliation of income tax expense at the statutory rate to the Company's actual income tax expense is shown below for the years ended December 31:
|
(In thousands)
|
2014
|
2013
|
2012
|
|||||||||
|
Computed at the statutory rate (35%)
|
$
|
17,601
|
$
|
11,387
|
$
|
14,012
|
||||||
|
Increase (decrease) in taxes resulting from:
|
||||||||||||
|
State income taxes, net of federal tax benefit
|
41
|
825
|
1,142
|
|||||||||
|
Tax exempt income
|
(3,774
|
)
|
(2,739
|
)
|
(2,615
|
)
|
||||||
|
Tax exempt earnings on BOLI
|
(499
|
)
|
(461
|
)
|
(512
|
)
|
||||||
|
Other differences, net
|
1,233
|
293
|
304
|
|||||||||
|
Actual tax provision
|
$
|
14,602
|
$
|
9,305
|
$
|
12,331
|
||||||
The Company follows ASC Topic 740,
Income Taxes
, which prescribes a recognition threshold and a measurement attribute for the financial statement recognition and measurement of a tax position taken or expected to be taken in a tax return. Benefits from tax positions should be recognized in the financial statements only when it is more likely than not that the tax position will be sustained upon examination by the appropriate taxing authority that would have full knowledge of all relevant information. A tax position that meets the more-likely-than-not recognition threshold is measured at the largest amount of benefit that is greater than fifty percent likely of being realized upon ultimate settlement. Tax positions that previously failed to meet the more-likely-than-not recognition threshold should be recognized in the first subsequent financial reporting period in which that threshold is met. Previously recognized tax positions that no longer meet the more-likely-than-not recognition threshold should be derecognized in the first subsequent financial reporting period in which that threshold is no longer met. ASC Topic 740 also provides guidance on the accounting for and disclosure of unrecognized tax benefits, interest and penalties.
99
The amount of unrecognized tax benefits may increase or decrease in the future for various reasons including adding amounts for current tax year positions, expiration of open income tax returns due to the statutes of limitation, changes in management’s judgment about the level of uncertainty, status of examinations, litigation and legislative activity and the addition or elimination of uncertain tax positions.
As discussed in Note 2, Metropolitan National Bank had approximately $72.8 million in net operating loss carryforward of which approximately $34.0 million is expected to be utilized by the Company under Internal Revenue Code Section 382 limitation calculations. The net operating loss carryforwards expire between 2028 and 2032.
The Company files income tax returns in the U.S. federal jurisdiction. The Company’s U.S. federal income tax returns are open and subject to examinations from the 2011 tax year and forward. The Company’s various state income tax returns are generally open from the 2008 and later tax return years based on individual state statute of limitations.
|
NOTE 9:
|
OTHER BORROWINGS AND SUBORDINATED DEBENTURES
|
Debt at December 31, 2014, and 2013 consisted of the following components.
|
(In thousands)
|
2014
|
2013
|
||||||
|
Other Borrowings
|
||||||||
|
FHLB advances, due 2015 to 2033, 0.35% to 8.41%, secured by residential real estate loans
|
$
|
71,582
|
$
|
71,090
|
||||
|
Notes payable, due 01/31/2015 to 12/31/2016, 3.25%, floating rate, unsecured
|
43,100
|
46,000
|
||||||
|
114,682
|
117,090
|
|||||||
|
Subordinated Debentures
|
||||||||
|
Trust preferred securities, due 12/30/2033, floating rate of 2.80% above the three-month LIBOR rate, reset quarterly, callable without penalty
|
20,620
|
20,620
|
||||||
|
Total other borrowings and subordinated debentures
|
$
|
135,302
|
$
|
137,710
|
||||
During the fourth quarter of 2013, the Company borrowed $46.0 million from correspondent banks to partially fund the acquisition of Metropolitan. This debt is unsecured and is all scheduled to be repaid by December 31, 2016.
At December 31, 2014, the Company had no Federal Home Loan Bank (“FHLB”) advances with original maturities of one year or less.
The Company had total FHLB advances of $71.6 million at December 31, 2014, with approximately $700.8 million of additional advances available from the FHLB.
The FHLB advances are secured by mortgage loans and investment securities totaling approximately $800.9 million at December 31, 2014.
The trust preferred securities are tax-advantaged issues that qualify for Tier 1 capital treatment. Distributions on these securities are included in interest expense. Each of the trusts is a statutory business trust organized for the sole purpose of issuing trust securities and investing the proceeds thereof in junior subordinated debentures of the Company, the sole asset of each trust. The preferred securities of each trust represent preferred beneficial interests in the assets of the respective trusts and are subject to mandatory redemption upon payment of the junior subordinated debentures held by the trust. The common securities of each trust are wholly-owned by the Company. Each trust’s ability to pay amounts due on the trust preferred securities is solely dependent upon the Company making payment on the related junior subordinated debentures. The Company’s obligations under the junior subordinated securities and other relevant trust agreements, in aggregate, constitute a full and unconditional guarantee by the Company of each respective trust’s obligations under the trust securities issued by each respective trust.
100
Aggregate annual maturities of long-term debt at December 31, 2014 are as follows:
|
(In thousands)
|
Year
|
Annual
Maturities
|
|||
|
2015
|
$
|
15,056
|
|||
|
2016
|
55,176
|
||||
|
2017
|
21,952
|
||||
|
2018
|
6,550
|
||||
|
2019
|
2,742
|
||||
|
Thereafter
|
33,826
|
||||
|
Total
|
$
|
135,302
|
|||
|
NOTE 10:
|
CAPITAL STOCK
|
On February 27, 2009, at a special meeting, the Company’s shareholders approved an amendment to the Articles of Incorporation to establish 40,040,000 authorized shares of preferred stock, $0.01 par value. The aggregate liquidation preference of all shares of preferred stock cannot exceed $80,000,000. As of December 31, 2014, no preferred stock has been issued.
On July 23, 2012, the Company approved a stock repurchase program which authorized the repurchase of up to 850,000 shares of Class A common stock, or approximately 5% of the shares outstanding. The shares are to be purchased from time to time at prevailing market prices, through open market or unsolicited negotiated transactions, depending upon market conditions. Under the repurchase program, there is no time limit for the stock repurchases, nor is there a minimum number of shares that the Company intends to repurchase. The Company may discontinue purchases at any time that management determines additional purchases are not warranted. The Company intends to use the repurchased shares to satisfy stock option exercises, payment of future stock awards and dividends and general corporate purposes.
During 2013, the Company repurchased 419,564 shares of stock with a weighted average repurchase price of $25.89 per share. Under the current stock repurchase plan, the Company can repurchase an additional 154,136 shares. As a result of its announced acquisition of Metropolitan National Bank, the Company suspended its stock repurchases in August of 2013. See Note 2, Acquisitions, for additional information on the Metropolitan acquisition.
On March 4, 2014 the Company filed a shelf registration statement with the Securities and Exchange Commission (“SEC”). Subsequently, on June 18, 2014 the Company filed Amendment No. 1 to the shelf registration statement. After becoming effective, the shelf registration statement allows the Company to raise capital from time to time, up to an aggregate of $300 million, through the sale of common stock, preferred stock, stock warrants, stock rights or a combination thereof, subject to market conditions. Specific terms and prices are determined at the time of any offering under a separate prospectus supplement that the Company is required to file with the SEC at the time of the specific offering
.
101
|
NOTE 11:
|
TRANSACTIONS WITH RELATED PARTIES
|
At December 31, 2014 and 2013, the subsidiary bank had extensions of credit to executive officers and directors and to companies in which the subsidiary bank’s executive officers or directors were principal owners in the amount of $25.1 million in 2014 and $42.0 million in 2013.
|
(In thousands)
|
2014
|
2013
|
||||||
|
Balance, beginning of year
|
$
|
42,018
|
$
|
27,790
|
||||
|
New extensions of credit
|
5,554
|
30,177
|
||||||
|
Repayments
|
(22,430
|
)
|
(15,949
|
)
|
||||
|
Balance, end of year
|
$
|
25,142
|
$
|
42,018
|
||||
In management's opinion, such loans and other extensions of credit and deposits (which were not material) were made in the ordinary course of business and were made on substantially the same terms (including interest rates and collateral) as those prevailing at the time for comparable transactions with other persons. Further, in management's opinion, these extensions of credit did not involve more than the normal risk of collectability or present other unfavorable features.
|
NOTE 12:
|
EMPLOYEE BENEFIT PLANS
|
Retirement Plans
The Company’s 401(k) retirement plan covers substantially all employees. Contribution expense totaled $837,000, $690,000 and $624,000, in 2014, 2013 and 2012, respectively.
The Company has a discretionary profit sharing and employee stock ownership plan covering substantially all employees. Contribution expense totaled $3,659,000 for 2014, $3,076,000 for 2013 and $2,952,000 for 2012.
The Company also provides deferred compensation agreements with certain active and retired officers. The agreements provide monthly payments of retirement compensation for either stated periods or for the life of the participant. The charges to income for the plans were $453,000 for 2014, $473,000 for 2013 and $258,000 for 2012. Such charges reflect the straight-line accrual over the employment period of the present value of benefits due each participant, as of their full eligibility date, using an appropriate discount factor.
Employee Stock Purchase Plan
The Company established an Employee Stock Purchase Plan in 2006 which generally allows participants to make contributions of up 3% of the employee’s salary, up to a maximum of $7,500 per year, for the purpose of acquiring the Company’s stock. Substantially all employees with at least two years of service are eligible for the plan. At the end of each plan year, full shares of the Company’s stock are purchased for each employee based on that employee’s contributions. The stock is purchased for an amount equal to 95% of its fair market value at the end of the plan year, or, if lower, 95% of its fair market value at the beginning of the plan year.
Stock-Based Compensation Plans
The Company’s Board of Directors has adopted various stock-based compensation plans. The plans provide for the grant of incentive stock options, nonqualified stock options, stock appreciation rights, and bonus stock awards. Pursuant to the plans, shares are reserved for future issuance by the Company upon exercise of stock options or awarding of bonus shares granted to directors, officers and other key employees.
102
Stock-based compensation expense for all stock-based compensation awards granted after January 1, 2006, is based on the grant date fair value. For all awards except stock option awards, the grant date fair value is the market value per share as of the grant date. For stock option awards, the fair value is estimated at the date of grant using the Black-Scholes option-pricing model. This model requires the input of highly subjective assumptions, changes to which can materially affect the fair value estimate. Additionally, there may be other factors that would otherwise have a significant effect on the value of employee stock options granted but are not considered by the model. Accordingly, while management believes that the Black-Scholes option-pricing model provides a reasonable estimate of fair value, the model does not necessarily provide the best single measure of fair value for the Company's employee stock options.
The fair value of each option award is estimated on the date of grant using the Black-Scholes option-pricing model that uses various assumptions. Expected volatility is based on historical volatility of the Company’s stock and other factors. The Company uses historical data to estimate option exercise and employee termination within the valuation model. The expected term of options granted is derived from the output of the option valuation model and represents the period of time that options granted are expected to be outstanding. The risk-free rate for periods within the contractual life of the option is based on the U.S. Treasury yield curve in effect at the time of grant. Forfeitures are estimated at the time of grant, and are based partially on historical experience.
The table below summarizes the transactions under the Company's active stock compensation plans at December 31, 2014, 2013 and 2012, and changes during the years then ended:
|
Stock Options
Outstanding
|
Non-Vested Stock
Awards Outstanding
|
|||||||||||||||
|
Number
of Shares
(000)
|
Weighted
Average
Exercise
Price
|
Number
of Shares
(000)
|
Weighted
Average
Grant-Date
Fair-Value
|
|||||||||||||
|
Balance, December 31, 2011
|
228
|
$
|
26.76
|
127
|
$
|
26.49
|
||||||||||
|
Granted
|
-
|
-
|
51
|
26.29
|
||||||||||||
|
Stock Options Exercised
|
-
|
-
|
-
|
-
|
||||||||||||
|
Stock Awards Vested
|
-
|
-
|
(44
|
)
|
28.29
|
|||||||||||
|
Forfeited/Expired
|
(10
|
)
|
26.54
|
-
|
-
|
|||||||||||
|
Balance, December 31, 2012
|
218
|
26.77
|
134
|
25.89
|
||||||||||||
|
Granted
|
-
|
-
|
75
|
26.89
|
||||||||||||
|
Stock Options Exercised
|
(24
|
)
|
24.88
|
-
|
-
|
|||||||||||
|
Stock Awards Vested
|
-
|
-
|
(63
|
)
|
26.82
|
|||||||||||
|
Forfeited/Expired
|
(9
|
)
|
26.16
|
(1
|
)
|
26.54
|
||||||||||
|
Balance, December 31, 2013
|
185
|
|
27.04
|
145
|
|
26.00
|
||||||||||
|
Granted
|
-
|
-
|
134
|
37.51
|
||||||||||||
|
Stock Options Exercised
|
(65
|
)
|
25.86
|
-
|
-
|
|||||||||||
|
Stock Awards Vested
|
-
|
-
|
(51
|
)
|
30.62
|
|||||||||||
|
Forfeited/Expired
|
-
|
-
|
(1
|
)
|
26.54
|
|||||||||||
|
Balance, December 31, 2014
|
120
|
$
|
27.72
|
227
|
$
|
31.88
|
||||||||||
|
Exercisable, December 31, 2014
|
120
|
$
|
27.72
|
|||||||||||||
103
The following table summarizes information about stock options under the plans outstanding at December 31, 2014:
|
Options Outstanding
|
Options Exercisable
|
|||||||||||||||||||||||
|
Range of
Exercise Prices
|
Number
of Shares
(000)
|
Weighted
Average
Remaining
Contractual
Life (Years)
|
Weighted
Average
Exercise
Price
|
Number
of Shares
(000)
|
Weighted
Average
Exercise
Price
|
|||||||||||||||||||
|
$
|
24.50
|
-
|
$
|
24.50
|
20
|
0.39
|
24.50
|
20
|
24.50
|
|||||||||||||||
|
26.19
|
-
|
27.67
|
32
|
1.37
|
26.21
|
32
|
26.21
|
|||||||||||||||||
|
28.42
|
-
|
28.42
|
34
|
2.41
|
28.42
|
34
|
28.42
|
|||||||||||||||||
|
30.31
|
-
|
30.31
|
34
|
3.41
|
30.31
|
34
|
30.31
|
|||||||||||||||||
Stock-based compensation expense totaled $1,366,000 in 2014, $1,417,000 in 2013 and $1,388,000 in 2012. Stock-based compensation expense is recognized ratably over the requisite service period for all stock-based awards. There was no unrecognized stock-based compensation expense related to stock options at December 31, 2014. Unrecognized stock-based compensation expense related to non-vested stock awards was $5.9 million at December 31, 2014. At such date, the weighted-average period over which this unrecognized expense is expected to be recognized was 2.5 years.
Aggregate intrinsic value of both the outstanding stock options and exercisable stock options was $1,548,000 at December 31, 2014. Aggregate intrinsic value represents the difference between the Company’s closing stock price on the last trading day of the period, which was $40.65 at December 31, 2014, and the exercise price multiplied by the number of options outstanding. There were 64,720 stock options exercised in 2014, with an intrinsic value of $957,000. There were 24,290 stock options exercised in 2013, with an intrinsic value of $298,000. There were no stock options exercised in 2012.
The fair value of the Company’s employee stock options granted is estimated on the date of grant using the Black-Scholes option-pricing model. There were no stock options granted in 2014, 2013 or 2012.
|
NOTE 13:
|
ADDITIONAL CASH FLOW INFORMATION
|
The following table presents additional information on cash payments and non-cash items:
|
(In thousands)
|
2014
|
2013
|
2012
|
|||||||||
|
Interest paid
|
$
|
14,274
|
$
|
11,908
|
$
|
15,959
|
||||||
|
Income taxes paid
|
18,832
|
14,867
|
11,548
|
|||||||||
|
Transfers of loans to foreclosed assets held for sale
|
5,145
|
7,358
|
5,173
|
|||||||||
|
Transfers of loans covered by FDIC loss share agreements to foreclosed assets covered by FDIC loss share agreements
|
5,536
|
9,239
|
12,268
|
|||||||||
In connection with the Delta Trust, Metropolitan, Truman and Excel acquisitions, accounted for by using the purchase method, the Company acquired assets and assumed liabilities as follows:
|
(In thousands)
|
2014
|
2013
|
2012
|
|||||||||
|
Assets acquired
|
$
|
417,386
|
$
|
919,340
|
$
|
433,710
|
||||||
|
Liabilities assumed
|
378,967
|
883,664
|
430,299
|
|||||||||
|
Purchase price
|
67,441
|
53,600
|
-
|
|||||||||
|
Bargain purchase gains
|
$
|
3,411
|
||||||||||
|
Goodwill
|
$
|
29,022
|
$
|
17,924
|
||||||||
104
|
NOTE 14:
|
OTHER OPERATING EXPENSES
|
Other operating expenses consist of the following:
|
(In thousands)
|
2014
|
2013
|
2012
|
|||||||||
|
Professional services
|
$
|
7,516
|
$
|
4,473
|
$
|
4,851
|
||||||
|
Postage
|
3,383
|
2,531
|
2,488
|
|||||||||
|
Telephone
|
2,957
|
2,323
|
2,391
|
|||||||||
|
Credit card expense
|
8,699
|
6,869
|
6,906
|
|||||||||
|
Operating supplies
|
1,964
|
1,511
|
1,419
|
|||||||||
|
Amortization of intangibles
|
1,979
|
600
|
347
|
|||||||||
|
Branch right sizing expense
|
4,721
|
641
|
-
|
|||||||||
|
Other expense
|
17,803
|
13,934
|
11,873
|
|||||||||
|
Total
|
$
|
49,022
|
$
|
32,882
|
$
|
30,275
|
||||||
The Company had aggregate annual equipment rental expense of approximately $1.9 million in 2014, $1.7 million in 2013 and $1.3 million in 2012. During 2012, the Company transitioned from purchasing to leasing its ATMs, accounting for approximately $1,283,000 of the 2014 rental expense and $1,153,000 of the 2013 rental expense. The Company had aggregate annual occupancy rental expense of approximately $3,706,000 in 2014, $2,385,000 in 2013 and $1,617,000 in 2012.
|
NOTE 15:
|
DISCLOSURES ABOUT FAIR VALUE OF FINANCIAL INSTRUMENTS
|
ASC Topic 820,
Fair Value Measurements
defines fair value, establishes a framework for measuring fair value and expands disclosures about fair value measurements.
ASC Topic 820 defines fair value as the price that would be received to sell an asset or paid to transfer a liability in an orderly transaction between market participants at the measurement date. The guidance also establishes a fair value hierarchy that requires the use of observable inputs and minimizes the use of unobservable inputs when measuring fair value. Topic 820 describes three levels of inputs that may be used to measure fair value:
|
·
|
Level 1 Inputs
– Quoted prices in active markets for identical assets or liabilities.
|
|
·
|
Level 2 Inputs
– Observable inputs other than Level 1 prices, such as quoted prices for similar assets or liabilities in active markets; quoted prices for similar assets or liabilities in markets that are not active; or other inputs that are observable or can be corroborated by observable market data for substantially the full term of the assets or liabilities.
|
|
·
|
Level 3 Inputs
– Unobservable inputs that are supported by little or no market activity and that are significant to the fair value of the assets or liabilities.
|
In general, fair value is based upon quoted market prices, where available. If such quoted market prices are not available, fair value is based upon internally developed models that primarily use, as inputs, observable market-based parameters. Valuation adjustments may be made to ensure that financial instruments are recorded at fair value. These adjustments may include amounts to reflect counterparty credit quality and the Company’s creditworthiness, among other things, as well as unobservable parameters. Any such valuation adjustments are applied consistently over time. The Company’s valuation methodologies may produce a fair value calculation that may not be indicative of net realizable value or reflective of future fair values. While management believes the Company’s valuation methodologies are appropriate and consistent with other market participants, the use of different methodologies or assumptions to determine the fair value of certain financial instruments could result in a different estimate of fair value at the reporting date. Furthermore, the reported fair value amounts have not been comprehensively revalued since the presentation dates, and therefore, estimates of fair value after the balance sheet date may differ significantly from the amounts presented herein. A more detailed description of the valuation methodologies used for assets and liabilities measured at fair value, as well as the general classification of such instruments pursuant to the valuation hierarchy, is set forth below.
105
Following is a description of the inputs and valuation methodologies used for assets measured at fair value on a recurring basis and recognized in the accompanying consolidated balance sheets, as well as the general classification of such assets pursuant to the valuation hierarchy.
Available-for-sale securities
– Where quoted market prices are available in an active market, securities are classified within Level 1 of the valuation hierarchy. Level 1 securities would include highly liquid government bonds, mortgage products and exchange traded equities. Other securities classified as available-for-sale are reported at fair value utilizing Level 2 inputs. For these securities, the Company obtains fair value measurements from an independent pricing service. The fair value measurements consider observable data that may include dealer quotes, market spreads, cash flows, the U.S. Treasury yield curve, live trading levels, trade execution data, market consensus prepayment speeds, credit information and the security’s terms and conditions, among other things. In order to ensure the fair values are consistent with ASC Topic 820, we periodically check the fair values by comparing them to another pricing source, such as Bloomberg. The availability of pricing confirms Level 2 classification in the fair value hierarchy. The third-party pricing service is subject to an annual review of internal controls (SSAE 16), which is made available to us for our review. In certain cases where Level 1 or Level 2 inputs are not available, securities are classified within Level 3 of the hierarchy. The Company’s investment in a government money market mutual fund (the “AIM Fund”) is reported at fair value utilizing Level 1 inputs. The remainder of the Company's available-for-sale securities are reported at fair value utilizing Level 2 inputs.
Assets held in trading accounts
– The Company’s trading account investment in the AIM Fund is reported at fair value utilizing Level 1 inputs. The remainder of the Company's assets held in trading accounts are reported at fair value utilizing Level 2 inputs.
The following table sets forth the Company’s financial assets by level within the fair value hierarchy that were measured at fair value on a recurring basis as of December 31, 2014 and 2013.
|
Fair Value Measurements
|
||||||||||||||||
|
(In thousands)
|
Fair Value
|
Quoted Prices in
Active Markets for
Identical Assets
(Level 1)
|
Significant Other
Observable Inputs
(Level 2)
|
Significant
Unobservable Inputs
(Level 3)
|
||||||||||||
|
December 31, 2014
|
||||||||||||||||
|
Available-for-sale securities
|
||||||||||||||||
|
U.S. Treasury
|
$ | 3,992 | $ | - | $ | 3,992 | $ | - | ||||||||
|
U.S. Government agencies
|
272,816 | - | 272,816 | - | ||||||||||||
|
Mortgage-backed securities
|
1,572 | - | 1,572 | - | ||||||||||||
|
States and political subdivisions
|
6,540 | - | 6,540 | - | ||||||||||||
|
Other securities
|
20,363 | - | 20,363 | - | ||||||||||||
|
Assets held in trading accounts
|
6,987 | 3,320 | 3,667 | - | ||||||||||||
|
December 31, 2013
|
||||||||||||||||
|
Available-for-sale securities
|
||||||||||||||||
|
U.S. Treasury
|
$ | 3,985 | $ | - | $ | 3,985 | $ | - | ||||||||
|
U.S. Government agencies
|
178,217 | - | 178,217 | - | ||||||||||||
|
Mortgage-backed securities
|
1,891 | - | 1,891 | - | ||||||||||||
|
States and political subdivisions
|
7,861 | - | 7,861 | - | ||||||||||||
|
Other securities
|
20,323 | 1,504 | 18,819 | - | ||||||||||||
|
Assets held in trading accounts
|
8,978 | 1,520 | 7,458 | - | ||||||||||||
Certain financial assets and liabilities are measured at fair value on a nonrecurring basis; that is, the instruments are not measured at fair value on an ongoing basis but are subject to fair value adjustments in certain circumstances (for example, when there is evidence of impairment). Financial assets and liabilities measured at fair value on a nonrecurring basis include the following:
106
Impaired loans (collateral dependent)
– Loan impairment is reported when full payment under the loan terms is not expected. Allowable methods for determining the amount of impairment include estimating fair value using the fair value of the collateral for collateral-dependent loans. If the impaired loan is identified as collateral dependent, then the fair value method of measuring the amount of impairment is utilized. This method requires obtaining a current independent appraisal of the collateral and applying a discount factor to the value. A portion of the allowance for loan losses is allocated to impaired loans if the value of such loans is deemed to be less than the unpaid balance. If these allocations cause the allowance for loan losses to require an increase, such increase is reported as a component of the provision for loan losses. Loan losses are charged against the allowance when management believes the uncollectability of a loan is confirmed. Impaired loans that are collateral dependent are classified within Level 3 of the fair value hierarchy when impairment is determined using the fair value method.
Appraisals are updated at renewal, if not more frequently, for all collateral dependent loans that are deemed impaired by way of impairment testing. Impairment testing for selected loans rated Special Mention or worse begins at $500,000, with testing on all loans over $1.5 million rated Special Mention or worse. All collateral dependent impaired loans meeting these thresholds have had updated appraisals or internally prepared evaluations within the last one to two years and these updated valuations are considered in the quarterly review and discussion of the corporate Special Asset Committee. On targeted CRE loans, appraisals/internally prepared valuations may be updated before the typical 1-3 year balloon/maturity period. If an updated valuation results in decreased value, a specific (ASC 310) impairment is placed against the loan, or a partial charge-down is initiated, depending on the circumstances and anticipation of the loan’s ability to remain a going concern, possibility of foreclosure, certain market factors, etc.
Foreclosed assets held for sale
– Foreclosed assets held for sale are reported at fair value, less estimated costs to sell. At foreclosure, if the fair value, less estimated costs to sell, of the real estate acquired is less than the Company’s recorded investment in the related loan, a write-down is recognized through a charge to the allowance for loan losses. Additionally, valuations are periodically performed by management and any subsequent reduction in value is recognized by a charge to income. The fair value of foreclosed assets held for sale is estimated using Level 3 inputs based on observable market data. As of December 31, 2014 and 2013, the fair value of foreclosed assets held for sale, excluding those covered by FDIC loss share agreements, less estimated costs to sell was $44.9 million and $64.8 million, respectively.
The significant unobservable inputs (Level 3) used in the fair value measurement of collateral for collateral-dependent impaired loans and foreclosed assets primarily relate to the specialized discounting criteria applied to the borrower’s reported amount of collateral. The amount of the collateral discount depends upon the condition and marketability of the collateral, as well as other factors which may affect the collectability of the loan. Our assessment of the significance of a particular input to the fair value measurement in its entirety requires judgment and considers factors specific to the asset. It is reasonably possible that a change in the estimated fair value for instruments measured using Level 3 inputs could occur in the future. As the Company’s primary objective in the event of default would be to liquidate the collateral to settle the outstanding balance of the loan, collateral that is less marketable would receive a larger discount. During the reported periods, collateral discounts ranged from 10% to 40% for commercial and residential real estate collateral.
Mortgage loans held for sale
– Mortgage loans held for sale are reported at fair value if, on an aggregate basis, the fair value of the loans is less than cost. In determining whether the fair value of loans held for sale is less than cost when quoted market prices are not available, the Company may consider outstanding investor commitments, discounted cash flow analyses with market assumptions or the fair value of the collateral if the loan is collateral dependent. Such loans are classified within either Level 2 or Level 3 of the fair value hierarchy. Where assumptions are made using significant unobservable inputs, such loans held for sale are classified as Level 3. At December 31, 2014 and 2013, the aggregate fair value of mortgage loans held for sale exceeded their cost. Accordingly, no mortgage loans held for sale were marked down and reported at fair value.
107
The following table sets forth the Company’s financial assets by level within the fair value hierarchy that were measured at fair value on a nonrecurring basis as of December 31, 2014 and 2013.
|
Fair Value Measurements Using
|
||||||||||||||||
|
(In thousands)
|
Fair Value
|
Quoted Prices in
Active Markets for
Identical Assets
(Level 1)
|
Significant Other
Observable Inputs
(Level 2)
|
Significant
Unobservable Inputs
(Level 3)
|
||||||||||||
|
December 31, 2014
|
||||||||||||||||
|
Impaired loans
(1) (2)
(collateral dependent)
|
$
|
12,276
|
$
|
-
|
$
|
-
|
$
|
12,276
|
||||||||
|
Foreclosed assets held for sale
(1)
|
3,417
|
-
|
-
|
3,417
|
||||||||||||
|
December 31, 2013
|
||||||||||||||||
|
Impaired loans
(1) (2)
(collateral dependent)
|
$
|
2,768
|
$
|
-
|
$
|
-
|
$
|
2,768
|
||||||||
|
Foreclosed assets held for sale
(1)
|
642
|
-
|
-
|
642
|
||||||||||||
|
(1)
|
These amounts represent the resulting carrying amounts on the Consolidated Balance Sheets for impaired collateral dependent loans and foreclosed assets held for sale for which fair value re-measurements took place during the period.
|
|
(2)
|
Specific allocations of $733,000 and $249,000 were related to the impaired collateral dependent loans for which fair value re-measurements took place during the period, as of December 31, 2014 and 2013, respectively.
|
ASC Topic 825,
Financial Instruments
, requires disclosure in annual financial statements of the fair value of financial assets and financial liabilities, including those financial assets and financial liabilities that are not measured and reported at fair value on a recurring basis or nonrecurring basis. The following methods and assumptions were used to estimate the fair value of each class of financial instruments not previously disclosed.
Cash and cash equivalents
– The carrying amount for cash and cash equivalents approximates fair value (Level 1).
Held-to-maturity securities
– Fair values for held-to-maturity securities equal quoted market prices, if available, such as for highly liquid government bonds (Level 1). If quoted market prices are not available, fair values are estimated based on quoted market prices of similar securities. For these securities, the Company obtains fair value measurements from an independent pricing service. The fair value measurements consider observable data that may include dealer quotes, market spreads, cash flows, the U.S. Treasury yield curve, live trading levels, trade execution data, market consensus prepayment speeds, credit information and the security’s terms and conditions, among other things (Level 2). In certain cases where Level 1 or Level 2 inputs are not available, securities are classified within Level 3 of the hierarchy.
Loans
– The fair value of loans, excluding loans acquired, is estimated by discounting the future cash flows, using the current rates at which similar loans would be made to borrowers with similar credit ratings and for the same remaining maturities. Loans with similar characteristics were aggregated for purposes of the calculations (Level 3).
Loans acquired
– Fair values of loans acquired are based on a discounted cash flow methodology that considers factors including the type of loan and related collateral, variable or fixed rate, classification status, remaining term, interest rate, historical delinquencies, loan to value ratios, current market rates and remaining loan balance. The loans were grouped together according to similar characteristics and were treated in the aggregate when applying various valuation techniques. The discount rates used for loans were based on current market rates for new originations of similar loans. Estimated credit losses were also factored into the projected cash flows of the loans (Level 3).
108
FDIC indemnification asset
– Fair value of the FDIC indemnification asset is based on the net present value of future cash proceeds expected to be received from the FDIC under the provisions of the loss share agreements using a discount rate that is based on current market rates (Level 3).
Deposits
– The fair value of demand deposits, savings accounts and money market deposits is the amount payable on demand at the reporting date (i.e., their carrying amount) (Level 2). The fair value of fixed-maturity time deposits is estimated using a discounted cash flow calculation that applies the rates currently offered for deposits of similar remaining maturities (Level 3).
Federal Funds purchased, securities sold under agreement to repurchase and short-term debt
– The carrying amount for Federal funds purchased, securities sold under agreement to repurchase and short-term debt are a reasonable estimate of fair value (Level 2).
Other borrowings
– For short-term instruments, the carrying amount is a reasonable estimate of fair value. For long-term debt, rates currently available to the Company for debt with similar terms and remaining maturities are used to estimate the fair value (Level 2).
Subordinated debentures
– The fair value of subordinated debentures is estimated using the rates that would be charged for subordinated debentures of similar remaining maturities (Level 2).
Accrued interest receivable/payable
– The carrying amounts of accrued interest approximated fair value (Level 2).
Commitments to extend credit, letters of credit and lines of credit
– The fair value of commitments is estimated using the fees currently charged to enter into similar agreements, taking into account the remaining terms of the agreements and the present creditworthiness of the counterparties. For fixed rate loan commitments, fair value also considers the difference between current levels of interest rates and the committed rates. The fair values of letters of credit and lines of credit are based on fees currently charged for similar agreements or on the estimated cost to terminate or otherwise settle the obligations with the counterparties at the reporting date.
The fair value of a financial instrument is the current amount that would be exchanged between willing parties, other than in a forced liquidation. Fair value is best determined based upon quoted market prices. However, in many instances, there are no quoted market prices for the Company’s various financial instruments. In cases where quoted market prices are not available, fair values are based on estimates using present value or other valuation techniques. Those techniques are significantly affected by the assumptions used, including the discount rate and estimates of future cash flows. Accordingly, the fair value estimates may not be realized in an immediate settlement of the instrument.
109
The estimated fair values, and related carrying amounts, of the Company’s financial instruments not previously disclosed are as follows:
|
Carrying
|
Fair Value Measurements
|
|||||||||||||||||||
|
(In thousands)
|
Amount
|
Level 1
|
Level 2
|
Level 3
|
Total
|
|||||||||||||||
|
December 31, 2014
|
||||||||||||||||||||
|
Financial assets:
|
||||||||||||||||||||
|
Cash and cash equivalents
|
$ | 335,909 | $ | 335,909 | $ | - | $ | - | $ | 335,909 | ||||||||||
|
Held-to-maturity securities
|
777,587 | - | 780,533 | - | 780,533 | |||||||||||||||
|
Mortgage loans held for sale
|
21,265 | - | - | 21,265 | 21,265 | |||||||||||||||
|
Interest receivable
|
16,774 | - | 16,774 | - | 16,774 | |||||||||||||||
|
Legacy loans (net of allowance)
|
2,024,693 | - | - |
2,022,889
|
2,022,889
|
|||||||||||||||
|
Loans acquired, not covered by FDIC loss share
|
575,980 | - | - |
560,651
|
560,651
|
|||||||||||||||
|
Loans acquired, covered by FDIC loss share
(net of allowance)
|
106,933 | - | - |
105,789
|
105,789
|
|||||||||||||||
|
FDIC indemnification asset
|
22,663 | - | - | 22,663 | 22,663 | |||||||||||||||
|
Financial liabilities:
|
||||||||||||||||||||
|
Non-interest bearing transaction accounts
|
889,260 | - | 889,260 | - | 889,260 | |||||||||||||||
|
Interest bearing transaction accounts and savings deposits
|
2,006,271 | - | 2,006,271 | - | 2,006,271 | |||||||||||||||
|
Time deposits
|
965,187 | - | - |
967,900
|
967,900
|
|||||||||||||||
|
Federal funds purchased and securities sold under agreements to repurchase
|
110,586 | - | 110,586 | - | 110,586 | |||||||||||||||
|
Other borrowings
|
114,682 | - |
114,698
|
- | 115,000 | |||||||||||||||
|
Subordinated debentures
|
20,620 | - |
16,115
|
- |
16,115
|
|||||||||||||||
|
Interest payable
|
1,147 | - | 1,147 | - | 1,147 | |||||||||||||||
|
December 31, 2013
|
||||||||||||||||||||
|
Financial assets
|
||||||||||||||||||||
|
Cash and cash equivalents
|
$ | 539,380 | $ | 539,380 | $ | - | $ | - | $ | 539,380 | ||||||||||
|
Held-to-maturity securities
|
745,688 | - | 731,445 | - | 731,445 | |||||||||||||||
|
Mortgage loans held for sale
|
9,494 | - | - | 9,494 | 9,494 | |||||||||||||||
|
Interest receivable
|
15,654 | - | 15,654 | - | 15,654 | |||||||||||||||
|
Legacy loans (net of allowance)
|
1,715,196 | - | - | 1,694,748 | 1,694,748 | |||||||||||||||
|
Loans acquired, not covered by FDIC loss share
|
515,644 | - | - | 513,676 | 513,676 | |||||||||||||||
|
Loans acquired, covered by FDIC loss share
|
146,653 | - | - | 143,814 | 143,814 | |||||||||||||||
|
FDIC indemnification asset
|
48,791 | - | - | 48,791 | 48,791 | |||||||||||||||
|
Financial liabilities:
|
||||||||||||||||||||
|
Non-interest bearing transaction accounts
|
718,438 | - | 718,438 | - | 718,438 | |||||||||||||||
|
Interest bearing transaction accounts and savings deposits
|
1,862,618 | - | 1,862,618 | - | 1,862,618 | |||||||||||||||
|
Time deposits
|
1,116,511 | - | - | 1,120,035 | 1,120,035 | |||||||||||||||
|
Federal funds purchased and securities sold under agreements to repurchase
|
107,887 | - | 107,887 | - | 107,887 | |||||||||||||||
|
Other borrowings
|
117,090 | - | 117,160 | - | 117,160 | |||||||||||||||
|
Subordinated debentures
|
20,620 | - | 12,991 | - | 12,991 | |||||||||||||||
|
Interest payable
|
1,450 | - | 1,450 | - | 1,450 | |||||||||||||||
The fair value of commitments to extend credit, letters of credit and lines of credit is not presented since management believes the fair value to be insignificant.
110
|
NOTE 16:
|
SIGNIFICANT ESTIMATES AND CONCENTRATIONS
|
The current economic environment presents financial institutions with continuing circumstances and challenges which in some cases have resulted in large declines in the fair values of investments and other assets, constraints on liquidity and significant credit quality problems, including severe volatility in the valuation of real estate and other collateral supporting loans. The financial statements have been prepared using values and information currently available to the Company.
Given the volatility of current economic conditions, the values of assets and liabilities recorded in the consolidated financial statements could change rapidly, resulting in material future adjustments in asset values, the allowance for loan losses and capital that could negatively impact the Company’s ability to meet regulatory capital requirements and maintain sufficient liquidity.
Estimates related to the allowance for loan losses, covered assets and certain concentrations of credit risk are reflected in Note 4, Loans and Allowance for Loan Losses, Note 5, Loans Acquired and Note 17, Commitments and Credit Risk.
|
NOTE 17:
|
COMMITMENTS AND CREDIT RISK
|
The Company grants agri-business, credit card, commercial and residential loans to customers throughout Arkansas, Kansas and Missouri. Commitments to extend credit are agreements to lend to a customer as long as there is no violation of any condition established in the contract. Commitments generally have fixed expiration dates or other termination clauses and may require payment of a fee. Since a portion of the commitments may expire without being drawn upon, the total commitment amounts do not necessarily represent future cash requirements. Each customer's creditworthiness is evaluated on a case-by-case basis. The amount of collateral obtained, if deemed necessary, is based on management's credit evaluation of the counterparty. Collateral held varies but may include accounts receivable, inventory, property, plant and equipment, commercial real estate and residential real estate.
At December 31, 2014, the Company had outstanding commitments to extend credit aggregating approximately $480,653,000 and $439,053,000 for credit card commitments and other loan commitments, respectively. At December 31, 2013, the Company had outstanding commitments to extend credit aggregating approximately $464,108,000 and $408,388,000 for credit card commitments and other loan commitments, respectively.
Standby letters of credit are conditional commitments issued by the Company to guarantee the performance of a customer to a third party. Those guarantees are primarily issued to support public and private borrowing arrangements, including commercial paper, bond financing and similar transactions. The credit risk involved in issuing letters of credit is essentially the same as that involved in extending loans to customers. The Company had total outstanding letters of credit amounting to $16,217,000 and $10,349,000 at December 31, 2014 and 2013, respectively, with terms ranging from 9 months to 5 years. The Company’s deferred revenue under standby letter of credit agreements was $13,125 at December 31, 2014 and approximately $10,000 at December 31, 2013.
At December 31, 2014, the Company did not have concentrations of 5% or more of the investment portfolio in bonds issued by a single municipality.
|
NOTE 18:
|
NEW ACCOUNTING STANDARDS
|
In July 2013, the FASB issued ASU 2013-11,
Presentation of an Unrecognized Tax Benefit When a Net Operating Loss Carryforward, a Similar Tax Loss, or a Tax Credit Carryforward Exists (Topic 740).
ASU 2013-11 requires an entity to present an unrecognized tax benefit, or portion thereof, in the statement of financial position as a reduction to a deferred tax asset for a net operating loss carryforward or a tax credit carryforward, with certain exceptions related to availability. The provisions of ASU 2013-11 became effective for the Company on January 1, 2014, and did not have a significant impact on the Company’s ongoing financial position or results of operations.
In January 2014, the FASB issued ASU 2014-04,
Reclassification of Residential Real Estate Collateralized Consumer Mortgage Loans upon Foreclosure (Topic 310-40): Receivables – Troubled Debt Restructurings by Creditors
. The objective of this guidance is to clarify when an in substance repossession or foreclosure occurs, that is, when a creditor should be considered to have received physical possession of residential real estate property collateralizing a consumer mortgage loan such that the loan receivable should be derecognized and the real estate property recognized. ASU 2014-04 states that an in substance repossession or foreclosure occurs, and a creditor is considered to have received physical possession of residential real estate property collateralizing a consumer mortgage loan, upon either (1) the creditor obtaining legal title to the residential real estate property upon completion of a foreclosure or (2) the borrower conveying all interest in the residential real estate property to the creditor to satisfy that loan through completion of a deed in lieu of foreclosure or through a similar legal agreement. Additionally, ASU 2014-04 requires interim and annual disclosure of both (1) the amount of foreclosed residential real estate property held by the creditor and (2) the recorded investment in consumer mortgage loans collateralized by residential real estate property that are in the process of foreclosure according to local requirements of the applicable jurisdiction. ASU 2014-04 is effective for interim and annual reporting periods beginning after December 15, 2014. An entity can elect to adopt the amendments in this ASU using either a modified retrospective transition method or a prospective transition method. Early adoption is permitted. The Company is in the process of evaluating the impact of ASU 2014-04 on its financial statements.
111
In April 2014, the FASB issued ASU 2014-08,
Reporting Discontinued Operations and Disclosures of Components of an Entity
, which changes the criteria for determining which disposals can be presented as discontinued operations and modifies related disclosure requirements. The guidance applies prospectively to new disposals and new classifications of disposal groups as held for sale after the effective date. The standard is required to be adopted by public business entities in annual periods beginning on or after December 15, 2014, and interim periods within those annual periods. The Company will be required to adopt this ASU beginning with the quarter ending March 31, 2015. The adoption of ASU 2014-08 is not expected to have a significant impact on the Company’s ongoing financial position or results of operations.
In August 2014, the FASB issued ASU 2014-14
, Classification of Certain Government-Guaranteed Mortgage Loans upon Foreclosure impacting FASB ASC 310-40, Receivables – Troubled Debt Restructuring by Creditors
. This update affects creditors that hold government-guaranteed mortgage loans. The amendments in this update require that a mortgage loan be derecognized and that a separate other receivable be recognized if the following conditions are met: (1) the loan has a government guarantee that is not separable from the loan before foreclosure; (2) at the time of foreclosure, the creditor has the intent to convey the real estate property to the guarantor and make a claim on the guarantee, and the creditor has the ability to recover under the claim; (3) at the time of foreclosure, the claim that is determined on the basis of the fair value of the real estate is fixed. Upon foreclosure, the separate other receivable should be measured based on the amount of the loan balance (principal and interest) expected to be recovered from the guarantor. ASU 2014-14 is effective for interim and annual reporting periods beginning after December 15, 2014. The Company is in the process of evaluating the impact of ASU 2014-04 on its financial statements.
In May 2014, the FASB issued ASU 2014-09,
Revenue from Contracts with Customers
. ASU 2014-09 provides guidance that an entity should recognize revenue to depict the transfer of promised goods or services to customers in an amount that reflects the consideration to which the entity expects to be entitled in exchange for those goods and services. ASU 2014-09 is effective for annual and interim periods beginning after December 15, 2016. The Company is in the process of evaluating the impact, if any, ASU 2014-09 will have on its financial position, results of operations and its financial disclosures.
Presently, the Company is not aware of any other changes to the Accounting Standards Codification that will have a material impact on the Company’s present or future financial position or results of operations.
|
NOTE 19:
|
CONTINGENT LIABILITIES
|
The Company and/or its subsidiaries have various unrelated legal proceedings, most of which involve loan foreclosure activity pending, which, in the aggregate, are not expected to have a material adverse effect on the financial position of the Company and its subsidiaries.
|
NOTE20:
|
STOCKHOLDERS’ EQUITY
|
The Company’s subsidiary bank is subject to a legal limitation on dividends that can be paid to the parent company without prior approval of the applicable regulatory agencies. The approval of the Office of the Comptroller of the Currency is required if the total of all the dividends declared by a national bank in any calendar year exceeds the total of its net profits, as defined, for that year, combined with its retained net profits of the preceding two years. At December 31, 2014, the Company subsidiary bank had approximately $10.0 million in undivided profits available for payment of dividends to the Company without prior approval of the regulatory agencies.
The Company’s subsidiary bank is subject to various regulatory capital requirements administered by the federal banking agencies. Failure to meet minimum capital requirements can initiate certain mandatory and possibly additional discretionary actions by regulators that, if undertaken, could have a direct material effect on the Company’s financial statements. Under capital adequacy guidelines and the regulatory framework for prompt corrective action, the Company must meet specific capital guidelines that involve quantitative measures of the Company’s assets, liabilities and certain off-balance-sheet items as calculated under regulatory accounting practices. The Company’s capital amounts and classifications are also subject to qualitative judgments by the regulators about components, risk weightings and other factors. Furthermore, the Company’s regulators could require adjustments to regulatory capital not reflected in these financial statements.
112
Quantitative measures established by regulation to ensure capital adequacy require the Company to maintain minimum amounts and ratios (set forth in the table below) of total and Tier 1 capital (as defined in the regulations) to risk-weighted assets (as defined) and of Tier 1 capital (as defined) to average assets (as defined). Management believes that, as of December 31, 2014, the Company meets all capital adequacy requirements to which it is subject.
As of the most recent notification from regulatory agencies, the subsidiaries were well capitalized under the regulatory framework for prompt corrective action. To be categorized as well capitalized, the Company and its subsidiary bank must maintain minimum total risk-based, Tier 1 risk-based and Tier 1 leverage ratios as set forth in the table. There are no conditions or events since that notification that management believes have changed the institutions’ categories.
The Company’s and the subsidiary Bank’s actual capital amounts and ratios are presented in the following table.
|
Actual
|
Minimum
For Capital
Adequacy Purposes
|
To Be Well
Capitalized Under
Prompt Corrective
Action Provision
|
||||||||||||||||||||||
|
(In thousands)
|
Amount
|
Ratio (%)
|
Amount
|
Ratio-%
|
Amount
|
Ratio (%)
|
||||||||||||||||||
|
As of December 31, 2014
|
||||||||||||||||||||||||
|
Total Risk-Based Capital Ratio
|
||||||||||||||||||||||||
|
Simmons First National Corporation
|
$
|
435,185
|
14.5
|
$
|
240,102
|
8.0
|
$
|
N/A
|
||||||||||||||||
|
Simmons First National Bank
|
432,590
|
14.5
|
238,670
|
8.0
|
298,338
|
10.0
|
||||||||||||||||||
|
Tier 1 Risk-Based Capital Ratio
|
||||||||||||||||||||||||
|
Simmons First National Corporation
|
403,110
|
13.4
|
120,331
|
4.0
|
N/A
|
|||||||||||||||||||
|
Simmons First National Bank
|
405,834
|
13.6
|
119,363
|
4.0
|
179,044
|
6.0
|
||||||||||||||||||
|
Tier 1 Leverage Ratio
|
||||||||||||||||||||||||
|
Simmons First National Corporation
|
403,110
|
8.8
|
183,232
|
4.0
|
N/A
|
|||||||||||||||||||
|
Simmons First National Bank
|
405,834
|
8.9
|
182,397
|
4.0
|
227,997
|
5.0
|
||||||||||||||||||
|
As of December 31, 2013
|
||||||||||||||||||||||||
|
Total Risk-Based Capital Ratio
|
||||||||||||||||||||||||
|
Simmons First National Corporation
|
$
|
380,347
|
14.1
|
$
|
215,800
|
8.0
|
$
|
N/A
|
||||||||||||||||
|
Simmons First National Bank
|
275,961
|
14.8
|
149,168
|
8.0
|
186,460
|
10.0
|
||||||||||||||||||
|
Tier 1 Risk-Based Capital Ratio
|
||||||||||||||||||||||||
|
Simmons First National Corporation
|
351,334
|
13.0
|
108,103
|
4.0
|
N/A
|
|||||||||||||||||||
|
Simmons First National Bank
|
261,318
|
14.0
|
74,662
|
4.0
|
111,993
|
6.0
|
||||||||||||||||||
|
Tier 1 Leverage Ratio
|
||||||||||||||||||||||||
|
Simmons First National Corporation
|
351,334
|
9.2
|
152,754
|
4.0
|
N/A
|
|||||||||||||||||||
|
Simmons First National Bank
|
261,318
|
10.1
|
103,492
|
4.0
|
129,365
|
5.0
|
||||||||||||||||||
113
|
NOTE 21:
|
CONDENSED FINANCIAL INFORMATION (PARENT COMPANY ONLY)
|
CONDENSED BALANCE SHEETS
DECEMBER 31, 2014 and 2013
|
(In thousands)
|
2014
|
2013
|
||||||
|
ASSETS
|
||||||||
|
Cash and cash equivalents
|
$
|
17,537
|
$
|
4,956
|
||||
|
Investment securities
|
1,660
|
4,973
|
||||||
|
Investments in wholly-owned subsidiaries
|
522,841
|
452,688
|
||||||
|
Intangible assets, net
|
133
|
133
|
||||||
|
Premises and equipment
|
5,711
|
633
|
||||||
|
Other assets
|
14,301
|
12,726
|
||||||
|
TOTAL ASSETS
|
$
|
562,183
|
$
|
476,109
|
||||
|
LIABILITIES
|
||||||||
|
Long-term debt
|
$
|
63,720
|
$
|
66,620
|
||||
|
Other liabilities
|
4,144
|
5,657
|
||||||
|
Total liabilities
|
67,864
|
72,277
|
||||||
|
STOCKHOLDERS’ EQUITY
|
||||||||
|
Common stock
|
181
|
162
|
||||||
|
Surplus
|
156,568
|
88,095
|
||||||
|
Undivided profits
|
338,906
|
318,577
|
||||||
|
Accumulated other comprehensive loss
|
||||||||
|
Unrealized
depreciation
on available-for-sale securities, net of income taxes of ($862) and ($1,938) at December 31, 2014 and 2013 respectively
|
(1,336
|
)
|
(3,002
|
)
|
||||
|
Total stockholders’ equity
|
494,319
|
403,832
|
||||||
|
TOTAL LIABILITIES AND STOCKHOLDERS’ EQUITY
|
$
|
562,183
|
$
|
476,109
|
||||
CONDENSED STATEMENTS OF INCOME
YEARS ENDED DECEMBER 31, 2014, 2013 and 2012
|
(In thousands)
|
2014
|
2013
|
2012
|
|||||||||
|
INCOME
|
||||||||||||
|
Dividends from subsidiaries
|
$
|
43,366
|
$
|
23,051
|
$
|
45,061
|
||||||
|
Other income
|
6,927
|
8,409
|
7,155
|
|||||||||
|
50,293
|
31,460
|
52,216
|
||||||||||
|
EXPENSE
|
23,024
|
17,839
|
15,830
|
|||||||||
|
Income before income taxes and equity in undistributed net income of subsidiaries
|
27,269
|
13,621
|
36,386
|
|||||||||
|
Provision for income taxes
|
(6,330
|
)
|
(3,510
|
)
|
(3,195
|
)
|
||||||
|
Income before equity in undistributed net income of subsidiaries
|
33,599
|
17,131
|
39,581
|
|||||||||
|
Equity in (distribution in excess of) undistributed net income of subsidiaries
|
2,089
|
6,100
|
(11,897
|
)
|
||||||||
|
NET INCOME
|
$
|
35,688
|
$
|
23,231
|
$
|
27,684
|
||||||
114
CONDENSED STATEMENTS OF COMPREHENSIVE INCOME
YEARS ENDED DECEMBER 31, 2014, 2013 and 2012
|
(In thousands)
|
2014
|
2013
|
2012
|
|||||||||
|
NET INCOME
|
$
|
35,688
|
$
|
23,231
|
$
|
27,684
|
||||||
|
OTHER COMPREHENSIVE INCOME
|
||||||||||||
|
Equity in other comprehensive income (loss) of subsidiaries
|
1,666
|
(3,259
|
)
|
(182
|
)
|
|||||||
|
COMPREHENSIVE INCOME
|
$
|
37,354
|
$
|
19,972
|
$
|
27,502
|
||||||
CONDENSED STATEMENTS OF CASH FLOWS
YEARS ENDED DECEMBER 31, 2014, 2013 and 2012
|
(In thousands)
|
2014
|
2013
|
2012
|
|||||||||
|
CASH FLOWS FROM OPERATING ACTIVITIES
|
||||||||||||
|
Net income
|
$
|
35,688
|
$
|
23,231
|
$
|
27,684
|
||||||
|
Items not requiring (providing) cash
|
||||||||||||
|
Depreciation and amortization
|
139
|
145
|
167
|
|||||||||
|
Deferred income taxes
|
1,338
|
81
|
75
|
|||||||||
|
Equity in (distribution in excess of) undistributed net income of bank subsidiaries
|
(2,089
|
)
|
(6,100
|
)
|
11,897
|
|||||||
|
Changes in
|
||||||||||||
|
Other assets
|
(1,514
|
)
|
19,978
|
(20,712
|
)
|
|||||||
|
Other liabilities
|
(1,103
|
)
|
1,891
|
-
|
||||||||
|
Net cash provided by operating activities
|
32,459
|
39,226
|
19,111
|
|||||||||
|
CASH FLOWS FROM INVESTING ACTIVITIES
|
||||||||||||
|
Net purchases of premises and equipment
|
(5,435
|
)
|
(174
|
)
|
(84
|
)
|
||||||
|
Additional (return from) investment in subsidiary
|
288
|
(27,400
|
)
|
310
|
||||||||
|
Sales (purchases) of available-for-sale securities
|
1,504
|
(1
|
)
|
-
|
||||||||
|
Cash paid in business combinations
|
(1,640
|
)
|
(53,600
|
)
|
-
|
|||||||
|
Net cash (used in) provided by investing activities
|
(5,283
|
)
|
(81,175
|
)
|
226
|
|||||||
|
CASH FLOWS FROM FINANCING ACTIVITIES
|
||||||||||||
|
Repayment of subordinated debentures
|
-
|
-
|
(10,310
|
)
|
||||||||
|
(Repayment) issuance of long-term debt
|
(2,900
|
)
|
46,000
|
-
|
||||||||
|
Issuance of common stock, net
|
3,389
|
2,353
|
1,711
|
|||||||||
|
Payment to repurchase common stock
|
-
|
(10,848
|
)
|
(17,567
|
)
|
|||||||
|
Dividends paid
|
(15,084
|
)
|
(13,707
|
)
|
(13,495
|
)
|
||||||
|
Net cash provided by (used in) financing activities
|
(14,595
|
)
|
23,798
|
(39,661
|
)
|
|||||||
|
INCREASE (DECREASE) IN CASH AND CASH EQUIVALENTS
|
12,581
|
(18,151
|
)
|
(20,324
|
)
|
|||||||
|
CASH AND CASH EQUIVALENTS, BEGINNING OF YEAR
|
4,956
|
23,107
|
43,431
|
|||||||||
|
CASH AND CASH EQUIVALENTS, END OF YEAR
|
$
|
17,537
|
$
|
4,956
|
$
|
23,107
|
||||||
115
|
ITEM
9.
|
CHANGES IN AND DISAGREEMENTS WITH ACCOUNTANTS ON ACCOUNTING AND FINANCIAL DISCLOSURE
|
No items are reportable.
|
ITEM
9A.
|
CONTROLS AND PROCEDURES
|
(a) Evaluation of disclosure controls and procedures. The Company's Chief Executive Officer and Chief Financial Officer have reviewed and evaluated the effectiveness of the Company's disclosure controls and procedures (as defined in Rule 13a-15(e) and Rule 15d-15(e) under the Exchange Act) as of December 31, 2014. Based upon that evaluation, the Chief Executive Officer and Chief Financial Officer have concluded that the Company's current disclosure controls and procedures were effective for the period.
(b) Changes in Internal Controls. The Company’s management, including the Company’s Chief Executive Officer, Chief Financial Officer and Chief Accounting Officer, regularly review our disclosure controls and procedures and make changes intended to ensure the quality of our financial reporting. On August 31, 2014, we completed our acquisition of Delta Bank and Trust, and as a result, we extended our oversight and monitoring processes that support our internal control over financial reporting during the third quarter of 2014, to include the operations of Delta Trust. Otherwise, there were no changes in our internal control over financial reporting during the Company’s fourth quarter of its 2014 fiscal year that has materially affected, or is reasonably likely to materially affect, the Company’s internal control over financial reporting.
|
ITEM
9B.
|
OTHER INFORMATION
|
No items are reportable.
|
ITEM
10.
|
DIRECTORS, EXECUTIVE OFFICERS AND CORPORATE GOVERNANCE
|
Incorporated herein by reference from the Company's definitive proxy statement for the Annual Meeting of Stockholders to be held June 18, 2015, to be filed pursuant to Regulation 14A on or about April 30, 2015.
|
ITEM
11.
|
EXECUTIVE COMPENSATION
|
Incorporated herein by reference from the Company's definitive proxy statement for the Annual Meeting of Stockholders to
be held June 18, 2015, to be filed pursuant to Regulation 14A on or about April 30, 2015.
|
ITEM
12.
|
SECURITY OWNERSHIP OF CERTAIN BENEFICIAL OWNERS AND MANAGEMENT AND RELATED STOCKHOLDER MATTERS
|
Incorporated herein by reference from the Company's definitive proxy statement for the Annual Meeting of Stockholders to
be held June 18, 2015, to be filed pursuant to Regulation 14A on or about April 30, 2015.
|
ITEM
13.
|
CERTAIN RELATIONSHIPS AND RELATED TRANSACTIONS, AND DIRECTOR INDEPENDENCE
|
Incorporated herein by reference from the Company's definitive proxy statement for the Annual Meeting of Stockholders to
be held June 18, 2015, to be filed pursuant to Regulation 14A on or about April 30, 2015.
|
ITEM
14.
|
PRINCIPAL ACCOUNTING FEES AND SERVICES
|
Incorporated herein by reference from the Company's definitive proxy statement for the Annual Meeting of Stockholders to
be held June 18, 2015, to be filed pursuant to Regulation 14A on or about April 30, 2015.
116
|
ITEM 15.
|
EXHIBITS AND FINANCIAL STATEMENT SCHEDULES
|
(a) 1 and 2. Financial Statements and any Financial Statement Schedules
The financial statements and financial statement schedules listed in the accompanying index to the consolidated financial statements and financial statement schedules are filed as part of this report.
(b) Listing of Exhibits
|
Exhibit No.
|
Description
|
|
|
2.1
|
Purchase and Assumption Agreement, dated as of May 14, 2010, among Federal Insurance Deposit Corporation, Receiver of Southwest Community Bank, Springfield, Missouri, Federal Deposit Insurance Corporation and Simmons First National Bank (incorporated by reference to Exhibit 2.1 to Simmons First National Corporation’s Current Report on Form 8-K, as amended, for May 19, 2010 (File No. 000-06253)).
|
|
|
2.2
|
Purchase and Assumption Agreement, dated as of October 15, 2010, among Federal Insurance Deposit Corporation, Receiver of Security Savings Bank F.S.B., Olathe, Kansas, Federal Deposit Insurance Corporation and Simmons First National Bank (incorporated by reference to Exhibit 2.1 to Simmons First National Corporation’s Current Report on Form 8-K, as amended, for October 21, 2010 (File No. 000-06253)).
|
|
|
2.3
|
Purchase and Assumption Agreement Whole Bank All Deposits, among Federal Insurance Deposit Corporation, Receiver of Truman Bank, St. Louis, Missouri, Federal Deposit Insurance Corporation, and Simmons First National Bank, Pine Bluff, Arkansas, dated as of September 14, 2012 (incorporated by reference to Exhibit 2.1 to Simmons First National Corporation’s Current Report on Form 8-K, as amended, for September 20, 2012 (File No. 000-06253)).
|
|
|
2.4
|
Loan Sale Agreement, by and between Federal Deposit Insurance Corporation, as Receiver for Truman Bank, St. Louis, Missouri, and Simmons First National Bank, Pine Bluff, Arkansas, dated as of September 14, 2012 (incorporated by reference to Exhibit 2.2 to Simmons First National Corporation’s Current Report on Form 8-K, as amended, for September 20, 2012 (File No. 000-06253)).
|
|
|
2.5
|
Purchase and Assumption Agreement Whole Bank All Deposits, among Federal Insurance Deposit Corporation, Receiver of Excel Bank, Sedalia, Missouri, Federal Deposit Insurance Corporation, and Simmons First National Bank, Pine Bluff, Arkansas, dated as of October 19, 2012 (incorporated by reference to Exhibit 2.1 to Simmons First National Corporation’s Current Report on Form 8-K, as amended, for October 25, 2012 (File No. 000-06253)).
|
|
|
2.6
|
Stock Purchase Agreement by and between Simmons First National Corporation and Rogers Bancshares, Inc., dated as of September 10, 23013 (incorporated by reference to Exhibit 10.1 to Simmons First National Corporation’s Current Report on Form 8-K for September 12, 2013 (File No. 000-06253)).
|
|
|
3.1
|
Restated Articles of Incorporation of Simmons First National Corporation (incorporated by reference to Exhibit 3.1 to Simmons First National Corporation’s Quarterly Report on Form 10
‑
Q for the Quarter ended March 31, 2009 (File No. 000-06253)).
|
|
|
3.2
|
Amended By-Laws of Simmons First National Corporation (incorporated by reference to Exhibit 3.2 to Simmons First National Corporation’s Quarterly Report on Form 10-Q for the Quarter ended September 30, 2013 (File No. 000-06253)).
|
|
|
10.1
|
Amended and Restated Trust Agreement, dated as of December 16, 2003, among the Company, Deutsche Bank Trust Company Americas, Deutsche Bank Trust Company Delaware and each of J. Thomas May, Barry L. Crow and Bob Fehlman as administrative trustees, with respect to Simmons First Capital Trust II (incorporated by reference to Exhibit 10.1 to Simmons First National Corporation’s Annual Report on Form 10-K for the Year ended December 31, 2003 (File No. 000-06253)).
|
117
|
10.2
|
Guarantee Agreement, dated as of December 16, 2003, between the Company and Deutsche Bank Trust Company Americas, as guarantee trustee, with respect to Simmons First Capital Trust II (incorporated by reference to Exhibit 10.2 to Simmons First National Corporation’s Annual Report on Form 10-K for the Year ended December 31, 2003 (File No. 000-06253)).
|
|
|
10.3
|
Junior Subordinated Indenture, dated as of December 16, 2003, among the Company and Deutsche Bank Trust Company Americas, as trustee, with respect to the junior subordinated note held by Simmons First Capital Trust II (incorporated by reference to Exhibit 10.3 to Simmons First National Corporation’s Annual Report on Form 10-K for the Year ended December 31, 2003 (File No. 000-06253)).
|
|
|
10.4
|
Amended and Restated Trust Agreement, dated as of December 16, 2003, among the Company, Deutsche Bank Trust Company Americas, Deutsche Bank Trust Company Delaware and each of J. Thomas May, Barry L. Crow and Bob Fehlman as administrative trustees, with respect to Simmons First Capital Trust III (incorporated by reference to Exhibit 10.4 to Simmons First National Corporation’s Annual Report on Form 10-K for the Year ended December 31, 2003 (File No. 000-06253)).
|
|
|
10.5
|
Guarantee Agreement, dated as of December 16, 2003, between the Company and Deutsche Bank Trust Company Americas, as guarantee trustee, with respect to Simmons First Capital Trust III (incorporated by reference to Exhibit 10.5 to Simmons First National Corporation’s Annual Report on Form 10-K for the Year ended December 31, 2003 (File No. 000-06253)).
|
|
|
10.6
|
Junior Subordinated Indenture, dated as of December 16, 2003, among the Company and Deutsche Bank Trust Company Americas, as trustee, with respect to the junior subordinated note held by Simmons First Capital Trust III (incorporated by reference to Exhibit 10.6 to Simmons First National Corporation’s Annual Report on Form 10-K for the Year ended December 31, 2003 (File No. 000-06253)).
|
|
|
10.7
|
Amended and Restated Trust Agreement, dated as of December 16, 2003, among the Company, Deutsche Bank Trust Company Americas, Deutsche Bank Trust Company Delaware and each of J. Thomas May, Barry L. Crow and Bob Fehlman as administrative trustees, with respect to Simmons First Capital Trust IV (incorporated by reference to Exhibit 10.7 to Simmons First National Corporation’s Annual Report on Form 10-K for the Year ended December 31, 2003 (File No. 000-06253)).
|
|
|
10.8
|
Guarantee Agreement, dated as of December 16, 2003, between the Company and Deutsche Bank Trust Company Americas, as guarantee trustee, with respect to Simmons First Capital Trust IV (incorporated by reference to Exhibit 10.8 to Simmons First National Corporation’s Annual Report on Form 10-K for the Year ended December 31, 2003 (File No. 000-06253)).
|
|
|
10.9
|
Junior Subordinated Indenture, dated as of December 16, 2003, among the Company and Deutsche Bank Trust Company Americas, as trustee, with respect to the junior subordinated note held by Simmons First Capital Trust IV (incorporated by reference to Exhibit 10.9 to Simmons First National Corporation’s Annual Report on Form 10-K for the Year ended December 31, 2003 (File No. 000-06253)).
|
|
|
10.10
|
Notice of discretionary bonuses to J. Thomas May, David L. Bartlett, Robert A. Fehlman, Marty D. Casteel and Robert C. Dill (incorporated by reference to Simmons First National Corporation’s Current Report on Form 8-K for January 25, 2010 (File No. 000-06253)).
|
|
10.11
|
Deferred Compensation Agreements, adopted January 25, 2010, between Simmons First National Corporation and Robert A. Fehlman and Marty D. Casteel (incorporated by reference to Exhibits 10.2 and 10.3 to Simmons First National Corporation’s Current Report on Form 8-K for January 25, 2010 (File No. 000-06253)).
|
|
|
10.12
|
Simmons First National Corporation Executive Retention Program, adopted January 25, 2010, and notice of retention bonuses to David Bartlett, Robert A. Fehlman and Marty D. Casteel (incorporated by reference to Exhibit 10.4 to Simmons First National Corporation’s Current Report on Form 8-K for January 25, 2010 (File No. 000-06253)).
|
|
118
|
10.13
|
Simmons First National Corporation Executive Stock Incentive Plan – 2010, adopted January 25, 2010 (incorporated by reference to Exhibit 10.5 to Simmons First National Corporation’s Current Report on Form 8-K for January 25, 2010 (File No. 000-06253)).
|
|
|
10.14
|
Deferred Compensation Agreement for Marty D. Casteel (incorporated by reference to Exhibit 10.3 to Simmons First National Corporation’s Current Report on Form 8-K for January 25, 2010 (File No. 000-06253)).
|
|
|
10.15
|
Simmons First National Corporation Executive Retention Program (incorporated by reference to Exhibit 10.4 to Simmons First National Corporation’s Current Report on Form 8-K for January 25, 2010 (File No. 000-06253)).
|
|
|
10.16
|
Simmons First National Corporation Executive Stock Incentive Plan - 2010 (incorporated by reference to Exhibit 10.5 to Simmons First National Corporation’s Current Report on Form 8-K for January 25, 2010 (File No. 000-06253)).
|
|
|
10.17
|
Change in Control Agreement for J. Thomas May (incorporated by reference to Exhibit 10(a) to Simmons First National Corporation’s Quarterly Report on Form 10-Q filed August 9, 2001 (File No. 000-06253)).
|
|
|
10.18
|
Change in Control Agreement for Robert A. Fehlman (incorporated by reference to Exhibit 10.3 to Simmons First National Corporation’s Current Report on Form 8-K filed January 29, 2010 (File No. 000-06253)).
|
|
|
10.19
|
Change in Control Agreement for David Bartlett (incorporated by reference to Exhibit 10.1 to Simmons First National Corporation’s Current Report on Form 8-K filed March 2, 2006 (File No. 000-06253)).
|
|
|
10.20
|
Change in Control Agreement for Marty D. Casteel (incorporated by reference to Exhibit 10.2 to Simmons First National Corporation’s Current Report on Form 8-K filed January 29, 2010 (File No. 000-06253)).
|
|
|
10.21
|
Change in Control Agreement for Robert Dill (incorporated by reference to Exhibit 10.21 to Simmons First National Corporation’s Amendment to the Annual Report on Form 10-K/A for the Year ended December 31, 2009 (File No. 000-06253)).
|
|
|
10.22
|
Amendment to Change in Control Agreement for Robert C. Dill (incorporated by reference to Exhibit 10.22 to Simmons First National Corporation’s Amendment to the Annual Report on Form 10-K/A for the Year ended December 31, 2009 (File No. 000-06253)).
|
|
|
10.23
|
Amended and Restated Deferred Compensation Agreement for J. Thomas May (incorporated by reference to Exhibit 10.23 to Simmons First National Corporation’s Amendment to the Annual Report on Form 10-K/A for the Year ended December 31, 2009 (File No. 000-06253)).
|
|
10.24
|
First Amendment to the Amended and Restated Deferred Compensation Agreement for J. Thomas May (incorporated by reference to Exhibit 10.24 to Simmons First National Corporation’s Amendment to the Annual Report on Form 10-K/A for the Year ended December 31, 2009 (File No. 000-06253)).
|
|
|
10.25
|
Second Amendment to the Amended and Restated Deferred Compensation Agreement for J. Thomas May (incorporated by reference to Exhibit 10.25 to Simmons First National Corporation’s Amendment to the Annual Report on Form 10-K/A for the Year ended December 31, 2009 (File No. 000-06253)).
|
|
|
10.26
|
Executive Salary Continuation Agreement for David L. Bartlett (incorporated by reference to Exhibit 10.26 to Simmons First National Corporation’s Amendment to the Annual Report on Form 10-K/A for the Year ended December 31, 2009 (File No. 000-06253)).
|
|
119
|
10.27
|
409A Amendment to the Simmons First Bank of Hot Springs Executive Salary Continuation Agreement for David Bartlett (incorporated by reference to Exhibit 10.27 to Simmons First National Corporation’s Amendment to the Annual Report on Form 10-K/A for the Year ended December 31, 2009 (File No. 000-06253)).
|
|
|
10.28
|
Simmons First National Corporation Incentive and Non-Qualified Stock Option Plan (incorporated by reference to Exhibit 4.1 to Simmons First National Corporation’s Registration Statement on Form S-8 filed May 19, 2006 (File No. 333-134276)).
|
|
|
10.29
|
Simmons First National Corporation Executive Stock Incentive Plan (incorporated by reference to Exhibit 4.1 to Simmons First National Corporation’s Registration Statement on Form S-8 filed May 19, 2006 (File No. 333-134301)).
|
|
|
10.30
|
Simmons First National Corporation Executive Stock Incentive Plan – 2001 (incorporated by reference to Definitive Additional Materials to Simmons First National Corporation’s Definitive Proxy Materials on Schedule 14A filed April 2, 2001 (File No. 000-06253)).
|
|
|
10.31
|
Simmons First National Corporation Executive Stock Incentive Plan – 2006 (incorporated by reference to Exhibit 1.2 to Simmons First National Corporation’s Definitive Proxy Materials on Schedule 14A filed March 10, 2006 (File No. 000-06253)).
|
|
|
10.32
|
First Amendment to Simmons First National Corporation Executive Stock Incentive Plan – 2006 (incorporated by reference to Exhibit 10.1 to Simmons First National Corporation’s Current Report on Form 8-K filed June 4, 2007 (File No. 000-06253)).
|
|
|
10.33
|
Simmons First National Corporation Outside Director's Stock Incentive Plan - 2006 (incorporated by reference to Exhibit 1.3 to Simmons First National Corporation’s Definitive Proxy Materials on Schedule 14A filed March 10, 2006 (File No. 000-06253)).
|
|
|
10.34
|
Amended and Restated Simmons First National Corporation Outside Director's Stock Incentive Plan - 2006 (incorporated by reference to Exhibit 1.1 to Simmons First National Corporation’s Definitive Proxy Materials on Schedule 14A filed March 10, 2008 (File No. 000-06253)).
|
|
|
10.35
|
Simmons First National Corporation Dividend Reinvestment Plan (incorporated by reference to Exhibit 4.1 to Simmons First National Corporation’s Registration Statement on Form S-3D filed May 20, 1998 (File No. 333-53119)).
|
|
|
10.36
|
Simmons First National Corporation Amended and Restated Dividend Reinvestment Plan (incorporated by reference to Exhibit 4.1 to Simmons First National Corporation’s Registration Statement on Form S-3D filed July 14, 2004 (File No. 333-117350)).
|
|
10.37
|
Form of Lock-Up Agreement (incorporated by reference to Exhibit 10.1 to Simmons First National Corporation’s Current Report on Form 8-K filed November 12, 2009 (File No. 000-06253)).
|
|
|
10.38
|
Simmons First National Corporation Executive Stock Incentive Plan - 2010 (incorporated by reference to Exhibit 99.1 to Simmons First National Corporation’s Registration Statement on Form S-8 filed January 28, 2013 (File No. 333-186254)).
|
|
|
10.39
|
Simmons First National Corporation Chief Executive Officer Long Term Incentive Plan (incorporated by reference to Exhibit 10.1 to Simmons First National Corporation’s Current Report on Form 8-K filed February 28, 2014 (File No. 000-6253)).
|
|
|
10.40
|
Simmons First National Corporation Outside Director Stock Incentive Plan - 2014 (incorporated by reference to Exhibit 10.2 to Simmons First National Corporation’s Current Report on Form 8-K filed February 28, 2014 (File No. 000-6253)).
|
|
|
12.1
|
Computation of Ratios of Earnings to Fixed Charges.*
|
|
|
14
|
Code of Ethics, dated December 2003, for CEO, CFO, controller and other accounting officers (incorporated by reference to Exhibit 14 to Simmons First National Corporation’s Annual Report on Form 10-K for the Year ended December 31, 2003 (File No. 000-06253)).
|
|
|
23
|
Consent of BKD, LLP.*
|
|
|
31.1
|
Rule 13a-15(e) and 15d-15(e) Certification – George A. Makris, Jr., Chairman and Chief Executive Officer.*
|
|
120
|
31.2
|
Rule 13a-15(e) and 15d-15(e) Certification – Robert A. Fehlman, Senior Executive Vice President, Chief Financial Officer and Treasurer.*
|
|
|
31.3
|
Rule 13a-15(e) and 15d-15(e) Certification – David W. Garner, Executive Vice President, Controller and Chief Accounting Officer.*
|
|
|
32.1
|
Certification Pursuant to 18 U.S.C. Sections 1350, as Adopted Pursuant to Section 906 of the Sarbanes-Oxley Act of 2002 – George A. Makris, Jr., Chairman and Chief Executive Officer.*
|
|
|
32.2
|
Certification Pursuant to 18 U.S.C. Sections 1350, as Adopted Pursuant to Section 906 of the Sarbanes-Oxley Act of 2002 – Robert A. Fehlman, Senior Executive Vice President, Chief Financial Officer and Treasurer.*
|
|
|
32.3
|
Certification Pursuant to 18 U.S.C. Sections 1350, as Adopted Pursuant to Section 906 of the Sarbanes-Oxley Act of 2002 – David W. Garner, Executive Vice President, Controller and Chief Accounting Officer.*
|
|
|
101.INS
|
XBRL Instance Document.**
|
|
|
101.SCH
|
XBRL Taxonomy Extension Schema.**
|
|
|
101.CAL
|
XBRL Taxonomy Extension Calculation Linkbase.**
|
|
|
101.DEF
|
XBRL Taxonomy Extension Definition Linkbase.**
|
|
|
101.LAB
|
XBRL Taxonomy Extension Labels Linkbase. **
|
|
|
101.PRE
|
XBRL Taxonomy Extension Presentation Linkbase.**
|
|
|
*
|
Filed herewith
|
|
|
**
|
Pursuant to Rule 406T of Regulation S-T, these interactive data files are deemed not filed or part of a registration statement or prospectus for purposes of Sections 11 or 12 of the Securities Act of 1933, as amended, are deemed not filed for purposes of Section 18 of the Securities Act of 1934, as amended, and otherwise are not subject to liability under those sections.
|
|
121
Pursuant to the requirements of Section 13 or 15 (d) of the Securities Exchange Act of 1934, the Registrant has duly caused this report to be signed on its behalf by the undersigned, thereunto duly authorized.
|
/s/ Susan F. Smith
|
March 16, 2015
|
||
|
Susan F. Smith, Secretary
|
|||
Pursuant to the requirements of the Securities and Exchange Act of 1934, this report has been signed below by the following persons on behalf of the registrant and in the capacities indicated on or about March 16, 2015.
|
Signature
|
Title
|
|
|
/s/ George A. Makris, Jr.
|
Chairman and Chief Executive Officer
|
|
|
George A. Makris, Jr.
|
and Director
|
|
|
/s/ Robert A. Fehlman
|
Senior Executive Vice President,
|
|
|
Robert A. Fehlman
|
Chief Financial Officer and Treasurer
|
|
|
(Principal Financial Officer)
|
||
|
/s/ David W. Garner
|
Executive Vice President, Controller and
|
|
|
David W. Garner
|
Chief Accounting Officer
|
|
|
(Principal Accounting Officer)
|
||
|
/s/ David L. Bartlett
|
President and Chief Banking Officer and Director
|
|
|
David L. Bartlett
|
||
|
/s/ William E. Clark II
|
Director
|
|
|
William E. Clark II
|
||
|
/s/ Steven A. Cossé
|
Director
|
|
|
Steven A. Cossé
|
||
|
/s/ Edward Drilling
|
Director
|
|
|
Edward Drilling
|
||
|
/s/ Sharon L. Gaber
|
Director
|
|
|
Sharon L. Gaber
|
||
|
/s/ Eugene Hunt
|
Director
|
|
|
Eugene Hunt
|
||
|
/s/ W. Scott McGeorge
|
Director
|
|
|
W. Scott McGeorge
|
||
|
/s/ Harry L. Ryburn
|
Director
|
|
|
Harry L. Ryburn
|
||
|
/s/ Robert L. Shoptaw
|
Director
|
|
|
Robert L. Shoptaw
|
122
TABLE OF CONTENTS
Part IItem 1. BusinessItem 1A. Risk FactorsItem 1B. Unresolved Staff CommentsItem 2. PropertiesItem 3. Legal ProceedingsPart IIItem 5. Market For Registrant S Common Equity, Related Stockholder Matters and Issuer Purchases Of Equity SecuritiesItem 6. Selected Consolidated Financial DataItem 7. Management's Discussion and Analysis Of Financialcondition and Results Of OperationsItem 7A. Quantitative and Qualitative Disclosures About Market RiskItem 8. Consolidated Financial Statements and Supplementary DataNote 1: Nature Of Operations and Summary Of Significant Accounting PoliciesNote 2: AcquisitionsNote 3: Investment SecuritiesNote 4: Loans and Allowance For Loan LossesNote 5: Loans AcquiredNote 6: Goodwill and Other Intangible AssetsNote 7: Time DepositsNote 8: Income TaxesNote 9: Other Borrowings and Subordinated DebenturesNote 10: Capital StockNote 11: Transactions with Related PartiesNote 12: Employee Benefit PlansNote 13: Additional Cash Flow InformationNote 14: Other Operating ExpensesNote 15: Disclosures About Fair Value Of Financial InstrumentsNote 16: Significant Estimates and ConcentrationsNote 17: Commitments and Credit RiskNote 18: New Accounting StandardsNote 19: Contingent LiabilitiesNote 21: Condensed Financial Information (parent Company Only)Item 9. Changes in and Disagreements with Accountants on Accounting and Financial DisclosureItem 9A. Controls and ProceduresItem 9B. Other InformationPart IIIItem 10. Directors, Executive Officers and Corporate GovernanceItem 11. Executive CompensationItem 12. Security Ownership Of Certain Beneficial Owners and Management and Related Stockholder MattersItem 13. Certain Relationships and Related Transactions, and Director IndependenceItem 14. Principal Accounting Fees and ServicesPart IVItem 15. Exhibits and Financial Statement Schedules