SURGERY PARTNERS, INC.
10-Ks and 10-Qs
|
|
|
|
|
|
|
|
|
|
|
|
|
|
|
|
|
|
|
|
|
|
|
|
|
|
|
|
|
|
|
|
|
|
|
|
|
|
UNITED STATES
SECURITIES AND EXCHANGE COMMISSION
Washington, D.C. 20549
________________________________________________________________
Form 10-K
|
x
|
Annual report pursuant to Section 13 or 15(d) of the Securities Exchange Act of 1934 for the fiscal year ended
December 31, 2019
|
OR
|
o
|
Transition report pursuant to Section 13 or 15(d) of the Securities Exchange Act of 1934
|
Commission file number: 001-37576
Surgery Partners, Inc.
(Exact name of registrant as specified in its charter)
|
Delaware
|
|
47-3620923
|
|
(State or other jurisdiction of
incorporation or organization)
|
|
(I.R.S. Employer
Identification No.)
|
310 Seven Springs Way, Suite 500
Brentwood, Tennessee 37027
(Address of principal executive offices and zip code)
(615) 234-5900
(Registrant’s telephone number, including area code)
Securities registered pursuant to Section 12(b) of the Act:
|
Title of each class
|
Trading Symbol(s)
|
Name of each exchange on which registered
|
||
|
Common Stock, par value $0.01 per share
|
SGRY
|
The Nasdaq Global Select Market
|
||
Securities registered pursuant to section 12(g) of the Act: None
Indicate by check mark if the registrant is a well-known seasoned issuer, as defined in Rule 405 of the Securities Act. Yes
o
No
x
Indicate by check mark if the registrant is not required to file reports pursuant to Section 13 or Section 15(d) of the Act. Yes
o
No
x
Indicate by check mark whether the registrant (1) has filed all reports required to be filed by Section 13 or 15(d) of the Securities Exchange Act of 1934 during the preceding 12 months (or for such shorter period that the registrant was required to file such reports), and (2) has been subject to such filing requirements for the past 90 days. Yes
x
No
o
Indicate by check mark whether the registrant has submitted electronically every Interactive Data File required to be submitted pursuant to Rule 405 of Regulation S-T (§ 232.405 of this chapter) during the preceding 12 months (or for such shorter period that the registrant was required to submit such files). Yes
x
No
o
Indicate by check mark whether the registrant is a large accelerated filer, an accelerated filer, a non-accelerated filer, a smaller reporting company, or an emerging growth company (each as defined in Exchange Act Rule 12b-2).
|
Large accelerated filer
o
|
|
Accelerated filer
x
|
Non-accelerated filer
o
|
|
|
Smaller reporting company
o
|
Emerging growth company
o
|
|||
If an emerging growth company, indicate by check mark if the registrant has elected not to use the extended transition period for complying with any new or revised financial accounting standards provided pursuant to Section 13(a) of the Exchange Act.
o
Indicate by check mark whether the registrant is a shell company (as defined in Rule 12b-2 of the Exchange Act). Yes
o
No
x
The aggregate market value of the registrant’s voting and non-voting common equity held by non-affiliates of the registrant based on the closing price of the shares of common stock on The Nasdaq Stock Market on June 28, 2019, was
$174.7 million
. As of
March 4, 2020
, there were
49,289,926
shares of the registrant’s common stock outstanding.
DOCUMENTS INCORPORATED BY REFERENCE
Portions of the registrant's definitive proxy statement for the 2020 annual meeting stockholders are incorporated by reference into Part III of this report.
SURGERY PARTNERS, INC.
FORM 10-K
TABLE OF CONTENTS
|
Page
|
||
Cautionary Note Regarding Forward-Looking Statements
This Annual Report on Form 10-K (this "Annual Report") contains forward-looking statements based on our current expectations, estimates and assumptions about future events. All statements other than statements of current or historical fact contained in this report, including statements regarding our future financial position, business strategy, budgets, projected costs and plans and objectives of management for future operations, are forward-looking statements. The words "projections," "believe," "continue," "drive," "estimate," "expect," "intend," "may," "plan," "will," "could," "would" and similar expressions are generally intended to identify forward-looking statements.
By their nature, forward-looking statements involve risks and uncertainties because they relate to events and depend on circumstances that may or may not occur in the future. We believe that these risks and uncertainties include, but are not limited to, those described in the "Risk Factors" section of this Annual Report, which include but are not limited to the following:
|
•
|
the social and economic impact of the COVID-19 outbreak on our business;
|
|
•
|
the impact of future legislation and other health care regulatory reform actions, and the effect of that legislation and other regulatory actions on our business;
|
|
•
|
our ability to comply with current health care laws and regulations;
|
|
•
|
reductions in payments from government health care programs and private insurance payors, such as health maintenance organizations ("HMOs"), preferred provider organizations ("PPOs"), and other managed care organizations and employers;
|
|
•
|
our ability to contract with private insurance payors;
|
|
•
|
changes in our payor mix or surgical case mix;
|
|
•
|
failure to maintain or develop relationships with our physicians on beneficial or favorable terms, or at all;
|
|
•
|
the impact of payor controls designed to reduce the number of surgical procedures;
|
|
•
|
our efforts to integrate operations of acquired businesses and surgical facilities, attract new physician partners, or acquire additional surgical facilities;
|
|
•
|
shortages or quality control issues with surgery-related products, equipment and medical supplies;
|
|
•
|
competition for physicians, nurses, strategic relationships, acquisitions and managed care contracts;
|
|
•
|
our ability to attract and retain qualified health care professionals;
|
|
•
|
our ability to enforce non-compete restrictions against our physicians;
|
|
•
|
our ability to manage material liabilities whether known or unknown incurred as a result of acquiring surgical facilities;
|
|
•
|
economic and competitive conditions;
|
|
•
|
the outcome of legal and regulatory proceedings that have been or may be brought against us;
|
|
•
|
changes in the regulatory, economic and other conditions of the states where our surgical facilities are located;
|
|
•
|
payments we are required to make under the tax receivable agreement; and
|
|
•
|
our indebtedness.
|
Although we base these forward-looking statements on assumptions that we believe are reasonable when made, we caution you that our actual results of operations, financial condition and liquidity, and the development of the industry in which we operate may differ materially from those made in or suggested by the forward-looking statements contained in this Annual Report. We have based these forward-looking statements on our current expectations and projections about future events and financial trends that we believe may affect our financial condition, results of operations, business strategy and financial needs. They can be affected by known or unknown risks, uncertainties and assumptions, including, among other things, the risks, uncertainties and assumptions described in Item 1A. "Risk Factors."
Any forward-looking statements and other information set forth in this Annual Report speak only as of the date made. Other than as required by law, we undertake no obligation to publicly update or revise any forward-looking statements, whether as a result of new information, future events or otherwise. You are advised, however, to consult any further disclosures we make on related subjects in our Quarterly Reports on Form 10-Q, Current Reports on Form 8-K, press releases, investor presentations and our website.
PART I
Item 1. Business
Overview
Surgery Partners, Inc., a Delaware corporation, acting through its subsidiaries, owns and operates a national network of surgical facilities and ancillary services. Surgery Partners, Inc. was formed April 2, 2015, as a holding company for the purpose of facilitating an initial public offering of shares of common stock. Prior to September 30, 2015, we conducted business through Surgery Center Holdings, Inc. and its subsidiaries. Unless the context otherwise indicates, Surgery Partners, Inc. and its subsidiaries are referred to herein as "Surgery Partners," "we," "us," "our" or the "Company."
On August 31, 2017, we completed the acquisition of NSH Holdco, Inc. (the "NSH Merger" or "acquisition of NSH"). Also on August 31, 2017, (i) we completed the sale and issuance of 310,000 shares of our 10.00% Series A Convertible Perpetual Participating Preferred Stock (the "Series A Preferred Stock") to a fund advised by an affiliate of Bain Capital Private Equity LP ("Bain Capital"), at a cash purchase price of $1,000 per share (the "Preferred Private Placement"), and (ii) Bain Capital completed its purchase of 26,455,651 shares (the "Purchased Shares") of our common stock from H.I.G. Surgery Centers, LLC ("H.I.G.") (the "Private Sale"). As a result, Bain Capital became our controlling stockholder, holding Series A Preferred Stock and Common Stock that collectively represented approximately 65.7% of the voting power of all classes of capital stock of the Company as of August 31, 2017, and H.I.G. and its affiliated investment funds no longer own any capital stock of the Company. We refer to the Preferred Private Placement and the Private Sale collectively in this Annual Report as the "Transactions."
The following discussion of our business covers periods both prior to and subsequent to the Transactions. As discussed in the notes to the consolidated financial statements included in this Annual Report, in connection with the change of control effected by the Private Sale, we elected to apply "pushdown" accounting. We have presented the information for the year ended December 31, 2017 on a Predecessor period and Successor period combined basis (each as defined in Note 1. "Organization and Summary of Accounting Policies" of our consolidated financial statements) to facilitate meaningful comparisons of operating results to the prior year periods. You should read the following discussion together with our consolidated financial statements and related notes included elsewhere herein.
As of
December 31, 2019
, we owned or operated primarily in partnership with physicians, a portfolio of
128
surgical facilities in the United States comprised of
112
ambulatory surgical centers ("ASCs") and
16
surgical hospitals ("surgical hospitals," and together with ASCs referred to as "surgical facilities" or "facilities") across
30
states, including a majority interest in
85
of the surgical facilities. During
2019
, patient services provided in our surgical facilities generated approximately
$1.7 billion
in revenue.
Our Growth Strategies
Our differentiated operating model employs a multifaceted strategy to grow revenue, earnings and cash flow. We believe the following are key components to this strategy:
|
•
|
Deliver outstanding patient care and clinical outcomes;
|
|
•
|
Continue to execute and expand upon our physician engagement strategy in attractive markets;
|
|
•
|
Become the partner of choice for physicians seeking to become or stay independent;
|
|
•
|
Drive organic growth at existing facilities through targeted physician recruitment, service line expansion and implementing our efficient operating model;
|
|
•
|
Seek partnership opportunities with payors to make health care more affordable for their members;
|
|
•
|
Continue our disciplined acquisition strategy;
|
|
•
|
Offer new services to provide a more comprehensive continuum of care; and
|
|
•
|
Enhance operational efficiencies and productivity by delivering on integration.
|
In addition, we believe favorable industry trends such as an aging population and advancements in medical technology will further drive growth.
Operations
We operate in three reporting segments: surgical facility services, ancillary services and optical services.
|
•
|
Our surgical facility services segment consists of the operation of ASCs and surgical hospitals and includes our anesthesia services. Our surgical facilities primarily provide non-emergency surgical procedures across many specialties, including, among others, orthopedics and pain management, ophthalmology, gastroenterology ("GI") and general surgery.
|
|
•
|
Our ancillary services segment consists of a diagnostic laboratory and multi-specialty physician practices, including physician practices owned and operated pursuant to long-term management service agreements.
|
|
•
|
Our optical services segment consists of an optical products group purchasing organization. Until we divested certain businesses in October 2018, this segment also included an optical laboratory that manufactured eyewear.
|
1
Surgical Facility Services Segment
Surgical Facility Operations
As of
December 31, 2019
, we owned or operated primarily in partnership with physicians,
128
surgical facilities, including
112
ASCs and
16
licensed surgical hospitals. Our surgical facility services segment contributed approximately
95%
of our total revenue in both 2019 and 2018, and
93%
of our total revenue in 2017.
Our typical ASC is a free-standing facility that performs planned surgical procedures on an outpatient basis for patients not requiring hospitalization and for whom an overnight stay is not expected after surgery. Each center typically has one to four operating or procedure rooms with areas for reception, pre-operative care, recovery and administration. The staff of our ASCs generally includes a center administrator, registered nurses, operating room technicians, as well as other administrative staff.
Our surgical hospitals are generally larger than our ASCs and include inpatient hospital rooms and, in certain cases, emergency departments. Our surgical hospitals also provide ancillary services such as diagnostic imaging, pharmacy and laboratory.
We operate both multi-specialty and single-specialty facilities. In multi-specialty facilities, a variety of surgical procedures are performed, including, among others, orthopedics and pain management, ophthalmology, GI and general surgery. We have diversified the mix of procedures performed at our facilities by strategically introducing select specialties that will complement existing services. In many cases, we keep certain facilities as single-specialty where it suits an individual facility or market demand.
Our surgical facilities are generally located in close proximity to physicians’ offices. We provide each of our surgical facilities with a full range of financial, marketing and operating services. For example, our regional managed care directors assist the local management team at each of our surgical facilities in developing relationships with private insurance payors and negotiating private insurance contracts.
Surgical Facility Ownership Structure
We own and operate our surgical facilities through partnerships or limited liability companies with physicians, physician groups and health care systems. One of our wholly-owned subsidiaries typically serves as the general partner or managing member of our surgical facilities. We generally seek to own a majority interest in our surgical facilities or otherwise have sufficient control over the facilities in order to consolidate the financial results. In some instances, we will acquire ownership in a surgical facility with the prior owners retaining ownership, and, in some cases, we offer new ownership to other physicians or health care systems. We hold majority ownership in
85
of the
128
surgical facilities in which we own an interest. We provide intercompany loans to some of the surgical facilities which often are secured by a pledge of assets of the facility. We also provide day-to-day management services for a majority of our surgical facilities pursuant to a management agreement and receive a management fee that is typically equal to a percentage of the facility revenue.
Strategic Relationships
When attractive opportunities arise, we may develop, acquire or operate surgical facilities through strategic relationships with payors, health care systems, and other health care providers. We believe that forming such strategic relationships can enhance our ability to attract physicians and access favorable private insurance contracts for our surgical facilities in that market.
The strategic relationships through which we own and operate surgical facilities are governed by partnership and operating agreements that are generally comparable to the partnership and operating agreements of the other surgical facilities in which we own an interest. The primary difference between the structure of these strategic relationships and the other surgical facilities in which we hold ownership is that, in these strategic relationships, a health care system holds ownership in the surgical facility in addition to physician investors. In each of these strategic relationships, we also have entered into a management agreement under which we provide day-to-day management services for a management fee equal to a percentage of the revenues of the surgical facility. The terms of those management agreements are comparable to the terms of our management agreements with other surgical facilities in which we own an interest.
Sources of Revenue
Revenue from our surgical facilities is earned from facility fees related to health care services performed in our surgical facilities and is included in our patient service revenues. The fee charged for surgical services varies depending on the type of service provided, but usually includes all charges for usage of an operating room, a recovery room, special equipment, supplies, nursing staff and/or medications. Our fees do not typically include professional fees charged by the patient's surgeon, anesthesiologist or other attending physician, which are billed directly by such physicians.
We are dependent upon government and private insurance sources of payment for the services we provide. The amounts that our surgical facilities receive in payment for their services may be adversely affected by market and cost factors as well as other factors over which we have no control, including Medicare, Medicaid and state regulations, cost containment and utilization decisions and reduced reimbursement schedules of private insurance payors.
2
The following table sets forth the percentage of total patient service revenues for our consolidated surgical facilities by type of payor for the periods indicated:
|
Year Ended December 31,
|
|||||||||
|
2019
|
2018
|
2017
|
|||||||
|
Private Insurance
|
53.8
|
%
|
54.6
|
%
|
53.6
|
%
|
|||
|
Government
|
38.9
|
%
|
37.6
|
%
|
38.3
|
%
|
|||
|
Self-pay
|
2.6
|
%
|
2.9
|
%
|
2.4
|
%
|
|||
|
Other
|
4.7
|
%
|
4.9
|
%
|
5.7
|
%
|
|||
|
Total patient service revenues
|
100.0
|
%
|
100.0
|
%
|
100.0
|
%
|
|||
We receive reimbursement from Medicare for surgical services based on three different payment systems depending on the site of service: hospital inpatient surgical services, hospital outpatient surgical services and outpatient surgical services generally provided in our ASCs.
Medicare Reimbursement - Hospital Inpatient Services
Sixteen
of our surgical facilities are licensed as hospitals. Most inpatient services provided by hospitals are reimbursed by Medicare under the inpatient prospective payment system ("IPPS"). Under the IPPS, a hospital receives a fixed amount for inpatient hospital services based on each patient's final assigned Medicare-severity diagnosis related group ("MS-DRG"). Each MS-DRG is assigned a payment rate that is prospectively set by CMS using national average resources used per case for treating a patient with a particular diagnosis. This assignment also affects the prospectively determined capital rate paid with each MS-DRG. MS-DRG and capital payments are adjusted by a predetermined geographic adjustment factor assigned to the geographic area in which the hospital is located. The index used to adjust the MS-DRG rates, known as the "hospital market basket index," gives consideration to the inflation experienced by hospitals in purchasing goods and services.
On August 2, 2019, the Centers for Medicare and Medicaid Services ("CMS") published the IPPS final rule for federal fiscal year ("FFY") 2020, which began on October 1, 2019. Under the FFY 2020 final rule, rates for inpatient stays in hospitals paid under the IPPS that successfully report certain quality data under the Hospital Inpatient Quality Reporting ("IQR") Program and demonstrate meaningful use of certified electronic health record ("EHR") technology will be increased by 3.1%. Those hospitals that do not successfully report quality data under the IQR Program (but are meaningful EHR users) may receive a payment rate increase of only 1.85%. In addition to the IQR Program, hospitals will be subject to payment adjustments under the Value Based Purchasing Program, Readmissions Reduction Program and Hospital Acquired Conditions Reduction Programs that have been implemented by the Department of Health and Human Services ("HHS").
Medicare Reimbursement - Hospital Outpatient Departments
Surgical services that are provided in hospital outpatient departments ("HOPDs") generally are reimbursed by CMS using the Outpatient Prospective Payment System (the "OPPS"). The OPPS, established by the Secretary of HHS, determines payment amounts prospectively (generally the following calendar year) for various categories of medical services performed in HOPDs. On November 12, 2019, CMS published its OPPS final rule for 2020. The final rule provides for a payment rate increase of 2.6%. Hospitals that do not meet the reporting requirements of the Medicare Hospital Outpatient Quality Reporting Program will be subject to a 2.0% payment rate decrease.
Additionally, as a result of legislative changes related to off-campus HOPDs, certain off-campus HOPDs that began billing under the OPPS (or underwent certain changes) on or after November 2, 2015 are no longer paid for most services under the OPPS. Instead, these facilities are paid under the Medicare Physician Fee Schedule ("MPFS"), which typically results in lower reimbursements. Services provided in a dedicated emergency department are still paid under the OPPS. This change has not significantly affected reimbursement to any of our HOPDs, but we cannot assure you that our HOPDs will not be impacted in the future.
Medicare Reimbursement - ASCs
Payments under the Medicare program to ASCs are also made based on the OPPS. However, the payment received from CMS is a percentage of the payment to HOPDs. Reimbursement rates for ASCs are updated annually based on changes in the consumer price index offset by multifactor productivity adjustments. Based on the OPPS Final Rule, ASC reimbursement rates will increase by 2.6% for 2020. CMS has established the Ambulatory Surgical Center for Quality Reporting ("ASCQR") Program as a pay-for-reporting, quality data program. Our ASCs that participate in the ASCQR Program receive the full annual update to the ASC payment rate. Those ASCs that do not successfully report quality data under the ASCQR Program may receive a payment reduction.
Annual Cost Reports
Hospitals participating in Medicare and Medicaid programs, whether paid on a reasonable cost basis or under a prospective payment system, may be required to meet certain financial reporting requirements. Federal and, where applicable, state regulations require submission of annual cost reports identifying medical costs and expenses associated with the services provided by each hospital to Medicare beneficiaries and Medicaid recipients. Annual cost reports required under the Medicare and Medicaid programs are subject to routine governmental audits. These audits may result in adjustments to the amounts ultimately determined to be payable to us under these reimbursement programs. Finalization of these audits often takes several years. Providers may appeal any final determination made in connection with an audit. While
3
ASCs are not currently subject to federal cost reporting requirements, it is possible that such requirements, which could be costly for us, will be implemented by CMS in the future.
Ancillary Services and Optical Services Segments
Ancillary Services
Our portfolio of outpatient surgical facilities is complemented by a suite of ancillary services, which support our physicians in providing high quality and cost-efficient patient care. Rather than contracting with insurance providers, in some markets we own ancillary businesses, including a diagnostic laboratory, multi-specialty physician practices and urgent care facilities. The Company, physicians and patients benefit from these services through improved clinical efficiency and scheduling, and from incremental revenue associated with retaining fees for these services. Our ancillary services segment contributed approximately
4%
of our total revenue in both 2019 and 2018, and
6%
of our total revenue in
2017
.
|
•
|
We offer physicians toxicology testing services through our wholly-owned diagnostic laboratory, based in Tampa, Florida. Advanced toxicology screening provides physicians with the ability to identify when a patient is taking too much of a prescribed substance, when a patient is non-compliant with a prescribed substance or when a patient is taking unprescribed or illicit substances. Our diagnostic laboratory supports the needs of our physicians across our existing specialties and new service lines.
|
|
•
|
We employ two models in connection with our network of multi-specialty physician practices. For example, in the state of Florida, where the law does not preclude a business corporation from employing physicians, we own and operate Tampa Pain Relief Center, Inc., a wholly-owned business with several locations throughout Florida. In certain other states, we operate physician practices pursuant to long-term management service agreements with separate professional corporations that are wholly-owned by physicians.
|
Optical Services
Our optical services segment contributed less than 1% of our total revenue in each of
2019
,
2018
and
2017
.
Sources of Revenue - Ancillary Services and Optical Services Segments
The fees charged for services in our ancillary services and optical services segments depend on a variety of factors, including the type of service provided, the location in which the service is provided and the provider of the service. Service fees are received from both government and private insurance payors. The amounts that we receive in payment for the provision of ancillary and optical services may be adversely affected by market and cost factors as well as other factors over which we have no control, including Medicare, Medicaid and state regulations, cost containment and utilization decisions and reduced reimbursement schedules of private insurance payors.
Our ancillary services revenue primarily consists of fee for service revenue that is derived principally from the provision of physician and laboratory services to patients of our surgical facilities. Medicare pays for physician services based upon the MPFS. Payment rates under the MPFS are determined based on (i) relative value units for the services provided, (ii) a geographic adjustment factor and (iii) a conversion factor. Payment rates under the MPFS are updated annually by HHS. The primary element in each year’s update calculation is the Medicare Economic Index ("MEI"), which is a measure of the inflation of the cost of operating a physician practice. The update is then adjusted in conformity with the Medicare Access and CHIP Reauthorization Act of 2015 ("MACRA"), which was enacted in 2015. Beginning in 2019, Medicare compensation to physicians and physician practices are subject to adjustment under the Merit-Based Incentive Payment System ("MIPS"). Under MIPS, physicians are assigned a composite performance score based on measures of quality, resource use, meaningful use of EHR, and clinical practice improvement activities. A threshold performance score is set annually by CMS at the mean or median of all composite scores for a prior annual performance period. Performance exceeding the threshold results in a positive adjustment, performance below the threshold results in a negative adjustment, and performance at the threshold results in no adjustment. We cannot predict the effect of future payment methodology changes under MACRA on our physician practices.
Certain of our laboratory ancillary services are reimbursed by Medicare under the Medicare Clinical Laboratory Fee Schedule ("CLFS"). Under a 2016 final rule that implemented the Protecting Access to Medicare Act of 2014 ("PAMA"), as of January 1, 2018 the CLFS payment methodology was adjusted so that payment amounts for laboratory tests on the CLFS is determined by calculating a weighted median of private payor rates using reported private payor rates and associated volume (number of tests). For tests that were paid on the CLFS prior to the implementation of PAMA, any reduction in payment amount will be phased in over the first six years of payment under the new system.
Acquisition and Development Programs
Acquisition Program.
In addition to our corporate strategy, we continuously evaluate opportunities to expand our presence in the surgical facility market by making strategic acquisitions of existing surgical facilities and by developing new surgical facilities in cooperation with local physician partners and, when appropriate, health care systems and other strategic partners. We generally structure our partnerships as two-way arrangements where either we are a majority owner partnered with physicians or we are a minority owner with buy-up rights. These buy-up rights give us the option to own a controlling interest at some point in the future. Alternatively, we may choose to pursue a strategic relationship with physicians and a health care system.
We employ a dedicated acquisition team with experience in health care services. Our team seeks to acquire surgical facilities that meet our criteria, including prominence and quality of physician partners, specialty mix, opportunities for growth, level of competition in the local market, level of private insurance penetration and our ability to access private insurance contracts. We carefully evaluate each of our acquisition opportunities through an extensive due diligence process to determine which facilities have the greatest potential for growth and profitability
4
improvements under our operating structure. Our team may also identify opportunities to attract additional physicians to increase the acquired facility’s revenues and profitability.
Development Program.
We develop surgical facilities in markets that we identify as having substantial interest by physicians and payors. We have experience in developing both single and multi-specialty surgical facilities. When we develop a new surgical facility, we generally provide all of the services necessary to complete the project. We offer in-house capabilities for structuring partnerships and financing facilities and work with architects and construction firms in the design and development of surgical facilities. Before and during the development phase of a new surgical facility, we analyze the competitive environment in the local market, review market data to identify appropriate services to provide, prepare and analyze financial forecasts, evaluate regulatory and licensing issues and assist in designing the surgical facility and identifying appropriate equipment to purchase or lease. After the surgical facility is developed, we typically provide general startup operational support, including information systems, equipment procurement and financing.
Marketing
We primarily direct our sales and marketing efforts at physicians who would utilize our surgical facilities. Marketing activities directed at physicians and other health care providers are coordinated locally by the individual surgical facility and are supplemented by our dedicated corporate personnel. These activities generally emphasize the benefits offered by our surgical facilities compared to other facilities in the market, such as the proximity of our surgical facilities to physicians’ offices, the ability to schedule consecutive cases without preemption by inpatient or emergency procedures, the efficient turnaround time between cases, our advanced surgical equipment and our simplified administrative procedures. Although the facility administrator is the primary point of contact, physicians who utilize our surgical facilities are important sources of recommendations to other physicians regarding the benefits of using our surgical facilities. Recruiting teams develop a target list of physicians, and we continually review our progress in successfully recruiting additional local physicians.
We also market our surgical facilities directly to private insurance payors. Payor marketing activities conducted by our corporate office management and facility administrators emphasize the high quality of care, cost advantages and convenience of our surgical facilities, and are focused on making each surgical facility an approved provider under local managed care plans.
Competition
In each market in which we operate a surgical facility, we compete with hospitals and operators of other surgical facilities to attract physicians and patients. We believe that the competitive factors that affect our surgical facilities’ ability to compete for physicians are convenience of location of the surgical facilities, quality of care offered, convenience of scheduling, professionalism and cleanliness of facilities, access to capital and participation in private insurance programs. In addition, we believe the national prominence, scale and reputation of our company are instrumental in attracting physicians. We believe that our surgical facilities attract patients based upon our quality of care, the specialties and reputations of the physicians who operate in our surgical facilities, participation in managed care programs, ease of access and convenient scheduling and registration procedures.
In developing or acquiring existing surgical facilities, we compete with other public and private surgical facility and hospital companies. Several large national companies own and/or manage surgical facilities, in some cases in connection with other lines of business with which we do not compete, including HCA Holdings, Inc., Envision Healthcare Corporation, Tenet Healthcare Corporation, Surgical Care Affiliates, Inc. and Optum, Inc. We also face competition from local hospitals, physicians and other providers who may compete with us in the ownership and operation of surgical facilities, as well as the trend of physicians choosing to perform procedures in an office-based setting rather than in a surgical facility.
Seasonality
Our revenue fluctuates based on the number of business days in each calendar quarter, because the majority of services provided by physicians in our surgical facilities consist of scheduled procedures and office visits that occur during business hours. In addition, revenue in the fourth quarter could also be impacted by an increased utilization of services due to annual deductibles which are not usually met until later in the year and also as patients utilize their health care benefits before they expire at year-end.
Employees
At
December 31, 2019
, we had approximately
9,600
employees, including approximately
6,900
full-time employees. None of our employees are represented by a collective bargaining agreement. We believe that we have a good relationship with our employees.
Environmental
We are subject to various federal, state and local laws and regulations relating to the protection of the environment and human health and safety, including those governing the management and disposal of hazardous substances and wastes, the cleanup of contaminated sites and the maintenance of a safe workplace. Our operations include the use, generation and disposal of hazardous materials. We may, in the future, incur liability under environmental statutes and regulations with respect to contamination of sites we own or operate (including contamination caused by prior owners or operators of such sites, adjoining properties or other persons) and the off-site disposal of hazardous substances. We believe that we have been and are in substantial compliance with the terms of all applicable environmental laws and regulations and that we have no liabilities under environmental requirements that we would expect to have a material adverse effect on our business, results of operations or financial condition (including our capital expenditures, earnings and competitive position).
5
Insurance
We maintain liability insurance in amounts that we believe are appropriate for our operations. Currently, we maintain professional, general and workers' compensation liability insurance in excess of self-insured retentions through third party commercial insurance carriers. We also maintain cyber insurance, business interruption insurance and property damage insurance. Coverage under certain of these policies is contingent upon the policy being in effect when a claim is made regardless of when the events which caused the claim occurred.
In addition, physicians who provide professional services in our surgical facilities are required to maintain separate malpractice coverage with defined minimum coverage limits. While we believe that our insurance policies are adequate in amount and coverage for our operations, we make no assurances that the insurance coverage is sufficient to cover all future claims or will continue to be available in adequate amounts or at a reasonable cost.
Private Insurance Payors
Most private third-party payors reimburse us for services pursuant to written contracts. These contracts generally require that we offer discounts from our established charges. Some of our payments come from private insurance payors with which we do not have written contracts. In those situations, commonly known as "out-of-network" services, we generally charge the patients the same co-payment or other patient responsibility amounts that we would have charged had we had a contract with the private insurance payor. We also submit a claim for the services to the private insurance payor along with full disclosure that we have charged the patient an in-network patient responsibility amount.
Governmental Regulation
General
Our businesses are subject to federal, state and local laws dealing with issues such as occupational safety, employment, medical leave, insurance regulations, civil rights, discrimination, building codes and medical waste and other environmental issues. Federal, state and local governments are expanding the regulatory requirements on businesses like ours. The imposition of these regulatory requirements may have the effect of increasing operating costs and reducing the profitability of our operations.
Certificates of Need, Licensure and Accreditation
Capital expenditures for the construction of new health care facilities, the addition of beds or new health care services or the acquisition of existing health care facilities may be reviewable by state regulators under statutory programs that are sometimes referred to as certificate of need laws. States with certificate of need laws place limits on the construction and acquisition of health care facilities and the expansion of existing facilities and services. In these states, approvals, generally known as certificates of need, are required for capital expenditures exceeding certain preset monetary thresholds for the development, acquisition and/or expansion of certain facilities or services, including, in certain of these states, surgical facilities. Certificate of need laws are being challenged in many states across the country and any future changes could have positive and negative impacts on our business. We currently operate in
20
states that have certificate of need laws.
Our surgical facilities also are subject to state licensing requirements for medical providers. Our ASCs have licenses to operate in the states in which they operate and must meet all applicable requirements for ASCs. In addition, even though our surgical facilities that are licensed as hospitals primarily provide surgical services, they must meet all applicable requirements for general hospital licensure. To assure continued compliance with these regulations, governmental and other authorities periodically inspect our surgical facilities. The failure to comply with these regulations could result in the suspension or revocation of a facility’s license. In addition, based on the specific operations of our surgical facilities, some of these facilities maintain a pharmacy license, a controlled substance registration, a clinical laboratory certification waiver, and environmental protection permits for biohazards and/or radioactive materials, as required by applicable law.
As of
December 31, 2019
, the majority of our facilities were accredited by either The Joint Commission or the Accreditation Association for Ambulatory Health Care, two of the major national organizations that establish standards relating to the physical plant, administration, quality of patient care and operation of medical staffs of various types of health care facilities. The effect of accreditation by these organizations is to exempt the facilities from routine surveys by state agencies to determine compliance with CMS requirements. These accredited facilities are subject to periodic surveys by the accrediting organization to ensure that they are in compliance with the applicable standards. Many private insurance health plans require our facilities to be accredited by one or both of these organizations in order to be participating providers. Failure to maintain accreditation would cause a facility to become subject to state survey agency oversight and potentially subject to increased scrutiny by CMS, and could result in a loss of payment from private insurance health plans.
Affordable Care Act Repeal Efforts
Initiatives to repeal or modify the Patient Protection and Affordable Care Act (the "Affordable Care Act") have been persistent over the past several years. As of December 31, 2019, legislative efforts to repeal and replace the Affordable Care Act in full have not been successful. However, as a result of the enactment of the Tax and Jobs Act of 2017, the tax penalty associated with the so-called "individual mandate," which requires most individuals to obtain qualifying health insurance coverage or pay a tax penalty, was reduced to zero as of calendar year 2019. The effective repeal of the individual mandate tax penalty and any other future repeal or replacement of the Affordable Care Act may have significant impact on the reimbursement for health care services generally, and may cause more individuals to become uninsured, rendering them unable to afford health care services offered by the Company. The Affordable Care Act also remains subject to various lawsuits challenging its enforcement and constitutionality. The United States Supreme Court recently agreed to hear a case that seeks to invalidate the Affordable Care Act, but it likely will not issue an opinion until 2021. Accordingly, there can be no assurance that the adoption of any future federal or
6
state health care reform legislation, or any ruling by a court with respect to the Affordable Care Act, will not have a negative financial impact on the Company.
Medicare and Medicaid Private Contractor Audits
CMS has implemented a number of programs that use private contractors that contract with CMS to identify overpayments and underpayments and other potential sources of billing fraud. These contractors, known as Recovery Audit Contractors ("RACs") and Zone Program Integrity Contractors ("ZPICs") conduct both post-payment and pre-payment review of claims submitted by Medicare providers. In addition, CMS employs Medicaid Integrity Contractors ("MICs") to perform post-payment audits of Medicaid claims and identify overpayments. Our facilities and providers periodically receive letters from auditors such as RACs and ZPICs requesting repayment of alleged overpayments for services and incur expenses associated with responding to and appealing these determinations, as well as the costs of repaying any overpayments. Moreover, in recent years, the increase in Medicare payment appeals has created a backlog such that resolving appeals often takes multiple years. For instance, we recently settled claims resulting from an audit for the period July 1, 2009 through May 31, 2012 in the second quarter of fiscal 2017. See Note 14. Commitments and Contingencies to our consolidated financial statements included in this Annual Report.
Although all other repayments requested to date as a result of RAC, MIC and ZPIC audits have not been material to our Company, we are unable to quantify the aggregate financial impact of these audits on our facilities given the pending appeals and uncertainty about the extent of future audits.
Medicare and Medicaid Participation
The majority of our revenue is expected to continue to be received from third-party payors, including federal and state programs, such as Medicare and Medicaid, and private insurance payors. To participate in the Medicare program and receive Medicare payment, our surgical facilities must comply with regulations promulgated by HHS. Among other things, these regulations, known as "conditions for coverage" or "conditions of participation," impose numerous requirements on our facilities, their equipment, their personnel and their standards of medical care, as well as compliance with all applicable state and local laws and regulations. In 2007, CMS issued a policy memorandum (the "2007 CMS Policy Memorandum") that reaffirmed its prior interpretation of its conditions of participation that all hospitals (other than critical access hospitals) participating in the Medicare program are required to provide basic emergency care interventions regardless of whether or not the hospital maintains an emergency department. Our facilities licensed as hospitals are required to meet this requirement to maintain their participating provider status in the Medicare program. Our hospitals that do not have an emergency room, maintain a protocol for the transfer of patients requiring emergency treatment. While we believe such protocols satisfy CMS requirements, CMS could interpret such protocols to be inconsistent with the 2007 CMS Policy Memorandum, which could jeopardize each facility's participation in the Medicare program. Our surgical facilities must also satisfy the conditions of participation to be eligible to participate in the various state Medicaid programs. The requirements for certification under Medicare and Medicaid are subject to change and, in order to remain qualified for these programs, we may have to make changes from time to time in our facilities, equipment, personnel or services. Although we intend to continue to participate in these reimbursement programs, we cannot ensure that our surgical facilities will continue to qualify for participation.
The Affordable Care Act and its associated regulations require a hospital to provide written disclosure of physician ownership interests to the hospital’s patients and on the hospital’s website and in any advertising, along with annual reports to the government detailing such interests. Additionally, hospitals that do not have 24/7 physician coverage are required to inform patients of this fact and receive signed acknowledgment from the patients of the disclosure. A hospital’s provider agreement may be terminated if it fails to provide the required notices.
Utilization Review
Federal law contains numerous provisions designed to ensure that services rendered by hospitals to Medicare and Medicaid patients meet professionally recognized standards, are medically necessary and that claims for reimbursement are properly filed. These provisions include a requirement that a sampling of admissions of Medicare and Medicaid patients must be reviewed by quality improvement organizations, which review the appropriateness of patient admissions and discharges, the quality of care provided, the validity of MS-DRG classifications and the appropriateness of cases of extraordinary length of stay or cost. Quality improvement organizations may deny payment for services provided or assess fines and also have the authority to recommend to HHS that a provider which is in substantial noncompliance with the standards of the quality improvement organization be excluded from participation in the Medicare program. Utilization review is also a requirement of most non-governmental managed care organizations.
Federal Anti-Kickback Statute and Medicare Fraud and Abuse Laws
The Social Security Act of 1935 includes provisions addressing false statements, illegal remuneration and other instances of fraud and abuse in federal health care programs. These provisions include the statute commonly known as the federal Anti-Kickback statute (the "Anti-Kickback Statute"). The Anti-Kickback Statute prohibits providers and others from, among other things, soliciting, receiving, offering or paying, directly or indirectly, any remuneration in return for either making a referral for, or ordering or arranging for, or recommending the order of, any item or service covered by a federal health care program, including, but not limited to, the Medicare and Medicaid programs. Violations of the Anti-Kickback Statute are criminal offenses punishable by imprisonment and fines of up to $25,000 for each violation. Civil violations are punishable by fines of up to $50,000 for each violation, as well as damages of up to three times the total amount of remuneration received from the government for health care claims.
7
Because physician-owners of our surgical facilities are in a position to generate referrals to the facilities, the distribution of available cash to those investors could come under scrutiny under the Anti-Kickback Statute. Some courts have held that the Anti-Kickback Statute is violated if one purpose (as opposed to a primary or the sole purpose) of a payment to a provider is to induce referrals. Further, Section 6402(f)(2) of the Affordable Care Act amends the Anti-Kickback Statute by adding a provision to clarify that a person need not have actual knowledge of such section or specific intent to commit a violation of the Anti-Kickback Statute. Because none of these cases involved a joint venture such as those owning and operating our surgical facilities, it is not clear how a court would apply these holdings to our activities. It is clear, however, that a physician’s investment income from a surgical facility may not vary with the number of his or her referrals to the surgical facility.
Under regulations issued by the Office of the Inspector General of HHS (the "OIG"), certain categories of activities are deemed not to violate the Anti-Kickback Statute (commonly referred to as the safe harbors). According to the preamble to these safe harbor regulations, the failure of a particular business arrangement to comply with the regulations does not determine whether the arrangement violates the Anti-Kickback Statute. The safe harbor regulations outline standards that, if complied with, protect conduct that might otherwise be deemed in violation of the Anti-Kickback Statute. When a transaction or relationship does not fit within a safe harbor, it does not mean that an Anti-Kickback Statute violation has occurred; rather, it means that the facts and circumstances as well as the intent of the parties related to a specific transaction or relationship must be examined to determine whether or not any illegal conduct has occurred.
We believe the ownership and operations of our surgical facilities do not fit wholly within any of the safe harbors, but we attempt to structure our ASCs to fit as closely as possible within the safe harbor designed to protect distributions to physician-investors in ASCs who directly refer patients to the ASC and personally perform the procedures at the center as an extension of their practice (the "ASC Safe Harbor"). The ASC Safe Harbor protects four categories of investors, including ASCs owned by (1) general surgeons, (2) single-specialty physicians, (3) multi-specialty physicians and (4) hospital/physician joint ventures, provided that certain requirements are satisfied. These requirements include the following:
|
•
|
The ASC must be certified to participate in the Medicare program, and its operating and recovery room space must be dedicated exclusively to the center and not a part of a hospital (although such space may be leased from a hospital if such lease meets the requirements of the safe harbor for space rental).
|
|
•
|
Each investor must be either (a) a physician who derived at least one-third of his or her medical practice income for the previous fiscal year or 12-month period from performing procedures on the list of Medicare-covered procedures for ASCs, (b) a hospital, or (c) a person or entity not in a position to make or influence referrals to the center, nor to provide items or services to the center, nor employed by the center or any investor.
|
|
•
|
Unless all physician-investors are members of a single specialty, each physician-investor must perform at least one-third of his or her procedures at the ASC each year. This requirement is in addition to the requirement that the physician-investor has derived at least one-third of his or her medical practice income for the past year from performing procedures.
|
|
•
|
Physician-investors must have fully informed their referred patients of the physician’s investment.
|
|
•
|
The terms on which an investment interest is offered to an investor are not related to the previous or expected volume of referrals, services furnished or the amount of business otherwise generated from that investor to the entity.
|
|
•
|
Neither the ASC nor any other investor nor any person acting on their behalf may loan funds to or guarantee a loan for an investor if the investor uses any part of such loan to obtain the investment interest.
|
|
•
|
The amount of payment to an investor in return for the investment interest is directly proportional to the amount of the capital investment (including the fair market value of any pre-operational services rendered) of that investor.
|
|
•
|
All physician-investors, any hospital-investor and the center agree to treat patients receiving benefits or assistance under a federal health care program in a non-discriminatory manner.
|
|
•
|
All ancillary services performed at the ASC for beneficiaries of federal health care programs must be directly and integrally related to primary procedures performed at the center and may not be billed separately.
|
|
•
|
No hospital-investor may include on its cost report or any claim for payment from a federal health care program any costs associated with the ASC.
|
|
•
|
The ASC may not use equipment owned by or services provided by a hospital-investor unless such equipment is leased in accordance with a lease that complies with the Anti-Kickback Statute equipment rental safe harbor and such services are provided in accordance with a contract that complies with the Anti-Kickback Statute personal services and management contract safe harbor.
|
|
•
|
No hospital-investor may be in a position to make or influence referrals directly or indirectly to any other investor or the center.
|
We believe that the ownership and operations of our surgical facilities will not fully satisfy the ASC Safe Harbor requirements for investment interests in ASCs because, among other things, we or one of our subsidiaries will generally be an investor in and provide management services to each ASC. While we believe our ASCs would nonetheless be found to be compliant with the Anti-Kickback Statute, we cannot
8
assure you that the OIG would view our activities favorably even though we strive to achieve compliance with the remaining elements of this safe harbor.
In addition, although we expect each physician-investor to utilize the ASCs as an extension of his or her practice and ask each physician-investor to certify this practice, we cannot assure you that all physician-investors will derive at least one-third of their medical practice income from performing Medicare-covered ASC procedures, perform one-third of their procedures at the centers or inform their referred patients of their investment interests. Interests in our ASC joint ventures are purchased at what we believe to be fair market value. Investors who purchase at a later time generally pay more for a given percentage interest than founding investors. The result is that while all investors are paid distributions in accordance with their ownership interests, for ASCs where there are later purchases, we cannot meet the safe harbor requirement that return on investment is directly proportional to the amount of capital investment. The OIG has on several occasions reviewed investments relating to ASCs, and in Advisory Opinion No. 07-05 (June 19, 2007), raised concerns that (a) purchases of interests from physicians might yield gains on investment rather than capital infusion to the ASCs, (b) such purchases could be meant to reward or influence the selling physicians’ referrals to the ASC or the hospital, and (c) such returns might not be directly proportional to the amount of capital invested.
In OIG Advisory Opinion No. 09-09 (July 29, 2009), the OIG concluded that an arrangement involving an ASC joint venture between a hospital and physicians involving the combination of their two ASCs into a single, larger ASC presented minimal risk of fraud or abuse, despite the fact that it did not fit within any applicable Anti-Kickback safe harbors. Additionally, the OIG stated that fair market value should be determined based only on the tangible assets of each ASC since the physician investors are referral sources for the ASC. The OIG stated that a cash flow-based valuation of the business contributed by the physician investors potentially would include the value of the physician investors’ referrals over the time that their ASC was in existence prior to the merger with the hospital’s ASC. The OIG went on to note that a valuation involving intangible assets would not necessarily result in a violation of the Anti-Kickback Statute, but would require a review of all the facts and circumstances. It is not clear whether the OIG is concerned about using a cash flow-based valuation in most health care transactions involving referral sources, or just transactions where the parties’ contributions would be valued differently for contributing the same assets if only one party’s contribution is valued as a going concern based on cash flow. Also, the OIG appears to be focused on historical cash flow rather than a projected, discounted cash flow, which is a commonly used valuation methodology.
Our hospital investments do not fit wholly within the safe harbor for investments in small entities because more than 40.0% of the investment interests are held by investors who are either in a position to refer to the hospital or who provide services to the hospital and more than 40.0% of the hospital’s gross revenue last year were derived from referrals generated by investors. However, we believe we comply with the remaining elements of the safe harbor.
In addition to the physician ownership in our surgical facilities, other financial relationships of ours with potential referral sources could potentially be scrutinized under the Anti-Kickback Statute. We have entered into management agreements to manage the majority of our surgical facilities and physician practices. Most of these agreements call for our subsidiary to be paid a percentage of revenue-based management fee. Although there is a safe harbor for personal services and management contracts (the "Personal Services and Management Safe Harbor"), the Personal Services and Management Safe Harbor requires, among other things, that the amount of the aggregate compensation paid to the manager over the term of the agreement be set in advance. Because our management fees are generally based on a percentage of revenue, our management agreements do not typically meet this requirement. We do, however, believe that our management arrangements satisfy the other requirements of the Personal Services and Management Safe Harbor for personal services and management contracts. The OIG has taken the position in several advisory opinions that percentage-based management agreements are not protected by a safe harbor, and consequently, may violate the Anti-Kickback Statute. We have implemented formal compliance programs designed to safeguard against overbilling and believe that our management agreements comply with the requirements of the Anti-Kickback Statute. However, we cannot assure you that the OIG would find our compliance programs to be adequate or that our management agreements would be found to comply with the Anti-Kickback Statute.
Certain of our ASCs have entered into arrangements for professional services, including arrangements for anesthesia services. In a Special Advisory Bulletin issued in April 2003, the OIG focused on "questionable" contractual arrangements where a health care provider in one line of business (the "Owner") expands into a related health care business by contracting with an existing provider of a related item or service (the "Manager/Supplier") to provide the new item or service to the Owner’s existing patient population, including federal health care program patients (so called "suspect Contractual Joint Ventures"). The Manager/Supplier not only manages the new line of business, but may also supply it with inventory, employees, space, billing, and other services. In other words, the Owner contracts out substantially the entire operation of the related line of business to the Manager/Supplier-otherwise a potential competitor-receiving in return the profits of the business as remuneration for its referrals. Through an Advisory Opinion, the OIG extended this suspect contractual joint venture analysis to arrangements between anesthesiologists and physician owners of ASCs. In Advisory Opinion No. 12-06 (May 25, 2012), the OIG concluded that certain proposed arrangements between anesthesia groups and physician-owned ASCs could result in prohibited remuneration under the federal Anti-Kickback Statute. We believe our arrangements for anesthesia services are distinguishable from those described in Advisory Opinion 12-06 (May 25, 2012) and are in compliance with the requirements of the federal Anti-Kickback Statute. However, we cannot assure you that regulatory authorities would agree with that position.
We also may guarantee a surgical facility’s third-party debt financing and certain lease obligations as part of our obligations under a management agreement. Physician investors are generally not required to enter into similar guarantees. The OIG might take the position that the failure of the physician investors to enter into similar guarantees represents a special benefit to the physician investors given to induce patient referrals and that such failure constitutes a violation of the Anti-Kickback Statute. We believe that the management fees (and in some cases guarantee fees) are adequate compensation to us for the credit risk associated with the guarantees and that the failure of the physician
9
investors to enter into similar guarantees does not create a material risk of violating the Anti-Kickback Statute. However, the OIG has not issued any guidance in this regard.
The OIG is authorized to issue advisory opinions regarding the interpretation and applicability of the Anti-Kickback Statute, including whether an activity constitutes grounds for the imposition of civil or criminal sanctions. We have not, however, sought such an opinion regarding any of our arrangements. If it were determined that our activities, or those of our surgical facilities or hospitals, violate the Anti-Kickback Statute, we, our subsidiaries, our officers, our directors and each surgical facility and hospital investor could be subject, individually, to substantial monetary liability, prison sentences and/or exclusion from participation in any health care program funded in whole or in part by the U.S. government, including Medicare, Medicaid, TRICARE or state health care programs.
Evolving interpretations of current, or the adoption of new, federal or state laws or regulations, such as the Eliminating Kickbacks in Recovery Act (discussed below), could affect many of our arrangements. Law enforcement authorities, including the OIG, the courts and Congress, are increasing their scrutiny of arrangements between health care providers and potential referral sources to ensure that the arrangements are not designed as a mechanism to exchange remuneration for patient care referrals or opportunities. Investigators have also demonstrated a willingness to look behind the formalities of a business transaction to determine the underlying purposes of payments between health care providers and potential referral sources.
On October 8, 2019, CMS and the OIG issued proposed rules that would modify the federal physician self-referral law, or Stark Law, regulations and the federal anti-kickback and civil monetary penalty for beneficiary inducement statutes and regulations. The intent of the proposed rules is to reduce over-burdensome and unnecessary regulatory barriers to value-based compensation models and accelerate the transformation of the health care system into one that better promotes the coordination of care among providers. Among other things, the proposed rules would create new anti-kickback and beneficiary inducement statute safe harbors and Stark Law exceptions for certain value based arrangements and arrangements that involve the donation of cybersecurity technology. In addition, the proposed rules would also provide additional guidance on several key requirements, including fair market value and commercial reasonableness, that must be met in order for physicians and health care providers to comply with the Stark Law. We cannot predict the final form of the rules that may be adopted, or if the proposed rules will be adopted at all, nor can we predict the impact that the final rules would have on our surgery centers and hospitals.
Eliminating Kickbacks in Recovery Act
In addition to the Anti-Kickback Statute, the United States recently enacted a new law known as the Eliminating Kickbacks in Recovery Act (the "EKRA"). The EKRA is contained within the broader Substance Use Disorder Prevention that Promotes Opioid Recovery and Treatment for Patients and Communities Act (the "SUPPORT Act"). The EKRA creates a new federal crime for knowingly and willfully: (1) soliciting or receiving any remuneration in return for referring a patient to a recovery home, clinical treatment facility, or laboratory; or (2) paying or offering any remuneration to induce such a referral or in exchange for an individual using the services of a recovery home, clinical treatment facility, or laboratory. Each conviction under the EKRA is punishable by up to $200,000 in monetary damages, imprisonment for up to ten (10) years, or both. Unlike the Anti-Kickback Statute, the EKRA is not limited to services reimbursable under a government health care program. While the SUPPORT Act targets substance abuse disorder prevention and recovery, the scope of EKRA is not limited to substance abuse drug testing (only one service line of a multitude provided by labs), and therefore it appears to prohibit payment for any patient referral to any laboratory for any service, unless an exception applies. While the EKRA does contain certain exceptions similar to the Anti-Kickback Statute Safe Harbors, those exceptions are more narrow than the Anti-Kickback Statute Safe Harbors.
Federal Physician Self-Referral Law
The Stark Law prohibits certain self-referrals for health care services. The Stark Law prohibits a practitioner, including a physician, dentist or podiatrist, from referring patients to an entity with which the practitioner or a member of his or her immediate family has a "financial relationship" for the provision of certain "designated health services" that are paid for in whole or in part by Medicare or Medicaid unless an exception applies. "Designated health services" include inpatient and outpatient hospital services, clinical laboratory services and radiology services. The term "financial relationship" is broadly defined and includes most types of ownership and compensation relationships. The Stark Law also prohibits the entity from seeking payment from Medicare or Medicaid for services that are rendered through a prohibited referral. If an entity is paid for services provided through a prohibited referral, it may be required to refund the payments. Violations of the Stark Law may also result in the imposition of damages equal to three times the amount improperly claimed and civil monetary penalties of up to $15,000 per prohibited claim and $100,000 per prohibited circumvention scheme and exclusion from participation in the Medicare and Medicaid programs.
Notably, "designated health services" does not include surgical services that are provided in an ASC. Furthermore, Stark Law regulations specifically define the term "designated health services" to not include services that are reimbursed by Medicare as part of a composite rate, such as services that are provided in an ASC. However, if designated health services are provided by an ASC and separately billed, referrals to the ASC by a physician-investor would be prohibited by the Stark Law. Because our facilities that are licensed as ASCs do not have independent laboratories and do not provide designated health services apart from surgical services, we do not believe referrals to these facilities by physician-investors are prohibited. If legislation or regulations are implemented that prohibit physicians from referring patients to surgical facilities in which the physician has a beneficial interest, our business and financial results could be materially adversely affected.
The Stark Law currently includes the Whole Hospital Exception, which applies to physician ownership of a hospital, provided such ownership is in the whole hospital and the physician is authorized to perform services at the hospital. We believe that physician investments
10
in our facilities licensed as hospitals meet this requirement. However, certain changes to the Whole Hospital Exception were made by the Affordable Care Act including:
|
•
|
a prohibition on hospitals from having any physician ownership unless the hospital already had physician ownership and a Medicare provider agreement in effect as of December 31, 2010;
|
|
•
|
a limitation on the percentage of total physician ownership or investment interests in the hospital or entity whose assets include the hospital to the percentage of physician ownership or investment as of March 23, 2010;
|
|
•
|
a prohibition from expanding the number of beds, operating rooms, and procedure rooms for which it is licensed after March 23, 2010, unless the hospital obtains an exception from the Secretary of the Department of Health & Human Services (the "Secretary");
|
|
•
|
a requirement that return on investment be proportionate to the investment by each investor;
|
|
•
|
restrictions on preferential treatment of physician versus non-physician investors;
|
|
•
|
a requirement for written disclosures of physician ownership interests to the hospital’s patients and on the hospital’s website and in any advertising, along with annual reports to the government detailing such interests;
|
|
•
|
a prohibition on the hospital or other investors from providing financing to physician investors;
|
|
•
|
a requirement that any hospital that does not have 24/7 physician coverage inform patients of this fact and receive signed acknowledgments from the patients of the disclosure; and
|
|
•
|
a prohibition on "grandfathered" status for any physician owned hospital that converted from an ASC to a hospital on or after March 23, 2010.
|
We cannot predict whether other proposed amendments to the Whole Hospital Exception will be included in any future legislation, including a repeal of the Affordable Care Act, or if Congress will adopt any similar provisions that would prohibit or otherwise restrict physicians from holding ownership interests in hospitals. Any such changes could have an adverse effect on our financial condition and results of operations.
In 2010, CMS issued a "self-referral disclosure protocol" for hospitals and other providers that wish to self-disclose potential violations of the Stark Law to CMS and to attempt to resolve those potential violations and any related overpayment liabilities at levels below the maximum penalties and amounts set forth in the statute.
In addition to the physician ownership in our surgical facilities, we have other financial relationships with potential referral sources that potentially could be scrutinized under the Stark Law. We have entered into personal service agreements, such as medical director agreements, with physicians at our surgical hospitals and physician owners within our physician practices may make referrals for certain designated health services within their physician practices. We believe that our agreements with referral sources satisfy the requirements of the personal service arrangements exception and that our physician practices satisfy the physician services and in-office ancillary services exceptions to the Stark Law and have implemented formal compliance programs designed to ensure continued compliance. However, we cannot assure you that the OIG or CMS would find our compliance programs to be adequate or that our agreements with referral sources would be found to comply with the Stark Law.
Other Fraud and Abuse Laws
The Medicare Patient and Program Protection Act of 1987, as amended by the Health Insurance Portability and Accountability Act of 1996, ("HIPAA"), and the Balanced Budget Act of 1997, impose civil monetary penalties and exclusion from state and federal health care programs on providers who commit violations of fraud and abuse laws. HIPAA authorizes the Secretary, and in some cases requires the Secretary, to exclude individuals and entities that the Secretary determines have "committed an act" in violation of applicable fraud and abuse laws or improperly filed claims in violation of such laws from participating in any federal health care program. HIPAA also expanded the Secretary’s authority to exclude a person involved in fraudulent activity from participating in a program providing health benefits, whether directly or indirectly, in whole or in part, by the U.S. government. Additionally, under HIPAA, individuals who hold a direct or indirect ownership or controlling interest in an entity that is found to violate these laws may also be excluded from Medicare and Medicaid and other federal and state health care programs if the individual knew or should have known, or acted with deliberate ignorance or reckless disregard of, the truth or falsity of the information of the activity leading to the conviction or exclusion of the entity, or where the individual is an officer or managing employee of such entity. This standard does not require that specific intent to defraud be proven by OIG. Under HIPAA it is also a crime to defraud any commercial health care benefit program.
Federal and State Privacy and Security Requirements
We are subject to HIPAA, including the Health Information Technology for Economic and Clinical Health Act (the "HITECH Act"), which was enacted as part of The American Recovery and Reinvestment Act of 2009. The HITECH Act strengthened the requirements and significantly increased the penalties for violations of the HIPAA privacy and security regulations. In 2013, HHS issued the HIPAA Omnibus Rule, which became effective on March 26, 2013. The HIPAA Omnibus Rule requires us to notify patients of any unauthorized access, acquisition, or disclosure of their unsecured protected health information in all situations except those in which we can demonstrate that there is a low probability that the protected health information has been compromised. We have the burden of demonstrating through a risk assessment that a breach of protected health information has not occurred.
11
The HIPAA privacy standards apply to individually identifiable information held or disclosed by a covered entity in any form, whether communicated electronically, on paper or orally. These standards impose extensive administrative requirements on us. These standards require our compliance with rules governing the use and disclosure of this health information. They create rights for patients in their health information, such as the right to amend their health information, and they require us to impose these rules, by contract, on any business associate to whom we disclose such information in order to perform functions on our behalf.
The HIPAA security standards require us to establish and maintain reasonable and appropriate administrative, technical and physical safeguards to ensure the integrity, confidentiality and the availability of electronic protected health and related financial information. Although the security standards do not reference or advocate a specific technology, and covered health care providers, plans and clearinghouses have the flexibility to choose their own technical solutions, the security standards have required us to implement significant new systems, business procedures and training programs.
Violations of the HIPAA privacy and security regulations may result in civil and criminal penalties. The HITECH Act strengthened the requirements of the HIPAA privacy and security regulations and significantly increased the penalties for violations by introducing a tiered penalty system, with penalties of up to $50,000 per violation with a maximum civil penalty of $1.5 million in a calendar year for violations of the same requirement. However, a single breach incident can result in violations of multiple requirements, resulting in possible penalties well in excess of $1.5 million. Under the HITECH Act, HHS is required to conduct periodic compliance audits of covered entities and their business associates. The HITECH Act and the HIPAA Omnibus Rule also extend the application of certain provisions of the security and privacy regulations to business associates and subjects business associates to civil and criminal penalties for violation of the regulations.
The HITECH Act authorizes State Attorneys General to bring civil actions seeking either an injunction or damages in response to violations of HIPAA privacy and security regulations or the new data breach law that affects the privacy of their state residents. We expect vigorous enforcement of the HITECH Act’s requirements by HHS and State Attorneys General. HHS has allocated increased funding towards HIPAA enforcement activity and such enforcement activity has seen a marked increase over recent years. We cannot predict whether our surgical facilities will be able to comply with the final rules and the financial impact to our surgical facilities in implementing the requirements under the final rules when they take effect, or whether our surgical hospitals will be selected for an audit, or the results of such an audit.
Our facilities also remain subject to any state laws that relate to privacy or the reporting of data breaches that are more restrictive than the regulations issued under HIPAA and the requirements of the HITECH Act. For example, various state laws and regulations may require us to notify affected individuals in the event of a data breach involving certain personal information, such as social security numbers, dates of birth and credit card information.
HIPAA Administrative Simplification Requirements
The HIPAA transaction regulations were issued to encourage electronic commerce in the health care industry. These regulations include standards that health care providers must follow when electronically transmitting certain health care transactions, such as health care claims.
Emergency Medical Treatment and Active Labor Act
Our hospitals are subject to the Emergency Medical Treatment and Active Labor Act ("EMTALA"). This federal law requires any hospital that participates in the Medicare program to conduct an appropriate medical screening examination of every person who presents to the hospital’s emergency department for treatment and, if the patient is suffering from an emergency medical condition, to either stabilize that condition or make an appropriate transfer of the patient to a facility that can handle the condition. The obligation to screen and stabilize emergency medical conditions or transfer exists regardless of a patient’s ability to pay for treatment. Off-campus facilities such as surgery centers that lack emergency departments or otherwise do not treat emergency medical conditions generally are not subject to EMTALA. They must, however, have policies in place that explain how the location should proceed in an emergency situation, such as transferring the patient to the closest hospital with an emergency department. There are severe penalties under EMTALA if a hospital fails to screen or appropriately stabilize or transfer a patient or if the hospital delays appropriate treatment in order to first inquire about the patient’s ability to pay, including civil monetary penalties and exclusion from participation in the government health care programs. In addition, an injured patient, the patient’s family or a medical facility that suffers a financial loss as a direct result of another hospital’s violation of the law can bring a civil suit against that other hospital. CMS has actively enforced EMTALA and has indicated that it will continue to do so in the future. We believe that our surgical hospitals comply with EMTALA.
State Regulation
Many of the states in which our surgical facilities operate have adopted statutes and/or regulations that prohibit the payment of kickbacks or any type of remuneration in exchange for patient referrals and that prohibit health care providers from, in certain circumstances, referring a patient to a health care facility in which the provider has an ownership or investment interest. While these statutes generally mirror the federal Anti-Kickback Statute and Stark Law, they vary widely in their scope and application. Some are specifically limited to health care services that are paid for in whole or in part by the Medicaid program; others apply to all health care services regardless of payor; and others apply only to state-defined designated services, which may differ from the designated health services under the Stark Law. In addition, many states have adopted statutes that mirror the False Claims Act and that prohibit the filing of a false or fraudulent claim with a state governmental agency. We intend to comply with all applicable state health care laws, rules and regulations. However, these laws, rules and regulations have typically been the subject of limited judicial and regulatory interpretation. As a result, we cannot assure you that our surgical facilities will not be investigated or scrutinized by the governmental authorities empowered to do so or, if challenged, that their activities would be found
12
to be lawful. A determination of non-compliance with the applicable state health care laws, rules, and regulations could subject our surgical facilities to civil and criminal penalties and could have a material adverse effect on our operations.
We are also subject to various state insurance statutes and regulations that prohibit us from submitting inaccurate, incorrect or misleading claims. Many state insurance laws and regulations are broadly worded and could be implicated, for example, if our surgical facilities were to adjust an out-of-network co-payment or other patient responsibility amounts without fully disclosing the adjustment on the claim submitted to the payor. While some of our surgical facilities adjust the out-of-network costs of patient co-payment and deductible amounts to reflect in-network co-payment costs when providing services to patients whose health insurance is covered by a payor with which the surgical facilities are not contracted, our policy is to fully disclose adjustments in the claims submitted to the payors. We believe that our surgical facilities are in compliance with all applicable state insurance laws and regulations regarding the submission of claims. We cannot assure you, however, that none of our surgical facilities’ insurance claims will ever be challenged. If we were found to be in violation of a state’s insurance laws or regulations, we could be forced to discontinue the violative practice, which could have an adverse effect on our financial position and results of operations, and we could be subject to fines and criminal penalties.
Fee Splitting; Corporate Practice of Medicine
The laws of many states prohibit physicians from splitting fees with non-physicians (i.e., sharing in a percentage of professional fees), prohibit non-physician entities (such as us) from practicing medicine and exercising control over or employing physicians and prohibit referrals to facilities in which physicians have a financial interest. The existence, interpretation and enforcement of these laws vary significantly from state to state. In light of these restrictions, in certain states we facilitate the provision of physician services by maintaining long-term management services agreements through our subsidiaries with affiliated professional contractors, which employ or contract with physicians and other health care professionals to provide physician professional services. Under these arrangements, our subsidiaries perform only non-medical administrative services, do not represent that they offer medical services and do not exercise influence or control over the practice of medicine by the physicians employed by the affiliated professional contractors. Although we believe that the fees we receive from affiliated professional contractors have been structured in a manner that is compliant with applicable fee-splitting laws, it is possible that a government regulator could interpret such fee arrangements to be in violation of certain fee-splitting laws. Future interpretations of, or changes in, these laws might require structural and organizational modifications of our existing relationships, and we cannot assure you that we would be able to appropriately modify such relationships. In addition, statutes in some states could restrict our expansion into those states.
Clinical Laboratory Regulation
Our clinical laboratories are subject to federal oversight under the Clinical Laboratory Improvement Amendments of 1988 ("CLIA") which extends federal oversight to virtually all clinical laboratories by requiring that they be certified by the federal government or by a federally-approved accreditation agency. CLIA requires that all clinical laboratories meet quality assurance, quality control and personnel standards. Laboratories also must undergo proficiency testing and are subject to inspections. Standards for testing under CLIA are based on the complexity of the tests performed by the laboratory, with tests classified as "high complexity," "moderate complexity," or "waived." Laboratories performing high complexity testing are required to meet more stringent requirements than moderate complexity laboratories. Laboratories performing only waived tests, which are tests determined by the Food and Drug Administration to have a low potential for error and requiring little oversight, may apply for a certificate of waiver exempting them from most of the requirements of CLIA. Our operations also subject to state and local laboratory regulation. CLIA provides that a state may adopt laboratory regulations different from or more stringent than those under federal law, and a number of states have implemented their own laboratory regulatory requirements. State laws may require that laboratory personnel meet certain qualifications, specify certain quality controls, or require maintenance of certain records. We believe that we are in material compliance with all applicable laboratory requirements, but no assurances can be given that our laboratories will pass all future licensure or certification inspections.
Regulatory Compliance Program
We have in place and continue to enhance a company-wide compliance program that focuses on all areas of regulatory compliance including billing, reimbursement, cost reporting practices and contractual arrangements with referral sources.
This regulatory compliance program is intended to help ensure that high standards of conduct are maintained in the operation of our business and that policies and procedures are implemented so that employees act in compliance with applicable laws, regulations and company policies. Under the regulatory compliance program, every employee and certain contractors involved in patient care, and coding and billing, receive initial and periodic legal compliance and ethics training. In addition, we regularly monitor our ongoing compliance efforts and develop and implement policies and procedures designed to foster compliance with the law. The program also includes a mechanism for employees to report, without fear of retaliation, any suspected legal or ethical violations to their supervisors, designated compliance officers in our facilities, our compliance hotline or directly to our corporate compliance office. We believe our compliance program is consistent with standard industry practices. However, we cannot provide any assurances that our compliance program will detect all violations of law or protect against qui tam suits or government enforcement actions.
Where You Can Find More Information
We make available on or through the "Investors-SEC Filings" page of our website at www.surgerypartners.com, free of charge, copies of reports, such as Annual Reports on Form 10-K, Quarterly Reports on Form 10-Q and Current Reports on Form 8-K, and amendments to those reports (along with certain other Company filings with the SEC), as soon as reasonably practicable after electronically filing such material
13
with, or furnishing it to, the SEC. The information found on, or otherwise accessible through, our website is not incorporated by reference into, nor does it form a part of, this Annual Report or any other document that we file with the SEC.
14
Item 1A. Risk Factors
We are subject to risks and uncertainties that could cause our actual financial condition, results of operations, business and prospects to differ materially from those described in the forward-looking statements contained in this report or in our other filings with the SEC. Some of these risks and uncertainties are discussed below. If any of the following risks, or other risks and uncertainties, actually occurred, our business, financial condition and operating results could suffer.
Risks Related to Our Business and Industry
We depend on payments from third-party payors, including government health care programs and private insurance organizations. If these payments are reduced or eliminated, our revenue and profitability could be materially and adversely affected.
We depend upon private and governmental third-party sources of payment for the services provided by physicians in our physician network, to patients in our surgical facilities, including surgical hospitals, and by our laboratory and diagnostic services. In
2019
,
2018
and
2017
, we derived approximately
39%
,
38%
and
38%
of our revenue, respectively, from government payors, including Medicare and Medicaid programs. The amounts that we receive from the Medicare and Medicaid programs for our services are subject to statutory and regulatory changes, administrative rulings, interpretations and determinations concerning patient eligibility requirements, funding levels and the method of calculating payments or reimbursements, among other things; refinements to the Medicare Ambulatory Surgery Center payment system and refinements made by CMS to Medicare’s reimbursement policies; requirements for utilization review; and federal and state funding restrictions; any of which could materially adversely affect payments we receive from these government programs, as well as affect the timing of payments to our facilities.
During the past several years, health care payors, such as federal and state governments, insurance companies and employers, have undertaken initiatives to revise payment methodologies and monitor health care costs. As part of their efforts to contain health care costs, payors increasingly are demanding discounted fee structures or the assumption by health care providers of all or a portion of the financial risk relating to paying for care provided, often in exchange for exclusive or preferred participation in their benefit plans. We expect efforts to impose greater discounts and more stringent cost controls by government and other payors to continue, thereby reducing the payments we receive for our services. Similarly, private third-party payors may be successful in negotiating reduced reimbursement schedules with our facilities.
Fixed fee schedules, capitation payment arrangements, exclusion from participation in or inability to reach agreements with private insurance organizations, reduction or elimination of payments or an increase in the payments at a rate that is less than the increase in our costs, or other factors affecting payments for health care services over which we have no control could have a material adverse effect on our business, prospects, results of operations and financial condition.
If we are unable to negotiate and enter into favorable contracts or maintain satisfactory relationships and renew existing contracts on favorable terms with private insurance payors, our revenue and profitability may decrease.
Payments from private insurance payors, including state workers’ compensation programs and managed care organizations, represented approximately
54%
,
55%
and
54%
of our patient service revenue in
2019
,
2018
and
2017
, respectively. Most of these payments came from private insurance payors with which our facilities have contracts. Managed care companies such as HMOs and PPOs, which offer prepaid and discounted medical service packages, represent a growing segment of private insurance payors. If we fail to enter into favorable contracts or maintain satisfactory relationships with private insurance organizations, our revenue may decrease. Our competitive position has been, and will continue to be, affected by initiatives undertaken during the past several years by major purchasers of health care services, including insurance companies and employers, to revise payment methods and monitor health care expenditures in an effort to contain health care costs. For instance, private insurance payors may lower reimbursement rates in response to increased obligations on payors imposed by the Affordable Care Act or future reductions in Medicare reimbursement rates. Further, private insurance payors may narrow their provider networks in response to the need to negotiate lower reimbursement rates with providers. If we are unable to maintain strong relationships with these payors, we may not be able to participate in these narrow provider networks.
Some of our payments from private insurance payors come from payors with which our facilities or subsidiaries do not have a contract. If we provide services to a patient that does not use a private insurance payor with which we have contracted, commonly known as "out-of-network" services, we generally charge the patient the same co-payment or other patient responsibility amounts that we would have charged had our facilities had a contract with the payor. In accordance with insurance laws and regulations, we submit a claim for the services to the payor along with full disclosure that our surgical facility has charged the patient an in-network patient responsibility amount. Historically, it was typical for those private insurance payors who do not have contracts with our surgical facilities to pay our claims at higher than comparable contracted rates. However, in recent years we have observed an increase in private insurance payors adopting out-of-network fee schedules that are more comparable to our contracted rates or to take other steps to discourage their enrollees from seeking treatment at out-of-network surgical facilities. If the proportion of our services subject to out-of-network fee schedules increases, we may experience a decrease in volume at our ASCs or other facilities due to fewer referrals of out-of-network patients.
Additionally, payments from workers’ compensation payors represented approximately
6%
of our patient service revenue in
2019
. A majority of states have implemented workers’ compensation provider fee schedules. In some cases, the fee schedule rates contain lower rates than the rates our surgical facilities have historically been paid for the same services. If states reduce the amounts paid to providers under the workers’ compensation fee schedules, it could have an adverse impact on our operating results.
15
Significant changes in our payor mix or surgical case mix resulting from fluctuations in the types of cases performed at our facilities could have a material adverse effect on our business, prospects, results of operations and financial condition.
Our results may change from period to period due to fluctuations in payor mix or case mix or other factors relating to the type of cases performed at our facilities. Payor mix refers to the relative share of total cases provided to patients with no insurance, private insurance, Medicare coverage and Medicaid coverage. Since, generally speaking, we receive relatively higher payment rates from private insurers than Medicare, Medicaid and other government-funded programs, a significant shift in our payor mix toward a higher percentage of Medicare and Medicaid cases, which could occur for reasons beyond our control, could have an adverse effect on our business, prospects, results of operations and financial condition.
Case mix refers to the relative share of total cases performed by specialty, such as GI, general surgery, ophthalmology, orthopedic and pain management. Generally speaking, certain types of our cases, such as orthopedic cases, generate relatively higher revenue than other types of cases, such as pain management and GI cases. Therefore, a significant shift in our case mix toward a higher percentage of lower revenue cases, which could occur for reasons beyond our control, could result in a material adverse effect on our business, prospects, results of operations and financial condition.
As we operate in multiple markets, each with a different competitive landscape, shifts within our payor mix or case mix may not be uniform across all of our affiliated facilities. Rather, these shifts may be concentrated within certain markets due to local competitive factors. Therefore, the results of our individual affiliated facilities, including facilities that are material to our results, may be volatile, which could result in a material adverse effect on our business, prospects, results of operations and financial condition.
We have a history of net losses and may not achieve or sustain profitability in the future.
We had net losses attributable to Surgery Partners, Inc. of
$74.8 million
,
$205.7 million
and
$53.0 million
, in
2019
,
2018
and
2017
, respectively. We cannot assure you that our revenue will grow or that we will achieve or maintain profitability in the future. Growth of our revenue may slow or revenue may decline and expenses may increase for a number of possible reasons, including reduced demand for our services, regulatory shifts and other risks and uncertainties. Our ability to achieve profitability will be affected by the other risks and uncertainties described in this section and in "Management’s Discussion and Analysis of Financial Condition and Results of Operations," included elsewhere in this Annual Report. All of these factors could contribute to future net losses and, if we are unable to meet these risks and challenges as we encounter them, our business may suffer. If we are not able to achieve, sustain or increase profitability, our business will be adversely affected and our stock price may decline.
Our ability to provide medical services at our facilities would be impaired and our revenue reduced if we are not able to maintain good relationships with affiliated physicians who utilize our surgical facilities.
Our business depends, among other things, upon the efforts and success of affiliated physicians who provide medical services at our surgical facilities and the strength of our relationships with these physicians. Most physicians are not employees of our surgical facilities and are not contractually required to use our facilities. We generally do not enter into contracts with physicians who use our surgical facilities, other than partnership and operating agreements with physicians who own interests in our surgical facilities, agreements for anesthesiology services and medical director agreements. Physicians who use our surgical facilities also use other facilities or hospitals and may choose to perform procedures in an office-based setting that might otherwise be performed at our surgical facilities. In recent years, pain management and gastrointestinal procedures have been performed increasingly in an office-based setting because of potential cost savings or better access for patients and physicians. Although physicians who own interests in our surgical facilities are subject to agreements restricting ownership of competing facilities, these agreements may not restrict procedures performed in a physician office or in other unrelated facilities. Also, these agreements restricting ownership of competing facilities are difficult to enforce, and we may be unsuccessful in preventing physicians who own interests in our surgical facilities from acquiring interests in competing facilities.
The financial success of our facilities is in part dependent upon the volume of procedures performed by the physicians who use our facilities, which can be affected by the economy, health care reform efforts, increases in patient co-payments and deductibles and other factors outside our or their control. The physicians who use our surgical facilities may choose not to accept patients who pay for services through certain third-party payors, which could reduce our revenue. From time to time, we may have disputes with physicians who use our surgical facilities and/or own interests in our surgical facilities or our Company. Our revenue and profitability could be significantly reduced if we lost our relationship with one or more key physicians or groups of physicians, or if such key physician or group of physicians reduce their use of any of our surgical facilities. In addition, any damage to the reputation of a key physician or group of physicians or the failure of these physicians to provide quality medical care or adhere to professional guidelines at our surgical facilities could damage our reputation, subject us to liability and significantly reduce our revenue.
Our leverage could adversely affect our ability to raise additional capital to fund our operations, limit our ability to react to changes in the economy or our industry, expose us to interest rate risk to the extent of our variable rate debt and prevent us from meeting our obligations under our outstanding indebtedness.
As of
December 31, 2019
, we and our subsidiaries had approximately
$2.6 billion
aggregate principal amount of indebtedness outstanding, which includes approximately
$1.4 billion
principal amount of senior secured term loans (the "Term Loan") outstanding,
$370.0 million
senior unsecured notes due 2025 (the "2025 Unsecured Notes") and
$430.0 million
senior unsecured notes due 2027 (the "2027 Unsecured Notes"). As of
December 31, 2019
, we had no outstanding borrowings under our
$120.0 million
senior secured revolving credit facility (the "Revolver" and, together with the Term Loan, the "Senior Secured Credit Facilities" and, together with the 2025 Unsecured Notes and the 2027 Unsecured
16
Notes, the "Senior Indebtedness"). After giving effect to the
$7.1 million
principal amount of outstanding letters of credit issued under our Revolver, we had
$112.9 million
of unused commitments available to be borrowed under the Revolver. In addition to the Senior Indebtedness, our aggregate principal amount of indebtedness outstanding includes approximately
$357.4 million
of notes payable and finance lease obligations primarily related to property and equipment for operations. Our level of indebtedness increases the risk that we may be unable to generate cash sufficient to pay amounts due in respect of our indebtedness. In addition, subject to applicable restrictions under our Senior Indebtedness, we may incur significant additional indebtedness, which may be secured, from time to time, which could have important consequences, including:
|
•
|
making it more difficult for us to satisfy our obligations with respect to our indebtedness;
|
|
•
|
making us more vulnerable to adverse changes in general economic, industry and competitive conditions and adverse changes in government regulation;
|
|
•
|
requiring us to dedicate a substantial portion of our cash flow to making payments on our indebtedness, thereby reducing the availability of our cash flow to fund working capital, capital expenditures and other general corporate purposes;
|
|
•
|
limiting our flexibility in reacting to competitive and other changes in our industry and economic conditions generally; and
|
|
•
|
limiting our ability to raise additional capital for working capital, capital expenditures, acquisitions, debt service requirements, execution of our business strategy or other general corporate purposes.
|
To service our indebtedness, we will require a significant amount of cash. Our ability to generate cash depends on many factors beyond our control, and any failure to meet our debt service obligations may adversely affect our business, financial condition and results of operations.
Our ability to pay or to refinance our indebtedness and to fund working capital needs and planned capital expenditures will depend upon our future operating performance and our ability to generate cash, which, to a certain extent, is subject to general economic, financial, competitive, legislative, regulatory, business and other factors that are beyond our control.
If our business does not generate sufficient cash flow or if future borrowings are not available to us in an amount sufficient to enable us to pay our indebtedness or to fund our other liquidity needs, we may need to refinance all or a portion of our indebtedness on or before the maturity thereof, sell assets, reduce or delay capital investments or seek to raise additional capital, any of which could have a material adverse effect on our operations. In addition, we may not be able to affect any of these actions, if necessary, on commercially-reasonable terms or at all. Our history of net losses may impair our ability to service our indebtedness or repay outstanding amounts when they become due. In addition, our ability to restructure or refinance our indebtedness will depend on the condition of the capital markets and our financial condition at such time. Any refinancing of our debt could be at higher interest rates and may require us to comply with more onerous covenants, and also might include incurring additional fees in connection with refinancing, which could further restrict our business operations. The terms of existing or future debt instruments may limit or prevent us from taking any of these actions. In addition, any failure to make scheduled payments of interest and principal on our outstanding indebtedness would likely result in a reduction of our credit rating, which could harm our ability to incur additional indebtedness on commercially-reasonable terms or at all. Our inability to generate sufficient cash flow to satisfy our debt service obligations, or to refinance or restructure our obligations on commercially reasonable terms or at all, may adversely affect our business, financial condition and results of operations.
Restrictive covenants in our debt instruments may adversely affect us.
The Senior Indebtedness imposes significant operating and financial restrictions and limit the ability of us and our restricted subsidiaries to, among other things:
|
•
|
incur additional indebtedness and guarantee indebtedness;
|
|
•
|
pay dividends or make other distributions in respect of, or repurchase or redeem, capital stock;
|
|
•
|
prepay, redeem or repurchase certain debt;
|
|
•
|
make loans and investments;
|
|
•
|
sell or otherwise dispose of assets;
|
|
•
|
sell stock of our subsidiaries;
|
|
•
|
incur liens;
|
|
•
|
enter into transactions with affiliates;
|
|
•
|
enter into agreements restricting certain of our subsidiaries’ ability to pay dividends; and
|
|
•
|
consolidate, merge or sell all or substantially all of our assets.
|
As a result of these and other covenants and restrictions, we are and will be limited in how we conduct our business, and we may be unable to raise additional capital to compete effectively or to take advantage of new business opportunities. In addition, we may be required to maintain specified financial maintenance ratios and satisfy other financial condition tests in connection with the Senior Indebtedness. The
17
terms of any future indebtedness we may incur could include more restrictive covenants. We cannot assure you that we will be able to maintain compliance with these covenants in the future and, if we fail to do so, that we will be able to obtain waivers from the lenders and/or amend the covenants. Our failure to comply with the restrictive covenants described above as well as others contained in our future debt instruments from time to time could result in an event of default, which, if not cured or waived, could result in our being required to repay these borrowings before their maturity. If we are forced to refinance these borrowings on less favorable terms, our results of operations and financial condition could be adversely affected.
We cannot assure you that our business will generate sufficient cash flow from operations, that currently anticipated revenue growth and operating improvements will be realized or that future borrowings will be available to us under the Term Loan and Revolver in amounts sufficient to enable us to pay our indebtedness, or to fund our other liquidity needs. If we are unable to meet our debt service obligations or fund our other liquidity needs, we could attempt to restructure or refinance our indebtedness or seek additional equity capital. We cannot assure you that we will be able to accomplish those actions on satisfactory terms, if at all.
Despite our current indebtedness levels, we and our subsidiaries may still be able to incur more debt, which could further exacerbate the risks associated with our leverage.
We and our subsidiaries may be able to incur additional indebtedness in the future, including secured indebtedness. Although the credit agreement governing the Senior Secured Credit Facilities and the indentures governing each of the 2025 Unsecured Notes and 2027 Unsecured Notes, respectively, contain restrictions on the incurrence of additional indebtedness, these restrictions are subject to a number of significant qualifications and exceptions, and the indebtedness incurred in compliance with these restrictions could be substantial.
In addition, as of
December 31, 2019
we had approximately
$112.9 million
available for additional borrowings under the Revolver (after giving effect to the
$7.1 million
aggregate principal amount of outstanding letters of credit issued under our Revolver at such time). If new debt is added to our or our subsidiaries’ current debt levels, the related risks that we face would be increased.
We are a holding company with no operations of our own.
We are a holding company, and our ability to service our debt is dependent upon the earnings from the business conducted by our subsidiaries that operate the surgical facilities. The effect of this structure is that we depend on the earnings of our subsidiaries, and the distribution or payment to us of a portion of these earnings to meet our obligations, including those under the Term Loans and Revolving Facility and any of our other debt obligations. The distributions of those earnings, advances or other distributions of funds by these entities to us, all of which are contingent upon our subsidiaries’ earnings, are subject to various business considerations. In addition, distributions by our subsidiaries could be subject to statutory restrictions, including state laws requiring that such subsidiaries be solvent, or contractual restrictions. Some of our subsidiaries may become subject to agreements that restrict the sale of assets and significantly restrict or prohibit the payment of dividends or the making of distributions, loans or other payments to stockholders, partners or members.
We make significant loans to, and are generally liable for debts and other obligations of, the partnerships and limited liability companies that own and operate some of our surgical facilities.
We own and operate our surgical facilities through limited partnerships and limited liability companies. Local physicians, physician groups and health care systems also own an interest many of these partnerships and limited liability companies. In the partnerships in which we are the general partner, we are liable for 100% of the debts and other obligations of the partnership, even if we do not own all of the partnership interests. For some of our surgical facilities, indebtedness at the partnership level is funded through intercompany loans that we provide. At
December 31, 2019
, our intercompany loans totaled
$36.7 million
. Through these loans we may have a security interest in the partnership’s or limited liability company’s assets, depending upon the terms thereof in each instance. However, our financial condition and results of operations would be materially adversely affected if our surgical facilities are unable to repay these intercompany loans, or such loans are challenged under certain health care laws. Additionally, at
December 31, 2019
, our global intercompany note, which we use to transfer debt balances between our subsidiaries, had a zero balance.
Although most of our intercompany loans are secured by the assets of the partnership or limited liability company, the physicians and physician groups that own an interest in these partnerships and limited liability companies generally do not guarantee a pro rata amount of this debt or the other obligations of these partnerships and limited liability companies.
From time to time, we may guarantee our pro-rata share of the third-party debts and other obligations of our non-wholly owned non-consolidated partnerships and limited liability companies in which we own an interest in an amount proportionate to our pro rata share of the equity interests issued by such entity. In such instances, the physicians and/or physician groups typically also guarantee their pro-rata share of such indebtedness.
Our variable rate indebtedness subjects us to interest rate risk, which could cause our indebtedness service obligations to increase significantly.
Borrowings under the Senior Secured Credit Facilities are at variable rates of interest and expose us to interest rate risk. If interest rates increase, our debt service obligations on variable rate indebtedness would increase even though the amount borrowed remained the same, and our net income and cash flows, including cash available for servicing our indebtedness, would correspondingly decrease. We periodically enter into interest rate swap agreements to manage our exposure to these fluctuations. Our interest rate swap agreements involve the exchange of fixed and variable rate interest payments between two parties, based on common notional principal amounts and maturity dates. The notional amounts of the swap agreements represent balances used to calculate the exchange of cash flows and are not our assets or liabilities.
18
Any refinancing of our debt could be at higher interest rates and may require us to comply with more onerous covenants, which could further restrict our business operations.
The Senior Secured Credit Facilities bear interest at a rate per annum equal to (x) the London Interbank Offered Rate ("LIBOR") plus a margin ranging from 3.00% to 3.25% per annum, depending on the Company’s first lien net leverage ratio or (y) an alternate base rate (which will be the highest of (i) the prime rate, (ii) 0.50% per annum above the federal funds effective rate and (iii) one-month LIBOR plus 1.00% per annum (solely with respect to the Term Loan, the alternate base rate shall not be less than 2.00% per annum)) plus a margin ranging from 2.00% to 2.25% per annum. In addition, the Company is required to pay a commitment fee of 0.50% per annum in respect of unused commitments under the Revolver.
Discontinuation, reform or replacement of LIBOR may adversely affect our business.
The credit agreement governing the Senior Secured Credit Facilities permits interest on borrowings to be calculated based on LIBOR. LIBOR and certain other interest "benchmarks" may be subject to regulatory guidance and/or reform that could cause interest rates under our current or future debt agreements to perform differently than in the past or cause other unanticipated consequences. The United Kingdom’s Financial Conduct Authority, which regulates LIBOR, has announced that it intends to phase out LIBOR by the end of 2021. If the phase out occurs as planned, the interest rate applicable to our variable rate debt may be calculated based on an alternative, comparable or successor rate which may have a material adverse impact on the cost of the variable rate portion of our indebtedness. The timing and result of the phase out of LIBOR are unclear, and efforts of industry groups to develop a suitable successor are not guaranteed to result in a viable or widely adopted replacement for LIBOR. If LIBOR becomes unavailable before a suitable replacement is widely adopted, it could have a material adverse impact on the availability of variable rate financing.
As of December 31, 2019, we also had interest rate swap agreements based on LIBOR. If LIBOR becomes unavailable, it is unclear how payments under those agreements would be calculated. Relevant industry groups are seeking to create a standard protocol addressing the expected discontinuation of LIBOR, but there can be no assurance that such a protocol will be developed or implemented with respect to our swap agreements.
Physician treatment methodologies and governmental or private insurance controls designed to reduce the number of surgical procedures may reduce our revenue and profitability.
Controls imposed by Medicare, Medicaid and private insurance payors designed to reduce surgical and other procedure volumes, in some instances referred to as "utilization review," could adversely affect our facilities. Although we are unable to predict the effect these changes will have on our operations, significant limits on the scope of services reimbursed and on reimbursement rates and fees may reduce our revenue and profitability. Additionally, trends in physician treatment protocols and private insurance plan design, such as plans that shift increased costs and accountability for care to patients, could reduce our surgical and other procedure volumes in favor of lower intensity and lower cost treatment methodologies, each of which could, in turn, have a material adverse effect on our business, prospects, results of operations and financial condition.
Our growth strategy depends in part on our ability to integrate operations of acquired surgical facilities, attract new physician partners, and to acquire and develop additional surgical facilities on favorable terms. If we are unable to achieve any of these goals, our future growth could be limited and our operating results could be adversely affected.
We believe that an important component of our financial performance and growth is our ability to provide physicians who use our surgical facilities with the opportunity to purchase ownership interests in our facilities. We may not be successful in attracting new physician investment in our surgical facilities, and that failure could result in a reduction in the quality, efficiency and profitability of our facilities. Based on competitive factors and market conditions, physicians may be able to negotiate relatively higher levels of equity ownership in our facilities, consequently limiting or reducing our share of the profits from these facilities. In addition, physician ownership in our facilities is subject to certain regulatory restrictions.
In addition, our growth strategy includes the acquisition and development of existing surgical facilities and the development of new surgical facilities jointly with local physicians and, in some cases, health care systems and other strategic partners. We are currently evaluating potential acquisitions and development projects and expect to continue to evaluate acquisitions and development projects in the foreseeable future. If we are unable to successfully execute on this strategy in the future, our future growth could be limited. We may be unable to identify suitable acquisition and development opportunities, or to complete acquisitions and new projects in a timely manner and on favorable terms. Further, the businesses or assets we acquire in the future may not ultimately produce returns that justify our related investment.
Our acquisition and development activities, require substantial capital resources, and we may need to obtain additional capital or financing, from time to time, to fund these activities. Historically, we have funded acquisition and development activities through our credit facilities. As a result, we may take actions to fund future acquisitions and development activities that could have a material adverse effect on our business, prospects, results of operations and financial condition, including incurring substantial debt with certain restrictive terms. Further, sufficient capital or financing may not be available to us on satisfactory terms, if at all. In addition, our ability to acquire and develop additional surgical facilities may be limited by state certificate of need programs, licensure requirements, antitrust laws, and other regulatory restrictions on expansion. We also face significant competition from local, regional and national health systems and other owners of surgical facilities in pursuing attractive acquisition candidates. The limited number of surgical facilities we develop typically incur losses in their early months of operation (more so in the case of surgical hospitals) and, until their case loads grow, they generally experience lower total revenue and operating margins than established surgical facilities, and we expect this trend to continue.
19
If we are not successful in integrating the operations and personnel of newly acquired surgical facilities in a timely and efficient manner, then the potential benefits of the transaction may not be realized and our operations and earnings could be materially adversely impacted. If we experience the loss of key personnel or if the effort devoted to the integration of acquired facilities diverts significant management or other resources from other operational activities, our operations could be impaired. Additionally, in some acquisitions, we may have to renegotiate, or risk losing, one or more of the facility’s private insurance contracts. We may also be unable to immediately collect the accounts receivable of an acquired facility while we align the payors’ payment systems and accounts with our own systems. Finally, certain transactions can require licensure changes which, in turn, result in disruptions in payment for services.
In addition, although we conduct extensive due diligence prior to the acquisition of surgical facilities and seek indemnification from prospective sellers covering unknown or contingent liabilities, we may acquire facilities with unknown or contingent liabilities, including liabilities for failure to comply with health care laws and regulations for which we do not have sufficient insurance or indemnification rights.
Our rapid growth has placed, and will continue to place, increased demands on our management, operational and financial information systems and other resources. Furthermore, expansions into new geographic markets and services may require us to comply with new and unfamiliar legal and regulatory requirements, which could impose substantial obligations on us and our management, cause us to expend additional time and resources, and increase our exposure to penalties or fines for non-compliance with such requirements. To accommodate our past and anticipated future growth, and to compete effectively, we will need to continue to improve our management, operational and financial information systems and to expand, train, manage and motivate our workforce. Our personnel, systems, procedures or controls may not be adequate to support our operations in the future. Further, focusing our financial resources and management attention on the expansion of our operations may negatively impact our financial results. Any failure to improve our management, operational and financial information systems, or to expand, train, manage or motivate our workforce, could reduce or prevent our growth.
Shortages of surgery-related products, equipment and medical supplies and quality control issues with such products, equipment and medical supplies could disrupt our operations and adversely affect our case volume, surgical case mix and profitability.
Our operations depend significantly upon our ability to obtain sufficient surgery-related products, drugs, equipment and medical supplies from suppliers on a timely and cost-effective basis. If we are unable to obtain such necessary products, or if we fail to properly manage existing inventory levels, the surgical facilities may be unable to perform certain surgeries, which could adversely affect case volume or result in a negative shift in surgical case mix. In addition, as a result of shortages, we could suffer, among other things, operational disruptions, disruptions in cash flows, increased costs and reductions in profitability. At times, supply shortages have occurred in our industry, and such shortages may be expected to recur from time to time.
Medical supplies and services can also be subject to supplier product quality control incidents and recalls. In addition to contributing to materials shortages, product quality can affect patient care and safety. Material quality control incidents have occurred in the past and may occur again in the future, for reasons beyond our control, and such incidents can negatively impact case volume, product costs and our reputation. In addition, we may have to incur costs to resolve quality control incidents related to medical supplies and services regardless of whether they were caused by us. Our inability to obtain the necessary amount and quality of surgery-related products, equipment and medical supplies due to a quality control incident or recall could have a material adverse effect on our business, prospects, results of operations and financial condition.
A pandemic, epidemic or outbreak of a contagious disease in the markets in which we operate or that otherwise impacts our facilities could adversely impact our business.
If a pandemic, epidemic or outbreak of an infectious disease, including the recent outbreak of respiratory illness caused by a novel coronavirus known as COVID-19, or other public health crisis were to affect the areas in which we operate, our business, including our revenue, profitability and cash flows, could be adversely affected. If any of our facilities were involved, or perceived to be involved, in treating patients with a highly contagious disease, or there was an outbreak of a highly contagious disease in areas in which our surgical centers are located, our patients might cancel or defer elective procedures or otherwise avoid medical treatment. This could result in reduced patient volumes and operating revenues, potentially over an extended period. Further, a pandemic, epidemic or outbreak of an infectious disease might adversely impact our business by causing temporary shutdowns of our facilities or diversion of patients or by causing staffing shortages in our facilities. We may be unable to locate replacement supplies, and ongoing delays could require us to reduce procedure volume or cause temporary shutdowns of our facilities. Although we have disaster plans in place and operate pursuant to infectious disease protocols, the extent to which COVID-19 or other public health crisis will impact our business is difficult to predict and will depend on many factors beyond our control, including the speed of contagion, the development and implementation of effective preventative measures and possible treatments, the scope of governmental and other restrictions on travel and other activity, and public reactions to these factors.
We face competition from other health care facilities and providers.
The health care business is highly competitive and each of the individual geographic areas in which we operate has a different competitive landscape. In each of our markets we compete with other health care providers for patients and in contracting with private insurance payors. In addition, because the number of physicians available to utilize and invest in our facilities is finite, we face intense competition from other surgery centers, hospitals, health systems and other health care providers in recruiting physicians to utilize and invest in our facilities. We are in competition with other surgery centers, hospitals and health care systems in the communities we serve to attract patients and provide them with the care they need.
20
There are also unaffiliated hospitals in each market in which we operate. These hospitals have established relationships with physicians and payors. In addition, other companies either currently are in the same or similar business of developing, acquiring and operating surgical facilities or may decide to enter our business. Many of these companies have greater resources than we do, including financial, marketing, staff and capital resources. We also may compete with some of these companies for entry into strategic relationships with health care systems and health care professionals. In addition, many physician groups develop surgical facilities without a corporate partner. In recent years, more physicians are choosing to perform procedures, including pain management and gastrointestinal procedures, in an office-based setting rather than in a surgical facility. If we are unable to compete effectively with any of these entities or groups, we may be unable to implement our business strategies successfully and our financial position and results of operations could be adversely affected.
Competition for physicians and clinical personnel, including nurses, shortages of qualified personnel or other factors could increase our labor costs and adversely affect our revenue, profitability and cash flows.
Our operations are dependent on the efforts, abilities and experience of our physicians and clinical personnel. We compete with other health care providers, primarily hospitals and other surgical facilities, in attracting physicians to utilize our surgical facilities, nurses and medical staff to support our surgical facilities, recruiting and retaining qualified management and support personnel responsible for the daily operations of each of our facilities and in contracting with private insurance payors in each of our markets. In some markets, the lack of availability of clinical personnel, such as nurses, has become a significant operating issue facing all health care providers. This shortage may require us to continue to enhance wages and benefits to recruit and retain qualified personnel or to contract for more expensive temporary personnel. For the year-ended
December 31, 2019
, our salary and benefit expenses represented approximately
30%
of our revenue. We also depend on the available labor pool of semi-skilled and unskilled workers in each of the markets in which we operate.
If our labor costs increase, we may not be able to raise rates to offset these increased costs. Because a significant percentage of our revenue consists of fixed, prospective payments, our ability to pass along increased labor costs is limited. In particular, if labor costs rise at an annual rate greater than our net annual consumer price index basket update from Medicare, our results of operations and cash flows will likely be adversely affected. Any union activity at our facilities that may occur in the future could contribute to increased labor costs. Certain proposed changes in federal labor laws and the National Labor Relations Board’s modification of its election procedures could increase the likelihood of employee unionization attempts. Although none of our employees are currently represented by a collective bargaining agreement, to the extent a significant portion of our employee base unionizes, it is possible our labor costs could increase materially. Our failure to recruit and retain qualified management and medical personnel, or to control our labor costs, could have a material adverse effect on our business, prospects, results of operations and financial condition.
Some jurisdictions preclude us from entering into non-compete agreements with our physicians, and other non-compete agreements and restrictive covenants applicable to certain physicians and other clinical employees may not be enforceable.
We have contracts with physicians and other health professionals in many states. Some of our physician services contracts, as well as many of our physician services contracts with hospitals, include provisions preventing these physicians and other health professionals from competing with us both during and after the term of our contract with them. The law governing non-compete agreements and other forms of restrictive covenants varies from state to state. Some jurisdictions prohibit us from entering into non-compete agreements with our professional staff. Other states are reluctant to strictly enforce non-compete agreements and restrictive covenants against physicians and other health care professionals. Therefore, there can be no assurance that our non-compete agreements related to employed or otherwise contracted physicians and other health professionals will be enforceable if challenged in certain states. In such event, we would be unable to prevent former employed or otherwise contracted physicians and other health professionals from competing with us, potentially resulting in the loss of some of our hospital contracts and other business. Additionally, certain facilities have the right to employ or engage our providers after the termination or expiration of our contract with those facilities and cause us not to enforce our non-compete provisions related to those providers.
We may become involved in litigation which could negatively impact the value of our business.
From time-to-time we are involved in lawsuits, claims, audits and investigations, including those arising out of services provided, personal injury claims, professional liability claims, billing and marketing practices, employment disputes and contractual claims. We may become subject to future lawsuits, claims, audits and investigations that could result in substantial costs and divert our attention and resources and adversely affect our business condition. In addition, since our current growth strategy includes acquisitions, among other things, we may become exposed to legal claims for the activities of an acquired business prior to our acquisition of such business. These lawsuits, claims, audits or investigations, regardless of their merit or outcome, may also adversely affect our reputation and ability to expand our business.
In addition, from time to time we have received, and expect to continue to receive, correspondence from former employees terminated by us who threaten to bring claims against us alleging that we have violated one or more labor and employment regulations. In certain instances former employees have brought claims against us and we expect that we will encounter similar actions against us in the future. An adverse outcome in any such litigation could require us to pay contractual damages, compensatory damages, punitive damages, attorneys’ fees and costs.
If we become subject to large malpractice or other legal claims, we could be required to pay significant damages, which may not be covered by insurance.
In recent years, physicians, hospitals and other health care providers have become subject to an increasing number of legal actions alleging malpractice, product liability or related legal theories. Many of these actions involve large monetary claims and significant defense costs. We also owe certain defense and indemnity obligations to our officers and directors.
21
Our insurance coverage may not cover all claims against us, or insurance coverage may not continue to be available at a cost allowing us to maintain adequate levels of insurance. If one or more successful claims against us were not covered by or exceeded the coverage of our insurance, our financial condition and results of operations could be adversely affected. Our business, profitability and growth prospects could suffer if we face negative publicity or we pay damages or defense costs in connection with a claim that is outside the scope or limits of coverage of any applicable insurance coverage, including claims related to adverse patient events, contractual disputes, professional and general liability, and directors’ and officers’ duties.
In addition, market rates for insurance premiums and deductibles have been steadily increasing. Our earnings and cash flows could be materially and adversely affected by any of the following:
|
•
|
the collapse or insolvency of our insurance carriers;
|
|
•
|
further increases in premiums and deductibles;
|
|
•
|
increases in the number of liability claims against us or the cost of settling or trying cases related to those claims; or
|
|
•
|
an inability to obtain one or more types of insurance on acceptable terms, if at all.
|
Cybersecurity attacks or intrusions could adversely impact our businesses.
We, independently and through third-party vendors, collect and store on our networks and devices sensitive information, including intellectual property, proprietary business information and personally identifiable information of our patients and employees. Information security risks have generally increased in recent years because of threats from malicious persons and groups, new vulnerabilities, the proliferation of new technologies and the increased sophistication and activities of perpetrators of cyber-attacks. A failure in or breach of our operational or information security systems as a result of cyber-attacks or information security breaches could disrupt our business, result in the loss, disclosure or misuse of confidential or proprietary information, damage our reputation, increase our costs or lead to fines and financial losses. As a result, cybersecurity and the continued development and enhancement of the controls and processes designed to protect our systems, computers, software, data and networks from attack, damage or unauthorized access remain a priority for us.
We and our third-party vendors have been and likely will continue to be subject to attempted cybersecurity attacks. While there has been no material impact on our business or operations from these attempted attacks. There can be no assurance that we or our third-party vendors will not be subject to cybersecurity incidents that bypass our security measures, impact the integrity, availability or privacy of personal health information or other data subject to privacy laws or disrupt our information systems, devices or business, including our ability to provide various health care services.
The market for cybersecurity insurance is relatively new and coverage available for cybersecurity events may evolve as the industry matures. While we maintain insurance relating to cybersecurity events, such insurance is subject to a number of exclusions and may be insufficient to offset any losses, costs or damage we experience. As cyber threats continue to evolve, we will be required to expend additional resources to continue to enhance our information security measures or to investigate and remediate any information security vulnerabilities.
Financial pressures on patients, and current and future economic condition, may adversely affect our volume and surgical case mix.
Our case volume and surgical case mix may be adversely affected by patients’ unwillingness to pay for procedures in our facilities. Higher numbers of unemployed individuals generally translates into more individuals without health care insurance to help pay for procedures, thereby increasing the potential for persons to elect not to have procedures performed. Even procedures normally thought to be non-elective may be delayed or may not be performed if the patient cannot afford the procedure due to a lack of insurance or money to pay their portion of our facilities’ fee. It is difficult to predict the degree to which our business will continue to be impacted by economic conditions in the future.
In addition, certain conditions of the U.S. economy have adversely affected and could continue to adversely affect the budgets of individual states and the federal government, which has resulted in and could continue to result in attempts to reduce payments made to us by federal and state government health care programs, including Medicare, military services, Medicaid and workers’ compensation programs, a reduction in the scope of services covered by those programs and an increase in taxes and assessments on our activities. Additionally, there continues to be uncertainty regarding the Affordable Care Act, and any such result could adversely affect our business by exacerbating the financial pressures on patients, leading them to further delay or cancel non-emergency surgical procedures.
Our surgical facilities are sensitive to regulatory, economic and other conditions in the states where they are located.
Our revenue is particularly sensitive to regulatory, economic and other conditions in the states of Florida, Georgia and Texas. As of
December 31, 2019
, we owned and operated
nine
consolidated surgical facilities in Texas,
seven
consolidated surgical facilities in Georgia and
20
consolidated surgical facilities in Florida. The Texas facilities represented approximately
14%
of our revenue in fiscal
2019
, the Georgia facilities represented approximately
13%
of our revenue in fiscal
2019
, and the Florida facilities represented approximately
10%
of our revenue in fiscal
2019
.
In addition, Mountain View Hospital in Idaho Falls, Idaho represented
17%
of our revenue during fiscal
2019
. This surgical hospital also provides ancillary services, including physician practices, radiation oncology and anesthesia services. If there were an adverse regulatory, economic or other development in any of the states in which we have a higher concentration of facilities, including Idaho, our case volumes could decline in such states or there could be other unanticipated adverse impacts on our business in those states, which could have a material adverse effect on our business, prospects, results of operations and financial condition.
22
If any of our existing health care facilities lose their accreditation status or any of our new facilities fail to receive accreditation, such facilities could become ineligible to receive reimbursement under Medicare or Medicaid or other third-party payors.
The construction and operation of health care facilities are subject to extensive federal, state and local regulation relating to, among other things, the adequacy of medical care, equipment, personnel, operating policies and procedures, fire prevention, rate-setting and compliance with building codes and environmental protection. Additionally, such facilities are subject to periodic inspection by government authorities and accreditation organizations to assure their continued compliance with these various standards.
All of our facilities are deemed certified, meaning that they are accredited, properly licensed under the relevant state laws and regulations and certified under the Medicare program or are in the process of applying for such accreditation, licensing or certification. The effect of maintaining certified facilities is to allow such facilities to participate in the Medicare and Medicaid programs. We believe that all of our facilities are in material compliance with applicable federal, state, local and other relevant accreditation and certification regulations and standards. However, should any of our health care facilities lose their deemed certified status and thereby lose certification under the Medicare or Medicaid programs, such facilities would be unable to receive reimbursement from either or both of those programs, and possibly from other third-party payors, and our business could be materially adversely affected.
Certain of our partnership and operating agreements contain provisions giving rights to our partners and other members that may be adverse to our interests.
Certain of the agreements governing the limited partnerships ("LPs"), general partnerships ("GPs") and limited liability companies ("LLCs") through which we own and operate our facilities contain provisions that give our partners or other members rights that may, in certain circumstances, be adverse to our interests. These rights include, but are not limited to, rights to purchase our interest in the partnership or LLC, rights to require us to purchase the interests of our partners or other members, or rights requiring the consent of our partners and other members prior to our transferring our ownership interest in a facility or prior to a change in control of us or certain of our subsidiaries. With respect to these purchase rights, the agreements generally include a specified formula or methodology to determine the applicable purchase price, which may or may not reflect fair market value.
Additionally, many of our partnership and operating agreements contain restrictions on actions that we can take, even though we may be the general partner or the managing member. Examples of these restrictions include the rights of our partners and other members to approve the sale of substantially all of the assets of the partnership or LLC, to dissolve the partnership or LLC, to appoint a new or additional general partner or managing member and to amend the partnership or operating agreements. Many of our agreements also restrict our ability in certain instances to compete with our existing facilities or with our partners. Where we hold only a limited partner or a non-managing member interest, the general partner or managing member may take certain actions without our consent, although we typically have certain protective rights to approve major decisions such as the sale of substantially all of the assets of the entity, dissolution of the partnership or LLC and the amendment of the partnership or operating agreement. These management and governance rights held by our partners and other members limit and restrict our ability to make unilateral decisions about the management and operation of the facilities without the approval of our partners and other members.
We may have a special legal responsibility to the holders of ownership interests in the entities through which we own our facilities, which may conflict with, and prevent us from acting solely in, our own best interests or the interests of our stockholders.
We generally hold our ownership interests in facilities through LPs, GPs, LLCs or limited liability partnerships ("LLPs") in which we maintain an ownership interest along with physicians and, in some cases, both physicians and health systems. As general partner and manager of most of these entities, we may have a fiduciary duty, to manage these entities in the best interests of the other owners. We also have a duty to operate our business for the benefit of our stockholders. As a result, we may encounter conflicts between our responsibility to the other owners and our responsibility to our stockholders. For example, we have entered into some management agreements to provide management services to our surgical facilities in exchange for a fee. Disputes may arise as to the nature of the services to be provided or the amount of the fee to be paid. In these cases, we may be obligated to exercise reasonable, good faith judgment to resolve the disputes and may not be free to act solely in our own best interests or the stockholders best interest. Disputes may also arise between us and our physician investors with respect to a particular business decision or regarding the interpretation of the provisions of the applicable partnership or limited liability company agreement. We seek to avoid these disputes but have not implemented any measures to resolve these conflicts if they arise. If we are unable to resolve a dispute on terms favorable or satisfactory to us, it could have a material adverse effect on our business, prospects, results of operations and financial condition.
Growth of patient receivables or deterioration in the ability to collect on these accounts, due to changes in economic conditions or otherwise, could have a material adverse effect on our business, prospects, results of operations and financial condition.
The current practice of providing medical services in advance of payment or, in many cases, prior to assessment of ability to pay for such services, may have significant negative impact on our revenue and cash flow. We bill numerous and varied payors, such as self-pay patients, private insurance payors and Medicare and Medicaid. These different payors typically have different billing requirements that must be satisfied prior to receiving payment for services rendered. Reimbursement is typically conditioned on our documenting medical necessity and correctly applying diagnosis codes. Incorrect or incomplete documentation and billing information could result in non-payment for services rendered. The primary collection risks with respect to our patient receivables relate to patient accounts for which the primary third-party payor has paid the amounts covered by the applicable agreement, but patient responsibility amounts (deductibles and co-payments) remain outstanding.
Additional factors that could complicate our billing include:
23
|
•
|
disputes between payors as to which party is responsible for payment;
|
|
•
|
failure of information systems and processes to submit and collect claims in a timely manner;
|
|
•
|
variation in coverage for similar services among various payors;
|
|
•
|
the difficulty of adherence to specific compliance requirements, diagnosis coding and other procedures mandated by various payors; and
|
|
•
|
failure to obtain proper physician credentialing and documentation in order to bill various payors.
|
Due to the difficulty in assessing future trends, including the effects of changes in economic conditions, an increase in the amount of patient receivables or a deterioration in the collectability of these receivables could have a material adverse effect on our business, prospects, results of operations and financial condition.
We may write-off intangible assets, such as goodwill.
As a result of purchase accounting for our various acquisition transactions, our balance sheet at
December 31, 2019
contained intangible assets designated as either goodwill or intangibles totaling approximately
$3.4 billion
in goodwill and approximately
$47.3 million
in intangibles. Any other additional acquisitions that result in the recognition of additional intangible assets would cause an increase in these intangible assets. On an ongoing basis, we evaluate whether facts and circumstances indicate any impairment of the value of intangible assets. As circumstances change, we cannot assure you that the value of these intangible assets will be realized by us. If we determine that a significant impairment has occurred, we will be required to write-off the impaired portion of intangible assets, which could have a material adverse effect on our results of operations in the period in which the write-off occurs.
We may be limited in our ability to utilize, or may not be able to utilize, net operating loss carryforwards to reduce our future tax liability.
As of
December 31, 2019
, we had U.S. federal net operating loss ("NOL") carryforwards of approximately
$530.6 million
and state NOL carryforwards of approximately
$596.7 million
, which may be limited annually due to certain change in ownership provisions of Section 382 of the Internal Revenue Code of 1986, as amended (the "Code"). In addition, as a result of the Symbion acquisition, approximately $179 million in NOL carryforwards are subject to an annual Section 382 base limitation of $4.9 million, and, as a result of the Novamed acquisition, approximately $17 million in NOL carryforwards are subject to an annual Section 382 base limitation of $4.9 million. As a result of the NSH acquisition, approximately $20.5 million in NOL carryforwards are subject to an annual Section 382 base limitation of $2.8 million. Further, the sale of H.I.G.'s shares to Bain Capital in connection with the Transactions resulted in an ownership change as defined in Section 382. As a result, we will not be able to use our pre-ownership-change NOLs in excess of the limitation imposed by Section 382. These limitations, when combined with amounts allowable due to net unrecognized built in gains, are not expected to impact the realization of the deferred tax assets associated with these NOLs.
$516.2 million
of our federal NOL carryforwards will begin to expire in
2025
and will completely expire in
2037
. The remaining federal NOL carryforwards, which were generated subsequent to 2017, do not expire. Our state NOL carryforwards will begin to expire in
2020
and will completely expire in
2039
. Future ownership changes may subject our NOL carryforwards to further annual limitations, which could restrict our ability to use them to offset our taxable income in periods following the ownership changes.
We entered into a tax receivable agreement that will require us to make payments to the pre-IPO owners of Surgery Center Holdings, LLC (the "Pre-IPO Owners"), which amounts are expected to be material.
On September 30, 2015, Surgery Partners, Inc. became the direct parent and sole member of Surgery Center Holdings, LLC (the "Reorganization"). We indirectly acquired favorable tax attributes in connection with the Reorganization. These tax attributes would not be available to us in the absence of the consummation of the Reorganization. As part of the Reorganization, we entered into a tax receivable agreement with the Pre-IPO Owners. In connection with the Transactions completed in in August 2017, we entered into an agreement to amend the tax receivable agreement (as amended, the "TRA"), which became effective on August 31, 2017.
Pursuant the TRA, we agreed to make annual payments to H.I.G. in its capacity as the stockholders representative on behalf of the other pre-Reorganization stockholders pursuant to a fixed payment schedule. The final payment is scheduled to be made in 2024. The amounts payable under the TRA are calculated to equal the product of (i) an annual base amount and (ii) the sum of (x) the maximum corporate federal income tax rate for the applicable year and (y) three percent. The amounts payable under the TRA are related to our projected realized tax savings over the next five years and are not dependent on our actual tax savings over the next five years. The calculations of amounts payable pursuant to the TRA is thus dependent on the maximum corporate federal income tax rate. To the extent that we are unable to make payments under the TRA, such payments will be deferred and will accrue interest at a rate of LIBOR plus 500 basis points until paid. If the terms of credit agreements and other debt documents cause us to be unable to make payments under the TRA and such terms are not materially more restrictive than those existing as of September 30, 2015, such payments will be deferred and will accrue interest at a rate of LIBOR plus 300 basis points until paid. We estimate that the total remaining amounts payable under the TRA as of
December 31, 2019
may be as high as
$60.1 million
, but the ultimate amounts payable are likely to vary if there are further changes in law as to the income tax rates applicable to domestic corporations.
24
Unanticipated changes in effective tax rates or adverse outcomes resulting from examination of our income or other tax returns could adversely affect our financial condition and results of operations.
We are subject to income taxes in the United States, and our domestic tax liabilities are subject to the allocation of expenses in differing jurisdictions. In December 2017, the U.S. government enacted comprehensive tax legislation commonly referred to as the Tax Cuts and Jobs Act (the "Tax Act"). The Tax Act makes broad and complex changes to the Code, including:
|
•
|
reducing the highest marginal U.S. federal corporate income tax rate from 35% to 21% for tax years beginning after December 31, 2017;
|
|
•
|
limiting the extent to which net operating losses can be utilized against taxable income that would apply to losses created after December 31, 2017;
|
|
•
|
changing rules related to the ability to apply net operating losses against later or earlier tax years that would apply to losses created after December 31, 2017;
|
|
•
|
creating a new limitation on deductible interest expense for tax years beginning after December 31, 2017;
|
|
•
|
eliminating the corporate alternative minimum tax ("AMT") and changing how existing AMT credits can be realized for tax years beginning after December 31, 2017; and
|
|
•
|
generally repealing the performance-based compensation exception to the Section 162(m) $1.0 million deduction limitation and revising the definition of a covered employee for tax years beginning after December 31, 2017.
|
In addition to the changes implemented by the Tax Act and associated regulations and guidance, our future effective tax rates could be subject to volatility or adversely affected by a number of other factors, including:
|
•
|
changes in the valuation of our deferred tax assets and liabilities;
|
|
•
|
expected timing and amount of the release of any tax valuation allowances;
|
|
•
|
tax effects of equity-based compensation;
|
|
•
|
costs related to intercompany restructurings;
|
|
•
|
changes in tax laws, regulations or interpretations thereof; or
|
|
•
|
lower than anticipated future earnings in jurisdictions where we have lower statutory tax rates and higher than anticipated future earnings in jurisdictions where we have higher statutory tax rates.
|
In addition, we may be subject to audits of our income, sales and other transaction taxes by U.S. federal, state and local authorities. Outcomes from these audits could have an adverse effect on our financial condition and results of operations.
Our facilities may be adversely impacted by weather and other factors beyond our control, and disruptions in our disaster recovery systems or management continuity planning could limit our ability to operate our business effectively.
The financial results of our facilities may be negatively impacted by adverse weather conditions, such as tornadoes, earthquakes and hurricanes, or other factors beyond our control, such as wildfires. These weather conditions or other factors could disrupt patient scheduling, displace our patients, employees and physician partners and force certain of our facilities to close temporarily or for an extended period of time. In certain markets, we have a large concentration of surgery centers that may be simultaneously affected by adverse weather condition or events beyond our control.
While we have disaster recovery systems and business continuity plans in place, any disruptions in our disaster recovery systems or the failure of these systems to operate as expected could, depending on the magnitude of the problem, adversely affect our operating results by limiting our capacity to effectively monitor and control our operations. Despite our implementation of a variety of security measures, our technology systems could be subject to physical or electronic break-ins, and similar disruptions from unauthorized tampering or weather related disruptions where our headquarters is located. In addition, in the event that a significant number of our management personnel were unavailable in the event of a disaster, our ability to effectively conduct business could be adversely affected.
Risks Related to Government Regulation
If we fail to comply with or otherwise incur liabilities under the numerous federal and state laws and regulations relating to the operation of our facilities, we could incur significant penalties or other costs or be required to make significant changes to our operations.
The health care industry is heavily regulated and we are subject to many laws and regulations at the federal, state and local government levels in the markets in which we operate. These laws and regulations require that our facilities meet various licensing, accreditation, certification and other requirements, including, but not limited to, those relating to:
|
•
|
ownership and control of our facilities;
|
|
•
|
operating policies and procedures;
|
25
|
•
|
qualification, training and supervision of medical and support persons;
|
|
•
|
pricing of, billing for and coding of services and properly handling overpayments, debt collection practices and the submission of false statements or claims;
|
|
•
|
the necessity, appropriateness and adequacy of medical care, equipment, personnel, operating policies and procedures; maintenance and preservation of medical records;
|
|
•
|
financial arrangements between referral sources and our facilities;
|
|
•
|
the protection of privacy, including patient and credit card information;
|
|
•
|
screening, stabilization and transfer of individuals who have emergency medical conditions and provision of emergency services;
|
|
•
|
antitrust;
|
|
•
|
building codes;
|
|
•
|
workplace health and safety;
|
|
•
|
licensure, certification and accreditation;
|
|
•
|
fee-splitting and the corporate practice of medicine;
|
|
•
|
handling of medication;
|
|
•
|
confidentiality, data breach, identity theft and maintenance and protection of health-related and other personal information and medical records; and
|
|
•
|
environmental protection, health and safety.
|
If we fail to comply with applicable laws and regulations, we could subject ourselves to administrative, civil or criminal penalties, cease and desist orders, forfeiture of amounts owed and recoupment of amounts paid to us by governmental or commercial payors, loss of licenses necessary to operate and disqualification from Medicare, Medicaid and other government-sponsored health care programs.
Many of these laws and regulations have not been fully interpreted by regulatory authorities or the courts, and their provisions are sometimes open to a variety of interpretations. Different interpretations or enforcement of existing or new laws and regulations could subject our current practices to allegations of impropriety or illegality, or require us to make changes in our operations, facilities, equipment, personnel, services, capital expenditure programs or operating expenses to comply with the evolving rules. Any enforcement action against us, even if we successfully defend against it, could cause us to incur significant legal expenses and divert our management’s attention from the operation of our business.
A number of initiatives have been proposed during the past several years to reform various aspects of the health care system in the United States. In the future, different interpretations or enforcement of existing or new laws and regulations could subject our current practices to allegations of impropriety or illegality, or could require us to make changes in our facilities, equipment, personnel, services, capital expenditure programs and operating expenses. In addition, some of the governmental and regulatory bodies that regulate us are considering or may in the future consider enhanced or new regulatory requirements. These authorities may also seek to exercise their supervisory or enforcement authority in new or more robust ways. All of these possibilities, if they occurred, could detrimentally affect the way we conduct our business and manage our capital, either of which, in turn, could have a material adverse effect on our business, prospects, results of operations and financial condition.
We cannot predict the effect that health care reform and other changes in government programs may have on our business, financial condition or results of operations.
The Affordable Care Act has changed and continues to change how health care services are covered, delivered and reimbursed through, among other things, expanded coverage of uninsured individuals, reduced growth in Medicare program spending and the establishment and expansion of programs tying reimbursement to quality and clinical integration. The Affordable Care Act also reforms certain aspects of health insurance, quality of care and fraud and abuse enforcement.
Substantial uncertainty remains regarding the net effect of the Affordable Care Act on our business because the long-term impact of a number of factors, including the following, remains unclear:
|
•
|
the responses of individuals, businesses and other market participants to the evolving choices and obligations under the Affordable Care Act;
|
|
•
|
the states’ decisions whether to implement the Medicaid expansion provisions of the Affordable Care Act, and under what terms;
|
|
•
|
the effect of value-based purchasing and other quality programs established under the Affordable Care Act;
|
|
•
|
the scope and nature of changes to Medicare reimbursement methods and programs, including accountable care organizations, bundled payment programs and other coordinated care models;
|
26
|
•
|
the financial sustainability of the Health Insurance Marketplace, which may be impacted by whether a sufficient number of payors participate;
|
|
•
|
our ability to participate in health insurance plans offered through the Health Insurance Marketplaces and the terms of our participation;
|
|
•
|
the net effect of reductions in federal health care program spending under the Affordable Care Act; and
|
|
•
|
the resolution of new and ongoing legislative and legal challenges to the Affordable Care Act.
|
Initiatives to repeal the Affordable Care Act, in whole or in part, and to offer amendments or supplements to modify its provisions have been persistent and have increased as a result of the 2016 election. However, as a result of the enactment of the Tax and Jobs Act of 2017, the tax penalty for failure to comply with the "individual mandate" was reduced to zero as of calendar year 2019, effectively repealing the mandate itself. The reduction to zero of the individual mandate tax penalty and any other future repeal or replacement of the Affordable Care Act or any component thereof may have significant impact on the reimbursement for health care services generally, and may cause more individuals to become uninsured, rendering them unable to afford health care services offered by the Company. In addition to proposed legislative changes to the Affordable Care Act, there remains ongoing litigation seeking to repeal the Affordable Care Act in whole or in part. The United States Supreme Court recently agreed to hear a case that seeks to invalidate the Affordable Care Act, but it likely will not issue an opinion until 2021.
Because of the many variables involved, we are unable to predict the net effect of the Affordable Care Act and other associated changes within the health care industry on us or our operations. Depending on how the Affordable Care Act continues to be interpreted, implemented or changed, it could have a material adverse effect on our business, prospects, results of operations and financial condition.
If laws governing the corporate practice of medicine or fee-splitting change, we may be required to restructure some of our relationships, which may result in a significant loss of revenue and divert other resources.
The laws of various states in which we operate or may operate in the future do not permit business corporations to practice medicine, to exercise control over or employ physicians who practice medicine or to engage in various business practices, such as fee-splitting with physicians (i.e., sharing in a percentage of professional fees). The interpretation and enforcement of these laws vary significantly from state to state. We provide management services to a network of physicians. If our arrangements with this network were deemed to violate state corporate practice of medicine, fee-splitting or similar laws, or if new laws are enacted rendering our arrangements illegal, we may be subject to civil and/or criminal penalties and could be required to restructure or terminate these arrangements, any of which may result in a significant loss of revenue and divert management and business resources.
If regulations change, we may be obligated to purchase some or all of the ownership of our physician partners or renegotiate some of our partnership and operating agreements with our physician partners and management agreements with surgical facilities.
Upon the occurrence of various fundamental regulatory changes or changes in the interpretation of existing regulations, we may be obligated to purchase all of the ownership of the physician investors in most of the partnerships or limited liability companies that own and operate our surgical facilities and/or hospitals. The purchase price that we would be required to pay for the ownership is specified in our partnership agreements and is typically based on either a multiple of the surgical facility’s EBITDA, as defined in our partnership and operating agreements with these surgical facilities and hospitals, or the fair market value of the ownership as determined by a third-party appraisal. The physician investors in some of our surgical facilities and hospitals can require us to purchase their interests in exchange for cash or shares of our common stock if these regulatory changes occur. In addition, some of our partnership agreements with our physician partners and management agreements with surgical facilities and hospitals require us to attempt to renegotiate the agreements upon the occurrence of various fundamental regulatory changes or changes in the interpretation of existing regulations and provide for termination of the agreements if renegotiations are not successful.
Regulatory changes that could create purchase or renegotiation obligations include changes that:
|
•
|
make illegal the referral of Medicare or other patients to our surgical facilities and hospitals by physician investors;
|
|
•
|
create a substantial likelihood that cash distributions to physician investors from the partnerships or LLCs through which we operate our surgical facilities and hospitals would be illegal;
|
|
•
|
make illegal the ownership by the physician investors of interests in the partnerships or LLCs through which we own and operate our surgical facilities and hospitals; or
|
|
•
|
require us to reduce the aggregate percentage of physician investor ownership in our hospitals.
|
We do not control whether or when any of these regulatory events might occur. In the event we are required to purchase all of the physicians’ ownership, our existing capital resources would not be sufficient for us to meet this obligation. These obligations and the possible termination of our partnership and management agreements would have a material adverse effect on our financial condition and results of operations.
27
Our surgical facilities do not satisfy the requirements for any of the safe harbors under the federal Anti-Kickback Statute. If a federal or state agency asserts a different position or enacts new laws in this regard, we could be subject to criminal and civil penalties, loss of licenses and exclusion from governmental programs, which may result in a substantial loss of revenue.
The Anti-Kickback Statute prohibits the offer, payment, solicitation or receipt of any form of remuneration in return for referrals for items or services payable by Medicare, Medicaid, or any other federally funded health care program. Our exclusion from participation in all federally funded health care programs as a result of a violation of the Anti-Kickback Statute would have a material adverse effect on our business, prospects, results of operations and financial condition. In addition, many of the states in which we operate have also adopted laws, similar to the Anti-Kickback Statute, that prohibit payments to physicians in exchange for referrals, some of which apply regardless of the source of payment for care. These statutes typically impose criminal and civil penalties, including the loss of a license to do business in the state.
The "Investment Interest" safe harbor and the "Personal Services and Management Contracts" safe harbor apply to business arrangements similar to those used in connection with our surgical facilities. However, the structure of the partnerships and limited liability companies operating our surgery centers and surgical hospitals, as well as our various business arrangements involving physician group practices, do not satisfy all of the requirements of either safe harbor. We have entered into management agreements to manage the majority of our surgical facilities. Most of these agreements call for our subsidiary to be paid a percentage-based management fee. Because our management fees are generally based on a percentage of revenue, our management agreements do not typically meet the Personal Services and Management Contracts safe harbor. We have implemented formal compliance programs designed to safeguard against overbilling and believe that our management agreements comply with the requirements of the Anti-Kickback Statute. However, we cannot assure you that the OIG would find our compliance programs to be adequate or that our management agreements would be found to comply with the Anti-Kickback Statute.
The surgery center safe harbor protects four types of investment arrangements: (1) surgeon owned surgery centers; (2) single specialty surgery centers; (3) multi-specialty surgery centers; and (4) hospital/physician surgery centers. In addition to the physician investor, the categories permit an "unrelated" investor, who is a person or entity that is not in a position to provide items or services related to the surgery center or its investors. Our business arrangements with our surgical facilities typically consist of one of our subsidiaries being an investor in each partnership or limited liability company that owns the facility, in addition to providing management and other services to the facility. Therefore, our business arrangements with our surgery centers, surgical hospitals and physician groups do not qualify for the expanded safe harbor protection from government review or prosecution under the Anti-Kickback Statute. However, we believe that we are in compliance with the requirements of the Anti-Kickback Statute.
We employ dedicated marketing personnel whose job functions include the recruitment of physicians to perform surgery at our facilities. These employees are paid a base salary plus a productivity bonus. We believe our employment arrangements with these employees are consistent with a safe harbor provision designed to protect payments made to employees. However, a government agency or private party may assert a contrary position.
We also enter into lease agreements with physicians from time to time for the rental of space for our surgical facilities. We seek to structure these lease agreements so that they are in compliance with the Anti-Kickback Statute safe harbor provision regarding real estate leases. However, a government agency or private party may assert a contrary position.
If any of our business arrangements with physicians or sales and marketing personnel were alleged or deemed to violate the Anti-Kickback Statute or similar laws, or if new federal or state laws were enacted rendering these arrangements illegal, it could have a material adverse effect on our business, prospects, results of operations and financial condition.
In addition to the physician ownership in our surgical facilities, other financial relationships of ours with potential referral sources could potentially be scrutinized under the Anti-Kickback Statute.
Certain of our ASCs have entered into arrangements for professional services, including arrangements for anesthesia services. The OIG scrutinizes certain arrangements it deems to be “suspect Contractual Joint Ventures”, including.. arrangements between anesthesiologists and physician owners of ASCs. We believe our arrangements for anesthesia services are distinguishable from those described in Advisory Opinion 12-06 (May 25, 2012) and are in compliance with the requirements of the federal Anti-Kickback Statute. However, we cannot assure you that regulatory authorities would agree with that position.
The Eliminating Kickbacks in Recovery Act may affect our financial relationships with referral sources utilizing our clinical laboratories
In addition to the Anti-Kickback Statute, the United States recently enacted a new law known as the Eliminating Kickbacks in Recovery Act, or the EKRA, discussed in greater detail above. While the EKRA does contain certain exceptions similar to the Anti-Kickback Statute Safe Harbors, those exceptions are more narrow than the Anti-Kickback Statute Safe Harbors. As a result, the operations at our clinical laboratories may be impacted by the EKRA.
If we fail to comply with physician self-referral laws as they are currently interpreted or may be interpreted in the future, or if other legislative restrictions are issued, we could incur substantial monetary penalties and a significant loss of revenue.
The Stark Law prohibits certain self-referrals for health care services unless an exception applies. Under the current Stark Law and related regulations, services provided at an ASC are not covered by the statute, even if those services include imaging, laboratory services or other Stark designated health services, provided that (i) the ASC does not bill for these services separately, or (ii) if the center is permitted to bill separately for these services, they are specifically exempted from Stark Law prohibitions. These are generally radiology and other imaging
28
services integral to performance of surgical procedures that meet certain requirements and certain outpatient prescription drugs. Services provided at our facilities licensed as hospitals are covered by the Stark Law. We attempt to structure our relationship with physicians who refer to our hospitals to meet an exception to the Stark Law where required, but the regulations implementing the exceptions are detailed and complex, and we cannot guarantee that every relationship complies fully with the Stark Law. We also believe that certain services provided by our managed physician network are covered by the Stark Law, but referrals for those services are exempt from the Stark Law under its "in-office ancillary services exception," among others. Our diagnostic laboratory is also subject to the Stark Law, but we believe that we have structured our agreements with physicians so as to not violate the Stark Law and related regulations.
Violations of these self-referral laws may result in substantial civil or criminal penalties, including treble damages for amounts improperly claimed, civil monetary penalties of up to $15,000 per prohibited service billed, up to $100,000 per prohibited circumvention scheme and exclusion from participation in the Medicare and Medicaid and other federal and state health care programs. Violations of the Stark Law will also create liability under the federal False Claims Act. Exclusion of our ASCs or hospitals from these programs through judicial or agency interpretation of existing laws or additional legislative restrictions on physician ownership or investments in health care entities could result in a significant loss of reimbursement revenue. We cannot provide assurances that CMS will not undertake other rulemaking to address additional revisions to or interpretations of the Stark Law regulations. If future rules modify the provisions of the Stark Law regulations that are applicable to our business, our revenue and profitability could be materially adversely affected and could require us to modify our relationships with our physician and health care system partners.
Federal law restricts the ability of our surgical hospitals to expand surgical capacity.
The Affordable Care Act dramatically curtailed the Whole Hospital Exception and prohibits physician ownership in hospitals that did not have a Medicare provider agreement by December 31, 2010. As a result, the law effectively prevents the formation of new physician-owned hospitals that participate in Medicare and Medicaid after December 31, 2010. Each of our surgical hospitals had a Medicare provider agreement in place prior to December 31, 2010 and is therefore able to continue operating with the ownership structure that was in place prior to December 30, 2010. However, the Affordable Care Act prohibits "grandfathered" hospitals from increasing their percentage of physician ownership, and it limits to a certain extent their ability to grow, because it prohibits such hospitals from increasing the aggregate number of inpatient beds, operating rooms and procedure rooms.
Companies within the health care industry, including us, continue to be the subject of federal and state audits and investigations, including actions for false and other improper claims.
Federal and state government agencies, as well as commercial payors, have increased their auditing and administrative, civil and criminal enforcement efforts as part of numerous ongoing investigations of health care organizations. These audits and investigations relate to a wide variety of topics, including the following: cost reporting and billing practices; quality of care; financial reporting; financial relationships with referral sources; and medical necessity of services provided. In addition, the OIG and the U.S. Department of Justice ("DOJ") have, from time to time, undertaken national enforcement initiatives that focus on specific billing practices or other suspected areas of abuse. In its 2013 Work Plan, the OIG stated its intention to review the safety and quality of care for Medicare beneficiaries having surgeries and procedures in ASCs and hospital outpatient departments.
The federal government may impose criminal, civil and administrative penalties on any person or entity that files a false claim for payment from the Medicare or Medicaid programs and other federal and state health care programs. Claims filed with private insurers can also lead to criminal and civil penalties, including, but not limited to, penalties relating to violations of federal mail and wire fraud statutes, as well as penalties under the anti-fraud provisions of the HIPAA. While the criminal statutes are generally reserved for instances of fraudulent intent, the federal government is applying its criminal, civil and administrative penalty statutes in an ever-expanding range of circumstances, including claiming payment for unnecessary services if the claimant merely should have known the services were unnecessary and claiming payment for low-quality services if the claimant should have known that the care was substandard. In addition, a violation of the Stark Law or the Anti-Kickback Statute can result in liability under the federal False Claims Act (the "FCA").
Over the past several years, the federal government has investigated an increasing number of health care providers for potential FCA violations, which, among other things, prohibits a person from knowingly presenting, or causing to be presented, a false or fraudulent claim to the federal government. The statute defines "knowingly" to include not only actual knowledge of a claim’s falsity, but also reckless disregard for or intentional ignorance of the truth or falsity of a claim. Violators of the FCA are subject to severe financial penalties, including treble damages and per claim penalties in excess of $10,000. Because our facilities perform hundreds or thousands of similar procedures each year for which they are paid by Medicare, and since the statute of limitations for such claims extends for six years under normal circumstances (and possibly as long as ten years in the event of failure to discover material facts), a repetitive billing error or cost reporting error could result in significant, material repayments and civil or criminal penalties.
Moreover, another trend impacting health care providers is the increased use of the FCA, particularly by individuals who bring actions under that law. Under the "qui tam," or whistleblower, provisions of the FCA, private parties may bring actions on behalf of the federal government. If the government intervenes and prevails in the action, the defendant may be required to pay three times the actual damages sustained by the government, plus mandatory civil monetary penalties of between $10,957 and $21,916 for each false claim submitted to the government. These private parties, often referred to as relators, are entitled to share in any amounts recovered by the government through trial or settlement. Both direct enforcement activity by the government and whistleblower lawsuits under the FCA have increased significantly in recent years; thus, the risk that we will have to defend a false claims action, pay significant fines or be excluded from the Medicare and Medicaid programs has increased.
29
In addition, the Fraud Enforcement and Recovery Act of 2009 ("FERA") further expanded the scope of the FCA to create liability for knowingly and improperly avoiding or decreasing an obligation to pay money to the federal government and FERA, along with statutory provisions found in the Acts, created federal False Claims Act liability for the knowing failure to report and return an overpayment within 60 days of the identification of the overpayment or, in certain cases, the date by which a corresponding cost report is due, whichever is later. Governmental authorities have and may continue to challenge or scrutinize our operations. An allegation or determination that we have violated the law could have a material adverse effect on our business, prospects, results of operations and financial condition.
HIPAA also created new federal criminal statutes that prohibit among other actions, knowingly and willfully executing, or attempting to execute, a scheme to defraud any health care benefit program, including private third-party payors, knowingly and willfully embezzling or stealing from a health care benefit program, willfully obstructing a criminal investigation of a health care offense, and knowingly and willfully falsifying, concealing or covering up a material fact or making any materially false, fictitious or fraudulent statement in connection with the delivery of or payment for health care benefits, items or services. Similar to the federal Anti-Kickback Statute, a person or entity does not need to have actual knowledge of the statute or specific intent to violate it in order to have committed a violation.
In addition, a person who offers or transfers to a Medicare or Medicaid beneficiary any remuneration, including waivers of co-payments and deductible amounts (or any part thereof), that the person knows or should know is likely to influence the beneficiary’s selection of a particular provider, practitioner or supplier of Medicare or Medicaid payable items or services may be liable for civil monetary penalties of up to $10,000 for each wrongful act. Moreover, in certain cases, providers who routinely waive copayments and deductibles for Medicare and Medicaid beneficiaries can also be held liable under the Anti-Kickback Statute and civil False Claims Act, which can impose additional penalties associated with the wrongful act. Although this prohibition applies only to federal health care program beneficiaries, the routine waivers of copayments and deductibles offered to patients covered by commercial payors may implicate applicable state laws related to, among other things, unlawful schemes to defraud, excessive fees for services, tortious interference with patient contracts and statutory or common law fraud. To the extent our patient assistance programs or other discount policies are found to be inconsistent with applicable laws, we may be required to restructure or discontinue such programs, or be subject to other significant penalties.
To enforce compliance with the federal laws, the DOJ has recently increased its scrutiny of interactions between health care companies and health care providers, which has led to a number of investigations, prosecutions, convictions and settlements in the health care industry. Dealing with investigations can be time and resource consuming and can divert management’s attention from the business. In addition, settlements with the DOJ or other law enforcement agencies have forced health care providers to agree to additional compliance and reporting requirements as part of a consent decree or corporate integrity agreement. Any such investigation or settlement could increase our costs or otherwise have an adverse effect on our business.
We are also subject to various state laws and regulations, as well as contractual provisions with commercial payors that prohibit us from submitting inaccurate, incorrect or misleading claims. We cannot be sure that none of our surgical facilities’ claims will ever be challenged. If we were found to be in violation of a state’s laws or regulations, or of a commercial payor contract, we could be forced to discontinue the violative practice and be subject to recoupment actions, fines and criminal penalties, which could have a material adverse effect on our business, prospects, results of operations and financial condition.
All payors are increasingly conducting post-payment audits. For example, CMS has implemented the RAC program, involving Medicare claims audits nationwide, and employs MICs to perform post-payment audits of Medicaid claims and identify overpayments. In addition to RACs and MICs, the state Medicaid agencies and other contractors have increased their review activities. We are regularly subject to these external audits and we also perform both internal and third-party audits and monitoring.
Although all other repayments requested to date as a result of RAC, MIC and ZPIC audits have not been material to our Company, we are unable to quantify the suspended payments and aggregate financial impact of these audits on our facilities given the pending appeals and uncertainty about the extent of future audits and whether the underlying conduct could be considered systemic. As such, the resolution of these audits could have a material adverse effect on our business, prospects, results of operations and financial condition.
On October 23, 2017, the Company received a series of civil investigative demands ("CIDs") from the federal government under the FCA for documents and information dating back to January 1, 2010 relating to the medical necessity of certain drug tests conducted by the Company’s physicians and submitted to laboratories owned and operated by the Company. In addition, the Company was informed by CMS that payments to its diagnostic laboratory, Logan Laboratories, were suspended for a period of time, pending further investigations by CMS. CMS lifted the suspension as of December 18, 2019. On January 23, 2020, the United States District Court for the Middle District of Florida unsealed the Complaint in the case of Cho et al. ex rel. United States v. Surgery Partners et al., which we understand to be related to the investigation that gave rise to the CIDs.
The Company has been providing information to the government in response to the CIDs and currently has a non-binding agreement in principle with the DOJ on the financial terms of a settlement with the goal of resolving these matters. The Company previously recorded a litigation-related charge of $46.0 million relating to an anticipated resolution of claims the government could assert arising out of these matters on the consolidated statements of operations for the year ended December 31, 2018. In addition, as part of any resolution of this investigation, the government may request that laboratories owned and operated by the Company enter into a corporate integrity agreement with the Office of Inspector General ("OIG"), which would impose additional compliance and related costs in the future. Until this matter is finally resolved, there can be no assurance that the amount the Company has reserved will be sufficient to cover the Company’s losses related to this matter. Losses could increase or decrease depending on a number of factors, including whether or not a settlement is reached, the terms of the settlement, the parties to the settlement and whether any potential excluded party seeks indemnification from the Company, the cost of complying with
30
the terms of the settlement, including potential monitoring fees related to any potential corporate integrity agreement, and other factors. For additional information, please refer to Note 14. Commitments and Contingencies to our audited financial statements included elsewhere in the report.
Failure to comply with Medicare’s conditions for coverage and conditions of participation may result in loss of program payment or other governmental sanctions.
To participate in and receive payment from the Medicare program, our facilities must comply with regulations promulgated by CMS. These regulations, known as "conditions for coverage" for ASCs and "conditions of participation" for hospitals, set forth specific requirements with respect to, among other things, the facility’s physical plant, equipment, personnel and standards of medical care. All of our surgery centers and surgical hospitals are certified to participate in the Medicare program. As such, these facilities are subject to on-site, unannounced surveys by state survey agencies working on behalf of CMS, which may lead to deficiency citations requiring remedy with appropriate action plans. Failure to comply with Medicare’s conditions for coverage or conditions of participation may result in loss of payment or other governmental sanctions, including termination from participation in the Medicare program. We have established ongoing quality assurance activities to monitor our facilities’ compliance with these conditions and respond to surveys, but we cannot be sure that our facilities are or will always remain in full compliance with the requirements. In addition, pending a determination regarding our compliance with these conditions, payment to us may be suspended and we may be required to devote significant time, effort and expense to demonstrate satisfactory compliance.
Our facilities could face decreased Medicare payments if they fail to report and meet various quality metrics.
The Medicare program presently requires hospitals and ASCs to report performance data on a variety of quality metrics. Facilities that fail to report are penalized with reduced Medicare payments. Additionally, payments to hospitals are adjusted based on the hospital’s performance on these quality measures. A substantial portion of hospital payment is at risk depending on its individual performance relative to benchmarks and other hospitals’ performance. There is a substantial risk that our Medicare payments could be reduced if our hospitals fail to perform adequately on these measures. Additionally, there is a risk that Medicare payments could be reduced if our facilities (hospitals and ASCs) fail to adequate report data as required by CMS. ASC payments are not yet adjusted based on performance against quality measures, but there is a substantial risk that Congress may soon link ASC Medicare payments to actual performance, in addition to reporting.
If the public performance data becomes a primary factor in determining where patients choose to receive care, and if competing hospitals and ASCs have better results than our facilities on those measures, our patient volumes could decline.
Our use and disclosure of personally identifiable information, including health information, is subject to federal and state privacy and security regulations, and our failure to comply with those regulations or to adequately secure the information we hold could result in significant liability or reputational harm.
HIPAA as well as numerous other federal and state laws and regulations, govern the collection, dissemination, use, privacy, security, confidentiality, integrity and availability of personally identifiable information ("PII"), including protected health information ("PHI") by covered entities such as us. Ongoing implementation of administrative, physical and technical safeguards, maintenance of policies and procedures governing use and disclosure of PHI, and oversight of compliance with HIPAA requirements involves significant time, effort and expense. While we undertake substantial efforts to secure the PHI we maintain, use and disclose in electronic form, a cyber-attack or other intrusion that bypasses our information security systems causing an information security breach, loss of protected health information or other data subject to privacy laws or a material disruption of our operational systems could result in a material adverse impact on our business, along with potentially substantial fines and penalties.
HIPAA also requires our surgical facilities to use standard transaction code sets and identifiers for certain standardized health care transactions, including billing and other claim transactions. We have undertaken significant efforts involving substantial time and expense to implement these requirements, and we anticipate that continual time and expense will be required to submit standardized transactions and to ensure that any newly acquired facilities can submit HIPAA-compliant transactions.
HIPAA requires covered entities to report breaches of unsecured protected health information to affected individuals without unreasonable delay and in no case later than 60 days after the discovery of the breach by the covered entity or its agents. Notification must also be made to HHS and, in certain situations involving large breaches, to the media. The HIPAA rules created a presumption that all non-permitted uses or disclosures of unsecured protected health information are breaches. HIPAA imposes mandatory civil and criminal penalties for violations of its requirements ranging up to $50,000 per violation, with a maximum civil penalty of $1.5 million in a calendar year for violations of the same requirement. However, a single breach incident can result in violations of multiple requirements, resulting in possible penalties well in excess of $1.5 million. In addition, the HITECH Act authorized state attorneys general to bring civil actions seeking either an injunction or damages in response to violations of HIPAA privacy and security regulations that threaten the privacy of state residents.
HIPAA also authorizes state attorneys general to bring civil actions seeking either an injunction or damages in response to violations of HIPAA privacy and security regulations that threaten the privacy of state residents. While HIPAA does not create a private right of action allowing individuals to sue us in civil court for violations of HIPAA’s requirements, its standards have been used as a basis for the duty of care in state civil suits, such as those for negligence or recklessness in the handling of PHI. In addition, HIPAA mandates that the Secretary of HHS conduct periodic compliance audits of HIPAA covered entities such as us.
In addition, many states in which we operate may impose laws that are more protective of the privacy and security of PII than HIPAA. Where these state laws are more protective than HIPAA, we have to comply with their stricter provisions. Only some of these state laws impose
31
fines and penalties upon violators, but some may afford private rights of action to individuals who believe their PII has been misused. California’s patient privacy laws, for example, provide for penalties of up to $250,000 and permit injured parties to sue for damages. Both state and federal laws are subject to modification or enhancement of privacy protection at any time. Our facilities will continue to remain subject to any federal or state privacy-related laws that are more restrictive than the privacy regulations issued under HIPAA. These statutes vary and could impose additional requirements on us and more severe penalties for disclosures of confidential health information. New health information standards could have a significant effect on the manner in which we do business, and the cost of complying with new standards could be significant. We may not remain in compliance with the diverse privacy requirements in all of the jurisdictions in which we do business. If we fail to comply with HIPAA or similar state laws, we could incur substantial civil monetary or criminal penalties.
If we are unable to integrate and operate our information systems effectively or implement new systems and processes, our operations could be disrupted.
Our operations depend significantly on effective information systems, which require continual maintenance, upgrading and enhancement to meet our operational needs. Any system failure or integration delay that causes an interruption in service or availability of our systems could adversely affect operations or delay the collection of revenue. Moreover, we use the development and implementation of sophisticated and specialized technology to improve our profitability, and our acquired surgical centers and hospitals will require frequent transitions and integration of various information systems. If we are unable to properly integrate other information systems or expand our current information systems it may have an adverse effect on our ability to obtain new business, retain existing business and maintain or increase our profit margins and we could suffer, among other things, operational disruptions, disruptions in cash flows and increases in administrative expenses.
State efforts to regulate the construction, acquisition or expansion of health care facilities could prevent us from acquiring additional surgical facilities, renovating our existing facilities or expanding the breadth of services we offer.
Some states require prior approval for the construction, acquisition or expansion of health care facilities or expansion of the services the facilities offer. In giving approval, these states consider the need for additional or expanded health care facilities or services, as well as the financial resources and operational experience of the potential new owners of existing health care facilities. In many of the states in which we currently operate, certificates of need must be obtained for capital expenditures exceeding a prescribed amount, changes in capacity or services offered and various other matters. The remaining states in which we now or may in the future operate may adopt similar legislation. Our costs of obtaining a certificate of need could be significant, and we cannot assure you that we will be able to obtain the certificates of need or other required approvals for additional or expanded surgical facilities or services in the future. In addition, at the time we acquire a surgical facility, we may agree to replace or expand the acquired facility. If we are unable to obtain required approvals, we may not be able to acquire additional surgical facilities, expand health care services we provide at these facilities or replace or expand acquired facilities.
If antitrust enforcement authorities conclude that our market share in any particular market is too concentrated, that our or our health system partners’ commercial payor contract negotiating practices are illegal, or that we other violate antitrust laws, we could be subject to enforcement actions that could have a material adverse effect on our business, prospects, results of operations and financial condition.
The federal government and most states have enacted antitrust laws that prohibit certain types of conduct deemed to be anti-competitive. These laws prohibit price fixing, concerted refusal to deal, market monopolization, price discrimination, tying arrangements, acquisitions of competitors and other practices that have, or may have, an adverse effect on competition. Violations of federal or state antitrust laws can result in various sanctions, including criminal and civil penalties. Antitrust enforcement in the health care industry is currently a priority of the Federal Trade Commission (the "FTC"). We believe we are in compliance with federal and state antitrust laws, but courts or regulatory authorities may reach a determination in the future that could have a material adverse effect on our business, prospects, results of operations and financial condition.
The health care laws and regulation to which we are subject is constantly evolving and may change significantly in the future.
The regulation applicable to our business and to the health care industry generally to which we are subject is constantly in a state of flux. While we believe that we have structured our agreements and operations in material compliance with applicable health care laws and regulations, there can be no assurance that we will be able to successfully address changes in the current regulatory environment. We believe that our business operations materially comply with applicable health care laws and regulations. However, some of the health care laws and regulations applicable to us are subject to limited or evolving interpretations, and a review of our business or operations by a court, law enforcement or a regulatory authority might result in a determination that could have a material adverse effect on us. Furthermore, the health care laws and regulations applicable to us may be amended or interpreted in a manner that could have a material adverse effect on our business, prospects, results of operations and financial condition.
Risks Related to Our Common Stock
We are a "controlled company" within the meaning of Nasdaq rules and, therefore, we qualify for, and currently rely on, exemptions from certain corporate governance requirements. Our stockholders do not have the same protections afforded to stockholders of companies that are subject to such requirements.
As of
December 31, 2019
, Bain Capital controlled a majority of the voting power of our outstanding common stock. As a result, we are a "controlled company" within the meaning of the corporate governance standards of Nasdaq. Under these rules, a company of which more than a majority of the voting power is held by an individual, group or another company is a "controlled company" and may elect not to comply
32
with certain corporate governance requirements including:
|
•
|
the requirement that a majority of the board of directors consist of independent directors;
|
|
•
|
the requirement that we have a nominating/corporate governance committee that is composed entirely of independent directors with a written charter addressing the committee’s purpose and responsibilities; and
|
|
•
|
the requirement that we have a compensation committee that is composed entirely of independent directors with a written charter addressing the committee’s purpose and responsibilities.
|
As of
December 31, 2019
, we have availed ourselves of certain of these exemptions.
For example, we did not have a majority of independent directors for the entire period covered by this report (and may, in the future, have less than a majority of independent directors) and we do not have a nominating and corporate governance committee. Accordingly, our stockholders will not have the same protections afforded to stockholders of companies that are subject to all of the corporate governance requirements of Nasdaq.
There can be no assurance as to the period of time during which we will remain a "controlled company".
Our controlling stockholder has significant influence over us, including control over decisions that require the approval of stockholders, which could limit our stockholders’ ability to influence the outcome of key transactions, including a change of control.
As of
December 31, 2019
, we were controlled by Bain Capital. As of that time, Bain Capital beneficially owned approximately
67%
of our outstanding common stock. For as long as Bain Capital continues to control a majority of the voting power of our common stock, it will be able to direct the election of all of the members of our board of directors and could exercise a controlling influence over our business and affairs, including any determinations with respect to mergers or other business combinations, the acquisition or disposition of assets, the incurrence of indebtedness, the issuance of any additional common stock or other equity securities, the repurchase or redemption of common stock and the payment of dividends. Similarly, Bain Capital will have the power to determine matters submitted to a vote of our stockholders without the consent of our other stockholders, will have the power to prevent a change in our control and could take other actions that might be favorable to it. Even if Bain Capital ceases to beneficially own a majority of the voting power of our common stock, it will continue to be able to strongly influence or effectively control our decisions.
Our stock price could be volatile, and, as a result, our stockholders may not be able to resell their shares at or above the price paid for them.
Since our initial public offering, the price of our common stock as reported on The Nasdaq Global Select Market has ranged from a low of $5.38 on August 15, 2019 to a high of $24.05 on June 28, 2017. The price of our common stock could be subject to fluctuations in response to a number of factors, including those described elsewhere in this report and others such as:
|
•
|
variations in our operating performance and the performance of our competitors;
|
|
•
|
actual or anticipated fluctuations in our quarterly or annual operating results;
|
|
•
|
publication of research reports by securities analysts about us or our competitors or our industry;
|
|
•
|
announcements by us, our competitors or our vendors of significant contracts, acquisitions, joint marketing relationships, joint ventures or capital commitments;
|
|
•
|
our failure or the failure of our competitors to meet analysts’ projections or guidance that we or our competitors may give to the market;
|
|
•
|
strategic decisions by us or our competitors, such as acquisitions, divestitures, spin-offs, joint ventures, strategic investments or changes in business strategy;
|
|
•
|
the passage of legislation or other regulatory developments affecting us or our industry;
|
|
•
|
our limited public float;
|
|
•
|
speculation in the press or investment community;
|
|
•
|
changes in accounting principles;
|
|
•
|
terrorist acts, acts of war or periods of widespread civil unrest;
|
|
•
|
natural disasters and other calamities; and
|
|
•
|
changes in general market and economic conditions.
|
Securities class action litigation is often initiated against companies following periods of volatility in their stock price. This type of litigation could result in substantial costs and divert our management’s attention and resources, and could also require us to make substantial payments to satisfy judgments or to settle litigation. For example, see Part I, Item 3. Legal Proceedings - Stockholder Litigation.
33
Provisions in the certificate of designation governing our preferred stock and in our charter documents and Delaware law may deter takeover efforts that could be beneficial to stockholder value.
Our certificate of incorporation and by-laws, the certificate of designation governing our preferred stock and Delaware law contain provisions that could make it harder for a third party to acquire us, even if doing so might be beneficial to our stockholders. The provisions in our organizational documents include a classified board of directors and limitations on actions by our stockholders. In addition, our board of directors has the right to issue additional preferred stock without stockholder approval that could be used to dilute a potential hostile acquiror. Our certificate of incorporation also imposes some restrictions on mergers and other business combinations between us and any holder of 15.0% or more of our outstanding common stock other than affiliates of Bain Capital. Finally, our 10% Series A Convertible Perpetual Participating Preferred Stock accrues conversion value for each quarter it is outstanding and is subject, under certain circumstances, to a redemption premium, which could significantly increase the cost to a potential acquirer of buying all of the outstanding securities of the Company. As a result of these features, our stockholders may lose their ability to sell their stock for a price in excess of the prevailing market price, and efforts by stockholders to change the direction or management of the Company may be unsuccessful.
Our amended and restated certificate of incorporation designates courts in the State of Delaware as the sole and exclusive forum for certain types of actions and proceedings that may be initiated by our stockholders, which could limit our stockholders’ ability to obtain a favorable judicial forum for disputes with us or our directors, officers or employees.
Our amended and restated certificate of incorporation (the "Certificate of Incorporation") provides that, subject to certain exceptions and to the fullest extent permitted by applicable law, the Court of Chancery of the State of Delaware (the "Court of Chancery") will be the sole and exclusive forum for (i) any derivative action or proceeding brought on our behalf, (ii) any action asserting a claim of breach of a fiduciary duty owed by any of our directors, officers or other employees to us or our stockholders, (iii) any action asserting a claim against us arising pursuant to any provision of the General Corporation Law of the State of Deleware, our Certificate of Incorporation or our amended and restated bylaws or (iv) any other action asserting a claim against us that is governed by the internal affairs doctrine (each, a "Covered Proceeding"). In addition, the Certificate of Incorporation states that this exclusive forum provision does not apply to actions in which the Court of Chancery concludes that an indispensable party is not subject to the jurisdiction of the Delaware courts and can be subject to the jurisdiction of another court within the United States. Our Certificate of Incorporation also provides that if any action, the subject matter of which is a Covered Proceeding, is filed in a court other than the specified Delaware courts without the approval of our board of directors (each, a "Foreign Action"), the claiming party will be deemed to have consented to (i) the personal jurisdiction of the specified Delaware courts in connection with any action brought in any such courts to enforce the exclusive forum provision described above and (ii) having service of process made upon such claiming party in any such enforcement action by service upon such claiming party’s counsel in the Foreign Action as agent for such claiming party. It is our current view that in some circumstances, such as in respect of actions arising under the Securities Act of 1933, as amended, or the Securities Exchange Act of 1934, as amended (the "Exchange Act"), the Court of Chancery may decline to exercise jurisdiction over such actions. Under such circumstances, our Certificate of Incorporation holds that such actions may properly be filed in a court other than the Court of Chancery. Any person or entity purchasing or otherwise acquiring any interest in shares of our stock shall be deemed to have notice of and to have consented to these provisions in our Certificate of Incorporation. These provisions may limit a stockholder’s ability to bring a claim in a judicial forum that it finds favorable for disputes with us or our directors, officers or other employees, which may discourage such lawsuits against us and our directors, officers and employees.
If we identify a material weakness in our internal control over financial reporting, then it could, if not remediated, result in material misstatements in our financial statements.
As a public company, we are required to evaluate our internal controls over financial reporting and to comply with Section 404 of the Sarbanes-Oxley Act. In connection with management's assessment of our internal control over financial reporting as of December 31, 2017, management recognized certain control deficiencies in our internal control over financial reporting that resulted in material weaknesses as of December 31, 2017. Although we successfully remediated these control deficiencies as of December 31, 2018, there can be no assurance that additional material weaknesses in internal control will not be discovered or occur in the future. If we identify a material weakness, then our consolidated financial statements may contain material misstatements and we could be required to restate our financial results, or the accuracy of our financial reporting could be adversely affected resulting in reputational harm, distractions to management and our board of directors, and disruptions to our business.
34
Item 1B. Unresolved Staff Comments
None.
Item 2. Properties
Our corporate headquarters is located in Brentwood, Tennessee, where we currently lease approximately 85,000 square feet of office space pursuant to an agreement with an initial term expiring December 31, 2027. Our surgical facilities typically are located on real estate leased by the partnership or limited liability company that operates the facility. Most of our ASC facilities range in size from 8,000 to 12,000 square feet, and are specifically tailored to meet the needs of physician-partners and their specialties. Of our
128
surgical facilities,
123
utilize leased real property. These leases generally have initial terms of ten years, but range from 2 to 15 years. Most of the leases contain options to extend the lease period for up to ten additional years. We generally guarantee the lease obligations of the partnerships and limited liability companies that own our surgical facilities. We expect to be able to renew or replace a substantial majority of these leases on substantially similar terms as they come due. We believe these spaces are sufficient and adequate for our needs at this time.
Item 3. Legal Proceedings
Stockholder Litigation
. On December 4, 2017, a purported Company stockholder filed an action in the Delaware Court of Chancery (the "Delaware Action"). That action is captioned Klein v. H.I.G. Capital, L.L.C., et al., C.A. No. 2017-0862. The plaintiff in the Delaware Action asserted claims against (i) certain current and former members of the Company’s Board of Directors (together, the "Directors"); (ii) H.I.G. Capital, LLC and certain of its affiliates (collectively, "H.I.G."); and (iii) Bain Capital Private Equity, L.P. and certain of its affiliates (collectively, "Bain Capital" and, together with the Directors and H.I.G., the "Defendants"). The plaintiff asserted derivative claims on behalf of the Company, which is a nominal defendant in the Delaware Action, as well as putatively direct claims on behalf of a purported class of Company stockholders. The plaintiff in the Delaware Action asserted that the Defendants breached their fiduciary duties in connection with the transactions in which (i) the Company acquired National Surgical Healthcare; (ii) Bain Capital acquired preferred equity in the Company; and (iii) Bain Capital acquired H.I.G.'s equity stake in the Company, and that, in the alternative, Bain Capital aided and abetted those purported breaches. The plaintiff also asserted an unjust enrichment claim against Bain Capital.
On January 2, 2018, the Defendants moved to dismiss the plaintiff’s complaint. On December 19, 2018, the Court of Chancery issued a decision on that motion. Following that decision, all of the Directors have been dismissed from the Delaware Action. The Court did not dismiss the plaintiff’s breach of fiduciary duty claim against H.I.G. or the aiding and abetting claim asserted against Bain Capital. However, the Court dismissed the plaintiff’s breach of fiduciary duty and unjust enrichment claims against Bain Capital. In addition, the Court dismissed all of the plaintiff’s claims that were asserted on behalf of a putative class of Company stockholders. Accordingly, all of the plaintiff’s remaining claims in the Delaware Action are asserted derivatively on the Company’s behalf.
Government Investigation.
On October 23, 2017, the Company received several civil investigative demands ("CIDs") from the federal government under the FCA for documents and information dating back to January 1, 2010 relating to the medical necessity of certain drug tests conducted by the Company’s physicians and submitted to laboratories owned and operated by the Company. In addition, the Company was informed by CMS that payments to its diagnostic laboratory, Logan Laboratories, were suspended for a period of time, pending further investigation by CMS. CMS lifted the suspension as of December 18, 2019. On January 23, 2020, the United States District Court for the Middle District of Florida unsealed the Complaint in the case of Cho et al. ex rel. United States v. Surgery Partners et al., which we understand to be related to the investigation that gave rise to the CIDs.
The Company has been providing information to the government in response to the CIDs and currently has a non-binding agreement in principle with the DOJ on the financial terms of a settlement with the goal of resolving these matters. We previously recorded a litigation-related charge of $46.0 million relating to these matters on the consolidated statements of operations for the year ended December 31, 2018. We continue to believe that this reserve is sufficient to cover a potential resolution with the government relating to these matters, including legal expenses relating to the settlement that have not previously been recorded in our operating expenses. The ultimate timing, amount and/or final terms of any such resolution may differ materially from those anticipated or we may not be able to reach a resolution at all. It is reasonably possible that we will incur additional losses above the amount reserved, but we are not able to estimate such amounts at this time. See Item 1A "Risk Factors" elsewhere in this report under the heading "Risk Factors - Risks Related to Government Regulation -
Companies within the health care industry, including us, continue to be the subject of federal and state audits and investigations, including actions for false and other improper claims
."
Other Litigation.
In addition, we are, from time to time, subject to claims and suits, or threats of claims or suits, relating to our business, including claims for damages for personal injuries, breach of management contracts and employment related claims. In certain of these actions, plaintiffs request payment for damages, including punitive damages, which may not be covered by insurance or may otherwise have a material adverse effect on our business or results of operations.
See Note 14. Commitments and Contingencies for additional information regarding pending legal proceedings, which information is incorporated herein by reference.
35
Item 4. Mine Safety Disclosures
Not applicable.
36
PART II
Item 5. Market for Registrant’s Common Equity, Related Stockholder Matters and Issuer Purchases of Equity Securities
Market Information for Common Stock
Our common stock trades under the symbol "SGRY" on the Nasdaq Global Select Market.
Stockholders
As of February 25, 2020, there were 125 holders of record of our common stock. The actual number of common stockholders is greater than the number of record holders, and includes stockholders who are beneficial owners, but whose shares are held in street name by brokers and other nominees. This number of holders of record also does not include stockholders whose shares may be held in trust by other entities.
Dividends
We have never declared or paid a cash dividend on our common stock, and have no current plans to declare or pay any cash dividends for the foreseeable future. Any decision to declare and pay dividends in the future will be made at the discretion of our Board of Directors and will depend on, among other things, our results of operations, financial condition, cash requirements, contractual restrictions and other factors that our Board of Directors may deem relevant. In addition, our ability to pay dividends may be limited by covenants of our existing and future outstanding indebtedness we or our subsidiaries incur, including our credit facility. Additionally, because we are a holding company, we would depend on distributions from our subsidiaries to fund any potential dividends.
Stock Performance Graph
The following graph compares the cumulative total shareholder return on our common stock with the cumulative total returns of the Nasdaq Composite Index and the Dow Jones U.S. Health Care Providers Index. The graph begins on October 1, 2015, the day our shares were initially sold to the public. The comparison assumes $100 was invested in our common stock and in each of the indices on October 1, 2015 and assumes the reinvestment of dividends, if any.
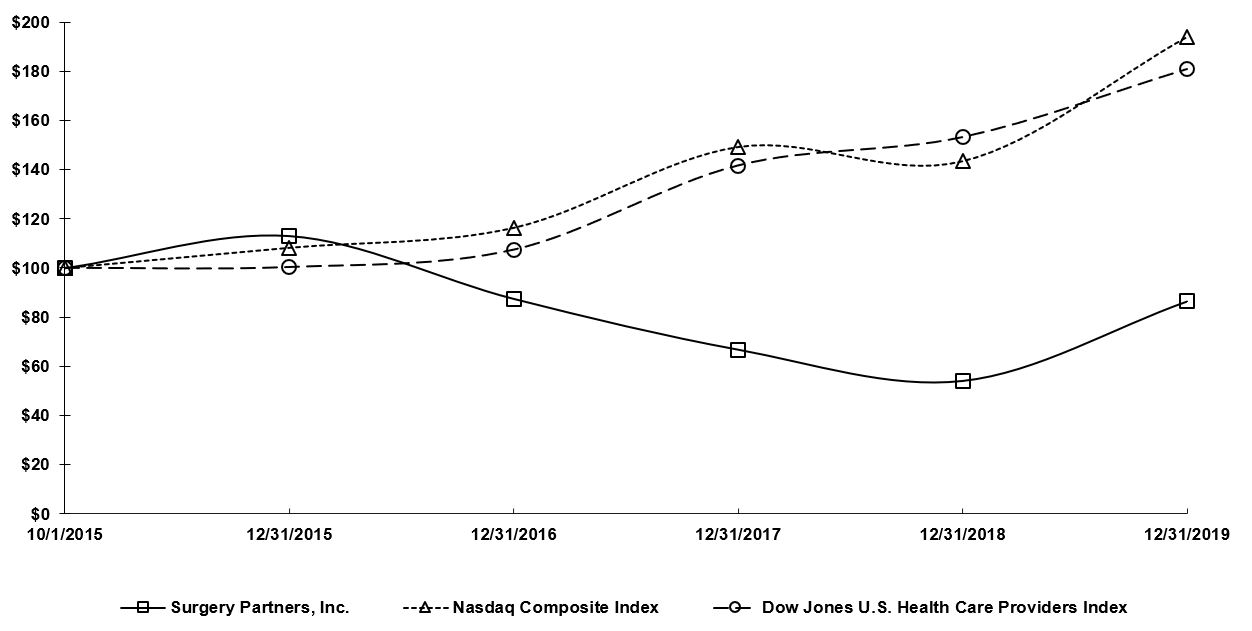
|
10/1/2015
|
12/31/2015
|
12/31/2016
|
12/31/2017
|
12/31/2018
|
12/31/2019
|
||||||||||||||||||
|
Surgery Partners, Inc.
|
$
|
100.00
|
|
$
|
113.14
|
|
$
|
87.52
|
|
$
|
66.81
|
|
$
|
54.06
|
|
$
|
86.44
|
|
|||||
|
Nasdaq Composite Index
|
$
|
100.00
|
|
$
|
108.22
|
|
$
|
116.34
|
|
$
|
149.20
|
|
$
|
143.40
|
|
$
|
193.91
|
|
|||||
|
Dow Jones U.S. Health Care Providers Index
|
$
|
100.00
|
|
$
|
100.34
|
|
$
|
107.40
|
|
$
|
141.60
|
|
$
|
153.10
|
|
$
|
180.73
|
|
|||||
This graph is furnished and not filed with the SEC, is not soliciting material under the Exchange Act and shall not be incorporated by reference into any such filings, irrespective of any general incorporation contained in such filing. The stock performance shown on the graph represents historical stock performance and is not necessarily indicative of future stock price performance.
37
Recent Purchases of Equity Securities by the Issuer and Affiliated Purchasers
On December 15, 2017, our Board of Directors authorized a share repurchase program of up to $50.0 million of our issued and outstanding common stock from time to time. The timing and size of repurchases will be determined based on market conditions and other factors. The authorization does not obligate us to repurchase any shares and we may repurchase shares of common stock at any time without prior notice. The share repurchases will be made in accordance with applicable securities laws in open market or privately negotiated transactions. The authorization does not have a specified expiration date, and the share repurchase program may be suspended, recommenced or discontinued at any time or from time to time without prior notice.
The following table presents information related to our repurchases of common stock for the periods indicated:
|
Total Number of Shares Purchased
(1)
|
Average Price Paid per Share
|
Total Number of Shares Purchased as Part of Publicly Announced Programs
|
Approximate Dollar Value of Shares that May Yet Be Purchased Under the Program
|
|||||||||||
|
(in thousands, except share and per share amounts)
|
||||||||||||||
|
October 1, 2019 to October 31, 2019
|
—
|
|
$
|
—
|
|
—
|
|
$
|
46,009
|
|
||||
|
November 1, 2019 to November 30, 2019
|
—
|
|
$
|
—
|
|
—
|
|
$
|
46,009
|
|
||||
|
December 1, 2019 to December 31, 2019
|
18,332
|
|
$
|
15.65
|
|
—
|
|
$
|
46,009
|
|
||||
|
Total
|
18,332
|
|
$
|
15.65
|
|
—
|
|
$
|
46,009
|
|
||||
|
(1)
|
Shares delivered to or withheld by us in connection with employee payroll tax withholding upon exercise or vesting of stock awards.
|
38
Item 6. Selected Financial Data
The table below contains selected consolidated financial and other data that has been derived from our audited consolidated financial statements for each of the years in the five-year period ended
December 31, 2019
. The timing of acquisitions and divestitures completed during the years presented affects the comparability of the selected financial data. The following table covers periods both prior to and subsequent to the Transactions. As discussed in the notes to the consolidated financial statements included in this report, in connection with the change of control effected by the Private Sale, we elected to apply "pushdown" accounting. We have presented the information for the year ended December 31, 2017 on a Predecessor period and Successor period combined basis (each as defined in Note 1. "Organization and Summary of Accounting Policies" of our consolidated financial statements) to facilitate meaningful comparisons of selected consolidated financial and other data to the prior year periods. The following selected consolidated financial and other data should be read in conjunction with "Management’s Discussion and Analysis of Financial Condition and Results of Operations" in Item 7 and our consolidated financial statements and the related notes included elsewhere in this report. The results presented below are not necessarily indicative of future results (dollars in millions, except per share amounts):
|
Year Ended December 31,
|
||||||||||||||||||||
|
2019
|
2018
|
2017
|
2016
|
2015
|
||||||||||||||||
|
Statements of Operations Data:
|
||||||||||||||||||||
|
Revenues
(1)
|
$
|
1,831.4
|
|
$
|
1,771.5
|
|
$
|
1,341.2
|
|
$
|
1,145.4
|
|
$
|
959.9
|
|
|||||
|
Net income (loss)
|
$
|
45.1
|
|
$
|
(95.6
|
)
|
$
|
28.7
|
|
$
|
85.1
|
|
$
|
72.8
|
|
|||||
|
Less: Net income attributable to non-controlling interests
|
(119.9
|
)
|
(110.1
|
)
|
(81.7
|
)
|
(75.6
|
)
|
(71.4
|
)
|
||||||||||
|
Net (loss) income attributable to Surgery Partners, Inc.
|
(74.8
|
)
|
(205.7
|
)
|
(53.0
|
)
|
9.5
|
|
1.4
|
|
||||||||||
|
Less: Amounts attributable to participating securities
(2)
|
(35.7
|
)
|
(32.4
|
)
|
(26.0
|
)
|
—
|
|
—
|
|
||||||||||
|
Net (loss) income attributable to common stockholders
|
$
|
(110.5
|
)
|
$
|
(238.1
|
)
|
$
|
(79.0
|
)
|
$
|
9.5
|
|
$
|
1.4
|
|
|||||
|
Per common share data:
|
||||||||||||||||||||
|
Basic
|
$
|
(2.29
|
)
|
$
|
(4.96
|
)
|
$
|
(1.64
|
)
|
$
|
0.20
|
|
$
|
0.04
|
|
|||||
|
Diluted
(3)
|
$
|
(2.29
|
)
|
$
|
(4.96
|
)
|
$
|
(1.64
|
)
|
$
|
0.20
|
|
$
|
0.04
|
|
|||||
|
Consolidated Balance Sheets Data:
|
||||||||||||||||||||
|
Working capital
|
$
|
127.4
|
|
$
|
239.0
|
|
$
|
260.2
|
|
$
|
175.2
|
|
$
|
129.7
|
|
|||||
|
Total assets
|
5,018.9
|
|
4,676.3
|
|
4,622.8
|
|
2,305.0
|
|
2,104.4
|
|
||||||||||
|
Long-term debt, less current maturities
|
2,524.7
|
|
2,270.9
|
|
2,130.6
|
|
1,414.4
|
|
1,228.1
|
|
||||||||||
|
Redeemable preferred stock
|
395.0
|
|
359.3
|
|
330.8
|
|
—
|
|
—
|
|
||||||||||
|
Total stockholders’ equity
|
983.4
|
|
1,098.9
|
|
1,336.6
|
|
324.7
|
|
297.9
|
|
||||||||||
|
Statements of Cash Flows Data:
|
||||||||||||||||||||
|
Net cash provided by operating activities
|
$
|
129.5
|
|
$
|
144.6
|
|
$
|
120.9
|
|
$
|
125.2
|
|
$
|
84.5
|
|
|||||
|
Net cash used in investing activities
|
(85.2
|
)
|
(128.9
|
)
|
(783.4
|
)
|
(184.7
|
)
|
(134.8
|
)
|
||||||||||
|
Net cash (used in) provided by financing activities
|
(135.9
|
)
|
(6.3
|
)
|
767.7
|
|
71.3
|
|
33.4
|
|
||||||||||
|
Other Data:
|
||||||||||||||||||||
|
Adjusted EBITDA
(4)
|
$
|
258.6
|
|
$
|
234.8
|
|
$
|
164.3
|
|
$
|
179.3
|
|
$
|
158.1
|
|
|||||
|
Adjusted EBITDA as a % of revenues
|
14.1
|
%
|
13.3
|
%
|
12.3
|
%
|
15.7
|
%
|
16.5
|
%
|
||||||||||
|
Number of surgical facilities as of the end of period
(5)
|
128
|
|
123
|
|
124
|
|
104
|
|
101
|
|
||||||||||
|
Number of consolidated surgical facilities included as of the end of period
|
107
|
|
106
|
|
108
|
|
94
|
|
90
|
|
||||||||||
|
(1)
|
Revenues in 2019 and 2018 reflect changes related to adoption of ASU 2014-09 as discussed in Note 1. "Organization and Summary of Accounting Policies."
|
|
(2)
|
Includes accrued dividends for the Series A Preferred Stock for the years ended December 31, 2019, 2018 and 2017. Includes a mark to redemption adjustment for the Series A Preferred Stock for the year ended December 31. 2017. There were no participating securities during 2016 and 2015.
|
|
(3)
|
The impact of potentially dilutive securities for the years ended December 31, 2019, 2018, and 2017 was not considered because the effect would be anti-dilutive in each of those periods.
|
|
(4)
|
See Item 7. "Management’s Discussion and Analysis of Financial Condition and Results of Operations - Certain non-GAAP Metrics" for a table showing the reconciliation of Adjusted EBITDA to income before income taxes.
|
|
(5)
|
Includes surgical facilities that we manage but in which we have no ownership interest.
|
39
SURGERY PARTNERS, INC.
MANAGEMENT'S DISCUSSION AND ANALYSIS OF FINANCIAL CONDITION
AND RESULTS OF OPERATIONS
Item 7. Management's Discussion and Analysis of Financial Condition and Results of Operations
The following discussion and analysis of our financial condition and results of operations should be read in conjunction with Item 6. "Selected Financial Data" and our audited consolidated financial statements and related notes included elsewhere in this Annual Report. This discussion contains forward-looking statements that involve risks and uncertainties. For additional information regarding certain of the risks and uncertainties that affect our business and the industry in which we operate, please see Item 1A. "Risk Factors" and Item 9A. "Controls and Procedures" found elsewhere in this report. Unless the context otherwise indicates, the terms "Surgery Partners," "we," "us," "our" or the "Company," as used herein, refer to Surgery Partners, Inc. and its subsidiaries. Unless the context implies otherwise, the term "affiliates" means direct and indirect subsidiaries of Surgery Partners, Inc., and partnerships and joint ventures in which such subsidiaries are partners. The terms "facilities" or "hospitals" refer to entities owned and operated by affiliates of Surgery Partners, Inc. and the term "employees" refers to employees of affiliates of Surgery Partners, Inc.
The following discussion and analysis of our financial condition and results of operations covers periods both prior to and subsequent to the Transactions (as defined in Item 1. Business above). Accordingly, the discussion and analysis of historical periods do not reflect the significant impact the Transactions had on the Company. As discussed in the notes to the consolidated financial statements included in this report, in connection with the change of control effected by the Private Sale, we elected to apply "pushdown" accounting. We have presented the information for the year ended December 31, 2017 on a Predecessor period and Successor period combined basis (each as defined in Note 1. "Organization and Summary of Accounting Policies" of our consolidated financial statements) to facilitate meaningful comparisons of operating results to the prior year period. You should read the following discussion together with our historical financial statements and related notes included elsewhere herein.
Executive Overview
As of
December 31, 2019
, we owned and operated a national network of surgical facilities, physician practices and a suite of ancillary services in
30
states. Our surgical facilities, which include ASCs and surgical hospitals, primarily provide non-emergency surgical procedures across many specialties, including, among others, gastroenterology ("GI"), general surgery, ophthalmology, orthopedics and pain management. Our surgical hospitals also provide services, such as diagnostic imaging, laboratory, obstetrics, oncology, cardiology, pharmacy, physical therapy and wound care. Our portfolio of outpatient surgical facilities is complemented by our suite of ancillary services, which support our physicians in providing high quality and cost-efficient patient care. As a result, we believe we are well positioned to benefit from rising consumerism and payors’ and patients’ focus on the delivery of high quality care and superior clinical outcomes in the lowest cost setting.
As of
December 31, 2019
, we owned or operated, primarily in partnership with physicians, a portfolio of
128
surgical facilities comprised of
112
ASCs and
16
surgical hospitals across
30
states. We owned a majority interest in
85
of the surgical facilities and consolidated
107
of these facilities for financial reporting purposes. During the year ended
December 31, 2019
, approximately
525,000
surgical procedures were performed in our surgical facilities, generating approximately
$1.7 billion
in revenue.
We continue to focus on improving our same-facility performance, selectively acquiring established facilities and developing new facilities. During the year ended
December 31, 2019
, we completed the acquisitions of a surgical facility, a clinic that was merged into an existing facility and a physician practice for an aggregate cash investment of
$20.1 million
, net of cash acquired. In connection with the clinic acquisition in 2019, the Company acquired the remaining non-controlling interests in one of its existing consolidated surgical facilities. As such,
$6.3 million
of the cash consideration for the clinic acquisition was classified as a financing activity and presented in payments related to ownership transactions with non-controlling interest holders in the Consolidated Statements of Cash Flows elsewhere in this Annual Report. Additionally, during the year ended December 31, 2019, we acquired non-controlling interests, primarily in four surgical facilities, for a cash investment of
$15.2 million
. The non-controlling interests were accounted for as equity method investments.
Total revenues for 2019 increased
3.4%
to
$1.83 billion
from
$1.77 billion
in 2018. Same-facility revenues for 2019 increased
7.6%
from 2018, with a
5.5%
increase in revenue per case and a
2.0%
increase in same-facility cases. As a result of our targeted net revenue improvement initiatives, the three months ended December 31, 2019 represented the sixth consecutive quarter of same-facility case volume growth. For 2019, the net loss attributable to common stockholders was
$110.5 million
compared to
$238.1 million
for 2018. Additionally, for 2019, Adjusted EBITDA increased
10.1%
to
$258.6 million
compared to
$234.8 million
for 2018. A reconciliation of non-GAAP financial measures appears below under "Certain Non-GAAP Metrics."
We had cash and cash equivalents of
$92.7 million
and
$112.9 million
of borrowing capacity under our revolving credit facility at December 31, 2019. Net operating cash inflows, including operating cash flows less distributions to non-controlling interests, were
$8.3 million
for 2019.
We are actively monitoring the worldwide outbreak of novel coronavirus, or COVID-19, and planning for any potential impact on our business. For a description of risks relating to COVID-19 or any other pandemic, epidemic or outbreak of contagious disease, see See Item 1A "Risk Factors" elsewhere in this report under the heading "Risk Factors - Risks Related to Our Business and Industry -
A pandemic, epidemic or outbreak of a contagious disease in the markets in which we operate or that otherwise impacts our facilities could adversely impact our revenue, profitability and cash flows
."
40
SURGERY PARTNERS, INC.
MANAGEMENT'S DISCUSSION AND ANALYSIS OF FINANCIAL CONDITION
AND RESULTS OF OPERATIONS (continued)
Revenues
Our revenues consist of patient service revenues and other service revenues. Patient service revenues consist of revenue from our surgical facility services and ancillary services segments. Specifically, patient service revenues include fees for surgical or diagnostic procedures performed at surgical facilities that we consolidate for financial reporting purposes, as well as for patient visits to our physician practices, anesthesia services, pharmacy services and diagnostic screens ordered by our physicians. Other service revenues include management and administrative service fees derived from our non-consolidated facilities that we account for under the equity method, management of surgical facilities and physician practices in which we do not own an interest and management services we provide to physician practices for which we are not required to provide capital or additional assets. Prior to the sale of our optical laboratory in 2018, other revenue also included product sales.
The following table summarizes revenues by service type as a percentage of total revenues:
|
Year Ended December 31,
|
|||||||||
|
2019
|
2018
|
2017
|
|||||||
|
Patient service revenues:
|
|||||||||
|
Surgical facilities revenues
|
94.1
|
%
|
93.6
|
%
|
92.7
|
%
|
|||
|
Ancillary services revenues
|
4.3
|
%
|
4.5
|
%
|
5.7
|
%
|
|||
|
98.4
|
%
|
98.1
|
%
|
98.4
|
%
|
||||
|
Other service revenues:
|
|||||||||
|
Optical services revenues
|
0.2
|
%
|
0.5
|
%
|
0.8
|
%
|
|||
|
Other
|
1.4
|
%
|
1.4
|
%
|
0.8
|
%
|
|||
|
1.6
|
%
|
1.9
|
%
|
1.6
|
%
|
||||
|
Total revenues
|
100.0
|
%
|
100.0
|
%
|
100.0
|
%
|
|||
Payor Mix
The following table sets forth by type of payor the percentage of our patient service revenues generated at the surgical facilities that we consolidate for financial reporting purposes:
|
Year Ended December 31,
|
|||||||||
|
2019
|
2018
|
2017
|
|||||||
|
Private insurance payors
|
53.8
|
%
|
54.6
|
%
|
53.6
|
%
|
|||
|
Government payors
|
38.9
|
%
|
37.6
|
%
|
38.3
|
%
|
|||
|
Self-pay payors
|
2.6
|
%
|
2.9
|
%
|
2.4
|
%
|
|||
|
Other payors
(1)
|
4.7
|
%
|
4.9
|
%
|
5.7
|
%
|
|||
|
Total
|
100.0
|
%
|
100.0
|
%
|
100.0
|
%
|
|||
|
(1)
|
Other is comprised of anesthesia service agreements, auto liability, letters of protection and other payor types.
|
Surgical Case Mix
We primarily operate multi-specialty surgical facilities where physicians perform a variety of procedures in various specialties. We believe this diversification helps to protect us from adverse pricing and utilization trends in any individual procedure type and results in greater consistency in our case volume.
41
SURGERY PARTNERS, INC.
MANAGEMENT'S DISCUSSION AND ANALYSIS OF FINANCIAL CONDITION
AND RESULTS OF OPERATIONS (continued)
The following table sets forth the percentage of cases in each specialty performed at the surgical facilities that we consolidate for financial reporting purposes:
|
Year Ended December 31,
|
|||||||||
|
2019
|
2018
|
2017
|
|||||||
|
Orthopedics and pain management
|
38.3
|
%
|
37.8
|
%
|
34.5
|
%
|
|||
|
Ophthalmology
|
24.8
|
%
|
25.3
|
%
|
27.9
|
%
|
|||
|
Gastrointestinal
|
20.9
|
%
|
21.4
|
%
|
22.3
|
%
|
|||
|
General surgery
|
3.2
|
%
|
3.0
|
%
|
2.7
|
%
|
|||
|
Other
|
12.8
|
%
|
12.5
|
%
|
12.6
|
%
|
|||
|
Total
|
100.0
|
%
|
100.0
|
%
|
100.0
|
%
|
|||
Segment Information
Our business is comprised of three segments: (1) surgical facility services, (2) ancillary facility services and (3) optical services. For more information about the components of each segment, please see Part I, Item 1. Business--Operations included elsewhere in this Annual Report. "All other" primarily consists of the Company's corporate general and administrative functions.
The following tables present financial information for each reportable segment (in millions):
|
Year Ended December 31,
|
||||||||||||
|
2019
|
2018
|
2017
|
||||||||||
|
Revenues:
|
||||||||||||
|
Surgical facility services
|
$
|
1,748.2
|
|
$
|
1,682.4
|
|
$
|
1,253.2
|
|
|||
|
Ancillary services
|
79.4
|
|
79.6
|
|
76.9
|
|
||||||
|
Optical services
|
3.8
|
|
9.5
|
|
11.1
|
|
||||||
|
Total revenues
|
$
|
1,831.4
|
|
$
|
1,771.5
|
|
$
|
1,341.2
|
|
|||
|
Adjusted EBITDA:
|
||||||||||||
|
Surgical facility services
|
$
|
328.9
|
|
$
|
309.5
|
|
$
|
229.7
|
|
|||
|
Ancillary services
|
2.6
|
|
3.0
|
|
(8.8
|
)
|
||||||
|
Optical services
|
1.4
|
|
2.5
|
|
2.9
|
|
||||||
|
All other
|
(74.3
|
)
|
(80.2
|
)
|
(59.5
|
)
|
||||||
|
Total Adjusted EBITDA
(1)
|
$
|
258.6
|
|
$
|
234.8
|
|
$
|
164.3
|
|
|||
|
Supplemental Information:
|
||||||||||||
|
Cash purchases of property and equipment, net:
|
||||||||||||
|
Surgical facility services
|
$
|
65.9
|
|
$
|
34.2
|
|
$
|
23.9
|
|
|||
|
Ancillary services
|
1.1
|
|
0.4
|
|
2.1
|
|
||||||
|
Optical services
|
—
|
|
—
|
|
0.2
|
|
||||||
|
All other
|
6.6
|
|
5.2
|
|
3.4
|
|
||||||
|
Total cash purchases of property and equipment, net
|
$
|
73.6
|
|
$
|
39.8
|
|
$
|
29.6
|
|
|||
|
(1)
|
For a reconciliation of Adjusted EBITDA to income before income taxes as reflected in the audited consolidated statements of operations see "Certain Non-GAAP Metrics" below.
|
42
SURGERY PARTNERS, INC.
MANAGEMENT'S DISCUSSION AND ANALYSIS OF FINANCIAL CONDITION
AND RESULTS OF OPERATIONS (continued)
|
December 31,
|
||||||||
|
2019
|
2018
|
|||||||
|
Assets:
|
||||||||
|
Surgical facility services
|
$
|
4,580.4
|
|
$
|
4,204.4
|
|
||
|
Ancillary services
|
69.6
|
|
52.7
|
|
||||
|
Optical services
|
17.7
|
|
20.1
|
|
||||
|
All other
|
351.2
|
|
399.1
|
|
||||
|
Total assets
|
$
|
5,018.9
|
|
$
|
4,676.3
|
|
||
Critical Accounting Policies
In preparing our consolidated financial statements in conformity with U.S. Generally Accepted Accounting Principles ("GAAP"), we must use estimates and assumptions that affect the reported amounts of assets and liabilities and related disclosures and the reported amounts of revenue and expenses. In general, our estimates are based on historical experience and various other assumptions we believe are reasonable under the circumstances. We evaluate our estimates on an ongoing basis and make changes to the estimates and related disclosures as experience develops or new information becomes known. Actual results could differ from those estimates.
We consider our critical accounting policies to be those that involve significant judgments and uncertainties, and may potentially result in materially different results under different assumptions and conditions.
Revenue Recognition
In May 2014, the Financial Accounting Standards Board ("FASB") issued Accounting Standards Update ("ASU") 2014-09,
Revenue from Contracts with Customers
. We adopted the new standard effective January 1, 2018, using the modified retrospective method. The presentation of the amount of earnings from operations and net earnings were unchanged upon adoption of the new standard; however, during the year of adoption, we determined that amounts historically considered to be bad debt should be considered an implicit price concession, as defined in FASB Accounting Standards Codification 606, "
Revenue From Contracts With Customers"
. This resulted in changes to the presentation of revenues and the provision for bad debts in the consolidated statements of operations. Previously, the estimate for unrealizable amounts was recorded to the provision for bad debts and presented as a component of operating expenses. Upon reassessment during the year of adoption, the estimate for unrealizable amounts is now reflected as an implicit price concession as a reduction to arrive at net revenue. This change in presentation was not material to the financial statements.
Our patient service revenues are derived primarily from surgical procedures performed at our ASCs and surgical hospitals, patient visits to physician practices, anesthesia services provided to patients, pharmacy services and diagnostic screens ordered by our physicians. The fees for such services are billed either to the patient or a third-party payor, including Medicare and Medicaid. We recognize patient service revenues, net of contractual allowances, which we estimate based on existing contracts or the historical trend of our cash collections and contractual write-offs.
Our optical products purchasing organization negotiates volume buying discounts with optical product manufacturers. The buying discounts and any handling charges billed to the members of the purchasing organization represent the revenues recognized for financial reporting purposes. Revenue is recognized as orders are shipped to members. Prior to the sale of our optical laboratories in 2018, product sale revenues from our optical laboratories and marketing products and services businesses, net of an allowance for returns and discounts, were recognized when the product was shipped or service is provided to the customer.
Other service revenues consist of management and administrative service fees derived from non-consolidated surgical facilities that we account for under the equity method, management of surgical facilities in which we do not own an interest and management services we provide to physician networks for which we are not required to provide capital or additional assets. The fees we derive from these management arrangements are based on a predetermined percentage of the revenues of each surgical facility and physician network. We recognize other service revenues in the period in which services are rendered.
Accounts Receivable
Our patient service revenues and other receivables from third-party payors are recorded net of estimated implicit price concessions which are estimated based on the historical trend of our surgical facilities’ cash collections and contractual write-offs, established fee schedules, relationships with payors and procedure statistics. While changes in estimated reimbursement from third-party payors remain a possibility, we expect that any such changes would be minimal and, therefore, would not have a material effect on our financial condition or results of operations.
Our collection policies and procedures are based on the type of payor, size of claim and estimated collection percentage for each patient account. The operating systems used to manage our patient accounts provide for an aging schedule in 30-day increments, by payor, physician and patient. We analyze accounts receivable at each of our surgical facilities to ensure the proper collection and aged category. The operating systems generate reports that assist in the collection efforts by prioritizing patient accounts. Collection efforts include direct contact with
43
SURGERY PARTNERS, INC.
MANAGEMENT'S DISCUSSION AND ANALYSIS OF FINANCIAL CONDITION
AND RESULTS OF OPERATIONS (continued)
insurance carriers or patients, written correspondence and the use of legal or collection agency assistance, as required. Our days sales outstanding was
64
days for the year ended
December 31, 2019
and
63
days for the year ended
December 31, 2018
.
We recognize that final reimbursement of outstanding accounts receivable is subject to final approval by each third-party payor. However, because we have contracts with our third-party payors and we verify the insurance coverage of the patient before services are rendered, the amounts that are pending approval from third-party payors are minimal. Amounts are classified outside of self-pay if we have an agreement with the third-party payor or we have verified a patient’s coverage prior to services rendered. It is our policy to collect co-payments and deductibles prior to providing services, where possible. It is also our policy to verify a patient’s insurance 72 hours prior to the patient’s procedure. Because our services are primarily non-emergency, our surgical facilities have the ability to control these procedures.
Income Taxes
We use the asset and liability method to account for income taxes. Under this method, deferred income tax assets and liabilities are recognized for the future tax consequences attributable to differences between the financial statement carrying amounts of existing assets and liabilities and their respective tax bases. Deferred tax assets and liabilities are measured using enacted tax rates expected to apply to taxable income in the years in which those temporary differences are expected to be recovered or settled. If a NOL carryforward exists, we make a determination as to whether that NOL carryforward will be utilized in the future. A valuation allowance will be established for certain NOL carryforwards and other deferred tax assets where their recoverability is deemed to be uncertain. The carrying value of the net deferred tax assets is based upon estimates and assumptions related to our ability to generate sufficient future taxable income in certain tax jurisdictions. If these estimates and related assumptions change in the future, we will be required to adjust our deferred tax valuation allowances.
As of
December 31, 2019
, we had unused federal NOL carryforwards of approximately
$530.6 million
. Such losses expire in various amounts at varying times beginning in 2025. Unless they expire, these NOL carryforwards may be used to offset future taxable income and thereby reduce our income taxes otherwise payable.
We recorded a valuation allowance against our deferred tax assets at
December 31, 2019
and
2018
totaling
$77.9 million
and
$50.4 million
, respectively. The valuation allowance has been established for certain deferred tax assets for which we believe it is more likely than not that the tax benefits will not be realized, which are primarily Section 163(j) interest carryforwards, certain state net operating losses and capital loss carryforwards. If our expectations for future operating results on a consolidated basis or at the state jurisdiction level vary from actual results due to changes in health care regulations, general economic conditions, or other factors, we may need to adjust the valuation allowance, for all or a portion of our deferred tax assets. Our income tax expense in future periods will be reduced or increased to the extent of offsetting decreases or increases, respectively, in our valuation allowance in the period when the change in circumstances occurs. These changes could have a significant impact on our future earnings.
Section 382 ("Section 382") of the Internal Revenue Code of 1986, as amended (the "Code") imposes an annual limit on the ability of a corporation that undergoes an "ownership change" to use its NOLs to reduce its tax liability. An "ownership change" is generally defined as any change in ownership of more than 50.0% of a corporation’s "stock" by its "5-percent shareholders" (as defined in Section 382) over a rolling three-year period based upon each of those shareholder’s lowest percentage of stock owned during such period. As a result of the Symbion acquisition in 2014, approximately $179 million in NOL carryforwards are subject to an annual Section 382 base limitation of $4.9 million, and, as a result of the NovaMed acquisition in 2011, approximately $17 million in NOL carryforwards are subject to an annual Section 382 base limitation of $4.9 million. As a result of the acquisition of NSH, approximately $20.5 million in NOL carryforwards are subject to an annual Section 382 base limitation of $2.8 million. The Private Sale resulted in an ownership change as defined in Section 382. As a result, approximately $461.2 million in NOL carryforwards are subject to an annual Section 382 base limitation of $14.2 million. At this time, we do not believe this limitation, when combined with amounts allowable due to net unrecognized built in gains, will affect our ability to use any NOLs before they expire. However, no such assurances can be provided. If our ability to utilize our NOLs to offset taxable income generated in the future is subject to this limitation, it could have an adverse effect on our business, prospects, results of operations and financial condition.
The Tax Cuts and Jobs Act (the "Tax Act") was enacted on December 22, 2017. The Tax Act reduces the U.S. federal corporate tax rate from 35% to 21%, allows for 100% expensing of certain capital expenditures, and limits interest expense deductions beginning in 2018. The Securities and Exchange Commission issued Staff Accounting Bulletin No. 118 ("SAB 118"), which provides a measurement period that should not extend beyond one year from the Tax Act enactment date for companies to complete the accounting under Accounting Standards Codification 740. In accordance with SAB 118, a company must reflect the income tax effects of those aspects of the Tax Act for which the accounting under Accounting Standards Codification 740 is complete. Our accounting for elements of the Tax Act is complete, and we reduced the U.S. federal corporate tax rate from 35% to 21%, expensed 100% of capital expenditures, and utilized the interest expense limitation under Section 163(j).
Impairment of Goodwill
Goodwill represents the excess of the fair value of the consideration conveyed in the acquisition over the fair value of net assets acquired. Goodwill is reviewed for impairment at the reporting unit level, which is defined as one level below an operating segment, on an annual basis or sooner if the indicators of impairment arise. Our judgments regarding the existence of impairment indicators are based on market conditions and operational performance of each reporting unit. We completed our most recent annual impairment test for goodwill as of October 1, 2019.
44
SURGERY PARTNERS, INC.
MANAGEMENT'S DISCUSSION AND ANALYSIS OF FINANCIAL CONDITION
AND RESULTS OF OPERATIONS (continued)
As of October 1,
2019
, we had three reporting units with allocated goodwill as follows: 1) Surgical Facilities -
$3.4 billion
, 2) Ancillary Services -
$28.6 million
, and 3) Alliance -
$11.6 million
, which is a component of our Optical Services operating segment. In 2018, we disposed of two previously identified reporting units, Midwest Labs and Family Vision Care.
As of the October 1, 2019 valuation, the fair value for both the Surgical Facilities and Ancillary Services reporting units was substantially in excess of its carrying value. For the Alliance reporting unit, the carrying value exceeded the fair value, resulting in non-cash impairment charges of
$2.5 million
in accordance with ASU No. 2017-04. During the year ended December 31, 2018, as a result of its impairment testing, the Company recorded non-cash impairment charges of
$60.7 million
and
$13.7 million
related to the Ancillary Services and Alliance reporting units, respectively. In connection with the implementation of pushdown accounting in 2017, we performed our goodwill impairment test as of August 31, 2017, then re-evaluated for impairment at October 1, 2017. Both evaluations resulted in no impairment.
As a result of the impairment charges, the fair value equaled carrying value as of October 1, 2019 for the Alliance reporting unit, any future adverse events or changes in the assumptions could require additional impairment. Subsequent to the date of our annual impairment test, the Company considered its operating results for the fourth quarter of 2019, macroeconomic, industry and market conditions, and other market indicators including its market capitalization. Based on its evaluation of all such factors, the Company concluded that an event had not occurred or circumstances had not changed that would more likely than not reduce the fair value of its reporting units below their carrying values.
See Note 4 to the consolidated financial statements elsewhere in this Annual Report for additional disclosure related to goodwill.
45
SURGERY PARTNERS, INC.
MANAGEMENT'S DISCUSSION AND ANALYSIS OF FINANCIAL CONDITION
AND RESULTS OF OPERATIONS (continued)
Results of Operations
The following tables summarize certain results from the statements of operations for the periods indicated (dollars in millions):
|
Year Ended December 31,
|
||||||||||||
|
2019
|
2018
|
2017
|
||||||||||
|
Revenues
|
$
|
1,831.4
|
|
$
|
1,771.5
|
|
$
|
1,341.2
|
|
|||
|
Operating expenses:
|
||||||||||||
|
Cost of revenues
|
1,407.6
|
|
1,361.4
|
|
1,013.8
|
|
||||||
|
General and administrative expenses
|
88.6
|
|
93.6
|
|
76.0
|
|
||||||
|
Depreciation and amortization
|
76.5
|
|
67.4
|
|
51.9
|
|
||||||
|
Provision for doubtful accounts
|
—
|
|
—
|
|
28.8
|
|
||||||
|
Income from equity investments
|
(10.2
|
)
|
(8.9
|
)
|
(6.4
|
)
|
||||||
|
(Gain) loss on disposals and deconsolidations, net
|
(4.4
|
)
|
31.8
|
|
1.7
|
|
||||||
|
Transaction and integration costs
|
19.0
|
|
31.7
|
|
13.1
|
|
||||||
|
Impairment charges
|
7.9
|
|
74.4
|
|
—
|
|
||||||
|
Loss on debt extinguishment
|
11.7
|
|
—
|
|
18.2
|
|
||||||
|
Loss (gain) on litigation settlements
|
0.2
|
|
46.0
|
|
(12.5
|
)
|
||||||
|
Gain on acquisition escrow release
|
—
|
|
—
|
|
(1.2
|
)
|
||||||
|
Other income
|
(1.4
|
)
|
(3.7
|
)
|
(0.5
|
)
|
||||||
|
Total operating expenses
|
1,595.5
|
|
1,693.7
|
|
1,182.9
|
|
||||||
|
Operating income
|
235.9
|
|
77.8
|
|
158.3
|
|
||||||
|
Gain on amendment to tax receivable agreement
|
—
|
|
—
|
|
16.4
|
|
||||||
|
Tax receivable agreement (expense) benefit
|
(2.4
|
)
|
—
|
|
25.3
|
|
||||||
|
Interest expense, net
|
(178.9
|
)
|
(147.0
|
)
|
(117.7
|
)
|
||||||
|
Income (loss) before income taxes
|
54.6
|
|
(69.2
|
)
|
82.3
|
|
||||||
|
Income tax expense
|
9.5
|
|
26.4
|
|
53.6
|
|
||||||
|
Net income (loss)
|
45.1
|
|
(95.6
|
)
|
28.7
|
|
||||||
|
Less: Net income attributable to non-controlling interests
|
(119.9
|
)
|
(110.1
|
)
|
(81.7
|
)
|
||||||
|
Net loss attributable to Surgery Partners, Inc.
|
$
|
(74.8
|
)
|
$
|
(205.7
|
)
|
$
|
(53.0
|
)
|
|||
Year Ended December 31,
2019
Compared to
Year Ended December 31,
2018
Overview.
During
2019
, our revenues
increased
3.4%
to
$1,831.4 million
from
$1,771.5 million
in
2018
. We incurred net loss attributable to
Surgery Partners, Inc.
in
2019
of
$74.8 million
, compared to net loss of
$205.7 million
in
2018
.
Revenues.
Revenues for
2019
and
2018
were as follows (dollars in millions):
|
Year Ended December 31,
|
||||||||
|
2019
|
2018
|
|||||||
|
Patient service revenues
|
$
|
1,803.1
|
|
$
|
1,737.0
|
|
||
|
Optical service revenues
|
3.8
|
|
9.5
|
|
||||
|
Other service revenues
|
24.5
|
|
25.0
|
|
||||
|
Total revenues
|
$
|
1,831.4
|
|
$
|
1,771.5
|
|
||
Patient service revenues
increased
3.8%
to
$1,803.1 million
in
2019
compared to
$1,737.0 million
in
2018
. The three months ended December 31, 2019 represented the sixth consecutive quarter of same-facility case volume growth, which resulted in
2.0%
same-facility case growth for the year ended December 31, 2019. Additionally, our targeted net revenue improvement initiatives have resulted in
5.5%
same-facility revenue per case growth for the same period. The 2018 period includes patient service revenues associated with disposed facilities that are not included in the 2019 period.
Cost of Revenues.
Cost of revenues were
$1,407.6 million
in
2019
compared to
$1,361.4 million
in
2018
, with the increase in costs primarily attributable to our 2019 and 2018 acquisitions and an increase in supply costs associated with higher acuity surgical case volume. As a percentage of revenues, cost of revenues was
76.9%
for both
2019
and
2018
.
46
SURGERY PARTNERS, INC.
MANAGEMENT'S DISCUSSION AND ANALYSIS OF FINANCIAL CONDITION
AND RESULTS OF OPERATIONS (continued)
General and Administrative Expenses.
General and administrative expenses were
$88.6 million
and
$93.6 million
in
2019
and
2018
, respectively. The decrease is primarily due to reduced costs as we continue our planned investment in our corporate infrastructure and integration of corporate office functions related to acquisitions we completed in 2017. As a percentage of revenues, general and administrative expenses were
4.8%
in
2019
compared to
5.3%
in
2018
.
Depreciation and Amortization.
Depreciation and amortization was
$76.5 million
and
$67.4 million
in
2019
and
2018
, respectively. As a percentage of revenues, depreciation and amortization expenses were
4.2%
in
2019
and
3.8%
in
2018
. The increase is primarily due to increased capital investments and integration of acquisitions we completed in 2019 and 2018.
Income from Equity Investments.
Income from equity investments was
$10.2 million
and
$8.9 million
in
2019
and
2018
, respectively. The increase is primarily due to the addition of four non-consolidated surgical facility equity method investments in 2019.
(Gain) Loss on Disposals and Deconsolidations, Net.
The net gain on disposals and deconsolidations was
$4.4 million
in 2019, including a $10.9 million gain on the sale of previously owned real property associated with one of our non-consolidated surgical facility equity method investments, offset by a loss of $6.5 million on disposals of other long-lived assets. The net loss on disposals and deconsolidations was
$31.8 million
in 2018, which included a net loss of $20.1 million on the disposal of six surgical facilities and our optical laboratory, and the deconsolidation of a surgical facility. The remaining loss in 2018 is related to disposals of other long-lived assets.
Transaction and Integration Costs.
We incurred
$19.0 million
of transaction and integration costs in
2019
compared to
$31.7 million
in
2018
. The decrease primarily relates to reduced reorganization costs as we continue our planned investment in our infrastructure and the integration of acquisitions completed in 2017.
Impairment charges.
In 2019 we recorded non-cash impairment charges of
$2.5 million
for goodwill assigned to the Alliance reporting unit and
$5.4 million
related to a management rights agreement intangible asset. The impairment of the management rights agreement is related to our 2019 acquisition of a clinic that we previously managed. As a result of the transaction, we determined the management rights agreement related to the acquired clinic no longer provided a future benefit. In 2018 we recorded a non-cash impairment charge of
$60.7 million
and
$13.7 million
for goodwill assigned to the Ancillary Services and the Alliance reporting units, respectively. The goodwill impairment charges in each period were warranted based on the calculated fair value compared to the carrying value of the reporting units. See Note 4 to the consolidated financial statements elsewhere in this Annual Report for further discussion.
Loss on Debt Extinguishment.
In 2019, we incurred a debt extinguishment loss of
$11.7 million
in connection with issuance of the 2027 Unsecured Notes, effective April 11, 2019. The loss includes the redemption premium paid to redeem the 2021 Unsecured Notes partially offset by the write-off of the unamortized fair value premium as of the redemption date.
Loss (Gain) on Litigation Settlement.
We incurred a loss in the amount of
$0.2 million
and
$46.0 million
in
2019
and
2018
, respectively, related to the potential resolution of the government investigation discussed in Item 3. Legal Proceedings.
Interest Expense, Net.
Interest expense, net, increased to
$178.9 million
in
2019
compared to
$147.0 million
in
2018
. The increase primarily relates to the $180.0 million senior secured incremental term loan, which was fully funded on October 23, 2018 and the issuance of the 2027 Unsecured Notes in the amount of $430.0 million effective April 11, 2019. As a percentage of revenues, interest expense, net was
9.8%
in
2019
compared to
8.3%
in
2018
.
Income Tax Expense (Benefit)
. Income tax expense was
$9.5 million
and
$26.4 million
in
2019
and
2018
, respectively. The effective tax rate was
17.4%
for
2019
compared to (38.3)% in
2018
. The change in effective tax rate from 2018 to 2019 was primarily attributable to the tax-effect of the non-deductible goodwill impairment, non-deductible settlement accruals related to a potential resolution of the investigation discussed in Item 3. Legal Proceedings, and non-deductible differences related to divested entities.
Net Income Attributable to Non-Controlling Interests.
Net income attributable to non-controlling interests was
$119.9 million
and
$110.1 million
in
2019
and
2018
, respectively. As a percentage of revenues, net income attributable to non-controlling interests was
6.5%
in the
2019
period and
6.2%
for the
2018
period.
Our discussion regarding the comparison of the year ended December 31, 2018 compared to the year ended December 31, 2017 was previously disclosed beginning on page 48 in our Annual Report on Form 10-K for the year ended December 31, 2018, which was filed on March 15, 2019, under "Item 7. Management's Discussion and Analysis of Financial Condition and Results of Operations - Results of Operations -
Year Ended December 31, 2018 Compared to Year Ended December 31, 2017
" and is hereby incorporated herein by reference.
Liquidity and Capital Resources
Operating Activities
The primary source of our operating cash flow is the collection of accounts receivable from federal and state agencies (under the Medicare and Medicaid programs), private insurance companies and individuals. Cash flow provided by operating activities was
$129.5 million
and
$144.6 million
in
2019
and
2018
, respectively. The decrease in operating cash flow in 2019 is primarily attributed to higher interest payments related to the $180.0 million senior secured incremental term loan, which was fully funded on October 23, 2018 and the issuance of $430.0 million in senior unsecured notes effective April 11, 2019.
47
SURGERY PARTNERS, INC.
MANAGEMENT'S DISCUSSION AND ANALYSIS OF FINANCIAL CONDITION
AND RESULTS OF OPERATIONS (continued)
Investing Activities
Net cash used in investing activities in
2019
was
$85.2 million
, which included
$73.6 million
related to purchases of property and equipment. We paid
$13.8 million
, in cash for acquisitions (net of cash acquired), which primarily included a surgical facility, a clinic that was merged into an existing facility and a physician practice. Further, we paid
$15.2 million
in cash for a non-controlling interest in four surgical facilities accounted for as equity method investments and we received cash proceeds of $17.6 million related to the sale of previously owned real property associated with one of our non-consolidated equity method investments.
Net cash used in investing activities in 2018 was $128.9 million, which included $39.8 million related to purchases of property and equipment. We paid $106.8 million, in cash for acquisitions (net of cash acquired), which included five surgical facilities in new markets, two surgical facilities in an existing market, one of which was merged into an existing facility and multiple physician practices. Further, we received $19.2 million in proceeds from disposals of six surgical facilities and our optical laboratory.
Financing Activities
Net cash used in financing activities in
2019
was
$135.9 million
. During this period, we made distributions to non-controlling interest holders of
$121.2 million
and payments related to ownership transactions with consolidated affiliates of
$3.2 million
. Further, we made repayments on our long-term debt of
$490.8 million
, which was offset by borrowings of
$506.9 million
. In connection with the issuance of the 2027 Unsecured Notes and redemption of the then existing 2021 Unsecured Notes, we paid debt issuance costs of
$8.9 million
and paid a redemption premium of
$17.8 million
.
Net cash used in financing activities in 2018 was $6.3 million. During this period, we made distributions to non-controlling interest holders of $109.0 million and payments related to ownership transactions with consolidated affiliates of $2.2 million. Further, we made repayments on our long-term debt of $157.6 million offset by borrowings of $282.7 million, which included incremental term loan borrowings of $180.0 million. In connection with the incremental term loan, we made payments of debt issuance costs of $3.0 million. In addition, we made preferred dividend payments of $7.8 million and repurchased $2.0 million of our common stock pursuant to our $50 million repurchase program announced on December 15, 2017.
Discussion of the operating, investing and financing activities for the year ended December 31, 2017 was previously disclosed beginning on page 51 in our Annual Report on Form 10-K for the year ended December 31, 2018, which was filed on March 15, 2019, under "Item 7. Management's Discussion and Analysis of Financial Condition and Results of Operations - Liquidity and Capital Resources" and is hereby incorporated herein by reference.
Long-Term Debt
As of
December 31, 2019
, the carrying value of our total indebtedness, including finance leases, was
$2.581 billion
, which includes unamortized fair value discount of
$4.6 million
and unamortized deferred financing costs of
$10.8 million
.
Term Loan and Revolving Credit Facility
As of
December 31, 2019
, we had term loan borrowings with a carrying value of
$1.434 billion
, consisting of outstanding aggregate principal of
$1.439 billion
and unamortized fair value discount of
$4.6 million
(the "Term Loan"). The Term Loan matures on August 31, 2024 The Term Loan amortizes in equal quarterly installments of 0.25% of the aggregate original principal amount of the Term Loan.
We have a revolving credit facility providing for revolving borrowings of up to $120.0 million (the "Revolver" and, together with the Term Loan, the "Senior Secured Credit Facilities"). The Revolver will mature on August 31, 2022. As of
December 31, 2019
, our availability on the Revolver was
$112.9 million
(including outstanding letters of credit of
$7.1 million
).
The Revolver may be utilized for working capital, capital expenditures and general corporate purposes. Subject to certain conditions and requirements set forth in the credit agreement, we may request one or more additional incremental term loan facilities or one or more increases in the commitments under the Revolver.
The Senior Secured Credit Facilities bear interest at a rate per annum equal to (x) LIBOR plus a margin ranging from 3.00% to 3.25% per annum, depending on our first lien net leverage ratio or (y) an alternate base rate (which will be the highest of (i) the prime rate, (ii) 0.5% per annum above the federal funds effective rate and (iii) one-month LIBOR plus 1.00% per annum (solely with respect to the Term Loan, the alternate base rate shall not be less than 2.00% per annum)) plus a margin ranging from 2.00% to 2.25% per annum. In addition, we are required to pay a commitment fee of 0.50% per annum in respect of unused commitments under the Revolver.
Senior Unsecured Notes
On April 11, 2019, we completed the issuance and sale of $430.0 million in gross proceeds of 2027 Unsecured Notes. The 2027 Unsecured Notes bear interest at the rate of 10.000% per year, payable semi-annually on April 15 and October 15 of each year, beginning on October 15, 2019. In connection with issuance of the 2027 Unsecured Notes, we redeemed in whole the then existing 2021 Unsecured Notes. The redemption price was equal to 104.438% of the outstanding principal amount plus accrued and unpaid interest. Refer to Note 3. "Long-Term Debt" to the Consolidated Financial Statements elsewhere in this Annual Report for further discussion.
We have $370.0 million aggregate principal amount of senior unsecured notes due July 1, 2025 outstanding (the "2025 Unsecured Notes"). The 2025 Unsecured Notes bear interest at the rate of 6.750% per year, payable semi-annually on January 1 and July 1 of each year.
48
SURGERY PARTNERS, INC.
MANAGEMENT'S DISCUSSION AND ANALYSIS OF FINANCIAL CONDITION
AND RESULTS OF OPERATIONS (continued)
Other Debt
We and certain of our subsidiaries have other debt consisting of outstanding bank indebtedness of
$104.0 million
, which is collateralized by the real estate and equipment owned by the surgical facilities to which the loans were made, and right-of-use finance lease obligations of
$253.4 million
for which we are liable to various vendors for several property and equipment leases classified as finance leases.
Summary
We believe we have sufficient liquidity in the next 12 to 18 months as described above. Nevertheless, we continue to monitor the state of the financial and credit markets and our current and expected liquidity and capital resource needs, and intend to continue to explore various financing alternatives to improve our capital structure, including extending maturities or relaxing financial covenants. These may include new equity or debt financings or exchange offers with existing security holders (including exchanges of debt for debt or equity) and other transactions involving our outstanding securities, given their secondary market trading prices. We cannot assure you, if we pursue any of these transactions, that we will be successful in completing a transaction on attractive terms, or at all.
Certain Non-GAAP Metrics
Adjusted EBITDA is not a measurement of financial performance under GAAP, and should not be considered in isolation or as a substitute for net income, operating income or any other measure calculated in accordance with GAAP. The items excluded from this non-GAAP metric are significant components in understanding and evaluating our financial performance. We believe such adjustments are appropriate, as the magnitude and frequency of such items can vary significantly and are not related to the assessment of normal operating performance. Our calculation of Adjusted EBITDA may not be comparable to similarly titled measures reported by other companies.
When we use the term "Adjusted EBITDA", we are referring to income (loss) before income taxes, adjusted for net income attributable to non-controlling interests, interest expense, net, depreciation and amortization, equity-based compensation expense, transaction, integration and acquisition costs, (gain) loss on disposals and deconsolidations, net, loss (gain) on litigation settlements and other litigation costs, loss on debt extinguishment, tax receivable agreement expense (benefit), impairment charges, reserve adjustments, contingent acquisition compensation expense, gain on acquisition escrow release and gain on amendment to tax receivable agreement. We use Adjusted EBITDA as a measure of financial performance. Adjusted EBITDA is a key measure used by our management to assess operating performance, make business decisions and allocate resources.
The following table reconciles Adjusted EBITDA to income (loss) before income taxes, the most directly comparable GAAP financial measure (in millions and unaudited):
|
Year Ended December 31,
|
||||||||||||
|
2019
|
2018
|
2017
|
||||||||||
|
Consolidated Statements of Operations Data:
|
||||||||||||
|
Income (loss) before income taxes
|
$
|
54.6
|
|
$
|
(69.2
|
)
|
$
|
82.3
|
|
|||
|
Plus (minus):
|
||||||||||||
|
Net income attributable to non-controlling interests
|
(119.9
|
)
|
(110.1
|
)
|
(81.7
|
)
|
||||||
|
Interest expense, net
|
178.9
|
|
147.0
|
|
117.7
|
|
||||||
|
Depreciation and amortization
|
76.5
|
|
67.4
|
|
51.9
|
|
||||||
|
Equity-based compensation expense
|
10.2
|
|
9.3
|
|
5.6
|
|
||||||
|
Transaction, integration and acquisition costs
(1)
|
36.1
|
|
34.0
|
|
17.0
|
|
||||||
|
(Gain) loss on disposals and deconsolidations, net
|
(4.4
|
)
|
31.8
|
|
1.7
|
|
||||||
|
Loss (gain) on litigation settlements and other litigation costs
(2)
|
4.6
|
|
46.0
|
|
(12.5
|
)
|
||||||
|
Loss on debt extinguishment
|
11.7
|
|
—
|
|
18.2
|
|
||||||
|
Tax receivable agreement expense (benefit)
|
2.4
|
|
—
|
|
(25.3
|
)
|
||||||
|
Impairment charges
|
7.9
|
|
74.4
|
|
—
|
|
||||||
|
Reserve adjustments
(3)
|
—
|
|
2.7
|
|
—
|
|
||||||
|
Contingent acquisition compensation expense
|
—
|
|
1.5
|
|
7.0
|
|
||||||
|
Gain on acquisition escrow release
|
—
|
|
—
|
|
(1.2
|
)
|
||||||
|
Gain on amendment to tax receivable agreement
|
—
|
|
—
|
|
(16.4
|
)
|
||||||
|
Adjusted EBITDA
|
$
|
258.6
|
|
$
|
234.8
|
|
$
|
164.3
|
|
|||
|
(1)
|
This amount includes transaction and integration costs of
$19.0 million
,
$31.7 million
and
$13.1 million
in 2019, 2018 and 2017, respectively, acquisition costs of
$2.8 million
,
$2.2 million
and
$3.9 million
in 2019, 2018 and 2017, respectively. This amount further includes start-up costs related to a de novo surgical hospital of
$14.3 million
in 2019, with no comparable costs in the 2018 and 2017 periods.
|
|
(2)
|
This amount includes a loss on litigation settlements of
$0.2 million
and
$46.0 million
in 2019 and 2018, respectively, and a gain on litigation of
$12.5 million
in 2017. This amount further includes other litigation costs of
$4.4 million
in 2019, with no comparable costs in the 2018 and 2017 periods.
|
49
SURGERY PARTNERS, INC.
MANAGEMENT'S DISCUSSION AND ANALYSIS OF FINANCIAL CONDITION
AND RESULTS OF OPERATIONS (continued)
|
(3)
|
This amount represents adjustments to revenue in order to apply consistent policies to businesses acquired by Surgery Partners in prior periods.
|
We use Credit Agreement EBITDA as a measure of liquidity and to determine our compliance under certain covenants pursuant to our credit facilities. Credit Agreement EBITDA is determined on a trailing twelve-month basis. We have included it because we believe that it provides investors with additional information about our ability to incur and service debt and make capital expenditures. Credit Agreement EBITDA is not a measurement of liquidity under GAAP, and should not be considered in isolation or as a substitute for any other measure calculated in accordance with GAAP. The items excluded from Credit Agreement EBITDA are significant components in understanding and evaluating our liquidity. Our calculation of Credit Agreement EBITDA may not be comparable to similarly titled measures reported by other companies.
When we use the term "Credit Agreement EBITDA," we are referring to Adjusted EBITDA, as defined above, further adjusted for acquisitions and synergies. These adjustments do not relate to our historical financial performance and instead relate to estimates compiled by management and calculated in conformance with the definition of "Consolidated EBITDA" used in the credit agreements governing our credit facilities.
The following table reconciles Credit Agreement EBITDA to cash flows from operating activities, the most directly comparable GAAP financial measure (in millions and unaudited):
|
Year Ended December 31, 2019
|
||||
|
Cash flows from operating activities
|
$
|
129.5
|
|
|
|
Plus (minus):
|
||||
|
Non-cash interest income, net
|
(2.5
|
)
|
||
|
Non-cash lease expense
|
(40.0
|
)
|
||
|
Deferred income taxes
|
(8.5
|
)
|
||
|
Income from equity investments, net of distributions received
|
(0.3
|
)
|
||
|
Changes in operating assets and liabilities, net of acquisitions and divestitures
|
68.8
|
|
||
|
Income tax expense
|
9.5
|
|
||
|
Net income attributable to non-controlling interests
|
(119.9
|
)
|
||
|
Interest expense, net
|
178.9
|
|
||
|
Transaction, integration and acquisition costs
|
36.1
|
|
||
|
Loss on litigation settlements and other litigation costs
|
4.6
|
|
||
|
Tax receivable agreement expense
|
2.4
|
|
||
|
Acquisitions and synergies
(1)
|
68.3
|
|
||
|
Credit Agreement EBITDA
|
$
|
326.9
|
|
|
|
(1)
|
Represents impact of acquisitions as if each acquisition had occurred on January 1, 2019. Further this includes revenue synergies from other business initiatives, de novo facilities and an adjustment for the effects of adopting the new lease accounting standard, as defined in the credit agreement governing the Senior Secured Credit Facilities.
|
Contractual Obligations and Commercial Commitments
The following table summarizes our contractual obligations by period as of
December 31, 2019
(in millions):
|
Payments Due by Period
|
||||||||||||||||||||
|
Total
|
Less than 1 year
|
1-3 years
|
4-5 years
|
More than 5 years
|
||||||||||||||||
|
Long-term debt obligations, including interest
(1)
|
$
|
3,671.6
|
|
$
|
219.7
|
|
$
|
420.9
|
|
$
|
1,724.3
|
|
$
|
1,306.7
|
|
|||||
|
Operating lease obligations, including interest
(2)
|
499.6
|
|
67.9
|
|
119.3
|
|
104.3
|
|
208.1
|
|
||||||||||
|
Tax receivable agreement
(3)
|
60.1
|
|
16.9
|
|
41.4
|
|
1.8
|
|
—
|
|
||||||||||
|
Total contractual obligations
|
$
|
4,231.3
|
|
$
|
304.5
|
|
$
|
581.6
|
|
$
|
1,830.4
|
|
$
|
1,514.8
|
|
|||||
|
(1)
|
Included in long-term debt obligations are principal and interest owed on our outstanding debt obligations. These amounts exclude our unamortized fair value adjustments related non-cash amortization for the Term Loan. These obligations are explained further in Note 5 to our consolidated financial statements included elsewhere in this Annual Report. We used the applicable annual interest rate as of December 31,
2019
of 4.96%, based on LIBOR plus the applicable margin, for our $1.4 billion outstanding Term Loan to estimate interest payments on this variable rate debt instrument.
|
|
(2)
|
This reflects our future operating lease payments. We enter into operating leases in the normal course of business. Substantially all of our operating lease agreements have fixed payment terms based on the passage of time. Some lease agreements provide us with the option to renew the lease. Our future operating lease obligations would change if we exercised these renewal options and if we entered into additional operating lease agreements. These obligations are explained further in Note 6 to our consolidated financial
|
50
SURGERY PARTNERS, INC.
MANAGEMENT'S DISCUSSION AND ANALYSIS OF FINANCIAL CONDITION
AND RESULTS OF OPERATIONS (continued)
statements included elsewhere in this Annual Report. Operating lease obligations do not include common area maintenance, insurance or tax payments for which we are also obligated to pay.
|
(3)
|
This reflects payments made pursuant to the terms of the TRA, as described further in "Critical Accounting Policies and Tax Receivable Agreement."
|
Inflation
Inflation and changing prices have not significantly affected our operating results or the markets in which we operate.
Recent Accounting Pronouncements
Please refer to Note 1 to our consolidated financial statements included elsewhere in this Annual Report for a discussion of the impact of the adoption of recently issued accounting standards and accounting standards not yet adopted.
51
Item 7A. Quantitative and Qualitative Disclosures about Market Risk
We are subject to market risk primarily from exposure to changes in interest rates based on our financing, investing and cash management activities. We utilize a balanced mix of maturities along with both fixed rate and variable rate debt to manage our exposures to changes in interest rates. Additionally, we periodically enter into interest rate swap agreements to manage our exposure to interest rate fluctuations. Our interest rate swap agreements involve the exchange of fixed and variable rate interest payments between two parties, based on common notional principal amounts and maturity dates. The notional amounts of the swap agreements represent balances used to calculate the exchange of cash flows and are not our assets or liabilities. Our credit risk related to these agreements is considered low because the swap agreements are with creditworthy financial institutions. The interest payments under these agreements are settled on a net basis. These derivatives have been recognized in the financial statements at their respective fair values. Changes in the fair value of these derivatives, which are designated as cash flow hedges, are included in other comprehensive income.
Our variable rate debt instruments are primarily indexed to the prime rate or LIBOR. Interest rate changes would result in gains or losses in the market value of our fixed rate debt portfolio due to differences in market interest rates and the rates at the inception of the debt agreements. Based on our indebtedness and the effect of our interest rate swap agreements at
December 31, 2019
, a 100 basis point interest rate change would impact our net earnings and cash flow by approximately $2.4 million annually. Although there can be no assurances that interest rates will not change significantly, we do not expect changes in interest rates to have a material effect on our net earnings or cash flows in 2020 based on our indebtedness at
December 31, 2019
.
Item 8. Financial Statements and Supplementary Data
Information with respect to this Item is contained in our consolidated financial statements beginning on Page
F-1
of this Annual Report.
Item 9. Changes in and Disagreements With Accountants on Accounting and Financial Disclosure
None.
Item 9A. Controls and Procedures
Disclosure Controls and Procedures and Limitations on the Effectiveness of Controls
An evaluation was performed under the supervision and with the participation of our management, including the Chief Executive Officer and the Chief Financial Officer, of the effectiveness of our disclosure controls and procedures (as defined in Rules 13a-15(e) and 15d-15(e) under the Exchange Act) as of the end of the period covered by this Annual Report to ensure that information required to be disclosed by us in the reports that we file or submit under the Exchange Act, is recorded, processed, summarized and reported within the time periods specified in the SEC’s rules and forms and to ensure that information required to be disclosed by us in the reports that we file or submit under the Exchange Act is accumulated and communicated to our management, including the Chief Executive Officer and the Chief Financial Officer, as appropriate to allow timely decisions regarding required disclosure.
Management, with the participation of our Chief Executive Officer and Chief Financial Officer, evaluated the effectiveness of our disclosure controls and procedures as of the end of the period covered by this Annual Report. Based on the evaluation of our disclosure controls and procedures conducted as of
December 31, 2019
, our Chief Executive Officer and Chief Financial Officer concluded that, as of such date, our disclosure controls and procedures were effective.
Management’s Report on Internal Control Over Financial Reporting
Management is responsible for establishing and maintaining adequate "internal control over financial reporting" (as such term is defined in Rule 13a-15(f)) under the Exchange Act) for the Company. Internal control over financial reporting includes maintaining records that in reasonable detail accurately and fairly reflect our transactions and disposition of assets; providing reasonable assurance that transactions are recorded as necessary for preparation of our financial statements; providing reasonable assurance that receipts and expenditures are made only in accordance with management and board authorizations; and providing reasonable assurance regarding prevention or timely detection of unauthorized acquisition, use or disposition of our assets that could have a material effect on our financial statements. Internal control over financial reporting is a process designed to provide reasonable assurance regarding the reliability of financial reporting and the preparation of financial statements prepared for external purposes in accordance with GAAP. Because of the inherent limitations in any internal control, no matter how well designed, internal control over financial reporting may not prevent or detect misstatements. Also, projections of any evaluation of effectiveness to future periods are subject to the risk that controls may become inadequate because of changes in conditions or that the degree of compliance with the policies or procedures may deteriorate.
Under the supervision and with the participation of management, including the Chief Executive Officer and Chief Financial Officer, we conducted an evaluation of the effectiveness of our internal control over financial reporting as of
December 31, 2019
. The assessment was based on criteria established in the framework
Internal Control-Integrated Framework (2013)
, issued by the Committee of Sponsoring Organizations of the Treadway Commission. Based on that evaluation, management, including the Chief Executive Officer and Chief Financial Officer, determined that our internal control over financial reporting was effective as of
December 31, 2019
.
52
Deloitte & Touche LLP, the Company's independent registered public accounting firm, has issued an attestation report on the effectiveness of our internal control over financial reporting as of
December 31, 2019
. Their attestation report is included below in this Item 9A.
Changes in Internal Control over Financial Reporting
There were no changes in our internal control over financial reporting identified in connection with the evaluation required by Rules 13a-15(d) and 15d‑15(d) of the Exchange Act that occurred during the quarter ended
December 31, 2019
that materially affected, or are reasonably likely to materially affect, our internal control over financial reporting.
53
REPORT OF INDEPENDENT REGISTERED PUBLIC ACCOUNTING FIRM
To the Board of Directors and Stockholders of Surgery Partners, Inc.
Opinion on Internal Control over Financial Reporting
We have audited the internal control over financial reporting of Surgery Partners, Inc. and subsidiaries (the “Company”) as of December 31, 2019, based on criteria established in
Internal Control - Integrated Framework (2013)
issued by the Committee of Sponsoring Organizations of the Treadway Commission (COSO). In our opinion, the Company maintained, in all material respects, effective internal control over financial reporting as of December 31, 2019, based on criteria established in
Internal Control - Integrated Framework (2013)
issued by COSO.
We have also audited, in accordance with the standards of the Public Company Accounting Oversight Board (United States) (PCAOB), the consolidated financial statements as of and for the year ended December 31, 2019, of the Company and our report dated March 13, 2020 expressed an unqualified opinion on those consolidated financial statements and included an explanatory paragraph regarding the Company’s adoption of Accounting Standards Codification Topic 842, “Leases”.
Basis for Opinion
The Company’s management is responsible for maintaining effective internal control over financial reporting and for its assessment of the effectiveness of internal control over financial reporting, included in the accompanying
Management’s Report on Internal Control Over Financial Reporting.
Our responsibility is to express an opinion on the Company’s internal control over financial reporting based on our audit. We are a public accounting firm registered with the PCAOB and are required to be independent with respect to the Company in accordance with the U.S. federal securities laws and the applicable rules and regulations of the Securities and Exchange Commission and the PCAOB.
We conducted our audit in accordance with the standards of the PCAOB. Those standards require that we plan and perform the audit to obtain reasonable assurance about whether the effective internal control over financial reporting was maintained in all material respects. Our audit included obtaining and understanding of internal control over financial reporting, assessing the risk that a material weakness exists, testing and evaluating the design and operating effectiveness of internal control based on the assessed risk, and performing such other procedures as we considered necessary in the circumstances. We believe that our audit provides a reasonable basis for our opinion.
Definition and Limitations of Internal Control over Financial Reporting
A company’s internal control over financial reporting is a process designed to provide reasonable assurance regarding the reliability of financial reporting and the preparation of financial statements for external purposes in accordance with generally accepted accounting principles. A company’s internal control over financial reporting includes those policies and procedures that (1) pertain to the maintenance of records that, in reasonable detail, accurately and fairly reflect the transactions and dispositions of the assets of the company; (2) provide reasonable assurance that transactions are recorded as necessary to permit preparation of financial statements in accordance with generally accepted accounting principles, and that receipts and expenditures of the company are being made only in accordance with authorizations of management and directors of the company; and (3) provide reasonable assurance regarding prevention or timely detection of unauthorized acquisition, use, or disposition of the company’s assets that could have a material effect on the financial statements.
Because of its inherent limitations, internal control over financial reporting may not prevent or detect misstatements. Also, projections of any evaluation of effectiveness to future periods are subject to the risk that controls may become inadequate because of changes in conditions, or that the degree of compliance with the policies or procedures may deteriorate.
/s/ Deloitte & Touche LLP
Nashville, Tennessee
March 13, 2020
54
Item 9B. Other Information
None.
55
PART III
Item 10. Directors, Executive Officers and Corporate Governance
The information called for by Item 10 is incorporated herein by reference to the definitive Proxy Statement of the Company relating to the 2020 Annual Meeting of Stockholders (the "Definitive Proxy Statement"), which the Company intends to file within 120 days after the close of our fiscal year ended
December 31, 2019
.
Item 11. Executive Compensation
The information called for by Item 11 is incorporated herein by reference to the Definitive Proxy Statement referenced above in Item 10.
Item 12. Security Ownership of Certain Beneficial Owners and Management and Related Stockholder Matters
The information called for by Item 12 is incorporated herein by reference to the Definitive Proxy Statement referenced above in Item 10.
Item 13. Certain Relationships and Related Transactions, and Director Independence
The information called for by Item 13 is incorporated herein by reference to the Definitive Proxy Statement referenced above in Item 10.
Item 14. Principal Accounting Fees and Services
The information called for by Item 14 is incorporated herein by reference to the Definitive Proxy Statement referenced above in Item 10.
56
PART IV
Item 15. Exhibits and Financial Statement Schedules
(a) Financial Statements, Financial Statement Schedules and Exhibits
(1) Financial Statements
Our Consolidated Financial Statements and Notes thereto are set forth starting on page
F-1
of this Annual Report on Form 10-K.
(2) Financial Statement Schedules
All financial schedules have been omitted either because they are not applicable or because the required information is provided in our Consolidated Financial Statements and Notes thereto, starting on page
F-1
of this Annual Report on Form 10-K.
(3) Exhibits:
|
No.
|
Description
|
|
|
2.1
|
||
|
2.2
|
||
|
3.1
|
|
|
|
3.2
|
|
|
|
3.3
|
|
|
|
4.1
|
||
|
4.2
|
||
|
4.3
|
||
|
4.4
|
||
|
10.1
|
||
|
10.2
|
||
|
10.3
|
||
|
10.4
|
||
|
10.5
|
||
|
10.6
|
||
|
10.7
|
||
|
10.8
|
||
|
10.9
|
||
|
10.10
|
||
57
|
10.11
|
||
|
10.12
|
||
|
10.13 (a)
|
||
|
10.14 (a)
|
||
|
10.15 (a)
|
||
|
10.16 (a)
|
||
|
10.17 (a)
|
||
|
10.18 (a)
|
||
|
10.19 (a)
|
||
|
10.20 (a)
|
||
|
10.21 (a)
|
||
|
10.22 (a)
|
||
|
10.23 (a)
|
||
|
10.24 (a)
|
||
|
10.25 (a)
|
||
|
10.26 (a)
|
||
|
10.27 (a)
|
||
|
10.28 (a)
|
||
|
10.29 (a)
|
||
|
10.30 (a)
|
||
|
10.31 (a)
|
||
|
10.32 (a)
|
||
|
10.33 (a)
|
||
|
10.34 (a)
|
||
|
10.35 (a)
|
||
|
10.36 (a)
|
||
|
16.1
|
||
|
21.1
|
||
|
23.1
|
||
|
23.2
|
||
|
31.1
|
||
58
|
31.2
|
||
|
32.1
|
||
|
101.INS
|
XBRL Instance Document
|
|
|
101.SCH
|
XBRL Taxonomy Extension Schema Document
|
|
|
101.CAL
|
XBRL Taxonomy Extension Calculation Linkbase Document
|
|
|
101.DEF
|
XBRL Taxonomy Extension Definition Linkbase Document
|
|
|
101.LAB
|
XBRL Taxonomy Extension Label Linkbase Document
|
|
|
101.PRE
|
XBRL Taxonomy Extension Presentation Linkbase Document
|
|
(a) Management Contract or Compensatory Plan or Arrangement.
* Schedules and/or Exhibits have been omitted pursuant to Item 601(b)(2) of Regulation S-K. The Company agrees to furnish a supplemental copy of any omitted schedule or exhibit to the SEC upon request.
Item 16. Form 10-K Summary
None.
59
INDEX TO FINANCIAL STATEMENTS
|
Page
|
|
F-1
Report of Independent Registered Public Accounting Firm
To the Board of Directors and Stockholders of Surgery Partners, Inc.
Opinion on the Financial Statements
We have audited the accompanying consolidated balance sheets of Surgery Partners, Inc. and subsidiaries (the "Company") as of December 31, 2019 and 2018, the related consolidated statements of operations, comprehensive income (loss), cash flow, stockholders' equity, for the years ended December 31, 2019 and 2018, and the related notes (collectively referred to as the "financial statements"). In our opinion, the financial statements present fairly, in all material respects, the financial position of the Company as of December 31, 2019 and 2018, and the results of its operations and its cash flows for the years ended December 31, 2019 and 2018, in conformity with accounting principles generally accepted in the United States of America.
We have also audited, in accordance with the standards of the Public Company Accounting Oversight Board (United States) (PCAOB), the Company’s internal control over financial reporting as of December 31, 2019, based on criteria established in
Internal Control - Integrated Framework (2013)
issued by the Committee of Sponsoring Organizations of the Treadway Commission and our report dated March 13, 2020, expressed an unqualified opinion on the Company’s internal control over financial reporting.
Change in Accounting Principle
As discussed in Note 1 to the financial statements, the Company has adopted Accounting Standards Codification Topic 842, “Leases”, using the modified retrospective adoption method on January 1, 2019.
Basis for Opinion
These financial statements are the responsibility of the Company's management. Our responsibility is to express an opinion on the Company's financial statements based on our audit. We are a public accounting firm registered with the Public Company Accounting Oversight Board (United States) (PCAOB) and are required to be independent with respect to the Company in accordance with the U.S. federal securities laws and the applicable rules and regulations of the Securities and Exchange Commission and the PCAOB.
We conducted our audits in accordance with the standards of the PCAOB. Those standards require that we plan and perform the audit to obtain reasonable assurance about whether the financial statements are free of material misstatement, whether due to error or fraud. Our audits included performing procedures to assess the risks of material misstatement of the financial statements, whether due to error or fraud, and performing procedures that respond to those risks. Such procedures included examining, on a test basis, evidence regarding the amounts and disclosures in the financial statements. Our audits also included evaluating the accounting principles used and significant estimates made by management, as well as evaluating the overall presentation of the financial statements. We believe that our audits provide a reasonable basis for our opinion.
/s/ DELOITTE & TOUCHE LLP
Nashville, Tennessee
March 13, 2020
We have served as the Company's auditor since 2018.
F-2
Report of Independent Registered Public Accounting Firm
To the Stockholders and the Board of Directors of Surgery Partners, Inc.
Opinion on the Financial Statements
We have audited the accompanying consolidated statements of operations, comprehensive income (loss), stockholders' equity and cash flows for the periods September 1, 2017 to December 31, 2017 (Successor) and January 1, 2017 to August 31, 2017 (Predecessor) of Surgery Partners, Inc. (the Company), and the related notes (collectively referred to as the consolidated financial statements). In our opinion, the consolidated financial statements present fairly, in all material respects, the results of the Company's operations and its cash flows for the periods September 1, 2017 to December 31, 2017 (Successor) and January 1, 2017 to August 31, 2017 (Predecessor), in conformity with U.S. generally accepted accounting principles.
Basis for Opinion
These financial statements are the responsibility of the Company's management. Our responsibility is to express an opinion on the Company’s financial statements based on our audits We are a public accounting firm registered with the PCAOB and are required to be independent with respect to the Company in accordance with the U.S. federal securities laws and the applicable rules and regulations of the Securities and Exchange Commission and the PCAOB.
We conducted our audit in accordance with the standards of the PCAOB. Those standards require that we plan and perform the audit to obtain reasonable assurance about whether the financial statements are free of material misstatement, whether due to error or fraud. Our audit included performing procedures to assess the risks of material misstatement of the financial statements, whether due to error or fraud, and performing procedures that respond to those risks. Such procedures included examining, on a test basis, evidence regarding the amounts and disclosures in the financial statements. Our audit also included evaluating the accounting principles used and significant estimates made by management, as well as evaluating the overall presentation of the financial statements. We believe that our audit provides a reasonable basis for our opinion.
/s/ Ernst & Young
We served as the Company’s auditor from 2014 to 2018.
Nashville, Tennessee
March 16, 2018, except for the effect of adopting ASU 2016-18,
Statement of Cash Flows - Restricted Cash
, as to which the date is March 15, 2019
F-3
SURGERY PARTNERS, INC.
CONSOLIDATED BALANCE SHEETS
(Dollars in millions, except per share amounts)
|
December 31,
|
||||||||
|
2019
|
2018
|
|||||||
|
ASSETS
|
||||||||
|
Current assets:
|
||||||||
|
Cash and cash equivalents
|
$
|
92.7
|
|
$
|
184.3
|
|
||
|
Accounts receivable
|
326.9
|
|
307.6
|
|
||||
|
Inventories
|
46.3
|
|
43.4
|
|
||||
|
Prepaid expenses
|
17.8
|
|
16.2
|
|
||||
|
Other current assets
|
41.8
|
|
36.8
|
|
||||
|
Total current assets
|
525.5
|
|
588.3
|
|
||||
|
Property and equipment, net
|
523.3
|
|
426.3
|
|
||||
|
Intangible assets, net
|
47.3
|
|
54.3
|
|
||||
|
Goodwill
|
3,402.4
|
|
3,382.8
|
|
||||
|
Investments in and advances to affiliates
|
93.2
|
|
78.5
|
|
||||
|
Long-term deferred tax assets
|
98.7
|
|
109.2
|
|
||||
|
Other long-term assets
|
328.5
|
|
36.9
|
|
||||
|
Total assets
|
$
|
5,018.9
|
|
$
|
4,676.3
|
|
||
|
LIABILITIES AND STOCKHOLDERS' EQUITY
|
||||||||
|
Current liabilities:
|
||||||||
|
Accounts payable
|
$
|
96.7
|
|
$
|
83.3
|
|
||
|
Accrued payroll and benefits
|
54.2
|
|
55.2
|
|
||||
|
Other current liabilities
|
191.2
|
|
155.2
|
|
||||
|
Current maturities of long-term debt
|
56.0
|
|
55.6
|
|
||||
|
Total current liabilities
|
398.1
|
|
349.3
|
|
||||
|
Long-term debt, less current maturities
|
2,524.7
|
|
2,270.9
|
|
||||
|
Other long-term liabilities
|
396.7
|
|
271.3
|
|
||||
|
Non-controlling interests—redeemable
|
321.0
|
|
326.6
|
|
||||
|
Redeemable preferred stock - Series A; shares authorized, issued and outstanding - 310,000; redemption value - $395.0 and $359.3, respectively
|
395.0
|
|
359.3
|
|
||||
|
Stockholders' equity:
|
||||||||
|
Preferred stock, $0.01 par value; shares authorized - 20,000,000; shares issued or outstanding - none
|
—
|
|
—
|
|
||||
|
Common stock, $0.01 par value; shares authorized - 300,000,000; shares issued and outstanding - 49,298,940 and 48,869,204, respectively
|
0.5
|
|
0.5
|
|
||||
|
Additional paid-in capital
|
662.7
|
|
673.5
|
|
||||
|
Accumulated other comprehensive loss
|
(50.7
|
)
|
(22.4
|
)
|
||||
|
Retained deficit
|
(315.7
|
)
|
(247.0
|
)
|
||||
|
Total Surgery Partners, Inc. stockholders' equity
|
296.8
|
|
404.6
|
|
||||
|
Non-controlling interests—non-redeemable
|
686.6
|
|
694.3
|
|
||||
|
Total stockholders' equity
|
983.4
|
|
1,098.9
|
|
||||
|
Total liabilities and stockholders' equity
|
$
|
5,018.9
|
|
$
|
4,676.3
|
|
||
See notes to consolidated financial statements.
F-4
SURGERY PARTNERS, INC.
CONSOLIDATED STATEMENTS OF OPERATIONS
(Dollars in millions, except per share amounts; shares in thousands)
|
Successor
|
Predecessor
|
|||||||||||||||||
|
Year Ended December 31,
|
September 1 to
December 31, |
January 1 to
August 31, |
||||||||||||||||
|
2019
|
2018
|
2017
|
2017
|
|||||||||||||||
|
Revenues
|
$
|
1,831.4
|
|
$
|
1,771.5
|
|
$
|
592.6
|
|
$
|
748.6
|
|
||||||
|
Operating expenses:
|
||||||||||||||||||
|
Salaries and benefits
|
550.0
|
|
534.7
|
|
175.4
|
|
241.1
|
|
||||||||||
|
Supplies
|
507.9
|
|
490.3
|
|
161.0
|
|
193.3
|
|
||||||||||
|
Professional and medical fees
|
154.8
|
|
145.5
|
|
45.1
|
|
57.9
|
|
||||||||||
|
Lease expense
|
85.6
|
|
86.7
|
|
27.9
|
|
36.5
|
|
||||||||||
|
Other operating expenses
|
109.3
|
|
104.2
|
|
32.2
|
|
43.4
|
|
||||||||||
|
Cost of revenues
|
1,407.6
|
|
1,361.4
|
|
441.6
|
|
572.2
|
|
||||||||||
|
General and administrative expenses
|
88.6
|
|
93.6
|
|
29.2
|
|
46.8
|
|
||||||||||
|
Depreciation and amortization
|
76.5
|
|
67.4
|
|
21.8
|
|
30.1
|
|
||||||||||
|
Provision for doubtful accounts (see Note 1)
|
—
|
|
—
|
|
12.5
|
|
16.3
|
|
||||||||||
|
Income from equity investments
|
(10.2
|
)
|
(8.9
|
)
|
(3.3
|
)
|
(3.1
|
)
|
||||||||||
|
(Gain) loss on disposals and deconsolidations, net
|
(4.4
|
)
|
31.8
|
|
—
|
|
1.7
|
|
||||||||||
|
Transaction and integration costs
|
19.0
|
|
31.7
|
|
7.5
|
|
5.6
|
|
||||||||||
|
Impairment charges
|
7.9
|
|
74.4
|
|
—
|
|
—
|
|
||||||||||
|
Loss on debt extinguishment
|
11.7
|
|
—
|
|
—
|
|
18.2
|
|
||||||||||
|
Loss (gain) on litigation settlements
|
0.2
|
|
46.0
|
|
(8.7
|
)
|
(3.8
|
)
|
||||||||||
|
Gain on acquisition escrow release
|
—
|
|
—
|
|
(0.2
|
)
|
(1.0
|
)
|
||||||||||
|
Other income
|
(1.4
|
)
|
(3.7
|
)
|
(0.1
|
)
|
(0.4
|
)
|
||||||||||
|
Total operating expenses
|
1,595.5
|
|
1,693.7
|
|
500.3
|
|
682.6
|
|
||||||||||
|
Operating income
|
235.9
|
|
77.8
|
|
92.3
|
|
66.0
|
|
||||||||||
|
Gain on amendment to tax receivable agreement
|
—
|
|
—
|
|
1.1
|
|
15.3
|
|
||||||||||
|
Tax receivable agreement (expense) benefit
|
(2.4
|
)
|
—
|
|
25.3
|
|
—
|
|
||||||||||
|
Interest expense, net
|
(178.9
|
)
|
(147.0
|
)
|
(48.7
|
)
|
(69.0
|
)
|
||||||||||
|
Income (loss) before income taxes
|
54.6
|
|
(69.2
|
)
|
70.0
|
|
12.3
|
|
||||||||||
|
Income tax expense (benefit)
|
9.5
|
|
26.4
|
|
71.7
|
|
(18.1
|
)
|
||||||||||
|
Net income (loss)
|
45.1
|
|
(95.6
|
)
|
(1.7
|
)
|
30.4
|
|
||||||||||
|
Less: Net income attributable to non-controlling interests
|
(119.9
|
)
|
(110.1
|
)
|
(39.6
|
)
|
(42.1
|
)
|
||||||||||
|
Net loss attributable to Surgery Partners, Inc.
|
(74.8
|
)
|
(205.7
|
)
|
(41.3
|
)
|
(11.7
|
)
|
||||||||||
|
Less: Amounts attributable to participating securities
|
(35.7
|
)
|
(32.4
|
)
|
(26.1
|
)
|
—
|
|
||||||||||
|
Net loss attributable to common stockholders
|
$
|
(110.5
|
)
|
$
|
(238.1
|
)
|
$
|
(67.4
|
)
|
$
|
(11.7
|
)
|
||||||
|
Net loss per share attributable to common stockholders - basic and diluted
(1)
|
$
|
(2.29
|
)
|
$
|
(4.96
|
)
|
$
|
(1.39
|
)
|
$
|
(0.24
|
)
|
||||||
|
Weighted average common shares outstanding - basic and diluted
(1)
|
48,280
|
|
48,028
|
|
48,319
|
|
48,121
|
|
||||||||||
|
(1)
|
The impact of potentially dilutive securities for all periods were not considered because the effect would be anti-dilutive in those periods.
|
See notes to consolidated financial statements.
F-5
SURGERY PARTNERS, INC.
CONSOLIDATED STATEMENTS OF COMPREHENSIVE INCOME (LOSS)
(Dollars in millions)
|
Successor
|
Predecessor
|
|||||||||||||||||
|
Year Ended December 31,
|
September 1 to
December 31, |
January 1 to
August 31, |
||||||||||||||||
|
2019
|
2018
|
2017
|
2017
|
|||||||||||||||
|
Net income (loss)
|
$
|
45.1
|
|
$
|
(95.6
|
)
|
$
|
(1.7
|
)
|
$
|
30.4
|
|
||||||
|
Other comprehensive (loss) income, net of tax:
|
||||||||||||||||||
|
Derivative activity
|
(28.3
|
)
|
(22.4
|
)
|
—
|
|
—
|
|
||||||||||
|
Comprehensive income (loss)
|
$
|
16.8
|
|
$
|
(118.0
|
)
|
$
|
(1.7
|
)
|
$
|
30.4
|
|
||||||
|
Less: Comprehensive income attributable to non-controlling interests
|
(119.9
|
)
|
(110.1
|
)
|
(39.6
|
)
|
(42.1
|
)
|
||||||||||
|
Comprehensive loss attributable to Surgery Partners, Inc.
|
$
|
(103.1
|
)
|
$
|
(228.1
|
)
|
$
|
(41.3
|
)
|
$
|
(11.7
|
)
|
||||||
See notes to consolidated financial statements.
F-6
SURGERY PARTNERS, INC.
CONSOLIDATED STATEMENTS OF STOCKHOLDERS' EQUITY
(Dollars in millions; shares in thousands)
|
Common Stock
|
Additional
Paid-in Capital |
Accumulated Other Comprehensive Loss
|
Retained Deficit
|
Non-Controlling Interests—
Non-Redeemable
|
Total
|
|||||||||||||||||||||
|
Shares
|
Amount
|
|||||||||||||||||||||||||
|
Predecessor
|
||||||||||||||||||||||||||
|
Balance as of December 31, 2016
|
48,489
|
|
$
|
0.5
|
|
$
|
320.5
|
|
$
|
—
|
|
$
|
(311.3
|
)
|
$
|
315.0
|
|
$
|
324.7
|
|
||||||
|
Net (loss) income
|
—
|
|
—
|
|
—
|
|
—
|
|
(11.7
|
)
|
32.5
|
|
20.8
|
|
||||||||||||
|
Equity-based compensation
|
321
|
|
—
|
|
2.9
|
|
—
|
|
—
|
|
—
|
|
2.9
|
|
||||||||||||
|
Acquisition of NSH
|
—
|
|
—
|
|
—
|
|
—
|
|
—
|
|
172.6
|
|
172.6
|
|
||||||||||||
|
Acquisition and disposal of shares of non-controlling interests, net
(1)
|
.
|
—
|
|
3.5
|
|
—
|
|
—
|
|
(5.6
|
)
|
(2.1
|
)
|
|||||||||||||
|
Distributions to non-controlling interests—non-redeemable holders
|
—
|
|
—
|
|
—
|
|
—
|
|
—
|
|
(38.9
|
)
|
(38.9
|
)
|
||||||||||||
|
Balance as of August 31, 2017
|
48,810
|
|
$
|
0.5
|
|
$
|
326.9
|
|
$
|
—
|
|
$
|
(323.0
|
)
|
$
|
475.6
|
|
$
|
480.0
|
|
||||||
|
Successor
|
||||||||||||||||||||||||||
|
Balance as of September 1, 2017
|
48,810
|
|
$
|
0.5
|
|
$
|
720.1
|
|
$
|
—
|
|
$
|
—
|
|
$
|
684.5
|
|
$
|
1,405.1
|
|
||||||
|
Net (loss) income
|
—
|
|
—
|
|
—
|
|
—
|
|
(41.3
|
)
|
26.7
|
|
(14.6
|
)
|
||||||||||||
|
Equity-based compensation
|
58
|
|
—
|
|
1.3
|
|
—
|
|
—
|
|
—
|
|
1.3
|
|
||||||||||||
|
Preferred dividends
|
—
|
|
—
|
|
(10.5
|
)
|
—
|
|
—
|
|
—
|
|
(10.5
|
)
|
||||||||||||
|
Mark to redemption adjustment
|
—
|
|
—
|
|
(15.6
|
)
|
—
|
|
—
|
|
—
|
|
(15.6
|
)
|
||||||||||||
|
Repurchase of shares
|
(181
|
)
|
—
|
|
(2.0
|
)
|
—
|
|
—
|
|
—
|
|
(2.0
|
)
|
||||||||||||
|
Acquisition and disposal of shares of non-controlling interests, net
(1)
|
—
|
|
—
|
|
2.2
|
|
—
|
|
—
|
|
(4.0
|
)
|
(1.8
|
)
|
||||||||||||
|
Distributions to non-controlling interests—non-redeemable holders
|
—
|
|
—
|
|
—
|
|
—
|
|
—
|
|
(25.3
|
)
|
(25.3
|
)
|
||||||||||||
|
Balance as of December 31, 2017
|
48,687
|
|
0.5
|
|
695.5
|
|
—
|
|
(41.3
|
)
|
681.9
|
|
1,336.6
|
|
||||||||||||
|
Net (loss) income
|
—
|
|
—
|
|
—
|
|
—
|
|
(205.7
|
)
|
75.5
|
|
(130.2
|
)
|
||||||||||||
|
Equity-based compensation
|
339
|
|
—
|
|
8.1
|
|
—
|
|
—
|
|
—
|
|
8.1
|
|
||||||||||||
|
Preferred dividends
|
—
|
|
—
|
|
(32.4
|
)
|
—
|
|
—
|
|
—
|
|
(32.4
|
)
|
||||||||||||
|
Other comprehensive loss
|
—
|
|
—
|
|
—
|
|
(22.4
|
)
|
—
|
|
—
|
|
(22.4
|
)
|
||||||||||||
|
Repurchase of shares
|
(157
|
)
|
—
|
|
(2.0
|
)
|
—
|
|
—
|
|
—
|
|
(2.0
|
)
|
||||||||||||
|
Acquisition and disposal of shares of non-controlling interests, net
(1)
|
—
|
|
—
|
|
4.3
|
|
—
|
|
—
|
|
15.8
|
|
20.1
|
|
||||||||||||
|
Distributions to non-controlling interests—non-redeemable holders
|
—
|
|
—
|
|
—
|
|
—
|
|
—
|
|
(78.3
|
)
|
(78.3
|
)
|
||||||||||||
|
Other
|
—
|
|
—
|
|
—
|
|
—
|
|
—
|
|
(0.6
|
)
|
(0.6
|
)
|
||||||||||||
|
Balance as of December 31, 2018
|
48,869
|
|
0.5
|
|
673.5
|
|
(22.4
|
)
|
(247.0
|
)
|
694.3
|
|
1,098.9
|
|
||||||||||||
|
Net (loss) income
|
—
|
|
—
|
|
—
|
|
—
|
|
(74.8
|
)
|
80.8
|
|
6.0
|
|
||||||||||||
|
Equity-based compensation
|
430
|
|
—
|
|
9.2
|
|
—
|
|
—
|
|
—
|
|
9.2
|
|
||||||||||||
|
Preferred dividends
|
—
|
|
—
|
|
(35.7
|
)
|
—
|
|
—
|
|
—
|
|
(35.7
|
)
|
||||||||||||
|
Other comprehensive loss
|
—
|
|
—
|
|
—
|
|
(28.3
|
)
|
—
|
|
—
|
|
(28.3
|
)
|
||||||||||||
|
Acquisition and disposal of shares of non-controlling interests, net
(1)
|
—
|
|
—
|
|
15.7
|
|
—
|
|
—
|
|
(7.4
|
)
|
8.3
|
|
||||||||||||
|
Distributions to non-controlling interests—non-redeemable holders
|
—
|
|
—
|
|
—
|
|
—
|
|
—
|
|
(81.2
|
)
|
(81.2
|
)
|
||||||||||||
|
Impact of adoption of ASC 842
|
—
|
|
—
|
|
—
|
|
—
|
|
6.1
|
|
—
|
|
6.1
|
|
||||||||||||
|
Other
|
—
|
|
—
|
|
—
|
|
—
|
|
—
|
|
0.1
|
|
0.1
|
|
||||||||||||
|
Balance as of December 31, 2019
|
49,299
|
|
$
|
0.5
|
|
$
|
662.7
|
|
$
|
(50.7
|
)
|
$
|
(315.7
|
)
|
$
|
686.6
|
|
$
|
983.4
|
|
||||||
|
(1)
|
Includes post acquisition date adjustments in all periods, including reallocation in application of pushdown accounting in the 2017 successor period.
|
See notes to consolidated financial statements.
F-7
SURGERY PARTNERS, INC.
CONSOLIDATED STATEMENTS OF CASH FLOWS
(Dollars in millions)
|
Successor
|
Predecessor
|
|||||||||||||||||
|
Year Ended December 31,
|
September 1 to
December 31, |
January 1 to
August 31, |
||||||||||||||||
|
2019
|
2018
|
2017
|
2017
|
|||||||||||||||
|
Cash flows from operating activities:
|
||||||||||||||||||
|
Net income (loss)
|
$
|
45.1
|
|
$
|
(95.6
|
)
|
$
|
(1.7
|
)
|
$
|
30.4
|
|
||||||
|
Adjustments to reconcile net income (loss) to net cash provided by operating activities:
|
||||||||||||||||||
|
Depreciation and amortization
|
76.5
|
|
67.4
|
|
21.8
|
|
30.1
|
|
||||||||||
|
Non-cash interest expense (income), net
|
2.5
|
|
(1.4
|
)
|
(0.8
|
)
|
4.9
|
|
||||||||||
|
Equity-based compensation expense
|
10.2
|
|
9.3
|
|
1.9
|
|
3.7
|
|
||||||||||
|
(Gain) loss on disposals and deconsolidations, net
|
(4.4
|
)
|
31.8
|
|
—
|
|
1.7
|
|
||||||||||
|
Deferred income taxes
|
8.5
|
|
25.3
|
|
71.0
|
|
(18.7
|
)
|
||||||||||
|
Income from equity investments, net of distributions received
|
0.3
|
|
0.2
|
|
0.7
|
|
0.5
|
|
||||||||||
|
Loss on debt extinguishment
|
11.7
|
|
—
|
|
—
|
|
18.2
|
|
||||||||||
|
Non-cash lease expense
|
40.0
|
|
—
|
|
—
|
|
—
|
|
||||||||||
|
Impairment charges
|
7.9
|
|
74.4
|
|
—
|
|
—
|
|
||||||||||
|
Gain on legal settlements
|
—
|
|
—
|
|
(8.7
|
)
|
—
|
|
||||||||||
|
Gain on amendment to tax receivable agreement
|
—
|
|
—
|
|
(1.1
|
)
|
(15.3
|
)
|
||||||||||
|
Tax receivable agreement benefit
|
—
|
|
—
|
|
(25.3
|
)
|
—
|
|
||||||||||
|
Provision for doubtful accounts
|
—
|
|
—
|
|
12.5
|
|
16.3
|
|
||||||||||
|
Changes in operating assets and liabilities, net of acquisitions and divestitures:
|
||||||||||||||||||
|
Accounts receivable
|
(23.5
|
)
|
(22.8
|
)
|
(31.5
|
)
|
8.8
|
|
||||||||||
|
Other operating assets and liabilities
|
(45.3
|
)
|
56.0
|
|
14.4
|
|
(12.9
|
)
|
||||||||||
|
Net cash provided by operating activities
|
129.5
|
|
144.6
|
|
53.2
|
|
67.7
|
|
||||||||||
|
Cash flows from investing activities:
|
||||||||||||||||||
|
Purchases of property and equipment, net
|
(73.6
|
)
|
(39.8
|
)
|
(10.8
|
)
|
(18.8
|
)
|
||||||||||
|
Payments for acquisitions, net of cash acquired
|
(13.8
|
)
|
(106.8
|
)
|
(29.2
|
)
|
(725.9
|
)
|
||||||||||
|
Purchase of equity investments
|
(15.2
|
)
|
—
|
|
—
|
|
—
|
|
||||||||||
|
Proceeds from divestitures
|
17.6
|
|
19.2
|
|
1.2
|
|
0.1
|
|
||||||||||
|
Other investing activities
|
(0.2
|
)
|
(1.5
|
)
|
—
|
|
—
|
|
||||||||||
|
Net cash used in investing activities
|
(85.2
|
)
|
(128.9
|
)
|
(38.8
|
)
|
(744.6
|
)
|
||||||||||
|
Cash flows from financing activities:
|
||||||||||||||||||
|
Principal payments on long-term debt
|
(490.8
|
)
|
(157.6
|
)
|
(18.6
|
)
|
(1,164.2
|
)
|
||||||||||
|
Borrowings of long-term debt
|
506.9
|
|
282.7
|
|
0.4
|
|
1,806.0
|
|
||||||||||
|
Payments of debt issuance costs
|
(8.9
|
)
|
(3.0
|
)
|
—
|
|
(58.6
|
)
|
||||||||||
|
Penalty on prepayment of debt
|
(17.8
|
)
|
—
|
|
—
|
|
—
|
|
||||||||||
|
Distributions to non-controlling interest holders
|
(121.2
|
)
|
(109.0
|
)
|
(33.5
|
)
|
(50.3
|
)
|
||||||||||
|
(Payments) proceeds related to ownership transactions with non-controlling interest holders, net
|
(3.2
|
)
|
(2.2
|
)
|
1.0
|
|
(1.5
|
)
|
||||||||||
|
Proceeds from preferred stock issuance
|
—
|
|
—
|
|
—
|
|
310.0
|
|
||||||||||
|
Payments of stock issuance costs
|
—
|
|
—
|
|
—
|
|
(18.3
|
)
|
||||||||||
|
Payments of preferred dividends
|
—
|
|
(7.8
|
)
|
(1.3
|
)
|
—
|
|
||||||||||
|
Repurchase of shares
|
—
|
|
(2.0
|
)
|
(2.0
|
)
|
—
|
|
||||||||||
|
Other financing activities
|
(0.9
|
)
|
(7.4
|
)
|
0.3
|
|
(1.7
|
)
|
||||||||||
|
Net cash (used in) provided by financing activities
|
(135.9
|
)
|
(6.3
|
)
|
(53.7
|
)
|
821.4
|
|
||||||||||
|
Net (decrease) increase in cash, cash equivalents and restricted cash
|
(91.6
|
)
|
9.4
|
|
(39.3
|
)
|
144.5
|
|
||||||||||
|
Cash, cash equivalents and restricted cash at beginning of period
|
184.6
|
|
175.2
|
|
214.5
|
|
70.0
|
|
||||||||||
|
Cash, cash equivalents and restricted cash at end of period
|
$
|
93.0
|
|
$
|
184.6
|
|
$
|
175.2
|
|
$
|
214.5
|
|
||||||
|
Supplemental cash flow information:
|
||||||||||||||||||
|
Interest paid, net of interest income received
|
180.3
|
|
145.4
|
|
40.9
|
|
68.6
|
|
||||||||||
|
Cash paid for income taxes
|
1.6
|
|
2.2
|
|
0.5
|
|
0.6
|
|
||||||||||
|
Non-cash purchases of property and equipment
|
30.7
|
|
61.0
|
|
14.9
|
|
8.5
|
|
||||||||||
See notes to consolidated financial statements.
F-8
1. Organization and Summary of Accounting Policies
Organization
Surgery Partners, Inc.,
a
Delaware corporation (together with its subsidiaries, the "Company"), was formed April 2, 2015. On August 31, 2017, a fund advised by an affiliate of Bain Capital Private Equity ("Bain Capital"), purchased approximately
54.2%
of the Company’s outstanding common stock. As a result, Bain Capital became the controlling stockholder of the Company, holding Series A Preferred Stock (as defined in Note 7. "Redeemable Preferred Stock") and common stock that collectively represent approximately
67.0%
of the voting power of all classes of capital stock of the Company.
As of
December 31, 2019
, the Company owned and operated a national network of surgical facilities and ancillary services in
30
states. The surgical facilities, which include ambulatory surgery centers ("ASCs") and surgical hospitals, primarily provide non-emergency surgical procedures across many specialties, including, among others, gastroenterology, general surgery, ophthalmology, orthopedics and pain management. The Company's surgical hospitals also provide services such as diagnostic imaging, laboratory, obstetrics, oncology, pharmacy, physical therapy and wound care. Ancillary services are comprised of a diagnostic laboratory, multi-specialty physician practices, urgent care facilities, anesthesia services and optical services.
As of
December 31, 2019
, the Company owned or operated a portfolio of
128
surgical facilities, comprised of
112
ASCs and
16
surgical hospitals. The Company owns these facilities in partnership with physicians and, in some cases, health care systems in the markets and communities it serves. The Company owned a majority interest in
85
of the surgical facilities and consolidated
107
of the facilities for financial reporting purposes.
Basis of Presentation
The preparation of financial statements in conformity with generally accepted accounting principles ("GAAP") requires management to make estimates and assumptions that affect the amounts reported in the consolidated financial statements and footnotes. Examples include, but are not limited to, estimates of accounts receivable allowances, professional and general liabilities and the estimate of deferred tax assets or liabilities. Actual results could differ from those estimates.
The consolidated financial statements include the accounts of the Company and its wholly-owned subsidiaries, as well as interests in partnerships and limited liability companies controlled by the Company through its ownership of a majority voting interest or other rights granted to the Company by contract to manage and control the affiliate's business. All significant intercompany balances and transactions are eliminated in consolidation.
In connection with the change of control effective August 31, 2017, the Company elected to apply "pushdown" accounting by applying the guidance in Financial Accounting Standards Board ("FASB") Accounting Standards Codification Topic 805,
Business Combinations
. Accordingly, the consolidated financial statements of the Company for periods before and after August 31, 2017 reflect different bases of accounting, and the results of operations, changes in stockholders' equity and cash flows of those periods are not comparable. Throughout the Company's consolidated financial statements and the accompanying notes herein, periods prior to August 31, 2017 (the date of the change of control) are identified as "Predecessor" and periods after the date of the change of control are identified as "Successor."
Variable Interest Entities
The consolidated financial statements include the accounts of variable interest entities ("VIE") in which the Company is the primary beneficiary under the provisions of Accounting Standards Codification 810,
Consolidation
. The Company has the power to direct the activities that most significantly impact a variable interest entity's economic performance. Additionally, the Company would absorb the majority of the expected losses from any of these entities should such expected losses occur. At
December 31, 2019
, the variable interest entities include
four
surgical facilities,
three
anesthesia practices and
three
physician practices.
The total assets (excluding goodwill and intangible assets, net) of the consolidated VIEs included in the accompanying consolidated balance sheets as of
December 31, 2019
and
2018
, were
$36.2 million
and
$11.2 million
, respectively, and the total liabilities of the consolidated VIEs were
$25.2 million
and
$3.6 million
, respectively.
Fair Value of Financial Instruments
The fair value of a financial instrument is the amount at which the instrument could be exchanged in an orderly transaction between market participants to sell the asset or transfer the liability. The Company uses fair value measurements based on inputs classified into the following hierarchy:
|
•
|
Level 1: Unadjusted quoted prices in active markets for identical assets or liabilities.
|
|
•
|
Level 2: Inputs other than quoted prices that are observable for the asset or liability, either directly or indirectly. These may include quoted prices for similar assets or liabilities in active markets and quoted prices for identical or similar assets or liabilities in markets that are not active.
|
|
•
|
Level 3: Unobservable inputs in which little or no market data exists, therefore requiring an entity to develop its own assumptions, depending on the nature of the item being valued.
|
F-9
The carrying amounts reported in the consolidated balance sheets for cash and cash equivalents, accounts receivable, restricted invested assets and accounts payable approximate their fair values under Level 3 calculations.
A summary of the carrying amounts and fair values of the Company's long-term debt follows (in millions):
|
Carrying Amount
|
Fair Value
|
|||||||||||||||
|
December 31,
|
December 31,
|
|||||||||||||||
|
2019
|
2018
|
2019
|
2018
|
|||||||||||||
|
Senior secured term loan
|
$
|
1,434.1
|
|
$
|
1,447.9
|
|
$
|
1,434.1
|
|
$
|
1,382.7
|
|
||||
|
8.875% senior unsecured notes due 2021
|
$
|
—
|
|
$
|
406.7
|
|
$
|
—
|
|
$
|
407.2
|
|
||||
|
6.750% senior unsecured notes due 2025
|
$
|
370.0
|
|
$
|
370.0
|
|
$
|
368.2
|
|
$
|
320.5
|
|
||||
|
10.000% senior unsecured notes due 2027
|
$
|
430.0
|
|
$
|
—
|
|
$
|
471.4
|
|
$
|
—
|
|
||||
The fair values in the table above were based on a Level 2 inputs using quoted prices for identical liabilities in inactive markets. The carrying amounts related to the Company's other long-term debt obligations, including finance lease obligations, approximate their fair values under Level 3 calculations.
The Company has entered into certain interest rate swap agreements (see Note 8. Derivatives and Hedging Activity). At
December 31, 2019
and
2018
, the fair value of these derivative instruments was
$50.7 million
and
$22.4 million
, respectively, and was included in other long-term liabilities in the consolidated balance sheets. The fair value of these derivative financial instruments was based on a quoted market price, or a Level 2 input.
Revenues
In May 2014, the FASB issued Accounting Standards Update ("ASU") 2014-09,
Revenue from Contracts with Customers
. The Company adopted the new standard effective January 1, 2018, using the modified retrospective method. The presentation of the amount of earnings from operations and net earnings were unchanged upon adoption of the new standard; however, during the year of adoption, the Company determined that amounts historically considered to be bad debt should be considered an implicit price concession, as defined in FASB Accounting Standards Codification 606, "
Revenue From Contracts With Customers"
. This resulted in changes to the presentation of revenues and the provision for bad debts in the consolidated statements of operations. Previously, the estimate for unrealizable amounts was recorded to the provision for bad debts and presented as a component of operating expenses. Upon reassessment during the year of adoption, the estimate for unrealizable amounts is now reflected as an implicit price concession as a reduction to arrive at net revenue.
The Company's revenues generally relate to contracts with patients in which the performance obligations are to provide health care services. The Company recognizes revenues in the period in which our obligations to provide health care services are satisfied and reports the amount that reflects the consideration the Company expects to be entitled to receive. The contractual relationships with patients, in most cases, also involve a third-party payor (e.g., Medicare, Medicaid and private insurance organizations, including plans offered through the health insurance exchanges) and the transaction prices for the services provided are dependent upon the terms provided by or negotiated with the third-party payors. The payment arrangements with third-party payors for the services provided to the related patients typically specify payments at amounts less than the Company's standard charges. The Company continually reviews the contractual estimation process to consider and incorporate updates to laws and regulations and the frequent changes in managed care contractual terms resulting from contract renegotiations and renewals.
A summary of revenues by service type as a percentage of total revenues follows:
|
Successor
|
Predecessor
|
|||||||||||||
|
Year Ended December 31,
|
September 1 to
December 31, |
January 1 to
August 31, |
||||||||||||
|
2019
|
2018
|
2017
|
2017
|
|||||||||||
|
Patient service revenues:
|
||||||||||||||
|
Surgical facilities revenues
|
94.1
|
%
|
93.6
|
%
|
94.3
|
%
|
91.4
|
%
|
||||||
|
Ancillary services revenues
|
4.3
|
%
|
4.5
|
%
|
4.2
|
%
|
7.0
|
%
|
||||||
|
98.4
|
%
|
98.1
|
%
|
98.5
|
%
|
98.4
|
%
|
|||||||
|
Other service revenues:
|
||||||||||||||
|
Optical services revenues
|
0.2
|
%
|
0.5
|
%
|
0.6
|
%
|
1.0
|
%
|
||||||
|
Other
|
1.4
|
%
|
1.4
|
%
|
0.9
|
%
|
0.6
|
%
|
||||||
|
1.6
|
%
|
1.9
|
%
|
1.5
|
%
|
1.6
|
%
|
|||||||
|
Total revenues
|
100.0
|
%
|
100.0
|
%
|
100.0
|
%
|
100.0
|
%
|
||||||
F-10
Patient service revenues.
This revenue is related to charging facility fees in exchange for providing patient care. The fee charged for health care procedures performed in surgical facilities varies depending on the type of service provided, but usually includes all charges for usage of an operating room, a recovery room, special equipment, medical supplies, nursing staff and medications. The fee does not normally include professional fees charged by the patient’s surgeon, anesthesiologist or other attending physician, which are billed directly by such physicians to the patient or third-party payor. However, in several surgical facilities, the Company charges for anesthesia services. Ancillary service revenues include fees for patient visits to the Company's physician practices, pharmacy services and diagnostic tests ordered by physicians.
Patient service revenues are recognized as performance obligations are satisfied. Performance obligations are based on the nature of services provided. Typically, the Company recognizes revenue at a point in time in which services are rendered and the Company has no obligation to provide further patient services. As the Company primarily performs outpatient procedures, performance obligations are generally satisfied same day and revenue is recognized on the date of service.
The Company determines the transaction price based on gross charges for services provided, net of estimated contractual adjustments, discounts from third-party payors. The Company estimates its contractual adjustments and discounts based on contractual agreements, its discount policies and historical experience. Changes in estimated contractual adjustments and discounts are recorded in the period of change.
Other service revenues.
Optical service revenues consist of handling charges billed to the members of the Company's optical products purchasing organization. The Company's optical products purchasing organization negotiates volume buying discounts with optical products manufacturers. The buying discounts and any handling charges billed to the members of the buying group represent the revenue recognized for financial reporting purposes. The Company satisfies the performance obligation and recognizes revenue when the orders are shipped to members. The Company bases its estimates for sales returns and discounts on historical experience and has not experienced significant fluctuations between estimated and actual return activity and discounts given.
Other revenues include management and administrative service fees derived from the non-consolidated facilities that the Company accounts for under the equity method, management of surgical facilities in which it does not own an interest, and management services provided to physician practices for which the Company is not required to provide capital or additional assets. These agreements typically require the Company to provide recurring management services over a multi-year period which are billed and collected on a monthly basis. The fees derived from these management arrangements are based on a predetermined percentage of the revenues of each facility or practice and are recognized in the period in which management services are rendered and billed.
The following table sets forth patient service revenues by type of payor and as a percentage of total patient service revenues for the Company's consolidated surgical facilities (dollars in millions):
|
Successor
|
Predecessor
|
|||||||||||||||||||||||||||||
|
Year Ended December 31,
|
Year Ended December 31,
|
September 1 to
December 31, |
January 1 to
August 31, |
|||||||||||||||||||||||||||
|
2019
|
2018
|
2017
|
2017
|
|||||||||||||||||||||||||||
|
Amount
|
%
|
Amount
|
%
|
Amount
|
%
|
Amount
|
%
|
|||||||||||||||||||||||
|
Patient service revenues:
|
||||||||||||||||||||||||||||||
|
Private insurance
|
$
|
970.5
|
|
53.8
|
%
|
$
|
948.9
|
|
54.6
|
%
|
$
|
347.8
|
|
59.6
|
%
|
$
|
360.1
|
|
48.9
|
%
|
||||||||||
|
Government
|
701.9
|
|
38.9
|
%
|
653.3
|
|
37.6
|
%
|
196.9
|
|
33.7
|
%
|
309.0
|
|
42.0
|
%
|
||||||||||||||
|
Self-pay
|
46.1
|
|
2.6
|
%
|
50.0
|
|
2.9
|
%
|
15.2
|
|
2.6
|
%
|
15.9
|
|
2.2
|
%
|
||||||||||||||
|
Other
(1)
|
84.6
|
|
4.7
|
%
|
84.8
|
|
4.9
|
%
|
23.9
|
|
4.1
|
%
|
51.4
|
|
6.9
|
%
|
||||||||||||||
|
Total patient service revenues
|
1,803.1
|
|
100.0
|
%
|
1,737.0
|
|
100.0
|
%
|
583.8
|
|
100.0
|
%
|
736.4
|
|
100.0
|
%
|
||||||||||||||
|
Other service revenues:
|
||||||||||||||||||||||||||||||
|
Optical service revenues
|
3.8
|
|
9.5
|
|
3.5
|
|
7.6
|
|
|
|
||||||||||||||||||||
|
Other revenues
|
24.5
|
|
25.0
|
|
5.3
|
|
4.6
|
|
|
|
||||||||||||||||||||
|
Total revenues
|
$
|
1,831.4
|
|
$
|
1,771.5
|
|
$
|
592.6
|
|
$
|
748.6
|
|
||||||||||||||||||
|
(1)
|
Other is comprised of anesthesia service agreements, auto liability, letters of protection and other payor types.
|
The increase in other revenues from 2017 to 2018 is primarily due to an increase in management and administrative service fees due to the acquisitions completed in 2017. Total net revenues in 2018 additionally reflect the impact of the Company's adoption of ASU 2014-09 as discussed above.
Subsequent to the transactions on August 31, 2017 (Predecessor), the Company, as part of a review of operations undertaken to create a solid foundation to support the Company's long-term growth objectives, incurred a non-recurring adjustment to revenue of
$15.6 million
, which was attributable to an increase in reserves for certain accounts receivable during the eight months ended August 31, 2017 (Predecessor). The increase in reserves resulted from certain known events and actions during the eight months ended August 31, 2017 (Predecessor) related to select payors primarily in the Company’s ancillary services segment. Upon consideration of such additional information, related receivables
F-11
were determined to have a low likelihood of collection. The majority of this adjustment related to receivables with balances from the first quarter of 2016 and prior.
Cash, Cash Equivalents and Restricted Cash
The Company considers all highly liquid investments with a maturity of three months or less when purchased to be cash equivalents. The Company maintains its cash and cash equivalent balances at high credit quality financial institutions.
Cash, cash equivalents and restricted cash reported within the consolidated statement of cash flows includes
$0.3 million
of restricted investments, which are reflected in other long-term assets in the consolidated balance sheet at both
December 31, 2019
and
2018
. These restricted investments represent restricted cash held in accordance with the provisions of a long-term operating lease agreement held as security for performance under the Company's covenants and obligations within the agreement through January 2024.
Accounts Receivable
Accounts receivable from third-party payors are recorded net of estimated implicit price concessions, which are estimated based on the historical trend of the Company's surgical facilities’ cash collections and contractual write-offs, established fee schedules, relationships with payors and procedure statistics. While changes in estimated reimbursement from third-party payors remain a possibility, the Company expects that any such changes would be minimal and, therefore, would not have a material effect on its financial condition or results of operations.
Accounts receivable consists of receivables from federal and state agencies (under the Medicare and Medicaid programs), private insurance organizations, employers and patients. Management recognizes that revenues and receivables from government agencies are significant to the Company's operations, but it does not believe that there is significant credit risk associated with these government agencies. Concentration of credit risk with respect to other payors is limited because of the large number of such payors. As of
December 31, 2019
and
December 31, 2018
, the Company had a net third-party Medicaid settlements liability of
$5.6 million
and
$4.8 million
, respectively.
The Company recognizes that final reimbursement of accounts receivable is subject to final approval by each third-party payor. However, because the Company has contracts with its third-party payors and also verifies insurance coverage of the patient before medical services are rendered, the amounts that are pending approval from third-party payors are not considered significant. Amounts are classified outside of self-pay if the Company has an agreement with the third-party payor or has verified a patient’s coverage prior to services rendered. The Company's policy is to collect co-payments and deductibles prior to providing medical services. Patient services of the Company are primarily non-emergency, which allows the surgical facilities to control the procedures for which third-party reimbursement is sought and obtained. The Company does not require collateral from self-pay patients.
The Company's collection policies and procedures are based on the type of payor, size of claim and estimated collection percentage for each patient account. The operating systems used to manage patient accounts provide for an aging schedule in 30-day increments, by payor, physician and patient. The Company analyzes accounts receivable at each of its surgical facilities to ensure the proper collection and aged category. The operating systems generate reports that assist in the collection efforts by prioritizing patient accounts. Collection efforts include direct contact with third-party payors or patients, written correspondence and the use of legal or collection agency assistance, as required.
A summary of the changes in the allowance for doubtful accounts receivable follows (in millions):
|
Balance at Beginning of Period
|
Provision for Doubtful Accounts
|
Accounts Written off, Net of Recoveries
|
Impact of adoption of ASC 606
|
Balance at End of Period
|
||||||||||||||||
|
Predecessor
|
||||||||||||||||||||
|
Eight months ended August 31, 2017
|
$
|
29.9
|
|
$
|
16.3
|
|
$
|
(14.1
|
)
|
$
|
—
|
|
$
|
32.1
|
|
|||||
|
Successor
|
||||||||||||||||||||
|
Four months ended December 31, 2017
|
—
|
|
12.5
|
|
(10.5
|
)
|
—
|
|
2.0
|
|
||||||||||
|
Year ended December 31, 2018
|
2.0
|
|
—
|
|
—
|
|
(2.0
|
)
|
—
|
|
||||||||||
The receivables related to the Company's optical products purchasing organization are recognized separately from patient accounts receivable and are included in other current assets in the consolidated balance sheets. Such receivables were
$8.6 million
and
$8.5 million
at
December 31, 2019
and
2018
, respectively.
Impairment of Long-Lived Assets, Goodwill and Intangible Assets
The Company evaluates the carrying value of long-lived assets when impairment indicators are present or when circumstances indicate that impairment may exist. The Company performs an impairment test by preparing an expected undiscounted cash flow projection. If the projection indicates that the recorded amount of the long-lived asset is not expected to be recovered, the carrying value is reduced to estimated fair value. The cash flow projection and fair value represents management’s best estimate, using appropriate and customary assumptions, projections and methodologies, at the date of evaluation. For discussion on impairment for goodwill and indefinite-lived intangible assets, refer to Note 4. "Goodwill and Intangible Assets."
F-12
Professional and General and Workers' Compensation Insurance
The Company maintains general liability and professional liability insurance in excess of self-insured retentions through third party commercial insurance carriers in amounts that management believes is sufficient for the Company's operations, although, potentially, some claims may exceed the scope of coverage in effect. The professional and general insurance coverage is on a claims-made basis. The Company also maintains workers' compensation insurance, subject to a deductible.
The Company expenses the costs under the self-insured retention exposure for general and professional liability and workers' compensation claims which relate to (i) claims made during the policy period, which are offset by insurance recoveries and (ii) an estimate of claims incurred but not yet reported that are expected to be reported after the policy period expires. Reserves and provisions are based upon actuarially determined estimates using individual case-basis valuations and actuarial analysis. Reserves for professional, general and workers' compensation claim liabilities are determined with no regard for expected insurance recoveries and are presented gross on the consolidated balance sheets.
Derivative Instruments and Hedging Activities
In accordance with Accounting Standards Codification 815,
Derivatives and Hedging
, the Company records all derivatives on the balance sheet at fair value. The accounting for changes in the fair value of derivatives depends on the intended use of the derivative, whether the Company has elected to designate a derivative in a hedging relationship and apply hedge accounting and whether the hedging relationship has satisfied the criteria necessary to apply hedge accounting. Hedge accounting generally provides for the matching of the timing of gain or loss recognition on the hedging instrument with the recognition of the changes in the fair value of the hedged asset or liability that are attributable to the hedged risk in a fair value hedge or the earnings effect of the hedged forecasted transactions in a cash flow hedge. The Company may enter into derivative contracts that are intended to economically hedge certain of its risk, even though hedge accounting does not apply or the Company elects not to apply hedge accounting.
In accordance with the FASB’s fair value measurement guidance in ASU 2011-04, the Company made an accounting policy election to measure the credit risk of its derivative financial instruments that are subject to master netting agreements on a net basis by counterparty portfolio.
Investments in Unconsolidated Affiliates
Investments in unconsolidated affiliates in which the Company exerts significant influence but does not control or otherwise consolidate are accounted for using the equity method. Equity method investments are initially recorded at cost, unless the investments are a result of the Company losing control of a previously controlled entity, but still retaining a non-controlling interest. Transactions that result in the deconsolidation of a previously consolidated entity, are measured at fair value. The fair value measurement utilizes Level 3 inputs, which include unobservable data, to measure the fair value of the retained non-controlling interest. The fair value determination is generally based on a combination of multiple valuation methods, which can include discounted cash flow, income approach, or market value approach which incorporates estimates of future earnings and market valuation multiples for certain guideline companies. These investments are included as investments in and advances to affiliates in the accompanying consolidated balance sheets. The Company’s share of the profits and losses from these investments is reported in income from equity investments in the accompanying consolidated statements of operations. The Company monitors its investments for other-than-temporary impairment by considering factors such as current economic and market conditions and the operating performance of the investees and records reductions in carrying values when necessary.
Summarized financial information for these equity method investees is included in the following tables (in millions):
|
December 31,
|
||||||||
|
2019
|
2018
|
|||||||
|
Current assets
|
$
|
51.8
|
|
$
|
41.2
|
|
||
|
Noncurrent assets
|
$
|
47.4
|
|
$
|
27.8
|
|
||
|
Current liabilities
|
$
|
25.5
|
|
$
|
21.8
|
|
||
|
Noncurrent liabilities
|
$
|
5.8
|
|
$
|
3.8
|
|
||
|
Year Ended December 31,
|
||||||||
|
2019
|
2018
|
|||||||
|
Net revenues
|
$
|
188.5
|
|
$
|
169.8
|
|
||
|
Cost of revenues
|
$
|
132.0
|
|
$
|
118.5
|
|
||
|
Net income
|
$
|
51.1
|
|
$
|
48.2
|
|
||
The results of operations for the Company's equity method investees was not considered material for the four months ended December 31, 2017 (Successor) and the eight months ended August 31, 2017 (Predecessor).
F-13
During the year ended
December 31, 2019
, the Company acquired non-controlling interests, primarily in
four
surgical facilities, for a cash investment of
$15.2 million
. The non-controlling interests were accounted for as equity method investments.
During the year ended December 31, 2018, the Company sold a portion of its interest in
one
surgery center for net cash proceeds of
$0.5 million
. As a result of this transaction, the Company lost control of the previously controlled entity but retains a non-controlling interest, resulting in the deconsolidation of the previously consolidated entity. The remaining non-controlling interest was accounted for as an equity method investment, and initially measured and recorded at fair value as of the date of the transaction. The transaction resulted in a pretax gain on deconsolidation of
$1.1 million
, which is included in loss on disposals and deconsolidations, net, in the accompanying consolidated statement of operations for the year ended December 31, 2018. The gain was determined based on the difference between the fair value of the Company's retained interest in the entity and the carrying value of both the tangible and intangible assets of the entity immediately prior to the transaction less cash proceeds received. The fair value of the investment of
$2.0 million
was recorded as a component of investments in and advances to affiliates in the accompanying consolidated balance sheets.
Non-Controlling Interests
The physician limited partners and physician minority members of the entities that the Company controls are responsible for the supervision and delivery of medical services. The governance rights of limited partners and minority members are restricted to those that protect their financial interests. Under certain partnership and operating agreements governing these partnerships and limited liability companies, the Company could be removed as the sole general partner or managing member for certain events such as material breach of the partnership or operating agreement, gross negligence or bankruptcy. These protective rights do not preclude consolidation of the respective partnerships and limited liability companies.
Ownership interests in consolidated subsidiaries held by parties other than the Company are identified and generally presented in the consolidated financial statements within the equity section but separate from the Company's equity. However, in instances in which certain redemption features that are not solely within the control of the Company are present, classification of non-controlling interests outside of permanent equity is required. Consolidated net income attributable to the Company and to the non-controlling interests are identified and presented on the consolidated statements of operations; changes in ownership interests in which the Company retains a controlling interest are accounted for as equity transactions assuming the Company continues to consolidate related entities. Certain transactions with non-controlling interests are classified within financing activities in the consolidated statements of cash flows.
The consolidated financial statements of the Company include all assets, liabilities, revenues and expenses of surgical facilities in which the Company has sufficient ownership and rights to allow the Company to consolidate the surgical facilities. Similar to its investments in non-consolidated affiliates, the Company regularly engages in the purchase and sale of ownership interests with respect to its consolidated subsidiaries that do not result in a change of control.
Non-Controlling Interests — Redeemable.
Each partnership and limited liability company through which the Company owns and operates its surgical facilities is governed by a partnership or operating agreement. In certain circumstances, the applicable partnership or operating agreements for the Company's surgical facilities provide that the facilities will purchase all of the physician limited partners’ or physician minority members', as applicable, ownership if certain adverse regulatory events occur, such as it becoming illegal for the physician(s) to own an interest in a surgical facility, refer patients to a surgical facility or receive cash distributions from a surgical facility. The non-controlling interests
—
redeemable are reported outside of stockholders' equity in the consolidated balance sheets.
A summary of activity related to the non-controlling interests—redeemable follows (in millions):
|
December 31,
|
||||||||
|
2019
|
2018
|
|||||||
|
Balance at beginning of period
|
$
|
326.6
|
|
$
|
299.3
|
|
||
|
Net income attributable to non-controlling interests—redeemable
|
39.1
|
|
34.6
|
|
||||
|
(Disposal) and acquisition of shares of non-controlling interests, net—redeemable
(1)
|
(4.7
|
)
|
23.7
|
|
||||
|
Distributions to non-controlling interest —redeemable holders
|
(40.0
|
)
|
(30.7
|
)
|
||||
|
Other
|
—
|
|
(0.3
|
)
|
||||
|
Balance at end of period
|
$
|
321.0
|
|
$
|
326.6
|
|
||
|
(1)
|
Includes post acquisition date adjustments in all periods.
|
Inventories
Inventories, which consist primarily of medical and drug supplies, are stated at the lower of cost or market value. Cost is determined using the first-in, first-out method.
Recent Accounting Pronouncements
In February 2016, the FASB issued ASU 2016-02, "Leases" (the "Lease Accounting Standard"). The Company adopted the Lease Accounting Standard effective January 1, 2019, using a modified retrospective transition approach. The most prominent among the changes
F-14
from this ASU is the recognition of right-of-use assets and lease liabilities by lessees for those leases classified as operating leases. The Company’s accounting for finance leases remained substantially unchanged from its prior accounting for capital leases. Upon adoption of the Lease Accounting Standard, the Company recorded
$294.0 million
of operating lease liabilities and right-of-use assets on January 1, 2019. The cumulative effect of the accounting change recognized upon adoption was
$6.1 million
reflected as an adjustment to retained deficit in our consolidated balance sheets. See Note 6. "Leases" for further discussion.
In June 2016, the FASB issued ASU 2016-13, which introduced a new model for recognizing credit losses on financial instruments based on an estimate of the current expected credit losses. The new current expected credit losses ("CECL") model generally calls for the immediate recognition of all expected credit losses and applies to financial instruments and other assets, including accounts receivable and other financial assets measured at amortized cost, debt securities and other financial assets. This guidance replaces the current incurred loss model for measuring expected credit losses, requires expected losses on available-for-sale debt securities to be recognized through an allowance for credit losses rather than as reductions in the amortized cost of the securities, and provides for additional disclosure requirements. This ASU is effective for fiscal years beginning after December 15, 2019, and interim periods within those fiscal years, with early adoption permitted. The Company adopted this ASU on January 1, 2020, and does not expect the adoption of this ASU will have a material impact on its consolidated financial position and results of operations.
2. Acquisitions and Disposals
The Company accounts for business combinations in accordance with the fundamental requirements of the acquisition method of accounting and under the premise that an acquirer can be identified for each business combination. The acquirer is the entity that obtains control of one or more businesses in the business combination and the acquisition date is the date the acquirer achieves control. The assets acquired, liabilities assumed and any non-controlling interests in the acquired business at the acquisition date are recognized at their fair values as of that date, and the direct costs incurred in connection with the business combination are recorded and expensed separately from the business combination. Any goodwill recognized is determined as the excess of the fair value of the consideration conveyed plus the fair value of any non-controlling interests in the acquisition over the fair value of the net assets acquired. Acquisitions in which the Company is able to exert significant influence but does not have control are accounted for using the equity method.
Acquired assets and assumed liabilities typically include, but are not limited to, fixed assets, intangible assets and professional liabilities. The valuations are based on appraisal reports, discounted cash flow analyses, actuarial analyses or other appropriate valuation techniques to determine the fair value of the assets acquired or liabilities assumed. Fair value attributable to non-controlling interests is based on a Level 3 computation using significant inputs that are not observable in the market. Key inputs used to determine the fair value include financial multiples used in the purchase of non-controlling interests, primarily from acquisitions of surgical facilities. Such multiples, based on earnings, are used as a benchmark for the discount to be applied for the lack of control or marketability. Fair value attributable to the property and equipment acquired is based on Level 3 computations using key inputs such as cost trend data and comparable asset sales. Fair value attributable to the intangible assets acquired is based on Level 3 computations using key inputs such as the Company's internally-prepared financial projections. Fair values assigned to acquired working capital are based on carrying amounts reported by the acquiree at the date of acquisition, which approximate their fair values.
Acquisitions
During the year ended
December 31, 2019
, the Company acquired a controlling interest in
one
surgical facility, a clinic that was merged into an existing facility and a physician practice for total aggregate consideration of
$26.7 million
, including cash consideration of
$20.1 million
, net of cash acquired. The remainder of the consideration related to the forgiveness of certain amounts due to the Company from the acquired clinic. The cash consideration was funded through cash from operations. The total consideration was allocated to the assets acquired and liabilities assumed based upon the respective acquisition date fair values.
During the year ended December 31, 2018, the Company acquired a controlling interest in
five
surgical facilities in new markets, two surgical facilities in existing markets, one of which was merged into an existing facility and multiple physician practices for a combined cash purchase price of
$105.6 million
, net of cash acquired. The 2018 acquisitions were funded through cash from operations. The total consideration related to these acquisitions was allocated to the assets acquired and liabilities assumed based upon their respective acquisition date fair values.
F-15
Preliminary or final amounts recognized for each major class of assets acquired and liabilities assumed for acquisitions completed during the years ended December 31,
2019
and
2018
, including post acquisition date adjustments, are as follows (in millions):
|
2019
|
2018
|
|||||||
|
Cash consideration
(1)
|
$
|
26.7
|
|
$
|
106.4
|
|
||
|
Fair value of non-controlling interests
|
8.3
|
|
63.8
|
|
||||
|
Aggregate acquisition date fair value
|
$
|
35.0
|
|
$
|
170.2
|
|
||
|
Net assets acquired:
|
||||||||
|
Current Assets
|
$
|
5.4
|
|
$
|
12.6
|
|
||
|
Property and equipment
|
1.8
|
|
5.3
|
|
||||
|
Intangible assets
|
—
|
|
0.4
|
|
||||
|
Goodwill
|
22.6
|
|
155.9
|
|
||||
|
Other long-term assets
(2)
|
37.7
|
|
6.6
|
|
||||
|
Current liabilities
|
(4.1
|
)
|
(6.5
|
)
|
||||
|
Long-term debt
|
(0.2
|
)
|
—
|
|
||||
|
Long-term liabilities
|
(28.2
|
)
|
(4.1
|
)
|
||||
|
Aggregate acquisition date fair value
|
$
|
35.0
|
|
$
|
170.2
|
|
||
|
(1)
|
In connection with the clinic acquisition in 2019, the Company acquired the remaining non-controlling interests in one of its existing consolidated surgical facilities. As such,
$6.3 million
of the cash consideration for the clinic acquisition was classified as a financing activity and presented in payments related to ownership transactions with non-controlling interest holders in the Consolidated Statements of Cash Flows.
|
|
(2)
|
The assets acquired in 2019 includes the fair value of a non-controlling investment held by the acquired clinic in one of the Company's consolidated surgical facilities of
$8.8 million
. This investment asset was subsequently eliminated in consolidation.
|
The fair values assigned to certain assets acquired and liabilities assumed by the Company in
2019
have been estimated on a preliminary basis and are subject to change as new facts and circumstances emerge that were present at the date of acquisition. During the year ended
December 31, 2019
, no significant changes were made to the purchase price allocation of assets and liabilities, existing at the date of acquisition, related to individual acquisitions completed in
2018
. The goodwill acquired in connection with the
2019
acquisitions was allocated to the Company's reportable segments as follows:
$14.1 million
to surgical facility services and
$8.5 million
to ancillary services. The results of operations of the
2019
acquisitions are included in the Company’s results of operations beginning on the dates of acquisitions, and were not considered significant for the year ended
December 31, 2019
.
Disposals
During the year ended
December 31, 2019
, the Company disposed of previously owned real property associated with one of its existing non-consolidated surgical facilities. In connection with the sale, the Company recognized a
$10.9 million
pretax gain included in loss (gain) on disposals and deconsolidations, net in the accompanying consolidated statements of operations. The sale did not impact the Company's investment in the surgical facility, which continues to be accounted for as an equity method investment.
During the year ended December 31, 2018, the Company disposed of
four
surgery centers,
two
surgical hospitals and its optical laboratory for net cash proceeds of
$18.7 million
, and recognized a net pretax loss of
$21.2 million
included in loss on disposals and deconsolidations, net in the consolidated statement of operations for the year ended
December 31, 2018
. This non-cash loss was primarily a result of the write-off of the net assets of the facility (net of proceeds received) and was primarily driven by the write-off of the associated goodwill.
3. Property and Equipment
Property and equipment are stated at cost or, if obtained through acquisition, at fair value determined on the date of acquisition. Depreciation is recognized using the straight-line method over the estimated useful lives of the assets, generally
20
to
40
years for buildings and building improvements,
three
to
five
years for computers and software and
five
to
seven
years for furniture and equipment. Leasehold improvements are depreciated on a straight-line basis over the shorter of the lease term or the estimated useful life of the assets. Routine maintenance and repairs are expensed as incurred, while expenditures that increase capacities or extend useful lives are capitalized.
The Company also leases certain facilities and equipment under finance leases. Assets held under finance leases are stated at the present value of lease payments at the inception of the related lease. Such assets are amortized on a straight-line basis over the lesser of the lease term or the remaining useful life of the leased asset.
F-16
A summary of property and equipment follows (in millions):
|
December 31,
|
||||||||
|
2019
|
2018
|
|||||||
|
Land
|
$
|
11.0
|
|
$
|
19.5
|
|
||
|
Buildings and improvements
|
106.6
|
|
200.4
|
|
||||
|
Furniture and equipment
|
23.1
|
|
24.1
|
|
||||
|
Computer and software
|
59.8
|
|
33.9
|
|
||||
|
Medical equipment
|
148.3
|
|
139.6
|
|
||||
|
Right-of-use finance lease asset
|
259.3
|
|
—
|
|
||||
|
Construction in progress
|
25.9
|
|
64.9
|
|
||||
|
Property and equipment, at cost
|
634.0
|
|
482.4
|
|
||||
|
Less: Accumulated depreciation
|
(110.7
|
)
|
(56.1
|
)
|
||||
|
Property and equipment, net
|
$
|
523.3
|
|
$
|
426.3
|
|
||
At December 31, 2018, the Company had certain land, buildings and improvements that arose solely as a result of the Company being the deemed accounting owner under the build-to-suit guidance in in effect prior to the adoption of the Lease Accounting Standard. Upon adoption of the Lease Accounting Standard on January 1, 2019, the Company derecognized the build-to-suit assets and related liabilities and concluded the leases should be recognized on the balance sheet as finance leases under the new guidance. Further the Company had an ongoing development agreement to construct a new hospital, which costs were recognized as incurred as construction in progress at December 31, 2018. Upon reevaluation, the Company concluded that it did not control the assets under construction and therefore the obligation and related asset were derecognized from the balance sheets upon adoption of the Lease Accounting Standard. The lease related to this new hospital commenced in November 2019, and is recognized as a finance lease at December 31, 2019 (see Note. 6 "Leases").
Depreciation expense was
$71.9 million
and
$62.5 million
for the years ended
December 31, 2019
and 2018 (Successor), respectively,
$20.0 million
for the four months ended
December 31, 2017
(Successor) and
$24.1 million
for the eight months ended August 31, 2017 (Predecessor).
4. Goodwill and Intangible Assets
Goodwill represents the fair value of the consideration provided in an acquisition over the fair value of net assets acquired and is not amortized. The Company has indefinite-lived intangible assets related to the certificates of need held in jurisdictions where certain of its surgical facilities are located, Medicare licenses and certain management rights agreements. The Company also has finite-lived intangible assets related to physician guarantee agreements, non-compete agreements, management rights agreements and customer relationships. Physician income guarantees are amortized into salaries and benefits costs in the consolidated statements of operations over the commitment period of the contract, generally
three
to
four years
. Non-compete agreements and management rights agreements are amortized into depreciation and amortization expense in the consolidated statements of operations over the service lives of the agreements, typically ranging from
two
to
five years
for non-compete agreements and
15 years
for the management rights agreements. Customer relationships are amortized into depreciation and amortization expense in the consolidated statements of operations over the estimated lives of the relationships, ranging from
three
to
ten years
.
The Company tests its goodwill and indefinite-lived intangible assets for impairment at least annually, as of October 1, or more frequently if certain indicators arise. The Company tests for goodwill impairment at the reporting unit level, which is defined as one level below an operating segment. As of October 1, 2019, the Company has identified
three
reporting units, which include the following: 1) Surgical Facilities, 2) Ancillary Services, and 3) Alliance, which is a component of the Optical Services operating segment. In 2018, the Company disposed of
two
previously identified reporting units, Midwest Labs and Family Vision Care.
The Company compares the carrying value of the net assets of the reporting unit to the estimated fair value of the reporting unit. To determine the fair value of the reporting units, the Company obtained valuations at the reporting unit level prepared by third-party valuation specialists which utilized a combination of the income and market approaches. The discounted cash flow model is projected based on a year-by-year assessment that considers historical results, estimated market conditions, internal projections, and relevant publicly available statistics. Determining fair value requires the exercise of significant judgment, including assumptions about appropriate discount rates, perpetual growth rates and the amount and timing of expected future cash flows. The significant judgments are typically based upon Level 3 inputs, generally defined as unobservable inputs representing the Company's own assumptions. The cash flows employed in the discounted cash flow analysis are based on the Company's most recent budgets and business plans aligned with provided guidance and, when applicable, various growth rates are assumed for years beyond the current business plan period. Discount rate assumptions are based on an assessment of the risk inherent in the future cash flows of the respective reporting units. The variables within the discount rate, many of which are outside of the Company's control, provide the best estimate of all assumptions applied within the DCF model. There can be no assurance that operations will achieve the future cash flows reflected in the projections. In determining the fair value under the market approaches, the analysis includes a control
F-17
premium, which was based on observable market data and a review of selected transactions of companies that operate in the Company's sector. While the Company believes that all assumptions utilized in the testing were appropriate, they may not reflect actual outcomes that could occur. Specific factors that could negatively impact the assumptions used include changes to the discount and growth rates and a change in the equity and enterprise premiums being realized in the market.
As of October 1, 2019, prior to impairment testing, the Company had
three
reporting units with allocated goodwill as follows: 1) Surgical Facilities -
$3.4 billion
, 2) Ancillary Services -
$28.6 million
, and 3) Alliance -
$11.6 million
. As of the October 1, 2019 valuation, the fair value for both the Surgical Facilities and Ancillary Services reporting units was substantially in excess of its carrying value. For the Alliance reporting unit, the carrying value exceeded the fair value, resulting in non-cash impairment charges of
$2.5 million
in accordance with ASU No. 2017-04.
As a result of the impairment charges, the fair value equaled carrying value as of October 1, 2019 for the Alliance reporting unit, any future adverse events or changes in the assumptions could require additional impairment. Subsequent to the date of our annual impairment test, the Company considered its operating results for the fourth quarter of 2019, macroeconomic, industry and market conditions, and other market indicators including its market capitalization. Based on its evaluation of all such factors, the Company concluded that an event had not occurred or circumstances had not changed that would more likely than not reduce the fair value of its reporting units below their carrying values.
During the year ended December 31, 2018, as a result of its impairment testing, the Company recorded non-cash impairment charges of
$60.7 million
and
$13.7 million
related to the Ancillary Services and Alliance reporting units, respectively.
A summary of the changes in the carrying amount of goodwill follows (in millions):
|
|
December 31,
|
|||||||
|
2019
|
2018
|
|||||||
|
Balance at beginning of period
|
$
|
3,382.8
|
|
$
|
3,346.8
|
|
||
|
Acquisitions, including post acquisition adjustments
|
22.3
|
|
143.5
|
|
||||
|
Disposals and deconsolidations
|
(0.2
|
)
|
(33.1
|
)
|
||||
|
Impairment
|
(2.5
|
)
|
(74.4
|
)
|
||||
|
Balance at end of period
|
$
|
3,402.4
|
|
$
|
3,382.8
|
|
||
A summary of the Company's acquisitions and disposals for the years ended
December 31, 2019
and
2018
is included in Note 2. "Acquisitions and Disposals."
A summary of the components of intangible assets follows (in millions):
|
December 31, 2019
|
December 31, 2018
|
|||||||||||||||||||||||
|
Gross Carrying Amount
|
Accumulated Amortization
|
Net
|
Gross Carrying Amount
|
Accumulated Amortization
|
Net
|
|||||||||||||||||||
|
Finite-lived intangible assets:
|
|
|
||||||||||||||||||||||
|
Management rights agreements
|
$
|
31.1
|
|
$
|
(7.3
|
)
|
$
|
23.8
|
|
$
|
41.6
|
|
$
|
(4.2
|
)
|
$
|
37.4
|
|
||||||
|
Other
|
8.8
|
|
(4.5
|
)
|
4.3
|
|
6.4
|
|
(2.8
|
)
|
3.6
|
|
||||||||||||
|
Total finite-lived intangible assets
|
39.9
|
|
(11.8
|
)
|
28.1
|
|
48.0
|
|
(7.0
|
)
|
41.0
|
|
||||||||||||
|
Indefinite-lived intangible assets
|
19.2
|
|
—
|
|
19.2
|
|
13.3
|
|
—
|
|
13.3
|
|
||||||||||||
|
Total intangible assets
|
$
|
59.1
|
|
$
|
(11.8
|
)
|
$
|
47.3
|
|
$
|
61.3
|
|
$
|
(7.0
|
)
|
$
|
54.3
|
|
||||||
During the year ended December 31, 2019, the Company acquired a clinic that was previously managed by the Company. As a result of the transaction, the Company determined the management rights agreement related to the acquired clinic no longer provided a future benefit. As such, the Company recorded non-cash impairment charges of
$5.4 million
, which was included as a component of impairment charges on the accompanying consolidated statement of operations.
Amortization expense for intangible assets was
$4.6 million
and
$4.9 million
for the years ended
December 31, 2019
and 2018 (Successor), respectively,
$1.8 million
for the four months ended December 31, 2017 (Successor) and
$6.0 million
for the eight months ended August 31, 2017 (Predecessor).
F-18
Total estimated amortization expense for the next five years and thereafter related to intangible assets follows (in millions):
|
2020
|
$
|
4.5
|
|
|
|
2021
|
4.1
|
|
||
|
2022
|
3.2
|
|
||
|
2023
|
2.1
|
|
||
|
2024
|
1.8
|
|
||
|
Thereafter
|
12.4
|
|
||
|
Total
|
$
|
28.1
|
|
|
5. Long-Term Debt
A summary of long-term debt follows (in millions):
|
December 31,
|
||||||||
|
2019
|
2018
|
|||||||
|
Senior secured term loan
(1)
|
$
|
1,434.1
|
|
$
|
1,447.9
|
|
||
|
Senior secured revolving credit facility
|
—
|
|
—
|
|
||||
|
8.875% senior unsecured notes due 2021
(2)
|
—
|
|
406.7
|
|
||||
|
6.750% senior unsecured notes due 2025
|
370.0
|
|
370.0
|
|
||||
|
10.000% senior unsecured notes due 2027
|
430.0
|
|
—
|
|
||||
|
Notes payable and other secured loans
|
104.0
|
|
79.3
|
|
||||
|
Finance lease obligations
(3)
|
253.4
|
|
25.4
|
|
||||
|
Less: unamortized debt issuance costs
|
(10.8
|
)
|
(2.8
|
)
|
||||
|
Total debt
|
2,580.7
|
|
2,326.5
|
|
||||
|
Less: Current maturities
|
56.0
|
|
55.6
|
|
||||
|
Total long-term debt
|
$
|
2,524.7
|
|
$
|
2,270.9
|
|
||
|
(1)
|
Includes unamortized fair value discount of
$4.6 million
and
$5.5 million
as of
December 31, 2019
and
2018
, respectively.
|
|
(2)
|
Includes unamortized fair value premium of
$6.7 million
as of December 31,
2018
. The premium was written-off upon redemption as discussed below.
|
|
(3)
|
In connection with the adoption of the Lease Accounting Standard, the Company's capital lease obligations that existed as of December 31, 2018 were derecognized and included as a component of the finance lease obligations included in the table shown above. See Note 6. "Leases" for further discussion on the adoption of the Lease Accounting Standard. The increase in finance lease obligations upon adoption of the Lease Accounting Standard is due to the inclusion of certain financing obligations that were previously recognized as a component of other current and long-term liabilities as discussed further in Note 13. "Other Assets and Liabilities." The increase also includes the addition of a new finance lease associated with a new de novo hospital, which began operations in the fourth quarter of 2019.
|
Senior Secured Credit Facilities
The Company has a credit agreement (the "Credit Agreement") providing for a
$1.44 billion
senior secured term loan (the "Term Loan") and a
$120.0 million
senior secured revolving credit facility (the "Revolver" and, together with the Term Loan, the "Senior Secured Credit Facilities"). The Revolver may be utilized for working capital, capital expenditures and general corporate purposes. Subject to certain conditions and requirements set forth in the Credit Agreement, the Company may request one or more additional incremental term loan facilities or one or more increases in the commitments under the Revolver. During 2019, in connection with the completion of the issuance of the 2027 Unsecured Notes (defined below), the outstanding commitments under the Company's Revolver were increased by
$45.0 million
pursuant to an incremental amendment to the credit agreement governing its revolving credit facility. As of both December 31, 2019 and 2018, the Company had no outstanding borrowing on the Revolver. As of
December 31, 2019
, the Company's availability on the Revolver was
$112.9 million
(including outstanding letters of credit of
$7.1 million
).
The Term Loan will mature on August 31, 2024 and the Revolver will mature on August 31, 2022. The Senior Secured Credit Facilities bear interest at a rate per annum equal to (x) LIBOR plus a margin ranging from
3.00%
to
3.25%
per annum, depending on the Company's first lien net leverage ratio or (y) an alternate base rate (which will be the highest of (i) the prime rate, (ii)
0.5%
per annum above the federal funds effective rate and (iii) one-month LIBOR plus
1.00%
per annum (solely with respect to the Term Loan, the alternate base rate shall not be less than
2.00%
per annum)) plus a margin ranging from
2.00%
to
2.25%
per annum. In addition, the Company is required to pay a commitment fee of
0.50%
per annum in respect of unused commitments under the Revolver.
The Term Loan amortizes in equal quarterly installments of
0.25%
of the aggregate original principal amount of the Term Loan. The Term Loan is subject to mandatory prepayments based on excess cash flow for the applicable fiscal year that will depend on the first lien net
F-19
leverage ratio as of the last day of the applicable fiscal year, as well as upon the occurrence of certain other events, as described in the Credit Agreement. There were no excess cash flow payments required as of
December 31, 2019
.
With respect to the Revolver, the Company is required to comply with a maximum consolidated total net leverage ratio of
9.50
:
1.00
, which covenant will be tested quarterly on a trailing four quarter basis only if, as of the last day of the applicable fiscal quarter the Revolver is drawn in an aggregate amount greater than
35%
of the total commitments under the Revolver. Such financial maintenance covenant is subject to an equity cure. The Credit Agreement includes customary negative covenants restricting or limiting the ability of the Company and its restricted subsidiaries, to, among other things, sell assets, alter its business, engage in mergers, acquisitions and other business combinations, declare dividends or redeem or repurchase equity interests, incur additional indebtedness or guarantees, make loans and investments, incur liens, enter into transactions with affiliates, prepay certain junior debt, and modify or waive certain material agreements and organizational documents, in each case, subject to customary and other agreed upon exceptions. The Credit Agreement also contains customary affirmative covenants and events of default. As of
December 31, 2019
, the Company was in compliance with the covenants contained in the Credit Agreement.
The Senior Secured Credit Facilities are guaranteed, on a joint and several basis, by SP Holdco I, Inc. and each of Surgery Center Holdings, Inc.'s current and future wholly-owned domestic restricted subsidiaries (subject to certain exceptions) (the "Subsidiary Guarantors") and are secured by a first priority security interest in substantially all of Surgery Center Holdings, Inc.'s, SP Holdco I, Inc.'s and the Subsidiary Guarantors’ assets (subject to certain exceptions).
In connection with the Term Loan and Revolver, in 2017 the Company repaid its then-existing 2014 First Lien Credit Agreement, resulting in a debt extinguishment loss of
$18.2 million
, included in the loss on debt refinancing in the consolidated statement of operations for the eight months ending August 31, 2017 (Predecessor). The loss includes the partial write-off of unamortized debt issuance costs and discount related to the 2014 Revolver Loan and 2014 First Lien Credit Agreement and a portion of costs incurred with the Senior Secured Credit Facilities.
In connection with the application of pushdown accounting, the Company remeasured and recorded the Term Loan at fair value using a measurement date of August 31, 2017 (Predecessor). The fair value was based on a Level 2 computation using quoted prices for identical liabilities in inactive markets. As a result, the Company recorded a fair value discount of
$6.5 million
as of the measurement date, which is reported in the consolidated balance sheets as a direct deduction from the face amount the Term Loan. The Company amortizes the fair value discount to interest expense over the life of the Term Loan.
In connection with incremental Term Loan borrowings in 2018, the Company recorded debt issuance costs and discount of
$3.0 million
.
6.750%
Senior Unsecured Notes due 2025
Effective June 30, 2017 (Predecessor), the Company issued
$370.0 million
in gross proceeds of senior unsecured notes due July 1, 2025 (the "2025 Unsecured Notes"). The 2025 Unsecured Notes bear interest at the rate of
6.750%
per year, payable semi-annually on January 1 and July 1 of each year. The 2025 Unsecured Notes are a senior unsecured obligation of Surgery Center Holdings, Inc. and are guaranteed on a senior unsecured basis by each of Surgery Center Holdings, Inc.'s existing and future domestic wholly-owned restricted subsidiaries that guarantees the Senior Secured Credit Facilities (subject to certain exceptions).
The Company may redeem up to
40%
of the aggregate principal amount of the 2025 Unsecured Notes at any time prior to July 1, 2020, with the net cash proceeds of certain equity issuances at a redemption price equal to
106.75%
of the principal amount to be redeemed, plus accrued and unpaid interest to, but excluding, the date of redemption, provided that at least
50%
of the aggregate principal amount of the 2025 Unsecured Notes remain outstanding immediately after the occurrence of such redemption and such redemption occurs within
180 days
of the date of the closing of the applicable equity offering.
The Company may redeem the 2025 Unsecured Notes, in whole or in part, at any time prior to July 1, 2020, at a price equal to
100%
of the principal amount to be redeemed plus the applicable premium, plus accrued and unpaid interest, if any, to, but excluding, the date of redemption. The Company may redeem the 2025 Unsecured Notes, in whole or in part, at any time on or after July 1, 2020, at the redemption prices set forth below (expressed as a percentage of the principal amount to be redeemed), plus accrued and unpaid interest, if any, up to, but excluding, the date of redemption:
|
July 1, 2020 to June 30, 2021
|
103.375
|
%
|
|
July 1, 2021 to June 30, 2022
|
101.688
|
%
|
|
July 1, 2022 and thereafter
|
100.000
|
%
|
If Surgery Center Holdings, Inc. experiences a change in control under certain circumstances, it must offer to purchase the 2025 Unsecured Notes at a purchase price equal to
101.000%
of the principal amount, plus accrued and unpaid interest, if any, up to, but excluding, the date of repurchase.
The 2025 Unsecured Notes contain customary affirmative and negative covenants, which, among other things, limit the Company’s ability to incur additional debt, pay dividends, create or assume liens, effect transactions with its affiliates, guarantee payment of certain debt securities, sell assets, merge, consolidate, enter into acquisitions and effect sale and leaseback transactions.
F-20
In connection with the offering of the 2025 Unsecured Notes, the Company recorded debt issuance costs of
$17.3 million
in the Predecessor period, which were eliminated with the application of pushdown accounting.
10.000%
Senior Unsecured Notes due 2027
Effective April 11, 2019, the Company issued the 2027 Unsecured Notes in an aggregate principal amount of
$430.0 million
due April 15, 2027. The 2027 Unsecured Notes bear interest at the rate of
10.000%
per annum, payable semi-annually on April 15 and October 15 of each year, beginning on October 15, 2019. The 2027 Unsecured Notes are a senior unsecured obligation of Surgery Center Holdings, Inc. and are guaranteed on a senior unsecured basis by each of Surgery Center Holdings, Inc.'s existing and future domestic wholly-owned restricted subsidiaries that guarantees the Senior Secured Credit Facilities (subject to certain exceptions).
The Company may redeem up to
40%
of the aggregate principal amount of the 2027 Unsecured Notes at any time prior to April 15, 2022, with the net cash proceeds of certain equity issuances at a redemption price equal to
110.000%
of the principal amount of notes to be redeemed, plus accrued and unpaid interest to, but excluding, the date of redemption.
The Company may redeem the 2027 Unsecured Notes, in whole or in part, at any time prior to April 15, 2022, at a redemption price equal to
100%
of the principal amount of notes to be redeemed plus the applicable premium, plus accrued and unpaid interest, if any, to, but excluding, the date of redemption. The Company may redeem the 2027 Unsecured Notes, in whole or in part, at any time on or after April 15, 2022, at the redemption prices set forth below (expressed as a percentage of the principal amount of notes to be redeemed), plus accrued and unpaid interest, if any, up to, but excluding, the date of redemption:
|
April 15, 2022 to April 14, 2023
|
105.000
|
%
|
|
April 15, 2023 to April 14, 2024
|
102.500
|
%
|
|
April 15, 2024 and thereafter
|
100.000
|
%
|
If Surgery Center Holdings, Inc. experiences a change of control under certain circumstances, it must offer to purchase the 2027 Unsecured Notes at a purchase price equal to
101.000%
of the aggregate principal amount of notes, plus accrued and unpaid interest, if any, up to, but excluding, the date of repurchase.
The indenture governing the 2027 Unsecured Notes contains customary affirmative and negative covenants, which, among other things, limit the Company’s ability to incur additional debt, pay dividends, create or assume liens, effect transactions with its affiliates, guarantee payment of certain debt securities, sell assets, merge, consolidate, enter into acquisitions and effect sale and leaseback transactions.
In connection with the offering of the 2027 Unsecured Notes, the Company recorded debt issuance costs of
$8.8 million
.
8.875%
Senior Unsecured Notes due 2021
In connection with issuance of the 2027 Unsecured Notes as discussed above, the Company redeemed all of the then existing senior unsecured notes due 2021 ("2021 Unsecured Notes"). The redemption price was equal to
104.438%
of the outstanding principal amount plus accrued and unpaid interest. In connection with the redemption, the Company recorded a debt extinguishment loss of
$11.7 million
, included in loss on debt extinguishment in the consolidated statements of operations for the year ended December 31, 2019. The loss includes the redemption premium paid partially offset by the write-off of the unamortized fair value premium as of the redemption date.
Other Debt
Certain of the Company’s subsidiaries have outstanding indebtedness under notes payable and other secured loans, which is collateralized by the real estate and equipment owned by the surgical facilities to which the loans were made, and right-of-use finance lease obligations for which we are liable to various vendors for several property and equipment leases classified as finance leases. The various bank indebtedness agreements contain covenants to maintain certain financial ratios and also restrict encumbrance of assets, creation of indebtedness, investing activities and payment of distributions. At
December 31, 2019
, the Company was in compliance with its covenants contained in the credit agreements.
Maturities
A summary of maturities for the Company's long-term debt, excluding unamortized debt issuance costs and the unamortized fair value discount discussed above, for the next five years and thereafter as of
December 31, 2019
follows (in millions):
|
2020
|
$
|
56.0
|
|
|
|
2021
|
55.2
|
|
||
|
2022
|
42.0
|
|
||
|
2023
|
36.7
|
|
||
|
2024
|
1,396.7
|
|
||
|
Thereafter
|
1,009.5
|
|
||
|
Total
|
$
|
2,596.1
|
|
|
F-21
6. Leases
On January 1, 2019, the Company adopted the Lease Accounting Standard using the modified retrospective transition approach by applying the new standard to all leases existing at that date. Results and disclosure requirements for reporting periods beginning after January 1, 2019 are presented under the new guidance, while prior period amounts have not been adjusted.
The Company elected the package of practical expedients permitted under the transition guidance, which allowed the Company to carryforward its historical lease identification, lease classification and initial direct costs for any leases that existed prior to January 1, 2019. The Company also elected the accounting policy practical expedient to exclude leases with an initial term of twelve months or less from the balance sheet. Certain of the Company’s lease agreements have lease and non-lease components, which for the majority of leases the Company accounts for separately when the actual lease and non-lease components are determinable.
The Company determines if an arrangement is a lease at inception. Right-of-use assets represent the right to use the underlying assets for the lease term and the lease liabilities represent the obligation to make lease payments arising from the leases. Right-of-use assets and liabilities are recognized at commencement date based on the present value of future lease payments over the lease term, which includes only payments that are fixed and determinable at the time of commencement. When readily determinable, the Company uses the interest rate implicit in a lease to determine the present value of future lease payments. For leases where the implicit rate is not readily determinable, the Company's incremental borrowing rate is used. The Company calculates its incremental borrowing rate on a periodic basis using a third-party financial model that estimates the rate of interest the Company would have to pay to borrow an amount equal to the total lease payments on a collateralized basis over a term similar to the lease. The Company applies its incremental borrowing rate using a portfolio approach. The right-of-use asset also includes any lease payments made prior to commencement and is recorded net of any lease incentives received. Lease terms may include options to extend or terminate the lease when it is reasonably certain that the Company will exercise such options.
The Company's operating leases are primarily for real estate, including medical office buildings, and corporate and other administrative offices. The Company's finance leases are primarily for medical equipment and information technology and telecommunications assets. The Company's finance leases also include certain land, buildings and improvements as discussed in Note 3. "Property and Equipment." Real estate lease agreements typically have initial terms of
ten years
and may include
one
or more options to renew. Certain leases also include options to purchase the leased property. The useful life of assets and leasehold improvements are limited by the expected lease term, unless there is a transfer of title or purchase option reasonably certain of exercise. The majority of the Company's medical equipment leases have a bargain purchase option that is reasonably certain of exercise, so these assets are depreciated over their useful life. The Company's lease agreements do not contain any material residual value guarantees, restrictions or covenants.
Certain of the Company's lease agreements require the Company to pay common area maintenance, repairs, property taxes and insurance costs, which are variable amounts based on actual costs incurred during each applicable period. Certain lease agreements also include escalating rent payments that are not fixed at commencement but are based on an index that is determined in future periods over the lease term based on changes in the Consumer Price Index or other measure of cost inflation. These variable components of lease payments are expensed as incurred and are not included in the determination of the right-of-use asset or lease liability.
The following table presents the components of the Company's right-of-use assets and liabilities related to leases and their classification in the consolidated balance sheets at
December 31, 2019
(in millions):
|
Classification in Consolidated Balance Sheets
|
December 31, 2019
|
|||||
|
Assets:
|
||||||
|
Operating lease assets
|
Other long-term assets
|
$
|
297.7
|
|
||
|
Finance lease assets
|
Property and equipment, net of accumulated depreciation
|
237.1
|
|
|||
|
Total leased assets
|
$
|
534.8
|
|
|||
|
Liabilities:
|
||||||
|
Operating lease liabilities:
|
||||||
|
Current
|
Other current liabilities
|
$
|
37.3
|
|
||
|
Long-term
|
Other long-term liabilities
|
283.1
|
|
|||
|
Total operating lease liabilities
|
320.4
|
|
||||
|
Finance lease liabilities:
|
||||||
|
Current
|
Current maturities of long-term debt
|
15.8
|
|
|||
|
Long-term
|
Long-term debt, less current maturities
|
237.6
|
|
|||
|
Total finance lease liabilities
|
253.4
|
|
||||
|
Total lease liabilities
|
$
|
573.8
|
|
|||
F-22
The following table presents the weighted-average lease terms and discount rates at
December 31, 2019
(in millions):
|
Operating Leases
|
Finance Leases
|
|||||
|
Weighted-average remaining lease term
|
8.9 years
|
|
16.6 years
|
|
||
|
Weight average discount rate
|
10.4
|
%
|
8.7
|
%
|
||
The following table presents the components of the Company's lease expense and their classification in the consolidated statement of operations for the year ended
December 31, 2019
(in millions):
|
December 31, 2019
|
||||
|
Operating lease costs
|
$
|
70.4
|
|
|
|
Finance lease costs:
|
||||
|
Amortization of leased assets
|
22.2
|
|
||
|
Interest on lease liabilities
|
13.0
|
|
||
|
Total finance lease costs
|
35.2
|
|
||
|
Variable and short-term lease costs
|
13.2
|
|
||
|
Total lease costs
|
$
|
118.8
|
|
|
During the year ended
December 31, 2019
, the Company incurred lease costs of
$20.6 million
under operating lease agreements with physician investors who are related parties. During the year ended
December 31, 2019
, the Company paid rent of
$6.7 million
under a finance lease agreement with a lessor who is a related party. One of the Company's surgical facilities has a non-controlling ownership interest in the lessor. Payments are allocated to principal adjustments of the finance lease liability and interest expense.
The following table presents supplemental cash flow information for the year ended
December 31, 2019
(dollars in millions):
|
December 31, 2019
|
||||
|
Cash paid for amounts included in the measurement of lease liabilities:
|
||||
|
Operating cash outflows from operating leases
|
$
|
67.3
|
|
|
|
Operating cash outflows from finance leases
|
$
|
13.0
|
|
|
|
Financing cash outflows from finance leases
|
$
|
13.4
|
|
|
|
Right-of-use assets obtained in exchange for lease obligations:
|
||||
|
Operating leases
|
$
|
56.2
|
|
|
|
Finance leases
|
$
|
133.3
|
|
|
Future maturities of lease liabilities at
December 31, 2019
are presented in the following table (in millions):
|
Operating Leases
|
Finance Leases
|
|||||||
|
2020
|
$
|
67.9
|
|
$
|
35.5
|
|
||
|
2021
|
62.3
|
|
35.5
|
|
||||
|
2022
|
57.0
|
|
32.8
|
|
||||
|
2023
|
53.8
|
|
30.5
|
|
||||
|
2024
|
50.5
|
|
25.6
|
|
||||
|
Thereafter
|
208.1
|
|
348.7
|
|
||||
|
Total lease payments
|
499.6
|
|
508.6
|
|
||||
|
Less: imputed interest
|
(179.2
|
)
|
(255.2
|
)
|
||||
|
Total lease obligations
|
$
|
320.4
|
|
$
|
253.4
|
|
||
F-23
Future maturities of lease liabilities at December 31, 2018, prior to the adoption of the Lease Accounting Standard, are presented in the following table (in millions):
|
Operating Leases
(1)
|
Capital Leases
|
|||||||
|
2019
|
$
|
81.5
|
|
$
|
8.8
|
|
||
|
2020
|
75.6
|
|
6.7
|
|
||||
|
2021
|
66.7
|
|
4.7
|
|
||||
|
2022
|
61.3
|
|
2.9
|
|
||||
|
2023
|
57.2
|
|
1.5
|
|
||||
|
Thereafter
|
470.2
|
|
4.3
|
|
||||
|
Total lease payments
|
$
|
812.5
|
|
28.9
|
|
|||
|
Less: imputed interest
|
(3.5
|
)
|
||||||
|
Total lease obligations
|
|
|
$
|
25.4
|
|
|||
|
(1)
|
Includes financing obligations payable to the lessors of certain land, buildings and improvements that arose due to the Company's continued involvement with the leased assets under the sale-leaseback guidance in effect prior to the adoption of the Lease Accounting Standard. As of December 31, 2018, the current portion of the financing obligations was
$7.0 million
and was included in other current liabilities in the consolidated balance sheets. The long-term portion of the finance obligations was
$149.8 million
and was included as other long-term liabilities in the consolidated balance sheets.
|
As of December 31, 2018, the Company had various non-cancellable sub-lease arrangements. The total future minimum rentals to be received under these arrangements as of December 31, 2018 is estimated to be
$3.4 million
.
Rental expense for operating leases was
$83.5 million
for the year ended December 31, 2018 (Successor),
$27.8 million
for the four months ended December 31, 2017 (Successor) and
$39.2 million
for the eight months ended August 31, 2017 (Predecessor). Included in these amounts, the Company incurred lease expense under operating lease agreements with physician investors who are related parties of
$20.2 million
for the year ended December 31, 2018 (Successor),
$7.5 million
for the four months ended December 31, 2017 (Successor) and
$9.8 million
for the eight months ended August 31, 2017 (Predecessor).
7. Redeemable Preferred Stock
On August 31, 2017 (Predecessor), the Company completed the sale issuance of
310,000
shares of the Company's preferred stock, par value
$0.01
per share, designated as
10.00%
Series A Convertible Perpetual Participating Preferred Stock (the "Series A Preferred Stock") to Bain Capital at a purchase price of
$1,000
per share for an aggregate purchase price of
$310.0 million
(the "Preferred Private Placement").
The accrued value of the Series A Preferred Stock is convertible into shares of common stock at a price per share of common stock equal to
$19.00
, subject to certain adjustments as provided in the Certificate of Designations, Preferences, Rights and Limitations of the
10.00%
Series A Convertible Perpetual Participating Preferred Stock of Surgery Partners, Inc. (the "Series A Certificate of Designation"), at any time at the option of the holder. In addition, the Company may require the conversion of all, but not less than all, of the Series A Preferred Stock pursuant to the terms and conditions of the Series A Certificate of Designation, after the second anniversary of the date of issuance, if the volume weighted average closing price of the Common Stock for any
20
out of
30
consecutive trading days prior to such date, equals or exceeds
$42.00
per share.
The Company cannot redeem the Series A Preferred Stock prior to the fifth anniversary of its issuance and thereafter, may redeem all, but not less than all, of the Series A Preferred Stock for cash pursuant to and subject to the terms and conditions of the Series A Certificate of Designation. The holders of Series A Preferred Stock may cause the Company to redeem the Series A Preferred Stock upon the occurrence of certain change of control transactions of the Company or the common stock ceasing to be listed or quoted on a trading market. The Company adjusts the carrying amount of the Series A Preferred Stock to equal the redemption value at the end of each reporting period as if it were also the redemption date. Changes in the redemption value are recognized immediately as they occur.
The Series A Preferred Stock ranks senior to the common stock and any other capital stock of the Company with respect to dividends, redemption and any other rights upon the liquidation, dissolution or winding up of the Company, and the holders thereof are entitled to vote with the holders of common stock, together as a single class, on all matters submitted to a vote of the Company’s stockholders. In addition to participating in any dividends that may be declared with respect to the common stock on an as-converted basis, each share of Series A Preferred Stock accrues dividends daily at a dividend rate of
10.00%
, compounding quarterly, and in any given quarter, subject to certain conditions, the Board of Directors of the Company may declare a cash dividend in an amount up to
50%
of the amount of the dividend that has accrued and accumulated during such quarter through the end of such quarter, and the amount of any quarterly dividend paid in cash shall not compound on the applicable date and shall not be included in the accrued value of the Series A Preferred Stock. In the event of the Company’s liquidation, dissolution or winding-up (whether voluntary of involuntary), holders of Series A Preferred Stock will be entitled to receive out of the assets of the Company available for distribution to shareholders, after satisfaction of any liabilities and obligations to creditors of the Company, with respect to each Series A Preferred Share, an amount equal to the greater of (i)
$1,000.00
per share, plus dividends compounded to date, plus
F-24
dividends accrued but not yet compounded and (ii) the amount that a holder of one share of common stock would receive, assuming the Series A Preferred Stock had converted into shares of common stock.
In connection with the issuance of Series A Preferred Stock, the Company incurred issuance costs of
$18.3 million
in the eight months ended August 31, 2017 (Predecessor), which were eliminated with the application of pushdown accounting.
The following table presents a summary of activity related to the redeemable preferred stock for the years ended
December 31, 2019
and 2018 (in millions):
|
December 31,
|
||||||||
|
2019
|
2018
|
|||||||
|
Balance at beginning of period
|
$
|
359.3
|
|
$
|
330.8
|
|
||
|
Dividends accrued
|
35.7
|
|
32.4
|
|
||||
|
Cash dividends declared
|
—
|
|
(3.9
|
)
|
||||
|
Balance at end of period
|
$
|
395.0
|
|
$
|
359.3
|
|
||
There were
no
unpaid cash dividends declared at
December 31, 2019
and
2018
. The aggregate and per share amounts of unpaid cumulative preferred dividends as of
December 31, 2019
and 2018 were
$69.5 million
and
$224.09
, and
$33.8 million
and
$108.97
, respectively.
8. Derivatives and Hedging Activities
The Company’s objectives in using interest rate derivatives are to add stability to interest expense and to manage its exposure to interest rate movements. To accomplish this objective, the Company primarily uses interest rate swaps as part of its interest rate risk management strategy. During
2019
and 2018, such derivatives have been used to hedge the variable cash flows associated with existing variable-rate debt.
For derivatives designated and that qualify as cash flow hedges of interest rate risk, the gain or loss on the derivative is recorded in accumulated other comprehensive income and subsequently reclassified into interest expense in the same period(s) during which the hedged transaction affects earnings, as documented at hedge inception in accordance with the Company’s accounting policy election. Amounts reported in accumulated other comprehensive income related to derivatives will be reclassified to interest expense as interest payments are made on the Company’s variable-rate debt. Over the next 12 months, the Company estimates that
$14.6 million
will be reclassified as an increase to interest expense.
As of
December 31, 2019
, the Company had
four
interest rate swaps with a current notional amount of
$1.2 billion
and a termination date of November 30, 2023. The derivatives are recorded at fair value (see Note 1. "Organization and Summary of Accounting Policies") and classified as a long-term liability included in other long-term liabilities in the consolidated balance sheets as of
December 31, 2019
and 2018 . As of
December 31, 2018
, the Company had three interest rate swaps with a notional amount of
$900.0 million
.
The following table presents the pre-tax effect of the interest rate swaps on the Company's accumulated other comprehensive income ("OCI") and statement of operations (in millions):
|
Successor
|
Predecessor
|
|||||||||||||||||
|
Year Ended December 31,
|
September 1 to
December 31, |
January 1 to
August 31, |
||||||||||||||||
|
2019
|
2018
|
2017
(1)
|
2017
(1)
|
|||||||||||||||
|
Derivatives in cash flow hedging relationships
|
||||||||||||||||||
|
Loss recognized in OCI (effective portion)
|
$
|
35.8
|
|
$
|
23.1
|
|
$
|
—
|
|
$
|
—
|
|
||||||
|
Loss reclassified from accumulated OCI to interest expense (effective portion)
|
7.5
|
|
0.6
|
|
—
|
|
—
|
|
||||||||||
|
(1)
|
There were no derivatives outstanding for the comparative periods in 2017.
|
F-25
9. Earnings Per Share
Basic and diluted earnings per share are calculated based on the weighted-average number of shares outstanding in each period and dilutive stock options, unvested shares and warrants, to the extent such securities exist and have a dilutive effect on earnings per share. The Company computes basic and diluted earnings per share using the two-class method. The two-class method of computing earnings per share is an earnings allocation method that determines earnings per share for common shares and participating securities according to their participation rights in dividends and undistributed earnings.
A reconciliation of the numerator and denominator of basic and diluted earnings per share follows (dollars in millions, except per share amounts; shares in thousands):
|
Successor
|
Predecessor
|
|||||||||||||||||
|
Year Ended December 31,
|
September 1 to
December 31, |
January 1 to
August 31, |
||||||||||||||||
|
2019
|
2018
|
2017
|
2017
|
|||||||||||||||
|
Numerator:
|
||||||||||||||||||
|
Net loss attributable to Surgery Partners, Inc.
|
$
|
(74.8
|
)
|
$
|
(205.7
|
)
|
$
|
(41.3
|
)
|
$
|
(11.7
|
)
|
||||||
|
Less: Amounts allocated to participating securities
(1)
|
(35.7
|
)
|
(32.4
|
)
|
(10.5
|
)
|
—
|
|
||||||||||
|
Less: Mark to redemption adjustment
|
—
|
|
—
|
|
(15.6
|
)
|
—
|
|
||||||||||
|
Net loss attributable to common stockholders
|
$
|
(110.5
|
)
|
$
|
(238.1
|
)
|
$
|
(67.4
|
)
|
$
|
(11.7
|
)
|
||||||
|
Denominator:
|
||||||||||||||||||
|
Weighted average shares outstanding- basic and diluted
(2)
|
48,280
|
|
48,028
|
|
48,319
|
|
48,121
|
|
||||||||||
|
Basic and diluted loss per share
(2)
|
$
|
(2.29
|
)
|
$
|
(4.96
|
)
|
$
|
(1.39
|
)
|
$
|
(0.24
|
)
|
||||||
|
Dilutive securities outstanding not included in the computation of diluted loss per share as their effect is antidilutive:
|
||||||||||||||||||
|
Stock options
|
—
|
|
83
|
|
—
|
|
—
|
|
||||||||||
|
Restricted shares
|
67
|
|
198
|
|
63
|
|
106
|
|
||||||||||
|
(1)
|
Includes dividends accrued during the Successor periods for the Series A Preferred Stock. The Series A Preferred Stock does not participate in undistributed losses. There were no participating securities during the Predecessor periods.
|
|
(2)
|
The impact of potentially dilutive securities for all periods were not considered because the effect would be anti-dilutive in each of those periods.
|
Share Repurchase Transactions
On December 15, 2017, the Company's Board of Directors authorized a share repurchase program of up to
$50.0 million
of the Company's issued and outstanding common stock from time to time. The timing and size of repurchases will be determined based on market conditions and other factors. The authorization does not obligate the repurchase of any shares and the Company may repurchase shares of common stock at any time without prior notice. The share repurchases will be made in accordance with applicable securities laws in open market or privately negotiated transactions. The authorization does not have a specified expiration date, and the share repurchase program may be suspended, recommenced or discontinued at any time or from time to time without prior notice.
In December 2017, the Company repurchased
180,664
shares of its common stock at an average price of
$11.12
per share through market purchases. In 2018, the Company repurchased
156,818
shares of its common stock at an average price of
$12.64
per share through market purchases. At December 31, 2019, the Company had
$46.0 million
of repurchase authorization available under the December 2017 authorization.
10. Income Taxes
Income Taxes
The Company uses the asset and liability method to account for income taxes. Under this method, deferred income tax assets and liabilities are recognized for the future tax consequences attributable to differences between the financial statement carrying amounts of existing assets and liabilities and their respective tax bases. Deferred tax assets and liabilities are measured using enacted tax rates expected to apply to taxable income in the years in which those temporary differences are expected to be recovered or settled. Any change in tax rates that could impact deferred tax assets or liabilities are recognized in the same period the change occurs. If a net operating loss ("NOL") carryforward exists, the Company makes a determination as to whether that NOL carryforward will be utilized in the future. A valuation allowance is established for certain net operating loss carryforwards when their recoverability is deemed to be uncertain. The carrying value of the net deferred tax assets assumes that the Company will be able to generate sufficient future taxable income in certain tax jurisdictions, based on estimates and
F-26
assumptions. If these estimates and related assumptions change in the future, the Company may be required to adjust its deferred tax valuation allowances.
The Company, or one or more of its subsidiaries, files income tax returns in the U.S. federal jurisdiction and various state jurisdictions. With few exceptions, the Company is no longer subject to U.S. federal income tax examinations for years prior to 2016 or state income tax examinations for years prior to 2015.
The Company and certain of its subsidiaries file a consolidated federal income tax return. The partnerships, limited liability companies, and certain non-consolidated physician practice corporations also file separate income tax returns. The Company's allocable portion of each partnership's and limited liability company's income or loss is included in taxable income of the Company. The remaining income or loss of each partnership and limited liability company is allocated to the other owners.
The Company made income tax payments of
$1.6 million
and
$2.2 million
for the years ended
December 31, 2019
and 2018 (Successor),
$0.5 million
for the four months ended December 31, 2017 (Successor) and
$0.6 million
for the eight months ended August 31, 2017 (Predecessor).
Income tax expense (benefit) is comprised of the following (in millions):
|
Successor
|
Predecessor
|
|||||||||||||||||
|
Year Ended December 31,
|
September 1 to
December 31, |
January 1 to
August 31, |
||||||||||||||||
|
2019
|
2018
|
2017
|
2017
|
|||||||||||||||
|
Current:
|
||||||||||||||||||
|
Federal
|
$
|
(0.2
|
)
|
$
|
(0.3
|
)
|
$
|
(0.1
|
)
|
$
|
—
|
|
||||||
|
State
|
1.7
|
|
1.5
|
|
1.0
|
|
0.6
|
|
||||||||||
|
Deferred:
|
||||||||||||||||||
|
Federal
|
3.2
|
|
16.5
|
|
77.5
|
|
(17.3
|
)
|
||||||||||
|
State
|
4.8
|
|
8.7
|
|
(6.7
|
)
|
(1.4
|
)
|
||||||||||
|
Total income tax expense (benefit)
|
$
|
9.5
|
|
$
|
26.4
|
|
$
|
71.7
|
|
$
|
(18.1
|
)
|
||||||
A reconciliation of the provision for income taxes as reported in the consolidated statements of operations and the amount of income tax expense (benefit) computed by multiplying consolidated income (loss) in each year by the U.S. federal statutory rate of
21%
(2019 and 2018) and
35%
(2017) follows (in millions):
|
Successor
|
Predecessor
|
|||||||||||||||||
|
Year Ended December 31,
|
September 1 to
December 31, |
January 1 to
August 31, |
||||||||||||||||
|
2019
|
2018
|
2017
|
2017
|
|||||||||||||||
|
Tax expense (benefit) at U.S.federal statutory rate
|
$
|
11.5
|
|
$
|
(14.5
|
)
|
$
|
24.5
|
|
$
|
4.3
|
|
||||||
|
State income tax, net of U.S. federal tax benefit
|
5.7
|
|
10.0
|
|
1.7
|
|
(0.5
|
)
|
||||||||||
|
Change in valuation allowance
|
13.6
|
|
26.9
|
|
0.6
|
|
1.3
|
|
||||||||||
|
Net income attributable to non-controlling interests
|
(25.2
|
)
|
(23.1
|
)
|
(13.9
|
)
|
(14.7
|
)
|
||||||||||
|
Changes in measurement of uncertain tax positions
|
(0.1
|
)
|
(0.1
|
)
|
(0.2
|
)
|
—
|
|
||||||||||
|
Stock option compensation
|
1.3
|
|
0.5
|
|
0.3
|
|
—
|
|
||||||||||
|
Differences related to divested facilities
|
0.1
|
|
6.0
|
|
(0.4
|
)
|
(1.7
|
)
|
||||||||||
|
Nondeductible transaction costs
|
—
|
|
—
|
|
2.1
|
|
(1.0
|
)
|
||||||||||
|
Tax return reconciling differences
|
1.1
|
|
1.7
|
|
—
|
|
(0.3
|
)
|
||||||||||
|
Change in effective tax rate
|
0.3
|
|
0.5
|
|
64.3
|
|
(0.8
|
)
|
||||||||||
|
Tax Receivable Agreement liability
|
1.6
|
|
0.9
|
|
(7.4
|
)
|
(4.8
|
)
|
||||||||||
|
Goodwill impairment
|
0.5
|
|
8.9
|
|
—
|
|
—
|
|
||||||||||
|
Litigation settlement
|
—
|
|
8.6
|
|
—
|
|
—
|
|
||||||||||
|
Other
|
(0.9
|
)
|
0.1
|
|
0.1
|
|
0.1
|
|
||||||||||
|
Total income tax expense (benefit)
|
$
|
9.5
|
|
$
|
26.4
|
|
$
|
71.7
|
|
$
|
(18.1
|
)
|
||||||
F-27
The components of temporary differences and the approximate tax effects that give rise to the Company’s net deferred tax asset are as follows (in millions):
|
December 31,
|
||||||||
|
2019
|
2018
|
|||||||
|
Deferred tax assets:
|
||||||||
|
Medical malpractice liability
|
$
|
3.5
|
|
$
|
3.5
|
|
||
|
Accrued vacation and incentive compensation
|
2.3
|
|
2.9
|
|
||||
|
Net operating loss carryforwards
|
143.0
|
|
139.4
|
|
||||
|
Allowance for bad debts
|
2.2
|
|
2.5
|
|
||||
|
Capital loss carryforwards
|
2.0
|
|
3.7
|
|
||||
|
Deferred rent
|
1.7
|
|
1.9
|
|
||||
|
Amortization of intangible assets
|
0.3
|
|
2.4
|
|
||||
|
Deferred financing costs
|
9.5
|
|
14.6
|
|
||||
|
Section 163(j) interest
|
54.7
|
|
27.3
|
|
||||
|
Interest rate swap liability
|
12.9
|
|
5.4
|
|
||||
|
TRA liability
|
1.2
|
|
1.2
|
|
||||
|
Right of use
|
52.1
|
|
—
|
|
||||
|
Affiliate indebtedness receivable
|
6.8
|
|
—
|
|
||||
|
Other deferred assets
|
7.3
|
|
7.1
|
|
||||
|
Total gross deferred tax assets
|
299.5
|
|
211.9
|
|
||||
|
Less: Valuation allowance
|
(77.9
|
)
|
(50.4
|
)
|
||||
|
Total deferred tax assets
|
221.6
|
|
161.5
|
|
||||
|
Deferred tax liabilities:
|
||||||||
|
Depreciation on property and equipment
|
(2.8
|
)
|
(3.9
|
)
|
||||
|
Basis differences of partnerships and joint ventures
|
(67.5
|
)
|
(47.8
|
)
|
||||
|
Right of use
|
(51.5
|
)
|
—
|
|
||||
|
Other deferred liabilities
|
(1.1
|
)
|
(0.6
|
)
|
||||
|
Total deferred tax liabilities
|
(122.9
|
)
|
(52.3
|
)
|
||||
|
Net deferred tax assets
|
$
|
98.7
|
|
$
|
109.2
|
|
||
The Company had federal NOL carryforwards of
$530.6 million
as of
December 31, 2019
, of which
$516.2 million
expire between
2025
and
2037
. The remaining federal NOL carryforwards, which were generated subsequent to 2017, do not expire. The Company had state NOL carryforwards of
$596.7 million
as of
December 31, 2019
, which expire between
2020
and
2039
. The Company had capital loss carryforwards of
$7.6 million
as of
December 31, 2019
, which expire between
2020
and
2023
. The Company had federal and state credit carryforwards of
$1.1 million
as of
December 31, 2019
. The federal credits do not expire, and the state credits expire between
2020
and
2030
. The Company had IRC Section 163(j) interest limitation carryforwards of
$222.7 million
as of December 31, 2019, which do not expire.
The Company has recorded a valuation allowance against deferred tax assets at
December 31, 2019
and
2018
totaling
$77.9 million
and
$50.4 million
, respectively, which represents an increase of
$27.5 million
. The valuation allowance continues to be provided for certain deferred tax assets for which the Company believes it is more likely than not that the tax benefits will not be realized, which are primarily Section 163(j) interest carryforwards, certain state NOLs and capital loss carryforwards.
The Company has evaluated the realizability of its deferred tax assets based on sources of positive and negative evidence, and determined that it is more likely than not that the NOL carryforwards will be realized. The determination was made based upon projections of future book and taxable income. If the Company's expectations for future operating results on a consolidated basis or at the state jurisdiction level vary from actual results due to changes in health care regulations, general economic conditions, or other factors, the Company may need to adjust the valuation allowance, for all or a portion of its deferred tax assets. The Company's income tax expense in future periods will be reduced or increased to the extent of offsetting decreases or increases, respectively, in its valuation allowance in the period when the change in circumstances occurs. These changes could have a significant impact on the Company's future earnings.
Included in the increase in the valuation allowance for the year ended
December 31, 2019
was an increase of approximately
$7.0 million
that was recorded to additional-paid-in-capital as the result of the tax effect of the interest rate swap liability. Approximately
$14.2 million
of the valuation allowance as of
December 31, 2019
is recorded against deferred tax assets that, if subsequently recognized, will be credited directly to contributed capital.
F-28
A reconciliation of the beginning and ending liability for gross unrecognized tax benefits for the years ended
December 31, 2019
and
2018
is as follows (in millions):
|
December 31,
|
||||||||
|
2019
|
2018
|
|||||||
|
Unrecognized tax benefits at beginning of year
|
$
|
0.1
|
|
$
|
0.7
|
|
||
|
Reductions for tax positions of prior year
|
—
|
|
(0.6
|
)
|
||||
|
Unrecognized tax benefits at end of year
|
$
|
0.1
|
|
$
|
0.1
|
|
||
The Company recognizes interest and penalties related to uncertain tax positions in its provision for income taxes in the consolidated statements of operations. For both the years ended
December 31, 2019
and
2018
, the Company had approximately
$0.1 million
of accrued interest and penalties related to uncertain tax positions. The total amount of accrued liabilities related to uncertain tax positions that would affect the Company's effective tax rate, if recognized, is
$0.1 million
and
$0.1 million
as of
December 31, 2019
and
2018
, respectively. The reserves are included in long-term taxes payable and long-term deferred tax assets in the consolidated balance sheet as of
December 31, 2019
.
The Tax Cuts and Jobs Act (the "Tax Act") was enacted on December 22, 2017. The Tax Act reduces the U.S. federal corporate tax rate from 35% to 21%, allows for 100% expensing of certain capital expenditures, and limits interest expense deductions beginning in 2018. The Securities and Exchange Commission issued Staff Accounting Bulletin No. 118 ("SAB 118"), which provides guidance on accounting for the tax effects of the Tax Act. SAB 118 provides a measurement period that should not extend beyond one year from the Tax Act enactment date for companies to complete the accounting under Accounting Standards Codification 740. In accordance with SAB 118, a company must reflect the income tax effects of those aspects of the Tax Act for which the accounting under Accounting Standards Codification 740 is complete. The Company's accounting for elements of the Tax Act is complete as of December 31, 2018, including a reduction of the U.S. federal corporate tax rate from 35% to 21%, 100% expensing of capital expenditures, and the interest expense limitation under Section 163(j).
11. Equity-Based Compensation
Transactions in which the Company receives employee and non-employee services in exchange for the Company’s equity instruments or liabilities that are based on the fair value of the Company’s equity securities or may be settled by the issuance of these securities are accounted for using a fair value method. The Company’s policy is to recognize compensation expense using the straight line method over the relevant vesting period for units that vest based on time.
The Surgery Partners, Inc. 2015 Omnibus Incentive Plan, as amended ("2015 Omnibus Incentive Plan") from which all equity-based awards will be granted. Under this plan, the Company can grant stock options, SARs, restricted stock, unrestricted stock, stock units, performance awards, cash awards and other awards convertible into or otherwise based on shares of its common stock. As of
December 31, 2019
,
8,315,700
shares were authorized to be granted under the 2015 Omnibus Incentive Plan and
6,448,187
were available for future equity grants.
Restricted Share-Based Awards
During the years ended
December 31, 2019
and
2018
, the Company granted
556,450
and
519,605
restricted stock awards ("RSAs") to certain officers, employees and non-employee directors in accordance with the 2015 Omnibus Incentive Plan, respectively. Vesting and payment of these RSAs are generally subject to continuing service of the employee or non-employee director over the ratable vesting periods beginning one year from the date of grant to
three
or
five
years after the date of grant. The fair values of these RSAs were determined based on the closing price of the Company’s common stock on the trading date immediately prior to the grant date.
During the years ended
December 31, 2019
and
2018
, the Company granted
389,972
and
335,074
performance-based restricted stock units ("PSUs") subject to the achievement of a combination of performance conditions, respectively. In addition to the achievement of the performance conditions, these PSUs are generally subject to the continuing service of the employee over the ratable vesting period from the earned date continuing for
two
years. For these restricted stock units, the number of shares payable at the end of the performance periods ranges from
0%
to
150%
of the targeted units based on the Company’s actual performance and/or market conditions results as compared to the targets. These stock units are not considered outstanding until earned. During the year ended
December 31, 2019
,
245,301
of the PSUs granted in 2018 were deemed to have been earned. During the year ended December 31, 2018, none of the PSUs previously granted were deemed to have been earned.
Additionally, during the year ended December 31,
2018
, the Company granted
127,292
leverage performance restricted stock units ("LPUs") subject to the achievement of a combination of market conditions. The Company did not grant any LPUs during the year ended
December 31, 2019
. The market condition for the LPUs granted during the year ended December 31, 2018 is based on the compound annual growth rate of the Company’s total stockholder return, considered both alone and relative to that of the companies making up the S&P Composite 1500 Health Care Companies, over a three-year performance period. In addition to the achievement of the market conditions, these LPUs are generally subject to the continuing service of the employee over the ratable vesting period from the performance period end date continuing for
two
years. These stock units are not considered outstanding until earned. During the years ended December 31, 2019 and 2018, none of the LPUs granted were deemed to have been earned.
F-29
For LPUs, the number of shares payable at the end of the vesting periods ranges from
0%
to
500%
of the targeted units based on the Company’s actual performance and/or market conditions results as compared to the targets. The fair values of these restricted stock units were determined based on a combination, where applicable, of the closing price of the Company’s common stock on the trading date immediately prior to the grant date for units subject to performance conditions, or at its Monte-Carlo simulation value for units subject to market conditions. The Company recognizes compensation expense for the portion of the targeted performance-based restricted stock units subject to market conditions even if the condition is never satisfied. However, if the performance conditions are not met for the portion of the targeted performance-based restricted stock units subject to such performance conditions, no compensation expense will be recognized, and any previously recognized compensation expense will be reversed. Forfeitures are recognized as incurred.
In early 2019, after analysis and consideration by the Company's Compensation Committee, including consultation with Frederic W. Cook & Co., Inc., an independent compensation consulting firm, the Compensation Committee determined that the terms of the LPUs were not appropriate to incentivize and retain the Company’s current executive management team. In March 2019, the Compensation Committee permitted certain named executive officers to exchange their previously granted LPUs for new stock option awards. As a result,
190,538
LPUs were voluntarily exchanged for
1,756,500
new stock option awards.
Restricted Share-Based Activity
A summary of non-vested restricted share-based activity for the years ended
December 31, 2019
,
2018
, and
2017
follows:
|
Unvested Shares
|
Weighted Average Grant Date Fair Value
|
||||||
|
Predecessor
|
|||||||
|
Outstanding at December 31, 2016
|
462,242
|
|
$
|
3.72
|
|
||
|
Granted/Earned
|
388,454
|
|
18.40
|
|
|||
|
Forfeited/Cancelled
|
(67,771
|
)
|
18.01
|
|
|||
|
Vested
|
(169,881
|
)
|
10.29
|
|
|||
|
Outstanding at August 31, 2017
|
613,044
|
|
$
|
16.02
|
|
||
|
Successor
|
|||||||
|
Outstanding at September 1, 2017
|
613,044
|
|
$
|
16.02
|
|
||
|
Granted/Earned
|
112,107
|
|
11.15
|
|
|||
|
Forfeited/Cancelled
|
(54,622
|
)
|
10.94
|
|
|||
|
Vested
|
(96,073
|
)
|
17.03
|
|
|||
|
Outstanding at December 31, 2017
|
574,456
|
|
$
|
15.95
|
|
||
|
Granted/Earned
|
519,605
|
|
16.10
|
|
|||
|
Forfeited/Cancelled
|
(180,719
|
)
|
15.09
|
|
|||
|
Vested
|
(210,318
|
)
|
16.31
|
|
|||
|
Outstanding at December 31, 2018
|
703,024
|
|
$
|
16.18
|
|
||
|
Granted/Earned
|
801,751
|
|
12.70
|
|
|||
|
Forfeited/Cancelled
|
(272,706
|
)
|
12.97
|
|
|||
|
Vested
|
(456,183
|
)
|
16.20
|
|
|||
|
Outstanding at December 31, 2019
|
775,886
|
|
$
|
13.78
|
|
||
Stock Options and Stock Appreciation Rights
The Company granted
2,256,500
and
700,000
stock options during the years ended
December 31, 2019
and
2018
, respectively. The Company did
not
grant any stock options during either the four months ended
December 31, 2017
(Successor) or the eight months ended August 31, 2017 (Predecessor). Options to purchase shares are granted with an exercise price equal to the fair market value of the Company’s common stock on the day of grant, based on the closing price of the Company’s common stock on the trading date immediately prior to the grant date.
The stock options granted during the year ended
December 31, 2019
are subject to the following performance and vesting criteria: (i) one-third (
33.3%
) of the award will vest in
three
equal annual installments on each of the first three anniversaries of December 31, 2019, (ii) one-third (
33.3%
) of the award will vest based on satisfaction of the time condition and the achievement by the Company of an average closing price of a share of Common Stock on the Nasdaq Stock Market of
$25.00
over a period of thirty (
30
) consecutive trading days, and (iii) one-third (
33.3%
) of the award will vest based on satisfaction of the time condition and the achievement by the Company of an average closing price of a share of Common Stock on the Nasdaq Stock Market of
$35.00
over a period of thirty (
30
) consecutive trading days, in each case, generally subject to continued employment on each vesting date. Forfeitures are recognized as incurred.
F-30
The stock options granted during the year ended
December 31, 2018
are subject to the following performance and vesting criteria: (i) fifty percent (
50%
) of the stock option awards will vest in
five
equal annual installments on each of the first five anniversaries of the date of grant, (ii) twenty-five percent (
25%
) of the award will vest based on satisfaction of the time condition and the achievement by the Company of an average closing price of a share of Common Stock on the Nasdaq Stock Market of
$25.00
over a period of sixty (
60
) consecutive trading days, and (iii) twenty-five percent (
25%
) of the award will vest based on satisfaction of the time condition and the achievement by the Company of an average closing price of a share of Common Stock on the Nasdaq Stock Market of
$35.00
over a period of sixty (
60
) consecutive trading days, in each case, generally subject to continued employment on each vesting date. Forfeitures are recognized as incurred.
On December 16, 2018, the Company cancelled
200,000
stock options and replaced them with
200,000
stock-settled stock appreciation right awards (the "SAR Awards"). These were the only SAR Awards granted as of
December 31, 2019
. The SAR Awards had a base price equal to the exercise price of the cancelled stock options. Fifty percent (
50%
) of the SAR Awards will vest in
five
equal annual installments on each of the first five anniversaries of the date of grant, generally subject to continued employment on each vesting date. Twenty-five percent (
25%
) of the award will vest based on satisfaction of the time condition and the achievement by the Company of an average closing price of a share of Common Stock on the Nasdaq Stock Market of
$25.00
over a period of sixty (
60
) consecutive trading days, and twenty-five percent (
25%
) of the award will vest based on satisfaction of the time condition and the achievement by the Company of an average closing price of a share of Common Stock on the Nasdaq Stock Market of
$35.00
over a period of sixty (
60
) consecutive trading days, in each case, generally subject to continued employment on each vesting date. Forfeitures are recognized as incurred.
Option/SAR Valuation
In applying the Monte Carlo simulation model to value both the stock options and SAR Awards, the Company used the following assumptions:
|
▪
|
Risk-free interest rate
. The risk-free interest rate is used as a component of the fair value of stock options to take into account the time value of money. For the risk-free interest rate, the Company uses the implied yield on United States Treasury zero-coupon issues with a remaining term equal to the expected life, in years, of the options granted.
|
|
▪
|
Expected volatility
. Volatility, for the purpose of share-based compensation, is a measurement of the amount that a share price has fluctuated. Expected volatility involves reviewing historical volatility and determining what, if any, change the share price will have in the future. The Company used historical stock price information of certain peer group companies for a period of time equal to the expected option life period to determine estimated volatility.
|
|
▪
|
Expected life, in years
. A clear distinction is made between the expected life of an option and the contractual term of the option. The expected life of an option is considered the amount of time, in years, that an option is expected to be outstanding before it is exercised. Whereas, the contractual term of the stock option is the term an option is valid before it expires.
|
|
▪
|
Expected dividend yield
. Since issuing dividends will affect the fair value of a stock option, GAAP requires companies to estimate future dividend yields or payments. The Company has not historically issued dividends and does not intend to issue dividends in the future. As a result, the Company does not apply a dividend yield component to its valuation.
|
The following table sets forth the assumptions used by the Company to estimate the fair value of options and SAR Awards granted during the years ended December 31, 2019 and 2018:
|
2019
|
2018
|
|||||
|
Expected volatility
|
60
|
%
|
60% - 65%
|
|
||
|
Risk-free interest rate
|
2.30% - 2.40%
|
|
2.50% - 2.90%
|
|
||
|
Expected dividends
|
—
|
|
—
|
|
||
|
Average expected term (years)
|
4
|
|
10
|
|
||
|
Fair value of stock options granted
|
$4.83 - $6.41
|
|
$8.48 - $9.44
|
|
||
The estimated fair value of options is amortized to expense on a straight-line basis over the options’ vesting period.
F-31
Stock Option and Stock Appreciation Rights Activity
A summary of stock option and SAR Award activity for the years ended
December 31, 2019
,
2018
, and
2017
follows:
|
Options/SARs
|
Weighted Average Exercise Price
|
Weighted Average Remaining Contractual Term (years)
|
|||||||
|
Predecessor
|
|||||||||
|
Outstanding at December 31, 2016
|
16,267
|
|
$
|
19.05
|
|
1.8
|
|||
|
Granted
|
—
|
|
|
|
|||||
|
Exercised
|
(3,580
|
)
|
15.36
|
|
|
||||
|
Forfeited/Cancelled
|
—
|
|
|||||||
|
Outstanding at August 31, 2017
|
12,687
|
|
$
|
20.10
|
|
1.5
|
|||
|
Successor
|
|||||||||
|
Outstanding at September 1, 2017
|
12,687
|
|
$
|
20.10
|
|
1.5
|
|||
|
Granted
|
—
|
|
|
|
|||||
|
Exercised
|
—
|
|
|||||||
|
Forfeited/Cancelled
|
—
|
|
|||||||
|
Outstanding at December 31, 2017
|
12,687
|
|
$
|
20.10
|
|
1.2
|
|||
|
Granted
|
700,000
|
|
12.90
|
|
10.0
|
||||
|
Exercised
|
—
|
|
|||||||
|
Forfeited/Cancelled
|
(200,000
|
)
|
12.90
|
|
10.0
|
||||
|
Outstanding at December 31, 2018
|
512,687
|
|
$
|
13.03
|
|
9.8
|
|||
|
Granted
|
2,256,500
|
|
13.00
|
|
9.2
|
||||
|
Exercised
|
—
|
|
|||||||
|
Forfeited/Cancelled
|
—
|
|
|||||||
|
Outstanding at December 31, 2019
(1)
|
2,769,187
|
|
$
|
13.02
|
|
9.0
|
|||
(1)
Of the outstanding options,
153,409
were exercisable as of
December 31, 2019
.
Other information pertaining to equity-based compensation
At
December 31, 2019
, unrecognized compensation cost related to unvested shares was approximately $
24.2 million
. Unrecognized compensation cost will be expensed annually based on the number of shares that vest during the year.
The Company records equity-based compensation expense to recognize the fair value of the restricted shares that vest and stock options granted. The Company recorded equity-based compensation expense of
$10.2 million
and
$9.3 million
for the years ended
December 31, 2019
and 2018 (Successor), respectively,
$1.9 million
for the four months ended
December 31, 2017
(Successor) and
$3.7 million
for the eight months ended August 31, 2017 (Predecessor).
12. Employee Benefit Plans
Surgery Partners 401(k) Plan
The
Surgery Partners 401(k) Plan is a defined contribution plan whereby certain employees who have completed at least one month of service, including at least one hour of service during that period of time, are eligible to participate. Employees may enroll in the plan immediately upon completion of the minimum service requirement. The Surgery Partners 401(k) Plan allows eligible employees to make contributions of varying percentages or flat dollar amounts of their annual compensation, up to the maximum allowable amounts by the Internal Revenue Service ("IRS"). Eligible employees may or may not receive a match by the Company of their contributions. Employer contributions vest incrementally over a period of
five
years. The Company's contributions were
$7.6 million
for each of the years ended
December 31, 2019
and 2018 (Successor),
$2.3 million
for the four months ended
December 31, 2017
(Successor) and
$2.8 million
for the eight months ended August 31, 2017 (Predecessor).
F-32
13. Other Assets and Liabilities
Other Long-Term Assets
A summary of other long-term assets is as follows (in millions):
|
December 31,
|
||||||||
|
2019
|
2018
|
|||||||
|
Right-of-use operating lease assets
|
$
|
297.7
|
|
$
|
—
|
|
||
|
Other
|
30.8
|
|
36.9
|
|
||||
|
Total
|
$
|
328.5
|
|
$
|
36.9
|
|
||
Other Current Liabilities
A summary of other current liabilities is as follows (in millions):
|
December 31,
|
||||||||
|
2019
|
2018
|
|||||||
|
Interest payable
|
$
|
21.8
|
|
$
|
20.8
|
|
||
|
Amounts due to patients and payors
|
16.5
|
|
20.0
|
|
||||
|
Accrued legal settlement
|
35.1
|
|
42.3
|
|
||||
|
Right-of-use operating lease liabilities
|
37.3
|
|
—
|
|
||||
|
Accrued expenses and other
|
80.5
|
|
72.1
|
|
||||
|
Total
|
$
|
191.2
|
|
$
|
155.2
|
|
||
Other Long-Term Liabilities
A summary of other long-term liabilities is as follows (in millions):
|
December 31,
|
||||||||
|
2019
|
2018
|
|||||||
|
Right-of-use operating lease liabilities
|
$
|
283.1
|
|
$
|
—
|
|
||
|
Facility lease obligations
|
—
|
|
149.8
|
|
||||
|
Other
|
113.6
|
|
121.5
|
|
||||
|
Total
|
$
|
396.7
|
|
$
|
271.3
|
|
||
At December 31, 2018, the Company had financing obligations payable to the lessors of certain land, buildings and improvements that arose solely as a result of the Company being the deemed accounting owner under the build-to-suit guidance in effect prior to the adoption of the Lease Accounting Standard. These obligations were included as facility lease obligations in other long-term liabilities at December 31, 2018 in the table above. Upon adoption of the Lease Accounting Standard on January 1, 2019, the Company derecognized the build-to-suit liabilities and related assets and concluded the leases should be recognized on the balance sheet as finance leases under the new guidance. Further, the Company had an ongoing development agreement to construct a new hospital, which costs were recognized as incurred as a deferred financing obligation included in facility lease obligations at December 31, 2018. Upon reevaluation, the Company concluded that it did not control the assets under construction and therefore the obligation and related asset were derecognized from the balance sheets upon adoption of the Lease Accounting Standard. The lease related to this new hospital commenced in November 2019, and is recognized as a component of finance lease assets and liabilities at December 31, 2019 (see Note. 6 "Leases").
14. Commitments and Contingencies
Professional, General and Workers' Compensation Liability Risks
The Company is subject to claims and legal actions in the ordinary course of business, including claims relating to patient treatment, employment practices and personal injuries. The Company maintains professional, general and workers' compensation liability insurance in excess of self-insured retentions, through third party commercial insurance carriers. Although management believes the coverage is sufficient for the Company's operations, some claims may potentially exceed the scope of coverage in effect. Plaintiffs in these matters may request punitive or other damages that may not be covered by insurance. The Company is not aware of any such proceedings that are reasonably possible to have a material adverse effect on the Company's business, financial position, results of operations or liquidity. Total professional,
F-33
general and workers' compensation claim liabilities as of
December 31, 2019
and
2018
were
$19.4 million
and
$18.2 million
, respectively. The balance includes expected insurance recoveries of
$12.1 million
and
$12.0 million
as of
December 31, 2019
and
2018
, respectively.
Laws and Regulations
Laws and regulations governing the Company's business, including those relating to the Medicare and Medicaid programs, are complex and subject to interpretation. These laws and regulations govern every aspect of how the Company's surgical facilities conduct their operations, from licensing requirements to how and whether the Company's facilities may receive payments pursuant to the Medicare and Medicaid programs. Compliance with such laws and regulations can be subject to future government agency review and interpretation as well as legislative changes to such laws. Noncompliance with such laws and regulations may subject the Company to significant regulatory action including fines, penalties, and exclusion from the Medicare, Medicaid and other federal health care programs. From time to time, governmental regulatory agencies will conduct inquiries of the Company's practices, including, but not limited to, the Company's compliance with federal and state fraud and abuse laws, billing practices and relationships with physicians.
On October 23, 2017, the Company received several civil investigative demands ("CIDs") from the federal government under the FCA for documents and information dating back to January 1, 2010 relating to the medical necessity of certain drug tests conducted by the Company’s physicians and submitted to laboratories owned and operated by the Company. In addition, the Company was informed by CMS that payments to its diagnostic laboratory, Logan Laboratories, were suspended for a period of time, pending further investigations by CMS. CMS lifted the suspension as of December 18, 2019. On January 23, 2020, the United States District Court for the Middle District of Florida unsealed the Complaint in the case of Cho et al. ex rel. United States v. Surgery Partners et al., which we understand to be related to the investigation that gave rise to the CIDs.
The Company has been providing information to the government in response to the CIDs and currently has a non-binding agreement in principle with the United States Department of Justice on the financial terms of a settlement with the goal of resolving these matters. The Company previously recorded a litigation-related charge of
$46.0 million
relating to these matters on the consolidated statements of operations for the year ended December 31, 2018. The Company continues to believe that this reserve is sufficient to cover a potential resolution with the government relating to these matters, including legal expenses relating to the settlement that have not previously been recorded in operating expenses. The ultimate timing, amount and/or final terms of any such resolution may differ materially from those anticipated or the Company may not be able to reach a resolution at all. It is reasonably possible that the Company will incur additional losses above the amount reserved, but the Company is not able to estimate such amounts at this time. See Item 1A "Risk Factors" included elsewhere in this Annual Report under the heading "Risk Factors - Risks Related to Government Regulation -
Companies within the health care industry, including us, continue to be the subject of federal and state audits and investigations, including actions for false and other improper claims
."
Acquired Facilities
The Company, through its wholly-owned subsidiaries or controlled partnerships and limited liability companies, has acquired and will continue to acquire surgical facilities with prior operating histories. Such facilities may have unknown or contingent liabilities, including liabilities for failure to comply with health care laws and regulations, such as billing and reimbursement, fraud and abuse and similar anti-referral laws. Although the Company attempts to assure that no such liabilities exist, obtain indemnification from prospective sellers covering such matters and institute policies designed to conform centers to its standards following completion of acquisitions, there can be no assurance that the Company will not become liable for past activities that may later be asserted to be improper by private plaintiffs or government agencies. There can be no assurance that any such matter will be covered by indemnification or, if covered, that the liability sustained will not exceed contractual limits or the financial capacity of the indemnifying party.
The Company cannot predict whether federal or state statutory or regulatory provisions will be enacted that would prohibit or otherwise regulate relationships which the Company has established or may establish with other health care providers or have materially adverse effects on its business or revenues arising from such future actions. Management believes, however, that it will be able to adjust the Company's operations so as to be in compliance with any statutory or regulatory provision as may be applicable.
Potential Physician Investor Liability
A majority of the physician investors in the partnerships and limited liability companies which operate the Company's surgical facilities carry general and professional liability insurance on a claims-made basis. Each partnership or limited liability company may, however, be liable for damages to persons or property arising from occurrences at the surgical facilities. Although the various physician investors and other surgeons generally are required to obtain general and professional liability insurance with tail coverage that extends beyond the period of any claims-made policies, such individuals may not be able to obtain coverage in amounts sufficient to cover all potential liability. Since most insurance policies contain exclusions, the physician investors will not be insured against all possible occurrences. In the event of an uninsured or underinsured loss, the value of an investment in the partnership interests or limited liability company membership units and the amount of distributions could be adversely affected.
Tax Receivable Agreement
On May 9, 2017, the Company entered into an agreement to amend that certain Income Tax Receivable Agreement, dated September 30, 2015 (as amended, the "TRA"), by and between the Company, and the other parties referred to therein, which amendment became effective on August 31, 2017. Pursuant to the amendment to the TRA, the Company agreed to make payments to H.I.G., the Company's former controlling shareholder, in its capacity as the stockholders representative pursuant to a fixed payment schedule. The amounts payable under the TRA are
F-34
calculated as the product of (i) an annual base amount and (ii) the maximum corporate federal income tax rate for the applicable year plus three percent. The amounts payable under the TRA are related to the Company’s projected realized tax savings over the next five years and are not dependent on the Company’s actual tax savings over such period. The calculation of amounts payable pursuant to the TRA is thus dependent on the maximum corporate federal income tax rate. To the extent that the Company is unable to make payments under the TRA, such payments will be deferred and will accrue interest at a rate of LIBOR plus
500
basis points until paid. If the terms of credit agreements and other debt documents cause the Company to be unable to make payments under the TRA and such terms are not materially more restrictive than those existing as of September 30, 2015, such payments will be deferred and will accrue interest at a rate of LIBOR plus
300
basis points until paid.
As a result of the amendment to the TRA, the Company was required to value the liability under the TRA by discounting the fixed payment schedule using the Company’s incremental borrowing rate. During the eight months ended August 31, 2017 (Predecessor), the Company recognized a reduction in the carrying value of the liability under the TRA of
$43.9 million
, with
$15.3 million
of the reduction recorded to a gain on amendment of TRA and
$28.6 million
recorded as a reduction to the goodwill recorded in connection with the application of pushdown accounting related to the change of control. As a result of the reduction in the corporate tax rate from the Tax Cuts and Jobs Act, the Company remeasured the value of the liability under the TRA pursuant to the calculation terms as described above. During the four months ended December 31, 2017 (Successor), the Company recognized a reduction in the carrying value of the liability under the TRA of
$25.3 million
, included as a tax receivable agreement benefit in the consolidated statement of operations.
Assuming the Company's tax rate is
24%
, calculated as the maximum corporate federal tax rate plus
three
percent, throughout the remaining term of the TRA, the Company estimates the total remaining amounts payable under the TRA was approximately
$60.1 million
and
$64.6 million
as of
December 31, 2019
and
2018
, respectively. The carrying value of the liability under the TRA, reflecting the discount as discussed above, was
$48.7 million
and
$48.5 million
as of
December 31, 2019
and
2018
, respectively. The current portion of the liability was
$16.9 million
and
$7.6 million
as of
December 31, 2019
and
2018
, respectively, and is included as a component of other current liabilities in the consolidated balance sheet. The long-term portion is included as a component of other long-term liabilities in the consolidate balance sheet.
Contingent Consideration
In connection with certain prior period acquisitions, pursuant to the applicable purchase agreements, the Company was required to pay consideration to the prior owners of the applicable facilities should the requirements for continuing employment agreed to in the purchase agreements be met. In accordance with Accounting Standards Codification 805,
Business Combinations
, contingent consideration with a continuing employment provision is recognized ratably over the defined performance period as compensation expense. The Company recognized contingent acquisition compensation expense of
$1.5 million
for the year ended
December 31, 2018
(Successor),
$1.9 million
for the four months ended
December 31, 2017
(Successor) and
$5.1 million
for the eight months ended August 31, 2017 (Predecessor). There was no contingent acquisition compensation expense during the year ended December 31, 2019 (Successor). The Company recorded the expense as a component of general and administrative expenses in the consolidated statement of operations. The Company has no further contingent acquisition compensation expense obligations.
Other
In connection with the Company's integration of the corporate office functions related to the acquisition of NSH, the Company closed its Chicago, Illinois office on September 30, 2018. As a result, the Company recognized a cease-use liability of
$1.4 million
, representing the estimated costs that will continue to be incurred under the office lease for its remaining term. The estimated costs were included as transaction and integration costs in the consolidated statement of operations for the year ended December 31, 2018 and as a component of other current liabilities and other long-term liabilities in the consolidated balance sheet as of December 31, 2018. In 2018, the Company recognized a liability of
$4.5 million
for estimated severance costs in connection with the corporate office integration. The estimated costs were included as transaction and integration costs in the consolidated statement of operations for the year ended December 31, 2018. There were no unpaid severance costs remaining as of December 31, 2019.
F-35
15. Segment Reporting
The Company operates in
three
major lines of business that are also the Company's reportable operating segments - the operation of surgical facilities, the operation of ancillary services and the operation of optical services. The surgical facility services segment consists of the operation of ASCs and surgical hospitals, and includes anesthesia services. The ancillary services segment consists of a diagnostic laboratory and multi-specialty physician practices. The optical services segment consists of an optical products group purchasing organization, and until October 2018, an optical laboratory that manufactured eyewear. "All other" primarily consists of the Company's corporate general and administrative functions.
The following tables present financial information for each reportable segment (in millions):
|
Successor
|
Predecessor
|
|||||||||||||||||
|
|
|
Year Ended December 31,
|
September 1 to
December 31, |
January 1 to
August 31, |
||||||||||||||
|
|
|
2019
|
2018
|
2017
|
2017
|
|||||||||||||
|
Revenues:
|
|
|
||||||||||||||||
|
Surgical facility services
|
|
$
|
1,748.2
|
|
$
|
1,682.4
|
|
$
|
564.4
|
|
$
|
688.7
|
|
|||||
|
Ancillary services
|
|
79.4
|
|
79.6
|
|
24.7
|
|
52.3
|
|
|||||||||
|
Optical services
|
|
3.8
|
|
9.5
|
|
3.5
|
|
7.6
|
|
|||||||||
|
Total
|
|
$
|
1,831.4
|
|
$
|
1,771.5
|
|
$
|
592.6
|
|
$
|
748.6
|
|
|||||
|
Adjusted EBITDA:
|
||||||||||||||||||
|
Surgical facility services
|
$
|
328.9
|
|
$
|
309.5
|
|
$
|
103.8
|
|
$
|
125.9
|
|
||||||
|
Ancillary services
|
2.6
|
|
3.0
|
|
(2.3
|
)
|
(6.5
|
)
|
||||||||||
|
Optical services
|
1.4
|
|
2.5
|
|
0.7
|
|
2.2
|
|
||||||||||
|
All other
|
(74.3
|
)
|
(80.2
|
)
|
(23.5
|
)
|
(36.0
|
)
|
||||||||||
|
Total
|
$
|
258.6
|
|
$
|
234.8
|
|
$
|
78.7
|
|
$
|
85.6
|
|
||||||
|
Adjusted EBITDA:
|
$
|
258.6
|
|
$
|
234.8
|
|
$
|
78.7
|
|
$
|
85.6
|
|
||||||
|
Net income attributable to non-controlling interests
|
119.9
|
|
110.1
|
|
39.6
|
|
42.1
|
|
||||||||||
|
Depreciations and amortization
|
(76.5
|
)
|
(67.4
|
)
|
(21.8
|
)
|
(30.1
|
)
|
||||||||||
|
Interest expense, net
|
(178.9
|
)
|
(147.0
|
)
|
(48.7
|
)
|
(69.0
|
)
|
||||||||||
|
Equity-based compensation expense
|
(10.2
|
)
|
(9.3
|
)
|
(1.9
|
)
|
(3.7
|
)
|
||||||||||
|
Transaction, integration and acquisition costs
(1)
|
(36.1
|
)
|
(34.0
|
)
|
(9.2
|
)
|
(7.7
|
)
|
||||||||||
|
Gain (loss) on disposals and deconsolidation, net
|
4.4
|
|
(31.8
|
)
|
—
|
|
(1.7
|
)
|
||||||||||
|
(Loss) gain on litigation settlements and other litigation costs
(2)
|
(4.6
|
)
|
(46.0
|
)
|
8.7
|
|
3.8
|
|
||||||||||
|
Loss on debt extinguishment
|
(11.7
|
)
|
—
|
|
—
|
|
(18.2
|
)
|
||||||||||
|
Tax receivable agreement (expense) benefit
|
(2.4
|
)
|
—
|
|
25.3
|
|
—
|
|
||||||||||
|
Impairment charges
|
(7.9
|
)
|
(74.4
|
)
|
—
|
|
—
|
|
||||||||||
|
Reserve adjustments
(3)
|
—
|
|
(2.7
|
)
|
—
|
|
—
|
|
||||||||||
|
Contingent acquisition compensation expense
|
—
|
|
(1.5
|
)
|
(2.0
|
)
|
(5.1
|
)
|
||||||||||
|
Gain on acquisition escrow release
|
—
|
|
—
|
|
0.2
|
|
1.0
|
|
||||||||||
|
Gain on amendment to tax receivable agreement
|
—
|
|
—
|
|
1.1
|
|
15.3
|
|
||||||||||
|
(Loss) income before income taxes
|
$
|
54.6
|
|
$
|
(69.2
|
)
|
$
|
70.0
|
|
$
|
12.3
|
|
||||||
|
(1)
|
For the years ended December 31, 2019 and 2018 (Successor), this amount includes transaction and integration costs of
$19.0 million
and
$31.7 million
, respectively, and acquisition costs of
$2.8 million
and
$2.2 million
, respectively. This amount further includes start-up costs related to a de novo surgical hospital of
$14.3 million
for the year ended
December 31, 2019
(Successor), with no comparable costs in the 2018 period (Successor). For the four months ended
December 31, 2017
(Successor) and the eight months ended August 31, 2017 (Predecessor), this amount includes transaction and integration costs of
$7.5 million
and
$5.6 million
, respectively, and acquisition costs of
$1.8 million
and
$2.1 million
, respectively. There were no start-up costs related to the de novo surgical hospital in the 2017 periods.
|
|
(2)
|
For the years ended December 31, 2019 and 2018 (Successor), this amount includes a loss on litigation settlements of
$0.2 million
and
$46.0 million
, respectively. This amount further includes other litigation costs of
$4.4 million
for the year ended
December 31, 2019
(Successor), with no comparable costs in the 2018 period (Successor). For the four months ended
December 31, 2017
(Successor) and the eight months ended August 31, 2017 (Predecessor), this amount includes a gain on litigation settlements of
$8.7 million
and
$3.8 million
, respectively.
|
F-36
|
(3)
|
This amount represents adjustments to revenue in connection with applying consistent policies across the combined company as a result of the integration of Surgery Partners and a previously acquired entity.
|
|
December 31,
|
||||||||
|
2019
|
2018
|
|||||||
|
Assets:
|
||||||||
|
Surgical facility services
|
$
|
4,580.4
|
|
$
|
4,204.4
|
|
||
|
Ancillary services
|
69.6
|
|
52.7
|
|
||||
|
Optical services
|
17.7
|
|
20.1
|
|
||||
|
All other
|
351.2
|
|
399.1
|
|
||||
|
Total assets
|
$
|
5,018.9
|
|
$
|
4,676.3
|
|
||
|
Successor
|
Predecessor
|
|||||||||||||||||
|
Year Ended December 31,
|
September 1 to
December 31, |
January 1 to
August 31, |
||||||||||||||||
|
2019
|
2018
|
2017
|
2017
|
|||||||||||||||
|
Cash purchases of property and equipment, net:
|
||||||||||||||||||
|
Surgical facility services
|
$
|
65.9
|
|
$
|
34.2
|
|
$
|
9.3
|
|
$
|
14.6
|
|
||||||
|
Ancillary services
|
1.1
|
|
0.4
|
|
0.2
|
|
1.9
|
|
||||||||||
|
Optical services
|
—
|
|
—
|
|
0.1
|
|
0.1
|
|
||||||||||
|
All other
|
6.6
|
|
5.2
|
|
1.2
|
|
2.2
|
|
||||||||||
|
Total
|
$
|
73.6
|
|
$
|
39.8
|
|
$
|
10.8
|
|
$
|
18.8
|
|
||||||
16. Quarterly Financial Information (Unaudited)
The following tables include a summary of certain information related to the Company's quarterly consolidated results of operations for each of the four quarters in the years ended
December 31, 2019
and
2018
. The timing of acquisitions and divestitures completed during the years presented affects the comparability of the quarterly financial information. The following should be read in conjunction with the audited consolidated financial statements included herein. The amounts are as follows (in millions except per share amounts):
|
2019
|
||||||||||||||||
|
|
Q1
|
Q2
|
Q3
|
Q4
|
||||||||||||
|
Revenues
|
$
|
416.8
|
|
$
|
445.4
|
|
$
|
452.0
|
|
$
|
517.2
|
|
||||
|
Cost of revenues
|
$
|
326.1
|
|
$
|
340.4
|
|
$
|
353.1
|
|
$
|
388.0
|
|
||||
|
Net income (loss)
|
$
|
3.5
|
|
$
|
8.1
|
|
$
|
10.9
|
|
$
|
22.6
|
|
||||
|
Net income attributable to non-controlling interests
|
$
|
(23.6
|
)
|
$
|
(27.9
|
)
|
$
|
(26.6
|
)
|
$
|
(41.8
|
)
|
||||
|
Net loss attributable to Surgery Partners, Inc.
|
$
|
(20.1
|
)
|
$
|
(19.8
|
)
|
$
|
(15.7
|
)
|
$
|
(19.2
|
)
|
||||
|
Basic net loss per share attributable to common stockholders
|
$
|
(0.60
|
)
|
$
|
(0.59
|
)
|
$
|
(0.51
|
)
|
$
|
(0.59
|
)
|
||||
|
Diluted net loss per share attributable to common stockholders
|
$
|
(0.60
|
)
|
$
|
(0.59
|
)
|
$
|
(0.51
|
)
|
$
|
(0.59
|
)
|
||||
|
2018
|
||||||||||||||||
|
|
Q1
|
Q2
|
Q3
|
Q4
|
||||||||||||
|
Revenues
|
$
|
411.3
|
|
$
|
436.6
|
|
$
|
432.4
|
|
$
|
491.2
|
|
||||
|
Cost of revenues
|
$
|
327.3
|
|
$
|
340.1
|
|
$
|
334.3
|
|
$
|
359.7
|
|
||||
|
Net income (loss)
|
$
|
5.1
|
|
$
|
4.3
|
|
$
|
2.0
|
|
$
|
(107.0
|
)
|
||||
|
Net income attributable to non-controlling interests
|
$
|
(22.6
|
)
|
$
|
(23.8
|
)
|
$
|
(23.0
|
)
|
$
|
(40.7
|
)
|
||||
|
Net loss attributable to Surgery Partners, Inc.
|
$
|
(17.5
|
)
|
|
$
|
(19.5
|
)
|
$
|
(21.0
|
)
|
$
|
(147.7
|
)
|
|||
|
Basic net loss per share attributable to common stockholders
|
$
|
(0.53
|
)
|
$
|
(0.57
|
)
|
$
|
(0.61
|
)
|
$
|
(3.25
|
)
|
||||
|
Diluted net loss per share attributable to common stockholders
|
$
|
(0.53
|
)
|
$
|
(0.57
|
)
|
$
|
(0.61
|
)
|
$
|
(3.25
|
)
|
||||
F-37
SIGNATURES
Pursuant to the requirements of Section 13 or 15(d) of the Securities Exchange Act of 1934, the Registrant has duly caused this report to be signed on its behalf by the undersigned, thereunto duly authorized.
|
SURGERY PARTNERS, INC.
|
|
|
By:
|
/s/ J. Eric Evans
J. Eric Evans
Chief Executive Officer
(Principal Executive Officer)
|
Date:
March 13, 2020
Pursuant to the requirements of the Securities Exchange Act of 1934, this Annual Report has been signed below by the following persons on behalf of the registrant and in the capacities and on the dates indicated.
|
SIGNATURES
|
TITLE
|
DATE
|
|
Chief Executive Officer, Director
(Principal Executive Officer)
|
March 13, 2020
|
|
|
/s/ J. Eric Evans
|
||
|
J. Eric Evans
|
||
|
Executive Vice President and Chief Financial Officer
(Principal Financial and Accounting Officer)
|
March 13, 2020
|
|
|
/s/ Thomas F. Cowhey
|
||
|
Thomas F. Cowhey
|
||
|
Executive Chairman of the Board
|
March 13, 2020
|
|
|
/s/ Wayne S. DeVeydt
|
||
|
Wayne S. DeVeydt
|
||
|
Director
|
March 13, 2020
|
|
|
/s/ T. Devin O'Reilly
|
||
|
T. Devin O'Reilly
|
||
|
Director
|
March 13, 2020
|
|
|
/s/ Teresa DeLuca
|
||
|
Teresa DeLuca
|
||
|
Director
|
March 13, 2020
|
|
|
/s/ John A. Deane
|
||
|
John A. Deane
|
||
|
Director
|
March 13, 2020
|
|
|
/s/ Brent Turner
|
||
|
Brent Turner
|
||
|
Director
|
March 13, 2020
|
|
|
/s/ Andrew Kaplan
|
||
|
Andrew Kaplan
|
||
|
Director
|
March 13, 2020
|
|
|
/s/ Clifford G. Adlerz
|
||
|
Clifford G. Adlerz
|
||
TABLE OF CONTENTS
Part IItem 1. BusinessItem 1A. Risk FactorsItem 1B. Unresolved Staff CommentsItem 2. PropertiesItem 3. Legal ProceedingsItem 4. Mine Safety DisclosuresPart IIItem 5. Market For Registrant S Common Equity, Related Stockholder Matters and Issuer Purchases Of Equity SecuritiesItem 6. Selected Financial DataItem 7. Management's Discussion and Analysis Of Financial Condition and Results Of OperationsItem 7A. Quantitative and Qualitative Disclosures About Market RiskItem 8. Financial Statements and Supplementary DataItem 9. Changes in and Disagreements with Accountants on Accounting and Financial DisclosureItem 9A. Controls and ProceduresItem 9B. Other InformationPart IIIItem 10. Directors, Executive Officers and Corporate GovernanceItem 11. Executive CompensationItem 12. Security Ownership Of Certain Beneficial Owners and Management and Related Stockholder MattersItem 13. Certain Relationships and Related Transactions, and Director IndependenceItem 14. Principal Accounting Fees and ServicesPart IVItem 15. Exhibits and Financial Statement SchedulesItem 16. Form 10-k Summary