SHAKE SHACK INC.
10-Ks and 10-Qs
|
|
|
|
|
|
|
|
|
|
|
|
|
|
|
|
|
|
|
|
|
|
|
|
|
|
|
|
|
|
|
|
|
|
|
|
|
|
UNITED STATES
SECURITIES AND EXCHANGE COMMISSION
Washington, D.C. 20549
FORM 10-K
|
(Mark One)
|
|||||
|
þ
|
ANNUAL REPORT PURSUANT TO SECTION 13 OR 15(d) OF THE SECURITIES EXCHANGE ACT OF 1934
|
||||
|
For the fiscal year ended December 26, 2018
|
|||||
|
OR
|
|||||
|
o
|
TRANSITION REPORT PURSUANT TO SECTION 13 OR 15(d) OF THE SECURITIES EXCHANGE ACT OF 1934
|
||||
|
For the transition period from _______ to ______
|
|||||
|
Commission file number:
001-36823
|
|||||
SHAKE SHACK INC.
(Exact name of registrant as specified in its charter)
|
Delaware
|
47-1941186
|
|||
|
(State or other jurisdiction of
incorporation or organization)
|
(I.R.S. Employer
Identification No.)
|
|||
|
225 Varick Street, Suite 301, New York, New York
|
10014
|
|||
|
(Address of principal
executive offices)
|
(Zip Code)
|
|||
|
(646) 747-7200
|
||||
|
(Registrant's telephone number, including area code)
|
||||
|
Securities registered pursuant to Section 12(b) of the Act:
|
||||
|
Title of each class
|
Name of exchange on which registered
|
|||
|
Class A Common Stock, par value $0.001
|
New York Stock Exchange
|
|||
|
Securities registered pursuant to Section 12(g) of the Act:
None
|
||||
Indicate by check mark if the registrant is a well-known seasoned issuer, as defined in Rule 405 of the Securities Act.
þ
Yes
o
No
Indicate by check mark if the registrant is not required to file reports pursuant to Section 13 or Section 15(d) of the Act.
o
Yes
þ
No
Indicate by check mark if the registrant (1) has filed all reports required to be filed by Section 13 or 15(d) of the Securities Exchange Act of 1934 during the preceding 12 months (or for such shorter period that the registrant was required to file such reports), and (2) has been subject to such filing requirements for the past 90 days.
þ
Yes
o
No
Indicate by check mark whether the registrant has submitted electronically every Interactive Data File required to be submitted pursuant to Rule-405 of Regulation S-T during the preceding 12 months (or for such shorter period that the registrant was required to submit such files).
þ
Yes
o
No
Indicate by check mark if disclosure of delinquent filers pursuant to Item 405 of Regulation S-K is not contained herein, and will not be contained, to the best of the registrant’s knowledge, in definitive proxy or information statements incorporated by reference in Part III of this Form 10-K or any amendment to this Form 10-K.
o
Indicate by check mark whether the registrant is a large accelerated filer, an accelerated filer, a non-accelerated filer, a smaller reporting company, or an emerging growth company. See the definitions of “large accelerated filer,” “accelerated filer”, “smaller reporting company”, and "emerging growth company" in Rule 12b-2 of the Exchange Act.
|
Large accelerated filer
|
þ
|
Accelerated filer
|
o
|
|
|
Non-accelerated filer
|
o
|
Smaller reporting company
|
o
|
|
|
Emerging growth company
|
o
|
|||
If an emerging growth company, indicate by check mark if the registrant has elected not to use the extended transition period for complying with any new or revised financial accounting standard provided pursuant to Section 13(a) of the Exchange Act.
o
Indicate by check mark whether the registrant is a shell company (as defined in Rule 12b-2 of the Act).
o
Yes
þ
No
The aggregate market value of the voting and non-voting stock held by non-affiliates of the Registrant, as of June 27, 2018, the last business day of the Registrant’s most recently completed second fiscal quarter, was approximately
$1,746,799,325
, computed using the closing price on that day of
$68.39
. Solely for purposes of this disclosure, shares of common stock held by members part of the Voting Group pursuant to to the Stockholders Agreement, as amended, of the Registrant as of such date have been excluded because such persons may be deemed to be affiliates. This determination of affiliates is not necessarily a conclusive determination for any other purposes.
As of
February 13, 2019
, there were
29,537,426
shares of Class A common stock outstanding and
7,547,347
shares of Class B common stock outstanding.
|
DOCUMENTS INCORPORATED BY REFERENCE
|
|
Portions of the registrant’s definitive Proxy Statement for its 2019 Annual Meeting of Shareholders are incorporated by reference into Part III of this Form 10-K.
|
SHAKE SHACK INC.
TABLE OF CONTENTS
2
|
Shake Shack Inc.
 Form 10-K
Form 10-K
Cautionary Note About Forward-Looking Information
This Annual Report on Form 10-K ("Form 10-K") contains forward-looking statements, within the meaning of the Private Securities Litigation Reform Act of 1995 ("PSLRA"), which are subject to known and unknown risks, uncertainties and other important factors that may cause actual results to be materially different. All statements other than statements of historical fact are forward-looking statements. Many of the forward-looking statements are located in Part II, Item 7 of this Form 10-K under the headings "Management's Discussion and Analysis of Financial Condition and Results of Operations", including, but not limited to, expected financial outlook for fiscal year 2019, expected Shack openings, expected same-Shack sales growth and trends in our business. Forward-looking statements discuss our current expectations and projections relating to our financial position, results of operations, plans, objectives, future performance and business. You can identify forward-looking statements by the fact that they do not relate strictly to historical or current facts. These statements may include words such as "aim," "anticipate," "believe," "estimate," "expect," "forecast," "outlook," "potential," "project," "projection," "plan," "intend," "seek," "may," "could," "would," "will," "should," "can," "can have," "likely," the negatives thereof and other similar expressions.
While we believe that our assumptions are reasonable, it is very difficult to predict the impact of known factors, and it is impossible to anticipate all factors that could affect our actual results. All forward-looking statements are expressly qualified in their entirety by these cautionary statements. You should evaluate all forward-looking statements made in this Form 10-K in the context of the risks and uncertainties disclosed in Part I, Item 1A of this Form 10-K under the heading "Risk Factors," which are incorporated herein by reference.
The forward-looking statements included in this Form 10-K are made only as of the date hereof. We undertake no obligation to publicly update or revise any forward-looking statement as a result of new information, future events or otherwise, except as otherwise required by law. If we do update one or more forward-looking statements, no inference should be made that we will make additional updates with respect to those or other forward-looking statements. We qualify all of our forward-looking statements by these cautionary statements.
Shake Shack Inc.
Form 10-K
|
1
Form 10-K
|
1
Part I
Item 1. Business.
Shake Shack Inc. was formed on September 23, 2014 as a Delaware corporation. Shake Shack Inc. Class A common stock trades on the New York Stock Exchange under the symbol "SHAK." Unless the context otherwise requires, "we," "us," "our," "Shake Shack," the "Company" and other similar references refer to Shake Shack Inc. and, unless otherwise stated, all of its subsidiaries, including SSE Holdings, LLC, which we refer to as "SSE Holdings."
INITIAL PUBLIC OFFERING AND ORGANIZATIONAL TRANSACTIONS
O
n February 4, 2015, we completed an initial public offering ("IPO") of
5,750,000
shares of our Class A common stock at a public offering price of
$21.00
per share, which includes
750,000
shares issued pursuant to the underwriters' over-allotment option. We received
$112.3
million in proceeds, net of underwriting discounts and commissions, which we used to purchase newly-issued membership interests from SSE Holdings at a price per interest equal to the initial public offering price of our Class A common stock of
$21.00
.
Shake Shack is a holding company with no direct operations and our principal asset is our equity interest in SSE Holdings. In connection with the IPO, we completed a series of organizational transactions, including the following:
|
▪
|
We amended and restated the limited liability company agreement of SSE Holdings (as amended, the "SSE Holdings LLC Agreement") to, among other things, (i) provide for a new single class of common membership interests in SSE Holdings ("LLC Interests"), (ii) exchange all of the membership interests of the then-existing holders of SSE Holdings for LLC Interests and (iii) appoint Shake Shack as the sole managing member of SSE Holdings;
|
|
▪
|
We amended and restated our certificate of incorporation to, among other things, (i) provide for Class B common stock with voting rights but no economic interests (where “economic interests” means the right to receive any distributions or dividends, whether cash or stock, in connection with common stock) and (ii) issue shares of Class B common stock to the then-existing members of SSE Holdings on a one-to-one basis with the number of LLC Interests they own;
|
|
▪
|
We acquired, by merger, two entities that were owned by former indirect members of SSE Holdings, for which we issued
5,968,841
shares of Class A common stock as merger consideration (the "Mergers").
|
The above mentioned transactions as well as the other transactions completed in connection with the IPO are referred to collectively as the "Organizational Transactions."
Following the completion of the Organizational Transactions, we owned
33.3%
of SSE Holdings. The non-controlling interest holders subsequent to the Mergers owned the remaining
66.7%
of SSE Holdings. As a result of the Organizational Transactions, we became the sole managing member of SSE Holdings and, although we had a minority economic interest in SSE Holdings, we had the sole voting power in, and control the management of, SSE Holdings. Accordingly, we consolidated the financial results of SSE Holdings and reported a non-controlling interest in our consolidated financial statements.
As the Organizational Transactions are considered transactions between entities under common control, the financial statements for periods prior to the IPO and Organizational Transactions have been adjusted to combine the previously separate entities for presentation purposes.
Secondary Offering
In August 2015, we completed a secondary offering of
4,000,000
shares of our Class A common stock at a price of
$60.00
per share. All of the shares sold in the offering were offered by certain non-controlling interest holders. We did not receive any proceeds
2
|
Shake Shack Inc.
Form 10-K
Form 10-K
from the sale of shares of Class A common stock offered by the aforementioned non-controlling interest holders. The shares sold in the offering consisted of (i)
844,727
existing shares of Class A common stock held and (ii)
3,155,273
newly-issued shares of Class A common stock issued in connection with the redemption of
3,155,273
LLC Interests by the non-controlling interest holders that participated in the offering. Simultaneously, and in connection with the redemption,
3,155,273
shares of Class B common stock were surrendered by non-controlling interest holders and canceled. Additionally, in connection with the redemption, we received
3,155,273
LLC Interests, increasing our total ownership interest in SSE Holdings.
USC Merger
Pursuant to a Stockholders Agreement, dated as of February 4, 2015, as amended, by and among Daniel H. Meyer and his affiliates (the "Meyer Group") and other parties thereto, the Meyer Group has the right to cause all of the stock of Union Square Cafe Corp. ("USC") and Gramercy Tavern Corp. ("GT") to be converted into and exchanged for shares of our Class A common stock pursuant to a tax-free reorganization (each, a "Reorganization"). In December 2015, the Meyer Group exercised their right with respect to USC. The Reorganization of USC was structured as a two-step merger, whereby (i) a newly-formed wholly-owned subsidiary of the Company merged with and into USC, then (ii) USC merged with and into the Company (the foregoing transactions are collectively referred to as the "USC Merger"). Prior to the USC Merger, USC owned
1,727,804
LLC Interests and an equivalent number of shares of our Class B common stock. In the USC Merger, (i)
1,727,804
shares of Class A common stock were issued to the stockholders of USC, with each stockholder receiving newly-issued shares of Class A common stock in an amount equivalent to the number of shares of USC held by such stockholders; (ii)
1,727,804
shares of Class B common stock held by USC were cancelled; and (iii)
1,727,804
LLC Interests held by USC were transferred to us.
As of
December 26, 2018
, we owned
79.6%
of SSE Holdings and the non-controlling interest holders own the remaining
20.4%
of SSE Holdings.
OVERVIEW
Shake Shack is a modern day "roadside" burger stand serving a classic American menu of premium burgers, hot dogs, crispy chicken, frozen custard, crinkle cut fries, shakes, beer, wine and more. Originally founded by Danny Meyer's Union Square Hospitality Group ("USHG"), which owns and operates some of New York City's most acclaimed and popular restaurants—Union Square Cafe, Gramercy Tavern, Blue Smoke, The Modern at the Museum of Modern Art, Maialino, Untitled, Marta, Martina, Daily Provisions, Tacocina, Manhatta and Intersect—Shake Shack originated as a hot dog cart in 2001 to support the rejuvenation of New York City's Madison Square Park through its Conservancy's first art installation, "I
Y
Taxi." The hot dog cart was an instant success, with lines forming daily throughout the summer months for the next three years. In response, the city's Department of Parks and Recreation awarded Shake Shack a contract to create a kiosk to help fund the park's future. In 2004, Shake Shack officially opened and immediately became a community gathering place for New Yorkers and visitors from all over the world and has since become a beloved New York City institution, garnering significant media attention, critical acclaim and a passionately-devoted following. Since its inception, Shake Shack has grown rapidly—with
208
Shacks, as of
December 26, 2018
, in 13 countries and 26 states, as well as the District of Columbia—and we continue to expand globally bringing the Shake Shack experience to new guests around the world.
THE SHACK PACT
The
Shack Pact
™ is an agreement that our team makes at Shake Shack to lead our company with integrity, with purpose and with intention. It’s our mission and vision. Quite simply: it’s
What We Do
and
Who We Are
and it’s the ethos of our work each and every day as we grow Shake Shack. The Shack Pact is prominently displayed in the team member areas of every Shack, on the inside cover of the Shackademics™ book (our training manual) and is referenced and applied throughout daily shifts.
WHAT WE DO:
We Stand For Something Good
Shake Shack Inc.
Form 10-K
|
3
Form 10-K
|
3
We strive to
Stand For Something Good
®
in everything we do. That means carefully sourced premium ingredients from like-minded purveyors we admire and love; thoughtful, well-crafted and responsible design for its place; and deep community support through donations, events and volunteering.
WHO WE ARE:
We Are Boundless Hospitality
Hospitality is in our DNA. We take great pride in our culture and believe that it is the single most important factor in our success. Our mission to
Stand For Something Good
®
permeates throughout every Shack we build, every ingredient we source and every team member we hire. We take care of each other first and foremost so that we can take care of our guests, our community, our suppliers and our investors. We aim to recruit people who have integrity, who are warm, friendly, motivated, caring, self-aware and intellectually curious—what we call "51%'ers." We use the term "51%" to describe the inherent interpersonal and emotional skills needed to thrive on the job and "49%" to describe the technical skills needed for the job. Our 51%'ers are excited and committed to champion performance, remarkable and enriching hospitality, embodying our culture, and actively growing themselves and the brand. Danny Meyer's original vision of Enlightened Hospitality™ guided the creation of the unique Shake Shack culture that, we believe, creates a differentiated experience for our guests at each of our Shacks around the world. Our team is trained to understand and practice the values of Enlightened Hospitality: caring for each other, caring for our guests, caring for our community, caring for our suppliers and caring for our investors. These principles have been championed by Danny Meyer throughout his career and are detailed in his
New York Times
best-selling book
Setting the Table: The Transforming Power of Hospitality in Business
, and they are fundamental to the way we operate our business.
The Bigger We Get, the Smaller We Act
With every passing year, this mantra continues to drive and challenge our strategy. As we continue to grow, it's more important than ever that we cherish our roots, continue the ethos that led to the creation of Shake Shack and to never veer from our original vision. We grew our Shack community by creating nearly 2,000 jobs across the country, adding 49 new Shacks, reaching more than 200 Shacks worldwide. Through this growth, we continue to make decisions that focus on the core of who we are, staying true to our mission to Stand For Something Good and the principles of Enlightened Hospitality. These principles drive us to seek out the finest team members, the tastiest ingredients, the best suppliers and the best community partners.
Hospitality in the Digital Age
Shake Shack continues to pursue innovation in technology that seeks to create an active dialogue with our guests, drive higher engagement and raise the bar on operational excellence and overall guest experience. Guests can now get their Shack wherever and whenever they want, including: (i) via mobile-ordering app; (ii) kiosk-ordering at select Shacks; (iii) web-ordering directly from their device; (iv) delivered to their door; and of course, (v) at their nearest Shack!
An essential part of Shake Shack's digital strategy is the Shack App.The launch of our first-ever mobile ordering app-available on both IOS and Android nationwide was a huge milestone for us in 2017. With the Shack App, we’re able to meet our guests wherever they are and provide them a whole new way to experience Shake Shack. The Shack App was developed to elevate the in-Shack experience, aiming to provide shorter pick-up times and convenient mobile ordering. Guests can order Shake Shack when they want it right from their phone, and it will be cooked-to-order and timed to their arrival. The Shack App features all our menu classics—all-natural beef burgers, flat-top dogs, chicken sandwiches, frozen custard, crinkle cut fries and more—and includes all the mobile ordering essentials: guests can pick from their favorite orders; keep track of food allergies; access nutritional information; see the latest events and promos; connect to all Shake Shack social media channels and share feedback.
Shack App Redesign
In 2018, knowing that consumers demand faster, easier and more personalized experiences, we used guest data to develop a number of enhancements that optimize the path to purchase with our Shack App redesign. These enhancements included: (i) creating efficiencies in the checkout process; (ii) optimizing the path to purchase, anticipating guests needs and help guests through checkout; (iii) providing a way to mark orders as favorites; (iv) more personalization with the ability to strategically message based on where the guest is in the order life cycle; and (v) p
reparing for enhanced location services like geo-tracking, allowing us to more seamlessly time guests orders for pickup and deliver a better product.
4
|
Shake Shack Inc.
Form 10-K
Form 10-K
Web Ordering
This year we piloted our web ordering platform, starting at 10 Shacks across the country, then rolling out nationwide by the end of the year. This new ordering channel is similar in feel to our kiosks and mobile application, and guests follow the same pick up process as the Shack App. With higher category limits (versus the Shack App) and the ability to check out as a guest, web ordering offers yet another convenient ordering opportunity to our guests.
Kiosk Ordering
We introduced our first kiosk-only ordering, cashless environment at our Astor Place Shack in New York City in 2017, and as of December 26, 2018, we had 16 Shacks using a form of kiosk across the country. The Shack kiosk was developed with an enhanced guest experience in mind, allowing us to serve more guests at peak times—whether in-Shack, for pickup via the Shack App or even delivery—intending to result in fewer lines, less wait time and less friction at every channel. The Sh
ack kiosk replicates the experience of the Shack App with a sharp aesthetic, an intuitive touch screen interface and ease of ordering. Guests simply select their food, place an order and choose to receive an alert via text or buzzer when their order is ready. Hospitality Champs are stationed around the kiosks to assist guests with their orders and answer any questions.
Delivery
We continued to explore delivery as a way to bring Shake Shack to our guests wherever they are and whenever they want. As an e
ssential part of how consumers eat today, delivery presents a unique opportunity to reach even more people and allow them to engage with Shake Shack on their terms. We conducted various delivery pilots with several partners
throughout the year and also offered special delivery promotions.
We also continue to create and test new packaging, especially with our entrance into delivery, which will help provide the best possible Shack experience to our guests at home. We learned about our various Shacks' ability to handle delivery at peak times and g
ained perspective on the capabilities of delivery partners and the benefits of systems integration. We expect that our thoughtful, strategic approach to delivery will result in an overall better Shake Shack experience for our guests.
We Are a Team: We Take Care of Each Other
Our people make all the difference and we remain committed to investing in our people to build the best team and retain our talent.
We believe the culture and unity that we have built amongst our Shack teams and across the Company as a whole is a key driver of our ability to deliver a great guest experience and, therefore, continue to successfully grow our footprint. We seek to be an employer of choice by offering competitive wages, comprehensive benefits and a variety of incentive programs. We believe t
hat team members who are treated and trained well will deliver Enlightened Hospitality and a superior guest experience. Through our leadership development programs, we teach our team members the principles of Enlightened Hospitality and how to live and breathe our Shack Pact, the agreement that encompasses our value system and brand ethos.
Ultimately, we believe that when we have the best team, we can reach our goals, deliver a great guest experience and continue to build our brand.
The HUG Fund Mission
One way we embrace Enlightened Hospitality internally is through the administration of our own HUG (Help Us Give) Fund program that we rolled out to our employees in late fiscal 2017. The HUG Fund provides a wonderful way for Shake Shack team members company-wide to take care of each other through tax-deductible payroll and other one-time contributions. The sole purpose of the HUG Fund is to provide timely financial assistance to our employees impacted by financially devastating circumstances that are far beyond their control and their means. All of the money donated by Shake Shack employees at every level will go directly into the fund.
Leaders Training Future Leaders
We invest in our team through extensive leadership development programs to so that Shake Shack remains a great place to work and a compelling career choice for team members at every level. We have built a culture of active learning and we foster an environment of leadership development throughout the entire life cycle of employment. We believe that our culture of Enlightened Hospitality enables us to develop future leaders from within, and deliver a consistent Shack experience as our team continues to grow.
The Shacksperience and Steppin' Up Model
Shake Shack Inc.
Form 10-K
|
5
Form 10-K
|
5
The goal of our training programs is to develop leaders and to cross-utilize team members throughout our operations. We call our team member life cycle and overall employment experience, The Shacksperience™. The Steppin' Up Model is the growth model for Shake Shack employees which defines the steps in the employment life cycle, beginning with the team member position and working up through the general manager position. It clarifies the eligibility requirements and training necessary for each position, outlines the growth opportunities at all levels of the organization and furthers our philosophy of "leaders training future leaders." By creating this model, employees have a clear view of the career progression for a Shack employee, which in turn helps foster communication in achieving these goals. We train our culture and guiding principles first, then move to menu knowledge, followed by a focus on operational training. We believe that everyone learns differently and our training programs use various formats: online interactive, video, hands-on and paper-based. For those online interactive training sessions, every team member has access to ShackSource™, our proprietary online training portal, which is used not only as a learning platform, but also as a communication tool for our team. ShackSource also allows team members to send recognition messages, comments, praise and thanks to their fellow team members across the Company. And for those hands-on training sessions, our new Leadership Center is the perfect place to host. Located below our Home Office on the lower level of our West Village Shack, the Leadership Center is a space dedicated to the training and development of our Shack teams and Home Office, where we now host a number of our New Leader Orientation for new managers.
We care about our team and are committed to setting them up for success in the future, both at Shake Shack and in their future careers. In 2018 we promoted 1,151 people throughout our company. Our shift manager position, a level between a team member and manager, allows team members to be introduced to certain managerial-level skills before making the full transition to manager. We are incredibly proud of the number of leaders who continue to graduate from hourly roles to shift managers, and on up the ladder of Shack leadership. We are committed to retaining our leaders and will continue to evolve training, compensation and benefits to do so, such as extending our equity program to general managers.
We Are Fine Casual: Inspired Food and Drink
We embrace our fine-dining heritage and are committed to sourcing premium, sustainable ingredients, such as all-natural, hormone and antibiotic-free beef, chicken and pork, while offering excellent value to our guests. Our core menu remains focused, and is supplemented with targeted innovation inspired by the best versions of the classic American roadside burger stand. Always focused on culinary creativity and excellence, we collaborate with award-winning chefs, talented bakers, farmers and artisanal purveyors who work with us in different and engaging ways. We never stop looking for the best ingredients and the best culinary partners in order to exceed our guests' expectations in every aspect of their experience. As we grow across the country, we are excited to collaborate even more with the talented chefs and suppliers who are leading our industry.
Our signature items are our all-natural, hormone and antibiotic-free burgers, hot dogs, crispy chicken, crinkle cut fries, shakes and frozen custard. We cook our burgers to order, hand-spin our shakes and strive to use the freshest premium ingredients available.
Our Menu
Our menu focuses on premium food and beverages, carefully crafted from a range of classic American foods at more accessible price points than full-service restaurants. The Shake Shack concept continues to offer our classic core menu items, introduced in 2004, which speaks to the timeless and universal appeal of our food offerings, and supplements this core menu with various other limited time and exclusive offerings.

|
Burgers & Chicken
|
|
Our burgers are made with a proprietary whole-muscle blend of 100% all-natural, hormone and antibiotic-free Angus beef, ground fresh daily, cooked to order and served on a non-GMO potato bun. We take great care in the preparation of our burgers—from sourcing, to handling, to cooking—to strive that the taste and quality of the burgers we serve is second to none. Our signature burger is the ShackBurger
®
, which is a four-ounce cheeseburger topped with lettuce, tomato and ShackSauce™. Our burger offerings also include the SmokeShack
®
, 'Shroom Burger™ (our vegetarian burger), Shack Stack
®
and Hamburger. Our Chick’n Shack™ is a 100% all-natural, hormone and antibiotic-free cage-free chicken breast, slow cooked in buttermilk herbs, hand-battered, hand-breaded and crisp-fried to order.
|
|
6
|
Shake Shack Inc.
Form 10-K
Form 10-K

|
Crinkle Cut Fries
|
|
Our classic and passionately loved crinkle cut fries are made from premium Yukon potatoes and are prepared 100% free of artificial trans-fat. Guests can also enjoy our Cheese Fries, which are our crinkle cut fries topped with a proprietary blend of cheddar and American cheese sauce. We believe the tactile pleasure and emotional attachment that our guests have to the crispiness and ridges of our crinkle cut fries is a nostalgic ode to the roadside burger stand of yesteryear.
|
|

|
Hot Dogs
|
|
Shake Shack was born from a hot dog cart in 2001 and we believe that our hot dog category gives our guests another premium category from which to choose. Both our beef hot dogs and our chicken dogs are made from 100% all-natural, hormone and antibiotic-free beef and chicken. Our signature Shack-cago Dog
®
is our nod to the classic Chicago-style hot dog, topped with Shack relish, onion, cucumber, pickle, tomato, sport pepper, celery salt and mustard.
|
|

|
Frozen Custard
|
|
Our premium, dense, rich and creamy ice cream, hand-spun daily on-site, is crafted from our proprietary vanilla and chocolate recipes using only real sugar (no corn syrup) and milk from dairy farmers who pledge not to use artificial growth hormones. Shakes remain our guests' favorite in this category and are scooped and spun to order. Our concretes are made by blending frozen custard at high speed with premium mix-ins. Since each Shake Shack intends to engage its community, each Shack has signature concretes, distinct to its location, that use locally-sourced mix-ins made by artisanal producers whenever possible.
|
|

|
Beer, Wine and Beverages
|
|
Our proprietary ShackMeister
®
Ale, brewed by Brooklyn Brewery, was specifically crafted to complement the flavor profile of a ShackBurger. At select locations, we also offer local craft beers tailored to each Shack's geography. When it comes to wine, our organic and biodynamic Shack Red
®
and Shack White
®
is sourced and produced exclusively by Gotham Project, which accentuates our fine dining ethos and provides our guests with premium beverage options not commonly found in our industry. In addition, we serve Abita Root Beer, Shack-made Lemonade, organic fresh brewed iced tea, Fifty/Fifty™ (half lemonade, half organic iced tea), Stumptown cold brew coffee, Honest Kids organic apple juice and Shack|
2
0
®
bottled water, from which 1% of the sales supports the clean-up of water sources around the world.
|
|

|
Dogs Are Welcome Too
|
|
We know that many dog owners treat their four-legged friends as family members. From our first Shack in Madison Square Park, we wanted to include dogs as part of the community gathering experience and developed the "Woof" section on our menu. ShackBurger dog biscuits, peanut butter sauce and vanilla custard make up our signature Pooch-ini
®
, which is available at Shacks with an outdoor space. We also serve dog biscuits to-go, handcrafted exclusively for us by a New York-based bakery.
|
|
Culinary Innovation
We continuously innovate around our core menu and our team is constantly experimenting with seasonal and local products, to enhance our menu, drive revenue and give our guests more reasons to keep coming back to Shake Shack.
The Innovation Kitchen
As a way to further foster innovation, we opened our first Innovation Kitchen in September 2018. Located on the lower level of the West Village Shack, and connected to our Home Office, the state-of-the-art Innovation Kitchen is the hub of all menu development at Shake Shack. This new dedicated space allows our culinary team to get even more creative, dig deeper into our fine dining roots, collaborate with other chefs and explore new opportunities as we continue to scale, with guest favorites potentially becoming permanent menu items. It also allows us to house our quality assurance and culinary teams together for the first time. The West Village Shack’s menu will have all the classic items, but still remain unique to all others, featuring a rotating list of items from the Innovation Kitchen.
Shack-Wide Limited Time Offerings ("LTO")
Shake Shack Inc.
Form 10-K
|
7
Form 10-K
|
7
We continued our LTO program through fiscal 2018 where we featured a new premium burger or chicken menu item for varying time periods throughout the year. We will continue to supplement our core menu
with targeted innovation inspired by the best versions of the classic American roadside burger stands.
|
▪
|
Griddled Chick'n
— In January 2018 we rolled out our Griddled Chick'n—our all-natural chicken breast topped with Niman Ranch smoked bacon, lettuce, tomato and buttermilk herb mayo. The Griddled Chick'n premiered exclusively on the Shack App before being offered nationwide.
|
|
▪
|
Smoked Cheddar BBQ Lineup
— In April 2018 we launched a limited-edition lineup of Sm
oked Cheddar BBQ items nationwide. The Smoked Cheddar BBQ Bacon Burger is a 100
% all-natural Angus beef cheeseburger with smoked cheddar cheese, Niman Ranch smoked bacon, pickles and Shack BBQ sauce; the Smoked Cheddar BBQ Bacon Griddled Chick'n is griddled all-natural chicken breast with smoked cheddar cheese, Niman Ranch smoked bacon, pickles and Shack BBQ sauce; and the Smoked Cheddar BBQ Bacon Cheese Fries are crinkle-cut fries topped with all-natural smoked Niman Ranch bacon, Shack BBQ Sauce and cheese sauce.
|
|
▪
|
Hot Chick'n
— In September 2018 we brought back a
spicy favorite, our Hot Chick'n. In fiscal 2017 we launched Hot Chick'n as a limited-time menu item, and by popular demand, brought it back and made it customizable
—with "hot" or "even hotter" optional.
Our Hot Chick'n
is crafted from an all-natural chicken breast—no hormones or antibiotics—slow-cooked in a creamy buttermilk marinade, hand-dipped into Shack-made batter, dredged through seasoned flour and crisp-fried. The sandwich is dusted with a guajillo and cayenne pepper blend and topped with Louisiana hot sauce slaw, kosher dill pickles and served on the same non-GMO potato bun as the classic ShackBurger.
|
|
▪
|
Trio of Featured Shakes
— Throughout 2018 we offered our guests a new slate of premium shake offerings for extended periods of time. For approximately three months each, we offered a trio of new featured shakes, which included: Chocolate Chip Red Velvet, Mint Cookies & Cream and Apple Pie à la Mode and White Mocha, Christmas Cookie; Marshmallow Chocolate Chip, Chocolate Brownie and Mocha Cookies & Cream; and Chocolate Peppermint. In 2019, we will be featuring a new shake each month, kicking January off with the Tiramisu shake and the Salted Vanilla Toffee shake in February.
|
Exclusive Offerings
In addition to supplementing our menu with LTOs, we also seek to create new and exciting offerings that are inspired by local favorites or special events. Some examples of our exclusive offerings from fiscal 2018 include:
|
▪
|
Veggie Shack
— In April 2018 we launched our first veggie burger at select Shacks, and by the end of the year it was available at 18 Shacks. The Veggie Shack
is made with black beans, brown rice and roasted beets topped with provolone cheese, lettuce, tomato, onions, pickles and vegan mustard mayo. It can also be made entirely vegan by removing the cheese and substituting a gluten free bun or lettuce wrap.
|
|
▪
|
BBQ Pulled Pork
— In July 2018 we offered our
BBQ Pulled Pork Burger on the app at select New York City and New Jersey Shacks. The BBQ Pulled Pork Burger is a cheeseburger topped with Niman Ranch BBQ pulled pork, jalapeño slaw and pickles.
|
|
▪
|
Chick'n Bites
— In September 2018, we launched Chick'n Bites exclusively at our West Village Shack. Chick'n Bites are crispy pieces of hand-breaded chicken breast, served with BBQ or honey mustard sauces, and available in a six-piece or 10-piece order size. In later September and October, Chick'n Bites were rolled out at select New York City Shacks and other markets across the country.
|
|
•
|
Montlake Double Cut
—
In October 2018, we introduced our Seattle-exclusive burger, the Montlake Double Cut, which features a W
ashington State all-natural beef double cheeseburger with Beecher’s ‘Just Jack’ cheese, caramelized onions and grainy mustard mayo on a Macrina Bakery bun.
It was important to us to introduce something truly local to this proud food town and continue to show our culinary heritage and differentiation.
This exclusive burger is available daily in limited quantities.
|
|
•
|
Golden Gate Double Shack
—
In December 2018, we introduced the Golden Gate Double Shack at our Palo Alto opening, which featured two grass-fed beef patties from Northern California’s Richards Grassfed Beef. In addition to the burger,
|
8
|
Shake Shack Inc.
Form 10-K
Form 10-K
we offered three local concretes, including: the MB Malt, with vanilla custard, Manresa Bread whole wheat chocolate chip walnut cookies and fudge; the Shack Attack, with chocolate custard, fudge sauce, chocolate truffle cookie dough, Dandelion dark chocolate chunks, and chocolate sprinkles; and the Pie Oh My, with vanilla custard and a slice of seasonal pie from Fremont bakery Pie Dreams.
Chef Collaborations
Our fine dining heritage has enabled Shake Shack to team up with some of the world's best chefs for short-term special menu items. We devote significant resources to menu innovation and are frequently invited to participate and compete in chef events such as the South Beach Wine and Food Festival's Burger Bash, which allows us to test out new creations that can often lead to the introduction of new items. Some of our more notable collaborations in fiscal 2018 include:
|
▪
|
Breakfast Taco and Chick'n de Sanchez
— In February 2018 we partnere
d with Rosio Sanchez, chef and founder of Copenhagen’s Sanchez and Hija de Sanchez, to bring New York City a two-part, one-day-only collaboration. At the Madison Square Park Shack, we served the brand-new, limited-edition Breakfast Taco and Chick’n de Sanchez. The Breakfast Taco featured roast pork belly, cured egg yolk, avocado and habanero salsa in a fresh-made corn tortilla, and the Chick’n de Sanchez featured a crispy chicken breast with spicy arbol oil, guajillo chili mayo, avocado, pickled onions, Boston lettuce and crema.
|
|
▪
|
Shack Cheesesteak
— In April 2018 we teamed up with our longtime partner, famed butcher Pat LaFrieda, to bring New York City a one-day-only, limited edition Shack Cheesesteak. The Shack Cheesesteak
featured Pat LaFrieda Meat Purveyors shaved steak, Shack Cheddar and American cheese sauce, caramelized onions and chopped cherry peppers on a hero roll. Additionally, $1 from every Shack Cheesesteak purchased benefited the Bob Woodruff Foundation, an organization that invests to find, fund and shape programs that works to empower impacted veterans, service members and their families.
|
|
▪
|
Lilia Burger
— To welcome our new Williamsburg Shack to Brooklyn in June 2018, we collaborated with chef Missy Robins, of the local Italian restaurant Lilia, to create the Lilia Burger—
a double hamburger brushed with garlic herb butter and topped with parmigiana fonduta
—offered specifically for opening day at the Shack. Additionally for the Williamsburg opening day, we premiered the Shack's exclusive concretes, created through collaborations with local vendors, including the "Just Du It", "Shack Attack" and "Pie Oh-My" concretes which features mix-ins from Du's Donuts, Mast Brother Chocolate and Four & Twenty Blackbirds, all of which are permanent menu items exclusive to the Williamsburg Shack.
|
|
▪
|
Ludo Shack and Salted Caramel Wakame Shake
— For one day only in October at the Madison Square Park Shack, we collaborated with chef Ludo Lefebvre to serve the Ludo Shack and Salted Caramel Wakame Shake.
The Ludo Shack is a double cheeseburger topped with bordelaise and special sauce, our interpretation of Ludo’s famous Big Mec burger. The Salted Caramel Wakame Shake is our classic salted caramel shake with a twist: Wakame edible seaweed!
|
We Are A Warm Community Gathering Place
Design Philosophy
The experience of Shake Shack continues to drive our strategy. Throughout fiscal 2018, and looking forward, we continued to enhance our design capability, simultaneously designing some of our most dynamic Shacks while gaining efficiency in the design process to prepare for the scalability of development ahead. The design of our Shacks is critical to the Shake Shack experience and we blend our core brand identifiers with features specifically designed for each Shack to be of its place and connect directly with its neighborhood. Whether domestic or international, we are passionate about securing vibrant sites and creating unique designs that give each Shack a hand-crafted look, are locally focused, and are appropriate for their respective communities. A typical domestic company-operated Shack is generally between 3,000 and 4,000 square feet with interior seating for between 75 and 100 guests. Additionally, whenever possible, our domestic company-operated Shacks feature either outdoor seating or easy access to a park or green space. We use high-quality tactile materials, warm lighting that focuses on every table and highlights the textured walls and seating layouts that encourage guests to relax and stay for a while. We take great care to build each Shack with thoughtful design with distinctive architectural features —all while taking key inspiration from our first home in Madison Square Park. The original Shake Shack in Madison Square Park was designed by SITE Architecture and Design, led by James Wines and Denise Lee, in collaboration with Pentagram, led by Paula Scher. This design set the tone for a dynamic dialogue inside the park and our
Shake Shack Inc.
Form 10-K
|
9
Form 10-K
|
9
surrounding neighborhood that continues to drive our designs today. The overall atmosphere of our new Shacks aim to evoke the very best from the original park kiosk, as well as the best of the fine dining experience in terms of the quality of design, materials used, lighting and music. We are mindful that each new Shack should embody the experience of the Madison Square Park Shake Shack—the line, the kiosk style, the experience of ordering food made just for you and the energetic open kitchen.
Each Shack is specifically designed to be of its place and connect with its neighborhood, but we have developed a number of iconic brand identifiers, including wrap-around steel beams, open kitchens, large distinctive menu boards and tables made from reclaimed bowling lanes from New York. We believe that these brand identifiers are key components to the expression of the brand and the experience of Shake Shack.
Often during the construction of new Shacks, particularly those in new markets, we re-imagine the often uninspiring plywood barriers that surround a construction site and use this as a canvas to begin the process of introducing Shake Shack to the community prior to our opening. We also collaborate with local artists and designers to bring beautiful artwork designs and installation to our Shacks from time to time. At our first Seattle Shack, we featured hoarding covered in classic Shake Shack menu icons outlined in moss.
In preparation for our first Hong Kong Shack that opened in 2018, we partnered with local illustrator and artist Zoie Lam to create hoarding that combined local culture with American graffiti art.
Today, we continue to evolve our timeless designs through the engagement of different designers from around the country. We continue to develop our prototypes, “classic” Shack designs, free-standing, in-line and unique formats. We are constantly pushing to be more creative and nimble, allowing us to ramp up our growth while making the Shack experience even more dynamic and accessible, as well as adapting to smaller footprints, proving our versatility and ability to enter and flourish in a variety of spaces. We currently use our second generation prototype model: a 3,200 square foot free-standing Shack that fits well in suburban locations, designed with more efficient use of materials while still offering the same full guest experience. Additionally, we further innovated our Shack design in the digital space by introducing a whole new guest flow with the opening of our first kiosk-only ordering and cashless environment at Astor Place last year and we have continued to design new Shacks incorporating the kiosk into their layout. We designed an optimized kitchen, with a self-service beverage station, bringing it out of the kitchen, as well as a split-kitchen format that aim to allow for greater output during peak times. We also continue to evolve and innovate around the growing digital order capabilities, experimenting with new pickup shelving and guest flow.
In April 2018, we moved our Home Office headquarters to the West Village of New York City. Our new Home Office features expanded space for our Home Office employees, our West Village Shack on the ground floor, a test kitchen facility on the lower level where our culinary team can continue to dream up new menu items, and a multi-purpose room to host special events and training. We engaged the team at Michael Hsu Office of Architecture in designing the new Home Office, who we have also worked with in bringing us designs at our Shacks, for example, in West Hollywood and South Lamar. The Home Office was created with the mission to reflect and foster our culture and brand history. It was designed to be inherently flexible and foster collaborative work, with open spaces for our Home Office team and Shack teams to come together. The West Village Shack reflects the neighborhood with detailed greenery and an art installation by a local artist. The Shack is crafted from recycled or sustainable materials - table tops are made from reclaimed bowling alley lanes and booths are created using certified Forest Stewardship Council lumber. Our new Home Office is an important investment in our team, our continued growth and our ability to continue to innovate.
Beloved Lifestyle Brand
Since 2004, we have become a globally recognized brand with outsized consumer awareness relative to our current footprint of
208
Shacks, opening our first international Shack after only seven domestic Shacks. Shake Shack has become a New York City institution, a vibrant and authentic community gathering place that delivers an unparalleled experience to our loyal guests and a broad, global demographic. Shake Shack grew up alongside the emergence of social media and we believe we have benefited from an ongoing love affair with passionate fans who want to engage with us and share their real-time experiences with friends. We aim to establish genuine connections with our guests and the communities in which they live. Shake Shack continues to be recognized by media and influencers alike, garnering attention around the world.
Our positioning and brand voice, derived from the spirit, integrity and light-hearted nature of Shake Shack, are reinforced by our contemporary, responsible designs and hospitable team members who Stand For Something Good; this identity anchors our marketing efforts. We believe that our guests recognize Shake Shack as a community gathering place and, thus, the heart of our marketing strategy is to cultivate that community and connect with our guests both in our Shacks and through digital channels.
10
|
Shake Shack Inc.
Form 10-K
Form 10-K
Digital and Social Media
Much like how we design our Shacks to be community gathering places, we execute a digital media strategy that creates an online, on-brand community gathering place. With our social media, we mirror t
he in-person hospitality that a guest experiences when they visit the Shack. We interact with fans on Facebook, Instagram and Twitter through comments, replies and the use of user-generated content; a quick search of "#shakeshack" on Instagram as of December 26, 2018 reveals about 927,000 organic posts from our fans! In addition to social media, we also send out menu item alerts, local event invites, new Shack opening information and other relevant Shake Shack news through our email marketing program. We're focused on strengthening our ties to the community by engaging with new and excited fans and building brand awareness through our digital marketing channels
.
The Shack App provides a different way to experience Shake Shack and promote our signature menu items as well as our creative promotions. Our app redesign this year worked to improve that experience even more with our enhancements that optimized the path to purchase. In addition to our social media presence, the Shack App is another digital tool that allows us to further expand our brand awareness by providing a new way to connect with our guests. Guests have the opportunity to take advantage of certain promotions and vouchers featured on the Shack App. We had our first digital partnership promotion this year with Bumble, where Bumble ran a campaign featured in their app to buy one, get one burger card that guests in the Shake Shack markets could match with a Bumble user. Also, for Election Day, guests had the opportunity to order through the app with the code "ivoted" to receive an order of free fries.
On our
shakeshack.com
website we have a mobile-friendly interactive digital tool featuring allergen and nutritional data, dedicated Shack App page and a Shack city guide section with local geo-mapping.
Community and Charitable Partners
Each Shack focuses on conveying a consistent national brand message while also tailoring marketing efforts to each region. We have menu items that feature local ingredients and beers that are specific to each Shack's community. We also aim marketing efforts at local events by participating in local celebrations and developing relationships within the community, which helps position Shake Shack as a premium brand that is connected to its neighborhood through. Outside of local events, each Shack has a local charity partner to which it donates 5% of the sales from its Pie Oh My concrete. The D.C. Shacks, for instance, featured the "Livin' the Pie Life" and donates 5% of this Pie Oh My concrete's sales to Casey's Trees.
We also serve our communities by hosting 25% Donation Days—we designate a Monday or Tuesday for our partners to promote and bring out their friends and family to have 25% of participant’s order values donated back to the charity of choice.
Since 2012, Shake Shack annually has held The Great American Shake Sale
™
during the month of May to raise money and awareness for childhood hunger. During The Great American Shake Sale, we encourage guests to donate $2 in exchange for a free shake (a $5 value) at their next visit. 100% of these donations go directly to Share Our Strength's No Kid Hungry campaign. In May 2018, we raised $343,000 across our domestic company-operated Shacks for this initiative.
In 2018, between the 25% donation days, product donations, special charitable promotions, concrete contributions and the Great American Shake Sale, we raised over $750,000 for charities!
In addition to each Shack's local charity partner, Shacks will also participate or host other local charitable events. Some examples include:
|
▪
|
LOVE SHACK SHAKE with the B52s
– For Valentine's Day, we teamed up with the famed music group The B-52s, to create the Love Shack Shake–a strawberry blonde milkshake topped with whipped cream and glitter sprinkles–offered for a limited time in February. Additionally, for every Love Shack sold, Shake Shack donated $2 to Canine Companions for Independence, a non-profit that enhances the lives of people with disabilities by providing highly trained assistance dogs and a lifetime of support entirely free of charge.
|
|
▪
|
Team Mr8 Shack
—
In April 2018 the Newbury Street Shack kicked off marathon Monday in Boston with its exclusive Team Mr8 Shake – vanilla custard blended with fudge and peanut butter sauces, topped with whipped cream and chocolate sprinkles. All proceeds from the shake went to Team Mr8, the Martin Richard Foundation, which provides opportunities for young people to learn, grow and lead through volunteerism and community engagement.
|
|
▪
|
PRIDE
—
Throughout the month of June, we participated in Pride activations throughout the country, including the Pride parades in New York City, Washington D.C., Chicago, Los Angeles, San Diego and Lexington. Our teams were decked
|
Shake Shack Inc.
Form 10-K
|
11
Form 10-K
|
11
out in Pride swag and distributed to parade-goers, hosted silent dance parties and vended at events. On our website, we sold a limited-edition Pride capsule collection, including a Shake Shack X PINTRILL pin, tee, tote and beach towel, of which 100% of the proceeds benefited The Trevor Project. We also sold a Pride Shake–a strawberry shake blended with Shack-made lemonade, topped with whipped cream and rainbow sprinkles–from which $1 of every shake sold also benefited the charity.
Pop-ups, Promotions and Events
Throughout fiscal 2018 we continued to do innovative branding by collaborating with other chefs and creating various pop-up concepts, as well as offering exciting promotions and participating in special events to drive brand awareness. These pop-ups are a key part of building the growing strength of the Shake Shack brand while capturing these unique moments that differentiate our brand. Some notable collaborative pop-ups, promotions and events include:
|
▪
|
Coachella and Stagecoach Music and Arts Festival
– In April 2018 we were excited to serve up our classic menu items at the Coachella Music and Arts Festival and Stagecoach Festival for three three-day weekends in California, where we set-up our first-ever festival kiosk model.
|
|
▪
|
Allbirds Collaboration
– For one day only in May at the Madison Square Park Shack, we set up shop with Allbirds and offered one-of-a-kind Shake Shack Tree Runners, a custom limited-edition lace kit and a Hokey Pokey shake – inspired by Allbirds’ New Zealand roots, which featured honeycomb candy and chocolate, topped with whipped cream and toffee.
|
|
▪
|
Shake Shack X Canlis Backlot Pop-Up
– To celebrate Seattle's first taste of Shake Shack, in June 2018, we partnered with Canlis, a Westlake fine dining institution, to serve-up Shake Shack classics plus Canlis Dungeness Crab melts, and créme brülée Whoopie pies, as well as featuring live music, all taking place in the backlot of Canlis.
|
|
▪
|
Shake Shack X Bob's Burgers Pop-Up
– In preparation for the kick-off of Comic-Con, and in celebration of the 150th episode of
Fox's
sitcom
Bobs Burgers
, we decorated our Mission Valley Shack in San Diego with
Bob's Burgers
artwork, including a replica of the show's iconic dining counter. We offered a "Burger of the Day" just as Bob would, called "Can I have your Slaw-tograph Burger"– a cheeseburger topped with barbecue pulled pork, jalapeño, pickles and scallion slaw.
|
|
▪
|
Shake Shack X Ralph's Italian Ices Pop-Up
– In anticipation of Shake Shack's opening at the Staten Island Mall, we popped up at the original Ralph's Famous Italian Ices & Ice Cream. We served-up a limited menu featuring ShackBurgers and crinkle-cut fries alongside Ralph's full menu, along with a one-day only collaboration, the Strawberry SHACKcake Italian Ice.
|
Media, Product Placement and Influencers
Shake Shack’s unique positioning has allowed us to garner robust media coverage across food, lifestyle, business and trade publications. We are often featured in outlets such as Bon Appetit, Food & Wine, Eater, Grub Street, Refinery29, BuzzFeed, People, New York Times, Wall Street Journal, Business Insider, CNBC, Fast Company, Forbes, Digiday and more. Shake Shack is continually mentioned on morning shows like
TODAY Show, Good Morning America, CBS Sunday Morning
and
LIVE with Kelly and Ryan
, as well as late shows like
Saturday Night Live, The Late Show with James Corden, Jimmy Kimmel Live!, The Daily Show, Late Night with Seth Meyers
and
Late Night with Jimmy Fallon
. We have also been mentioned in prime time television programs like CBS’s sitcom
The Big Bang Theory
and ABC's
Jeopardy
.
Shake Shack has been fortunate to receive considerable product placement in movies, TV shows and other media without any cost to the Company, and in some cases, has been able to charge fees for these location shoots, which have included scenes from the motion pictures
Something Borrowed
and
Tower Heist
, as well as the acclaimed HBO series
The Newsroom, Showtime's Billions
and
Shameless
and the Amazon original series
Bosch
(which featured our West Hollywood Shack).
Shake Shack’s popularity and cultural relevance has awarded us countless celebrity and influencer fans across Hollywood, music, fashion, sports and more. We have seen organic promotion from the likes of Matt Damon, Oprah, Keith Urban and Taylor Swift, to name a few.
We Are Accountable For Results
12
|
Shake Shack Inc.
Form 10-K
Form 10-K
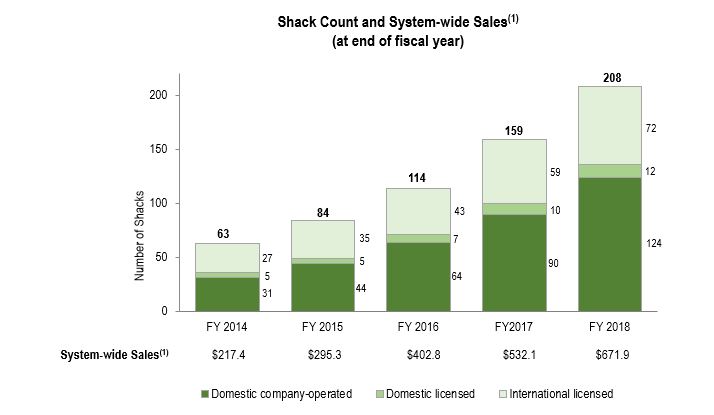
Our brand power and thoughtful approach to growth have resulted in strong performance across a variety of geographies and formats. We grew from
63
Shacks in fiscal 2014 to
208
Shacks in fiscal 2018 spanning 26 states (and the District of Columbia) and 13 countries, representing a
35%
compound annual growth rate ("CAGR"). As a result of our expansion and strong performance:
|
▪
|
Our total revenue grew from
$118.5 million
in fiscal 2014 to
$459.3 million
in fiscal
2018
, a
40%
CAGR. Compared to fiscal
2017
, total revenue increased
28.0%
in fiscal
2018
.
|
|
▪
|
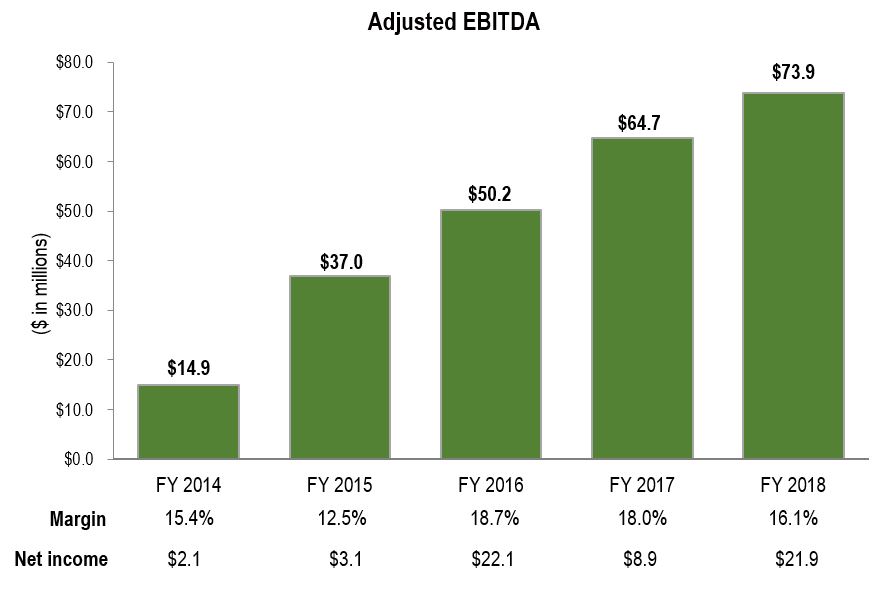
Net income attributable to Shake Shack Inc. for fiscal
2018
was
$15.2 million
, compared to a loss of
$0.3 million
for fiscal
2017
.
|
|
▪
|
Adjusted EBITDA, a non-GAAP measure, increased
14%
to
$73.9 million
for fiscal
2018
from
$64.7 million
for fiscal
2017
. For a reconciliation of Adjusted EBITDA to net income, see "Non-GAAP Financial Measures—EBITDA and Adjusted EBITDA" in Part II, Item 7.
|
|
▪
|
Adjusted pro forma net
income
, a non-GAAP measure,
increase
d
28.0%
to
$26.9 million
, or
$0.71
per fully exchanged and diluted share in fiscal
2018
, compared to
$21.0 million
, or
$0.57
per fully exchanged and diluted share in fiscal
2017
.
For a reconciliation of adjusted pro forma, a non-GAAP measure, to net
income (loss)
attributable to Shake Shack Inc., see "Non-GAAP Financial Measures—Adjusted Pro Forma Net Income and Adjusted Pro Forma Earnings Per Fully Exchanged and Diluted Share" in Part II, Item 7.
|
|
(1)
|
System-wide sales consists of sales from our domestic company-operated Shacks, our domestic licensed Shacks and our international licensed Shacks. We do not recognize the sales from our licensed Shacks as revenue. Of these amounts, our revenue is limited to Shack sales from domestic company-operated Shacks and licensing revenue based on a percentage of sales from domestic and international licensed Shacks. Our total revenue also includes certain up-front fees such as territory fees and opening fees we receive in connection with our licensing arrangements.
|
COMPETITION
The restaurant industry is highly competitive and fragmented, with restaurants competing on multiple areas, such as taste, price, food quality, service, location and the ambiance and condition of the restaurant. Our primary competitors include other fast casual restaurants, quick service restaurants and casual dining restaurants. Our competition includes multi-unit national and regional chains, as well as a wide variety of locally-owned restaurants. Our competitors may operate company-owned restaurants, franchised restaurants or some combination. Many of our competitors offer breakfast, lunch and dinner, as well as dine-in, carry-out and delivery services. We may also compete with companies outside of the traditional restaurant industry, such as grocery store chains, meal subscription services and delicatessens, especially those that target customers who seek high-quality food, as well as convenience food stores, cafeterias and other dining outlets. Our competition continues to intensify as new competitors enter both the burger
Shake Shack Inc.
Form 10-K
|
13
Form 10-K
|
13
and fast casual segments, as well as new digital experience and convenience food options. We also face increasing competitive pressures from some of our competitors who have recently announced initiatives to offer better quality ingredients, such as antibiotic-free meat. For more information regarding the risks we face from our competitors, who may have, among other things, a more diverse menu, greater financial resources, lower operating costs, a more well-established brand, better locations and more effective marketing than we do, see "Risks Related to Operating in the Restaurant Industry—We face significant competition for guests, and if we are unable to compete effectively, our business could be adversely affected" in
Item 1A, Risk Factors
.
We specifically target guests that seek an engaging and differentiated guest experience that includes great food, unique and thoughtful integration with local communities and high standards of excellence and hospitality.
We believe that we are well positioned to continue to grow our market position, as we believe consumers will continue to trade up to higher quality offerings given the increasing consumer focus on responsible sourcing, ingredients and preparation. Additionally, we believe that consumers will continue to move away from the added time commitment and cost of traditional casual dining. We believe that many consumers want to associate with brands whose ethos matches their own, and that Shake Shack, with our mission to Stand For Something Good and our culture of Enlightened Hospitality, is a distinct and differentiated global lifestyle brand.
GROWTH STRATEGIES
We believe that we are well-positioned to achieve significant, sustainable financial growth. Our goal — to be a growing and loyal brand, connected to our community, relentlessly focused on excellence, experience and hospitality. We plan to continue to expand our business, drive Shack sales and enhance our competitive positioning by executing on the following strategies:
Opening New Domestic Company-Operated Shacks
This is where our greatest opportunity for growth lies. Shake Shack’s business model remains strong and we intend to open many more Shacks. We waited nearly five years to open our second Shack, and we are still in the very early stage of our story, with only
124
domestic company-operated and
12
domestic licensed Shacks in 26 states and Washington, D.C. as of
December 26, 2018
. We believe there is tremendous whitespace opportunity to expand in both existing and new U.S. markets, and we will continue to invest in the infrastructure that will enable us to continue to grow rapidly and with discipline. In fiscal
2018
, we significantly expanded our domestic company-operated footprint by opening
34
new Shacks, representing a
37.8%
increase in our domestic company-operated Shack count. We believe that over the long-term, we have the potential to grow our current domestic company-operated Shack footprint to at least 450 Shacks by opening domestic company-operated Shacks in new and existing markets, of which we have only opened 28% of that footprint thus far. The rate of future Shack growth in any particular period is inherently uncertain and is subject to numerous factors that are outside of our control. As a result, we do not currently have an anticipated timeframe for such expansion. We believe we have a versatile real estate model built for growth. We have adopted a disciplined expansion strategy designed to leverage the strength of our business model and our significant brand awareness to successfully develop new Shacks in an array of markets that are primed for growth, including new and existing, as well as small and large markets. We continue to be encouraged by the success of our multi-format strategy which includes Shacks in various formats including but not limited to urban centers, free-standing pads, mall locations, food courts, lifestyle centers, train stations, airports, stadiums, outlets and more.
We will continue to expand in existing markets in 2019, in order to leverage operational effectiveness as we cluster in these high-density markets, but we will also enter new markets, including Salt Lake City and New Orleans. In 2018 we entered into five new states, including: Alabama, North Carolina, Ohio, Tennessee and Washington. With
208
Shacks around the world (as of
December 26, 2018
), we have identified many attractive and differentiated markets for the Shake Shack experience. In major metropolitan areas, we seek locations where communities gather, often with characteristics such as high foot traffic, substantial commercial density, reputable co-tenants and other traffic drivers such as proximity to parks, museums, schools, hospitals and tourist attractions. For every potential domestic company-operated Shack we consider, we apply rigorous financial metrics to ensure we maintain our targeted profitability.
Capitalizing on Our Outsized Brand Awareness
One of the great advantages for Shake Shack has been our birthplace and headquarters in New York City. Rarely has a brand of our type been born in New York, and from a fine dining company. This gives us tremendous media and brand power which often
14
|
Shake Shack Inc.
Form 10-K
Form 10-K
outweighs our relative size. This year marked a huge accomplishment for us as we received an "A" grading from
the Natural Resources Defense Council's (NRDC)
Chain Reaction Report
for sourcing beef raised without any antibiotics, being one of only two burger chains to have done so. Also related to how we strive to Stand For Something Good, last year w
e had the honor of being recognized at
Compassion in World Farming’s
2017 Good Farm Animal Welfare Awards (GFAWA), which celebrates companies that use or have committed to use cage-free eggs or egg products. We focus our efforts on building a genuine connection with our guests and integrating into their communities through investment in innovative marketing and programming. Shake Shack was named in Nation's Restaurant's News as one of the
2018 Top 10 Fastest Growing Chains
and on Foodable's "brand of the year" list as part of their
2018 Top Emerging Brands
. Our marketing efforts focus on interacting with our guests in an authentic, innovative manner which creates memorable, meaningful experiences. The experience that we provide for our guests and local communities has generated a growing loyal following that promotes our brand through word-of-mouth. We believe that this outsized brand awareness will continue to fuel our growth in existing and new markets.
Growing Same-Shack Sales
Given the significant awareness of our brand and the excitement we have been able to generate for our market launches, our Shacks in newer markets have generally opened with higher volumes and operating profits relative to their second year, following the strong initial honeymoon period. We expect our Shacks to deliver low single digit same-Shack sales growth over the long term, while the number of new Shack openings relative to our comparable Shack base remains our primary driver of growth in the near term. We believe, based on our business strategy and various factors in and out of our control, that we will have quarters where our same Shack sales may be negative. We do, however, continually focus on improving our same-Shack sales performance by providing an engaging and differentiated guest experience that includes new seasonal and Shack-specific offerings, technological upgrades including the Shack App, web ordering and delivery, unique and thoughtful integration with local communities and high standards of excellence and hospitality. We will continue to innovate around our core menu to keep our offerings fresh, while remaining focused on our signature items.
Thoughtfully Increasing Our Licensed Shacks
We will continue to grow our licensed portfolio by expanding further domestically, in the countries in which we currently have internationally licensed operations, as well as entering new international markets. This strategy historically has been a low-cost, high-return method of growing our brand awareness and providing an increasing source of cash flow. As of
December 26, 2018
we had 84 licensed Shacks, of which 72 were international and 12 were domestic.
Shake Shack Inc.
Form 10-K
|
15
Form 10-K
|
15
International Licensed Operations
Throughout fiscal 2018 we continued to expand upon our international footprint by making new partnerships, as well as building upon existing ones, and opened 13 international licensed Shacks. A meaningful part of our international business strategy is focused in Asia, with continued growth in Japan and South Korea, as well as our entrance into Hong Kong this year, the first at the Central IFC Mall and the second at Pacific Place. Additionally, we entered into new licensing agreements to bring Shake Shack to the Philippines and Singapore, with the plan of opening 15 Shacks in the Philippines through 2026 and 10 Shacks in Singapore through 2023, both of which are planned to commence in 2019. We signed our first licensing agreement to enter into Japan in 2014, with a plan to open 10 Shacks over the following five years, which we were able to execute in just three years. With this great success and demand, this year we extended the agreement in Japan to open an additional 15 Shacks through 2024. As of December 26, 2018 we had a total of 19 licensed Shacks in Asia, which will increase throughout the region as we continue to execute upon our licensing agreements. Additionally, to further lead our Asian business, we announced that we will be investing in our first international regional office in Hong Kong in 2019 to support the brand and day-to-day operations. Outside of Asia, we entered into a new partnership to bring Shake Shack to Mexico, with the plan to open 30 Shacks through 2028, and the first to open in 2019. These new partnerships are great opportunities for our team to grow, learn and bring back new insights to the broader company.
Domestic Licensed Operations
Domestically, we have continued to grow our licensed business, especially in our presence at airport locations around the country, which have be an exciting layer of growth to our licensed strategy. This year we opened two domestic licensed locations, both of which were at airports, including at the Atlanta Hartsfield Airport and LaGuardia Airport. Given our position in New York and the success of our current licensed Shacks at home and abroad, we continue to attract substantial interest from potential international licensees around the world and we believe we have significant opportunities to expand our licensing footprint in existing and new international markets as our team, development opportunities and supply chain matures.
16
|
Shake Shack Inc.
Form 10-K
Form 10-K
OPERATIONS
Sourcing and Supply Chain
Shake Shack has always been committed to working with best-in-class suppliers, across our supply chain. Our Stand For Something Good vision guides us in how we source and develop our ingredients, always looking for the best ways to provide top quality food at an excellent value and accessible to all.
We pride ourselves on sourcing premium ingredients from like-minded ranchers, farmers and food purveyors—using real premium ingredients like 100% all-natural proteins with no hormones or antibiotics, humanely raised and source verified. We received an "A" grading from the NRDC this year in their
Chain Reaction Report
for sourcing beef raised without any antibiotics, being one of only two burger chains to have done so without the routine use of antibiotics. Additionally, our animal welfare policy can be found on our Shake Shack website and we have remained committed to using cage-free eggs in all of our food and have done so for the past two years. This year we elevated our mission to Stand For Something Good even further by our commitment to eliminate the use of plastic straws and high fructose corn syrup in our foods by 2019, as well as building our relationships with local suppliers and ranchers throughout the country.
We have a regional strategy for ground beef production to ensure that we are always serving freshly ground and never frozen beef at our domestic Shacks. Initially, and around the time or our IPO, our beef production was focused in New York City. However, as we've grown around the country, we now have eight butchers spread throughout the country who produce our burgers on a daily basis, and we will continue to partner with regional suppliers in new markets as we grow.
We have a limited number of suppliers for our major ingredients, including beef patties, chicken, potato buns, custard, Portobello mushrooms and cheese sauce. In fiscal
2018
, we purchased all of our (i) ground beef patties from eight suppliers, with approximately 56% of our ground beef patties from one supplier; (ii) chicken breast from one supplier; (iii) potato buns directly from one supplier; (iv) custard base from three suppliers; (v) 'Shroom Burgers from one supplier; (vi) crinkle cut fries from two suppliers; and (vii) ShackSauce from two suppliers, with approximately 88% of ShackSauce supplied by one supplier.
We have developed a reliable supply chain and continue to focus on identifying alternative sources to avoid any possible interruptions of service and product.
Distribution
We contract with one distributor, which we refer to as our "broadline" distributor, to provide virtually all of our food distribution services in the United States. As of
December 26, 2018
, approximately 84% of our core food and beverage ingredients and 100% of our paper goods and chemicals, collectively representing approximately 49% of our purchases, were processed through our broadline distributor for distribution and delivery to each Shack. As of
December 26, 2018
, we were utilizing 19 affiliated distribution centers to supply our domestic company-operated Shacks.
We recognize that the safety and consistency of our products begins with our suppliers. Suppliers must meet certain criteria and strict quality control standards in the production and delivery of our food and other products. We regularly evaluate our broadline distributor to ensure that the products we purchase conform to our standards and that the prices they offer are competitive.
Food Safety and Quality Assurance
Food safety is a top priority and w
e are committed to serving safe, high quality food. We have rigorous quality assurance and food safety protocols in place throughout our supply chain and in our Shacks. We have a comprehensive supplier and ingredient selection process and maintain a limited list of approved suppliers. We thoroughly review the results of suppliers' internal and external quality audits, insurance coverage and track record on an ongoing basis. We have a food safety site inspection process and periodically perform supplier site visits, as well as mock food recalls. We have developed and implemented training and operating standards related to the food preparation, cleanliness and safety in the Shacks. We have a dedicated Quality Assurance team to ensure food safety across all domestic company-operated Shacks as well as employing an external third-party to conduct additional audits of these Shacks on a quarterly basis.
Site Selection
Shake Shack is ultimately about the guest experience and our site selection focuses on choosing great sites where people want to be together. Our site selection process is actively led by our Real Estate Committee, which meets regularly and follows a detailed
Shake Shack Inc.
Form 10-K
|
17
Form 10-K
|
17
approval process to ensure quality, fiduciary responsibility and overall adherence to our strategic growth goals. We invest in analytical tools for extensive demographic analysis and data collection for both existing and new potential sites. In addition to our in-house team of experienced real estate professionals, we use a national real estate broker to manage a network of regional brokers in order to leverage external resources in pursuit of pipeline development and consistent deal flow.
Construction
A typical Shack takes between 14 and 20 weeks to build. In fiscal
2018
, the total investment cost of a new Shack, which includes costs related to items such as furniture, fixtures and equipment, ranged from approximately $1.4 million to $4.0 million, with an average investment cost of approximately $2.2 million. We use a number of general contractors on a regional basis and employ a mixed approach of bidding and strategic negotiation in order to ensure the best value and highest quality construction.
Management Information Systems
Our domestic company-operated Shacks use computerized point-of-sale and back-office systems that are designed specifically for the restaurant industry and we use many customized features to increase operational effectiveness, internal communication and data analysis. This system provides a touch screen interface, graphical order confirmation display, touch screen kitchen display and integrated, high-speed credit card and gift card processing. The point-of-sale system is used to collect daily transaction data, which generates information about daily sales, product mix and average transaction size.
Enterprise-wide System Upgrade Initiative – Project Concrete
In an effort to ensure our infrastructure and support systems are sufficiently robust and scalable to deliver upon our current and future growth opportunities, we have been making key investments in our core financial and operational systems this year through our enterprise-wide system upgrade initiative called "Project Concrete". Project Concrete is an enterprise resource planning (ERP) project to implement new systems and processes supporting our finance, procure-to-pay, inventory and human capital management (HCM) areas. Throughout Project Concrete, we will be focusing on: (i) streamlining and automating business processes within the aforementioned areas to establish a scalable foundation for robust growth; (ii) standardizing and centralizing business processes; and (iii) implementing new software applications to enable the centralized business process in a controlled and efficient way.
Our back-office computer systems are designed to assist in the management of our domestic company-operated Shacks and provide real-time labor and food cost management tools. These tools provide the Home Office and operations management quick access
to detailed business data and reduces the amount of time spent by our Shack-level managers on administrative needs.
Project Concrete will also replace our current back of the house systems and reduce the
administrative tasks in the Shacks as we continue to invest in our tools across the company.
Digital Tools
Last year we rolled out nationwide our first-ever mobile ordering Shack App for iOS and Android, where guests are able to order S
hack menu items directly from their phone. Information from the Shack App indirectly interfaces with our point-of-sale system. In 2018, we made design enhancements to our app knowing that consumers demand faster, easier and more personalized experiences, and as such, we used guest data to develop a number of these enhancements to optimize the path to purchase. These app enhancements were primarily around personalized messaging, faster and easier checkout steps, order history and activation readiness f
or future features.
Additionally this year, we introduced a new way our guests can get their Shack right from their computer! We piloted our web ordering platform, starting at 10 Shacks across the country, and subsequently rolling it out nationwide by the end of the year. This new ordering channel is similar in feel to our kiosks and mobile application, and guests follow the same pick up process as the app. With higher category limits (versus the Shack app) and the ability to check out as a guest, web ordering offers a way to attract the more transient guest.
We have grown our kiosk base at the Shacks throughout this year, from launching our first kiosk-only order, cashless environment at Astor Place last year to having kiosks at 16 Shacks by the end of 2018. The Shack kiosk was developed to allow Shake Shack to serve more guests at peak times – whether in-Shack, for pickup via the Shack App, or even delivery.
The Shack kiosk replicates the experience of the Shack App with a sharp aesthetic, an intuitive touch screen interface and ease of ordering. Guests simply
18
|
Shake Shack Inc.
Form 10-K
Form 10-K
select their food, place an order and choose to receive an alert via text when their order is ready. We incorporate the kiosk in a variety of ways at the Shack, some are kiosk-only, like at Astor Place, and others use a mixture between kiosks and cashier, whichever way, we always strive to deliver the most hospitable experience to our guests as possible.
INTELLECTUAL PROPERTY
Since our inception, we have undertaken to strategically and proactively develop our intellectual property portfolio by registering our trademarks and service marks worldwide. As of
December 26, 2018
, we had 22 registered marks domestically, including registrations in our core marks ("Shake Shack," "Shack Burger," "
" and "
") and certain other marks, such as Stand for Something Good. Internationally, we have registered our core marks in over 82 countries spanning six continents. These marks are registered in multiple international trademark classes, including for restaurant services, food services, non-alcoholic beverages and apparel. We also own the domain www.shakeshack.com as well as over 400 other domain names for use in other markets.
In addition, we have agreements with the suppliers of our proprietary products stating that the recipes and production processes associated with those products are our property, confidential to us, and may not be provided to any other customer. Our proprietary products include the burger recipe for our whole muscle blend and the patty grinding procedure and the product formulations for our ShackSauce, 'Shroom Burger, chicken breast, chicken breader and buttermilk herb mayo, cheese sauce, unflavored custard base, chocolate custard base, and certain toppings and custard mix-ins. We also have exclusive arrangements with our suppliers of ShackMeister Ale, Shack Red wine, Shack White wine, all-natural hot dog and all-natural chicken sausage, relish and cherry peppers.
GOVERNMENT REGULATION AND ENVIRONMENTAL MATTERS
We are subject to extensive federal, state, local and foreign laws and regulations, as well as other statutory and regulatory requirements, including those related to, among others, nutritional content labeling and disclosure requirements, food safety regulations, local licensure, building and zoning regulations, employment regulations and laws and regulations related to our licensed operations. New laws and regulations or new interpretations of existing laws and regulations may also impact our business. The costs of compliance with these laws and regulations are high and are likely to increase in the future and any failure on our part to comply with these laws may subject us to significant liabilities and other penalties. See "Regulatory and Legal Risks" in
Item 1A, Risk Factors
for more information.
We are not aware of any federal, state or local provisions that have been enacted or adopted regulating the discharge of materials into the environment, or otherwise relating to the protection of the environment, that have materially affected, or are reasonably expected to materially affect, our results of operations, competitive position, or capital expenditures.
SEASONALITY
Our business is subject to slight regional seasonal fluctuations, during the respective region's summer months, affecting certain quarters of the fiscal year. Additionally, given our use of a fiscal calendar, there may be some fluctuations between quarters due to holiday shifts in the calendar year.
EMPLOYEES
As of
December 26, 2018
, we had 6,101 employees, of whom 5,214 were hourly team members, 703 were Shack-level managers and 184 were Home Office personnel.
Shake Shack Inc.
Form 10-K
|
19
Form 10-K
|
19
EXECUTIVE OFFICERS OF THE REGISTRANT
The name, age and position held by each of our executive officers as of
December 26, 2018
is set forth below.
|
Name
|
Age
|
Position
|
||
|
Randy Garutti
|
43
|
Chief Executive Officer and Director
|
||
|
Tara Comonte
|
44
|
Chief Financial Officer
|
||
|
Zachary Koff
|
39
|
Chief Operating Officer
|
||
Randy Garutti
has served as Shake Shack's Chief Executive Officer and on the Board of Directors since April 2012. Prior to becoming Chief Executive Officer, Mr. Garutti served as Chief Operating Officer of SSE Holdings since January 2010. Mr. Garutti has worked with USHG and Mr. Meyer for over 19 years. Prior to leading Shake Shack, Mr. Garutti was the Director of Operations, overseeing the operations for all USHG restaurants. In addition, Mr. Garutti served as General Manager of Union Square Cafe and Tabla, both of which won numerous accolades in the hospitality industry. Mr. Garutti graduated from Cornell University's School of Hotel Administration in 1997. Mr. Garutti was selected to our board of directors because of his leadership role in our development and growth and because he possesses particular knowledge and experience in strategic planning and leadership in the hospitality business.
Tara Comonte
has served as Shake Shack's Chief Financial Officer since June 2017. Prior to joining Shake Shack, Ms. Comonte served as Chief Financial & Business Affairs Officer and Executive Vice President at Getty Images, having joined in April 2013 as Chief Financial Officer and Senior Vice President. Earlier in her career, Ms. Comonte served as Chief Financial Officer at McCann Worldgroup,
part of Interpublic Group (IPG). Previously, she was a key founding member of Mediabrands, IPG's media group, serving there as Global Chief Financial Officer and Chief Operating Officer.
Zachary Koff
has served as Shake Shack’s Chief Operating Officer since January 2017. Prior to becoming Chief Operating Officer, Mr. Koff served as the Senior Vice President of Operations since March 2015, Vice President of Operations since April of 2012 and Director of Operations since February 2010, as well as opened Shake Shack’s 4th location in Miami Beach. Prior to leading operations for Shake Shack, Mr. Koff worked for the Bravo/Brio Restaurant Group for eight years, and opened and operated locations in five markets. Mr. Koff graduated from Cornell University’s School of Hotel Administration in 2002 with a Bachelor’s Degree in Hospitality Administration and a concentration in Law.
20
|
Shake Shack Inc.
Form 10-K
Form 10-K
AVAILABLE INFORMATION
Our website is located at www.shakeshack.com, and our investor relations website is located at http://investor.shakeshack.com. We are subject to the informational requirements of the Securities Exchange Act of 1934 (the "Exchange Act") and file or furnish reports, proxy statements and other information with the U.S. Securities and Exchange Commission ("SEC"). Our Annual Reports on Form 10-K, Quarterly Reports on Form 10-Q, Current Reports on Form 8-K, proxy statements, statements of changes in beneficial ownership and amendments to those reports are available for free on our investor relations website as soon as reasonably practicable after we electronically file them with, or furnish them to, the SEC. The SEC maintains a website (www.sec.gov) that contains reports, proxy and information statements and other information regarding issuers that file electronically with the SEC.
We webcast our earnings calls and certain events we participate in or host with members of the investment community on our investor relations website. Additionally, we provide notifications of news or announcements regarding our financial performance, including SEC filings, investor events, press and earnings releases as part of our investor relations website. Investors and others can receive notifications of new information posted on our investor relations website in real time by subscribing to email alerts. We also make certain corporate governance documents available on our investor relations website, including our corporate governance guidelines, board committee charters, codes of conduct and ethics, as well as certain company policies.
The contents of our website is not incorporated by reference into this Annual Report on Form 10-K or in any other report or document we file with the SEC, and any references to our websites are intended to be inactive textual references only.
Shake Shack Inc.
Form 10-K
|
21
Form 10-K
|
21
Item 1A. Risk Factors.
Described below are certain risks that we believe apply to our business and the industry in which we operate. You should carefully consider each of the following risk factors in conjunction with other information provided in this Annual Report on Form 10-K and in our other public disclosures. The risks described below highlight potential events, trends or other circumstances that could adversely affect our business, financial condition, results of operations, cash flows, liquidity or access to sources of financing, and consequently, the market value of our Class A common stock. These risks could cause our future results to differ materially from historical results and from guidance we may provide regarding our expectations of future financial performance. The risks described below are those that we have identified as material and is not an exhaustive list of all the risks we face. There may be others that we have not identified or that we have deemed to be immaterial. All forward-looking statements made by us or on our behalf are qualified by the risks described below.
RISKS RELATED TO OUR GROWTH STRATEGIES AND OPERATIONS
Our long-term success is dependent on the selection, design and execution of appropriate business strategies.
We operate in a highly competitive and ever-changing environment. Our long-term success is dependent on our ability to identify, develop and execute appropriate business strategies within this environment. Our current strategies include:
|
▪
|
opening new domestic company-operated Shacks;
|
|
▪
|
capitalizing on our outsized brand awareness;
|
|
▪
|
innovating our digital products and capabilities;
|
|
▪
|
growing same-Shack sales; and
|
|
▪
|
thoughtfully increasing our licensed Shacks, both domestically and abroad.
|
We may experience challenges in achieving the goals we have set and we may be unsuccessful in executing on our strategies once identified. Conversely, we may also execute on poorly designed strategies that prove to be ineffective or require us to make substantial changes to our strategy in order to produce the desired results. Our strategies may expose us to additional risks, and strategies that have been successful for us in the past may fail to be so in the future. We may incur significant costs and damage our brand if we are unable to identify, develop and execute on appropriate business strategies, which could have a material adverse impact on our business and results of operations.
Our primary growth strategy is highly dependent on the availability of suitable locations and our ability to develop and open new Shacks on a timely basis and on terms attractive to us.
One of the key means of achieving our growth strategies will be through opening and operating new Shacks on a profitable basis for the foreseeable future. We must identify target markets where we can enter or expand, taking into account numerous factors such as the location of our current Shacks, the target consumer base, population density, demographics, traffic patterns, competition, geography and information gathered from our various contacts. We may not be able to open our planned new Shacks within budget or on a timely basis, if at all, given the uncertainty of these factors, which could adversely affect our business, financial condition and results of operations. As we operate more Shacks, our rate of expansion relative to the size of our Shack base will eventually decline.
The number and timing of new Shacks opened during any given period may be negatively impacted by a number of factors including:
|
▪
|
the identification and availability of attractive sites for new Shacks;
|
|
▪
|
difficulty negotiating suitable lease terms;
|
|
▪
|
shortages of construction labor or materials;
|
|
▪
|
recruitment and training of qualified personnel in the local market;
|
|
▪
|
our ability to obtain all required governmental permits, including zonal approvals;
|
|
▪
|
our ability to control construction and development costs of new Shacks;
|
|
▪
|
competition in new markets, including competition for appropriate sites;
|
22
|
Shake Shack Inc.
Form 10-K
Form 10-K
|
▪
|
failure of the landlords to timely deliver real estate to us and other landlord delays;
|
|
▪
|
the proximity of potential sites to an existing Shack, and the impact of cannibalization on future growth;
|
|
▪
|
anticipated commercial, residential and infrastructure development near our new Shacks; and
|
|
▪
|
the cost and availability of capital to fund construction costs and pre-opening costs.
|
Accordingly, we cannot assure you that we will be able to successfully expand as we may not correctly analyze the suitability of a location or anticipate all of the challenges imposed by expanding our operations. Our growth strategy, and the substantial investment associated with the development of each new domestic company-operated Shack, may cause our operating results to fluctuate and be unpredictable or adversely affect our profits. In addition, as has happened when other restaurant concepts have tried to expand, we may find that our concept has limited appeal in new markets or we may experience a decline in the popularity of our concept in the markets in which we operate. If we are unable to expand in existing markets or penetrate new markets, our ability to increase our revenues and profitability may be materially harmed or we may face losses.
Our expansion into new domestic markets may present increased risks, which could affect our profitability.
We plan to open domestic company-operated Shacks in markets where we have little or no operating experience. Shacks we open in new markets may take longer to reach expected Shack sales and profit levels on a consistent basis, are likely to be less profitable on average than our current base of Shacks and may have higher construction, occupancy or operating costs than Shacks we open in existing markets. New markets may have competitive conditions, consumer tastes and discretionary spending patterns that are more difficult to predict or satisfy than our existing markets. We may need to make greater investments than we originally planned in advertising and promotional activity in new markets to build brand awareness. We may find it more difficult in new markets to hire, motivate and keep qualified employees who share our values. We may also incur higher costs from entering new markets if, for example, we assign area directors to manage comparatively fewer Shacks than we assign in more developed markets. Also, until we attain a critical mass in a market, the Shacks we do open will incur higher food distribution costs and reduced operating leverage. As a result, these new Shacks may be less successful or may achieve target Shack-level operating profit margins at a slower rate, if ever. If we do not successfully execute our plans to enter new markets, our business, financial condition or results of operations could be adversely affected. In addition, we plan to continue to expand into new international markets, which can pose similar and additional challenges in opening new Shacks.
Our failure to manage our growth effectively could harm our business and operating results.
Our growth plan includes opening a significant number of new Shacks. Our existing personnel, management systems, financial and management controls and information systems may not be adequate to support our planned expansion. Our ability to manage our growth effectively will require us to continue to enhance these systems, procedures and controls and to locate, hire, train and retain management and operating personnel, particularly in new markets. We may not be able to respond on a timely basis to all of the changing demands that our planned expansion will impose on management and on our existing infrastructure, or be able to hire or retain the necessary management and operating personnel, which could harm our business, financial condition or results of operations. These demands could cause us to operate our existing business less effectively, which in turn could cause a deterioration in the financial performance of our existing Shacks. If we experience a decline in financial performance, we may decrease the number of or discontinue Shack openings, or we may decide to close Shacks that we are unable to operate in a profitable manner.
New Shacks, once opened, may not be profitable, and may negatively affect Shack sales at our existing Shacks.
Our results have been, and in the future may continue to be, significantly impacted by the timing of new Shack openings (often dictated by factors outside of our control), including landlord delays, associated Shack pre-opening costs and operating inefficiencies, as well as changes in our geographic concentration due to the opening of new Shacks. We typically incur the most significant portion of pre-opening costs associated with a given Shack within the three months preceding the opening of the Shack. Our experience has been that labor and operating costs associated with a newly opened Shack for the first several months of operation, are materially greater than what can be expected after that time, both in aggregate dollars and as a percentage of Shack sales. Our new Shacks commonly take 8 to 12 weeks to reach target operating levels due to inefficiencies typically associated with new Shacks, including the training of new personnel, new market learning curves, inability to hire sufficient qualified staff and other factors. We may incur additional costs in new markets, particularly for transportation and distribution, which may impact the profitability of those Shacks. Although we have specific target operating and financial metrics, new Shacks may not meet these targets or may take longer than
Shake Shack Inc.
Form 10-K
|
23
Form 10-K
|
23
anticipated to do so. Any new Shacks we open may not be profitable or achieve operating results similar to those of our existing Shacks, which could adversely affect our business, financial condition or results of operations.
The opening of a new Shack in or near markets in which we already have Shacks could adversely affect the Shack sales of those existing Shacks. Existing Shacks could also make it more difficult to build our consumer base for a new Shack in the same market. We will continue to cluster in select markets and open new Shacks in and around areas of existing Shacks that are operating at or near capacity to leverage operational efficiencies and effectively serve our guests. Cannibalization of Shack sales among our Shacks may become significant in the future as we continue to expand our operations and could adversely affect our Shack sales growth, which could, in turn, adversely affect our business, financial condition or results of operations.
Additionally, many of our current domestic company-operated Shacks are located in high volume urban markets. As we expand, this percentage will decline and as a result we do not expect to maintain our current average unit volumes ("AUVs") and Shack-level operating profit margins, and our business, financial condition and results of operations may be adversely affected.
If we are unable to maintain and grow Shack sales at our existing Shacks, our financial performance could be adversely affected.
The level of same-Shack sales growth, which represents the change in year-over-year revenues for domestic company-operated Shacks open for 24 full months or longer, could affect our Shack sales growth. Our ability to increase same-Shack sales depends, in part, on our ability to successfully implement our initiatives to build Shack sales. It is possible such initiatives will not be successful, that we will not achieve our target same-Shack sales growth or that same-Shack sales growth could be negative, which may cause a decrease in Shack sales and profit growth that would adversely affect our business, financial condition or results of operations.
Our mission to Stand For Something Good subjects us to risks.
Our mission to Stand For Something Good is a significant part of our business strategy and who we are as a company. It's our commitment to all that is good in the world
and a reflection of how we embrace our values both internally and externally.
We pride ourselves on sourcing premium ingredients from like-minded producers—all natural proteins, vegetarian fed, humanely raised and source verified, with no hormones or antibiotics.
We are dedicated to using sustainable materials and equipment whenever possible, such as handmade tabletops constructed from reclaimed bowling alleys, as well as being
committed to achieving ethical and humane practices for the animals in our supply chain
.
We also strive to be the best employer and a good citizen in each community we call home.
We do, however, face many challenges in carrying out our mission to Stand For Something Good. We incur higher costs and other risks associated with paying above-average wages to our employees and purchasing high quality ingredients grown or raised with an emphasis on quality, sustainability and other responsible practices. As a result, our food and labor costs may be significantly higher than other companies who do not source high quality ingredients or pay above minimum wage. Additionally, the supply for high quality ingredients may be limited and it may take us longer to identify and secure relationships with suppliers that are able to meet our quality standards and have sufficient quantities to support our growing business. If we are unable to obtain a sufficient and consistent supply for our ingredients on a cost-effective basis, our food costs could increase or we may experience supply interruptions which could have an adverse effect on our operating margins. Additionally, some of our competitors have recently announced initiatives to offer better quality ingredients, such as antibiotic-free meat. If this trend continues, it could further limit our supply for certain ingredients and we may lose our competitive advantage as it will be more difficult to differentiate ourselves.
Because we hold ourselves to such high standards, and because we believe our guests have come to have high expectations of us, we may be more severely affected by negative reports or publicity if we fail, or are believed to have failed, to comply with our own standards. The damage to our reputation may be greater than other companies that do not have similar values as us, and it may take us longer to recover from such an incident and gain back the trust of our guests. Our mission to Stand For Something Good also exposes us to criticism from special interest groups who have different opinions regarding certain food issues or who believe we should pursue different strategies and goals. Any adverse publicity that results from such criticism could damage our brand and adversely affect customer traffic.
We believe that our Stand For Something Good philosophy has been a major contributing factor in our past success because we believe consumers are increasingly more focused on where their food comes from and how it's made, and that consumers want to
24
|
Shake Shack Inc.
Form 10-K
Form 10-K
associate themselves with
brands whose ethos matches that of their own. However, if these trends change we may no longer be able to successfully compete with other restaurants who share different values than us.
If we fail to maintain our corporate culture, our relationships with our employees and guests could be negatively affected.
We take great pride in our culture and believe that it is the single most important factor in our success. We believe that our culture of Enlightened Hospitality and our mission to Stand For Something Good creates a truly differentiated experience for our guests and is one of the reasons guests choose to dine with us and employees choose us as a place of employment. If we are unable to maintain our culture, especially as we continue to rapidly grow and expand in new markets, our reputation may be damaged, we may lose the trust of our guests, employee morale may be diminished and we may experience difficulty recruiting and retaining qualified employees. Any of these factors could have a material adverse effect on our business, financial condition and results of operations.
We have a limited number of suppliers for our major products and rely on one distribution company for the majority of our domestic distribution needs. If our suppliers or distributor are unable to fulfill their obligations under our arrangements with them, we could encounter supply shortages and incur higher costs.
We have a limited number of suppliers for our major ingredients, including beef patties, chicken, potato buns, custard, portobello mushrooms and cheese sauce. In fiscal
2018
, we purchased all of our (i) ground beef patties from eight suppliers, with approximately 56% of our ground beef patties supplied by one supplier; (ii) chicken breast from one supplier; (iii) potato buns directly from one supplier, which operates two facilities; (iv) custard base from three suppliers; (v) 'Shroom Burgers from one supplier; and (vi) ShackSauce from two supplier, with approximately 88% of our ShackSauce supplied by one supplier. Due to this concentration of suppliers, the cancellation of our supply arrangements with any one of these suppliers or the disruption, delay or inability of these suppliers to deliver these major products to our Shacks may materially and adversely affect our results of operations while we establish alternate distribution channels. In addition, if our suppliers fail to comply with food safety or other laws and regulations, or face allegations of non-compliance, their operations may be disrupted. We cannot assure you that we would be able to find replacement suppliers on commercially reasonable terms or a timely basis, if at all.
We contract with one distributor, which we refer to as our "broadline" distributor, to provide virtually all of our food distribution services in the United States. As of
December 26, 2018
, approximately 84% of our core food and beverage ingredients and 100% of our paper goods and chemicals, collectively representing 49% of our purchases, were processed through our broadline distributor for distribution and delivery to each Shack. As of
December 26, 2018
, we were utilizing 19 affiliated distribution centers and each distribution center carries two to three weeks of inventory for our core ingredients. In the event of a catastrophe, such as a fire, our broadline distributor can supply the Shacks affected by their respective distribution center from another affiliated distribution center. If a catastrophe, such as a fire, were to occur at the distribution center that services the Shacks located in New York and northern New Jersey, we would be at immediate risk of product shortages because that distribution center supplies 26% of our domestic company-operated Shacks as of
December 26, 2018
, which collectively represented 34% of our Shack sales for fiscal 2018. The other 18 distribution centers collectively supply the other approximately 74% of our domestic company-operated Shacks, which represented the remaining 66% of our Shack sales.
Accordingly, although we believe that alternative supply and distribution sources are available, there can be no assurance that we will continue to be able to identify or negotiate with such sources on terms that are commercially reasonable to us. If our suppliers or distributors are unable to fulfill their obligations under their contracts or we are unable to identify alternative sources, we could encounter supply shortages and incur higher costs, each of which could have a material adverse effect on our results of operations.
Our plans to open new Shacks, and the ongoing need for capital expenditures at our existing Shacks, require us to spend capital.
Our growth strategy depends on opening new Shacks, which will require us to use cash flows from oper
ations and a portion of the net proceeds from our initial public offering. We cannot assure that cash flows from operations and the net proceeds from our initial public offering will be sufficient to allow us to implement our growth strategy. If these funds are not allocated efficiently a
mong our various projects, or if any of these initiatives prove to be unsuccessful, we may experience reduced profitability and we could be required to delay, significantly curtail or eliminate planned Shack openings, which could have a material adverse effect on our business, financial condition and results of operations.
Shake Shack Inc.
Form 10-K
|
25
Form 10-K
|
25
In addition, as our Shacks mature, our business will require capital expenditures for the maintenance, renovation and improvement of existing Shacks to remain competitive and maintain the value of our brand standard. This creates an ongoing need for cash, and, to the extent we cannot fund capital expenditures from cash flows from operations, funds will need to be borrowed or otherwise obtained.
If the costs of funding new Shacks or renovations or enhancements to existing Shacks exceed budgeted amounts, and/or the time for building or renovation is longer than anticipated, our profits could be reduced. Additionally, recent inflation of material and labor costs have resulted in higher construction costs. If we cannot access the capital we need, we may not be able to execute our growth strategy, take advantage of future opportunities or respond to competitive pressures.
Our marketing strategies and channels will evolve and our programs may or may not be successful.
Shake Shack is a small, but growing brand. We incur costs and expend other resources in our marketing efforts to attract and retain guests. Our strategy includes public relations, digital and social media, promotions and in-store messaging, which require less marketing spend as compared to traditional marketing programs. Currently, the amount of discounted promotions and advertising we do is not significant. As the number of Shacks increases, and as we expand into new markets, we expect to increase our investment in advertising and consider additional promotional activities. Accordingly, in the future, we will incur greater marketing expenditures, resulting in greater financial risk and a greater impact on our Company.
We rely heavily on social media for many of our marketing efforts. If consumer sentiment towards social media changes or a new medium of communication becomes more mainstream, we may be required to fundamentally change our current marketing strategies which could require us to incur significantly more costs.
Some of our marketing initiatives may not be successful, resulting in expenses incurred without the benefit of higher revenues. Additionally, some of our competitors have greater financial resources, which enable them to spend significantly more on marketing and advertising than we are able to at this time. Should our competitors increase spending on marketing and advertising or our marketing funds decrease for any reason, or should our advertising and promotions be less effective than those of our competitors, there could be a material adverse effect on our business, financial condition and results of operations.
We rely on a limited number of licensees for the operation of our licensed Shacks, and we have limited control with respect to the operations of our licensed Shacks, which could have a negative impact on our reputation and business.
We rely, in part, on our licensees and the manner in which they operate their Shacks to develop and promote our business. As of
December 26, 2018
, four licensees operated all of our domestic licensed Shacks and four licensees operated all of our international licensed Shacks, with one such licensee operating 53% of our international licensed Shacks. Our licensees are required to operate their Shacks according to the specific guidelines we set forth, which are essential to maintaining brand integrity and reputation, all laws and regulations applicable to Shake Shack and its subsidiaries, and all laws and regulations applicable in the countries in which Shake Shack operates. We provide training to these licensees to integrate them into our operating strategy and culture. However, since we do not have day-to-day control over all of these Shacks, we cannot give assurance that there will not be differences in product and service quality, operations, labor law enforcement or marketing or that there will be adherence to all of our guidelines and applicable laws at these Shacks. In addition, if our licensees fail to make investments necessary to maintain or improve their Shacks, guest preference for the Shake Shack brand could suffer. Failure of these Shacks to operate effectively could adversely affect our cash flows from those operations or have a negative impact on our reputation or our business.
Given the relatively small number of licensees with which we do business, the success of our licensed operations depends on our ability to establish and maintain good relationships with our licensees, in particular, our relationship with our largest licensee who has an exclusive right to open new Shacks in existing markets. The value of our brand and the rapport that we maintain with our licensees are important factors for potential licensees considering doing business with us. If we are unable to maintain good relationships with licensees, we may be unable to renew license agreements and opportunities for developing new relationships with additional licensees may be adversely affected. This, in turn, could have an adverse effect on our business, financial condition and results of operations.
Although we have developed criteria to evaluate and screen prospective developers and licensees, we cannot be certain that the developers and licensees we select will have the business acumen necessary to open and operate successful licensed Shacks in
26
|
Shake Shack Inc.
Form 10-K
Form 10-K
their licensing areas. Our licensees compete for guests with other restaurants in their geographic markets, and the ability of our licensees to compete for guests directly impacts our business, financial condition and results of operations, as well as the desirability of our brand to prospective licensees. Licensees may not have access to the financial or management resources that they need to open the Shacks contemplated by their agreements with us or to be able to find suitable sites on which to develop them, or they may elect to cease development for other reasons. Licensees may not be able to negotiate acceptable lease or purchase terms for the sites, obtain the necessary permits and governmental approvals or meet construction schedules. Additionally, financing from banks and other financial institutions may not always be available to licensees to construct and open new Shacks. Any of these problems could slow our growth from licensing operations and reduce our licensing revenues.
RISKS RELATED TO OPERATING IN THE RESTAURANT INDUSTRY
Incidents involving food safety and food-borne illnesses could adversely affect guests' perception of our brand, result in lower sales and increase operating costs.
Food safety is a top priority, and we dedicate substantial resources to ensure the safety and quality of the food we serve. Nevertheless, we face food safety risks, including the risk of food-borne illness and food contamination, which are common both in the restaurant industry and the food supply chain and cannot be completely eliminated. We rely on third-party food suppliers and distributors to properly handle, store and transport our ingredients to our Shacks. Any failure by our suppliers, or their suppliers, could cause our ingredients to be contaminated, which may be difficult to detect before the food is served. Additionally, the risk of food-borne illness may also increase whenever our food is served outside of our control, such as by third-party delivery s
ervices. We are further exposed to this risk as our sales through unaffiliated third-party delivery services increases, if we continue to conduct pilots with third-party delivery partners and/or if we enter into a formal arrangement with one or more third-party delivery partners.
Regardless of the source or cause, any report of food-borne illnesses or food safety issues, whether or not accurate, at one or more of our Shacks, including Shacks operated by our licensees, could adversely affect our brand and reputation, which in turn could result in reduced guest traffic and lower sales. Additionally, we believe that, because our mission to Stand For Something Good promotes the use of higher quality ingredients, our guests have high expectations of us and we could be more severely affected by incidents of food-borne illnesses or food safety issues than some of our competitors who do not promote such standards. We may also have a more difficult time recovering from a food-borne illness incident and may be required to incur significant costs to repair our reputation.
If any of our guests become ill from food-borne illnesses, we could be forced to temporarily close one or more Shacks or choose to close as a preventative measure if we suspect there was a pathogen in our Shacks. Furthermore, any instances of food contamination, whether or not at our Shacks, could subject us or our suppliers to voluntary or involuntary food recalls and the costs to conduct such recalls could be significant and could interrupt our supply to unaffected Shacks or increase the cost of our ingredients.
Additionally, consumer preferences could be affected by health concerns about the consumption of beef, our key ingredient. For example, if a pathogen, such as "mad cow disease," or other virus, bacteria, parasite or toxin infects the food supply (or is believed to have infected the food supply), regardless of whether our supply chain is affected, guests may actively avoid consuming certain ingredients. A negative report or negative publicity surrounding such an incident, whether related to one of our Shacks or to a competitor in the industry, may have an adverse impact on demand for our food and could result in a material decrease in guest traffic and lower sales.
Shake Shack Inc.
Form 10-K
|
27
Form 10-K
|
27
Rising labor costs and difficulties recruiting and retaining the right team members could adversely affect our business.
We believe that our culture is the single most important factor to our success. Therefore, our success depends, in part, on our ability to attract, motivate and retain a sufficient number of qualified managers and team members to meet the needs of our existing Shacks and to staff new Shacks. We aim to hire people who have integrity, who are warm, friendly, motivated, caring, self-aware and intellectually curious—what we call "51%'ers." 51%'ers are excited and committed to championship performance, remarkable and enriching hospitality, embodying our culture, and actively growing themselves and the brand. In many markets, competition for qualified individuals is intense and we may be unable to identify and attract a sufficient number of individuals to meet our growing needs, especially in markets where our brand is less established. As a result, because we aim to hire the best people, we may be required to pay higher wages and provide greater benefits. Our commitment to taking care of our team may cause us to incur higher labor costs compared to other restaurant companies. Additionally, several states in which we operate have enacted minimum wage increases and it is possible that other states or the federal government could also enact minimum wage increases. Such increases will cause an increase to our labor and related expenses and cause our Shack-level operating profit margins to decline. As more minimum wage increases or other legislation relating to employee benefits are enacted or changed, such as the Affordable Care Act, we may be required to implement additional pay increases or offer additional benefits in the future in order to continue to attract and retain the most qualified people, which may put further pressure on our operating margins by increasing costs. Overall, we expect wages at all levels to continue to increase in the near and short term and we expect these rising wages to add pressure to our operating profit.
We place a heavy emphasis on the qualification and training of our team members and spend a significant amount of time and money training our employees. Any inability to recruit and retain qualified individuals may result in higher turnover and increased labor costs, and could compromise the quality of our service, all of which could adversely affect our business. Any such inability could also delay the planned openings of new Shacks and could adversely impact our existing Shacks. Such increased costs of attracting qualified employees or delays in Shack openings could adversely affect our business and results of operations.
Increased food commodity and energy costs could decrease our Shack-level operating profit margins or cause us to limit or otherwise modify our menu, which could adversely affect our business.
Our profitability depends, in part, on our ability to anticipate and react to changes in the price and availability of food commodities, including among other things beef, poultry, grains, dairy and produce. Prices may be affected due to market changes, increased competition, the general risk of inflation, shortages or interruptions in supply due to weather, disease or other conditions beyond our control, or other reasons. For example, in 2018 there were recalls on romaine lettuce, and although we do not serve romaine lettuce, we nonetheless experienced a slight financial impact due to higher demand and price of other types of lettuce we do serve. We experienced a slight financial impact as we use lettuce on our burgers and sandwiches. Other events could increase commodity prices or cause shortages that could affect the cost and quality of the items we buy or require us to further raise prices or limit our menu options. These events, combined with other more general economic and demographic conditions, could impact our pricing and negatively affect our Shack sales and Shack-level operating profit margins. While we have been able to partially offset inflation and other changes in the costs of core operating resources by gradually increasing menu prices, coupled with more efficient purchasing practices, productivity improvements and greater economies of scale, there can be no assurance that we will be able to continue to do so in the future. From time to time, competitive conditions could limit our menu pricing flexibility. In addition, macroeconomic conditions could make additional menu price increases imprudent. There can be no assurance that future cost increases can be offset by increased menu prices or that increased menu prices will be fully absorbed by our guests without any resulting change to their visit frequencies or purchasing patterns. In addition, there can be no assurance that we will generate same-Shack sales growth in an amount sufficient to offset inflationary or other cost pressures.
We may decide to enter into certain forward pricing arrangements with our suppliers, which could result in fixed or formula-based pricing with respect to certain food products. However, these arrangements generally are relatively short in duration and may provide only limited protection from price changes. In addition, the use of these arrangements may limit our ability to benefit from favorable price movements.
Our profitability is also adversely affected by increases in the price of utilities, such as natural gas, electric and water, whether as a result of inflation, shortages or interruptions in supply, or otherwise. Our ability to respond to increased costs by increasing prices or by implementing alternative processes or products will depend on our ability to anticipate and react to such increases and other
28
|
Shake Shack Inc.
Form 10-K
Form 10-K
more general economic and demographic conditions, as well as the responses of our competitors and guests. All of these things may be difficult to predict and beyond our control. In this manner, increased costs could adversely affect our results of operations.
Shortages or interruptions in the supply or delivery of food products could adversely affect our operating results.
We are dependent on frequent deliveries of food products that meet our exact specifications. Shortages or interruptions in the supply of food products caused by problems in production or distribution, inclement weather, unanticipated demand or other conditions could adversely affect the availability, quality and cost of ingredients, which would adversely affect our operating results.
Our burgers depend on the availability of our proprietary ground beef blend. Availability of our blend depends on two different components: raw material supplied by the slaughterhouses and ground and formed beef patties supplied by regional grinders who further process and convert whole muscle purchased from the slaughterhouses. The primary risk we face is with our regional grinders. If there is an interruption of operation at any one of our regional grinder's facilities, we face an immediate risk because each Shack typically has less than three days of beef patty inventory on hand. However, we have agreements with our regional grinders to provide an alternate back-up supply in the event of a disruption in their operations. In addition, our second largest regional grinder can, in an emergency, supply us in the event of a disruption of operations at one of our beef grinders through our broadline distributor's network, but there would be a delay in availability due to production and shipping.
We currently have nine approved raw beef suppliers and nine approved beef processors in the United States. If there is a supply issue with all U.S. raw beef, we have eight approved raw beef suppliers and eight approved beef processors in other countries. The risks to using international suppliers are shipping lead time, shipping costs, potential import duties and U.S. customs. It is unknown at this time how long it would take and at what cost the raw material would be to import from any such other country, but the delay and cost would likely be adverse to our business.
We face significant competition for guests, and if we are unable to compete effectively, our business could be adversely affected.
The restaurant industry is intensely competitive with many well-established companies that compete directly and indirectly with us with respect to taste, price, food quality, service, value, design and location. We compete in the restaurant industry with multi-unit national, regional and locally-owned and/or operated limited-service restaurants and full-service restaurants. We compete with (i) restaurants, (ii) other fast casual restaurants, (iii) quick service restaurants and (iv) casual dining restaurants. Our competitors may operate company-owned restaurants, franchised restaurants or some combination. Many of our competitors offer breakfast, lunch and dinner, as well as dine-in, carry-out and delivery services. We may also compete with companies outside of the traditional restaurant industry, such as grocery store chains, meal subscription services and delicatessens, especially those that target customers who seek high-quality food, as well as convenience food stores, cafeterias and other dining outlets. Many of our competitors have existed longer than we have and may have a more established market presence, better locations and greater name recognition nationally or in some of the local markets in which we operate or plan to open Shacks. Some of our competitors may also have significantly greater financial, marketing, personnel and other resources than we do. They may also operate more restaurants than we do and be able to take advantage of greater economies of scale than we can given our current size.
Our competition continues to intensify as new competitors enter the burger, fast casual, quick service and casual dining segments. Many of our competitors emphasize low cost "value meal" menu options or other programs that provide price discounts on their menu offerings, a strategy we do not pursue. We also face increasing competitive pressures from some of our competitors who have recently announced initiatives to offer better quality ingredients, such as antibiotic-free meat.
Changes in consumer tastes, nutritional and dietary trends, traffic patterns and the type, number, and location of competing restaurants often affect the restaurant business. Our sales could be impacted by changes in consumer preferences in response to dietary concerns, including preferences regarding items such as calories, sodium, carbohydrates or fat. Our competitors may react more efficiently and effectively to these changes than we can. We cannot make any assurances regarding our ability to effectively respond to changes in consumer health perceptions or our ability to adapt our menu offerings to trends in eating habits.
Additionally, as we continue to innovate upon our digital strategy and offer more ways to order through digital channels, such as the app, web ordering, kiosk and delivery, we compete with other competitors who currently, or are beginning to, offer the same
Shake Shack Inc.
Form 10-K
|
29
Form 10-K
|
29
options as well as new and improved technologies. With the introduction of these digital channels, there is also an increased opportunity for customer credit card fraud to occur, which could result in increased credit card fees for us.
Our continued success depends, in part, on the continued popularity of our menu and the experience we offer guests at our Shacks. If we are unable to continue to compete effectively on any of the factors mentioned above, our traffic, Shack sales and Shack-level operating profit margins could decline and our business, financial condition and results of operations would be adversely affected.
Our international licensed Shacks import many of our proprietary and other core ingredients from the United States, the United Kingdom and the European Union. If this international supply chain is interrupted, our international licensed operations could encounter supply shortages and incur higher costs.
Our international licensed Shacks import many of our proprietary ingredients from the United States, United Kingdom and the European Union ("EU"). For example, our proprietary blend of beef patties and/or raw materials for beef patties originate from the United States and the EU as well as Australia. In addition, outside of Japan, Korea and Turkey our potato buns supplied internationally are exclusively from the United States, and other key items, such as crinkle cut fries, originate within the United States or the EU. While we have established secondary supply solutions for some of these ingredients, we have not acquired secondary supplies for all of them.
Due to the long lead time and general volatility in the supply chain, the third-party logistic providers for our international licensed Shacks in the Middle East carry at least three months of inventory to allow for delays or interruptions in the supply chain. Specifically, we have had past and ongoing issues ensuring that timely and adequate supplies reach our Middle East Shacks. In the Middle East, our licensee delegates the supply function to its own third-party logistics providers in each country in which it operates, with which we have limited and restricted communication, preventing us from exercising direct control or instruction over such entities.
Sanctions enacted by the Russian Federation on many imported ingredients from the United States, the United Kingdom, the EU and Australia have affected our Russian licensee's ability to import such ingredients to our Russian Shacks. As a result of the changing and uncertain nature of such sanctions, and although our Russian licensee has identified a back-up supplier, we are unable to guarantee that the licensee will be able to import our proprietary ingredients to supply these Shacks. We have given our licensee in Russia approval to utilize alternative ingredients not affected by the sanctions, but there is a risk that these substitute ingredients may be inferior in taste and quality or come from suppliers that have not been vetted for food safety and quality assurance.
If our international licensed Shacks are unable to obtain our proprietary ingredients in the necessary amounts in a timely fashion as a result of logistics issues, sanctions or other challenges, it could harm its business and adversely affect the licensing revenue we receive, adversely impacting our business and results of operations.
We are subject to risks associated with leasing property subject to long-term non-cancelable leases.
We do not own any real property and all of our domestic company-operated Shacks are located on leased premises. The leases for our Shacks generally have initial terms ranging from 10 to 15 years and typically provide for two five-year renewal options as well as for rent escalations. However, the license agreement for our Madison Square Park Shack can be terminated by the New York City Commissioner of Parks for any reason on 25 days' written notice.
Generally, our leases are net leases that require us to pay our share of the costs of real estate taxes, utilities, building operating expenses, insurance and other charges in addition to rent. We generally cannot cancel these leases. Additional sites that we lease are likely to be subject to similar long-term non-cancelable leases. If we close a Shack, we may still be obligated to perform our monetary obligations under the applicable lease, including, among other things, payment of the base rent for the remaining lease term. In addition, as each of our leases expire, we may fail to negotiate renewals, either on commercially acceptable terms or at all, which could cause us to close Shacks in desirable locations. We depend on cash flows from operations to pay our lease expenses and to fulfill our other cash needs. If our business does not generate sufficient cash flow from operating activities, and sufficient funds are not otherwise available to us from borrowings or other sources, we may not be able to service our lease obligations or fund our other liquidity and capital needs, which would materially affect our business.
30
|
Shake Shack Inc.
Form 10-K
Form 10-K
Restaurant companies have been the target of class action lawsuits and other proceedings that are costly, divert management attention and, if successful, could result in our payment of substantial damages or settlement costs.
Our business is subject to the risk of litigation by employees, guests, suppliers, licensees, stockholders or others through private actions, class actions, administrative proceedings, regulatory actions or other litigation. The outcome of litigation, particularly class action and regulatory actions, is difficult to assess or quantify. In recent years, restaurant companies have been subject to lawsuits, including class action lawsuits, alleging violations of federal and state laws regarding workplace and employment matters, discrimination and similar matters. A number of these lawsuits have resulted in the payment of substantial damages by the defendants. Similar lawsuits have been instituted from time to time alleging violations of various federal and state wage and hour laws regarding, among other things, employee meal deductions, overtime eligibility of assistant managers and failure to pay for all hours worked. In fiscal 2018 we were the subject of such an employment-related claim and there can be no assurance that we will not be named in any such lawsuit in the future or that we would not be required to pay substantial expenses and/or damages.
Occasionally, our guests file complaints or lawsuits against us alleging that we are responsible for some illness or injury they suffered at or after a visit to one of our Shacks, including actions seeking damages resulting from food-borne illness or accidents in our Shacks. We are also subject to a variety of other claims from third parties arising in the ordinary course of our business, including contract claims. The restaurant industry has also been subject to a growing number of claims that the menus and actions of restaurant chains have led to the obesity of certain of their customers.
Regardless of whether any claims against us are valid or whether we are liable, claims may be expensive to defend and may divert time and money away from our operations. In addition, they may generate negative publicity, which could reduce guest traffic and Shack sales. Although we maintain what we believe to be adequate levels of insurance to cover any of these liabilities, insurance may not be available at all or in sufficient amounts with respect to these or other matters. A judgment or other liability in excess of our insurance coverage for any claims or any adverse publicity resulting from claims could adversely affect our business and results of operations.
Our business is subject to risks related to our sale of alcoholic beverages.
We serve beer and wine at most of our Shacks. Alcoholic beverage control regulations generally require our Shacks to apply to a state authority and, in certain locations, county or municipal authorities for a license that must be renewed annually and may be revoked or suspended for cause at any time. Alcoholic beverage control regulations relate to numerous aspects of daily operations of our Shacks, including minimum age of patrons and employees, hours of operation, advertising, trade practices, wholesale purchasing, other relationships with alcohol manufacturers, wholesalers and distributors, inventory control and handling, storage and dispensing of alcoholic beverages. Any future failure to comply with these regulations and obtain or retain licenses could adversely affect our business, financial condition and results of operations.
We are also subject in certain states to "dram shop" statutes, which generally provide a person injured by an intoxicated person the right to recover damages from an establishment that wrongfully served alcoholic beverages to the intoxicated person. We carry liquor liability coverage as part of our existing comprehensive general liability insurance. Recent litigation against restaurant chains has resulted in significant judgments and settlements under dram shop statutes. Because these cases often seek punitive damages, which may not be covered by insurance, such litigation could have an adverse impact on our business, results of operations or financial condition. Regardless of whether any claims against us are valid or whether we are liable, claims may be expensive to defend and may divert time and resources away from operations and hurt our financial performance. A judgment significantly in excess of our insurance coverage or not covered by insurance could have a material adverse effect on our business, results of operations or financial condition.
Shake Shack Inc.
Form 10-K
|
31
Form 10-K
|
31
GENERAL BUSINESS AND ECONOMIC RISKS
Damage to our reputation could negatively impact our business, financial condition and results of operations.
Our reputation and the quality of our brand are critical to our business and success in existing markets, and will be critical to our success as we enter new markets. We believe that we have built our reputation on the high quality of our food and service, our commitment to our guests, our strong employee culture, and the atmosphere and design of our Shacks, and we must protect and grow the value of our brand in order for us to continue to be successful. Any incident that erodes consumer loyalty for our brand could significantly reduce its value and damage our business.
We may be adversely affected by any negative publicity, regardless of its accuracy, including with respect to:
|
▪
|
food safety concerns, including food tampering or contamination;
|
|
▪
|
food-borne illness incidents;
|
|
▪
|
the safety of the food commodities we use, particularly beef;
|
|
▪
|
guest injury;
|
|
▪
|
security breaches of confidential guest or employee information;
|
|
▪
|
third-party service providers, particularly related to delivery services and information technology, and potential guest dissatisfaction from circumstances out of our control relating to third-party service providers;
|
|
▪
|
employment-related claims relating to alleged employment discrimination, wage and hour violations, labor standards or health care and benefit issues; or
|
|
▪
|
government or industry findings concerning our Shacks, restaurants operated by other food service providers or others across the food industry supply chain.
|
Also, there has been a marked increase in the use of social media platforms and similar devices, including weblogs (blogs), social media websites and other forms of internet-based communications that provide individuals with access to a broad audience of consumers and other interested persons. The availability of information on social media platforms is virtually immediate as is its impact. Many social media platforms immediately publish the content their subscribers and participants can post, often without filters or checks on accuracy of the content posted. The opportunity for dissemination of information, including inaccurate information, is seemingly limitless and readily available. Information concerning us may be posted on such platforms at any time. Information posted may be adverse to our interests or may be inaccurate, each of which may harm our performance, prospects or business. The harm may be immediate without affording us an opportunity for redress or correction.
Ultimately, the risks associated with any such negative publicity or incorrect information cannot be completely eliminated or mitigated and may materially harm our reputation, business, financial condition and results of operations.
Changes in economic conditions, both domestically and internationally, could materially affect our business, financial condition and results of operations.
The restaurant industry depends on consumer discretionary spending. During the economic downturn that began in 2008, disruptions in the overall economy, including the impact of the housing crisis, high unemployment and financial market volatility and unpredictability, caused a related reduction in consumer confidence, which negatively affected the restaurant industry. These factors, as well as national, regional and local regulatory and economic conditions, gasoline prices, energy and other utility costs, inclement weather, conditions in the residential real estate and mortgage markets, health care costs, access to credit, disposable consumer income and consumer confidence, affect discretionary consumer spending. Additionally, because some of our Shacks are located in or near retail malls, general declines in mall traffic experienced by the retail industry in general could negatively affect us.
In poor economic conditions, guest traffic could be adversely impacted if our guests choose to dine out less frequently or reduce the amount they spend on meals while dining out. Reduced guest traffic could result in lower Shack sales and licensing revenue, as well as a decline in our profitability as we spread fixed costs across a lower level of Shack sales. Prolonged negative trends in sales could cause us and our licensees to, among other things, reduce the number and frequency of new Shack openings, close Shacks or delay remodeling of our existing Shacks or recognize asset impairment charges.
32
|
Shake Shack Inc.
Form 10-K
Form 10-K
Because many of our domestic company-operated Shacks are concentrated in local or regional areas, we are susceptible to economic and other trends and developments, including adverse weather conditions, in these areas.
Our financial performance is highly dependent on Shacks located in the Northeast and the New York City metropolitan area, which comprised approximately
49%
(or
61
out of
124
) of our total domestic company-operated Shacks as of
December 26, 2018
. As a result, adverse economic conditions in any of these areas could have a material adverse effect on our overall results of operations. In addition, given our geographic concentrations, negative publicity regarding any of our Shacks in these areas could have a material adverse effect on our business and operations, as could other regional occurrences such as local strikes, terrorist attacks, increases in energy prices, inclement weather or natural or man-made disasters.
In particular, adverse weather conditions, such as regional winter storms, floods, severe thunderstorms and hurricanes, could negatively impact our results of operations. Temporary or prolonged Shack closures may occur and guest traffic may decline due to the actual or perceived effects of future weather related events.
Security breaches of either confidential guest information in connection with, among other things, our electronic processing of credit and debit card transactions or mobile ordering app, or confidential employee information may adversely affect our business.
Our business requires the collection, transmission and retention of large volumes of guest and employee data, including credit and debit card numbers and other personally identifiable information, in various information technology systems that we maintain and in those maintained by third parties with whom we contract to provide services. The integrity and protection of that guest and employee data is critical to us. Further, our guests and employees have a high expectation that we and our service providers will adequately protect their personal information.
Like many other retail companies and because of the prominence of our brand, we have experienced, and will likely continue to experience, attempts to compromise our information technology systems. Additionally, the techniques and sophistication used to conduct cyber-attacks and breaches of information technology systems, as well as the sources and targets of these attacks, change frequently and are often not recognized until such attacks are launched or have been in place for a period of time. While we continue to make significant investment in physical and technological security measures, employee training, and third party services, designed to anticipate cyber-attacks and prevent breaches, our information technology networks and infrastructure or those of our third party vendors and other service providers could be vulnerable to damage, disruptions, shutdowns, or breaches of confidential information due to criminal conduct, employee error or malfeasance, utility failures, natural disasters or other catastrophic events. Due to these scenarios we cannot provide assurance that we will be successful in preventing such breaches or data loss.
Additionally, the information, security and privacy requirements imposed by governmental regulation are increasingly demanding. Our systems may not be able to satisfy these changing requirements and guest and employee expectations, or may require significant additional investments or time in order to do so. Efforts to hack or breach security measures, failures of systems or software to operate as designed or intended, viruses, operator error or inadvertent releases of data all threaten our and our service providers' information systems and records. A breach in the security of our information technology systems or those of our service providers could lead to an interruption in the operation of our systems, resulting in operational inefficiencies and a loss of profits. Additionally, a significant theft, loss or misappropriation of, or access to, guests' or other proprietary data or other breach of our information technology systems could result in fines, legal claims or proceedings, including regulatory investigations and actions, or liability for failure to comply with privacy and information security laws, which could disrupt our operations, damage our reputation and expose us to claims from guests and employees, any of which could have a material adverse effect on our financial condition and results of operations.
If we are unable to maintain and update our information technology systems to meet the needs of our business, our business could be adversely impacted.
We rely heavily on information systems, including point-of-sale processing in our Shacks, for management of our supply chain, accounting, payment of obligations, collection of cash, credit and debit card transactions, mobile ordering and other processes and procedures. As a rapidly growing business, our current information technology infrastructure may not be adequately suited to handle the increasing volume of data and additional information needs of our organization. If we are unable to successfully upgrade our
Shake Shack Inc.
Form 10-K
|
33
Form 10-K
|
33
information systems to meet the growing needs of our business or are delayed in doing so, whether through our current enterprise-wide finance initiative Project Concrete or other future ones, our growth could be adversely affected.
Additionally, as technology systems continue to evolve and as consumers adopt new technologies, we may need to enhance our systems or modify our strategies in order to remain relevant in our industry and to our guests. If we are unable to successfully identify and implement new and emerging technologies, our business could be adversely affected.
If we experience a material failure or interruption in our systems, our business could be adversely impacted.
Our ability to efficiently and effectively manage our business depends significantly on the reliability and capacity of our information technology systems. Our operations depend upon our ability to protect our computer equipment and systems against damage from physical theft, fire, power loss, telecommunications failure or other catastrophic events, as well as from internal and external security breaches, viruses and other disruptive problems. The failure of these systems to operate effectively, maintenance problems, upgrading or transitioning to new platforms, expanding our systems as we grow or a breach in security of these systems could result in interruptions to or delays in our business and guest service and reduce efficiency in our operations. If our information technology systems fail and our redundant systems or disaster recovery plans are not adequate to address such failures, or if our business interruption insurance does not sufficiently compensate us for any losses that we may incur, our revenues and profits could be reduced and the reputation of our brand and our business could be materially adversely affected. In addition, remediation of such problems could result in significant, unplanned capital investments.
Additionally, as we continue to evolve our digital platforms and enhance our internal systems, we place increasing reliance on third-parties to provide infrastructure and other support services. We may be adversely affected if any of our third-party service providers experience any interruptions in their systems, which then could potentially impact the services we receive from them and cause a material failure or interruption in our own systems.
Because a component of our strategy is to continue to grow our licensed business internationally, the risks of doing business internationally could lower our revenues, increase our costs, reduce our profits or disrupt our business.
Seventy-two
of our
84
licensed Shacks as of
December 26, 2018
are located outside the United States and we expect to continue to expand our licensed Shacks internationally. As a result, we are and will be, on an increasing basis, subject to the risks of doing business outside the United States, including:
|
▪
|
changes in foreign currency exchange rates or currency restructurings and hyperinflation or deflation in the countries in which we operate;
|
|
▪
|
the imposition of restrictions on currency conversion or the transfer of funds or limitations on our ability to repatriate non-U.S. earnings in a tax effective manner;
|
|
▪
|
the presence and acceptance of varying levels of business corruption in international markets;
|
|
▪
|
the ability to comply with, or impact of complying with, complex and changing laws, regulations and policies of foreign governments that may affect investments or operations, including foreign ownership restrictions, import and export controls, tariffs, embargoes, intellectual property, licensing requirements and regulations, increase in taxes paid and other changes in applicable tax laws;
|
|
▪
|
the difficulties involved in managing an organization doing business in many different countries;
|
|
▪
|
the ability to comply with, or impact of complying with, complex and changing laws, regulations and economic political policies of the U.S. government, including U.S. laws and regulations relating to economic sanctions, export controls and anti-boycott requirements;
|
|
▪
|
increase in an anti-American sentiment and the identification of the licensed brand as an American brand;
|
|
▪
|
the effect of disruptions caused by severe weather, natural disasters, outbreak of disease or other events that make travel to a particular region less attractive or more difficult; and
|
|
▪
|
political and economic instability.
|
Any or all of these factors may adversely affect the performance of and licensing revenues we receive from our licensed Shacks located in international markets. Our international licensed Shacks operate in several volatile regions that are subject to geopolitical and socio-political factors that pose risk to our business operations. In the past, our licensee has been negatively impacted by currency devaluation in Russia and Turkey and we have seen a reduction in licensing revenue from our those respective Shacks.
34
|
Shake Shack Inc.
Form 10-K
Form 10-K
In addition, the economy of any region in which our Shacks are located may be adversely affected to a greater degree than that of other areas of the country or the world by certain developments affecting industries concentrated in that region or country. For example, our Shacks located in the Middle East have, in the past, suffered from violence and political unrest, as well as depressed oil prices with declines in traffic experienced throughout the region, and in 2017, our licensee in the Middle East closed two Shacks; it is possible that our licensee may choose to close more of these Shacks in the future. While these factors and the impact of these factors are difficult to predict, any one or more of them could lower our revenues, increase our costs, reduce our profits or disrupt our business, and, as our international licensed operations increase, these risks will become more pronounced.
We depend on key members of our executive management team.
We depend on the leadership and experience of key members of our executive management team. The loss of the services of any of our executive management team members could have a material adverse effect on our business and prospects, as we may not be able to find suitable individuals to replace such personnel on a timely basis or without incurring increased costs, or at all. We do not maintain key person life insurance policies on any of our executive officers. We believe that our future success will depend on our continued ability to attract and retain highly skilled and qualified personnel. There is a high level of competition for experienced, successful personnel in our industry. Our inability to meet our executive staffing requirements in the future could impair our growth and harm our business.
We may not be able to adequately protect our intellectual property, which, in turn, could harm the value of our brands and adversely affect our business.
Our ability to implement our business plan successfully depends in part on our ability to further build brand recognition using our trademarks, service marks, proprietary products and other intellectual property, including our name and logos and the unique character and atmosphere of our Shacks. We rely on U.S. and foreign trademark, copyright, and trade secret laws, as well as license agreements, non-disclosure agreements, and confidentiality and other contractual provisions to protect our intellectual property. Nevertheless, our competitors may develop similar menu items and concepts, and adequate remedies may not be available in the event of an unauthorized use or disclosure of our trade secrets and other intellectual property.
The success of our business depends on our continued ability to use our existing trademarks and service marks to increase brand awareness and further develop our brand in both domestic and international markets. We have registered and applied to register trademarks and service marks in the United States and foreign jurisdictions. We may not be able to adequately protect our trademarks and service marks, and our competitors and others may successfully challenge the validity and/or enforceability of our trademarks and service marks and other intellectual property. Additionally, we may be prohibited from entering into certain new markets due to restrictions surrounding competitors' trademarks. The steps we have taken to protect our intellectual property in the United States and in foreign countries may not be adequate. In addition, the laws of some foreign countries do not protect intellectual property to the same extent as the laws of the United States.
If our efforts to maintain and protect our intellectual property are inadequate, or if any third party misappropriates, dilutes or infringes on our intellectual property, the value of our brands may be harmed, which could have a material adverse effect on our business and might prevent our brands from achieving or maintaining market acceptance.
We may also from time to time be required to institute litigation to enforce our trademarks, service marks and other intellectual property. Such litigation could result in substantial costs and diversion of resources and could negatively affect our sales, profitability and prospects regardless of whether we are able to successfully enforce our rights.
Third parties may assert that we infringe, misappropriate or otherwise violate their intellectual property and may sue us for intellectual property infringement. Even if we are successful in these proceedings, we may incur substantial costs, and the time and attention of our management and other personnel may be diverted in pursuing these proceedings. If a court finds that we infringe a third party's intellectual property, we may be required to pay damages and/or be subject to an injunction. With respect to any third party intellectual property that we use or wish to use in our business (whether or not asserted against us in litigation), we may not be able to enter into licensing or other arrangements with the owner of such intellectual property at a reasonable cost or on reasonable terms.
Shake Shack Inc.
Form 10-K
|
35
Form 10-K
|
35
Our insurance coverage and self-insurance reserves may not provide adequate levels of coverage against claims.
We maintain various insurance policies for employee health, workers' compensation, general liability, and property damage. We believe that we maintain insurance customary for businesses of our size and type. However, there are types of losses we may incur that cannot be insured against or that we believe are not economically reasonable to insure. Such losses could have a material adverse effect on our business and results of operations.
Additionally, we are self-insured for our employee medical plan and we recognize a liability that represents our estimated cost of claims incurred but not reported as of the balance sheet date. Our estimated liability is based on a number of assumptions and factors, including actuarial assumptions and historical trends. Our history of claims experience is short and our significant growth rate could affect the accuracy of our estimates. If a greater amount of claims are reported, or if medial costs increase beyond what we expect, our liabilities may not be sufficient and we could recognize additional expense, which could adversely affect our results of operations.
REGULATORY AND LEGAL RISKS
We are subject to many federal, state and local laws, as well as other statutory and regulatory requirements, with which compliance is both costly and complex. Failure to comply with, or changes in these laws or requirements, could have an adverse impact on our business.
We are subject to extensive federal, state, local and foreign laws and regulations, as well as other statutory and regulatory requirements, including those related to:
|
▪
|
nutritional content labeling and disclosure requirements;
|
|
▪
|
food safety regulations;
|
|
▪
|
local licensure, building and zoning regulations;
|
|
▪
|
employment regulations;
|
|
▪
|
the Affordable Care Act;
|
|
▪
|
the Americans with Disabilities Act ("ADA") and similar state laws;
|
|
▪
|
privacy and cybersecurity;
|
|
▪
|
laws and regulations related to our licensed operations; and
|
|
▪
|
U.S. Foreign Corrupt Practices Act and other similar anti-bribery and anti-kickback laws;
|
The impact of current laws and regulations, the effect of future changes in laws or regulations that impose additional requirements and the consequences of litigation relating to current or future laws and regulations, uncertainty around future changes in laws made by new regulatory administrations or our inability to respond effectively to significant regulatory or public policy issues, could increase our compliance and other costs of doing business and, therefore, have an adverse effect on our results of operations. Failure to comply with the laws and regulatory requirements of federal, state and local authorities could result in, among other things, revocation of required licenses, administrative enforcement actions, fines and civil and criminal liability. In addition, certain laws, including the ADA, could require us to expend significant funds to make modifications to our Shacks if we failed to comply with applicable standards. Compliance with all of these laws and regulations can be costly and can increase our exposure to litigation or governmental investigations or proceedings.
Nutritional Content Labeling and Disclosure Requirements
In recent years, there has been an increased legislative, regulatory and consumer focus on the food industry including nutritional and advertising practices. These changes have resulted in, and may continue to result in, the enactment of laws and regulations that impact the ingredients and nutritional content of our menu offerings, or laws and regulations requiring us to disclose the nutritional content of our food offerings. For example, a number of states, counties and cities have enacted menu labeling laws requiring multi-unit restaurant operators to disclose certain nutritional information to customers, or have enacted legislation restricting the use of certain types of ingredients in restaurants. Furthermore, the Patient Protection and Affordable Care Act of 2010 (the "PPACA") establishes a uniform, federal requirement for certain restaurants to post certain nutritional information on their menus. Specifically,
36
|
Shake Shack Inc.
Form 10-K
Form 10-K
the PPACA amended the Federal Food, Drug and Cosmetic Act to require certain chain restaurants to publish the total number of calories of standard menu items on menus and menu boards, along with a statement that puts this calorie information in the context of a total daily calorie intake. These new labeling laws may also change consumer buying habits in a way that adversely impacts our sales. Additionally, an unfavorable report on, or reaction to, our menu ingredients, the size of our portions or the nutritional content of our menu items could negatively influence the demand for our offerings.
Food Safety Regulations
There is also a potential for increased regulation of certain food establishments in the United States, where compliance with a Hazard Analysis and Critical Control Points ("HACCP") approach may now be required. HACCP refers to a management system in which food safety is addressed through the analysis and control of potential hazards from production, procurement and handling, to manufacturing, distribution and consumption of the finished product. Many states have required restaurants to develop and implement HACCP Systems, and the United States government continues to expand the sectors of the food industry that must adopt and implement HACCP programs. For example, the Food Safety Modernization Act ("FSMA") granted the FDA new authority regarding the safety of the entire food system, including through increased inspections and mandatory food recalls. Although restaurants are specifically exempted from or not directly implicated by some of these new requirements, we anticipate that the new requirements may impact our industry. Additionally, our suppliers may initiate or otherwise be subject to food recalls that may impact the availability of certain products, result in adverse publicity or require us to take actions that could be costly for us or otherwise impact our business.
Local Licensure, Building and Zoning Regulations
The development and operation of Shacks depend, to a significant extent, on the selection of suitable sites, which are subject to zoning, land use, environmental, traffic and other regulations and requirements. We are also subject to licensing and regulation by state and local authorities relating to health, sanitation, safety and fire standards. Typically, licenses, permits and approvals under such laws and regulations must be renewed annually and may be revoked, suspended or denied renewal for cause at any time if governmental authorities determine that our conduct violates applicable regulations. Difficulties or failure to maintain or obtain the required licenses, permits and approvals could adversely affect our existing Shacks and delay or result in our decision to cancel the opening of new Shacks, which would adversely affect our business.
Employment Regulations
We are subject to various federal and state laws governing our employment practices, including laws relating to minimum wage requirements, employee classifications as exempt or non-exempt, payroll and unemployment tax laws, requirements to provide meal and rest periods or other benefits, family leave mandates, requirements regarding working conditions and accommodations to certain employees, citizenship and work authorization requirements, insurance and workers' compensation rules, scheduling notification requirements and anti-discrimination laws. Compliance with these regulations is costly and requires significant resources. For example, the Fair Workweek legislation was implemented in New York City, which requires fast food employers to provide employees with specified notice in scheduling changes and pay premiums for changes made to employees' schedules, amongst other requirements. Similar legislation may be enacted in other jurisdictions we operate as well, and in turn, could result in increased costs. Additionally, we may suffer losses from or incur significant costs to defend claims alleging non-compliance.
Although none of our employees are currently covered under collective bargaining agreements, our employees may elect to be represented by labor unions in the future. If a significant number of our employees were to become unionized and collective bargaining agreement terms were significantly different from our current compensation arrangements, it could adversely affect our business, financial condition or results of operations. In addition, a labor dispute involving some or all of our employees may harm our reputation, disrupt our operations and reduce our revenues, and resolution of disputes may increase our costs. Further, if we enter into a new market with unionized construction companies, or the construction companies in our current markets become unionized, construction and build out costs for new Shacks in such markets could materially increase.
The Affordable Care Act
Under the PPACA, we are required to provide affordable coverage, as defined in the PPACA, to substantially all full-time employees, or otherwise be subject to potential excise tax penalties based on the affordability criteria in the PPACA. Additionally, some states and localities have passed state and local laws mandating the provision of certain levels of health benefits by some employers. Increased health care and insurance costs, as well as the potential increase in participation by our employees who previously had
Shake Shack Inc.
Form 10-K
|
37
Form 10-K
|
37
not participated in our medical plan coverage, could have a material adverse effect on our business, financial condition and results of operations.
Americans with Disabilities Act and Similar State Laws
We are subject to the ADA and similar state laws, which, among other things, prohibits discrimination in employment and public accommodations on the basis of disability. Under the ADA, our Shacks are required to meet federally mandated requirements for the disabled and we could be required to incur expenses to modify our Shacks to provide service to, or make reasonable accommodations for the employment of, disabled persons. The expenses associated with these modifications, or any damages, legal fees and costs associated with resolving ADA-related complaints could be material.
Privacy and Cybersecurity
Our business requires the collection, transmission and retention of large volumes of guest and employee data, including credit and debit card numbers and other personally identifiable information, in various information technology systems that we maintain and in those maintained by third parties with whom we contract to provide services. The collection and use of such information is regulated at the federal and state levels, as well as by the European Union (EU), in which regulatory requirements have been increasing. As our environment continues to evolve in this digital age and reliance upon new technologies, for example cloud computing, become more prevalent, it is imperative we secure the private and sensitive information we collect. Failure to do so, whether through fault of our own information systems or those of outsourced third party providers, could not only cause us to fail to comply with these laws and regulations, but also could cause us to face litigation and penalties that could adversely affect our business, financial condition and results of operations. Our brand's reputation and our image as an employer could also be harmed by these types of security breaches or regulatory violations.
Laws and Regulations Relating to Our Licensed Operations
Our licensing operations are subject to laws enacted by a number of states, rules and regulations promulgated by the U.S. Federal Trade Commission and certain rules and requirements regulating licensing activities in foreign countries. Failure to comply with new or existing licensing laws, rules and regulations in any jurisdiction or to obtain required government approvals could negatively affect our licensing sales and our relationships with our licensees.
U.S. Foreign Corrupt Practices Act and Similar Anti-Bribery and Anti-Kickback Laws
A significant portion of our licensed operations are located outside the United States. The U.S. Foreign Corrupt Practices Act, and other similar anti-bribery and anti-kickback laws and regulations, generally prohibit companies and their intermediaries from making improper payments to non-U.S. officials for the purpose of obtaining or retaining business. While our license agreements mandate compliance with applicable law, we cannot assure you that we will be successful in preventing our employees or other agents from taking actions in violation of these laws or regulations. Such violations, or allegations of such violations, could disrupt our business and result in a material adverse effect on our financial condition, results of operations and cash flows.
Changes in effective tax rates or adverse outcomes resulting from examination of our income or other tax returns could adversely affect our results of operations and financial condition.
We are subject to taxes by the U.S. federal, state, local and foreign tax authorities, and our tax liabilities will be affected by the allocation of expenses to differing jurisdictions. Our future effective tax rates could be subject to volatility or adversely affected by a number of factors, including:
|
▪
|
changes in the valuation of our deferred tax assets and liabilities;
|
|
▪
|
expected timing and amount of the release of any tax valuation allowance;
|
|
▪
|
tax effects of stock-based compensation;
|
|
▪
|
changes in tax laws, regulations or interpretations thereof, including the Tax Cuts and Jobs Act that was enacted in December 2017; or
|
|
▪
|
future earnings being lower than anticipated in jurisdictions where we have lower statutory tax rates and higher than anticipated earnings in jurisdictions where we have higher statutory tax rates.
|
38
|
Shake Shack Inc.
Form 10-K
Form 10-K
We may also be subject to audits of our income, sales and other transaction taxes by U.S. federal, state, local and foreign taxing authorities. Outcomes from these audits could have an adverse effect on our operating results and financial condition.
Additionally, SSE Holdings is treated as a partnership for U.S. federal income tax purposes, and the SSE Holdings LLC Agreement restricts transfers of LLC Interests that would cause SSE Holdings to be treated as a "publicly traded partnership" for U.S. federal income tax purposes. If the Internal Revenue Service ("IRS") were to contend successfully that SSE Holdings should be treated as a “publicly traded partnership” for U.S. federal income tax purposes, SSE Holdings would be treated as a corporation for U.S. federal income tax purposes and thus would be subject to entity-level tax on its taxable income, which could have a material adverse effect on our results of operations, financial position and cash flows.
If we fail to maintain effective internal controls over financial reporting, our ability to produce timely and accurate financial information or comply with Section 404 of the Sarbanes-Oxley Act of 2002 could be impaired, which could have a material adverse effect on our business and stock price.
As a public company, we are subject to the reporting requirements of the Securities Exchange Act of 1934, as amended, (the "Exchange Act"), the Sarbanes-Oxley Act of 2002, as amended (the "Sarbanes-Oxley Act"), and the listing standards of the New York Stock Exchange.
The Sarbanes-Oxley Act requires, among other things, that we maintain effective disclosure controls and procedures and internal control over financial reporting. It also requires annual management assessments of the effectiveness of our internal control over financial reporting and disclosure of any material weaknesses in such controls. Additionally, as we are no longer considered an emerging growth company, we are now required to have our independent registered public accounting firm provide an attestation report on the effectiveness of our internal control over financial reporting. In order to maintain and improve the effectiveness of our disclosure controls and procedures and internal control over financial reporting, we have expended, and anticipate that we will continue to expend, significant resources, including accounting-related costs and significant management oversight. We expect that the requirements of these rules and regulations will continue to increase our legal, accounting and financial compliance costs, make some activities more difficult, time consuming and costly, and place significant strain on our personnel, systems and resources.
Any failure to develop or maintain effective controls, or any difficulties encountered in their implementation or improvement, could harm our operating results or cause us to fail to meet our reporting obligations and may result in a restatement of our financial statements for prior periods. Any failure to implement and maintain effective internal control over financial reporting also could adversely affect the results of management evaluations and independent registered public accounting firm audits of our internal control over financial reporting that we are required to include in our periodic reports that will be filed with the SEC. Ineffective disclosure controls and procedures and internal control over financial reporting could also cause investors to lose confidence in our reported financial and other information, which may have a negative effect on the trading price of our Class A common stock. In addition, if we are unable to continue to meet these requirements, we may not be able to remain listed on the New York Stock Exchange.
Shake Shack Inc.
Form 10-K
|
39
Form 10-K
|
39
RISKS RELATED TO OUR ORGANIZATIONAL STRUCTURE
Shake Shack has non-controlling interest holders, whose interests may differ from those of our public stockholders.
As of
December 26, 2018
, the non-controlling interest holders control approximately 39.7% of the combined voting power of our common stock through their ownership of both our Class A and Class B common stock. The non-controlling interest holders, for the foreseeable future, have influence over corporate management and affairs, as well as matters requiring stockholder approval. The non-controlling interest holders are able to, subject to applicable law and the voting arrangements, participate in the election of a majority of the members of our Board of Directors and actions to be taken by us and our Board of Directors, including amendments to our certificate of incorporation and bylaws and approval of significant corporate transactions, including mergers and sales of substantially all of our assets. The directors so elected will have the authority, subject to the terms of our indebtedness and applicable rules and regulations, to issue additional stock, implement stock repurchase programs, declare dividends and make other decisions. It is possible that the interests of the non-controlling interest holders may in some circumstances conflict with our interests and the interests of our other stockholders. For example, the non-controlling interest holders may have different tax positions from us, especially in light of the tax receivable agreement we entered into with the non-controlling interest holders
that provides for the payment by us to the non-controlling interest holders of
85%
of the amount of any tax benefits that we actually realize, or in some cases are deemed to realize (the "Tax Receivable Agreement").
This could influence their decisions regarding whether and when to dispose of assets, whether and when to incur new or refinance existing indebtedness, and whether and when Shake Shack should terminate the Tax Receivable Agreement and accelerate its obligations thereunder. In addition, the determination of future tax reporting positions, the structuring of future transactions and the handling of any future challenges by any taxing authorities to our tax reporting positions may take into consideration these non-controlling interest holders' tax or other considerations, which may differ from the considerations of us or our other stockholders.
In addition, certain of the non-controlling interest holders are in the business of making or advising on investments in companies and may hold, and may from time to time in the future acquire interests in or provide advice to businesses that directly or indirectly compete with certain portions of our business or the business of our suppliers. Our amended and restated certificate of incorporation provides that, to the fullest extent permitted by law, none of the non-controlling interest holders or any director who is not employed by us or his or her affiliates has any duty to refrain from engaging in a corporate opportunity in the same or similar lines of business as us. The non-controlling interest holders may also pursue acquisitions that may be complementary to our business, and, as a result, those acquisition opportunities may not be available to us.
Our organizational structure, including the Tax Receivable Agreement, confers certain benefits upon the non-controlling interest holders that will not benefit Class A common stockholders to the same extent as it will benefit the non-controlling interest holders.
We are a party to the Tax Receivable Agreement with the non-controlling interest holders. Under the Tax Receivable Agreement, we are required to make cash payments to the non-controlling interest holders equal to 85% of the tax benefits, if any, that we actually realize, or in certain circumstances are deemed to realize, as a result of (i) the increases in the tax basis of the net assets of SSE Holdings resulting from any redemptions or exchanges of LLC Interests from the non-controlling interest holders and (ii) certain other tax benefits related to our making payments under the Tax Receivable Agreement.
We expect that the amount of the cash payments that we are required to make under the Tax Receivable Agreement will be significant. Any payments made by us to the non-controlling interest holders under the Tax Receivable Agreement will generally reduce the amount of overall cash flow that might have otherwise been available to us. Furthermore, our future obligation to make payments under the Tax Receivable Agreement could make us a less attractive target for an acquisition, particularly in the case of an acquirer that cannot use some or all of the tax benefits that are the subject of the Tax Receivable Agreement. Payments under the Tax Receivable Agreement are not conditioned on any non-controlling interest holders continued ownership of LLC Interests or our Class A common stock after the IPO.
The actual amount and timing of any payments under the Tax Receivable Agreement, will vary depending upon a number of factors, including the timing of redemptions or exchanges by the holders of LLC Interests, the amount of gain recognized by such holders of LLC Interests, the amount and timing of the taxable income we generate in the future, and the federal tax rates then applicable.
40
|
Shake Shack Inc.
Form 10-K
Form 10-K
The non-controlling interest holders have the right to have their LLC Interests redeemed or exchanged into shares of Class A common stock, which may cause volatility in our stock price.
We have an aggregate of 170,479,167 shares of Class A common stock authorized but unissued, including 7,557,347 shares of Class A common stock issuable upon the redemption or exchange of LLC Interests held by the non-controlling interest holders. Subject to certain restrictions set forth in the SSE Holdings LLC Agreement, the non-controlling interest holders are entitled to have their LLC Interests redeemed or exchanged for shares of our Class A common stock.
We cannot predict the timing or size of any future issuances of our Class A common stock resulting from the redemption or exchange of LLC Interests or the effect, if any, that future issuances and sales of shares of our Class A common stock may have on the market price of our Class A common stock. Sales or distributions of substantial amounts of our Class A common stock, including shares issued in connection with an acquisition, or the perception that such sales or distributions could occur, may cause the market price of our Class A common stock to decline.
We will continue to incur relatively outsized costs as a result of becoming a public company and in the administration of our complex organizational structure.
As a newly public company, we will incur significant legal, accounting, insurance and other expenses that we did not incur as a private company, including costs associated with public company reporting requirements. We have also incurred and will continue to incur costs associated with compliance with the Sarbanes-Oxley Act and related rules implemented by the SEC. The expenses incurred by public companies generally for reporting and corporate governance purposes have been increasing. We expect these rules and regulations to increase our legal and financial compliance costs and to make some activities more time-consuming. These laws and regulations could also make it more difficult or costly for us to obtain certain types of insurance, including director and officer liability insurance, and we may be forced to accept reduced policy limits and coverage or incur substantially higher costs to obtain the same or similar coverage. Furthermore, if we are unable to satisfy our obligations as a public company, we could be subject to delisting of our common stock, fines, sanctions and other regulatory action and potentially civil litigation.
Our organizational structure, including our Tax Receivable Agreement, is very complex and we require the expertise of various tax, legal and accounting advisers to ensure compliance with applicable laws and regulations. We have and will continue to incur significant expenses in connection with the administration of our organizational structure. As a result, our expenses for legal, tax and accounting compliance may be significantly greater than other companies of our size that do not have a similar organizational structure or a tax receivable agreement in place.
Our anti-takeover provisions could prevent or delay a change in control of our Company, even if such change in control would be beneficial to our stockholders.
Provisions of our amended and restated certificate of incorporation and amended and restated bylaws, as well as provisions of Delaware law could discourage, delay or prevent a merger, acquisition or other change in control of our Company, even if such change in control would be beneficial to our stockholders. These provisions include:
|
▪
|
authorizing the issuance of "blank check" preferred stock that could be issued by our Board of Directors to increase the number of outstanding shares and thwart a takeover attempt;
|
|
▪
|
establishing a classified board of directors so that not all members of our Board of Directors are elected at one time;
|
|
▪
|
the removal of directors only for cause;
|
|
▪
|
prohibiting the use of cumulative voting for the election of directors;
|
|
▪
|
limiting the ability of stockholders to call special meetings or amend our bylaws;
|
|
▪
|
requiring all stockholder actions to be taken at a meeting of our stockholders; and
|
|
▪
|
establishing advance notice and duration of ownership requirements for nominations for election to the Board of Directors or for proposing matters that can be acted upon by stockholders at stockholder meetings.
|
These provisions could also discourage proxy contests and make it more difficult for you and other stockholders to elect directors of your choosing and cause us to take other corporate actions you desire. In addition, because our Board of Directors is responsible for appointing the members of our management team, these provisions could in turn affect any attempt by our stockholders to replace current members of our management team.
Shake Shack Inc.
Form 10-K
|
41
Form 10-K
|
41
In addition, the Delaware General Corporation Law (the "DGCL"), to which we are subject, prohibits us, except under specified circumstances, from engaging in any mergers, significant sales of stock or assets or business combinations with any stockholder or group of stockholders who owns at least 15% of our common stock.
The provision of our certificate of incorporation requiring exclusive venue in the Court of Chancery in the State of Delaware for certain types of lawsuits may have the effect of discouraging lawsuits against our directors and officers.
Our amended and restated certificate of incorporation requires, to the fullest extent permitted by law, that (i) any derivative action or proceeding brought on our behalf, (ii) any action asserting a claim of breach of a fiduciary duty owed by any of our directors, officers or other employees to us or our stockholders, (iii) any action asserting a claim against us arising pursuant to any provision of the DGCL or our amended and restated certificate of incorporation or the bylaws or (iv) any action asserting a claim against us governed by the internal affairs doctrine will have to be brought only in the Court of Chancery in the State of Delaware. Although we believe this provision benefits us by providing increased consistency in the application of Delaware law in the types of lawsuits to which it applies, the provision may have the effect of discouraging lawsuits against our directors and officers.
We do not currently expect to pay any cash dividends.
The continued operation and expansion of our business will require substantial funding. Accordingly, we do not currently expect to pay any cash dividends on shares of our Class A common stock. Any determination to pay dividends in the future will be at the discretion of our Board of Directors and will depend upon our results of operations, financial condition, contractual restrictions, restrictions imposed by applicable law and other factors our Board of Directors deems relevant. We are a holding company, and substantially all of our operations are carried out by SSE Holdings and its subsidiaries. Under the Revolving Credit Facility, SSE Holdings is currently restricted from paying cash dividends, and we expect these restrictions to continue in the future. Our ability to pay dividends may also be restricted by the terms of any future credit agreement or any future debt or preferred equity securities of ours or of our subsidiaries. Accordingly, if you purchase shares in this offering, realization of a gain on your investment will depend on the appreciation of the price of our Class A common stock, which may never occur. Investors seeking cash dividends in the foreseeable future should not purchase our Class A common stock.
RISKS RELATED TO OUR TAX RECEIVABLE AGREEMENT
We are a holding company and our principal asset is our interest in SSE Holdings, and, accordingly, we will depend on distributions from SSE Holdings to pay our taxes and expenses, including payments under the Tax Receivable Agreement. SSE Holdings' ability to make such distributions may be subject to various limitations and restrictions.
We are a holding company and have no material assets other than our ownership interest in SSE Holdings and certain deferred tax assets. As such, we will have no independent means of generating revenue or cash flow, and our ability to pay our taxes and operating expenses or declare and pay dividends in the future, if any, will be dependent upon the distributions we receive from SSE Holdings. There can be no assurance that SSE Holdings will generate sufficient cash flow to distribute funds to us or that applicable state law and contractual restrictions, including negative covenants in our debt instruments, will permit such distributions.
SSE Holdings is treated as a partnership for U.S. federal income tax purposes and, as such, will not be subject to any entity-level U.S. federal income tax. Instead, taxable income will be allocated to its members, including us. Accordingly, we will incur income taxes on our allocable share of any net taxable income of SSE Holdings. Under the terms of the SSE Holdings LLC Agreement, SSE Holdings is obligated to make tax distributions to its members, including us. In addition to tax expenses, we will also incur expenses related to our operations, including payments under the Tax Receivable Agreement, which we expect will be significant. We intend, as its managing member, to cause SSE Holdings to make cash distributions to its members in an amount sufficient to (i) fund all or part of their tax obligations in respect of taxable income allocated to them and (ii) cover our operating expenses, including payments under the Tax Receivable Agreement. However, SSE Holdings' ability to make such distributions may be subject to various limitations and restrictions, such as restrictions on distributions that would either violate any contract or agreement to which SSE Holdings is then a party, including debt agreements, or any applicable law, or that would have the effect of rendering SSE Holdings insolvent. If we do not have sufficient funds to pay our tax and other liabilities or to fund our operations, we may have to borrow funds, which could materially adversely affect our liquidity and financial condition and subject us to various restrictions imposed by any such
42
|
Shake Shack Inc.
Form 10-K
Form 10-K
lenders. To the extent that we are unable to make payments under the Tax Receivable Agreement for any reason, such payments generally will be deferred and will accrue interest until paid; provided, however, that nonpayment for a specified period may constitute a material breach of a material obligation under the Tax Receivable Agreement and therefore accelerate payments due under the Tax Receivable Agreement. In addition, if SSE Holdings does not have sufficient funds to make distributions, our ability to declare and pay cash dividends will also be restricted or impaired.
In certain cases, payments under the Tax Receivable Agreement to the non-controlling interest holders may be accelerated or significantly exceed the actual benefits we realize in respect of the tax attributes subject to the Tax Receivable Agreement.
The Tax Receivable Agreement provides that, upon certain mergers, asset sales, other forms of business combinations or other changes of control or if, at any time, we elect an early termination of the Tax Receivable Agreement, our obligations, or our successor's obligations, under the Tax Receivable Agreement to make payments thereunder would be based on certain assumptions, including an assumption that we would have sufficient taxable income to fully utilize all potential future tax benefits that are subject to the Tax Receivable Agreement.
As a result of the foregoing, (i) we could be required to make payments under the Tax Receivable Agreement that are greater than the specified percentage of the actual benefits we ultimately realize in respect of the tax benefits that are subject to the Tax Receivable Agreement and (ii) if we elect to terminate the Tax Receivable Agreement early, we would be required to make an immediate cash payment equal to the present value of the anticipated future tax benefits that are the subject of the Tax Receivable Agreement, which payment may be made significantly in advance of the actual realization, if any, of such future tax benefits. In these situations, our obligations under the Tax Receivable Agreement could have a substantial negative impact on our liquidity and could have the effect of delaying, deferring or preventing certain mergers, asset sales, other forms of business combinations or other changes of control. There can be no assurance that we will be able to fund or finance our obligations under the Tax Receivable Agreement.
We will not be reimbursed for any payments made to the non-controlling interest holders under the Tax Receivable Agreement in the event that any tax benefits are disallowed.
Payments under the Tax Receivable Agreement will be based on the tax reporting positions that we determine, and the IRS or another tax authority may challenge all or part of the tax basis increases, as well as other related tax positions we take, and a court could sustain such challenge. If the outcome of any such challenge would reasonably be expected to materially affect a recipient's payments under the Tax Receivable Agreement, then we will not be permitted to settle or fail to contest such challenge without the consent (not to be unreasonably withheld or delayed) of each non-controlling interest holder that directly or indirectly owns at least 10% of the outstanding LLC Interests. We will not be reimbursed for any cash payments previously made to the non-controlling interest holders under the Tax Receivable Agreement in the event that any tax benefits initially claimed by us and for which payment has been made to non-controlling interest holders are subsequently challenged by a taxing authority and are ultimately disallowed. Instead, any excess cash payments made by us to non-controlling interest holders will be netted against any future cash payments that we might otherwise be required to make to such non-controlling interest holders under the terms of the Tax Receivable Agreement. However, we might not determine that we have effectively made an excess cash payment to a non-controlling interest holder for a number of years following the initial time of such payment and, if any of our tax reporting positions are challenged by a taxing authority, we will not be permitted to reduce any future cash payments under the Tax Receivable Agreement until any such challenge is finally settled or determined. As a result, payments could be made under the Tax Receivable Agreement in excess of the tax savings that we realize in respect of the tax attributes with respect to non-controlling interest holders that are the subject of the Tax Receivable Agreement.
Item 1B. Unresolved Staff Comments.
None.
Shake Shack Inc.
Form 10-K
|
43
Form 10-K
|
43
Item 2. Properties.
Our Home Office is located at 225 Varick Street, Suite 301, New York, NY 10014. We lease our Home Office, which is approximately 19,500 square feet and all of our domestic company-operated Shacks. We do not own any real property, nor do we own or lease any property related to our licensed operations. The following table sets forth the number of company-operated and licensed Shacks by geographic location as of
December 26, 2018
.
|
Company
Operated
|
|
Licensed
|
|
Total
|
|
|||
|
Alabama
|
1
|
|
—
|
|
1
|
|
||
|
Arizona
|
3
|
|
—
|
|
3
|
|
||
|
California
|
11
|
|
1
|
|
12
|
|
||
|
Colorado
|
2
|
|
—
|
|
2
|
|
||
|
Connecticut
|
4
|
|
—
|
|
4
|
|
||
|
Delaware
|
1
|
|
—
|
|
1
|
|
||
|
District of Columbia
|
6
|
|
1
|
|
7
|
|
||
|
Florida
|
10
|
|
—
|
|
10
|
|
||
|
Georgia
|
2
|
|
1
|
|
3
|
|
||
|
Illinois
|
6
|
|
—
|
|
6
|
|
||
|
Kentucky
|
1
|
|
—
|
|
1
|
|
||
|
Maryland
|
4
|
|
1
|
|
5
|
|
||
|
Massachusetts
|
5
|
|
—
|
|
5
|
|
||
|
Michigan
|
2
|
|
—
|
|
2
|
|
||
|
Minnesota
|
2
|
|
—
|
|
2
|
|
||
|
Missouri
|
2
|
|
—
|
|
2
|
|
||
|
North Carolina
|
2
|
|
—
|
|
2
|
|
||
|
Nevada
|
4
|
|
1
|
|
5
|
|
||
|
New Jersey
|
5
|
|
—
|
|
5
|
|
||
|
New York
|
28
|
|
5
|
|
33
|
|
||
|
Ohio
|
1
|
|
—
|
|
1
|
|
||
|
Pennsylvania
|
5
|
|
1
|
|
6
|
|
||
|
Tennessee
|
1
|
|
—
|
|
1
|
|
||
|
Texas
|
11
|
|
1
|
|
12
|
|
||
|
Virginia
|
3
|
|
—
|
|
3
|
|
||
|
Washington
|
1
|
|
—
|
|
1
|
|
||
|
Wisconsin
|
1
|
|
—
|
|
1
|
|
||
|
Domestic
|
124
|
|
12
|
|
136
|
|
||
|
Bahrain
|
—
|
|
2
|
|
2
|
|
||
|
China
|
—
|
|
2
|
|
2
|
|
||
|
Japan
|
—
|
|
10
|
|
10
|
|
||
|
Korea
|
—
|
|
7
|
|
7
|
|
||
|
Kuwait
|
—
|
|
10
|
|
10
|
|
||
|
Oman
|
—
|
|
1
|
|
1
|
|
||
|
Qatar
|
—
|
|
4
|
|
4
|
|
||
|
Russia
|
—
|
|
3
|
|
3
|
|
||
44
|
Shake Shack Inc.
Form 10-K
Form 10-K
|
Saudi Arabia
|
—
|
|
9
|
|
9
|
|
||
|
Turkey
|
—
|
|
3
|
|
3
|
|
||
|
United Arab Emirates
|
—
|
|
12
|
|
12
|
|
||
|
United Kingdom
|
—
|
|
9
|
|
9
|
|
||
|
INTERNATIONAL
|
—
|
|
72
|
|
72
|
|
||
|
SYSTEM-WIDE
|
124
|
|
|
84
|
|
208
|
|
|
Shake Shack Inc.
Form 10-K
|
45
Form 10-K
|
45
Item 3. Legal Proceedings
We are subject to various legal proceedings, claims and liabilities, such as employment-related claims and slip and fall cases, which arise in the ordinary course of business and are generally covered by insurance. As of
December 26, 2018
, we do not expect the amount of ultimate liability with respect to these matters to be material to the company's financial condition, results of operations or cash flows.
46
|
Shake Shack Inc.
Form 10-K
Form 10-K
Item 4. Mine Safety Disclosures.
Not applicable.
Shake Shack Inc.
Form 10-K
|
47
Form 10-K
|
47
Part II
Item 5. Market for Registrant's Common Equity, Related Stockholder Matters and Issuer Purchases of Equity Securities.
MARKET INFORMATION
Our Class A common stock is traded on the New York Stock Exchange under the symbol "SHAK."
Our Class B common stock is not listed nor traded on any stock exchange.
HOLDERS OF RECORD
As of February 13, 2019, there were 72 shareholders of record of our Class A common stock. The number of record holders does not include persons who held shares of our Class A common stock in nominee or "street name" accounts through brokers. As of February 13, 2019, there were 34 shareholders of record of our Class B common stock.
DIVIDEND POLICY
We currently intend to retain all available funds and any future earnings for use in the operation of our business, and therefore we do not currently expect to pay any cash dividends on our Class A common stock. Holders of our Class B common stock are not entitled to participate in any dividends declared by our Board of Directors. Any future determination to pay dividends to holders of our Class A common stock will be at the discretion of our Board of Directors and will depend upon many factors, including our results of operations, financial condition, capital requirements, restrictions in SSE Holdings' debt agreements and other factors that our Board of Directors deems relevant. We are a holding company, and substantially all of our operations are carried out by SSE Holdings and its subsidiaries. Additionally, under the Revolving Credit Facility, SSE Holdings is currently restricted from paying cash dividends, and we expect these restrictions to continue in the future, which may in turn limit our ability to pay dividends on our Class A common stock.
48
|
Shake Shack Inc.
Form 10-K
Form 10-K
SECURITIES AUTHORIZED FOR ISSUANCE UNDER EQUITY INCENTIVE PLANS
The following table provides information about our compensation plans under which our Class A common stock is authorized for issuance, as of
December 26, 2018
:
|
Plan Category
|
Number of securities to be issued upon exercise of outstanding options, warrants and rights
|
|
Weighted-average exercise price of outstanding options, warrants and rights
|
|
Number of securities remaining available for future issuances under equity compensation plans
(2)
|
|
||||
|
Equity compensation plans approved by security holders
(1)
|
1,360,983
|
|
$
|
21.25
|
|
3,476,319
|
|
|||
|
(1)
|
Includes awards granted and available to be granted under our 2015 Incentive Award Plan.
|
|
(2)
|
This amount represents shares of common stock available for issuance under the 2015 Incentive Award Plan, which include stock options, performance stock units and restricted stock units.
|
Shake Shack Inc.
Form 10-K
|
49
Form 10-K
|
49
STOCK PERFORMANCE GRAPH
The following graph and table illustrate the total return from January 30, 2015 through
December 26, 2018
for (i) our Class A common stock, (ii) the Standard and Poor's 500 Index, and (iii) the Standard and Poor’s 600 Restaurants Index, assuming an investment of $100 on January 30, 2015 including the reinvestment of dividends.
Comparison of 47 Month Cumulative Total Return
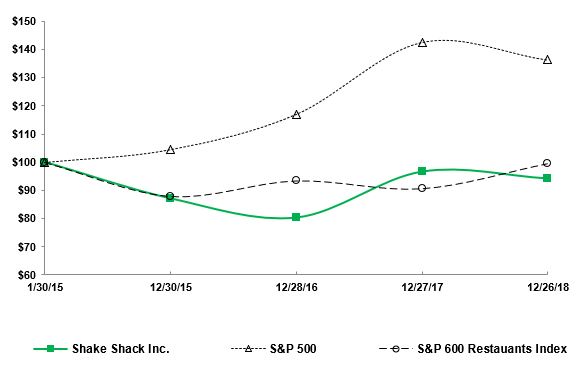
|
1/30/2015
|
|
12/30/2015
|
|
12/28/2016
|
|
12/27/2017
|
|
12/26/2018
|
|
||||||||||
|
Shake Shack Inc.
|
$
|
100.00
|
|
$
|
87.06
|
|
$
|
80.24
|
|
$
|
96.60
|
|
$
|
94.14
|
|
||||
|
S&P 500 Index
|
100.00
|
|
104.52
|
|
117.02
|
|
142.57
|
|
136.32
|
|
|||||||||
|
S&P 600 Restaurants Index
|
100.00
|
|
87.80
|
|
93.36
|
|
90.55
|
|
99.55
|
|
|||||||||
50
|
Shake Shack Inc.
Form 10-K
Form 10-K
Item 6. Selected Financial Data.
The selected financial and operating data set forth below was derived from our audited consolidated financial statements and should be read in conjunction with Item 1A, "Risk Factors," Item 7, "Management's Discussion and Analysis of Financial Condition and Results of Operations" and our audited consolidated financial statements included in Item 8, "Financial Statements and Supplementary Data."
|
(dollar amounts in thousands, except per share amounts)
|
2018
|
|
2017
|
|
2016
|
|
2015
|
|
2014
(1)
|
|
|||||||||||
|
Selected statement of income data:
|
|||||||||||||||||||||
|
Shack sales
|
$
|
445,589
|
|
$
|
346,388
|
|
$
|
259,350
|
|
$
|
183,219
|
|
$
|
112,042
|
|
||||||
|
Licensing revenue
(2)
|
13,721
|
|
12,422
|
|
9,125
|
|
7,373
|
|
6,488
|
|
|||||||||||
|
Shack-level operating expenses
|
332,683
|
|
254,079
|
|
186,058
|
|
130,345
|
|
85,181
|
|
|||||||||||
|
General and administrative expenses
|
52,720
|
|
39,003
|
|
30,556
|
|
37,825
|
|
18,187
|
|
|||||||||||
|
Pre-opening costs
|
12,279
|
|
9,603
|
|
9,520
|
|
5,430
|
|
6,105
|
|
|||||||||||
|
Operating income
|
31,711
|
|
33,813
|
|
27,805
|
|
6,753
|
|
3,143
|
|
|||||||||||
|
Net income
|
21,948
|
|
8,884
|
|
22,146
|
|
3,124
|
|
2,118
|
|
|||||||||||
|
Net income (loss) attributable to Shake Shack Inc.
|
15,179
|
|
(320
|
)
|
12,446
|
|
(8,776
|
)
|
2,118
|
|
|||||||||||
|
Per share data:
|
|||||||||||||||||||||
|
Earnings (loss) per share—basic
|
$
|
0.54
|
|
$
|
(0.01
|
)
|
$
|
0.54
|
|
$
|
(0.65
|
)
|
$
|
0.07
|
|
||||||
|
Earnings (loss) per share—diluted
|
$
|
0.52
|
|
$
|
(0.01
|
)
|
$
|
0.53
|
|
$
|
(0.65
|
)
|
$
|
0.07
|
|
||||||
|
Selected balance sheet data (at period end):
|
|||||||||||||||||||||
|
Cash and cash equivalents
|
$
|
24,750
|
|
$
|
21,507
|
|
$
|
11,607
|
|
$
|
70,849
|
|
$
|
2,677
|
|
||||||
|
Short-term marketable securities
|
62,113
|
|
63,036
|
|
62,040
|
|
275
|
|
—
|
|
|||||||||||
|
Total current assets
|
101,119
|
|
93,199
|
|
83,944
|
|
78,934
|
|
7,925
|
|
|||||||||||
|
Total assets
|
610,532
|
|
470,606
|
|
538,194
|
|
379,547
|
|
82,962
|
|
|||||||||||
|
Total current liabilities
|
59,948
|
|
34,024
|
|
31,716
|
|
24,005
|
|
48,177
|
|
|||||||||||
|
Total debt
|
20,846
|
|
14,518
|
|
2,007
|
|
313
|
|
32,313
|
|
|||||||||||
|
Total liabilities
|
337,077
|
|
246,127
|
|
336,841
|
|
222,528
|
|
70,362
|
|
|||||||||||
|
Total equity
|
273,455
|
|
224,479
|
|
201,353
|
|
157,019
|
|
12,600
|
|
|||||||||||
|
Selected cash flow data:
|
|||||||||||||||||||||
|
Net cash provided by operating activities
|
$
|
85,395
|
|
$
|
70,878
|
|
$
|
54,285
|
|
$
|
41,258
|
|
$
|
13,584
|
|
||||||
|
Net cash used in investing activities
|
(86,604
|
)
|
(61,943
|
)
|
(114,761
|
)
|
(34,514
|
)
|
(28,515
|
)
|
|||||||||||
|
Net cash provided by financing activities
|
4,452
|
|
965
|
|
1,234
|
|
61,428
|
|
4,532
|
|
|||||||||||
Shake Shack Inc.
Form 10-K
|
51
Form 10-K
|
51
|
(dollar amounts in thousands)
|
2018
|
|
2017
|
|
2016
|
|
2015
|
|
2014
(1)
|
|
|||||||||||
|
Selected operating data:
|
|||||||||||||||||||||
|
System-wide sales
(3)
|
$
|
671,926
|
|
$
|
532,137
|
|
$
|
402,791
|
|
$
|
295,257
|
|
$
|
217,442
|
|
||||||
|
Same-Shack sales growth
(4)
|
1.0
|
%
|
(1.2
|
)%
|
4.2
|
%
|
13.3
|
%
|
4.1
|
%
|
|||||||||||
|
Shacks in the comparable base
|
61
|
|
43
|
|
29
|
|
21
|
|
13
|
|
|||||||||||
|
Average weekly sales
(5)
:
|
|
|
|
|
|||||||||||||||||
|
Domestic company-operated
|
$
|
84
|
|
$
|
88
|
|
$
|
96
|
|
$
|
96
|
|
$
|
89
|
|
||||||
|
Average unit volumes
(6)
:
|
|
|
|
|
|||||||||||||||||
|
Domestic company-operated
|
$
|
4,390
|
|
$
|
4,598
|
|
$
|
4,981
|
|
$
|
4,976
|
|
$
|
4,611
|
|
||||||
|
International licensed
|
$
|
3,047
|
|
$
|
3,176
|
|
$
|
3,334
|
|
$
|
3,413
|
|
$
|
4,588
|
|
||||||
|
Shack-level operating profit
(7)
|
$
|
112,906
|
|
$
|
92,309
|
|
$
|
73,292
|
|
$
|
52,874
|
|
$
|
26,861
|
|
||||||
|
Shack-level operating profit margin
(7)
|
25.3
|
%
|
26.6
|
%
|
28.3
|
%
|
28.9
|
%
|
24.0
|
%
|
|||||||||||
|
Adjusted EBITDA
(8)
|
$
|
73,850
|
|
$
|
64,664
|
|
$
|
50,234
|
|
$
|
37,011
|
|
$
|
14,862
|
|
||||||
|
Adjusted EBITDA margin
(8)
|
16.1
|
%
|
18.0
|
%
|
18.7
|
%
|
19.4
|
%
|
12.5
|
%
|
|||||||||||
|
Shack counts (at end of period):
|
|
|
|
|
|||||||||||||||||
|
System-wide
|
208
|
|
159
|
|
114
|
|
84
|
|
63
|
|
|||||||||||
|
Domestic company-operated
|
124
|
|
90
|
|
64
|
|
44
|
|
31
|
|
|||||||||||
|
Domestic licensed
|
12
|
|
10
|
|
7
|
|
5
|
|
5
|
|
|||||||||||
|
International licensed
|
72
|
|
59
|
|
43
|
|
35
|
|
27
|
|
|||||||||||
|
(1)
|
We operate on a 52/53 week fiscal year that ends on the last Wednesday of the calendar year. Fiscal 2018, 2017, 2016, and 2015 each contained 52 weeks. Fiscal 2014 was a 53-week year with the extra operating week (the "53rd week") falling in our fiscal fourth quarter.
|
|
(2)
|
On December 28, 2017 we adopted ASU 2014-09, Revenue from Contracts with Customers (Topic 606). Results for reporting periods beginning on or after December 28, 2017 are presented under Accounting Standards Codification Topic 606 ("ASC 606"). Prior period amounts were not revised and continue to be reported in accordance with ASC Topic 605 ("ASC 605"), the accounting standard then in effect. See Note 3 to the consolidated financial statements for more information.
|
|
(3)
|
System-wide sales consists of sales from our domestic company-operated Shacks, our domestic licensed Shacks and our international licensed Shacks. We do not recognize the sales from our licensed Shacks as revenue. Of these amounts, our revenue is limited to Shack sales from domestic company-operated Shacks and licensing revenue based on a percentage of sales from domestic and international licensed Shacks, as well as certain up-front fees such as territory fees and opening fees.
|
|
(4)
|
Same-Shack sales growth reflects the change in year-over-year Shack sales for domestic company-operated Shacks open for 24 full fiscal months or longer. Same-Shack sales growth for fiscal 2014 excludes sales from the 53rd week.
|
|
(5)
|
Average weekly sales is calculated by dividing total Shack sales by the number of operating weeks for all Shacks in operation during the period. For Shacks that are not open for the entire period, fractional adjustments are made to the number of operating weeks used in the denominator such that it corresponds to the period of associated sales.
|
|
(6)
|
Average unit volumes ("AUVs") are calculated by dividing total Shack sales by the number of Shacks open during the period. For Shacks that are not open for the entire period, fractional adjustments are made to the number of Shacks used in the denominator such that it corresponds to the period of associated sales.
|
|
(7)
|
See "Non-GAAP Measures—Shack-Level Operating Profit" on page 65 for additional information and a reconciliation to the most directly comparable GAAP financial measure.
|
|
(8)
|
See "Non-GAAP Measures—EBITDA and Adjusted EBITDA" on page 66 for additional information and a reconciliation to the most directly comparable GAAP financial measure.
|
52
|
Shake Shack Inc.
Form 10-K
Form 10-K
Item 7. Management's Discussion and Analysis of Financial Condition and Results of Operations.
This section and other parts of this Annual Report on Form 10-K (“Form 10-K”) contain forward-looking statements, within the meaning of the Private Securities Litigation Reform Act of 1995 ("PSLRA"), which are subject to known and unknown risks, uncertainties and other important factors that may cause actual results to be materially different. Forward-looking statements provide current expectations of future events based on certain assumptions and include any statement that does not directly relate to any historical or current fact. Forward-looking statements can also be identified by words such as "aim," "anticipate," "believe," "estimate," "expect," "forecast," "future," "intend," "outlook," "plan," "potential," "predict," "project," "seek," "may," "can," "will," "would," "could," "should," the negatives thereof and other similar expressions. Forward-looking statements are not guarantees of future performance and actual results may differ significantly from the results discussed in the forward-looking statements. All forward-looking statements are expressly qualified in their entirety by these cautionary statements. Factors that might cause such differences include, but are not limited to, those discussed in Part I, Item 1A of this Form 10-K under the heading “Risk Factors,” which are incorporated herein by reference. The following discussion should be read in conjunction with the consolidated financial statements and notes thereto included in Part II, Item 8 of this Form 10-K. All information presented herein is based on our fiscal calendar. Unless otherwise stated, references to particular years, quarters, months or periods refer to our fiscal years and the associated quarters, months and periods of those fiscal years. We undertake no obligation to revise or update any forward-looking statements for any reason, except as required by law.
OVERVIEW
Shake Shack is a modern day "roadside" burger stand serving a classic American menu of premium burgers, hot dogs, crispy chicken, crinkle cut fries, shakes, frozen custard, beer and wine. Our fine dining heritage and commitment to community building, hospitality and the sourcing of premium ingredients is what we call "fine casual."
Fine casual
couples the ease, value and convenience of fast casual concepts with the high standards of excellence grounded in our fine dining heritage—thoughtful ingredient sourcing and preparation, hospitality and quality.
Our mission is to
Stand For Something Good
in all aspects of our business, including the exceptional team we hire and train, the premium ingredients making up our menu, our community engagement and the design of our Shacks.
Stand For Something Good
is a call to action for all of our stakeholders—our team, guests, communities, suppliers and investors—and we actively invite them all to share in this philosophy with us. This commitment drives our integration into the local communities in which we operate and fosters a deep and lasting connection with our guests.
FISCAL 2018 HIGHLIGHTS
Fiscal
2018
was a strong year for Shake Shack with a record-breaking number of domestic openings, expansion into new markets, new licensing partnerships and continued digital innovation to meet our guests' needs. We surpassed our targeted growth plan and opened
34
domestic company-operated Shacks and we
entered into five new states, comprised of Alabama, North Carolina, Ohio, Tennessee and Washington, as well as deepened our roots in our current markets across the country
. Internationally, we expanded our footprint by opening
13
net new licensed Shacks, opening our first two Shacks in Hong Kong and signing three new partnerships to expand into Singapore, the Philippines and Mexico. Additionally, we opened
two
domestic licensed Shacks, further supporting our growth in airports with openings at the Atlanta-Hartsfield Airport and LaGuardia Airport.
Fiscal
2018
also marked a year of continued menu innovation, not only for new events and promotions, chef collaborations and our dynamic limited time offering ("LTO"), but also with the launch of our Innovation Kitchen. Our Innovation Kitchen opened in September 2018 and is located on the lower level of our West Village Shack and connected to our Home Office. It is a state-of-the-art space dedicated to menu development at Shake Shack, which allows our culinary team to get even more creative, dig deeper into our fine dining roots, collaborate with other chefs and explore new opportunities as we continue to scale. For our LTOs this year, we rolled
Shake Shack Inc.
Form 10-K
|
53
Form 10-K
|
53
out our Smoked Cheddar BBQ lineup, which featured variations in the burger, chicken and fries menu categories. We also offered two more chicken options, including the Griddled Chick'n Club and Hot Chick'n, back by popular demand with enhancements. In addition to our LTOs, we exclusively offered two completely new menu items, Chick'n Bites and the Veggie Shacks, which were available at select locations in fiscal 2018.
We have made great strides in expanding our digital ecosystem by introducing more ways for guests to get their Shake Shack whenever and wherever they want it, including via the mobile-ordering app, kiosk-ordering at select Shacks and web-ordering directly from their device. Knowing that consumers demand faster, easier and more personalized experiences, we used guest data to develop a number of enhancements that optimize the path to purchase with our app redesign. These enhancements were around improving the checkout experience, saving guest order history for easier future purchases, personalization via messaging and location services. We also launched web ordering in fiscal 2018, providing a
channel similar in feel to our kiosks and mobile application. With higher category limits (versus the app) and the ability to check out as a guest, web ordering offers yet another convenient ordering opportunity to our guests. Additionally, we further expanded our kiosks, which are now in 16 Shacks across the country. We also continued to conduct various delivery pilots with several partners throughout the year and offered special delivery promotions.
We also achieved notable milestones in fiscal 2018 in our
mission to Stand For Something Good.
We received an "A" grading from the NRDC this year in their
Chain Reaction Report
for sourcing beef raised without any antibiotics, being one of only two burger chains to have done so. We elevated our mission to Stand For Something Good even further by our commitment to eliminate the use of plastic straws and high fructose corn syrup in our foods by 2019, as well as building our relationships with local suppliers and ranchers throughout the country.
Our fiscal 2018 results demonstrate the success of our various growth strategies. Our brand power and thoughtful approach to growth have resulted in strong Shack performance across a variety of geographic areas and formats. Some financial highlights for fiscal 2018 include:
|
•
|
Total revenue
increase
d
28.0%
to
$459.3 million
.
|
|
•
|
Shack sales
increase
d
28.6%
to
$445.6 million
.
|
|
•
|
Same-Shack sales increased
1.0%
.
|
|
•
|
Shack system-wide sales increased
26.3%
to
$671.9 million
|
|
•
|
Operating income was
$31.7 million
, or
6.9%
of total revenue, which included the impact of costs associated with Project Concrete and other one-time items totaling
$3.9 million
.
|
|
•
|
Shack-level operating profit*, a non-GAAP measure,
increase
d
22.3%
to
$112.9 million
, or
25.3%
of Shack sales.
|
|
•
|
Net income was
$21.9 million
and net income attributable to Shake Shack Inc. was
$15.2 million
, or
$0.52
per diluted share.
|
|
•
|
Adjusted EBITDA*, a non-GAAP measure,
increase
d
14.2%
to
$73.9 million
.
|
|
•
|
Adjusted pro forma net
income
*, a non-GAAP measure,
increase
d
28.0%
to
$26.9 million
, or
$0.71
per fully exchanged and diluted share.
|
|
•
|
49
net system-wide Shack openings, including
34
domestic company-operated Shacks and
15
net licensed Shacks, representing a
30.8%
net increase in system-wide Shack count.
|
* Shack-level operating profit, adjusted EBITDA and adjusted pro forma net income are non-GAAP measures.
Reconciliations of Shack-level operating profit to operating income, adjusted EBITDA to net
income (loss)
attributable to Shake Shack Inc., and adjusted pro forma net income to net
income (loss)
attributable to Shake Shack Inc., the most directly comparable financial measures presented in accordance with GAAP, are set forth on pages
65–69.
TRENDS IN OUR BUSINESS
In fiscal 2018 we continued to focus on driving long-term value creation—building the community gathering places our guests love (both in the Shack and digitally), expanding upon our digital platforms, while innovating around our core menu, and further strengthening the unique culture that differentiates and drives our company forward.
We plan to continue to expand our business, drive Shack sales and enhance our competitive positioning by executing on the following strategies: (i) opening new domestic
54
|
Shake Shack Inc.
Form 10-K
Form 10-K
company-operated Shacks; (ii) capitalizing on our outsized brand awareness; (iii) innovating our digital products and capabilities; and (iv) thoughtfully increasing our licensed Shacks domestically and abroad.
Our primary means of growth continues to be opening new domestic company-operated Shacks, increasing our footprint in our existing markets as well as continuing to expand into new ones. We continue to broaden our Shack formats to suit our new and existing markets, such formats include urban, free-standing pad, stadiums, airports, shopping centers, events, food courts and, new to fiscal 2019, food trucks. Our development strategy focuses on further penetration of existing markets, complemented by launches in some new markets, including Salt Lake City and New Orleans.
As we continue to grow, especially outside of New York City and other urban markets, we expect our company-wide average unit volume ("AUV") for all domestic company-operated Shacks to continue to decline over time as Shacks of various unit volumes are introduced into the system. Our historical AUVs have been higher, due in large part to our concentration in New York City and urban markets, and as such, historical domestic company-operated AUVs are not a good measure of expected sales at new Shacks. For fiscal 2019, we expect domestic company-operated AUV to be between
$4.0 to $4.1 million
.
Our licensing business has become a greater focus and fiscal 2019 will be a pivotal year for us internationally. A meaningful part of our international business strategy is focused in Asia, with continued growth in Japan and South Korea, Hong Kong and our first Shack in mainland China in Shanghai, which opened at the beginning of fiscal 2019. With our new licensing agreements in place, both of which are to commence in fiscal 2019, we plan to open 15 Shacks in the Philippines through 2026 and 10 Shacks in Singapore through 2023. To further support our expansion into China, we will be investing in our first international regional office in Hong Kong to support the brand and day-to-day operations. In fiscal 2019, we also will open our first Shack in Mexico, with a plan to open 30 Shacks through 2028. In addition to our international licensing initiatives, we also remain focused on growing our domestic licensed operations, especially in our presence at airport locations around the country, adding Dallas, Denver and Phoenix in fiscal 2019. Our domestic licensed expansion model complements our domestic company operated model by allowing for an optimum allocation of resources. For further details around financial information about geographic areas, see Note 20 to the consolidated financial statements included in Part II, Item 8.
We continue to pursue innovation in technology and raise the bar on operational excellence and overall guest experience. Through our digital innovation, we strive to build deeper levels of engagement with our guests by listening and learning about their needs, which drove many of the app redesign enhancements we made in fiscal 2018, which included personalized content and updated visual design. We have introduced new ways for our guests to get their Shack, whether it is at the Shack, through the mobile-ordering app, kiosk-ordering or web-ordering. We make it our mission to deliver an amazing guest experience in the most convenient way.
Given our expected growth of between 36 to 40 Shacks to open in fiscal 2019, and digital expansion over the past year, we recognize that it is essential for our infrastructure and support systems to be sufficiently robust and scalable to deliver upon our future growth opportunities. As such, we have been making key investments in our core financial and operational systems this year and going into fiscal 2019 through our enterprise-wide system upgrade initiative called "Project Concrete." The primary goals of Project Concrete are: (i) streamlining and automating business processes within the aforementioned areas to establish a scalable foundation for robust growth; (ii) standardizing and centralizing business processes; and (iii) implementing new software applications to enable the centralized business process in a controlled and efficient way. Project Concrete will also replace our current back of the house systems and reduce the
administrative tasks in the Shacks as we continue to invest in our tools across the company.
We will continue to embrace our fine-dining heritage and, although our core menu remains focused, we plan to continue supplementing it with LTOs and our new Innovation Kitchen will be a perfect place to do so. Our Chick'n Bites will be a new menu category for us in the upcoming year, originally test launched in 2018 and rolled out nationwide in February 2019. We also will be making a move from offering a trio of featured shakes to a new shake of the month, kicking the year off with the Tiramisu shake.
While we believe there are significant opportunities ahead of us, we also face many challenges, along with our industry, particularly around labor and related expenses, food and paper costs and the new leasing accounting standard.
|
•
|
We expect the high labor cost trends to continue into fiscal 2019, as we have seen for the last couple of years. We believe that rising minimum wage legislation will continue to affect the restaurant industry, with significant mandatory increases in both minimum wages and salaries in many of our key markets, higher wages overall as a result of a competitive and
|
Shake Shack Inc.
Form 10-K
|
55
Form 10-K
|
55
low unemployment labor market, as well as increased regulatory pressures such as the Fair Work Week legislation in New York City. Several states in which we operate have enacted minimum wage increases and it is possible that other states or the federal government could also enact minimum wage increases. Our primary challenge for fiscal 2019 and the next few years will be preserving our margins in the face of these rising labor costs. As more minimum wage increases are enacted, we may be required to implement additional pay increases or offer additional benefits in the future in order to attract and retain the most qualified people, which we expect to put further pressure on our operating margins. In addition to recruiting the most qualified people, we are committed to retaining them and will continue to evolve training, compensation and benefits to do so, such as extending our equity-based compensation program to general managers.
|
•
|
Additionally, in regards to food and paper costs, we expect increased usage and cost of paper and packaging as our digital sales continue to represent a higher proportion of our business, as well as broader inflation in transport and distribution costs.
|
|
•
|
And lastly, in regards to
the adoption of
ASC 842 Leases
in fiscal 2019, we expect to see an impact relating to leases that were classified as operating leases under previous GAAP will be recognized as lease assets and liabilities. See “—Critical Accounting Policies and Estimates” and Note 2 to the consolidated financial statements for more information.
|
While we expect our operating profit to increase in absolute terms, we expect our Shack-level operating profit margins to decline due to the aforementioned items, coupled with the introduction of more Shacks of various unit volumes.
With
208
Shacks system-wide as of
December 26, 2018
, we remain excited for the new opportunities ahead of us, both domestically and abroad. Despite the challenges we face, we believe that we are positioned well for future growth.
56
|
Shake Shack Inc.
Form 10-K
Form 10-K
FISCAL 2019 GUIDANCE
For the fiscal year ending
December 25, 2019
, we are providing the following preliminary financial outlook:
|
Current Outlook
|
|
|
Total revenue (inclusive of licensing revenue)
|
$570 million to $576 million
|
|
Licensing revenue
|
$15 million to $16 million
|
|
Same-Shack sales growth (%)
(1)
|
0% to 1% increase
|
|
Domestic company-operated Shack openings
|
36 to 40
|
|
Licensed Shack openings, net
|
16 to 18
|
|
Average annual sales volume for domestic company-operated Shacks
|
$4.0 to $4.1 million
|
|
Shack-level operating profit margin (%)
(2)
|
23.0% to 24.0%
|
|
Total general and administrative expenses
|
$66.4 million to $68.2 million
|
|
Core general and administrative expenses
|
$56 million to $57 million
|
|
Equity-based compensation
|
$7.4 million to $7.7 million
|
|
One-time costs related to Project Concrete
|
$3.0 million to $3.5 million
|
|
Project Concrete capital spend
|
approximately $4 million
|
|
Depreciation expense
|
$41 million to $42 million
|
|
Pre-opening costs
|
$13 million to $14 million
|
|
Interest expense
|
$0.3 million to $0.4 million
|
|
Adjusted pro forma effective tax rate (%)
|
26.5% to 27.5%
|
|
(1)
|
Includes approximately 1.5% of menu price increases taken in December 2018.
|
|
(2)
|
Includes approximately 50 bps of impact from the adoption of the new lease accounting standard.
|
FISCAL 2020 TARGETS
Beginning in February 2018, we provided 2020 targets around total revenue and system-wide Shack openings. We continue to target the following:
|
Target
|
|
|
Total revenue (inclusive of licensing revenue)
|
Over $700 million
|
|
Domestic company-operated Shack openings
|
At least 200
|
|
Licensed Shack openings, net
|
At least 120
|
Shake Shack Inc.
Form 10-K
|
57
Form 10-K
|
57
RESULTS OF OPERATIONS
The following table summarizes our results of operations for fiscal
2018
,
2017
and
2016
:
|
(dollar amounts in thousands)
|
2018
|
2017
|
2016
|
||||||||||||||||
|
Shack sales
|
$
|
445,589
|
|
97.0
|
%
|
$
|
346,388
|
|
96.5
|
%
|
$
|
259,350
|
|
96.6
|
%
|
||||
|
Licensing revenue
|
13,721
|
|
3.0
|
%
|
12,422
|
|
3.5
|
%
|
9,125
|
|
3.4
|
%
|
|||||||
|
TOTAL REVENUE
|
459,310
|
|
100.0
|
%
|
358,810
|
|
100.0
|
%
|
268,475
|
|
100.0
|
%
|
|||||||
|
Shack-level operating expenses
(1)
:
|
|||||||||||||||||||
|
Food and paper costs
|
126,096
|
|
28.3
|
%
|
98,337
|
|
28.4
|
%
|
73,752
|
|
28.4
|
%
|
|||||||
|
Labor and related expenses
|
122,094
|
|
27.4
|
%
|
91,740
|
|
26.5
|
%
|
65,540
|
|
25.3
|
%
|
|||||||
|
Other operating expenses
|
51,783
|
|
11.6
|
%
|
35,805
|
|
10.3
|
%
|
24,946
|
|
9.6
|
%
|
|||||||
|
Occupancy and related expenses
|
32,710
|
|
7.3
|
%
|
28,197
|
|
8.1
|
%
|
21,820
|
|
8.4
|
%
|
|||||||
|
General and administrative expenses
|
52,720
|
|
11.5
|
%
|
39,003
|
|
10.9
|
%
|
30,556
|
|
11.4
|
%
|
|||||||
|
Depreciation expense
|
29,000
|
|
6.3
|
%
|
21,704
|
|
6.0
|
%
|
14,502
|
|
5.4
|
%
|
|||||||
|
Pre-opening costs
|
12,279
|
|
2.7
|
%
|
9,603
|
|
2.7
|
%
|
9,520
|
|
3.5
|
%
|
|||||||
|
Loss on disposal of property and equipment
|
917
|
|
0.2
|
%
|
608
|
|
0.2
|
%
|
34
|
|
—
|
%
|
|||||||
|
TOTAL EXPENSES
|
427,599
|
|
93.1
|
%
|
324,997
|
|
90.6
|
%
|
240,670
|
|
89.6
|
%
|
|||||||
|
OPERATING INCOME
|
31,711
|
|
6.9
|
%
|
33,813
|
|
9.4
|
%
|
27,805
|
|
10.4
|
%
|
|||||||
|
Other income, net
|
1,514
|
|
0.3
|
%
|
128,123
|
|
35.7
|
%
|
1,065
|
|
0.4
|
%
|
|||||||
|
Interest expense
|
(2,415
|
)
|
(0.5
|
)%
|
(1,643
|
)
|
(0.5
|
)%
|
(374
|
)
|
(0.1
|
)%
|
|||||||
|
INCOME BEFORE INCOME TAXES
|
30,810
|
|
6.7
|
%
|
160,293
|
|
44.7
|
%
|
28,496
|
|
10.6
|
%
|
|||||||
|
Income tax expense
|
8,862
|
|
1.9
|
%
|
151,409
|
|
42.2
|
%
|
6,350
|
|
2.4
|
%
|
|||||||
|
NET INCOME
|
21,948
|
|
4.8
|
%
|
8,884
|
|
2.5
|
%
|
22,146
|
|
8.2
|
%
|
|||||||
|
Less: net income attributable to non-controlling interests
|
6,769
|
|
1.5
|
%
|
9,204
|
|
2.6
|
%
|
9,700
|
|
3.6
|
%
|
|||||||
|
NET INCOME (LOSS) ATTRIBUTABLE TO SHAKE SHACK INC.
|
$
|
15,179
|
|
3.3
|
%
|
$
|
(320
|
)
|
(0.1
|
)%
|
$
|
12,446
|
|
4.6
|
%
|
||||
(1)
As a percentage of Shack sales.
Shake Shack Inc.
Form 10-K
|
58
Form 10-K
|
58
Shack Sales
Shack sales represent the aggregate sales of food, beverages and Shake Shack branded merchandise at our domestic company-operated Shacks. Shack sales in any period are directly influenced by the number of operating weeks in such period, the number of open Shacks and same-Shack sales. Same-Shack sales means, for any reporting period, sales for the comparable Shack base, which we define as the number of domestic company-operated Shacks open for 24 full fiscal months or longer. Effective December 29th, 2016, we changed our methodology for calculating same-Shack sales whereby Shacks enter the comparable base at the beginning of their 25th full fiscal month, whereas previously they entered at the beginning of their 105th full fiscal week. Prior period amounts have been restated to conform to the current period methodology.
|
(dollar amounts in thousands)
|
2018
|
|
2017
|
|
2016
|
|
|||||||
|
Shack sales
|
$
|
445,589
|
|
$
|
346,388
|
|
$
|
259,350
|
|
||||
|
Percentage of total revenue
|
97.0
|
%
|
96.5
|
%
|
96.6
|
%
|
|||||||
|
Dollar change compared to prior year
|
$
|
99,201
|
|
$
|
87,038
|
|
|||||||
|
Percentage change compared to prior year
|
28.6
|
%
|
33.6
|
%
|
|||||||||
The increase in Shack sales for fiscal
2018
is primarily driven by the opening of
34
new domestic company-operated Shacks and a same-Shack sales increase of
1.0%
, which was approximately
$2.5 million
of the total increase in Shack sales. The same-Shack sales increase was primarily driven by a combined increase of
3.7%
in price and sales mix partially offset by decreased guest traffic of
2.7%
. For purposes of calculating same-Shack sales growth, Shack sales for
61
Shacks were included in the comparable Shack base. AUVs for domestic company-operated Shacks decreased to
$4.4 million
in fiscal
2018
from
$4.6 million
in fiscal
2017
, primarily due to the addition of Shacks with lower unit volumes to the system.
The increase in Shack sales for fiscal
2017
was primarily driven by the opening of
26
new domestic company-operated Shacks partially offset by a same-Shack sales decrease of
1.2%
. Shacks outside of the comparable Shack base contributed $89.3 million to the increase, partially offset by a decrease of $2.3 million related to those Shacks included in the comparable base. The same-Shack sales decrease was primarily driven by decreased guest traffic of
3.2%
, partially offset by a combined increase of
2.0%
in price and sales mix. For purposes of calculating same-Shack sales growth, Shack sales for
43
Shacks were included in the comparable Shack base. AUVs for domestic company-operated Shacks decreased to
$4.6 million
in fiscal
2017
from
$5.0 million
in fiscal
2016
, primarily due to the addition of Shacks with lower unit volumes to the system.
Licensing Revenue
On December 28, 2017, we adopted ASU 2014-09,
Revenue from Contracts with Customers (Topic 606).
Results for reporting periods beginning on or after December 28, 2017 are presented under Accounting Standards Codification Topic 606 ("ASC 606"). Prior period amounts were not revised and continue to be reported in accordance with ASC Topic 605 ("ASC 605"), the accounting standard then in effect. See Note 3 to the consolidated financial statements included in Part II, Item 8 for more information.
Licensing revenue is comprised of sales-based royalty fees and amortization of certain upfront fees, including opening fees for certain licensed Shacks and initial territory fees received for the exclusive right to develop Shacks in a specific geographic area.
Prior to the adoption of ASC 606, opening fees were typically recognized as revenue when a licensed Shack opened and territory fees were recognized as revenue on a straight-line basis over the term of the license agreement.
|
(dollar amounts in thousands)
|
2018
|
|
2017
|
|
2016
|
|
|||||||
|
Licensing revenue
|
$
|
13,721
|
|
$
|
12,422
|
|
$
|
9,125
|
|
||||
|
Percentage of total revenue
|
3.0
|
%
|
3.5
|
%
|
3.4
|
%
|
|||||||
|
Dollar change compared to prior year
|
$
|
1,299
|
|
$
|
3,297
|
|
|||||||
|
Percentage change compared to prior year
|
10.5
|
%
|
36.1
|
%
|
|||||||||
The
increase
in licensing revenue for fiscal
2018
was primarily driven by the opening of
15
licensed Shacks during the fiscal year
and strong performance in Asia, including the initial strength of newer Shacks in Hong Kong and Japan.
Shake Shack Inc.
Form 10-K
|
59
Form 10-K
|
59
This
increase
in licensing revenue for
2017
was primarily driven by the opening of
19
licensed Shacks (net of closures) during the fiscal year
, $0.5 million of previously deferred royalty revenue recognized in connection with the initial publication of the Shake Shack book and
the initial strength of our newer Shacks in South Korea, pa
rtially offset by lower revenue from Shacks in the Middle East, as a result of macroeconomic and geopolitical volatile conditions.
Food and Paper Costs
Food and paper costs include the direct costs associated with food, beverage and packaging of our menu items. The components of food and paper costs are variable by nature, change with sales volume, are impacted by menu mix and are subject to increases or decreases in commodity costs.
|
(dollar amounts in thousands)
|
2018
|
|
2017
|
|
2016
|
|
|||||||
|
Food and paper costs
|
$
|
126,096
|
|
$
|
98,337
|
|
$
|
73,752
|
|
||||
|
Percentage of Shack sales
|
28.3
|
%
|
28.4
|
%
|
28.4
|
%
|
|||||||
|
Dollar change compared to prior year
|
$
|
27,759
|
|
$
|
24,585
|
|
|||||||
|
Percentage change compared to prior year
|
28.2
|
%
|
33.3
|
%
|
|||||||||
The
increase
in food and paper costs for fiscal
2018
was primarily due to the opening of
34
new domestic company-operated Shacks during the fiscal year. The decrease in food and paper costs as a percentage of Shack sales for fiscal
2018
was primarily due to the menu price increase we implemented in December 2017, sponsorship receipts for our biennial leadership retreat and costs associated with the free burger promotion in fiscal 2017 related to the launch of our mobile app that did not exist in fiscal 2018.
The
increase
in food and paper costs for fiscal
2017
was primarily due to the opening of
26
new domestic company-operated Shacks during the fiscal year, and as a percentage of Shack sales, food and paper costs
remained constant
in fiscal
2017
and fiscal 2016.
Labor and Related Expenses
Labor and related expenses include domestic company-operated Shack-level hourly and management wages, bonuses, payroll taxes, equity-based compensation, workers’ compensation expense and medical benefits. As we expect with other variable expense items, we expect labor costs to grow as our Shack sales grow. Factors that influence labor costs include minimum wage and payroll tax legislation, health care costs and the performance of our domestic company-operated Shacks.
|
(dollar amounts in thousands)
|
2018
|
|
2017
|
|
2016
|
|
|||||||
|
Labor and related expenses
|
$
|
122,094
|
|
$
|
91,740
|
|
$
|
65,540
|
|
||||
|
Percentage of Shack sales
|
27.4
|
%
|
26.5
|
%
|
25.3
|
%
|
|||||||
|
Dollar change compared to prior year
|
$
|
30,354
|
|
$
|
26,200
|
|
|||||||
|
Percentage change compared to prior year
|
33.1
|
%
|
40.0
|
%
|
|||||||||
The
increase
in labor and related expenses for fiscal
2018
was primarily due to the opening of
34
new domestic company-operated Shacks during the fiscal year. As a percentage of Shack sales, the
increase
in labor and related expenses for fiscal
2018
was due to: (i) the opening of
34
new domestic company-operated Shacks, as well as the timing of new Shack openings, which typically carry higher labor costs during the first few months of operations; and (ii) ongoing increases to hourly minimum wages and regulatory factors, such as the Fair Workweek legislation in New York City.
The
increase
in labor and related expenses for fiscal
2017
was primarily due to the opening of
26
new domestic company-operated Shacks during the fiscal year. As a percentage of Shack sales, the
increase
in labor and related expenses for fiscal
2017
was due to: (i) the opening of
26
new domestic company-operated Shacks, which typically carry higher labor costs during the first few months of operations; (ii) increases in hourly wages that were implemented at the end of fiscal 2016; (iii) investments in our management team to support future growth; and (iv) the opening of Shacks at various volumes.
Shake Shack Inc.
Form 10-K
|
60
Form 10-K
|
60
Other Operating Expenses
Other operating expenses consist of Shack-level marketing expenses, repairs and maintenance, utilities and other operating expenses incidental to operating our domestic company-operated Shacks, such as non-perishable supplies, credit card fees, delivery commissions and business insurance.
|
(dollar amounts in thousands)
|
2018
|
|
2017
|
|
2016
|
|
|||||||
|
Other operating expenses
|
$
|
51,783
|
|
$
|
35,805
|
|
$
|
24,946
|
|
||||
|
Percentage of Shack sales
|
11.6
|
%
|
10.3
|
%
|
9.6
|
%
|
|||||||
|
Dollar change compared to prior year
|
$
|
15,978
|
|
$
|
10,859
|
|
|||||||
|
Percentage change compared to prior year
|
44.6
|
%
|
43.5
|
%
|
|||||||||
The
increase
in other operating expenses for fiscal
2018
was primarily due to the opening of
34
new domestic company-operated Shacks during the fiscal year. As a percentage of Shack sales, the
increase
in other operating expenses for fiscal
2018
was primarily due to commissions paid as part of integrated delivery pilots and the impact of higher repairs and maintenance and certain fixed operating expenses spread across Shacks at a broader range of average unit volumes.
The
increase
in other operating expenses for fiscal
2017
was primarily due to the opening of
26
new domestic company-operated Shacks during the fiscal year. As a percentage of Shack sales, the
increase
in other operating expenses for fiscal
2017
was due to certain fixed expenses and increased facility costs as our Shacks mature, as well as the introduction of more Shacks of various volumes into the system.
Occupancy and Related Expenses
Occupancy and related expenses consist of Shack-level occupancy expenses (including rent, common area expenses and certain local taxes), excluding pre-opening costs, which are recorded separately.
|
(dollar amounts in thousands)
|
2018
|
|
2017
|
|
2016
|
|
|||||||
|
Occupancy and related expenses
|
$
|
32,710
|
|
$
|
28,197
|
|
$
|
21,820
|
|
||||
|
Percentage of Shack sales
|
7.3
|
%
|
8.1
|
%
|
8.4
|
%
|
|||||||
|
Dollar change compared to prior year
|
$
|
4,513
|
|
$
|
6,377
|
|
|||||||
|
Percentage change compared to prior year
|
16.0
|
%
|
29.2
|
%
|
|||||||||
The
increase
in occupancy and related expenses for fiscal
2018
was primarily due to the opening of
34
new domestic company-operated Shacks during the fiscal year. As a percentage of Shack sales, the
decrease
in occupancy and related expenses for fiscal
2018
was primarily due to the increased number of leases where we are deemed to be the accounting owner and for which less rent expense is recognized and the impact from a one-time benefit to deferred rent related to certain historical leases with co-tenancy provisions, partially offset by the introduction of Shacks at various volumes into the system.
The
increase
in occupancy and related expenses for fiscal
2017
was primarily due to the opening of
26
new domestic company-operated Shacks during the fiscal year. As a percentage of Shack sales, the decrease in occupancy and related expenses for fiscal
2017
was primarily due to more favorable lease terms and the impact of additional lease financing arrangements where we are deemed to be the accounting owner.
General and Administrative Expenses
General and administrative expenses consist of costs associated with Home Office and administrative functions that support Shack development and operations, as well as equity-based compensation expense.
Shake Shack Inc.
Form 10-K
|
61
Form 10-K
|
61
|
(dollar amounts in thousands)
|
2018
|
|
2017
|
|
2016
|
|
|||||||
|
General and administrative expenses
|
52,720
|
|
$
|
39,003
|
|
$
|
30,556
|
|
|||||
|
Percentage of total revenue
|
11.5
|
%
|
10.9
|
%
|
11.4
|
%
|
|||||||
|
Dollar change compared to prior year
|
$
|
13,717
|
|
$
|
8,447
|
|
|||||||
|
Percentage change compared to prior year
|
35.2
|
%
|
27.6
|
%
|
|||||||||
The
increase
in general and administrative expenses for fiscal
2018
was primarily driven by the increase in the Company's investment across the business, particularly in the addition of headcount to support its ongoing growth initiatives and
$3.9 million
of one-time charges, including a legal settlement of $1.2 million and costs related to Project Concrete. As a percentage of total revenue, the
increase
in general and administrative expenses for fiscal
2018
was primarily due to the aforementioned items.
The
increase
in general and administrative expenses for fiscal
2017
was primarily due to higher payroll expenses from increased headcount at our Home Office to support our growth plans, technology development costs related to our digital products, $0.7 million of costs incurred in connection with our executive transition, $0.5 million of the recognition of previously deferred costs related to the initial publication of the
Shake Shack
book, $0.2 million of the first phase costs associated with Project Concrete and $0.2 million of non-cash deferred rent for our new Home Office. As a percentage of total revenue, the
decrease
in general and administrative expenses for fiscal
2017
was primarily due to higher Shack sales.
Depreciation Expense
Depreciation expense consists of the depreciation of fixed assets, including leasehold improvements and equipment.
|
(dollar amounts in thousands)
|
2018
|
|
2017
|
|
2016
|
|
|||||||
|
Depreciation expense
|
$
|
29,000
|
|
$
|
21,704
|
|
$
|
14,502
|
|
||||
|
Percentage of total revenue
|
6.3
|
%
|
6.0
|
%
|
5.4
|
%
|
|||||||
|
Dollar change compared to prior year
|
$
|
7,296
|
|
$
|
7,202
|
|
|||||||
|
Percentage change compared to prior year
|
33.6
|
%
|
49.7
|
%
|
|||||||||
The
increase
in depreciation expense for fiscal
2018
was primarily due to incremental depreciation associated with the capital expenditures related to the
34
new domestic company-operated Shacks that opened during the fiscal year. As a percentage of total revenue, the
increase
in depreciation expense for fiscal
2018
was primarily due to incremental depreciation of property, plant and equipment related to the opening of
34
new domestic company-operated Shacks during the fiscal year, as well as the
introduction of Shacks at various volumes into the system.
The
increase
in depreciation expense for fiscal
2017
was due primarily to depreciation of capital expenditures related to the opening of
26
new domestic company-operated Shacks during fiscal
2017
. As a percentage of total revenue, the
increase
in depreciation expense for fiscal
2017
was primarily due to incremental depreciation of property, plant and equipment related to the opening of
26
new domestic company-operated Shacks during fiscal
2017
.
Pre-Opening Costs
Pre-opening costs consist primarily of: (i) rent; (ii) managers’ salaries; (iii) training costs; (iv) employee payroll and related expenses; (iv) all costs to relocate and compensate Shack management teams prior to an opening; (v) wages, travel and lodging costs for our opening training team and other support team members; (vi) marketing costs; (vii) attorney fees; and (viii) permits and licensing. All such costs incurred prior to the opening of a domestic company-operated Shack are expensed in the period in which the expense is incurred. Pre-opening costs can fluctuate significantly from period to period, based on the number and timing of domestic company-operated Shack openings and the specific pre-opening costs recognized for each domestic company-operated Shack. Additionally, domestic company-operated Shack openings in new geographic market areas will initially experience higher pre-opening costs than our established geographic market areas, such as the New York City metropolitan area, where we have greater economies of scale and typically incur lower travel and lodging costs for our training team.
Shake Shack Inc.
Form 10-K
|
62
Form 10-K
|
62
|
(dollar amounts in thousands)
|
2018
|
|
2017
|
|
2016
|
|
|||||||
|
Pre-opening costs
|
$
|
12,279
|
|
$
|
9,603
|
|
$
|
9,520
|
|
||||
|
Percentage of total revenue
|
2.7
|
%
|
2.7
|
%
|
3.5
|
%
|
|||||||
|
Dollar change compared to prior year
|
$
|
2,676
|
|
$
|
83
|
|
|||||||
|
Percentage change compared to prior year
|
27.9
|
%
|
0.9
|
%
|
|||||||||
The
increase
in pre-opening costs for fiscal
2018
and
2017
was primarily due to an increased number of openings and the timing of new domestic company-operated openings.
Loss on Disposal of Property and Equipment
Loss on disposal of property and equipment represents the net book value of assets that have been retired and consists primarily of furniture, equipment and fixtures that were replaced in the normal course of business.
|
(dollar amounts in thousands)
|
2018
|
|
2017
|
|
2016
|
|
|||||||
|
Loss on disposal of property and equipment
|
$
|
917
|
|
$
|
608
|
|
$
|
34
|
|
||||
|
Percentage of total revenue
|
0.2
|
%
|
0.2
|
%
|
—
|
%
|
|||||||
|
Dollar change compared to prior year
|
$
|
309
|
|
$
|
574
|
|
|||||||
|
Percentage change compared to prior year
|
50.8
|
%
|
1,688.2
|
%
|
|||||||||
The loss on disposal of property and equipment in fiscal
2018
,
2017
and
2016
was not material.
Other Income, net
Other income consists of interest income, dividend income, adjustments to liabilities under our tax receivable agreement and net realized gains and losses from the sale of marketable securities.
|
(dollar amounts in thousands)
|
2018
|
|
2017
|
|
2016
|
|
|||||||
|
Other income, net
|
$
|
1,514
|
|
$
|
128,123
|
|
$
|
1,065
|
|
||||
|
Percentage of total revenue
|
0.3
|
%
|
35.7
|
%
|
0.4
|
%
|
|||||||
|
Dollar change compared to prior year
|
$
|
(126,609
|
)
|
$
|
127,058
|
|
|||||||
|
Percentage change compared to prior year
|
(98.8
|
)%
|
11,930.3
|
%
|
|||||||||
The
decrease
in other income, net for fiscal
2018
primarily related to a $127.2 million one-time adjustment made in the prior year to reduce our liabilities under tax receivable agreement in connection with the enactment of the
Tax Cuts and Jobs Act of 2017 (the "TCJA"). No such adjustment was made in fiscal 2018.
The
increase
in other income, net for fiscal
2017
primarily related to the aforementioned $127.2 million adjustment made in connection with enactment of the TCJA, and $0.8 million of dividend income related to the investments in marketable securities we acquired during fiscal 2017.
Interest Expense
Interest expense primarily consists of amortization of deferred financing costs, imputed interest on deferred compensation, interest on the current portion of our liabilities under the Tax Receivable Agreement, imputed interest on our deemed landlord financing liability as well as interest and fees on our Revolving Credit Facility.
Shake Shack Inc.
Form 10-K
|
63
Form 10-K
|
63
|
(dollar amounts in thousands)
|
2018
|
|
2017
|
|
2016
|
|
|||||||
|
Interest expense
|
$
|
(2,415
|
)
|
$
|
(1,643
|
)
|
$
|
(374
|
)
|
||||
|
Percentage of total revenue
|
(0.5
|
)%
|
(0.5
|
)%
|
(0.1
|
)%
|
|||||||
|
Dollar change compared to prior year
|
$
|
(772
|
)
|
$
|
(1,269
|
)
|
|||||||
|
Percentage change compared to prior year
|
47.0
|
%
|
339.3
|
%
|
|||||||||
The
increase
s in interest expense for fiscal
2018
and fiscal
2017
was primarily due to the increased number of additional lease financing arrangements where we are deemed to be the accounting owner.
Income Tax Expense
As a result of the IPO and the Organizational Transactions, we became the sole managing member of SSE Holdings, which is treated as a partnership for U.S. federal and most applicable state and local income tax purposes. As a partnership, SSE Holdings is not subject to U.S. federal and certain state and local income taxes. Any taxable income or loss generated by SSE Holdings is passed through to and included in the taxable income or loss of its members, including us, on a pro rata basis. We are subject to U.S. federal income taxes, in addition to state and local income taxes with respect to our allocable share of any taxable income or loss generated by SSE Holdings.
|
(dollar amounts in thousands)
|
2018
|
|
2017
|
|
2016
|
|
|||||||
|
Income tax expense
|
$
|
8,862
|
|
$
|
151,409
|
|
$
|
6,350
|
|
||||
|
Percentage of total revenue
|
1.9
|
%
|
42.2
|
%
|
2.4
|
%
|
|||||||
|
Dollar change compared to prior year
|
$
|
(142,547
|
)
|
$
|
145,059
|
|
|||||||
|
Percentage change compared to prior year
|
(94.1
|
)%
|
2,284.4
|
%
|
|||||||||
The
decrease
in income tax expense for fiscal
2018
was primarily driven by the remeasurement of the our deferred tax assets in fiscal 2017 made in connection with the enactment of the TCJA, which resulted in $138.6 million of additional income tax expense, which was partially offset by an increase in our ownership interest in SSE Holdings. As our ownership interest in SSE Holdings increases, our share of the taxable income of SSE Holdings also increases. Our weighted-average ownership interest in SSE Holdings increased to
76.6%
in fiscal
2018
from
70.6%
in
2017
. Our effective income tax rate decreased to
28.8%
in fiscal
2018
from
94.5%
in fiscal
2017
primarily due to the aforementioned remeasurement of deferred tax assets in connection with the enactment of the
TCJA
in the prior year.
The
increase
in income tax expense for fiscal
2017
was primarily due to $138.6 million of additional income tax expense we recognized in connection with the remeasurement of our deferred tax assets relating to the enactment of the TCJA. To a lesser extent, the increase in income tax expense was also driven by an increase in our pre-tax income, as well as an increase in our ownership interest in SSE Holdings. As our ownership interest in SSE Holdings increases, our share of the taxable income of SSE Holdings also increases. Our weighted-average ownership interest in SSE Holdings increased to
70.6%
in fiscal
2017
from
63.2%
in fiscal
2016
. Our effective income tax rate increased to
94.5%
in fiscal
2017
from
22.3%
in fiscal
2016
primarily due to the remeasurement of deferred tax assets in connection with the enactment of the TCJA.
Net Income Attributable to Non-controlling Interests
We are the sole managing member of SSE Holdings and have the sole voting power in, and control the management of, SSE Holdings. Accordingly, we consolidate the financial results of SSE Holdings and report a non-controlling interest on our Consolidated Statements of Income (Loss), representing the portion of net income attributable to the other members of SSE Holdings. The SSE Holdings LLC Agreement provides that holders of LLC Interests may, from time to time, require SSE Holdings to redeem all or a portion of their LLC Interests for newly-issued shares of Class A common stock on a one-for-one basis. In connection with any redemption or exchange, we receive a corresponding number of LLC Interests, increasing our total ownership interest in SSE Holdings. The weighted average ownership percentages for the applicable reporting periods are used to attribute net income and other comprehensive income to Shake Shack Inc. and the non-controlling interest holders.
Shake Shack Inc.
Form 10-K
|
64
Form 10-K
|
64
|
(dollar amounts in thousands)
|
2018
|
|
2017
|
|
2016
|
|
|||||||
|
Net income attributable to non-controlling interests
|
$
|
6,769
|
|
$
|
9,204
|
|
$
|
9,700
|
|
||||
|
Percentage of total revenue
|
1.5
|
%
|
2.6
|
%
|
3.6
|
%
|
|||||||
|
Dollar change compared to prior year
|
$
|
(2,435
|
)
|
$
|
(496
|
)
|
|||||||
|
Percentage change compared to prior year
|
(26.5
|
)%
|
(5.1
|
)%
|
|||||||||
The
decrease
in net income attributable to non-controlling interests for fiscal
2018
was primarily driven by an increase in our weighted-average ownership interest in SSE Holdings from
70.6%
in fiscal
2017
to
76.6%
in fiscal
2018
as a result of redemptions of LLC Interests.
The
decrease
in net income attributable to non-controlling interests for fiscal
2017
was primarily driven by an increase in our weighted-average ownership interest in SSE Holdings from
63.2%
in fiscal
2016
to
70.6%
in fiscal
2017
as a result of redemptions of LLC Interests.
NON-GAAP FINANCIAL MEASURES
To supplement the consolidated financial statements, which are prepared and presented in accordance with U.S. generally accepted accounting principles (“GAAP”), we use the following non-GAAP financial measures: Shack-level operating profit, Shack-level operating profit margin, EBITDA, adjusted EBITDA, adjusted EBITDA margin, adjusted pro forma net income and adjusted pro forma earnings per fully exchanged and diluted share (collectively the "non-GAAP financial measures").
Shack-Level Operating Profit
Shack-level operating profit is defined as Shack sales less Shack-level operating expenses including food and paper costs, labor and related expenses, other operating expenses and occupancy and related expenses.
How This Measure Is Useful
When used in conjunction with GAAP financial measures, Shack-level operating profit and Shack-level operating profit margin are supplemental measures of operating performance that we believe are useful measures to evaluate the performance and profitability of our Shacks. Additionally, Shack-level operating profit and Shack-level operating profit margin are key metrics used internally by our management to develop internal budgets and forecasts, as well as assess the performance of our Shacks relative to budget and against prior periods. It is also used to evaluate employee compensation as it serves as a metric in certain of our performance-based employee bonus arrangements. We believe presentation of Shack-level operating profit and Shack-level operating profit margin provides investors with a supplemental view of our operating performance that can provide meaningful insights to the underlying operating performance of our Shacks, as these measures depict the operating results that are directly impacted by our Shacks and exclude items that may not be indicative of, or are unrelated to, the ongoing operations of our Shacks. It may also assist investors to evaluate our performance relative to peers of various sizes and maturities and provides greater transparency with respect to how our management evaluates our business, as well as our financial and operational decision-making.
Limitations of the Usefulness of this Measure
Shack-level operating profit and Shack-level operating profit margin may differ from similarly titled measures used by other companies due to different methods of calculation. Presentation of Shack-level operating profit and Shack-level operating profit margin is not intended to be considered in isolation or as a substitute for, or superior to, the financial information prepared and presented in accordance with GAAP. Shack-level operating profit excludes certain costs, such as general and administrative expenses and pre-opening costs, which are considered normal, recurring cash operating expenses and are essential to support the operation and development of our Shacks. Therefore, this measure may not provide a complete understanding of the operating results of our company as a whole and Shack-level operating profit and Shack-level operating profit margin should be reviewed in conjunction with our GAAP financial results. A reconciliation of Shack-level operating profit to operating income, the most directly comparable GAAP financial measure, is as follows.
Shake Shack Inc.
Form 10-K
|
65
Form 10-K
|
65
|
(dollar amounts in thousands)
|
2018
|
|
2017
|
|
2016
|
|
2015
|
|
2014
(2)
|
|
|||||||||||
|
Operating income
|
$
|
31,711
|
|
$
|
33,813
|
|
$
|
27,805
|
|
$
|
6,753
|
|
$
|
3,143
|
|
||||||
|
Less:
|
|||||||||||||||||||||
|
Licensing revenue
|
13,721
|
|
12,422
|
|
9,125
|
|
7,373
|
|
6,488
|
|
|||||||||||
|
Add:
|
|||||||||||||||||||||
|
General and administrative expenses
|
52,720
|
|
39,003
|
|
30,556
|
|
37,825
|
|
18,187
|
|
|||||||||||
|
Depreciation expense
|
29,000
|
|
21,704
|
|
14,502
|
|
10,222
|
|
5,809
|
|
|||||||||||
|
Pre-opening costs
|
12,279
|
|
9,603
|
|
9,520
|
|
5,430
|
|
6,105
|
|
|||||||||||
|
Loss on disposal of property and equipment
|
917
|
|
608
|
|
34
|
|
17
|
|
105
|
|
|||||||||||
|
Shack-level operating profit
|
$
|
112,906
|
|
$
|
92,309
|
|
$
|
73,292
|
|
$
|
52,874
|
|
$
|
26,861
|
|
||||||
|
Total revenue
|
$
|
459,310
|
|
$
|
358,810
|
|
$
|
268,475
|
|
$
|
190,592
|
|
$
|
118,530
|
|
||||||
|
Less: Licensing revenue
|
13,721
|
|
12,422
|
|
9,125
|
|
7,373
|
|
6,488
|
|
|||||||||||
|
Shack sales
|
$
|
445,589
|
|
$
|
346,388
|
|
$
|
259,350
|
|
$
|
183,219
|
|
$
|
112,042
|
|
||||||
|
Shack-level operating profit margin
(1)
|
25.3
|
%
|
26.6
|
%
|
28.3
|
%
|
28.9
|
%
|
24.0
|
%
|
|||||||||||
|
(1)
|
As a percentage of Shack sales.
|
|
(2)
|
We operate on a 52/53 week fiscal year that ends on the last Wednesday of the calendar year.
Fiscal 2018, 2017, 2016 and 2015 each contained 52 weeks.
Fiscal 2014 was a 53-week year.
|
EBITDA and Adjusted EBITDA
EBITDA is defined as net income before interest expense (net of interest income), income tax expense and depreciation and amortization expense. Adjusted EBITDA is defined as EBITDA (as defined above) excluding equity-based compensation expense, deferred rent expense, losses on the disposal of property and equipment, as well as certain non-recurring items that we don't believe directly reflect our core operations and may not be indicative of our recurring business operations.
How These Measures Are Useful
When used in conjunction with GAAP financial measures, EBITDA and Adjusted EBITDA are supplemental measures of operating performance that we believe are useful measures to facilitate comparisons to historical performance and competitors' operating results. Adjusted EBITDA is a key metric used internally by our management to develop internal budgets and forecasts and also serves as a metric in our performance-based equity incentive programs and certain of our bonus arrangements. We believe presentation of EBITDA and Adjusted EBITDA provides investors with a supplemental view of our operating performance that facilitates analysis and comparisons of our ongoing business operations because they exclude items that may not be indicative of our ongoing operating performance.
Limitations of the Usefulness of These Measures
EBITDA and Adjusted EBITDA may differ from similarly titled measures used by other companies due to different methods of calculation. Presentation of EBITDA and Adjusted EBITDA is not intended to be considered in isolation or as a substitute for, or superior to, the financial information prepared and presented in accordance with GAAP. EBITDA and Adjusted EBITDA exclude certain normal recurring expenses. Therefore, these measures may not provide a complete understanding of our performance and should be reviewed in conjunction with our GAAP financial measures. A reconciliation of EBITDA and Adjusted EBITDA to net income, the most directly comparable GAAP measure, is as follows.
66
|
Shake Shack Inc.
Form 10-K
Form 10-K
|
(in thousands)
|
2018
|
|
2017
|
|
2016
|
|
2015
|
|
2014
(2)
|
|
|||||||||||
|
Net income
|
$
|
21,948
|
|
$
|
8,884
|
|
$
|
22,146
|
|
$
|
3,124
|
|
$
|
2,118
|
|
||||||
|
Depreciation expense
|
29,000
|
|
21,704
|
|
14,502
|
|
10,222
|
|
5,809
|
|
|||||||||||
|
Interest expense, net
|
2,407
|
|
1,565
|
|
285
|
|
325
|
|
363
|
|
|||||||||||
|
Income tax expense
|
8,862
|
|
151,409
|
|
6,350
|
|
3,304
|
|
662
|
|
|||||||||||
|
EBITDA
|
62,217
|
|
183,562
|
|
43,283
|
|
16,975
|
|
8,952
|
|
|||||||||||
|
Equity-based compensation
|
6,067
|
|
5,623
|
|
5,354
|
|
4,314
|
|
165
|
|
|||||||||||
|
Deferred rent
|
876
|
|
983
|
|
2,251
|
|
1,482
|
|
2,830
|
|
|||||||||||
|
Loss on disposal of property and equipment
|
917
|
|
608
|
|
34
|
|
17
|
|
105
|
|
|||||||||||
|
Non-recurring compensation expenses related to the IPO
(3)
|
—
|
|
—
|
|
—
|
|
12,818
|
|
—
|
|
|||||||||||
|
IPO-related expenses
|
—
|
|
—
|
|
—
|
|
635
|
|
2,675
|
|
|||||||||||
|
Legal settlement
|
1,200
|
|
—
|
|
—
|
|
770
|
|
—
|
|
|||||||||||
|
Executive transition costs
(4)
|
340
|
|
664
|
|
—
|
|
—
|
|
—
|
|
|||||||||||
|
Project Concrete
(5)
|
1,292
|
|
181
|
|
—
|
|
—
|
|
—
|
|
|||||||||||
|
Costs related to relocation of Home Office
(6)
|
1,019
|
|
264
|
|
—
|
|
—
|
|
—
|
|
|||||||||||
|
Other income related to adjustment of liabilities under tax receivable agreement
|
(78
|
)
|
(1,362
|
)
|
(688
|
)
|
—
|
|
—
|
|
|||||||||||
|
Other income related to adjustment of liabilities under tax receivable agreement resulting from the enactment of the TCJA
|
—
|
|
(125,859
|
)
|
—
|
|
—
|
|
—
|
|
|||||||||||
|
Other non-cash items
|
—
|
|
—
|
|
—
|
|
—
|
|
135
|
|
|||||||||||
|
ADJUSTED EBITDA
|
$
|
73,850
|
|
$
|
64,664
|
|
$
|
50,234
|
|
$
|
37,011
|
|
$
|
14,862
|
|
||||||
|
Adjusted EBITDA margin
(1)
|
16.1
|
%
|
18.0
|
%
|
18.7
|
%
|
12.5
|
%
|
15.4
|
%
|
|||||||||||
|
(1)
|
As a percentage of total revenue.
|
|
(2)
|
We operate on a 52/53 week fiscal year that ends on the last Wednesday of the calendar year. Fiscal 2018, 2017, 2016 and 2015 each contained 52 weeks. Fiscal 2014 was a 53-week year.
|
|
(3)
|
Non-recurring compensation expense incurred in connection with the IPO, including expense recognized upon settlement of outstanding unit appreciation rights, the related employer withholding taxes and the accelerated vesting of outstanding restricted Class B units.
|
|
(4)
|
Represents fees paid in connection with the search for certain of our executive and key management positions, non-recurring signing bonuses and other transition costs, including related equity-based compensation.
|
|
(5)
|
Represents consulting and advisory fees related to our enterprise-wide system upgrade initiative called Project Concrete.
|
(6) Costs incurred in connection with our relocation to a new Home Office.
Adjusted Pro Forma Net Income and Adjusted Pro Forma Earnings Per Fully Exchanged and Diluted Share
Adjusted pro forma net income represents net income (loss) attributable to Shake Shack Inc. assuming the full exchange of all outstanding SSE Holdings, LLC membership interests ("LLC Interests") for shares of Class A common stock, adjusted for certain non-recurring items that we don't believe directly reflect our core operations and may not be indicative of our recurring business operations. Adjusted pro forma earnings per fully exchanged and diluted share is calculated by dividing adjusted pro forma net income by the weighted-average shares of Class A common stock outstanding, assuming the full exchange of all outstanding LLC Interests, after giving effect to the dilutive effect of outstanding equity-based awards.
How These Measures Are Useful
When used in conjunction with GAAP financial measures, adjusted pro forma net income and adjusted pro forma earnings per fully exchanged and diluted share are supplemental measures of operating performance that we believe are useful measures to evaluate our performance period over period and relative to our competitors. By assuming the full exchange of all outstanding LLC Interests,
Shake Shack Inc.
Form 10-K
|
67
Form 10-K
|
67
we believe these measures facilitate comparisons with other companies that have different organizational and tax structures, as well as comparisons period over period because it eliminates the effect of any changes in net income attributable to Shake Shack Inc. driven by increases in our ownership of SSE Holdings, which are unrelated to our operating performance, and excludes items that are non-recurring or may not be indicative of our ongoing operating performance.
Limitations of the Usefulness of These Measures
Adjusted pro forma net income and adjusted pro forma earnings per fully exchanged and diluted share may differ from similarly titled measures used by other companies due to different methods of calculation. Presentation of adjusted pro forma net income and adjusted pro forma earnings per fully exchanged and diluted share should not be considered alternatives to net income (loss) and earnings (loss) per share, as determined under GAAP. While these measures are useful in evaluating our performance, it does not account for the earnings attributable to the non-controlling interest holders and therefore does not provide a complete understanding of the net income attributable to Shake Shack Inc. Adjusted pro forma net income and adjusted pro forma earnings per fully exchanged and diluted share should be evaluated in conjunction with our GAAP financial results. A reconciliation of adjusted pro forma net income to net income (loss) attributable to Shake Shack Inc., the most directly comparable GAAP measure, and the computation of adjusted pro forma earnings per fully exchanged and diluted share are set forth below.
|
(in thousands, except per share amounts)
|
2018
|
|
2017
|
|
2016
|
|
2015
|
|
2014
(1)
|
|
|||||||||||
|
Numerator:
|
|||||||||||||||||||||
|
Net income (loss) attributable to Shake Shack Inc.
|
$
|
15,179
|
|
$
|
(320
|
)
|
$
|
12,446
|
|
$
|
(8,776
|
)
|
$
|
2,118
|
|
||||||
|
Adjustments:
|
|||||||||||||||||||||
|
Reallocation of net income attributable to non-controlling interests from the assumed exchange of LLC Interests
(2)
|
$
|
6,769
|
|
9,204
|
|
9,700
|
|
11,900
|
|
—
|
|
||||||||||
|
Non-recurring compensation expenses incurred in connection with the IPO
(3)
|
—
|
|
—
|
|
—
|
|
12,818
|
|
—
|
|
|||||||||||
|
IPO-related expenses
|
—
|
|
—
|
|
—
|
|
635
|
|
2,675
|
|
|||||||||||
|
Legal settlement
|
1,200
|
|
—
|
|
—
|
|
770
|
|
—
|
|
|||||||||||
|
Executive transition costs
(4)
|
340
|
|
664
|
|
—
|
|
—
|
|
—
|
|
|||||||||||
|
Project Concrete
(5)
|
1,292
|
|
181
|
|
—
|
|
—
|
|
—
|
|
|||||||||||
|
Costs related to relocation of Home Office
(6)
|
1,019
|
|
264
|
|
—
|
|
—
|
|
—
|
|
|||||||||||
|
Other income related to the adjustment of liabilities under tax receivable agreement
|
(78
|
)
|
(1,362
|
)
|
(688
|
)
|
—
|
|
—
|
|
|||||||||||
|
Other income related to the remeasurement of liabilities under tax receivable agreement resulting from the enactment of the TCJA
|
—
|
|
(125,859
|
)
|
—
|
|
—
|
|
—
|
|
|||||||||||
|
Remeasurement of deferred tax assets
|
3,794
|
|
138,636
|
|
(1,526
|
)
|
—
|
|
—
|
|
|||||||||||
|
Tax effect of change in tax basis related to the adoption of ASC 606
|
(311
|
)
|
—
|
|
—
|
|
—
|
|
—
|
|
|||||||||||
|
Income tax expense
(7)
|
(2,290
|
)
|
(377
|
)
|
(3,164
|
)
|
(5,302
|
)
|
(67
|
)
|
|||||||||||
|
Adjusted pro forma net income
|
$
|
26,914
|
|
$
|
21,031
|
|
$
|
16,768
|
|
$
|
12,045
|
|
$
|
4,726
|
|
||||||
|
Denominator:
|
|||||||||||||||||||||
|
Weighted-average shares of Class A common stock outstanding—diluted
|
28,299
|
|
25,876
|
|
23,449
|
|
13,588
|
|
30,122
|
|
|||||||||||
|
Adjustments:
|
|||||||||||||||||||||
|
Assumed exchange of LLC Interests for shares of Class A common stock
(2)
|
8,664
|
|
10,773
|
|
13,360
|
|
22,635
|
|
—
|
|
|||||||||||
|
Assumed issuance of shares in connection with the IPO and settlement of outstanding unit appreciation rights
(8)
|
—
|
|
—
|
|
—
|
|
—
|
|
6,089
|
|
|||||||||||
|
Dilutive effect of stock options
|
879
|
|
555
|
|
—
|
|
987
|
|
—
|
|
|||||||||||
|
Adjusted pro forma fully exchanged weighted-average shares of Class A common stock outstanding—diluted
|
37,842
|
|
37,204
|
|
36,809
|
|
37,210
|
|
36,211
|
|
|||||||||||
|
Adjusted pro forma earnings per fully exchanged share—diluted
|
$
|
0.71
|
|
$
|
0.57
|
|
$
|
0.46
|
|
$
|
0.32
|
|
$
|
0.13
|
|
||||||
|
(1)
|
We operate on a 52/53 week fiscal year that ends on the last Wednesday of the calendar year. Fiscal 2018, 2017, 2016 and 2015 each contained 52 weeks. Fiscal 2014 was a 53-week year.
|
|
(2)
|
Assumes the exchange of all outstanding LLC Interests for shares of Class A common stock, resulting in the elimination of the non-controlling interest and recognition of the net income attributable to non-controlling interests.
|
|
(3)
|
Non-recurring compensation expense incurred in connection with the IPO. Includes expense recognized upon settlement of outstanding unit appreciation rights, the related employer withholding taxes and the accelerated vesting of outstanding restricted Class B units.
|
68
|
Shake Shack Inc.
Form 10-K
Form 10-K
|
(4)
|
Represents fees paid in connection with the search for certain of our executive and key management positions, non-recurring signing bonuses and other transition costs, including related equity-based compensation.
|
|
(5)
|
Represents consulting and advisory fees related to our operational and financial system upgrade initiative called Project Concrete.
|
|
(6)
|
Costs incurred in connection with the relocation to a new Home Office, including duplicative non-cash deferred rent and legal costs.
|
|
(7)
|
For fiscal 2018, 2017, 2016 and 2015, amounts represent the tax effect of the aforementioned adjustments and pro forma adjustments to reflect corporate income taxes at assumed effective tax rates of
22.2%
,
38.5%
and
39.7%
and 41.7% respectively, which include provisions for U.S. federal income taxes, certain LLC entity-level taxes and foreign withholding taxes, assuming the highest statutory rates apportioned to each applicable state, local and foreign jurisdiction. For fiscal 2014, amount represents the tax effect of the aforementioned adjustments at an assumed effective tax rate of 13.4%, which includes provisions for certain LLC entity-level taxes and foreign withholding taxes.
|
|
(8)
|
Adjustment to give effect to (i) 5,750,000 shares issued to investors in our IPO and (ii) 339,306 shares issued upon settlement of outstanding unit appreciation rights, both of which were not retrospectively applied in the computations of earnings per share for fiscal 2014.
|
Shake Shack Inc.
Form 10-K
|
69
Form 10-K
|
69
LIQUIDITY AND CAPITAL RESOURCES
Sources and Uses of Cash
Our primary sources of liquidity are cash and cash equivalents on hand, short-term investments and availability under our Revolving Credit Facility. As of
December 26, 2018
, we maintained a cash balance of
$24.8 million
, a short-term investments balance of
$62.1 million
and had
$19.3 million
of availability under our Revolving Credit Facility.
Our primary requirements for liquidity are to fund our working capital needs, lease obligations, capital expenditures and general corporate needs. Our requirements for working capital are not significant because our guests pay for their food and beverage purchases in cash or on debit or credit cards at the time of the sale and we are able to sell many of our inventory items before payment is due to the supplier of such items. Our ongoing capital expenditures are principally related to opening new Shacks, existing Shack capital investments (both for remodels and maintenance), as well as investments in our corporate infrastructure and digital innovation.
In addition, we are obligated to make payments to the non-controlling interest holders under the Tax Receivable Agreement. As of
December 26, 2018
, such obligations totaled
$203.7 million
, of which
$5.8 million
is expected to be paid in fiscal 2019. Amounts payable under the Tax Receivable Agreement are contingent upon, among other things, (i) gener
ation of future taxable income over the term of the Tax Receivable Agreement and (ii) future changes in tax laws. If we do not generate sufficient taxable income in the aggregate over the term of the Tax Receivable Agreement to utilize the tax benefits, then we would not be required to make the related TRA Payments. Although the amount of any payments that must be made under the Tax Receivable Agreement may be significant, the timing of these payments will vary and will generally be limited to one payment per member per year. The amount of such payments are also limited to the extent we utilize the related deferred tax assets. The payments that we are required to make will generally reduce the amount of overall cash flow that might have otherwise been available to us or to SSE Holdings, but we expect the cash tax savings we will realize from the utilization of the related deferred tax assets to fund the required payments.
We believe that cash provided by operating activities, cash on hand and availability under the Revolving Credit Facility will be sufficient to fund our lease obligations, capital expenditures, tax receivable agreement obligations and working capital needs for at least the next 12 months and the foreseeable future.
Summary of Cash Flows
The following table and discussion presents, for the periods indicated, a summary of our key cash flows from operating, investing and financing activities.
|
(in thousands)
|
2018
|
|
2017
|
|
2016
|
|
|||||
|
Net cash provided by operating activities
|
$
|
85,395
|
|
$
|
70,878
|
|
$
|
54,285
|
|
||
|
Net cash used in investing activities
|
(86,604
|
)
|
(61,943
|
)
|
(114,761
|
)
|
|||||
|
Net cash provided by financing activities
|
4,452
|
|
965
|
|
1,234
|
|
|||||
|
Increase (decrease) in cash and cash equivalents
|
3,243
|
|
9,900
|
|
(59,242
|
)
|
|||||
|
Cash and cash equivalents at beginning of period
|
21,507
|
|
11,607
|
|
70,849
|
|
|||||
|
Cash and cash equivalents at end of period
|
$
|
24,750
|
|
$
|
21,507
|
|
$
|
11,607
|
|
||
Operating Activities
For fiscal
2018
, net cash provided by operating activities was
$85.4 million
compared to
$70.9 million
for fiscal
2017
, an
increase
of
$14.5 million
. This
increase
was primarily driven by the opening of
34
new domestic company-operated Shack during fiscal
2018
.
For fiscal
2017
, net cash provided by operating activities was
$70.9 million
compared to
$54.3 million
for fiscal
2016
, an
increase
of
$16.6 million
. This increase was primarily driven by the opening of 26 new domestic company-operated Shack during fiscal
2017
.
70
|
Shake Shack Inc.
Form 10-K
Form 10-K
Investing Activities
For fiscal
2018
, net cash used in investing activities was
$86.6 million
compared to
$61.9 million
for fiscal
2017
, an
increase
of
$24.7 million
. This
increase
primarily relates to an increase in capital expenditures of $26.0 million to construct new domestic company-operated Shacks compared to fiscal
2017
.
For fiscal
2017
, net cash used in investing activities was
$61.9 million
compared to
$114.8 million
for fiscal
2016
, an increase of
$52.8 million
. This decrease was primarily due to purchases of marketable securities, whereby we made significant investments in the prior year totaling $60.3 million, net of sales. In the current year our net purchases totaled $0.4 million. Offsetting the decrease, was an increase in capital expenditures of $7.1 million to construct new domestic company-operated Shacks compared to fiscal 2016.
Financing Activities
For fiscal
2018
, net cash provided by financing activities was
$4.5 million
compared to
$1.0 million
for fiscal
2017
, an
increase
of
$3.5 million
. This increase is primarily due to a reduction in financing cash outflows of $1.6 million in distributions to non-controlling interest holders and $4.8 million of payments made under the Tax Receivable Agreement in fiscal 2017 that did not exist in fiscal 2018, offset by a decrease of $2.1 million in proceeds from the exercise of employee stock options.
For fiscal
2017
, net cash provided by financing activities was
$1.0 million
compared to
$1.2 million
for fiscal
2016
, a decrease of $0.2 million. This decrease was primarily due to $4.8 million in payments made under the Tax Receivable Agreement and $0.6 million in distributions to non-controlling interest holders, offset by an increase of $4.4 million in proceeds from the exercise of employee stock options and $0.9 million in proceeds from deemed landlord financing (net of payments).
Revolving Credit Facility
We maintain a Revolving Credit Facility that provides for a revolving total commitment amount of
$50.0 million
, of which
$20.0 million
is available immediately. The Revolving Credit Facility will mature and all amounts outstanding will be due and payable in February 2020. The Revolving Credit Facility permits the issuance of letters of credit upon our request of up to
$10.0 million
. Borrowings under the facility bear interest at either: (i) LIBOR plus a percentage ranging from
2.3%
to
3.3%
or (ii) the prime rate plus a percentage ranging from
0.0%
to
0.8%
, depending on the type of borrowing made under the facility. As of
December 26, 2018
, there were
no
amounts outstanding under the Revolving Credit Facility. We had
$19.3 million
of availability as of
December 26, 2018
, after giving effect to
$0.7 million
in outstanding letters of credit.
The Revolving Credit Facility is secured by a first-priority security interest in substantially all of the assets of SSE Holdings and the guarantors. The obligations under the Revolving Credit Facility are guaranteed by each of SSE Holdings' wholly-owned domestic subsidiaries (with certain exceptions).
The Revolving Credit Facility contains a number of covenants that, among other things, limit our ability to, subject to specified exceptions, incur additional debt; incur additional liens and contingent liabilities; sell or dispose of assets; merge with or acquire other companies; liquidate or dissolve ourselves; pay dividends or make distributions; engage in businesses that are not in a related line of business; make loans, advances or guarantees; engage in transactions with affiliates; and make investments. In addition, the Revolving Credit Facility contains certain cross-default provisions. We are required to maintain a specified consolidated fixed-charge coverage ratio and a specified funded net debt to adjusted EBITDA ratio, both as defined under the Revolving Credit Facility. As of
December 26, 2018
, we were in compliance with all covenants.
Shake Shack Inc.
Form 10-K
|
71
Form 10-K
|
71
CONTRACTUAL OBLIGATIONS
The following table sets forth certain contractual obligations as of
December 26, 2018
and the timing and effect that such commitments are expected to have on our liquidity and capital requirements in future periods.
|
(in thousands)
|
Total
|
|
Less than
1 Year
|
|
1-3
Years
|
|
3-5
Years
|
|
More Than
5 Years
|
|
|||||||||
|
Operating lease obligations
(1)
|
$
|
339,634
|
|
$
|
31,785
|
|
$
|
66,182
|
|
$
|
67,522
|
|
$
|
174,145
|
|
||||
|
Deemed landlord financing obligations
(1)
|
46,691
|
|
4,487
|
|
9,571
|
|
9,974
|
|
22,659
|
|
|||||||||
|
Liabilities under tax receivable agreement
(2)
|
203,712
|
|
5,804
|
|
21,885
|
|
22,766
|
|
153,257
|
|
|||||||||
|
Purchase obligations
|
158,020
|
|
52,652
|
|
27,693
|
|
23,362
|
|
54,313
|
|
|||||||||
|
TOTAL
|
$
|
748,057
|
|
$
|
94,728
|
|
$
|
125,331
|
|
$
|
123,624
|
|
$
|
404,374
|
|
||||
|
(1)
|
See
Note 10 to the consolidated financial statements included in Item 8 for further discussion of our leases and deemed landlord financing.
|
|
(2)
|
See Notes 15 and 18 to the consolidated financial statements included in Item 8 for further discussion of our Tax Receivable Agreement and related liabilities.
|
Purchase obligations include all legally binding contracts, including commitments for the purchase, construction or remodeling of real estate and facilities, firm minimum commitments for inventory purchases, future minimum lease payments under non-cancelable operating leases without a possession date, equipment purchases and cancelable operating leases, marketing-related contracts, software acquisition/license commitments and service contracts.
Liabilities under Tax Receivable Agreement include amounts to be paid to the non-controlling interest holders, estimated over the next five years, assuming we will have sufficient taxable income over the term of the Tax Receivable Agreement to utilize the related tax benefits.
The above table excludes non-cash obligations for deferred rent and deferred property incentives. In addition, other unrecorded obligations that have been excluded from the contractual obligations table include contingent rent payments, property taxes, insurance payments and common area maintenance costs.
OFF-BALANCE SHEET ARRANGEMENTS
Except for operating leases entered into in the normal course of business, certain letters of credit entered into as security under the terms of several of our leases and the unrecorded contractual obligations set forth above, we did not have any off-balance sheet arrangements as of
December 26, 2018
.
72
|
Shake Shack Inc.
Form 10-K
Form 10-K
CRITICAL ACCOUNTING POLICIES AND ESTIMATES
The preparation of financial statements and related disclosures in conformity with U.S. generally accepted accounting principles (“GAAP”) requires that we make estimates and judgments that affect the reported amounts of assets, liabilities, revenues and expenses, and disclosure of contingent assets and liabilities. We base our estimates on past experience and other assumptions that we believe are reasonable under the circumstances, and we evaluate these estimates on an ongoing basis.
The critical accounting policies and estimates described below are those that materially affect or have the greatest potential impact on our consolidated financial statements, and involve difficult, subjective or complex judgments made by management. Because of the uncertainty inherent in these matters, actual results may differ from those estimates we use in applying our critical accounting policies and estimates. The following discussion should be read in conjunction with the consolidated financial statements included in Part II, Item 8 of this Form 10-K.
Property and Equipment
We assess potential impairments to our long-lived assets, which includes property and equipment, whenever events or circumstances indicate that the carrying amount of an asset may not be recoverable. Recoverability of an asset is measured by a comparison of the carrying amount of an asset group to the estimated undiscounted future cash flows expected to be generated by the asset. The evaluation is performed at the lowest level of identifiable cash flows, which is primarily at the individual Shack level. Significant judgment is involved in determining the assumptions used in estimating future cash flows, including projected sales growth and operating margins. If the carrying amount of the asset group exceeds its estimated undiscounted future cash flows, an impairment charge is recognized as the amount by which the carrying amount of the asset exceeds the fair value of the asset. There were no impairment charges recorded during fiscal
2018
,
2017
or
2016
.
Leases
We currently lease all of our domestic company-operated Shacks and the Home Office. At the inception of each lease, we determine its appropriate classification as an operating or capital lease. As of
December 26, 2018
and
December 27, 2017
there were no leases classified as capital leases. For operating leases that include rent escalations, we record the base rent expense on a straight-line basis over the term of the lease and the difference between the base cash rents paid and the straight-line rent expense is recorded as deferred rent. Certain leases contain contingent rent provisions that require additional rental payments based upon sales volume. When achievement of such sales volume target is probable, contingent rent is accrued in proportion to the sales recognized during the period that are attributable to the expected achievement of the sales volume target. It is our policy to record straight-line rent expense from possession date through the opening date as pre-opening expense. Once a domestic company-operated Shack opens, we record the straight-line rent plus contingent rent, if applicable, as occupancy and related expenses.
We expend cash for leasehold improvements and to build out and equip our leased premises. Generally, a portion of the leasehold improvements and building costs are reimbursed to us by our landlords as construction contributions pursuant to agreed-upon terms in our leases. If obtained, landlord construction contributions usually take the form of cash, full or partial credits against our future minimum or percentage rents otherwise payable by us, or a combination thereof. When contractually due to us, we classify tenant improvement allowances as deferred rent on the consolidated balance sheets and amortize the tenant improvement allowance on a straight-line basis over the lease term as a credit to occupancy and related expenses.
We make judgments regarding the probable term for each lease, which can impact the classification and accounting for a lease as capital or operating, as well as the amount of straight-lined rent expense and deferred rent expense in a particular period.
Lease Financing Arrangements
We are typically involved in the construction of our leased space in order to ready the space for its intended use. If our maximum obligation under these lease arrangements is more than a minor amount of the asset’s fair value, we consider the nature and extent of our involvement during the construction period to determine whether we are considered the accounting owner of the construction project. Our maximum obligation includes the present value of our minimum lease payments, including an estimate for our share of common area maintenance and real estate taxes, budgeted construction costs, an estimate for construction cost overruns, and
Shake Shack Inc.
Form 10-K
|
73
Form 10-K
|
73
residual value guarantees, if any. We consider our maximum obligation to be “minor” if it is ten percent or less of the asset’s fair value. Significant judgment is involved in determining the fair value of the total construction project. Changes to certain estimates and assumptions could result in a higher or lower fair value, which could in turn result in our maximum obligations being more or less than minor.
If we are considered the accounting owner during the construction period, which generally begins upon lease execution, we capitalize the construction costs funded by the landlord related to our leased premises, in addition to capitalizing our construction costs, and also recognize a corresponding liability for deemed landlord financing. Additionally, we impute ground rent during the term of the lease on a straight-line basis, beginning on lease execution date. We utilize certain assumptions and apply judgment when imputing the ground rent portion, including developing an estimate of the ratio of the total fair value of the land and building. Changes to these assumptions and judgments could result in higher or lower pre-opening costs.
At the end of the construction period, we determine whether these transactions meet the criteria for sales recognition under the sale-leaseback accounting guidance. Generally, due to various forms of continuing involvement, these arrangements “fail” sale-leaseback and we are precluded from de-recognizing the landlord-funded asset and related liability, and continue to account for these arrangements as a financing.
As of
December 26, 2018
, we were deemed to be the accounting owner of
24
leased Shacks,
one
of which was under construction as of the end of the period. As of December 27, 2017, we were deemed to be the accounting owner of
23
leased Shacks, 11 of which were under construction as of the end of the period.
Self-Insurance Liabilities
We are self-insured for our employee medical and dental plans and we recognize a liability that represents our estimated cost of claims incurred but not reported as of the balance sheet date. Our estimated liability is based on a number of assumptions and factors, which requires significant judgment including historical claims experience, severity factors, litigation costs, inflation and other actuarial assumptions. Our history of claims experience is short and our significant growth rate could affect the accuracy of our estimates. If a greater amount of claims are reported, or if medical costs increase beyond what our expectation, our liabilities may not be sufficient and we could recognize additional expense.
Equity-Based Compensation
Equity-based compensation expense is measured based on fair value. For awards with graded-vesting features and service conditions only, compensation expense is recognized on a straight-line basis over the total requisite service period for the entire award. For awards with graded-vesting features and a combination of service and performance conditions, compensation expense is recognized using a graded-vesting attribution method over the vesting period based on the most probable outcome of the performance conditions. We determine the probability of achievement of future performance conditions based on our internal estimates of future performance, and we account for forfeitures as they occur. We estimate the grant date fair value of stock options using the Black-Scholes valuation model. Calculating the grant date fair value of stock-based awards is based on certain assumptions and requires judgment, including estimating stock price volatility, and expected life. We have limited historical data of our own to utilize in determining our assumptions. As such, for stock options granted in fiscal
2018
and
2017
, we based our volatility assumption on a combined weighted average of our own historical data and that of a selected peer group. The weighted-average volatility used in determining the grant date fair value of awards granted in fiscal
2018
and
2017
was
42.5%
and
44.5%
, respectively.
Income Taxes
We record valuation allowances against our deferred tax assets when it is more likely than not that all or a portion of a deferred tax asset will not be realized. We routinely evaluate the realizability of our deferred tax assets by assessing the likelihood that our deferred tax assets will be recovered based on all available positive and negative evidence, including scheduled reversals of deferred tax liabilities, estimates of future taxable income, tax planning strategies and results of operations. Estimating future taxable income is inherently uncertain and requires judgment. In projecting future taxable income, we consider our historical results and incorporate certain assumptions, including projected Shack openings, revenue growth, and operating margins, among others. As of
December 26, 2018
, we had
$242.5 million
of deferred tax assets, net of valuation allowances. We expect to realize future tax benefits related to the utilization of these assets. If we determine in the future that we will not be able to fully utilize all or part of
74
|
Shake Shack Inc.
Form 10-K
Form 10-K
these deferred tax assets, we would record a valuation allowance through earnings in the period the determination was made, which would have an adverse effect on our results of operations and earnings in future periods.
Liabilities Under Tax Receivable Agreement
As described in
Note 15
to the consolidated financial statements included in Item 8, we are a party to the Tax Receivable Agreement under which we are contractually committed to pay the non-controlling interest holders 85% of the amount of any tax benefits that we actually realize, or in some cases are deemed to realize, as a result of certain transactions. Amounts payable under the Tax Receivable Agreement are contingent upon, among other things, (i) generation of future taxable income over the term of the Tax Receivable Agreement and (ii) future changes in tax laws. If we do not generate sufficient taxable income in the aggregate over the term of the Tax Receivable Agreement to utilize the tax benefits, then we would not be required to make the related TRA Payments. Therefore, we would only recognize a liability for TRA Payments if we determine if it is probable that we will generate sufficient future taxable income over the term of the Tax Receivable Agreement to utilize the related tax benefits. Estimating future taxable income is inherently uncertain and requires judgment. In projecting future taxable income, we consider our historical results and incorporate certain assumptions, including projected Shack openings, revenue growth, and operating margins, among others. During fiscal
2018
, as a result of the redemptions of LLC Interests, we recognized liabilities totaling
$203.7 million
relating to our obligations under the Tax Receivable Agreement, after concluding that it was probable that we would have sufficient future taxable income to utilize the related tax benefits.
If we determine in the future that we will not be able to fully utilize all or part of the related tax benefits, we would derecognize the portion of the liability related the benefits not expected to be utilized.
Additionally, we estimate the amount of TRA Payments expected to be paid within the next 12 months and classify this amount as current on our Consolidated Balance Sheets. This determination is based on our estimate of taxable income for the next fiscal year. To the extent our estimate differs from actual results, we may be required reclassify portions of our liabilities under the Tax Receivable Agreement between current and non-current.
Shake Shack Inc.
Form 10-K
|
75
Form 10-K
|
75
Item 7A. Quantitative and Qualitative Disclosures About Market Risk.
COMMODITY PRICE RISKS
We are exposed to commodity price risks. Many of the ingredients we use to prepare our food, as well as our packaging materials, are commodities or are affected by the price of other commodities. Factors that affect the price of commodities are generally outside of our control and include foreign currency exchange rates, foreign and domestic supply and demand, inflation, weather, and seasonality. For the majority of our major ingredients, we enter into supply contracts, obligating us to purchase specified quantities. However, the prices associated with these supply contracts are generally not fixed and are typically pegged to a commodity market price and, therefore, fluctuate with the market. Significant increases in the price of commodities could have a material impact on our operating results to the extent that such increases cannot be offset by menu price increases or other operating efficiencies.
FOREIGN CURRENCY EXCHANGE RISK
Although we conduct business outside of the United States, the revenue and expenses associated with our international business are transacted in U.S. dollars and none of our subsidiaries have functional currencies that are not the U.S. dollar. Accordingly, we do not have foreign currency translation risk. However, we are exposed to foreign exchange risk in that sales at our international licensed Shacks are denominated in their local currencies and the amount of licensing revenue we earn is directly affected by fluctuations in currency exchange rates.
INTEREST RATE RISK
We are exposed to interest rate risk through fluctuations in interest rates on our debt obligations. Our Revolving Credit Facility carries interest at a floating rate. We seek to manage exposure to adverse interest rate changes through our normal operating and financing activities. As of
December 26, 2018
, we had
no
outstanding borrowings under the Revolving Credit Facility.
We are also exposed to interest rate risk through fluctuations of interest rates on our investments. Our available-for-sale securities primarily consist of fixed-income and equity instruments. Changes in interest rates affect the interest income we earn, and therefore impact our cash flows and results of operations.
76
|
Shake Shack Inc.
Form 10-K
Form 10-K
Item 8. Financial Statements and Supplementary Data.
INDEX TO FINANCIAL STATEMENTS
|
Page
|
|
Shake Shack Inc.
Form 10-K
|
77
Form 10-K
|
77
MANAGEMENT'S REPORT
Management's Annual Report on the Consolidated Financial Statements
Management is responsible for the preparation, integrity and objectivity of the accompanying consolidated financial statements and related financial information. The consolidated financial statements have been prepared in accordance with accounting principles generally accepted in the United States and necessarily include certain amounts that are based on estimates and informed judgments. Our management also prepared the related financial information included in this Annual Report on Form 10-K and is responsible for its accuracy and consistency with the consolidated financial statements.
Ernst & Young LLP, our independent registered public accounting firm, has audited the Consolidated Financial Statements as of
December 26, 2018
, as stated in their report herein.
Management's Report on Internal Control Over Financial Reporting
Management is responsible for establishing and maintaining adequate internal control over financial reporting, as such term is defined in Exchange Act Rules 13a-15(f). Internal control over financial reporting is a process designed to provide reasonable assurance regarding the reliability of financial reporting and the preparation of the financial statements for external purposes in accordance with generally accepted accounting principles in the United States of America. Because of its inherent limitations, internal control over financial reporting may not prevent or detect misstatements. Also, projections of any evaluation of effectiveness to future periods are subject to the risk that controls may become inadequate because of changes in conditions, or that the degree of compliance with the policies or procedures may deteriorate.
Under the supervision and with the participation of our management, including our chief executive officer and chief financial officer, we assessed the effectiveness of our internal control over financial reporting as of
December 26, 2018
, based on the framework in Internal Control—Integrated Framework (2013), issued by the Committee of Sponsoring Organizations of the Treadway Commission (2013 framework). Based on the results of our evaluation, management concluded that our internal control over financial reporting was effective as of
December 26, 2018
.
Our independent registered public accounting firm, Ernst & Young LLP, has issued an attestation report on the effectiveness of our internal control over financial reporting as of
December 26, 2018
, as stated in their report herein.

|

|
|
|
Randy Garutti
|
Tara Comonte
|
|
|
Chief Executive Officer and Director
|
Chief Financial Officer
|
|
|
(duly authorized and principal executive officer)
|
(duly authorized and principal financial officer)
|
|
78
|
Shake Shack Inc.
Form 10-K
Form 10-K
REPORT OF INDEPENDENT REGISTERED PUBLIC ACCOUNTING FIRM
To the Shareholders and the Board of Directors of Shake Shack Inc.
Opinion on the Financial Statements
We have audited the accompanying consolidated balance sheets of Shake Shack Inc. (the Company) as of
December 26, 2018
and
December 27, 2017
, the related consolidated statements of income (loss), comprehensive income (loss), stockholders' equity and cash flows for each of the three years in the period ended
December 26, 2018
, and the related notes and financial statement schedules listed in the Index at Item 15(a) (collectively referred to as the “consolidated financial statements”). In our opinion, the consolidated financial statements present fairly, in all material respects, the financial position of the Company at
December 26, 2018
and
December 27, 2017
, and the results of its operations and its cash flows for each of the three years in the period ended
December 26, 2018
, in conformity with U.S. generally accepted accounting principles.
We also have audited, in accordance with the standards of the Public Company Accounting Oversight Board (United States) (PCAOB), the Company's internal control over financial reporting as of
December 26, 2018
, based on criteria established in Internal Control-Integrated Framework issued by the Committee of Sponsoring Organizations of the Treadway Commission (2013 framework) and our report dated February 25, 2019 expressed an unqualified opinion thereon.
Adoption of ASU No. 2014-09
As discussed in Note 2 to the consolidated financial statements, the Company changed its method for recognizing revenue effective December 28, 2017 due to the adoption of Accounting Standards Update (ASU) No. 2014-09, Revenue from Contracts with Customers (Topic 606), and the amendments in ASUs 2015-14, 2016-08, 2016-10 and 2016-12.
Basis for Opinion
These financial statements are the responsibility of the Company's management. Our responsibility is to express an opinion on the Company’s financial statements based on our audits. We are a public accounting firm registered with the PCAOB and are required to be independent with respect to the Company in accordance with the U.S. federal securities laws and the applicable rules and regulations of the Securities and Exchange Commission and the PCAOB.
We conducted our audits in accordance with the standards of the PCAOB. Those standards require that we plan and perform the audit to obtain reasonable assurance about whether the financial statements are free of material misstatement, whether due to error or fraud. Our audits included performing procedures to assess the risks of material misstatement of the financial statements, whether due to error or fraud, and performing procedures that respond to those risks. Such procedures included examining, on a test basis, evidence regarding the amounts and disclosures in the financial statements. Our audits also included evaluating the accounting principles used and significant estimates made by management, as well as evaluating the overall presentation of the financial statements. We believe that our audits provide a reasonable basis for our opinion.

We have served as the Company's auditor since 2014.
New York, New York
February 25, 2019
Shake Shack Inc.
Form 10-K
|
79
Form 10-K
|
79
REPORT OF INDEPENDENT REGISTERED PUBLIC ACCOUNTING FIRM
To the Shareholders and the Board of Directors of Shake Shack Inc.
Opinion on Internal Control over Financial Reporting
We have audited Shake Shack Inc.’s (the Company’s) internal control over financial reporting as of December 26, 2018, based on criteria established in Internal Control-Integrated Framework issued by the Committee of Sponsoring Organizations of the Treadway Commission (2013 framework) (the COSO criteria). In our opinion, the Company maintained, in all material respects, effective internal control over financial reporting as of December 26, 2018, based on the COSO criteria.
We also have audited, in accordance with the standards of the Public Company Accounting Oversight Board (United States) (PCAOB), the consolidated balance sheets of the Company as of December 26, 2018 and December 27, 2017, the related consolidated statements of income (loss), comprehensive income (loss), stockholders' equity, and cash flows for each of the three years in the period ended December 26, 2018, and the related notes and financial statement schedules listed in the Index at Item 15(a) (collectively referred to as the “consolidated financial statements”) and our report dated February 25, 2018 expressed an unqualified opinion thereon.
Basis for Opinion
The Company’s management is responsible for maintaining effective internal control over financial reporting and for its assessment of the effectiveness of internal control over financial reporting included in the accompanying Management’s Report on Internal Control over Financial Reporting. Our responsibility is to express an opinion on the Company’s internal control over financial reporting based on our audit. We are a public accounting firm registered with the PCAOB and are required to be independent with respect to the Company in accordance with the U.S. federal securities laws and the applicable rules and regulations of the Securities and Exchange Commission and the PCAOB.
We conducted our audit in accordance with the standards of the PCAOB. Those standards require that we plan and perform the audit to obtain reasonable assurance about whether effective internal control over financial reporting was maintained in all material respects.
Our audit included obtaining an understanding of internal control over financial reporting, assessing the risk that a material weakness exists, testing and evaluating the design and operating effectiveness of internal control based on the assessed risk, and performing such other procedures as we considered necessary in the circumstances. We believe that our audit provides a reasonable basis for our opinion.
Definition and Limitations of Internal Control Over Financial Reporting
A company’s internal control over financial reporting is a process designed to provide reasonable assurance regarding the reliability of financial reporting and the preparation of financial statements for external purposes in accordance with generally accepted accounting principles. A company’s internal control over financial reporting includes those policies and procedures that (1) pertain to the maintenance of records that, in reasonable detail, accurately and fairly reflect the transactions and dispositions of the assets of the company; (2) provide reasonable assurance that transactions are recorded as necessary to permit preparation of financial statements in accordance with generally accepted accounting principles, and that receipts and expenditures of the company are being made only in accordance with authorizations of management and directors of the company; and (3) provide reasonable assurance regarding prevention or timely detection of unauthorized acquisition, use, or disposition of the company’s assets that could have a material effect on the financial statements.
Because of its inherent limitations, internal control over financial reporting may not prevent or detect misstatements. Also, projections of any evaluation of effectiveness to future periods are subject to the risk that controls may become inadequate because of changes in conditions, or that the degree of compliance with the policies or procedures may deteriorate.
New York, New York
February 25, 2019
Shake Shack Inc.
Form 10-K
|
80
Form 10-K
|
80
SHAKE SHACK INC.
CONSOLIDATED BALANCE SHEETS
(in thousands, except share and per share amounts)
|
December 26
2018 |
|
December 27
2017 |
|
||||||
|
ASSETS
|
|||||||||
|
Current assets:
|
|||||||||
|
Cash and cash equivalents
|
$
|
24,750
|
|
$
|
21,507
|
|
|||
|
Marketable securities
|
62,113
|
|
63,036
|
|
|||||
|
Accounts receivable
|
10,523
|
|
5,641
|
|
|||||
|
Inventories
|
1,749
|
|
1,258
|
|
|||||
|
Prepaid expenses and other current assets
|
1,984
|
|
1,757
|
|
|||||
|
Total current assets
|
101,119
|
|
93,199
|
|
|||||
|
Property and equipment, net
|
261,854
|
|
187,095
|
|
|||||
|
Deferred income taxes, net
|
242,533
|
|
185,914
|
|
|||||
|
Other assets
|
5,026
|
|
4,398
|
|
|||||
|
TOTAL ASSETS
|
$
|
610,532
|
|
$
|
470,606
|
|
|||
|
LIABILITIES AND STOCKHOLDERS' EQUITY
|
|||||||||
|
Current liabilities:
|
|||||||||
|
Accounts payable
|
$
|
12,467
|
|
$
|
8,210
|
|
|||
|
Accrued expenses
|
22,799
|
|
11,649
|
|
|||||
|
Accrued wages and related liabilities
|
10,652
|
|
6,228
|
|
|||||
|
Other current liabilities
|
14,030
|
|
7,937
|
|
|||||
|
Total current liabilities
|
59,948
|
|
34,024
|
|
|||||
|
Deemed landlord financing
|
20,846
|
|
14,518
|
|
|||||
|
Deferred rent
|
47,864
|
|
36,596
|
|
|||||
|
Liabilities under tax receivable agreement, net of current portion
|
197,921
|
|
158,436
|
|
|||||
|
Other long-term liabilities
|
10,498
|
|
2,553
|
|
|||||
|
Total liabilities
|
337,077
|
|
246,127
|
|
|||||
|
Commitments and contingencies
|
|
|
|||||||
|
Stockholders' equity:
|
|||||||||
|
Preferred stock, no par value—10,000,000 shares authorized; none issued and outstanding as of December 26, 2018 and December 27, 2017, respectively.
|
—
|
|
—
|
|
|||||
|
Class A common stock, $0.001 par value—200,000,000 shares authorized; 29,520,833 and 26,527,477 shares issued and outstanding as of December 26, 2018 and December 27, 2017, respectively.
|
30
|
|
27
|
|
|||||
|
Class B common stock, $0.001 par value—35,000,000 shares authorized; 7,557,347 and 10,250,007 shares issued and outstanding as of December 26, 2018 and December 27, 2017, respectively.
|
8
|
|
10
|
|
|||||
|
Additional paid-in capital
|
195,633
|
|
153,105
|
|
|||||
|
Retained earnings
|
30,404
|
|
16,399
|
|
|||||
|
Accumulated other comprehensive loss
|
—
|
|
(49
|
)
|
|||||
|
Total stockholders' equity attributable to Shake Shack Inc.
|
226,075
|
|
169,492
|
|
|||||
|
Non-controlling interests
|
47,380
|
|
54,987
|
|
|||||
|
Total equity
|
273,455
|
|
224,479
|
|
|||||
|
TOTAL LIABILITIES AND STOCKHOLDERS' EQUITY
|
$
|
610,532
|
|
$
|
470,606
|
|
|||
See accompanying Notes to Consolidated Financial Statements.
Shake Shack Inc.
Form 10-K
|
81
Form 10-K
|
81
SHAKE SHACK INC.
CONSOLIDATED STATEMENTS OF INCOME (LOSS)
(in thousands, except per share amounts)
|
|
|
Fiscal Year Ended
|
|||||||||||||
|
December 26
2018 |
|
December 27
2017 |
|
December 28
2016 |
|
||||||||
|
Shack sales
|
$
|
445,589
|
|
$
|
346,388
|
|
$
|
259,350
|
|
||||
|
Licensing revenue
|
13,721
|
|
12,422
|
|
9,125
|
|
|||||||
|
TOTAL REVENUE
|
459,310
|
|
358,810
|
|
268,475
|
|
|||||||
|
Shack-level operating expenses:
|
|||||||||||||
|
Food and paper costs
|
126,096
|
|
98,337
|
|
73,752
|
|
|||||||
|
Labor and related expenses
|
122,094
|
|
91,740
|
|
65,540
|
|
|||||||
|
Other operating expenses
|
51,783
|
|
35,805
|
|
24,946
|
|
|||||||
|
Occupancy and related expenses
|
32,710
|
|
28,197
|
|
21,820
|
|
|||||||
|
General and administrative expenses
|
52,720
|
|
39,003
|
|
30,556
|
|
|||||||
|
Depreciation expense
|
29,000
|
|
21,704
|
|
14,502
|
|
|||||||
|
Pre-opening costs
|
12,279
|
|
9,603
|
|
9,520
|
|
|||||||
|
Loss on disposal of property and equipment
|
917
|
|
608
|
|
34
|
|
|||||||
|
TOTAL EXPENSES
|
427,599
|
|
324,997
|
|
240,670
|
|
|||||||
|
OPERATING INCOME
|
31,711
|
|
33,813
|
|
27,805
|
|
|||||||
|
Other income, net
|
1,514
|
|
128,123
|
|
1,065
|
|
|||||||
|
Interest expense
|
(2,415
|
)
|
(1,643
|
)
|
(374
|
)
|
|||||||
|
INCOME BEFORE INCOME TAXES
|
30,810
|
|
160,293
|
|
28,496
|
|
|||||||
|
Income tax expense
|
8,862
|
|
151,409
|
|
6,350
|
|
|||||||
|
NET INCOME
|
21,948
|
|
8,884
|
|
22,146
|
|
|||||||
|
Less: net income attributable to non-controlling interests
|
6,769
|
|
9,204
|
|
9,700
|
|
|||||||
|
NET INCOME (LOSS) ATTRIBUTABLE TO SHAKE SHACK INC.
|
$
|
15,179
|
|
$
|
(320
|
)
|
$
|
12,446
|
|
||||
|
Earnings (loss) per share of Class A common stock:
|
|||||||||||||
|
Basic
|
$
|
0.54
|
|
$
|
(0.01
|
)
|
$
|
0.54
|
|
||||
|
Diluted
|
$
|
0.52
|
|
$
|
(0.01
|
)
|
$
|
0.53
|
|
||||
|
Weighted-average shares of Class A common stock outstanding:
|
|||||||||||||
|
Basic
|
28,299
|
|
25,876
|
|
22,956
|
|
|||||||
|
Diluted
|
29,179
|
|
25,876
|
|
23,449
|
|
|||||||
See accompanying Notes to Consolidated Financial Statements.
82
|
Shake Shack Inc.
Form 10-K
Form 10-K
SHAKE SHACK INC.
CONSOLIDATED STATEMENTS OF COMPREHENSIVE INCOME (LOSS)
(in thousands)
|
Fiscal Year Ended
|
|||||||||||||
|
December 26
2018 |
|
December 27
2017 |
|
December 28
2016 |
|
||||||||
|
Net income
|
$
|
21,948
|
|
$
|
8,884
|
|
$
|
22,146
|
|
||||
|
Other comprehensive income (loss), net of tax:
|
|||||||||||||
|
Available-for-sale securities
(1)
:
|
|||||||||||||
|
Change in net unrealized holding losses
|
(3
|
)
|
(94
|
)
|
(35
|
)
|
|||||||
|
Less: reclassification adjustments for net realized losses included in net income
|
16
|
|
47
|
|
19
|
|
|||||||
|
Net change
|
13
|
|
(47
|
)
|
(16
|
)
|
|||||||
|
OTHER COMPREHENSIVE INCOME (LOSS)
|
13
|
|
(47
|
)
|
(16
|
)
|
|||||||
|
COMPREHENSIVE INCOME
|
21,961
|
|
8,837
|
|
22,130
|
|
|||||||
|
Less: comprehensive income attributable to non-controlling interests
|
6,772
|
|
9,191
|
|
9,694
|
|
|||||||
|
COMPREHENSIVE INCOME (LOSS) ATTRIBUTABLE TO SHAKE SHACK INC.
|
$
|
15,189
|
|
$
|
(354
|
)
|
$
|
12,436
|
|
||||
(1) Net of tax benefit of
$0
for fiscal years ended
December 26, 2018
,
December 27, 2017
and
December 28, 2016
.
See accompanying Notes to Consolidated Financial Statements.
Shake Shack Inc.
Form 10-K
|
83
Form 10-K
|
83
SHAKE SHACK INC.
CONSOLIDATED STATEMENTS OF STOCKHOLDERS' EQUITY
(in thousands, except share amounts)
|
Class A
Common Stock
|
Class B
Common Stock
|
Additional
Paid-In
Capital
|
|
Retained Earnings
|
|
Accumulated Other Comprehensive Income (Loss)
|
|
Non-
Controlling
Interest
|
|
Total
Equity
|
|
||||||||||||||||||||||
|
Shares
|
|
Amount
|
|
Shares
|
|
Amount
|
|
||||||||||||||||||||||||||
|
BALANCE, DECEMBER 30, 2015
|
19,789,259
|
|
$
|
20
|
|
16,460,741
|
|
$
|
16
|
|
$
|
96,311
|
|
$
|
4,273
|
|
$
|
(5
|
)
|
$
|
56,404
|
|
$
|
157,019
|
|
||||||||
|
Net income
|
12,446
|
|
9,700
|
|
22,146
|
|
|||||||||||||||||||||||||||
|
Other comprehensive loss:
|
|||||||||||||||||||||||||||||||||
|
Net unrealized losses related to available-for-sale securities
|
(10
|
)
|
(6
|
)
|
(16
|
)
|
|||||||||||||||||||||||||||
|
Equity-based compensation
|
5,493
|
|
5,493
|
|
|||||||||||||||||||||||||||||
|
Stock option exercises
|
154,976
|
|
—
|
|
795
|
|
2,402
|
|
3,197
|
|
|||||||||||||||||||||||
|
Income tax effect of stock compensation plans
|
30
|
|
3
|
|
33
|
|
|||||||||||||||||||||||||||
|
Redemption of LLC Interests
|
5,207,149
|
|
5
|
|
(5,207,149
|
)
|
(5
|
)
|
16,986
|
|
(16,986
|
)
|
—
|
|
|||||||||||||||||||
|
Establishment of liabilities under tax receivable agreement and related changes to deferred tax assets associated with increases in tax basis
|
15,833
|
|
15,833
|
|
|||||||||||||||||||||||||||||
|
Distributions paid and payable to non-controlling interest holders
|
(2,352
|
)
|
(2,352
|
)
|
|||||||||||||||||||||||||||||
|
BALANCE, DECEMBER 28, 2016
|
25,151,384
|
|
25
|
|
11,253,592
|
|
11
|
|
135,448
|
|
16,719
|
|
(15
|
)
|
49,165
|
|
201,353
|
|
|||||||||||||||
|
Net income (loss)
|
(320
|
)
|
9,204
|
|
8,884
|
|
|||||||||||||||||||||||||||
|
Other comprehensive loss:
|
|
||||||||||||||||||||||||||||||||
|
Net unrealized losses related to available-for-sale securities
|
(34
|
)
|
(13
|
)
|
(47
|
)
|
|||||||||||||||||||||||||||
|
Equity-based compensation
|
5,732
|
|
5,732
|
|
|||||||||||||||||||||||||||||
|
Activity under stock compensation plans
|
372,508
|
|
1
|
|
4,451
|
|
2,818
|
|
7,270
|
|
|||||||||||||||||||||||
|
Redemption of LLC Interests
|
1,003,585
|
|
1
|
|
(1,003,585
|
)
|
(1
|
)
|
4,415
|
|
(4,415
|
)
|
—
|
|
|||||||||||||||||||
|
Establishment of liabilities under tax receivable agreement and related changes to deferred tax assets associated with increases in tax basis
|
3,059
|
|
3,059
|
|
|||||||||||||||||||||||||||||
|
Distributions paid to non-controlling interest holders
|
(1,772
|
)
|
(1,772
|
)
|
|||||||||||||||||||||||||||||
|
BALANCE, DECEMBER 27, 2017
|
26,527,477
|
|
27
|
|
10,250,007
|
|
10
|
|
153,105
|
|
16,399
|
|
(49
|
)
|
54,987
|
|
224,479
|
|
|||||||||||||||
|
Cumulative effect of accounting changes
|
(1,174
|
)
|
39
|
|
(439
|
)
|
(1,574
|
)
|
|||||||||||||||||||||||||
|
Net income
|
15,179
|
|
6,769
|
|
21,948
|
|
|||||||||||||||||||||||||||
|
Other comprehensive income:
|
|||||||||||||||||||||||||||||||||
|
Net change related to available-for-sale securities
|
10
|
|
3
|
|
13
|
|
|||||||||||||||||||||||||||
|
Equity-based compensation
|
6,250
|
|
6,250
|
|
|||||||||||||||||||||||||||||
|
Activity under stock compensation plans
|
300,696
|
|
1
|
|
2,509
|
|
2,013
|
|
4,523
|
|
|||||||||||||||||||||||
|
Redemption of LLC Interests
|
2,692,660
|
|
2
|
|
(2,692,660
|
)
|
(2
|
)
|
15,202
|
|
(15,202
|
)
|
—
|
|
|||||||||||||||||||
|
Establishment of liabilities under tax receivable agreement and related changes to deferred tax assets associated with increases in tax basis
|
18,567
|
|
18,567
|
|
|||||||||||||||||||||||||||||
|
Distributions paid to non-controlling interest holders
|
(751
|
)
|
(751
|
)
|
|||||||||||||||||||||||||||||
|
BALANCE, DECEMBER 26, 2018
|
29,520,833
|
|
$
|
30
|
|
7,557,347
|
|
$
|
8
|
|
$
|
195,633
|
|
$
|
30,404
|
|
$
|
—
|
|
$
|
47,380
|
|
$
|
273,455
|
|
||||||||
See accompanying Notes to Consolidated Financial Statements.
84
|
Shake Shack Inc.
Form 10-K
Form 10-K
SHAKE SHACK INC.
CONSOLIDATED STATEMENTS OF CASH FLOWS
(in thousands)
|
Fiscal Year Ended
|
||||||||||||||||
|
December 26
2018 |
|
December 27
2017 |
|
December 28
2016 |
|
|||||||||||
|
OPERATING ACTIVITIES
|
||||||||||||||||
|
Net income (including amounts attributable to non-controlling interests)
|
$
|
21,948
|
|
$
|
8,884
|
|
$
|
22,146
|
|
|||||||
|
Adjustments to reconcile net income to net cash provided by operating activities:
|
||||||||||||||||
|
Depreciation expense
|
29,000
|
|
21,704
|
|
14,502
|
|
||||||||||
|
Equity-based compensation
|
6,143
|
|
5,623
|
|
5,354
|
|
||||||||||
|
Deferred income taxes
|
788
|
|
146,334
|
|
(523
|
)
|
||||||||||
|
Non-cash interest expense
|
72
|
|
317
|
|
304
|
|
||||||||||
|
Excess tax benefits on equity-based compensation
|
—
|
|
—
|
|
(33
|
)
|
||||||||||
|
Loss on sale of marketable securities
|
16
|
|
5
|
|
18
|
|
||||||||||
|
Loss on disposal of property and equipment
|
917
|
|
608
|
|
34
|
|
||||||||||
|
Other non-cash expense (income)
|
(78
|
)
|
(127,221
|
)
|
(688
|
)
|
||||||||||
|
Net loss on sublease
|
672
|
|
—
|
|
—
|
|
||||||||||
|
Changes in operating assets and liabilities:
|
||||||||||||||||
|
Accounts receivable
|
5,530
|
|
6,421
|
|
2,974
|
|
||||||||||
|
Inventories
|
(491
|
)
|
(452
|
)
|
(263
|
)
|
||||||||||
|
Prepaid expenses and other current assets
|
(270
|
)
|
2,244
|
|
(756
|
)
|
||||||||||
|
Other assets
|
(2,726
|
)
|
(446
|
)
|
(822
|
)
|
||||||||||
|
Accounts payable
|
3,156
|
|
1,235
|
|
839
|
|
||||||||||
|
Accrued expenses
|
7,979
|
|
4,388
|
|
5,560
|
|
||||||||||
|
Accrued wages and related liabilities
|
4,424
|
|
144
|
|
280
|
|
||||||||||
|
Other current liabilities
|
860
|
|
(988
|
)
|
2,130
|
|
||||||||||
|
Deferred rent
|
1,247
|
|
1,008
|
|
3,415
|
|
||||||||||
|
Other long-term liabilities
|
6,208
|
|
1,070
|
|
(186
|
)
|
||||||||||
|
NET CASH PROVIDED BY OPERATING ACTIVITIES
|
85,395
|
|
70,878
|
|
54,285
|
|
||||||||||
|
INVESTING ACTIVITIES
|
|
|
||||||||||||||
|
Purchases of property and equipment
|
(87,525
|
)
|
(61,533
|
)
|
(54,433
|
)
|
||||||||||
|
Purchases of marketable securities
|
(1,223
|
)
|
(7,861
|
)
|
(61,266
|
)
|
||||||||||
|
Sales of marketable securities
|
2,144
|
|
7,451
|
|
938
|
|
||||||||||
|
NET CASH USED IN INVESTING ACTIVITIES
|
(86,604
|
)
|
(61,943
|
)
|
(114,761
|
)
|
||||||||||
|
FINANCING ACTIVITIES
|
||||||||||||||||
|
Payments on promissory note
|
—
|
|
—
|
|
(313
|
)
|
||||||||||
|
Proceeds from deemed landlord financing
|
1,382
|
|
1,183
|
|
65
|
|
||||||||||
|
Payments on deemed landlord financing
|
(702
|
)
|
(266
|
)
|
—
|
|
||||||||||
|
Distributions paid to non-controlling interest holders
|
(751
|
)
|
(2,379
|
)
|
(1,745
|
)
|
||||||||||
|
Payments under tax receivable agreement
|
—
|
|
(4,844
|
)
|
—
|
|
||||||||||
|
Proceeds from stock option exercises
|
5,472
|
|
7,585
|
|
3,194
|
|
||||||||||
|
Employee withholding taxes related to net settled equity awards
|
(949
|
)
|
(314
|
)
|
—
|
|
||||||||||
|
Excess tax benefits from equity-based compensation
|
—
|
|
—
|
|
33
|
|
||||||||||
|
NET CASH PROVIDED BY FINANCING ACTIVITIES
|
4,452
|
|
965
|
|
1,234
|
|
||||||||||
|
INCREASE (DECREASE) IN CASH AND CASH EQUIVALENTS
|
3,243
|
|
9,900
|
|
(59,242
|
)
|
||||||||||
|
CASH AND CASH EQUIVALENTS AT BEGINNING OF PERIOD
|
21,507
|
|
11,607
|
|
70,849
|
|
||||||||||
|
CASH AND CASH EQUIVALENTS AT END OF PERIOD
|
$
|
24,750
|
|
$
|
21,507
|
|
$
|
11,607
|
|
|||||||
See accompanying Notes to Consolidated Financial Statements.
Shake Shack Inc.
Form 10-K
|
85
Form 10-K
|
85
SHAKE SHACK INC.
NOTES TO CONSOLIDATED FINANCIAL STATEMENTS
(in thousands, except share and per share amounts)
|
Page
|
||
86
|
Shake Shack Inc.
Form 10-K
Form 10-K
NOTE
1
: NATURE OF OPERATIONS
Sha
ke Shack Inc. was formed on September 23, 2014 as a Delaware corporation for the purpose of facilitating an initial public offering and other related tran
sactions in order to carry on the business of SSE Holdings, LLC and its subsidiaries. Unless the context otherwise requires, references to "we," "us," "our," "Shake Shack" and the "Company" refer to Shake Shack Inc. and its subsidiaries, including SSE Holdings, LLC, which we refer to as "SSE Holdings."
We operate and license Shake Shack restaurants ("Shacks"), which serve hamburgers, hot dogs, chicken, crinkle cut fries, shakes, frozen custard, beer, wine and more. As of
December 26, 2018
, there were
208
Shacks in operation, system-wide, of which
124
were domestic company-operated Shacks,
12
were domestic licensed Shacks and
72
were international licensed Shacks.
NOTE
2
: SUMMARY OF SIGNIFICANT ACCOUNTING POLICIES
Basis of Presentation
The accompanying consolidated financial statements have been prepared in accordance with accounting principles generally accepted in the United States of America (“U.S. GAAP”) and include our accounts and the accounts of our subsidiaries. All intercompany accounts and transactions have been eliminated in consolidation. Certain reclassifications have been made to prior period amounts to conform to the current year presentation.
SSE Holdings is considered a variable interest entity. Shake Shack Inc. is the primary beneficiary as we have the majority economic interest in SSE Holdings and, as the sole managing member, have decision making authority that significantly affects the economic performance of the entity, while the limited partners have no substantive kick-out or participating rights. As a result, we will continue to consolidate SSE Holdings. The assets and liabilities of SSE Holdings represent substantially all of our consolidated assets and liabilities with the exception of certain deferred taxes and liabilities under the Tax Receivable Agreement. As of
December 26, 2018
and
December 27, 2017
, the net assets of SSE Holdings were
$232,711
and
$197,301
, respectively. The assets of SSE Holdings are subject to certain restrictions in SSE Holdings' revolving credit agreements. See Note 9 for more information.
Fiscal Year
We operate on a 52/53 week fiscal year ending on the last Wednesday in December. Fiscal year
2018
contained 52 weeks and ended on
December 26, 2018
. Fiscal year
2017
contained 52 weeks and ended on
December 27, 2017
. Fiscal year
2016
contained 52 weeks and ended on
December 28, 2016
. Unless otherwise stated, references to years in this report relate to fiscal years.
Use of Estimates
The preparation of these consolidated financial statements in conformity with U.S. GAAP requires management to make estimates and assumptions that affect the reported amounts of assets and liabilities and disclosure of contingent assets and liabilities at the date of the financial statements, and the reported amounts of sales and expenses during the reporting period. Actual results could differ from those estimates.
Segment Reporting
We own and operate Shacks in the United States. We also have domestic and international licensed operations. Our chief operating decision maker (the "CODM") is our Chief Executive Officer. As the CODM reviews financial performance and allocates resources at a consolidated level on a recurring basis, we have
one
operating segment and
one
reportable segment.
Fair Value Measurements
We apply fair value accounting for all financial assets and liabilities and non-financial assets and liabilities that are recognized or disclosed at fair value in the financial statements on a recurring basis. Fair value is defined as the price that would be received from
Shake Shack Inc.
Form 10-K
|
87
Form 10-K
|
87
selling an asset or paid to transfer a liability in an orderly transaction between market participants at the measurement date. When determining the fair value measurements for assets and liabilities that are required to be recorded at fair value, we assume the highest and best use of the asset by market participants in which we would transact and the market-based risk measurements or assumptions that market participants would use in pricing the asset or liability, such as inherent risk, transfer restrictions, and credit risk.
Assets and liabilities are classified using a fair value hierarchy, which prioritizes the inputs used to measure fair value into three levels, and bases the categorization within the hierarchy upon the lowest level of input that is available and significant to the fair value measurement:
|
▪
|
Level 1 - Quoted prices in active markets for identical assets or liabilities
|
|
▪
|
Level 2 - Observable inputs other than quoted prices in active markets for identical assets or liabilities, quoted prices for identical assets or liabilities in inactive markets, or other inputs that are observable or can be corroborated by observable market data for substantially the full term of the assets or liabilities
|
|
▪
|
Level 3 - Inputs that are both unobservable and significant to the overall fair value measurements reflecting an entity's estimates of assumptions that market participants would use in pricing the asset or liability
|
Cash and Cash Equivalents
Cash and cash equivalents consist primarily of cash on hand, deposits with banks, and short-term, highly liquid investments that have original maturities of three months or less. Cash equivalents are stated at cost, which approximates fair value. Cash equivalents consist primarily of money market funds.
Accounts Receivable
Accounts receivable consist primarily of receivables from landlords for tenant improvement allowances, receivables from our licensees for licensing revenue and related reimbursements, credit card receivables and vendor rebates. We evaluate the collectibility of our accounts receivable based on a variety of factors, including historical experience, current economic conditions and other factors.
Inventories
Inventories, which consist of food, beer, wine, other beverages and retail merchandise, are stated at the lower of cost or net realizable value with cost determined on a first-in, first-out basis. No adjustment is deemed necessary to reduce inventory to net realizable value due to the rapid turnover and high utilization of inventory.
Property and Equipment
Property and equipment is stated at historical cost less accumulated depreciation. Property and equipment is depreciated based on the straight-line method over the estimated useful lives of the assets, generally ranging from three to seven years for equipment, furniture and fixtures, and computer equipment and software. Leasehold improvements are depreciated over the shorter of their estimated useful life or the related lease life, generally ranging from
10
to
15
years. Landlord funded assets are depreciated over the shorter of their estimated useful life or the related lease life, generally ranging from
10
to
15
years. For leases with renewal periods at our option, we use the original lease term, excluding renewal option periods, to determine estimated useful lives.
Costs incurred when constructing Shacks are capitalized. The cost of repairs and maintenance are expensed when incurred. Costs for refurbishments and improvements that significantly increase the productive capacity or extend the useful life of the asset are capitalized. When assets are disposed of, the resulting gain or loss is recognized on the Consolidated Statements of Income (Loss).
We assess potential impairments to our long-lived assets, which includes property and equipment, whenever events or circumstances indicate that the carrying amount of an asset may not be recoverable. Recoverability of an asset is measured by a comparison of the carrying amount of an asset group to its estimated undiscounted future cash flows expected to be generated by the asset. If the carrying amount of the asset group exceeds its estimated undiscounted future cash flows, an impairment charge is recognized
88
|
Shake Shack Inc.
Form 10-K
Form 10-K
as the amount by which the carrying amount of the asset exceeds the fair value of the asset. There were
no
impairment charges recorded in fiscal
2018
,
2017
and
2016
.
Deferred Financing Costs
Deferred financing costs incurred in connection with the issuance of long-term debt and establishing credit facilities are capitalized and amortized to interest expense based on the related debt agreements. Deferred financing costs are included in other assets on the Consolidated Balance Sheets.
Other Assets
Other assets consist primarily of capitalized implementation costs from cloud computing arrangements, long-term marketable securities, security deposits, transferable liquor licenses and certain custom furniture pre-ordered for future Shacks and yet to be placed in service.
The costs of obtaining non-transferable liquor licenses that are directly issued by local government agencies for nominal fees are expensed as incurred. The costs of purchasing transferable liquor licenses through open markets in jurisdictions with a limited number of authorized liquor licenses are capitalized as indefinite-lived intangible assets. Annual liquor license renewal fees are expensed over the renewal term. As of
December 26, 2018
and
December 27, 2017
, indefinite-lived intangible assets relating to transferable liquor licenses totaled
$1,159
and
$894
, respectively. We evaluate our indefinite-lived intangible assets for impairment annually during our fiscal fourth quarter, and whenever events or changes in circumstances indicate that an impairment may exist. When evaluating other intangible assets for impairment, we may first perform a qualitative assessment to determine whether it is more likely than not that an intangible asset group is impaired. If we do not perform the qualitative assessment, or if we determine that it is not more likely than not that the fair value of the intangible asset group exceeds its carrying amount, we calculate the estimated fair value of the intangible asset group. If the carrying amount of the intangible asset group exceeds the estimated fair value, an impairment charge is recorded to reduce the carrying value to the estimated fair value. In addition, we continuously monitor and may revise our intangible asset useful lives if and when facts and circumstances change.
Equity-based Compensation
Equity-based compensation expense is measured based on fair value. For awards with graded-vesting features and service conditions only, compensation expense is recognized on a straight-line basis over the total requisite service period for the entire award. For awards with graded-vesting features and a combination of service and performance conditions, compensation expense is recognized using a graded-vesting attribution method over the vesting period based on the most probable outcome of the performance conditions. Forfeitures are recognized as they occur for all equity awards. Equity-based compensation expense is included within general and administrative expenses and
labor and related expenses
on the Consolidated Statements of
Income (Loss)
.
Leases
We lease all of our domestic company-operated Shacks, our Home Office and certain equipment under various non-cancelable lease agreements that expire on various dates through 2035. Generally, our real estate leases have initial terms ranging from
10
to
15
years and typically include
two
five
-year renewal options. At the inception of each lease, we determine its classification as an operating or capital lease. Most of our leases are classified as operating leases and typically provide for fixed minimum rent payments and/or contingent rent payments based upon sales in excess of specified thresholds. When the achievement of such sales thresholds are deemed to be probable, contingent rent is accrued in proportion to the sales recognized during the period. For operating leases that include rent holidays and rent escalation clauses, we recognize rent expense on a straight-line basis over the lease term from the date we take possession of the leased property. The difference between the straight-line rent amounts and amounts payable under the lease agreements is recorded as deferred rent and is included as rent expense in occupancy and related expenses on the Consolidated Statements of
Income (Loss)
. Rent expense incurred before a Shack opens is recorded in pre-opening costs. Once a domestic company-operated Shack opens, we record the straight-line rent expense and any contingent rent, if applicable, in occupancy and related expenses on the Consolidated Statements of
Income (Loss)
.
Shake Shack Inc.
Form 10-K
|
89
Form 10-K
|
89
Many of our leases also require us to pay real estate taxes, common area maintenance costs and other occupancy costs which are included in occupancy and related expenses on the Consolidated Statements of
Income (Loss)
.
We expend cash for leasehold improvements to build out and equip our leased premises. Generally, a portion of the leasehold improvements and building costs are reimbursed by our landlords as landlord incentives pursuant to agreed-upon terms in our lease agreements. If obtained, landlord incentives usually take the form of up-front cash, full or partial credits against our future minimum or contingent rents otherwise payable by us, or a combination thereof. When contractually due, we classify landlord incentives as deferred rent on the Consolidated Balance Sheets and amortize the landlord incentives on a straight-line basis over the lease term as a reduction of occupancy costs and related expenses or pre-opening costs on the Consolidated Statements of
Income (Loss)
.
Lease Financing Arrangements
In certain leasing arrangements, due to our involvement in the construction of the leased assets, we are considered the owner of the leased assets for accounting purposes. In such cases, in addition to capitalizing our own construction costs, we capitalize the construction costs funded by the landlord related to our leased premises, and also recognize a corresponding liability for those costs as deemed landlord financing. If, upon completion of construction, the arrangement does not meet the sales recognition criteria under the sale-leaseback accounting guidance, we are precluded from de-recognizing the landlord-funded asset and related financing obligation and continue to account for the landlord-funded asset as if we were the legal owner. If de-recognition is permitted we are required to account for the lease as either an operating or capital lease.
As of
December 26, 2018
, we were deemed to be the accounting owner of
24
leased Shacks,
one
of which was under construction as of the end of the period. As of
December 27, 2017
, we were deemed to be the accounting owner of
23
leased Shacks,
11
of which were under construction as of the end of the period.
Revenue Recognition
Revenue consists of Shack sales and licensing revenue. Generally, revenue is recognized as promised goods or services transfer to the guest or customer in an amount that reflects the consideration we expect to be entitled in exchange for those goods or services.
Revenue from Shack sales is presented net of discounts and recognized when food, beverage and retail products are sold. Sales tax collected from customers is excluded from Shack sales and the obligation is included in sales tax payable until the taxes are remitted to the appropriate taxing authorities. Revenue from our gift cards is deferred and recognized upon redemption.
Licensing revenues include initial territory fees, Shack opening fees, and ongoing sales-based royalty fees from licensed Shacks.
Income Taxes
We account for income taxes pursuant to the asset and liability method which requires the recognition of deferred income tax assets and liabilities related to the expected future tax consequences arising from temporary differences between the carrying amounts and tax bases of assets and liabilities based on enacted statutory tax rates applicable to the periods in which the temporary differences are expected to reverse. Any effects of changes in income tax rates or laws are included in income tax expense in the period of enactment. A valuation allowance is recognized if we determine it is more likely than not that all or a portion of a deferred tax asset will not be recognized.
Pre-Opening Costs
Pre-opening costs are expensed as incurred and consist primarily of legal fees, marketing expenses, occupancy, manager and employee wages, travel and related training costs incurred prior to the opening of a Shack.
90
|
Shake Shack Inc.
Form 10-K
Form 10-K
Advertising
The cost of advertising is expensed as incurred. Advertising costs amounted to
$399
,
$357
and
$147
in fiscal
2018
,
2017
and
2016
, respectively, and are included in general and administrative expense and other operating expenses on the Consolidated Statements of
Income (Loss)
.
Recently Adopted Accounting Pronouncements
We adopted the Accounting Standards Updates (“ASUs”) summarized below in fiscal 2018.
|
Accounting Standards Update (“ASU”)
|
Description
|
Date
Adopted
|
|
Revenue from Contracts with Customers and related standards
(ASU’s 2014-09, 2015-14, 2016-08, 2016-10, 2016-12, 2016-20)
|
This standard supersedes the existing revenue recognition guidance and provides a new framework for recognizing revenue. The core principle of the standard is that an entity should recognize revenue to depict the transfer of promised goods or services to customers in an amount that reflects the consideration to which the entity expects to be entitled in exchange for those goods and services. The new standard also requires significantly more comprehensive disclosures than the existing standard. Guidance subsequent to ASU 2014-09 has been issued to clarify various provisions in the standard, including principal versus agent considerations, identifying performance obligations, licensing transactions, as well as various technical corrections and improvements.
See Note 3 for more information.
|
December 28, 2017
|
|
Recognition and Measurement of Financial Assets and Financial Liabilities
(ASU 2016-01)
|
For public business entities, this standard requires: (i) certain equity investments to be measured at fair value with changes in fair value recognized in net income; (ii) a qualitative assessment to identify impairment of equity investments without readily determinable fair values; (iii) elimination of the requirement to disclose the method(s) and significant assumptions used to estimate the fair value for financial instruments measured at amortized cost on the balance sheet; (iv) use of the exit price notion when measuring the fair value of financial instruments for disclosure purposes; (v) separate presentation in other comprehensive income of the portion of the total change in the fair value of a liability resulting from a change in the instrument-specific credit risk when the entity has elected to measure the liability at fair value in accordance with the fair value option for financial instruments; (vi) separate presentation of financial assets and liabilities by measurement category and form of financial asset in the financial statements; and (vii) an entity to evaluate the need for a valuation allowance on a deferred tax asset related to available-for-sale securities in combination with the entity’s other deferred tax assets.
The adoption of this standard did not have a material impact to our consolidated financial statements.
|
December 28, 2017
|
|
Statement of Cash Flows: Classification of Certain Cash Receipts and Payments
(ASU 2016-15)
|
This standard provides guidance on eight specific cash flow issues with the objective of reducing diversity in practice.
The adoption of this standard did not have a material impact to our consolidated financial statements.
|
December 28, 2017
|
|
Customer's Accounting for Implementation Costs Incurred in a Cloud Computing Arrangement That Is a Service Contract
(ASU 2018-15)
|
This standard provides additional guidance on accounting for costs of implementation activities performed in a cloud computing arrangement that is a service contract. The standard aligns the requirements for capitalizing implementation costs of such arrangements with the requirements for capitalizing implementation costs incurred to develop or obtain internal-use software. The standard also clarifies the presentation and classification of the capitalized costs, amortization expense, and the associated treatment in the statement of cash flows by aligning these items with the same treatment for costs of the hosting service itself.
We adopted this standard on a prospective basis on September 27, 2018, and began capitalizing certain costs related to the implementation of an enterprise-wide system initiative that previously would have been expensed. As of December 26, 2018, we have capitalized certain implementation costs within other assets. We will begin amortizing the implementation costs once the system is ready for its intended use, on a straight-line basis, over the term of the related service agreements. The amortization expense related to cloud computing arrangements that are service contracts will be recorded within general and administrative expenses.
|
September 27, 2018
|
Shake Shack Inc.
Form 10-K
|
91
Form 10-K
|
91
Recently Issued Accounting Pronouncements
|
Accounting Standards Update (“ASU”)
|
Description
|
Expected Impact
|
Effective Date
|
|
Leases
(ASU's 2016-02, 2018-01, 2018-10, 2018-11)
|
This standard establishes a new lease accounting model, which introduces the recognition of lease assets and liabilities for those leases classified as operating leases under previous GAAP. It should be applied using a modified retrospective approach applied either at the beginning of the earliest period presented, or at the adoption date, with the option to elect various practical expedients. Early adoption is permitted.
|
We will adopt the standard on December 27, 2018, electing the optional transition method to apply the standard as of the transition date. As a result, we will not apply the standard to the comparative periods presented.
We have elected the transition package of three practical expedients permitted under the new standard, which among other things, allows us to carryforward our historical lease classifications. We also made certain accounting policy elections for new leases post-transition, including the election to combine components.
The adoption will have a significant impact to our consolidated balance sheet given the extent of our real estate lease portfolio. We will derecognize all landlord funded assets, deemed financing liabilities and deferred rent liabilities upon transition. We will record a right-of-use asset and lease liability for those leases as well as all other existing leases, the majority of which are real estate operating leases. We expect the adoption to result in a net increase of between $207,000 to $217,000 in lease assets and $202,000 to $212,000 in lease liabilities. The difference between the additional lease assets and lease liabilities, net of tax, will be recorded as an adjustment through equity.
Our existing operating leases will not have a material impact on our statement of income post-transition. For those leases where we are involved in construction and deemed to be the accounting owner, they will be accounted for as operating leases post-transition, resulting in an increase to occupancy and related expenses, and a decrease to interest and depreciation expense.
We are substantially complete with our implementation efforts.
|
December 27, 2018
|
92
|
Shake Shack Inc.
Form 10-K
Form 10-K
NOTE
3
: REVENUE
On December 28, 2017 we adopted ASU 2014-09,
Revenue from Contracts with Customers (Topic 606)
, using the modified retrospective method applied to those contracts which were not completed as of December 28, 2017. We elected a practical expedient to aggregate the effect of all contract modifications that occurred before the adoption date, which did not have a material impact to our consolidated financial statements. Results for reporting periods beginning on or after December 28, 2017 are presented under Accounting Standards Codification Topic 606 ("ASC 606"). Prior period amounts were not revised and continue to be reported in accordance with ASC Topic 605 ("ASC 605"), the accounting standard then in effect.
Upon transition, on December 28, 2017, we recorded a decrease to opening equity of
$1,574
, net of tax, of which
$1,135
was recognized in retained earnings and accumulated other comprehensive income (loss) and
$439
in non-controlling interest, with a corresponding increase of
$1,769
in other long-term liabilities, a decrease of
$68
in other current liabilities and an increase of
$100
to accounts receivable.
Revenue Recognition
Revenue consists of Shack sales and licensing revenue. Generally, revenue is recognized as promised goods or services transfer to the guest or customer in an amount that reflects the consideration we expect to be entitled in exchange for those goods or services.
Revenue from Shack sales is presented net of discounts and recognized when food, beverage and retail products are sold. Sales tax collected from customers is excluded from Shack sales and the obligation is included in sales tax payable until the taxes are remitted to the appropriate taxing authorities. Revenue from our gift cards is deferred and recognized upon redemption.
Licensing revenues include initial territory fees, Shack opening fees and ongoing sales-based royalty fees from licensed Shacks. Generally, the licenses granted to develop, open and operate each Shack in a specified territory are the predominant goods or services transferred to the licensee in our contracts, and represent distinct performance obligations. Ancillary promised services, such as training and assistance during the initial opening of a Shack, are typically combined with the licenses and considered as one performance obligation per Shack. We determine the transaction price for each contract, which is comprised of the initial territory fee and an estimate of the total Shack opening fees we expect to be entitled to. The calculation of total Shack opening fees included in the transaction price requires judgment, as it is based on an estimate of the number of Shacks we expect the licensee to open. The transaction price is then allocated equally to each Shack expected to open. The performance obligations are satisfied over time, starting when a Shack opens, through the end of the term of the license granted to the Shack. Because we are transferring licenses to access our intellectual property during a contractual term, revenue is recognized on a straight-line basis over the license term. Generally, payment for the initial territory fee is received upon execution of the licensing agreement and payment for the restaurant opening fees are received either in advance of or upon opening the related restaurant. These payments are initially deferred and recognized as revenue as the performance obligations are satisfied, which occurs over a long-term period.
Revenue from sales-based royalties is recognized as the related sales occur.
Prior to the adoption of ASC 606, Shack opening fees were recorded as deferred revenue when received and proportionate amounts were recognized as revenue when a licensed Shack opened and all material services and conditions related to the fee were substantially performed. Territory fees were recorded as deferred revenue when received and recognized as revenue on a straight-line basis over the term of the license agreement, which generally began upon execution of the contract.
Shake Shack Inc.
Form 10-K
|
93
Form 10-K
|
93
Revenue recognized during fiscal
2018
under ASC 606 and revenue that would have been recognized during fiscal
2018
had ASC 605 been applied is as follows:
|
As reported under ASC 606
|
|
If reported under ASC 605
|
|
Increase (decrease)
|
|
||||||
|
Shack sales
|
$
|
445,589
|
|
$
|
445,589
|
|
$
|
—
|
|
||
|
Licensing revenue
|
13,721
|
|
14,389
|
|
(668
|
)
|
|||||
|
Total revenue
|
$
|
459,310
|
|
$
|
459,978
|
|
$
|
(668
|
)
|
||
Revenue recognized during fiscal
2018
(under ASC 606) and fiscal
2017
and
2016
(under ASC 605) disaggregated by type is as follows:
|
December 26
2018 |
|
December 27
2017 |
|
December 28
2016 |
|
||||||
|
Shack sales
|
$
|
445,589
|
|
$
|
346,388
|
|
$
|
259,350
|
|
||
|
Licensing revenue:
|
|||||||||||
|
Sales-based royalties
|
13,422
|
|
11,633
|
|
8,765
|
|
|||||
|
Initial territory and opening fees
|
299
|
|
789
|
|
360
|
|
|||||
|
Total revenue
|
$
|
459,310
|
|
$
|
358,810
|
|
$
|
268,475
|
|
||
The aggregate amount of the transaction price allocated to performance obligations that are unsatisfied (or partially unsatisfied) as of
December 26, 2018
is
$15,333
. We expect to recognize this amount as revenue over a long-term period, as the license term for each Shack ranges from 5 to 20 years. This amount excludes any variable consideration related to sales-based royalties.
Contract Balances
Opening and closing balances of contract liabilities and receivables from contracts with customers for fiscal 2018 is as follows:
|
|
||||||||
|
December 26
2018 |
|
December 28
2017 |
|
|||||
|
Shack sales receivables
|
$
|
2,550
|
|
$
|
2,184
|
|
||
|
Licensing receivables
|
2,616
|
|
1,522
|
|
||||
|
Gift card liability
|
1,796
|
|
1,472
|
|
||||
|
Deferred revenue, current
|
307
|
|
265
|
|
||||
|
Deferred revenue, long-term
|
10,026
|
|
3,742
|
|
||||
Revenue recognized during fiscal
2018
that was included in the balances of gift card liability and deferred revenue, current, at the beginning of the period is
$506
and
$253
, respectively.
NOTE
4
: FAIR VALUE MEASUREMENTS
Assets and Liabilities Measured at Fair Value on a Recurring Basis
The following tables present information about our financial assets and liabilities measured at fair value on a recurring basis as of
December 26, 2018
and
December 27, 2017
, and indicate the classification within the fair value hierarchy. Refer to Note 2 for further information.
Shake Shack Inc.
Form 10-K
|
94
Form 10-K
|
94
Cash, Cash Equivalents and Marketable Securities
The following tables summarize our cash, cash equivalents and marketable securities by significant investment categories as of
December 26, 2018
and
December 27, 2017
:
|
December 26, 2018
|
||||||||||||||||||||||||
|
Cost Basis
|
|
Gross Unrealized Gains
|
|
Gross Unrealized Losses
|
|
Fair Value
|
|
Cash and Cash Equivalents
|
|
Marketable Securities
|
|
|||||||||||||
|
Cash
|
$
|
19,746
|
|
$
|
—
|
|
$
|
—
|
|
$
|
19,746
|
|
$
|
19,746
|
|
$
|
—
|
|
||||||
|
Level 1:
|
||||||||||||||||||||||||
|
Money market funds
|
5,004
|
|
—
|
|
—
|
|
5,004
|
|
5,004
|
|
—
|
|
||||||||||||
|
Mutual funds
|
62,235
|
|
—
|
|
(122
|
)
|
62,113
|
|
—
|
|
62,113
|
|
||||||||||||
|
Level 2:
|
||||||||||||||||||||||||
|
Corporate debt securities
(1)
|
—
|
|
—
|
|
—
|
|
—
|
|
—
|
|
—
|
|
||||||||||||
|
Total
|
$
|
86,985
|
|
$
|
—
|
|
$
|
(122
|
)
|
$
|
86,863
|
|
$
|
24,750
|
|
$
|
62,113
|
|
||||||
|
December 27, 2017
|
||||||||||||||||||||||||
|
Cost Basis
|
|
Gross Unrealized Gains
|
|
Gross Unrealized Losses
|
|
Fair Value
|
|
Cash and Cash Equivalents
|
|
Marketable Securities
|
|
|||||||||||||
|
Cash
|
$
|
16,138
|
|
$
|
—
|
|
$
|
—
|
|
$
|
16,138
|
|
$
|
16,138
|
|
$
|
—
|
|
||||||
|
Level 1:
|
||||||||||||||||||||||||
|
Money market funds
|
5,369
|
|
—
|
|
—
|
|
5,369
|
|
5,369
|
|
—
|
|
||||||||||||
|
Mutual funds
|
60,985
|
|
—
|
|
(61
|
)
|
60,924
|
|
—
|
|
60,924
|
|
||||||||||||
|
Level 2:
|
||||||||||||||||||||||||
|
Corporate debt securities
(1)
|
2,125
|
|
2
|
|
(15
|
)
|
2,112
|
|
—
|
|
2,112
|
|
||||||||||||
|
Total
|
$
|
84,617
|
|
$
|
2
|
|
$
|
(76
|
)
|
$
|
84,543
|
|
$
|
21,507
|
|
$
|
63,036
|
|
||||||
|
(1)
|
Corporate debt securities were measured at fair value using a market approach utilizing observable prices for identical securities or securities with similar characteristics and inputs that are observable or can be corroborated by observable market data.
|
On December 28, 2017, we adopted ASU 2016-01, which
requires certain equity investments to be measured at fair value with changes in fair value recognized in net income. Net un
realized losses on available-for-sale equity securities totaling
$61
were included
on the Condensed Consolidated Statements of Income
during fiscal
2018
. Net unrealized losses on available-for-sale securities totaling
$74
were included in accumulated other comprehensive loss on the Condensed Consolidated Balance Sheet as of
December 27, 2017
.
The following tables summarize the gross unrealized losses and fair values for investments in debt securities that were in an unrealized loss position as of
December 26, 2018
and
December 27, 2017
, aggregated by length of time that individual securities have been in a continuous loss position:
|
Less than 12 Months
|
12 Months or Greater
|
Total
|
||||||||||||||||
|
Fair Value
|
|
Unrealized Loss
|
|
Fair Value
|
|
Unrealized Loss
|
|
Fair Value
|
|
Unrealized Loss
|
|
|||||||
|
As of December 26, 2018
|
—
|
|
—
|
|
—
|
|
—
|
|
—
|
|
—
|
|
||||||
|
As of December 27, 2017
|
1,675
|
|
(12
|
)
|
162
|
|
(3
|
)
|
1,837
|
|
(15
|
)
|
||||||
Shake Shack Inc.
Form 10-K
|
95
Form 10-K
|
95
A summary of other income from available-for-sale securities recognized during fiscal
2018
,
2017
and
2016
is as follows:
|
2018
|
|
2017
|
|
2016
|
|
|||||||
|
Available-for-sale securities:
|
||||||||||||
|
Dividend income
|
$
|
1,392
|
|
$
|
830
|
|
$
|
296
|
|
|||
|
Interest income
|
9
|
|
77
|
|
88
|
|
||||||
|
Loss on investments
|
(3
|
)
|
(5
|
)
|
(7
|
)
|
||||||
|
Unrealized loss on available-for-sale equity securities
|
(61
|
)
|
—
|
|
—
|
|
||||||
|
Total other income, net
|
$
|
1,337
|
|
$
|
902
|
|
$
|
377
|
|
|||
A summary of available-for-sale securities sold and gross realized gains and losses recognized during fiscal
2018
,
2017
and
2016
is as follows:
|
2018
|
|
2017
|
|
2016
|
|
|||||||
|
Available-for-sale securities:
|
||||||||||||
|
Gross proceeds from sales and redemptions
|
$
|
2,144
|
|
$
|
2,223
|
|
$
|
938
|
|
|||
|
Cost basis of sales and redemptions
|
2,160
|
|
2,271
|
|
956
|
|
||||||
|
Gross realized gains included in net income
|
2
|
|
1
|
|
2
|
|
||||||
|
Gross realized losses included in net income
|
(18
|
)
|
(49
|
)
|
(20
|
)
|
||||||
|
Amounts reclassified out of accumulated other comprehensive loss
|
16
|
|
47
|
|
19
|
|
||||||
Realized gains and losses are determined on a specific identification method and are included in other income, net on the Consolidated Statements of
Income (Loss)
.
We periodically review our marketable securities for other-than-temporary impairment. We consider factors such as the duration, severity and the reason for the decline in value, the potential recovery period and our intent to sell. For our debt securities, we also considered whether (i) it is more likely than not that we will be required to sell the debt securities before recovery of their amortized cost basis, and (ii) the amortized cost basis cannot be recovered as a result of credit losses. As of
December 26, 2018
and
December 27, 2017
, the declines in the market value of our marketable securities investment portfolio are considered to be temporary in nature.
Other Financial Instruments
The carrying value of our financial instruments, including accounts receivable, accounts payable, and accrued expenses as of
December 26, 2018
and
December 27, 2017
approximated their fair value due to the short-term nature of these financial instruments.
Assets and Liabilities Measured at Fair Value on a Non-Recurring Basis
Assets and liabilities that are measured at fair value on a non-recurring basis include our long-lived assets and indefinite-lived intangible assets. There were
no
impairments recognized during fiscal
2018
,
2017
and
2016
.
NOTE
5
: ACCOUNTS RECEIVABLE
The components of accounts receivable as of
December 26, 2018
and
December 27, 2017
are as follows:
96
|
Shake Shack Inc.
Form 10-K
Form 10-K
|
December 26
2018 |
|
December 27
2017 |
|
||||
|
Landlord receivables
|
$
|
4,494
|
|
$
|
1,660
|
|
|
|
Licensing receivables
|
2,579
|
|
1,422
|
|
|||
|
Credit card receivables
|
2,446
|
|
2,018
|
|
|||
|
Other receivables
|
1,004
|
|
541
|
|
|||
|
Accounts receivable
|
$
|
10,523
|
|
$
|
5,641
|
|
|
As of
December 26, 2018
and
December 27, 2017
,
no
allowance for doubtful accounts was recorded based on our evaluation of collectibility.
NOTE
6
: INVENTORIES
Inventories consisted of the following:
|
December 26
2018 |
|
December 27
2017 |
|
||||
|
Food
|
$
|
1,291
|
|
$
|
874
|
|
|
|
Wine
|
83
|
|
69
|
|
|||
|
Beer
|
95
|
|
85
|
|
|||
|
Beverages
|
203
|
|
111
|
|
|||
|
Retail merchandise
|
77
|
|
119
|
|
|||
|
Inventories
|
$
|
1,749
|
|
$
|
1,258
|
|
|
NOTE
7
: PROPERTY AND EQUIPMENT
Property and equipment consisted of the following:
|
December 26
2018 |
|
December 27
2017 |
|
||||
|
Leasehold improvements
|
$
|
228,453
|
|
$
|
166,963
|
|
|
|
Landlord funded assets
|
15,595
|
|
7,472
|
|
|||
|
Equipment
|
40,716
|
|
31,608
|
|
|||
|
Furniture and fixtures
|
14,055
|
|
10,128
|
|
|||
|
Computer equipment and software
|
19,008
|
|
12,721
|
|
|||
|
Construction in progress (includes assets under construction from deemed landlord financing)
|
29,474
|
|
16,458
|
|
|||
|
Property and equipment, gross
|
347,301
|
|
245,350
|
|
|||
|
Less: accumulated depreciation
|
(85,447
|
)
|
(58,255
|
)
|
|||
|
Property and equipment, net
|
$
|
261,854
|
|
$
|
187,095
|
|
|
Depreciation expense was
$29,000
,
$21,704
and
$14,502
for fiscal
2018
,
2017
and
2016
, respectively.
NOTE
8
: SUPPLEMENTAL BALANCE SHEET INFORMATION
Shake Shack Inc.
Form 10-K
|
97
Form 10-K
|
97
The components of other current liabilities as of
December 26, 2018
and
December 27, 2017
are as follows:
|
December 26
2018 |
|
December 27
2017 |
|
||||
|
Sales tax payable
|
$
|
3,143
|
|
$
|
1,813
|
|
|
|
Current portion of liabilities under tax receivable agreement
|
5,804
|
|
937
|
|
|||
|
Gift card liability
|
1,796
|
|
1,472
|
|
|||
|
Other
|
3,287
|
|
3,715
|
|
|||
|
Other current liabilities
|
$
|
14,030
|
|
$
|
7,937
|
|
|
98
|
Shake Shack Inc.
Form 10-K
Form 10-K
NOTE
9
: DEBT
In January 2015, we executed a Third Amended and Restated Credit Agreement, which became effective on February 4, 2015 (together with the prior agreements and amendments, and as further amended, the "Revolving Credit Facility"), which provides for a total revolving commitment amount of
$50,000
, of which
$20,000
is available immediately. The Revolving Credit Facility will mature and all amounts outstanding will be due and payable
five years
from the effective date. The Revolving Credit Facility permits the issuance of letters of credit upon our request of up to
$10,000
. In May 2016, the Revolving Credit Facility was amended to, among other things, lower the borrowing rates. Borrowings under the Revolving Credit Facility bear interest at either: (i) LIBOR plus a percentage ranging from
2.3%
to
3.3%
or (ii) the prime rate plus a percentage ranging from
0.0%
to
0.8%
, depending on the type of borrowing made under the Revolving Credit Facility. As of
December 26, 2018
and
December 27, 2017
, there were
no
amounts outstanding under the Revolving Credit Facility. As of
December 26, 2018
, we had
$19,317
of availability under the Revolving Credit Facility, after giving effect to
$683
in outstanding letters of credit.
The Revolving Credit Facility is secured by a first-priority security interest in substantially all of the assets of SSE Holdings and the guarantors. The obligations under the Revolving Credit Facility are guaranteed by each of SSE Holdings' wholly-owned domestic subsidiaries (with certain exceptions).
The Revolving Credit Facility contains a number of covenants that, among other things, limit our ability to, subject to specified exceptions, incur additional debt; incur additional liens and contingent liabilities; sell or dispose of assets; merge with or acquire other companies; liquidate or dissolve ourselves; pay dividends or make distributions; engage in businesses that are not in a related line of business; make loans, advances or guarantees; engage in transactions with affiliates; and make investments. In addition, the Revolving Credit Facility contains certain cross-default provisions. We are required to maintain a specified consolidated fixed-charge coverage ratio and a specified funded net debt to adjusted EBITDA ratio, both as defined under the Revolving Credit Facility. As of
December 26, 2018
, we were in compliance with all covenants.
In March 2013, we entered into a promissory note in the amount of
$313
in connection with the purchase of a liquor license, and we repaid the entire outstanding balance of the promissory note during the fiscal year ended
December 28, 2016
.
As of
December 26, 2018
and
December 27, 2017
we had deemed landlord financing liabilities of
$20,846
and
$14,518
, respectively, for certain leases where we are involved in the construction of leased assets and are considered the accounting owner of the construction project. Refer to
Note 10
for further details regarding these leases.
Total interest costs incurred were
$2,572
,
$1,806
and
$374
in fiscal
2018
,
2017
and
2016
, respectively. Amounts capitalized into property and equipment were
$157
and
$164
during fiscal
2018
and
2017
, respectively.
No
amounts were capitalized into property and equipment during fiscal
2016
.
Shake Shack Inc.
Form 10-K
|
99
Form 10-K
|
99
NOTE
10
: LEASES
A summary of rent expense under operating lease agreements is as follows:
|
2018
|
|
2017
|
|
2016
|
|
|||||||
|
Minimum rent
|
$
|
24,920
|
|
$
|
20,421
|
|
$
|
15,408
|
|
|||
|
Deferred rent
|
1,241
|
|
838
|
|
2,122
|
|
||||||
|
Contingent rent
|
4,805
|
|
4,902
|
|
4,294
|
|
||||||
|
Total rent expense
|
$
|
30,966
|
|
$
|
26,161
|
|
$
|
21,824
|
|
|||
The rent expense above does not include common area maintenance costs, real estate taxes and other occupancy costs, which were
$6,479
,
$4,570
and
$3,229
in fiscal
2018
,
2017
and
2016
, respectively.
As of
December 26, 2018
, future minimum lease payments under non-cancelable operating leases and lease financing arrangements consisted of the following:
|
Operating
Leases
|
|
Deemed Landlord Financing
(1)
|
|
||||
|
2019
|
$
|
31,785
|
|
$
|
4,487
|
|
|
|
2020
|
32,819
|
|
4,755
|
|
|||
|
2021
|
33,363
|
|
4,816
|
|
|||
|
2022
|
33,934
|
|
4,889
|
|
|||
|
2023
|
33,588
|
|
5,085
|
|
|||
|
Thereafter
|
174,145
|
|
22,659
|
|
|||
|
Total minimum lease payments
|
$
|
339,634
|
|
$
|
46,691
|
|
|
|
(1)
|
Amounts include minimum lease payments for
one
lease under construction as of
December 26, 2018
where we are deemed the accounting owner. Final classification of lease payments under deemed landlord financing is subject to change pending sale lease-back analysis performed at the store opening date.
|
As of
December 26, 2018
, we had
24
leases where we are involved in the construction of the leased assets and have been deemed the accounting owner of the construction project. The deemed landlord financing liability related to these leases was
$20,846
as of
December 26, 2018
. As of
December 27, 2017
, we had
23
leases where we are involved in the construction of the leased assets and have been deemed the accounting owner of the construction project. The deemed landlord financing liability related to those leases was
$14,518
as of
December 27, 2017
.
NOTE
11
: EMPLOYEE BENEFIT PLANS
Deferred Compensation
In fiscal 2014, we entered into an incentive bonus agreement with one of our executives, whereby the executive is entitled to receive a deferred compensation award in the amount of
$2,450
payable by us in March 2018. This amount was included in other current liabilities on the Consolidated Balance Sheet as of
December 27, 2017
. In fiscal 2013, we recorded
$2,054
of deferred compensation expense to recognize the present value of the incentive bonus liability, which was included within general and administrative expense on the Consolidated Statement of Income (Loss). There was no such expense in fiscal
2018
,
2017
or
2016
. The difference between the present value of the bonus liability and the amount payable was accreted to interest expense over the term of the agreement. For the purpose of funding our deferred compensation obligation, we established a grantor trust, commonly referred to as a "rabbi trust," and contributed
$2,450
to the trust in October 2015. Assets held by the trust were subject to creditor claims. In March 2018,
100
|
Shake Shack Inc.
Form 10-K
Form 10-K
we paid the entire incentive bonus of
$2,450
to our executive from the trust.
No
amounts were held in the trust or payable by us as of
December 26, 2018
.
Defined Contribution Plan
Our employees are eligible to participate in a defined contribution savings plan maintained by Union Square Hospitality Group, LLC, a related party. The plan is funded by employee and employer contributions. We pay our share of the employer contributions directly to the third party trustee. Employer contributions to the plan are at our discretion. Effective January 2014, we began making contributions matching a portion of participants' contributions. We match
100%
of participants' contributions for the first
3%
of eligible compensation contributed and
50%
of contributions made in excess of
3%
of eligible compensation up to
5%
of eligible compensation. Employer contributions totaled
$509
,
$389
and
$257
for fiscal
2018
,
2017
and
2016
, respectively.
NOTE
12
: STOCKHOLDERS' EQUITY
Redemptions of LLC Interests
The SSE Holdings LLC Agreement provides that holders of LLC Interests may, from time to time, require SSE Holdings to redeem all or a portion of their LLC Interests for newly-issued shares of Class A common stock on a one-for-one basis. In connection with any redemption or exchange, we receive a corresponding number of LLC Interests, increasing our total ownership interest in SSE Holdings.
During fiscal
2018
, an aggregate of
2,692,660
LLC Interests were redeemed by the non-controlling interest holders. Pursuant to the SSE Holdings LLC Agreement, we issued
2,692,660
shares of Class A common stock in connection with these redemptions and received
2,692,660
LLC Interests, increasing our ownership interest in SSE Holdings.
Simultaneously, and in connection with these redemptions,
2,692,660
shares of Class B common stock were surrendered and cancelled.
During fiscal
2017
, an aggregate of
1,003,585
LLC Interests were redeemed by the non-controlling interest holders. Pursuant to the SSE Holdings LLC Agreement, we issued
1,003,585
shares of Class A common stock in connection with these redemptions and received
1,003,585
LLC Interests, increasing our ownership interest in SSE Holdings.
Simultaneously, and in connection with these redemptions,
1,003,585
shares of Class B common stock were surrendered and cancelled.
Stock Compensation Plan Activity
We received an aggregate of
300,696
and
372,508
LLC Interests in connection with the activity under our stock compensation plan during fiscal
2018
and
2017
, respectively.
Dividend Restrictions
We are a holding company with no direct operations. As a result, our ability to pay cash dividends on our common stock, if any, is dependent upon cash dividends, distributions or other transfers from SSE Holdings.
The amounts available to us to pay cash dividends are subject to certain covenants and restrictions set forth in the Revolving Credit Facility. As of
December 26, 2018
, essentially all of the net assets of SSE Holdings were restricted. See
Note 9
for more information regarding the covenants and restrictions set forth in the Revolving Credit Facility.
NOTE
13
: NON-CONTROLLING INTERESTS
We are the sole managing member of SSE Holdings and, as a result, consolidate the financial results of SSE Holdings. We report a non-controlling interest representing the economic interest in SSE Holdings held by the other members of SSE Holdings. The SSE Holdings LLC Agreement provides that holders of LLC Interests may, from time to time, require SSE Holdings to redeem all or a portion of their LLC Interests for newly-issued shares of Class A common stock on a
one
-for-one basis. In connection with any redemption or exchange, we will receive a corresponding number of LLC Interests, increasing our total ownership interest in SSE
Shake Shack Inc.
Form 10-K
|
101
Form 10-K
|
101
Holdings. Changes in our ownership interest in SSE Holdings while we retain our controlling interest in SSE Holdings will be accounted for as equity transactions. As such, future redemptions or direct exchanges of LLC Interests in SSE Holdings by the other members of SSE Holdings will result in a change in ownership and reduce the amount recorded as non-controlling interest and increase additional paid-in capital.
The following table summarizes the ownership interest in SSE Holdings as of
December 26, 2018
and
December 27, 2017
:
|
2018
|
2017
|
||||||||||
|
LLC Interests
|
|
Ownership %
|
|
LLC Interests
|
|
Ownership %
|
|
||||
|
Number of LLC Interests held by Shake Shack Inc.
|
29,520,833
|
|
79.6
|
%
|
26,527,477
|
|
72.1
|
%
|
|||
|
Number of LLC Interests held by non-controlling interest holders
|
7,557,347
|
|
20.4
|
%
|
10,250,007
|
|
27.9
|
%
|
|||
|
Total LLC Interests outstanding
|
37,078,180
|
|
100.0
|
%
|
36,777,484
|
|
100.0
|
%
|
|||
The weighted average ownership percentages for the applicable reporting periods are used to attribute net income and other comprehensive loss between Shake Shack Inc. and the non-controlling interest holders. The non-controlling interest holders' weighted average ownership percentage for fiscal
2018
and
2017
was
23.4%
and
29.4%
, respectively.
The following table summarizes the effects of changes in ownership in SSE Holdings on our equity during fiscal
2018
,
2017
and
2016
.
|
2018
|
|
2017
|
|
2016
|
|
|||||||
|
Net income (loss) attributable to Shake Shack Inc.
|
$
|
15,179
|
|
$
|
(320
|
)
|
$
|
12,446
|
|
|||
|
Other comprehensive income (loss):
|
||||||||||||
|
Unrealized holding gains (losses) on available-for-sale securities
|
10
|
|
(34
|
)
|
(10
|
)
|
||||||
|
Transfers (to) from non-controlling interests:
|
||||||||||||
|
Increase in additional paid-in capital as a result of the redemption of LLC Interests
|
15,202
|
|
4,415
|
|
16,986
|
|
||||||
|
Increase in additional paid-in capital as a result of activity under the stock compensation plan and the related income tax effect
|
2,509
|
|
4,451
|
|
825
|
|
||||||
|
Total effect of changes in ownership interest on equity attributable to Shake Shack Inc.
|
$
|
32,900
|
|
$
|
8,512
|
|
$
|
30,247
|
|
|||
During fiscal
2018
, an aggregate of
2,692,660
LLC Interests were redeemed by the non-controlling interest holders for newly-issued shares of Class A common stock, and we received
2,692,660
LLC Interests, increasing our total ownership interest in SSE Holdings to
79.6%
. During
2017
, an aggregate of
1,003,585
LLC Interests were redeemed by the non-controlling interest holders, and we received
1,003,585
LLC Interests, increasing our total ownership interest in SSE Holdings to
72.1%
.
We received an aggregate of
300,696
and
372,508
LLC Interests in connection with the activity under our stock compensation plans during fiscal
2018
and
2017
, respectively.
NOTE
14
: EQUITY-BASED COMPENSATION
A summary of equity-based compensation expense recognized during fiscal
2018
,
2017
and
2016
is as follows:
102
|
Shake Shack Inc.
Form 10-K
Form 10-K
|
2018
|
|
2017
|
|
2016
|
|
|||||||
|
Stock options
|
3,039
|
|
3,474
|
|
4,262
|
|
||||||
|
Performance stock units
|
2,449
|
|
1,869
|
|
1,092
|
|
||||||
|
Restricted stock units
|
655
|
|
280
|
|
—
|
|
||||||
|
Equity-based compensation expense
|
$
|
6,143
|
|
$
|
5,623
|
|
$
|
5,354
|
|
|||
|
Total income tax benefit recognized related to equity-based compensation
|
$
|
172
|
|
$
|
198
|
|
$
|
168
|
|
|||
Equity-based compensation expense is allocated to general and administrative expenses and labor and related expenses on the Consolidated Statements of
Income (Loss)
during fiscal
2018
,
2017
and
2016
as follows:
|
2018
|
|
2017
|
|
2016
|
|
||||
|
General and administrative expenses
|
5,991
|
|
5,463
|
|
5,260
|
|
|||
|
Labor and related expenses
|
152
|
|
160
|
|
94
|
|
|||
|
Equity-based compensation expense
|
6,143
|
|
5,623
|
|
5,354
|
|
|||
We capitalized
$107
,
$109
and
$139
of equity-based compensation expense associated with the construction cost of our Shacks and our enterprise-wide system upgrade initiative, Project Concrete, during fiscal
2018
,
2017
and
2016
, respectively.
Stock Options
In January 2015, we adopted the 2015 Incentive Award Plan (the "2015 Plan") under which we may grant up to
5,865,522
stock options and other equity-based awards to employees, directors and officers. The stock options granted generally vest equally over periods ranging from
one
to
five
years. We do not use cash to settle any of our equity-based awards, and we issue new shares of Class A common stock upon the exercise of stock options.
The fair value of stock option awards was determined on the grant date using the Black-Scholes valuation model based on the following weighted-average assumptions:
|
2018
|
|
2017
|
|
2016
|
|
|||
|
Expected term (years)
(1)
|
7.5
|
|
7.5
|
|
5.5
|
|
||
|
Expected volatility
(2)
|
42.5
|
%
|
44.5
|
%
|
50.7
|
%
|
||
|
Risk-free interest rate
(3)
|
2.8
|
%
|
2.1
|
%
|
1.5
|
%
|
||
|
Dividend yield
(4)
|
—
|
%
|
—
|
%
|
—
|
%
|
||
|
(1)
|
Expected term represents the estimated period of time until an award is exercised and was determined using the simplified method.
|
|
(2)
|
Expected volatility is based on the historical volatility of a selected peer group over a period equivalent to the expected term.
|
|
(3)
|
The risk-free rate rate is an interpolation of yields on U.S. Treasury securities with maturities equivalent to the expected term.
|
|
(4)
|
We have assumed a dividend yield of
zero
as we have no plans to declare dividends in the foreseeable future.
|
Shake Shack Inc.
Form 10-K
|
103
Form 10-K
|
103
A summary of stock option activity for fiscal years
2018
,
2017
and
2016
is as follows:
|
Stock
Options
|
|
Weighted
Average
Exercise
Price
|
|
Aggregate Intrinsic Value
|
|
Weighted Average Remaining Contractual Life (Years)
|
|||||||
|
Outstanding as of December 30, 2015
|
2,574,981
|
|
$
|
21.00
|
|
||||||||
|
Granted
|
16,931
|
|
34.74
|
|
|||||||||
|
Exercised
|
(160,230
|
)
|
21.00
|
|
|||||||||
|
Forfeited
|
(66,960
|
)
|
(21.00
|
)
|
|||||||||
|
Expired
|
—
|
|
—
|
|
|||||||||
|
Outstanding as of December 28, 2016
|
2,364,722
|
|
$
|
21.10
|
|
||||||||
|
Granted
|
5,150
|
|
38.91
|
|
|||||||||
|
Exercised
|
(359,011
|
)
|
21.13
|
|
|||||||||
|
Forfeited
|
(291,520
|
)
|
(21.00
|
)
|
|||||||||
|
Expired
|
—
|
|
—
|
|
|||||||||
|
Outstanding as of December 27, 2017
|
1,719,341
|
|
$
|
21.16
|
|
||||||||
|
Granted
|
5,036
|
|
39.91
|
|
|||||||||
|
Exercised
|
(260,515
|
)
|
21.00
|
|
|||||||||
|
Forfeited
|
(102,879
|
)
|
(21.27
|
)
|
|||||||||
|
Expired
|
—
|
|
—
|
|
|||||||||
|
Outstanding as of December 26, 2018
|
1,360,983
|
|
$
|
21.25
|
|
$
|
29,881
|
|
6.1
|
||||
|
Options vested and exercisable as of December 26, 2018
|
674,247
|
|
$
|
21.26
|
|
$
|
14,798
|
|
6.1
|
||||
|
Options expected to vest as of December 26, 2018
|
686,736
|
|
$
|
21.25
|
|
$
|
15,083
|
|
6.1
|
||||
As of
December 26, 2018
, total unrecognized compensation expense related to unvested stock options was
$3,335
, which is expected to be recognized over a weighted-average period of
1.2
years. The total intrinsic value of stock options exercised during fiscal
2018
,
2017
and
2016
was
$5,786
,
$8,333
and
$2,536
, respectively. C
ash received from stock option exercises was
$5,472
for fiscal
2018
.
104
|
Shake Shack Inc.
Form 10-K
Form 10-K
A summary of unvested stock option activity for fiscal years
2018
,
2017
and
2016
is as follows:
|
Stock
Options
|
|
Weighted
Average
Grant-Date Fair Value
|
|
||||
|
Unvested as of December 30, 2015
|
2,574,981
|
|
$
|
8.53
|
|
||
|
Vested
|
(562,296
|
)
|
8.32
|
|
|||
|
Granted
|
16,931
|
|
16.32
|
|
|||
|
Forfeited
|
(65,365
|
)
|
8.59
|
|
|||
|
Unvested as of December 28, 2016
|
1,964,251
|
|
$
|
8.66
|
|
||
|
Vested
|
(503,686
|
)
|
8.85
|
|
|||
|
Granted
|
5,150
|
|
19.42
|
|
|||
|
Forfeited
|
(289,620
|
)
|
8.59
|
|
|||
|
Unvested as of December 27, 2017
|
1,176,095
|
|
$
|
8.64
|
|
||
|
Vested
|
(404,120
|
)
|
8.62
|
|
|||
|
Granted
|
5,036
|
|
19.86
|
|
|||
|
Forfeited
|
(90,275
|
)
|
8.59
|
|
|||
|
Unvested as of December 26, 2018
|
686,736
|
|
$
|
8.74
|
|
||
The total fair value of stock options vested during fiscal
2018
,
2017
and
2016
was
$3,483
,
$4,458
and
$4,678
, respectively.
The following table summarizes information about stock options outstanding and exercisable as
December 26, 2018
:
|
Options Outstanding
|
Options Exercisable
|
||||||||||||||||||
|
Number Outstanding at December 26, 2018
|
|
Weighted Average Remaining Contractual Life (Years)
|
Weighted Average Exercise Price
|
|
Number Exercisable at December 26, 2018
|
|
Weighted Average Remaining Contractual Life (Years)
|
|
Weighted Average Exercise Price
|
|
|||||||||
|
Exercise Price
|
|||||||||||||||||||
|
$21.00
|
1,339,274
|
|
6.1
|
$
|
21.00
|
|
661,694
|
|
6.1
|
|
$
|
21.00
|
|
||||||
|
$34.62
|
10,415
|
|
7.4
|
$
|
34.62
|
|
10,415
|
|
7.4
|
|
$
|
34.62
|
|
||||||
|
$36.41
|
1,108
|
|
7.9
|
$
|
36.41
|
|
1,108
|
|
7.9
|
|
$
|
36.41
|
|
||||||
|
$38.91
|
5,150
|
|
8.5
|
$
|
38.91
|
|
1,030
|
|
8.5
|
|
$
|
38.91
|
|
||||||
|
$39.91
|
5,036
|
|
9.2
|
$
|
39.91
|
|
—
|
|
—
|
|
$
|
—
|
|
||||||
Performance Stock Units
Under the 2015 Plan, we may grant performance stock units and other types of performance-based equity awards that vest based on the outcome of certain performance criteria that are established and approved by the Compensation Committee of the Board of Directors. The actual number of equity awards earned is based on the level of performance achieved over a predetermined performance period, relative to established financial goals, none of which are considered market conditions.
For performance stock units granted during fiscal
2018
, the amount of awards that can be earned ranges from
0%
to
125%
of the number of performance stock units granted, based on the achievement of approved financial goals over a
one
-year performance period. In addition to the performance conditions, performance stock units are also subject to a requisite service period and the awards vest ratably over
three
years. The fair value of performance stock units is determined based on the closing market price of our Class A common stock on the date of grant. Compensation expense related to the performance stock units is recognized using a graded-vesting attribution method over the vesting period based on the most probable outcome of the performance conditions.
Shake Shack Inc.
Form 10-K
|
105
Form 10-K
|
105
A summary of performance stock unit activity for fiscal years
2018
,
2017
and
2016
is as follows:
|
Performance
Stock
Units
|
|
Weighted
Average
Grant Date Fair Value
|
|
||||
|
Outstanding as of December 30, 2015
|
—
|
|
$
|
—
|
|
||
|
Granted
|
63,600
|
|
38.41
|
|
|||
|
Performance achievement
(1)
|
—
|
|
—
|
|
|||
|
Vested
|
—
|
|
—
|
|
|||
|
Forfeited
|
(2,000
|
)
|
38.43
|
|
|||
|
Expired
|
—
|
|
—
|
|
|||
|
Outstanding as of December 28, 2016
|
61,600
|
|
$
|
38.41
|
|
||
|
Granted
|
87,596
|
|
37.90
|
|
|||
|
Performance achievement
(1)
|
9,545
|
|
38.40
|
|
|||
|
Vested
|
(22,703
|
)
|
38.40
|
|
|||
|
Forfeited
|
(11,196
|
)
|
38.28
|
|
|||
|
Expired
|
—
|
|
—
|
|
|||
|
Outstanding as of December 27, 2017
|
124,842
|
|
$
|
38.06
|
|
||
|
Granted
|
60,437
|
|
58.46
|
|
|||
|
Performance achievement
(1)
|
(12,139
|
)
|
37.89
|
|
|||
|
Vested
|
(43,861
|
)
|
38.13
|
|
|||
|
Forfeited
|
(10,737
|
)
|
41.28
|
|
|||
|
Expired
|
—
|
|
—
|
|
|||
|
Outstanding as of December 26, 2018
|
118,542
|
|
$
|
48.16
|
|
||
|
(1)
|
Represents the incremental awards earned and/or awards forfeited based on the achievement of performance conditions.
|
As of
December 26, 2018
, there were
118,542
performance stock units outstanding, of which none were vested. As of
December 26, 2018
, total unrecognized compensation expense related to unvested performance stock units was
$2,954
, which is expected to be recognized over a weighted-average period of
2.2
years.
Restricted Stock Units
Under the 2015 Plan,
we may grant restricted stock units to employees, directors and officers. The restricted stock units granted generally vest equally over periods ranging from
one
to
five
years. T
he fair value of restricted stock units is determined based on the closing market price of our Class A common stock on the date of grant. Compensation expense related to the restricted stock units is recognized using a straight-line attribution method over the vesting period.
106
|
Shake Shack Inc.
Form 10-K
Form 10-K
A summary of restricted stock unit activity for fiscal years
2018
and
2017
is as follows:
|
Restricted
Stock
Units
|
|
Weighted
Average
Grant Date Fair Value
|
|
||||
|
Outstanding as of December 28, 2016
|
—
|
|
$
|
—
|
|
||
|
Granted
|
44,476
|
|
38.98
|
|
|||
|
Vested
|
—
|
|
—
|
|
|||
|
Forfeited
|
—
|
|
—
|
|
|||
|
Expired
|
—
|
|
—
|
|
|||
|
Outstanding as of December 27, 2017
|
44,476
|
|
$
|
38.98
|
|
||
|
Granted
|
18,882
|
|
49.12
|
|
|||
|
Vested
|
(13,635
|
)
|
39.13
|
|
|||
|
Forfeited
|
—
|
|
—
|
|
|||
|
Expired
|
—
|
|
—
|
|
|||
|
Outstanding as of December 26, 2018
|
49,723
|
|
$
|
42.79
|
|
||
As of
December 26, 2018
, there were
49,723
restricted stock units outstanding, of which none were vested.
No
restricted stock units were granted in fiscal
2016
. As of
December 26, 2018
, total unrecognized compensation expense related to unvested restricted stock units was
$1,726
, which is expected to be recognized over a weighted-average period of
3.5
years.
NOTE
15
: INCOME TAXES
We are the sole managing member of SSE Holdings, and as a result, consolidate the financial results of SSE Holdings. SSE Holdings is treated as a partnership for U.S. federal and most applicable state and local income tax purposes. As a partnership, SSE Holdings is not subject to U.S. federal and certain state and local income taxes. Any taxable income or loss generated by SSE Holdings is passed through to and included in the taxable income or loss of its members, including us, on a pro rata basis. We are subject to U.S. federal income taxes, in addition to state and local income taxes with respect to our allocable share of any taxable income or loss of SSE Holdings, as well as any stand-alone income or loss generated by Shake Shack Inc. We are also subject to withholding taxes in foreign jurisdictions.
Income Tax Expense
The components of income before income taxes are follows:
|
2018
|
|
2017
|
|
2016
|
|
||||||
|
Domestic
|
$
|
21,595
|
|
$
|
152,204
|
|
$
|
20,623
|
|
||
|
Foreign
|
9,215
|
|
8,089
|
|
7,873
|
|
|||||
|
Income before income taxes
|
$
|
30,810
|
|
$
|
160,293
|
|
$
|
28,496
|
|
||
Shake Shack Inc.
Form 10-K
|
107
Form 10-K
|
107
The components of income tax expense are as follows:
|
2018
|
|
2017
|
|
2016
|
|
||||||||
|
Current income taxes:
|
|||||||||||||
|
Federal
|
$
|
5,281
|
|
$
|
518
|
|
$
|
3,767
|
|
||||
|
State and local
|
858
|
|
3,615
|
|
2,439
|
|
|||||||
|
Foreign
|
1,935
|
|
942
|
|
667
|
|
|||||||
|
Total current income taxes
|
8,074
|
|
5,075
|
|
6,873
|
|
|||||||
|
Deferred income taxes:
|
|||||||||||||
|
Federal
|
(210
|
)
|
145,139
|
|
(48
|
)
|
|||||||
|
State and local
|
998
|
|
1,195
|
|
(475
|
)
|
|||||||
|
Total deferred income taxes
|
788
|
|
146,334
|
|
(523
|
)
|
|||||||
|
Income tax expense
|
$
|
8,862
|
|
$
|
151,409
|
|
$
|
6,350
|
|
||||
Reconciliations of income tax
expense
computed at the U.S. federal statutory income tax rate to the recognized income tax
expense
and the U.S. statutory income tax rate to our effective tax rates are as follows:
|
2018
|
2017
|
2016
|
||||||||||||||||
|
Expected U.S. federal income taxes at statutory rate
|
$
|
6,470
|
|
21.0
|
%
|
$
|
56,103
|
|
35.0
|
%
|
$
|
9,689
|
|
34.0
|
%
|
|||
|
State and local income taxes, net of federal benefit
|
797
|
|
2.6
|
%
|
2,590
|
|
1.6
|
%
|
1,461
|
|
5.1
|
%
|
||||||
|
Foreign withholding taxes
|
1,935
|
|
6.3
|
%
|
942
|
|
0.6
|
%
|
667
|
|
2.3
|
%
|
||||||
|
Tax credits
|
(2,151
|
)
|
(7.0
|
)%
|
(1,230
|
)
|
(0.8
|
)%
|
(779
|
)
|
(2.7
|
)%
|
||||||
|
Non-controlling interest
|
(1,908
|
)
|
(6.2
|
)%
|
(3,273
|
)
|
(2.0
|
)%
|
(3,765
|
)
|
(13.2
|
)%
|
||||||
|
Remeasurement of deferred tax assets in connection with the enactment of the TCJA
|
—
|
|
—
|
%
|
138,636
|
|
86.5
|
%
|
—
|
|
—
|
%
|
||||||
|
Remeasurement of deferred tax assets in connection with other tax rate changes
|
3,794
|
|
12.3
|
%
|
1,657
|
|
1.0
|
%
|
(1,353
|
)
|
(4.7
|
)%
|
||||||
|
Remeasurement of liabilities under tax receivable agreement in connection with the enactment of the TCJA
|
—
|
|
—
|
%
|
(44,051
|
)
|
(27.4
|
)%
|
—
|
|
—
|
%
|
||||||
|
Other
|
(75
|
)
|
(0.2
|
)%
|
35
|
|
—
|
%
|
430
|
|
1.5
|
%
|
||||||
|
Income tax expense
|
$
|
8,862
|
|
28.8
|
%
|
$
|
151,409
|
|
94.5
|
%
|
$
|
6,350
|
|
22.3
|
%
|
|||
Our effective income tax rates for fiscal
2018
,
2017
and
2016
were
28.8%
,
94.5%
and
22.3%
, respectively. The
decrease
in our effective income tax rate from fiscal
2017
to fiscal
2018
and the
increase
from fiscal
2016
to fiscal
2017
were primarily due
to the remeasurement of deferred tax assets resulting from the enactment of the Tax Cuts and Jobs Act of 2017 (the "TCJA") in fiscal 2017.
In December 2017, the TCJA was enacted into law and provided for significant changes to the U.S. Internal Revenue Code of 1986, as amended, including the reduction of the U.S. federal corporate income tax rate from 35% to 21%, among other provisions. We calculated our best estimate of the impact of the TCJA based on current interpretations and understanding of the TCJA and recognized an additional
$138,636
of income tax expense in fiscal 2017, in accordance with Staff Accounting Bulletin No. 118 ("SAB 118"), relating to the remeasurement of our deferred tax assets. During fiscal 2018 the Company finalized its calculations related to the impacts of the TCJA with no adjustment to the Company’s previously recorded provisional tax expense.
108
|
Shake Shack Inc.
Form 10-K
Form 10-K
Deferred Tax Assets and Liabilities
The components of deferred tax assets and liabilities are as follows:
|
December 26
2018 |
|
December 27
2017 |
|
||||||
|
Deferred tax assets:
|
|||||||||
|
Investment in partnership
|
$
|
168,451
|
|
$
|
137,449
|
|
|||
|
Tax Receivable Agreement
|
57,203
|
|
43,464
|
|
|||||
|
Deferred rent
|
1,109
|
|
571
|
|
|||||
|
Deferred revenue
|
184
|
|
59
|
|
|||||
|
Stock-based compensation
|
375
|
|
322
|
|
|||||
|
Net operating loss carryforwards
|
18,046
|
|
12,332
|
|
|||||
|
Tax credits
|
5,194
|
|
2,328
|
|
|||||
|
Other assets
|
331
|
|
176
|
|
|||||
|
Total gross deferred tax assets
|
250,893
|
|
196,701
|
|
|||||
|
Valuation allowance
|
(6,925
|
)
|
(10,114
|
)
|
|||||
|
Total deferred tax assets, net of valuation allowance
|
243,968
|
|
186,587
|
|
|||||
|
Deferred tax liabilities:
|
|||||||||
|
Property and equipment
|
(1,435
|
)
|
(673
|
)
|
|||||
|
Total gross deferred tax liabilities
|
(1,435
|
)
|
(673
|
)
|
|||||
|
Net deferred tax assets
|
$
|
242,533
|
|
$
|
185,914
|
|
|||
As of
December 26, 2018
, our federal and state net operating loss carryforwards for income tax purposes were
$68,658
and
$60,546
. If not utilized,
$16,791
of our federal net operating losses can be carried forward indefinitely, and the remainder will begin to expire in 2035. If not utilized
$4,586
of our state net operating loss carryforwards can be carried forward indefinitely, and the remainder will begin to expire in 2027.
As described in Note 12, we acquired an aggregate of
2,993,356
LLC Interests during fiscal
2018
through redemptions of LLC Interests and activity under stock-based compensation plans. We recognized a deferred tax asset in the amount of
$38,843
associated with the basis difference in our investment in SSE Holdings upon acquiring these LLC Interests. As of
December 26, 2018
, the total deferred tax asset related to the basis difference in our investment in SSE Holdings was
$168,451
. These were partially offset by reductions in basis due to the utilization of
$12,383
of amortization. However, a portion of the total basis difference will only reverse upon the eventual sale of our interest in SSE Holdings, which we expect would result in a capital loss. As of
December 26, 2018
, we established a valuation allowance in the amount of
$6,192
against the deferred tax asset to which this portion relates.
During fiscal
2018
, we also recognized
$12,495
of deferred tax assets related to additional tax basis increases generated from expected future payments under the Tax Receivable Agreement and related deductions for imputed interest on such payments. See "—Tax Receivable Agreement" for more information.
We evaluate the realizability of our deferred tax assets on a quarterly basis and establish valuation allowances when it is more likely than not that all or a portion of a deferred tax asset may not be realized. As of
December 26, 2018
, we concluded, based on the weight of all available positive and negative evidence, that all of our deferred tax assets (except for those deferred tax assets described above relating to basis differences that are expected to result in a capital loss upon the eventual sale of our interest in SSE Holdings) are more likely than not to be realized, except for certain credits we no longer expect to utilize before expiration. As such, a valuation allowance in the amount of
$733
was recognized. The net change in valuation allowance for fiscal
2018
was a decrease of
$3,189
.
Shake Shack Inc.
Form 10-K
|
109
Form 10-K
|
109
Uncertain Tax Positions
There were
no
reserves for uncertain tax positions as of
December 26, 2018
and
December 27, 2017
. Shake Shack Inc. was formed in September 2014 and did not engage in any operations prior to the IPO and Organizational Transactions. Shake Shack Inc. first filed tax returns for tax year 2014, which is the first tax year subject to examination by taxing authorities for U.S. federal and state income tax purposes. Additionally, although SSE Holdings is treated as a partnership for U.S. federal and state income taxes purposes, it is still required to file an annual U.S. Return of Partnership Income, which is subject to examination by the Internal Revenue Service ("IRS"). The statute of limitations has expired for tax years through 2014 for SSE Holdings.
Tax Receivable Agreement
Pursuant to our election under Section 754 of the Internal Revenue Code (the "Code"), we expect to obtain an increase in our share of the tax basis in the net assets of SSE Holdings when LLC Interests are redeemed or exchanged by the non-controlling interest holders and other qualifying transactions. We plan to make an election under Section 754 of Code for each taxable year in which a redemption or exchange of LLC Interest occurs. We intend to treat any redemptions and exchanges of LLC Interests by the non-controlling interest holders as direct purchases of LLC Interests for U.S. federal income tax purposes. These increases in tax basis may reduce the amounts that we would otherwise pay in the future to various tax authorities. They may also decrease gains (or increase losses) on future dispositions of certain capital assets to the extent tax basis is allocated to those capital assets.
On February 4, 2015, we entered into a tax receivable agreement with the then-existing non-controlling interest holders (the "Tax Receivable Agreement") that provides for the payment by us to the non-controlling interest holders of
85%
of the amount of any tax benefits that we actually realize, or in some cases are deemed to realize, as a result of (i) increases in our share of the tax basis in the net assets of SSE Holdings resulting from any redemptions or exchanges of LLC Interests, (ii) tax basis increases attributable to payments made under the Tax Receivable Agreement, and (iii) deductions attributable to imputed interest pursuant to the Tax Receivable Agreement (the "TRA Payments"). We expect to benefit from the remaining
15%
of any tax benefits that we may actually realize. The TRA Payments are not conditioned upon any continued ownership interest in SSE Holdings or us. The rights of each non-controlling interest holder under the Tax Receivable Agreement are assignable to transferees of its LLC Interests.
During fiscal
2018
, we acquired an aggregate of
2,692,660
LLC Interests in connection with the redemption of LLC Interests, which resulted in an increase in the tax basis of our investment in SSE Holdings subject to the provisions of the Tax Receivable Agreement. We recognized an additional liability in the amount of
$44,338
for the TRA Payments due to the redeeming members, representing
85%
of the aggregate tax benefits we expect to realize from the tax basis increases related to the redemption of LLC Interests, after concluding it was probable that such TRA Payments would be paid based on our estimates of future taxable income.
No
payments were made to members of SSE Holdings pursuant to the Tax Receivable Agreement during fiscal
2018
. As of
December 26, 2018
, the total amount of TRA Payments due under the Tax Receivable Agreement was
$203,725
, of which
$5,804
was included in other current liabilities on the Consolidated Balance Sheet. See Note 18 for more information relating to our liabilities under the Tax Receivable Agreement.
NOTE
16
: EARNINGS PER SHARE
Basic earnings per share of Class A common stock is computed by dividing net income attributable to Shake Shack Inc. by the weighted-average number of shares of Class A common stock outstanding during the period. Diluted earnings per share of Class A common stock is computed by dividing net income attributable to Shake Shack Inc. by the weighted-average number of shares of Class A common stock outstanding adjusted to give effect to potentially dilutive securities.
110
|
Shake Shack Inc.
Form 10-K
Form 10-K
The following table sets forth reconciliations of the numerators and denominators used to compute basic and diluted earnings per share of Class A common stock for fiscal
2018
,
2017
and
2016
.
|
2018
|
|
2017
|
|
2016
|
|
||||||||
|
Numerator:
|
|||||||||||||
|
Net income
|
$
|
21,948
|
|
$
|
8,884
|
|
$
|
22,146
|
|
||||
|
Less: net income attributable to non-controlling interests
|
6,769
|
|
9,204
|
|
9,700
|
|
|||||||
|
Net income (loss) attributable to Shake Shack Inc.
|
$
|
15,179
|
|
$
|
(320
|
)
|
$
|
12,446
|
|
||||
|
Denominator:
|
|||||||||||||
|
Weighted-average shares of Class A common stock outstanding—basic
|
28,299
|
|
25,876
|
|
22,956
|
|
|||||||
|
Effect of dilutive securities:
|
|||||||||||||
|
Stock options
|
798
|
|
—
|
|
491
|
|
|||||||
|
Performance stock units
|
63
|
|
—
|
|
2
|
|
|||||||
|
Restricted stock units
|
19
|
|
—
|
|
—
|
|
|||||||
|
Weighted-average shares of Class A common stock outstanding—diluted
|
29,179
|
|
25,876
|
|
23,449
|
|
|||||||
|
Earnings (loss) per share of Class A common stock—basic
|
$
|
0.54
|
|
$
|
(0.01
|
)
|
$
|
0.54
|
|
||||
|
Earnings (loss) per share of Class A common stock—diluted
|
$
|
0.52
|
|
$
|
(0.01
|
)
|
$
|
0.53
|
|
||||
Shares of our Class B common stock do not share in the earnings or losses of Shake Shack and are therefore not participating securities. As such, separate presentation of basic and diluted earnings per share of Class B common stock under the two-class method has not been presented.
The following table presents potentially dilutive securities excluded from the computations of diluted earnings per share of Class A common stock for fiscal
2018
,
2017
and
2016
.
|
2018
|
2017
|
2016
|
|||||||||||
|
Stock options
|
—
|
|
1,719,341
|
|
(2)
|
125
|
|
(1)
|
|||||
|
Performance stock units
|
21,560
|
|
(3)
|
124,842
|
|
(2)
|
26,860
|
|
(3)
|
||||
|
Restricted stock units
|
—
|
|
44,476
|
|
(2)
|
—
|
|
||||||
|
Shares of Class B common stock
|
7,557,347
|
|
(4)
|
10,250,007
|
|
(4)
|
11,253,592
|
|
(4)
|
||||
|
(1)
|
Weighted-average number of securities excluded from the computation of diluted earnings per share of Class A common stock because the exercise price of the stock options exceeded the average market price of our Class A common stock during the period ("out-of-the-money").
|
|
(2)
|
Represents number of instruments outstanding at the end of the period that were excluded from the computation of diluted earnings per share of Class A common stock because the effect would have been anti-dilutive.
|
|
(3)
|
Weighted-average number of securities excluded from the computation of diluted earnings per share of Class A common stock because the performance conditions were not met for a portion of the fiscal year.
|
|
(4)
|
Shares of our Class B common stock are considered potentially dilutive shares of Class A common stock. Amounts have been excluded from the computations of diluted earnings per share of Class A common stock because the effect would have been anti-dilutive under the if-converted and two-class methods.
|
Shake Shack Inc.
Form 10-K
|
111
Form 10-K
|
111
NOTE
17
: SUPPLEMENTAL CASH FLOW INFORMATION
The following table sets forth supplemental cash flow information for fiscal
2018
,
2017
and
2016
:
|
2018
|
|
2017
|
|
2016
|
|
|||||||
|
Cash paid for:
|
||||||||||||
|
Income taxes, net of refunds
|
$
|
3,272
|
|
$
|
2,261
|
|
$
|
1,823
|
|
|||
|
Interest, net of amounts capitalized
|
2,261
|
|
1,106
|
|
54
|
|
||||||
|
Non-cash investing activities:
|
||||||||||||
|
Accrued purchases of property and equipment
|
17,443
|
|
7,526
|
|
6,150
|
|
||||||
|
Capitalized landlord assets for leases where we are deemed the accounting owner
|
5,443
|
|
10,125
|
|
1,985
|
|
||||||
|
Capitalized equity-based compensation
|
107
|
|
109
|
|
139
|
|
||||||
|
Non-cash financing activities:
|
||||||||||||
|
Class A common stock issued in connection with the redemption of LLC Interests
|
2
|
|
1
|
|
5
|
|
||||||
|
Cancellation of Class B common stock in connection with the redemption of LLC Interests
|
(2
|
)
|
(1
|
)
|
(5
|
)
|
||||||
|
Establishment of liabilities under tax receivable agreement
|
44,338
|
|
18,973
|
|
100,063
|
|
||||||
|
Accrued distributions payable to non-controlling interest holders
|
—
|
|
—
|
|
607
|
|
||||||
NOTE
18
: COMMITMENTS AND CONTINGENCIES
Lease Commitments
We are obligated under various operating leases for Shacks and our Home Office space, expiring in various years through
2035
. Under certain of these leases, we are liable for contingent rent based on a percentage of sales in excess of specified thresholds and are responsible for our proportionate share of real estate taxes, common area maintenance charges and utilities. See
Note 10
, Leases.
As security under the terms of one of our leases, we are obligated under a letter of credit totaling
$130
as of
December 26, 2018
, which expires on
February 28, 2026
. In addition, we entered into two irrevocable standby letters of credit: (i) in December 2013, we entered into a letter of credit in conjunction with our previous Home Office lease in the amount of
$80
, which expires in
September 2019
and (ii) in September 2017, we entered into a letter of credit in conjunction with our new Home Office lease in the amount of
$603
, which expires in
August 2019
and renews automatically for one-year periods through
January 31, 2034
.
Purchase Commitments
Purchase obligations include legally binding contracts, including commitments for the purchase, construction or remodeling of real estate and facilities, firm minimum commitments for inventory purchases, equipment purchases, marketing-related contracts, software acquisition/license commitments and service contracts. These obligations are generally short-term in nature and are recorded as liabilities when the related goods are received or services rendered. We also enter into
long-term, exclusive contracts with certain vendors to supply us with food, beverages and paper goods, obligating us to purchase specified quantities. These volume commitments are generally not subject to any time limit and there are no material financial penalties associated with these agreements in the event of early termination.
Legal Contingencies
In February 2018, a claim was filed against Shake Shack in California state court alleging certain violations of the California Labor Code. At a mediation between the parties, we agreed to settle the matter with the plaintiff and all other California employees who
112
|
Shake Shack Inc.
Form 10-K
Form 10-K
elect to participate in the settlement for
$1,200
. As of
December 26, 2018
, an accrual in the amount of
$1,200
was recorded for this matter and related expenses.
We are subject to various legal proceedings, claims and liabilities, such as employment-related claims and slip and fall cases, which arise in the ordinary course of business and are generally covered by insurance. As of
December 26, 2018
, the amount of the ultimate liability with respect to these matters was not material.
Liabilities under Tax Receivable Agreement
As described in Note 15, we are a party to the Tax Receivable Agreement under which we are contractually committed to pay the non-controlling interest holders
85%
of the amount of any tax benefits that we actually realize, or in some cases are deemed to realize, as a result of certain transactions. We are not obligated to make any payments under the Tax Receivable Agreement until the tax benefits associated the transaction that gave rise to the payment are realized. Amounts payable under the Tax Receivable Agreement are contingent upon, among other things, (i) generation of future taxable income over the term of the Tax Receivable Agreement and (ii) future changes in tax laws. If we do not generate sufficient taxable income in the aggregate over the term of the Tax Receivable Agreement to utilize the tax benefits, then we would not be required to make the related TRA Payments. As of
December 26, 2018
, we recognized
$203,725
of
liabilities relating to our obligations under the Tax Receivable Agreement, after concluding that it was probable that we would have sufficient future taxable income to utilize the related tax benefits. There were no transactions subject to the Tax Receivable Agreement for which we did not recognize the related liability, as we concluded that we would have sufficient future taxable income to utilize all of the related tax benefits generated by all transactions that occurred in fiscal
2018
.
NOTE
19
: RELATED PARTY TRANSACTIONS
Union Square Hospitality Group
The Chairman of our Board of Directors serves as the Chief Executive Officer of Union Square Hospitality Group, LLC. As a result, Union Square Hospitality Group, LLC and its subsidiaries are considered related parties.
USHG, LLC
Effective January 2015, we entered into an Amended and Restated Management Services Agreement with USHG, LLC ("USHG"), which USHG provides reduced management services to SSE Holdings comprised of executive leadership from members of its senior management, advisory and development services and limited leadership development and human resources services. The initial term of the Amended and Restated Management Services Agreement is through December 31, 2019, with renewal periods.
Amounts paid to USHG for general corporate expenses were
$2
,
$7
and
$10
for fiscal
2018
,
2017
and
2016
, respectively, and are included in general and administrative expenses on the Consolidated Statements of
Income (Loss)
.
No
amounts were payable to USHG as of
December 26, 2018
and
December 27, 2017
.
No
amounts were due from USHG as of
December 26, 2018
and
December 27, 2017
.
Hudson Yards Sports and Entertainment
In fiscal 2011, we entered into a Master License Agreement (as amended, an "MLA") with Hudson Yards Sports and Entertainment LLC ("HYSE") to operate Shake Shack branded limited menu concession stands in sports and entertainment venues within the United States. The agreement expires on December 31, 2027 and includes
five
consecutive
five
-year renewal options at HYSE's option. As consideration for these rights, HYSE pays us a license fee based on a percentage of net food sales, as defined in the MLA. HYSE also pays us a percentage of profits on sales of branded beverages, as defined in the MLA. Amounts paid to us by HYSE for fiscal
2018
,
2017
and
2016
were
$420
,
$452
and
$309
, respectively, and are included in licensing revenue on the Consolidated Statements of
Income (Loss)
. Total amounts due from HYSE as of
December 26, 2018
and
December 27, 2017
were
$37
and
$18
, respectively, which are included in
other current assets
on the Consolidated Balance Sheets
.
Shake Shack Inc.
Form 10-K
|
113
Form 10-K
|
113
Madison Square Park Conservancy
The Chairman of our Board of Directors serves as a director of the Madison Square Park Conservancy ("MSP Conservancy"), with which we have a license agreement and pay license fees to operate our Madison Square Park Shack. Amounts paid to Madison Square Park Conservancy as rent amounted to
$877
,
$907
and
$1,062
for f
iscal
2018
,
2017
and
2016
, respectively.
These amounts are included in occupancy and related expenses on the Consolidated Statements of
Income (Loss)
. Total amounts due to MSP Conservancy were
$70
as of
December 26, 2018
, which is included in accrued expenses on the Consolidated Balance Sheets.
No
amounts were due to MSP Conservancy as of
December 27, 2017
.
Additionally, we received tenant improvement allowances from MSP Conservancy related to a reconstruction project which ended in 2015. Amounts paid to us from MSP Conservancy for fiscal
2017
were
$200
.
No
amounts were paid to us by MSP Conservancy in fiscal
2018
and
2016
.
No
amounts were due to us from MSP Conservancy as of
December 26, 2018
and
December 27, 2017
.
Share Our Strength
The Chairman of our Board of Directors serves as a director of Share Our Strength, for which Shake Shack holds the "Great American Shake Sale" every year during the month of May to raise money and awareness for childhood hunger. During the Great American Shake Sale, we encourage guests to donate money to Share Our Strength's No Kid Hungry campaign in exchange for a coupon for a free shake. All of the guest donations we collect go directly to Share Our Strength. We raised a total of
$343
,
$633
and
$587
,
in fiscal
2018
,
2017
and
2016
, respectively, and the proceeds were remitted to Share Our Strength in the respective years. We incurred costs of approximately
$53
,
$148
and
$117
for fiscal
2018
,
2017
and
2016
, respectively, representing the cost of the free shakes redeemed. These costs are included in general and administrative expenses and other operating expenses on the Consolidated Statements of
Income (Loss)
.
Additionally, we held a promotional event in August 2016 in which we donated a total of
$20
to the Share Our Strength's No Kid Hungry campaign, which is included in general and administrative expenses on the Consolidated Statements of
Income (Loss)
.
Mobo Systems, Inc.
The Chairman of our Board of Directors serves as a director of Mobo Systems, Inc. (also known as "Olo"), a platform we use in connection with our kiosks and web and mobile ordering applications. Amounts paid to Olo for fiscal
2018
and
2017
were
$111
and
$80
, respectively, which are included in other operating expenses on the Consolidated Statements of
Income (Loss)
.
No
amounts were paid to Olo for fiscal
2016
.
No
amounts were payable to Olo as of
December 26, 2018
and
December 27, 2017
.
Square, Inc.
In July 2017, our Chief Executive Officer joined the Board of Directors of Square, Inc. ("Square"). We currently use certain point-of-sale applications, payment processing services, hardware and other enterprise platform services in connection with the processing of a limited amount of sales at certain of our Shacks, sales for certain off-site events and in connection with our kiosk technology. Additionally, we partnered with Caviar, Square’s food ordering service for delivery services, in a number of cities for limited-time delivery promotions.
114
|
Shake Shack Inc.
Form 10-K
Form 10-K
Tax Receivable Agreement
In connection with our IPO, we entered into a Tax Receivable Agreement with certain non-controlling interest holders that provides for the payment by us to the non-controlling holders
of
85%
of the amount of any tax benefits that Shake Shack actually realizes or in some cases is deemed to realize as a result of (i) increases in the tax basis of the net assets of SSE Holdings resulting from any redemptions or exchanges of LLC Interests and (ii) certain other tax benefits related to our making payments under the Tax Receivable Agreement. See
Note 15
for further information. In fiscal
2017
, payments of
$4,910
, inclusive of interest, were made to the non-controlling interest holders. There were
no
amounts paid under the Tax Receivable Agreement to the non-controlling interest holders during fiscal
2018
and
2016
. As of
December 26, 2018
and
December 27, 2017
, total amounts due under the Tax Receivable Agreement were
$203,725
and
$159,373
, respectively.
Distributions to Members of SSE Holdings
Under the terms of the SSE Holdings LLC Agreement, SSE Holdings is obligated to make tax distributions to its members. During fiscal
2018
,
2017
and
2016
, tax distributions of
$751
,
$2,379
and
$1,745
, respectively, were paid to non-controlling interest holders.
No
tax distributions were payable to non-controlling interest holders as of
December 26, 2018
and
December 27, 2017
.
NOTE
20
: GEOGRAPHIC INFORMATION
Revenue by geographic area for fiscal
2018
,
2017
and
2016
is as follows:
|
2018
|
|
2017
|
|
2016
|
|
|||||||
|
United States
|
$
|
447,575
|
|
$
|
348,575
|
|
$
|
260,602
|
|
|||
|
Other countries
|
11,735
|
|
10,235
|
|
7,873
|
|
||||||
|
Total revenue
|
$
|
459,310
|
|
$
|
358,810
|
|
$
|
268,475
|
|
|||
Revenues are shown based on the geographic location of our customers and licensees. All of our assets are located in the United States.
NOTE
21
: SELECTED QUARTERLY FINANCIAL DATA (UNAUDITED)
The following table sets forth certain unaudited financial information for each quarter of fiscal
2018
and
2017
. The unaudited quarterly information includes all adjustments (consisting of normal recurring adjustments) that, in the opinion of management, are necessary for the fair presentation of the information presented. Operating results for interim periods are not necessarily indicative of the results that may be expected for a full fiscal year.
|
2018
|
|||||||||||||||||
|
First
|
|
Second
|
|
Third
|
|
Fourth
|
|
||||||||||
|
Quarter
|
|
Quarter
|
|
Quarter
|
|
Quarter
|
|
||||||||||
|
Total revenue
|
$
|
99,116
|
|
$
|
116,282
|
|
$
|
119,647
|
|
$
|
124,265
|
|
|||||
|
Operating income
|
6,514
|
|
13,018
|
|
9,343
|
|
2,836
|
|
|||||||||
|
Net income (loss)
|
4,979
|
|
10,571
|
|
6,946
|
|
(548
|
)
|
|||||||||
|
Net income (loss) attributable to Shake Shack Inc.
|
3,508
|
|
7,604
|
|
5,025
|
|
(958
|
)
|
|||||||||
|
Earnings (loss) per share
(1)
:
|
|||||||||||||||||
|
Basic
|
$
|
0.13
|
|
$
|
0.27
|
|
$
|
0.17
|
|
$
|
(0.03
|
)
|
|||||
|
Diluted
|
$
|
0.13
|
|
$
|
0.26
|
|
$
|
0.17
|
|
$
|
(0.03
|
)
|
|||||
Shake Shack Inc.
Form 10-K
|
115
Form 10-K
|
115
|
2017
|
|||||||||||||||||
|
First
|
|
Second
|
|
Third
|
|
Fourth
|
|
||||||||||
|
Quarter
|
|
Quarter
|
|
Quarter
|
|
Quarter
|
|
||||||||||
|
Total revenue
|
$
|
76,749
|
|
$
|
91,316
|
|
$
|
94,609
|
|
$
|
96,136
|
|
|||||
|
Operating income
|
5,628
|
|
11,737
|
|
10,610
|
|
5,838
|
|
|||||||||
|
Net income (loss)
|
3,682
|
|
8,184
|
|
7,870
|
|
(11,032
|
)
|
|||||||||
|
Net income (loss) attributable to Shake Shack Inc.
|
2,267
|
|
4,879
|
|
4,997
|
|
(12,463
|
)
|
|||||||||
|
Earnings (loss) per share
(1)
:
|
|||||||||||||||||
|
Basic
|
$
|
0.09
|
|
$
|
0.19
|
|
$
|
0.19
|
|
$
|
(0.47
|
)
|
|||||
|
Diluted
|
$
|
0.09
|
|
$
|
0.19
|
|
$
|
0.19
|
|
$
|
(0.47
|
)
|
|||||
|
(1)
|
Basic and diluted earnings per share are computed independently for each of the quarters presented. Therefore, the sum of quarterly basic and diluted earnings per share amounts may not equal annual basic and diluted earnings per share amounts.
|
116
|
Shake Shack Inc.
Form 10-K
Form 10-K
Schedule I: Condensed Financial Information of Registrant
SHAKE SHACK INC.
CONDENSED BALANCE SHEETS
(PARENT COMPANY ONLY)
(in thousands, except share and per share amounts)
|
December 26
2018 |
|
December 27
2017 |
|
||||||
|
ASSETS
|
|||||||||
|
Current assets:
|
|||||||||
|
Cash
|
$
|
5,686
|
|
$
|
4,988
|
|
|||
|
Prepaid expenses
|
135
|
|
100
|
|
|||||
|
Total current assets
|
5,821
|
|
5,088
|
|
|||||
|
Deferred income taxes, net
|
242,353
|
|
185,750
|
|
|||||
|
Investment in subsidiaries
|
185,331
|
|
142,314
|
|
|||||
|
TOTAL ASSETS
|
$
|
433,505
|
|
$
|
333,152
|
|
|||
|
LIABILITIES AND STOCKHOLDERS' EQUITY
|
|||||||||
|
Current liabilities:
|
|||||||||
|
Accrued expenses
|
171
|
|
70
|
|
|||||
|
Due to SSE Holdings
|
3,534
|
|
4,217
|
|
|||||
|
Current portion of liabilities under tax receivable agreement
|
5,804
|
|
937
|
|
|||||
|
Total current liabilities
|
9,509
|
|
5,224
|
|
|||||
|
Liabilities under tax receivable agreement, net of current portion
|
197,921
|
|
158,436
|
|
|||||
|
Total liabilities
|
207,430
|
|
163,660
|
|
|||||
|
Commitments and contingencies
|
|
|
|||||||
|
Stockholders' equity:
|
|||||||||
|
Preferred stock, no par value—10,000,000 shares authorized; none issued and outstanding as of December 26, 2018 and December 27, 2017, respectively.
|
—
|
|
—
|
|
|||||
|
Class A common stock, $0.001 par value—200,000,000 shares authorized; 29,520,833 and 26,527,477 shares issued and outstanding as of December 26, 2018 and December 27, 2017, respectively.
|
30
|
|
27
|
|
|||||
|
Class B common stock, $0.001 par value—35,000,000 shares authorized; 7,557,347 and 10,250,007 shares issued and outstanding as of December 26, 2018 and December 27, 2017, respectively.
|
8
|
|
10
|
|
|||||
|
Additional paid-in capital
|
195,633
|
|
153,105
|
|
|||||
|
Retained earnings
|
30,404
|
|
16,399
|
|
|||||
|
Accumulated other comprehensive loss
|
—
|
|
(49
|
)
|
|||||
|
Total stockholders' equity
|
226,075
|
|
169,492
|
|
|||||
|
TOTAL LIABILITIES AND STOCKHOLDERS' EQUITY
|
$
|
433,505
|
|
$
|
333,152
|
|
|||
See accompanying Notes to Condensed Financial Statements.
Shake Shack Inc.
Form 10-K
|
117
Form 10-K
|
117
Schedule I: Condensed Financial Information of Registrant
(continued)
SHAKE SHACK INC.
CONDENSED STATEMENTS OF INCOME (LOSS)
(PARENT COMPANY ONLY)
(in thousands)
|
Fiscal Year Ended
|
|||||||||||||
|
December 26
2018 |
|
December 27
2017 |
|
December 28
2016 |
|
||||||||
|
Intercompany revenue
|
$
|
2,055
|
|
$
|
1,466
|
|
$
|
1,603
|
|
||||
|
TOTAL REVENUE
|
2,055
|
|
1,466
|
|
1,603
|
|
|||||||
|
General and administrative expenses
|
1,933
|
|
1,692
|
|
1,603
|
|
|||||||
|
TOTAL EXPENSES
|
1,933
|
|
1,692
|
|
1,603
|
|
|||||||
|
OPERATING INCOME (LOSS)
|
122
|
|
(226
|
)
|
—
|
|
|||||||
|
Equity in net income of subsidiaries
|
21,537
|
|
22,090
|
|
16,982
|
|
|||||||
|
Other income
|
78
|
|
127,221
|
|
688
|
|
|||||||
|
Interest expense
|
(14
|
)
|
(50
|
)
|
(16
|
)
|
|||||||
|
INCOME BEFORE INCOME TAXES
|
21,723
|
|
149,035
|
|
17,654
|
|
|||||||
|
Income tax expense
|
6,544
|
|
149,355
|
|
5,208
|
|
|||||||
|
NET INCOME (LOSS)
|
$
|
15,179
|
|
$
|
(320
|
)
|
$
|
12,446
|
|
||||
See accompanying Notes to Condensed Financial Statements.
118
|
Shake Shack Inc.
Form 10-K
Form 10-K
Schedule I: Condensed Financial Information of Registrant
(continued)
SHAKE SHACK INC.
CONDENSED STATEMENTS OF COMPREHENSIVE INCOME (LOSS)
(PARENT COMPANY ONLY)
(in thousands)
|
Fiscal Year Ended
|
|||||||||||||
|
December 26
2018 |
|
December 27
2017 |
|
December 28
2016 |
|
||||||||
|
Net income (loss)
|
$
|
15,179
|
|
$
|
(320
|
)
|
$
|
12,446
|
|
||||
|
Other comprehensive income (loss), net of tax:
|
|||||||||||||
|
Available-for-sale securities
(1)
:
|
|||||||||||||
|
Change in net unrealized holding losses
|
(3
|
)
|
(67
|
)
|
(22
|
)
|
|||||||
|
Less: reclassification adjustments for net realized losses included in net income
|
13
|
|
33
|
|
12
|
|
|||||||
|
Net change
|
10
|
|
(34
|
)
|
(10
|
)
|
|||||||
|
OTHER COMPREHENSIVE INCOME (LOSS)
|
10
|
|
(34
|
)
|
(10
|
)
|
|||||||
|
COMPREHENSIVE INCOME (LOSS)
|
$
|
15,189
|
|
$
|
(354
|
)
|
$
|
12,436
|
|
||||
(1) Net of tax benefit of
$0
for fiscal years ended
December 26, 2018
,
December 27, 2017
and
December 28, 2016
.
See accompanying Notes to Condensed Financial Statements.
Shake Shack Inc.
Form 10-K
|
119
Form 10-K
|
119
Schedule I: Condensed Financial Information of Registrant
(continued)
SHAKE SHACK INC.
CONDENSED STATEMENTS OF CASH FLOWS
(PARENT COMPANY ONLY)
(in thousands)
|
Fiscal Year Ended
|
||||||||||||||||
|
December 26
2018 |
|
December 27
2017 |
|
December 28
2016 |
|
|||||||||||
|
OPERATING ACTIVITIES
|
||||||||||||||||
|
Net income (loss)
|
$
|
15,179
|
|
$
|
(320
|
)
|
$
|
12,446
|
|
|||||||
|
Adjustments to reconcile net income (loss) to net cash provided by (used in) operating activities:
|
||||||||||||||||
|
Equity in net income of subsidiaries
|
(21,537
|
)
|
(22,090
|
)
|
(16,982
|
)
|
||||||||||
|
Equity-based compensation
|
252
|
|
234
|
|
189
|
|
||||||||||
|
Non-cash reimbursement revenue treated as investment
|
—
|
|
—
|
|
(189
|
)
|
||||||||||
|
Deferred income taxes
|
777
|
|
146,095
|
|
(462
|
)
|
||||||||||
|
Other non-cash income
|
(78
|
)
|
(127,221
|
)
|
(688
|
)
|
||||||||||
|
Changes in operating assets and liabilities:
|
||||||||||||||||
|
Accounts receivable
|
—
|
|
2
|
|
(2
|
)
|
||||||||||
|
Prepaid expenses and other current assets
|
—
|
|
5
|
|
(1
|
)
|
||||||||||
|
Due to/from SSE Holdings
|
(7,103
|
)
|
(5,339
|
)
|
214
|
|
||||||||||
|
Accrued expenses
|
5,669
|
|
21
|
|
(11
|
)
|
||||||||||
|
Other current liabilities
|
14
|
|
(17
|
)
|
17
|
|
||||||||||
|
Income taxes payable
|
—
|
|
2,990
|
|
5,023
|
|
||||||||||
|
NET CASH USED IN OPERATING ACTIVITIES
|
(6,827
|
)
|
(5,640
|
)
|
(446
|
)
|
||||||||||
|
INVESTING ACTIVITIES
|
||||||||||||||||
|
Purchases of LLC Interests from SSE Holdings
|
(11,142
|
)
|
(5,522
|
)
|
(4,559
|
)
|
||||||||||
|
Return of investment in SSE Holdings
|
2,053
|
|
4,101
|
|
2,694
|
|
||||||||||
|
NET CASH USED IN INVESTING ACTIVITIES
|
(9,089
|
)
|
(1,421
|
)
|
(1,865
|
)
|
||||||||||
|
FINANCING ACTIVITIES
|
||||||||||||||||
|
Proceeds from issuance of Class A common stock to SSE Holdings upon settlement of equity awards
|
11,142
|
|
5,522
|
|
2,489
|
|
||||||||||
|
Proceeds from stock option exercises
|
5,472
|
|
7,586
|
|
3,185
|
|
||||||||||
|
Payments under tax receivable agreement
|
—
|
|
(4,844
|
)
|
—
|
|
||||||||||
|
NET CASH PROVIDED BY FINANCING ACTIVITIES
|
16,614
|
|
8,264
|
|
5,674
|
|
||||||||||
|
INCREASE IN CASH
|
698
|
|
1,203
|
|
3,363
|
|
||||||||||
|
CASH AT BEGINNING OF PERIOD
|
4,988
|
|
3,785
|
|
422
|
|
||||||||||
|
CASH AT END OF PERIOD
|
$
|
5,686
|
|
$
|
4,988
|
|
$
|
3,785
|
|
|||||||
See accompanying Notes to Condensed Financial Statements.
120
|
Shake Shack Inc.
Form 10-K
Form 10-K
Schedule I: Condensed Financial Information of Registrant
(continued)
SHAKE SHACK INC.
NOTES TO CONDENSED FINANCIAL STATEMENTS
(PARENT COMPANY ONLY)
(in thousands, except share and per share amounts)
NOTE 1: ORGANIZATION
Sha
ke Shack Inc. (the "Parent Company") was formed on September 23, 2014 as a Delaware corporation and is a holding company with no direct operations. The Parent Company's assets consist primarily of its equity interest in
SSE Holdings, LLC ("SSE Holdings") and certain deferred tax assets.
The Parent Company's cash inflows are primarily from cash dividends or distributions and other transfers from SSE Holdings. The amounts available to the Parent Company to fulfill cash commitments and pay cash dividends on its common stock are subject to certain restrictions in SSE Holdings' revolving credit agreement. See Note 9 to the consolidated financial statements.
NOTE 2: BASIS OF PRESENTATION
These condensed parent company financial statements should be read in conjunction with the consolidated financial statements of Shake Shack Inc. and the accompanying notes thereto, included in this Annual Report on Form 10-K. For purposes of these condensed financial statements, the Parent Company's interest in SSE Holdings is recorded based upon its proportionate share of SSE Holdings' net assets (similar to presenting them on the equity method).
The Parent Company is the sole managing member of SSE Holdings, and pursuant to the Third Amended and Restated LLC Agreement of SSE Holdings (the “SSE Holdings LLC Agreement”), receives compensation in the form of reimbursements for all costs associated with being a public company and maintaining its existence. Intercompany revenue consists of these reimbursement payments and is recognized when the corresponding expense to which it relates is recognized.
Certain intercompany balances presented in these condensed parent company financial statements are eliminated in the consolidated financial statements. As of
December 26, 2018
,
$3,534
of intercompany payables were eliminated in consolidation and
$4,217
of intercompany payables were eliminated in consolidation as of
December 27, 2017
. For fiscal
2018
,
$2,055
and
$21,537
of intercompany revenue and equity in net income of subsidiaries, respectively, was eliminated in consolidation. For fiscal
2017
,
$1,466
and
$22,090
of intercompany revenue and equity in net income of subsidiaries, respectively, was eliminated in consolidation. Related party amounts that were not eliminated in the consolidated financial statements include the Parent Company's liabilities under the tax receivable agreement, which totaled
$203,725
and
$159,373
as of
December 26, 2018
and
December 27, 2017
, respectively.
NOTE 3: COMMITMENTS AND CONTINGENCIES
On February 4, 2015, the Parent Company entered into a tax receivable agreement with the non-controlling interest holders that provides for payments to the non-controlling interest holders of
85%
of the amount of any tax benefits that the Parent Company actually realizes, or in some cases is deemed to realize, as a result of certain transactions. S
ee Note 15 to the consolidated financial statements for more information regarding the Parent Company's tax receivable agreement. As described in Note 18 to the consolidated financial statements, a
mounts payable under the tax receivable agreement are contingent upon, among other things, (i) generation of future taxable income of Shake Shack Inc. over the term of the tax receivable agreement and (ii) future changes in tax laws.
As of
December 26, 2018
and
December 27, 2017
, liabilities under the tax receivable agreement totaled
$203,725
and
$159,373
, respectively.
Shake Shack Inc.
Form 10-K
|
121
Form 10-K
|
121
NOTE 4: SUPPLEMENTAL CASH FLOW INFORMATION
The following table sets forth supplemental cash flow information for fiscal
2018
,
2017
and
2016
:
|
2018
|
|
2017
|
|
2016
|
|
|||||||||||
|
Cash paid for:
|
||||||||||||||||
|
Income taxes
|
$
|
185
|
|
$
|
253
|
|
$
|
576
|
|
|||||||
|
Interest
|
—
|
|
2
|
|
—
|
|
||||||||||
|
Non-cash investing activities:
|
||||||||||||||||
|
Accrued contribution related to stock option exercises
|
5,472
|
|
7,586
|
|
1,116
|
|
||||||||||
|
Class A common stock issued in connection with the acquisition of LLC Interests upon redemption by the non-controlling interest holders
|
15,202
|
|
4,415
|
|
18,944
|
|
||||||||||
|
Non-cash contribution made in connection with equity awards granted to employees of SSE Holdings
|
5,999
|
|
5,497
|
|
5,304
|
|
||||||||||
|
Non-cash financing activities:
|
||||||||||||||||
|
Cancellation of Class B common stock in connection with the Organizational Transactions
|
||||||||||||||||
|
Cancellation of Class B common stock in connection with the redemption of LLC Interests
|
(2
|
)
|
(1
|
)
|
(5
|
)
|
||||||||||
|
Establishment of liabilities under tax receivable agreement
|
44,338
|
|
18,973
|
|
100,063
|
|
||||||||||
122
|
Shake Shack Inc.
Form 10-K
Form 10-K
Schedule II: Valuation and Qualifying Accounts
|
Balance at beginning of period
|
|
Additions
|
Reductions
|
|
Balance at end of period
|
|
||||||||||||||
|
(in thousands)
|
Charged to costs and expenses
|
|
Charged to other accounts
|
|
||||||||||||||||
|
Deferred tax asset valuation allowance:
|
||||||||||||||||||||
|
Fiscal year ended December 31, 2014
|
$
|
—
|
|
$
|
—
|
|
$
|
—
|
|
$
|
—
|
|
$
|
—
|
|
|||||
|
Fiscal year ended December 30, 2015
|
$
|
—
|
|
$
|
—
|
|
$
|
39,700
|
|
(1)
|
$
|
(16,545
|
)
|
$
|
23,155
|
|
||||
|
Fiscal year ended December 28, 2016
|
$
|
23,155
|
|
$
|
90
|
|
$
|
1,965
|
|
(1)
|
$
|
(9,642
|
)
|
$
|
15,568
|
|
||||
|
Fiscal year ended December 27, 2017
|
$
|
15,568
|
|
$
|
—
|
|
$
|
3,455
|
|
(1)
|
$
|
(8,909
|
)
|
(2)
|
$
|
10,114
|
|
|||
|
Fiscal year ended December 26, 2018
|
$
|
10,114
|
|
$
|
782
|
|
$
|
—
|
|
$
|
(3,971
|
)
|
$
|
6,925
|
|
|||||
|
(1)
|
Amount relates to a valuation allowance established on deferred tax assets related to our investment in SSE Holdings.
|
|
(2)
|
Amount includes a
$4,780
remeasurement adjustment related to the enactment of the TCJA, which was recognized through earnings.
|
Shake Shack Inc.
Form 10-K
|
123
Form 10-K
|
123
Item 9. Changes in and Disagreements with Accountants on Accounting and Financial Disclosure.
None.
Item 9A. Controls and Procedures.
DISCLOSURE CONTROLS AND PROCEDURES
Under the supervision and with the participation of our management, including the Chief Executive Officer and Chief Financial Officer, we conducted an e
valuation of the effectiveness of our disclosure controls and procedures (as such term is defined in Rules 13a-15(e) and 15d-15(e) under the
Exchange Act) as of the end of the period covered by this report. Based on this evaluation, our Chief Executive Officer and Chief Financial Officer concluded that our disclosure controls and procedures were effective as of such date. Our disclosure controls and procedures are designed to ensure that information required to be disclosed in the reports we file or submit under the Exchange Act is recorded, processed, summarized and reported within the time periods specified in the SEC’s rules and forms and that such information is accumulated and communicated to management, including the Chief Executive Officer and Chief Financial Officer, to allow timely decisions regarding required disclosure.
MANAGEMENT'S REPORT ON INTERNAL CONTROL OVER FINANCIAL REPORTING
For Management's Report on Internal Control over Financial Reporting, see Item 8, Financial Statements and Supplementary Data.
CHANGES IN INTERNAL CONTROL OVER FINANCIAL REPORTING
There were no changes to our internal control over financial reporting that occurred during the quarter ended
December 26, 2018
that have materially affected, or are reasonably likely to materially affect, our internal control over financial reporting.
Item 9B. Other Information.
Not applicable.
124
|
Shake Shack Inc.
Form 10-K
Form 10-K
PART III
Item 10. Directors, Executive Officers and Corporate Governance.
The information required by this item with respect to our directors is incorporated by reference to the sections entitled “Nominees for Election as Class I Directors” and "Continuing Directors" in our Proxy Statement to be filed in connection with our 2019 Annual Meeting of Shareholders (the “Proxy Statement”). The information required by this item with respect to our Code of Business Conduct and Audit Committee (including our “audit committee financial expert”) is incorporated by reference to the sections entitled “Code of Ethics” and “Audit Committee Report.”
The information required by this item with respect to our executive officers is set forth under the section entitled “Executive Officers of the Registrant” in Part I, Item 1 of this Annual Report on Form 10-K.
The information required by this item with respect to Section 16(a) of the Exchange Act is incorporated by reference to the section of the Proxy Statement entitled “Section 16(a) Beneficial Ownership Reporting Compliance.”
Item 11. Executive Compensation.
The information required by this item with respect to director and executive officer compensation is incorporated by reference to the section entitled “Executive Compensation” in our Proxy Statement.
Item 12. Security Ownership of Certain Beneficial Owners and Management and Related Stockholder Matters.
The information required by this item with respect to securities authorized for issuance under equity compensation plans is set forth under the section entitled “Securities Authorized for Issuance under Equity Compensation Plans” in Part II, Item 5 of this Annual Report on Form 10-K.
The information required by this item with respect to security ownership of certain beneficial owners and management is incorporated by reference to the section entitled “Security Ownership of Certain Beneficial Owners and Management” in our Proxy Statement.
Item 13. Certain Relationships and Related Transactions, and Director Independence.
The information required by this item with respect to transactions with related persons and director independence is incorporated by reference to the sections entitled “Certain Relationships and Related Party Transactions” and “Composition of our Board of Directors” in our Proxy Statement.
Item 14. Principal Accounting Fees and Services.
The information required by this item with respect to principal accountant’s fees and services is incorporated by reference to the sections entitled “Audit and Related Fees” and “Audit Committee Report” in our Proxy Statement.
Shake Shack Inc.
Form 10-K
|
125
Form 10-K
|
125
Part IV
Item 15. Exhibits and Financial Statement Schedules.
|
(a)
|
The following documents are filed as part of this report:
|
|
(1)
|
Financial Statements
|
|
Page
|
|
|
(2)
|
Financial Statement Schedules
|
All other financial statement schedules are omitted since they are not required or are not applicable, or the required information is included in the consolidated financial statements or notes thereto.
|
(1)
|
Exhibits
|
The exhibits listed on the accompanying Exhibit Index are filed or incorporated by reference as part of this report and such Exhibit Index is incorporated herein by reference.
Item 16. Form 10-K Summary
None.
126
|
Shake Shack Inc.
Form 10-K
Form 10-K
EXHIBIT INDEX
|
Exhibit
Number
|
Incorporated by Reference
|
Filed
Herewith
|
||||||||
|
Exhibit Description
|
Form
|
Exhibit
|
Filing Date
|
|||||||
|
8-K
|
3.1
|
2/10/2015
|
||||||||
|
8-K
|
3.2
|
2/10/2015
|
||||||||
|
S-1/A
|
4.1
|
1/28/2015
|
||||||||
|
8-K
|
10.3
|
2/10/2015
|
||||||||
|
POSAM
|
10.1.1
|
3/10/2016
|
||||||||
|
10-K
|
10.1.2
|
3/13/2017
|
||||||||
|
S-1
|
10.13
|
12/29/2014
|
||||||||
|
8-K
|
10.1
|
2/10/2015
|
||||||||
|
8-K
|
10.2
|
2/10/2015
|
||||||||
|
10-Q
|
10.2
|
11/6/2015
|
||||||||
|
8-K
|
10.4
|
2/10/2015
|
||||||||
|
10-Q
|
10.1
|
11/6/2015
|
||||||||
|
10-Q
|
10.2
|
8/4/2017
|
||||||||
|
*
|
||||||||||
|
10-K
|
10.6
|
3/27/2015
|
||||||||
|
*
|
||||||||||
|
S-1/A
|
10.6
|
1/20/2015
|
||||||||
|
S-1/A
|
10.21
|
1/20/2015
|
||||||||
|
†
|
S-8
|
4.4
|
1/30/2015
|
|||||||
|
†
|
10-Q
|
10.1
|
5/16/2016
|
|||||||
|
†
|
S-1/A
|
10.19
|
1/20/2015
|
|||||||
Shake Shack Inc.
Form 10-K
|
127
Form 10-K
|
127
|
Exhibit
Number
|
Incorporated by Reference
|
Filed
Herewith
|
||||||||
|
Exhibit Description
|
Form
|
Exhibit
|
Filing Date
|
|||||||
|
†
|
S-1/A
|
10.20
|
1/20/2015
|
|||||||
|
†
|
10-Q
|
10.2
|
5/16/2016
|
|||||||
|
†
|
10-Q
|
10.3
|
5/16/2016
|
|||||||
|
†
|
*
|
|||||||||
|
†
|
*
|
|||||||||
|
†
|
*
|
|||||||||
|
†
|
S-1
|
10.12
|
12/29/2014
|
|||||||
|
†
|
8-K
|
10.1
|
1/5/2017
|
|||||||
|
†
|
8-K
|
10.1
|
5/1/2017
|
|||||||
|
†
|
8-K
|
10.1
|
10/26/2018
|
|||||||
|
†
|
10-K
|
10.2
|
2/26/2018
|
|||||||
|
†
|
10-K
|
10.19.1
|
2/26/2018
|
|||||||
|
†
|
10-K
|
10.19.2
|
2/26/2018
|
|||||||
|
*
|
||||||||||
|
*
|
||||||||||
|
*
|
||||||||||
|
*
|
||||||||||
|
#
|
||||||||||
|
101.INS
|
XBRL Instance Document
|
*
|
||||||||
|
101.SCH
|
XBRL Taxonomy Extension Schema Document
|
*
|
||||||||
|
101.CAL
|
XBRL Taxonomy Extension Calculation Linkbase Document
|
*
|
||||||||
|
101.DEF
|
XBRL Taxonomy Extension Definition Linkbase Document
|
*
|
||||||||
|
101.LAB
|
XBRL Taxonomy Extension Label Linkbase Document
|
*
|
||||||||
|
101.PRE
|
XBRL Taxonomy Extension Presentation Linkbase Document
|
*
|
||||||||
|
†
|
Indicates a management contract or compensatory plan or arrangement.
|
|
#
|
Furnished herewith.
|
128
|
Shake Shack Inc.
Form 10-K
Form 10-K
SIGNATURES
Pursuant to the requirements of Section 13 or 15(d) of the Securities Exchange Act of 1934, the registrant has duly caused this report to be signed on its behalf by the undersigned, thereunto duly authorized.
|
Shake Shack Inc.
|
||
|
(Registrant)
|
||
|
By:
|
/s/ Tara Comonte
|
|
|
|
Tara Comonte
|
|
|
Date: February 25, 2019
|
|
Chief Financial Officer
|
Pursuant to the requirements of the Securities and Exchange Act of 1934, this report has been signed below by the following persons on behalf of the registrant and in the capacities and on the dates indicated.
|
Signature
|
Title
|
Date
|
|
|
February 25, 2019
|
|||
|
/s/ Randy Garutti
|
Chief Executive Officer and Director
|
||
|
Randy Garutti
|
(Principal Executive Officer)
|
||
|
|
|||
|
/s/ Tara Comonte
|
Chief Financial Officer
|
February 25, 2019
|
|
|
Tara Comonte
|
(Principal Financial and Accounting Officer)
|
||
|
/s/ Daniel Meyer
|
Chairman of the Board of Directors
|
February 25, 2019
|
|
|
Daniel Meyer
|
|||
|
/s/ Anna Fieler
|
Director
|
February 25, 2019
|
|
|
Anna Fieler
|
|||
|
/s/ Jeff Flug
|
Director
|
February 25, 2019
|
|
|
Jeff Flug
|
|||
|
/s/ Jenna Lyons
|
Director
|
February 25, 2019
|
|
|
Jenna Lyons
|
|||
|
/s/ Joshua Silverman
|
Director
|
February 25, 2019
|
|
|
Joshua Silverman
|
|||
|
/s/ Jonathan D. Sokoloff
|
Director
|
February 25, 2019
|
|
|
Jonathan D. Sokoloff
|
|||
|
/s/ Robert Vivian
|
Director
|
February 25, 2019
|
|
|
Robert Vivian
|
|||
Shake Shack Inc.
Form 10-K
|
129
Form 10-K
|
129
TABLE OF CONTENTS
Part IItem 1. BusinessItem 1A. Risk FactorsItem 1B. Unresolved Staff CommentsItem 2. PropertiesItem 3. Legal ProceedingsItem 4. Mine Safety DisclosuresPart IIItem 5. Market For Registrant's Common Equity, Related Stockholder Matters and Issuer Purchases Of Equity SecuritiesItem 6. Selected Financial DataItem 7. Management's Discussion and Analysis Of Financial Condition and Results Of OperationsItem 7A. Quantitative and Qualitative Disclosures About Market RiskItem 8. Financial Statements and Supplementary DataNote 1: Nature Of OperationsNote 2: Summary Of Significant Accounting PoliciesNote 3: RevenueNote 4: Fair Value MeasurementsNote 5: Accounts ReceivableNote 6: InventoriesNote 7: Property and EquipmentNote 8: Supplemental Balance Sheet InformationNote 9: DebtNote 10: LeasesNote 11: Employee Benefit PlansNote 12: Stockholders' EquityNote 13: Non-controlling InterestsNote 14: Equity-based CompensationNote 15: Income TaxesNote 16: Earnings Per ShareNote 17: Supplemental Cash Flow InformationNote 18: Commitments and ContingenciesNote 19: Related Party TransactionsNote 20: Geographic InformationNote 21: Selected Quarterly Financial Data (unaudited)Note 1: OrganizationNote 2: Basis Of PresentationNote 3: Commitments and ContingenciesNote 4: Supplemental Cash Flow InformationItem 9. Changes in and Disagreements with Accountants on Accounting and Financial DisclosureItem 9A. Controls and ProceduresItem 9B. Other InformationPart IIIItem 10. Directors, Executive Officers and Corporate GovernanceItem 11. Executive CompensationItem 12. Security Ownership Of Certain Beneficial Owners and Management and Related Stockholder MattersItem 13. Certain Relationships and Related Transactions, and Director IndependenceItem 14. Principal Accounting Fees and ServicesPart IVItem 15. Exhibits and Financial Statement SchedulesItem 16. Form 10-k Summary