Table of Contents
royaldutchshell.shareholders@shell.com
|
Title of Each Class
|
Name of Each Exchange on Which Registered
|
|
| American Depositary Shares representing two Class A ordinary shares of the issuer with a nominal value of €0.07 each | New York Stock Exchange | |
| American Depositary Shares representing two Class B ordinary shares of the issuer with a nominal value of €0.07 each | New York Stock Exchange | |
| 4.95% Guaranteed Notes due 2012 | New York Stock Exchange | |
| Floating Rate Guaranteed Notes due 2012 | New York Stock Exchange | |
| 1.875% Guaranteed Notes due 2013 | New York Stock Exchange | |
| 4.0% Guaranteed Notes due 2014 | New York Stock Exchange | |
| 3.1% Guaranteed Notes due 2015 | New York Stock Exchange | |
| 3.25% Guaranteed Notes due 2015 | New York Stock Exchange | |
| 5.2% Guaranteed Notes due 2017 | New York Stock Exchange | |
| 4.3% Guaranteed Notes due 2019 | New York Stock Exchange | |
| 4.375% Guaranteed Notes due 2020 | New York Stock Exchange | |
| 6.375% Guaranteed Notes due 2038 | New York Stock Exchange | |
| 5.5% Guaranteed Notes due 2040 | New York Stock Exchange |
None
Securities for which there is a reporting obligation pursuant to Section 15(d) of the Act
None
| U.S. GAAP o International Financial Reporting Standards as issued by the International Accounting Standards Board | þ Other o |
Table of Contents

| ANNUAL REPORT ROYAL DUTCH SHELL PLC ANNUAL REPORT AND FORM 20-F FOR THE YEAR ENDED DECEMBER 31, 2011 BUILDING AN ENERGY FUTURE ANNUAL REPORT ROYAL DUTCH SHELL PLC ANNUAL REPORT AND FORM 20-F FOR THE YEAR ENDED DECEMBER 31, 2011 BUILDING AN ENERGY FUTURE |
Table of Contents
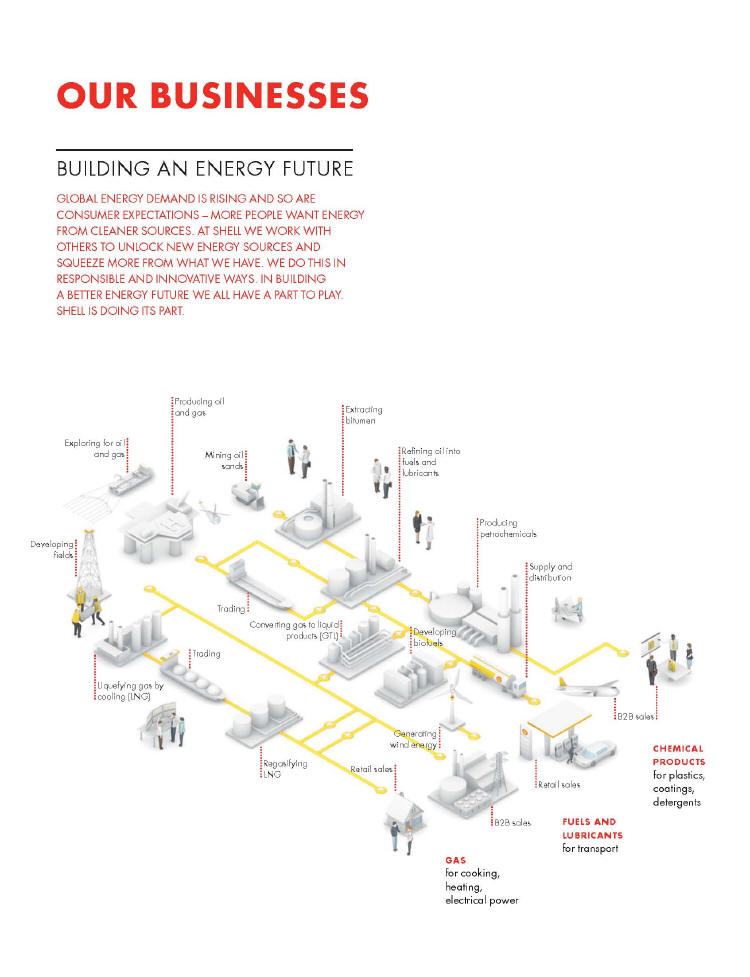
| OUR BUSINESSES BUILDING AN ENERGY FUTURE GLOBAL ENERGY DEMAND IS RISING AND SO ARE CONSUMER EXPECTATIONS — MORE PEOPLE WANT ENERGY FROM CLEANER SOURCES. AT SHELL WE WORK WITH OTHERS TO UNLOCK NEW ENERGY SOURCES AND SQUEEZE MORE FROM WHAT WE HAVE. WE DO THIS IN RESPONSIBLE AND INNOVATIVE WAYS. IN BUILDING A BETTER ENERGY FUTURE WE ALL HAVE A PART TO PLAY. SHELL IS DOING ITS PART. Producing oil and gas Extracting bitumen Exploring for oil Refining oil into and gas Mining oil fuels and sands lubricants Producing petrochemicals Developing fields Supply and distribution Trading Converting gas to liquid Developing products (GTL) biofuels Trading Liquefying gas by cooling (LNG) B2B sales Generating wind energy CHEMICAL PRODUCTS Regasifying Retail sales LNG for plastics, Retail sales coatings, detergents B2B sales FUELS AND LUBRICANTS for transport GAS for cooking, heating, electrical power |
Table of Contents
|
2
|
Shell Annual Report and Form 20-F 2011 | ||
| About this Report |
|
CURRENCIES
|
||||
|
$
|
US dollar | |||
|
€
|
euro | |||
|
£
|
sterling | |||
|
CHF
|
Swiss franc | |||
|
UNITS OF MEASUREMENT
|
||||
|
acre
|
approximately 0.004 square kilometres | |||
|
b(/d)
|
barrels (per day) | |||
|
boe(/d)
|
barrels of oil equivalent (per day); natural gas volumes are converted to oil equivalent using a factor of 5,800 scf per barrel | |||
|
MMBtu
|
million British thermal units | |||
|
mtpa
|
million tonnes per annum | |||
|
per day
|
volumes are converted to a daily basis using a calendar year | |||
|
scf
|
standard cubic feet | |||
|
PRODUCTS
|
||||
|
GTL
|
gas to liquids | |||
|
LNG
|
liquefied natural gas | |||
|
LPG
|
liquefied petroleum gas | |||
|
NGL
|
natural gas liquids | |||
|
MISCELLANEOUS
|
||||
|
ADS
|
American Depositary Share | |||
|
AGM
|
Annual General Meeting | |||
|
CCS
|
current cost of supplies | |||
|
CO
2
|
carbon dioxide | |||
|
DBP
|
Deferred Bonus Plan | |||
|
EMTN
|
euro medium-term note | |||
|
EPS
|
earnings per share | |||
|
GHG
|
greenhouse gas | |||
|
HSSE
|
health, safety, security and environment | |||
|
IFRIC
|
Interpretation(s) issued by the IFRS Interpretations Committee | |||
|
IFRS
|
International Financial Reporting Standard(s) | |||
|
LTIP
|
Long-term Incentive Plan | |||
|
OML
|
oil mining lease | |||
|
OPEC
|
Organization of the Petroleum Exporting Countries | |||
|
OPL
|
oil prospecting licence | |||
|
PSC
|
production-sharing contract | |||
|
PSP
|
Performance Share Plan | |||
|
R&D
|
research and development | |||
|
REMCO
|
Remuneration Committee | |||
|
RSP
|
Restricted Share Plan | |||
|
SEC
|
United States Securities and Exchange Commission | |||
|
TRCF
|
total recordable case frequency | |||
|
TSR
|
total shareholder return | |||
|
WTI
|
West Texas Intermediate | |||
Table of Contents
|
Shell Annual Report and Form 20-F 2011
|
3 | ||
|
About this Report
|
|
4
|
Shell Annual Report and Form 20-F 2011 | ||
| About this Report |
Table of Contents
|
Shell Annual Report and Form 20-F 2011
|
5 | ||
|
Chairman’s message
|
Table of Contents
|
6
|
Shell Annual Report and Form 20-F 2011 | ||
| Chief Executive Officer’s review |
Table of Contents
|
Shell Annual Report and Form 20-F 2011
|
7 | ||
|
Chief Executive Officer’s review
|
Table of Contents
|
8
|
Shell Annual Report and Form 20-F 2011 | ||
| Business Review > Performance indicators |
|
Total shareholder return
|
||||||
|
2011
|
17.1% | 2010 | 17.0% | |||
|
Net cash from operating activities ($ billion)
|
||||||
|
2011
|
37 | 2010 | 27 | |||
|
Project delivery
|
||||||
|
2011
|
79% | 2010 | 75% | |||
|
Production available for sale (thousand boe/d)
|
||||||
|
2011
|
3,215 | 2010 | 3,314 | |||
|
Sales of liquefied natural gas (million tonnes)
|
||||||
|
2011
|
18.8 | 2010 | 16.8 | |||
|
Refinery and chemical plant availability
|
||||||
|
2011
|
91.2% | 2010 | 92.4% | |||
|
Total recordable case frequency (injuries per million working
hours)
|
||||||
|
2011
|
1.2 | 2010 | 1.2 | |||
Table of Contents
|
Shell Annual Report and Form 20-F 2011
|
9 | ||
|
Business Review > Performance indicators
|
| Earnings on a current cost of supplies basis attributable to Royal Dutch Shell plc shareholders ($ million) | ||||||
|
2011
|
28,625 | 2010 | 18,643 | |||
|
Earnings per share on a current cost of supplies basis
|
||||||
|
2011
|
$4.61 | 2010 | $3.04 | |||
|
Net capital investment ($ million)
|
||||||
|
2011
|
23,503 | 2010 | 23,680 | |||
|
Return on average capital employed
|
||||||
|
2011
|
15.9% | 2010 | 11.5% | |||
|
Gearing
|
||||||
|
2011
|
13.1% | 2010 | 17.1% | |||
| Proved oil and gas reserves attributable to Royal Dutch Shell plc shareholders (million boe) | ||||||
|
2011
|
14,250 | 2010 | 14,249 | |||
|
Operational spills over 100 kilograms
|
||||||
|
2011
|
207 | 2010 | 195 | |||
|
Employees (thousand)
|
||||||
|
2011
|
90 | 2010 | 97 | |||
Table of Contents
|
10
|
Shell Annual Report and Form 20-F 2011 | ||
| Business Review > Selected financial data |
| CONSOLIDATED STATEMENT OF INCOME AND OF COMPREHENSIVE INCOME DATA | $ MILLION | |||||||||||||||||||||
| 2011 | 2010 | 2009 | 2008 | 2007 | ||||||||||||||||||
|
Revenue
|
470,171 | 368,056 | 278,188 | 458,361 | 355,782 | |||||||||||||||||
|
Income for the period
|
31,185 | 20,474 | 12,718 | 26,476 | 31,926 | |||||||||||||||||
|
Income attributable to non-controlling interest
|
267 | 347 | 200 | 199 | 595 | |||||||||||||||||
|
Income attributable to Royal Dutch Shell plc shareholders
|
30,918 | 20,127 | 12,518 | 26,277 | 31,331 | |||||||||||||||||
|
Comprehensive income attributable to Royal Dutch Shell plc
shareholders
|
29,727 | 20,131 | 19,141 | 15,228 | 36,264 | |||||||||||||||||
| CONSOLIDATED BALANCE SHEET DATA | $ MILLION | |||||||||||||||||||||
| 2011 | 2010 | 2009 | 2008 | 2007 | ||||||||||||||||||
|
Total assets
|
345,257 | 322,560 | 292,181 | 282,401 | 269,470 | |||||||||||||||||
|
Total debt
|
37,175 | 44,332 | 35,033 | 23,269 | 18,099 | |||||||||||||||||
|
Share capital
|
536 | 529 | 527 | 527 | 536 | |||||||||||||||||
|
Equity attributable to Royal Dutch Shell plc shareholders
|
169,517 | 148,013 | 136,431 | 127,285 | 123,960 | |||||||||||||||||
|
Non-controlling interest
|
1,486 | 1,767 | 1,704 | 1,581 | 2,008 | |||||||||||||||||
| EARNINGS PER SHARE | $ | |||||||||||||||||||||
| 2011 | 2010 | 2009 | 2008 | 2007 | ||||||||||||||||||
|
Basic earnings per €0.07 ordinary share
|
4.98 | 3.28 | 2.04 | 4.27 | 5.00 | |||||||||||||||||
|
Diluted earnings per €0.07 ordinary share
|
4.97 | 3.28 | 2.04 | 4.26 | 4.99 | |||||||||||||||||
| SHARES | NUMBER | |||||||||||||||||||||
| 2011 | 2010 | 2009 | 2008 | 2007 | ||||||||||||||||||
|
Basic weighted average number of Class A and B shares
|
6,212,532,421 | 6,132,640,190 | 6,124,906,119 | 6,159,102,114 | 6,263,762,972 | |||||||||||||||||
|
Diluted weighted average number of Class A and B shares
|
6,221,655,088 | 6,139,300,098 | 6,128,921,813 | 6,171,489,652 | 6,283,759,171 | |||||||||||||||||
| OTHER FINANCIAL DATA | $ MILLION | |||||||||||||||||||||
| 2011 | 2010 | 2009 | 2008 | 2007 | ||||||||||||||||||
|
Net cash from operating activities
|
36,771 | 27,350 | 21,488 | 43,918 | 34,461 | |||||||||||||||||
|
Net cash used in investing activities
|
20,443 | 21,972 | 26,234 | 28,915 | 14,570 | |||||||||||||||||
|
Dividends paid
|
7,315 | 9,979 | 10,717 | 9,841 | 9,204 | |||||||||||||||||
|
Net cash used in financing activities
|
18,131 | 1,467 | 829 | 9,394 | 19,393 | |||||||||||||||||
|
(Decrease)/increase in cash and cash equivalents
|
(2,152 | ) | 3,725 | (5,469 | ) | 5,532 | 654 | |||||||||||||||
|
Earnings/(losses) by segment [A]
|
||||||||||||||||||||||
|
Upstream
|
24,455 | 15,935 | 8,354 | 26,506 | 18,094 | |||||||||||||||||
|
Downstream
|
4,289 | 2,950 | 258 | 5,309 | 8,588 | |||||||||||||||||
|
Corporate
|
86 | 91 | 1,310 | (69 | ) | 1,387 | ||||||||||||||||
|
Total segment earnings
|
28,830 | 18,976 | 9,922 | 31,746 | 28,069 | |||||||||||||||||
|
Attributable to non-controlling interest
|
(205 | ) | (333 | ) | (118 | ) | (380 | ) | (505 | ) | ||||||||||||
|
Earnings on a current cost of supplies basis attributable to
Royal Dutch Shell plc shareholders [B] |
28,625 | 18,643 | 9,804 | 31,366 | 27,564 | |||||||||||||||||
|
Net capital investment [A]
|
||||||||||||||||||||||
|
Upstream
|
19,083 | 21,222 | 22,326 | 28,257 | 13,555 | |||||||||||||||||
|
Downstream
|
4,342 | 2,358 | 6,232 | 3,104 | 2,682 | |||||||||||||||||
|
Corporate
|
78 | 100 | 324 | 60 | 202 | |||||||||||||||||
|
Total
|
23,503 | 23,680 | 28,882 | 31,421 | 16,439 | |||||||||||||||||
| [A] | See Notes 2 and 4 to the “Consolidated Financial Statements”. | |
| [B] | See table on page 16. |
Table of Contents
|
Shell Annual Report and Form 20-F 2011
|
11 | ||
|
Business Review > Business overview
|
Table of Contents
|
12
|
Shell Annual Report and Form 20-F 2011 | ||
| Business Review > Business overview |
|
REVENUE
BY BUSINESS SEGMENT
|
||||||||||||||
| (INCLUDING INTER-SEGMENT SALES) | $ MILLION | |||||||||||||
| 2011 | 2010 | 2009 | ||||||||||||
|
Upstream
|
||||||||||||||
|
Third parties
|
42,260 | 32,395 | 27,996 | |||||||||||
|
Inter-segment
|
49,431 | 35,803 | 27,144 | |||||||||||
|
Total
|
91,691 | 68,198 | 55,140 | |||||||||||
|
Downstream
|
||||||||||||||
|
Third parties
|
427,864 | 335,604 | 250,104 | |||||||||||
|
Inter-segment
|
782 | 612 | 258 | |||||||||||
|
Total
|
428,646 | 336,216 | 250,362 | |||||||||||
|
Corporate
|
||||||||||||||
|
Third parties
|
47 | 57 | 88 | |||||||||||
|
Total
|
47 | 57 | 88 | |||||||||||
|
REVENUE
BY GEOGRAPHICAL AREA
|
||||||||||||||||||||
| (EXCLUDING INTER-SEGMENT SALES) | $ MILLION | |||||||||||||||||||
| 2011 | % | 2010 | % | 2009 | % | |||||||||||||||
| Europe | 187,498 | 39.9 | 137,359 | 37.3 | 103,424 | 37.2 | ||||||||||||||
|
Asia, Oceania, Africa
|
148,260 | 31.5 | 110,955 | 30.2 | 80,398 | 28.9 | ||||||||||||||
| USA | 91,946 | 19.6 | 77,660 | 21.1 | 60,721 | 21.8 | ||||||||||||||
| Other Americas | 42,467 | 9.0 | 42,082 | 11.4 | 33,645 | 12.1 | ||||||||||||||
| Total | 470,171 | 100.0 | 368,056 | 100.0 | 278,188 | 100.0 | ||||||||||||||
Table of Contents
|
Shell Annual Report and Form 20-F 2011
|
13 | ||
|
Business Review > Risk factors
|
| OIL AND GAS PRODUCTION AVAILABLE FOR SALE | MILLION BOE [A] | ||||||||||
| 2011 | 2010 | 2009 | |||||||||
|
Shell subsidiaries
|
811 | 855 | 828 | ||||||||
|
Shell share of equity-accounted investments
|
362 | 355 | 319 | ||||||||
|
Total
|
1,173 | 1,210 | 1,147 | ||||||||
| [A] | Natural gas volumes are converted to oil equivalent using a factor of 5,800 scf per barrel. |
|
PROVED
DEVELOPED AND UNDEVELOPED
|
|||||||||||
| RESERVES [A][B] (AT DECEMBER 31) | MILLION BOE [C] | ||||||||||
| 2011 | 2010 | 2009 | |||||||||
|
Shell subsidiaries
|
10,320 | 10,176 | 9,859 | ||||||||
|
Shell share of equity-accounted investments
|
3,946 | 4,097 | 4,286 | ||||||||
|
Total
|
14,266 | 14,273 | 14,145 | ||||||||
|
Non-controlling interest [D]
|
16 | 24 | 13 | ||||||||
|
Total less non-controlling interest
|
14,250 | 14,249 | 14,132 | ||||||||
| [A] | We manage our total proved reserves base without distinguishing between proved reserves from subsidiaries and those from equity-accounted investments. | |
| [B] | Includes proved reserves associated with future production that will be consumed in operations. | |
| [C] | Natural gas volumes are converted to oil equivalent using a factor of 5,800 scf per barrel. | |
| [D] | Represents proved reserves attributable to non-controlling interest in Shell subsidiaries. |
Table of Contents
|
14
|
Shell Annual Report and Form 20-F 2011 | ||
| Business Review > Risk factors |
Table of Contents
|
Shell Annual Report and Form 20-F 2011
|
15 | ||
|
Business Review > Risk factors
|
Table of Contents
|
16
|
Shell Annual Report and Form 20-F 2011 | ||
| Business Review > Summary of results and strategy |
| INCOME FOR THE PERIOD | $ MILLION | |||||||||||||
| 2011 | 2010 | 2009 | ||||||||||||
|
Earnings by segment [A]
|
||||||||||||||
|
Upstream
|
24,455 | 15,935 | 8,354 | |||||||||||
|
Downstream
|
4,289 | 2,950 | 258 | |||||||||||
|
Corporate
|
86 | 91 | 1,310 | |||||||||||
|
Total segment earnings
|
28,830 | 18,976 | 9,922 | |||||||||||
|
Attributable to non-controlling interest
|
(205 | ) | (333 | ) | (118 | ) | ||||||||
|
Earnings on a current cost of supplies basis attributable to
Royal Dutch Shell plc shareholders
|
28,625 | 18,643 | 9,804 | |||||||||||
|
Current cost of supplies adjustment [A]
|
2,355 | 1,498 | 2,796 | |||||||||||
|
Non-controlling interest
|
(62 | ) | (14 | ) | (82 | ) | ||||||||
|
Income attributable to Royal Dutch Shell plc shareholders
|
30,918 | 20,127 | 12,518 | |||||||||||
|
Non-controlling interest
|
267 | 347 | 200 | |||||||||||
|
Income for the period
|
31,185 | 20,474 | 12,718 | |||||||||||
| [A] | Segment earnings are presented on a current cost of supplies basis. See Note 2 to the “Consolidated Financial Statements” for further information. |
Table of Contents
|
Shell Annual Report and Form 20-F 2011
|
17 | ||
|
Business Review > Summary of results and strategy
|
| n | building our resource base through worldwide exploration, focused acquisitions and exits from non-core portfolio positions; |
| n | accelerating the extraction of value from our resources, with profitable production growth, top-quartile project delivery and operational excellence; and |
| n | differentiating ourselves from the competition through integrated gas leadership, technology and partnerships. |
| n | operational excellence and cost efficiency, to maximise the uptime and operating performance of our asset base, and to reduce costs and complexity; |
| n | refocusing our refining portfolio on the most efficient facilities – those that best integrate with crude supplies, marketing outlets and local petrochemical plants; and |
| n | selective growth in countries such as Brazil, China and India, which have high growth potential, while maintaining or increasing our margins in our core countries. This includes researching, developing and marketing biofuels. |
Table of Contents
|
18
|
Shell Annual Report and Form 20-F 2011 | ||
| Business Review > Summary of results and strategy |
Table of Contents
|
Shell Annual Report and Form 20-F 2011
|
19 | ||
|
Business Review > Summary of results and strategy
|
Table of Contents
|
20
|
Shell Annual Report and Form 20-F 2011 | ||
| Business Review > Upstream |
| KEY STATISTICS | $ MILLION | ||||||||||
| 2011 | 2010 | 2009 | |||||||||
|
Segment earnings
|
24,455 | 15,935 | 8,354 | ||||||||
|
Including:
|
|||||||||||
|
Revenue (including inter-segment sales)
|
91,691 | 68,198 | 55,140 | ||||||||
|
Share of profit of equity-accounted investments
|
7,127 | 4,900 | 3,852 | ||||||||
|
Production and manufacturing expenses
|
15,606 | 13,697 | 13,958 | ||||||||
|
Selling, distribution and administrative expenses
|
1,276 | 1,512 | 2,206 | ||||||||
|
Exploration
|
2,266 | 2,036 | 2,178 | ||||||||
|
Depreciation, depletion and amortisation
|
8,827 | 11,144 | 9,875 | ||||||||
|
Net capital investment [A]
|
19,083 | 21,222 | 22,326 | ||||||||
|
Oil and gas production available for sale (thousand boe/d)
|
3,215 | 3,314 | 3,142 | ||||||||
|
LNG sales volume (million tonnes)
|
18.83 | 16.76 | 13.40 | ||||||||
|
Proved oil and gas reserves at December 31 (million
boe) [B]
|
14,250 | 14,249 | 14,132 | ||||||||
| [A] | See Notes 2 and 4 to the “Consolidated Financial Statements”. | |
| [B] | Excludes reserves attributable to non-controlling interest in Shell subsidiaries. |
| REALISED PRICE [A] | $/BOE | ||||||||
|
|||||||||
| [A] | Includes subsidiaries and European equity-accounted investments. Excludes deemed transfer prices. |
Table of Contents
|
Shell Annual Report and Form 20-F 2011
|
21 | ||
|
Business Review > Upstream
|
Table of Contents
|
22
|
Shell Annual Report and Form 20-F 2011 | ||
| Business Review > Upstream |
Table of Contents
|
Shell Annual Report and Form 20-F 2011
|
23 | ||
|
Business Review > Upstream
|
| n | licences (or concessions), which entitle the holder to explore for hydrocarbons and exploit any commercial discoveries. Under a licence, the holder bears the risk of exploration, development and production activities, and is responsible for financing these activities. In principle, the licence holder is entitled to the totality of production minus any royalties in kind. The government, government entity or government-run oil and gas company may sometimes enter as a joint-venture participant sharing the rights and obligations of the licence but usually without sharing the exploration risk. In a few cases, the government entity, government-run oil and gas company or agency has an option to purchase a certain share of production; |
| n | lease agreements, which are typically used in North America and are usually governed by similar terms as licences. Participants may include governments or private entities, and royalties are either paid in cash or in kind; and |
| n | production-sharing contracts (PSCs) entered into with a government, government entity or government-run oil and gas company. PSCs generally oblige the independent oil and gas company, as contractor, to provide all the financing and bear the risk of exploration, development and production activities in exchange for a share of the production. Usually, this share consists of a fixed or variable part that is reserved for the recovery of the contractor’s cost (cost oil). The remaining production is split with the government, government entity or government-run oil and gas company on a fixed or volume/revenue-dependent basis. In some cases, the government, government entity or government-run oil and gas company will participate in the rights and obligations of the contractor and will share in the costs of development and production. Such participation can be across the venture, or on a field-by-field basis. Additionally, as the price of oil or gas increases above certain predetermined levels, the independent oil and gas company’s entitlement share of production normally decreases. Accordingly, its interest in a project may not be the same as its entitlement. |
Table of Contents
|
24
|
Shell Annual Report and Form 20-F 2011 | ||
| Business Review > Upstream |
Table of Contents
|
Shell Annual Report and Form 20-F 2011
|
25 | ||
|
Business Review > Upstream
|
Table of Contents
|
26
|
Shell Annual Report and Form 20-F 2011 | ||
| Business Review > Upstream |
Table of Contents
|
Shell Annual Report and Form 20-F 2011
|
27 | ||
|
Business Review > Upstream
|
Table of Contents
|
28
|
Shell Annual Report and Form 20-F 2011 | ||
| Business Review > Upstream |
|
SUMMARY
OF PROVED OIL AND GAS RESERVES OF SHELL SUBSIDIARIES AND SHELL
SHARE OF
|
|||||||||||||||||
| EQUITY-ACCOUNTED INVESTMENTS [A] (AT DECEMBER 31, 2011) | BASED ON AVERAGE PRICES FOR 2011 | ||||||||||||||||
|
Oil and natural
gas liquids (million barrels) |
Natural gas
(thousand million scf) |
Synthetic crude oil
(million barrels) |
Bitumen
(million barrels) |
Total
all products (million boe) [B] |
|||||||||||||
|
Proved developed
|
|||||||||||||||||
|
Europe
|
490 | 12,522 | – | – | 2,649 | ||||||||||||
|
Asia
|
1,264 | 14,315 | – | – | 3,732 | ||||||||||||
|
Oceania
|
56 | 1,080 | – | – | 242 | ||||||||||||
|
Africa
|
438 | 1,112 | – | – | 630 | ||||||||||||
|
North America
|
|||||||||||||||||
|
USA
|
442 | 1,552 | – | – | 710 | ||||||||||||
|
Canada
|
22 | 951 | 1,249 | 22 | 1,457 | ||||||||||||
|
South America
|
53 | 97 | – | – | 70 | ||||||||||||
|
Proved undeveloped
|
|||||||||||||||||
|
Europe
|
264 | 2,879 | – | – | 760 | ||||||||||||
|
Asia
|
400 | 2,638 | – | – | 855 | ||||||||||||
|
Oceania
|
153 | 6,014 | – | – | 1,190 | ||||||||||||
|
Africa
|
293 | 1,688 | – | – | 584 | ||||||||||||
|
North America
|
|||||||||||||||||
|
USA
|
396 | 1,707 | – | – | 690 | ||||||||||||
|
Canada
|
13 | 1,094 | 431 | 33 | 666 | ||||||||||||
|
South America
|
29 | 13 | – | – | 31 | ||||||||||||
|
Total proved developed and undeveloped
|
|||||||||||||||||
|
Europe
|
754 | 15,401 | – | – | 3,409 | ||||||||||||
|
Asia
|
1,664 | 16,953 | – | – | 4,587 | ||||||||||||
|
Oceania
|
209 | 7,094 | – | – | 1,432 | ||||||||||||
|
Africa
|
731 | 2,800 | – | – | 1,214 | ||||||||||||
|
North America
|
|||||||||||||||||
|
USA
|
838 | 3,259 | – | – | 1,400 | ||||||||||||
|
Canada
|
35 | 2,045 | 1,680 | 55 | 2,123 | ||||||||||||
|
South America
|
82 | 110 | – | – | 101 | ||||||||||||
|
Total
|
4,313 | 47,662 | 1,680 | 55 | 14,266 | ||||||||||||
| [A] | Includes 16 million boe of reserves attributable to non-controlling interest in Shell subsidiaries. | |
| [B] | Natural gas volumes are converted to oil equivalent using a factor of 5,800 scf per barrel. |
Table of Contents
|
Shell Annual Report and Form 20-F 2011
|
29 | ||
|
Business Review > Upstream
|
|
LOCATION
OF OIL AND GAS PRODUCING ACTIVITIES [A]
|
|||||||||||
| (AT DECEMBER 31, 2011) | |||||||||||
| Exploration |
Development
and/or production |
Shell operator [B] | |||||||||
|
Europe
|
|||||||||||
|
Denmark
|
n | n | |||||||||
|
Germany
|
n | n | |||||||||
|
Ireland
|
n | n | n | ||||||||
|
Italy
|
n | n | |||||||||
|
The Netherlands
|
n | n | n | ||||||||
|
Norway
|
n | n | n | ||||||||
|
UK
|
n | n | n | ||||||||
|
Ukraine
|
n | n | |||||||||
|
Asia [C]
|
|||||||||||
|
Brunei
|
n | n | n | ||||||||
|
China
|
n | n | n | ||||||||
|
Indonesia
|
n | ||||||||||
|
Iraq
|
n | n | n | ||||||||
|
Jordan
|
n | n | |||||||||
|
Kazakhstan
|
n | n | |||||||||
|
Malaysia
|
n | n | n | ||||||||
|
Oman
|
n | n | |||||||||
|
Philippines
|
n | n | n | ||||||||
|
Qatar
|
n | n | n | ||||||||
|
Russia
|
n | n | n | ||||||||
|
Saudi Arabia
|
n | ||||||||||
|
Turkey
|
n | n | |||||||||
|
United Arab Emirates
|
n | n | |||||||||
|
Oceania
|
|||||||||||
|
Australia
|
n | n | n | ||||||||
|
New Zealand
|
n | n | n | ||||||||
|
Africa
|
|||||||||||
|
Egypt
|
n | n | n | ||||||||
|
Gabon
|
n | n | n | ||||||||
|
Libya
|
n | n | |||||||||
|
Nigeria
|
n | n | n | ||||||||
|
Tanzania
|
n | ||||||||||
|
Tunisia
|
n | n | |||||||||
|
North America
|
|||||||||||
|
USA
|
n | n | n | ||||||||
|
Canada
|
n | n | n | ||||||||
|
Greenland
|
n | n | |||||||||
|
South America
|
|||||||||||
|
Argentina
|
n | n | |||||||||
|
Brazil
|
n | n | n | ||||||||
|
Colombia
|
n | n | |||||||||
|
French Guiana
|
n | n | |||||||||
|
Guyana
|
n | ||||||||||
|
Venezuela
|
n | ||||||||||
| [A] | Includes equity-accounted investments. Where an equity-accounted investment has properties outside its base country, those properties are not shown in this table. | |
| [B] | In several countries where “Shell operator” is indicated, Shell is the operator of some but not all exploration and/or production ventures. | |
| [C] | In compliance with international sanctions, Shell has suspended activities in Syria. |
|
CAPITAL
EXPENDITURE ON OIL AND GAS ACTIVITIES AND
|
|||||||||||
|
EXPLORATION
EXPENSE OF SHELL SUBSIDIARIES BY
|
|||||||||||
| GEOGRAPHICAL AREA [A] | $ MILLION | ||||||||||
| 2011 | 2010 | 2009 | |||||||||
|
Europe
|
1,907 | 2,033 | 2,618 | ||||||||
|
Asia
|
4,319 | 3,137 | 4,539 | ||||||||
|
Oceania
|
3,349 | 1,804 | 969 | ||||||||
|
Africa
|
1,701 | 1,629 | 2,351 | ||||||||
|
North America – USA
|
6,445 | 9,400 | 4,114 | ||||||||
|
North America – Other [B]
|
2,913 | 3,455 | 4,305 | ||||||||
|
South America
|
487 | 373 | 537 | ||||||||
|
Total
|
21,121 | 21,831 | 19,433 | ||||||||
| [A] | Capital expenditure is the cost of acquiring property, plant and equipment for exploration and production activities, and – following the successful efforts method in accounting for exploration costs – includes exploration drilling costs capitalised pending determination of commercial reserves. See also Note 2 to the “Consolidated Financial Statements” for further information. Exploration expense is the cost of geological and geophysical surveys and of other exploratory work charged to income as incurred. Exploration expense excludes depreciation and release of cumulative currency translation differences. | |
| [B] | Comprises Canada and Greenland. |
| OIL AND GAS AVERAGE INDUSTRY PRICES [A] | |||||||||||
| 2011 | 2010 | 2009 | |||||||||
|
Brent ($/b) [B]
|
111.26 | 79.50 | 61.55 | ||||||||
|
WTI ($/b) [B]
|
95.04 | 79.45 | 61.75 | ||||||||
|
Henry Hub ($/MMBtu)
|
4.01 | 4.40 | 3.90 | ||||||||
|
UK National Balancing Point (pence/therm)
|
56.35 | 42.12 | 30.93 | ||||||||
| [A] | Yearly average Brent, WTI and UK National Balancing Point prices are based upon daily spot prices; yearly average Henry Hub prices are based upon monthly spot prices. | |
| [B] | Average industry prices differ from realised prices because the quality, and therefore the price, of actual crude oil produced differs from the blends used for market pricing purposes or quoted blends. |
Table of Contents
|
30
|
Shell Annual Report and Form 20-F 2011 | ||
| Business Review > Upstream |
| OIL AND NATURAL GAS LIQUIDS | $/BARREL | |||||||||||||||||||||||||
| 2011 | 2010 | 2009 | ||||||||||||||||||||||||
|
Shell
subsidiaries |
Shell share of
equity-accounted investments |
Shell
subsidiaries |
Shell share of
equity-accounted investments |
Shell
subsidiaries |
Shell share of
equity-accounted investments |
|||||||||||||||||||||
| Europe | 106.77 | 103.97 | 73.35 | 83.24 | 55.53 | 56.97 | ||||||||||||||||||||
| Asia | 103.73 | 62.81 | 76.21 | 44.27 | 57.50 | 36.53 | ||||||||||||||||||||
| Oceania | 92.38 | 99.74 | [A] | 67.90 | 78.05 | [A] | 50.47 | 56.16 | [A] | |||||||||||||||||
| Africa | 111.70 | – | 79.63 | – | 61.45 | – | ||||||||||||||||||||
| North America – USA | 104.93 | 109.49 | 76.36 | 74.27 | 57.25 | 56.24 | ||||||||||||||||||||
| North America – Canada | 70.72 | – | 53.23 | – | 39.26 | – | ||||||||||||||||||||
| South America | 100.44 | 97.76 | 69.99 | 63.57 | 57.76 | 58.00 | ||||||||||||||||||||
| Total | 105.74 | 73.01 | 75.74 | 52.42 | 57.39 | 42.49 | ||||||||||||||||||||
| [A] | Includes Shell’s ownership of 24% of Woodside Petroleum Ltd as from November 2010 (previously: 34%), a publicly listed company on the Australian Securities Exchange. We have limited access to data; accordingly, the number is an estimate. |
| NATURAL GAS | $/THOUSAND SCF | |||||||||||||||||||||||||
| 2011 | 2010 | 2009 | ||||||||||||||||||||||||
|
Shell
subsidiaries |
Shell share of
equity-accounted investments |
Shell
subsidiaries |
Shell share of
equity-accounted investments |
Shell subsidiaries |
Shell share of
equity-accounted investments |
|||||||||||||||||||||
| Europe | 9.40 | 8.58 | 6.87 | 6.71 | 7.06 | 8.17 | ||||||||||||||||||||
| Asia | 4.83 | 8.37 | 4.40 | 6.55 | 3.61 | 4.26 | ||||||||||||||||||||
| Oceania | 9.95 | 10.09 | [A] | 8.59 | 8.79 | [A] | 5.29 | 3.94 | [A] | |||||||||||||||||
| Africa | 2.32 | – | 1.96 | – | 1.71 | – | ||||||||||||||||||||
| North America – USA | 4.54 | 8.91 | 4.90 | 7.27 | 4.36 | 5.02 | ||||||||||||||||||||
| North America – Canada | 3.64 | – | 4.09 | – | 3.73 | – | ||||||||||||||||||||
| South America | 2.81 | 0.99 | 3.79 | – | 3.18 | – | ||||||||||||||||||||
| Total | 5.92 | 8.58 | 5.28 | 6.81 | 4.83 | 6.73 | ||||||||||||||||||||
| [A] | Includes Shell’s ownership of 24% of Woodside Petroleum Ltd as from November 2010 (previously: 34%), a publicly listed company on the Australian Securities Exchange. We have limited access to data; accordingly, the number is an estimate. |
| SYNTHETIC CRUDE OIL | $/BARREL | |||||||||||||||||
| 2011 | 2010 | 2009 | ||||||||||||||||
|
Shell
subsidiaries |
Shell
subsidiaries |
Shell
subsidiaries |
||||||||||||||||
| North America – Canada | 91.32 | 71.56 | 56.23 | |||||||||||||||
| BITUMEN | $/BARREL | |||||||||||||||||
| 2011 | 2010 | 2009 | ||||||||||||||||
|
Shell
subsidiaries |
Shell
subsidiaries |
Shell
subsidiaries |
||||||||||||||||
| North America – Canada | 76.28 | 66.00 | 50.00 | |||||||||||||||
Table of Contents
|
Shell Annual Report and Form 20-F 2011
|
31 | ||
|
Business Review > Upstream
|
| OIL, NATURAL GAS LIQUIDS AND NATURAL GAS [A] | $/BOE | |||||||||||||||||||||||||
| 2011 | 2010 | 2009 | ||||||||||||||||||||||||
|
Shell
subsidiaries |
Shell share of
equity-accounted investments |
Shell
subsidiaries |
Shell share of
equity-accounted investments |
Shell
subsidiaries |
Shell share of
equity-accounted investments |
|||||||||||||||||||||
| Europe | 12.17 | 3.12 | 10.09 | 2.78 | 11.91 | 3.18 | ||||||||||||||||||||
| Asia | 6.92 | 4.60 | 6.07 | 4.68 | 5.86 | 5.44 | ||||||||||||||||||||
| Oceania | 8.50 | 14.46 | [B] | 5.85 | 8.37 | [B] | 3.63 | 5.59 | [B] | |||||||||||||||||
| Africa | 8.45 | – | 7.09 | – | 9.71 | – | ||||||||||||||||||||
| North America – USA | 17.91 | 17.63 | 12.90 | 16.47 | 12.11 | 15.74 | ||||||||||||||||||||
| North America – Canada | 18.12 | – | 17.48 | – | 16.63 | – | ||||||||||||||||||||
| South America | 12.50 | 12.25 | 8.88 | 25.05 | 12.94 | 12.75 | ||||||||||||||||||||
| Total | 11.00 | 5.60 | 9.10 | 5.29 | 9.88 | 5.72 | ||||||||||||||||||||
| [A] | Natural gas volumes are converted to oil equivalent using a factor of 5,800 scf per barrel. | |
| [B] | Includes Shell’s ownership of 24% of Woodside Petroleum Ltd as from November 2010 (previously: 34%), a publicly listed company on the Australian Securities Exchange. We have limited access to data; accordingly, the number is an estimate. |
| SYNTHETIC CRUDE OIL | $/BARREL | |||||||||||||||||||||||
| 2011 | 2010 | 2009 | ||||||||||||||||||||||
|
Shell
subsidiaries |
Shell
subsidiaries |
Shell
subsidiaries |
||||||||||||||||||||||
| North America – Canada | 46.19 | 49.83 | 39.83 | |||||||||||||||||||||
| BITUMEN | $/BARREL | |||||||||||||||||||||||
| 2011 | 2010 | 2009 | ||||||||||||||||||||||
|
Shell
subsidiaries |
Shell
subsidiaries |
Shell
subsidiaries |
||||||||||||||||||||||
| North America – Canada | 31.81 | 23.82 | 18.32 | |||||||||||||||||||||
Table of Contents
|
32
|
Shell Annual Report and Form 20-F 2011 | ||
| Business Review > Upstream |
| CRUDE OIL AND NATURAL GAS LIQUIDS PRODUCTION [A][B] | THOUSAND B/D | |||||||||||||||||||||||||
| 2011 | 2010 | 2009 | ||||||||||||||||||||||||
|
Shell
subsidiaries |
Shell share of
equity-accounted investments |
Shell
subsidiaries |
Shell share of
equity-accounted investments |
Shell
subsidiaries |
Shell share of
equity-accounted investments |
|||||||||||||||||||||
|
Europe
|
||||||||||||||||||||||||||
|
Denmark
|
88 | – | 98 | – | 107 | – | ||||||||||||||||||||
|
Italy
|
35 | – | 33 | – | 30 | – | ||||||||||||||||||||
|
Norway
|
37 | – | 48 | – | 62 | – | ||||||||||||||||||||
|
UK
|
71 | – | 98 | – | 110 | – | ||||||||||||||||||||
|
Other
|
3 | 5 | 3 | 5 | 3 | 5 | ||||||||||||||||||||
|
Total Europe
|
234 | 5 | 280 | 5 | 312 | 5 | ||||||||||||||||||||
|
Asia
|
||||||||||||||||||||||||||
|
Brunei
|
2 | 76 | 3 | 77 | 2 | 76 | ||||||||||||||||||||
|
Malaysia
|
40 | – | 40 | – | 39 | – | ||||||||||||||||||||
|
Oman
|
200 | – | 199 | – | 195 | – | ||||||||||||||||||||
|
Russia
|
– | 117 | – | 117 | – | 106 | ||||||||||||||||||||
|
United Arab Emirates
|
– | 144 | – | 135 | – | 127 | ||||||||||||||||||||
|
Other
|
40 | 20 | 29 | 1 | 42 | 1 | ||||||||||||||||||||
|
Total Asia
|
282 | 357 | 271 | 330 | 278 | 310 | ||||||||||||||||||||
|
Oceania
|
||||||||||||||||||||||||||
|
Australia
|
20 | 18 | 18 | 29 | 18 | 35 | ||||||||||||||||||||
|
Other
|
10 | – | 12 | – | 12 | – | ||||||||||||||||||||
|
Total Oceania
|
30 | 18 | 30 | 29 | 30 | 35 | ||||||||||||||||||||
|
Africa
|
||||||||||||||||||||||||||
|
Gabon
|
44 | – | 34 | – | 29 | – | ||||||||||||||||||||
|
Nigeria
|
262 | – | 302 | – | 231 | – | ||||||||||||||||||||
|
Other
|
20 | – | 20 | – | 24 | – | ||||||||||||||||||||
|
Total Africa
|
326 | – | 356 | – | 284 | – | ||||||||||||||||||||
|
North America
|
||||||||||||||||||||||||||
|
USA
|
141 | 70 | 163 | 74 | 195 | 78 | ||||||||||||||||||||
|
Other
|
18 | – | 20 | – | 20 | – | ||||||||||||||||||||
|
Total North America
|
159 | 70 | 183 | 74 | 215 | 78 | ||||||||||||||||||||
|
South America
|
||||||||||||||||||||||||||
|
Brazil
|
45 | – | 53 | – | 24 | – | ||||||||||||||||||||
|
Other
|
1 | 9 | 1 | 7 | 1 | 9 | ||||||||||||||||||||
|
Total South America
|
46 | 9 | 54 | 7 | 25 | 9 | ||||||||||||||||||||
|
Total
|
1,077 | 459 | 1,174 | 445 | 1,144 | 437 | ||||||||||||||||||||
| [A] | Includes natural gas liquids. Royalty purchases are excluded. Reflects 100% of production attributable to subsidiaries except in respect of PSCs, where the figures shown represent the entitlement of the subsidiaries concerned under those contracts. | |
| [B] | Other comprises countries where 2011 production was lower than 20 thousand boe/day or where specific disclosures are prohibited. |
Table of Contents
|
Shell Annual Report and Form 20-F 2011
|
33 | ||
|
Business Review > Upstream
|
| NATURAL GAS PRODUCTION [A][B] | MILLION SCF/DAY | |||||||||||||||||||||||||
| 2011 | 2010 | 2009 | ||||||||||||||||||||||||
|
Shell
subsidiaries |
Shell share of
equity-accounted investments |
Shell
subsidiaries |
Shell share of
equity-accounted investments |
Shell
subsidiaries |
Shell share of
equity-accounted investments |
|||||||||||||||||||||
| Europe | ||||||||||||||||||||||||||
|
Denmark
|
256 | – | 328 | – | 335 | – | ||||||||||||||||||||
|
Germany
|
253 | – | 267 | – | 311 | – | ||||||||||||||||||||
|
The Netherlands
|
– | 1,767 | – | 1,997 | – | 1,639 | ||||||||||||||||||||
|
Norway
|
618 | – | 643 | – | 593 | – | ||||||||||||||||||||
|
UK
|
403 | – | 541 | – | 561 | – | ||||||||||||||||||||
|
Other
|
41 | – | 38 | – | 31 | – | ||||||||||||||||||||
| Total Europe | 1,571 | 1,767 | 1,817 | 1,997 | 1,831 | 1,639 | ||||||||||||||||||||
| Asia | ||||||||||||||||||||||||||
|
Brunei
|
52 | 524 | 55 | 497 | 44 | 473 | ||||||||||||||||||||
|
China
|
174 | – | 253 | – | 257 | – | ||||||||||||||||||||
|
Malaysia
|
763 | – | 807 | – | 886 | – | ||||||||||||||||||||
|
Russia
|
– | 382 | – | 359 | – | 192 | ||||||||||||||||||||
|
Other
|
363 | 246 | 209 | – | 217 | – | ||||||||||||||||||||
| Total Asia | 1,352 | 1,152 | 1,324 | 856 | 1,404 | 665 | ||||||||||||||||||||
| Oceania | ||||||||||||||||||||||||||
|
Australia
|
373 | 167 | 404 | 204 | 383 | 216 | ||||||||||||||||||||
|
New Zealand
|
175 | – | 202 | – | 218 | – | ||||||||||||||||||||
| Total Oceania | 548 | 167 | 606 | 204 | 601 | 216 | ||||||||||||||||||||
| Africa | ||||||||||||||||||||||||||
|
Nigeria
|
707 | – | 587 | – | 292 | – | ||||||||||||||||||||
|
Other
|
133 | – | 137 | – | 163 | – | ||||||||||||||||||||
| Total Africa | 840 | – | 724 | – | 455 | – | ||||||||||||||||||||
| North America | ||||||||||||||||||||||||||
|
USA
|
961 | 6 | 1,149 | 4 | 1,055 | 6 | ||||||||||||||||||||
|
Canada
|
570 | – | 563 | – | 530 | – | ||||||||||||||||||||
| Total North America | 1,531 | 6 | 1,712 | 4 | 1,585 | 6 | ||||||||||||||||||||
| Total South America | 51 | 1 | 61 | – | 81 | – | ||||||||||||||||||||
| Total | 5,893 | 3,093 | 6,244 | 3,061 | 5,957 | 2,526 | ||||||||||||||||||||
| [A] | Reflects 100% of production attributable to subsidiaries except in respect of PSCs, where the figures shown represent the entitlement of the companies concerned under those contracts. | |
| [B] | Other comprises countries where 2011 production was lower than 150 million scf/day or where specific disclosures are prohibited. |
| SYNTHETIC CRUDE OIL PRODUCTION | THOUSAND B/D | |||||||||||||||||||||||||
| 2011 | 2010 | 2009 | ||||||||||||||||||||||||
|
Shell
subsidiaries |
Shell
subsidiaries |
Shell
subsidiaries |
||||||||||||||||||||||||
| North America – Canada | 115 | 72 | 80 | |||||||||||||||||||||||
| BITUMEN PRODUCTION | THOUSAND B/D | |||||||||||||||||||||||||
| 2011 | 2010 | 2009 | ||||||||||||||||||||||||
|
Shell
subsidiaries |
Shell
subsidiaries |
Shell
subsidiaries |
||||||||||||||||||||||||
| North America – Canada | 15 | 18 | 19 | |||||||||||||||||||||||
Table of Contents
|
34
|
Shell Annual Report and Form 20-F 2011 | ||
| Business Review > Upstream |
| OIL AND GAS ACREAGE [A][B] (AT DECEMBER 31) | THOUSAND ACRES | |||||||||||||||||||||||||||||||||||||
| 2011 | 2010 | 2009 | ||||||||||||||||||||||||||||||||||||
| Developed | Undeveloped | Developed | Undeveloped | Developed | Undeveloped | |||||||||||||||||||||||||||||||||
| Gross | Net | Gross | Net | Gross | Net | Gross | Net | Gross | Net | Gross | Net | |||||||||||||||||||||||||||
| Europe | 9,016 | 2,586 | 6,688 | 2,376 | 8,983 | 2,550 | 8,165 | 3,265 | 9,045 | 2,592 | 9,770 | 3,653 | ||||||||||||||||||||||||||
| Asia [C] | 27,268 | 9,810 | 48,554 | 25,779 | 27,496 | 9,970 | 41,781 | 22,800 | 30,969 | 11,108 | 78,382 | 40,547 | ||||||||||||||||||||||||||
| Oceania | 1,798 | 500 | 67,907 | 26,326 | 2,274 | 553 | 81,748 | 24,413 | 2,276 | 568 | 82,945 | 24,326 | ||||||||||||||||||||||||||
| Africa | 6,060 | 2,465 | 20,706 | 15,364 | 6,701 | 2,424 | 23,327 | 17,079 | 7,393 | 2,615 | 27,096 | 18,656 | ||||||||||||||||||||||||||
| North America – USA | 1,592 | 984 | 7,815 | 6,140 | 1,568 | 952 | 7,003 | 5,834 | 1,030 | 597 | 6,250 | 5,027 | ||||||||||||||||||||||||||
| North America – Other [D] | 1,101 | 757 | 31,573 | 23,849 | 1,002 | 664 | 31,501 | 21,489 | 966 | 628 | 26,712 | 19,448 | ||||||||||||||||||||||||||
| South America | 162 | 76 | 20,655 | 8,905 | 162 | 76 | 15,878 | 6,588 | 126 | 59 | 18,081 | 7,178 | ||||||||||||||||||||||||||
| Total | 46,997 | 17,178 | 203,898 | 108,739 | 48,186 | 17,189 | 209,403 | 101,468 | 51,805 | 18,167 | 249,236 | 118,835 | ||||||||||||||||||||||||||
| [A] | Includes equity-accounted investments. | |
| [B] | The term “gross” refers to the total activity in which Shell subsidiaries and equity-accounted investments have an interest. The term “net” refers to the sum of the fractional interests owned by Shell subsidiaries plus the Shell share of equity-accounted investments’ fractional interests. | |
| [C] | In compliance with international sanctions, Shell has suspended activities in Syria. Gross and net developed acreage decreased by 477 and 309 thousand acres respectively, with a corresponding increase in undeveloped acreage. | |
| [D] | Comprises Canada and Greenland. Greenland acreage at December 31, 2010, has been reclassified from Europe to North America – Other. |
| NUMBER OF PRODUCTIVE WELLS [A][B] (AT DECEMBER 31) | ||||||||||||||||||||||||||||||||||||||
| 2011 | 2010 | 2009 | ||||||||||||||||||||||||||||||||||||
| Oil | Gas | Oil | Gas | Oil | Gas | |||||||||||||||||||||||||||||||||
| Gross | Net | Gross | Net | Gross | Net | Gross | Net | Gross | Net | Gross | Net | |||||||||||||||||||||||||||
| Europe | 1,454 | 427 | 1,317 | 430 | 1,464 | 412 | 1,341 | 443 | 1,544 | 423 | 1,343 | 446 | ||||||||||||||||||||||||||
| Asia [C] | 7,361 | 2,352 | 289 | 162 | 7,236 | 2,382 | 298 | 164 | 6,751 | 2,250 | 207 | 99 | ||||||||||||||||||||||||||
| Oceania | 48 | 5 | 557 | 212 | 39 | 4 | 608 | 211 | 39 | 6 | 566 | 122 | ||||||||||||||||||||||||||
| Africa | 883 | 357 | 98 | 65 | 1,180 | 447 | 89 | 59 | 1,150 | 415 | 80 | 53 | ||||||||||||||||||||||||||
| North America – USA | 14,993 | 7,607 | 3,449 | 2,222 | 15,322 | 7,771 | 3,884 | 2,457 | 15,425 | 7,835 | 1,640 | 1,170 | ||||||||||||||||||||||||||
| North America – Canada | 476 | 406 | 1,115 | 906 | 433 | 370 | 1,007 | 764 | 446 | 382 | 947 | 713 | ||||||||||||||||||||||||||
| South America | 67 | 33 | 7 | 2 | 73 | 34 | 6 | 1 | 72 | 32 | 12 | 5 | ||||||||||||||||||||||||||
| Total | 25,282 | 11,187 | 6,832 | 3,999 | 25,747 | 11,420 | 7,233 | 4,099 | 25,427 | 11,343 | 4,795 | 2,608 | ||||||||||||||||||||||||||
| [A] | Includes equity-accounted investments. | |
| [B] | The term “gross” refers to the total activity in which Shell subsidiaries and equity-accounted investments have an interest. The term “net” refers to the sum of the fractional interests owned by Shell subsidiaries plus the Shell share of equity-accounted investments’ fractional interests. | |
| [C] | In compliance with international sanctions, Shell has suspended activities in Syria. Gross and net productive oil wells decreased by 241 and 155 respectively. |
| NUMBER OF NET PRODUCTIVE WELLS AND DRY HOLES DRILLED [A] | ||||||||||||||||||||
| 2011 | 2010 | 2009 | ||||||||||||||||||
| Productive | Dry | Productive | Dry | Productive | Dry | |||||||||||||||
| Exploratory | ||||||||||||||||||||
|
Europe
|
1 | 1 | 4 | 4 | 6 | 3 | ||||||||||||||
|
Asia
|
23 | 97 | 27 | 31 | 38 | 10 | ||||||||||||||
|
Oceania
|
32 | 2 | 33 | 2 | 24 | 3 | ||||||||||||||
|
Africa
|
6 | 5 | 15 | 5 | 8 | 4 | ||||||||||||||
|
North America – USA
|
20 | 2 | 80 | 5 | 49 | 2 | ||||||||||||||
|
North America – Canada
|
70 | 4 | 64 | 8 | 32 | 19 | ||||||||||||||
|
South America
|
3 | 1 | 4 | 1 | 1 | – | ||||||||||||||
| Total | 155 | 112 | 227 | 56 | 158 | 41 | ||||||||||||||
| Development | ||||||||||||||||||||
|
Europe
|
12 | 1 | 20 | 1 | 15 | – | ||||||||||||||
|
Asia
|
196 | 8 | 269 | 4 | 260 | 3 | ||||||||||||||
|
Oceania
|
– | – | 3 | – | 27 | – | ||||||||||||||
|
Africa
|
23 | 2 | 11 | – | 12 | 1 | ||||||||||||||
|
North America – USA
|
347 | 2 | 388 | – | 424 | 1 | ||||||||||||||
|
North America – Canada
|
102 | 1 | 34 | – | 45 | – | ||||||||||||||
|
South America
|
1 | – | 1 | – | 5 | – | ||||||||||||||
| Total | 681 | 14 | 726 | 5 | 788 | 5 | ||||||||||||||
| [A] | Includes equity-accounted investments. |
Table of Contents
|
Shell Annual Report and Form 20-F 2011
|
35 | ||
|
Business Review > Upstream
|
| NUMBER OF WELLS IN THE PROCESS OF EXPLORATORY DRILLING [A][B][C] | 2011 | |||||||||||||||||||||||||||||||||||||||||
| At January 1 |
Wells in the process of
drilling at January 1 and allocated proved reserves during the year |
Wells in the process of
drilling at January 1 and determined as dry during the year |
New wells in the process
of drilling at December 31 |
At December 31 | ||||||||||||||||||||||||||||||||||||||
| Gross | Net | Gross | Net | Gross | Net | Gross | Net | Gross | Net | |||||||||||||||||||||||||||||||||
|
Europe
|
36 | 11 | (14 | ) | (5 | ) | (7 | ) | (3 | ) | 7 | 2 | 22 | 5 | ||||||||||||||||||||||||||||
|
Asia
|
93 | 41 | (18 | ) | (6 | ) | (22 | ) | (14 | ) | 37 | 19 | 90 | 40 | ||||||||||||||||||||||||||||
|
Oceania
|
255 | 68 | (6 | ) | (3 | ) | – | – | 84 | 29 | 333 | 94 | ||||||||||||||||||||||||||||||
|
Africa
|
40 | [D] | 24 | [D] | – | – | (5 | ) | (3 | ) | 6 | 4 | 41 | 25 | ||||||||||||||||||||||||||||
|
North America – USA
|
85 | 54 | (35 | ) | (23 | ) | (2 | ) | (1 | ) | 99 | 68 | 147 | 98 | ||||||||||||||||||||||||||||
|
North America – Canada
|
114 | [D] | 111 | [D] | (34 | ) | (32 | ) | (3 | ) | (2 | ) | 63 | 60 | 140 | 137 | ||||||||||||||||||||||||||
|
South America
|
10 | 5 | – | – | (5 | ) | (2 | ) | 6 | 2 | 11 | 5 | ||||||||||||||||||||||||||||||
|
Total
|
633 | 314 | (107 | ) | (69 | ) | (44 | ) | (25 | ) | 302 | 184 | 784 | 404 | ||||||||||||||||||||||||||||
| [A] | Includes equity-accounted investments. | |
| [B] | The term “gross” refers to the total activity in which Shell subsidiaries and equity-accounted investments have an interest. The term “net” refers to the sum of the fractional interests owned by Shell subsidiaries plus the Shell share of equity-accounted investments’ fractional interests. | |
| [C] | Wells in the process of drilling includes exploratory wells temporarily suspended. | |
| [D] | The number of wells in the process of exploratory drilling at January 1, 2011, has been increased by 52 gross (43 net) additional wells, which were identified after publication of the 2010 Annual Report and Form 20-F. The adjustment comprises 17 gross (8 net) wells in Africa and 35 gross (35 net) wells in Canada. |
| NUMBER OF WELLS IN THE PROCESS OF DEVELOPMENT DRILLING [A][B][C] | 2011 | |||||||||||||||||
| At January 1 | At December 31 | |||||||||||||||||
| Gross | Net | Gross | Net | |||||||||||||||
|
Europe
|
6 | 1 | 14 | 3 | ||||||||||||||
|
Asia
|
73 | 23 | 69 | 20 | ||||||||||||||
|
Oceania
|
– | – | 3 | 1 | ||||||||||||||
|
Africa
|
– | – | 8 | 4 | ||||||||||||||
|
North America – USA
|
128 | 73 | 191 | 105 | ||||||||||||||
|
North America – Canada
|
14 | 13 | 16 | 13 | ||||||||||||||
|
South America
|
– | – | 1 | – | ||||||||||||||
|
Total
|
221 | 110 | 302 | 146 | ||||||||||||||
| [A] | Includes equity-accounted investments. | |
| [B] | The term “gross” refers to the total activity in which Shell subsidiaries and equity-accounted investments have an interest. The term “net” refers to the sum of the fractional interests owned by Shell subsidiaries plus the Shell share of equity-accounted investments’ fractional interests. | |
| [C] | In addition to the present activities above, Shell has ongoing activities related to the installation of waterflood projects in Europe, Asia, Africa and North America. Activities related to steam floods are in progress in Europe, Asia and North America and gas compression is being installed in Europe and Asia. |
Table of Contents
|
36
|
Shell Annual Report and Form 20-F 2011 | ||
| Business Review > Upstream |
| LNG LIQUEFACTION PLANTS IN OPERATION (AT DECEMBER 31, 2011) | ||||||||||||||
| Location |
Shell
interest (% |
) [A] | 100% capacity (mtpa | ) [B] | ||||||||||
|
Australia North West Shelf
|
Karratha | 21 | 16.3 | |||||||||||
|
Brunei LNG
|
Lumut | 25 | 7.8 | |||||||||||
|
Malaysia LNG (Dua and Tiga)
|
Bintulu | 15 | 17.3 | [C] | ||||||||||
|
Nigeria LNG
|
Bonny | 26 | 21.6 | |||||||||||
|
Oman LNG
|
Sur | 30 | 7.1 | |||||||||||
|
Qalhat (Oman) LNG
|
Sur | 11 | 3.7 | |||||||||||
|
Qatargas 4
|
Ras Laffan | 30 | 7.8 | |||||||||||
|
Sakhalin LNG
|
Prigorodnoye | 27.5 | 9.6 | |||||||||||
| [A] | Interest may be held via indirect shareholding. | |
| [B] | As reported by the operator. | |
| [C] | Our interests in the Dua and Tiga plants are due to expire in 2015 and 2023 respectively. |
| LNG LIQUEFACTION PLANTS UNDER CONSTRUCTION (AT DECEMBER 31, 2011) | ||||||||||||
| Location |
Shell
interest (%) |
100% capacity
(mtpa) [A] |
||||||||||
|
Australia Pluto 1
|
Karratha | 21 | [B] | 4.3 | ||||||||
|
Gorgon
|
Barrow Island | 25 | 15.3 | |||||||||
|
Prelude
|
Offshore Australia | 100 | 3.6 | |||||||||
|
Wheatstone
|
Onslow | 6.4 | 8.9 | |||||||||
| [A] | As reported by the operator. | |
| [B] | Based on 90% Woodside shareholding in the Pluto 1 plant. |
| LNG REGASIFICATION TERMINALS (AT DECEMBER 31, 2011) | |||||||||||||||||||
| Location |
Capacity right
period |
Shell
interest (%) |
Shell capacity
rights (mtpa) |
Start-up
date |
|||||||||||||||
|
Altamira
|
Tamaulipas, Mexico | from 2006 | Leased | 3.3 | 2006 | ||||||||||||||
|
Barcelona
|
Barcelona, Spain | 2010-2034 | [A] | Leased | 0.9 | 1969 | |||||||||||||
|
Costa Azul
|
Baja California, Mexico | 2008-2028 | Leased | 2.7 | 2008 | ||||||||||||||
|
Cove Point
|
Lusby, MD, USA | 2003-2023 | Leased | 1.8 | 2003 | ||||||||||||||
|
Elba Expansion
|
Elba Island, GA, USA | 2010-2035 | Leased | 4.2 | 2010 | ||||||||||||||
|
Elba Island
|
Elba Island, GA, USA | 2006-2036 | Leased | 2.8 | 2006 | ||||||||||||||
|
Hazira
|
Gujarat, India | from 2005 | 74% | 2.2 | 2005 | ||||||||||||||
|
Hazira Expansion (under construction)
|
Gujarat, India | from 2013 | 74% | 1.5 | 2013 | ||||||||||||||
| [A] | Capacity rights have a cancellation notice period of three months. |
| GTL PLANTS (AT DECEMBER 31, 2011) | |||||||||||
| Country |
Shell
interest (%) |
100%
capacity (b/d) |
|||||||||
|
Bintulu
|
Malaysia | 72 | 14,700 | ||||||||
|
Pearl
|
Qatar | 100 | 140,000 | ||||||||
Table of Contents
|
Shell Annual Report and Form 20-F 2011
|
37 | ||
|
Business Review > Downstream
|
| KEY STATISTICS | $ MILLION | ||||||||||
| 2011 | 2010 | 2009 | |||||||||
|
Segment earnings [A]
|
4,289 | 2,950 | 258 | ||||||||
|
Including:
|
|||||||||||
|
Revenue (including inter-segment sales)
|
428,646 | 336,216 | 250,362 | ||||||||
|
Share of earnings of equity-accounted investments [A]
|
1,577 | 948 | 661 | ||||||||
|
Production and manufacturing expenses
|
10,547 | 10,592 | 11,829 | ||||||||
|
Selling, distribution and administrative expenses
|
12,920 | 13,716 | 14,505 | ||||||||
|
Depreciation, depletion and amortisation
|
4,251 | 4,254 | 4,399 | ||||||||
|
Net capital investment [A]
|
4,342 | 2,358 | 6,232 | ||||||||
|
Refinery availability (%)
|
92 | 92 | 93 | ||||||||
|
Chemical plant availability (%) [B]
|
89 | 94 | 92 | ||||||||
|
Refinery processing intake (thousand b/d)
|
2,845 | 3,197 | 3,067 | ||||||||
|
Oil products sales volumes (thousand b/d)
|
6,196 | 6,460 | 6,156 | ||||||||
|
Chemicals sales volumes (thousand tonnes)
|
18,831 | 20,653 | 18,311 | ||||||||
| [A] | Segment earnings are presented on a current cost of supplies basis. See Notes 2 and 4 to the “Consolidated Financial Statements” for further information. | |
| [B] | The calculation of chemical plant availability for 2011 is based on a methodology to bring better alignment for our Downstream assets. On this basis, 2010 and 2009 figures would be 92% and 91% respectively. |
Table of Contents
|
38
|
Shell Annual Report and Form 20-F 2011 | ||
| Business Review > Downstream |
Table of Contents
|
Shell Annual Report and Form 20-F 2011
|
39 | ||
|
Business Review > Downstream
|
Table of Contents
|
40
|
Shell Annual Report and Form 20-F 2011 | ||
| Business Review > Downstream |
|
OIL
PRODUCTS – COST OF CRUDE OIL
|
|||||||||||
| PROCESSED OR CONSUMED [A] | $ PER BARREL | ||||||||||
| 2011 | 2010 | 2009 | |||||||||
|
Total
|
104.71 | 77.22 | 58.96 | ||||||||
| [A] | Includes Upstream margin on crude oil supplied by Shell subsidiaries and equity-accounted investment exploration and production companies. |
| CRUDE DISTILLATION CAPACITY [A] | THOUSAND B/CALENDAR DAY [B][C] | ||||||||||
| 2011 | 2010 | 2009 | |||||||||
|
Europe
|
1,243 | 1,501 | 1,519 | ||||||||
|
Asia-Pacific
|
861 | 855 | 853 | ||||||||
|
Americas
|
1,064 | 1,155 | 1,185 | ||||||||
|
Other
|
83 | 83 | 82 | ||||||||
|
Total
|
3,251 | 3,594 | 3,639 | ||||||||
| [A] | Average operating capacity for the year, excluding mothballed capacity. | |
| [B] | One barrel per day is equivalent to approximately 50 tonnes a year, depending on the specific gravity of the crude oil. | |
| [C] | Calendar day capacity is the maximum sustainable capacity minus capacity loss due to normal unit downtime. |
| ETHYLENE CAPACITY [A] | THOUSAND TONNES/YEAR | ||||||||||
| 2011 | 2010 | 2009 | |||||||||
|
Europe
|
1,659 | 1,878 | 1,880 | ||||||||
|
Asia-Pacific
|
1,556 | 1,565 | 681 | ||||||||
|
Americas
|
2,212 | 2,212 | 2,255 | ||||||||
|
Other
|
366 | 366 | 366 | ||||||||
|
Total
|
5,793 | 6,021 | 5,182 | ||||||||
| [A] | Includes the Shell share of equity-accounted investments’ capacity entitlement (offtake rights), which may be different from nominal equity interest. Nominal capacity is quoted as at December 31. |
| OIL PRODUCTS – CRUDE OIL PROCESSED [A] | THOUSAND B/D [B] | ||||||||||
| 2011 | 2010 | 2009 | |||||||||
|
Europe
|
1,058 | 1,306 | 1,323 | ||||||||
|
Asia-Pacific
|
731 | 729 | 593 | ||||||||
|
Americas
|
985 | 1,007 | 1,013 | ||||||||
|
Other
|
200 | 222 | 214 | ||||||||
|
Total
|
2,974 | 3,264 | 3,143 | ||||||||
| [A] | Includes natural gas liquids, share of equity-accounted investments and processing for others. | |
| [B] | One barrel per day is equivalent to approximately 50 tonnes a year, depending on the specific gravity of the crude oil. |
| REFINERY PROCESSING INTAKE [A] | THOUSAND B/D [B] | ||||||||||
| 2011 | 2010 | 2009 | |||||||||
|
Crude oil
|
2,652 | 2,932 | 2,783 | ||||||||
|
Feedstocks
|
193 | 265 | 284 | ||||||||
|
Total
|
2,845 | 3,197 | 3,067 | ||||||||
|
Europe
|
1,041 | 1,314 | 1,330 | ||||||||
|
Asia-Pacific
|
666 | 650 | 532 | ||||||||
|
Americas
|
1,075 | 1,158 | 1,141 | ||||||||
|
Other
|
63 | 75 | 64 | ||||||||
|
Total
|
2,845 | 3,197 | 3,067 | ||||||||
| [A] | Includes crude oil, natural gas liquids and feedstocks processed in crude distillation units and in secondary conversion units. | |
| [B] | One barrel per day is equivalent to approximately 50 tonnes a year, depending on the specific gravity of the crude oil. |
| REFINERY PROCESSING OUTTURN [A] | THOUSAND B/D [B] | ||||||||||
| 2011 | 2010 | 2009 | |||||||||
|
Gasolines
|
993 | 1,224 | 1,179 | ||||||||
|
Kerosines
|
339 | 354 | 341 | ||||||||
|
Gas/Diesel oils
|
977 | 1,074 | 1,025 | ||||||||
|
Fuel oil
|
252 | 315 | 279 | ||||||||
|
Other
|
385 | 442 | 432 | ||||||||
|
Total
|
2,946 | 3,409 | 3,256 | ||||||||
| [A] | Excludes “own use” and products acquired for blending purposes. | |
| [B] | One barrel per day is equivalent to approximately 50 tonnes a year, depending on the specific gravity of the crude oil. |
Table of Contents
|
Shell Annual Report and Form 20-F 2011
|
41 | ||
|
Business Review > Downstream
|
| OIL PRODUCT SALES VOLUMES [A] | THOUSAND B/D | ||||||||||
| 2011 | 2010 | 2009 | |||||||||
|
Europe
|
|||||||||||
|
Gasolines
|
467 | 505 | 520 | ||||||||
|
Kerosines
|
261 | 299 | 267 | ||||||||
|
Gas/Diesel oils
|
876 | 953 | 1,003 | ||||||||
|
Fuel oil
|
227 | 205 | 210 | ||||||||
|
Other products
|
192 | 227 | 242 | ||||||||
|
Total
|
2,023 | 2,189 | 2,242 | ||||||||
|
Asia-Pacific
|
|||||||||||
|
Gasolines
|
315 | 308 | 303 | ||||||||
|
Kerosines
|
164 | 172 | 159 | ||||||||
|
Gas/Diesel oils
|
423 | 370 | 337 | ||||||||
|
Fuel oil
|
273 | 301 | 187 | ||||||||
|
Other products
|
220 | 224 | 214 | ||||||||
|
Total
|
1,395 | 1,375 | 1,200 | ||||||||
|
Americas
|
|||||||||||
|
Gasolines
|
1,136 | 1,128 | 1,107 | ||||||||
|
Kerosines
|
265 | 270 | 246 | ||||||||
|
Gas/Diesel oils
|
461 | 523 | 465 | ||||||||
|
Fuel oil
|
91 | 90 | 130 | ||||||||
|
Other products
|
236 | 249 | 208 | ||||||||
|
Total
|
2,189 | 2,260 | 2,156 | ||||||||
|
Other
|
|||||||||||
|
Gasolines
|
156 | 174 | 141 | ||||||||
|
Kerosines
|
93 | 86 | 69 | ||||||||
|
Gas/Diesel oils
|
236 | 253 | 226 | ||||||||
|
Fuel oil
|
60 | 75 | 77 | ||||||||
|
Other products
|
44 | 48 | 45 | ||||||||
|
Total
|
589 | 636 | 558 | ||||||||
|
Total product sales [B][C]
|
|||||||||||
|
Gasolines
|
2,074 | 2,115 | 2,071 | ||||||||
|
Kerosines
|
783 | 827 | 741 | ||||||||
|
Gas/Diesel oils
|
1,996 | 2,099 | 2,031 | ||||||||
|
Fuel oil
|
651 | 671 | 604 | ||||||||
|
Other products
|
692 | 748 | 709 | ||||||||
|
Total
|
6,196 | 6,460 | 6,156 | ||||||||
| [A] | Excludes deliveries to other companies under reciprocal sale and purchase arrangements, which are in the nature of exchanges. Sales of condensate and natural gas liquids are included. | |
| [B] | Certain contracts are held for trading purposes and reported net rather than gross. The effect in 2011 was a reduction in oil product sales of approximately 925,000 b/d (2010: 934,000 b/d; 2009: 739,000 b/d). | |
| [C] | Export sales as a percentage of total oil sales amounted to 26.0% in 2011 (2010: 24.1%; 2009: 20.0%). |
| CHEMICALS SALES VOLUMES [A] | THOUSAND TONNES | ||||||||||
| 2011 | 2010 | 2009 | |||||||||
|
Europe
|
|||||||||||
|
Base chemicals
|
4,006 | 4,507 | 4,610 | ||||||||
|
First-line derivatives and others
|
2,689 | 2,795 | 2,776 | ||||||||
|
Total
|
6,695 | 7,302 | 7,386 | ||||||||
|
Asia-Pacific
|
|||||||||||
|
Base chemicals
|
2,027 | 2,209 | 1,837 | ||||||||
|
First-line derivatives and others
|
3,111 | 3,415 | 2,518 | ||||||||
|
Total
|
5,138 | 5,624 | 4,355 | ||||||||
|
Americas
|
|||||||||||
|
Base chemicals
|
3,405 | 3,949 | 3,396 | ||||||||
|
First-line derivatives and others
|
3,193 | 3,134 | 2,698 | ||||||||
|
Total
|
6,598 | 7,083 | 6,094 | ||||||||
|
Other
|
|||||||||||
|
Base chemicals
|
229 | 461 | 323 | ||||||||
|
First-line derivatives and others
|
171 | 183 | 153 | ||||||||
|
Total
|
400 | 644 | 476 | ||||||||
|
Total product sales
|
|||||||||||
|
Base chemicals
|
9,667 | 11,126 | 10,166 | ||||||||
|
First-line derivatives and others
|
9,164 | 9,527 | 8,145 | ||||||||
|
Total
|
18,831 | 20,653 | 18,311 | ||||||||
| [A] | Excludes volumes sold by equity-accounted investments, chemical feedstock trading and by-products. |
Table of Contents
|
42
|
Shell Annual Report and Form 20-F 2011 | ||
| Business Review > Downstream |
| SHELL INTEREST BY REFINING LOCATION AND CAPACITY DATA [A] (AT DECEMBER 31, 2011) | ||||||||||||||||||||||||||||
| Thousand barrels/calendar day, 100% capacity [C] | ||||||||||||||||||||||||||||
| Location |
Asset
class |
Shell
interest (%) [B] |
Crude
distillation capacity |
Thermal
cracking/ visbreaking/ coking |
Catalytic
cracking |
Hydro-
cracking |
||||||||||||||||||||||
|
Europe
|
||||||||||||||||||||||||||||
|
Czech Republic
|
Kralupy | [D] | 16 | 59 | – | 24 | – | |||||||||||||||||||||
| Litvinov | [D] | 16 | 101 | 14 | – | 30 | ||||||||||||||||||||||
|
Denmark
|
Fredericia | = | 100 | 63 | 40 | – | – | |||||||||||||||||||||
|
Germany
|
Harburg | = | 100 | 108 | 14 | 15 | – | |||||||||||||||||||||
| Miro | [D] | 32 | 310 | 65 | 89 | – | ||||||||||||||||||||||
| Rheinland | n = | 100 | 327 | 57 | – | 79 | ||||||||||||||||||||||
| Schwedt | [D] | 38 | 220 | 47 | 50 | – | ||||||||||||||||||||||
|
The Netherlands
|
Pernis | n = | 90 | 404 | 45 | 48 | 81 | |||||||||||||||||||||
|
Norway
|
Mongstad | [D] | u | 21 | 205 | 23 | 56 | – | ||||||||||||||||||||
|
Asia-Pacific
|
||||||||||||||||||||||||||||
|
Australia
|
Clyde | 100 | 79 | – | 35 | – | ||||||||||||||||||||||
| Geelong | u | 100 | 118 | – | 38 | – | ||||||||||||||||||||||
|
Japan
|
Mizue (Toa) | [D] | u = | 18 | 60 | 23 | 38 | – | ||||||||||||||||||||
| Yamaguchi | [D] | u | 13 | 110 | – | 25 | – | |||||||||||||||||||||
| Yokkaichi | [D] | u = | 26 | 193 | – | 55 | – | |||||||||||||||||||||
|
Malaysia
|
Port Dickson | u | 51 | 107 | – | 39 | – | |||||||||||||||||||||
|
Pakistan
|
Karachi | [D] | 30 | 43 | – | – | – | |||||||||||||||||||||
|
Philippines
|
Tabangao | u | 67 | 96 | 31 | – | – | |||||||||||||||||||||
|
Singapore
|
Pulau Bukom | n = | 100 | 462 | 63 | 34 | 55 | |||||||||||||||||||||
|
Turkey
|
Batman | [D] | 1 | 20 | – | – | – | |||||||||||||||||||||
| Izmir | [D] | 1 | 218 | 18 | 14 | 17 | ||||||||||||||||||||||
| Izmit | [D] | 1 | 217 | – | 13 | 24 | ||||||||||||||||||||||
| Kirikale | [D] | 1 | 107 | – | – | 15 | ||||||||||||||||||||||
|
Americas
|
||||||||||||||||||||||||||||
|
Argentina
|
Buenos Aires | u = | 100 | 100 | 18 | 20 | – | |||||||||||||||||||||
|
Canada
|
||||||||||||||||||||||||||||
|
Alberta
|
Scotford | u | 100 | 92 | – | – | 62 | |||||||||||||||||||||
|
Ontario
|
Sarnia | u | 100 | 71 | 5 | 19 | 9 | |||||||||||||||||||||
|
USA
|
||||||||||||||||||||||||||||
|
California
|
Martinez | = | 100 | 145 | 42 | 65 | 37 | |||||||||||||||||||||
|
Louisiana
|
Convent | [D] | u | 50 | 227 | – | 82 | 45 | ||||||||||||||||||||
| Norco | [D] | n | 50 | 230 | 25 | 107 | 34 | |||||||||||||||||||||
|
Texas
|
Deer Park | n = | 50 | 312 | 79 | 63 | 53 | |||||||||||||||||||||
| Port Arthur | [D] | = | 50 | 275 | 52 | 81 | – | |||||||||||||||||||||
|
Washington
|
Puget Sound | u = | 100 | 135 | 23 | 52 | – | |||||||||||||||||||||
|
Other
|
||||||||||||||||||||||||||||
|
Saudi Arabia
|
Al Jubail | [D] | u = | 50 | 292 | 85 | – | 45 | ||||||||||||||||||||
|
South Africa
|
Durban | [D] | u | 38 | 165 | 23 | 34 | – | ||||||||||||||||||||
| [A] | Excludes mothballed capacity. | |
| [B] | Shell interest rounded to nearest whole percentage point; Shell share of production capacity may differ. | |
| [C] | Calendar day capacity is the maximum sustainable capacity minus capacity loss due to normal unit downtime. | |
| [D] | Indicates refining location is not operated by Shell. | |
| n | Integrated refinery and chemical complex. | |
| = | Refinery complex with cogeneration capacity. | |
| u | Refinery complex with chemical unit(s). |
Table of Contents
|
Shell Annual Report and Form 20-F 2011
|
43 | ||
|
Business Review > Downstream
|
| SHELL SHARE PRODUCTION CAPACITY BY CHEMICAL MANUFACTURING PLANT LOCATION [A] (AT DECEMBER 31, 2011) | ||||||||||||||||||||||||
| Thousand tonnes/year | ||||||||||||||||||||||||
| Location | Ethylene |
Styrene
monomer |
Ethylene
glycol |
Higher
olefins [B] |
Additional
products |
|||||||||||||||||||
|
Europe
|
||||||||||||||||||||||||
|
Germany
|
Rheinland | 270 | – | – | – | A | ||||||||||||||||||
|
The Netherlands
|
Moerdijk | 974 | 789 | 155 | – | A, I | ||||||||||||||||||
|
UK
|
Mossmorran | [D] | 415 | – | – | – | – | |||||||||||||||||
| Stanlow | [D] | – | – | – | 330 | I | ||||||||||||||||||
|
Asia-Pacific
|
||||||||||||||||||||||||
|
China
|
Nanhai | [D] | 475 | 320 | 175 | – | A, I, P | |||||||||||||||||
|
Japan
|
Yamaguchi | [D] | – | – | – | 11 | A | |||||||||||||||||
|
Singapore
|
Jurong Island | [C] | 281 | 720 | 880 | – | A, I, P, O | |||||||||||||||||
| Pulau Bukom | 800 | – | – | – | A, I | |||||||||||||||||||
|
Americas
|
||||||||||||||||||||||||
|
Canada
|
Scotford | – | 450 | 450 | – | A, I | ||||||||||||||||||
|
USA
|
Deer Park | 836 | – | – | – | A, I | ||||||||||||||||||
| Geismar | – | – | 375 | 920 | I | |||||||||||||||||||
| Norco | 1,376 | – | – | – | A | |||||||||||||||||||
|
Other
|
||||||||||||||||||||||||
|
Saudi Arabia
|
Al Jubail | [D] | 366 | 400 | – | – | A, O | |||||||||||||||||
|
Total
|
5,793 | 2,679 | 2,035 | 1,261 | ||||||||||||||||||||
| [A] | Includes joint-venture plants, with the exception of the Infineum additives joint ventures. | |
| [B] | Higher olefins are linear alpha and internal olefins (products range from C6-C2024). | |
| [C] | Combination of 100% Shell owned plants and joint ventures (Shell and non-Shell operated). | |
| [D] | Indicates plant is not operated by Shell. | |
| A | Aromatics, lower olefins. | |
| I | Intermediates. | |
| P | Polyethylene, polypropylene. | |
| O | Other. |
| OTHER CHEMICAL LOCATIONS | ||||||
| Location | Products | |||||
|
Europe
|
||||||
|
Germany
|
Harburg | I | ||||
| Karlsruhe | A | |||||
| Schwedt | A | |||||
|
The Netherlands
|
Pernis | A, I, O | ||||
|
Asia-Pacific
|
||||||
|
Australia
|
Geelong | A, I | ||||
|
Japan
|
Kawasaki | A, I | ||||
| Yokkaichi | A | |||||
|
Malaysia
|
Bintulu | I | ||||
| Port Dickson | A | |||||
|
Philippines
|
Tabangao | I | ||||
|
Americas
|
||||||
|
Argentina
|
Buenos Aires | I | ||||
|
Canada
|
Sarnia | A, I | ||||
|
USA
|
Martinez | O | ||||
| Mobile | A | |||||
| Puget Sound | O | |||||
|
Other
|
||||||
|
South Africa
|
Durban | I | ||||
| A | Aromatics, lower olefins. | |
| I | Intermediates. | |
| O | Other. |
Table of Contents
|
44
|
Shell Annual Report and Form 20-F 2011 | ||
| Business Review > Corporate |
| EARNINGS | $ MILLION | |||||||||||||
| 2011 | 2010 | 2009 | ||||||||||||
|
Interest and investment (expense)/income
|
(624 | ) | (309 | ) | 360 | |||||||||
|
Foreign exchange (losses)/gains
|
(77 | ) | 42 | 644 | ||||||||||
|
Other – including taxation
|
787 | 358 | 306 | |||||||||||
|
Segment earnings
|
86 | 91 | 1,310 | |||||||||||
Table of Contents
|
Shell Annual Report and Form 20-F 2011
|
45 | ||
|
Business Review > Liquidity and capital resources
|
| EXTRACT FROM CASH FLOW STATEMENT [A] | $ BILLION | |||||||||||||
| 2011 | 2010 | 2009 | ||||||||||||
|
Net cash from operating activities excluding working capital
movements
|
43.2 | 33.3 | 23.8 | |||||||||||
|
(Increase) in inventories
|
(1.9 | ) | (2.9 | ) | (7.1 | ) | ||||||||
|
(Increase)/decrease in accounts receivable
|
(10.1 | ) | (11.9 | ) | 23.7 | |||||||||
|
Increase/(decrease) in accounts payable and accrued liabilities
|
5.6 | 8.9 | (18.9 | ) | ||||||||||
|
(Increase)/decrease in working capital
|
(6.4 | ) | (5.9 | ) | (2.3 | ) | ||||||||
|
Net cash from operating activities
|
36.8 | 27.4 | 21.5 | |||||||||||
|
Net cash used in investing activities
|
(20.4 | ) | (22.0 | ) | (26.2 | ) | ||||||||
|
Net cash used in financing activities
|
(18.1 | ) | (1.5 | ) | (0.8 | ) | ||||||||
|
Currency translation differences relating to cash and cash
equivalents
|
(0.4 | ) | (0.2 | ) | 0.1 | |||||||||
|
(Decrease)/increase in cash and cash equivalents
|
(2.1 | ) | 3.7 | (5.5 | ) | |||||||||
|
Cash and cash equivalents at the beginning of the year
|
13.4 | 9.7 | 15.2 | |||||||||||
|
Cash and cash equivalents at the end of the year
|
11.3 | 13.4 | 9.7 | |||||||||||
| [A] | For the “Consolidated Statement of Cash Flows” see page 104. |
Table of Contents
|
46
|
Shell Annual Report and Form 20-F 2011 | ||
| Business Review > Liquidity and capital resources |
| n | a $10 billion global CP programme, exempt from registration under section 3 (a)(3) of the US Securities Act 1933, with maturities not exceeding 270 days; |
| n | a $10 billion CP programme, exempt from registration under section 4(2) of the US Securities Act 1933, with maturities not exceeding 397 days; |
| n | a $25 billion EMTN programme; and |
| n | an unlimited US shelf registration. |
| RATIO OF EARNINGS TO FIXED CHARGES | ||||||||||||||||
| 2011 | 2010 | 2009 | 2008 | 2007 | ||||||||||||
|
Ratio of earnings to fixed charges
|
35.78 | 21.75 | 12.90 | 26.80 | 27.43 | |||||||||||
Table of Contents
|
Shell Annual Report and Form 20-F 2011
|
47 | ||
|
Business Review > Liquidity and capital resources
|
| CAPITALISATION TABLE | $ MILLION | |||||||
| Dec 31, 2011 | Dec 31, 2010 | |||||||
|
Equity attributable to Royal Dutch Shell plc shareholders
|
169,517 | 148,013 | ||||||
|
Current debt
|
6,712 | 9,951 | ||||||
|
Non-current debt [A]
|
30,463 | 34,381 | ||||||
|
Total debt [B]
|
37,175 | 44,332 | ||||||
|
Total capitalisation
|
206,692 | 192,345 | ||||||
| [A] | Includes $2.3 billion of certain tolling commitments (2010: $2.4 billion). | |
| [B] | Of total debt, $32.7 billion (2010: $39.3 billion) was unsecured and $4.5 billion (2010: $5.0 billion) was secured. |
| ISSUER PURCHASES OF EQUITY SECURITIES | ||||||||||||||||||||||||||||||
| Class A shares | Class B shares | Class A ADSs | ||||||||||||||||||||||||||||
| Purchase period |
Number
repurchased for employee share plans |
Weighted
average price ($) [A] |
Number
repurchased for employee share plans |
Number
repurchased for cancellation [B] |
Weighted
average price ($) [A] |
Number
repurchased for employee share plans |
Weighted
average price ($) [A] |
|||||||||||||||||||||||
|
2011
|
||||||||||||||||||||||||||||||
|
January
|
– | – | – | – | – | 1,041,466 | 67.11 | |||||||||||||||||||||||
|
March
|
– | – | – | – | – | 176,471 | 69.81 | |||||||||||||||||||||||
|
June
|
630,635 | 34.99 | – | – | – | 123,827 | 71.21 | |||||||||||||||||||||||
|
August
|
– | – | – | 10,349,020 | 32.36 | – | – | |||||||||||||||||||||||
|
September
|
668,127 | 32.32 | – | 17,750,569 | 32.14 | 132,367 | 65.78 | |||||||||||||||||||||||
|
October
|
– | – | – | 5,062,067 | 31.62 | – | – | |||||||||||||||||||||||
|
November
|
– | – | – | 1,243,275 | 34.58 | – | – | |||||||||||||||||||||||
|
December
|
15,499,739 | 35.29 | 11,870,630 | – | 36.78 | 7,163,396 | 71.05 | |||||||||||||||||||||||
|
Total 2011
|
16,798,501 | 35.16 | 11,870,630 | 34,404,931 | 33.39 | 8,637,527 | 70.47 | |||||||||||||||||||||||
|
2012
|
||||||||||||||||||||||||||||||
|
January
|
– | – | – | – | – | 768,737 | 73.15 | |||||||||||||||||||||||
|
Total 2012 [C]
|
– | – | – | – | – | 768,737 | 73.15 | |||||||||||||||||||||||
| [A] | Average price paid per share includes stamp duty and brokers’ commission. | |
| [B] | Under the share buyback programme announced on August 11, 2011. | |
| [C] | As at February 21, 2012. |
Table of Contents
|
48
|
Shell Annual Report and Form 20-F 2011 | ||
| Business Review > Liquidity and capital resources |
| CONTRACTUAL OBLIGATIONS | $ BILLION | ||||||||||||||||
|
Less
than 1 year |
Between
1 and 3 years |
Between
3 and 5 years |
5 years
and later |
Total | |||||||||||||
|
Debt [A]
|
6.4 | 7.7 | 4.8 | 13.0 | 31.9 | ||||||||||||
|
Finance leases [B]
|
0.7 | 1.3 | 1.1 | 4.7 | 7.8 | ||||||||||||
|
Operating leases [C]
|
3.9 | 5.8 | 4.0 | 6.2 | 19.9 | ||||||||||||
|
Purchase obligations [D]
|
186.3 | 119.1 | 71.1 | 184.5 | 561.0 | ||||||||||||
|
Other long-term contractual liabilities [E]
|
0.5 | 0.3 | 0.3 | 1.1 | |||||||||||||
|
Total
|
197.3 | 134.4 | 81.3 | 208.7 | 621.7 | ||||||||||||
| [A] | Contractual repayments excluding $4.3 billion of finance lease obligations. See Note 15 to the “Consolidated Financial Statements”. | |
| [B] | Includes interest. See Note 15 to the “Consolidated Financial Statements”. | |
| [C] | See Note 15 to the “Consolidated Financial Statements”. | |
| [D] | Includes all significant items, including fixed or minimum quantities to be purchased; fixed, minimum or any agreement to purchase goods and services that is enforceable, legally binding and specifies variable price provisions; and the approximate timing of the purchase. | |
| [E] | Includes all obligations included in “Trade and other payables” in “Non-current liabilities” on the Consolidated Balance Sheet that are contractually fixed as to timing and amount. In addition to these amounts, Shell has certain obligations that are not contractually fixed as to timing and amount, including contributions to defined benefit pension plans (see Note 18 to the “Consolidated Financial Statements”) and obligations associated with decommissioning and restoration (see Note 19 to the “Consolidated Financial Statements”). |
|
CALCULATION
OF RETURN ON AVERAGE
|
||||||||||||||
| CAPITAL EMPLOYED (ROACE) | $ MILLION | |||||||||||||
| 2011 | 2010 | 2009 | ||||||||||||
|
Income for the period
|
31,185 | 20,474 | 12,718 | |||||||||||
|
Interest expense after tax
|
770 | 577 | 328 | |||||||||||
|
Income before interest expense
|
31,955 | 21,051 | 13,046 | |||||||||||
|
Capital employed – opening
|
194,112 | 173,168 | 152,135 | |||||||||||
|
Capital employed – closing
|
208,178 | 194,112 | 173,168 | |||||||||||
|
Capital employed – average
|
201,145 | 183,640 | 162,652 | |||||||||||
|
ROACE
|
15.9% | 11.5% | 8.0% | |||||||||||
Table of Contents
|
Shell Annual Report and Form 20-F 2011
|
49 | ||
|
Business Review > Our people
|
|
EMPLOYEES
BY GEOGRAPHICAL AREA
|
||||||||||||||
| (AVERAGE NUMBERS) | THOUSAND | |||||||||||||
| 2011 | 2010 | 2009 | ||||||||||||
|
The Netherlands
|
8 | 8 | 9 | |||||||||||
|
UK
|
7 | 7 | 8 | |||||||||||
|
Other
|
10 | 13 | 14 | |||||||||||
|
Europe
|
25 | 28 | 31 | |||||||||||
|
Asia, Oceania, Africa
|
33 | 34 | 34 | |||||||||||
|
USA
|
20 | 20 | 22 | |||||||||||
|
Other Americas
|
12 | 15 | 14 | |||||||||||
|
Total
|
90 | 97 | 101 | |||||||||||
Table of Contents
|
50
|
Shell Annual Report and Form 20-F 2011 | ||
| Business Review > Environment and society |
Table of Contents
|
Shell Annual Report and Form 20-F 2011
|
51 | ||
|
Business Review > Environment and society
|
Table of Contents
|
52
|
Shell Annual Report and Form 20-F 2011 | ||
| Business Review > Environment and society |
Table of Contents
|
Shell Annual Report and Form 20-F 2011
|
53 | ||
|
Business Review > Environment and society
|
Table of Contents
|
54
|
Shell Annual Report and Form 20-F 2011 | ||
| The Board of Royal Dutch Shell plc |
Table of Contents
|
Shell Annual Report and Form 20-F 2011
|
55 | ||
|
The Board of Royal Dutch Shell plc
|
Table of Contents
|
56
|
Shell Annual Report and Form 20-F 2011 | ||
| The Board of Royal Dutch Shell plc |
|
BOARD
COMMITTEE MEMBERSHIP WITH EFFECT FROM
|
||||
| MAY 23, 2012 [A] | ||||
|
Committee
|
Membership | |||
|
Audit Committee
|
Guy Elliott (Chairman)
Gerard Kleisterlee Christine Morin-Postel Linda G. Stuntz |
|||
|
Corporate and Social Responsibility Committee
|
Charles O. Holliday (Chairman)
Sir Nigel Sheinwald Jeroen van der Veer |
|||
|
Nomination and Succession Committee
|
Jorma Ollila (Chairman)
Josef Ackermann Hans Wijers |
|||
|
Remuneration Committee
|
Hans Wijers (Chairman)
Josef Ackermann Charles O. Holliday |
|||
| [A] | Except in the case of Sir Nigel Sheinwald, whose membership of the Corporate and Social Responsibility Committee is with effect from July 1, 2012, subject to his appointment as a Director of the Company at the 2012 AGM. |
Table of Contents
|
Shell Annual Report and Form 20-F 2011
|
57 | ||
|
Senior Management
|
Table of Contents
|
58
|
Shell Annual Report and Form 20-F 2011 | ||
| Report of the Directors |
| [A] | ADSs are listed on the New York Stock Exchange under the symbols RDS.A and RDS.B. Each ADS represents two shares – two Class A shares in the case of RDS.A or two Class B shares in the case of RDS.B. |
| [B] | Different scrip and dividend currency election dates may apply to shareholders holding shares in a securities account with a bank or other financial institution ultimately holding through Euroclear Nederland. Such shareholders can obtain the applicable deadlines from their broker, financial intermediary, bank or other financial institution where they hold their securities account. A different scrip election date may also apply to registered and non-registered ADS holders. Registered ADS holders can contact The Bank of New York Mellon for the applicable deadline. Non-registered ADS holders can contact their broker, financial intermediary, bank or other financial institution for the applicable election deadline. |
| DIVIDENDS | 2011 | |||||||||||||||||
| Class A shares | Class B shares [A] | Class A ADSs | Class B ADSs | |||||||||||||||
| $ | € | pence | $ | pence | € | $ | $ | |||||||||||
|
Q1
|
0.42 | 0.2888 | 25.71 | 0.42 | 25.71 | 0.2888 | 0.84 | 0.84 | ||||||||||
|
Q2
|
0.42 | 0.2909 | 25.77 | 0.42 | 25.77 | 0.2909 | 0.84 | 0.84 | ||||||||||
|
Q3
|
0.42 | 0.3167 | 27.11 | 0.42 | 27.11 | 0.3167 | 0.84 | 0.84 | ||||||||||
|
Q4
|
0.42 | 0.3202 | 26.74 | 0.42 | 26.74 | 0.3202 | 0.84 | 0.84 | ||||||||||
|
Total announced in respect of the year
|
1.68 | 1.2166 | 105.33 | 1.68 | 105.33 | 1.2166 | 3.36 | 3.36 | ||||||||||
|
Amount paid during the year
|
1.1966 | 104.41 | 104.41 | 1.1966 | 3.36 | 3.36 | ||||||||||||
| [A] | It is expected that holders of Class B shares will receive dividends through the dividend access mechanism applicable to such shares. The dividend access mechanism is described more fully on pages 87-88. |
Table of Contents
|
Shell Annual Report and Form 20-F 2011
|
59 | ||
|
Report of the Directors
|
| n | select suitable accounting policies and then apply them consistently; |
| n | make judgements and accounting estimates that are reasonable and prudent; and |
| n | state whether IFRS as adopted by the EU and IFRS as issued by the IASB have been followed. |
| n | the financial statements, which have been prepared in accordance with IFRS as adopted by the EU, and with IFRS as issued by the IASB, give a true and fair view of the assets, liabilities, financial position and profit of Shell and the Company; |
| n | the Business Review includes a fair review of the development and performance of the business and the position of Shell, together with a description of the principal risks and uncertainties that it faces; and |
| n | he or she has taken all the steps that ought to have been taken in order to become aware of any relevant audit information and to establish that the auditors are aware of that information. There is no relevant audit information of which the auditors are unaware. |
| [A] | As announced on February 22, 2012, Malcolm Brinded will be standing down as an Executive Director of the Company with effect from April 1, 2012. |
Table of Contents
|
60
|
Shell Annual Report and Form 20-F 2011 | ||
| Report of the Directors |
| DIRECTORS’ INTERESTS [A] | ||||||||||||||||||
| January 1, 2011 | December 31, 2011 | |||||||||||||||||
| Class A | Class B | Class A | Class B | |||||||||||||||
|
Josef Ackermann
|
10,000 | – | 10,000 | – | ||||||||||||||
|
Malcolm Brinded
|
20,240 | 141,941 | 20,240 | 141,941 | ||||||||||||||
|
Guy Elliott
|
– | 3,177 | – | 5,677 | ||||||||||||||
|
Simon Henry
|
4,175 | 49,836 | 9,175 | 50,843 | ||||||||||||||
|
Charles O. Holliday
|
– | 20,000 | [B] | – | 20,000 | [B] | ||||||||||||
|
Lord Kerr of Kinlochard
|
– | 17,500 | – | 17,500 | ||||||||||||||
|
Gerard Kleisterlee
|
– | – | 5,000 | – | ||||||||||||||
|
Christine Morin-Postel
|
8,485 | – | 8,485 | – | ||||||||||||||
|
Jorma Ollila
|
25,000 | – | 25,000 | – | ||||||||||||||
|
Linda G. Stuntz
|
– | 3,000 | [C][D] | – | 3,000 | [D] | ||||||||||||
|
Jeroen van der Veer
|
190,195 | – | 195,195 | – | ||||||||||||||
|
Peter Voser
|
112,091 | [E] | – | 148,496 | – | |||||||||||||
|
Hans Wijers
|
5,251 | – | 5,251 | – | ||||||||||||||
| [A] | Excludes interests in shares or options awarded under the Long-term Incentive Plan, the Deferred Bonus Plan, the Restricted Share Plan and the share option plans. Interests under these plans as at January 1, 2011, and December 31, 2011, are given on pages 74-78. | |
| [B] | Held as 10,000 ADSs (RDS.B ADS). Each RDS.B ADS represents two Class B shares. | |
| [C] | At the date of appointment. | |
| [D] | Held as 1,500 ADSs (RDS.B ADS). Each RDS.B ADS represents two Class B shares. | |
| [E] | Includes 1,397 Class A shares received pursuant to the Company’s Scrip Dividend Programme in respect of the third quarter interim dividend for 2010. |
| [A] | The Senior Management of the Company are given on page 57. |
| SHARE CAPITAL PERCENTAGE | % | ||||
| Share Class | |||||
|
Class A ordinary
|
57.96 | ||||
|
Class B ordinary
|
42.04 | ||||
|
Sterling deferred
|
de minimis | ||||
Table of Contents
|
Shell Annual Report and Form 20-F 2011
|
61 | ||
|
Report of the Directors
|
March 14, 2012
Table of Contents
|
62
|
Shell Annual Report and Form 20-F 2011 | ||
| Directors’ Remuneration Report |
Table of Contents
|
Shell Annual Report and Form 20-F 2011
|
63 | ||
| Directors’ Remuneration Report > Overview |
| Policy | REMCO Determinations | |||
| Base salary and pensionable salary |
n
The
current comparator group consists of BP, Chevron, ExxonMobil and
Total as well as a selection of top Europe-based companies. In
addition, REMCO is sensitive to salary increases applied below
the Board level. Base salaries are quoted in euros.
|
n
With
effect from January 1, 2012, REMCO increased base salaries as
follows: Chief Executive Officer Peter Voser to €1,600,000
(+3.2%); Executive Director Malcolm Brinded to €1,200,000
(+2.1%) and Chief Financial Officer Simon Henry to €940,000
(+5.6%).
|
||
|
n
Salary
review date is January each year. Pensionable salaries in the
base country are reviewed at the same time on the basis of base
country market movements and conversion of the euro base salary
using long-term exchange rates.
|
n
Pensionable
salaries were also reviewed and effective January 1, 2012,
increased to CHF 2,485,000 (+1.0%) for Chief Executive Officer
Peter Voser, to £920,000 (+2.2%) for Executive Director
Malcolm Brinded and to £686,500 (+5.6%) for Chief Financial
Officer Simon Henry.
|
|||
| Annual bonus |
n
Target
levels (as percentage of base salary):
Chief Executive Officer - 150% Other Executive Directors - 110% Maximum bonus - 250% and 220% respectively. |
n
The
Executive Directors’ Scorecard produced a calculated score
of 1.44. REMCO noted strong operational performance but applied
discretion to adjust downwards the 1.44 outcome to 1.30.
|
||
|
n
Calculation
of an Executive Director’s annual bonus:
– Shell
results at the end of the year are translated into a score
between zero and two, on the basis of a predefined scorecard and
REMCO’s judgement.
– Bonus
awards are based on this score multiplied by the target bonus
levels and adjusted for individual performance as defined by
REMCO.
|
n
Assessed
individual performance as above target and set the individual
bonuses for 2011 at €3,500,000, €2,000,000 and
€1,500,000 for Peter Voser, Malcolm Brinded and Simon Henry
respectively.
|
|||
| Long-term Incentive Plan (LTIP) |
n
Award
levels (as percentage of base salary):
Chief Executive Officer - 300% Other Executive Directors - 240% Maximum vesting - 600% and 480% respectively.
n
The
actual value delivered after three years depends on the relative
performance of LTIP measures against other oil majors.
n
LTIP
shares to be held for two years following vesting.
n
Shareholding
requirements – three times base salary for Chief
Executive Officer and two times base salary for other Executive
Directors built up over five years.
|
n
New
LTIP awards were made on February 3, 2012 (see page 70
for further details).
n
In
March 2012, 60% of the LTIP shares awarded in 2009 vested, in
line with the plan rules and based on relative performance on
TSR, growth in EPS, hydrocarbon production and net cash from
operating activities. This is how Shell performed relative to
its competitors: TSR (first), EPS (fourth), hydrocarbon
production (fourth) and net cash from operating activities
(fourth). For Simon Henry, 170% of the 2009 Performance Share
Plan (PSP) award vested.
|
||
| Deferred Bonus Plan (DBP) |
n
Executive
Directors are required to invest no less than 25% and can choose
to invest up to 50% of their annual bonus in deferred bonus
shares.
n
Half
of these deferred bonus shares are matchable with additional
performance-related shares which can be earned on the same basis
as the LTIP vesting.
|
n
All
three Executive Directors elected to defer the maximum 50% of
the 2011 annual bonus into the DBP. Shares worth
€1,750,000, €1,000,000 and €750,000 were
purchased by Peter Voser, Malcolm Brinded and Simon Henry
respectively.
n
In
March 2012, 60% of the performance-related matching DBP shares
awarded to Peter Voser and Malcolm Brinded in 2009
vested.
|
||
Table of Contents
|
64
|
Shell Annual Report and Form 20-F 2011 | ||
| Directors’ Remuneration Report > Overview |
| n | base salary earned in 2011; |
| n | annual bonus for 2011 performance paid in 2012; |
| n | other cash and non-cash remuneration; |
| n | value of the LTIP awards granted in 2008 that vested in March 2011; |
| n | value of DBP awards granted in 2008 that vested in March 2011, representing the matching shares delivered less the original amount deferred; and |
| n | value of RSP awards of one times base salary made in 2008 to Peter Voser and Malcolm Brinded, which were released in August 2011. The rationale behind these awards was retention in a time of CEO succession. Awards were made following shareholder consultation. |
| 2011 SUMMARY COMPENSATION | € THOUSAND | |||||||||||||
|
Peter
Voser |
Malcolm
Brinded |
Simon
Henry |
||||||||||||
|
Earnings [A]
|
5,208 | 3,214 | 2,469 | |||||||||||
|
Value of released 2008 LTIP awards
|
4,614 | 5,363 | – | |||||||||||
|
Value of released 2008 DBP awards
|
450 | 1,192 | – | |||||||||||
|
Value of released 2008 RSP awards
|
1,391 | 1,609 | – | |||||||||||
|
Value of released 2008 PSP awards
|
– | – | 1,152 | [B] | ||||||||||
|
Value of exercised share options
|
– | – | 122 | |||||||||||
|
Total compensation
|
||||||||||||||
|
in euros
|
11,663 | 11,378 | 3,743 | |||||||||||
|
in dollars
|
16,232 | 15,835 | 5,209 | |||||||||||
|
in sterling
|
10,124 | 9,876 | 3,249 | |||||||||||
| [A] | More details can be found on page 73. | |
| [B] | Value of shares under the PSP received prior to appointment as an Executive Director, released in March 2011. |
Table of Contents
|
Shell Annual Report and Form 20-F 2011
|
65 | ||
|
Directors’ Remuneration Report > The Remuneration
Committee
|
| n | setting remuneration policy; |
| n | agreeing performance frameworks, setting targets and reviewing performance; |
| n | determining actual remuneration and benefits; and |
| n | determining contractual terms. |
| n | Hans Wijers (Chairman of the Committee); |
| n | Josef Ackermann; and |
| n | Charles O. Holliday. |
| n | Peter Voser, Chief Executive Officer; |
| n | Hugh Mitchell, Chief Human Resources & Corporate Officer and Secretary to the Committee; and |
| n | Michael Reiff, Executive Vice President Remuneration, Benefits & Services. |
| TARGET PAY DISTRIBUTION | |||

|
|||
| n | alignment with Shell’s strategy; |
| n | pay for performance; |
| n | competitiveness; |
| n | long-term creation of shareholder value; |
| n | consistency; and |
| n | compliance and risk assessment. |
Table of Contents
|
66
|
Shell Annual Report and Form 20-F 2011 | ||
| Directors’ Remuneration Report > REMCO’S remuneration policy for Executive Directors |
|
2012
ANNUAL BONUS SCORECARD MEASURES FOR
|
| EXECUTIVE DIRECTORS |
|
| ANNUAL BONUS LEVELS | |||||||
|
Target award
(as a % of salary) |
Maximum
(as a % of salary) |
||||||
| Chief Executive Officer | 150% | 250% | |||||
| Other Executive Directors | 110% | 220% | |||||
Table of Contents
|
Shell Annual Report and Form 20-F 2011
|
67 | ||
|
Directors’ Remuneration Report > REMCO’S
remuneration policy for Executive Directors
|
|
2012
LONG-TERM INCENTIVE MEASURES FOR
|
| EXECUTIVE DIRECTORS |
|
| [A] | Earnings per share on a CCS basis takes into account the changes in the cost of supplies and thereby enables a consistent comparison with other oil majors. See Note 2 to the “Consolidated Financial Statements” for further information. |
| LTIP AWARD LEVELS | |||||||
|
Target award [A]
(as a % of salary) |
Maximum
vesting (as a % of salary) |
||||||
|
Chief Executive Officer
|
300% | 600% | |||||
|
Other Executive Directors
|
240% | 480% | |||||
| [A] | LTIP target awards cannot exceed four times base salary, as approved by shareholders in 2005. |
| TIMELINE FOR 2012 LTIP SHARE AWARDS | ||

|
||
| TIMELINE FOR 2011 DEFERRED BONUS PLAN | ||
|
||
| RELATIVE PERFORMANCE RANKINGS | ||
|
Shell’s rank against peers
on each of the four performance measures |
Number of conditional performance shares ultimately awarded, taking into account the weightings of the four performance measures. | |
|
1st
|
2 x initial LTIP award | |
| 2 x half of the deferred bonus shares | ||
|
2nd
|
1.5 x initial LTIP award | |
| 1.5 x half of the deferred bonus shares | ||
|
3rd
|
0.8 x initial LTIP award | |
| 0.8 x half of the deferred bonus shares | ||
|
4th or 5th
|
Nil | |
| EUROPEAN COMPARATOR GROUP | ||||
|
Allianz
|
Diageo | Rio Tinto | ||
|
Anglo American
|
E.ON | Roche | ||
|
AstraZeneca
|
GlaxoSmithKline | Siemens | ||
|
AXA
|
HSBC | Unilever | ||
|
Barclays
|
Nokia | Vivendi | ||
|
BHP Billiton
|
Novartis | Vodafone | ||
|
Deutsche Bank
|
Philips | |||
Table of Contents
|
68
|
Shell Annual Report and Form 20-F 2011 | ||
| Directors’ Remuneration Report > REMCO’S remuneration policy for Executive Directors |
| n | all performance-based incentives awarded to Executive Directors are subject to a clawback provision which applies in situations of financial restatements due to material non-compliance and/or misconduct by an Executive Director or misconduct through his direction or non-direction. To facilitate clawback actions, specific provisions are incorporated in all incentive award documents issued from 2011. The clawback period covers at least the three-year period preceding the decision to claw back; |
| n | the use of multiple performance measures, including non-financial and relative measures, mitigates unintended financial and behavioural consequences; |
| n | the Executive Directors’ shareholdings ensure that they bear the consequences of their management decisions; and |
| n | Executive Directors’ expenses are audited internally and reviewed by REMCO on a regular basis. |
Table of Contents
|
Shell Annual Report and Form 20-F 2011
|
69 | ||
| Directors’ Remuneration Report > REMCO’s remuneration determinations for Executive Directors in 2011 |
| BASE SALARY OF CURRENT EXECUTIVE DIRECTORS (UNAUDITED) | ||||||||
| € thousand | % change | Effective date | ||||||
| Peter Voser | 1,600 | 3.2% | January 1, 2012 | |||||
| Malcolm Brinded | 1,200 | 2.1% | January 1, 2012 | |||||
| Simon Henry | 940 | 5.6% | January 1, 2012 | |||||
| n | the market positioning of the Executive Directors’ compensation packages; |
| n | the different tenure and experience each Executive Director has in his role; |
| n | the planned average salary increase in 2012 for other employees across three major countries – the Netherlands, the UK and the USA; |
| n | the impact of pensionable salary increase on pension benefits; and |
| n | Shell’s performance and Executive Directors’ individual contribution in 2011. |
| n | Net cash from operating activities was outstanding at $37 billion. |
| n | Operational excellence was on target: |
|
–
|
project delivery was above target, with selected projects being delivered on time and on budget; | |
|
–
|
hydrocarbon production was below target at 3,215 thousand boe/d; |
|
–
|
LNG sales were outstanding at 18.8 mtpa; and | |
|
–
|
combined refinery and chemical plant availability was slightly below target at 91.2%. |
| n | Shell’s sustainability performance was in aggregate above target: |
|
–
|
occupational safety, as measured by the total recordable case frequency (TRCF), was outstanding at 1.2 cases per million working hours, in line with last year’s lowest recorded score; and | |
|
–
|
targeted internal measures covering energy efficiency and use of fresh water were on or above target, whereas the volume of operational spills was below target. |
| 2011 SCORECARD FOR EXECUTIVE DIRECTORS |
|
Table of Contents
|
70
|
Shell Annual Report and Form 20-F 2011 | ||
| Directors’ Remuneration Report > REMCO’s remuneration determinations for Executive Directors in 2011 |
| AWARDED LTIP SHARES | |||||
|
Number of shares
conditionally awarded |
|||||
|
Peter Voser [A]
|
175,985 | ||||
|
Malcolm Brinded [B]
|
104,296 | ||||
|
Simon Henry [B]
|
81,699 | ||||
| [A] | Class A shares. | |
| [B] | Class B shares. |
| AWARDED DBP SHARES | |||||
|
Number of deferred shares
awarded |
|||||
|
Peter Voser [A]
|
64,161 | ||||
|
Malcolm Brinded [B]
|
36,214 | ||||
|
Simon Henry [B]
|
27,160 | ||||
| [A] | Class A shares. | |
| [B] | Class B shares. |
| EXECUTIVE DIRECTORS’ EMPLOYMENT CONTRACTS | |||||||
| Executive Director |
Employing company
|
Contract date | |||||
|
Peter Voser
|
Shell Petroleum N.V.
|
July 20, 2005 | |||||
|
Malcolm Brinded
|
Shell Petroleum N.V.
|
July 20, 2005 | |||||
|
Simon Henry
|
Shell Petroleum N.V.
|
May 20, 2009 | |||||
Table of Contents
|
Shell Annual Report and Form 20-F 2011
|
71 | ||
|
Directors’ Remuneration Report > REMCO’s
remuneration determinations for Executive Directors in 2011
|
| EXTERNAL APPOINTMENTS | THOUSAND | |||||||||
| Executive Director | Appointee organisation | Total fee | ||||||||
| CHF | £ | |||||||||
|
Peter Voser [A]
|
Roche | 280 | ||||||||
|
Malcolm Brinded [B]
|
Network Rail | 50 | ||||||||
| [A] | Appointed as Non-executive Director as of March 1, 2011. | |
| [B] | Appointed as Non-executive Director as of October 12, 2010. |
| n | Return to base country, the UK, to be employed by Shell International Limited until April 30, 2012, which will be the last day of his employment by Shell. |
| n | The separation agreement provides for him to receive a gross severance payment of 2,520,000 euros, equivalent to one times annual pay (base salary plus target bonus). This payment is in line with the policy introduced in 2010 and described on page 70 of this report. This policy was set in the context of Dutch employment law. |
| n | To receive a prorated performance bonus for his period of employment in 2012 (i.e. from January 1, 2012, to April 30, 2012), the level of which will be determined by REMCO based on the 2012 Executive Directors’ scorecard result to be declared in 2013. |
| n | Grants under the Long-term Incentive Plan and Deferred Bonus Plan continue and may vest in accordance with plan rules. However, the LTIP awards made in 2011 and 2012 are subject to prorating for service. REMCO retains the discretion to modify the prorating if it considers that this would be appropriate. |
| n | Annual bonus payments, as well as LTIP and DBP awards provided from 2011 onwards, are subject to Shell’s clawback provisions, which continue to apply post termination of employment. |
| n | Vested share options remain exercisable until their expiry date as determined by the relevant plan rules and award documentation. |
| n | Relocation support to the UK in the form of shipping of household goods and travel, both at standard Shell levels. |
| n | Following his relocation to the Netherlands in 2002, Malcolm Brinded received an indemnity on the house that Shell requested him to purchase in the Netherlands. The indemnity entailed that, should a Shell-initiated transfer result in the sale of this property with a loss (defined as a sale price below the original purchase price), Shell would compensate him for such loss. |
Table of Contents
|
72
|
Shell Annual Report and Form 20-F 2011 | ||
| Directors’ Remuneration Report > Non-executive Directors |
|
NON-EXECUTIVE
DIRECTORS’ FEES STRUCTURE
|
|||||
| (UNAUDITED) | € | ||||
|
Chairman of the Board
|
800,000 | ||||
|
Non-executive Director annual fee
|
120,000 | ||||
|
Senior Independent Director
|
55,000 | ||||
|
Audit Committee
|
|||||
|
Chairman [A]
|
45,000 | ||||
|
Member
|
25,000 | ||||
|
Corporate and Social Responsibility Committee
|
|||||
|
Chairman [A]
|
35,000 | ||||
|
Member
|
17,250 | ||||
|
Nomination and Succession Committee
|
|||||
|
Chairman [A]
|
25,000 | ||||
|
Member
|
12,000 | ||||
|
Remuneration Committee
|
|||||
|
Chairman [A]
|
35,000 | ||||
|
Member
|
17,250 | ||||
|
Intercontinental travel fee
|
5,000 | ||||
| [A] | The chairman of a committee does not receive an additional fee for membership of that committee. |
| [A] | Compensation includes gains realised from long-term incentive awards released and share options exercised during the year. |
ROYAL DUTCH SHELL PLC CLASS A SHARES
| RDSA VERSUS EURONEXT 100 |
|
ROYAL DUTCH SHELL PLC CLASS B SHARES
| RDSB VERSUS FTSE 100 |
|
Table of Contents
|
Shell Annual Report and Form 20-F 2011
|
73 | ||
|
Directors’ Remuneration Report > Data
tables – Executive Directors
|
| EARNINGS OF EXECUTIVE DIRECTORS IN OFFICE DURING 2011 (AUDITED) | € THOUSAND | |||||||||||||||||||
| Peter Voser | Malcolm Brinded | Simon Henry | ||||||||||||||||||
| 2011 | 2010 | 2011 | 2010 | 2011 | 2010 | |||||||||||||||
|
Salary
|
1,550 | 1,500 | 1,175 | 1,175 | 890 | 850 | ||||||||||||||
|
Bonus [A]
|
3,500 | 3,750 | 2,000 | 2,302 | 1,500 | 1,537 | ||||||||||||||
|
Cash benefits [B]
|
155 | 107 | 1 | 1 | 50 | 29 | ||||||||||||||
|
Non-cash benefits [C]
|
3 | 4 | 38 | 45 | 29 | 40 | ||||||||||||||
|
Total earnings
|
||||||||||||||||||||
|
in euros
|
5,208 | 5,361 | 3,214 | 3,523 | 2,469 | 2,456 | ||||||||||||||
|
in dollars
|
7,249 | 7,100 | 4,473 | 4,666 | 3,436 | 3,253 | ||||||||||||||
|
in sterling
|
4,521 | 4,596 | 2,790 | 3,020 | 2,143 | 2,106 | ||||||||||||||
| [A] | The annual bonus figures are shown in the table in their related performance year and not in the year in which they are paid. (See also the DBP table on page 75.) | |
| [B] | Includes employer contributions to insurance plans, school fees, car allowances and tax compensation. | |
| [C] | Comprise life and medical insurance, company-provided transport for home-to-office commuting and lease cars. |
Table of Contents
|
74
|
Shell Annual Report and Form 20-F 2011 | ||
| Directors’ Remuneration Report > Data tables – Executive Directors |
| LONG-TERM INCENTIVE PLAN | ||||||||||||||||||||||||||||||||||||||||||||||||||
| Audited | Unaudited | |||||||||||||||||||||||||||||||||||||||||||||||||
|
Number of shares
under award as at January 1, 2011 [A] |
||||||||||||||||||||||||||||||||||||||||||||||||||
|
Original
award |
Dividend
shares accrued in prior years [B] |
Market
price at date of award |
Dividend
shares accrued during the year [B] |
Additional
shares awarded during the year |
Number
of shares released during the year |
Value of
shares at release (thousand) [C] |
Total number of
shares under award as at December 31, 2011 |
Initial
expected value of the award (thousand) [D] |
Potential
value as at December 31, 2011 (thousand) [E] |
|||||||||||||||||||||||||||||||||||||||||
|
Class A shares
|
€ | € | € | $ | € | $ | ||||||||||||||||||||||||||||||||||||||||||||
|
Peter Voser
|
||||||||||||||||||||||||||||||||||||||||||||||||||
|
2011 to 2013
|
182,174 | – | 25.53 | 8,907 | – | – | – | 191,081 | 4,283 | 5,840 | 7,853 | 10,149 | ||||||||||||||||||||||||||||||||||||||
|
2010 to 2012
|
227,560 | 13,110 | 19.78 | 11,768 | – | – | – | 252,438 | 4,184 | 5,729 | 10,730 | 13,867 | ||||||||||||||||||||||||||||||||||||||
|
2009 to 2011 [F]
|
128,074 | 16,112 | 19.40 | 7,050 | – | – | – | 151,236 | 2,320 | 3,103 | 4,257 | 5,502 | ||||||||||||||||||||||||||||||||||||||
|
2008 to 2010
|
98,623 | 17,779 | 23.97 | 2,051 | 58,201 | 176,654 | 4,614 | – | 2,123 | 3,157 | – | – | ||||||||||||||||||||||||||||||||||||||
|
Class B shares
|
£ | £ | £ | $ | £ | $ | ||||||||||||||||||||||||||||||||||||||||||||
|
Malcolm Brinded
|
||||||||||||||||||||||||||||||||||||||||||||||||||
|
2011 to 2013
|
110,961 | – | 21.45 | 5,397 | – | – | – | 116,358 | 2,191 | 3,540 | 4,169 | 6,426 | ||||||||||||||||||||||||||||||||||||||
|
2010 to 2012
|
148,660 | 8,888 | 16.56 | 7,663 | – | – | – | 165,211 | 2,293 | 3,597 | 6,122 | 9,437 | ||||||||||||||||||||||||||||||||||||||
|
2009 to 2011 [F]
|
153,855 | 19,904 | 16.58 | 8,452 | – | – | – | 182,211 | 2,384 | 3,394 | 4,471 | 6,893 | ||||||||||||||||||||||||||||||||||||||
|
2008 to 2010
|
114,201 | 20,910 | 17.58 | 2,413 | 67,556 | 205,080 | 4,772 | – | 1,801 | 3,587 | – | – | ||||||||||||||||||||||||||||||||||||||
|
Simon Henry
|
||||||||||||||||||||||||||||||||||||||||||||||||||
|
2011 to 2013
|
84,047 | – | 21.45 | 4,088 | – | – | – | 88,135 | 1,660 | 2,681 | 3,158 | 4,868 | ||||||||||||||||||||||||||||||||||||||
|
2010 to 2012
|
107,541 | 6,429 | 16.56 | 5,544 | – | – | – | 119,514 | 1,659 | 2,602 | 4,429 | 6,827 | ||||||||||||||||||||||||||||||||||||||
|
2009 to 2011 [G]
|
26,000 | 2,845 | 15.40 | 1,403 | – | – | – | 30,248 | 389 | 539 | 1,212 | 1,869 | ||||||||||||||||||||||||||||||||||||||
|
2008 to 2010 [G]
|
26,000 | 4,436 | 20.15 | 518 | 13,088 | 44,042 | 1,025 | – | 531 | 1,042 | – | – | ||||||||||||||||||||||||||||||||||||||
| [A] | The 2011 award was made on February 4, 2011. (See pages 66-67 for more details about LTIP performance conditions.) | |
| [B] | Dividend shares are performance related and accumulate each year on an assumed notional LTIP award. Such dividend shares are disclosed and recorded on the basis of the number of shares conditionally awarded but, when an award vests, dividend shares will be awarded only in relation to vested shares as if the vested shares were held from the award date. | |
| [C] | The vested awards were delivered on April 29, 2011, at a share price of €26.12 for Peter Voser and at a share price of £23.27 for Malcolm Brinded and Simon Henry. | |
| [D] | The initial expected value of the 2011 awards is equal to 87.80% of the face value of the conditional awards. The initial expected value of the TSR-related conditional performance shares has been calculated on the basis of a Monte Carlo pricing model, which currently is considered the most appropriate way to value a plan with a relative market condition such as TSR. In respect of the three non-market measures, a statistical equal probability of ranking outcome has been used. The valuations were provided by Towers Watson after which a risk of forfeiture discount was applied. | |
| [E] | Representing the value of the conditional shares awarded in previous years under the LTIP at the end of the financial year. This is calculated by multiplying the market price of Royal Dutch Shell plc shares at December 31, 2011, by the number of shares under the LTIP that would vest based on the achievement of LTIP performance conditions up to December 31, 2011. (See pages 66-67 for more details about LTIP performance conditions.) | |
| [F] | On March 13, 2012, REMCO determined to vest 60% of shares for the 2009 award (see page 70). The vesting percentage is applied to the total number of shares awarded on January 30, 2009. The resulting number of shares has been increased by notional dividends accrued between award date and vesting date (as if this resulting number of shares had been in place from award date). | |
| [G] | Awarded under the Performance Share Plan (PSP) before his appointment as an Executive Director. The initial expected value of the 2009 PSP award has been calculated on the basis of a Monte Carlo pricing model, adjusted with PSP conditions. The 2009 award vested at 170% on March 13, 2012. More information about the PSP can be found on pages 135-136. |
Table of Contents
|
Shell Annual Report and Form 20-F 2011
|
75 | ||
|
Directors’ Remuneration Report > Data
tables – Executive Directors
|
| DEFERRED BONUS PLAN (AUDITED) | |||||||||||||||||||||||||||||||||||||||||||||
|
Number of shares under award
as at January 1, 2011 [B] |
|||||||||||||||||||||||||||||||||||||||||||||
|
Awards [A]
|
Number of
shares deferred from the bonus [C] |
Non-
performance- related matching shares awarded at grant |
Dividend
shares accrued in prior years [D] |
Market
price at date of award |
Dividend
shares accrued during the year [D] |
Performance-
related matching shares vested |
Dividend
shares accrued on performance- related matching shares [E] |
Number of
shares released during the year |
Value of
shares at release (thousand |
) [F] |
Realised
gains on deferral (thousand |
) [G] |
Total
number of shares under award as at December 31, 2011 |
||||||||||||||||||||||||||||||||
|
Class A shares
|
€ | € | € | ||||||||||||||||||||||||||||||||||||||||||
|
Peter Voser
|
|||||||||||||||||||||||||||||||||||||||||||||
|
2011 to 2013
|
73,457 | – | – | 25.53 | 3,591 | – | – | – | – | – | 77,048 | ||||||||||||||||||||||||||||||||||
|
2010 to 2012
|
47,121 | – | 2,714 | 19.78 | 2,437 | – | – | – | – | – | 52,272 | ||||||||||||||||||||||||||||||||||
|
2009 to 2011 [H]
|
36,687 | 9,171 | 5,769 | 19.40 | 2,525 | – | – | – | – | – | 54,152 | ||||||||||||||||||||||||||||||||||
|
2008 to 2010
|
14,690 | 3,673 | 3,309 | 23.97 | 357 | 7,345 | 1,324 | 30,698 | 801 | 450 | – | ||||||||||||||||||||||||||||||||||
|
Class B shares
|
£ | £ | £ | ||||||||||||||||||||||||||||||||||||||||||
|
Malcolm Brinded
|
|||||||||||||||||||||||||||||||||||||||||||||
|
2011 to 2013
|
45,289 | – | – | 21.45 | 2,203 | – | – | – | – | – | 47,492 | ||||||||||||||||||||||||||||||||||
|
2010 to 2012
|
37,474 | – | 2,240 | 16.56 | 1,932 | – | – | – | – | – | 41,646 | ||||||||||||||||||||||||||||||||||
|
2009 to 2011 [H]
|
44,073 | 11,018 | 7,127 | 16.58 | 3,026 | – | – | – | – | – | 65,244 | ||||||||||||||||||||||||||||||||||
|
2008 to 2010
|
34,022 | 8,505 | 7,787 | 17.58 | 838 | 17,011 | 3,115 | 71,278 | 1,658 | 1,061 | – | ||||||||||||||||||||||||||||||||||
|
Simon Henry
|
|||||||||||||||||||||||||||||||||||||||||||||
|
2011 to 2013
|
30,238 | – | – | 21.45 | 1,470 | – | – | – | – | – | 31,708 | ||||||||||||||||||||||||||||||||||
|
2010 to 2012
|
17,607 | – | 1,052 | 16.56 | 908 | – | – | – | – | – | 19,567 | ||||||||||||||||||||||||||||||||||
| [A] | Awards made in 2009, 2010 and 2011 refer to the portion of the 2008, 2009 and 2010 annual bonus respectively, which was deferred, and the related accrued dividends and matching shares. | |
| [B] | The 2011 award was made on February 4, 2011. | |
| [C] | Representing the proportion of the annual bonus that has been deferred and converted into notional share entitlements (deferred bonus shares), in which there is no beneficial ownership. Half of the shares awarded are matchable with additional performance-related shares which can be earned on the same basis as the LTIP vesting. The value of the deferred bonus shares awarded for 2011 is also included in the annual bonus figures in the Earnings of Executive Directors table on page 73. | |
| [D] | Representing dividends accumulated since the award on the number of shares equal to the deferred bonus shares awarded. | |
| [E] | Dividend shares are performance related and accumulate each year on an assumed notional DBP award. When an award vests, dividend shares will be awarded only in relation to vested shares as if the vested shares were held from the award date. | |
| [F] | The vested awards were delivered on April 29, 2011, at a share price of €26.12 for Peter Voser and £23.27 for Malcolm Brinded. | |
| [G] | Representing the difference between the value of shares released and bonus deferred. Peter Voser deferred 25% and Malcolm Brinded deferred 50% of their 2007 annual bonus. | |
| [H] | On March 13, 2012, REMCO decided to vest 60% of the performance-related matching shares relating to the 2009 award. The total vested award (comprising the original deferred bonus award plus the matching award) has been increased by the notional dividends accrued between the award date and the vesting date (see page 70). |
| RESTRICTED SHARE PLAN (AUDITED) | ||||||||||||||||||||||||||||||||
|
Number of shares under award
as at January 1, 2011 [A] |
||||||||||||||||||||||||||||||||
|
Type of
share |
Original
award |
Dividend
shares accrued in prior years |
Market
price at date of award |
Dividend
shares accrued during the year |
Number of
shares released during the year |
Value of
shares at release (thousand) [B] |
Total
number of shares under award as at December 31, 2011 |
|||||||||||||||||||||||||
|
Peter Voser
|
Class A | 45,877 | 7,194 | €22.56 | 1,283 | 54,354 | €1,391 | – | ||||||||||||||||||||||||
|
Malcolm Brinded
|
Class B | 52,941 | 8,445 | £17.50 | 1,471 | 62,857 | £1,408 | – | ||||||||||||||||||||||||
| [A] | Restricted share awards were made on August 1, 2008. | |
| [B] | The vested awards were delivered on August 1, 2011, at a share price of €25.60 for Peter Voser and £22.40 for Malcolm Brinded. |
Table of Contents
|
76
|
Shell Annual Report and Form 20-F 2011 | ||
| Directors’ Remuneration Report > Data tables – Executive Directors |
| SHARE OPTIONS (AUDITED) | ||||||||||||||||||||||||||||||||||||||||||
|
Number of
options under award as at January 1, 2011 |
Number of
options exercised during the year |
Number of
options under award as at December 31, 2011 |
Grant
price [A] |
Exercisable
from date |
Expiry date |
Realisable
gains as at December 31, 2011 (thousand) [B] |
Realised
gains on options exercised during the year (thousand) |
|||||||||||||||||||||||||||||||||||
|
Class A shares
|
€ | € | $ | € | $ | |||||||||||||||||||||||||||||||||||||
|
Malcolm Brinded
|
50,000 | – | 50,000 | 31.05 | 21/03/05 | 20/03/12 | – | – | – | – | ||||||||||||||||||||||||||||||||
|
Class B shares
|
£ | £ | $ | £ | $ | |||||||||||||||||||||||||||||||||||||
|
Peter Voser
|
229,866 | – | 229,866 | 15.04 | 05/11/07 | 04/11/14 | 2,184 | 3,367 | – | – | ||||||||||||||||||||||||||||||||
|
Malcolm Brinded
|
229,866 | – | 229,866 | 13.89 | 07/05/07 | 06/05/14 | 2,448 | 3,774 | – | – | ||||||||||||||||||||||||||||||||
|
Simon Henry [C]
|
12,872 | 12,872 | – | 19.21 | 26/03/04 | 25/03/11 | – | – | 32 | 52 | ||||||||||||||||||||||||||||||||
| 16,694 | 16,694 | – | 18.20 | 21/03/05 | 20/03/12 | – | – | 75 | 121 | |||||||||||||||||||||||||||||||||
| 22,728 | – | 22,728 | 12.74 | 19/03/06 | 18/03/13 | 268 | 413 | – | – | |||||||||||||||||||||||||||||||||
| 32,583 | – | 32,583 | 13.89 | 07/05/07 | 06/05/14 | 347 | 535 | – | – | |||||||||||||||||||||||||||||||||
| [A] | Average of the opening and closing share prices over a period of five successive trading days prior to and including the day on which the options are granted (not at a discount). | |
| [B] | Representing the value of unexercised share options granted in previous years at the end of the financial year, calculated by taking the difference between the grant price of the option and the market price of Royal Dutch Shell plc shares at December 31, 2011, multiplied by the number of shares under option at December 31, 2011. The actual gain realised, if any, will depend on the market price of Royal Dutch Shell plc shares at the time of exercise. | |
| [C] | Awarded to Simon Henry prior to his appointment as an Executive Director. Simon Henry exercised 12,872 and 16,694 share options on February 4, 2011, and October 28, 2011. The market price at the date of exercise was £21.67 and £22.68 respectively. |
| PENSIONS (AUDITED) | THOUSAND | |||||||||||||||||||||||||
|
Accrued pension
|
||||||||||||||||||||||||||
| At December 31, 2011 | Increase over the year |
Increase over the year
(excluding inflation) |
||||||||||||||||||||||||
| CHF | $ | CHF | $ | CHF | $ | |||||||||||||||||||||
|
Peter Voser [A]
|
1,255 | 1,333 | 57 | 60 | 57 | 60 | ||||||||||||||||||||
| £ | $ | £ | $ | £ | $ | |||||||||||||||||||||
|
Malcolm Brinded [B]
|
642 | 989 | 58 | 90 | 28 | 43 | ||||||||||||||||||||
|
Simon Henry [B]
|
353 | 544 | 38 | 59 | 22 | 34 | ||||||||||||||||||||
| PENSIONS (AUDITED) | THOUSAND | |||||||||||||||||||||||||||||||||
|
Transfer values of accrued benefits
|
||||||||||||||||||||||||||||||||||
| At December 31, 2011 | At December 31, 2010 |
Increase over the year
less Directors’ contributions |
Increase in accrued
pension over the year (excluding inflation) less Directors’ contributions |
|||||||||||||||||||||||||||||||
| CHF | $ | CHF | $ | CHF | $ | CHF | $ | |||||||||||||||||||||||||||
|
Peter Voser [A]
|
15,665 | 16,647 | 14,374 | 15,344 | 1,215 | 1,292 | 631 | 670 | ||||||||||||||||||||||||||
| £ | $ | £ | $ | £ | $ | £ | $ | |||||||||||||||||||||||||||
|
Malcolm Brinded [B]
|
17,260 | 26,606 | 13,877 | 21,474 | 3,383 | 5,215 | 754 | 1,162 | ||||||||||||||||||||||||||
|
Simon Henry [B]
|
8,270 | 12,748 | 5,770 | 8,929 | 2,462 | 3,795 | 476 | 733 | ||||||||||||||||||||||||||
| [A] | The pension values for Peter Voser include all pension benefits. This includes a capped defined benefit pension in the Swiss pension fund based on salary up to a cap of CHF 835,200 per annum and benefits for salary in excess of this level provided via an individual savings account and an unfunded pension promise. As at December 31, 2011, his capped defined benefit pension was CHF 425,952 per annum and the transfer value in respect of this benefit was CHF 5,249,819. The individual savings account was worth CHF 2,581,175 at December 31, 2011. The balance of his benefits (valued at CHF 7,833,942 at December 31, 2011) will be provided through the unfunded pension arrangement. | |
| [B] | Malcolm Brinded and Simon Henry elected to have their benefits in the Shell Contributory Pension Fund (the main UK pension arrangement) restricted to the UK applicable lifetime allowance with any excess provided from an unfunded defined benefit scheme (the Shell Supplementary Pension Plan). While Malcolm Brinded and Simon Henry are working outside of the UK, their benefits are provided by the Shell Overseas Contributory Pension Fund rather than the Shell Contributory Pension Fund, in line with Shell’s general pension policy. These promises of pension delivery are contained in the aggregate values presented in the table and therefore not disclosed separately. The significant increase in both Malcolm Brinded and Simon Henry’s transfer values are largely as a result of changes in UK financial conditions during 2011; there has been a significant fall in UK government bond yields (which determine the discount rate used to value their benefits), partly offset by a fall in the market implied rate of inflation. |
Table of Contents
|
Shell Annual Report and Form 20-F 2011
|
77 | ||
|
Directors’ Remuneration Report > Data
tables – Non-executive Directors
|
| EARNINGS OF NON-EXECUTIVE DIRECTORS IN OFFICE DURING 2011 (AUDITED) | THOUSAND | |||||||||||||||||
| 2011 | 2010 | |||||||||||||||||
| Non-executive Directors | € | $ | € | $ | ||||||||||||||
|
Josef Ackermann
|
137 | 191 | 132 | 175 | ||||||||||||||
|
Guy Elliott
|
157 | 219 | 47 | 62 | ||||||||||||||
|
Charles O. Holliday
|
196 | 272 | 47 | 63 | ||||||||||||||
|
Lord Kerr of Kinlochard
|
214 | 297 | 224 | 297 | ||||||||||||||
|
Gerard Kleisterlee
|
145 | 202 | 23 | 31 | ||||||||||||||
|
Wim Kok [A]
|
63 | 88 | 162 | 215 | ||||||||||||||
|
Christine Morin-Postel
|
153 | 212 | 160 | 212 | ||||||||||||||
|
Jorma Ollila [B]
|
800 | 1,112 | 750 | 993 | ||||||||||||||
|
Linda G. Stuntz [C]
|
95 | 131 | – | – | ||||||||||||||
|
Jeroen van der Veer
|
137 | 191 | 132 | 175 | ||||||||||||||
|
Hans Wijers
|
162 | 226 | 150 | 199 | ||||||||||||||
| [A] | Wim Kok stood down with effect from May 17, 2011. | |
| [B] | Jorma Ollila receives no additional payments for chairing the Nomination and Succession Committee. He does have the use of an apartment when on business in The Hague. | |
| [C] | Linda G. Stuntz was appointed with effect from June 1, 2011. |
| LONG-TERM INCENTIVE PLAN (AUDITED) | CLASS A SHARES | |||||||||
| 2008 to 2010 | 2009 to 2011 | |||||||||
|
Number of shares under award as at January 1, 2011
|
227,733 | 348,276 | ||||||||
|
Original award
|
192,949 | 309,358 | ||||||||
|
Dividend shares accrued in prior years
|
34,784 | 38,918 | ||||||||
|
Market price at date of award
|
€23.97 | €19.40 | ||||||||
|
Dividend shares accrued during the year [A]
|
4,012 | 17,029 | ||||||||
|
Additional shares awarded during the year
|
113,867 | – | ||||||||
|
Number of shares released during the year
|
345,612 | – | ||||||||
|
Value of shares at release (thousand) [B]
|
€9,017 | – | ||||||||
|
Total number of shares under award as at December 31,
2011 [C]
|
– | 365,305 | ||||||||
| [A] | Dividend shares are performance related and accumulate each year at an assumed notional LTIP award. Such dividend shares are disclosed and recorded on the basis of the number of shares conditionally awarded but, when an award vests, dividend shares will be awarded only in relation to vested shares as if the vested shares were held from the award date. | |
| [B] | The vested awards were delivered on May 3, 2011, at a share price of €26.09. | |
| [C] | On March 13, 2012, REMCO determined to vest 60% of the 2009 award. The vesting percentage is applied to the total number of shares awarded on January 30, 2009. The resulting number of shares has been increased by notional dividends accrued between award date and vesting date (as if this resulting number of shares had been in place from award date). See page 70. |
Table of Contents
|
78
|
Shell Annual Report and Form 20-F 2011 | ||
| Directors’ Remuneration Report > Data tables – Non-executive Directors |
| DEFERRED BONUS PLAN [A] (AUDITED) | CLASS A SHARES | ||||||||
| 2008 to 2010 | 2009 to 2011 [G] | ||||||||
|
Number of shares under award as at January 1, 2011
|
88,815 | 136,044 | |||||||
|
Number of shares deferred from the bonus [B]
|
60,200 | 96,674 | |||||||
|
Non-performance related matching shares awarded at grant
|
15,050 | 24,168 | |||||||
|
Dividend shares accrued in prior years [C]
|
13,565 | 15,202 | |||||||
|
Market price at date of award
|
€23.97 | €19.40 | |||||||
|
Dividend shares accrued during the year [C]
|
1,460 | 6,652 | |||||||
|
Performance-related matching shares vested during the year
|
30,100 | – | |||||||
|
Dividend shares accrued on the performance related matching
shares [D]
|
5,427 | – | |||||||
|
Number of shares released during the year
|
125,802 | – | |||||||
|
Value of shares at release (thousand) [E]
|
€3,286 | – | |||||||
|
Realised gains on deferral (thousand) [F]
|
€1,843 | – | |||||||
|
Total number of shares under award as at December 31, 2011
|
– | 142,696 | |||||||
| [A] | Awards made in 2008 and 2009 refer to the portion of the 2007 and 2008 annual bonus respectively, which was deferred, and the related accrued dividends and matching shares. | |
| [B] | Representing the proportion of the annual bonus that has been deferred and converted into notional share entitlements (deferred bonus shares), in which there is no beneficial ownership. | |
| [C] | Representing dividends accumulated since the award on the number of shares equal to the deferred bonus shares awarded. | |
| [D] | Dividend shares are performance related and accumulate each year on an assumed notional DBP award. When an award vests, dividend shares will be awarded only in relation to vested shares as if the vested shares were held from the award date. | |
| [E] | The vested awards were delivered on April 29, 2011, at a share price of €26.12. | |
| [F] | Representing the difference between the value of shares released and bonus deferred. | |
| [G] | On March 13, 2012, REMCO decided to vest 60% of the performance-related matching shares relating to the 2009 award. The total vested award (comprising the original deferred bonus award plus the matching award) has been increased by the notional dividends accrued between award date and vesting date (see page 70). |
| SHARE OPTIONS (AUDITED) | CLASS A SHARES | |||||||||||
| Awarded | 2002 | 2003 | 2004 | |||||||||
|
Number of options under award as at January 1, 2011
|
105,000 | 300,000 | 300,000 | |||||||||
|
Number of options exercised during the year
|
– | – | – | |||||||||
|
Number of options under award as at December 31, 2011
|
105,000 | 300,000 | [B] | 300,000 | ||||||||
|
Grant price [A]
|
€31.05 | €18.41 | €20.65 | |||||||||
|
Exercisable from date
|
21/03/05 | 19/03/06 | 07/05/07 | |||||||||
|
Expiry date
|
20/03/12 | 18/03/13 | 06/05/14 | |||||||||
| [A] | The grant price is the average of the opening and closing share prices over a period of five successive trading days prior to and including the day on which the options are granted (not at a discount). | |
| [B] | Jeroen van der Veer exercised 150,000 share options on February 13, 2012. |
| PENSION (AUDITED) | THOUSAND | |||||||||||||||||||||||
|
Accrued pension
|
||||||||||||||||||||||||
| At December 31, 2011 | Increase over the year |
Increase over the year
(excluding inflation) |
||||||||||||||||||||||
| € | $ | € | $ | € | $ | |||||||||||||||||||
|
Jeroen van der Veer [A]
|
1,569 | 2,028 | 30 | 39 | (6 | ) | (8 | ) | ||||||||||||||||
| PENSION (AUDITED) | THOUSAND | |||||||||||||||||||||||||||||||
|
Transfer values of accrued benefits
|
||||||||||||||||||||||||||||||||
| At December 31, 2011 | At December 31, 2010 |
Increase over the year
less Director’s contributions |
Increase in accrued
pension over the year (excluding inflation) less Director’s contributions |
|||||||||||||||||||||||||||||
| € | $ | € | $ | € | $ | € | $ | |||||||||||||||||||||||||
|
Jeroen van der Veer [A]
|
26,919 | 34,788 | 26,552 | 35,422 | 367 | 474 | (111 | ) | (143 | ) | ||||||||||||||||||||||
| [A] | Jeroen van der Veer is a pensioner. The pension payments made to him during 2011 amounted to approximately €1,554,000. The net increase in pension and the transfer value of that increase are negative for Jeroen van der Veer due to Dutch price inflation during the year being higher than the pension increase granted in the Dutch pension fund during 2011. The increase in transfer value for Jeroen van der Veer is largely due to the change in financial conditions (discount rate decrease and interest). |
Table of Contents
|
Shell Annual Report and Form 20-F 2011
|
79 | ||
|
Corporate governance
|
Table of Contents
|
80
|
Shell Annual Report and Form 20-F 2011 | ||
| Corporate governance |
Table of Contents
|
Shell Annual Report and Form 20-F 2011
|
81 | ||
|
Corporate governance
|
| ATTENDANCE AT BOARD AND BOARD COMMITTEE MEETINGS [A] | |||||||||||||||||
| Board |
Audit
Committee |
Corporate and
Social Responsibility Committee |
Nomination
and Succession Committee |
Remuneration
Committee |
|||||||||||||
|
Josef Ackermann
|
7/8 | 4/5 | |||||||||||||||
|
Malcolm Brinded
|
8/8 | ||||||||||||||||
|
Guy Elliott
|
8/8 | 5/5 | |||||||||||||||
|
Simon Henry
|
8/8 | ||||||||||||||||
|
Charles O. Holliday
|
8/8 | 5/5 | 5/5 | ||||||||||||||
|
Lord Kerr of Kinlochard
|
8/8 | 3/3 | 5/5 | 5/5 | |||||||||||||
|
Gerard Kleisterlee
|
7/8 | 4/5 | |||||||||||||||
|
Wim Kok
|
2/2 | 2/2 | 2/2 | ||||||||||||||
|
Christine Morin-Postel
|
8/8 | 5/5 | |||||||||||||||
|
Jorma Ollila
|
8/8 | 4/5 | |||||||||||||||
|
Linda G. Stuntz
|
4/5 | 1/2 | |||||||||||||||
|
Jeroen van der Veer
|
8/8 | 5/5 | |||||||||||||||
|
Peter Voser
|
8/8 | ||||||||||||||||
|
Hans Wijers
|
8/8 | 3/3 | 5/5 | ||||||||||||||
| [A] | The first figure represents attendance and the second figure the possible number of meetings. For example, 7/8 signifies attendance at seven out of eight possible meetings. Where a Director stood down from the Board or a Board committee during the year, or was appointed during the year, only meetings before standing down or after the date of appointment are shown. |
| EXECUTIVE COMMITTEE | ||||
|
Peter Voser
|
Chief Executive Officer [A][B]
|
|||
|
Matthias Bichsel
|
Projects & Technology Director [B]
|
|||
|
Malcolm Brinded
|
Executive Director, Upstream International [A][B][C]
|
|||
|
Simon Henry
|
Chief Financial Officer [A][B]
|
|||
|
Hugh Mitchell
|
Chief Human Resources & Corporate Officer [B]
|
|||
|
Marvin Odum
|
Upstream Americas Director [B]
|
|||
|
Peter Rees
|
Legal Director [B]
|
|||
|
Mark Williams
|
Downstream Director [B]
|
|||
| [A] | Director of the Company. | |
| [B] | Designated an Executive Officer pursuant to US Exchange Act Rule 3b-7. Beneficially owns less than 1% of outstanding classes of securities. | |
| [C] | As announced on February 22, 2012, Malcolm Brinded will be standing down as an Executive Director of the Company with effect from April 1, 2012. Andrew Brown will take over the responsibilities for the Upstream International business as a member of the Executive Committee of the Company with effect from this date. |
Table of Contents
|
82
|
Shell Annual Report and Form 20-F 2011 | ||
| Corporate governance |
| n | Audit Committee; |
| n | Corporate and Social Responsibility Committee; |
| n | Nomination and Succession Committee; and |
| n | Remuneration Committee. |
| n | tax compliance work that is part of assurance process for the audit of the Consolidated or Parent Company Financial Statements or the accounts of subsidiaries; |
| n | regulatory compliance audits; and |
| n | verification of non-financial data for public disclosure. |
Table of Contents
|
Shell Annual Report and Form 20-F 2011
|
83 | ||
|
Corporate governance
|
Table of Contents
|
84
|
Shell Annual Report and Form 20-F 2011 | ||
| Corporate governance |
Table of Contents
|
Shell Annual Report and Form 20-F 2011
|
85 | ||
|
Corporate governance
|
| CONTROL FRAMEWORK | |||
|
|||
Table of Contents
|
86
|
Shell Annual Report and Form 20-F 2011 | ||
| Corporate governance |
| [A] | Copies of the Articles have been previously filed with the SEC and are incorporated by reference as exhibits to this Report. They can be found at www.shell.com. |
| n | a Director may not vote or be counted in the quorum in respect of any matter in which he or she is materially interested including any matter related to his or her own compensation; |
| n | the Directors may exercise the Company’s power to borrow money provided that the borrowings of Shell shall not, without the consent of an ordinary resolution of the Company’s shareholders, exceed two times the Company’s adjusted capital and reserves (these powers relating to borrowing may only be varied by special resolution of shareholders); and |
| n | Directors are not required to hold shares of the Company to qualify as a director. |
Table of Contents
|
Shell Annual Report and Form 20-F 2011
|
87 | ||
|
Corporate governance
|
| [A] | On February 5, 2010, Lloyds TSB Offshore Trust Company Limited (Lloyds TSB Trustee) entered into an agreement with EES Trustee whereby the benefit of certain clients of Lloyds TSB Trustee, including the Trust, would be transferred to EES Trustee with effect from that date. EES Trustee replaced Lloyds TSB Trustee as the Trustee on January 26, 2012. For the period between February 5, 2010, and replacement of Lloyds TSB Trustee, Lloyds TSB Trustee granted EES Trustee a general trustee power of attorney as further described in Clause 2.2 of a Trust and Fund Business Administration Agreement between Lloyds TSB Trustee and EES Trustee. |
Table of Contents
|
88
|
Shell Annual Report and Form 20-F 2011 | ||
| Corporate governance |
Table of Contents
|
Shell Annual Report and Form 20-F 2011
|
89 | ||
|
Corporate governance
|
| [A] | For this purpose “persons” includes companies, natural persons, legal persons and partnerships. |
Table of Contents
|
90
|
Shell Annual Report and Form 20-F 2011 | ||
| Corporate governance |
| n | the terms of reference of the Audit Committee, Corporate and Social Responsibility Committee, Nomination and Succession Committee and Remuneration Committee (these documents explain the Committees’ roles and the authority the Board delegates to them); |
| n | the full list of matters reserved to the Board for decision; |
| n | Shell General Business Principles; |
| n | Shell Code of Conduct; |
| n | Code of Ethics for Executive Directors and Senior Financial Officers; and |
| n | Articles of Association. |
March 14, 2012
Table of Contents
|
Shell Annual Report and Form 20-F 2011
|
91 | ||
|
Additional shareholder information
|
INFORMATION
| [A] | At February 21, 2012, there were outstanding 406,464,194 Class A ADSs and 185,368,142 Class B ADSs representing 22.2% and 13.9% of the respective share capital class, held by 7,584 and 1,017 holders of record with an address in the USA respectively. In addition to holders of ADSs, as at February 21, 2012, there were 62,831 Class A shares and 766,905 Class B shares of €0.07 each representing 0.002% and 0.029% of the respective share capital class, held by 89 and 878 holders of record registered with an address in the USA respectively. |
| LISTING INFORMATION | ||||||||
| Class A shares | Class B shares | |||||||
|
Ticker symbol London
|
RDSA | RDSB | ||||||
|
Ticker symbol Amsterdam
|
RDSA | RDSB | ||||||
|
Ticker symbol New York (ADS [A])
|
RDS.A | RDS.B | ||||||
|
ISIN Code
|
GB00B03MLX29 | GB00B03MM408 | ||||||
|
CUSIP
|
G7690A100 | G7690A118 | ||||||
|
SEDOL Number London
|
B03MLX2 | B03MM40 | ||||||
|
SEDOL Number Euronext
|
B09CBL4 | B09CBN6 | ||||||
|
Weighting on FTSE as at 31/12/11
|
5.98% | 4.57% | ||||||
|
Weighting on AEX as at 31/12/11
|
19.42% | not included | ||||||
| [A] | Each Class A ADS represents two Class A shares of €0.07 each and each Class B ADS represents two Class B shares of €0.07 each. |
| SHARE CAPITAL | ||||||||||
| Issued and fully paid | ||||||||||
| Number | Nominal value | |||||||||
|
Ordinary shares of €0.07 each
|
||||||||||
|
Class A
|
3,668,550,437 | € | 256,798,531 | |||||||
|
Class B
|
2,661,403,172 | € | 186,298,222 | |||||||
|
Sterling deferred shares of £1 each
|
50,000 | £50,000 | ||||||||
| n | upon issuance, Class A shares and Class B shares are fully paid and free from all liens, equities, charges, encumbrances and other interest of the Company and not subject to calls of any kind; |
| n | all Class A shares and Class B shares rank equally for all dividends and distributions on ordinary share capital declared; and |
| n | Class A shares and Class B shares are admitted to the Official List of the UK Listing Authority and to trading on the market for listed securities of the London Stock Exchange. Class A shares and Class B shares are also admitted to trading on Euronext Amsterdam. Class A ADSs and Class B ADSs are listed on the New York Stock Exchange. |
Table of Contents
|
92
|
Shell Annual Report and Form 20-F 2011 | ||
| Additional shareholder information |
| INDIRECT | ||||||||||||||||||||||||||
| Class A shares | Class B shares | Total | ||||||||||||||||||||||||
| Number | % | Number | % | Number | % | |||||||||||||||||||||
|
BlackRock, Inc
|
183,809,399 | 5.01 | 180,281,718 | 6.77 | 364,091,117 | 5.75 | ||||||||||||||||||||
|
Legal & General Group plc
|
116,549,002 | 3.18 | 96,057,492 | 3.61 | 212,606,494 | 3.36 | ||||||||||||||||||||
|
The Capital Group Companies Inc
|
114,728,248 | 3.13 | 257,868,047 | 9.69 | 372,596,295 | 5.89 | ||||||||||||||||||||
| DIRECT | ||||||||||||||||||||||||||
| Class A shares | Class B shares | Total | ||||||||||||||||||||||||
| Number | % | Number | % | Number | % | |||||||||||||||||||||
|
Euroclear Nederland
|
1,815,510,433 | 49.49 | 14,071,113 | 0.53 | 1,829,581,546 | 28.90 | ||||||||||||||||||||
|
BNY (Nominees) Limited
|
676,074,397 | 18.43 | 358,763,284 | 13.48 | 1,034,837,681 | 16.35 | ||||||||||||||||||||
|
Chase Nominees Limited
|
19,565,013 | 0.53 | 179,794,305 | 6.76 | 199,359,318 | 3.15 | ||||||||||||||||||||
|
Chase Nominees Limited (LEND)
|
33,312,708 | 0.91 | 96,878,655 | 3.64 | 130,191,363 | 2.06 | ||||||||||||||||||||
|
State Street Nominees Limited (OM02)
|
88,985,497 | 2.43 | 86,336,647 | 3.24 | 175,322,144 | 2.77 | ||||||||||||||||||||
|
State Street Nominees Limited (OM04)
|
23,837,074 | 0.65 | 106,475,202 | 4.00 | 130,312,276 | 2.06 | ||||||||||||||||||||
|
Lynchwood Nominees Limited (2006420)
|
29,283,827 | 0.80 | 88,263,821 | 3.32 | 117,547,648 | 1.86 | ||||||||||||||||||||
| INVESTOR | ||||||||||||||||||||||||||
| Class A shares | Class B shares | Total | ||||||||||||||||||||||||
| Number | % | Number | % | Number | % | |||||||||||||||||||||
|
Legal & General Group plc
|
110,124,732 | 3.06 | 107,696,428 | 3.99 | 217,821,160 | 3.46 | ||||||||||||||||||||
Table of Contents
|
Shell Annual Report and Form 20-F 2011
|
93 | ||
|
Additional shareholder information
|
| CLASS A AND B SHARES | $ | ||||||||||||||||
| 2011 | 2010 | 2009 | 2008 | 2007 | |||||||||||||
|
Q1
|
0.42 | 0.42 | 0.42 | 0.40 | 0.36 | ||||||||||||
|
Q2
|
0.42 | 0.42 | 0.42 | 0.40 | 0.36 | ||||||||||||
|
Q3
|
0.42 | 0.42 | 0.42 | 0.40 | 0.36 | ||||||||||||
|
Q4
|
0.42 | 0.42 | 0.42 | 0.40 | 0.36 | ||||||||||||
|
Total
|
1.68 | 1.68 | 1.68 | 1.60 | 1.44 | ||||||||||||
| CLASS A SHARES | € [A] | ||||||||||||||||
| 2011 | 2010 | 2009 | 2008 | 2007 | |||||||||||||
|
Q1
|
0.29 | 0.32 | 0.32 | 0.26 | 0.26 | ||||||||||||
|
Q2
|
0.29 | 0.32 | 0.30 | 0.26 | 0.26 | ||||||||||||
|
Q3
|
0.32 | 0.31 | 0.28 | 0.31 | 0.25 | ||||||||||||
|
Q4
|
0.32 | 0.30 | 0.30 | 0.30 | 0.24 | ||||||||||||
|
Total announced in respect of the year
|
1.22 | 1.25 | 1.21 | 1.13 | 1.02 | ||||||||||||
|
Amount paid during the year
|
1.20 | 1.25 | 1.21 | 1.07 | 1.03 | ||||||||||||
| [A] | Euro equivalent, rounded to the nearest euro cent. |
| CLASS B SHARES | PENCE [A] | ||||||||||||||||
| 2011 | 2010 | 2009 | 2008 | 2007 | |||||||||||||
|
Q1
|
25.71 | 27.37 | 28.65 | 20.05 | 18.09 | ||||||||||||
|
Q2
|
25.77 | 26.89 | 25.59 | 20.21 | 17.56 | ||||||||||||
|
Q3
|
27.11 | 26.72 | 25.65 | 24.54 | 17.59 | ||||||||||||
|
Q4
|
26.74 | 25.82 | 26.36 | 27.97 | 18.11 | ||||||||||||
|
Total announced in respect of the year
|
105.33 | 106.80 | 106.25 | 92.77 | 71.35 | ||||||||||||
|
Amount paid during the year
|
104.41 | 107.34 | 107.86 | 82.91 | 69.84 | ||||||||||||
| [A] | Sterling equivalent. |
| CLASS A AND B ADSs | $ | ||||||||||||||||
| 2011 | 2010 | 2009 | 2008 | 2007 | |||||||||||||
|
Q1
|
0.84 | 0.84 | 0.84 | 0.80 | 0.72 | ||||||||||||
|
Q2
|
0.84 | 0.84 | 0.84 | 0.80 | 0.72 | ||||||||||||
|
Q3
|
0.84 | 0.84 | 0.84 | 0.80 | 0.72 | ||||||||||||
|
Q4
|
0.84 | 0.84 | 0.84 | 0.80 | 0.72 | ||||||||||||
|
Total announced in respect of the year
|
3.36 | 3.36 | 3.36 | 3.20 | 2.88 | ||||||||||||
|
Amount paid during the year
|
3.36 | 3.36 | 3.32 | 3.12 | 2.81 | ||||||||||||
Table of Contents
|
94
|
Shell Annual Report and Form 20-F 2011 | ||
| Additional shareholder information |
registered ordinary shares:
| n | of €0.07 nominal value on the London Stock Exchange; |
| n | of €0.07 nominal value on Euronext Amsterdam; and |
| n |
in the form of ADSs on the New York Stock Exchange (ADSs do not
have a
nominal value). |
| ANNUAL SHARE PRICES | ||||||||||||||||||||||||||
|
Euronext Amsterdam
Class A shares |
New York Stock Exchange
Class A ADSs |
|||||||||||||||||||||||||
|
High
€ |
Low
€ |
Year-end
€ |
High
$ |
Low
$ |
Year-end
$ |
|||||||||||||||||||||
|
2007
|
31.35 | 23.72 | 28.75 | 88.31 | 62.71 | 84.20 | ||||||||||||||||||||
|
2008
|
29.63 | 16.25 | 18.75 | 88.73 | 41.62 | 52.94 | ||||||||||||||||||||
|
2009
|
21.46 | 15.27 | 21.10 | 63.75 | 38.29 | 60.11 | ||||||||||||||||||||
|
2010
|
25.28 | 19.53 | 24.73 | 68.54 | 49.16 | 66.78 | ||||||||||||||||||||
|
2011
|
28.40 | 20.12 | 28.15 | 77.96 | 57.97 | 73.09 | ||||||||||||||||||||
|
London Stock Exchange
Class B shares |
New York Stock Exchange
Class B ADSs |
|||||||||||||||||||||||||
|
High
pence |
Low
pence |
Year-end
pence |
High
$ |
Low
$ |
Year-end
$ |
|||||||||||||||||||||
|
2007
|
2,173 | 1,600 | 2,090 | 87.94 | 62.20 | 83.00 | ||||||||||||||||||||
|
2008
|
2,245 | 1,223 | 1,726 | 87.54 | 41.41 | 51.43 | ||||||||||||||||||||
|
2009
|
1,897 | 1,315 | 1,812 | 62.26 | 37.16 | 58.13 | ||||||||||||||||||||
|
2010
|
2,149 | 1,550 | 2,115 | 68.32 | 47.12 | 66.67 | ||||||||||||||||||||
|
2011
|
2,476 | 1,768 | 2,454 | 78.75 | 58.42 | 76.01 | ||||||||||||||||||||
| QUARTERLY SHARE PRICES | ||||||||||||||||||||||||||||||||||
|
Euronext
Amsterdam Class A shares |
London
Stock Exchange Class B shares |
New York
Stock Exchange Class A ADSs |
New York
Stock Exchange Class B ADSs |
|||||||||||||||||||||||||||||||
|
High
€ |
Low
€ |
High
pence |
Low
pence |
High
$ |
Low
$ |
High
$ |
Low
$ |
|||||||||||||||||||||||||||
|
2010
|
||||||||||||||||||||||||||||||||||
|
Q1
|
22.06 | 19.53 | 1,887 | 1,632 | 62.69 | 53.23 | 60.71 | 51.32 | ||||||||||||||||||||||||||
|
Q2
|
23.84 | 20.01 | 1,998 | 1,615 | 63.10 | 49.99 | 61.10 | 48.17 | ||||||||||||||||||||||||||
|
Q3
|
22.77 | 19.73 | 1,892 | 1,550 | 61.57 | 49.16 | 59.82 | 47.12 | ||||||||||||||||||||||||||
|
Q4
|
25.28 | 22.09 | 2,149 | 1,855 | 68.54 | 60.02 | 68.32 | 59.07 | ||||||||||||||||||||||||||
|
2011
|
||||||||||||||||||||||||||||||||||
|
Q1
|
26.74 | 23.80 | 2,289 | 1,772 | 73.84 | 65.30 | 73.87 | 65.00 | ||||||||||||||||||||||||||
|
Q2
|
26.37 | 23.49 | 2,352 | 2,000 | 77.96 | 66.90 | 78.75 | 67.36 | ||||||||||||||||||||||||||
|
Q3
|
26.04 | 20.12 | 2,323 | 1,768 | 75.56 | 59.85 | 76.13 | 60.05 | ||||||||||||||||||||||||||
|
Q4
|
28.40 | 21.97 | 2,476 | 1,900 | 73.50 | 57.97 | 76.51 | 58.42 | ||||||||||||||||||||||||||
| MONTHLY SHARE PRICES | ||||||||||||||||||||||||||||||||||
|
Euronext
Amsterdam Class A shares |
London
Stock Exchange Class B shares |
New York
Stock Exchange Class A ADSs |
New York
Stock Exchange Class B ADSs |
|||||||||||||||||||||||||||||||
|
High
€ |
Low
€ |
High
pence |
Low
pence |
High
$ |
Low
$ |
High
$ |
Low
$ |
|||||||||||||||||||||||||||
|
2011
|
||||||||||||||||||||||||||||||||||
|
September
|
24.29 | 21.97 | 2,145 | 1,942 | 67.77 | 60.04 | 68.22 | 61.00 | ||||||||||||||||||||||||||
|
October
|
26.37 | 21.97 | 2,371 | 1,900 | 72.78 | 57.97 | 74.38 | 58.42 | ||||||||||||||||||||||||||
|
November
|
26.12 | 23.96 | 2,326 | 2,126 | 72.03 | 64.73 | 73.87 | 67.27 | ||||||||||||||||||||||||||
|
December
|
28.40 | 25.70 | 2,476 | 2,265 | 73.50 | 69.13 | 76.51 | 71.07 | ||||||||||||||||||||||||||
|
2012
|
||||||||||||||||||||||||||||||||||
|
January
|
29.18 | 26.46 | 2,499 | 2,281 | 74.51 | 68.36 | 77.52 | 71.04 | ||||||||||||||||||||||||||
|
February
|
27.88 | 26.67 | 2,485 | 2,261 | 74.09 | 71.00 | 75.08 | 72.08 | ||||||||||||||||||||||||||
Table of Contents
|
Shell Annual Report and Form 20-F 2011
|
95 | ||
|
Additional shareholder information
|
| n | directly as registered shares either in uncertificated form or in certificated form in a shareholder’s own name; |
| n | indirectly through Euroclear Nederland (in respect of which the Dutch Securities Giro Act (“Wet giraal effectenverkeer”) is applicable); |
| n | through the Royal Dutch Shell Corporate Nominee; and |
| n | as a direct or indirect holder of either a Class A ADS or a Class B ADS with the Depositary. |
Table of Contents
|
96
|
Shell Annual Report and Form 20-F 2011 | ||
| Additional shareholder information |
| PERSONS DEPOSITING OR WITHDRAWING SHARES MUST PAY: | FOR: | |
| $5.00 or less per 100 ADSs (or portion of 100 ADSs) | Issuance of ADSs, including those resulting from a distribution of shares, rights or other property; | |
| Cancellation of ADSs for the purpose of their withdrawal, including if the deposit agreement terminates; | ||
| Distribution of securities to holders of deposited securities by the Depositary to ADS registered holders. | ||
| Registration and transfer fees | Registration and transfer of shares on the share register to or from the name of the Depositary or its agent when they deposit or withdraw shares. | |
| Expenses of the Depositary | Cable, telex and facsimile transmissions (when expressly provided in the deposit agreement); | |
| Converting foreign currency to US dollars. | ||
| Taxes and other governmental charges the Depositary or the custodian has to pay on any ADS or share underlying an ADS, for example, share transfer taxes, stamp duty or withholding taxes | As necessary. | |
| n | if the US holder is an exempt pension trust as described in article 35 of the Convention, or an exempt organisation as described in article 36 thereof, the US holder will be exempt from Dutch withholding tax; or |
| n | if the US holder is a company that holds directly at least 10% of the voting power in the Company, the US holder will be subject to Dutch withholding tax at a rate not exceeding 5%. |
Table of Contents
|
Shell Annual Report and Form 20-F 2011
|
97 | ||
|
Additional shareholder information
|
| £ | ||||||||
| March 31, 1982 | July 20, 2005 | |||||||
| Royal Dutch Petroleum Company | ||||||||
| (N.V. Koninklijke Nederlandsche Petroleum Maatschappij) which ceased to exist on December 21, 2005 | 1.1349 | 17.6625 | ||||||
| The “Shell” Transport and Trading Company, p.l.c. | ||||||||
| which delisted on July 19, 2005 | 1.4502 | Not applicable | ||||||
| [A] | Restated where applicable to reflect all capitalisation issues since the relevant date. This includes the change in the capital structure in 2005, when Royal Dutch Shell plc became the single parent company of Royal Dutch Petroleum Company and of The “Shell” Transport and Trading Company, p.l.c., now The Shell Transport and Trading Company Limited, and one share in Royal Dutch Petroleum Company was exchanged for two Royal Dutch Shell plc Class A shares and one share in The “Shell” Transport and Trading Company, p.l.c. was exchanged for 0.287333066 Royal Dutch Shell plc Class B shares. |
| FINANCIAL CALENDAR | |||||
| Financial year ends | December 31, 2011 | ||||
|
Announcements
|
|||||
|
Full year results for 2011
|
February 2, 2012 | ||||
|
First quarter results for 2012
|
April 26, 2012 | ||||
|
Second quarter results for 2012
|
July 26, 2012 | ||||
|
Third quarter results for 2012
|
November 1, 2012 | ||||
|
Dividend timetable
[A]
|
|||||
|
2011 Fourth quarter interim [B]
|
|||||
|
Announced
|
February 2, 2012 | ||||
|
Ex-dividend date
|
February 15, 2012 | ||||
|
Record date
|
February 17, 2012 | ||||
|
Scrip reference share price announcement date
|
February 22, 2012 | ||||
|
Closing date for scrip election and currency election [C]
|
March 2, 2012 | ||||
|
Euro and sterling equivalents announcement date
|
March 9, 2012 | ||||
|
Payment date
|
March 22, 2012 | ||||
|
2012 First quarter interim
|
|||||
|
Announced
|
April 26, 2012 | ||||
|
Ex-dividend date
|
May 9, 2012 | ||||
|
Record date
|
May 11, 2012 | ||||
|
Scrip reference share price announcement date
|
May 16, 2012 | ||||
|
Closing date for scrip election and currency election [C]
|
May 25, 2012 | ||||
|
Euro and sterling equivalents announcement date
|
June 1, 2012 | ||||
|
Payment date
|
June 21, 2012 | ||||
|
2012 Second quarter interim
|
|||||
|
Announced
|
July 26, 2012 | ||||
|
Ex-dividend date
|
August 8, 2012 | ||||
|
Record date
|
August 10, 2012 | ||||
|
Scrip reference share price announcement date
|
August 15, 2012 | ||||
|
Closing date for scrip election and currency election [C]
|
August 24, 2012 | ||||
|
Euro and sterling equivalents announcement date
|
September 3, 2012 | ||||
|
Payment date
|
September 20, 2012 | ||||
|
2012 Third quarter interim
|
|||||
|
Announced
|
November 1, 2012 | ||||
|
Ex-dividend date
|
November 14, 2012 | ||||
|
Record date
|
November 16, 2012 | ||||
|
Scrip reference share price announcement date
|
November 21, 2012 | ||||
|
Closing date for scrip election and currency election [C]
|
November 30, 2012 | ||||
|
Euro and sterling equivalents announcement date
|
December 7, 2012 | ||||
|
Payment date
|
December 20, 2012 | ||||
|
Annual General Meeting
|
May 22, 2012 | ||||
| [A] | This timetable is the intended timetable as announced on October 27, 2011. | |
| [B] | The Directors do not propose to recommend any further distribution in respect of 2011. | |
| [C] | Different scrip and dividend currency election dates may apply to shareholders holding shares in a securities account with a bank or other financial institution ultimately holding through Euroclear Nederland. Such shareholders can obtain the applicable deadlines from their broker, financial intermediary, bank or other financial institution where they hold their securities account. A different scrip election date may also apply to registered and non-registered ADS holders. Registered ADS holders can contact The Bank of New York Mellon for the applicable deadline. Non-registered ADS holders can contact their broker, financial intermediary, bank or other financial institution for the applicable election deadline. |
Table of Contents
|
98
|
Shell Annual Report and Form 20-F 2011 | ||
| Report on the Annual Report and Accounts |
| n | give a true and fair view of the state of Shell’s affairs as at December 31, 2011, and of its income and cash flows for the year then ended; |
| n | have been properly prepared in accordance with IFRSs as adopted by the European Union; and |
| n | have been prepared in accordance with the requirements of the Companies Act 2006 and Article 4 of the IAS Regulation. |
| n | the information given in the Report of the Directors for the financial year for which the Consolidated Financial Statements are prepared is consistent with the Consolidated Financial Statements. |
| n | certain disclosures of Directors’ remuneration specified by law are not made; or |
| n | we have not received all the information and explanations we require for our audit. |
| n | the Directors’ statement, set out on page 84, in relation to going concern; |
| n | the part of the Corporate Governance Statement relating to the Company’s compliance with the nine provisions of the UK Corporate Governance Code specified for our review; and |
| n | certain elements of the report to shareholders by the Board on Directors’ remuneration. |
| n | The report set out above is included for the purposes of Royal Dutch Shell plc’s Annual Report and Accounts for 2011 only and does not form part of Royal Dutch Shell plc’s Annual Report on Form 20-F for 2011. |
| n | The maintenance and integrity of the Royal Dutch Shell plc website (www.shell.com) are the responsibility of the Directors; the work carried out by the auditors does not involve consideration of these matters and, accordingly, the auditors accept no responsibility for any changes that may have occurred to the Consolidated Financial Statements since they were initially presented on the website. |
| n | Legislation in the United Kingdom governing the preparation and dissemination of financial statements may differ from legislation in other jurisdictions. |
Table of Contents
|
Shell Annual Report and Form 20-F 2011
|
99 | ||
|
Report on the Annual Report on
Form 20-F
|
|
100
|
Shell Annual Report and Form 20-F 2011 | ||
| Consolidated Financial Statements |
Table of Contents
|
Shell Annual Report and Form 20-F 2011
|
101 | ||
|
Consolidated Financial Statements
|
|
|
$ MILLION | |||||||||||||||||
| NOTES | 2011 | 2010 | 2009 | |||||||||||||||
|
Revenue
|
470,171 | 368,056 | 278,188 | |||||||||||||||
|
Share of profit of equity-accounted investments
|
10 | 8,737 | 5,953 | 4,976 | ||||||||||||||
|
Interest and other income
|
6 | 5,581 | 4,143 | 1,965 | ||||||||||||||
|
Total revenue and other income
|
484,489 | 378,152 | 285,129 | |||||||||||||||
|
Purchases
|
370,044 | 283,176 | 203,075 | |||||||||||||||
|
Production and manufacturing expenses
|
26,458 | 24,458 | 25,301 | |||||||||||||||
|
Selling, distribution and administrative expenses
|
14,335 | 15,528 | 17,430 | |||||||||||||||
|
Research and development
|
1,125 | 1,019 | 1,125 | |||||||||||||||
|
Exploration
|
2,266 | 2,036 | 2,178 | |||||||||||||||
|
Depreciation, depletion and amortisation
|
13,228 | 15,595 | 14,458 | |||||||||||||||
|
Interest expense
|
7 | 1,373 | 996 | 542 | ||||||||||||||
|
Income before taxation
|
55,660 | 35,344 | 21,020 | |||||||||||||||
|
Taxation
|
17 | 24,475 | 14,870 | 8,302 | ||||||||||||||
|
Income for the period
|
4 | 31,185 | 20,474 | 12,718 | ||||||||||||||
|
Income attributable to non-controlling interest
|
267 | 347 | 200 | |||||||||||||||
|
Income attributable to Royal Dutch Shell plc shareholders
|
30,918 | 20,127 | 12,518 | |||||||||||||||
| EARNINGS PER SHARE | $ | |||||||||||||||||
| NOTES | 2011 | 2010 | 2009 | |||||||||||||||
|
Basic earnings per share
|
27 | 4.98 | 3.28 | 2.04 | ||||||||||||||
|
Diluted earnings per share
|
27 | 4.97 | 3.28 | 2.04 | ||||||||||||||
| CONSOLIDATED STATEMENT OF COMPREHENSIVE INCOME | $ MILLION | |||||||||||||||||
| NOTES | 2011 | 2010 | 2009 | |||||||||||||||
|
Income for the period
|
31,185 | 20,474 | 12,718 | |||||||||||||||
|
Other comprehensive income, net of tax:
|
23 | |||||||||||||||||
|
Currency translation differences
|
(3,328 | ) | (142 | ) | 6,490 | |||||||||||||
|
Unrealised gains/(losses) on securities
|
1,684 | (298 | ) | (143 | ) | |||||||||||||
|
Cash flow hedging (losses)/gains
|
(222 | ) | (2 | ) | 324 | |||||||||||||
|
Share of other comprehensive income of equity-accounted
investments
|
60 | 488 | 4 | |||||||||||||||
|
Other comprehensive (loss)/income for the period
|
(1,806 | ) | 46 | 6,675 | ||||||||||||||
|
Comprehensive income for the period
|
29,379 | 20,520 | 19,393 | |||||||||||||||
|
Comprehensive income attributable to non-controlling interest
|
(348 | ) | 389 | 252 | ||||||||||||||
|
Comprehensive income attributable to Royal Dutch Shell plc
shareholders
|
29,727 | 20,131 | 19,141 | |||||||||||||||
Table of Contents
|
102
|
Shell Annual Report and Form 20-F 2011 | ||
| Consolidated Financial Statements |
| CONSOLIDATED BALANCE SHEET | $ MILLION | |||||||||||||
| NOTES | Dec 31, 2011 | Dec 31, 2010 | ||||||||||||
|
Assets
|
||||||||||||||
|
Non-current assets
|
||||||||||||||
|
Intangible assets
|
8 | 4,521 | 5,039 | |||||||||||
|
Property, plant and equipment
|
9 | 152,081 | 142,705 | |||||||||||
|
Equity-accounted investments
|
10 | 37,990 | 33,414 | |||||||||||
|
Investments in securities
|
11 | 5,492 | 3,809 | |||||||||||
|
Deferred tax
|
17 | 4,732 | 5,361 | |||||||||||
|
Prepaid pension costs
|
18 | 11,408 | 10,368 | |||||||||||
|
Trade and other receivables
|
12 | 9,256 | 8,970 | |||||||||||
| 225,480 | 209,666 | |||||||||||||
|
Current assets
|
||||||||||||||
|
Inventories
|
13 | 28,976 | 29,348 | |||||||||||
|
Trade and other receivables
|
12 | 79,509 | 70,102 | |||||||||||
|
Cash and cash equivalents
|
14 | 11,292 | 13,444 | |||||||||||
| 119,777 | 112,894 | |||||||||||||
|
Total assets
|
345,257 | 322,560 | ||||||||||||
|
Liabilities
|
||||||||||||||
|
Non-current liabilities
|
||||||||||||||
|
Debt
|
15 | 30,463 | 34,381 | |||||||||||
|
Trade and other payables
|
16 | 4,921 | 4,250 | |||||||||||
|
Deferred tax
|
17 | 14,649 | 13,388 | |||||||||||
|
Retirement benefit obligations
|
18 | 5,931 | 5,924 | |||||||||||
|
Decommissioning and other provisions
|
19 | 15,631 | 14,285 | |||||||||||
| 71,595 | 72,228 | |||||||||||||
|
Current liabilities
|
||||||||||||||
|
Debt
|
15 | 6,712 | 9,951 | |||||||||||
|
Trade and other payables
|
16 | 81,846 | 76,550 | |||||||||||
|
Taxes payable
|
17 | 10,606 | 10,306 | |||||||||||
|
Retirement benefit obligations
|
18 | 387 | 377 | |||||||||||
|
Decommissioning and other provisions
|
19 | 3,108 | 3,368 | |||||||||||
| 102,659 | 100,552 | |||||||||||||
|
Total liabilities
|
174,254 | 172,780 | ||||||||||||
|
Equity
|
||||||||||||||
|
Share capital
|
20 | 536 | 529 | |||||||||||
|
Shares held in trust
|
22 | (2,990 | ) | (2,789 | ) | |||||||||
|
Other reserves
|
23 | 8,984 | 10,094 | |||||||||||
|
Retained earnings
|
162,987 | 140,179 | ||||||||||||
|
Equity attributable to Royal Dutch Shell plc shareholders
|
169,517 | 148,013 | ||||||||||||
|
Non-controlling interest
|
1,486 | 1,767 | ||||||||||||
|
Total equity
|
171,003 | 149,780 | ||||||||||||
|
Total liabilities and equity
|
345,257 | 322,560 | ||||||||||||
March 14, 2012
Table of Contents
|
Shell Annual Report and Form 20-F 2011
|
103 | ||
|
Consolidated Financial Statements
|
| CONSOLIDATED STATEMENT OF CHANGES IN EQUITY | $ MILLION | |||||||||||||||||||||||||||||
| Equity attributable to Royal Dutch Shell plc shareholders | ||||||||||||||||||||||||||||||
|
Share
capital (see Note 20) |
Shares
held in trust (see Note 22 |
) |
Other
reserves (see Note 23 |
) |
Retained
earnings |
Total |
Non-
controlling interest |
Total
equity |
||||||||||||||||||||||
|
At January 1, 2011
|
529 | (2,789 | ) | 10,094 | 140,179 | 148,013 | 1,767 | 149,780 | ||||||||||||||||||||||
|
Comprehensive income for the period
|
– | – | (1,191 | ) | 30,918 | 29,727 | (348 | ) | 29,379 | |||||||||||||||||||||
|
Capital contributions from, and other changes in,
non-controlling interest
|
– | – | – | 41 | 41 | 505 | 546 | |||||||||||||||||||||||
|
Dividends paid (see Note 24)
|
– | – | – | (10,457 | ) | (10,457 | ) | (438 | ) | (10,895 | ) | |||||||||||||||||||
|
Scrip dividends (see Note 24)
|
10 | – | (10 | ) | 3,580 | 3,580 | – | 3,580 | ||||||||||||||||||||||
|
Repurchases of shares
|
(3 | ) | – | 3 | (1,106 | ) | (1,106 | ) | – | (1,106 | ) | |||||||||||||||||||
|
Shares held in trust: net (purchases)/sales and dividends
received
|
– | (201 | ) | – | 142 | (59 | ) | – | (59 | ) | ||||||||||||||||||||
|
Share-based compensation
|
– | – | 88 | (310 | ) | (222 | ) | – | (222 | ) | ||||||||||||||||||||
|
At December 31, 2011
|
536 | (2,990 | ) | 8,984 | 162,987 | 169,517 | 1,486 | 171,003 | ||||||||||||||||||||||
|
At January 1, 2010
|
527 | (1,711 | ) | 9,982 | 127,633 | 136,431 | 1,704 | 138,135 | ||||||||||||||||||||||
|
Comprehensive income for the period
|
– | – | 4 | 20,127 | 20,131 | 389 | 20,520 | |||||||||||||||||||||||
|
Capital contributions from, and other changes in,
non-controlling interest
|
– | – | – | 283 | 283 | 69 | 352 | |||||||||||||||||||||||
|
Dividends paid (see Note 24)
|
– | – | – | (10,196 | ) | (10,196 | ) | (395 | ) | (10,591 | ) | |||||||||||||||||||
|
Scrip dividends (see Note 24)
|
2 | – | (2 | ) | 612 | 612 | – | 612 | ||||||||||||||||||||||
|
Shares held in trust: net sales and dividends received
|
– | (1,078 | ) | – | 1,521 | 443 | – | 443 | ||||||||||||||||||||||
|
Share-based compensation
|
– | – | 110 | 199 | 309 | – | 309 | |||||||||||||||||||||||
|
At December 31, 2010
|
529 | (2,789 | ) | 10,094 | 140,179 | 148,013 | 1,767 | 149,780 | ||||||||||||||||||||||
|
At January 1, 2009
|
527 | (1,867 | ) | 3,178 | 125,447 | 127,285 | 1,581 | 128,866 | ||||||||||||||||||||||
|
Comprehensive income for the period
|
– | – | 6,623 | 12,518 | 19,141 | 252 | 19,393 | |||||||||||||||||||||||
|
Capital contributions from, and other changes in,
non-controlling interest
|
– | – | – | 3 | 3 | 62 | 65 | |||||||||||||||||||||||
|
Dividends paid (see Note 24)
|
– | – | – | (10,526 | ) | (10,526 | ) | (191 | ) | (10,717 | ) | |||||||||||||||||||
|
Shares held in trust: net sales and dividends received
|
– | 156 | – | – | 156 | – | 156 | |||||||||||||||||||||||
|
Share-based compensation
|
– | – | 181 | 191 | 372 | – | 372 | |||||||||||||||||||||||
|
At December 31, 2009
|
527 | (1,711 | ) | 9,982 | 127,633 | 136,431 | 1,704 | 138,135 | ||||||||||||||||||||||
Table of Contents
|
104
|
Shell Annual Report and Form 20-F 2011 | ||
| Consolidated Financial Statements |
| CONSOLIDATED STATEMENT OF CASH FLOWS | $ MILLION | |||||||||||||
| 2011 | 2010 | 2009 | ||||||||||||
|
Cash flow from operating activities
|
||||||||||||||
|
Income for the period
|
31,185 | 20,474 | 12,718 | |||||||||||
|
Adjustment for:
|
||||||||||||||
|
Current taxation
|
23,009 | 16,384 | 9,297 | |||||||||||
|
Interest expense (net)
|
1,164 | 842 | 1,247 | |||||||||||
|
Depreciation, depletion and amortisation
|
13,228 | 15,595 | 14,458 | |||||||||||
|
Net gains on sale of assets
|
(4,485 | ) | (3,276 | ) | (781 | ) | ||||||||
|
(Increase) in inventories
|
(1,930 | ) | (2,888 | ) | (7,138 | ) | ||||||||
|
(Increase)/decrease in accounts receivable
|
(10,109 | ) | (11,931 | ) | 23,679 | |||||||||
|
Increase/(decrease) in accounts payable and accrued liabilities
|
5,568 | 8,890 | (18,872 | ) | ||||||||||
|
Share of profit of equity-accounted investments
|
(8,737 | ) | (5,953 | ) | (4,976 | ) | ||||||||
|
Dividends received from equity-accounted investments
|
9,681 | 6,519 | 4,903 | |||||||||||
|
Deferred taxation and decommissioning and other provisions
|
1,768 | (1,934 | ) | (1,925 | ) | |||||||||
|
Other
|
(949 | ) | (10 | ) | (1,879 | ) | ||||||||
|
Net cash from operating activities (pre-tax)
|
59,393 | 42,712 | 30,731 | |||||||||||
|
Taxation paid
|
(22,622 | ) | (15,362 | ) | (9,243 | ) | ||||||||
|
Net cash from operating activities
|
36,771 | 27,350 | 21,488 | |||||||||||
|
Cash flow from investing activities
|
||||||||||||||
|
Capital expenditure
|
(26,301 | ) | (26,940 | ) | (26,516 | ) | ||||||||
|
Investments in equity-accounted investments
|
(1,886 | ) | (2,050 | ) | (2,955 | ) | ||||||||
|
Proceeds from sale of assets
|
6,990 | 3,325 | 1,325 | |||||||||||
|
Proceeds from sale of equity-accounted investments
|
468 | 3,591 | 1,633 | |||||||||||
|
Proceeds from sale/(purchases) of securities (net)
|
90 | (34 | ) | (105 | ) | |||||||||
|
Interest received
|
196 | 136 | 384 | |||||||||||
|
Net cash used in investing activities
|
(20,443 | ) | (21,972 | ) | (26,234 | ) | ||||||||
|
Cash flow from financing activities
|
||||||||||||||
|
Net (decrease)/increase in debt with maturity period within
three months
|
(3,724 | ) | 4,647 | (6,507 | ) | |||||||||
|
Other debt:
|
||||||||||||||
|
New borrowings
|
1,249 | 7,849 | 19,742 | |||||||||||
|
Repayments
|
(4,649 | ) | (3,240 | ) | (2,534 | ) | ||||||||
|
Interest paid
|
(1,665 | ) | (1,312 | ) | (902 | ) | ||||||||
|
Change in non-controlling interest
|
8 | 381 | 62 | |||||||||||
|
Cash dividends paid to:
|
||||||||||||||
|
Royal Dutch Shell plc shareholders
|
(6,877 | ) | (9,584 | ) | (10,526 | ) | ||||||||
|
Non-controlling interest
|
(438 | ) | (395 | ) | (191 | ) | ||||||||
|
Repurchases of shares
|
(1,106 | ) | – | – | ||||||||||
|
Shares held in trust: net (purchases)/sales and dividends
received
|
(929 | ) | 187 | 27 | ||||||||||
|
Net cash used in financing activities
|
(18,131 | ) | (1,467 | ) | (829 | ) | ||||||||
|
Currency translation differences relating to cash and cash
equivalents
|
(349 | ) | (186 | ) | 106 | |||||||||
|
(Decrease)/increase in cash and cash equivalents
|
(2,152 | ) | 3,725 | (5,469 | ) | |||||||||
|
Cash and cash equivalents at January 1
|
13,444 | 9,719 | 15,188 | |||||||||||
|
Cash and cash equivalents at December 31
|
11,292 | 13,444 | 9,719 | |||||||||||
Table of Contents
|
Shell Annual Report and Form 20-F 2011
|
105 | ||
|
Consolidated Financial Statements > Notes to the
Consolidated Financial Statements
|
Table of Contents
|
106
|
Shell Annual Report and Form 20-F 2011 | ||
| Consolidated Financial Statements > Notes to the Consolidated Financial Statements |
| Asset type | Useful life | ||||
|
Upgraders
|
30 years | ||||
|
Refineries and chemical plants
|
20 years | ||||
|
Retail service stations
|
15 years | ||||
|
Property, plant and equipment held under finance leases
|
lease term | ||||
|
Software
|
5 years | ||||
|
Trademarks
|
40 years | ||||
Table of Contents
|
Shell Annual Report and Form 20-F 2011
|
107 | ||
|
Consolidated Financial Statements > Notes to the
Consolidated Financial Statements
|
Table of Contents
|
108
|
Shell Annual Report and Form 20-F 2011 | ||
| Consolidated Financial Statements > Notes to the Consolidated Financial Statements |
Table of Contents
|
Shell Annual Report and Form 20-F 2011
|
109 | ||
|
Consolidated Financial Statements > Notes to the
Consolidated Financial Statements
|
Table of Contents
|
110
|
Shell Annual Report and Form 20-F 2011 | ||
| Consolidated Financial Statements > Notes to the Consolidated Financial Statements |
Table of Contents
|
Shell Annual Report and Form 20-F 2011
|
111 | ||
|
Consolidated Financial Statements > Notes to the
Consolidated Financial Statements
|
| n | rates of increase in pensionable salaries: historical outturns and management’s long-term expectation; |
| n | mortality rates: the latest available standard mortality tables for the individual countries concerned. The assumptions for each country are reviewed each year and are adjusted where necessary to reflect changes in fund experience and actuarial recommendations; |
| n | discount rates used to convert future cash flows to current values: prevailing long-term AA corporate bond yields, which can be volatile, chosen to match the duration of the relevant obligations; and |
| n | expected rates of return on plan assets: a projection of real long-term bond yields and an equity risk premium, which are combined with local inflation assumptions and applied to the actual asset mix of each plan. The amount of the expected return on plan assets is calculated using the expected rate of return for the year and the fair value of assets at the beginning of the year. |
Table of Contents
|
112
|
Shell Annual Report and Form 20-F 2011 | ||
| Consolidated Financial Statements > Notes to the Consolidated Financial Statements |
| 2011 | $ MILLION | |||||||||||||||||
| Upstream | Downstream | Corporate | Total | |||||||||||||||
|
Revenue and other income
|
||||||||||||||||||
|
Revenue
|
||||||||||||||||||
|
Third party
|
42,260 | 427,864 | 47 | 470,171 | ||||||||||||||
|
Inter-segment
|
49,431 | 782 | – | |||||||||||||||
|
Share of profit/(loss) of equity-accounted investments
|
7,127 | 1,896 | (286 | ) | 8,737 | |||||||||||||
|
Interest and other income
|
4,150 | 1,106 | 325 | 5,581 | ||||||||||||||
|
Total
|
484,489 | |||||||||||||||||
|
Earnings on a current cost of supplies basis
|
24,455 | 4,289 | 86 | 28,830 | ||||||||||||||
|
Other items
|
||||||||||||||||||
|
Depreciation, depletion and amortisation charge of which:
|
8,827 | 4,251 | 150 | 13,228 | ||||||||||||||
|
Impairment losses
|
325 | 1,194 | – | 1,519 | ||||||||||||||
|
Impairment reversals
|
– | 4 | – | 4 | ||||||||||||||
|
Interest expense
|
756 | 83 | 534 | 1,373 | ||||||||||||||
|
Taxation charge/(credit)
|
23,994 | 1,632 | (1,151 | ) | 24,475 | |||||||||||||
| 2010 | $ MILLION | |||||||||||||||||
| Upstream | Downstream | Corporate | Total | |||||||||||||||
|
Revenue and other income
|
||||||||||||||||||
|
Revenue
|
||||||||||||||||||
|
Third party
|
32,395 | 335,604 | 57 | 368,056 | ||||||||||||||
|
Inter-segment
|
35,803 | 612 | – | |||||||||||||||
|
Share of profit/(loss) of equity-accounted investments
|
4,900 | 1,167 | (114 | ) | 5,953 | |||||||||||||
|
Interest and other income
|
3,616 | 418 | 109 | 4,143 | ||||||||||||||
|
Total
|
378,152 | |||||||||||||||||
|
Earnings on a current cost of supplies basis
|
15,935 | 2,950 | 91 | 18,976 | ||||||||||||||
|
Other items
|
||||||||||||||||||
|
Depreciation, depletion and amortisation charge of which:
|
11,144 | 4,254 | 197 | 15,595 | ||||||||||||||
|
Impairment losses
|
1,724 | 1,192 | 39 | 2,955 | ||||||||||||||
|
Impairment reversals
|
40 | 8 | – | 48 | ||||||||||||||
|
Interest expense
|
663 | 84 | 249 | 996 | ||||||||||||||
|
Taxation charge/(credit)
|
14,822 | 998 | (950 | ) | 14,870 | |||||||||||||
Table of Contents
|
Shell Annual Report and Form 20-F 2011
|
113 | ||
|
Consolidated Financial Statements > Notes to the
Consolidated Financial Statements
|
| 2009 | $ MILLION | |||||||||||||||||
| Upstream | Downstream | Corporate | Total | |||||||||||||||
|
Revenue and other income
|
||||||||||||||||||
|
Revenue
|
||||||||||||||||||
|
Third party
|
27,996 | 250,104 | 88 | 278,188 | ||||||||||||||
|
Inter-segment
|
27,144 | 258 | – | |||||||||||||||
|
Share of profit of equity-accounted investments
|
3,852 | 1,110 | 14 | 4,976 | ||||||||||||||
|
Interest and other income
|
652 | 480 | 833 | 1,965 | ||||||||||||||
|
Total
|
285,129 | |||||||||||||||||
|
Earnings on a current cost of supplies basis
|
8,354 | 258 | 1,310 | 9,922 | ||||||||||||||
|
Other items
|
||||||||||||||||||
|
Depreciation, depletion and amortisation charge of which:
|
9,875 | 4,399 | 184 | 14,458 | ||||||||||||||
|
Impairment losses
|
792 | 1,616 | 10 | 2,418 | ||||||||||||||
|
Impairment reversals
|
432 | 151 | – | 583 | ||||||||||||||
|
Interest expense/(credit)
|
645 | 84 | (187 | ) | 542 | |||||||||||||
|
Taxation charge/(credit)
|
8,942 | 195 | (835 | ) | 8,302 | |||||||||||||
| $ MILLION | ||||||||||||||
| 2011 | 2010 | 2009 | ||||||||||||
|
Total segment earnings on a current cost of supplies basis
|
28,830 | 18,976 | 9,922 | |||||||||||
|
Current cost of supplies adjustment:
|
||||||||||||||
|
Purchases
|
2,825 | 1,789 | 3,242 | |||||||||||
|
Taxation
|
(789 | ) | (510 | ) | (895 | ) | ||||||||
|
Share of profit of equity-accounted investments
|
319 | 219 | 449 | |||||||||||
|
Income for the period
|
31,185 | 20,474 | 12,718 | |||||||||||
| NET CAPITAL INVESTMENT | $ MILLION | |||||||||||||
| 2011 | 2010 | 2009 | ||||||||||||
|
Net capital investment
|
||||||||||||||
|
Upstream
|
19,083 | 21,222 | 22,326 | |||||||||||
|
Downstream
|
4,342 | 2,358 | 6,232 | |||||||||||
|
Corporate
|
78 | 100 | 324 | |||||||||||
|
Total
|
23,503 | 23,680 | 28,882 | |||||||||||
|
Proceeds from disposals
|
7,548 | 6,882 | 2,853 | |||||||||||
|
Capital investment
|
31,051 | 30,562 | 31,735 | |||||||||||
|
Exploration expense, excluding exploration wells written off
|
(1,462 | ) | (1,214 | ) | (1,186 | ) | ||||||||
|
Investments in equity-accounted investments
|
(1,886 | ) | (2,050 | ) | (2,955 | ) | ||||||||
|
Leases and other adjustments
|
(1,402 | ) | (358 | ) | (1,078 | ) | ||||||||
|
Capital expenditure
|
26,301 | 26,940 | 26,516 | |||||||||||
| EQUITY-ACCOUNTED INVESTMENTS | $ MILLION | |||||||||
|
Dec 31,
2011 |
Dec 31,
2010 |
|||||||||
|
Upstream
|
21,683 | 20,955 | ||||||||
|
Downstream
|
16,303 | 12,453 | ||||||||
|
Corporate
|
4 | 6 | ||||||||
|
Total
|
37,990 | 33,414 | ||||||||
Table of Contents
|
114
|
Shell Annual Report and Form 20-F 2011 | ||
| Consolidated Financial Statements > Notes to the Consolidated Financial Statements |
| 2011 | $ MILLION | |||||||||||||||||||||
| Europe |
Asia,
Oceania, Africa |
USA |
Other
Americas |
Total | ||||||||||||||||||
|
Third-party revenue, by origin
|
187,498 | 148,260 | 91,946 | 42,467 | 470,171 | |||||||||||||||||
|
Intangible assets, property, plant and equipment and
equity-accounted investments at December 31
|
27,509 | 83,409 | 44,234 | 39,440 | 194,592 | |||||||||||||||||
| 2010 | $ MILLION | |||||||||||||||||||||
| Europe |
Asia,
Oceania, Africa |
USA |
Other
Americas |
Total | ||||||||||||||||||
|
Third-party revenue, by origin
|
137,359 | 110,955 | 77,660 | 42,082 | 368,056 | |||||||||||||||||
|
Intangible assets, property, plant and equipment and
equity-accounted investments at December 31
|
28,580 | 76,553 | 39,934 | 36,091 | 181,158 | |||||||||||||||||
| 2009 | $ MILLION | |||||||||||||||||||||
| Europe |
Asia,
Oceania, Africa |
USA |
Other
Americas |
Total | ||||||||||||||||||
|
Third-party revenue, by origin
|
103,424 | 80,398 | 60,721 | 33,645 | 278,188 | |||||||||||||||||
|
Intangible assets, property, plant and equipment and
equity-accounted investments at December 31
|
33,404 | 67,822 | 32,082 | 34,842 | 168,150 | |||||||||||||||||
| $ MILLION | ||||||||||||||
| 2011 | 2010 | 2009 | ||||||||||||
|
Remuneration
|
11,158 | 10,667 | 10,608 | |||||||||||
|
Social law taxes
|
774 | 758 | 818 | |||||||||||
|
Retirement benefits (see Note 18)
|
1,804 | 1,980 | 2,679 | |||||||||||
|
Share-based compensation (see Note 22)
|
754 | 701 | 642 | |||||||||||
|
Total
|
14,490 | 14,106 | 14,747 | |||||||||||
| THOUSAND | ||||||||||||||
| 2011 | 2010 | 2009 | ||||||||||||
|
Upstream
|
27 | 26 | 23 | |||||||||||
|
Downstream
|
51 | 59 | 62 | |||||||||||
|
Corporate
|
12 | 12 | 16 | |||||||||||
|
Total
|
90 | 97 | 101 | |||||||||||
Table of Contents
|
Shell Annual Report and Form 20-F 2011
|
115 | ||
|
Consolidated Financial Statements > Notes to the
Consolidated Financial Statements
|
| $ MILLION | ||||||||||||||
| 2011 | 2010 | 2009 | ||||||||||||
|
Short-term benefits
|
27.3 | 27.8 | 31.1 | |||||||||||
|
Retirement benefits
|
3.2 | 2.9 | 3.4 | |||||||||||
|
Share-based compensation
|
36.0 | 22.6 | 32.7 | |||||||||||
|
Realised gains on exercise of share options
|
2.1 | 2.6 | 0.5 | |||||||||||
| $ MILLION | ||||||||||||||
| 2011 | 2010 | 2009 | ||||||||||||
|
Interest income
|
209 | 153 | 384 | |||||||||||
|
Dividend income (from investments in securities)
|
830 | 399 | 270 | |||||||||||
|
Net gains on sale of assets
|
4,485 | 3,276 | 781 | |||||||||||
|
Foreign exchange gains/(losses) on financing activities
|
63 | (17 | ) | 440 | ||||||||||
|
Other
|
(6 | ) | 332 | 90 | ||||||||||
|
Total
|
5,581 | 4,143 | 1,965 | |||||||||||
| $ MILLION | ||||||||||||||
| 2011 | 2010 | 2009 | ||||||||||||
|
Interest incurred and similar charges
|
1,292 | 1,231 | 1,105 | |||||||||||
|
Less: interest capitalised
|
(674 | ) | (969 | ) | (1,088 | ) | ||||||||
|
Other net fair value gains on fair value hedges of debt
|
(83 | ) | (13 | ) | (203 | ) | ||||||||
|
Accretion expense (see Note 19)
|
838 | 747 | 728 | |||||||||||
|
Total
|
1,373 | 996 | 542 | |||||||||||
Table of Contents
|
116
|
Shell Annual Report and Form 20-F 2011 | ||
| Consolidated Financial Statements > Notes to the Consolidated Financial Statements |
| 2011 | $ MILLION | |||||||||||||
| Goodwill |
Software
and other |
Total | ||||||||||||
|
Cost
|
||||||||||||||
|
At January 1
|
3,383 | 4,429 | 7,812 | |||||||||||
|
Additions
|
– | 291 | 291 | |||||||||||
|
Sales, retirements and other movements
|
(358 | ) | (241 | ) | (599 | ) | ||||||||
|
Currency translation differences
|
(45 | ) | (68 | ) | (113 | ) | ||||||||
|
At December 31
|
2,980 | 4,411 | 7,391 | |||||||||||
|
Depreciation, depletion and amortisation, including impairments
|
||||||||||||||
|
At January 1
|
393 | 2,380 | 2,773 | |||||||||||
|
Charge for the year
|
31 | 350 | 381 | |||||||||||
|
Sales, retirements and other movements
|
(62 | ) | (177 | ) | (239 | ) | ||||||||
|
Currency translation differences
|
(2 | ) | (43 | ) | (45 | ) | ||||||||
|
At December 31
|
360 | 2,510 | 2,870 | |||||||||||
|
Net carrying amount at December 31
|
2,620 | 1,901 | 4,521 | |||||||||||
| 2010 | $ MILLION | |||||||||||||
| Goodwill |
Software
and other |
Total | ||||||||||||
|
Cost
|
||||||||||||||
|
At January 1
|
3,436 | 4,654 | 8,090 | |||||||||||
|
Additions
|
– | 339 | 339 | |||||||||||
|
Sales, retirements and other movements
|
(65 | ) | (482 | ) | (547 | ) | ||||||||
|
Currency translation differences
|
12 | (82 | ) | (70 | ) | |||||||||
|
At December 31
|
3,383 | 4,429 | 7,812 | |||||||||||
|
Depreciation, depletion and amortisation, including impairments
|
||||||||||||||
|
At January 1
|
296 | 2,438 | 2,734 | |||||||||||
|
Charge for the year
|
115 | 366 | 481 | |||||||||||
|
Sales, retirements and other movements
|
(19 | ) | (381 | ) | (400 | ) | ||||||||
|
Currency translation differences
|
1 | (43 | ) | (42 | ) | |||||||||
|
At December 31
|
393 | 2,380 | 2,773 | |||||||||||
|
Net carrying amount at December 31
|
2,990 | 2,049 | 5,039 | |||||||||||
| 2011 | $ MILLION | |||||||||||||||||||||
| Exploration and production assets | ||||||||||||||||||||||
|
Exploration
and evaluation |
Production |
Manufacturing
and distribution |
Other | Total | ||||||||||||||||||
|
Cost
|
||||||||||||||||||||||
|
At January 1
|
26,052 | 166,345 | 65,908 | 27,220 | 285,525 | |||||||||||||||||
|
Additions
|
7,971 | 11,859 | 3,919 | 2,950 | 26,699 | |||||||||||||||||
|
Sales, retirements and other movements
|
(5,451 | ) | (1,363 | ) | (3,722 | ) | (2,644 | ) | (13,180 | ) | ||||||||||||
|
Currency translation differences
|
(221 | ) | (1,776 | ) | (693 | ) | (797 | ) | (3,487 | ) | ||||||||||||
|
At December 31
|
28,351 | 175,065 | 65,412 | 26,729 | 295,557 | |||||||||||||||||
|
Depreciation, depletion and amortisation, including impairments
|
||||||||||||||||||||||
|
At January 1
|
2,095 | 94,944 | 30,797 | 14,984 | 142,820 | |||||||||||||||||
|
Charge for the year
|
595 | 7,814 | 3,359 | 1,079 | 12,847 | |||||||||||||||||
|
Sales, retirements and other movements
|
(315 | ) | (5,008 | ) | (3,353 | ) | (1,697 | ) | (10,373 | ) | ||||||||||||
|
Currency translation differences
|
(24 | ) | (956 | ) | (426 | ) | (412 | ) | (1,818 | ) | ||||||||||||
|
At December 31
|
2,351 | 96,794 | 30,377 | 13,954 | 143,476 | |||||||||||||||||
|
Net carrying amount at December 31
|
26,000 | 78,271 | 35,035 | 12,775 | 152,081 | |||||||||||||||||
Table of Contents
|
Shell Annual Report and Form 20-F 2011
|
117 | ||
|
Consolidated Financial Statements > Notes to the
Consolidated Financial Statements
|
| 2010 | $ MILLION | |||||||||||||||||||||
| Exploration and production assets | ||||||||||||||||||||||
|
Exploration
and evaluation |
Production |
Manufacturing
and distribution |
Other | Total | ||||||||||||||||||
|
Cost
|
||||||||||||||||||||||
|
At January 1
|
20,425 | 155,340 | 66,034 | 29,017 | 270,816 | |||||||||||||||||
|
Additions
|
9,763 | 12,243 | 4,250 | 1,673 | 27,929 | |||||||||||||||||
|
Sales, retirements and other movements
|
(4,598 | ) | (1,927 | ) | (3,854 | ) | (3,088 | ) | (13,467 | ) | ||||||||||||
|
Currency translation differences
|
462 | 689 | (522 | ) | (382 | ) | 247 | |||||||||||||||
|
At December 31
|
26,052 | 166,345 | 65,908 | 27,220 | 285,525 | |||||||||||||||||
|
Depreciation, depletion and amortisation, including impairments
|
||||||||||||||||||||||
|
At January 1
|
1,899 | 90,579 | 30,810 | 15,909 | 139,197 | |||||||||||||||||
|
Charge for the year
|
1,491 | 9,352 | 2,701 | 1,570 | 15,114 | |||||||||||||||||
|
Sales, retirements and other movements
|
(1,257 | ) | (4,821 | ) | (2,367 | ) | (2,192 | ) | (10,637 | ) | ||||||||||||
|
Currency translation differences
|
(38 | ) | (166 | ) | (347 | ) | (303 | ) | (854 | ) | ||||||||||||
|
At December 31
|
2,095 | 94,944 | 30,797 | 14,984 | 142,820 | |||||||||||||||||
|
Net carrying amount at December 31
|
23,957 | 71,401 | 35,111 | 12,236 | 142,705 | |||||||||||||||||
| $ MILLION | ||||||||||
| 2011 | 2010 | |||||||||
|
Exploration and production assets
|
1,759 | 1,887 | ||||||||
|
Manufacturing and distribution
|
802 | 854 | ||||||||
|
Other
|
574 | 521 | ||||||||
|
Total
|
3,135 | 3,262 | ||||||||
| $ MILLION | ||||||||||||||
| 2011 | 2010 | 2009 | ||||||||||||
|
Impairment losses
|
||||||||||||||
|
Exploration and production assets
|
317 | 1,620 | 777 | |||||||||||
|
Manufacturing and distribution
|
1,134 | 1,140 | 1,466 | |||||||||||
|
Other
|
36 | 33 | 144 | |||||||||||
|
Total
|
1,487 | 2,793 | 2,387 | |||||||||||
|
Impairment reversals
|
||||||||||||||
|
Exploration and production assets
|
– | 40 | 432 | |||||||||||
|
Manufacturing and distribution
|
4 | 7 | 151 | |||||||||||
|
Other
|
– | 1 | – | |||||||||||
|
Total
|
4 | 48 | 583 | |||||||||||
Table of Contents
|
118
|
Shell Annual Report and Form 20-F 2011 | ||
| Consolidated Financial Statements > Notes to the Consolidated Financial Statements |
| $ MILLION | ||||||||||||||
| 2011 | 2010 | 2009 | ||||||||||||
|
At January 1
|
4,218 | 3,614 | 3,247 | |||||||||||
|
Additions pending determination of proved reserves
|
3,742 | 2,598 | 2,041 | |||||||||||
|
Amounts charged to expense
|
(351 | ) | (279 | ) | (350 | ) | ||||||||
|
Reclassifications to productive wells on determination of proved
reserves
|
(2,022 | ) | (1,779 | ) | (931 | ) | ||||||||
|
Other movements, including acquisitions, disposals and currency
translation differences
|
(289 | ) | 64 | (393 | ) | |||||||||
|
At December 31
|
5,298 | 4,218 | 3,614 | |||||||||||
| 2011 | ||||||||
| $ million |
Number
of wells |
|||||||
|
Between one and five years
|
2,321 | 159 | ||||||
|
Between six and ten years
|
256 | 17 | ||||||
|
Total
|
2,577 | 176 | ||||||
| 2011 | ||||||||
| $ million |
Number
of projects |
|||||||
|
Between one and five years
|
2,573 | 41 | ||||||
|
Between six and ten years
|
4 | 1 | ||||||
|
Total
|
2,577 | 42 | ||||||
| $ MILLION | ||||||||||||||||||||||||||||||||||||||
| 2011 | 2010 | 2009 | ||||||||||||||||||||||||||||||||||||
| Associates |
Jointly
controlled entities |
Total | Associates |
Jointly
controlled entities |
Total | Associates |
Jointly
controlled entities |
Total | ||||||||||||||||||||||||||||||
|
Revenue
|
36,688 | 66,349 | 103,037 | 27,759 | 44,641 | 72,400 | 23,136 | 36,456 | 59,592 | |||||||||||||||||||||||||||||
|
Income for the period
|
3,956 | 4,781 | 8,737 | 2,310 | 3,643 | 5,953 | 1,397 | 3,579 | 4,976 | |||||||||||||||||||||||||||||
Table of Contents
|
Shell Annual Report and Form 20-F 2011
|
119 | ||
|
Consolidated Financial Statements > Notes to the
Consolidated Financial Statements
|
| $ MILLION | ||||||||||||||||||||||||||
| Dec 31, 2011 | Dec 31, 2010 | |||||||||||||||||||||||||
| Associates |
Jointly
controlled entities |
Total | Associates |
Jointly
controlled entities |
Total | |||||||||||||||||||||
|
Current assets
|
7,809 | 14,048 | 21,857 | 6,203 | 12,836 | 19,039 | ||||||||||||||||||||
|
Non-current assets
|
27,467 | 30,689 | 58,156 | 26,467 | 23,333 | 49,800 | ||||||||||||||||||||
|
Total assets
|
35,276 | 44,737 | 80,013 | 32,670 | 36,169 | 68,839 | ||||||||||||||||||||
|
Current liabilities
|
7,078 | 8,953 | 16,031 | 5,424 | 8,195 | 13,619 | ||||||||||||||||||||
|
Non-current liabilities
|
14,746 | 11,246 | 25,992 | 13,190 | 8,616 | 21,806 | ||||||||||||||||||||
|
Total liabilities
|
21,824 | 20,199 | 42,023 | 18,614 | 16,811 | 35,425 | ||||||||||||||||||||
|
Total assets less total liabilities
|
13,452 | 24,538 | 37,990 | 14,056 | 19,358 | 33,414 | ||||||||||||||||||||
| DECEMBER 31, 2011 | ||||||||||||||
| Segment |
Name
|
Description | Country of incorporation | Shell interest (% | ) |
Fair value
($1 million) |
||||||||
|
Upstream
|
||||||||||||||
|
Aera
|
Jointly controlled entity | USA | 52 | |||||||||||
|
Arrow
|
Jointly controlled entity | Australia | 50 | |||||||||||
|
Brunei LNG
|
Associate | Brunei | 25 | |||||||||||
|
Brunei Shell
|
Jointly controlled entity | Brunei | 50 | |||||||||||
|
NAM
|
Jointly controlled entity | The Netherlands | 50 | |||||||||||
|
Nigeria LNG
|
Associate | Nigeria | 26 | |||||||||||
|
Oman LNG
|
Associate | Oman | 30 | |||||||||||
|
Qatargas 4 LNG
|
Associate | Qatar | 30 | |||||||||||
|
Sakhalin Energy
|
Associate | Bermuda | 28 | |||||||||||
|
Woodside
|
Associate | Australia | 24 | 5,912 | ||||||||||
|
Downstream
|
||||||||||||||
|
CNOOC and Shell
Petrochemicals (Nanhai) |
Jointly controlled entity | China | 50 | |||||||||||
|
Deer Park
|
Jointly controlled entity | USA | 50 | |||||||||||
|
Infineum
|
Jointly controlled entity | The Netherlands | 50 | |||||||||||
|
Motiva
|
Jointly controlled entity | USA | 50 | |||||||||||
|
Raízen
|
Jointly controlled entity | Brazil | 50 | |||||||||||
|
Saudi Arabia Petrochemical
|
Jointly controlled entity | Saudi Arabia | 50 | |||||||||||
|
Saudi Aramco Shell Refinery
|
Jointly controlled entity | Saudi Arabia | 50 | |||||||||||
|
Showa Shell
|
Associate | Japan | 35 | 883 | ||||||||||
Table of Contents
|
120
|
Shell Annual Report and Form 20-F 2011 | ||
| Consolidated Financial Statements > Notes to the Consolidated Financial Statements |
| $ MILLION | |||||||||||
| 2011 | 2010 | 2009 | |||||||||
|
Charges to equity-accounted investments
|
55,280 | 38,368 | 28,399 | ||||||||
|
Charges from equity-accounted investments
|
47,615 | 34,827 | 27,494 | ||||||||
| $ BILLION | ||||||||
| 2011 | 2010 | |||||||
|
Shell commitments to purchases from equity-accounted investments
|
192.0 | 179.9 | ||||||
|
Guarantees issued in respect of equity-accounted investments
|
2.2 | 2.4 | ||||||
| $ MILLION | ||||||||||
| 2011 | 2010 | |||||||||
|
At January 1
|
2,388 | 2,670 | ||||||||
|
Gains/(losses) recognised in other comprehensive income
|
1,633 | (288 | ) | |||||||
|
Purchases
|
25 | 5 | ||||||||
|
Sales
|
(18 | ) | (2 | ) | ||||||
|
Currency translation differences
|
2 | 3 | ||||||||
|
At December 31
|
4,030 | 2,388 | ||||||||
| $ MILLION | ||||||||||||||
| Dec 31, 2011 | Dec 31, 2010 | |||||||||||||
| Current | Non-current | Current | Non-current | |||||||||||
|
Trade receivables
|
48,307 | – | 37,436 | – | ||||||||||
|
Other receivables
|
8,204 | 3,375 | 6,291 | 3,833 | ||||||||||
|
Amounts due from equity-accounted investments
|
3,231 | 2,580 | 2,982 | 1,815 | ||||||||||
|
Derivative contracts (see Note 21)
|
16,394 | 1,615 | 19,670 | 1,490 | ||||||||||
|
Prepayments and deferred charges
|
3,373 | 1,686 | 3,723 | 1,832 | ||||||||||
|
Total
|
79,509 | 9,256 | 70,102 | 8,970 | ||||||||||
Table of Contents
|
Shell Annual Report and Form 20-F 2011
|
121 | ||
|
Consolidated Financial Statements > Notes to the
Consolidated Financial Statements
|
| $ MILLION | ||||||||
| 2011 | 2010 | |||||||
|
Not overdue
|
44,433 | 34,226 | ||||||
|
Overdue 1–30 days
|
2,573 | 1,995 | ||||||
|
Overdue 31–60 days
|
297 | 367 | ||||||
|
Overdue 61–90 days
|
99 | 221 | ||||||
|
Overdue 91–180 days
|
394 | 175 | ||||||
|
Overdue more than 180 days
|
511 | 452 | ||||||
|
Total
|
48,307 | 37,436 | ||||||
| $ MILLION | ||||||||
| Dec 31, 2011 | Dec 31, 2010 | |||||||
|
Oil and chemicals
|
27,343 | 27,742 | ||||||
|
Materials
|
1,633 | 1,606 | ||||||
|
Total
|
28,976 | 29,348 | ||||||
| $ MILLION | ||||||||
| Dec 31, 2011 | Dec 31, 2010 | |||||||
|
Cash
|
4,592 | 4,121 | ||||||
|
Short-term bank deposits
|
3,260 | 2,780 | ||||||
|
Money market funds and other cash equivalents
|
3,440 | 6,543 | ||||||
|
Total
|
11,292 | 13,444 | ||||||
| $ MILLION | ||||||||||||||||||||||||||
| Dec 31, 2011 | Dec 31, 2010 | |||||||||||||||||||||||||
|
Debt
(excluding finance lease obligations) |
Finance
lease obligations |
Total |
Debt
(excluding finance lease obligations) |
Finance
lease obligations |
Total | |||||||||||||||||||||
|
Short-term debt
|
2,262 | – | 2,262 | 5,898 | – | 5,898 | ||||||||||||||||||||
|
Long-term debt due within one year
|
4,140 | 310 | 4,450 | 3,757 | 296 | 4,053 | ||||||||||||||||||||
|
Current debt
|
6,402 | 310 | 6,712 | 9,655 | 296 | 9,951 | ||||||||||||||||||||
|
Non-current debt
|
26,450 | 4,013 | 30,463 | 30,142 | 4,239 | 34,381 | ||||||||||||||||||||
|
Total debt
|
32,852 | 4,323 | 37,175 | 39,797 | 4,535 | 44,332 | ||||||||||||||||||||
|
Cash and cash equivalents (see Note 14)
|
11,292 | 13,444 | ||||||||||||||||||||||||
|
Net debt
|
25,883 | 30,888 | ||||||||||||||||||||||||
Table of Contents
|
122
|
Shell Annual Report and Form 20-F 2011 | ||
| Consolidated Financial Statements > Notes to the Consolidated Financial Statements |
| $ MILLION, EXCEPT WHERE OTHERWISE INDICATED | ||||||||||
| 2011 | 2010 | |||||||||
|
Net debt
|
25,883 | 30,888 | ||||||||
|
Total equity
|
171,003 | 149,780 | ||||||||
|
Total capital
|
196,886 | 180,668 | ||||||||
|
Gearing
|
13.1% | 17.1% | ||||||||
| $ MILLION | ||||||||||||||||||
|
Current
debt |
Non-current
debt |
Cash and cash
equivalents |
Net debt | |||||||||||||||
|
At January 1, 2011
|
(9,951 | ) | (34,381 | ) | 13,444 | (30,888 | ) | |||||||||||
|
Cash flow
|
7,157 | (33 | ) | (1,803 | ) | 5,321 | ||||||||||||
|
Other movements
|
(4,079 | ) | 3,930 | – | (149 | ) | ||||||||||||
|
Currency translation differences
|
161 | 21 | (349 | ) | (167 | ) | ||||||||||||
|
At December 31, 2011
|
(6,712 | ) | (30,463 | ) | 11,292 | (25,883 | ) | |||||||||||
|
At January 1, 2010
|
(4,171 | ) | (30,862 | ) | 9,719 | (25,314 | ) | |||||||||||
|
Cash flow
|
(2,153 | ) | (7,084 | ) | 3,911 | (5,326 | ) | |||||||||||
|
Other movements
|
(3,613 | ) | 3,570 | – | (43 | ) | ||||||||||||
|
Currency translation differences
|
(14 | ) | (5 | ) | (186 | ) | (205 | ) | ||||||||||
|
At December 31, 2010
|
(9,951 | ) | (34,381 | ) | 13,444 | (30,888 | ) | |||||||||||
| $ MILLION | ||||||||||
| 2011 | 2010 | |||||||||
|
Net present value of operating lease obligations [A]
|
18,770 | 15,878 | ||||||||
|
Under-funded retirement benefit obligations [B]
|
10,711 | 6,653 | ||||||||
|
Fair value hedges related to debt [C]
|
(983 | ) | (1,012 | ) | ||||||
|
Cash required for operational requirements
|
2,300 | 2,300 | ||||||||
| [A] | Total future minimum operating lease payments at December 31 discounted at 1.5% in 2011 (2010: 2.6%). | |
| [B] | The excess of pension and other retirement obligations over related plan assets of $6,325 million (2010: $2,586 million) and $4,386 million (2010: $4,067 million) respectively (see Note 18). | |
| [C] | The fair value of hedging derivatives in designated fair value hedges, net of related accrued interest. |
Table of Contents
|
Shell Annual Report and Form 20-F 2011
|
123 | ||
|
Consolidated Financial Statements > Notes to the
Consolidated Financial Statements
|
| $ MILLION | ||||||||||||||
| Facility | Amount undrawn | |||||||||||||
| 2011 | 2010 | 2011 | 2010 | |||||||||||
|
CP programmes
|
20,000 | 20,000 | 20,000 | 16,063 | ||||||||||
|
EMTN programme
|
25,000 | 25,000 | 12,443 | 12,213 | ||||||||||
|
US shelf registration
|
unrestricted | unrestricted | n/a | n/a | ||||||||||
|
Committed credit facility
|
5,100 | 5,100 | 5,100 | 5,100 | ||||||||||
| 2011 | $ MILLION | |||||||||||||||||||||||||||||||||||||
| Contractual payments | Difference | |||||||||||||||||||||||||||||||||||||
|
Less than
1 year |
Between
1 and 2 years |
Between
2 and 3 years |
Between
3 and 4 years |
Between
4 and 5 years |
5 Years
and later |
Total |
from
carrying amount |
Carrying
amount |
||||||||||||||||||||||||||||||
|
EMTN programme
|
2,262 | 3,231 | – | – | 1,615 | 5,169 | 12,277 | 608 | 12,885 | |||||||||||||||||||||||||||||
|
US shelf registration
|
1,500 | 2,000 | 2,500 | 2,750 | – | 7,750 | 16,500 | 342 | 16,842 | |||||||||||||||||||||||||||||
|
Bank borrowings and other
|
2,640 | 2 | 1 | 58 | 387 | 37 | 3,125 | – | 3,125 | |||||||||||||||||||||||||||||
|
Total (excluding interest)
|
6,402 | 5,233 | 2,501 | 2,808 | 2,002 | 12,956 | 31,902 | 950 | 32,852 | |||||||||||||||||||||||||||||
|
Interest
|
1,308 | 1,037 | 866 | 789 | 729 | 6,009 | 10,738 | |||||||||||||||||||||||||||||||
| 2010 | $ MILLION | |||||||||||||||||||||||||||||||||||||
| Contractual payments | Difference | |||||||||||||||||||||||||||||||||||||
|
Less than
1 year |
Between
1 and 2 years |
Between
2 and 3 years |
Between
3 and 4 years |
Between
4 and 5 years |
5 years
and later |
Total |
from
carrying amount |
Carrying
amount |
||||||||||||||||||||||||||||||
|
CP programmes
|
3,931 | – | – | – | – | – | 3,931 | – | 3,931 | |||||||||||||||||||||||||||||
|
EMTN programme
|
320 | 2,335 | 3,335 | – | – | 7,004 | 12,994 | 262 | 13,256 | |||||||||||||||||||||||||||||
|
US shelf registration
|
3,000 | 1,500 | 2,000 | 2,500 | 2,750 | 7,750 | 19,500 | 253 | 19,753 | |||||||||||||||||||||||||||||
|
Bank borrowings and other
|
2,404 | 32 | 86 | 3 | 169 | 163 | 2,857 | – | 2,857 | |||||||||||||||||||||||||||||
|
Total (excluding interest)
|
9,655 | 3,867 | 5,421 | 2,503 | 2,919 | 14,917 | 39,282 | 515 | 39,797 | |||||||||||||||||||||||||||||
|
Interest
|
1,310 | 1,155 | 1,040 | 868 | 791 | 6,729 | 11,893 | |||||||||||||||||||||||||||||||
Table of Contents
|
124
|
Shell Annual Report and Form 20-F 2011 | ||
| Consolidated Financial Statements > Notes to the Consolidated Financial Statements |
| 2011 | $ MILLION | |||||||||||||||||
| Finance leases | Operating leases | |||||||||||||||||
|
Total future
minimum lease payments |
Interest |
Present value
of minimum lease payments |
Total future
minimum lease payments |
|||||||||||||||
|
Less than 1 year
|
705 | 395 | 310 | 3,913 | ||||||||||||||
|
Between 1 and 5 years
|
2,425 | 1,279 | 1,146 | 9,769 | ||||||||||||||
|
5 years and later
|
4,653 | 1,786 | 2,867 | 6,230 | ||||||||||||||
|
Total
|
7,783 | 3,460 | 4,323 | 19,912 | ||||||||||||||
| 2010 | $ MILLION | |||||||||||||||||
| Finance leases | Operating leases | |||||||||||||||||
|
Total future
minimum lease payments |
Interest |
Present value
of minimum lease payments |
Total future
minimum lease payments |
|||||||||||||||
|
Less than 1 year
|
722 | 426 | 296 | 3,976 | ||||||||||||||
|
Between 1 and 5 years
|
2,580 | 1,393 | 1,187 | 8,088 | ||||||||||||||
|
5 years and later
|
5,155 | 2,103 | 3,052 | 5,511 | ||||||||||||||
|
Total
|
8,457 | 3,922 | 4,535 | 17,575 | ||||||||||||||
| $ MILLION | ||||||||||||||
| 2011 | 2010 | 2009 | ||||||||||||
|
Rental expense, of which:
|
3,520 | 3,373 | 3,375 | |||||||||||
|
Contingent rentals
|
91 | 172 | 14 | |||||||||||
|
Sub-lease
income
|
(177 | ) | (99 | ) | (152 | ) | ||||||||
| $ MILLION | ||||||||||||||||||
| Dec 31, 2011 | Dec 31, 2010 | |||||||||||||||||
| Current | Non-current | Current | Non-current | |||||||||||||||
|
Trade payables
|
44,844 | – | 34,476 | – | ||||||||||||||
|
Other payables
|
4,196 | 2,200 | 4,828 | 2,146 | ||||||||||||||
|
Amounts due to equity-accounted investments
|
5,162 | 559 | 4,382 | 14 | ||||||||||||||
|
Derivative contracts (see Note 21)
|
15,831 | 1,002 | 20,308 | 866 | ||||||||||||||
|
Accruals and deferred income
|
11,813 | 1,160 | 12,556 | 1,224 | ||||||||||||||
|
Total
|
81,846 | 4,921 | 76,550 | 4,250 | ||||||||||||||
Table of Contents
|
Shell Annual Report and Form 20-F 2011
|
125 | ||
|
Consolidated Financial Statements > Notes to the
Consolidated Financial Statements
|
| $ MILLION | ||||||||||||||
| 2011 | 2010 | 2009 | ||||||||||||
|
Current taxation
|
||||||||||||||
|
Charge in respect of current period
|
22,519 | 16,891 | 10,912 | |||||||||||
|
Adjustment in respect of prior periods
|
490 | (507 | ) | (1,615 | ) | |||||||||
|
Total
|
23,009 | 16,384 | 9,297 | |||||||||||
|
Deferred taxation
|
||||||||||||||
|
Relating to the origination and reversal of temporary differences
|
2,295 | (2,030 | ) | (1,079 | ) | |||||||||
|
Relating to changes in tax rates
|
(45 | ) | (60 | ) | (86 | ) | ||||||||
|
Adjustment in respect of prior periods
|
(784 | ) | 576 | 170 | ||||||||||
|
Total
|
1,466 | (1,514 | ) | (995 | ) | |||||||||
|
Total taxation charge
|
24,475 | 14,870 | 8,302 | |||||||||||
| $ MILLION | ||||||||||||||
| 2011 | 2010 | 2009 | ||||||||||||
|
Income before taxation
|
55,660 | 35,344 | 21,020 | |||||||||||
|
Less: Share of profit of equity-accounted investments
|
(8,737 | ) | (5,953 | ) | (4,976 | ) | ||||||||
|
Income before taxation and share of profit of equity-accounted
investments
|
46,923 | 29,391 | 16,044 | |||||||||||
|
Applicable tax charge at statutory tax rates
|
25,552 | 16,253 | 9,634 | |||||||||||
|
Adjustment in respect of prior periods
|
(294 | ) | 69 | (1,445 | ) | |||||||||
|
(Derecognition)/recognition of tax losses
|
(450 | ) | (99 | ) | 21 | |||||||||
|
Income not subject to tax
|
(1,009 | ) | (1,880 | ) | (747 | ) | ||||||||
|
Expenses not deductible for tax purposes
|
1,117 | 1,205 | 1,263 | |||||||||||
|
Deductible items not expensed
|
(473 | ) | (641 | ) | (521 | ) | ||||||||
|
Taxable income not recognised
|
310 | 198 | 214 | |||||||||||
|
Other reconciling items, including amounts relating to changes
in tax rate
|
(278 | ) | (235 | ) | (117 | ) | ||||||||
|
Taxation charge
|
24,475 | 14,870 | 8,302 | |||||||||||
| $ MILLION | ||||||||
| Dec 31, 2011 | Dec 31, 2010 | |||||||
|
Income taxes
|
7,151 | 6,084 | ||||||
|
Sales taxes, excise duties and similar levies and social law
taxes
|
3,455 | 4,222 | ||||||
|
Total
|
10,606 | 10,306 | ||||||
Table of Contents
|
126
|
Shell Annual Report and Form 20-F 2011 | ||
| Consolidated Financial Statements > Notes to the Consolidated Financial Statements |
| 2011 | $ MILLION | |||||||||||||||||||||||||
|
Decommissioning
and other provisions |
Losses
carried forward |
Property,
plant and equipment |
Retirement
benefits |
Other | Total | |||||||||||||||||||||
|
At January 1
|
||||||||||||||||||||||||||
|
Deferred tax assets
|
4,311 | 979 | (2,463 | ) | 375 | 2,159 | 5,361 | |||||||||||||||||||
|
Deferred tax liabilities
|
3,517 | 1,657 | (15,909 | ) | (1,539 | ) | (1,114 | ) | (13,388 | ) | ||||||||||||||||
| 7,828 | 2,636 | (18,372 | ) | (1,164 | ) | 1,045 | (8,027 | ) | ||||||||||||||||||
|
(Charged)/credited to income
|
(400 | ) | 906 | (1,854 | ) | (58 | ) | (60 | ) | (1,466 | ) | |||||||||||||||
|
Other movements
|
(17 | ) | (233 | ) | (39 | ) | 20 | (286 | ) | (555 | ) | |||||||||||||||
|
Currency translation differences
|
(67 | ) | (61 | ) | 194 | 26 | 39 | 131 | ||||||||||||||||||
| (484 | ) | 612 | (1,699 | ) | (12 | ) | (307 | ) | (1,890 | ) | ||||||||||||||||
|
At December 31
|
||||||||||||||||||||||||||
|
Deferred tax assets
|
4,011 | 1,029 | (1,761 | ) | 368 | 1,085 | 4,732 | |||||||||||||||||||
|
Deferred tax liabilities
|
3,333 | 2,219 | (18,310 | ) | (1,544 | ) | (347 | ) | (14,649 | ) | ||||||||||||||||
| 7,344 | 3,248 | (20,071 | ) | (1,176 | ) | 738 | (9,917 | ) | ||||||||||||||||||
| 2010 | $ MILLION | |||||||||||||||||||||||||
|
Decommissioning
and other provisions |
Losses
carried forward |
Property,
plant and equipment |
Retirement
benefits |
Other | Total | |||||||||||||||||||||
|
At January 1
|
||||||||||||||||||||||||||
|
Deferred tax assets
|
1,606 | 1,360 | (915 | ) | 383 | 2,099 | 4,533 | |||||||||||||||||||
|
Deferred tax liabilities
|
5,185 | 1,159 | (17,768 | ) | (1,257 | ) | (1,157 | ) | (13,838 | ) | ||||||||||||||||
| 6,791 | 2,519 | (18,683 | ) | (874 | ) | 942 | (9,305 | ) | ||||||||||||||||||
|
Credited/(charged) to income
|
1,170 | 196 | 311 | (337 | ) | 174 | 1,514 | |||||||||||||||||||
|
Other movements
|
(21 | ) | (101 | ) | 3 | (39 | ) | (161 | ) | (319 | ) | |||||||||||||||
|
Currency translation differences
|
(112 | ) | 22 | (3 | ) | 86 | 90 | 83 | ||||||||||||||||||
| 1,037 | 117 | 311 | (290 | ) | 103 | 1,278 | ||||||||||||||||||||
|
At December 31
|
||||||||||||||||||||||||||
|
Deferred tax assets
|
4,311 | 979 | (2,463 | ) | 375 | 2,159 | 5,361 | |||||||||||||||||||
|
Deferred tax liabilities
|
3,517 | 1,657 | (15,909 | ) | (1,539 | ) | (1,114 | ) | (13,388 | ) | ||||||||||||||||
| 7,828 | 2,636 | (18,372 | ) | (1,164 | ) | 1,045 | (8,027 | ) | ||||||||||||||||||
Table of Contents
|
Shell Annual Report and Form 20-F 2011
|
127 | ||
|
Consolidated Financial Statements > Notes to the
Consolidated Financial Statements
|
| $ MILLION | ||||||||||||||||||||||||||
| Pension benefits | Other benefits | |||||||||||||||||||||||||
| 2011 | 2010 | 2009 | 2011 | 2010 | 2009 | |||||||||||||||||||||
|
Service cost
|
1,262 | 1,141 | 965 | 61 | 62 | 57 | ||||||||||||||||||||
|
Interest cost
|
3,354 | 3,227 | 3,131 | 206 | 216 | 222 | ||||||||||||||||||||
|
Expected return on plan assets
|
(3,960 | ) | (3,645 | ) | (3,142 | ) | ||||||||||||||||||||
|
Net actuarial losses recognised and other components
|
531 | 641 | 1,033 | 5 | 9 | 144 | ||||||||||||||||||||
|
Total for defined benefit plans
|
1,187 | 1,364 | 1,987 | 272 | 287 | 423 | ||||||||||||||||||||
|
Defined contribution plans
|
345 | 329 | 269 | |||||||||||||||||||||||
|
Total
|
1,532 | 1,693 | 2,256 | 272 | 287 | 423 | ||||||||||||||||||||
| $ MILLION | ||||||||||||||||||||||||||
| Total | Pension benefits | Other benefits | ||||||||||||||||||||||||
| 2011 | 2010 | 2011 | 2010 | 2011 | 2010 | |||||||||||||||||||||
|
Prepaid pension costs
|
11,408 | 10,368 | 11,408 | 10,368 | ||||||||||||||||||||||
|
Retirement benefit obligations:
|
||||||||||||||||||||||||||
|
Non-current
|
(5,931 | ) | (5,924 | ) | (2,196 | ) | (2,275 | ) | (3,735 | ) | (3,649 | ) | ||||||||||||||
|
Current
|
(387 | ) | (377 | ) | (180 | ) | (176 | ) | (207 | ) | (201 | ) | ||||||||||||||
|
Net amount recognised
|
5,090 | 4,067 | 9,032 | 7,917 | (3,942 | ) | (3,850 | ) | ||||||||||||||||||
| $ MILLION | ||||||||||||||||||
| Pension benefits | Other benefits | |||||||||||||||||
| 2011 | 2010 | 2011 | 2010 | |||||||||||||||
|
Defined benefit obligations
|
||||||||||||||||||
|
At January 1
|
65,848 | 62,718 | 4,067 | 3,825 | ||||||||||||||
|
Increase in present value of the obligation for benefits based
on employee service during the year
|
1,262 | 1,141 | 61 | 62 | ||||||||||||||
|
Interest on the obligation for benefits in respect of employee
service in previous years
|
3,354 | 3,227 | 206 | 216 | ||||||||||||||
|
Benefit payments made
|
(3,104 | ) | (3,079 | ) | (155 | ) | (151 | ) | ||||||||||
|
Actuarial losses
|
3,732 | 4,414 | 228 | 123 | ||||||||||||||
|
Other movements
|
111 | (21 | ) | 2 | 6 | |||||||||||||
|
Currency translation differences
|
(1,241 | ) | (2,552 | ) | (23 | ) | (14 | ) | ||||||||||
|
At December 31
|
69,962 | 65,848 | 4,386 | 4,067 | ||||||||||||||
|
Plan assets
|
||||||||||||||||||
|
At January 1
|
63,262 | 59,425 | ||||||||||||||||
|
Expected return on plan assets
|
3,960 | 3,645 | ||||||||||||||||
|
Actuarial (losses)/gains
|
(1,888 | ) | 3,555 | |||||||||||||||
|
Employer contributions
|
2,316 | 2,063 | ||||||||||||||||
|
Plan participants’ contributions
|
90 | 86 | ||||||||||||||||
|
Benefit payments made
|
(3,104 | ) | (3,079 | ) | ||||||||||||||
|
Other movements
|
71 | 89 | ||||||||||||||||
|
Currency translation differences
|
(1,070 | ) | (2,522 | ) | ||||||||||||||
|
At December 31
|
63,637 | 63,262 | ||||||||||||||||
|
Plan assets less than defined benefit obligations at December 31
|
(6,325 | ) | (2,586 | ) | (4,386 | ) | (4,067 | ) | ||||||||||
|
Unrecognised net actuarial losses since adoption of IFRS
|
15,349 | 10,494 | 408 | 173 | ||||||||||||||
|
Unrecognised past service cost
|
8 | 9 | 36 | 44 | ||||||||||||||
|
Net amount recognised
|
9,032 | 7,917 | (3,942 | ) | (3,850 | ) | ||||||||||||
Table of Contents
|
128
|
Shell Annual Report and Form 20-F 2011 | ||
| Consolidated Financial Statements > Notes to the Consolidated Financial Statements |
| $ MILLION, EXCEPT WHERE OTHERWISE INDICATED | ||||||||||||||||||||||
| 2011 | 2010 | 2009 | 2008 | 2007 | ||||||||||||||||||
|
Pension benefits
|
||||||||||||||||||||||
|
Obligation for pension benefits in respect of unfunded plans
|
3,567 | 3,293 | 3,087 | 2,684 | 2,505 | |||||||||||||||||
|
Obligation for pension benefits in respect of funded plans
|
66,395 | 62,555 | 59,631 | 49,955 | 60,018 | |||||||||||||||||
|
Total defined benefit obligation
|
69,962 | 65,848 | 62,718 | 52,639 | 62,523 | |||||||||||||||||
|
Experience adjustments as a percentage of the total benefit
obligation
|
0.6% | 0.1% | (0.5)% | 1.0% | 0.7% | |||||||||||||||||
|
Plan assets
|
63,637 | 63,262 | 59,425 | 44,299 | 76,198 | |||||||||||||||||
|
Experience adjustments as a percentage of plan assets
|
(3.0)% | 5.6% | 10.5% | (61.1)% | 1.3% | |||||||||||||||||
|
Plan (deficit)/surplus
|
(6,325 | ) | (2,586 | ) | (3,293 | ) | (8,340 | ) | 13,675 | |||||||||||||
|
Actual return on plan assets
|
2,072 | 7,200 | 9,398 | (22,087 | ) | 5,846 | ||||||||||||||||
|
Other benefits
|
||||||||||||||||||||||
|
Total benefit obligation (unfunded)
|
4,386 | 4,067 | 3,825 | 3,494 | 3,179 | |||||||||||||||||
|
Experience adjustments as a percentage of the total benefit
obligation
|
(4.7)% | (3.4)% | (1.9)% | 0.6% | 6.0% | |||||||||||||||||
| Target allocation | Percentage of plan assets | |||||||||||||
| 2011 | 2011 | 2010 | ||||||||||||
|
Equities
|
51% | 48% | 54% | |||||||||||
|
Debt securities
|
41% | 40% | 38% | |||||||||||
|
Real estate
|
4% | 3% | 2% | |||||||||||
|
Other
|
4% | 9% | 6% | |||||||||||
|
Total
|
100% | 100% | 100% | |||||||||||
| 2011 | 2010 | 2009 | ||||||||||||
|
Used to determine benefit expense for year
|
||||||||||||||
|
Rates of increase in pensionable salaries
|
5.5% | 5.5% | 4.4% | |||||||||||
|
Discount rates
|
5.1% | 5.5% | 6.0% | |||||||||||
|
Expected rates of return on plan assets
|
6.3% | 6.6% | 6.7% | |||||||||||
|
Used to determine benefit obligations at December 31
|
||||||||||||||
|
Rates of increase in pensionable salaries
|
5.1% | 5.5% | 5.5% | |||||||||||
|
Discount rates
|
4.5% | 5.1% | 5.5% | |||||||||||
|
Expected age at death for persons aged 60
|
||||||||||||||
|
Men (years)
|
86 | 86 | 86 | |||||||||||
|
Women (years)
|
88 | 88 | 88 | |||||||||||
Table of Contents
|
Shell Annual Report and Form 20-F 2011
|
129 | ||
|
Consolidated Financial Statements > Notes to the
Consolidated Financial Statements
|
| $ MILLION | ||||||||||
| One percentage point | ||||||||||
| Increase | Decrease | |||||||||
|
Rates of increase in pensionable salaries
|
||||||||||
|
Change in annual pension benefit expense (pre-tax)
|
239 | (211 | ) | |||||||
|
Change in defined benefit obligations
|
2,233 | (2,014 | ) | |||||||
|
Discount rates
|
||||||||||
|
Change in annual pension benefit expense (pre-tax)
|
(65 | ) | 42 | |||||||
|
Change in defined benefit obligations
|
(9,113 | ) | 11,378 | |||||||
|
Expected rates of return on plan assets
|
||||||||||
|
Change in annual pension benefit expense (pre-tax)
|
(633 | ) | 631 | |||||||
| 2011 | 2010 | 2009 | ||||||||||||
|
Discount rates (used to determine benefit obligations)
|
4.6% | 5.4% | 5.9% | |||||||||||
|
Healthcare cost trend rate in year after reporting year
|
7.4% | 7.7% | 7.9% | |||||||||||
|
Ultimate healthcare cost trend rate
|
4.3% | 4.3% | 4.3% | |||||||||||
|
Year ultimate healthcare cost trend rate is applicable
|
2028 | 2027 | 2027 | |||||||||||
| $ MILLION | ||||||||||||||||||||||||||
| Current | Non-current | Total | ||||||||||||||||||||||||
| Dec 31, 2011 | Dec 31, 2010 | Dec 31, 2011 | Dec 31, 2010 | Dec 31, 2011 | Dec 31, 2010 | |||||||||||||||||||||
|
Decommissioning and restoration
|
894 | 1,006 | 13,072 | 12,011 | 13,966 | 13,017 | ||||||||||||||||||||
|
Environmental
|
357 | 325 | 1,078 | 797 | 1,435 | 1,122 | ||||||||||||||||||||
|
Redundancy
|
406 | 746 | 297 | 204 | 703 | 950 | ||||||||||||||||||||
|
Litigation
|
256 | 175 | 330 | 382 | 586 | 557 | ||||||||||||||||||||
|
Other
|
1,195 | 1,116 | 854 | 891 | 2,049 | 2,007 | ||||||||||||||||||||
|
Total
|
3,108 | 3,368 | 15,631 | 14,285 | 18,739 | 17,653 | ||||||||||||||||||||
Table of Contents
|
130
|
Shell Annual Report and Form 20-F 2011 | ||
| Consolidated Financial Statements > Notes to the Consolidated Financial Statements |
| $ MILLION | ||||||||||||||||||||||||||
|
Decommissioning
and restoration |
Environmental | Redundancy | Litigation | Other | Total | |||||||||||||||||||||
|
At January 1, 2011
|
13,017 | 1,122 | 950 | 557 | 2,007 | 17,653 | ||||||||||||||||||||
|
Additional provisions
|
584 | 570 | 373 | 160 | 806 | 2,493 | ||||||||||||||||||||
|
Amounts charged against provisions
|
(543 | ) | (257 | ) | (567 | ) | (155 | ) | (647 | ) | (2,169 | ) | ||||||||||||||
|
Accretion expense
|
750 | 29 | 8 | 13 | 38 | 838 | ||||||||||||||||||||
|
Reclassifications and other movements
|
242 | (6 | ) | (46 | ) | 17 | (105 | ) | 102 | |||||||||||||||||
|
Currency translation differences
|
(84 | ) | (23 | ) | (15 | ) | (6 | ) | (50 | ) | (178 | ) | ||||||||||||||
|
At December 31, 2011
|
13,966 | 1,435 | 703 | 586 | 2,049 | 18,739 | ||||||||||||||||||||
|
At January 1, 2010
|
12,286 | 1,256 | 1,649 | 700 | 1,964 | 17,855 | ||||||||||||||||||||
|
Additional provisions
|
224 | 89 | 142 | 103 | 662 | 1,220 | ||||||||||||||||||||
|
Amounts charged against provisions
|
(350 | ) | (223 | ) | (890 | ) | (236 | ) | (586 | ) | (2,285 | ) | ||||||||||||||
|
Accretion expense
|
656 | 31 | – | 15 | 45 | 747 | ||||||||||||||||||||
|
Reclassifications and other movements
|
361 | (28 | ) | 93 | (19 | ) | (67 | ) | 340 | |||||||||||||||||
|
Currency translation differences
|
(160 | ) | (3 | ) | (44 | ) | (6 | ) | (11 | ) | (224 | ) | ||||||||||||||
|
At December 31, 2010
|
13,017 | 1,122 | 950 | 557 | 2,007 | 17,653 | ||||||||||||||||||||
| ISSUED AND FULLY PAID | NUMBER OF SHARES | |||||||||||||
| Ordinary shares of €0.07 each | Sterling deferred | |||||||||||||
| Class A | Class B | shares of £1 each | ||||||||||||
|
At January 1, 2011
|
3,563,952,539 | 2,695,808,103 | 50,000 | |||||||||||
|
Scrip dividends
|
104,597,898 | – | – | |||||||||||
|
Repurchases of shares
|
– | (34,404,931 | ) | – | ||||||||||
|
At December 31, 2011
|
3,668,550,437 | 2,661,403,172 | 50,000 | |||||||||||
|
At January 1, 2010
|
3,545,663,973 | 2,695,808,103 | 50,000 | |||||||||||
|
Scrip dividends
|
18,288,566 | – | – | |||||||||||
|
At December 31, 2010
|
3,563,952,539 | 2,695,808,103 | 50,000 | |||||||||||
Table of Contents
|
Shell Annual Report and Form 20-F 2011
|
131 | ||
|
Consolidated Financial Statements > Notes to the
Consolidated Financial Statements
|
| NOMINAL VALUE | $ MILLION | |||||||||||||
| Ordinary shares of €0.07 each | ||||||||||||||
| Class A | Class B | Total | ||||||||||||
|
At January 1, 2011
|
302 | 227 | 529 | |||||||||||
|
Scrip dividends
|
10 | – | 10 | |||||||||||
|
Repurchases of shares
|
– | (3 | ) | (3 | ) | |||||||||
|
At December 31, 2011
|
312 | 224 | 536 | |||||||||||
|
At January 1, 2010
|
300 | 227 | 527 | |||||||||||
|
Scrip dividends
|
2 | – | 2 | |||||||||||
|
At December 31, 2010
|
302 | 227 | 529 | |||||||||||
Table of Contents
|
132
|
Shell Annual Report and Form 20-F 2011 | ||
| Consolidated Financial Statements > Notes to the Consolidated Financial Statements |
| $ MILLION | ||||||||||||||||||
|
Increase/(decrease)
in income |
Increase
in net assets |
|||||||||||||||||
| 2011 | 2010 | 2011 | 2010 | |||||||||||||||
|
10% appreciation against the dollar of:
|
||||||||||||||||||
|
Sterling
|
(58 | ) | (50 | ) | 1,042 | 965 | ||||||||||||
|
Canadian dollar
|
(360 | ) | (406 | ) | 1,364 | 1,213 | ||||||||||||
|
Euro
|
458 | 87 | 1,768 | 1,567 | ||||||||||||||
|
Australian dollar
|
153 | 124 | 120 | 959 | ||||||||||||||
| VALUE-AT-RISK (PRE-TAX) | $ MILLION | |||||||||||||||||||||||||
| 2011 | 2010 | |||||||||||||||||||||||||
| High | Low | Average | Year-end | High | Low | Average | Year-end | |||||||||||||||||||
|
Global oil
|
39 | 10 | 19 | 19 | 30 | 7 | 13 | 16 | ||||||||||||||||||
|
North America gas and power
|
16 | 3 | 8 | 12 | 13 | 3 | 7 | 8 | ||||||||||||||||||
|
Europe gas and power
|
17 | 3 | 9 | 4 | 32 | 1 | 8 | 9 | ||||||||||||||||||
Table of Contents
|
Shell Annual Report and Form 20-F 2011
|
133 | ||
|
Consolidated Financial Statements > Notes to the
Consolidated Financial Statements
|
| 2011 | $ MILLION | |||||||||||||||||||||||
| Asset | Liability | |||||||||||||||||||||||
| Designated |
Not
designated |
Total | Designated |
Not
designated |
Total | Net | ||||||||||||||||||
|
Interest rate swaps
|
466 | – | 466 | – | – | – | 466 | |||||||||||||||||
|
Forward foreign exchange contracts
|
2 | 506 | 508 | 28 | 390 | 418 | 90 | |||||||||||||||||
|
Currency swaps
|
894 | 292 | 1,186 | 23 | 351 | 374 | 812 | |||||||||||||||||
|
Commodity swaps, options, futures and forwards
|
– | 15,626 | 15,626 | 167 | 14,882 | 15,049 | 577 | |||||||||||||||||
|
Other contracts
|
– | 223 | 223 | – | 992 | 992 | (769 | ) | ||||||||||||||||
|
Total
|
1,362 | 16,647 | 18,009 | 218 | 16,615 | 16,833 | 1,176 | |||||||||||||||||
| 2010 | $ MILLION | |||||||||||||||||||||||
| Asset | Liability | |||||||||||||||||||||||
| Designated |
Not
designated |
Total | Designated |
Not
designated |
Total | Net | ||||||||||||||||||
|
Interest rate swaps
|
399 | – | 399 | – | – | – | 399 | |||||||||||||||||
|
Forward foreign exchange contracts
|
– | 167 | 167 | – | 349 | 349 | (182 | ) | ||||||||||||||||
|
Currency swaps
|
1,013 | 26 | 1,039 | 36 | 354 | 390 | 649 | |||||||||||||||||
|
Commodity swaps, options, futures and forwards
|
92 | 19,281 | 19,373 | 540 | 18,921 | 19,461 | (88 | ) | ||||||||||||||||
|
Other contracts
|
– | 182 | 182 | – | 974 | 974 | (792 | ) | ||||||||||||||||
|
Total
|
1,504 | 19,656 | 21,160 | 576 | 20,598 | 21,174 | (14 | ) | ||||||||||||||||
Table of Contents
|
134
|
Shell Annual Report and Form 20-F 2011 | ||
| Consolidated Financial Statements > Notes to the Consolidated Financial Statements |
| 2011 | $ MILLION | ||||||||||||||||||||||||||||
| Contractual maturities | |||||||||||||||||||||||||||||
|
Less than
1 year |
Between
1 and 2 years |
Between
2 and 3 years |
Between
3 and 4 years |
Between
4 and 5 years |
5 years
and later |
Total | Discounting |
Carrying
amount |
|||||||||||||||||||||
|
Forward foreign exchange contracts
|
314 | 118 | 5 | – | – | – | 437 | (19) | 418 | ||||||||||||||||||||
|
Currency swaps
|
337 | 14 | – | – | 1 | 25 | 377 | (3) | 374 | ||||||||||||||||||||
|
Commodity swaps, options, futures and forwards
|
11,767 | 2,430 | 705 | 417 | 166 | 135 | 15,620 | (571) | 15,049 | ||||||||||||||||||||
|
Other contracts
|
166 | 194 | 200 | 203 | 184 | 410 | 1,357 | (365) | 992 | ||||||||||||||||||||
|
Total
|
12,584 | 2,756 | 910 | 620 | 351 | 570 | 17,791 | (958) | 16,833 | ||||||||||||||||||||
| 2010 | $ MILLION | |||||||||||||||||||||||||||||
| Contractual maturities | ||||||||||||||||||||||||||||||
|
Less than
1 year |
Between
1 and 2 years |
Between
2 and 3 years |
Between
3 and 4 years |
Between
4 and 5 years |
5 years
and later |
Total | Discounting |
Carrying
amount |
||||||||||||||||||||||
|
Forward foreign exchange contracts
|
339 | 22 | 1 | 1 | – | – | 363 | (14 | ) | 349 | ||||||||||||||||||||
|
Currency swaps
|
328 | 66 | 1 | 1 | 2 | 58 | 456 | (66 | ) | 390 | ||||||||||||||||||||
|
Commodity swaps, options, futures and forwards
|
13,499 | 3,713 | 1,329 | 505 | 276 | 339 | 19,661 | (200 | ) | 19,461 | ||||||||||||||||||||
|
Other contracts
|
265 | 188 | 132 | 134 | 137 | 478 | 1,334 | (360 | ) | 974 | ||||||||||||||||||||
|
Total
|
14,431 | 3,989 | 1,463 | 641 | 415 | 875 | 21,814 | (640 | ) | 21,174 | ||||||||||||||||||||
| 2011 | $ MILLION | |||||||||||||||||
|
Prices in
active markets for identical assets/liabilities |
Other
observable inputs |
Unobservable
inputs |
Total | |||||||||||||||
|
Interest rate swaps
|
– | 466 | – | 466 | ||||||||||||||
|
Forward foreign exchange contracts
|
– | 90 | – | 90 | ||||||||||||||
|
Currency swaps
|
2 | 810 | – | 812 | ||||||||||||||
|
Commodity swaps, options, futures and forwards
|
11 | 391 | 175 | 577 | ||||||||||||||
|
Other contracts
|
14 | (19 | ) | (764 | ) | (769 | ) | |||||||||||
|
Total
|
27 | 1,738 | (589 | ) | 1,176 | |||||||||||||
Table of Contents
|
Shell Annual Report and Form 20-F 2011
|
135 | ||
|
Consolidated Financial Statements > Notes to the
Consolidated Financial Statements
|
| 2010 | $ MILLION | |||||||||||||||||
|
Prices in
active markets for identical assets/liabilities |
Other
observable inputs |
Unobservable
inputs |
Total | |||||||||||||||
|
Interest rate swaps
|
– | 399 | – | 399 | ||||||||||||||
|
Forward foreign exchange contracts
|
– | (182 | ) | – | (182 | ) | ||||||||||||
|
Currency swaps
|
– | 649 | – | 649 | ||||||||||||||
|
Commodity swaps, options, futures and forwards
|
185 | 252 | (525 | ) | (88 | ) | ||||||||||||
|
Other contracts
|
(42 | ) | 28 | (778 | ) | (792 | ) | |||||||||||
|
Total
|
143 | 1,146 | (1,303 | ) | (14 | ) | ||||||||||||
| $ MILLION | ||||||||||
| 2011 | 2010 | |||||||||
|
At January 1
|
(1,303 | ) | (1,265 | ) | ||||||
|
Net gains/(losses) recognised in revenue
|
633 | 237 | ||||||||
|
Purchases
|
136 | 112 | ||||||||
|
Sales
|
(231 | ) | (407 | ) | ||||||
|
Recategorisations (net)
|
184 | (9 | ) | |||||||
|
Currency translation differences
|
(8 | ) | 29 | |||||||
|
At December 31
|
(589 | ) | (1,303 | ) | ||||||
| $ MILLION | |||||||||||
| 2011 | 2010 | 2009 | |||||||||
|
Equity-settled plans
|
662 | 478 | 504 | ||||||||
|
Cash-settled plans
|
92 | 223 | 138 | ||||||||
|
Total share-based compensation expense
|
754 | 701 | 642 | ||||||||
|
Fair value of share-based compensation awards granted in the year
|
676 | 466 | 386 | ||||||||
Table of Contents
|
136
|
Shell Annual Report and Form 20-F 2011 | ||
| Consolidated Financial Statements > Notes to the Consolidated Financial Statements |
|
Number of
Class A shares (million) |
Number of
Class B shares (million) |
Number of
Class A ADSs (million) |
Weighted
average remaining contractual life (years) |
|||||||||||||||
|
At January 1, 2011
|
25 | 10 | 8 | 1.0 | ||||||||||||||
|
Granted
|
9 | 3 | 3 | |||||||||||||||
|
Vested
|
(8 | ) | (3 | ) | (3 | ) | ||||||||||||
|
Expired/forfeited
|
(1 | ) | – | – | ||||||||||||||
|
At December 31, 2011
|
25 | 10 | 8 | 1.0 | ||||||||||||||
|
At January 1, 2010
|
23 | 10 | 7 | 1.1 | ||||||||||||||
|
Granted
|
8 | 3 | 3 | |||||||||||||||
|
Vested
|
(4 | ) | (2 | ) | (1 | ) | ||||||||||||
|
Expired/forfeited
|
(2 | ) | (1 | ) | (1 | ) | ||||||||||||
|
At December 31, 2010
|
25 | 10 | 8 | 1.0 | ||||||||||||||
| Class A shares | Class B shares | Class A ADSs | ||||||||||||||||||||||||
|
Number
under option (million) |
Weighted
average exercise price ($) |
Number
under option (million) |
Weighted
average exercise price ($) |
Number
under option (million) |
Weighted
average exercise price ($) |
|||||||||||||||||||||
|
2011
|
29 | 28.84 | 7 | 22.53 | 6 | 48.08 | ||||||||||||||||||||
|
2010
|
46 | 31.33 | 16 | 25.50 | 9 | 50.03 | ||||||||||||||||||||
| $ MILLION | ||||||||
| 2011 | 2010 | |||||||
|
Liability
|
279 | 515 | ||||||
|
Intrinsic value of vested plans
|
279 | 435 | ||||||
Table of Contents
|
Shell Annual Report and Form 20-F 2011
|
137 | ||
|
Consolidated Financial Statements > Notes to the
Consolidated Financial Statements
|
| $ MILLION | ||||||||||||||||||||||||||
|
Merger
reserve |
Share
premium reserve |
Capital
redemption reserve |
Share plan
reserve |
Accumulated
other comprehensive income |
Total | |||||||||||||||||||||
|
At January 1, 2011
|
3,442 | 154 | 57 | 1,483 | 4,958 | 10,094 | ||||||||||||||||||||
|
Other comprehensive loss attributable to Royal Dutch
Shell plc shareholders
|
– | – | – | – | (1,191 | ) | (1,191 | ) | ||||||||||||||||||
|
Scrip dividends
|
(10 | ) | – | – | – | – | (10 | ) | ||||||||||||||||||
|
Repurchases of shares
|
– | – | 3 | – | – | 3 | ||||||||||||||||||||
|
Share-based compensation
|
– | – | – | 88 | – | 88 | ||||||||||||||||||||
|
At December 31, 2011
|
3,432 | 154 | 60 | 1,571 | 3,767 | 8,984 | ||||||||||||||||||||
|
At January 1, 2010
|
3,444 | 154 | 57 | 1,373 | 4,954 | 9,982 | ||||||||||||||||||||
|
Other comprehensive income attributable to Royal
Dutch Shell plc shareholders
|
– | – | – | – | 4 | 4 | ||||||||||||||||||||
|
Scrip dividends
|
(2 | ) | – | – | – | – | (2 | ) | ||||||||||||||||||
|
Share-based compensation
|
– | – | – | 110 | – | 110 | ||||||||||||||||||||
|
At December 31, 2010
|
3,442 | 154 | 57 | 1,483 | 4,958 | 10,094 | ||||||||||||||||||||
|
At January 1, 2009
|
3,444 | 154 | 57 | 1,192 | (1,669 | ) | 3,178 | |||||||||||||||||||
|
Other comprehensive income attributable to Royal Dutch Shell plc
shareholders
|
– | – | – | – | 6,623 | 6,623 | ||||||||||||||||||||
|
Share-based compensation
|
– | – | – | 181 | – | 181 | ||||||||||||||||||||
|
At December 31, 2009
|
3,444 | 154 | 57 | 1,373 | 4,954 | 9,982 | ||||||||||||||||||||
Table of Contents
|
138
|
Shell Annual Report and Form 20-F 2011 | ||
| Consolidated Financial Statements > Notes to the Consolidated Financial Statements |
| 2011 | $ MILLION | |||||||||||||||||||||||||||||||||
| Recognised in 2011 | ||||||||||||||||||||||||||||||||||
|
Jan 1,
2011 |
Pre-tax | Tax | After tax |
Share of
equity- accounted investments |
Non-
controlling interest |
Attributable to
Royal Dutch Shell plc shareholders |
Dec 31,
2011 |
|||||||||||||||||||||||||||
|
Currency translation differences
|
||||||||||||||||||||||||||||||||||
|
Recognised in the period
|
(2,755 | ) | 14 | (2,741 | ) | |||||||||||||||||||||||||||||
|
Reclassified to income
|
(587 | ) | – | (587 | ) | |||||||||||||||||||||||||||||
|
Net currency translation differences
|
2,732 | (3,342 | ) | 14 | (3,328 | ) | 48 | 618 | (2,662 | ) | 70 | |||||||||||||||||||||||
|
Unrealised gains/(losses) on securities
|
||||||||||||||||||||||||||||||||||
|
Recognised in the period
|
1,656 | 3 | 1,659 | |||||||||||||||||||||||||||||||
|
Reclassified to income
|
16 | 9 | 25 | |||||||||||||||||||||||||||||||
|
Net unrealised gains/(losses) on securities
|
2,214 | 1,672 | 12 | 1,684 | 47 | 1 | 1,732 | 3,946 | ||||||||||||||||||||||||||
|
Cash flow hedging gains/(losses)
|
||||||||||||||||||||||||||||||||||
|
Recognised in the period
|
(228 | ) | 6 | (222 | ) | |||||||||||||||||||||||||||||
|
Reclassified to income
|
– | – | – | |||||||||||||||||||||||||||||||
|
Net cash flow hedging gains/(losses)
|
12 | (228 | ) | 6 | (222 | ) | (35 | ) | (4 | ) | (261 | ) | (249 | ) | ||||||||||||||||||||
|
Total
|
4,958 | (1,898 | ) | 32 | (1,866 | ) | 60 | 615 | (1,191 | ) | 3,767 | |||||||||||||||||||||||
| 2010 | $ MILLION | |||||||||||||||||||||||||||||||||
| Recognised in 2010 | ||||||||||||||||||||||||||||||||||
|
Jan 1,
2010 |
Pre-tax | Tax | After tax |
Share of
equity- accounted investments |
Non-
controlling interest |
Attributable to
Royal Dutch Shell plc shareholders |
Dec 31,
2010 |
|||||||||||||||||||||||||||
|
Currency translation differences
|
||||||||||||||||||||||||||||||||||
|
Recognised in the period
|
138 | (4 | ) | 134 | ||||||||||||||||||||||||||||||
|
Reclassified to income
|
(276 | ) | – | (276 | ) | |||||||||||||||||||||||||||||
|
Net currency translation differences
|
2,528 | (138 | ) | (4 | ) | (142 | ) | 388 | (42 | ) | 204 | 2,732 | ||||||||||||||||||||||
|
Unrealised gains/(losses) on securities
|
||||||||||||||||||||||||||||||||||
|
Recognised in the period
|
(272 | ) | (10 | ) | (282 | ) | ||||||||||||||||||||||||||||
|
Reclassified to income
|
(25 | ) | 9 | (16 | ) | |||||||||||||||||||||||||||||
|
Net unrealised gains/(losses) on securities
|
2,464 | (297 | ) | (1 | ) | (298 | ) | 48 | – | (250 | ) | 2,214 | ||||||||||||||||||||||
|
Cash flow hedging gains/(losses)
|
||||||||||||||||||||||||||||||||||
|
Recognised in the period
|
(13 | ) | (1 | ) | (14 | ) | ||||||||||||||||||||||||||||
|
Reclassified to income
|
12 | – | 12 | |||||||||||||||||||||||||||||||
|
Net cash flow hedging gains/(losses)
|
(38 | ) | (1 | ) | (1 | ) | (2 | ) | 52 | – | 50 | 12 | ||||||||||||||||||||||
|
Total
|
4,954 | (436 | ) | (6 | ) | (442 | ) | 488 | (42 | ) | 4 | 4,958 | ||||||||||||||||||||||
| 2009 | $ MILLION | |||||||||||||||||||||||||||||||||
| Recognised in 2009 | ||||||||||||||||||||||||||||||||||
|
Jan 1,
2009 |
Pre-tax | Tax | After tax |
Share of
equity- accounted investments |
Non-
controlling interest |
Attributable to
Royal Dutch Shell plc shareholders |
Dec 31,
2009 |
|||||||||||||||||||||||||||
|
Currency translation differences
|
||||||||||||||||||||||||||||||||||
|
Recognised in the period
|
6,698 | (164 | ) | 6,534 | ||||||||||||||||||||||||||||||
|
Reclassified to income
|
(44 | ) | – | (44 | ) | |||||||||||||||||||||||||||||
|
Net currency translation differences
|
(3,984 | ) | 6,654 | (164 | ) | 6,490 | 74 | (52 | ) | 6,512 | 2,528 | |||||||||||||||||||||||
|
Unrealised gains/(losses) on securities
|
||||||||||||||||||||||||||||||||||
|
Recognised in the period
|
(101 | ) | (16 | ) | (117 | ) | ||||||||||||||||||||||||||||
|
Reclassified to income
|
(27 | ) | 1 | (26 | ) | |||||||||||||||||||||||||||||
|
Net unrealised gains/(losses) on securities
|
2,679 | (128 | ) | (15 | ) | (143 | ) | (72 | ) | – | (215 | ) | 2,464 | |||||||||||||||||||||
|
Cash flow hedging gains/(losses)
|
||||||||||||||||||||||||||||||||||
|
Recognised in the period
|
(37 | ) | (1 | ) | (38 | ) | ||||||||||||||||||||||||||||
|
Reclassified to income
|
318 | 44 | 362 | |||||||||||||||||||||||||||||||
|
Net cash flow hedging gains/(losses)
|
(364 | ) | 281 | 43 | 324 | 2 | – | 326 | (38 | ) | ||||||||||||||||||||||||
|
Total
|
(1,669 | ) | 6,807 | (136 | ) | 6,671 | 4 | (52 | ) | 6,623 | 4,954 | |||||||||||||||||||||||
Table of Contents
|
Shell Annual Report and Form 20-F 2011
|
139 | ||
|
Consolidated Financial Statements > Notes to the
Consolidated Financial Statements
|
| $ MILLION | |||||||||||
| 2011 | 2010 | 2009 | |||||||||
|
Interim dividends – Class A shares
|
|||||||||||
|
Cash: $1.68 per share (2010: $1.68; 2009: $1.66)
|
3,440 | 5,239 | 5,969 | ||||||||
|
Scrip: $1.68 per share (2010: $0.42; 2009: n/a)
|
2,556 | 549 | – | ||||||||
|
Total – Class A shares
|
5,996 | 5,788 | 5,969 | ||||||||
|
Interim dividends – Class B shares
|
|||||||||||
|
Cash: $1.68 per share (2010: $1.68; 2009: $1.66)
|
3,437 | 4,345 | 4,557 | ||||||||
|
Scrip: $1.68 per share (2010: $0.42; 2009: n/a)
|
1,024 | 63 | – | ||||||||
|
Total – Class B shares
|
4,461 | 4,408 | 4,557 | ||||||||
|
Total
|
10,457 | 10,196 | 10,526 | ||||||||
| $ MILLION | |||||||||||
| 2011 | 2010 | 2009 | |||||||||
|
Fees in respect of the audit of the Consolidated and Parent
Company Financial Statements, including audit of consolidation
returns
|
5 | 4 | 4 | ||||||||
|
Other audit fees, principally in respect of audits of accounts
of subsidiaries
|
42 | 50 | 53 | ||||||||
|
Total audit fees
|
47 | 54 | 57 | ||||||||
|
Audit-related fees (for other services provided pursuant to
legislation)
|
2 | 1 | 2 | ||||||||
|
Fees in respect of non-audit services (principally for tax
compliance)
|
– | 1 | 1 | ||||||||
|
Total
|
49 | 56 | 60 | ||||||||
Table of Contents
|
140
|
Shell Annual Report and Form 20-F 2011 | ||
| Consolidated Financial Statements > Notes to the Consolidated Financial Statements |
|
Income attributable
to Royal Dutch Shell plc shareholders ($ million) |
Basic weighted
average number of Class A and B shares |
Diluted weighted
average number of Class A and B shares |
||||||||||||
|
2011
|
30,918 | 6,212,532,421 | 6,221,655,088 | |||||||||||
|
2010
|
20,127 | 6,132,640,190 | 6,139,300,098 | |||||||||||
|
2009
|
12,518 | 6,124,906,119 | 6,128,921,813 | |||||||||||
Table of Contents
|
Shell Annual Report and
Form 20-F
2011
|
141 | ||
|
Supplementary information – oil and gas
(unaudited)
|
OIL AND GAS (UNAUDITED)
Table of Contents
|
142
|
Shell Annual Report and Form 20-F 2011 | ||
| Supplementary information – oil and gas (unaudited) > Crude oil, natural gas liquids, synthetic crude oil and bitumen |
Table of Contents
|
Shell Annual Report and
Form 20-F
2011
|
143 | ||
|
Supplementary information – oil and gas (unaudited)
> Crude oil, natural gas liquids, synthetic crude oil and
bitumen
|
synthetic crude oil and bitumen
| PROVED DEVELOPED AND UNDEVELOPED RESERVES 2011 | MILLION BARRELS | |||||||||||||||||||||||||||||||||||||||||||||||||||||
| Europe | Asia | Oceania | Africa |
North
America |
South
America |
Total | ||||||||||||||||||||||||||||||||||||||||||||||||
| USA | Canada | |||||||||||||||||||||||||||||||||||||||||||||||||||||
|
Oil and
NGL |
Oil and
NGL |
Oil and
NGL |
Oil and
NGL |
Oil and
NGL |
Oil and
NGL |
Synthetic
crude oil |
Bitumen |
Oil and
NGL |
Oil and
NGL |
Synthetic
crude oil |
Bitumen |
All
products |
||||||||||||||||||||||||||||||||||||||||||
|
Shell subsidiaries
|
||||||||||||||||||||||||||||||||||||||||||||||||||||||
|
At January 1
|
587 | 1,493 | 74 | 750 | 556 | 35 | 1,567 | 51 | 66 | 3,561 | 1,567 | 51 | 5,179 | |||||||||||||||||||||||||||||||||||||||||
|
Revisions and reclassifications
|
140 | (293 | ) | 17 | 128 | 28 | 3 | 42 | 9 | 10 | 33 | 42 | 9 | 84 | ||||||||||||||||||||||||||||||||||||||||
|
Improved recovery
|
– | 1 | – | – | – | – | – | – | 1 | 2 | – | – | 2 | |||||||||||||||||||||||||||||||||||||||||
|
Extensions and discoveries
|
81 | 6 | 95 | 1 | 5 | 4 | 116 | – | 3 | 195 | 116 | – | 311 | |||||||||||||||||||||||||||||||||||||||||
|
Purchases of minerals in place
|
– | – | – | – | – | – | – | – | – | – | – | – | – | |||||||||||||||||||||||||||||||||||||||||
|
Sales of minerals in place
|
– | – | – | (29 | ) | (5 | ) | – | – | – | – | (34 | ) | – | – | (34 | ) | |||||||||||||||||||||||||||||||||||||
|
Production [A]
|
(85 | ) | (103 | ) | (11 | ) | (119 | ) | (52 | ) | (7 | ) | (45 | ) | (5 | ) | (17 | ) | (394 | ) | (45 | ) | (5 | ) | (444 | ) | ||||||||||||||||||||||||||||
|
At December 31
|
723 | 1,104 | 175 | 731 | 532 | 35 | 1,680 | 55 | 63 | 3,363 | 1,680 | 55 | 5,098 | |||||||||||||||||||||||||||||||||||||||||
|
Shell share of equity-accounted investments
|
||||||||||||||||||||||||||||||||||||||||||||||||||||||
|
At January 1
|
30 | 592 | 35 | – | 287 | – | – | – | 23 | 967 | – | – | 967 | |||||||||||||||||||||||||||||||||||||||||
|
Revisions and reclassifications
|
3 | 83 | 6 | – | 15 | – | – | – | (1 | ) | 106 | – | – | 106 | ||||||||||||||||||||||||||||||||||||||||
|
Improved recovery
|
– | 1 | – | – | 31 | – | – | – | – | 32 | – | – | 32 | |||||||||||||||||||||||||||||||||||||||||
|
Extensions and discoveries
|
– | 14 | 1 | – | – | – | – | – | – | 15 | – | – | 15 | |||||||||||||||||||||||||||||||||||||||||
|
Purchases of minerals in place
|
– | – | – | – | – | – | – | – | – | – | – | – | – | |||||||||||||||||||||||||||||||||||||||||
|
Sales of minerals in place
|
– | – | (1 | ) | – | (2 | ) | – | – | – | – | (3 | ) | – | – | (3 | ) | |||||||||||||||||||||||||||||||||||||
|
Production
|
(2 | ) | (130 | ) | (7 | ) | – | (25 | ) | – | – | – | (3 | ) | (167 | ) | – | – | (167 | ) | ||||||||||||||||||||||||||||||||||
|
At December 31
|
31 | 560 | 34 | – | 306 | – | – | – | 19 | 950 | – | – | 950 | |||||||||||||||||||||||||||||||||||||||||
|
Total
|
754 | 1,664 | 209 | 731 | 838 | 35 | 1,680 | 55 | 82 | 4,313 | 1,680 | 55 | 6,048 | |||||||||||||||||||||||||||||||||||||||||
|
Reserves attributable to non-controlling interest in Shell
subsidiaries
|
||||||||||||||||||||||||||||||||||||||||||||||||||||||
|
At December 31
|
– | – | – | 13 | – | – | – | – | – | 13 | – | – | 13 | |||||||||||||||||||||||||||||||||||||||||
| [A] | Includes three million barrels consumed in operations. |
| PROVED DEVELOPED RESERVES 2011 | MILLION BARRELS | |||||||||||||||||||||||||||||||||||||||||||||||||||||
| Europe | Asia | Oceania | Africa |
North
America |
South
America |
Total | ||||||||||||||||||||||||||||||||||||||||||||||||
| USA | Canada | |||||||||||||||||||||||||||||||||||||||||||||||||||||
|
Oil and
NGL |
Oil and
NGL |
Oil and
NGL |
Oil and
NGL |
Oil and
NGL |
Oil and
NGL |
Synthetic
crude oil |
Bitumen |
Oil and
NGL |
Oil and
NGL |
Synthetic
crude oil |
Bitumen |
All
products |
||||||||||||||||||||||||||||||||||||||||||
|
Shell subsidiaries
|
||||||||||||||||||||||||||||||||||||||||||||||||||||||
|
At January 1
|
496 | 382 | 36 | 406 | 262 | 26 | 1,214 | 23 | 38 | 1,646 | 1,214 | 23 | 2,883 | |||||||||||||||||||||||||||||||||||||||||
|
At December 31
|
460 | 781 | 35 | 438 | 240 | 22 | 1,249 | 22 | 35 | 2,011 | 1,249 | 22 | 3,282 | |||||||||||||||||||||||||||||||||||||||||
|
Shell share of equity-accounted
|
||||||||||||||||||||||||||||||||||||||||||||||||||||||
|
investments
|
||||||||||||||||||||||||||||||||||||||||||||||||||||||
|
At January 1
|
22 | 402 | 22 | – | 205 | – | – | – | 21 | 672 | – | – | 672 | |||||||||||||||||||||||||||||||||||||||||
|
At December 31
|
30 | 483 | 21 | – | 202 | – | – | – | 18 | 754 | – | – | 754 | |||||||||||||||||||||||||||||||||||||||||
| PROVED UNDEVELOPED RESERVES 2011 | MILLION BARRELS | |||||||||||||||||||||||||||||||||||||||||||||||||||||
| Europe | Asia | Oceania | Africa |
North
America |
South
America |
Total | ||||||||||||||||||||||||||||||||||||||||||||||||
| USA | Canada | |||||||||||||||||||||||||||||||||||||||||||||||||||||
|
Oil and
NGL |
Oil and
NGL |
Oil and
NGL |
Oil and
NGL |
Oil and
NGL |
Oil and
NGL |
Synthetic
crude oil |
Bitumen |
Oil and
NGL |
Oil and
NGL |
Synthetic
crude oil |
Bitumen |
All
products |
||||||||||||||||||||||||||||||||||||||||||
|
Shell subsidiaries
|
||||||||||||||||||||||||||||||||||||||||||||||||||||||
|
At January 1
|
91 | 1,111 | 38 | 344 | 294 | 9 | 353 | 28 | 28 | 1,915 | 353 | 28 | 2,296 | |||||||||||||||||||||||||||||||||||||||||
|
At December 31
|
263 | 323 | 140 | 293 | 292 | 13 | 431 | 33 | 28 | 1,352 | 431 | 33 | 1,816 | |||||||||||||||||||||||||||||||||||||||||
|
Shell share of equity-accounted
|
||||||||||||||||||||||||||||||||||||||||||||||||||||||
|
investments
|
||||||||||||||||||||||||||||||||||||||||||||||||||||||
|
At January 1
|
8 | 190 | 13 | – | 82 | – | – | – | 2 | 295 | – | – | 295 | |||||||||||||||||||||||||||||||||||||||||
|
At December 31
|
1 | 77 | 13 | – | 104 | – | – | – | 1 | 196 | – | – | 196 | |||||||||||||||||||||||||||||||||||||||||
Table of Contents
|
144
|
Shell Annual Report and Form 20-F 2011 | ||
| Supplementary information – oil and gas (unaudited) > Crude oil, natural gas liquids, synthetic crude oil and bitumen |
synthetic crude oil and bitumen
| PROVED DEVELOPED AND UNDEVELOPED RESERVES 2010 | MILLION BARRELS | |||||||||||||||||||||||||||||||||||||||||||||||||||||
| Europe | Asia | Oceania | Africa |
North
America |
South
America |
Total | ||||||||||||||||||||||||||||||||||||||||||||||||
| USA | Canada | |||||||||||||||||||||||||||||||||||||||||||||||||||||
|
Oil and
NGL |
Oil and
NGL |
Oil and
NGL |
Oil and
NGL |
Oil and
NGL |
Oil and
NGL |
Synthetic
crude oil |
Bitumen |
Oil and
NGL |
Oil and
NGL |
Synthetic
crude oil |
Bitumen |
All
products |
||||||||||||||||||||||||||||||||||||||||||
|
Shell subsidiaries
|
||||||||||||||||||||||||||||||||||||||||||||||||||||||
|
At January 1
|
496 | 1,231 | 77 | 735 | 422 | 38 | 1,599 | 57 | 38 | 3,037 | 1,599 | 57 | 4,693 | |||||||||||||||||||||||||||||||||||||||||
|
Revisions and reclassifications
|
205 | 313 | 7 | 138 | 47 | 2 | (4 | ) | (2 | ) | 17 | 729 | (4 | ) | (2 | ) | 723 | |||||||||||||||||||||||||||||||||||||
|
Improved recovery
|
– | 8 | – | – | 54 | – | – | – | – | 62 | – | – | 62 | |||||||||||||||||||||||||||||||||||||||||
|
Extensions and discoveries
|
– | 7 | 1 | 7 | 96 | 2 | – | 3 | 31 | 144 | – | 3 | 147 | |||||||||||||||||||||||||||||||||||||||||
|
Purchases of minerals in place
|
11 | 33 | – | 14 | 1 | – | – | – | – | 59 | – | – | 59 | |||||||||||||||||||||||||||||||||||||||||
|
Sales of minerals in place
|
(23 | ) | – | – | (14 | ) | (5 | ) | – | – | – | – | (42 | ) | – | – | (42 | ) | ||||||||||||||||||||||||||||||||||||
|
Production [A]
|
(102 | ) | (99 | ) | (11 | ) | (130 | ) | (59 | ) | (7 | ) | (28 | ) | (7 | ) | (20 | ) | (428 | ) | (28 | ) | (7 | ) | (463 | ) | ||||||||||||||||||||||||||||
|
At December 31
|
587 | 1,493 | 74 | 750 | 556 | 35 | 1,567 | 51 | 66 | 3,561 | 1,567 | 51 | 5,179 | |||||||||||||||||||||||||||||||||||||||||
|
Shell share of equity-accounted investments
|
||||||||||||||||||||||||||||||||||||||||||||||||||||||
|
At January 1
|
30 | 599 | 58 | – | 288 | – | – | – | 19 | 994 | – | – | 994 | |||||||||||||||||||||||||||||||||||||||||
|
Revisions and reclassifications
|
2 | 101 | 2 | – | 22 | – | – | – | 6 | 133 | – | – | 133 | |||||||||||||||||||||||||||||||||||||||||
|
Improved recovery
|
– | 4 | – | – | – | – | – | – | – | 4 | – | – | 4 | |||||||||||||||||||||||||||||||||||||||||
|
Extensions and discoveries
|
– | 9 | – | – | 4 | – | – | – | 1 | 14 | – | – | 14 | |||||||||||||||||||||||||||||||||||||||||
|
Purchases of minerals in place
|
– | – | – | – | – | – | – | – | – | – | – | – | – | |||||||||||||||||||||||||||||||||||||||||
|
Sales of minerals in place
|
– | – | (15 | ) | – | – | – | – | – | – | (15 | ) | – | – | (15 | ) | ||||||||||||||||||||||||||||||||||||||
|
Production
|
(2 | ) | (121 | ) | (10 | ) | – | (27 | ) | – | – | – | (3 | ) | (163 | ) | – | – | (163 | ) | ||||||||||||||||||||||||||||||||||
|
At December 31
|
30 | 592 | 35 | – | 287 | – | – | – | 23 | 967 | – | – | 967 | |||||||||||||||||||||||||||||||||||||||||
|
Total
|
617 | 2,085 | 109 | 750 | 843 | 35 | 1,567 | 51 | 89 | 4,528 | 1,567 | 51 | 6,146 | |||||||||||||||||||||||||||||||||||||||||
|
Reserves attributable to non-controlling interest in Shell
subsidiaries
|
||||||||||||||||||||||||||||||||||||||||||||||||||||||
|
At December 31
|
– | 5 | – | 13 | – | – | – | – | – | 18 | – | – | 18 | |||||||||||||||||||||||||||||||||||||||||
| [A] | Includes two million barrels consumed in operations. |
| PROVED DEVELOPED RESERVES 2010 | MILLION BARRELS | |||||||||||||||||||||||||||||||||||||||||||||||||||||
| Europe | Asia | Oceania | Africa |
North
America |
South
America |
Total | ||||||||||||||||||||||||||||||||||||||||||||||||
| USA | Canada | |||||||||||||||||||||||||||||||||||||||||||||||||||||
|
Oil and
NGL |
Oil and
NGL |
Oil and
NGL |
Oil and
NGL |
Oil and
NGL |
Oil and
NGL |
Synthetic
crude oil |
Bitumen |
Oil and
NGL |
Oil and
NGL |
Synthetic
crude oil |
Bitumen |
All
products |
||||||||||||||||||||||||||||||||||||||||||
|
Shell subsidiaries
|
||||||||||||||||||||||||||||||||||||||||||||||||||||||
|
At January 1
|
384 | 341 | 40 | 379 | 249 | 23 | 691 | 29 | 35 | 1,451 | 691 | 29 | 2,171 | |||||||||||||||||||||||||||||||||||||||||
|
At December 31
|
496 | 382 | 36 | 406 | 262 | 26 | 1,214 | 23 | 38 | 1,646 | 1,214 | 23 | 2,883 | |||||||||||||||||||||||||||||||||||||||||
|
Shell share of equity-accounted investments
|
||||||||||||||||||||||||||||||||||||||||||||||||||||||
|
At January 1
|
9 | 420 | 39 | – | 216 | – | – | – | 17 | 701 | – | – | 701 | |||||||||||||||||||||||||||||||||||||||||
|
At December 31
|
22 | 402 | 22 | – | 205 | – | – | – | 21 | 672 | – | – | 672 | |||||||||||||||||||||||||||||||||||||||||
| PROVED UNDEVELOPED RESERVES 2010 | MILLION BARRELS | |||||||||||||||||||||||||||||||||||||||||||||||||||||
| Europe | Asia | Oceania | Africa |
North
America |
South
America |
Total | ||||||||||||||||||||||||||||||||||||||||||||||||
| USA | Canada | |||||||||||||||||||||||||||||||||||||||||||||||||||||
|
Oil and
NGL |
Oil and
NGL |
Oil and
NGL |
Oil and
NGL |
Oil and
NGL |
Oil and
NGL |
Synthetic
crude oil |
Bitumen |
Oil and
NGL |
Oil and
NGL |
Synthetic
crude oil |
Bitumen |
All
products |
||||||||||||||||||||||||||||||||||||||||||
|
Shell subsidiaries
|
||||||||||||||||||||||||||||||||||||||||||||||||||||||
|
At January 1
|
112 | 890 | 37 | 356 | 173 | 15 | 908 | 28 | 3 | 1,586 | 908 | 28 | 2,522 | |||||||||||||||||||||||||||||||||||||||||
|
At December 31
|
91 | 1,111 | 38 | 344 | 294 | 9 | 353 | 28 | 28 | 1,915 | 353 | 28 | 2,296 | |||||||||||||||||||||||||||||||||||||||||
|
Shell share of equity-accounted investments
|
||||||||||||||||||||||||||||||||||||||||||||||||||||||
|
At January 1
|
21 | 179 | 19 | – | 72 | – | – | – | 2 | 293 | – | – | 293 | |||||||||||||||||||||||||||||||||||||||||
|
At December 31
|
8 | 190 | 13 | – | 82 | – | – | – | 2 | 295 | – | – | 295 | |||||||||||||||||||||||||||||||||||||||||
Table of Contents
|
Shell Annual Report and
Form 20-F
2011
|
145 | ||
|
Supplementary information – oil and gas (unaudited)
> Crude oil, natural gas liquids, synthetic crude oil and
bitumen
|
synthetic crude oil and bitumen
| PROVED DEVELOPED AND UNDEVELOPED RESERVES 2009 | MILLION BARRELS | |||||||||||||||||||||||||||||||||||||||||||||||||||||
| Europe | Asia | Oceania | Africa |
North
America |
South
America |
Total | ||||||||||||||||||||||||||||||||||||||||||||||||
| USA | Canada | |||||||||||||||||||||||||||||||||||||||||||||||||||||
|
Oil and
NGL |
Oil and
NGL |
Oil and
NGL |
Oil and
NGL |
Oil and
NGL |
Oil and
NGL |
Synthetic
crude oil |
Bitumen |
Oil and
NGL |
Oil and
NGL |
Synthetic
crude oil |
Bitumen |
All
products |
||||||||||||||||||||||||||||||||||||||||||
|
Shell subsidiaries
|
||||||||||||||||||||||||||||||||||||||||||||||||||||||
|
At January 1
|
481 | 1,069 | 65 | 598 | 347 | 40 | – | 8 | 12 | 2,612 | – | 8 | 2,620 | |||||||||||||||||||||||||||||||||||||||||
|
Revisions and reclassifications
|
123 | 210 | 4 | 189 | 92 | 4 | 1,207 | 54 | 11 | 633 | 1,207 | 54 | 1,894 | |||||||||||||||||||||||||||||||||||||||||
|
Improved recovery
|
– | 39 | – | 1 | – | – | – | – | – | 40 | – | – | 40 | |||||||||||||||||||||||||||||||||||||||||
|
Extensions and discoveries
|
7 | 15 | 19 | 51 | 54 | 1 | 423 | 2 | 24 | 171 | 423 | 2 | 596 | |||||||||||||||||||||||||||||||||||||||||
|
Purchases of minerals in place
|
– | – | – | – | – | – | – | – | – | – | – | – | – | |||||||||||||||||||||||||||||||||||||||||
|
Sales of minerals in place
|
(1 | ) | – | – | – | – | – | – | – | – | (1 | ) | – | – | (1 | ) | ||||||||||||||||||||||||||||||||||||||
|
Production [A]
|
(114 | ) | (102 | ) | (11 | ) | (104 | ) | (71 | ) | (7 | ) | (31 | ) | (7 | ) | (9 | ) | (418 | ) | (31 | ) | (7 | ) | (456 | ) | ||||||||||||||||||||||||||||
|
At December 31
|
496 | 1,231 | 77 | 735 | 422 | 38 | 1,599 | 57 | 38 | 3,037 | 1,599 | 57 | 4,693 | |||||||||||||||||||||||||||||||||||||||||
|
Shell share of equity-accounted investments
|
||||||||||||||||||||||||||||||||||||||||||||||||||||||
|
At January 1
|
10 | 493 | 59 | – | 241 | – | – | – | 20 | 823 | – | – | 823 | |||||||||||||||||||||||||||||||||||||||||
|
Revisions and reclassifications
|
22 | 200 | 12 | – | 73 | – | – | – | 1 | 308 | – | – | 308 | |||||||||||||||||||||||||||||||||||||||||
|
Improved recovery
|
– | 2 | – | – | – | – | – | – | – | 2 | – | – | 2 | |||||||||||||||||||||||||||||||||||||||||
|
Extensions and discoveries
|
– | 18 | – | – | 3 | – | – | – | – | 21 | – | – | 21 | |||||||||||||||||||||||||||||||||||||||||
|
Purchases of minerals in place
|
– | – | – | – | – | – | – | – | – | – | – | – | – | |||||||||||||||||||||||||||||||||||||||||
|
Sales of minerals in place
|
– | – | – | – | – | – | – | – | – | – | – | – | – | |||||||||||||||||||||||||||||||||||||||||
|
Production
|
(2 | ) | (114 | ) | (13 | ) | – | (29 | ) | – | – | – | (2 | ) | (160 | ) | – | – | (160 | ) | ||||||||||||||||||||||||||||||||||
|
At December 31
|
30 | 599 | 58 | – | 288 | – | – | – | 19 | 994 | – | – | 994 | |||||||||||||||||||||||||||||||||||||||||
|
Total
|
526 | 1,830 | 135 | 735 | 710 | 38 | 1,599 | 57 | 57 | 4,031 | 1,599 | 57 | 5,687 | |||||||||||||||||||||||||||||||||||||||||
|
Reserves attributable to non-controlling interest in Shell
subsidiaries
|
||||||||||||||||||||||||||||||||||||||||||||||||||||||
|
At December 31
|
– | – | – | 10 | – | – | – | – | – | 10 | – | – | 10 | |||||||||||||||||||||||||||||||||||||||||
| [A] | Includes two million barrels consumed in operations. |
| PROVED DEVELOPED RESERVES 2009 | MILLION BARRELS | |||||||||||||||||||||||||||||||||||||||||||||||||||||
| Europe | Asia | Oceania | Africa |
North
America |
South
America |
Total | ||||||||||||||||||||||||||||||||||||||||||||||||
| USA | Canada | |||||||||||||||||||||||||||||||||||||||||||||||||||||
|
Oil and
NGL |
Oil and
NGL |
Oil and
NGL |
Oil and
NGL |
Oil and
NGL |
Oil and
NGL |
Synthetic
crude oil |
Bitumen |
Oil and
NGL |
Oil and
NGL |
Synthetic
crude oil |
Bitumen |
All
products |
||||||||||||||||||||||||||||||||||||||||||
|
Shell subsidiaries
|
||||||||||||||||||||||||||||||||||||||||||||||||||||||
|
At January 1
|
376 | 307 | 55 | 300 | 175 | 26 | – | 8 | 10 | 1,249 | – | 8 | 1,257 | |||||||||||||||||||||||||||||||||||||||||
|
At December 31
|
384 | 341 | 40 | 379 | 249 | 23 | 691 | 29 | 35 | 1,451 | 691 | 29 | 2,171 | |||||||||||||||||||||||||||||||||||||||||
|
Shell share of equity-accounted investments
|
||||||||||||||||||||||||||||||||||||||||||||||||||||||
|
At January 1
|
8 | 375 | 49 | – | 189 | – | – | – | 19 | 640 | – | – | 640 | |||||||||||||||||||||||||||||||||||||||||
|
At December 31
|
9 | 420 | 39 | – | 216 | – | – | – | 17 | 701 | – | – | 701 | |||||||||||||||||||||||||||||||||||||||||
| PROVED UNDEVELOPED RESERVES 2009 | MILLION BARRELS | |||||||||||||||||||||||||||||||||||||||||||||||||||||
| Europe | Asia | Oceania | Africa |
North
America |
South
America |
Total | ||||||||||||||||||||||||||||||||||||||||||||||||
| USA | Canada | |||||||||||||||||||||||||||||||||||||||||||||||||||||
|
Oil and
NGL |
Oil and
NGL |
Oil and
NGL |
Oil and
NGL |
Oil and
NGL |
Oil and
NGL |
Synthetic
crude oil |
Bitumen |
Oil and
NGL |
Oil and
NGL |
Synthetic
crude oil |
Bitumen |
All
products |
||||||||||||||||||||||||||||||||||||||||||
|
Shell subsidiaries
|
||||||||||||||||||||||||||||||||||||||||||||||||||||||
|
At January 1
|
105 | 762 | 10 | 298 | 172 | 14 | – | – | 2 | 1,363 | – | – | 1,363 | |||||||||||||||||||||||||||||||||||||||||
|
At December 31
|
112 | 890 | 37 | 356 | 173 | 15 | 908 | 28 | 3 | 1,586 | 908 | 28 | 2,522 | |||||||||||||||||||||||||||||||||||||||||
|
Shell share of equity-accounted investments
|
||||||||||||||||||||||||||||||||||||||||||||||||||||||
|
At January 1
|
2 | 118 | 10 | – | 52 | – | – | – | 1 | 183 | – | – | 183 | |||||||||||||||||||||||||||||||||||||||||
|
At December 31
|
21 | 179 | 19 | – | 72 | – | – | – | 2 | 293 | – | – | 293 | |||||||||||||||||||||||||||||||||||||||||
Table of Contents
|
146
|
Shell Annual Report and Form 20-F 2011 | ||
| Supplementary information – oil and gas (unaudited) > Natural gas |
Table of Contents
|
Shell Annual Report and
Form 20-F
2011
|
147 | ||
|
Supplementary information – oil and gas (unaudited)
> Natural gas
|
| PROVED DEVELOPED AND UNDEVELOPED RESERVES 2011 | THOUSAND MILLION STANDARD CUBIC FEET | |||||||||||||||||||||||||||||||||
| North America | South | |||||||||||||||||||||||||||||||||
| Europe | Asia | Oceania | Africa | USA | Canada | America | Total | |||||||||||||||||||||||||||
|
Shell subsidiaries
|
||||||||||||||||||||||||||||||||||
|
At January 1
|
5,082 | 11,970 | 4,814 | 2,989 | 2,671 | 1,308 | 149 | 28,983 | ||||||||||||||||||||||||||
|
Revisions and reclassifications
|
990 | (860 | ) | (118 | ) | 90 | 405 | 155 | (23 | ) | 639 | |||||||||||||||||||||||
|
Improved recovery
|
– | – | – | – | – | – | – | – | ||||||||||||||||||||||||||
|
Extensions and discoveries
|
31 | 239 | 1,471 | 71 | 694 | 816 | – | 3,322 | ||||||||||||||||||||||||||
|
Purchases of minerals in place
|
– | – | – | – | – | – | – | – | ||||||||||||||||||||||||||
|
Sales of minerals in place
|
– | (120 | ) | – | (21 | ) | (213 | ) | (5 | ) | – | (359 | ) | |||||||||||||||||||||
|
Production [A]
|
(605 | ) | (538 | ) | (215 | ) | (329 | ) | (361 | ) | (229 | ) | (22 | ) | (2,299 | ) | ||||||||||||||||||
|
At December 31
|
5,498 | 10,691 | 5,952 | 2,800 | 3,196 | 2,045 | 104 | 30,286 | ||||||||||||||||||||||||||
|
Shell share of equity-accounted investments
|
||||||||||||||||||||||||||||||||||
|
At January 1
|
10,484 | 6,248 | 1,335 | – | 74 | – | 11 | 18,152 | ||||||||||||||||||||||||||
|
Revisions and reclassifications
|
72 | 310 | (112 | ) | – | (6 | ) | – | (4 | ) | 260 | |||||||||||||||||||||||
|
Improved recovery
|
– | – | – | – | 3 | – | – | 3 | ||||||||||||||||||||||||||
|
Extensions and discoveries
|
– | 168 | 14 | – | – | – | – | 182 | ||||||||||||||||||||||||||
|
Purchases of minerals in place
|
– | – | – | – | – | – | – | – | ||||||||||||||||||||||||||
|
Sales of minerals in place
|
(4 | ) | – | (30 | ) | – | (1 | ) | – | – | (35 | ) | ||||||||||||||||||||||
|
Production [B]
|
(649 | ) | (464 | ) | (65 | ) | – | (7 | ) | – | (1 | ) | (1,186 | ) | ||||||||||||||||||||
|
At December 31
|
9,903 | 6,262 | 1,142 | – | 63 | – | 6 | 17,376 | ||||||||||||||||||||||||||
|
Total
|
15,401 | 16,953 | 7,094 | 2,800 | 3,259 | 2,045 | 110 | 47,662 | ||||||||||||||||||||||||||
|
Reserves attributable to noncontrolling interest in Shell
subsidiaries
|
||||||||||||||||||||||||||||||||||
|
At December 31
|
– | 10 | – | 9 | – | – | – | 19 | ||||||||||||||||||||||||||
| [A] | Includes 149 thousand million standard cubic feet consumed in operations. |
| PROVED DEVELOPED RESERVES 2011 | THOUSAND MILLION STANDARD CUBIC FEET | |||||||||||||||||||||||||||||||||
| North America | South | |||||||||||||||||||||||||||||||||
| Europe | Asia | Oceania | Africa | USA | Canada | America | Total | |||||||||||||||||||||||||||
|
Shell subsidiaries
|
||||||||||||||||||||||||||||||||||
|
At January 1
|
4,358 | 2,273 | 1,041 | 1,092 | 1,460 | 869 | 89 | 11,182 | ||||||||||||||||||||||||||
|
At December 31
|
4,685 | 9,379 | 839 | 1,112 | 1,506 | 951 | 92 | 18,564 | ||||||||||||||||||||||||||
|
Shell share of equity-accounted investments
|
||||||||||||||||||||||||||||||||||
|
At January 1
|
8,154 | 2,510 | 311 | – | 55 | – | 9 | 11,039 | ||||||||||||||||||||||||||
|
At December 31
|
7,837 | 4,936 | 241 | – | 46 | – | 5 | 13,065 | ||||||||||||||||||||||||||
| PROVED UNDEVELOPED RESERVES 2011 | THOUSAND MILLION STANDARD CUBIC FEET | |||||||||||||||||||||||||||||||||
| North America | South | |||||||||||||||||||||||||||||||||
| Europe | Asia | Oceania | Africa | USA | Canada | America | Total | |||||||||||||||||||||||||||
|
Shell subsidiaries
|
||||||||||||||||||||||||||||||||||
|
At January 1
|
724 | 9,697 | 3,773 | 1,897 | 1,211 | 439 | 60 | 17,801 | ||||||||||||||||||||||||||
|
At December 31
|
813 | 1,312 | 5,113 | 1,688 | 1,690 | 1,094 | 12 | 11,722 | ||||||||||||||||||||||||||
|
Shell share of equity-accounted investments
|
||||||||||||||||||||||||||||||||||
|
At January 1
|
2,330 | 3,738 | 1,024 | – | 19 | – | 2 | 7,113 | ||||||||||||||||||||||||||
|
At December 31
|
2,066 | 1,326 | 901 | – | 17 | – | 1 | 4,311 | ||||||||||||||||||||||||||
Table of Contents
|
148
|
Shell Annual Report and Form 20-F 2011 | ||
| Supplementary information – oil and gas (unaudited) > Natural gas |
| PROVED DEVELOPED AND UNDEVELOPED RESERVES 2010 | THOUSAND MILLION STANDARD CUBIC FEET | |||||||||||||||||||||||||||||||||
| North America | South | |||||||||||||||||||||||||||||||||
| Europe | Asia | Oceania | Africa | USA | Canada | America | Total | |||||||||||||||||||||||||||
|
Shell subsidiaries
|
||||||||||||||||||||||||||||||||||
|
At January 1
|
4,722 | 13,733 | 4,800 | 3,038 | 2,258 | 1,172 | 238 | 29,961 | ||||||||||||||||||||||||||
|
Revisions and reclassifications
|
1,077 | (1,379 | ) | 262 | 118 | 292 | 36 | (75 | ) | 331 | ||||||||||||||||||||||||
|
Improved recovery
|
– | – | – | – | 41 | – | – | 41 | ||||||||||||||||||||||||||
|
Extensions and discoveries
|
– | 122 | 9 | 194 | 432 | 334 | 13 | 1,104 | ||||||||||||||||||||||||||
|
Purchases of minerals in place
|
2 | 9 | – | 5 | 173 | – | – | 189 | ||||||||||||||||||||||||||
|
Sales of minerals in place
|
(20 | ) | – | (20 | ) | (80 | ) | (94 | ) | (11 | ) | (2 | ) | (227 | ) | |||||||||||||||||||
|
Production [A]
|
(699 | ) | (515 | ) | (237 | ) | (286 | ) | (431 | ) | (223 | ) | (25 | ) | (2,416 | ) | ||||||||||||||||||
|
At December 31
|
5,082 | 11,970 | 4,814 | 2,989 | 2,671 | 1,308 | 149 | 28,983 | ||||||||||||||||||||||||||
|
Shell share of equity-accounted investments
|
||||||||||||||||||||||||||||||||||
|
At January 1
|
11,113 | 6,079 | 1,832 | – | 65 | – | 5 | 19,094 | ||||||||||||||||||||||||||
|
Revisions and reclassifications
|
103 | 321 | 52 | – | 16 | – | 6 | 498 | ||||||||||||||||||||||||||
|
Improved recovery
|
– | 1 | – | – | – | – | – | 1 | ||||||||||||||||||||||||||
|
Extensions and discoveries
|
– | 184 | – | – | – | – | – | 184 | ||||||||||||||||||||||||||
|
Purchases of minerals in place
|
– | – | 48 | – | – | – | – | 48 | ||||||||||||||||||||||||||
|
Sales of minerals in place
|
– | – | (516 | ) | – | – | – | – | (516 | ) | ||||||||||||||||||||||||
|
Production [B]
|
(732 | ) | (337 | ) | (81 | ) | – | (7 | ) | – | – | (1,157 | ) | |||||||||||||||||||||
|
At December 31
|
10,484 | 6,248 | 1,335 | – | 74 | – | 11 | 18,152 | ||||||||||||||||||||||||||
|
Total
|
15,566 | 18,218 | 6,149 | 2,989 | 2,745 | 1,308 | 160 | 47,135 | ||||||||||||||||||||||||||
|
Reserves attributable to non-controlling interest in Shell
subsidiaries
|
||||||||||||||||||||||||||||||||||
|
At December 31
|
– | 24 | – | 8 | – | – | – | 32 | ||||||||||||||||||||||||||
| [A] | Includes 138 thousand million standard cubic feet consumed in operations. | |
| [B] | Includes 40 thousand million standard cubic feet consumed in operations. |
| PROVED DEVELOPED RESERVES 2010 | THOUSAND MILLION STANDARD CUBIC FEET | |||||||||||||||||||||||||||||||||
| North America | South | |||||||||||||||||||||||||||||||||
| Europe | Asia | Oceania | Africa | USA | Canada | America | Total | |||||||||||||||||||||||||||
|
Shell subsidiaries
|
||||||||||||||||||||||||||||||||||
|
At January 1
|
3,574 | 2,418 | 1,046 | 957 | 1,248 | 754 | 173 | 10,170 | ||||||||||||||||||||||||||
|
At December 31
|
4,358 | 2,273 | 1,041 | 1,092 | 1,460 | 869 | 89 | 11,182 | ||||||||||||||||||||||||||
|
Shell share of equity-accounted investments
|
||||||||||||||||||||||||||||||||||
|
At January 1
|
8,732 | 1,973 | 354 | – | 56 | – | 5 | 11,120 | ||||||||||||||||||||||||||
|
At December 31
|
8,154 | 2,510 | 311 | – | 55 | – | 9 | 11,039 | ||||||||||||||||||||||||||
| PROVED UNDEVELOPED RESERVES 2010 | THOUSAND MILLION STANDARD CUBIC FEET | |||||||||||||||||||||||||||||||||
| North America | South | |||||||||||||||||||||||||||||||||
| Europe | Asia | Oceania | Africa | USA | Canada | America | Total | |||||||||||||||||||||||||||
|
Shell subsidiaries
|
||||||||||||||||||||||||||||||||||
|
At January 1
|
1,148 | 11,315 | 3,754 | 2,081 | 1,010 | 418 | 65 | 19,791 | ||||||||||||||||||||||||||
|
At December 31
|
724 | 9,697 | 3,773 | 1,897 | 1,211 | 439 | 60 | 17,801 | ||||||||||||||||||||||||||
|
Shell share of equity-accounted investments
|
||||||||||||||||||||||||||||||||||
|
At January 1
|
2,381 | 4,106 | 1,478 | – | 9 | – | – | 7,974 | ||||||||||||||||||||||||||
|
At December 31
|
2,330 | 3,738 | 1,024 | – | 19 | – | 2 | 7,113 | ||||||||||||||||||||||||||
Table of Contents
|
Shell Annual Report and
Form 20-F
2011
|
149 | ||
|
Supplementary information – oil and gas (unaudited)
> Natural gas
|
| PROVED DEVELOPED AND UNDEVELOPED RESERVES 2009 | THOUSAND MILLION STANDARD CUBIC FEET | |||||||||||||||||||||||||||||||||
| North America | South | |||||||||||||||||||||||||||||||||
| Europe | Asia | Oceania | Africa | USA | Canada | America | Total | |||||||||||||||||||||||||||
|
Shell subsidiaries
|
||||||||||||||||||||||||||||||||||
|
At January 1
|
4,641 | 13,556 | 2,045 | 1,759 | 2,392 | 1,231 | 303 | 25,927 | ||||||||||||||||||||||||||
|
Revisions and reclassifications
|
751 | 580 | 94 | 740 | 36 | (4 | ) | (41 | ) | 2,156 | ||||||||||||||||||||||||
|
Improved recovery
|
– | – | – | – | – | – | – | – | ||||||||||||||||||||||||||
|
Extensions and discoveries
|
30 | 198 | 2,880 | 720 | 229 | 160 | 8 | 4,225 | ||||||||||||||||||||||||||
|
Purchases of minerals in place
|
– | – | 16 | – | – | – | – | 16 | ||||||||||||||||||||||||||
|
Sales of minerals in place
|
– | – | – | – | – | – | – | – | ||||||||||||||||||||||||||
|
Production [A]
|
(700 | ) | (601 | ) | (235 | ) | (181 | ) | (399 | ) | (215 | ) | (32 | ) | (2,363 | ) | ||||||||||||||||||
|
At December 31
|
4,722 | 13,733 | 4,800 | 3,038 | 2,258 | 1,172 | 238 | 29,961 | ||||||||||||||||||||||||||
|
Shell share of equity-accounted investments
|
||||||||||||||||||||||||||||||||||
|
At January 1
|
11,091 | 5,256 | 1,055 | – | 10 | – | – | 17,412 | ||||||||||||||||||||||||||
|
Revisions and reclassifications
|
594 | 1,008 | 862 | – | 63 | – | 5 | 2,532 | ||||||||||||||||||||||||||
|
Improved recovery
|
– | 1 | – | – | – | – | – | 1 | ||||||||||||||||||||||||||
|
Extensions and discoveries
|
29 | 71 | – | – | 1 | – | – | 101 | ||||||||||||||||||||||||||
|
Purchases of minerals in place
|
– | – | – | – | – | – | – | – | ||||||||||||||||||||||||||
|
Sales of minerals in place
|
– | – | – | – | – | – | – | – | ||||||||||||||||||||||||||
|
Production [B]
|
(601 | ) | (257 | ) | (85 | ) | – | (9 | ) | – | – | (952 | ) | |||||||||||||||||||||
|
At December 31
|
11,113 | 6,079 | 1,832 | – | 65 | – | 5 | 19,094 | ||||||||||||||||||||||||||
|
Total
|
15,835 | 19,812 | 6,632 | 3,038 | 2,323 | 1,172 | 243 | 49,055 | ||||||||||||||||||||||||||
|
Reserves attributable to non-controlling interest in Shell
subsidiaries
|
||||||||||||||||||||||||||||||||||
|
At December 31
|
– | 15 | – | 5 | – | – | – | 20 | ||||||||||||||||||||||||||
| [A] | Includes 188 thousand million standard cubic feet consumed in operations. | |
| [B] | Includes 30 thousand million standard cubic feet consumed in operations. |
| PROVED DEVELOPED RESERVES 2009 | THOUSAND MILLION STANDARD CUBIC FEET | |||||||||||||||||||||||||||||||||
| North America | South | |||||||||||||||||||||||||||||||||
| Europe | Asia | Oceania | Africa | USA | Canada | America | Total | |||||||||||||||||||||||||||
|
Shell subsidiaries
|
||||||||||||||||||||||||||||||||||
|
At January 1
|
3,371 | 2,021 | 1,501 | 593 | 1,194 | 747 | 144 | 9,571 | ||||||||||||||||||||||||||
|
At December 31
|
3,574 | 2,418 | 1,046 | 957 | 1,248 | 754 | 173 | 10,170 | ||||||||||||||||||||||||||
|
Shell share of equity-accounted investments
|
||||||||||||||||||||||||||||||||||
|
At January 1
|
9,131 | 852 | 575 | – | 8 | – | – | 10,566 | ||||||||||||||||||||||||||
|
At December 31
|
8,732 | 1,973 | 354 | – | 56 | – | 5 | 11,120 | ||||||||||||||||||||||||||
| PROVED UNDEVELOPED RESERVES 2009 | THOUSAND MILLION STANDARD CUBIC FEET | |||||||||||||||||||||||||||||||||
| North America | South | |||||||||||||||||||||||||||||||||
| Europe | Asia | Oceania | Africa | USA | Canada | America | Total | |||||||||||||||||||||||||||
|
Shell subsidiaries
|
||||||||||||||||||||||||||||||||||
|
At January 1
|
1,270 | 11,535 | 544 | 1,166 | 1,198 | 484 | 159 | 16,356 | ||||||||||||||||||||||||||
|
At December 31
|
1,148 | 11,315 | 3,754 | 2,081 | 1,010 | 418 | 65 | 19,791 | ||||||||||||||||||||||||||
|
Shell share of equity-accounted investments
|
||||||||||||||||||||||||||||||||||
|
At January 1
|
1,960 | 4,404 | 480 | – | 2 | – | – | 6,846 | ||||||||||||||||||||||||||
|
At December 31
|
2,381 | 4,106 | 1,478 | – | 9 | – | – | 7,974 | ||||||||||||||||||||||||||
Table of Contents
|
150
|
Shell Annual Report and Form 20-F 2011 | ||
| Supplementary information – oil and gas (unaudited) > Standardised measure of discounted future cash flows |
| 2011 – SHELL SUBSIDIARIES | $ MILLION | |||||||||||||||||||||||||||||||||
| North America | South | |||||||||||||||||||||||||||||||||
| Europe | Asia | Oceania | Africa | USA | Canada | America | Total | |||||||||||||||||||||||||||
|
Future cash inflows
|
134,985 | 131,083 | 66,460 | 88,833 | 68,992 | 161,029 | 6,291 | 657,673 | ||||||||||||||||||||||||||
|
Future production costs
|
39,102 | 26,746 | 15,029 | 25,795 | 37,258 | 69,986 | 2,904 | 216,820 | ||||||||||||||||||||||||||
|
Future development costs
|
15,548 | 13,280 | 23,692 | 7,325 | 15,004 | 20,935 | 1,370 | 97,154 | ||||||||||||||||||||||||||
|
Future tax expenses
|
51,533 | 41,412 | 8,257 | 32,812 | 6,066 | 18,028 | 762 | 158,870 | ||||||||||||||||||||||||||
|
Future net cash flows
|
28,802 | 49,645 | 19,482 | 22,901 | 10,664 | 52,080 | 1,255 | 184,829 | ||||||||||||||||||||||||||
|
Effect of discounting cash flows at 10%
|
12,002 | 22,306 | 17,510 | 7,454 | 3,934 | 35,312 | 293 | 98,811 | ||||||||||||||||||||||||||
|
Standardised measure of discounted future net cash flows
|
16,800 | 27,339 | 1,972 | 15,447 | 6,730 | 16,768 | 962 | 86,018 | ||||||||||||||||||||||||||
|
Non-controlling interest included
|
– | 12 | – | 269 | – | – | – | 281 | ||||||||||||||||||||||||||
| 2011 – SHELL SHARE OF EQUITY-ACCOUNTED INVESTMENTS | $ MILLION | |||||||||||||||||||||||||||||||||
| North America | South | |||||||||||||||||||||||||||||||||
| Europe | Asia | Oceania [A] | Africa | USA | Canada | America | Total | |||||||||||||||||||||||||||
|
Future cash inflows
|
85,799 | 103,430 | 17,173 | – | 33,018 | – | 1,909 | 241,329 | ||||||||||||||||||||||||||
|
Future production costs
|
58,419 | 48,613 | 5,089 | – | 11,512 | – | 826 | 124,459 | ||||||||||||||||||||||||||
|
Future development costs
|
2,290 | 6,651 | 4,167 | – | 3,361 | – | 211 | 16,680 | ||||||||||||||||||||||||||
|
Future tax expenses
|
9,753 | 20,679 | 2,315 | – | 6,350 | – | 541 | 39,638 | ||||||||||||||||||||||||||
|
Future net cash flows
|
15,337 | 27,487 | 5,602 | – | 11,795 | – | 331 | 60,552 | ||||||||||||||||||||||||||
|
Effect of discounting cash flows at 10%
|
6,758 | 11,056 | 2,301 | – | 5,151 | – | 120 | 25,386 | ||||||||||||||||||||||||||
|
Standardised measure of discounted future net cash flows
|
8,579 | 16,431 | 3,301 | – | 6,644 | – | 211 | 35,166 | ||||||||||||||||||||||||||
| [A] | Includes Shell’s ownership of 24% of Woodside Petroleum Ltd, a publicly listed company on the Australian Securities Exchange. We have limited access to data; accordingly, the numbers are estimated. |
| 2010 – SHELL SUBSIDIARIES | $ MILLION | |||||||||||||||||||||||||||||||||
| North America | South | |||||||||||||||||||||||||||||||||
| Europe | Asia | Oceania | Africa | USA | Canada | America | Total | |||||||||||||||||||||||||||
|
Future cash inflows
|
82,004 | 125,394 | 35,794 | 65,203 | 53,573 | 114,649 | 4,873 | 481,490 | ||||||||||||||||||||||||||
|
Future production costs
|
28,812 | 24,155 | 8,797 | 22,453 | 25,277 | 67,835 | 2,507 | 179,836 | ||||||||||||||||||||||||||
|
Future development costs
|
11,719 | 17,432 | 11,946 | 7,770 | 11,753 | 18,988 | 1,330 | 80,938 | ||||||||||||||||||||||||||
|
Future tax expenses
|
25,739 | 34,635 | 5,090 | 21,854 | 5,852 | 7,521 | 572 | 101,263 | ||||||||||||||||||||||||||
|
Future net cash flows
|
15,734 | 49,172 | 9,961 | 13,126 | 10,691 | 20,305 | 464 | 119,453 | ||||||||||||||||||||||||||
|
Effect of discounting cash flows at 10%
|
4,150 | 29,399 | 8,498 | 4,111 | 3,835 | 13,524 | 82 | 63,599 | ||||||||||||||||||||||||||
|
Standardised measure of discounted future net cash flows
|
11,584 | 19,773 | 1,463 | 9,015 | 6,856 | 6,781 | 382 | 55,854 | ||||||||||||||||||||||||||
|
Non-controlling interest included
|
– | 126 | – | 166 | – | – | – | 292 | ||||||||||||||||||||||||||
Table of Contents
|
Shell Annual Report and Form 20-F 2011
|
151 | ||
|
Supplementary information – oil and gas (unaudited)
> Standardised measure of discounted future cash flows
|
| 2010 – SHELL SHARE OF EQUITY-ACCOUNTED INVESTMENTS | $ MILLION | |||||||||||||||||||||||||||||||||
| North America | South | |||||||||||||||||||||||||||||||||
| Europe | Asia | Oceania [A] | Africa | USA | Canada | America | Total | |||||||||||||||||||||||||||
|
Future cash inflows
|
71,140 | 69,452 | 12,179 | – | 21,994 | – | 1,667 | 176,432 | ||||||||||||||||||||||||||
|
Future production costs
|
50,406 | 30,703 | 3,083 | – | 8,099 | – | 493 | 92,784 | ||||||||||||||||||||||||||
|
Future development costs
|
2,265 | 5,116 | 1,410 | – | 2,944 | – | 118 | 11,853 | ||||||||||||||||||||||||||
|
Future tax expenses
|
6,881 | 14,750 | 1,751 | – | 3,921 | – | 531 | 27,834 | ||||||||||||||||||||||||||
|
Future net cash flows
|
11,588 | 18,883 | 5,935 | – | 7,030 | – | 525 | 43,961 | ||||||||||||||||||||||||||
|
Effect of discounting cash flows at 10%
|
5,159 | 7,024 | 2,423 | – | 2,928 | – | 165 | 17,699 | ||||||||||||||||||||||||||
|
Standardised measure of discounted future net cash flows
|
6,429 | 11,859 | 3,512 | – | 4,102 | – | 360 | 26,262 | ||||||||||||||||||||||||||
| [A] | Includes Shell’s ownership of 24% of Woodside Petroleum Ltd as from November 2010 (previously: 34%), a publicly listed company on the Australian Securities Exchange. We have limited access to data; accordingly, the numbers are estimated. |
| 2009 – SHELL SUBSIDIARIES | $ MILLION | |||||||||||||||||||||||||||||||||
| North America | South | |||||||||||||||||||||||||||||||||
| Europe | Asia | Oceania | Africa | USA | Canada | America | Total | |||||||||||||||||||||||||||
|
Future cash inflows
|
61,836 | 87,327 | 29,353 | 48,742 | 32,766 | 91,855 | 2,481 | 354,360 | ||||||||||||||||||||||||||
|
Future production costs
|
23,116 | 18,367 | 9,169 | 18,697 | 16,964 | 62,287 | 1,268 | 149,868 | ||||||||||||||||||||||||||
|
Future development costs
|
11,724 | 18,429 | 12,977 | 5,975 | 6,131 | 20,303 | 444 | 75,983 | ||||||||||||||||||||||||||
|
Future tax expenses
|
14,496 | 21,254 | 2,955 | 10,929 | 3,496 | 2,969 | 313 | 56,412 | ||||||||||||||||||||||||||
|
Future net cash flows
|
12,500 | 29,277 | 4,252 | 13,141 | 6,175 | 6,296 | 456 | 72,097 | ||||||||||||||||||||||||||
|
Effect of discounting cash flows at 10%
|
3,010 | 19,848 | 5,319 | 3,649 | 1,517 | 5,306 | 53 | 38,702 | ||||||||||||||||||||||||||
|
Standardised measure of discounted future net cash flows
|
9,490 | 9,429 | (1,067 | ) | 9,492 | 4,658 | 990 | 403 | 33,395 | |||||||||||||||||||||||||
|
Non-controlling interest included
|
– | 5 | – | 105 | – | – | – | 110 | ||||||||||||||||||||||||||
| 2009 – SHELL SHARE OF EQUITY-ACCOUNTED INVESTMENTS | $ MILLION | |||||||||||||||||||||||||||||||||
| North America | South | |||||||||||||||||||||||||||||||||
| Europe | Asia | Oceania [A] | Africa | USA | Canada | America | Total | |||||||||||||||||||||||||||
|
Future cash inflows
|
84,784 | 54,598 | 29,412 | – | 15,778 | – | 1,001 | 185,573 | ||||||||||||||||||||||||||
|
Future production costs
|
58,794 | 24,105 | 13,549 | – | 7,565 | – | 459 | 104,472 | ||||||||||||||||||||||||||
|
Future development costs
|
2,624 | 5,679 | 4,700 | – | 2,488 | – | 54 | 15,545 | ||||||||||||||||||||||||||
|
Future tax expenses
|
9,105 | 10,576 | 4,658 | – | 2,073 | – | 286 | 26,698 | ||||||||||||||||||||||||||
|
Future net cash flows
|
14,261 | 14,238 | 6,505 | – | 3,652 | – | 202 | 38,858 | ||||||||||||||||||||||||||
|
Effect of discounting cash flows at 10%
|
6,530 | 5,485 | 3,020 | – | 1,443 | – | 34 | 16,512 | ||||||||||||||||||||||||||
|
Standardised measure of discounted future net cash flows
|
7,731 | 8,753 | 3,485 | – | 2,209 | – | 168 | 22,346 | ||||||||||||||||||||||||||
| [A] | Reflects Shell’s ownership of 34% of Woodside Petroleum Ltd, a publicly listed company on the Australian Securities Exchange. We have limited access to data; accordingly, the numbers are estimated. |
Table of Contents
|
152
|
Shell Annual Report and Form 20-F 2011 | ||
| Supplementary information – oil and gas (unaudited) > Standardised measure of discounted future cash flows |
| 2011 | $ MILLION | |||||||||||||
|
Shell
subsidiaries |
Shell share
of equity- accounted investments |
Total | ||||||||||||
|
At January 1
|
55,854 | 26,262 | 82,116 | |||||||||||
|
Net changes in prices and production costs
|
80,192 | 23,636 | 103,828 | |||||||||||
|
Revisions of previous reserves estimates
|
15,144 | 3,205 | 18,349 | |||||||||||
|
Extensions, discoveries and improved recovery
|
14,508 | 1,725 | 16,233 | |||||||||||
|
Purchases and sales of minerals in place
|
(1,957 | ) | (288 | ) | (2,245 | ) | ||||||||
|
Development cost related to future production
|
(21,733 | ) | (4,173 | ) | (25,906 | ) | ||||||||
|
Sales and transfers of oil and gas, net of production costs
|
(47,669 | ) | (15,296 | ) | (62,965 | ) | ||||||||
|
Development cost incurred during the year
|
13,529 | 2,607 | 16,136 | |||||||||||
|
Accretion of discount
|
10,572 | 3,727 | 14,299 | |||||||||||
|
Net change in income tax
|
(32,422 | ) | (6,239 | ) | (38,661 | ) | ||||||||
|
At December 31
|
86,018 | 35,166 | 121,184 | |||||||||||
| 2010 | $ MILLION | |||||||||||||
|
Shell
subsidiaries |
Shell share
of equity- accounted investments |
Total | ||||||||||||
|
At January 1
|
33,395 | 22,346 | 55,741 | |||||||||||
|
Net changes in prices and production costs
|
49,223 | 10,585 | 59,808 | |||||||||||
|
Revisions of previous reserves estimates
|
23,288 | 3,732 | 27,020 | |||||||||||
|
Extensions, discoveries and improved recovery
|
5,486 | 785 | 6,271 | |||||||||||
|
Purchases and sales of minerals in place
|
317 | (2,070 | ) | (1,753 | ) | |||||||||
|
Development cost related to future production
|
(12,355 | ) | (698 | ) | (13,053 | ) | ||||||||
|
Sales and transfers of oil and gas, net of production costs
|
(36,841 | ) | (11,432 | ) | (48,273 | ) | ||||||||
|
Development cost incurred during the year
|
13,454 | 2,380 | 15,834 | |||||||||||
|
Accretion of discount
|
5,928 | 3,393 | 9,321 | |||||||||||
|
Net change in income tax
|
(26,041 | ) | (2,759 | ) | (28,800 | ) | ||||||||
|
At December 31
|
55,854 | 26,262 | 82,116 | |||||||||||
| 2009 | $ MILLION | |||||||||||||
|
Shell
subsidiaries |
Shell share
of equity- accounted investments |
Total | ||||||||||||
|
At January 1
|
17,995 | 14,000 | 31,995 | |||||||||||
|
Net changes in prices and production costs
|
35,269 | 15,067 | 50,336 | |||||||||||
|
Revisions of previous reserve estimates
|
18,267 | 7,045 | 25,312 | |||||||||||
|
Extensions, discoveries and improved recovery
|
17,898 | 2,328 | 20,226 | |||||||||||
|
Purchases and sales of minerals in place
|
(23 | ) | – | (23 | ) | |||||||||
|
Development cost related to future production
|
(28,834 | ) | (6,071 | ) | (34,905 | ) | ||||||||
|
Sales and transfers of oil and gas, net of production costs
|
(27,443 | ) | (12,829 | ) | (40,272 | ) | ||||||||
|
Development cost incurred during the year
|
14,569 | 3,861 | 18,430 | |||||||||||
|
Accretion of discount
|
2,901 | 2,994 | 5,895 | |||||||||||
|
Net change in income tax
|
(17,204 | ) | (4,049 | ) | (21,253 | ) | ||||||||
|
At December 31
|
33,395 | 22,346 | 55,741 | |||||||||||
Table of Contents
|
Shell Annual Report and Form 20-F 2011
|
153 | ||
|
Supplementary information – oil and gas (unaudited)
> Oil and gas exploration and production activities
capitalised costs
|
| $ MILLION | ||||||||||
| 2011 | 2010 | |||||||||
|
Cost
|
||||||||||
|
Proved properties [A]
|
167,690 | 159,099 | ||||||||
|
Unproved properties
|
28,474 | 26,420 | ||||||||
|
Support equipment and facilities
|
6,313 | 6,034 | ||||||||
| 202,477 | 191,553 | |||||||||
|
Depreciation
|
||||||||||
|
Proved properties [A]
|
92,562 | 90,873 | ||||||||
|
Unproved properties
|
2,351 | 2,095 | ||||||||
|
Support equipment and facilities
|
3,515 | 3,255 | ||||||||
| 98,428 | 96,223 | |||||||||
|
Net capitalised costs
|
104,049 | 95,330 | ||||||||
| [A] | Includes capitalised asset decommissioning and restoration costs and related depreciation. |
| $ MILLION | ||||||||||
| 2011 | 2010 | |||||||||
|
Cost
|
||||||||||
|
Proved properties [A]
|
45,389 | 41,968 | ||||||||
|
Unproved properties
|
2,563 | 3,058 | ||||||||
|
Support equipment and facilities
|
3,249 | 3,156 | ||||||||
| 51,201 | 48,182 | |||||||||
|
Depreciation
|
||||||||||
|
Proved properties [A]
|
23,669 | 22,576 | ||||||||
|
Unproved properties
|
155 | 131 | ||||||||
|
Support equipment and facilities
|
1,798 | 1,657 | ||||||||
| 25,622 | 24,364 | |||||||||
|
Net capitalised costs
|
25,579 | 23,818 | ||||||||
| [A] | Includes capitalised asset decommissioning and restoration costs and related depreciation. |
Table of Contents
|
154
|
Shell Annual Report and Form 20-F 2011 | ||
| Supplementary information – oil and gas (unaudited) > Oil and gas exploration and production activities costs incurred |
| 2011 | $ MILLION | |||||||||||||||||||||||||||||||||
| North America | South | |||||||||||||||||||||||||||||||||
| Europe | Asia | Oceania | Africa | USA | Other [B] | America | Total | |||||||||||||||||||||||||||
|
Acquisition of properties
|
||||||||||||||||||||||||||||||||||
|
Proved
|
32 | 1 | – | 1 | – | 1 | – | 35 | ||||||||||||||||||||||||||
|
Unproved
|
1 | 1,181 | 73 | 174 | 1,417 | 763 | 23 | 3,632 | ||||||||||||||||||||||||||
|
Exploration
|
321 | 510 | 300 | 404 | 3,138 | 663 | 386 | 5,722 | ||||||||||||||||||||||||||
|
Development [A]
|
1,152 | 3,089 | 1,196 | 1,047 | 2,697 | 1,614 | 340 | 11,135 | ||||||||||||||||||||||||||
| [A] | Includes capitalised asset decommissioning and restoration costs. | |
| [B] | Comprises Canada and Greenland. |
| 2010 | $ MILLION | |||||||||||||||||||||||||||||||||
| North America | South | |||||||||||||||||||||||||||||||||
| Europe | Asia | Oceania | Africa | USA | Other [B] | America | Total | |||||||||||||||||||||||||||
|
Acquisition of properties
|
||||||||||||||||||||||||||||||||||
|
Proved
|
302 | 4 | – | 313 | 38 | – | – | 657 | ||||||||||||||||||||||||||
|
Unproved
|
304 | 110 | – | 330 | 5,776 | 86 | – | 6,606 | ||||||||||||||||||||||||||
|
Exploration
|
380 | 414 | 410 | 508 | 1,939 | 443 | 277 | 4,371 | ||||||||||||||||||||||||||
|
Development [A]
|
2,590 | 2,800 | 437 | 1,569 | 2,072 | 3,239 | 307 | 13,014 | ||||||||||||||||||||||||||
| [A] | Includes capitalised asset decommissioning and restoration costs. | |
| [B] | Comprises Canada and Greenland. |
| 2009 | $ MILLION | |||||||||||||||||||||||||||||||||
| North America | South | |||||||||||||||||||||||||||||||||
| Europe | Asia | Oceania | Africa | USA | Other [B] | America | Total | |||||||||||||||||||||||||||
|
Acquisition of properties
|
||||||||||||||||||||||||||||||||||
|
Proved
|
10 | 531 | 99 | – | – | 3 | – | 643 | ||||||||||||||||||||||||||
|
Unproved
|
– | 2 | 163 | 163 | 224 | 43 | 7 | 602 | ||||||||||||||||||||||||||
|
Exploration
|
485 | 355 | 385 | 376 | 1,632 | 373 | 267 | 3,873 | ||||||||||||||||||||||||||
|
Development [A]
|
2,378 | 3,669 | 533 | 1,768 | 2,315 | 4,002 | 296 | 14,961 | ||||||||||||||||||||||||||
| [A] | Includes capitalised asset decommissioning and restoration costs. | |
| [B] | Comprises Canada and Greenland. |
Table of Contents
|
Shell Annual Report and Form 20-F 2011
|
155 | ||
|
Supplementary information – oil and gas (unaudited)
> Oil and gas exploration and production activities costs
incurred
|
| 2011 | $ MILLION | |||||||||||||||||||||||||||||||||
| North America | South | |||||||||||||||||||||||||||||||||
| Europe | Asia | Oceania | Africa | USA | Other | America | Total | |||||||||||||||||||||||||||
|
Acquisition of properties
|
||||||||||||||||||||||||||||||||||
|
Proved
|
– | – | – | – | – | – | – | – | ||||||||||||||||||||||||||
|
Unproved
|
– | – | 279 | – | – | – | – | 279 | ||||||||||||||||||||||||||
|
Exploration
|
26 | 250 | 160 | – | 9 | – | – | 445 | ||||||||||||||||||||||||||
|
Development [A]
|
280 | 2,103 | 1,023 | – | 349 | – | 81 | 3,836 | ||||||||||||||||||||||||||
| [A] | Includes capitalised asset decommissioning and restoration costs. |
| 2010 | $ MILLION | |||||||||||||||||||||||||||||||||
| North America | South | |||||||||||||||||||||||||||||||||
| Europe | Asia | Oceania | Africa | USA | Other | America | Total | |||||||||||||||||||||||||||
|
Acquisition of properties
|
||||||||||||||||||||||||||||||||||
|
Proved
|
– | – | – | – | – | – | – | – | ||||||||||||||||||||||||||
|
Unproved
|
– | – | – | – | – | – | – | – | ||||||||||||||||||||||||||
|
Exploration
|
59 | 276 | 127 | – | 4 | – | – | 466 | ||||||||||||||||||||||||||
|
Development [A]
|
306 | 2,083 | 849 | – | 302 | – | 50 | 3,590 | ||||||||||||||||||||||||||
| [A] | Includes capitalised asset decommissioning and restoration costs. |
| 2009 | $ MILLION | |||||||||||||||||||||||||||||||||
| North America | South | |||||||||||||||||||||||||||||||||
| Europe | Asia | Oceania | Africa | USA | Other | America | Total | |||||||||||||||||||||||||||
|
Acquisition of properties
|
||||||||||||||||||||||||||||||||||
|
Proved
|
– | 31 | – | – | – | – | – | 31 | ||||||||||||||||||||||||||
|
Unproved
|
– | – | – | – | – | – | – | – | ||||||||||||||||||||||||||
|
Exploration
|
9 | 364 | 109 | – | 1 | – | – | 483 | ||||||||||||||||||||||||||
|
Development [A]
|
440 | 2,377 | 1,720 | – | 316 | – | 54 | 4,907 | ||||||||||||||||||||||||||
| [A] | Includes capitalised asset decommissioning and restoration costs. |
Table of Contents
|
156
|
Shell Annual Report and Form 20-F 2011 | ||
| Supplementary information – oil and gas (unaudited) > Oil and gas exploration and production activities earnings |
| 2011 | $ MILLION | |||||||||||||||||||||||||||||||||
| North America | South | |||||||||||||||||||||||||||||||||
| Europe | Asia | Oceania | Africa | USA | Other [B] | America | Total | |||||||||||||||||||||||||||
|
Revenue
|
||||||||||||||||||||||||||||||||||
|
Third parties
|
5,038 | 4,227 | 1,823 | 3,143 | 3,369 | 342 | 96 | 18,038 | ||||||||||||||||||||||||||
|
Sales between businesses
|
10,379 | 14,495 | 1,160 | 10,986 | 4,016 | 6,710 | 1,570 | 49,316 | ||||||||||||||||||||||||||
|
Total
|
15,417 | 18,722 | 2,983 | 14,129 | 7,385 | 7,052 | 1,666 | 67,354 | ||||||||||||||||||||||||||
|
Production costs excluding taxes
|
2,243 | 1,301 | 386 | 1,453 | 2,005 | 2,979 | 250 | 10,617 | ||||||||||||||||||||||||||
|
Taxes other than income tax [A]
|
390 | 588 | 300 | 1,499 | 59 | – | 180 | 3,016 | ||||||||||||||||||||||||||
|
Exploration
|
288 | 326 | 178 | 493 | 745 | 110 | 126 | 2,266 | ||||||||||||||||||||||||||
|
Depreciation, depletion and amortisation
|
1,473 | 1,008 | 351 | 1,181 | 2,427 | 1,575 | 352 | 8,367 | ||||||||||||||||||||||||||
|
Other (costs)/income
|
(1,670 | ) | (3,242 | ) | (331 | ) | 1,071 | 797 | (2,080 | ) | 504 | (4,951 | ) | |||||||||||||||||||||
|
Earnings before taxation
|
9,353 | 12,257 | 1,437 | 10,574 | 2,946 | 308 | 1,262 | 38,137 | ||||||||||||||||||||||||||
|
Taxation charge/(credit)
|
6,048 | 9,748 | (15 | ) | 6,511 | 714 | 165 | 471 | 23,642 | |||||||||||||||||||||||||
|
Earnings after taxation
|
3,305 | 2,509 | 1,452 | 4,063 | 2,232 | 143 | 791 | 14,495 | ||||||||||||||||||||||||||
| [A] | Includes cash paid royalties to governments outside North America. | |
| [B] | Comprises Canada and Greenland. |
| 2010 | $ MILLION | |||||||||||||||||||||||||||||||||
| North America | South | |||||||||||||||||||||||||||||||||
| Europe | Asia | Oceania | Africa | USA | Other [B] | America | Total | |||||||||||||||||||||||||||
|
Revenue
|
||||||||||||||||||||||||||||||||||
|
Third parties
|
4,100 | 2,755 | 1,674 | 2,215 | 3,547 | 487 | 121 | 14,899 | ||||||||||||||||||||||||||
|
Sales between businesses
|
8,572 | 10,672 | 980 | 8,225 | 3,153 | 4,101 | 1,356 | 37,059 | ||||||||||||||||||||||||||
|
Total
|
12,672 | 13,427 | 2,654 | 10,440 | 6,700 | 4,588 | 1,477 | 51,958 | ||||||||||||||||||||||||||
|
Production costs excluding taxes
|
2,186 | 1,106 | 287 | 1,244 | 1,700 | 2,257 | 209 | 8,989 | ||||||||||||||||||||||||||
|
Taxes other than income tax [A]
|
303 | 333 | 284 | 1,019 | 100 | – | 154 | 2,193 | ||||||||||||||||||||||||||
|
Exploration
|
335 | 275 | 110 | 294 | 730 | 167 | 125 | 2,036 | ||||||||||||||||||||||||||
|
Depreciation, depletion and amortisation
|
2,690 | 748 | 436 | 1,192 | 1,858 | 3,178 | 636 | 10,738 | ||||||||||||||||||||||||||
|
Other (costs)/income
|
(1,144 | ) | (2,748 | ) | 2,479 | 497 | (528 | ) | (1,324 | ) | 72 | (2,696 | ) | |||||||||||||||||||||
|
Earnings before taxation
|
6,014 | 8,217 | 4,016 | 7,188 | 1,784 | (2,338 | ) | 425 | 25,306 | |||||||||||||||||||||||||
|
Taxation charge/(credit)
|
2,915 | 6,752 | 524 | 4,564 | 542 | (614 | ) | 132 | 14,815 | |||||||||||||||||||||||||
|
Earnings after taxation
|
3,099 | 1,465 | 3,492 | 2,624 | 1,242 | (1,724 | ) | 293 | 10,491 | |||||||||||||||||||||||||
| [A] | Includes cash paid royalties to governments outside North America. | |
| [B] | Comprises Canada and Greenland. |
| 2009 | $ MILLION | |||||||||||||||||||||||||||||||||
| North America | South | |||||||||||||||||||||||||||||||||
| Europe | Asia | Oceania | Africa | USA | Other [B] | America | Total | |||||||||||||||||||||||||||
|
Revenue
|
||||||||||||||||||||||||||||||||||
|
Third parties
|
2,945 | 2,449 | 1,001 | 1,613 | 3,055 | 348 | 119 | 11,530 | ||||||||||||||||||||||||||
|
Sales between businesses
|
8,271 | 8,170 | 877 | 5,524 | 2,774 | 3,334 | 486 | 29,436 | ||||||||||||||||||||||||||
|
Total
|
11,216 | 10,619 | 1,878 | 7,137 | 5,829 | 3,682 | 605 | 40,966 | ||||||||||||||||||||||||||
|
Production costs excluding taxes
|
2,729 | 1,113 | 177 | 1,285 | 1,666 | 1,963 | 184 | 9,117 | ||||||||||||||||||||||||||
|
Taxes other than income tax [A]
|
322 | 185 | 172 | 465 | 56 | – | 68 | 1,268 | ||||||||||||||||||||||||||
|
Exploration
|
273 | 208 | 196 | 532 | 610 | 177 | 182 | 2,178 | ||||||||||||||||||||||||||
|
Depreciation, depletion and amortisation
|
2,730 | 937 | 307 | 1,233 | 2,440 | 1,999 | 124 | 9,770 | ||||||||||||||||||||||||||
|
Other (costs)/income
|
(1,064 | ) | (2,458 | ) | (463 | ) | (444 | ) | (653 | ) | (1,075 | ) | (72 | ) | (6,229 | ) | ||||||||||||||||||
|
Earnings before taxation
|
4,098 | 5,718 | 563 | 3,178 | 404 | (1,532 | ) | (25 | ) | 12,404 | ||||||||||||||||||||||||
|
Taxation charge/(credit)
|
2,886 | 4,744 | 69 | 2,370 | (458 | ) | (572 | ) | (126 | ) | 8,913 | |||||||||||||||||||||||
|
Earnings after taxation
|
1,212 | 974 | 494 | 808 | 862 | (960 | ) | 101 | 3,491 | |||||||||||||||||||||||||
| [A] | Includes cash paid royalties to governments outside North America. | |
| [B] | Comprises Canada and Greenland. |
Table of Contents
|
Shell Annual Report and Form 20-F 2011
|
157 | ||
|
Supplementary information – oil and gas (unaudited)
> Oil and gas exploration and production activities
earnings
|
| 2011 | $ MILLION | |||||||||||||||||||||||||||||||||
| North America | South | |||||||||||||||||||||||||||||||||
| Europe | Asia | Oceania [B] | Africa | USA | Other | America | Total | |||||||||||||||||||||||||||
|
Third party revenue
|
5,688 | 11,021 | 1,271 | – | 2,807 | – | 318 | 21,105 | ||||||||||||||||||||||||||
|
Total
|
5,688 | 11,021 | 1,271 | – | 2,807 | – | 318 | 21,105 | ||||||||||||||||||||||||||
|
Production costs excluding taxes
|
353 | 932 | 247 | – | 457 | – | 41 | 2,030 | ||||||||||||||||||||||||||
|
Taxes other than income tax [A]
|
2,990 | 4,358 | 74 | – | 127 | – | 89 | 7,638 | ||||||||||||||||||||||||||
|
Exploration
|
13 | 60 | 89 | – | 8 | – | – | 170 | ||||||||||||||||||||||||||
|
Depreciation, depletion and amortisation
|
237 | 1,250 | 246 | – | 211 | – | 35 | 1,979 | ||||||||||||||||||||||||||
|
Other income/(costs)
|
349 | (30 | ) | (141 | ) | – | 103 | – | (108 | ) | 173 | |||||||||||||||||||||||
|
Earnings before taxation
|
2,444 | 4,391 | 474 | – | 2,107 | – | 45 | 9,461 | ||||||||||||||||||||||||||
|
Taxation
|
940 | 1,983 | 174 | – | 765 | – | 45 | 3,907 | ||||||||||||||||||||||||||
|
Earnings after taxation
|
1,504 | 2,408 | 300 | – | 1,342 | – | – | 5,554 | ||||||||||||||||||||||||||
| [A] | Includes cash paid royalties to governments outside North America. | |
| [B] | Includes Shell’s ownership of 24% of Woodside Petroleum Ltd, a publicly listed company on the Australian Securities Exchange. We have limited access to data; accordingly, the numbers are estimated. |
| 2010 | $ MILLION | |||||||||||||||||||||||||||||||||
| North America | South | |||||||||||||||||||||||||||||||||
| Europe | Asia | Oceania [B] | Africa | USA | Other | America | Total | |||||||||||||||||||||||||||
|
Third party revenue
|
5,027 | 6,895 | 1,471 | – | 2,023 | – | 196 | 15,612 | ||||||||||||||||||||||||||
|
Total
|
5,027 | 6,895 | 1,471 | – | 2,023 | – | 196 | 15,612 | ||||||||||||||||||||||||||
|
Production costs excluding taxes
|
355 | 815 | 196 | – | 449 | – | 64 | 1,879 | ||||||||||||||||||||||||||
|
Taxes other than income tax [A]
|
2,471 | 2,416 | 139 | – | 35 | – | 9 | 5,070 | ||||||||||||||||||||||||||
|
Exploration
|
19 | 8 | 111 | – | 4 | – | – | 142 | ||||||||||||||||||||||||||
|
Depreciation, depletion and amortisation
|
247 | 1,177 | 303 | – | 270 | – | 30 | 2,027 | ||||||||||||||||||||||||||
|
Other income/(costs)
|
337 | (56 | ) | 3 | – | 18 | – | 43 | 345 | |||||||||||||||||||||||||
|
Earnings before taxation
|
2,272 | 2,423 | 725 | – | 1,283 | – | 136 | 6,839 | ||||||||||||||||||||||||||
|
Taxation
|
878 | 1,338 | 207 | – | 465 | – | 136 | 3,024 | ||||||||||||||||||||||||||
|
Earnings after taxation
|
1,394 | 1,085 | 518 | – | 818 | – | – | 3,815 | ||||||||||||||||||||||||||
| [A] | Includes cash paid royalties to governments outside North America. | |
| [B] | Includes Shell’s ownership of 24% of Woodside Petroleum Ltd as from November 2010 (previously: 34%), a publicly listed company on the Australian Securities Exchange. We have limited access to data; accordingly, the numbers are estimated. |
| 2009 | $ MILLION | |||||||||||||||||||||||||||||||||
| North America | South | |||||||||||||||||||||||||||||||||
| Europe | Asia | Oceania [B] | Africa | USA | Other | America | Total | |||||||||||||||||||||||||||
|
Third party revenue
|
4,965 | 4,962 | 1,053 | – | 1,613 | – | 192 | 12,785 | ||||||||||||||||||||||||||
|
Total
|
4,965 | 4,962 | 1,053 | – | 1,613 | – | 192 | 12,785 | ||||||||||||||||||||||||||
|
Production costs excluding taxes
|
334 | 843 | 148 | – | 454 | – | 42 | 1,821 | ||||||||||||||||||||||||||
|
Taxes other than income tax [A]
|
2,201 | 1,446 | 72 | – | 3 | – | 9 | 3,731 | ||||||||||||||||||||||||||
|
Exploration
|
13 | 126 | 92 | – | 1 | – | – | 232 | ||||||||||||||||||||||||||
|
Depreciation, depletion and amortisation
|
300 | 964 | 294 | – | 293 | – | 297 | 2,148 | ||||||||||||||||||||||||||
|
Other income/(costs)
|
332 | (76 | ) | 30 | – | 342 | – | (36 | ) | 592 | ||||||||||||||||||||||||
|
Earnings before taxation
|
2,449 | 1,507 | 477 | – | 1,204 | – | (192 | ) | 5,445 | |||||||||||||||||||||||||
|
Taxation
|
940 | 955 | 194 | – | 437 | – | 11 | 2,537 | ||||||||||||||||||||||||||
|
Earnings after taxation
|
1,509 | 552 | 283 | – | 767 | – | (203 | ) | 2,908 | |||||||||||||||||||||||||
| [A] | Includes cash paid royalties to governments outside North America. | |
| [B] | Reflects Shell’s ownership of 34% of Woodside Petroleum Ltd, a publicly listed company on the Australian Securities Exchange. We have limited access to data; accordingly, the numbers are estimated. |
Table of Contents
|
158
|
Shell Annual Report and Form 20-F 2011 | ||
| Independent Auditors’ Report to the Members of Royal Dutch Shell plc |
| n | give a true and fair view of the state of the Company’s affairs as at December 31, 2011, and of its income and cash flows for the year then ended; |
| n | have been properly prepared in accordance with IFRSs as adopted by the European Union; and |
| n | have been prepared in accordance with the requirements of the Companies Act 2006. |
| n | the part of the Directors’ Remuneration Report to be audited has been properly prepared in accordance with the Companies Act 2006; and |
| n | the information given in the Report of the Directors for the financial year for which the Parent Company Financial Statements are prepared is consistent with the Parent Company Financial Statements. |
| n | adequate accounting records have not been kept by the Company, or returns adequate for our audit have not been received from branches not visited by us; or |
| n | the Parent Company Financial Statements and the part of the Directors’ Remuneration Report to be audited are not in agreement with the accounting records and returns; or |
| n | certain disclosures of Directors’ remuneration specified by law are not made; or |
| n | we have not received all the information and explanations we require for our audit. |
| n | The maintenance and integrity of the Royal Dutch Shell plc website (www.shell.com) are the responsibility of the Directors; the work carried out by the auditors does not involve consideration of these matters and, accordingly, the auditors accept no responsibility for any changes that may have occurred to the Parent Company Financial Statements since they were initially presented on the website. |
| n | Legislation in the United Kingdom governing the preparation and dissemination of financial statements may differ from legislation in other jurisdictions. |
Table of Contents
|
Shell Annual Report and Form 20-F 2011
|
159 | ||
|
Parent Company Financial Statements
|
Table of Contents
|
160
|
Shell Annual Report and Form 20-F 2011 | ||
| Parent Company Financial Statements |
| STATEMENT OF INCOME | $ MILLION | |||||||||||||
| NOTES | 2011 | 2010 | ||||||||||||
|
Dividend income
|
13,438 | 14,345 | ||||||||||||
|
Finance income
|
3 | 79 | 20 | |||||||||||
|
Administrative expenses
|
(103 | ) | (42 | ) | ||||||||||
|
Finance expense
|
3 | (225 | ) | (231 | ) | |||||||||
|
Income before taxation
|
13,189 | 14,092 | ||||||||||||
|
Taxation
|
5 | 6 | 35 | |||||||||||
|
Income for the period
|
13,195 | 14,127 | ||||||||||||
| STATEMENT OF COMPREHENSIVE INCOME | $ MILLION | |||||||||
| 2011 | 2010 | |||||||||
|
Income for the period
|
13,195 | 14,127 | ||||||||
|
Comprehensive income for the period
|
13,195 | 14,127 | ||||||||
| BALANCE SHEET | $ MILLION | |||||||||||||
| NOTES | Dec 31, 2011 | Dec 31, 2010 | ||||||||||||
|
Assets
|
||||||||||||||
|
Non-current assets
|
||||||||||||||
|
Investments in subsidiaries
|
202,291 | 202,160 | ||||||||||||
|
Deferred tax
|
5 | 350 | 252 | |||||||||||
| 202,641 | 202,412 | |||||||||||||
|
Current assets
|
||||||||||||||
|
Accounts receivable
|
6 | 17,433 | 1 | |||||||||||
|
Cash and cash equivalents
|
7 | 121 | 11,727 | |||||||||||
| 17,554 | 11,728 | |||||||||||||
|
Total assets
|
220,195 | 214,140 | ||||||||||||
|
Liabilities
|
||||||||||||||
|
Current liabilities
|
||||||||||||||
|
Accounts payable and accrued liabilities
|
9 | 1,110 | 927 | |||||||||||
| 1,110 | 927 | |||||||||||||
|
Total liabilities
|
1,110 | 927 | ||||||||||||
|
Equity
|
||||||||||||||
|
Share capital
|
10 | 536 | 529 | |||||||||||
|
Other reserves
|
11 | 201,606 | 201,542 | |||||||||||
|
Retained earnings
|
16,943 | 11,142 | ||||||||||||
|
Total equity
|
219,085 | 213,213 | ||||||||||||
|
Total liabilities and equity
|
220,195 | 214,140 | ||||||||||||
March 14, 2012
Table of Contents
|
Shell Annual Report and Form 20-F 2011
|
161 | ||
|
Parent Company Financial Statements
|
| STATEMENT OF CHANGES IN EQUITY | $ MILLION | |||||||||||||||||||||
| NOTES |
Share
capital |
Other
reserves |
Retained
earnings |
Total equity | ||||||||||||||||||
|
At January 1, 2011
|
529 | 201,542 | 11,142 | 213,213 | ||||||||||||||||||
|
Comprehensive income for the period
|
– | – | 13,195 | 13,195 | ||||||||||||||||||
|
Dividends paid
|
12 | – | – | (10,457 | ) | (10,457 | ) | |||||||||||||||
|
Scrip dividends
|
12 | 10 | (10 | ) | 3,580 | 3,580 | ||||||||||||||||
|
Repurchases of shares
|
11 | (3 | ) | 3 | (1,106 | ) | (1,106 | ) | ||||||||||||||
|
Share-based compensation
|
11 | – | 71 | 589 | 660 | |||||||||||||||||
|
At December 31, 2011
|
536 | 201,606 | 16,943 | 219,085 | ||||||||||||||||||
|
At January 1, 2010
|
527 | 201,448 | 6,220 | 208,195 | ||||||||||||||||||
|
Comprehensive income for the period
|
– | – | 14,127 | 14,127 | ||||||||||||||||||
|
Dividends paid
|
12 | – | – | (10,196 | ) | (10,196 | ) | |||||||||||||||
|
Scrip dividends
|
12 | 2 | (2 | ) | 612 | 612 | ||||||||||||||||
|
Share-based compensation
|
11 | – | 96 | 379 | 475 | |||||||||||||||||
|
At December 31, 2010
|
529 | 201,542 | 11,142 | 213,213 | ||||||||||||||||||
| STATEMENT OF CASH FLOWS | $ MILLION | |||||||||||||
| NOTES | 2011 | 2010 | ||||||||||||
|
Cash flow from operating activities
|
||||||||||||||
|
Income for the period
|
13,195 | 14,127 | ||||||||||||
|
Adjustment for:
|
||||||||||||||
|
Dividend income
|
(13,438 | ) | (14,345 | ) | ||||||||||
|
Taxation
|
(6 | ) | (35 | ) | ||||||||||
|
Unrealised foreign exchange losses
|
205 | 216 | ||||||||||||
|
Interest income
|
(79 | ) | (20 | ) | ||||||||||
|
Interest expense
|
17 | 17 | ||||||||||||
|
Share-based compensation
|
69 | 12 | ||||||||||||
|
(Increase)/decrease in working capital
|
(17,097 | ) | 197 | |||||||||||
|
Net cash (used in)/from operating activities (pre-tax)
|
(17,134 | ) | 169 | |||||||||||
|
Taxation refunded
|
11 | 144 | ||||||||||||
|
Net cash (used in)/from operating activities
|
(17,123 | ) | 313 | |||||||||||
|
Cash flow from investing activities
|
||||||||||||||
|
Dividends received
|
13,438 | 14,345 | ||||||||||||
|
Interest received
|
79 | 20 | ||||||||||||
|
Net cash from investing activities
|
13,517 | 14,365 | ||||||||||||
|
Cash flow from financing activities
|
||||||||||||||
|
Dividends paid
|
12 | (6,877 | ) | (9,584 | ) | |||||||||
|
Repurchases of shares
|
(1,106 | ) | – | |||||||||||
|
Interest paid
|
(17 | ) | (17 | ) | ||||||||||
|
Net cash used in financing activities
|
(8,000 | ) | (9,601 | ) | ||||||||||
|
(Decrease)/increase in cash and cash equivalents
|
(11,606 | ) | 5,077 | |||||||||||
|
Cash and cash equivalents at January 1
|
7 | 11,727 | 6,650 | |||||||||||
|
Cash and cash equivalents at December 31
|
7 | 121 | 11,727 | |||||||||||
Table of Contents
|
162
|
Shell Annual Report and Form 20-F 2011 | ||
| Parent Company Financial Statements > Notes to the Parent Company Financial Statements |
Table of Contents
|
Shell Annual Report and Form 20-F 2011
|
163 | ||
|
Parent Company Financial Statements > Notes to the Parent
Company Financial Statements
|
| $ MILLION | ||||||||||
| 2011 | 2010 | |||||||||
|
Finance income
|
||||||||||
|
Interest income
|
79 | 20 | ||||||||
|
Total
|
79 | 20 | ||||||||
|
Finance expense
|
||||||||||
|
Interest expense
|
(17 | ) | (17 | ) | ||||||
|
Foreign exchange losses
|
(208 | ) | (214 | ) | ||||||
|
Total
|
(225 | ) | (231 | ) | ||||||
| $ MILLION | ||||||||||
| 2011 | 2010 | |||||||||
|
Current taxation
|
||||||||||
|
Credit in respect of current period
|
(12 | ) | (32 | ) | ||||||
|
Total
|
(12 | ) | (32 | ) | ||||||
|
Deferred taxation
|
||||||||||
|
Relating to the origination and reversal of temporary differences
|
6 | (3 | ) | |||||||
|
Total
|
6 | (3 | ) | |||||||
|
Total taxation credit
|
(6 | ) | (35 | ) | ||||||
| $ MILLION | ||||||||||
| 2011 | 2010 | |||||||||
|
Income before taxation
|
13,189 | 14,092 | ||||||||
|
Applicable tax charge at the statutory tax rate of 25.0% (2010:
25.5%)
|
3,297 | 3,593 | ||||||||
|
Income not subject to tax
|
(3,361 | ) | (3,659 | ) | ||||||
|
Expenses not deductible for tax purposes
|
52 | 59 | ||||||||
|
Other reconciling items
|
6 | (28 | ) | |||||||
|
Taxation credit
|
(6 | ) | (35 | ) | ||||||
Table of Contents
|
164
|
Shell Annual Report and Form 20-F 2011 | ||
| Parent Company Financial Statements > Notes to the Parent Company Financial Statements |
| $ MILLION | ||||||||||
| 2011 | 2010 | |||||||||
|
At January 1
|
252 | 159 | ||||||||
|
Recognised in income
|
(6 | ) | 3 | |||||||
|
Additions during the year
|
104 | 90 | ||||||||
|
At December 31
|
350 | 252 | ||||||||
| $ MILLION | ||||||||||
| Dec 31, 2011 | Dec 31, 2010 | |||||||||
|
Amounts due from subsidiaries (see Note 14)
|
17,433 | – | ||||||||
|
Other receivables
|
– | 1 | ||||||||
|
Total
|
17,433 | 1 | ||||||||
| $ MILLION | ||||||||||
| Dec 31, 2011 | Dec 31, 2010 | |||||||||
|
Amounts owed to subsidiaries
|
965 | 767 | ||||||||
|
Withholding tax payable
|
135 | 151 | ||||||||
|
Accruals
|
8 | 8 | ||||||||
|
Unclaimed dividends
|
2 | 1 | ||||||||
|
Total
|
1,110 | 927 | ||||||||
Table of Contents
|
Shell Annual Report and Form 20-F 2011
|
165 | ||
|
Parent Company Financial Statements > Notes to the Parent
Company Financial Statements
|
| ISSUED AND FULLY PAID | NUMBER OF SHARES | |||||||||||||
| Ordinary shares of €0.07 each | Sterling deferred | |||||||||||||
| Class A | Class B | shares of £1 each | ||||||||||||
|
At January 1, 2011
|
3,563,952,539 | 2,695,808,103 | 50,000 | |||||||||||
|
Scrip dividends
|
104,597,898 | – | – | |||||||||||
|
Repurchases of shares
|
– | (34,404,931 | ) | – | ||||||||||
|
At December 31, 2011
|
3,668,550,437 | 2,661,403,172 | 50,000 | |||||||||||
|
At January 1, 2010
|
3,545,663,973 | 2,695,808,103 | 50,000 | |||||||||||
|
Scrip dividends
|
18,288,566 | – | – | |||||||||||
|
At December 31, 2010
|
3,563,952,539 | 2,695,808,103 | 50,000 | |||||||||||
| NOMINAL VALUE | $ MILLION | |||||||||||||
| Ordinary shares of €0.07 each | ||||||||||||||
| Class A | Class B | Total | ||||||||||||
|
At January 1, 2011
|
302 | 227 | 529 | |||||||||||
|
Scrip dividends
|
10 | – | 10 | |||||||||||
|
Repurchases of shares
|
– | (3 | ) | (3 | ) | |||||||||
|
At December 31, 2011
|
312 | 224 | 536 | |||||||||||
|
At January 1, 2010
|
300 | 227 | 527 | |||||||||||
|
Scrip dividends
|
2 | – | 2 | |||||||||||
|
At December 31, 2010
|
302 | 227 | 529 | |||||||||||
Table of Contents
|
166
|
Shell Annual Report and Form 20-F 2011 | ||
| Parent Company Financial Statements > Notes to the Parent Company Financial Statements |
| $ MILLION | ||||||||||||||||||||||
|
Share premium
reserve |
Capital redemption
reserve |
Share plan
reserve |
Other
reserve |
Total | ||||||||||||||||||
|
At January 1, 2011
|
154 | 57 | 956 | 200,375 | 201,542 | |||||||||||||||||
|
Scrip dividends
|
– | – | – | (10 | ) | (10 | ) | |||||||||||||||
|
Repurchases of shares
|
– | 3 | – | – | 3 | |||||||||||||||||
|
Share-based compensation
|
– | – | 71 | – | 71 | |||||||||||||||||
|
At December 31, 2011
|
154 | 60 | 1,027 | 200,365 | 201,606 | |||||||||||||||||
|
At January 1, 2010
|
154 | 57 | 860 | 200,377 | 201,448 | |||||||||||||||||
|
Scrip dividends
|
– | – | – | (2 | ) | (2 | ) | |||||||||||||||
|
Share-based compensation
|
– | – | 96 | – | 96 | |||||||||||||||||
|
At December 31, 2010
|
154 | 57 | 956 | 200,375 | 201,542 | |||||||||||||||||
Table of Contents
|
Shell Annual Report and Form 20-F 2011
|
167 | ||
|
Parent Company Financial Statements > Notes to the Parent
Company Financial Statements
|
| $ MILLION | |||||||||||||
| Cash | Scrip | Total | |||||||||||
|
Interim
|
|||||||||||||
|
March 25, 2011
|
$0.42 per Class A share | 820 | 681 | 1,501 | |||||||||
|
March 25, 2011
|
$0.42 per Class B share | 738 | 387 | 1,125 | |||||||||
|
Interim
|
|||||||||||||
|
June 27, 2011
|
$0.42 per Class A share | 890 | 601 | 1,491 | |||||||||
|
June 27, 2011
|
$0.42 per Class B share | 878 | 236 | 1,114 | |||||||||
|
Interim
|
|||||||||||||
|
September 19, 2011
|
$0.42 per Class A share | 912 | 571 | 1,483 | |||||||||
|
September 19, 2011
|
$0.42 per Class B share | 954 | 148 | 1,102 | |||||||||
|
Interim
|
|||||||||||||
|
December 16, 2011
|
$0.42 per Class A share | 818 | 703 | 1,521 | |||||||||
|
December 16, 2011
|
$0.42 per Class B share | 867 | 253 | 1,120 | |||||||||
|
Total
|
6,877 | 3,580 | 10,457 | ||||||||||
|
Interim
|
|||||||||||||
|
March 17, 2010
|
$0.42 per Class A share | 1,465 | – | 1,465 | |||||||||
|
March 17, 2010
|
$0.42 per Class B share | 1,089 | – | 1,089 | |||||||||
|
Interim
|
|||||||||||||
|
June 9, 2010
|
$0.42 per Class A share | 1,376 | – | 1,376 | |||||||||
|
June 9, 2010
|
$0.42 per Class B share | 1,073 | – | 1,073 | |||||||||
|
Interim
|
|||||||||||||
|
September 8, 2010
|
$0.42 per Class A share | 1,461 | – | 1,461 | |||||||||
|
September 8, 2010
|
$0.42 per Class B share | 1,121 | – | 1,121 | |||||||||
|
Interim
|
|||||||||||||
|
December 17, 2010
|
$0.42 per Class A share | 937 | 549 | 1,486 | |||||||||
|
December 17, 2010
|
$0.42 per Class B share | 1,062 | 63 | 1,125 | |||||||||
|
Total
|
9,584 | 612 | 10,196 | ||||||||||
Table of Contents
|
168
|
Shell Annual Report and Form 20-F 2011 | ||
| Parent Company Financial Statements > Notes to the Parent Company Financial Statements |
Table of Contents
|
Shell Annual Report and Form 20-F 2011
|
169 | ||
|
Independent Auditors’ Report to EES Trustees
International Limited as Trustee of the Royal Dutch Shell
Dividend Access Trust
|
| n | give a true and fair view of the state of the Trust’s affairs as at December 31, 2011, and of its income and cash flows for the year then ended; and |
| n | have been properly prepared in accordance with IFRSs as adopted by the European Union. |
| n | proper accounting records have not been kept by the Trust; or |
| n | the Financial Statements are not in agreement with the accounting records; or |
| n | we have not received all the information and explanations we require for our audit. |
| n | The report set out above is included for the purposes of Royal Dutch Shell plc’s Annual Report and Accounts for 2011 only and does not form part of Royal Dutch Shell plc’s Annual Report on Form 20-F for 2011. |
| n | The maintenance and integrity of the Royal Dutch Shell plc website (www.shell.com) are the responsibility of the Directors of Royal Dutch Shell plc; the work carried out by the auditors does not involve consideration of these matters and, accordingly, the auditors accept no responsibility for any changes that may have occurred to the Financial Statements since they were initially presented on the website. |
| n | Legislation in Jersey governing the preparation and dissemination of financial statements may differ from legislation in other jurisdictions. |
Table of Contents
|
170
|
Shell Annual Report and Form 20-F 2011 | ||
| Report of Independent Registered Public Accounting Firm |
Table of Contents
|
Shell Annual Report and Form 20-F 2011
|
171 | ||
|
Royal Dutch Shell Dividend Access Trust Financial
Statements
|
|
172
|
||
|
172
|
||
|
172
|
||
|
173
|
||
|
173
|
||
|
174
|
||
|
174
|
||
|
174
|
||
|
174
|
||
|
174
|
||
|
175
|
||
|
175
|
||
|
175
|
||
|
175
|
||
|
175
|
Table of Contents
|
172
|
Shell Annual Report and Form 20-F 2011 | ||
| Royal Dutch Shell Dividend Access Trust Financial Statements |
| STATEMENT OF INCOME | £ MILLION | |||||||||||||
| 2011 | 2010 | 2009 | ||||||||||||
|
Dividend income
|
2,175 | 2,863 | 2,902 | |||||||||||
|
Income before and after taxation and for the period
|
2,175 | 2,863 | 2,902 | |||||||||||
| STATEMENT OF COMPREHENSIVE INCOME | £ MILLION | |||||||||||||
| 2011 | 2010 | 2009 | ||||||||||||
|
Income for the period
|
2,175 | 2,863 | 2,902 | |||||||||||
|
Comprehensive income for the period
|
2,175 | 2,863 | 2,902 | |||||||||||
| BALANCE SHEET | £ MILLION | |||||||||||||
| NOTES | Dec 31, 2011 | Dec 31, 2010 | ||||||||||||
|
Assets
|
||||||||||||||
|
Current assets
|
||||||||||||||
|
Cash and cash equivalents
|
1 | 1 | ||||||||||||
|
Total assets
|
1 | 1 | ||||||||||||
|
Liabilities
|
||||||||||||||
|
Current liabilities
|
||||||||||||||
|
Other liabilities
|
4 | 1 | 1 | |||||||||||
|
Total liabilities
|
1 | 1 | ||||||||||||
|
Equity
|
||||||||||||||
|
Capital account
|
5 | – | – | |||||||||||
|
Revenue account
|
– | – | ||||||||||||
|
Total equity
|
– | – | ||||||||||||
|
Total liabilities and equity
|
1 | 1 | ||||||||||||
Table of Contents
|
Shell Annual Report and Form 20-F 2011
|
173 | ||
|
Royal Dutch Shell Dividend Access Trust Financial Statements
|
| STATEMENT OF CHANGES IN EQUITY | £ MILLION | |||||||||||||||||
| NOTES |
Capital
account |
Revenue
account |
Total equity | |||||||||||||||
|
At January 1, 2011
|
– | – | – | |||||||||||||||
|
Comprehensive income for the period
|
– | 2,175 | 2,175 | |||||||||||||||
|
Distributions made
|
6 | – | (2,175 | ) | (2,175 | ) | ||||||||||||
|
At December 31, 2011
|
– | – | – | |||||||||||||||
|
At January 1, 2010
|
– | – | – | |||||||||||||||
|
Comprehensive income for the period
|
– | 2,863 | 2,863 | |||||||||||||||
|
Distributions made
|
6 | – | (2,863 | ) | (2,863 | ) | ||||||||||||
|
At December 31, 2010
|
– | – | – | |||||||||||||||
|
At January 1, 2009
|
– | – | – | |||||||||||||||
|
Comprehensive income for the period
|
– | 2,902 | 2,902 | |||||||||||||||
|
Distributions made
|
6 | – | (2,902 | ) | (2,902 | ) | ||||||||||||
|
At December 31, 2009
|
– | – | – | |||||||||||||||
| STATEMENT OF CASH FLOWS | £ MILLION | |||||||||||||
| 2011 | 2010 | 2009 | ||||||||||||
|
Cash flow from operating activities
|
||||||||||||||
|
Income for the period
|
2,175 | 2,863 | 2,902 | |||||||||||
|
Adjustment for:
|
||||||||||||||
|
Dividends received
|
(2,175 | ) | (2,863 | ) | (2,902 | ) | ||||||||
|
Increase in working capital
|
– | – | 1 | |||||||||||
|
Net cash from operating activities
|
– | – | 1 | |||||||||||
|
Cash flow from investing activities
|
||||||||||||||
|
Dividends received
|
2,175 | 2,863 | 2,902 | |||||||||||
|
Net cash from investing activities
|
2,175 | 2,863 | 2,902 | |||||||||||
|
Cash flow from financing activities
|
||||||||||||||
|
Distributions made
|
(2,175 | ) | (2,863 | ) | (2,902 | ) | ||||||||
|
Net cash used in financing activities
|
(2,175 | ) | (2,863 | ) | (2,902 | ) | ||||||||
|
Change in cash and cash equivalents
|
– | – | 1 | |||||||||||
|
Cash and cash equivalents at January 1
|
1 | 1 | – | |||||||||||
|
Cash and cash equivalents at December 31
|
1 | 1 | 1 | |||||||||||
Table of Contents
|
174
|
Shell Annual Report and Form 20-F 2011 | ||
| Royal Dutch Shell Dividend Access Trust Financial Statements > Notes to the Royal Dutch Shell Dividend Access Trust Financial Statements |
Table of Contents
|
Shell Annual Report and Form 20-F 2011
|
175 | ||
|
Royal Dutch Shell Dividend Access Trust Financial Statements
> Notes to the Royal Dutch Shell Dividend Access Trust
Financial Statements
|
Table of Contents
|
176
|
Shell Annual Report and Form 20-F 2011 | ||
| Cross reference to Form 20-F |
|
|
PAGES | |||
|
Item 1.
|
Identity of Directors, Senior Management and Advisers | N/A | ||
|
Item 2.
|
Offer Statistics and Expected Timetable | N/A | ||
|
Item 3.
|
Key Information | |||
| A. Selected financial data | 10, 93 | |||
| B. Capitalisation and indebtedness | 47-48 | |||
| C. Reasons for the offer and use of proceeds | N/A | |||
| D. Risk factors | 13-15 | |||
|
Item 4.
|
Information on the Company | |||
| A. History and development of the company | 11, 16-27, 29, 37-40, 91 | |||
| B. Business overview | 8-9, 11-12, 16-44, 49-53, 141-149 | |||
| C. Organisational structure | 11, E2-E4 | |||
| D. Property, plant and equipment | 16-43, 50-53 | |||
|
Item 4A.
|
Unresolved Staff Comments | N/A | ||
|
Item 5.
|
Operating and Financial Review and Prospects | |||
| A. Operating results | 8-10, 12, 16-44, 133-135 | |||
| B. Liquidity and capital resources | 45-48 | |||
| C. Research and development, patents and licences, etc. | 18, 58, 110 | |||
| D. Trend information | 8-9, 11-12, 16-22, 37-43 | |||
| E. Off-balance sheet arrangements | 48 | |||
| F. Tabular disclosure of contractual obligations | 48 | |||
| G. Safe harbour | 48 | |||
|
Item 6.
|
Directors, Senior Management and Employees | |||
| A. Directors and senior management | 54-57, 80-81 | |||
| B. Compensation | 63-78 | |||
| C. Board practices | 54-56, 58-61, 70, 79-90 | |||
| D. Employees | 49, 114 | |||
| E. Share ownership | 49, 60, 65-78, 91, 108, 135-136 | |||
|
Item 7.
|
Major Shareholders and Related Party Transactions | |||
| A. Major shareholders | 89-92 | |||
| B. Related party transactions | 60, 107, 118-120, 167-168, 175 | |||
| C. Interests of experts and counsel | N/A | |||
|
Item 8.
|
Financial Information | |||
| A. Consolidated Statements and Other Financial Information | 41, 45-48, 99-140, 158-175 | |||
| B. Significant Changes | 58 | |||
|
Item 9.
|
The Offer and Listing | |||
| A. Offer and listing details | 91-94 | |||
| B. Plan of distribution | N/A | |||
| C. Markets | 91 | |||
| D. Selling shareholders | N/A | |||
| E. Dilution | N/A | |||
| F. Expenses of the issue | N/A | |||
|
Item 10.
|
Additional Information | |||
| A. Share capital | 47, 49, 60, 76, 91-92, 103, 130-131, 135-137, 161, 165 | |||
| B. Memorandum and articles of association | 86-90 | |||
| C. Material contracts | 60 | |||
| D. Exchange controls | 96 | |||
| E. Taxation | 96-97 | |||
| F. Dividends and paying agents | 58, 86-88, 91, 95, 97 | |||
| G. Statement by experts | N/A | |||
| H. Documents on display | 3 | |||
| I. Subsidiary Information | N/A | |||
|
Item 11.
|
Quantitative and Qualitative Disclosures About Market Risk | 85, 105-112, 120, 131-135, 164, 175 | ||
|
Item 12.
|
Description of Securities Other than Equity Securities | 91, 95-96 |
Table of Contents
|
Shell Annual Report and Form 20-F 2011
|
177 | ||
|
Cross reference to Form 20-F
|
|
|
PAGES | |||
|
Item 13.
|
Defaults, Dividend Arrearages and Delinquencies | N/A | ||
|
Item 14.
|
Material Modifications to the Rights of Security Holders and Use of Proceeds | N/A | ||
|
Item 15.
|
Controls and Procedures | 84-86, 99, E5-E6 | ||
|
Item 16.
|
[Reserved] | |||
|
Item 16A.
|
Audit committee financial expert | 79, 82 | ||
|
Item 16B.
|
Code of Ethics | 80 | ||
|
Item 16C.
|
Principal Accountant Fees and Services | 82-83, 139, 168, 175 | ||
|
Item 16D.
|
Exemptions from the Listing Standards for Audit Committees | 79-80 | ||
|
Item 16E.
|
Purchases of Equity Securities by the Issuer and Affiliated Purchasers | 47 | ||
|
Item 16F.
|
Change in Registrant’s Certifying Accountant | N/A | ||
|
Item 16G.
|
Corporate Governance | 79-80 | ||
|
|
PAGES | |||
|
Item 17.
|
Financial Statements | N/A | ||
|
Item 18.
|
Financial Statements | 99-140, 158-175 | ||
|
Item 19.
|
Exhibits | 178, E1-E9 |
Table of Contents
|
178
|
Shell Annual Report and Form 20-F 2011 | ||
| Exhibits |
| Exhibit No. | Description | PAGE | ||
|
1.1
|
Memorandum of Association of Royal Dutch Shell plc, together with a special resolution of Royal Dutch Shell plc dated May 18, 2010, (incorporated by reference to Exhibit 4.12 to the Registration Statement on Form F-3 (Registration No. 333-177588) of Royal Dutch Shell plc filed with the Securities and Exchange Commission on October 28, 2011). | |||
|
1.2
|
Articles of Association of Royal Dutch Shell plc, together with a special resolution of Royal Dutch Shell plc dated May 18, 2010, (incorporated by reference to Exhibit 4.11 to the Registration Statement on Form F-3 (Registration No. 333-177588) of Royal Dutch Shell plc filed with the Securities and Exchange Commission on October 28, 2011). | |||
|
2
|
Dividend Access Trust Deed (incorporated by reference to Exhibit 2 to the Annual Report for fiscal year ended December 31, 2006, on Form 20-F (File No. 001-32575) of Royal Dutch Shell plc filed with the Securities and Exchange Commission on March 13, 2007). | |||
|
4.2
|
Shell Provident Fund Regulations and Trust Agreement (incorporated by reference to Exhibit 4.7 to the Post-Effective Amendment to Registration Statement on Form S-8 (Registration No. 333-126715) of Royal Dutch Shell plc filed with the Securities and Exchange Commission on June 18, 2007). | |||
|
4.3
|
Form of Director Indemnity Agreement (incorporated by reference to Exhibit 4.3 to the Annual Report for the fiscal year ended December 31, 2005, on Form 20-F (File No. 001-32575) of Royal Dutch Shell plc filed with the Securities and Exchange Commission on March 13, 2006). | |||
|
4.4
|
Senior Debt Securities Indenture dated June 27, 2006, among Shell International Finance B.V., as issuer, Royal Dutch Shell plc, as guarantor, and Deutsche Bank Trust Company Americas, as trustee (incorporated by reference to Exhibit 4.3 to the Registration Statement on Form F-3 (Registration No. 333-126726) of Royal Dutch Shell plc filed with the Securities and Exchange Commission on July 20, 2005, amended from then to be dated as of June 27, 2006, and with the parties signatures). | |||
|
4.5
|
Form of Directors Letter of appointments (incorporated by reference to Exhibits 4.5 – 4.11 to the Annual Report for fiscal year ended December 31, 2006, on Form 20-F (File No. 001-32575) of Royal Dutch Shell plc filed with the Securities and Exchange Commission on March 13, 2007). | |||
|
4.6
|
Compromise Agreement with Malcolm Brinded (February 21, 2012). | |||
|
7.1
|
Calculation of Ratio of Earnings to Fixed Charges. | E1 | ||
|
7.2
|
Calculation of Return on Average Capital Employed (ROACE) (incorporated by reference to page 48 herein). | |||
|
7.3
|
Calculation of gearing (incorporated by reference to page 9 and Note 15 to the Consolidated Financial Statements on page 122 herein). | |||
|
8
|
Significant Shell subsidiaries as at December 31, 2011. | E2 | ||
|
12.1
|
Section 302 Certification of Royal Dutch Shell plc. | E5 | ||
|
12.2
|
Section 302 Certification of Royal Dutch Shell plc. | E6 | ||
|
13.1
|
Section 906 Certification of Royal Dutch Shell plc. | E7 | ||
|
99.1
|
Consent of PricewaterhouseCoopers LLP, London. | E8 | ||
|
99.2
|
Consent of PricewaterhouseCoopers CI LLP, Jersey, Channel Islands, relating to the Royal Dutch Shell Dividend Access Trust. | E9 |
Table of Contents
|
Shell Annual Report and Form 20-F 2011
|
179 | ||
|
Signatures
|
Table of Contents
| CONTACT INFORMATION REGISTERED OFFICE Royal Dutch Shell plc Shell Centre London SE1 7NA United Kingdom Registered in England and Wales Company number 4366849 Registered with the Dutch Trade Register under number 34179503 HEADQUARTERS Royal Dutch Shell plc Carel van Bylandtlaan 30 2596 HR The Hague The Netherlands SHARE REGISTRATION Equiniti Aspect House Spencer Road Lancing West Sussex BN99 6DA United Kingdom 0800 169 1679 (UK) +44 (0) 121 415 7073 +44 (0) 1903 833168 For online information about your holding and to change the way you receive your company documents: www.shareview.co.uk SHAREHOLDER RELATIONS Royal Dutch Shell plc Carel van Bylandtlaan 30 2596 HR The Hague The Netherlands +31 (0)70 377 1365 +31 (0)70 377 4088 +31 (0)70 377 3953 or Royal Dutch Shell plc Shell Centre London SE1 7NA United Kingdom +44 (0)20 7934 3363 +44 (0)20 7934 7515 royaldutchshell.shareholders@shell.com www.shell.com/shareholder AMERICAN DEPOSITARY SHARES (ADSS) The Bank of New York Mellon PO Box 358516 Pittsburgh, PA 15252-8516 USA +1 888 737 2377 (USA) +1 201 680 6825 (international) shrrelations@bnymellon.com www.bnymellon.com/shareowner INVESTOR RELATIONS Royal Dutch Shell plc PO Box 162 2501 AN The Hague The Netherlands +31 (0)70 377 4540 or Shell Oil Company Investor Relations 910 Louisiana Street, 4580B Houston, TX 77002 USA +1 713 241 1042 +1 713 241 0176 ir-europe@shell.com ir-usa@shell.com www.shell.com/investor REPORT ORDERING order@shell.com +31 (0)888 800 844 Annual Report/20-F service for US residents +1 888 301 0504 Designed by Studio Dumbar Typeset by RR Donnelley Printed by Tu.tel under ISO 14001 The printing of this document was carbon neutral: certifi ed carbon-offset projects compensated for the CO2 emissions. www.natureoffi ce.com NL—001—357791 |
Table of Contents

| OTHER SHELL PUBLICATIONS HTTP://REPORTS.SHELL.COM All information from our reports is available for online reading and for downloading as a PDF file. KEY ADVANTAGES OPTIMISED SCREEN READING FIND-AS-YOU-TYPE SEARCH TOOL INTERACTIVE CHARTING EXCEL DOWNLOADS OF ALL TABLES VIDEO ENHANCEMENTS SIMPLE SWITCH BETWEEN REPORTS PAPER AND COST SAVINGS Annual Review and Summary Financial Statements 2011 A summarised operational and financial overview of Shell. Investors’ Handbook 2007—2011 Five years’ detailed financial and operational information, including maps. Sustainability Report 2011 Report on our progress in contributing to sustainable development. |