SHENANDOAH TELECOMMUNICATIONS CO/VA/
10-Ks and 10-Qs
|
|
|
|
|
|
|
|
|
|
|
|
|
|
|
|
|
|
|
|
|
|
|
|
|
|
|
|
|
|
|
|
|
|
|
|
|
|
|
|
|
|
|
|
|
|
|
|
|
|
|
|
|
|
|
|
UNITED STATES OF AMERICA
SECURITIES AND EXCHANGE COMMISSION
Washington, D. C. 20549
FORM 10-K
(Mark One)
Commission File No.: 000-09881

(Exact name of registrant as specified in its charter)
|
VIRGINIA
|
|
54-1162807
|
|
(State or other jurisdiction of incorporation or organization)
|
|
(I.R.S. Employer Identification No.)
|
|
500 Shentel Way, Edinburg, Virginia
|
|
22824
|
|
(Address of principal executive offices)
|
|
(Zip Code)
|
(540) 984-4141
(Registrant's telephone number, including area code)
|
Common Stock (No Par Value)
|
NASDAQ Global Select Market
|
|
(Title of Class)
|
(Name of Exchange on which Registered)
|
SECURITIES REGISTERED PURSUANT TO SECTION 12(G) OF THE ACT:
NONE
Indicate by check mark if the registrant is a well-known seasoned issuer, as defined in Rule 405 of the Securities Act. Yes
o
No
þ
Indicate by check mark if the registrant is not required to file reports pursuant to Section 13 or Section 15(d) of the Exchange Act. Yes
o
No
þ
Indicate by check mark whether the registrant (1) has filed all reports required to be filed by Section 13 or 15(d) of the Securities Exchange Act of 1934 during the preceding 12 months (or for such shorter period that the registrant was required to file such reports), and (2) has been subject to such filing requirements for the past 90 days. Yes
þ
No
o
Indicate by check mark if disclosure of delinquent filers pursuant to Item 405 of Regulation S-K is not contained herein, and will not be contained, to the best of registrant’s knowledge, in definitive proxy or information statements incorporated by reference in Part III of this Form 10-K or any amendment to this Form 10-K.
þ
Indicate by check mark whether the registrant has submitted electronically and posted on its corporate Web site, if any, every Interactive Data File required to be submitted and posted pursuant to Rule 405 of Regulation S-T (
§ 232.405 of this chapter) during the preceding 12 months (or for such shorter period that the registrant was required to submit and post such files). Yes
þ
No
o
Indicate by check mark whether the registrant is a large accelerated filer, an accelerated filer, a non-accelerated filer, or a smaller reporting company. See the definitions of “large accelerated filer,” “accelerated filer” and “smaller reporting company” in Rule 12b-2 of the Exchange Act
|
Large accelerated filer
o
|
Accelerated filer
þ
|
Non-accelerated filer
o
|
Smaller reporting company
o
|
Indicate by check mark whether the registrant is a shell company (as defined in Rule 12b-2 of the Exchange Act). Yes
o
No
þ
The aggregate market value of the registrant’s voting stock held by non-affiliates of the registrant at June 30, 2013 based on the closing price of such stock on the Nasdaq Global Select Market on such date was approximately $372,000,000.
The number of shares of the registrant’s common stock outstanding on February 20, 2014 was 24,044,188.
DOCUMENTS INCORPORATED BY REFERENCE
Portions of the registrant’s definitive proxy statement relating to its 2014 annual meeting of shareholders (the “2014 Proxy Statement”) are incorporated by reference into Part III of this Annual Report on Form 10-K where indicated. The 2014 Proxy Statement will be filed with the U.S. Securities and Exchange Commission within 120 days after the end of the fiscal year to which this report relates.
1
|
Item
|
|
Page
|
|
Number
|
|
Number
|
|
|
|
|
|
|
PART I
|
|
|
|
|
|
|
1.
|
4
|
|
|
1A.
|
19
|
|
|
1B.
|
31
|
|
|
2.
|
31
|
|
|
3.
|
31
|
|
|
4.
|
31
|
|
|
|
|
|
|
|
PART II
|
|
|
|
|
|
|
5.
|
32
|
|
|
6.
|
34
|
|
|
7.
|
35
|
|
|
7A.
|
59
|
|
|
8.
|
59
|
|
|
9.
|
60
|
|
|
9A.
|
60
|
|
|
9B.
|
60
|
|
|
|
|
|
|
|
PART III
|
|
|
|
|
|
|
10.
|
61
|
|
|
11.
|
61
|
|
|
12.
|
61
|
|
|
13.
|
62
|
|
|
14.
|
62
|
|
|
|
|
|
|
|
PART IV
|
|
|
|
|
|
|
15.
|
62
|
CAUTIONARY NOTE REGARDING FORWARD-LOOKING STATEMENTS
This report includes “forward-looking statements” within the meaning of Section 27A of the Securities Act of 1933 and Section 21E of the Securities Exchange Act of 1934. The words “may,” “will,” “anticipate,” “estimate,” “expect,” “intend,” “plan,” “continue” and similar expressions as they relate to us or our management are intended to identify these forward-looking statements. All statements by us regarding our expected financial position, revenues, cash flow and other operating results, business strategy, financing plans, forecasted trends related to the markets in which we operate and similar matters are forward-looking statements. Our expectations expressed or implied in these forward-looking statements may not turn out to be correct. Our results could be materially different from our expectations because of various risks, including the risks discussed in this report under “Business” and “Risk Factors.”
PART I
Some of the information contained in this report concerning the markets and industry in which we operate is derived from publicly available information and from industry sources. Although we believe that this publicly available information and the information provided by these industry sources are reliable, we have not independently verified the accuracy of any of this information.
Unless we indicate otherwise, references in this report to “we,” “us,” “our,” “Shentel” and “the Company” means Shenandoah Telecommunications Company and its subsidiaries.
Overview
Shenandoah Telecommunications Company is a diversified telecommunications holding company that, through its operating subsidiaries, provides both regulated and unregulated telecommunications services to end-user customers and
other telecommunications providers in Virginia, West Virginia, central Pennsylvania and western Maryland. The Company offers a comprehensive suite of voice, video and data communications services based on the products and services provided by the Company’s operating subsidiaries.
As of December 31, 2011, the Company had twelve operating subsidiaries. During 2012, the Company implemented an internal reorganization to improve operating efficiencies and achieve other benefits. As part of the reorganization, we converted our two Wireless segment subsidiaries, our two Cable segment subsidiaries, and one of our Wireline segment subsidiaries, from corporations to limited liability companies. We consolidated our two Cable segment limited liability companies and merged four of our other Wireline segment subsidiaries into Shentel Communications, LLC. These conversions and mergers had no impact on the composition of our reported segments. Since December 31, 2012, the Company has had a total of seven operating subsidiaries.
Operating Segments
The Company provides integrated voice, video and data communications services to end-user customers and other telecommunications providers. Operating segments are defined as components of an enterprise about which separate financial information is available that is evaluated regularly by the chief operating decision makers. The Company has three reportable segments: (1) Wireless, (2) Cable, and (3) Wireline; and a fourth segment, Other, which primarily consists of parent company activities.
Wireless Segment
The business of the Wireless segment is conducted principally by the Company’s Shenandoah Personal Communications, LLC (“PCS”) subsidiary. As a Sprint PCS Affiliate of
Sprint Communications, Inc.
(“Sprint”), this subsidiary provides digital wireless service to a portion of a four-state area extending from Harrisburg, York and Altoona, Pennsylvania, to Harrisonburg, Virginia. Through the Company’s Shenandoah Mobile, LLC subsidiary, the Wireless segment owns 153 towers in the Company’s PCS service area, leases space on 151 towers to PCS and has 217 leases with other wireless communications providers at December 31, 2013. The Company expects a decline of 24 leases during the first quarter of 2014 due to termination of iDEN leases associated with the former Nextel network.
PCS has offered personal communications services through a digital wireless telephone and data network since 1995. In 1999, this subsidiary executed a management agreement with Sprint. The network, which utilizes code division multiple access, or CDMA, currently covers 269 miles of Interstates 81 and 83, and a 177 mile section of the Pennsylvania Turnpike between Pittsburgh and Philadelphia, as well as many of the communities near these routes. This territory includes approximately 2.4 million residents, and our network currently covers more than 86% of them. In early 2012, the Company amended its Management Agreement with Sprint in connection with the Company’s commitment to build a 4G LTE network in the Company’s service area. Under its agreements with Sprint,
the Company is the exclusive provider of wireless mobility communications network products and services in the 800 and 1900 megahertz spectrum ranges. The Company had 273,721 postpaid PCS customers at December 31, 2013, an increase of 4.1% compared to December 31, 2012. The Company had 137,047 prepaid wireless customers at December 31, 2013, an increase of 6.9% compared to December 31, 2012.
Of the Company’s total operating revenues, 59.2% in 2013, 58.6% in 2012 and 56.6% in 2011 were generated by or through Sprint and its customers using the Company's portion of Sprint’s nationwide PCS network. No other customer relationship generated more than 1.5% of the Company’s total operating revenues in 2013, 2012 or 2011.
Under the Sprint agreements, Sprint provides the Company significant support services, such as customer service, billing, collections, long distance, national network operations support, inventory logistics support, use of the Sprint brand names, national advertising, national distribution and product development.
The Company records its postpaid PCS revenues, with the exception of certain roaming and equipment sales revenues, based on the net PCS revenues billed by Sprint, net of an 8% Management Fee and a Net Service Fee retained by Sprint. The Net Service Fee was 12.0% for 2011, 2012, and early 2013. Effective August 1, 2013, this fee increased to 14.0%, the current cap. Net PCS revenues billed by Sprint consist of gross monthly recurring charges for service, net of both recurring and non-recurring customer credits, account write offs and other billing adjustments. Neither the Management Fee nor the Net Service Fee are deferred.
Prepaid revenues are recorded net of a 6% Management Fee retained by Sprint. Sprint charges the Company separately to acquire and support prepaid customers. These charges are calculated based on Sprint’s national averages for its prepaid programs, and are billed per user or per gross additional customer, as appropriate. The customer acquisition costs include handset subsidies.
The Sprint agreements require the Company to maintain certain minimum network performance standards and to meet other performance requirements. The Company was in compliance in all material respects with these requirements as of December 31, 2013.
Cable Segment
The business of the Company’s Cable segment is conducted through Shenandoah Cable Television, LLC (“Shenandoah Cable”), which was created through the 2012 merger of Company subsidiaries Shenandoah Cable Television Company and Shentel Cable Company. Shenandoah Cable provides video, voice and data services to customers in Virginia, Maryland, and West Virginia.
The Company has acquired several cable networks since 2008 with the intention to upgrade and integrate the networks, with the goal of improving existing services and offering expanded video, voice and internet services. As of December 31, 2013, the Company has upgraded all of the markets acquired in these transactions. Most of these markets are connected by a fiber network of 2,446 miles. Subscriber counts for internet services have doubled since acquisition, while voice subscribers have increased approximately 250% from acquisition. Video subscribers have declined approximately 10% from acquisition, excluding disposals.
There were 120,275 cable revenue generating units at December 31, 2013. A revenue generating unit consists of each separate service (video, voice and internet) subscribed to by a customer.
Wireline Segment
The business of the Company’s Wireline segment is conducted primarily by its Shenandoah Telephone Company subsidiary. This subsidiary provides both regulated and unregulated telephone services and leases fiber optic facilities in Virginia, primarily throughout the Northern Shenandoah Valley.
Shenandoah Telephone Company provides telephone services to approximately 22,060 customers as of December 31, 2013, primarily in Shenandoah County and small service areas in Rockingham, Frederick, Warren, and Augusta counties in Virginia. This subsidiary provides access for interexchange carriers to the local exchange network and switching for voice products offered through the Cable segment. This subsidiary has a 20 percent ownership interest in ValleyNet, which offers fiber network facility capacity to business customers and other telecommunications providers in western, central, and northern Virginia, as well as the Interstate 81 corridor from Johnson City, Tennessee to Carlisle, Pennsylvania.
The Wireline segment also includes Shentel Communications, LLC, which was created through the 2012 merger of four other of the Company’s Wireline subsidiaries into Shentel Communications, LLC. The following services are provided through this entity:
| · | Internet access to customers in the northern Shenandoah Valley and surrounding areas. The Internet service has 12,585 digital subscriber line, or DSL, customers at December 31, 2013. DSL service is available to all customers in the Company’s regulated telephone service area. |
| · | Operation of the Maryland and West Virginia portions of a fiber optic network along the Interstate 81 corridor. In conjunction with the telephone subsidiary, Shentel Communications, LLC is associated with the ValleyNet fiber optic network. Shentel Communications, LLC’s fiber network also extends south from Harrisonburg, Virginia, through Covington, Virginia, then westward to Charleston, West Virginia. This extension of the fiber network was acquired to connect to and support the Company’s cable business, and the provision of facility leases of fiber optic capacity to end users, in these areas. |
| · | Resale of long distance service for calls placed to locations outside the regulated telephone service area by telephone customers. There were approximately 9,851 long distance customers at December 31, 2013. |
| · | Facility leases of fiber optic capacity, owned by itself and affiliates, in surrounding counties and into Herndon, Virginia. |
Other Segment
The Other segment includes Shenandoah Telecommunications Company, which provides investing and management services to its subsidiaries.
Additional information concerning the Company’s operating segments is set forth in Note 15 of the Company’s consolidated financial statements appearing elsewhere in this report.
Discontinued Operation
The Company provided high speed Internet, video and local and long distance voice services to multi-dwelling unit (“MDU”) communities (primarily off-campus student housing) in the southeastern United States through its subsidiary, Shentel Converged Services, Inc. (“Converged Services”). In September 2008, the Company announced its intention to dispose of Converged Services, and in a number of transactions executed during 2011, 2012 and 2013, completed the disposition of all Converged Services properties and assets.
Competition
The telecommunications industry is highly competitive. We compete primarily on the basis of the price, availability, reliability, variety and quality of our offerings and on the quality of our customer service. Our ability to compete effectively depends on our ability to maintain high-quality services at prices competitive with those charged by our competitors. In particular, price competition in the integrated telecommunications services markets generally has been intense and is expected to increase. Our competitors include, among others, larger providers such as AT&T Inc., Verizon Communications Inc., CenturyLink, Inc., Frontier Communications Corp., DISH Network Corporation, DIRECTV, and various competitive service providers. The larger providers have substantially greater infrastructure, financial, personnel, technical, marketing and other resources, larger numbers of established customers and more prominent name recognition than the Company.
In markets where we provide video services, we also compete in the provision of local telephone and high speed data services against the incumbent local telephone company. Incumbent carriers enjoy substantial competitive advantages arising from their historical monopoly position in the local telephone market, including pre-existing customer relationships with virtually all end-users. Wireless communications providers also are competing with wireline service providers, which further increases competition.
Competition is intense in the wireless communications industry. Competition has caused, and we anticipate that competition will continue to cause, the market prices for wireless products and services to be constrained. This has resulted in some carriers introducing pricing plans that are structurally different and often more aggressively priced than in the past. Wireless providers are upgrading their wireless services to better accommodate real-time and downloadable audio and video content as well as Internet browsing capabilities and other services. Our ability to compete effectively will depend, in part, on our ability to anticipate and respond to various competitive factors affecting the wireless industry.
An additional competitive factor affecting the wireless industry is handset exclusivity. Until late 2011, the Company did not have access to the very popular iPhone. If we are unable to obtain access to popular handsets, or provide comparable phones, our ability to add or retain wireless customers may be adversely impacted.
Competition is also intense and growing in the market for video services. Incumbent cable television companies, which have historically provided video service, face competition from direct broadcast satellite providers, on-line video services and more recently from large wireline providers of telecommunications services (such as Verizon, Centurylink and AT&T) which have begun to upgrade their networks to provide video services in addition to voice and high-speed Internet access services. These entities are large and have substantially greater infrastructure, financial, personnel, technical, marketing and other resources, larger numbers of established customers and more prominent name recognition than the Company. Our ability to compete effectively will depend, in part, on the extent to which our service offerings overlap with these entities, and on our ability to anticipate and respond to the competitive forces affecting the market for video and other services.
A continuing trend toward consolidation, mergers, acquisitions and strategic alliances in the telecommunications industry could also increase the level of competition we face by further strengthening our competitors.
Regulation
Our operations are subject to regulation by the Federal Communications Commission (“FCC”), the Virginia State Corporation Commission (“VSCC”), the West Virginia Public Service Commission, the Maryland Public Service Commission, and other federal, state, and local governmental agencies. The laws governing these agencies, and the regulations and policies that they administer, are subject to constant review and revision, and some of these changes could have material impacts on our revenues and expenses.
The discussion below focuses on the regulation of our wireless subsidiaries, Shenandoah Personal Communications, LLC and Shenandoah Mobile, LLC, our incumbent local exchange carrier (“ILEC”) subsidiary, Shenandoah Telephone Company, and our cable subsidiary, Shenandoah Cable Television, LLC.
Regulation of Wireless Operations
We operate our wireless business using radio spectrum licensed from Sprint under the Sprint management agreements. Our wireless business is directly or indirectly subject to, or affected by, a number of regulations and requirements of the FCC and other governmental authorities that apply to providers of commercial mobile radio services (“CMRS”).
Interconnection.
Federal law and FCC regulations impose certain obligations on CMRS providers to interconnect their networks with other telecommunications providers (either directly or indirectly) and to enter into interconnection agreements (“ICAs”) with certain types of telecommunications providers. Interconnection agreements typically are negotiated on a statewide basis and are subject to state approval. If an agreement cannot be reached, parties to interconnection negotiations can submit unresolved issues to federal or state regulators for arbitration. In addition, FCC regulations previously required that local exchange carriers (“LECs”) and CMRS providers establish reciprocal compensation arrangements for the termination of traffic to one another. Disputes regarding intercarrier compensation can be brought in a number of forums (depending on the nature and jurisdiction of the dispute) including state public utility commissions (“PUCs”), FCC, and the courts. The Company does not presently have any interconnection or intercarrier compensation disputes.
On October 27, 2011, the FCC adopted a report and order which comprehensively reformed and modernized the agency’s intercarrier compensation (“ICC”) rules governing the telecommunications industry. Under the new FCC regime, effective December 29, 2011, local traffic between CMRS providers and most LECs must be compensated pursuant to a default bill-and-keep framework if there was no pre-existing agreement between the CMRS provider and the LEC. A number of parties have challenged the legality of the FCC’s report and order. Additionally, the FCC is considering a number of petitions for declaratory ruling and other proceedings regarding disputes among carriers relating to interconnection payment obligations. Resolution of these proceedings and any additional FCC rules regarding interconnection could directly affect us in the future. Interconnection costs represent a significant expense item for us and any significant changes in the intercarrier compensation scheme may have a material impact on our business. We are unable to determine with any certainty at this time whether any such changes would be beneficial to or detrimental to our wireless operations.
Universal Service Contribution Requirements.
Sprint is required to contribute to the federal universal service fund (the “USF”) based in part on the revenues it receives in connection with our wireless operations. The purpose of this fund is to subsidize telecommunications services in rural areas, for low-income consumers, and for schools, libraries, and rural healthcare facilities. Sprint is permitted to, and does, pass through these mandated payments as surcharges paid by customers.
Transfers, Assignments and Changes of Control of PCS Licenses
. The FCC must give prior approval to the assignment of ownership or control of a PCS license, as well as transfers involving substantial changes in such ownership or control. The FCC also requires licensees to maintain effective working control over their licenses. Our agreements with Sprint reflect an alliance that the parties believe meets the FCC requirements for licensee control of licensed spectrum. If the FCC were to determine that the Sprint PCS agreements need to be modified to increase the level of licensee control, we have agreed with Sprint under the terms of our Sprint PCS agreements to use our best efforts to modify the agreements as necessary to cause the agreements to comply with applicable law and to preserve to the extent possible the economic arrangements set forth in the agreements. If the agreements cannot be modified, the agreements may be terminated pursuant to their terms. The FCC could also impose sanctions on the Company for failure to meet these requirements.
PCS licenses are granted for ten-year terms. The PCS licenses for our service area are scheduled to expire on various dates between December 1, 2014 and June 30, 2015. Licensees have an expectation of license renewal if they have provided “substantial” service during its past license terms, and have “substantially” complied with FCC rules and policies, and with the Communications Act of 1934. All of the PCS licenses used in our wireless business have been successfully renewed since their initial grant.
Construction and Operation of Wireless Facilities.
Wireless systems must comply with certain FCC and Federal Aviation Administration (“FAA”) regulations regarding the registration, siting, marking, lighting and construction of transmitter towers and antennas. The FCC also requires that aggregate radio frequency emissions from every site meet certain standards. These regulations affect site selection for new network build-outs and may increase the costs of improving our network. The costs and delays from these regulations could have a material adverse effect on our operations.
The FCC’s decision to authorize a proposed tower may also be subject to environmental review pursuant to the National Environmental Policy Act of 1969 (“NEPA”), which requires federal agencies to evaluate the environmental impacts of their decisions under some circumstances. FCC regulations implementing NEPA place responsibility on each applicant to investigate any potential environmental effects of a proposed operation, including health effects relating to radio frequency emissions, and impacts on endangered species such as certain migratory birds, and to disclose any significant effects on the environment to the agency prior to commencing construction. On December 9, 2011, the FCC instituted a new pre-application notification process to enable members of the public to comment on the environmental effects of a proposed antenna structure that requires registration with the FCC. Under this process, a partial antenna structure registration (“ASR”) application is filed, and the applicant must provide notice of the proposed new antenna or modification. During that period any interested party may file a Petition for Environmental Request. The FCC may then determine if further environmental review is necessary. In the event that the FCC determines that a proposed tower would have a significant environmental impact, the FCC would require preparation of an environmental impact statement.
In addition, tower construction is subject to regulations implementing the National Historic Preservation Act. Compliance with FAA, environmental or historic preservation requirements could significantly delay or prevent the registration or construction of a particular tower or make tower construction more costly. In some jurisdictions, local laws or regulations may impose similar requirements.
Wireless Facilities Siting
. States and localities are authorized to engage in forms of regulation, including zoning and land-use regulation, which may affect our ability to select and modify sites for wireless facilities. States and localities may not engage in forms of regulation that effectively prohibit the provision of wireless services, discriminate among functionally equivalent services, or regulate the placement, construction or operation of wireless facilities on the basis of the environmental effects of radio frequency emissions. Courts and the FCC are routinely asked to review whether state and local zoning and land-use actions should be preempted by federal law, and the FCC also is routinely asked to consider other issues affecting wireless facilities siting in other proceedings. We cannot predict the outcome of these proceedings or the effect they may have on us.
Communications Assistance for Law Enforcement Act.
The Communications Assistance for Law Enforcement Act (“CALEA”) was enacted in 1994 to preserve electronic surveillance capabilities by law enforcement officials in the face of rapidly changing telecommunications technology. CALEA requires telecommunications carriers, including the Company, to modify their equipment, facilities, and services to allow for authorized electronic surveillance based on either industry or FCC standards. Following adoption of interim standards and a lengthy rulemaking proceeding, including an appeal and remand proceeding, all carriers were required to be in compliance with the CALEA requirements as of June 30, 2002. We are currently in compliance with the CALEA requirements.
Local Number Portability
. All covered CMRS providers, including the Company, are required to allow wireless customers to retain their existing telephone numbers when switching from one telecommunications carrier to another. These rules are generally referred to as wireless local number portability (“WLNP”). The future volume of any porting requests, and the processing costs related thereto, may increase our operating costs in the future. We are currently in compliance with WLNP requirements.
Number Pooling
. The FCC regulates the assignment and use of telephone numbers by wireless and other telecommunications carriers to preserve numbering resources. CMRS providers in the top 100 markets are required to be capable of sharing blocks of 10,000 numbers among themselves in subsets of 1,000 numbers (“1000s-block number pooling”); the FCC considers state requests to implement 1000s-block number pooling in smaller markets on a case-by-case basis, and has granted such requests in the past. In addition, all CMRS carriers, including those operating outside the top 100 markets, must be able to support roaming calls on their network placed by users with pooled numbers. Wireless carriers must also maintain detailed records of the numbers they have used, subject to audit. The pooling requirements may impose additional costs and increase operating expenses on us and limit our access to numbering resources. We are currently in compliance with the FCC number pooling requirements.
Telecommunications Relay Services (“TRS”).
Federal law requires wireless service providers to take steps to enable the hearing impaired and other disabled persons to have reasonable access to wireless services. The FCC has adopted rules and regulations implementing this requirement to which we are subject, and requires that we pay a regulatory assessment to support such telecommunications relay services for the disabled. The Company is in compliance with these requirements.
Consumer Privacy.
The Company is subject to various federal and state laws intended to protect the privacy of end-users who subscribe to the Company’s services. For example, the FCC has regulations that place restrictions on the permissible uses that we can make of customer-specific information, known as Customer Proprietary Network Information (“CPNI”), received from subscribers, and that govern procedures for release of such information in order to prevent identity theft schemes. Other laws impose criminal and other penalties for the violation of certain CPNI requirements and related privacy protections. In addition, restrictions exist, and new restrictions are considered from time to time by Congress, federal agencies and states, on the extent to which wireless customers may receive unsolicited telemarketing calls, text messages, junk e-mail or spam. Congress, federal agencies and certain states also are considering, and may in the future consider imposing, additional requirements on entities that possess consumer information to protect the privacy of consumers. The Company is required to file an annual certification of compliance to the FCC’s CPNI rules. Complying with these requirements may impose costs on us or compel us to alter the way we provide or promote our services.
Consumer Protection
. Many members of the wireless industry, including us, have voluntarily committed to comply with the CTIA Consumer Code for Wireless, which includes consumer protection provisions regarding the content and format of bills; advance disclosures regarding rates, terms of service, contract provisions, and network coverage; and the right to terminate service after a trial period or after changes to contract provisions are implemented. The FCC and/or some state commissions have considered or are considering imposing additional consumer protection requirements upon wireless service providers, including billing-related disclosures and usage alerts, as well as the adoption of standards for responses to customers and limits on early termination fees. On December 12, 2013, CTIA filed a letter with the Commission detailing voluntary commitments by large wireless providers, including Sprint, which will permit subscribers and former subscribers to unlock their mobile devices, subject to contract fulfillment timeframes for postpaid plans, or after 1 year for prepaid plans. The carriers have agreed to fully implement the voluntary commitments within 12 months of adoption. Adoption of those consumer protection requirements could increase the expenses or decrease the revenue of our wireless business.
Courts have also had, and in the future may continue to have, an effect on the extent to which matters pertaining to the content and format of wireless bills can be regulated at the state level. Any further changes to these and similar requirements could increase our costs of doing business and our costs of acquiring and retaining customers.
Net Neutrality
. In December 2010, the FCC adopted so-called “net neutrality” rules that it deemed necessary to ensure an “open” Internet that is not unduly restricted by network “gatekeepers.” Those rules subjected wireline and wireless broadband Internet access service providers to varying regulations (depending upon the nature of the service) including three key requirements: 1) a prohibition against blocking websites or other online applications; 2) a prohibition against unreasonable discrimination among Internet users or among different websites or other sources of information; and 3) a transparency requirement compelling the disclosure of network management policies. Our wireline and wireless subsidiaries that provide broadband Internet access services were subject to these rules. However, on January 14, 2014, the D.C. Circuit Court of Appeals, in Verizon v. FCC, struck down major portions of the FCC’s net neutrality rules governing the operating practices of broadband Internet access providers like us. The Court struck down the first two components of the rules, the prohibition against blocking and unreasonable discrimination, concluding that they constitute “common carrier” restrictions that are not permissible given the FCC’s earlier decision to classify Internet access as an “information service,” rather than a “telecommunications service.” The Court simultaneously upheld the FCC’s transparency requirement, concluding that this final requirement does not amount to impermissible common carrier regulation.
It is far from clear what impact the Court’s decision will have on the FCC’s future regulation of Internet traffic and broadband providers. The decision affirmatively recognizes the FCC’s jurisdiction over the Internet, based on Section 706 of the Telecommunications Act of 1996. Under the court’s reasoning, the FCC arguably could in the future resurrect the invalidated network neutrality regulations either by reclassifying broadband access as a telecommunications service subject to common carrier restrictions, by modifying the invalidated regulations so that they restrict broadband practices, but not as rigidly as the regulations the Court just invalided, or by investigating and sanctioning conduct that the FCC considers inconsistent with net neutrality principles on a case-by-case basis, without expressly relying on “common carrier”-type regulation. Alternatively, the FCC (or another party) could challenge the recent court ruling by seeking rehearing en banc or Supreme Court review. Legislation in this area is also possible. The reimposition of network neutrality restrictions could adversely affect the potential development of advantageous relationships with Internet content providers. Rules or statutes increasing the regulation of our Internet services could limit our ability to efficiently manage our networks and respond to operational and competitive challenges.
Radio Frequency Emission from Handsets
. Some studies (and media reports) have suggested that radio frequency emissions from handsets, wireless data devices and cell sites may raise various health concerns, including cancer, and may interfere with various electronic medical devices, including hearing aids and pacemakers. Most of the expert reviews conducted to date have concluded that the evidence does not support a finding of adverse health effects but that further research is appropriate. Courts have dismissed a number of lawsuits filed against other wireless service operators and manufacturers, asserting claims relating to radio frequency transmissions to and from handsets and wireless data devices. However, there can be no assurance that the outcome of other lawsuits, or general public concerns over these issues, will not have a material adverse effect on the wireless industry, including us.
Accessibility
. The FCC imposes obligations on telecommunications service providers, including wireless providers, intended to ensure that individuals with disabilities receive access to telecommunications services and equipment. For example, in 2012, certain FCC rules became effective that require providers of advanced telecommunications services (such as email and text messaging) to make their services and products accessible to disabled persons, unless doing so is not achievable. Similarly, existing FCC rules require us to offer a minimum number of hearing aid-compatible handsets to consumers. We cannot predict if or when additional changes will be made to the current FCC accessibility rules, or whether and how such changes will affect us.
911 Services
. We are subject to FCC rules that require wireless carriers to make emergency 911 services available to their subscribers, including enhanced 911 services that convey the caller’s telephone number and detailed location information to emergency responders. The FCC has also sought public comment to investigate further requirements regarding the accuracy of wireless location information transmitted during an emergency 911 call. Additionally, the FCC has recently proposed rules that would require all wireless carriers to support the ability of consumers to send text messages to 911 in all areas of the country where 911 Public Safety Answering Points are capable of receiving text messages. Also, in May 2013, the FCC adopted rules which require CMRS providers to provide an automatic “bounce-back” text message when a subscriber attempts to send a text message to 911 in a location where text-to-911 is not available. We are not able to predict the outcome of these proceedings or the effect that any changes to the 911 service rules will have on our operations.
Regulation of Incumbent Local Exchange Carrier Operations
As an ILEC, Shenandoah Telephone Company’s (“Shenandoah Telephone”) operations are regulated by federal and state regulatory agencies.
State Regulation
. Shenandoah Telephone’s rates for local exchange service, intrastate toll service, and intrastate access charges are subject to the approval of the VSCC. The VSCC also establishes and oversees implementation of certain provisions of the federal and state telecommunications laws, including interconnection requirements, promotion of competition, and consumer protection standards. The VSCC also regulates rates, service areas, service standards, accounting methods, affiliated transactions and certain other financial transactions. Pursuant to the FCC’s October 27, 2011 order adopting comprehensive reforms to the federal intercarrier compensation and universal service policies and rules (as discussed above and further below), the FCC preempted state regulatory commissions’ jurisdiction over all terminating access charges, including intrastate terminating access charges, which historically have been within the states’ jurisdiction. However, the FCC vested in the states the obligation to monitor the tariffing of intrastate rate reductions for a transition period, to oversee interconnection negotiations and arbitrations, and to determine the network edge, subject to FCC guidance, for purposes of the new “bill-and-keep” framework. Numerous judicial challenges to the FCC’s order have been filed and remain pending, and additional challenges remain possible, any of which could modify or delay the effectiveness of the FCC’s rule changes. We are therefore unable to predict the ultimate effect that the FCC’s order will have on the state regulatory landscape or our operations.
Regulation of Intercarrier Compensation.
Shenandoah Telephone participates in the access revenue pools administered by the FCC-supervised National Exchange Carrier Association (“NECA”), which collects and distributes the revenues from interstate access charges that long-distance carriers pay us for originating and terminating interstate calls over our network. Shenandoah Telephone also participates in some NECA tariffs that govern the rates, terms, and conditions of our interstate access offerings. Some of those tariffs are under review by the FCC, and we may be obligated to refund affected access charges collected in the past or in the future if the FCC ultimately finds that the tariffed rates were unreasonable. We cannot predict whether, when, and to what extent such refunds may be due.
On October 27, 2011, the FCC adopted a number of broad changes to the ICC rules governing the interstate access rates charged by small-to-mid-sized ILECs such as Shenandoah Telephone. For example, the FCC adopted a national “bill-and-keep” framework, which will result in substantial reductions in the access charges paid by long distance carriers and other interconnecting carriers, possibly to zero, accompanied by increases to the subscriber line charges paid by business and residential end users. In addition, the FCC has changed some of the rules that determine what compensation voice service providers, including but not limited to wireless carriers, competitive local exchange carriers, VOIP providers and providers of other Internet-enabled services, should pay and receive for originating and terminating traffic that is interconnected with ILEC networks.
Although the legality of the FCC’s recent changes to the ICC rules has been challenged by various parties, these changes, and potential future changes, to such compensation regulations could increase our expenses and/or reduce our revenues. At this time we cannot estimate the amount of such additional expense or revenue changes.
The VSCC has jurisdiction over local telephone companies’ intrastate access charges, and has indicated in the past that it might open a generic proceeding on the rates charged for intrastate access, although the scope and likelihood of such a proceeding is unclear in light of the FCC’s overhaul of the intercarrier compensation rules (discussed above), which affect states’ jurisdiction over intrastate access charges. The VSCC issued a Final Order on August 9, 2011 that requires service providers to eliminate their common carrier line charges in three stages. Pursuant to the order, the Company’s revenue was expected to decline by approximately $0.3 million annually beginning in 2012 until such charges are eliminated by mid-2014.
Interstate and intrastate access charges are important sources of revenue for Shenandoah Telephone’s operations. Unless these revenues can either be replaced through a new universal service mechanism, or unless they can be reflected in higher rates to local end users, or replaced through other newly created methods of cost recovery, the loss of revenues to us could be significant. There can be no assurance that access charges in their present form will be continued or that sufficient substitutes for the lost revenues will be provided. If access charges are reduced without sufficient substitutes for the lost revenues, this could have a material adverse impact on our financial condition, results of operations and cash flows. In addition, changes to the intercarrier compensation rules and policies could have a material impact on our competitive position vis-à-vis other service providers, particularly in our ability to proactively make improvements to our networks and systems.
Universal Service Fund.
Shenandoah Telephone receives disbursements from the USF. In October 2011, the FCC adopted comprehensive changes to the universal service program that are intended in part to stabilize the USF, the total funding of which had increased considerably in recent years. Some of the FCC’s reforms impact the rules that govern disbursements from the USF to rural ILECs such as Shenandoah Telephone, and to other providers. Although a number of challenges to the FCC’s reforms remain pending, such changes, and additional future changes, may reduce the size of the USF and payments to Shenandoah Telephone, which could have an adverse impact on the Company’s financial position, results of operations, and cash flows. The Company is not able to predict if or when additional changes will be made to the USF, or whether and how such changes would affect the extent of our total federal universal service assessments, the amounts we receive, or our ability to recover costs associated with the USF.
If the Universal Service Administrative Company (“USAC”) were required to account for the USF program in accordance with generally accepted accounting principles for federal agencies under the Anti-Deficiency Act (the “ADA”), it could cause delays in USF payments to fund recipients and significantly increase the amount of USF contribution payments charged to wireline and wireless consumers. Each year since 2004, Congress has adopted short-term exemptions for the USAC from the ADA. Congress has from time to time considered adopting a longer term exemption for the USAC from the ADA, but we cannot predict whether any such exemption will be adopted or the effect it may have on the Company.
In February, 2012, the FCC released an order making substantial changes to the rules and regulations governing the USF Lifeline Program, which provides discounted telephone services to low income consumers. The order imposes greater recordkeeping and reporting obligations, and generally subjects providers of Lifeline-supported services to greater oversight. As a result of our Company providing Lifeline-supported services, it is subject to increased reporting and recordkeeping requirements, and could be subject to increased regulatory oversight, investigations or audits. The FCC, USAC and other authorities have conducted, and in the future are expected to continue to conduct, more extensive audits of USF support recipients, as well as other heightened oversight activities. The impact of these activities on the Company, if any, is uncertain.
Other Regulatory Obligations.
Shenandoah Telephone is subject to requirements relating to CPNI, CALEA implementation, interconnection, access to rights of way, number portability, number pooling, accessibility of telecommunications for those with disabilities, protection for consumer privacy, and other obligations similar to those discussed above for our wireless operations.
The FCC and other authorities continue to consider policies to encourage nationwide advanced broadband infrastructure development. For example, the FCC has largely deregulated DSL and other broadband services offered by ILECs. Such changes benefit our ILEC, but could make it more difficult for us (or for NECA) to tariff and pool DSL costs. Broadband networks and services are subject to CALEA rules, network management disclosure and prohibitions, requirements relating to consumer privacy, and other regulatory mandates.
Net Neutrality
. For information concerning the FCC’s non-discrimination requirements for fixed broadband providers, see the discussion under “Regulation of Wireless Operations – Net Neutrality” above.
Long-Distance Services
. We offer long distance service to our customers through our subsidiary, Shentel Communications, LLC. Our long distance rates are not subject to FCC regulation, but we are required to offer long-distance service through a subsidiary other than Shenandoah Telephone, to disclose our long distance rates on a website, to maintain geographically averaged rates, to pay contributions to the USF and make other mandatory payments based on our long-distance revenues, and to comply with other filing and regulatory requirements. In November 2011 the FCC issued an order imposing greater recordkeeping and reporting obligations on certain long distance providers delivering calls to rural areas. The order imposes greater recordkeeping and quarterly reporting obligations on such providers, and generally subjects such providers to greater oversight.
At this time, the Company is exempt from these rules.
CLEC Operations.
We are authorized to operate as a CLEC in Maryland, Virginia, and West Virginia. CLECs generally are subject to federal and state regulations that are similar to, but not as stringent as, those that apply to our ILEC operations. Both the FCC and the state regulatory authorities require that, in most circumstances, CLEC access charges be no higher than the access charges of the ILECs in areas where they operate.
Regulation of Cable Television, Interconnected VoIP and Other Video Service Operations
Through Shenandoah Cable Television, LLC, we provide cable service in Shenandoah County, Virginia, a number of jurisdictions throughout West Virginia, numerous communities across southern and southwestern Virginia, and a small area of western Maryland.
The provision of cable service generally is subject to regulation by the FCC, and cable operators typically also must comply with the terms of the franchise agreement between the cable operator and the local franchising authority. Some states, including Virginia and West Virginia, have enacted regulations and franchise provisions that also can affect certain aspects of a cable operator’s operations.
Pricing and Packaging
. Federal law limits cable rate regulation to communities that are not subject to “effective competition,” as defined by law. Absent a finding of effective competition by the FCC, federal law authorizes local franchising authorities to regulate the monthly rates charged for the minimum level of video programming service (the “basic service tier”) and for the installation, sale and lease of equipment used by end users to receive the basic service tier. Although none of our cable communities have been found to be subject to effective competition, none of the local franchise authorities presently regulate our rates. Congress and the FCC from time to time have considered imposing new pricing and packaging restrictions on cable operators, including possible requirements to unbundle existing service tiers and provide cable programming on an a la carte basis. We cannot predict whether or when such new pricing and packaging restrictions may be imposed on us or what effect they would have on our ability to provide cable service.
Must-Carry/Retransmission Consent.
Local commercial and non-commercial broadcast television stations can require a cable operator to carry their signals pursuant to federal “must carry” requirements. Alternatively, local television stations may require that a cable operator obtain “retransmission consent” for carriage of the station’s signal, which can enable a popular local television station to obtain concessions from the cable operator for the right to carry the station’s signal. When stations choose retransmission consent over must-carry, both the station and the cable operator have a duty to negotiate in good faith for such consent. Although some local television stations today are carried by cable operators under the must-carry obligation, popular broadcast network affiliated stations (like ABC, CBS, FOX, and NBC) typically are carried pursuant to retransmission consent agreements. The cable industry’s retransmission consent costs are increasing rapidly. In 2010, a coalition of public interest groups and multichannel video programming distributors (“MVPDs”) petitioned the FCC for reform of the retransmission consent rules, and that FCC proceeding remains pending. In addition, legislation has been introduced in Congress to eliminate retransmission consent entirely. We are unable to predict what rules or rule changes, if any, Congress or the FCC might adopt in connection with retransmission consent and how such rules may affect our business.
Programming Costs.
Cable operators pay compulsory copyright fees (in addition to possible retransmission consent fees) to retransmit broadcast programming. Although the cable compulsory copyright license has been in place for almost 40 years, there have been legislative and regulatory proposals to replace the compulsory license with privately negotiated licenses. We cannot predict whether such proposals will be enacted and how they might affect our business.
Satellite-delivered cable programming, such as ESPN, HBO and the Discovery Channel, is not subject to must-carry/retransmission consent regulations or a compulsory copyright license. Rather, cable operators negotiate directly or through the National Cable Television Cooperative (“NCTC”) with satellite-delivered cable programmers for the right to carry their programming. The cost of acquiring the right to carry satellite-delivered cable programming can increase as the popularity of such programming increases, or as programmers demand rate increases. We cannot predict the extent to which such programming costs may increase in the future or the effect such cost increases may have on our ability to provide cable service.
Franchise Matters.
Cable operators generally must apply for and obtain non-exclusive franchises from local or state franchising authorities before providing cable service. The terms and conditions of franchises vary among jurisdictions, but franchises generally last for a fixed term, subject to renewal; require the cable operator to pay a franchise fee of as much as 5% of the cable operator’s gross revenue from video services; and contain certain service quality and customer service obligations. A significant number of states today have processes in place for obtaining state-wide franchises, and legislation has been introduced from time to time in Congress and in various states, including those in which we provide some form of video service, that would require the implementation of state-wide franchising processes. Although we cannot predict whether state-wide franchising will become ubiquitous, it would, if implemented, likely lower barriers to entry and increase competition in the marketplace for video services. In 2006, the FCC adopted new rules governing the terms and conditions under which franchising authorities can award franchises to entities that compete against incumbent cable service operators. These rules generally limit the ability of franchising authorities to impose certain requirements on and extract certain concessions from new entrants. Also in 2006, Virginia adopted a new franchising statute. This statute largely leaves franchising responsibility in the hands of local municipalities and counties, but it governs the local government entities’ award of such franchises and their conduct of franchise negotiations. We cannot predict the extent to which these rules and other developments will accelerate the pace of new entry into the video market or the effect, if any, they may have on our cable operations.
Leased Access/PEG.
The Communications Act permits franchising authorities to require cable operators to set aside the use of channels for public, education and governmental access (“PEG”) programming. The Communications Act also requires certain cable systems to make available a portion of their capacity for commercial leased access by third parties that would compete with programming offered on other channels of the cable system. Increases in the amount of required leased access or PEG access usage could reduce the number of channels available to us to provide other types of programming to subscribers and capacity to offer broadband.
Broadband Services
. For information concerning the regulation of Broadband services, see the discussion under “Regulation of Incumbent Local Exchange Carrier Operations – Broadband Services” above.
Net Neutrality
. For information concerning the FCC’s non-discrimination requirements for fixed broadband providers, see the discussion under “Regulation of Wireless Operations – Net Neutrality” above.
Voice over Internet Protocol (“VoIP”) Services
. We provide voice communications services over our cable network utilizing interconnected VoIP technology and service arrangements. Although similar to telephone service in some ways, our VoIP service arrangement utilizes different technology and is subject to many of the same rules and regulations applicable to traditional telephone service. The FCC order adopted on October 27, 2011, established rules governing intercarrier compensation payments for the origination and termination of telephone traffic between carriers and VoIP providers. The new rules are likely to substantially decrease intercarrier compensation payments we may have otherwise received over a multi-year period. The decreases over the multi-year transition will affect both the amounts that we pay to telecommunications carriers and the amounts that we receive from other carriers. The schedule and magnitude of these decreases, however, will vary depending on the nature of the carriers and the telephone traffic at issue. We cannot yet predict with certainty the balance of the impact on our revenues and expenses for voice services at particular times over this multi-year period.
Further regulatory changes are being considered that could impact our VoIP service. The FCC and state regulatory authorities are considering, for example, whether certain common carrier regulations traditionally applied to incumbent local exchange carriers should be modified or reduced, and the extent to which common carrier requirements should be extended to VoIP providers. The FCC has already determined that certain providers of voice services using Internet Protocol technology must comply with requirements relating to 911 emergency services, CALEA, Universal Service Fund contribution, customer privacy and Customer Proprietary Network Information issues, number portability, disability access, regulatory fees, and discontinuance of service. In March 2007, a federal appeals court affirmed the FCC’s decision concerning federal regulation of certain VoIP services, but declined to specifically find that VoIP service provided by cable companies, such as we provide, should be regulated only at the federal level. As a result, some states, including West Virginia, have begun proceedings to subject cable VoIP services to state level regulation. Although the West Virginia proceeding concluded without any new state-level regulation, it is difficult to predict whether it, or other state regulators, will continue to attempt to regulate our VoIP service. We have registered with, or obtained certificates or authorizations from, the FCC and the state regulatory authorities in those states in which we offer competitive voice services in order to ensure the continuity of our services and to maintain needed network interconnection arrangements. It is unclear whether and how these and other ongoing regulatory matters ultimately will be resolved.
Prospective competitors of Shenandoah Cable may also receive disbursements from the USF. Some of those competitors have requested USF support under the Connect America Fund to build broadband facilities in areas already served by Shenandoah Cable and its affiliates. Although Shenandoah Cable and its affiliates have opposed such requests, we cannot predict whether the FCC or another agency will grant such requests or otherwise fund broadband service in areas already served by the company.
Other Issues.
Our ability to provide cable service may be affected by a wide range of additional regulatory and related issues, including FCC regulations pertaining to set-top boxes, equipment connectivity, program exclusivity blackouts, accessibility to persons with disabilities, emergency alerts, pole attachments, privacy and technical standards. For example, proceedings before the FCC and state regulatory bodies have examined the rates that cable operators must pay to use utility poles and conduits, and other terms and conditions of pole attachment agreements. The FCC may also resume consideration of requiring cable operators to support a new interface that would enable consumers to use set-top boxes purchased at retail without the use of CableCARDs, rather than set-top boxes provided by the cable operator. We cannot predict the nature and pace of these and other developments or the effect they may have on our operations.
Employees
At December 31, 2013, we had approximately 682 employees, of whom approximately 619 were full-time employees. None of our employees is represented by a union or covered by a collective bargaining agreement.
Executive Officers
The following table presents information about our executive officers who, other than Christopher E. French, are not members of our board of directors. Our executive officers serve at the pleasure of the Board of Directors.
|
Name
|
Title
|
Age
|
Date in Position
|
|
Christopher E. French
|
President and Chief Executive Officer
|
56
|
April 1988
|
|
|
|
|
|
|
Earle A. MacKenzie
|
Executive Vice President and Chief Operating Officer
|
61
|
June 2003
|
|
|
|
|
|
|
Adele M. Skolits
|
Vice President – Finance, Chief Financial Officer and Treasurer
|
55
|
September 2007
|
|
|
|
|
|
|
William L. Pirtle
|
Vice President – Wireless
|
54
|
April 2004
|
|
|
|
|
|
|
Raymond B. Ostroski
|
General Counsel, Vice President-Legal and Secretary
|
59
|
January 2013
|
|
|
|
|
|
|
Thomas A. Whitaker
|
Vice President – Cable
|
53
|
June 2010
|
|
|
|
|
|
|
Edward H. McKay
|
Vice President – Wireline & Engineering
|
41
|
June 2010
|
|
|
|
|
|
|
Richard A. Baughman
|
Vice President – Information Technology
|
46
|
June 2010
|
Mr. French is President and Chief Executive Officer of the Company, where he is responsible for the overall leadership and strategic direction of the Company. He has served as president since 1988, and has been a member and Chairman of the Board of Directors since 1996. Prior to appointment as President, Mr. French held a variety of positions with the Company, including Vice President Network Service and Executive Vice President. Mr. French holds a BS in electrical engineering and an MBA, both from the University of Virginia. He has held board and officer positions in both state and national telecommunications associations, including service as a director of the Organization for the Promotion and Advancement of Small Telecommunications Companies (OPASTCO) and was president and director of the Virginia Telecommunications Industry Association. Mr. French is currently a member of the Leadership Committee of the USTelecom Association.
Mr. MacKenzie is Executive Vice President and Chief Operating Officer (COO) of the Company. He joined the Company in 2003, and is responsible for Shentel's daily operations of its subsidiaries. Mr. MacKenzie began his career in the telecommunications industry in 1975. He was the co-founder and President of Broadslate Networks and Essex Communications. He served as COO of Digital Television Services and as Senior Vice President of Contel Cellular. Mr. MacKenzie is a graduate of The College of William and Mary and holds a BBA in accounting and holds a C.P.A. certificate from the Virginia State Board of Accountancy. Mr. MacKenzie is a member of the Board of Directors of the American Cable Association.
Ms. Skolits serves as Chief Financial Officer and Vice President of Finance at Shentel. She joined the Company in 2007 and is responsible for Shentel's daily financial decisions. Ms. Skolits’ industry experience began in 1995 and included three years with Revol Wireless where she served as Chief Financial Officer. Ms. Skolits' telecommunications experience also includes serving as Controller for Comcast Metrophone, Director of Financial Operations for Comcast Cellular Communications and Chief Financial Officer of City Signal Communications. Ms. Skolits earned a BS degree in Commerce with a concentration in Accounting from the University of Virginia and she holds a C.P.A. certificate from the Virginia State Board of Accountancy.
Mr. Pirtle is Vice President - Wireless for Shentel. He is responsible for the ongoing operations of the Wireless segment of the Company. He joined the Company in 1992 as Vice President of Network Services responsible for Shentel's technology decisions, and maintenance and operation of its networks – telephone, cable, cellular, paging and fiber optics. He helped launch Shentel's Internet business in 1994, and led its participation in its wireless PCS business beginning in 1995. He is a graduate of the University of Virginia. Mr. Pirtle is a co-founder of the Shenandoah Valley Technology Council.
Mr. Ostroski is General Counsel and Vice President – Legal and Secretary for Shentel. Prior to joining the Company in January 2013, Mr. Ostroski was a Partner in the law firm of Thomas, Long, Niesen & Kennard since 2012 and was the Principal at RBO Consulting from 2011 to 2012 and from 2007 to 2009. Mr. Ostroski also served as Executive Vice President and General Counsel for One Communications from 2009 to 2011 and Senior Vice President and General Counsel for Commonwealth Telephone Enterprises from 2001 to 2007. Mr. Ostroski began his career in the telecommunications industry in 1985 and also served as General Counsel to RCN Corporation and C-TEC Corporation prior to 2001. Mr. Ostroski earned a B.S. degree in Social Science from Wilkes University and also earned a J.D. degree from Temple University School of Law.
Mr. Whitaker is Vice President – Cable for Shentel. He is responsible for the ongoing operations of the Cable segment of the Company. Mr. Whitaker joined Shentel in 2004 through the Shentel acquisition of NTC Communications. Mr. Whitaker began his career in 1982. Mr. Whitaker was previously COO of NTC Communications, and served as VP of Network Operations at Broadslate Networks, Director of Wireless Operations for nTelos, and was Co-Founder and Vice President of Nat-Com, Incorporated. Mr. Whitaker is a graduate of West Virginia Wesleyan College in Buckhannon, WV.
Mr. McKay is Vice President – Wireline and Engineering for Shentel. He joined Shentel in 2004 and is responsible for the ongoing operations of the Wireline segment of the Company, as well as the network planning and engineering for Shentel’s networks. Mr. McKay began his telecommunications industry experience in 1996, including previous engineering management positions at UUNET and Verizon. He is a graduate of the University of Virginia, where he earned M.E. and B.S. degrees in Electrical Engineering. Mr. McKay represents the Company on the Board of Valleynet.
Mr. Baughman is Vice President of Information Technology of Shentel. He began his career in 1995 with telecommunications and operations experience from a variety of telecommunications companies, including Bellcore/Telcordia, AT&T, Lucent, WINfirst and SureWest. He joined the Company in 2006. He is responsible for all of the back-office software and infrastructure systems at Shentel. Mr. Baughman has a B.S. in Electrical Engineering from Lafayette College and an M.S. in Optics from the University of Rochester.
Websites and Additional Information
The Company maintains a corporate website at
www.shentel.com
.
We make available free of charge through our website our annual report on Form 10-K, quarterly reports on Form 10-Q, current reports on Form 8‑K, and all amendments to those reports, as soon as reasonably practicable after we electronically file or furnish such reports with or to the SEC. The contents of our website are not a part of this report.
In addition,
the SEC maintains a website at www.sec.gov that contains reports, proxy and information statements, and other information regarding the Company.
Our business and operations are subject to a number of risks and uncertainties, including those set forth under “Business-Competition” and the following:
Risks Related to the Telecommunications Industry
Intensifying competition in all segments of our business may limit our ability to sustain profitable operations.
As new technologies are developed and deployed by competitors in our service area, some of our subscribers may select other providers’ offerings based on price, capabilities and personal preferences. Most of our competitors possess greater resources, have more extensive coverage areas, and offer more services than we do. If significant numbers of our subscribers elect to move to other competing providers, or if market saturation limits the rate of new subscriber additions, we may not be able to sustain profitable operations.
Nationwide, incumbent local exchange carriers have experienced a decrease in access lines due to the effect of wireless and wireline competition and the elimination of second lines dedicated to dial-up Internet as customers migrate to broadband connections. We have experienced comparatively modest reductions in the number of access lines to date, but based on industry experience we anticipate that the long-term trend toward declining telephone subscriber counts will continue. There is a significant risk that this downward trend could have a material adverse effect on the Company’s landline telephone operations in the future.
The Company’s revenue from fiber leases may be adversely impacted by price competition for these facilities.
Alternative technologies, changes in the regulatory environment and current uncertainties in the marketplace may reduce future demand for existing telecommunication services.
The telecommunications industry is experiencing significant technological change, evolving industry standards, ongoing improvements in the capacity and quality of digital technology, shorter development cycles for new products and enhancements and changes in end-user requirements and preferences. Technological advances, industry changes, changes in the regulatory environment, and the availability of additional blocks of spectrum or additional flexibility with respect to the use of currently available spectrum could cause the technology we use to become obsolete. We and our vendors may not be able to respond to such changes and implement new technology on a timely basis, or at an acceptable cost.
Continued adverse economic conditions in the United States and in our market area involving significantly reduced consumer spending could have a negative impact on our results of operations.
Our customers are individual consumers and businesses that provide goods and services to others, and are located in a relatively concentrated geographic area. The on-going national economic weakness, restricted credit markets, and high unemployment rates could continue to depress consumer spending and harm our operating performance. In addition, any adverse economic conditions that affect our geographic markets in particular could have further negative impacts on our results.
Regulation by government and taxing agencies may increase our costs of providing service or require changes in services, either of which could impair our financial performance.
Our operations are subject to varying degrees of regulation by the FCC, the Federal Trade Commission, the Federal Aviation Administration, the Environmental Protection Agency, and the Occupational Safety and Health Administration, as well as by state and local regulatory agencies. Action by these regulatory bodies could negatively affect our operations and our costs of doing business. For example, changes in tax laws or the interpretation of existing tax laws by state and local authorities could increase income, sales, property or other tax costs.
Our access revenue may be adversely impacted by legislative or regulatory actions, or technology developments, that decrease access rates or exempt certain traffic from paying for access to our regulated telephone network.
On October 27, 2011, the FCC adopted a number of broad changes to the intercarrier compensation rules governing the interstate access rates charged by small-to-mid-sized ILECs such as Shenandoah Telephone. For example, the FCC adopted a national “bill and keep” framework, which may result in substantial reductions in the access charges paid by long distance carriers and other interconnecting carriers, possibly to zero, accompanied by increases to the subscriber line charges paid by business and residential end users. In addition, the FCC has changed some of the rules that determine what compensation carriers, including but not limited to wireless carriers, competitive local exchange carriers, VoIP providers and providers of other Internet-enabled services, should pay (and receive) for their traffic that is interconnected with ILEC networks. Although the legality of the FCC’s recent changes to the ICC rules have been challenged by various parties, these changes, and potential future changes, to such compensation regulations could increase our expenses or reduce our revenues.
The VSCC has jurisdiction over local telephone companies’ intrastate access charges, and has indicated in the past that it might open a generic proceeding on the rates charged for intrastate access, although the scope and likelihood of such a proceeding is unclear in light of the FCC’s overhaul of the intercarrier compensation rules, which affect states’ jurisdiction over intrastate access charges. The VSCC issued a Final Order on August 9, 2011 that requires elimination of common carrier line charges in three stages. Pursuant to the order, the Company’s intrastate common line revenue has declined in each of the last two years and is expected to be eliminated by mid-2014.
Our distribution networks may be subject to weather-related events that may damage our networks and adversely impact our ability to deliver promised services or increase costs related to such events.
During 2012, the Mid-Atlantic region experienced two storms that impacted our cable networks more extensively than usual. The Company incurred approximately $800 thousand of costs to repair damage caused in these storms. Some published reports predict that warming global temperatures will increase the frequency and severity of such weather related events. Should such predictions be correct, and should such events impact the Mid-Atlantic region covered by our networks more frequently than in the past, our revenues and expenses could be materially adversely impacted.
Risks Related to our Overall Business Strategy
We may not benefit from our acquisition strategy.
As part of our business strategy, we regularly evaluate opportunities to enhance the value of our company by pursuing acquisitions of other businesses, and we intend to evaluate whether to pursue such strategic acquisition opportunities as they arise, though we remain subject to financial and other covenants in our credit agreements that contain restrictions as to the opportunities we may be able to pursue. We cannot provide any assurance, however, with respect to the timing, likelihood, size or financial effect of any potential transaction involving our company, as we may not be successful in identifying and consummating any acquisition or in integrating any newly acquired business into our operations.
The evaluation of business acquisition opportunities and the integration of any acquired businesses pose a number of significant risks, including the following:
| · | acquisitions may place significant strain on our management, financial and other resources by requiring us to expend a substantial amount of time and resources in the pursuit of acquisitions that we may not complete, or to devote significant attention to the various integration efforts of any newly acquired businesses, all of which will require the allocation of limited resources; |
| · | acquisitions may not have a positive impact on our cash flows or financial performance, even if acquired companies eventually contribute to an increase in our cash flows or profitability, because the acquisitions may adversely affect our operating results in the short term as a result of transaction-related expenses we will have to pay or the higher operating and administrative expenses we may incur in the periods immediately following an acquisition as we seek to integrate the acquired business into our operations; |
| · | we may not be able to eliminate as many redundant costs as we anticipate; |
| · | our operating and financial systems and controls and information services may not be compatible with those of the companies we may acquire and may not be adequate to support our integration efforts, and any steps we take to improve these systems and controls may not be sufficient; |
| · | our business plans and projections used to justify the acquisitions and expansion investments are based on assumptions of revenues per subscriber, penetration rates in specific markets where we operate, and expected operating costs. These assumptions may not develop as projected which may negatively impact our profitability; |
| · | growth through acquisitions will increase our need for qualified personnel, who may not be available to us or, if they were employed by a business we acquire, remain with us after the acquisition; and |
| · | acquired businesses may have unexpected liabilities and contingencies, which could be significant. |
Our ability to comply with the financial covenants in our credit agreement depends primarily on our ability to generate sufficient operating cash flow.
Our ability to comply with the financial covenants under the agreement governing our secured credit facilities will depend primarily on our success in generating sufficient operating cash flow. Under our credit agreement, we are subject to a total leverage ratio covenant, a minimum debt service coverage ratio covenant, and a minimum equity to assets ratio covenant. Industry conditions and financial, business and other factors, including those we identify as risk factors in this and our other reports, will affect our ability to generate the cash flows we need to meet those financial tests and ratios. Our failure to meet the tests or ratios could result in a default and acceleration of repayment of the indebtedness under our credit facilities. If the maturity of our indebtedness were accelerated, we would not have sufficient funds to repay such indebtedness. In such event, our lenders would be entitled to proceed against the collateral securing the indebtedness, which includes substantially our entire assets, to the extent permitted by our credit agreement and applicable law.
Our substantial level of indebtedness could adversely affect our financial health and ability to compete.
As of December 31, 2013, we have $230.0 million of total long-term indebtedness, including the current portion of such indebtedness. Our substantial level of indebtedness could have important consequences. For example, it may:
| · | increase our vulnerability to general adverse economic and industry conditions, including interest rate fluctuations, because a significant portion of our borrowings may continue to be at variable rates of interest; |
| · | require us to dedicate a substantial portion of our cash flow from operations to payments on our indebtedness, thereby reducing the availability of our cash flow to fund working capital, capital expenditures, dividends and other general corporate purposes; |
| · | limit our ability to borrow additional funds to alleviate liquidity constraints, as a result of financial and other restrictive covenants in our credit agreement; |
| · | limit our flexibility in planning for, or reacting to, changes in our business and the industry in which we operate; and |
| · | place us at a competitive disadvantage relative to companies that have less indebtedness. |
In addition, our secured credit facilities impose operating and financial restrictions that limit our discretion on some business matters, which could make it more difficult for us to expand, finance our operations and engage in other business activities that may be in our interest. These restrictions limit our ability and that of our subsidiaries to:
| · | incur additional indebtedness and additional liens on our assets; |
| · | engage in mergers or acquisitions or dispose of assets; |
| · | pay dividends or make other distributions; |
| · | voluntarily prepay other indebtedness; |
| · | enter into transactions with affiliated persons; |
| · | make investments; and |
| · | change the nature of our business. |
In addition to the term loan secured indebtedness we have incurred, and the $50 million of revolving credit indebtedness we may incur from time to time, we may incur additional indebtedness under our credit facilities. Any additional indebtedness we may incur in the future may subject us to similar or even more restrictive conditions.
Our ability to refinance our indebtedness in the future, should circumstances require it, will depend on our ability in the future to generate cash flows from operations and to raise additional funds, including through the offering of equity or debt securities. We may not be able to generate sufficient cash flows from operations or to raise additional funds in amounts necessary for us to repay our indebtedness when such indebtedness becomes due and to meet our other cash needs.
Our wireless switch equipment, as well as the primary means of access to and from our customers to other parties’ telecommunications networks, are located in one building.
Our PCS wireless switch, as well as many of the trunk lines and other circuits that provide access to and from our customers for voice services, and to some extent video services, are all housed in one building. Should that building and its contents be damaged severely, our ability to deliver many of our promised services may be substantially affected for extended periods of time, causing us to lose or refund revenue, lose customers, or incur significant costs to repair damage quickly to minimize the loss of revenues and customers. If proper or adequate insurance coverage is not in place, we may incur substantial costs to write-down the value of damaged equipment and other assets.
Disruptions of our information technology infrastructure could harm our business.
We depend on our information technology infrastructure to achieve our business objectives. A disruption of our infrastructure could be caused by a natural disaster, manufacturing failure, telecommunications system failure, or defective or improperly installed new or upgraded business management systems. Portions of our IT infrastructure also may experience interruptions, delays, or cessations of service or produce errors in connection with systems integration or migration work that takes place from time to time. In the event of any such disruption, we may be unable to conduct our business in the normal course. Moreover, our business involve
s
the processing, storage and transmission of data, which would also be negatively affected by such an event. A disruption of our infrastructure could cause us to lose customers and revenue, particularly during a period of heavy demand for our services. We also could incur significant expense in repairing system damage and taking other remedial measures.
We could suffer a loss of revenue and increased costs, exposure to significant liability, reputational harm, and other serious negative consequences if we sustain cyber attacks or other data security breaches that disrupt our operations or result in the dissemination of proprietary or confidential information about us or our customers or other third parties.
We manage and store various proprietary information and sensitive or confidential data relating to our operations. We routinely process, store and transmit large amounts of data for our customers, including sensitive and personally identifiable information. We may be subject to breaches of the information technology systems we use for these purposes. Experienced computer programmers and hackers may be able to penetrate our network security and misappropriate or compromise our confidential information or that of third parties, create system disruptions, or cause shutdowns. Computer programmers and hackers also may be able to develop and deploy viruses, worms, and other malicious software programs that attack our products or otherwise exploit any security vulnerabilities of our systems. In addition, sophisticated hardware and operating system software and applications that we procure from third parties may contain defects in design or manufacture, including "bugs" and other problems that could unexpectedly interfere with the operation of the system.
The costs to us to eliminate or address the foregoing security problems and security vulnerabilities before or after a cyber incident could be significant. Our remediation efforts may not be successful and could result in interruptions, delays, or cessation of service, and loss of existing or potential customers that may impede our critical functions. We could lose existing or potential customers for our services in connection with any actual or perceived security vulnerabilities in the services. In addition, breaches of our security measures and the unapproved dissemination of proprietary information or sensitive or confidential data about us or our customers or other third parties could expose us, our customers, or other third parties affected to a risk of loss or misuse of this information, result in litigation and potential liability for us, damage our brand and reputation, or otherwise harm our business.
We are subject to laws, rules and regulations relating to the collection, use and security of user data. Our ability to execute transactions and to possess and use personal information and data in conducting our business subjects us to legislative and regulatory burdens that may require us to notify customers or employees of a data security breach. We have incurred, and will continue to incur, expenses to comply with mandatory privacy and security standards and protocols imposed by law, regulation, industry standards or contractual obligations.
Risks Related to the Wireless Industry
New disclosure or usage requirements could adversely affect the results of our wireless operations.
The FCC is considering imposing additional consumer protection requirements upon wireless service providers, including billing-related disclosures and usage alerts. Such requirements could increase costs related to or impact the amount of revenue we receive from our wireless services.
Customer concerns over radio frequency emissions may discourage use of wireless handsets or expose us to potential litigation.
Media reports have suggested that certain radio frequency emissions from wireless handsets may be linked to various health problems, including cancer, and may interfere with various electronic medical devices, including hearing aids and pacemakers. Additionally, the FCC has commenced a rulemaking and notice of inquiry that seeks public comment on a variety of issues, including whether revisions to the existing radio frequency standards and testing requirements are warranted. Any decrease in demand for wireless services, increases in the costs of litigation, or damage awards resulting from substantiation of harm from such emissions could impair our ability to sustain profitable operations.
Regulation by government or potential litigation relating to the use of wireless phones while driving could adversely affect the results of our wireless operations.
Some studies have indicated that some aspects of using wireless phones while driving may impair drivers' attention in certain circumstances, making accidents more likely. These concerns could lead to litigation relating to accidents, deaths or serious bodily injuries, or to new restrictions or regulations on wireless phone use. A number of state and local governments are considering or have enacted legislation that would restrict or prohibit the use of a wireless handset while driving a vehicle or, alternatively, require the use of a hands-free handset. Additionally, certain federal agencies have adopted rules and proposed guidelines for the use of wireless handsets while operating commercial and non-commercial vehicles. These rules, and any legislation that could be enacted, may require wireless service providers to supply to their subscribers hands-free enhanced services, such as voice-activated dialing and hands-free speaker phones and headsets, in order to continue generating revenue from subscribers, who make many of their calls while on the road. If we are unable to provide hands-free services and products to subscribers in a timely and adequate fashion, the volume of wireless phone usage would likely decrease, and the ability of our wireless operations to generate revenues would suffer.
Risks Related to our PCS Business
The performance of Shenandoah Personal Communications, LLC, our largest operating subsidiary in terms of revenues and assets, may be adversely affected by any interruption in, or other adverse change to, Sprint’s business.
We rely on Sprint’s ongoing operations to continue to offer our PCS subscribers the seamless national services that we currently provide. Any interruption in, or other adverse change to, Sprint’s business could adversely affect our results of operations, liquidity and financial condition. The results of Sprint’s transaction with Softbank Corp. could affect Sprint’s business in a way that could be adverse to us. Our business could also be adversely affected if competing national or regional wireless carriers are able to introduce new products and services or otherwise satisfy customers’ service demands more rapidly or more effectively than Sprint.
Our participation in Sprint’s network modernization plan may affect our operating results, liquidity and financial position.
Sprint is implementing a network modernization plan, known as Network Vision, which incorporates upgrades and improvements to its wireless networks, with the intention of improving voice quality, coverage and data speeds and simultaneously reducing future operating costs. We are participating in this plan, and to date, have upgraded substantially all of the network in our service areas, on time and on budget.
The continuing success of the Network Vision plan will depend on the timing, extent and cost of implementation and the performance of third parties
.
Future activities include transitioning data services to the 800 megahertz spectrum, incorporating the 2.5 gigahertz spectrum acquired by Sprint as part of its acquisition of the portion of Clearwire it did not own, as well as other changes and improvements.
If Network Vision does not provide an enhanced network experience, our ability to provide enhanced wireless services to our customers, to retain and attract customers, and to maintain and grow our customer revenues could be adversely affected. Should Sprint’s implementation of the Network Vision plan be delayed, our margins would be adversely affected and such effects could be material. Should Sprint’s delivery of services expected to be deployed on the upgraded network be delayed due to technological constraints, performance of third-party suppliers, or other reasons, the cost of providing such services could become higher than expected, which could produce higher costs to customers, potentially resulting in the loss of customers to our competitors, and adversely affecting our revenues, profitability and cash flows from operations.
Our business may suffer as a result of competitive pressures.
Our revenue growth is primarily dependent on the growth of the subscriber base and average monthly revenues per user. Competitive pressures may adversely affect our ability to increase our future revenues. A continuation of competitive pressures in the wireless telecommunications market could cause some major carriers to offer plans with increasingly larger bundles of minutes of use and data services at lower prices that may compete with the Sprint wireless plans we sell. Increased price competition may lead to lower average monthly revenues per user.
We may not be able to implement our business plan if our operating costs are higher than we anticipate.
Increased competition may lead to higher promotional costs, losses on sales of handsets and other costs to acquire subscribers. If these costs are more than we anticipate, the actual amount of funds available to implement our operating strategy and business plan may fall short of our estimates.
The dynamic nature of the wireless market may limit management’s ability to correctly identify causes of volatility in key operating performance measures.
Our business plan and estimated future operating results are based on estimates of key operating performance measures, including subscriber growth, subscriber turnover (commonly known as churn), average monthly revenue per subscriber, losses on sales of handsets and other subscriber acquisition costs and other operating costs. The dynamic nature of the wireless market, economic conditions, increased competition in the wireless telecommunications industry, the entry of new competitors due to recent or future FCC spectrum auctions, new service offerings by Sprint or competitors at lower prices, and other issues facing the wireless telecommunications industry in general have created a level of uncertainty that may adversely affect our ability to predict these key measures.
We may experience a high rate of subscriber turnover, which could adversely affect our future financial performance.
Subscriber loss, or churn, has been relatively stable in recent years. Because of significant competition in the industry, the popularity of prepaid wireless service offerings, changes to Sprint’s competitive position and the overall economic downturn, among other factors, this relative stability may not continue and the future rate of subscriber turnover may be higher than rates in recent periods.
A high rate of subscriber loss could increase the sales and marketing costs we incur in obtaining new subscribers, especially because, consistent with industry practice, we subsidize most of the costs related to the purchases of handsets by subscribers.
We may incur significantly higher wireless handset subsidy costs than we anticipate for existing subscribers who upgrade to a new handset.
As our subscriber base matures, and technological innovations occur, we anticipate that existing subscribers will continue to upgrade to new wireless handsets. To discourage customer defections to competitors, we subsidize a portion of the price of wireless handsets and in some cases incur sales commissions for handset upgrades. If more subscribers upgrade to new wireless handsets than we project, or if the cost of such handsets increases or the amount of handset subsidies offered in the competitive marketplace increases more than we project, our results of operations would be adversely affected. If we do not continue to subsidize the cost of the handsets for handset upgrades, subscribers could choose to deactivate the service and move to other carriers.
If we are unable to secure and retain tower sites, the level of service we provide could be adversely affected.
Many of our cell sites are co-located on leased tower facilities shared with one or more wireless providers. A large portion of these leased tower sites are owned by a limited number of companies. If economic conditions affect the leasing company, our lease may be affected and the ability to remain on the tower at reasonable rates could be jeopardized, which could leave portions of our service area without service and increase customer turnover.
Most of the towers that we own are located on leased real property. If such leases were not renewed, we could be forced to relocate our cell site, which would create significant additional expenses, or leave portions of our service area without service, increasing the likelihood of customer turnover.
Risks Related to Our Relationship with Sprint
Sprint may make business decisions that are not in our best interests, which may adversely affect our relationships with subscribers in our territory, increase our expenses and decrease our revenues.
Under its agreements with us, Sprint has a substantial amount of control over the conduct of our PCS business. Accordingly, Sprint may make decisions that could adversely affect our PCS business, such as the following:
| · | Sprint could price its national plans based on its own objectives and could set price levels or other terms that may not be economically advantageous for us; |
| · | Sprint could develop products and services, or establish credit policies, that could adversely affect our results of operations; |
| · | if Sprint’s costs to perform certain services exceed the costs we expect, subject to limitations under our agreements, Sprint could seek to increase amounts charged; |
| · | Sprint could make decisions that could adversely affect the Sprint brand names, products or services; |
| · | Sprint could make technology and network decisions that could greatly increase our capital investment requirements and our operating costs to continue offering the seamless national service we provide; |
| · | Sprint could restrict our ability to offer new services needed to remain competitive. This could put us at a competitive disadvantage relative to other wireless service providers if they begin offering new services in our market areas, increasing our churn and reducing our revenues and operating income from wireless services. |
Our dependence on Sprint for services may limit our ability to forecast operating results.
Our dependence on Sprint injects a degree of uncertainty into our business and financial planning. We may, at times, disagree with Sprint concerning the applicability, calculation approach, or accuracy of Sprint-supplied revenue data. It is our practice to reflect the information supplied by Sprint in our financial statements for the applicable periods and to make corrections, if any, no earlier than the period in which Sprint and we agree to the corrections.
Inaccuracies in data provided by Sprint could overstate or understate our expenses or revenues and result in out-of-period adjustments that may adversely affect our financial results.
Because Sprint provides billing and collection services for us, Sprint remits a significant portion of our total revenues. We rely on Sprint to provide accurate, timely and sufficient data and information to enable us to properly record revenues, expenses and accounts receivable which underlie a substantial portion of our financial statements and other financial disclosures. We and Sprint could discover errors or inaccuracies, which, while not material to Sprint, could be material to us. If we are required in the future to make adjustments or incur charges as a result of errors or inaccuracies in data provided by Sprint, such adjustments or charges could materially affect our financial results for the period with respect to which the adjustments are made or charges are incurred. Such adjustments or charges could require restatement of our financial statements.
We are subject to risks relating to Sprint’s provision of back office services, and changes in products, services, plans and programs.
Any failure by Sprint to provide high-quality back office services could lead to subscriber dissatisfaction, increased churn or otherwise increased costs. We rely on Sprint’s internal support systems, including customer care, billing and back office support. Our operations could be disrupted if Sprint is unable to provide and expand its internal support systems while maintaining acceptable service levels, or to efficiently outsource those services and systems through third-party vendors.
The competitiveness of Sprint’s PCS products and services is a key factor in our ability to attract and retain subscribers. Changes in Sprint’s PCS products and services may reduce subscriber additions, increase subscriber turnover and decrease subscriber credit quality.
Sprint’s roaming arrangements to provide service outside of the Sprint National Network may not be competitive with other wireless service providers, which may restrict our ability to attract and retain subscribers and may increase our costs of doing business.
We rely on Sprint’s roaming arrangements with other wireless service providers for coverage in areas where Sprint PCS service is not available. If customers are not able to roam quickly or efficiently onto other wireless networks, we may lose current subscribers and Sprint PCS wireless services may be less attractive to new subscribers.
The risks related to our roaming arrangements include the following:
| · | the quality of the service provided by another provider while roaming may not approximate the quality of the service provided by the Sprint PCS network; |
| · | the price of a roaming call off network may not be competitive with prices of other wireless companies for roaming calls; |
| · | customers may not be able to use Sprint’s advanced features, such as voicemail notification, while roaming; and |
| · | Sprint or the carriers providing the service may not be able to provide accurate billing information on a timely basis. |
Some provisions of the Sprint agreements may diminish the value of our common stock and restrict or diminish the value of our business.
Under limited circumstances involving non-renewal of our agreement or a breach by us, Sprint may purchase the operating assets of our PCS operations at a discount of 20% in the event of non-renewal, or 28% in the event of a breach. These discounts would be applied to the “entire business value” (“EBV”) as that term is defined in our agreement with Sprint.
EBV is defined as i) the fair market value of a going concern paid by a willing buyer to a willing seller; ii) valued as if the business will continue to utilize existing brands and operate under existing agreements; and, iii) valued as if we own the spectrum. Determination of EBV is made by an independent appraisal process.
In addition, Sprint must approve any assignment of the Sprint agreements by us. Sprint also has a right of first refusal to purchase our PCS operating assets if we decide to sell those assets to a third party. These restrictions and other restrictions contained in the Sprint agreements could adversely affect the value of our common stock, may limit our ability to sell the foregoing assets on advantageous terms, may reduce the value a buyer would be willing to pay, and may reduce the EBV, as described in the Sprint agreements.
We may have difficulty in obtaining an adequate supply of handsets from Sprint.
We depend on our relationship with Sprint to obtain handsets. Sprint orders handsets from various manufacturers. We could have difficulty obtaining specific types of handsets in a timely manner if:
| · | Sprint does not adequately project the need for handsets, or enter into arrangements for new types of handsets or other customer equipment, for itself, its PCS Affiliates and its other third-party distribution channels, particularly in connection with the transition to new technologies; |
| · | Sprint gives preference to other distribution channels; |
| · | we do not adequately project our need for handsets; |
| · | Sprint modifies its handset logistics and delivery plan in a manner that restricts or delays access to handsets; or |
| · | there is an adverse development in the relationship between Sprint and its suppliers or vendors. |
The occurrence of any of the foregoing could disrupt subscribers’ service or result in a decrease in our subscribers.
If Sprint does not continue to enhance its nationwide digital wireless network, we may not be able to attract and retain subscribers.
Our PCS operations are dependent on Sprint’s national network. Sprint’s digital wireless network may not provide nationwide coverage to the same extent as the networks of its competitors, which could adversely affect our ability to attract and retain subscribers. Sprint currently covers a significant portion of the population of the United States, Puerto Rico and the U.S. Virgin Islands. Sprint offers PCS services, either on its own network or through its roaming agreements, in every part of the United States.
Sprint completed a transaction in which it transferred mobile broadband licenses and business operations to Clearwire Corp. and obtained a majority equity ownership interest in Clearwire. This transaction was entered with an expectation that Clearwire would expand its broadband networks in large metropolitan areas across the United States and that Sprint would offer high-speed broadband services (“4G Wimax”) in conjunction with Clearwire. During 2013, Sprint acquired the portion of Clearwire that it did not previously own.
Sprint’s arrangements with Clearwire and the risks associated with the Clearwire venture might adversely affect our business. Since initially entering into the Clearwire arrangement, Sprint has decided to upgrade its entire network incorporating 4G LTE technology. At this point, other wireless providers are ahead of Sprint in deploying their 4G networks. The introduction of 4G services in our service area by other operators, independent of arrangements with us or before we are able to complete the deployment of our own 4G network, might adversely affect our PCS business.
If Sprint’s PCS licenses are not renewed or are revoked, our PCS business would be harmed.
Non-renewal or revocation by the FCC of Sprint’s PCS licenses would significantly harm us. Wireless spectrum licenses are subject to renewal and revocation by the FCC. There may be opposition to renewal of Sprint’s PCS licenses upon their expiration, and Sprint’s PCS licenses may not be renewed. The FCC has adopted specific standards to apply to PCS license renewals. Any failure by Sprint to comply with these standards could cause revocation or forfeiture of Sprint’s PCS licenses.
If Sprint does not maintain control over its licensed spectrum, our Sprint agreements may be terminated, which would render us unable to continue providing service to our subscribers.
Risks Related to Our Cable Businesses
We face risks from increasing competition for the provision of cable and related video services.
Incumbent cable companies, which have historically provided video service, face competition from direct broadcast satellite providers, and more recently from large providers of wireline telecommunications services (such as Verizon, Centurylink and AT&T), which have begun to upgrade their networks to provide video services in addition to voice and broadband services. Wireless providers are also entering the market for video services by making such services available on handsets and tablets. In some areas, direct broadcast satellite providers have partnered with large incumbent telecommunications service providers to offer triple-play services. Moreover, consumers are increasingly accessing video content from alternative sources, such as internet-based websites and applications. The influx of competitors in this area, together with the development of new technologies to support them, are resulting in significant changes in the business models and regulatory provisions that have applied to the provision of video and other services. These developments may lead to a decline in the price and profitability of video and other services.
Our programming costs are subject to demands for increased payments.
The cable television industry has continued to experience an increase in the cost of programming, especially sports programming. In addition, as we add programming to our video services for existing customers or distribute existing programming to more customers, we incur increased programming expenses. Broadcasters affiliated with major over-the-air network services have been increasing their demands for cash payments and other concessions for the right to carry local network television signals on our cable systems. These increased costs cannot always be recouped by increased rates to subscribers. Moreover, as our programming contracts and retransmission agreements with programming providers expire, there can be no assurance that they will be renewed on acceptable terms.
Changes to key regulatory requirements can affect our ability to compete.
As programming costs and retail rates increase, Congress and the FCC have expressed concern about the impact on consumers, and they could impose restrictions affecting cable rates and programming packages that could adversely impact our existing business model.
There is currently extensive litigation against Aereo, an entity claiming a legal right to deliver broadcast signals to customers via Internet connections without paying any copyright fees or retransmission consent fees. The Aereo case is currently pending in the United States Supreme Court. If Aereo’s claim is ultimately upheld, it could lead to an increase in competition related to retransmitting broadcast signals, an important part of our business.
The Company operates cable television systems in largely rural areas of Virginia, West Virginia and Maryland. Virginia has adopted legislation to make it easier for companies to obtain local franchises to provide cable television service. The FCC has adopted new rules which substantially reduce the cost of obtaining a local franchise. These rules may make it easier for the Company to expand its cable television business, but also may result in increased competition for such business.
In 2013, the Federal Court of Appeals for the D.C. Circuit vacated some, but not all, of the FCC’s rules that require us to support CableCARDs that enable our customers to use set-top boxes purchased at retail rather than our leased set-top boxes. The FCC has taken comment on a petition to restore some of these rules and some parties are lobbying the Commission to revive earlier proceedings that would radically reshape set-top box regulation. One proposed rule would require multichannel video service providers to make available a standardized adapter that could be used to access cable content without the use of a cable set-top box or our branded program interface. New regulations could increase our cost for equipment, affect our relationship with our customers, and/or enable third parties to try to offer equipment that accesses disaggregated cable content merged with other services delivered over the Internet to compete with our premium service offerings.
Any significant impairment of our non-amortizing cable franchise rights would lead to a decrease in our assets and a reduction in our net operating performance.
At December 31, 2013, we had non-amortizing cable franchise rights of approximately $64.1 million which constituted approximately 10.7% of total assets at that date. If we make changes in our business strategy or if market or other conditions adversely affect our cable operations, we may be forced to record an impairment charge, which would lead to a decrease in the carrying value of the Company’s assets and reduction in our net operating performance. We test non-amortizing intangible assets for impairment annually or whenever events or changes in circumstances indicate impairment may have occurred. If the testing performed indicates that impairment has occurred, we are required to record an impairment charge for the difference between the carrying value of the non-amortizing intangible assets and the fair value of the non-amortizing intangible assets, in the period in which the determination is made. The testing of non-amortizing intangible assets for impairment requires the Company to make significant estimates about the future performance and cash flows of our Cable segment, as well as other assumptions. These estimates can be affected by numerous factors, including changes in economic, industry or market conditions, changes in underlying business operations, future reporting unit operating performance, changes in competition, or changes in technologies. Any changes to key assumptions, or actual performance compared with those assumptions, about our Cable segment’s business and its future prospects or other assumptions could affect the fair value of our Cable segment non-amortizing intangibles, resulting in an impairment charge.
Risks Related To Broadband Services
Our broadband services may be adversely impacted by legislative or regulatory changes that affect our ability to develop and offer services or that could expose us to liability from customers or others.
The Company provides broadband services to its cable and telephone customers through cable modems and digital subscriber lines (“DSL”), respectively. The FCC has adopted “open internet” rules, also referred to as “net neutrality,” that could affect the Company’s provision of broadband services. For information concerning the FCC’s non-discrimination requirements for fixed broadband providers, see the discussion under “Regulation of Wireless Operations – Net Neutrality” above.
None.
The Company owns its corporate headquarters, which occupies a 60,000-square foot building in Edinburg, Virginia. The Company also owns a 26,500-square foot building in Edinburg that houses the Company's main switching center and technical staff and a 10,700-square foot building in Edinburg used for customer services and retail sales.
The Company owns nine telephone exchange buildings that are located in the major towns and some of the rural communities that are served by the regulated telecommunications operations. These buildings contain switching and fiber optic equipment and associated local exchange telecommunications equipment. The Company has fiber optic hubs or points of presence in Hagerstown, Maryland; Ashburn, Berryville, Edinburg, Front Royal, Harrisonburg, Herndon, Leesburg, Stephens City, Warrenton and Winchester, Virginia; and Franklin, Petersburg, Shepherdstown and Martinsburg, West Virginia.
The Company leases land, buildings and tower space in support of its PCS operations. As of December 31, 2013, the Company had 526 PCS sites, including sites on property owned by the Company, and 14 leased retail locations.
The Company owns or leases other warehouse, office and retail space in various locations to support its operations. The leases for the foregoing land, buildings and tower space expire on various dates between 2014 and 2039. For information about these leases, see Note 13 to the consolidated financial statements appearing elsewhere in this report. The Company plans to lease additional land, equipment space, and retail space in support of its operations.
None
Not applicable
PART II
| ITEM 5. | MARKET FOR THE REGISTRANT'S COMMON EQUITY, RELATED STOCKHOLDER MATTERS AND ISSUER PURCHASES OF EQUITY SECURITIES |
The Company's stock is traded on the NASDAQ Global Select Market under the symbol “SHEN.” The following table shows the closing high and low sales prices per share of common stock as reported by the NASDAQ Global Select Market for each quarter during the last two years:
|
2013
|
High
|
Low
|
||||||
|
Fourth Quarter
|
$
|
28.69
|
$
|
22.92
|
||||
|
Third Quarter
|
24.10
|
17.15
|
||||||
|
Second Quarter
|
17.81
|
14.23
|
||||||
|
First Quarter
|
16.04
|
13.76
|
||||||
|
2012
|
High
|
Low
|
||||||
|
Fourth Quarter
|
$
|
18.71
|
$
|
12.92
|
||||
|
Third Quarter
|
18.32
|
13.61
|
||||||
|
Second Quarter
|
13.61
|
10.07
|
||||||
|
First Quarter
|
11.42
|
9.51
|
||||||
As of February 20, 2014, there were 4,289 holders of record of the Company’s common stock.
Shenandoah Telecommunications Company historically has paid annual cash dividends on or about December 1 of each year. The cash dividend was $0.36 per share in 2013 and $0.33 per share in 2012. Dividends are paid to Shenandoah Telecommunications Company shareholders from accumulated dividends paid to it by its operating subsidiaries. Under the Company’s credit agreement with CoBank dated September 14, 2012, the Company is restricted in its ability to pay dividends in the future.
So long as no Default or Event of Default (as such term is defined in the credit agreement) exists before, or will result after giving effect to such dividends, distributions or redemptions on a pro forma basis, the Company may declare or pay a lawful dividend or other distribution of assets, or retire, redeem, purchase or otherwise acquire capital stock in an aggregate amount which when added to any such dividends, distributions or redemptions of capital stock or other equity interest made, declared or paid from and after January 1, 2012 does not exceed $5 million plus 50% of the Company’s consolidated net income (excluding non-cash extraordinary items such as write-downs or write-ups of assets, other than current assets) from January 1, 2012 to the date of declaration of any such dividends, distributions or redemptions.
The following graph and table show the cumulative total shareholder return on the Company’s common stock compared to the NASDAQ U.S. Index, the NASDAQ Telecommunications Index, the NDAQ U.S. Index and the NDAQ Telecom Stocks Index for the period between December 31, 2008 and December 31, 2013. The NASDAQ Telecommunications Index includes 124 companies that represent a wide mix of telecommunications service and equipment providers and smaller carriers that offer similar products and serve similar markets. The graph assumes $100 was invested on December 31, 2008 in the Company’s common stock, and the other four indexes, and that all dividends were reinvested and market capitalization weighting as of December 31, 2009, 2010, 2011, 2012 and 2013.
As a result of a change in the total return data made available to us through our vendor provider, our performance graphs going forward will be using comparable indexes provided by NASDAQ OMX Global Indexes.
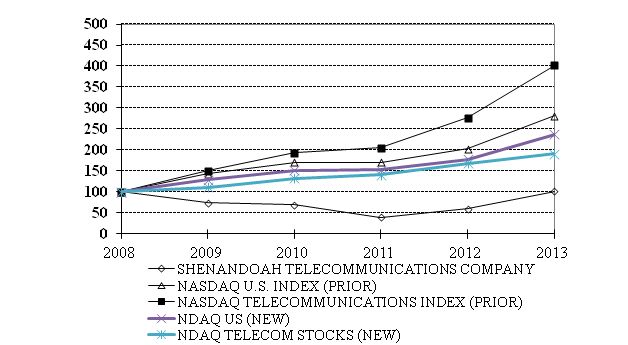
|
|
2008
|
2009
|
2010
|
2011
|
2012
|
2013
|
||||||||||||||||||
|
Shenandoah Telecommunications Company
|
100
|
74
|
69
|
40
|
60
|
102
|
||||||||||||||||||
|
NASDAQ U.S. Index (Prior)
|
100
|
144
|
170
|
171
|
202
|
282
|
||||||||||||||||||
|
NDAQ US (New)
|
100
|
129
|
152
|
152
|
177
|
237
|
||||||||||||||||||
|
NASDAQ Telecommunications Index (Prior)
|
100
|
150
|
194
|
205
|
277
|
401
|
||||||||||||||||||
|
NDAQ Telecom Stocks (New)
|
100
|
111
|
132
|
141
|
168
|
191
|
||||||||||||||||||
The Company maintains a dividend reinvestment plan (the “DRIP”) for the benefit of its shareholders. When shareholders remove shares from the DRIP, the Company issues a certificate for whole shares, pays out cash for any fractional shares, and cancels the fractional shares purchased. In addition, in conjunction with the award of shares or exercises of stock options, the Company periodically repurchases shares from certain recipients to cover the minimum statutory tax withholding requirements associated with the transaction. The following table provides information about the Company’s repurchases of shares during the three months ended December 31, 2013:
|
|
Number of
Shares
Purchased
|
Average
Price Paid
per Share
|
||||||
|
|
|
|
||||||
|
October 1 to October 31
|
-
|
$
|
-
|
|||||
|
November 1 to November 30
|
10,899
|
27.73
|
||||||
|
December 1 to December 31
|
2
|
25.67
|
||||||
|
|
||||||||
|
Total
|
10,901
|
$
|
27.73
|
|||||
The following table presents selected financial data as of December 31, 2013, 2012, 2011, 2010, and 2009 and for each of the years in the five-year period ended December 31, 2013.
The selected financial data as of December 31, 2013 and 2012 and for each of the years in the three-year period ended December 31, 2013 are derived from the Company’s audited consolidated financial statements appearing elsewhere in this report. The selected financial data as of December 31, 2011, 2010, and 2009 and for the years ended December 31, 2010 and 2009 are derived from the Company’s audited consolidated financial statements not included in this report.
The selected financial data should be read in conjunction with “Management’s Discussion and Analysis of Financial Condition and Results of Operations” and our consolidated financial statements and related notes thereto appearing elsewhere in this report.
(in thousands, except share and per share data)
|
|
2013
|
2012
|
2011
|
2010
|
2009
|
|||||||||||||||
|
|
|
|
|
|
|
|||||||||||||||
|
Operating revenues
|
$
|
308,942
|
$
|
288,075
|
$
|
251,145
|
$
|
195,206
|
$
|
160,935
|
||||||||||
|
Operating expenses
|
253,535
|
253,417
|
218,855
|
162,875
|
117,995
|
|||||||||||||||
|
Operating income
|
55,407
|
34,658
|
32,290
|
36,331
|
42,940
|
|||||||||||||||
|
Interest expense
|
8,468
|
7,850
|
8,289
|
4,716
|
1,361
|
|||||||||||||||
|
Income taxes
|
19,878
|
12,008
|
10,667
|
13,393
|
17,510
|
|||||||||||||||
|
|
||||||||||||||||||||
|
Net income from continuing operations
|
$
|
29,586
|
$
|
16,603
|
$
|
13,538
|
$
|
18,774
|
$
|
25,152
|
||||||||||
|
Discontinued operations, net of tax (a)
|
-
|
(300
|
)
|
(545
|
)
|
(699
|
)
|
(10,060
|
)
|
|||||||||||
|
Net income
|
$
|
29,586
|
$
|
16,303
|
$
|
12,993
|
$
|
18,075
|
$
|
15,092
|
||||||||||
|
Total assets
|
597,006
|
570,740
|
479,979
|
466,437
|
271,725
|
|||||||||||||||
|
Total debt – including current maturities
|
230,000
|
231,977
|
180,575
|
195,112
|
32,960
|
|||||||||||||||
|
|
||||||||||||||||||||
|
Shareholder Information:
|
||||||||||||||||||||
|
Shares outstanding
|
24,040,277
|
23,962,110
|
23,837,528
|
23,766,873
|
23,680,843
|
|||||||||||||||
|
Income per share from continuing operations-diluted
|
$
|
1.23
|
$
|
0.69
|
$
|
0.57
|
$
|
0.79
|
$
|
1.06
|
||||||||||
|
Loss per share from discontinued operations-diluted
|
|
-
|
(0.01
|
)
|
(0.02
|
)
|
(0.03
|
)
|
(0.42
|
)
|
||||||||||
|
Net income per share-diluted
|
|
1.23
|
0.68
|
0.55
|
0.76
|
0.64
|
||||||||||||||
|
Cash dividends per share
|
$
|
0.36
|
$
|
0.33
|
$
|
0.33
|
$
|
0.33
|
$
|
0.32
|
||||||||||
| (a) | Discontinued operations include the operating results of Converged Services. The Company announced its intention to dispose of Converged Services in September 2008, and reclassified its operating results as discontinued operations. In 2009, 2010, and 2011, the Company recognized impairment losses of $10.7 million, $1.1 million, and $0.4 million, respectively and in each case, net of taxes, to reduce the carrying value of net assets to their expected estimated fair value. The Company completed the disposition of Converged Services properties during 2013. |
This annual report contains forward-looking statements within the meaning of Section 27A of the Securities Act of 1933 and Section 21E of the Securities Exchange Act of 1934, including statements regarding our expectations, hopes, intentions, or strategies regarding the future. These statements are subject to certain risks and uncertainties that could cause actual results to differ materially from those anticipated in the forward-looking statements. Factors that might cause such a difference include those discussed in this report under “Business-Competition” and “Risk Factors.” The Company undertakes no obligation to publicly revise these forward-looking statements to reflect subsequent events or circumstances, except as required by law.
General
Overview.
Shenandoah Telecommunications Company is a diversified telecommunications company providing both regulated and unregulated telecommunications services through its wholly owned subsidiaries. These subsidiaries provide wireless personal communications services (as a Sprint PCS affiliate) and local exchange telephone services, as well as cable television, video, Internet and data services, long distance, sale of telecommunications equipment, fiber optics facilities, and leased tower facilities.
The Company has three reportable segments, which the Company operates and manages as strategic business units organized by lines of business: (1) Wireless, (2) Cable, and (3) Wireline. A fourth segment,
Other, primarily includes Shenandoah Telecommunications Company, the parent holding company.
The Company’s primary service area for the wireline and cable television businesses was historically Shenandoah County, Virginia. The county is a rural area in northwestern Virginia, with an estimated population of approximately 43,000 inhabitants. The Company believes that the potential for significant numbers of additional wireline customers in its historical operating area is limited.
The Wireless segment provides digital wireless service as a Sprint PCS Affiliate to a portion of a four-state area covering the region from Harrisburg, York and Altoona, Pennsylvania, to Harrisonburg, Virginia.
In this area, the Company is the exclusive provider of wireless mobility communications network products and services on the 800 and 1900 MHz bands under the Sprint brand.
This segment also owns cell site towers built on leased land, and leases space on these towers to both affiliates and non-affiliated service providers.
The Cable segment provides video, internet and voice services in Virginia, West Virginia and portions of western Maryland, and leases fiber optic facilities throughout its service area.
With the acquisition in December 2008 of cable system assets and customers from Rapid Communications, LLC, the Company expanded its cable services beyond Shenandoah County, Virginia, to portions of West Virginia and Alleghany County, Virginia. In July 2010, the Company further expanded its cable services through the acquisition of cable system assets and customers from JetBroadband, LLC, located throughout southern Virginia and southern West Virginia, and in December 2010, with the acquisition of cable assets and customers in Salem, West Virginia, and Oakland, Maryland, from Cequel III Communications II LP, doing business as Suddenlink.
The Wireline segment provides regulated and unregulated voice services, dial-up and DSL internet access, and long distance access services throughout Shenandoah County and portions of Rockingham, Frederick, Warren and Augusta counties in Virginia, and leases fiber optic facilities throughout the northern Shenandoah Valley of Virginia, northern Virginia and adjacent areas along the Interstate 81 corridor, including portions of West Virginia and Maryland.
The Company acquired approximately 1,000 telephone access lines in northwestern Augusta County, Virginia, by acquiring the assets of the North River Telephone Cooperative in 2009.
Through its subsidiary Shentel Converged Services, the Company provided local and long distance voice, video, and Internet services on an exclusive and non-exclusive basis to MDU communities, consisting primarily of off-campus college student housing throughout the southeastern United States. Since late 2008, Converged Services has been classified as a discontinued operation and its assets and liabilities classified as held for sale in the consolidated financial statements. The Company disposed of the assets of this subsidiary in a series of sales during 2011, 2012 and 2013.
Significant Transactions
The 2013, 2012 and 2011 financial results of the Company reflected several significant transactions. These transactions should be noted in understanding the financial results of the Company for 2013, 2012 and 2011.
Network Vision
In February 2012, the Company amended its Management Agreement with Sprint in connection with the Company’s commitment to build a 4G LTE network in the Company’s service area. Replacement of base stations began in May 2012, proceeded slowly through that August, and accelerated that fall. During 2012, the Company completed upgrades to 200 base stations, and during 2013, completed upgrades to substantially all of its 526
total base stations. Based upon the initial timetable and revisions, the Company determined that changes to the remaining depreciable lives for base stations and certain other assets were required, adding $8.4 million of additional depreciation expense to 2012’s results and $3.4 million to 2013. The 4G LTE base stations require either fiber or microwave backhaul. Accordingly, the Company has replaced the copper-based T1 circuits it previously had with fiber and microwave technology. In addition to incurring the costs to install the new backhaul facilities, the Company incurred duplicate network costs during the replacement period for each base station, and higher monthly costs of the higher capacity circuits (though much less expensive per megabit of capacity) following the upgrade, impacting 2012, 2013 and future years. However, the additional capacity of the new fiber-based backhaul facilities will delay the need to further upgrade its capacity to accommodate additional network traffic. Due to increases in capacity needs, the Company expects to replace microwave backhaul that it deployed at approximately 150 of its cell sites with fiber-based backhaul facilities in 2015 or 2016.
Revision of Prepaid Cost Pass-throughs
In July 2010, the Company executed an amendment to its Management Agreement with Sprint to allow the Company to participate in Sprint’s prepaid wireless offerings. The amendment specified that the revenue and cost per unit (per average subscriber or per gross addition or upgrade, as defined) as determined by Sprint on a national basis would be passed through to the Company. In December 2012, Sprint determined it had incorrectly calculated certain cost pass-throughs from inception of the Company’s participation, and reimbursed the Company for $11.8 million to correct its errors from July 2010 through September 2012. The Company recognized this receipt as a reduction of expenses in the quarter and year ended December 31, 2012. Approximately $6.1 million of this adjustment related to miscalculations of costs incurred in 2010 and 2011.
Cable Segment Goodwill Impairment
During 2012, the Company determined that the fair value of the Company’s Cable segment had declined during the year, and that the goodwill associated with this segment had become impaired. As a result the Company recorded an $11.0 million write-down of Cable segment goodwill in December of 2012. Factors contributing to this determination included weak economic conditions, underperformance relative to market operating margins and penetration levels, and continued capital spending to upgrade the last remaining markets, improve the customer experience, and combat subscriber loss.
Critical Accounting Policies
The Company relies on the use of estimates and makes assumptions that affect its financial condition and operating results. These estimates and assumptions are based on historical results and trends as well as the Company's forecasts as to how these might change in the future. The most critical accounting policies that materially affect the Company's results of operations include the following:
Revenue Recognition
The Company recognizes revenue when persuasive evidence of an arrangement exists, services have been rendered or products have been delivered, the price to the buyer is fixed and determinable and collectability is reasonably assured. Revenues are recognized by the Company based on the various types of transactions generating the revenue. For services, revenue is recognized as the services are performed. For equipment sales, revenue is recognized when the sales transaction is complete. For transactions with customers in our Wireless segment that involve multiple elements, such as the sale of service combined with the sale of a handset, the consideration received at the time of sale is measured and allocated to the separate units based upon their relative fair values. This method generally results in all cash received at the time of the initial sale being allocated to and recognized as equipment revenue.
Under the Sprint Management Agreement, postpaid wireless service revenues are reported net of an 8% Management Fee and, since its imposition effective January 1, 2007, the Net Service Fee retained by Sprint. The Net Service Fee was set at 12%, the maximum then allowed under the Management Agreement, during 2010. In accordance with the February 2012 amendment, the fee increased to 14%, the maximum allowed, effective August 1, 2013. Prepaid wireless service revenues are reported net of a 6% Management Fee.
Allowance for Doubtful Accounts
Estimates are used in determining the allowance for doubtful accounts and are based on historical collection and write-off experience, current trends, credit policies, and the analysis of the accounts receivable by aging category. In determining these estimates, the Company compares historical write-offs in relation to the estimated period in which the subscriber was originally billed. The Company also looks at the historical average length of time that elapses between the original billing date and the date of write-off and the financial position of its larger customers in determining the adequacy of the allowance for doubtful accounts. From this information, the Company assigns specific amounts to the aging categories. The Company provides an allowance for all receivables over 60 days old and partial allowances for all other receivables. The Company does not carry an allowance for receivables related to Sprint PCS customers. In accordance with the terms of the affiliate contract with Sprint, the Company receives payment from Sprint for the monthly net billings to PCS customers in weekly installments over the following four or five weeks.
Income Taxes
Income taxes are accounted for under the asset and liability method. Deferred tax assets and liabilities are recognized for the future tax consequences attributable to differences between financial statement carrying amounts of existing assets and liabilities and their respective tax bases. Deferred tax assets and liabilities are measured using enacted tax rates expected to apply to taxable income in the years in which those temporary differences are expected to be recovered or settled. The effect on deferred tax assets and liabilities of a change in tax rates is recognized in income in the period that includes the enactment date. The Company evaluates the recoverability of deferred tax assets generated on a state-by-state basis from net operating losses apportioned to that state. Management uses a more likely than not threshold to make the determination if a valuation allowance is warranted for tax assets in each state. Management evaluates the effective rate of taxes based on apportionment factors, the Company’s operating results, and the various state income tax rates.
Leases
The Company recognizes rent expense on a straight-line basis over the initial lease term and renewal periods that are reasonably assured at the inception of the lease. In light of the Company’s investment in each leased site, including acquisition costs and leasehold improvements, the Company includes the exercise of certain renewal options in the recording of operating leases. Where the Company is the lessor, the Company recognizes revenue on a straight line basis over the non-cancelable term of the lease.
Long-lived Assets
The Company views the determination of the carrying value of long-lived assets as a critical accounting estimate since the Company must determine an estimated economic useful life in order to properly amortize or depreciate long-lived assets and because the Company must consider if the value of any long-lived assets have been impaired, requiring adjustment to the carrying value.
Economic useful life is the duration of time the asset is expected to be productively employed by us, which may be less than its physical life. The Company’s assumptions on obsolescence, technological advances, and other factors affect the determination of estimated economic useful life. The estimated economic useful life of an asset is monitored to determine if it continues to be appropriate in light of changes in business circumstances. For example, technological advances may result in a shorter estimated useful life than originally anticipated. In such a case, the Company would depreciate the remaining net book value of the asset over the new estimated remaining life, increasing depreciation expense on a prospective basis. During 2013, based upon Company projections, the Company determined that microwave equipment used to backhaul wireless traffic from approximately 150 of its cell sites would be inadequate to carry its traffic by 2016, and accordingly, reduced the remaining useful life of this class of assets. The additional depreciation expense for 2013 was not significant.
Goodwill and Other Intangible Assets
Goodwill represents the excess of consideration paid over the fair value of net assets acquired in business combinations and was created primarily through cable acquisitions. The Company determined that Cable segment goodwill had become impaired during 2012, and the full carrying value was written off.
Cable franchises included in Intangible assets, net provide us with the non-exclusive right to provide video services in a specified area. While some cable franchises are issued for a fixed time (generally 10 years), renewals of cable franchises have occurred routinely and at nominal cost. Moreover, we have determined that there are currently no legal, regulatory, contractual, competitive, economic or other factors that limit the useful lives of our cable franchises.
Cable franchise rights and other intangible assets with indefinite lives are not amortized but are tested at least annually for impairment. The testing is performed on the value as of November 30 each year, and is generally composed of comparing the book value of the assets to their estimated fair value. Cable franchises are tested for impairment on an aggregate basis, consistent with the management of the Cable segment as a whole, utilizing a greenfield valuation approach. It is the Company’s practice to engage an independent appraiser to prepare these fair value analyses.
Intangible assets that have finite useful lives are amortized over their useful lives. Acquired subscriber base assets are amortized using accelerated amortization methods over the expected period in which those relationships are expected to contribute to our future cash flows. Other finite-lived intangible assets are generally amortized using the straight-line method of amortization.
Other
The Company does not have any unrecorded off-balance sheet transactions or arrangements; however, the Company has significant commitments under operating leases.
Results of Continuing Operations
2013 Compared to 2012
Consolidated Results
The Company’s consolidated results from continuing operations for the years ended December 31, 2013 and 2012 are summarized as follows:
|
(in thousands)
|
Years Ended
December 31,
|
Change
|
||||||||||||||
|
2013
|
2012
|
$
|
%
|
|||||||||||||
|
Operating revenues
|
$
|
308,942
|
$
|
288,075
|
20,867
|
7.2
|
||||||||||
|
Operating expenses
|
253,535
|
253,417
|
118
|
0.0
|
||||||||||||
|
Operating income
|
55,407
|
34,658
|
20,749
|
59.9
|
||||||||||||
|
Other income (expense)
|
(5,943
|
)
|
(6,047
|
)
|
104
|
1.7
|
||||||||||
|
Income tax expense
|
19,878
|
12,008
|
7,870
|
65.5
|
||||||||||||
|
Net income from continuing operations
|
$
|
29,586
|
$
|
16,603
|
12,983
|
78.2
|
||||||||||
Operating revenues
Operating revenues increased $20.9 million, or 7.2%, in 2013 over 2012, primarily due to an increase of $18.5 million in the Wireless segment and $5.1 million in the Cable segment. The increase in the Wireless segment resulted from increases in postpaid service revenues of $11.1 million and $8.9 million in prepaid service revenues. The postpaid revenues grew as a result of a 4.1% increase in subscribers during the year, and incremental data fees charged to customers with smartphones. The prepaid service revenues grew as a result of improved product mix and a 6.9% increase in prepaid customers during 2013. The Cable segment revenues grew primarily due to revenue generating unit growth of 11.7% and 22.2% in high speed data and voice service, respectively. The growth in revenue described above was partially offset by a $2.0 million increase in affiliated revenue, which is eliminated in consolidation.
Operating expenses
During the fourth quarter of 2012, the Company received $11.8 million from Sprint to reduce cost allocations relating to our participation in Sprint’s prepaid program beginning in July 2010 and continuing through September 30, 2012. The expense reduction reduced costs of goods and services sold by $8.4 million and selling, general and administrative expenses by $3.4 million, and reflected the recalculation of certain expenses, costs per gross addition (including the cost of handsets) and cash cost per user, associated with the program. Had Sprint calculated these costs consistently in previous years, $6.1 million of the $11.8 million would have been recorded in 2010 and 2011.
Adjusting for the effect of the prepaid wireless expense reduction discussed above, operating expenses decreased $6.0 million compared to the 2012 period. Cable segment operating expenses decreased $9.8 million, due to an $11.0 million write-off of goodwill in 2012, partially offset by 2013 growth in network costs, programming costs, and costs for customer service. The adjusted Wireless segment accounted for a year over year increase of $5.6 million, principally due to increased costs to add and maintain prepaid subscribers and growth in rent and maintenance expenses associated with the rollout of LTE coverage. These Wireless segment increases were partially offset by a decrease in depreciation expense due to less accelerated depreciation on assets to be replaced by Network Vision in the current year. Wireline segment operating expenses increased $0.2 million, primarily due to higher depreciation on new switch and circuit equipment, partially offset by a decrease in cost of goods and services.
Other income (expense)
The change in other income (expense) was driven by activity in patronage income and interest expense in 2013 over 2012. Other income increased $0.8 million primarily due to higher patronage income, arising from the September 2012 Amended and Restated Credit Agreement. Interest expense grew $1.4 million in 2013 as a result of higher outstanding debt balances, and was partially offset by the 2012 write-off of $0.8 million of unamortized loan costs.
Income tax expense
The Company’s effective tax rate on income from continuing operations decreased from 42.0% in 2012 to 40.2% in 2013 principally due to changes undertaken in 2012 to simplify the Company’s corporate structure that reduced the impact of state taxes on the Company’s overall effective tax rate. The Company expects that the effective tax rate will be approximately 40% in 2014.
Net income from continuing operations
Net income from continuing operations increased $13.0 million in 2013 from 2012, primarily as a result of the 2012 goodwill impairment, the continued growth in the Wireless and Cable segments and the decrease in the effective tax rate.
Wireless
The Company’s Wireless segment provides digital wireless service to a portion of a four-state area covering the region from Harrisburg, York and Altoona, Pennsylvania, to Harrisonburg, Virginia, through Shenandoah Personal Communications, LLC (“PCS”), a Sprint PCS Affiliate. This segment also leases land on which it builds Company-owned cell towers, which it leases to affiliated and non-affiliated wireless service providers, throughout the same four-state area described above, through Shenandoah Mobile, LLC (“Mobile”).
PCS receives revenues from Sprint for subscribers that obtain service in PCS’s network coverage area. PCS relies on Sprint to provide timely, accurate and complete information to record the appropriate revenue for each financial period. Postpaid revenues received from Sprint are recorded net of certain fees retained by Sprint. These fees totaled 20% of net postpaid billed revenue, as defined, during 2011, 2012 and through July 31, 2013.
During the first quarter of 2012, the Company entered into agreements with Sprint and Alcatel-Lucent to begin adding 4G LTE service to the Company’s Wireless network. The 4G service uses base station equipment acquired from Alcatel-Lucent in conjunction with Sprint’s wireless network upgrade plan known as Network Vision. Based upon an analysis of the balance of payments between Sprint and Shentel, effective August 1, 2013, Sprint increased the net service fee to 14%, bringing the total fee retained by Sprint to 22%.
The Company offers prepaid wireless products and services in its PCS network coverage area. Sprint retains a 6% Management Fee on prepaid revenues. Prepaid revenues received from Sprint are reported net of the cost of this fee. Other fees charged on a per unit basis are separately recorded as expenses according to the nature of the expense. The Company pays handset subsidies to Sprint for the difference between the selling price of handsets and their cost, in aggregate and as a net cost included in cost of goods sold. The revenue and expense components reported to us by Sprint are based on Sprint’s national averages for prepaid services, rather than being specifically determined by customers assigned to our geographic service areas.
The following tables show selected operating statistics of the Wireless segment as of the dates shown:
|
|
Dec. 31,
|
Dec. 31,
|
Dec. 31,
|
|||||||||
|
|
2013
|
2012
|
2011
|
|||||||||
|
Retail PCS Subscribers – Postpaid
|
273,721
|
262,892
|
248,620
|
|||||||||
|
Retail PCS Subscribers – Prepaid
|
137,047
|
128,177
|
107,100
|
|||||||||
|
PCS Market POPS (000) (1)
|
2,397
|
2,390
|
2,388
|
|||||||||
|
PCS Covered POPS (000) (1)
|
2,067
|
2,057
|
2,055
|
|||||||||
|
CDMA Base Stations (sites)
|
526
|
516
|
509
|
|||||||||
|
Towers
|
153
|
150
|
149
|
|||||||||
|
Non-affiliate Cell Site Leases (2)
|
217
|
216
|
219
|
|||||||||
|
Gross PCS Subscriber Additions – Postpaid
|
66,558
|
69,124
|
65,240
|
|||||||||
|
Net PCS Subscriber Additions – Postpaid
|
10,829
|
14,272
|
13,811
|
|||||||||
|
PCS Average Monthly Retail Churn % - Postpaid (3)
|
1.75
|
%
|
1.79
|
%
|
1.78
|
%
|
||||||
|
Gross PCS Subscriber Additions – Prepaid
|
76,416
|
72,793
|
86,328
|
|||||||||
|
Net PCS Subscriber Additions – Prepaid
|
8,870
|
21,077
|
40,144
|
|||||||||
|
PCS Average Monthly Retail Churn % - Prepaid (3)
|
4.24
|
%
|
3.67
|
%
|
4.33
|
%
|
||||||
| 1) | POPS refers to the estimated population of a given geographic area and is based on information purchased from third party sources. Market POPS are those within a market area which the Company is authorized to serve under its Sprint PCS affiliate agreements, and Covered POPS are those covered by the Company’s network. |
| 2) | The Company expects a decline of 24 leases during the first quarter of 2014 due to termination of Sprint iDEN leases associated with the former Nextel network. |
| 3) | PCS Average Monthly Retail Churn is the average of the monthly subscriber turnover, or churn, calculations for the period. |
|
(in thousands)
|
Years Ended
December 31,
|
Change
|
||||||||||||||
|
|
2013
|
2012
|
$
|
%
|
||||||||||||
|
|
|
|
|
|||||||||||||
|
Segment operating revenues
|
|
|
|
|||||||||||||
|
Wireless service revenue
|
$
|
182,955
|
$
|
162,912
|
$
|
20,043
|
12.3
|
|||||||||
|
Tower lease revenue
|
10,339
|
9,114
|
1,225
|
13.4
|
||||||||||||
|
Equipment revenue
|
5,218
|
5,982
|
(764
|
)
|
(12.8
|
)
|
||||||||||
|
Other revenue
|
(387
|
)
|
1,630
|
(2,017
|
)
|
(123.7
|
)
|
|||||||||
|
Total segment operating revenues
|
$
|
198,125
|
$
|
179,638
|
$
|
18,487
|
10.3
|
|||||||||
|
|
||||||||||||||||
|
Segment operating expenses
|
||||||||||||||||
|
Cost of goods and services, exclusive of depreciation and amortization shown separately below
|
72,995
|
63,906
|
9,089
|
14.2
|
||||||||||||
|
Selling, general and administrative, exclusive of depreciation and amortization shown separately below
|
36,828
|
30,716
|
6,112
|
19.9
|
||||||||||||
|
Depreciation and amortization
|
28,177
|
31,660
|
(3,483
|
)
|
(11.0
|
)
|
||||||||||
|
Total segment operating expenses
|
138,000
|
126,282
|
11,718
|
9.3
|
||||||||||||
|
Segment operating income
|
$
|
60,125
|
$
|
53,356
|
$
|
6,769
|
12.7
|
|||||||||
Operating revenues
Wireless service revenue increased $20.0 million, or 12.3%, for 2013 over 2012. Net postpaid service revenues increased $11.1 million, driven by a $7.3 million increase in data fees and a 4.1% increase in subscribers during 2013. As stated above, the net service fee increased from 12% of net billed revenues to 14% on August 1, 2013, reducing net postpaid service revenue by $1.2 million, or approximately $0.2 million per month. Net prepaid service revenues grew $8.9 million, or 28.3%, due to improved product mix and 12.9% growth in average prepaid subscribers during 2013.
The increase in tower lease revenue resulted primarily from rent increases related to tenants installing 4G equipment on our towers.
The decrease in net equipment revenue resulted primarily from higher promotional activity during the current year.
The decrease in other revenue primarily resulted from a $0.8 million adjustment to straight-line rent accruals related to termination of Sprint iDEN leases at a small number of sites and from a $0.5 million decline in federal Universal Service Fund (“USF”) revenue from Sprint.
Operating expenses
During the fourth quarter of 2012, the Company received $11.8 million from Sprint to correct errors in its cost allocations relating to our participation in Sprint’s prepaid program beginning in July 2010 and continuing through September 30, 2012. The expense reduction reflected the recalculation of certain expenses, including the cost of handsets, costs per gross addition and cash cost per user, associated with the program. The expense reductions for 2010 and 2011 lowered total operating expenses in 2012 by $6.1 million.
Cost of goods and services
Costs of goods and services increased $9.1 million, or 14.2%, in 2013 from 2012. After adjusting for the effect of the prepaid wireless expense reduction discussed above, cost of goods and services increased $4.8 million, or 7.1%, in 2013 from 2012. Costs of the expanded network coverage and roll-out of LTE coverage resulted in a $2.6 million increase in network costs, including a $3.2 million increase in rent expense, partially offset by lower backhaul expenses. Cost of goods and services related to prepaid customers increased $1.8 million, or 16.1%, in 2013 over 2012 primarily due to a 17.5% increase in the number of subsidized handsets sold. Maintenance expense increased $0.8 million due to increases in maintenance contracts that support the upgraded wireless network.
Selling, general and administrative
Selling, general and administrative costs increased $6.1 million, or 19.9%, in 2013 from 2012. After adjusting for the effect of the prepaid wireless expense reduction discussed above, selling, general and administrative expenses increased $4.2 million, or 13.0%, in 2013 from 2012. Costs associated with supporting the existing prepaid subscriber base increased $2.2 million due to a 12.9% increase in average prepaid subscribers and a 13.7% increase in average cost per subscriber. Costs to add new prepaid subscribers increased $1.2 million in 2013 due to a 17.5% increase in gross additions and upgrades over 2012. Commissions, advertising and professional services expenses associated with postpaid activities, increased $0.4 million in 2013 from 2012 levels.
Depreciation and amortization
Depreciation and amortization decreased $3.5 million in 2013 from 2012. Accelerated depreciation on assets to be replaced by Network Vision upgrades decreased from $8.4 million in the prior year to $3.4 million in 2013. The decrease in accelerated depreciation was partially offset by a 2012 favorable adjustment of $0.9 million related to asset retirement obligations associated with the upgrades.
Cable
The Cable segment provides analog, digital and high-definition television service under franchise agreements in Virginia, West Virginia and Maryland, as well as internet and voice services in these markets.
Over the last several years, the Company has been upgrading the Cable markets acquired in 2010. As of December 31, 2013, all significant upgrade activities have been completed. The Company has rolled out new or expanded video services, internet and voice services to each market as upgrades have been completed.
The following table shows selected operating statistics of the Cable segment as of the dates shown:
|
|
Dec. 31,
2013
|
Dec. 31,
2012
|
Dec. 31,
2011
|
|||||||||
|
|
|
|
|
|||||||||
|
Homes Passed (1)
|
186,565
|
184,533
|
182,156
|
|||||||||
|
Customer Relationships (2)
|
||||||||||||
|
Video customers
|
57,244
|
59,089
|
62,835
|
|||||||||
|
Non-video customers
|
18,341
|
15,709
|
12,513
|
|||||||||
|
Total customer relationships
|
75,585
|
74,798
|
75,348
|
|||||||||
|
Video
|
||||||||||||
|
Customers (3)
|
59,418
|
61,559
|
64,979
|
|||||||||
|
Penetration (4)
|
31.8
|
%
|
33.4
|
%
|
35.7
|
%
|
||||||
|
Digital video penetration (5)
|
49.2
|
%
|
39.5
|
%
|
39.0
|
%
|
||||||
|
High-speed Internet
|
||||||||||||
|
Available Homes (6)
|
168,255
|
163,273
|
156,119
|
|||||||||
|
Customers (3)
|
45,823
|
41,025
|
37,021
|
|||||||||
|
Penetration (4)
|
27.2
|
%
|
25.1
|
%
|
23.7
|
%
|
||||||
|
Voice
|
||||||||||||
|
Available Homes (6)
|
163,282
|
154,552
|
143,235
|
|||||||||
|
Customers (3)
|
15,034
|
12,307
|
9,881
|
|||||||||
|
Penetration (4)
|
9.2
|
%
|
8.0
|
%
|
6.9
|
%
|
||||||
|
Revenue Generating Units (7)
|
120,275
|
114,891
|
111,881
|
|||||||||
|
Fiber Route Miles
|
2,446
|
2,077
|
1,990
|
|||||||||
|
Total Fiber Miles (8)
|
69,715
|
39,418
|
34,772
|
|||||||||
| 1) | Homes and businesses are considered passed (“homes passed”) if we can connect them to our distribution system without further extending the transmission lines. Homes passed is an estimate based upon the best available information. |
| 2) | Customer relationships represent the number of customers who receive at least one of our services. |
| 3) | Generally, a dwelling or commercial unit with one or more television sets connected to our distribution system counts as one video customer. Where services are provided on a bulk basis, such as to hotels and some multi-dwelling units, the revenue charged to the customer is divided by the rate for comparable service in the local market to determine the number of customer equivalents included in the customer counts shown above. |
| 4) | Penetration is calculated by dividing the number of customers by the number of homes passed or available homes, as appropriate. |
| 5) | Digital video penetration is calculated by dividing the number of digital video customers by total video customers. Digital video customers are video customers who receive any level of video service via digital transmission. A dwelling with one or more digital set-top boxes or digital adapters counts as one digital video customer. |
| 6) | Homes and businesses are considered available (“available homes”) if we can connect them to our distribution system without further extending the transmission lines and if we offer the service in that area. Homes passed in Shenandoah County are excluded from available homes as we do not offer high-speed internet or voice services over our co-axial distribution network in this market. |
| 7) | Revenue generating units are the sum of video, voice and high-speed internet customers. |
| 8) | Fiber miles are measured by taking the number of fiber strands in a cable and multiplying that number by the route distance. For example, a 10 mile route with 144 fiber strands would equal 1,440 fiber miles. Fiber counts were recalculated after a fiber audit and deployment of enhanced mapping software in the fourth quarter of 2013. |
|
(in thousands)
|
Years Ended
December 31,
|
Change
|
||||||||||||||
|
|
2013
|
2012
|
$
|
%
|
||||||||||||
|
|
|
|
|
|||||||||||||
|
Segment operating revenues
|
|
|
|
|||||||||||||
|
Service revenue
|
$
|
70,529
|
$
|
66,010
|
$
|
4,519
|
6.8
|
|||||||||
|
Equipment and other revenue
|
10,894
|
10,313
|
581
|
5.6
|
||||||||||||
|
Total segment operating revenues
|
$
|
81,423
|
$
|
76,323
|
$
|
5,100
|
6.7
|
|||||||||
|
|
||||||||||||||||
|
Segment operating expenses
|
||||||||||||||||
|
Cost of goods and services, exclusive of depreciation and amortization shown separately below
|
50,151
|
48,978
|
1,173
|
2.4
|
||||||||||||
|
Goodwill impairment
|
-
|
10,952
|
(10,952
|
)
|
(100.0
|
)
|
||||||||||
|
Selling, general and administrative, exclusive of depreciation and amortization shown separately below
|
23,189
|
22,335
|
854
|
3.8
|
||||||||||||
|
Depreciation and amortization
|
22,663
|
23,519
|
(856
|
)
|
(3.6
|
)
|
||||||||||
|
Total segment operating expenses
|
96,003
|
105,784
|
(9,781
|
)
|
(9.2
|
)
|
||||||||||
|
Segment operating loss
|
$
|
(14,580
|
)
|
$
|
(29,461
|
)
|
$
|
14,881
|
50.5
|
|||||||
Operating revenues
The Cable segment service revenues increased $4.5 million in 2013 over 2012. High speed data access revenue increased $3.5 million due to an 11.7% increase in revenue generating units, while voice revenue increased $1.0 million due to a 22.2% increase in revenue generating units. Video revenue was flat, as revenue increases from video price increases and customers shifting to higher-priced digital TV packages were offset by a 3.5% decline in revenue generating units.
Equipment and other revenues increased $0.6 million, or 5.6%, due to $1.1 million of increases in revenue from sales of fiber optic services and in a variety of ancillary revenues such as installation fees, advertising revenues, and other fees billed to customers. The increases were partially offset by a $0.5 million decline in revenue from modems and converters.
Operating expenses
Cable segment cost of goods and services increased due to $0.8 million of additional network costs to support the expansion of network capacity. Cable content cost increased $0.6 million as the impact of rising rates per subscriber outpaced declining video subscriber counts. Network maintenance costs declined $0.1 million from a prior year that included $0.8 million of storm damage costs.
The Company recorded an $11.0 million impairment of goodwill in the fourth quarter of 2012.
Selling, general and administrative expenses increased principally due to costs for customer service and general administrative functions.
The decrease in depreciation and amortization expense consists of $2.0 million lower amortization on the customer base intangible asset recorded when the cable markets were acquired. The amortization of this asset declines on the anniversary of the acquisitions. The cost reduction was partially offset by higher depreciation expense on assets placed in service.
Wireline
The Wireline segment is composed of two subsidiaries providing telecommunications services. Through these subsidiaries, this segment provides regulated and unregulated voice services, dial-up and DSL internet access, and long distance access services throughout Shenandoah County and portions of Rockingham, Frederick, Warren and Augusta counties in Virginia, and leases fiber optic facilities throughout its network.
|
|
Dec. 31,
|
Dec. 31,
|
Dec. 31,
|
|||||||||
|
|
2013
|
2012
|
2011
|
|||||||||
|
Telephone Access Lines
|
22,060
|
22,297
|
23,083
|
|||||||||
|
Long Distance Subscribers
|
9,851
|
10,157
|
10,483
|
|||||||||
|
DSL Subscribers
|
12,585
|
12,567
|
12,351
|
|||||||||
|
Fiber Route Miles
|
1,452
|
1,420
|
1,349
|
|||||||||
|
Total Fiber Miles (1)
|
85,135
|
84,107
|
78,523
|
|||||||||
| 1) | Fiber miles are measured by taking the number of fiber strands in a cable and multiplying that number by the route distance. For example, a 10 mile route with 144 fiber strands would equal 1,440 fiber miles. |
|
(in thousands)
|
Years Ended
December 31,
|
Change
|
||||||||||||||
|
|
2013
|
2012
|
$
|
%
|
||||||||||||
|
|
|
|
|
|||||||||||||
|
Segment operating revenues
|
|
|
|
|||||||||||||
|
Service revenue
|
$
|
17,268
|
$
|
16,444
|
$
|
824
|
5.0
|
|||||||||
|
Access revenue
|
11,721
|
12,604
|
(883
|
)
|
(7.0
|
)
|
||||||||||
|
Facilities lease revenue
|
21,836
|
21,153
|
683
|
3.2
|
||||||||||||
|
Equipment revenue
|
32
|
36
|
(4
|
)
|
(11.1
|
)
|
||||||||||
|
Other revenue
|
3,062
|
4,421
|
(1,359
|
)
|
(30.7
|
)
|
||||||||||
|
Total segment operating revenues
|
$
|
53,919
|
$
|
54,658
|
$
|
(739
|
)
|
(1.4
|
)
|
|||||||
|
Segment operating expenses
|
||||||||||||||||
|
Cost of goods and services, exclusive of depreciation and amortization shown separately below
|
24,219
|
24,785
|
(566
|
)
|
(2.3
|
)
|
||||||||||
|
Selling, general and administrative, exclusive of depreciation and amortization shown separately below
|
6,950
|
6,859
|
91
|
1.3
|
||||||||||||
|
Depreciation and amortization
|
9,848
|
9,171
|
677
|
7.4
|
||||||||||||
|
Total segment operating expenses
|
41,017
|
40,815
|
202
|
0.5
|
||||||||||||
|
Segment operating income
|
$
|
12,902
|
$
|
13,843
|
$
|
(941
|
)
|
(6.8
|
)
|
|||||||
Operating revenues
Operating revenues decreased $0.7 million, or 1.4%, in 2013 from 2012. The increase in service revenue resulted primarily from contracts to provide internet access to third parties. The decrease in access revenues resulted from a $0.5 million reversal of previously recorded revenues as a result of settling a billing dispute, along with changes to certain intrastate access charges. Facility lease revenue increased due to the addition of affiliate and non-affiliated leased circuits for fiber to the tower, to support voice services in the acquired cable markets, as well as service contracts to other customers. Other revenue decreased due to the conclusion of billings for transition services to buyers of Converged Services’ properties (coupled with a corresponding decrease in costs of goods and services mentioned below).
Operating expenses
Operating expenses overall increased $0.2 million, or 0.5%, in 2013, compared to 2012. The decrease in cost of goods and services resulted from the conclusion of costs to provide service to the new owners of transitioning Converged Services properties. Partially offsetting the decrease were the costs to provide services to PCS, Shenandoah Cable and other customers, related to the increases in revenue shown above.
The increase in depreciation resulted from additions to switch and circuit equipment in support of fiber and other service contract revenue increases as discussed above. The increase in selling, general and administrative expenses resulted from increased bad debt charges and operating taxes, partially offset by lower customer service costs, each of which was less than $0.2 million.
2012 Compared to 2011
Consolidated Results
The Company’s consolidated results from continuing operations for the years ended December 31, 2012 and 2011 are summarized as follows:
|
(in thousands)
|
Years Ended
December 31,
|
Change
|
||||||||||||||
|
2012
|
2011
|
$
|
%
|
|||||||||||||
|
Operating revenues
|
$
|
288,075
|
$
|
251,145
|
36,930
|
14.7
|
||||||||||
|
Operating expenses
|
253,417
|
218,855
|
34,562
|
15.8
|
||||||||||||
|
Operating income
|
34,658
|
32,290
|
2,368
|
7.3
|
||||||||||||
|
Other income (expense)
|
(6,047
|
)
|
(8,085
|
)
|
2,038
|
(25.2
|
)
|
|||||||||
|
Income tax expense
|
12,008
|
10,667
|
1,341
|
12.6
|
||||||||||||
|
Net income from continuing operations
|
$
|
16,603
|
$
|
13,538
|
3,065
|
22.6
|
||||||||||
Operating revenues
Operating revenues increased $36.9 million, or 14.7%, in 2012 over 2011, primarily due to an increase of $26.2 million in the Wireless segment and $8.3 million in the Cable segment. The increase in the Wireless segment resulted from an increase in postpaid service revenues of $16.4 million and $9.4 million in prepaid service revenues. The postpaid revenues grew as a result of a 5.8% increase in subscribers during the year, and incremental data fees charged to customers with smartphones. The prepaid service revenues grew as a result of a 20% increase in prepaid customers during 2012. The Cable segment revenues grew primarily due to a 4.6% increase in average revenue generating units, customers shifting to higher-priced digital TV packages and higher speed data access packages, and video
price increases.
Operating expenses
During the fourth quarter of 2012, the Company received $11.8 million from Sprint to reduce cost allocations relating to our participation in Sprint’s prepaid program beginning in July 2010 and continuing through September 30, 2012. The expense reduction reduced costs of goods and services sold by $8.4 million and selling, general and administrative expenses by $3.4 million, and reflected the recalculation of certain expenses, costs per gross addition (including the cost of handsets) and cash cost per user, associated with the program. Had Sprint calculated these costs consistently in previous years, prepaid expenses in 2010 and 2011 would have been reduced by $1.2 million and $4.9 million, respectively.
Adjusting for the effect of the prepaid wireless expense reduction discussed above, operating expenses increased $45.6 million compared to the 2011 period. The adjusted Wireless segment operations accounted for $27.2 million of the year over year increase, principally due to incremental handset subsidies of $9.4 million and a $9.1 million increase in depreciation expense due to accelerated depreciation on base station and other assets being replaced earlier than originally expected. The remaining increase in Wireless segment operating expenses was largely a result of costs to expand and upgrade the wireless network, along with higher selling and marketing expenses associated with prepaid wireless plans. Cable segment operating expenses increased $16.3 million, due to an $11.0 million write-off of goodwill, along with growth in customer service support costs, programming costs, network costs and maintenance expenses.
Other income (expense)
The change in other income (expense) resulted primarily from improvement in investment results in 2012 over 2011. The decrease in interest expense that resulted from declining rates and lower outstanding balances (prior to the refinancing in September 2012) was largely offset by the write-off of $0.8 million of unamortized loan costs remaining from the 2010 loan as a result of replacing certain lenders from the original credit agreement. Changes in the fair value of the swap agreement entered into in 2010 added $0.4 million to interest expense during 2011, while reducing interest expense $0.2 million during 2012.
Income tax expense
The Company’s effective tax rate on income from continuing operations decreased from 44.1% in 2011 to 42.0% in 2012 principally due to changes undertaken to simplify the Company’s corporate structure that reduced the impact of state taxes on the Company’s overall effective tax rate.
Net income from continuing operations
Net income from continuing operations increased $3.1 million in 2012 from 2011, primarily as a result of the prepaid adjustment offset by the goodwill impairment, improved investment results, lower interest expense, and the decrease in the effective tax rate.
Wireless
|
(in thousands)
|
Years Ended
December 31,
|
Change
|
||||||||||||||
|
|
2012
|
2011
|
$
|
%
|
||||||||||||
|
|
|
|
|
|||||||||||||
|
Segment operating revenues
|
|
|
|
|||||||||||||
|
Wireless service revenue
|
$
|
162,912
|
$
|
137,118
|
$
|
25,794
|
18.8
|
|||||||||
|
Tower lease revenue
|
9,114
|
8,901
|
213
|
2.4
|
||||||||||||
|
Equipment revenue
|
5,982
|
5,053
|
929
|
18.4
|
||||||||||||
|
Other revenue
|
1,630
|
2,366
|
(736
|
)
|
(31.1
|
)
|
||||||||||
|
Total segment operating revenues
|
$
|
179,638
|
$
|
153,438
|
$
|
26,200
|
17.1
|
|||||||||
|
|
||||||||||||||||
|
Segment operating expenses
|
||||||||||||||||
|
Cost of goods and services, exclusive of depreciation and amortization shown separately below
|
63,906
|
56,705
|
7,201
|
12.7
|
||||||||||||
|
Selling, general and administrative, exclusive of depreciation and amortization shown separately below
|
30,716
|
29,455
|
1,261
|
4.3
|
||||||||||||
|
Depreciation and amortization
|
31,660
|
23,906
|
7,754
|
32.4
|
||||||||||||
|
Total segment operating expenses
|
126,282
|
110,066
|
16,216
|
14.7
|
||||||||||||
|
Segment operating income
|
$
|
53,356
|
$
|
43,372
|
$
|
9,984
|
23.0
|
|||||||||
Operating revenues
Wireless service revenue increased $25.8 million, or 18.8%, for 2012 over 2011. Postpaid wireless service revenue, net of fees and adjustments, generated $16.4 million of the year over year increase. The $10 monthly fee for smartphone data usage contributed $15.1 million to postpaid service revenues during 2012, an increase of $8.4 million over 2011. In addition, average postpaid subscribers for 2012 increased 5.8% compared to 2011. Prepaid wireless service revenue increased $9.4 million, net of service fees. Prepaid customers increased 19.7% to more than 128 thousand at December 31, 2012, from 107 thousand customers at December 31, 2011.
The increase in tower lease revenue resulted primarily from scheduled escalations in revenue streams.
The increase in equipment revenue resulted primarily from the incremental revenue from iPhones sold, partially offset by fewer sales of other lower priced devices.
The decrease in other revenue primarily resulted from a $500 thousand reclassification of activation revenues from other revenue to Wireless service revenue. The remaining decrease was driven by lower revenues received from the Federal Universal Service Fund through Sprint.
Operating Expenses
During the fourth quarter of 2012, the Company received $11.8 million from Sprint to correct errors in its cost allocations relating to our participation in Sprint’s prepaid program beginning in July 2010 and continuing through September 30, 2012. The expense reduction reflected the recalculation of certain expenses, including the cost of handsets, costs per gross addition and cash cost per user, associated with the program. Had Sprint correctly calculated these costs, prepaid expenses in 2010 and 2011 would have been reduced by $1.2 million and $4.9 million, respectively.
Cost of goods and services
Costs of goods and services increased $7.2 million, or 12.7%, in 2012 from 2011. After adjusting for the effect of the prepaid wireless expense reduction discussed above, cost of goods and services increased $14.8 million, or 27.8%, in 2012 from 2011. Costs of handsets for postpaid phones increased $5.9 million due to higher cost iPhones and 4G smartphones. Similarly, handset subsidies associated with prepaid wireless plans increased $3.8 million, or 54%, in 2012 over 2011 due to a greater offering of higher cost smartphones. Costs of the expanded network coverage and roll-out of LTE coverage resulted in a $3.3 million increase in network costs, including $2.4 million in additional backhaul line costs and increased rent expense of $1.1 million at LTE cell sites. The Company recognized minimal gains on equipment traded-in during 2012 compared to $1.9 million of gains on equipment traded-in during 2011.
Selling, general and administrative
Selling, general and administrative expenses increased $1.3 million, or 4.3%, in 2012 from 2011. After adjusting for the effect of the prepaid wireless expense reduction discussed above, selling, general and administrative expenses increased $4.8 million, or 17.4%, in 2012 from 2011, principally due to $3.3 million of incremental selling and marketing expenses associated with the prepaid wireless plans. Commission and advertising expenses increased $0.8 million and $0.4 million, respectively, in 2012 from 2011 levels.
Depreciation and amortization
Depreciation and amortization increased $7.8 million in 2012 over 2011. Depreciation increased $9.1 million in 2012, as work began to build a 4G LTE network in the Company’s service area, resulting in accelerated depreciation of $8.4 million on existing assets as the Company replaces its existing wireless network. The increase in depreciation was partially offset by a decrease of $1.3 million in the amortization expense of the acquired prepaid subscriber base.
Cable
|
(in thousands)
|
Years Ended
December 31,
|
Change
|
||||||||||||||
|
|
2012
|
2011
|
$
|
%
|
||||||||||||
|
|
|
|
|
|||||||||||||
|
Segment operating revenues
|
|
|
|
|||||||||||||
|
Service revenue
|
$
|
66,010
|
$
|
59,051
|
$
|
6,959
|
11.8
|
|||||||||
|
Equipment and other revenue
|
10,313
|
9,009
|
1,304
|
14.5
|
||||||||||||
|
Total segment operating revenues
|
$
|
76,323
|
$
|
68,060
|
$
|
8,263
|
12.1
|
|||||||||
|
|
||||||||||||||||
|
Segment operating expenses
|
||||||||||||||||
|
Cost of goods and services, exclusive of depreciation and amortization shown separately below
|
48,978
|
47,417
|
1,561
|
3.3
|
||||||||||||
|
Goodwill impairment
|
10,952
|
-
|
10,952
|
N/A
|
|
|||||||||||
|
Selling, general and administrative, exclusive of depreciation and amortization shown separately below
|
22,335
|
18,827
|
3,508
|
18.6
|
||||||||||||
|
Depreciation and amortization
|
23,519
|
23,198
|
321
|
1.4
|
||||||||||||
|
Total segment operating expenses
|
105,784
|
89,442
|
16,342
|
18.3
|
||||||||||||
|
Segment operating loss
|
$
|
(29,461
|
)
|
$
|
(21,382
|
)
|
$
|
(8,079
|
)
|
37.8
|
||||||
Operating revenues and expenses
The Cable segment total operating revenues increased $7.0 million in 2012 over 2011, due to a 4.6% increase in average revenue generating units, customers shifting to higher-priced digital TV packages and higher speed data access packages, and video price increases.
Equipment and other revenues increased $1.3 million, or 14.5%, due to increases in revenue from sales of fiber optic services and in a variety of ancillary revenues such as set-top box rental fees, advertising revenues, and other fees billed to customers, each of which generated approximately $0.3 million in incremental revenues.
Cable segment cost of goods and services increased due to a $1.2 million increase in Cable content cost. In addition, costs to support the expansion of voice services, along with costs for third party installation and maintenance, contributed an additional $1.6 million of the increase. Network maintenance costs also grew $0.7 million, primarily due to repairs that were required after strong storms damaged portions of the network. Partially offsetting the increases in cost of goods and services were $1.9 million of savings in backhaul and power costs as a result of the network re-build efforts over the last two years.
The Company recorded an $11.0 million impairment of goodwill in the fourth quarter of 2012.
Selling, general and administrative expenses have increased principally due to costs for customer service and general administrative functions.
Wireline
|
(in thousands)
|
Years Ended
December 31,
|
Change
|
||||||||||||||
|
|
2012
|
2011
|
$
|
%
|
||||||||||||
|
|
|
|
|
|||||||||||||
|
Segment operating revenues
|
|
|
|
|||||||||||||
|
Service revenue
|
$
|
16,444
|
$
|
16,028
|
$
|
416
|
2.6
|
|||||||||
|
Access revenue
|
12,604
|
13,405
|
(801
|
)
|
(6.0
|
)
|
||||||||||
|
Facilities lease revenue
|
21,153
|
16,856
|
4,297
|
25.5
|
||||||||||||
|
Equipment revenue
|
36
|
39
|
(3
|
)
|
(7.7
|
)
|
||||||||||
|
Other revenue
|
4,421
|
3,200
|
1,221
|
38.2
|
||||||||||||
|
Total segment operating revenues
|
$
|
54,658
|
$
|
49,528
|
$
|
5,130
|
10.4
|
|||||||||
|
Segment operating expenses
|
||||||||||||||||
|
Cost of goods and services, exclusive of depreciation and amortization shown separately below
|
24,785
|
19,702
|
5,083
|
25.8
|
||||||||||||
|
Selling, general and administrative, exclusive of depreciation and amortization shown separately below
|
6,859
|
7,528
|
(669
|
)
|
(8.9
|
)
|
||||||||||
|
Depreciation and amortization
|
9,171
|
8,453
|
718
|
8.5
|
||||||||||||
|
Total segment operating expenses
|
40,815
|
35,683
|
5,132
|
14.4
|
||||||||||||
|
Segment operating income
|
$
|
13,843
|
$
|
13,845
|
$
|
(2
|
)
|
(0.0
|
)
|
|||||||
Operating revenues
Operating revenues increased $5.1 million, or 10.4%, in 2012 from 2011. The increase in service revenue resulted primarily from contracts to provide internet access to third parties. Access revenue decreased due to changes in affiliate billings in the third quarter of 2011. Facility lease revenue increased due to charges for additional circuits to our Wireless affiliate and third parties for fiber to the tower and similar projects, to support voice services in the acquired cable markets, as well as service contracts to other customers. Other revenue increased as the Company provided services at cost to the new owners of Converged Services properties during transition of the properties. This increase is offset by an increase in cost of goods and services.
Operating expenses
Operating expenses overall increased $5.1 million, or 14.4%, in 2012, compared 2011. The increase in cost of goods and services resulted from the costs of providing service to the new owners of transitioning Converged Services properties. Also driving the increase were the costs of obtaining service from third parties to provide voice services to Shentel Cable and other customers, related to the increases in service revenue and facilities lease revenue shown above, as well as approximately $0.3 million in costs to repair facilities following a major summer storm at the end of June 2012.
The increase in depreciation resulted from additions to switch and circuit equipment in support of fiber and other service contract revenue increases as shown above. The decrease in selling, general and administrative expenses resulted from lower commissions, customer service and bad debt charges, each of which was less than $0.2 million.
Non-GAAP Financial Measure
In managing our business and assessing our financial performance, management supplements the information provided by financial statement measures prepared in accordance with GAAP with adjusted OIBDA, which is considered a “non-GAAP financial measure” under SEC rules.
Adjusted OIBDA is defined by us as operating income (loss) before depreciation and amortization, adjusted to exclude the effects of: certain non-recurring transactions; impairment of assets; gains and losses on asset sales; and share based compensation expense. Adjusted OIBDA should not be construed as an alternative to operating income as determined in accordance with GAAP as a measure of operating performance.
In a capital-intensive industry such as telecommunications, management believes that adjusted OIBDA and the associated percentage margin calculations are meaningful measures of our operating performance. We use adjusted OIBDA as a supplemental performance measure because management believes it facilitates comparisons of our operating performance from period to period and comparisons of our operating performance to that of other companies by excluding potential differences caused by the age and book depreciation of fixed assets (affecting relative depreciation expenses) as well as the other items described above for which additional adjustments were made. In the future, management expects that the Company may again report adjusted OIBDA excluding these items and may incur expenses similar to these excluded items. Accordingly, the exclusion of these and other similar items from our non-GAAP presentation should not be interpreted as implying these items are non-recurring, infrequent or unusual.
While depreciation and amortization are considered operating costs under generally accepted accounting principles, these expenses primarily represent the current period allocation of costs associated with long-lived assets acquired or constructed in prior periods, and accordingly may obscure underlying operating trends for some purposes. By isolating the effects of these expenses and other items that vary from period to period without any correlation to our underlying performance, or that vary widely among similar companies, management believes adjusted OIBDA facilitates internal comparisons of our historical operating performance, which are used by management for business planning purposes, and also facilitates comparisons of our performance relative to that of our competitors. In addition, we believe that adjusted OIBDA and similar measures are widely used by investors and financial analysts as measures of our financial performance over time, and to compare our financial performance with that of other companies in our industry.
Adjusted OIBDA has limitations as an analytical tool, and should not be considered in isolation or as a substitute for analysis of our results as reported under GAAP. These limitations include the following:
| · | it does not reflect capital expenditures; |
| · | many of the assets being depreciated and amortized will have to be replaced in the future and adjusted OIBDA does not reflect cash requirements for such replacements; |
| · | it does not reflect costs associated with share-based awards exchanged for employee services; |
| · | it does not reflect interest expense necessary to service interest or principal payments on indebtedness; |
| · | it does not reflect gains, losses or dividends on investments |
| · | it does not reflect expenses incurred for the payment of income taxes; and |
| · | other companies, including companies in our industry, may calculate adjusted OIBDA differently than we do, limiting its usefulness as a comparative measure. |
In light of these limitations, management considers adjusted OIBDA as a financial performance measure that supplements but does not replace the information reflected in our GAAP results.
The following table shows adjusted OIBDA for the years ended December 31, 2013, 2012 and 2011:
|
(in thousands)
|
Years Ended
December 31,
|
|||||||||||
|
|
2013
|
2012
|
2011
|
|||||||||
|
|
|
|
|
|||||||||
|
Adjusted OIBDA
|
$
|
118,596
|
$
|
106,765
|
$
|
93,148
|
||||||
The following table reconciles adjusted OIBDA to operating income, which we consider to be the most directly comparable GAAP financial measure, for the years ended December 31, 2013, 2012 and 2011:
|
(in thousands)
|
Years Ended
December 31,
|
|||||||||||
|
|
2013
|
2012
|
2011
|
|||||||||
|
|
|
|
|
|||||||||
|
Operating income
|
$
|
55,407
|
$
|
34,658
|
$
|
32,290
|
||||||
|
Plus depreciation and amortization
|
60,722
|
64,412
|
55,770
|
|||||||||
|
Adjusted prepaid wireless results
|
-
|
(6,137
|
)
|
4,890
|
||||||||
|
Less (gain) loss on asset sales
|
784
|
441
|
(1,309
|
)
|
||||||||
|
Plus non-cash goodwill impairment charge
|
-
|
10,952
|
-
|
|||||||||
|
Plus storm damage costs
|
-
|
813
|
-
|
|||||||||
|
Plus share based compensation expense
|
1,683
|
1,626
|
1,507
|
|||||||||
|
Adjusted OIBDA
|
$
|
118,596
|
$
|
106,765
|
$
|
93,148
|
||||||
The following tables reconcile adjusted OIBDA to operating income by major segment for the years ended December 31, 2013, 2012 and 2011:
|
Wireless Segment:
(in thousands)
|
Years Ended
December 31,
|
|||||||||||
|
|
2013
|
2012
|
2011
|
|||||||||
|
|
|
|
|
|||||||||
|
Operating income
|
$
|
60,125
|
$
|
53,356
|
$
|
43,372
|
||||||
|
Plus depreciation and amortization
|
28,177
|
31,660
|
23,906
|
|||||||||
|
Adjusted prepaid results
|
-
|
(6,137
|
)
|
4,890
|
||||||||
|
Less (gain) loss on asset sales
|
647
|
(9
|
)
|
(1,699
|
)
|
|||||||
|
Plus share based compensation expense
|
481
|
468
|
444
|
|||||||||
|
Adjusted OIBDA
|
$
|
89,430
|
$
|
79,338
|
$
|
70,913
|
||||||
|
Cable Segment:
(in thousands)
|
Years Ended
December 31,
|
|||||||||||
|
|
2013
|
2012
|
2011
|
|||||||||
|
|
|
|
|
|||||||||
|
Operating income (loss)
|
$
|
(14,580
|
)
|
$
|
(29,461
|
)
|
$
|
(21,382
|
)
|
|||
|
Plus depreciation and amortization
|
22,663
|
23,519
|
23,198
|
|||||||||
|
Less (gain) loss on asset sales
|
(59
|
)
|
126
|
176
|
||||||||
|
Plus non-cash goodwill impairment charge
|
-
|
10,952
|
-
|
|||||||||
|
Plus storm damage costs
|
-
|
813
|
-
|
|||||||||
|
Plus share based compensation expense
|
735
|
692
|
594
|
|||||||||
|
Adjusted OIBDA
|
$
|
8,759
|
$
|
6,641
|
$
|
2,586
|
||||||
|
Wireline Segment:
(in thousands)
|
Years Ended
December 31,
|
|||||||||||
|
|
2013
|
2012
|
2011
|
|||||||||
|
|
|
|
|
|||||||||
|
Operating income
|
$
|
12,902
|
$
|
13,843
|
$
|
13,845
|
||||||
|
Plus depreciation and amortization
|
9,848
|
9,171
|
8,453
|
|||||||||
|
Less (gain) loss on asset sales
|
195
|
305
|
214
|
|||||||||
|
Plus share based compensation expense
|
356
|
372
|
357
|
|||||||||
|
Adjusted OIBDA
|
$
|
23,301
|
$
|
23,691
|
$
|
22,869
|
||||||
Financial Condition, Liquidity and Capital Resources
The Company has four principal sources of funds available to meet the financing needs of its operations, capital projects, debt service, investments and potential dividends. These sources include cash flows from operations, existing balances of cash and cash equivalents, the liquidation of investments and borrowings. Management routinely considers the alternatives available to determine what mix of sources are best suited for the long-term benefit of the Company.
Sources and Uses of Cash
. The Company generated $94.3 million of net cash from operations in 2013, a $2.7 million decrease from $97.0 million in 2012, which was a $16.0 million increase over 2011. The decrease in 2013 from 2012 was primarily due to the increase in income taxes paid, partially offset by the changes in net income and the non-cash components of expenses, principally goodwill impairment and deferred income taxes. The increase in 2012 over 2011, was driven by higher net income in 2012 and increases in the non-cash components of expenses, principally goodwill impairment and depreciation charges, combined with increases in payables for income taxes.
During 2013, the Company utilized $116.6 million in net investing activities, including $117.0 million invested in capital expenditures, offset by proceeds from sales of assets. During 2012, the Company utilized $83.9 million in investing activities. Plant and equipment purchases totaled $89.1 million in 2012, up $14.4 million from $74.7 million in 2011. Capital expenditures in 2013 and 2012 primarily supported the upgrade of PCS base stations in conjunction with the Network Vision project, as well as expansion of capacity on other PCS base stations and other related spending. Cable system upgrades to acquired systems were completed in 2013. Capital expenditures in 2011 were made primarily to support upgrades of cable markets acquired in 2010 and to keep pace with capacity demands in our Wireless segment. The Company received $3.8 million and $3.0 million in cash proceeds from sales of service contracts and assets in our discontinued Converged Services unit during 2012 and 2011, respectively.
Financing activities utilized $10.5 million in 2013, as the Company paid dividends totaling $8.2 million and made $2.0 million of principal payments on long-term debt. The increase in dividends paid in the current year over 2012 was due to an increase in the per share dividend rate from $0.33 to $0.36. Financing activities provided $42.2 million in 2012, as the Company refinanced its credit agreement and expanded the term loan to support the expected spending associated with the Network Vision project. Dividends paid totaled $7.4 million in 2012. Financing activities in 2011 utilized $21.9 million, principally due to $14.5 million in repayments of principal under our loan agreements and $7.3 million in dividends paid to shareholders.
Indebtedness.
As of December 31, 2013, the Company’s indebtedness totaled $230.0 million, with an annualized effective interest rate of approximately 3.40% after considering the impact of the interest rate swap contract. The balance consists of the Term Loan A Facility at a variable rate (of 2.67% as of December 31, 2013) that resets monthly based on one month LIBOR plus a base rate of 2.50% currently. The Term Loan A Facility requires quarterly principal repayments of $5.75 million beginning on December 31, 2014 and continuing thereafter until the remaining expected balance of approximately $120.75 million is due at maturity on September 30, 2019.
The Company’s credit agreement includes a Revolver Facility that provides for $50 million in availability for future capital expenditures and general corporate needs. In addition, the credit agreement permits the Company to enter into one or more Incremental Term Loan Facilities in the aggregate principal amount not to exceed $100 million subject to compliance with certain covenants. At December 31, 2013, no draw had been made under the Revolver Facility and the Company had not entered into any Incremental Term Loan Facility. When and if a draw is made, the maturity date and interest rate options would be substantially identical to the Term Loan A Facility, though the margin on principal drawn on the revolver is 0.25% less than the corresponding margin on term loans. If the interest rate on an Incremental Term Loan Facility is more than 0.25% greater than the rate on the existing outstanding balances, the interest rate on the existing debt would reset at the same rate as the Incremental Term Loan Facility. Repayment provisions would be agreed to at the time of each draw under the Incremental Term Loan Facility.
The Company is subject to certain financial covenants measured on a trailing twelve month basis each calendar quarter unless otherwise specified. These covenants include:
| · | a limitation on the Company’s total leverage ratio, defined as indebtedness divided by earnings before interest, taxes, depreciation and amortization, or EBITDA, of less than or equal to 3.00 to 1.00 from the closing date through March 31, 2014, then 2.50 to 1.00 from April 1, 2014 through March 31, 2015, and 2.00 to 1.00 thereafter; |
| · | a minimum debt service coverage ratio, defined as EBITDA divided by the sum of all scheduled principal payments on the Term Loans and regularly scheduled principal payments on other indebtedness plus cash interest expense, greater than 2.50 to 1.00 at all times; |
| · | a minimum equity to assets ratio, defined as consolidated total assets minus consolidated total liabilities, divided by consolidated total assets, of at least 0.30 to 1.00 from the amendment date through December 31, 2013; then at least 0.325 to 1.00 through December 31, 2014, and at least 0.35 to 1.00 thereafter, measured at each fiscal quarter end. |
As of December 31, 2013, the Company was in compliance with the financial covenants in its credit agreements,
and ratios at December 31, 2013 were as follows:
|
|
Actual
|
|
Covenant Requirement
|
|
Total Leverage Ratio
|
1.91
|
|
3.00 or Lower
|
|
Debt Service Coverage Ratio
|
9.86
|
|
2.50 or Higher
|
|
Equity to Assets Ratio
|
39.2%
|
|
30.0% or Higher
|
Contractual Commitments.
The Company is obligated to make future payments under various contracts it has entered into, primarily amounts pursuant to its long-term debt facility, and non-cancelable operating lease agreements for retail space, tower space and cell sites. Expected future minimum contractual cash obligations for the next five years and in the aggregate at December 31, 2013, are as follows:
Payments due by periods
|
(in thousands)
|
Total
|
Less than 1
year
|
1-3 years
|
4-5 years
|
After 5 years
|
|||||||||||||||
|
|
|
|
|
|
|
|||||||||||||||
|
Long-term debt principal (1)
|
$
|
230,000
|
$
|
5,750
|
$
|
46,000
|
$
|
46,000
|
$
|
132,250
|
||||||||||
|
Interest on long–term debt (1)
|
28,775
|
6,139
|
10,896
|
8,441
|
3,299
|
|||||||||||||||
|
“Pay fixed” obligations (2)
|
9,250
|
1,973
|
3,503
|
2,713
|
1,061
|
|||||||||||||||
|
Operating leases (3)
|
140,819
|
13,114
|
26,168
|
26,059
|
75,478
|
|||||||||||||||
|
Purchase obligations (4)
|
14,905
|
8,968
|
3,855
|
2,082
|
-
|
|||||||||||||||
|
Total obligations
|
$
|
423,749
|
$
|
35,944
|
$
|
90,422
|
$
|
85,295
|
$
|
212,088
|
||||||||||
| 1) | Includes principal payments and estimated interest payments on the Term Loan A Facility based upon outstanding balances and rates in effect at December 31, 2013. |
| 2) | Represents the maximum interest payments we are obligated to make under our derivative agreement. Assumes no receipts from the counterparty to our derivative agreement. |
| 3) | Amounts include payments over reasonably assured renewals. See Note 13 to the consolidated financial statements appearing elsewhere in this report for additional information. |
| 4) | Represents open purchase orders at December 31, 2013. Multi-year maintenance commitments for our wireless network represent approximately $7.6 million of this amount, including the amounts shown above in years 1-3 and 4-5. |
The Company has no other off-balance sheet arrangements and has not entered into any transactions involving unconsolidated, limited purpose entities or commodity contracts.
Capital Commitments.
The Company spent $117.0 million on capital projects in 2013, up from $89.1 million spent in 2012 and $74.7 million spent in 2011. The Company incurred significant capital spending in 2013 and 2012 to upgrade its PCS network as part of Sprint’s Network Vision upgrade project, and in 2011 to keep pace with rising demand for data in our Wireless network. Wireless network related spending will continue in 2014, but at lower levels than 2013. Spending on upgrades to the acquired cable systems occurred in all three years, and is expected to decline in 2014. The Company also continued capital spending to expand and upgrade its fiber network and other on-going projects.
Capital expenditures budgeted for 2014 total $74.0 million. The 2014 budget includes $25.1 million on the wireless segment to add capacity and new retail stores, $22.5 million on the wireline segment budget for on-going spending to expand and upgrade our fiber networks and $18.9 million for cable segment extension and upgrade of outside plant and investment in customer premise equipment.
The Company believes that cash on hand and cash flow from operations (and if necessary, borrowings available under the Company’s existing credit facilities) will provide sufficient cash to enable the Company to fund its planned capital expenditures, make scheduled principal and interest payments, meet its other cash requirements and maintain compliance with the terms of its financing agreements for at least the next 12 months. Thereafter, capital expenditures will likely continue to be required to provide increased capacity to meet the Company’s expected growth in demand for its products and services. The actual amount and timing of the Company’s future capital requirements may differ materially from the Company’s estimate depending on the demand for its products, new market developments and opportunities and general economic opportunities.
The Company’s cash flows from operations could be adversely affected by events outside the Company’s control, including, without limitation, changes in overall economic conditions, regulatory requirements, changes in technologies, availability of labor resources and capital, changes in the Company’s relationship with Sprint, and other conditions.
The Wireless segment's operations are dependent upon Sprint’s ability to execute certain functions such as billing, customer care, and collections; the subsidiary’s ability to develop and implement successful marketing programs, and the subsidiary’s ability to effectively and economically manage other operating activities under the Company's agreements with Sprint. The Company's ability to continue to attract and maintain a sufficient customer base, particularly in the cable markets, is also critical to the Company’s ability to maintain a positive cash flow from operations.
The foregoing events individually or collectively could affect the Company’s results.
Recently Issued Accounting Standards
As of December 31, 2013, there were no recently issued but not yet effective accounting pronouncements that would have a significant impact on the Company’s financial statements.
The Company’s market risks relate primarily to changes in interest rates on instruments held for other than trading purposes. The Company’s interest rate risk generally involves three components. The first component is outstanding debt with variable rates. As of December 31, 2013, the Company had $230.0 million of variable rate debt outstanding, bearing interest at a rate of 2.67% as determined on a monthly basis. An increase in market interest rates of 1.00% would add approximately $2.3 million to annual interest expense, excluding the effect of the interest rate swap. In 2012, the Company entered into a swap agreement that covers notional principal equal to approximately 76% of the outstanding variable rate debt through maturity in 2019, requiring the Company to pay a fixed rate of 1.13% and receive a variable rate based on one month LIBOR, to manage a portion of its interest rate risk. Changes in the net interest paid or received under the 2012 swap would offset approximately 76% of the change in interest expense on the variable rate debt outstanding. The 2012 swap currently adds approximately $1.6 million to annual interest expense, based on the spread between the fixed rate and the variable rate currently in effect on our debt.
The second component of interest rate risk consists of temporary excess cash, which can be invested in various short-term investment vehicles such as overnight repurchase agreements and Treasury bills with a maturity of less than 90 days. As of December 31, 2013, the cash is invested in a combination of a commercial checking account that has limited interest rate risk, and three money market mutual funds that contain a total investment of $20 million. Management continually evaluates the most beneficial use of these funds.
The third component of interest rate risk is marked increases in interest rates that may adversely affect the rate at which the Company may borrow funds for growth in the future. If the Company should borrow additional funds under any Incremental Term Loan Facility to fund its capital investment needs, repayment provisions would be agreed to at the time of each draw under the Incremental Term Loan Facility. If the interest rate margin on any draw exceeds by more than 0.25% the applicable interest rate margin on the Term Loan A Facility, the applicable interest rate margin on the Term Loan A Facility shall be increased to equal the interest rate margin on the Incremental Term Loan Facility. If interest rates increase generally, or if the rate applied under the Company’s Incremental Term Loan Facility causes the Company’s outstanding debt to be repriced, the Company’s future interest costs could increase.
Management views market risk as having a potentially significant impact on the Company's results of operations, as future results could be adversely affected if interest rates were to increase significantly for an extended period, or if the Company’s need for additional external financing resulted in increases to the interest rates applied to all of its new and existing debt. As of December 31, 2013 the Company has $55.4 million of variable rate debt with no interest rate protection. The Company’s investments in publicly traded stock and bond mutual funds under the rabbi trust, which are subject to market risks and could experience significant swings in market values, are offset by corresponding changes in the liabilities owed to participants in the Executive Supplemental Retirement Plan. General economic conditions affected by regulatory changes, competition or other external influences may pose a higher risk to the Company’s overall results.
As of December 31, 2013, the Company has $6.8 million of cost and equity method investments. Approximately $2.4 million is invested in privately held companies through investments with portfolio managers. Most of the companies are in an early stage of development and significant increases in interest rates could have an adverse impact on their results, ability to raise capital and viability. The Company’s market risk is limited to the funds previously invested.
The financial statements listed in Item 15 are filed as part of this report and appear on pages F-2 through F-31.
None
(a)
Evaluation of Disclosure Controls and Procedures
As required by Rule 13a-15(b) of the Securities Exchange Act of 1934, as amended (the Exchange Act), our management, including our chief executive officer and chief financial officer, conducted an evaluation of the effectiveness of the design and operation of our disclosure controls and procedures (as defined in Exchange Act Rule 13a-15(e)) as of December 31, 2013. Based on this, our chief executive officer and chief financial officer concluded that, as of December 31, 2013, our disclosure controls and procedures were effective.
(b)
Management’s Report on Internal Control Over Financial Reporting
Our management is responsible for establishing and maintaining adequate internal control over financial reporting for the Company. With the participation of our chief executive officer and our chief financial officer, our management conducted an evaluation of the effectiveness of our internal control over financial reporting as of December 31, 2013, based on the framework and criteria established in
Internal Control – Integrated Framework (1992)
, issued by the Committee of Sponsoring Organizations of the Treadway Commission.
Based on management’s evaluation under the COSO framework of our internal control over financial reporting, management concluded that our internal control over financial reporting was effective as of December 31, 2013.
KPMG LLP, an independent registered public accounting firm, which audited the Company’s consolidated financial statements included in this Annual Report, has issued a report on the effectiveness of the Company’s internal control over financial reporting, which is included in Item 8 of this Annual Report.
(c)
Changes in Internal Control Over Financial Reporting
There have been no changes in our internal control over financial reporting that occurred during the quarter ended December 31, 2013 that have materially affected, or are reasonably likely to materially affect, our internal control over financial reporting.
None
PART III
See “Executive Officers” in Part 1, Item 1 of this report for information about our executive officers, which is incorporated by reference in this Item 10. Other information required by this Item 10 is incorporated by reference to the Company's definitive proxy statement for its 2014 Annual Meeting of Shareholders, referred to as the “2014 proxy statement,” which we will file with the SEC on or before 120 days after our 2013 fiscal year end, and which appears in the 2014 proxy statement under the captions “Election of Directors” and “Section 16(a) Beneficial Ownership Reporting Compliance.”.
We have adopted a code of ethics applicable to our chief executive officer and other senior financial officers, who include our principal financial officer, principal accounting officer or controller, and persons performing similar functions. The code of ethics, which is part of our Code of Business Conduct and Ethics, is available on our website at
www.shentel.com
. To the extent required by SEC rules, we intend to disclose any amendments to our code of conduct and ethics, and any waiver of a provision of the code with respect to the Company’s directors, principal executive officer, principal financial officer, principal accounting officer or controller, or persons performing similar functions, on our website referred to above within four business days following such amendment or waiver, or within any other period that may be required under SEC rules from time to time.
Information required by this Item 11 is incorporated herein by reference to the 2014 proxy statement, including the information in the 2014 proxy statement appearing under the captions “Election of Directors-Director Compensation” and “Executive Compensation.”
| ITEM 12. | SECURITY OWNERSHIP OF CERTAIN BENEFICIAL OWNERS AND MANAGEMENT AND RELATED STOCKHOLDER MATTERS |
Information required by this Item 12 is incorporated herein by reference to the 2014 proxy statement appearing under the caption “Security Ownership.”
The Company awards stock options to its employees meeting certain eligibility requirements under a plan approved by its shareholders in 2005. Outstanding options and the number of shares available for future issuance as of December 31, 2013 were as follows:
|
|
Number of securities to
be issued upon exercise
of outstanding options
|
Weighted average
exercise price of
outstanding options
|
Number of securities
remaining available for
future issuance
|
|||||||||
|
|
|
|
|
|||||||||
|
2005 stock option plan
|
550,507
|
$
|
16.71
|
374,122
|
||||||||
Since 2007, under the terms of the 2005 stock option plan, the Company has awarded 435,892 shares and share units to employees and directors in various grants in 2007, 2010, 2011, 2012 and 2013. As of December 31, 2013, 213,090 shares and share units were outstanding, and 67,956 shares and share units vested and were distributed during 2013. These shares and share units have been deducted from the number of securities remaining available for future issuance in the table above.
Information required by this Item 13 is incorporated herein by reference to the 2014 proxy statement, including the information in the 2014 proxy statement appearing under the caption “Executive Compensation-Certain Relationships and Related Transactions.”
Information required by this Item 14 is incorporated herein by reference to the 2014 proxy statement, including the information in the 2014 proxy statement appearing under the caption “Shareholder Ratification of Independent Registered Public Accounting Firm.”
PART IV
(a)(1) The following consolidated financial statements of the Company appear on pages F-2 through F-33 of this report and are incorporated by reference in Part II, Item 8:
Reports of Independent Registered Public Accounting Firm
Consolidated Financial Statements
Consolidated Balance Sheets as of December 31, 2013 and 2012
Consolidated Statements of Income and Comprehensive Income for the three years ended December 31, 2013
Consolidated Statements of Shareholders’ Equity for the three years ended December 31, 2013
Consolidated Statements of Cash Flows for the three years ended December 31, 2013
Notes to Consolidated Financial Statements
(a)(2) All schedules for which provision is made in the applicable accounting regulations of the Securities and Exchange Commission are not required under the related instructions or are inapplicable and therefore have been omitted.
(a)(3) The following exhibits are either filed with this Form 10-K or incorporated herein by reference. Our Securities Exchange Act file number is 000-09881.
Exhibit
| Number | Exhibit Description |
| 3.1 | Amended and Restated Articles of Incorporation of Shenandoah Telecommunications Company filed as Exhibit 3.1 to the Company’s Quarterly Report on Form 10-Q for the period ending June 30, 2007. |
| 3.2 | Amended and Restated Bylaws of Shenandoah Telecommunications Company, effective September 17, 2012, filed as Exhibit 3.3 to the Company’s Current Report on Form 8-K dated September 18, 2012. |
| 4.1 | Rights Agreement, dated as of February 8, 2008 between the Company and American Stock Transfer & Trust Company filed as Exhibit 4.1 to the Company's Current Report on Form 8-K, dated January 25, 2008. |
| 4.2 | Specimen representing the Common Stock, no par value, of Shenandoah Telecommunications Company, filed as Exhibit 4.3 to the Company’s Report on Form 10-K for the year ended December 31, 2007. |
| 10.1 | Shenandoah Telecommunications Company Stock Incentive Plan filed as Exhibit 4.1 to the Company’s Registration Statement on Form S-8 (No. 333-21733). |
| 10.2 | Shenandoah Telecommunications Company Dividend Reinvestment Plan filed as Exhibit 4.4 to the Company’s Registration Statement on Form S-3D (No. 333-74297). |
| 10.3 | Settlement Agreement and Mutual Release dated as of January 30, 2004 by and among Sprint Spectrum L.P., Sprint Communications Company L.P., WirelessCo, L.P., APC PCS, LLC, PhillieCo, L.P. and Shenandoah Personal Communications Company and Shenandoah Telecommunications Company, dated January 30, 2004; filed as Exhibit 10.3 to the Company’s Report on Form 10-K for the year ended December 31, 2003. |
| 10.4 | Sprint PCS Management Agreement dated as of November 5, 1999 by and among Sprint Spectrum L.P., WirelessCo, L.P., APC PCS, LLC, PhillieCo, L.P., and Shenandoah Personal Communications Company filed as Exhibit 10.4 to the Company’s Report on Form 10-K for the year ended December 31, 2003. |
| 10.5 | Sprint PCS Services Agreement dated as of November 5, 1999 by and between Sprint Spectrum L.P. and Shenandoah Personal Communications Company filed as Exhibit 10.5 to the Company’s Report on Form 10-K for the year ended December 31, 2003. |
| 10.6 | Sprint Trademark and Service Mark License Agreement dated as of November 5, 1999 by and between Sprint Communications Company, L.P. and Shenandoah Personal Communications Company filed as Exhibit 10.6 to the Company’s Report on Form 10-K for the year ended December 31, 2003. |
| 10.7 | Sprint Spectrum Trademark and Service Mark License Agreement dated as of November 5, 1999 by and between Sprint Spectrum L.P. and Shenandoah Personal Communications Company filed as Exhibit 10.7 to the Company’s Report on Form 10-K for the year ended December 31, 2003. |
| 10.8 | Addendum I to Sprint PCS Management Agreement by and among Sprint Spectrum L.P., WirelessCo, L.P., APC PCS, LLC, PhillieCo, L.P., and Shenandoah Personal Communications Company filed as Exhibit 10.8 to the Company’s Report on Form 10-K for the year ended December 31, 2003. |
| 10.9 | Asset Purchase Agreement dated November 5, 1999 by and among Sprint Spectrum L.P., Sprint Spectrum Equipment Company, L. P., Sprint Spectrum Realty Company, L.P., and Shenandoah Personal Communications Company, serving as Exhibit A to Addendum I to the Sprint PCS Management Agreement and as Exhibit 2.6 to the Sprint PCS Management Agreement filed as Exhibit 10.9 to the Company’s Report on Form 10-K for the year ended December 31, 2003. |
| 10.10 | Addendum II dated August 31, 2000 to Sprint PCS Management Agreement by and among Sprint Spectrum L.P., WirelessCo, L.P., APC PCS, LLC, PhillieCo, L.P., and Shenandoah Personal Communications Company filed as Exhibit 10.10 to the Company’s Report on Form 10-K for the year ended December 31, 2003. |
| 10.11 | Addendum III dated September 26, 2001 to Sprint PCS Management Agreement by and among Sprint Spectrum L.P., WirelessCo, L.P., APC PCS, LLC, PhillieCo, L.P., and Shenandoah Personal Communications Company filed as Exhibit 10.11 to the Company’s Report on Form 10-K for the year ended December 31, 2003. |
| 10.12 | Addendum IV dated May 22, 2003 to Sprint PCS Management Agreement by and among Sprint Spectrum L.P., WirelessCo, L.P., APC PCS, LLC, PhillieCo, L.P., and Shenandoah Personal Communications Company filed as Exhibit 10.12 to the Company’s Report on Form 10-K for the year ended December 31, 2003. |
| 10.13 | Addendum V dated January 30, 2004 to Sprint PCS Management Agreement by and among Sprint Spectrum L.P., WirelessCo, L.P., APC PCS, LLC, PhillieCo, L.P., and Shenandoah Personal Communications Company filed as Exhibit 10.13 to the Company’s Report on Form 10-K for the year ended December 31, 2003. |
| 10.14 | Supplemental Executive Retirement Plan as amended and restated, filed as Exhibit 10.14 to the Company’s Current Report on Form 8-K dated March 23, 2007. |
| 10.15 | Addendum VI dated May 24, 2004 to Sprint PCS Management Agreement by and among Sprint Spectrum L.P., WirelessCo, L.P., APC PCS, LLC, PhillieCo, L.P., and Shenandoah Personal Communications Company filed as Exhibit 10.15 to the Company’s Report on Form 10-Q for the quarterly period ended June 30, 2004. |
| 10.16 | Description of the Shenandoah Telecommunications Company Incentive Plan filed as Exhibit 10.25 to the Company’s Current Report on Form 8-K dated January 21, 2005. |
| 10.17 | Description of Compensation of Non-Employee Directors. Filed as Exhibit 10.26 to the Company’s Current Report on Form 8-K dated May 4, 2005. |
| 10.18 | Description of Management Compensatory Plans and Arrangements. Filed as Exhibit 10.27 to the Company’s current report on Form 8-K dated April 20, 2005. |
| 10.19 | 2005 Stock Incentive Plan filed as Exhibit 10.1 to the Company’s Registration Statement on Form S-8 (No. 333-127342). |
| 10.20 | Form of Incentive Stock Option Agreement under the 2005 Stock Incentive Plan filed as Exhibit 10.29 to the Company’s Report on Form 10-K for the year ended December 31, 2005. |
| 10.21 | Addendum VII dated March 13, 2007 to Sprint PCS Management Agreement by and among Sprint Spectrum L.P., Wireless Co., L.P., APC PCS, LLC, Phillieco, L.P., and Shenandoah Personal Communications Company, filed as Exhibit 10.31 to the Company’s Report on Form 10-K for the year ended December 31, 2006. |
| 10.22 | Settlement Agreement and Mutual Release dated March 13, 2007 by and among Sprint Corporation, Sprint Spectrum L.P., Wireless Co., L.P., Sprint Communications Company L.P., APC PCS, LLC, Phillieco, L.P., and Shenandoah Personal Communications Company and Shenandoah Telecommunications, filed as Exhibit 10.32 to the Company’s Report on Form 10-K for the year ended December 31, 2006. |
| 10.23 | Form of Performance Share Award to Executives filed as Exhibit 10.33 to the Company’s Current Report on Form 8-K dated September 20, 2007. |
| 10.24 | Addendum VIII to the Sprint Management Agreement dated November 19, 2007, filed as Exhibit 10.36 to the Company’s Current Report on Form 8-K dated November 20, 2007. |
| 10.25 | Asset Purchase Agreement dated August 6, 2008, between Rapid Communications, LLC, Rapid Acquisition Company, LLC, and Shentel Cable Company, filed as Exhibit 10.37 to the Company’s Report on Form 10-Q for the period ended June 30, 2008. |
| 10.26 | Amendment Number 1 to the Asset Purchase Agreement dated August 6, 2008, between Rapid Communications, LLC, Rapid Acquisition Company, LLC, and Shentel Cable Company, filed as Exhibit 10.40 to the Company’s Current Report on Form 8-K dated November 7, 2008. |
| 10.27 | Addendum IX to the Sprint Management Agreement dated as of April 14, 2009, and filed as Exhibit 10.42 to the Company’s Annual Report on Form 10-K dated March 8, 2010. |
| 10.28 | Asset Purchase Agreement dated as of April 16, 2010, between JetBroadband VA, LLC, Helicon Cable Communications, LLC, JetBroadband WV, LLC, JetBroadband Holdings, LLC, Helicon Cable Holdings, LLC, Shentel Cable Company and Shenandoah Telecommunications Company, filed as Exhibit 10.43 to the Company’s Current Report on Form 8-K, dated April 16, 2010. |
| 10.29 | Addendum X dated March 15, 2010 to Sprint PCS Management Agreement by and among Sprint Spectrum L.P., WirelessCo, L.P., APC PCS, LLC, PhillieCo, L.P., Sprint Communications Company L.P. and Shenandoah Personal Communications Company, filed as Exhibit 10.44 to the Company’s Current Report on Form 10-Q, dated May 7, 2010. |
| 10.30 | Addendum XI dated July 7, 2010 to Sprint PCS Management Agreement by and among Sprint Spectrum L.P., WirelessCo, L.P., APC PCS, LLC, PhillieCo, L.P., Sprint Communications Company L.P. and Shenandoah Personal Communications Company, filed as Exhibit 10.45 to the Company’s Current Report on Form 8-K dated July 8, 2010. |
| 10.31 | Credit Agreement dated as of July 30, 2010, among Shenandoah Telecommunications Company, CoBank, ACB, Branch Banking and Trust Company, Wells Fargo Bank, N.A., and other Lenders, filed as Exhibit 10.46 to the Company’s Current Report on Form 8-K dated July 30, 2010. |
| 10.32 | Second Amendment to the Credit Agreement dated as of July 30, 2010, among Shenandoah Telecommunications Company, CoBank, ACB, Branch Banking and Trust Company, Wells Fargo Bank, N.A., and other Lenders, filed as Exhibit 10.47 to the Company’s Current Report on Form 8-K dated April 29, 2011. |
| 10.33 | Third Amendment to the Credit Agreement dated as of July 30, 2010, among Shenandoah Telecommunications Company, CoBank, ACB, Branch Banking and Trust Company, Wells Fargo Bank, N.A., and other Lenders, filed as Exhibit 10.48 to the Company’s Quarterly Report on Form 10-Q dated August 8, 2011. |
| 10.34 | Letter Agreement modifying section 10.2.7.2 of Addendum X dated March 15, 2010 to Sprint PCS Management Agreement by and among Sprint Spectrum L.P., WirelessCo, L.P., APC PCS, LLC, PhillieCo, L.P., Sprint Communications Company L.P. and Shenandoah Personal Communications Company, filed as Exhibit 10.49 to the Company’s Quarterly Report on Form 10-Q dated August 8, 2011. |
| 10.35 | Fourth Amendment to the Credit Agreement dated as of July 30, 2010, among Shenandoah Telecommunications Company, CoBank, ACB, Branch Banking and Trust Company, Wells Fargo Bank, N.A., and other Lenders, filed as Exhibit 10.50 to the Company’s Quarterly Report on Form 10-Q dated August 8, 2011. |
| 10.36 | Addendum XII dated February 1, 2012 to Sprint PCS Management Agreement by and among Sprint Spectrum L.P., WirelessCo, L.P., APC PCS, LLC, PhillieCo, L.P., Sprint Communications Company L.P. and Shenandoah Personal Communications Company, filed as Exhibit 10.51 to the Company’s Current Report on Form 8-K dated February 2, 2012. |
| 10.37 | Fifth Amendment to the Credit Agreement dated as of July 30, 2010, among Shenandoah Telecommunications Company, CoBank, ACB, Branch Banking and Trust Company, Wells Fargo Bank, N.A., and other Lenders, filed as Exhibit 10.52 to the Company’s Current Report on Form 8-K dated February 2, 2012. |
| 10.38 | Addendum XIII dated September 14, 2012 to Sprint PCS Management Agreement by and among Sprint Spectrum L.P., WirelessCo, L.P., APC PCS, LLC, PhillieCo, L.P., Sprint Communications Company L.P. and Shenandoah Personal Communications, LLC, filed as Exhibit 10.53 to the Company’s Current Report on Form 8-K dated September 17, 2012. |
| 10.39 | Consent and Agreement dated September 14, 2012 related to Sprint PCS Management Agreement by and among Sprint Spectrum L.P., WirelessCo, L.P., APC PCS, LLC, PhillieCo, L.P., Sprint Communications Company L.P. and Shenandoah Personal Communications, LLC, filed as Exhibit 10.54 to the Company’s Current Report on Form 8-K dated September 17, 2012. |
| 10.40 | Amended and Restated Credit Agreement dated as of September 14, 2012, among Shenandoah Telecommunications Company, CoBank, ACB, and other Lenders, filed as Exhibit 10.55 to the Company’s Current Report on Form 8-K dated September 17, 2012. |
| 10.41 | Addendum XIV dated as of November 19, 2012, to Sprint PCS Management Agreement by and among Sprint Spectrum L.P., WirelessCo, L.P., APC PCS, LLC, PhillieCo, L.P., Sprint Communications Company L.P. and Shenandoah Personal Communications, LLC, filed as Exhibit 10.42 to the Company’s Annual Report on Form 10-K dated March 5, 2013. |
| 10.42 | Addendum XV dated as of March 11, 2013, to Sprint PCS Management Agreement by and among Sprint Spectrum, L.P., WirelessCo, L.P., APC PCS, LLC, PhillieCo, L.P., Sprint Communications Company L.P. and Shenandoah Personal communications, LLC, filed as Exhibit 10.43 to the Company’s Quarterly Report on Form 10-Q dated May 3, 2013. |
| *21 | List of Subsidiaries. |
| *23.1 | Consent of KPMG LLP, Independent Registered Public Accounting Firm. |
| *31.1 | Certification of President and Chief Executive Officer of Shenandoah Telecommunications Company pursuant to Rule 13a-14(a)under the Securities Exchange Act of 1934. |
| *31.2 | Certification of Vice President and Chief Financial Officer of Shenandoah Telecommunications Company pursuant to Rule 13a-14(a)under the Securities Exchange Act of 1934. |
| *32 | Certifications pursuant to Rule 13a-14(b) under the Securities Exchange Act of 1934 and 18 U.S.C. § 1350. |
| (101) | Formatted in XBRL (Extensible Business Reporting Language) |
|
101.INS
|
XBRL Instance Document
|
|
101.SCH
|
XBRL Taxonomy Extension Schema Document
|
|
101.CAL
|
XBRL Taxonomy Extension Calculation Linkbase Document
|
|
101.DEF
|
XBRL Taxonomy Extension Definition Linkbase Document
|
|
101.LAB
|
XBRL Taxonomy Extension Label Linkbase Document
|
|
101.PRE
|
XBRL Taxonomy Extension Presentation Linkbase Document
|
* Filed herewith.
SIGNATURES
Pursuant to the requirements of Sections 13 or 15(d) of the Securities Exchange Act of 1934, the Registrant has duly caused this report to be signed on its behalf by the undersigned, thereunto duly authorized.
|
SHENANDOAH TELECOMMUNICATIONS COMPANY
|
||
|
|
|
|
|
March 3, 2014
|
/S/ CHRISTOPHER E. FRENCH
|
|
|
|
Christopher E. French, President
|
|
|
|
(Duly Authorized Officer)
|
|
Pursuant to the requirements of the Securities Exchange Act of 1934, this report has been signed by the following persons on behalf of the Registrant and in the capacities and on the dates indicated.
|
/s/CHRISTOPHER E. FRENCH
|
President & Chief Executive Officer,
|
|
March 3, 2014
|
Director (Principal Executive Officer)
|
|
Christopher E. French
|
|
|
|
|
|
/s/ADELE M. SKOLITS
|
Vice President – Finance and Chief Financial Officer
|
|
March 3, 2014
|
(Principal Financial Officer and
|
|
Adele M. Skolits
|
Principal Accounting Officer)
|
|
|
|
|
/s/DOUGLAS C. ARTHUR
|
Director
|
|
March 3, 2014
|
|
|
Douglas C. Arthur
|
|
|
|
|
|
/s/KEN L. BURCH
|
Director
|
|
March 3, 2014
|
|
|
Ken L. Burch
|
|
|
|
|
|
/s/TRACY FITZSIMMONS
|
Director
|
|
March 3, 2014
|
|
|
Tracy Fitzsimmons
|
|
|
|
|
|
/s/JOHN W. FLORA
|
Director
|
|
March 3, 2014
|
|
|
John W. Flora
|
|
|
|
|
|
/s/ RICHARD L. KOONTZ, JR.
|
Director
|
|
March 3, 2014
|
|
|
Richard L. Koontz, Jr.
|
|
|
|
|
|
/s/DALE S. LAM
|
Director
|
|
March 3, 2014
|
|
|
Dale S. Lam
|
|
|
|
|
|
/s/ JONELLE ST. JOHN
|
Director
|
|
March 3, 2014
|
|
|
Jonelle St. John
|
|
|
|
|
|
/s/JAMES E. ZERKEL II
|
Director
|
|
March 3, 2014
|
|
|
James E. Zerkel II
|
|
SHENANDOAH TELECOMMUNICATIONS COMPANY
AND SUBSIDIARIES
Index to the Consolidated 2013 Financial Statements
|
|
Page
|
|
Reports of Independent Registered Public Accounting Firm
|
F-2 and F-3
|
|
|
|
|
Consolidated Financial Statements for the Years Ended December 31, 2013, 2012 and 2011
|
|
|
|
|
|
Consolidated Balance Sheets
|
F-4 and F-5
|
|
Consolidated Statements of Income and Comprehensive Income
|
F-6
|
|
Consolidated Statements of Shareholders’ Equity
|
F-7 and F-8
|
|
Consolidated Statements of Cash Flows
|
F-9 and F-10
|
|
Notes to Consolidated Financial Statements
|
F-11 through F-31
|
Report of Independent Registered Public Accounting Firm
The Board of Directors and Shareholders
Shenandoah Telecommunications Company:
We have audited Shenandoah Telecommunications Company’s (the Company’s) internal control over financial reporting as of December 31, 2013, based on criteria established in
Internal Control—Integrated Framework (1992)
issued by the Committee of Sponsoring Organizations of the Treadway Commission. The Company’s management is responsible for maintaining effective internal control over financial reporting and for its assessment of the effectiveness of internal control over financial reporting, included in the accompanying Management’s Report on Internal Control over Financial Reporting. Our responsibility is to express an opinion on the Company's internal control over financial reporting based on our audit.
We conducted our audit in accordance with the standards of the Public Company Accounting Oversight Board (United States). Those standards require that we plan and perform the audit to obtain reasonable assurance about whether effective internal control over financial reporting was maintained in all material respects. Our audit included obtaining an understanding of internal control over financial reporting, assessing the risk that a material weakness exists, and testing and evaluating the design and operating effectiveness of internal control based on the assessed risk. Our audit also included performing such other procedures as we considered necessary in the circumstances. We believe that our audit provides a reasonable basis for our opinion.
A company's internal control over financial reporting is a process designed to provide reasonable assurance regarding the reliability of financial reporting and the preparation of financial statements for external purposes in accordance with generally accepted accounting principles. A company's internal control over financial reporting includes those policies and procedures that (1) pertain to the maintenance of records that, in reasonable detail, accurately and fairly reflect the transactions and dispositions of the assets of the company; (2) provide reasonable assurance that transactions are recorded as necessary to permit preparation of financial statements in accordance with generally accepted accounting principles, and that receipts and expenditures of the company are being made only in accordance with authorizations of management and directors of the company; and (3) provide reasonable assurance regarding prevention or timely detection of unauthorized acquisition, use, or disposition of the company's assets that could have a material effect on the financial statements.
Because of its inherent limitations, internal control over financial reporting may not prevent or detect misstatements. Also, projections of any evaluation of effectiveness to future periods are subject to the risk that controls may become inadequate because of changes in conditions, or that the degree of compliance with the policies or procedures may deteriorate.
In our opinion, the Company maintained, in all material respects, effective internal control over financial reporting as of December 31, 2013, based on criteria established in
Internal Control—Integrated Framework (1992),
issued by the Committee of Sponsoring Organizations of the Treadway Commission.
We also have audited, in accordance with the standards of the Public Company Accounting Oversight Board (United States), the consolidated balance sheets of Shenandoah Telecommunications Company and subsidiaries as of December 31, 2013 and 2012, and the related consolidated statements of income and comprehensive income, shareholders’ equity, and cash flows for each of the years in the three-year period ended December 31, 2013, and our report dated March 3, 2014 expressed an unqualified opinion on those consolidated financial statements.
/S/ KPMG LLP
Richmond, Virginia
March 3, 2014
Report of Independent Registered Public Accounting Firm
The Board of Directors and Shareholders
Shenandoah Telecommunications Company:
We have audited the accompanying consolidated balance sheets of Shenandoah Telecommunications Company and subsidiaries (the Company) as of December 31, 2013 and 2012, and the related consolidated statements of income and comprehensive income, shareholders’ equity, and cash flows for each of the years in the three-year period ended December 31, 2013. These consolidated financial statements are the responsibility of the Company’s management. Our responsibility is to express an opinion on these consolidated financial statements based on our audits.
We conducted our audits in accordance with the standards of the Public Company Accounting Oversight Board (United States). Those standards require that we plan and perform the audit to obtain reasonable assurance about whether the financial statements are free of material misstatement. An audit includes examining, on a test basis, evidence supporting the amounts and disclosures in the financial statements. An audit also includes assessing the accounting principles used and significant estimates made by management, as well as evaluating the overall financial statement presentation. We believe that our audits provide a reasonable basis for our opinion.
In our opinion, the consolidated financial statements referred to above present fairly, in all material respects, the financial position of Shenandoah Telecommunications Company and subsidiaries as of December 31, 2013 and 2012, and the results of their operations and their cash flows for each of the years in the three-year period ended December 31, 2013, in conformity with U.S. generally accepted accounting principles.
We also have audited, in accordance with the standards of the Public Company Accounting Oversight Board (United States), the Company’s internal control over financial reporting as of December 31, 2013, based on criteria established in
Internal Control–Integrated Framework (1992),
issued by the Committee of Sponsoring Organizations of the Treadway Commission, and our report dated March 3, 2014 expressed an unqualified opinion on the effectiveness of the Company’s internal control over financial reporting
.
/S/ KPMG LLP
Richmond, Virginia
March 3, 2014
CONSOLIDATED BALANCE SHEETS
December 31, 2013 and 2012
in thousands
|
ASSETS
|
2013
|
2012
|
||||||
|
|
|
|
||||||
|
Current Assets
|
|
|
||||||
|
Cash and cash equivalents
|
$
|
38,316
|
$
|
71,086
|
||||
|
Accounts receivable, net
|
25,824
|
25,274
|
||||||
|
Income taxes receivable
|
16,576
|
4,705
|
||||||
|
Materials and supplies
|
10,715
|
9,789
|
||||||
|
Prepaid expenses and other
|
5,580
|
4,546
|
||||||
|
Assets held for sale
|
-
|
203
|
||||||
|
Deferred income taxes
|
963
|
832
|
||||||
|
Total current assets
|
97,974
|
116,435
|
||||||
|
|
||||||||
|
Investments, including $
2,528
and $2,064 carried at fair value
|
9,332
|
8,214
|
||||||
|
|
||||||||
|
Property, plant and equipment, net
|
408,963
|
365,474
|
||||||
|
|
||||||||
|
Other Assets
|
||||||||
|
Intangible assets, net
|
70,816
|
74,932
|
||||||
|
Deferred charges and other assets, net
|
9,921
|
5,685
|
||||||
|
Other assets, net
|
80,737
|
80,617
|
||||||
|
Total assets
|
$
|
597,006
|
$
|
570,740
|
||||
See accompanying notes to consolidated financial statements.
(Continued)
SHENANDOAH TELECOMMUNICATIONS COMPANY AND SUBSIDIARIES
CONSOLIDATED BALANCE SHEETS
December 31, 2013 and 2012
in thousands
|
LIABILITIES AND SHAREHOLDERS’ EQUITY
|
2013
|
2012
|
||||||
|
|
|
|
||||||
|
Current Liabilities
|
|
|
||||||
|
Current maturities of long-term debt
|
$
|
5,750
|
$
|
1,977
|
||||
|
Accounts payable
|
12,604
|
31,729
|
||||||
|
Advanced billings and customer deposits
|
11,661
|
11,190
|
||||||
|
Accrued compensation
|
4,192
|
2,671
|
||||||
|
Accrued liabilities and other
|
9,787
|
10,573
|
||||||
|
Total current liabilities
|
43,994
|
58,140
|
||||||
|
|
||||||||
|
Long-term debt, less current maturities
|
224,250
|
230,000
|
||||||
|
|
||||||||
|
Other Long-Term Liabilities
|
||||||||
|
Deferred income taxes
|
74,547
|
57,896
|
||||||
|
Deferred lease payable
|
6,156
|
4,903
|
||||||
|
Asset retirement obligations
|
6,485
|
5,896
|
||||||
|
Other liabilities
|
7,259
|
6,057
|
||||||
|
Total other liabilities
|
94,447
|
74,752
|
||||||
|
|
||||||||
|
Commitments and Contingencies
|
||||||||
|
|
||||||||
|
Shareholders’ Equity
|
||||||||
|
Common stock, no par value, authorized 48,000 shares; issued and outstanding 24,040 shares in 2013 and 23,962 shares in 2012
|
26,759
|
24,688
|
||||||
|
Accumulated other comprehensive income (loss)
|
2,594
|
(863
|
)
|
|||||
|
Retained earnings
|
204,962
|
184,023
|
||||||
|
Total shareholders’ equity
|
234,315
|
207,848
|
||||||
|
|
||||||||
|
Total liabilities and shareholders’ equity
|
$
|
597,006
|
$
|
570,740
|
||||
See accompanying notes to consolidated financial statements.
SHENANDOAH TELECOMMUNICATIONS COMPANY AND SUBSIDIARIES
CONSOLIDATED STATEMENTS OF INCOME AND COMPREHENSIVE INCOME
Years Ended December 31, 2013, 2012 and 2011
in thousands, except per share amounts
|
|
2013
|
2012
|
2011
|
|||||||||
|
|
|
|
|
|||||||||
|
Operating revenues
|
$
|
308,942
|
$
|
288,075
|
$
|
251,145
|
||||||
|
|
||||||||||||
|
Operating expenses
|
||||||||||||
|
Cost of goods and services, exclusive of depreciation and amortization shown separately below
|
125,140
|
117,407
|
106,640
|
|||||||||
|
Impairment charge on goodwill
|
-
|
10,952
|
-
|
|||||||||
|
Selling, general and administrative, exclusive of depreciation and amortization shown separately below
|
67,673
|
60,646
|
56,445
|
|||||||||
|
Depreciation and amortization
|
60,722
|
64,412
|
55,770
|
|||||||||
|
Total operating expenses
|
253,535
|
253,417
|
218,855
|
|||||||||
|
Operating income
|
55,407
|
34,658
|
32,290
|
|||||||||
|
|
||||||||||||
|
Other income (expense)
|
||||||||||||
|
Interest expense
|
(8,468
|
)
|
(7,850
|
)
|
(8,289
|
)
|
||||||
|
Gain (loss) on investments, net
|
756
|
858
|
(696
|
)
|
||||||||
|
Non-operating income, net
|
1,769
|
945
|
900
|
|||||||||
|
Income from continuing operations before income taxes
|
49,464
|
28,611
|
24,205
|
|||||||||
|
Income tax expense
|
19,878
|
12,008
|
10,667
|
|||||||||
|
Net income from continuing operations
|
29,586
|
16,603
|
13,538
|
|||||||||
|
|
||||||||||||
|
Loss from discontinued operations of Converged Services, net of tax benefits of $0, $196 and $359, respectively
|
-
|
(300
|
)
|
(545
|
)
|
|||||||
|
Net income
|
$
|
29,586
|
$
|
16,303
|
$
|
12,993
|
||||||
|
Other comprehensive income (loss):
|
||||||||||||
|
Unrealized gain (loss) on interest rate hedge, net of tax
|
3,457
|
(863
|
)
|
-
|
||||||||
|
Comprehensive income
|
$
|
33,043
|
$
|
15,440
|
$
|
12,993
|
||||||
|
|
||||||||||||
|
Income per share:
|
||||||||||||
|
Basic and diluted net income per share:
|
||||||||||||
|
Net income from continuing operations
|
$
|
1.23
|
$
|
0.69
|
$
|
0.57
|
||||||
|
Loss from discontinued operations, net of income taxes
|
-
|
(0.01
|
)
|
(0.02
|
)
|
|||||||
|
Net income
|
$
|
1.23
|
$
|
0.68
|
$
|
0.55
|
||||||
|
|
||||||||||||
|
Weighted average shares outstanding, basic
|
24,001
|
23,877
|
23,781
|
|||||||||
|
|
||||||||||||
|
Weighted average shares outstanding, diluted
|
24,115
|
24,019
|
23,826
|
|||||||||
See accompanying notes to consolidated financial statements.
SHENANDOAH TELECOMMUNICATIONS COMPANY AND SUBSIDIARIES
CONSOLIDATED STATEMENTS OF SHAREHOLDERS' EQUITY
Years Ended December 31, 2013, 2012 and 2011
in thousands, except per share amounts
|
|
Shares
|
Common
Stock
|
Retained
Earnings
|
Accumulated
Other
Comprehensive
Income (Loss)
|
Total
|
|||||||||||||||
|
Balance, December 31, 2010
|
23,767
|
$
|
19,833
|
$
|
170,472
|
$
|
-
|
$
|
190,305
|
|||||||||||
|
|
||||||||||||||||||||
|
Net income
|
-
|
-
|
12,993
|
-
|
12,993
|
|||||||||||||||
|
Dividends declared ($0.33 per share)
|
-
|
-
|
(7,849
|
)
|
-
|
(7,849
|
)
|
|||||||||||||
|
Dividends reinvested in common stock
|
51
|
529
|
-
|
-
|
529
|
|||||||||||||||
|
Stock based compensation
|
-
|
1,718
|
-
|
-
|
1,718
|
|||||||||||||||
|
|
||||||||||||||||||||
|
Common stock issued through exercise of incentive stock options
|
5
|
37
|
-
|
-
|
37
|
|||||||||||||||
|
Common stock issued for share awards
|
19
|
-
|
-
|
-
|
-
|
|||||||||||||||
|
Common stock issued
|
1
|
13
|
-
|
-
|
13
|
|||||||||||||||
|
Common stock repurchased
|
(5
|
)
|
(92
|
)
|
-
|
-
|
(92
|
)
|
||||||||||||
|
Net excess tax benefit from stock options exercised
|
-
|
5
|
-
|
-
|
5
|
|||||||||||||||
|
Balance, December 31, 2011
|
23,838
|
$
|
22,043
|
$
|
175,616
|
$
|
-
|
$
|
197,659
|
|||||||||||
|
|
||||||||||||||||||||
|
Net income
|
-
|
-
|
16,303
|
-
|
16,303
|
|||||||||||||||
|
Other comprehensive loss, net of tax
|
-
|
-
|
-
|
(863
|
)
|
(863
|
)
|
|||||||||||||
|
Dividends declared ($0.33 per share)
|
-
|
-
|
(7,896
|
)
|
-
|
(7,896
|
)
|
|||||||||||||
|
Dividends reinvested in common stock
|
37
|
493
|
-
|
-
|
493
|
|||||||||||||||
|
Stock based compensation
|
-
|
1,842
|
-
|
-
|
1,842
|
|||||||||||||||
|
Common stock issued through exercise of incentive stock options
|
55
|
404
|
-
|
-
|
404
|
|||||||||||||||
|
Common stock issued for share awards
|
45
|
-
|
-
|
-
|
-
|
|||||||||||||||
|
Common stock issued
|
1
|
10
|
-
|
-
|
10
|
|||||||||||||||
|
Common stock repurchased
|
(13
|
)
|
(143
|
)
|
-
|
-
|
(143
|
)
|
||||||||||||
|
Net excess tax benefit from stock options exercised
|
-
|
39
|
-
|
-
|
39
|
|||||||||||||||
|
Balance, December 31, 2012
|
23,962
|
24,688
|
184,023
|
(863
|
)
|
207,848
|
||||||||||||||
(Continued)
SHENANDOAH TELECOMMUNICATIONS COMPANY AND SUBSIDIARIES
CONSOLIDATED STATEMENTS OF SHAREHOLDERS' EQUITY
Years Ended December 31, 2013, 2012 and 2011
in thousands, except per share amounts
|
|
Shares
|
Common
Stock
|
Retained
Earnings
|
Accumulated
Other
Comprehensive
Income (Loss)
|
Total
|
|||||||||||||||
|
Net income
|
-
|
-
|
29,586
|
-
|
29,586
|
|||||||||||||||
|
Other comprehensive income, net of tax
|
-
|
-
|
-
|
3,457
|
3,457
|
|||||||||||||||
|
Dividends declared ($0.36 per share)
|
-
|
-
|
(8,647
|
)
|
-
|
(8,647
|
)
|
|||||||||||||
|
Dividends reinvested in common stock
|
20
|
475
|
-
|
-
|
475
|
|||||||||||||||
|
Stock based compensation
|
-
|
1,938
|
-
|
-
|
1,938
|
|||||||||||||||
|
Common stock issued through exercise of incentive stock options
|
66
|
1,186
|
-
|
-
|
1,186
|
|||||||||||||||
|
Common stock issued for share awards
|
68
|
-
|
-
|
-
|
-
|
|||||||||||||||
|
Common stock issued
|
1
|
10
|
-
|
-
|
10
|
|||||||||||||||
|
Common stock repurchased
|
(77
|
)
|
(1,600
|
)
|
-
|
-
|
(1,600
|
)
|
||||||||||||
|
Net excess tax benefit from stock options exercised
|
-
|
62
|
-
|
-
|
62
|
|||||||||||||||
|
Balance, December 31, 2013
|
24,040
|
$
|
26,759
|
$
|
204,962
|
$
|
2,594
|
$
|
234,315
|
|||||||||||
See accompanying notes to consolidated financial statements.
SHENANDOAH TELECOMMUNICATIONS COMPANY AND SUBSIDIARIES
CONSOLIDATED STATEMENTS OF CASH FLOWS
Years Ended December 31, 2013, 2012 and 2011
in thousands
|
|
2013
|
2012
|
2011
|
|||||||||
|
|
|
|
|
|||||||||
|
Cash Flows from Operating Activities
|
|
|
|
|||||||||
|
Net income
|
$
|
29,586
|
$
|
16,303
|
$
|
12,993
|
||||||
|
Adjustments to reconcile net income to net cash provided by operating activities:
|
||||||||||||
|
Impairments on assets held for sale
|
-
|
-
|
645
|
|||||||||
|
Goodwill impairment
|
-
|
10,952
|
-
|
|||||||||
|
Depreciation
|
56,583
|
57,961
|
45,350
|
|||||||||
|
Amortization
|
4,139
|
6,452
|
10,420
|
|||||||||
|
Provision for bad debt
|
2,019
|
2,870
|
3,243
|
|||||||||
|
Stock based compensation expense
|
1,938
|
1,842
|
1,718
|
|||||||||
|
Excess tax benefits on stock option exercises
|
(101
|
)
|
(106
|
)
|
(5
|
)
|
||||||
|
Deferred income taxes
|
14,266
|
6,504
|
15,973
|
|||||||||
|
Net (gain) loss on disposal of equipment
|
753
|
426
|
(1,360
|
)
|
||||||||
|
Realized (gain) loss on disposal of investments
|
1
|
(66
|
)
|
27
|
||||||||
|
Unrealized (gains) losses on investments
|
(391
|
)
|
(191
|
)
|
132
|
|||||||
|
Net (gain) loss from patronage and equity investments
|
(837
|
)
|
(894
|
)
|
233
|
|||||||
|
Write-off of unamortized loan fees
|
-
|
780
|
-
|
|||||||||
|
Other
|
2,272
|
1,526
|
257
|
|||||||||
|
Changes in assets and liabilities, exclusive of acquired businesses:
|
||||||||||||
|
(Increase) decrease in:
|
||||||||||||
|
Accounts receivable
|
(2,594
|
)
|
(8,246
|
)
|
(1,891
|
)
|
||||||
|
Materials and supplies
|
(927
|
)
|
(2,321
|
)
|
(1,080
|
)
|
||||||
|
Income taxes receivable
|
(11,871
|
)
|
7,790
|
(9,919
|
)
|
|||||||
|
Increase (decrease) in:
|
||||||||||||
|
Accounts payable
|
(2,145
|
)
|
(4,690
|
)
|
(596
|
)
|
||||||
|
Deferred lease payable
|
1,253
|
729
|
416
|
|||||||||
|
Other prepaids, deferrals and accruals
|
320
|
(647
|
)
|
4,371
|
||||||||
|
Net cash provided by operating activities
|
$
|
94,264
|
$
|
96,974
|
$
|
80,927
|
||||||
(Continued)
SHENANDOAH TELECOMMUNICATIONS COMPANY AND SUBSIDIARIES
CONSOLIDATED STATEMENTS OF CASH FLOWS
Years Ended December 31, 2013, 2012 and 2011
in thousands
|
|
2013
|
2012
|
2011
|
|||||||||
|
|
|
|
|
|||||||||
|
Cash Flows From Investing Activities
|
|
|
|
|||||||||
|
Acquisition of property, plant and equipment
|
$
|
(117,028
|
)
|
$
|
(89,053
|
)
|
$
|
(74,663
|
)
|
|||
|
Proceeds from sale of equipment
|
331
|
102
|
675
|
|||||||||
|
Proceeds from sales of assets
|
25
|
3,803
|
2,986
|
|||||||||
|
Purchase of investment securities
|
(12
|
)
|
-
|
(84
|
)
|
|||||||
|
Proceeds from sale of investment securities
|
121
|
1,227
|
475
|
|||||||||
|
|
||||||||||||
|
Net cash used in investing activities
|
$
|
(116,563
|
)
|
$
|
(83,921
|
)
|
$
|
(70,611
|
)
|
|||
|
|
||||||||||||
|
Cash Flows From Financing Activities
|
||||||||||||
|
Principal payments on long-term debt
|
$
|
(1,977
|
)
|
$
|
(178,397
|
)
|
$
|
(14,538
|
)
|
|||
|
Amounts borrowed under debt agreements
|
-
|
230,000
|
-
|
|||||||||
|
Cash paid for debt issuance costs
|
-
|
(2,418
|
)
|
-
|
||||||||
|
Dividends paid, net of dividends reinvested
|
(8,191
|
)
|
(7,403
|
)
|
(7,320
|
)
|
||||||
|
Excess tax benefits on stock option exercises
|
101
|
106
|
5
|
|||||||||
|
Repurchases of stock
|
(1,600
|
)
|
(143
|
)
|
(92
|
)
|
||||||
|
Proceeds from exercise of incentive stock options
|
1,196
|
414
|
50
|
|||||||||
|
|
||||||||||||
|
Net cash provided by (used in) financing activities
|
$
|
(10,471
|
)
|
$
|
42,159
|
$
|
(21,895
|
)
|
||||
|
|
||||||||||||
|
Net increase (decrease) in cash and cash equivalents
|
$
|
(32,770
|
)
|
$
|
55,212
|
$
|
(11,579
|
)
|
||||
|
|
||||||||||||
|
Cash and cash equivalents:
|
||||||||||||
|
Beginning
|
71,086
|
15,874
|
27,453
|
|||||||||
|
Ending
|
$
|
38,316
|
$
|
71,086
|
$
|
15,874
|
||||||
|
|
||||||||||||
|
Supplemental Disclosures of Cash Flow Information
|
||||||||||||
|
Cash payments for:
|
||||||||||||
|
Interest, net of capitalized interest of $396 in 2013, $486 in 2012, and $215 in 2011
|
$
|
8,077
|
$
|
6,598
|
$
|
7,076
|
||||||
|
Income taxes paid (refunded), net
|
$
|
17,483
|
$
|
(2,482
|
)
|
$
|
4,248
|
|||||
During 2013, 2012 and 2011, the Company traded in certain PCS equipment and received credits of $14,533, $20,307 and $2,923, respectively, against the purchase price of new equipment. Accounts payable at December 31, 2013 and 2012 included $7,635 and $24,675 associated with PCS Network Vision capital expenditures.
See accompanying notes to consolidated financial statements.
SHENANDOAH TELECOMMUNICATIONS COMPANY AND SUBSIDIARIES
NOTES TO CONSOLIDATED FINANCIAL STATEMENTS
Description of business:
Shenandoah Telecommunications Company and its subsidiaries (collectively, the “Company”) provide wireless personal communications service (“PCS”) under the Sprint brand, and telephone service, cable television, unregulated communications equipment sales and services, and Internet access under the Shentel brand. In addition, the Company leases towers and operates and maintains an interstate fiber optic network. Pursuant to a management agreement with Sprint and its related parties (collectively, “Sprint”), the Company is the exclusive Sprint PCS Affiliate providing wireless mobility
communications network products and services on the 800 and 1900 megahertz spectrum ranges in the geographic area extending from Altoona, Harrisburg and York, Pennsylvania, south through Western Maryland and the panhandle of West Virginia to Harrisonburg, Virginia. The Company is licensed to use the Sprint brand name in this territory, and operates its network under the Sprint radio spectrum license (See Note 7). The Company's other operations are located in the four-state region surrounding the Northern Shenandoah Valley of Virginia.
A summary of the Company's significant accounting policies follows:
Principles of consolidation:
The consolidated financial statements include the accounts of all wholly owned subsidiaries. All significant intercompany balances and transactions have been eliminated in consolidation.
Use of estimates:
Management of the Company has made a number of estimates and assumptions related to the reporting of assets and liabilities, the disclosure of contingent assets and liabilities at the date of the consolidated financial statements and the reported amounts of revenues and expenses during the reporting periods. Management reviews its estimates, including those related to recoverability and useful lives of assets as well as liabilities for income taxes and pension benefits. Changes in facts and circumstances may result in revised estimates, and actual results could differ from those reported estimates.
Cash and cash equivalents:
The Company considers all temporary cash investments purchased with a maturity of three months or less to be cash equivalents. The Company places its temporary cash investments with high credit quality financial institutions. At times, these investments may be in excess of FDIC insurance limits. Cash equivalents were comprised of $20.0 million of institutional cash management funds and $20.0 million of U.S. Treasury bills at December 31, 2013 and 2012, respectively.
Accounts receivable:
Accounts receivable are recorded at the invoiced amount and do not bear interest. The allowance for doubtful accounts is the Company’s best estimate of the amount of probable credit losses in the Company’s existing accounts receivable. The Company determines the allowance based on historical write-off experience and industry and local economic data. The Company reviews its allowance for doubtful accounts monthly. Past due balances meeting specific criteria are reviewed individually for collectability. All other balances are reviewed on a pooled basis. Account balances are charged off against the allowance after all means of collection have been exhausted and the potential for recovery is considered remote. Accounts receivable are concentrated among customers within the Company's geographic service area and large telecommunications companies. Changes in the allowance for doubtful accounts for trade accounts receivable for the years ended December 31, 2013, 2012 and 2011 are summarized below (in thousands):
|
|
2013
|
2012
|
2011
|
|||||||||
|
|
|
|||||||||||
|
Balance at beginning of year
|
$
|
1,113
|
$
|
838
|
$
|
460
|
||||||
|
Bad debt expense
|
2,019
|
2,870
|
3,243
|
|||||||||
|
Losses charged to allowance
|
(2,390
|
)
|
(2,854
|
)
|
(3,304
|
)
|
||||||
|
Recoveries added to allowance
|
182
|
259
|
439
|
|||||||||
|
Balance at end of year
|
$
|
924
|
$
|
1,113
|
$
|
838
|
||||||
Investments:
The classifications of debt and equity securities are determined by management at the date individual investments are acquired. The appropriateness of such classification is periodically reassessed. The Company monitors the fair value of all investments, and based on factors such as market conditions, financial information and industry conditions, the Company will reflect impairments in values as is warranted. The classification of those securities and the related accounting policies are as follows:
Investments Carried at Fair Value:
Investments in stock and bond mutual funds and investment trusts held within the Company’s rabbi trust, which is related to the Company’s unfunded Supplemental Executive Retirement Plan, are reported at net asset value, which approximates fair value. Unrealized gains and losses are recognized in earnings.
Investments Carried at Cost:
Investments in common stock in which the Company does not have a significant ownership (less than 20%) and for which there is no ready market, are carried at cost. Information regarding investments carried at cost is reviewed for evidence of impairment in value. Impairments are charged to earnings and a new cost basis for the investment is established.
Equity Method Investments:
Investments in partnerships and in unconsolidated corporations where the Company's ownership is 20% or more, or where the Company otherwise has the ability to exercise significant influence, are reported under the equity method. Under this method, the Company's equity in earnings or losses of investees is reflected in earnings. Distributions received reduce the carrying value of these investments. The Company recognizes a loss when there is a decline in value of the investment which is other than a temporary decline.
Materials and supplies:
New and reusable materials are carried in inventory at the lower of average cost or market value. Inventory held for sale, such as telephones and accessories, are carried at the lower of average cost or market value. Non-reusable material is carried at estimated salvage value.
Property, plant and equipment:
Property, plant and equipment is stated at cost. The Company capitalizes all costs associated with the purchase, deployment and installation of property, plant and equipment, including interest on major capital projects during the period of their construction. Expenditures, including those on leased assets, which extend the useful life or increase its utility, are capitalized. Maintenance expense is recognized when repairs are performed. Depreciation is calculated on the straight-line method over the estimated useful lives of the assets. Depreciation and amortization is not included in the income statement line items “Cost of goods and services” or “Selling, general and administrative.” Depreciable lives are assigned to assets based on their estimated useful lives. Leasehold improvements are depreciated over the lesser of their useful lives or respective lease terms. The Company takes technology changes into consideration as it assigns the estimated useful lives, and monitors the remaining useful lives of asset groups to reasonably match the remaining economic life with the useful life and makes adjustments when necessary.
Valuation of long-lived assets:
Long‑lived assets, such as property, plant, and equipment, and purchased intangibles subject to amortization, are reviewed for impairment whenever events or changes in circumstances indicate that the carrying amount of an asset may not be recoverable. Recoverability of assets to be held and used is measured by a comparison of the carrying amount of an asset to estimated undiscounted future cash flows expected to be generated by the asset. If the carrying amount of an asset exceeds its estimated future cash flows, an impairment charge is recognized by the amount by which the carrying amount of the asset exceeds the fair value of the asset.
Fair value
: Financial instruments presented on the consolidated balance sheets that approximate fair value include: cash and cash equivalents, receivables, investments carried at fair value, payables, accrued liabilities, interest rate swaps and long-term debt.
The Company measures its interest rate swaps at fair value based on information provided by the counterparty and third party software, and recognizes it on the Company’s consolidated balance sheet. Changes in the fair value of the swap acquired in 2010 were recognized in interest expense, as the Company did not designate this swap agreement as a cash flow hedge for accounting purposes. Changes in the fair value of the swap acquired in 2012 are recognized in other comprehensive income, as this swap was designated as a cash flow hedge for accounting purposes. The Company entered into these swaps to manage a portion of its exposure to interest rate movements by converting a portion of its long-term debt from variable to fixed rates.
Asset retirement obligations:
The Company records the fair value of an asset retirement obligation as a liability in the period in which it incurs a legal obligation associated with the retirement of tangible long-lived assets that results from acquisition, construction, development and/or normal use of the assets. The Company also records a corresponding asset, which is depreciated over the life of the tangible long-lived asset. Subsequent to the initial measurement of the asset retirement obligation, the obligation is adjusted at the end of each period to reflect the passage of time and changes in the estimated future cash flows underlying the obligation.
The Company records the retirement obligation on towers owned and cell site improvements where there is a legal obligation to remove the tower or cell site improvements and restore the site to its original condition, as required by certain operating leases and applicable zoning ordinances of certain jurisdictions, at the time the Company discontinues its use. The obligations are estimated and vary based on the size of the towers. The Company’s cost to remove the tower or cell site improvements is amortized over the life of the tower or cell site assets.
Changes in the liability for asset removal obligations for the years ended December 31, 2013, 2012 and 2011 are summarized below (in thousands):
|
|
2013
|
2012
|
2011
|
|||||||||
|
|
|
|||||||||||
|
Balance at beginning of year
|
$
|
5,896
|
$
|
7,610
|
$
|
6,542
|
||||||
|
Additional liabilities accrued
|
1,189
|
1,148
|
556
|
|||||||||
|
Changes to prior estimates
|
-
|
(2,265
|
)
|
-
|
||||||||
|
Payments made
|
(909
|
)
|
(846
|
)
|
-
|
|||||||
|
Accretion expense
|
309
|
249
|
512
|
|||||||||
|
Balance at end of year
|
$
|
6,485
|
$
|
5,896
|
$
|
7,610
|
||||||
Cost in excess of net assets of businesses acquired (goodwill) and intangible assets:
In connection with the acquisition of a business, a portion of the purchase price may be allocated to identifiable intangible assets with indefinite lives, such as franchise rights, and goodwill, which is the excess of the total purchase price over the fair values of the net tangible and identifiable intangible assets. Goodwill and intangible assets with indefinite lives are assessed annually, at November 30, for impairment and in interim periods if certain events occur indicating that the carrying value may be impaired. No impairments were required to be recorded in the year ended December 31, 2011. In the fourth quarter of 2012, the Company determined that goodwill in the Cable segment had become impaired, and an impairment charge of $11.0 million was recognized. The Company determined that no impairment of Cable segment franchise rights was required for the years ended December 31, 2013 or 2012. The fair value of cable franchise rights, which is determined by a “greenfield” analysis, was determined to exceed its $64.1 million carrying value by approximately $6.1 million at December 31, 2013, up from $3.4 million of excess fair value at December 31, 2012.
The following table presents the goodwill balance allocated by segment and changes in the balances for the years ended December 31, 2013 and 2012 (in thousands):
|
CATV
Segment
|
Wireline
Segment
|
Total
|
||||||||||
|
Balance as of December 31, 2011
|
$
|
10,952
|
$
|
10
|
$
|
10,962
|
||||||
|
Impairment recognized
|
(10,952
|
)
|
-
|
(10,952
|
)
|
|||||||
|
Balance as of December 31, 2012
|
$
|
-
|
$
|
10
|
$
|
10
|
||||||
|
No activity
|
-
|
-
|
-
|
|||||||||
|
Balance as of December 31, 2013
|
$
|
-
|
$
|
10
|
$
|
10
|
||||||
Intangible assets consist of the following at December 31, 2013 and 2012 (in thousands):
| 2013 |
2012
|
|||||||||||||||||||||||
|
Gross
Carrying
Amount
|
Accum-
ulated
Amort-
ization
|
Net
|
Gross
Carrying
Amount
|
Accum-
ulated
Amort-
ization
|
Net
|
|||||||||||||||||||
|
|
|
|
|
|
||||||||||||||||||||
|
Intangible assets subject to amortization:
|
||||||||||||||||||||||||
|
|
|
|
|
|
|
|||||||||||||||||||
|
Business contracts
|
$
|
2,069
|
$
|
(479
|
)
|
$
|
1,590
|
$
|
2,069
|
$
|
(354
|
)
|
$
|
1,715
|
||||||||||
|
Cable franchise rights
|
122
|
(122
|
)
|
-
|
122
|
(122
|
)
|
-
|
||||||||||||||||
|
Acquired subscriber base
|
32,325
|
(27,197
|
)
|
5,128
|
32,325
|
(23,206
|
)
|
9,119
|
||||||||||||||||
|
$
|
34,516
|
$
|
(27,798
|
)
|
$
|
6,718
|
$
|
34,516
|
$
|
(23,682
|
)
|
$
|
10,834
|
|||||||||||
|
Non-amortizing intangible assets:
|
||||||||||||||||||||||||
|
|
||||||||||||||||||||||||
|
Cable franchise rights
|
$
|
64,059
|
$
|
-
|
$
|
64,059
|
$
|
64,059
|
$
|
-
|
$
|
64,059
|
||||||||||||
|
Railroad crossing rights
|
39
|
-
|
39
|
39
|
-
|
39
|
||||||||||||||||||
|
$
|
64,098
|
$
|
-
|
$
|
64,098
|
$
|
64,098
|
$
|
-
|
$
|
64,098
|
|||||||||||||
|
Total intangibles
|
$
|
98,614
|
$
|
(27,798
|
)
|
$
|
70,816
|
$
|
98,614
|
$
|
(23,682
|
)
|
$
|
74,932
|
||||||||||
For the years ended December 31, 2013, 2012 and 2011, amortization expense related to intangible assets was approximately $4.1 million, $6.5 million and $10.4 million, respectively. During 2012, the Company determined that, beginning in early 2013, it would not continue to provide service under two franchises acquired in 2010, and the Company reclassified and began amortizing the franchise rights associated with these markets over the expected remaining period during which services would be provided.
Aggregate amortization expense for intangible assets for the periods shown is expected to be as follows:
|
Year Ending
December 31,
|
Amount
|
|||
|
|
(in thousands)
|
|||
|
2014
|
$
|
2,566
|
||
|
2015
|
1,411
|
|||
|
2016
|
943
|
|||
|
2017
|
514
|
|||
|
2018
|
196
|
|||
Retirement plans:
The Company maintains a Supplemental Executive Retirement Plan (“SERP”) for selected employees. This is an unfunded defined contribution plan. The Company created and funded a rabbi trust to hold assets equal to the liabilities under this plan. The Company ceased making employer contributions to this plan during 2010. Participant balances and earnings on them continue to be maintained for this plan.
The Company maintains a defined contribution 401(k) plan under which substantially all employees may defer a portion of their earnings on a pretax basis, up to the allowable federal maximum. The Company may make matching and discretionary contributions to this plan.
Neither the rabbi trust nor the defined contribution 401(k) plan directly holds Company stock in the plan’s portfolio.
Income taxes:
Income taxes are accounted for under the asset and liability method. Deferred tax assets and liabilities are recognized for the future tax consequences attributable to differences between financial statement carrying amounts of existing assets and liabilities and their respective tax bases. Deferred tax assets and liabilities are measured using enacted tax rates expected to apply to taxable income in the years in which those temporary differences are expected to be recovered or settled. The effect on deferred tax assets and liabilities of a change in tax rates is recognized in income in the period that includes the enactment date. The Company evaluates the recoverability of tax assets generated on a state-by-state basis from net operating losses apportioned to that state. Management uses a more likely than not threshold to make that determination and has concluded that at December 31, 2013 and 2012, a valuation allowance against certain state deferred tax assets is necessary, as discussed in Note 6.
Revenue recognition:
The Company recognizes revenue when persuasive evidence of an arrangement exists, services have been rendered or products have been delivered, the price to the buyer is fixed and determinable and collectability is reasonably assured. Revenues are recognized by the Company based on the various types of transactions generating the revenue. For services, revenue is recognized as the services are performed. For equipment sales, revenue is recognized when the sales transaction is complete.
Under the Sprint Management Agreement, postpaid wireless service revenues are reported net of an 8% Management Fee and a 12% Net Service Fee for 2011, 2012 and early 2013, retained by Sprint. The Net Service Fee increased to its 14% maximum effective August 1, 2013. Prepaid wireless service revenues are reported net of a 6% Management Fee retained by Sprint. See Note 7 for additional information about the Management Fee and Net Service Fee.
The Company enters into revenue arrangements that may involve multiple revenue-generating activities, i.e., the delivery or performance of multiple products, services, and/or rights to use assets. In accounting for these arrangements, separate contracts with the same party, entered into at or near the same time, will be presumed to be a bundled transaction, and the consideration will be measured and allocated to the separate units based on their relative fair values. The Company has evaluated each arrangement entered into by the Company for each sales channel, and the Company continues to monitor arrangements with its sales channels to determine if any changes in revenue recognition need to be made. Substantially all of the activation fee revenue recognized at the time a related wireless handset is sold is classified as equipment revenue.
Earnings per share:
Basic net income per share was computed on the weighted average number of shares outstanding. Diluted net income per share was computed under the treasury stock method, assuming the conversion as of the beginning of the period, for all dilutive stock options. Of 748 thousand, 661 thousand, and 503 thousand shares and options outstanding at December 31, 2013, 2012 and 2011, respectively, 129 thousand, 343 thousand and 352 thousand were anti-dilutive, respectively. These options have been excluded from the computation of diluted earnings per share shown below. There were no adjustments to net income in the computation of diluted earnings per share for any of the years presented.
The following tables show the computation of basic and diluted earnings per share for the years ended December 31, 2013, 2012 and 2011:
|
|
2013
|
2012
|
2011
|
|||||||||
|
|
|
|
|
|||||||||
|
Basic income per share
|
(in thousands, except per share amounts)
|
|||||||||||
|
Net income
|
$
|
29,586
|
$
|
16,303
|
$
|
12,993
|
||||||
|
Weighted average shares outstanding
|
24,001
|
23,877
|
23,781
|
|||||||||
|
Basic income per share
|
$
|
1.23
|
$
|
0.68
|
$
|
0.55
|
||||||
|
|
||||||||||||
|
Effect of stock options outstanding:
|
||||||||||||
|
Weighted average shares outstanding
|
24,001
|
23,877
|
23,781
|
|||||||||
|
Assumed exercise, at the strike price at the beginning of year
|
485
|
343
|
231
|
|||||||||
|
Assumed repurchase of shares under treasury stock method
|
(371
|
)
|
(201
|
)
|
(186
|
)
|
||||||
|
Diluted weighted average shares
|
24,115
|
24,019
|
23,826
|
|||||||||
|
Diluted income per share
|
$
|
1.23
|
$
|
0.68
|
$
|
0.55
|
||||||
Recently Issued Accounting Standards:
As of December 31, 2013, there were no recently issued but not yet effective accounting pronouncements that would have a material impact on the Company’s financial statements.
Note 2. Discontinued Operations
The Company announced its intention to sell its Converged Services operation in 2008. Subsequently, the assets and liabilities related to this operation have been presented as held for sale in the consolidated balance sheet, and its operating results have been presented as discontinued operations. Following a series of sales of properties during 2011 and 2012, the Company completed the disposition of all remaining properties during 2013.
Discontinued operations included the following amounts of operating revenue and loss before income taxes:
|
|
Years Ended December 31,
|
|||||||||||
|
|
2013
|
2012
|
2011
|
|||||||||
|
|
(in thousands)
|
|||||||||||
|
|
|
|
|
|||||||||
|
Operating revenues
|
$
|
-
|
$
|
1,091
|
$
|
10,516
|
||||||
|
Loss before income taxes
|
$
|
-
|
$
|
(496
|
)
|
$
|
(904
|
)
|
||||
Note 3. Investments
The Company has three classifications of investments: investments carried at fair value, investments carried at cost, and equity method investments. See Note 1 for definitions of each classification of investment.
At December 31, 2013 and 2012, investments carried at fair value consisted of:
|
|
2013
|
2012
|
||||||
|
|
(in thousands)
|
|||||||
|
Taxable bond funds
|
$
|
10
|
$
|
728
|
||||
|
Domestic equity funds
|
2,419
|
1,265
|
||||||
|
International equity funds
|
99
|
71
|
||||||
|
|
$
|
2,528
|
$
|
2,064
|
||||
Investments carried at fair value were acquired under a rabbi trust arrangement related to the Company’s SERP. The Company purchases investments in the trust to mirror the investment elections of participants in the SERP; gains and losses on the investments in the trust are reflected as increases or decreases in the liability owed to the participants. The Company recorded unrealized gains of $391 thousand and $191 thousand during 2013 and 2012, respectively. During 2011, the Company recorded unrealized losses of $132 thousand. Sales of investments resulted in the recognition of $1 thousand of realized losses in 2013, $66 thousand of realized gains in 2012 and $27 thousand of realized losses in 2011. Fair values for these investments are determined by quoted market prices (“level 1 fair values”) for the underlying mutual funds, which may be based upon net asset value.
At December 31, 2013 and 2012, other investments, comprised of equity securities which do not have readily determinable fair values, consist of the following:
|
|
2013
|
2012
|
||||||
|
Cost method:
|
(in thousands)
|
|||||||
|
CoBank
|
$
|
3,343
|
$
|
2,968
|
||||
|
Other
|
766
|
756
|
||||||
|
|
4,109
|
3,724
|
||||||
|
Equity method:
|
||||||||
|
Burton Partnership
|
2,365
|
2,086
|
||||||
|
Other
|
330
|
340
|
||||||
|
|
2,695
|
2,426
|
||||||
|
Total other investments
|
$
|
6,804
|
$
|
6,150
|
||||
The Company’s investment in CoBank increased $375 thousand and $221 thousand in the years ended December 31, 2013 and 2012, respectively, due to the ongoing patronage earned from the outstanding investment and loan balances the Company has with CoBank.
In the year ended December 31, 2013, the Company received distributions from its equity investments totaling $121 thousand in cash. Equity method investments had a net gain of $364 thousand in the year ended December 31, 2013, including $279 thousand from the Burton Partnership, a private equity fund.
The Company’s ownership interests in equity method investees were unchanged during 2013, except for a $36 thousand disposal of an investment included in Other.
Note 4. Property, Plant and Equipment
Property, plant and equipment consisted of the following at December 31, 2013 and 2012:
|
|
Estimated
|
|
|
||||||||
|
|
Useful Lives
|
2013
|
2012
|
||||||||
|
|
(in thousands)
|
||||||||||
|
Land
|
$
|
3,415
|
$
|
3,345
|
|||||||
|
Buildings and structures
|
10 – 40 years
|
96,700
|
75,664
|
||||||||
|
Cable and wire
|
4 – 40 years
|
187,293
|
175,833
|
||||||||
|
Equipment and software
|
2 –
16.7
years
|
346,072
|
331,374
|
||||||||
|
Plant in service
|
$
|
633,480
|
$
|
586,216
|
|||||||
|
Plant under construction
|
23,181
|
25,469
|
|||||||||
|
Total property, plant and equipment
|
656,661
|
611,685
|
|||||||||
|
Less accumulated amortization and depreciation
|
247,698
|
246,211
|
|||||||||
|
Property, plant and equipment, net
|
$
|
408,963
|
$
|
365,474
|
|||||||
The Company traded in certain base station PCS equipment for 4G LTE base station equipment in 2013 and 2012, and received credits of $14.5 million and $20.3 million, respectively, against the fair value purchase price of the new equipment. The Company adjusted depreciation on equipment to be traded in so that the net book value at trade-in approximated the credit to be received.
Note 5. Long-Term Debt and Revolving Lines of Credit
Total debt consists of the following at December 31, 2013 and 2012:
|
|
|
Interest Rate
|
|
|
|||||||||
|
|
|
2013
|
2012
|
||||||||||
|
|
|
|
(in thousands)
|
||||||||||
|
CoBank (term loan)
|
Fixed
|
7.37%
|
$
|
-
|
$
|
1,876
|
|||||||
|
CoBank Term Loan A
|
Variable
|
2.67%
|
230,000
|
230,000
|
|||||||||
|
Other debt
|
|
Various
|
-
|
101
|
|||||||||
|
|
|
230,000
|
231,977
|
||||||||||
|
Current maturities
|
|
5,750
|
1,977
|
||||||||||
|
Total long-term debt
|
|
$
|
224,250
|
$
|
230,000
|
||||||||
On September 14, 2012, the Company executed an Amended and Restated Credit Agreement with CoBank and with the participation of 16 additional Farm Credit institutions, for the purpose of refinancing the Company’s existing outstanding debt, funding capital expenditures to upgrade the Company’s wireless network in conjunction with Sprint’s wireless network upgrade project known as Network Vision, and other corporate needs.
The Amended and Restated Credit Agreement provides for three facilities, a Term Loan Facility, a Revolver Facility, and an Incremental Term Loan Facility. The Term Loan Facility had two parts, the Fixed Term Loan Facility and the Term Loan A Facility. The Fixed Term Loan Facility was repaid in August 2013. The Term Loan A Facility requires quarterly principal repayments of $5.75 million beginning on December 31, 2014, with the remaining expected balance of approximately $120.75 million due at maturity on September 30, 2019. The Term Loan A Facility bears interest at 30-day LIBOR, currently 0.17%, plus a spread determined by the Company’s Total Leverage Ratio, currently 2.50%. The spread decreased from 2.75% during the second quarter of 2013 based on improvements in the Company’s leverage ratio at March 31, 2013. The Company may elect to use rates other than the 30-day LIBOR as the base, but does not currently expect to do so.
The Revolver Facility provides for $50 million in immediate availability for future capital expenditures and general corporate needs. In addition, the Credit Agreement permits the Company to enter into one or more Incremental Term Loan Facilities, or to increase the Revolver Facility, in the aggregate principal amount not to exceed $100 million subject to compliance with certain covenants. No draw has been made or is currently contemplated under either of these facilities. When and if a draw is made, the maturity date and interest rate options would be substantially identical to the Term Loan A Facility. Repayment provisions would be agreed to at the time of each draw under the Incremental Term Loan Facility.
The Credit Agreement contains affirmative and negative covenants customary to secured credit facilities, including covenants restricting the ability of the Company and its subsidiaries, subject to negotiated exceptions, to incur additional indebtedness and additional liens on their assets, engage in mergers or acquisitions, dispose of assets, pay dividends or make other distributions, voluntarily prepay other indebtedness, enter into transactions with affiliated persons, make investments, and change the nature of the Company’s and its subsidiaries’ businesses.
Indebtedness outstanding under any of the facilities may be accelerated by an Event of Default, as defined in the Credit Agreement.
The Facilities are secured by a pledge by the Company of its stock in its subsidiaries, a guarantee by the Company’s subsidiaries other than Shenandoah Telephone Company or Shentel Converged Services, Inc., and a security interest in all of the assets of the guarantors.
The Company is subject to certain financial covenants to be measured on a trailing twelve month basis each calendar quarter unless otherwise specified. These covenants include:
| · | a limitation on the Company’s total leverage ratio, defined as indebtedness divided by earnings before interest, taxes, depreciation and amortization, or EBITDA, of less than or equal to 3.00 to 1.00 from the closing date through March 31, 2014, then 2.50 to 1.00 from April 1, 2014 through March 31, 2015, and 2.00 to 1.00 thereafter; |
| · | a minimum debt service coverage ratio, defined as EBITDA divided by the sum of all scheduled principal payments on the Term Loans and regularly scheduled principal payments on other indebtedness plus cash interest expense, greater than 2.50 to 1.00 at all times; |
| · | a minimum equity to assets ratio, defined as consolidated total assets minus consolidated total liabilities, divided by consolidated total assets, of at least 0.30 to 1.00 from the amendment date through December 31, 2013; then at least 0.325 to 1.00 through December 31, 2014, and at least 0.35 to 1.00 thereafter, measured at each fiscal quarter end; |
The Amended and Restated Credit Agreement required the Company to obtain interest rate protection within 90 days of the amendment date for at least 33% of the aggregate principal balance of the Term Loan A then outstanding, for not less than three years after such date. In September 2012, the Company entered into a pay fixed, receive variable interest rate swap (the 2012 swap) agreement covering approximately 76% of the outstanding principal of the Term Loan A balance through its maturity. The 2012 swap fixes the effective rate on this portion of the debt at 1.13% over our margin, currently 2.50%, for an effective fixed rate of 3.63% at December 31, 2013. The Company has applied hedge accounting to this swap agreement. The Company also had an existing pay fixed, receive variable interest rate swap agreement (the 2010 swap). This agreement was executed in 2010 and expired in July 2013. The Company did not elect to apply hedge accounting to the 2010 swap.
During 2012, the Company wrote-off approximately $0.8 million, pre-tax, of existing unamortized transaction costs as a result of replacing certain lenders from the original credit agreement.
As of December 31, 2013, the Company was in compliance with the financial covenants in its credit agreements.
The aggregate maturities of long-term debt for each of the five years subsequent to December 31, 2013 are as follows:
|
Year
|
Amount
|
|||
|
|
(in thousands)
|
|||
|
2014
|
$
|
5,750
|
||
|
2015
|
23,000
|
|||
|
2016
|
23,000
|
|||
|
2017
|
23,000
|
|||
|
2018
|
23,000
|
|||
|
Later years
|
132,250
|
|||
|
|
$
|
230,000
|
||
The Company has no fixed rate debt instruments as of December 31, 2013. The estimated fair value
of fixed rate debt instruments a
s of December 31, 2012 was approximately equal to its carrying value, given the short remaining term to maturity. The estimated fair value of the variable rate debt approximates its carrying value. The fair value of the Company’s interest rate swaps was an asset of $4.3 million and a liability of $1.7 million at December 31, 2013 and December 31, 2012, respectively.
The Company receives patronage credits from CoBank and certain of its affiliated Farm Credit institutions, which are not reflected in the stated rates shown above. Patronage credits are a distribution of profits of CoBank as approved by its Board of Directors.
During both the first quarters of 2013 and 2012, the Company received patronage credits on its outstanding CoBank debt balance. The Company accrued $1.4 million in the year ended December 31, 2013, in anticipation of the early 2014 distribution of the credits by CoBank. Patronage credits have historically been paid in a mix of cash and shares of CoBank stock. The 2013 payout mix was 75% cash and 25% shares.
Note 6. Income Taxes
Total income taxes for the years ended December 31, 2013, 2012 and 2011 were allocated as follows:
|
|
2013
|
2012
|
2011
|
|||||||||
|
|
(in thousands)
|
|||||||||||
|
Income tax expense on continuing operations
|
$
|
19,878
|
$
|
12,008
|
$
|
10,667
|
||||||
|
Income tax benefit on discontinued operations
|
-
|
(196
|
)
|
(359
|
)
|
|||||||
|
Shareholders’ equity, for compensation expense for tax purposes in excess of amounts recognized for financial reporting purposes
|
(101
|
)
|
(106
|
)
|
(5
|
)
|
||||||
|
Other comprehensive income for changes in cash flow hedge
|
2,315
|
(574
|
)
|
|||||||||
|
|
$
|
22,092
|
$
|
11,132
|
$
|
10,303
|
||||||
The Company and its subsidiaries file income tax returns in several jurisdictions. The provision for the federal and state income taxes attributable to income from continuing operations consists of the following components:
|
|
Years Ended December 31,
|
|||||||||||
|
|
2013
|
2012
|
2011
|
|||||||||
|
|
(in thousands)
|
|||||||||||
|
Current expense (benefit)
|
|
|
|
|||||||||
|
Federal taxes
|
$
|
3,404
|
$
|
3,741
|
$
|
(8,539
|
)
|
|||||
|
State taxes
|
2,305
|
1,868
|
3,233
|
|||||||||
|
Total current provision (benefit)
|
5,709
|
5,609
|
(5,306
|
)
|
||||||||
|
Deferred expense (benefit)
|
||||||||||||
|
Federal taxes
|
12,317
|
5,618
|
15,749
|
|||||||||
|
State taxes
|
1,852
|
781
|
224
|
|||||||||
|
Total deferred provision
|
14,169
|
6,399
|
15,973
|
|||||||||
|
Income tax expense on continuing operations
|
$
|
19,878
|
$
|
12,008
|
$
|
10,667
|
||||||
A reconciliation of income taxes determined by applying the federal and state tax rates to income from continuing operations is as follows for the years ended December 31, 2013, 2012 and 2011:
|
|
Years Ended December 31,
|
|||||||||||
|
|
2013
|
2012
|
2011
|
|||||||||
|
|
(in thousands)
|
|||||||||||
|
Computed “expected” tax expense (35%)
|
$
|
17,312
|
$
|
10,014
|
$
|
8,472
|
||||||
|
State income taxes, net of federal tax effect
|
2,702
|
1,722
|
2,247
|
|||||||||
|
Other, net
|
(136
|
)
|
272
|
(52
|
)
|
|||||||
|
Income tax expense on continuing operations
|
$
|
19,878
|
$
|
12,008
|
$
|
10,667
|
||||||
The effective rates vary among the years presented primarily due to state income taxes. Changes in the mix of income and/or losses among the Company’s subsidiaries, which file separate state returns for various states, result in variations in the effective tax rates. Furthermore, the Company completed a legal entity restructuring during the year ended December 31, 2012 that reduced the effective tax rate from the prior year.
Net deferred tax assets and liabilities consist of the following at December 31, 2013 and 2012:
|
|
2013
|
2012
|
||||||
|
|
(in thousands)
|
|||||||
|
Deferred tax assets:
|
|
|||||||
|
Lease obligations
|
$
|
2,139
|
$
|
1,374
|
||||
|
Deferred activation charges
|
107
|
105
|
||||||
|
Allowance for doubtful accounts
|
370
|
441
|
||||||
|
Inventory reserves
|
259
|
244
|
||||||
|
State net operating loss carry-forwards, net of federal tax
|
650
|
782
|
||||||
|
Accrued pension costs
|
1,018
|
879
|
||||||
|
Loss on investments, net
|
-
|
438
|
||||||
|
Accrued compensation costs
|
1,140
|
996
|
||||||
|
Asset retirement obligations
|
2,601
|
2,356
|
||||||
|
Intangible assets
|
7,757
|
7,966
|
||||||
|
Goodwill
|
2,660
|
4,091
|
||||||
|
Deferred revenues
|
1,873
|
1,401
|
||||||
|
Other, net
|
-
|
549
|
||||||
|
Total gross deferred tax assets
|
20,574
|
21,622
|
||||||
|
Less valuation allowance
|
(591
|
)
|
(538
|
)
|
||||
|
Net deferred tax assets
|
19,983
|
21,084
|
||||||
|
|
||||||||
|
Deferred tax liabilities:
|
||||||||
|
Plant and equipment
|
$
|
84,772
|
72,747
|
|||||
|
Franchise rights
|
5,942
|
4,211
|
||||||
|
Section 481a deferred revenues
|
493
|
737
|
||||||
|
Deferred financing costs
|
128
|
453
|
||||||
|
Prepaid insurance
|
241
|
-
|
||||||
|
Gain on investments, net
|
115
|
-
|
||||||
|
Other, net
|
1,876
|
-
|
||||||
|
Total gross deferred tax liabilities
|
93,567
|
78,148
|
||||||
|
Net deferred tax liabilities
|
$
|
73,584
|
$
|
57,064
|
||||
In assessing the ability to realize deferred tax assets, management considers whether it is more likely than not that some portion or all of the deferred tax assets will not be realized. The ultimate realization of deferred tax assets is dependent upon generating future taxable income during the periods in which those temporary differences become deductible. Management considers the scheduled reversal of deferred tax liabilities, projected future taxable income and tax planning strategies in making this assessment. Based upon the level of historical taxable income and projections for future taxable income over the periods for which the deferred tax assets are deductible, management believes it more likely than not that the state net operating loss carry-forwards from its Converged Services segment will not be realized. The Company has a deferred tax asset of $650 thousand related to various state net operating losses, and carries this asset at $59 thousand, net of the valuation allowance of $591 thousand.
As of December 31, 2013 and 2012, the Company had no unrecognized tax benefits. It is the Company’s policy to record interest and penalties related to unrecognized tax benefits in income before taxes.
The Company files U.S. federal income tax returns and various state and local income tax returns. With few exceptions, years prior to 2010 are no longer subject to examination. The Company is under audit in the state of Maryland for the 2009, 2010 and 2011 tax years, and in the state of Pennsylvania for the 2009 tax year. No other state or federal income tax audits were in process as of December 31, 2013.
Note 7. Significant Contractual Relationship
In 1999, the Company executed a Management Agreement (the “Agreement”) with Sprint whereby the Company committed to construct and operate a PCS network using CDMA air interface technology. Under the Agreement, the Company was the exclusive PCS Affiliate of Sprint providing wireless mobility communications network products and services on the 1900 MHz band in its territory which extends from Altoona, York and Harrisburg, Pennsylvania, and south along the Interstate 81 corridor through Western Maryland, the panhandle of West Virginia, to Harrisonburg, Virginia. The Company is authorized to use the Sprint brand in its territory, and operate its network under Sprint’s radio spectrum licenses. As an exclusive PCS Affiliate of Sprint, the Company has the exclusive right to build, own and maintain its portion of Sprint’s nationwide PCS network, in the aforementioned areas, to Sprint’s specifications. The initial term of the Agreement was for 20 years and was automatically renewable for three 10-year options, unless terminated by either party under provisions outlined in the Agreement. Upon non-renewal by either party, the Company has either the right or the obligation to sell the business at 80% of “Entire Business Value” (“EBV”) as defined in the Agreement. EBV is defined as i) the fair market value of a going concern paid by a willing buyer to a willing seller; ii) valued as if the business will continue to utilize existing brands and operate under existing agreements; and, iii) valued as if Manager (Shentel) owns the spectrum. Determination of EBV is made by an independent appraisal process.
The Agreement has been amended numerous times, most recently during 2013.
During
2010, the Company acquired the right to receive a share of revenues from approximately 50,000 Virgin Mobile customers in our service area and began selling Virgin Mobile and Boost prepaid products and services
in its PCS network coverage area. Prepaid revenues received from Sprint are reported gross of expenses passed through from Sprint. The Company pays handset subsidies to Sprint for the difference between the selling price of handsets and their cost, in the aggregate and as a net cost. Many of the revenue and expense components reported to us by Sprint are based on Sprint’s national averages for prepaid services, rather than being specifically determined by customers homed in our geographic service areas. In December 2012, Sprint paid the Company $11.8 million to reimburse the Company for handset subsidies and other costs per gross add that had been calculated incorrectly by Sprint from inception of the prepaid program through September 30, 2012.
The Company recognizes amortization on the $6.9 million capitalized purchase price of the acquired subscriber base for the 50,000 acquired Virgin Mobile subscribers. The amortization of the acquired subscriber base will approximate the life of the customers acquired, gradually decreasing over the expected four year life of this asset.
During 2012, the Company
amended its Agreement with Sprint in order to build a 4G LTE network in the Company’s service area. The Company is mirroring Sprint’s Network Vision architecture using Alcatel Lucent equipment. During 2012, the Company upgraded 224 cell sites to the new technology, and during 2013, completed upgrades to substantially all of its 526 base stations.
In addition to adding 4G services to the Company’s network, the Company received access to additional 1900 and 800 MHz spectrum, extended the initial term of the contract five years from 2019 to 2024 and increased the cap on the Net Service Fee. Effective August 1, 2013, the Net Service Fee increased to its 14% maximum.
During 2013, the Company amended its Agreement with Sprint in order to allow Sprint to recover the capital costs incurred in providing the Company hardware and software components of the network. These components control and direct LTE traffic between LTE devices in the Company’s service area and the internet, in order to assure interoperability of the Company’s network with Sprint’s PCS network. The Company pays a one-time fee of $9.23 per LTE device activated in the Company’s service area. The Company incurred $1.3 million of these fees during 2013.
Under the Sprint agreements, Sprint provides the Company significant support services such as customer service, billing, collections, long distance, national network operations support, inventory logistics support, use of the Sprint brand names, national advertising, national distribution and product development. Cost of equipment transactions between the Company and Sprint relate to inventory purchased and subsidized costs of handsets. These costs also included transactions related to subsidized costs on handsets and commissions paid to Sprint for sales of handsets through Sprint’s national distribution programs.
The Company's PCS subsidiary is dependent upon Sprint’s ability to execute certain functions such as billing, customer care, collections and other operating activities under the Company's agreements with Sprint. Due to the high degree of integration within many of the Sprint systems, and the Company’s dependency on these systems, in many cases it would be difficult for the Company to perform these services in-house or to outsource the services to another provider. If Sprint is unable to perform any such service, the change could result in increased operating expenses and have an adverse impact on the Company's operating results and cash flow. In addition, the Company's ability to attract and maintain a sufficient customer base is critical to generating positive cash flow from operations and profits for its PCS operation. Changes in technology, increased competition, or economic conditions in the wireless industry or the economy in general, individually and/or collectively, could have an adverse effect on the Company's financial position and results of operations.
The Sprint agreements require the Company to maintain certain minimum network performance standards and to meet other performance requirements. The Company was in compliance in all material respects with these requirements as of December 31, 2013.
Note 8. Related Party Transactions
ValleyNet, an equity method investee of the Company, resells capacity on the Company’s fiber network under an operating lease agreement. Facility lease revenue from ValleyNet was approximately $3.0 million, $3.2 million and $3.1 million in the years ended December 31, 2013, 2012 and 2011, respectively. At December 31, 2013 and 2012, the Company had accounts receivable from ValleyNet of approximately $0.2 million and $0.3 million, respectively. The Company's PCS operating subsidiary leases capacity through ValleyNet. Payment for usage of these facilities was $1.7 million, $0.8 million and $0.8 million in the years ended December 31, 2013, 2012 and 2011, respectively.
Note 9. Retirement Plans
The Company maintains a defined contribution 401(k) plan. The Company's matching and employer discretionary contributions to the defined contribution 401(k) plan were approximately $2.3 million, $2.4 million and $1.9 million for the years ended December 31, 2013, 2012 and 2011, respectively.
The Company maintains an unfunded, nonqualified Supplemental Executive Retirement Plan (the “SERP”) for named executives. In 2010, the Company curtailed future participation in the SERP. Current participants may remain in the SERP and continue to earn returns (either gains or losses) on invested balances, but the Company will make no further contributions to the SERP and no new participants will be eligible to join the SERP.
At December 31, 2013 and 2012, the total liability due to participants in the SERP was $2.5 million and $2.1 million, respectively.
In order to provide some protection to the participants, the Company created a rabbi trust to hold assets sufficient to pay obligations under the SERP. Assets within the trust were invested to mirror participant elections as to investment options (a mix of stock and bond mutual funds); investment income, gains and losses in the trust were used to determine investment returns on the participants’ balances in the SERP.
Note 10. Stock Incentive Plans
The Company maintained two shareholder-approved Company Stock Incentive Plans providing for the grant of equity based incentive compensation to essentially all employees. The 1995 Plan authorized grants of up to 1,440,000 shares of common stock over a ten-year period beginning in 1996. The term of the 1995 Plan expired in February of 2006, and the last outstanding award of options was exercised in 2012. The 2005 Plan authorizes grants of up to 1,440,000 shares over a ten-year period beginning in 2005. Under both Plans, grants may take the form of stock awards, awards of options to acquire stock, stock appreciation rights, and other forms of equity based compensation; both options to acquire stock and stock awards were granted. The option price for all grants has been the current market price at the time of the grant.
Option Awards
During 2013, 2012 and 2011, the Company granted stock options to certain management employees. These grants consisted of incentive and non-qualified stock options, vesting 25% annually on the first through fourth anniversaries of the grant date, and having a maximum ten year life. Options granted prior to 2010 had various vesting schedules and maximum lives. In addition, during 2013 the Company granted stock options to a recently hired officer. This grant consisted of both incentive and non-qualified stock options, vesting 25% annually on the third, fourth, fifth and sixth anniversaries of the grant date, and having a maximum seven year life. These grants were accounted for as equity-classified stock options.
The fair values of these grants were estimated at the respective grant dates using a Black-Scholes option-pricing model with the following assumptions (for 2013, the assumptions shown represent the weighted average of the two valuations):
|
|
2013
|
2012
|
2011
|
|
Dividend rate
|
2.38%
|
3.05%
|
1.99%
|
|
Risk-free interest rate
|
1.15%
|
1.22%
|
2.73%
|
|
Expected lives of options
|
6.14 years
|
6.25 years
|
6.25 years
|
|
Price volatility
|
40.66%
|
38.80%
|
38.45%
|
Volatility is based on the historical volatility of the price of the Company’s stock over the expected term of the options. The expected term represents the period of time that the options granted are expected to be outstanding. The risk free rate is based on the U.S. Treasury yield curve, in effect at the date the fair value of the options is calculated, with an equivalent term.
Management has made an estimate of expected forfeitures and recognizes compensation costs only for those awards expected to vest.
Compensation cost recognized in 2013, 2012 and 2011 totaled $
612
thousand, $561 thousand and $601 thousand, respectively, and the income tax benefit for option-based compensation arrangements recognized in 2013, 2012 and 2011 was $
134
thousand, $129 thousand and $80 thousand, respectively.
A summary of outstanding options at December 31, 2013, 2012 and 2011, and changes during the years ended on those dates, is as follows:
|
|
Options
|
Weighted
Average Grant
Price Per Option
|
Fair Value Per Option
|
|||||||||
|
|
|
|
|
|||||||||
|
Outstanding December 31, 2010
|
341,108
|
19.69
|
|
|||||||||
|
|
|
|||||||||||
|
Granted
|
81,343
|
16.58
|
$
|
5.62
|
||||||||
|
Cancelled
|
(10,557
|
)
|
21.87
|
|||||||||
|
Exercised
|
(5,000
|
)
|
7.34
|
|||||||||
|
Outstanding December 31, 2011
|
406,894
|
$
|
19.16
|
|||||||||
|
|
||||||||||||
|
Granted
|
151,522
|
10.82
|
$
|
3.02
|
||||||||
|
Cancelled
|
(8,728
|
)
|
25.26
|
|||||||||
|
Exercised
|
(55,000
|
)
|
7.34
|
|||||||||
|
Outstanding December 31, 2012
|
494,688
|
$
|
17.82
|
|||||||||
|
|
||||||||||||
|
Granted
|
133,048
|
13.84
|
$
|
4.33
|
||||||||
|
Cancelled
|
(10,591
|
)
|
25.26
|
|||||||||
|
Exercised
|
(66,638
|
)
|
16.82
|
|||||||||
|
Outstanding December 31, 2013
|
550,507
|
$
|
16.71
|
|||||||||
There were options for 553,514 shares outstanding at December 31, 2013 at a weighted average exercise price of $16.76 per share, an aggregate intrinsic value of $4.9 million and a weighted-average remaining contractual life of 6.3 years. There were options for 217,156 shares exercisable at December 31, 2013 at a weighted average exercise price of $20.49 per share, an aggregate intrinsic value of $1.1 million and a weighted-average remaining contractual life of 4.3 years.
The aggregate intrinsic value represents the total pretax intrinsic value of in-the-money options, based on the Company’s closing stock price of $25.67 as of December 31, 2013.
During 2013, the total fair value of options vested
was $0.6 million
; the total intrinsic value of options exercised was
$0.3 million
.
The total cash received as a result of employee stock option exercises was $1.2 million. The tax benefit realized from these exercises was $0.1 million.
As of December 31, 2013, the total compensation cost related to
non-vested options not yet recognized is $0.6 million, which will be recognized over a weighted-average period of 3.1 years
.
Stock Awards
In September 2007, the Company granted 68,130 performance shares to all members of the Board of Directors and essentially all employees during 2007. Directors and senior management in the aggregate were granted 23,404 performance shares (“management shares”); all other employees in the aggregate were granted 44,726 performance shares (“employee shares”). Management shares can vest at the fifth, sixth, seventh or eighth anniversary of the grant date if, for the thirty day period ending on the day prior to the respective anniversary date, the average closing price of a share of the Company’s common stock exceeds a defined target price. The target price for each anniversary date is equal to the grant date market price ($20.50 per share) plus $1.64 for each year since the grant date. Shares will vest only if the target price is achieved and the recipient has remained employed through, or reached normal retirement age before, the anniversary date that the target price is achieved on. No shares have vested under these awards. In September 2013, employee shares expired without vesting and were cancelled.
The Company estimated expected forfeitures of 40% for management shares and 35% for employee shares. During 2011, the Company revised its estimate of management share forfeitures to 15%, adding $48 thousand to recorded compensation expense. During 2013, the Company finalized its adjustment for employee share forfeitures to 39%, which lowered recorded compensation expense by $40 thousand.
In June 2010, the Company made grants of 34,142 non-vested shares to 16 management employees. The shares vest 25% annually. The award was valued at the market price of the Company’s common stock on the date of grant ($16.50 per share). The Company also made a grant of 7,272 non-vested shares to the non-employee members of the Company’s Board of Directors, valued at the market price of the Company’s common stock on the grant date ($16.50 per share). The shares vest 33% annually.
In February 2011, 2012 and 2013 the Company made grants of 54,075 and 66,384 and 62,283 non-vested shares to 18, 17 and 18 management employees, respectively. The shares vest 25% annually. The awards were valued at the market price of the Company’s common stock on the date of grant ($16.58, $10.82 and $13.84 per share, respectively). The Company also made grants of non-vested shares to the non-employee members of the Company’s Board of Directors. The Company granted 8,448, 14,784 and 11,560 shares in 2011, 2012 and 2013, respectively, valued at the market price of the Company’s common stock on the grant date ($16.58, $10.82 and $13.84 per share, respectively). The shares vest 33% annually.
In April 2011, May 2012 and May 2013, the Company made grants of non-vested shares to selected other employees. The Company granted 16,184 shares, of which 8,159 were vested and distributed immediately, in April 2011; granted 38,186 shares, of which 14,040 were vested and distributed immediately, in May 2012; and granted 24,843 shares, of which 9,567 were vested and distributed immediately, in May 2013. The remaining shares in each award vest in various schedules over four years. The awards were valued at the market price of the Company’s common stock on the date of grant ($18.06, $10.51 and $17.48 per share in 2011, 2012 and 2013, respectively).
A summary of outstanding share grants at December 31, 2013, 2012, and 2011, and changes during the years ended on those dates, is as follows:
|
|
Shares
|
|||
|
|
|
|||
|
Outstanding December 31, 2010
|
94,100
|
|||
|
|
||||
|
Granted
|
78,707
|
|||
|
Cancelled
|
(6,733
|
)
|
||
|
Vested and issued
|
(18,931
|
)
|
||
|
Outstanding December 31, 2011
|
147,143
|
|||
|
|
||||
|
Granted
|
119,354
|
|||
|
Cancelled
|
(8,098
|
)
|
||
|
Vested and issued
|
(45,045
|
)
|
||
|
Outstanding December 31, 2012
|
213,354
|
|||
|
|
||||
|
Granted
|
98,686
|
|||
|
Cancelled
|
(30,994
|
)
|
||
|
Vested and issued
|
(67,956
|
)
|
||
|
Outstanding December 31, 2013
|
213,090
|
|||
Compensation cost recognized for share awards during 2013, 2012 and 2011, was $1.3 million, $1.3 million and $1.1 million, respectively. The income tax benefit for share-based compensation arrangements
was $0.5
million, $0.3 million, and $0.4 million for 2013, 2012 and 2011.
As of December 31, 2013, the total compensation cost related to non-vested share awards not yet recognized is $1.9 million which will be recognized over a weighted-average period
of 2.4 years
.
Note 11. Major Customer
The Company has one major customer relationship that is a significant source of revenue. Approximately
59
% of total operating revenues for the years ended December 31, 2013 and December 31, 2012, and 57% of total operating revenues for the year ended December 31, 2011, were generated by or through Sprint and its customers using the Company's portion of Sprint’s nationwide PCS network. No other customer relationship generated more than
1.5%
of the Company’s total operating revenues for the years ended December 31, 2013, 2012 or 2011.
Note 12. Shareholder Rights Plan
Effective as of February 8, 2008, the Board of Directors adopted a Shareholder Rights Plan (the “Plan”) to replace an expiring plan which was adopted in 1998. Under certain circumstances, holders of each right (granted at one right per share of outstanding common stock) will be entitled to purchase for $40 one half a share of the Company’s common stock (or, in certain circumstances, $80 worth of cash, property or other securities of the Company for $40). The rights are neither exercisable nor traded separately from the Company’s common stock. The rights are only exercisable if a person or group becomes or attempts to become, the beneficial owner of 15% or more of the Company’s common stock. Under the terms of the Plan, such a person or group would not be entitled to the benefits of the rights. The Plan provides that the Board of Directors may redeem the outstanding rights at any time for $.001 per right, and except with respect to the redemption price of the rights, any of the provisions of the Rights Agreement may be amended by the Board of Directors of the Company. The Plan provides for the Board of Directors to appoint a committee (the “TIDE Committee”) that is comprised of independent directors of the Company to review and evaluate the Shareholder Rights Plan in order to consider whether it continues to be in the interest of the Company and its shareholders at least every three years. Following each such review, the TIDE Committee will communicate its conclusions to the full Board of Directors, including any recommendation as to whether the Plan should be modified or the Rights should be redeemed. In January 2014, the TIDE Committee recommended to the full Board of Directors, and the Board of Directors approved, that the Plan be maintained as originally adopted.
Note 13. Lease Commitments
The Company leases land, buildings and tower space under various non-cancelable agreements, which expire between the years 2014 and 2039 and require various minimum annual rental payments.
These leases typically include renewal options and escalation clauses. In general, tower leases have five or ten year initial terms with four renewal terms of five years each.
The other leases generally contain certain renewal options for periods ranging from five to twenty years.
Future minimum lease payments under non-cancelable operating leases, including renewals that are reasonably assured at the inception of the lease, with initial variable lease terms in excess of one year as of December 31, 2013, are as
follows:
|
Year Ending
|
Amount
|
|||
|
(in thousands)
|
||||
|
2014
|
$
|
13,114
|
||
|
2015
|
13,120
|
|||
|
2016
|
13,048
|
|||
|
2017
|
13,187
|
|||
|
2018
|
12,872
|
|||
|
2019 and beyond
|
75,478
|
|||
|
|
$
|
140,819
|
||
The Company’s total rent expense was $
15.6
million, $13.1 million, and $12.4 million for the years ended December 31, 2013, 2012 and 2011, respectively.
As lessor, the Company has leased buildings, tower space and telecommunications equipment to other entities under various non-cancelable agreements, which require various minimum annual payments. The total minimum rental receipts at December 31, 2013 are as follows:
|
Year Ending
|
Amount
|
|||
|
|
(in thousands)
|
|||
|
2014
|
$
|
5,038
|
||
|
2015
|
4,523
|
|||
|
2016
|
2,968
|
|||
|
2017
|
2,005
|
|||
|
2018
|
727
|
|||
|
2019 and beyond
|
1,037
|
|||
|
|
$
|
16,298
|
||
The Company’s total rent income was $5.6 million, $6.1 million, and $6.1 million for the years ended December 31, 2013, 2012 and 2011, respectively. Total rent income includes month-to-month leases which are excluded from the table above. During 2013, rent income was reduced by a $0.8 million write-off of straight-line rent assets associated with the termination of iDEN leases. The termination of these leases resulted in a decrease in total minimum rental receipts for all years in the table above.
Note 14.
Derivative Instruments and Hedging Activities
The Company’s objectives in using interest rate derivatives are to add stability to cash flows and to manage its exposure to interest rate movements. To accomplish this objective, the Company primarily uses interest rate swaps as part of its interest rate risk management strategy. Interest rate swaps (both those designated as cash flow hedges as well as those not designated as cash flow hedges) involve the receipt of variable-rate amounts from a counterparty in exchange for the Company making fixed-rate payments over the life of the agreements without exchange of the underlying notional amount.
In August 2010, the Company entered into a pay fixed, receive variable interest rate swap of $63.3 million of notional principal. This interest rate swap was not designated as a cash flow hedge. Changes in the fair value of interest rate swaps not designated as cash flow hedges were recorded in interest expense each reporting period. The total outstanding notional amount of interest rate swaps not designated as cash flow hedges was $52.2 million as of December 31, 2012. This swap expired in July 2013. Changes in fair value recorded in interest expense for the years ended December 31, 2013 and 2012, were decreases of $239 thousand and $213 thousand, respectively.
The Company entered into a pay fixed, receive variable interest rate swap of $174.6 million of notional principal in September 2012. This interest rate swap was designated as a cash flow hedge. The total outstanding notional amount of cash flow hedges was $174.6 million as of December 31, 2013 and 2012.
The effective portion of changes in the fair value of interest rate swaps designated and that qualify as cash flow hedges is recorded in accumulated other comprehensive income and is subsequently reclassified into earnings in the period that the hedged forecasted transaction affects earnings. The Company uses its derivatives to hedge the variable cash flows associated with existing variable-rate debt. The ineffective portion of the change in fair value of the derivative is recognized directly in earnings through interest expense. No hedge ineffectiveness was recognized during any of the periods presented.
Amounts reported in accumulated other comprehensive income related to the interest rate swap designated and that qualify as cash flow hedges are reclassified to interest expense as interest payments are accrued on the Company’s variable-rate debt. As of December 31, 2013, the Company estimates that $1.6 million will be reclassified as an increase to interest expense during the next twelve months due to the interest rate swap since the hedge interest rate exceeds the variable interest rate on the debt.
The table below presents the fair value of the Company’s derivative financial instruments as well as its classification on the consolidated balance sheet as of December 31, 2013 and 2012 (in thousands; amounts in parentheses indicate debits):
|
|
|
|||||||||||
|
|
|
Fair Value as of
|
||||||||||
|
|
Balance Sheet
|
December 31,
|
December 31,
|
|||||||||
|
Location
|
2013
|
2012
|
||||||||||
|
Derivatives not designated as hedging instruments:
|
|
|
||||||||||
|
Interest rate swaps
|
Accrued liabilities
and other
|
$
|
-
|
$
|
239
|
|||||||
|
Total derivatives not designated as cash flow hedges
|
$
|
-
|
$
|
239
|
||||||||
|
|
||||||||||||
|
Derivatives designated as hedging instruments:
|
||||||||||||
|
Interest rate swaps
|
Accrued liabilities
and other
|
$
|
1,590
|
$
|
1,613
|
|||||||
|
|
Deferred charges and other assets, net
|
(5,926
|
)
|
(177
|
)
|
|||||||
|
Total derivatives designated as hedging instruments
|
$
|
(4,336
|
)
|
$
|
1,436
|
|||||||
The fair value of interest rate swaps is determined using a pricing model with inputs that are observable in the market (level 2 fair value inputs).
The table below presents changes in accumulated other comprehensive income by component for the twelve months ended December 31, 2013 (in thousands; amounts in parentheses indicate debits):
|
|
Gains and
(Losses) on
Cash Flow
Hedges
|
Income
Taxes
|
Accumulated
Other Comprehensive Income (Loss)
|
|||||||||
|
|
|
|
|
|||||||||
|
Balance as of December 31, 2012
|
$
|
(1,436
|
)
|
$
|
573
|
$
|
(863
|
)
|
||||
|
Other comprehensive income before reclassifications
|
4,111
|
(1,647
|
)
|
2,464
|
||||||||
|
Amounts reclassified from accumulated other comprehensive income (to interest expense)
|
1,661
|
(668
|
)
|
993
|
||||||||
|
Net current period other comprehensive income
|
5,772
|
(2,315
|
)
|
3,457
|
||||||||
|
Balance as of December 31, 2013
|
$
|
4,336
|
$
|
(1,742
|
)
|
$
|
2,594
|
|||||
Note 15. Segment Reporting
Operating segments are defined as components of an enterprise about which separate financial information is available that is evaluated regularly by the chief operating decision makers. The Company has three reportable segments, which the Company operates and manages as strategic business units organized by lines of business: (1) Wireless, (2) Cable, and (3) Wireline. A fourth segment, Other, primarily includes Shenandoah Telecommunications Company, the parent holding company.
The Wireless segment provides digital wireless service to a portion of a four-state area covering the region from Harrisburg, York and Altoona, Pennsylvania, to Harrisonburg, Virginia, as a Sprint PCS Affiliate of Sprint. This segment also owns cell site towers built on leased land, and leases space on these towers to both affiliates and non-affiliated service providers.
The Cable segment provides video, internet and voice services in Virginia, West Virginia and Maryland, and leases fiber optic facilities throughout its service area.
The Wireline segment provides regulated and unregulated voice services, DSL internet access, and long distance access services throughout Shenandoah County and portions of Rockingham, Frederick, Warren and Augusta counties in Virginia, and leases fiber optic facilities throughout the northern Shenandoah Valley of Virginia, northern Virginia and adjacent areas along the Interstate 81 corridor, including portions of West Virginia and Maryland.
Selected financial data for each segment is as follows:
|
(In thousands)
|
Wireless
|
Cable
|
Wireline
|
Other
|
Eliminations
|
Consolidated
Totals
|
||||||||||||||||||
|
External revenues
|
|
|
|
|
|
|
||||||||||||||||||
|
Service revenues
|
$
|
182,955
|
$
|
70,529
|
$
|
15,506
|
-
|
-
|
$
|
268,990
|
||||||||||||||
|
Other revenues
|
10,842
|
10,771
|
18,339
|
-
|
-
|
39,952
|
||||||||||||||||||
|
Total external revenues
|
193,797
|
81,300
|
33,845
|
-
|
-
|
308,942
|
||||||||||||||||||
|
Internal revenues
|
4,328
|
123
|
20,074
|
-
|
(24,525
|
)
|
-
|
|||||||||||||||||
|
Total operating revenues
|
198,125
|
81,423
|
53,919
|
-
|
(24,525
|
)
|
308,942
|
|||||||||||||||||
|
|
||||||||||||||||||||||||
|
Operating expenses
|
||||||||||||||||||||||||
|
Costs of goods and services, exclusive of depreciation and amortization shown separately below
|
72,995
|
50,151
|
24,219
|
-
|
(22,225
|
)
|
125,140
|
|||||||||||||||||
|
Selling, general and administrative, exclusive of depreciation and amortization shown separately below
|
36,828
|
23,189
|
6,950
|
3,006
|
(2,300
|
)
|
67,673
|
|||||||||||||||||
|
Depreciation and amortization
|
28,177
|
22,663
|
9,848
|
34
|
-
|
60,722
|
||||||||||||||||||
|
Total operating expenses
|
138,000
|
96,003
|
41,017
|
3,040
|
(24,525
|
)
|
253,535
|
|||||||||||||||||
|
Operating income (loss)
|
$
|
60,125
|
$
|
(14,580
|
)
|
$
|
12,902
|
$
|
(3,040
|
)
|
$
|
-
|
$
|
55,407
|
||||||||||
|
|
||||||||||||||||||||||||
|
Year ended December 31, 2012
(In thousands)
|
Wireless
|
Cable
|
Wireline
|
Other
|
Eliminations
|
Consolidated
Totals
|
||||||||||||||||||
|
External revenues
|
||||||||||||||||||||||||
|
Service revenues
|
$
|
162,912
|
$
|
66,010
|
$
|
15,021
|
-
|
-
|
$
|
243,943
|
||||||||||||||
|
Other revenues
|
13,398
|
10,024
|
20,710
|
-
|
-
|
44,132
|
||||||||||||||||||
|
Total external revenues
|
176,310
|
76,034
|
35,731
|
-
|
-
|
288,075
|
||||||||||||||||||
|
Internal revenues
|
3,328
|
289
|
18,927
|
-
|
(22,544
|
)
|
-
|
|||||||||||||||||
|
Total operating revenues
|
179,638
|
76,323
|
54,658
|
-
|
(22,544
|
)
|
288,075
|
|||||||||||||||||
|
|
||||||||||||||||||||||||
|
Operating expenses
|
||||||||||||||||||||||||
|
Costs of goods and services, exclusive of depreciation and amortization shown separately below
|
63,906
|
48,978
|
24,785
|
25
|
(20,287
|
)
|
117,407
|
|||||||||||||||||
|
Goodwill impairment
|
-
|
10,952
|
-
|
-
|
-
|
10,952
|
||||||||||||||||||
|
Selling, general and administrative, exclusive of depreciation and amortization shown separately below
|
30,716
|
22,335
|
6,859
|
2,993
|
(2,257
|
)
|
60,646
|
|||||||||||||||||
|
Depreciation and amortization
|
31,660
|
23,519
|
9,171
|
62
|
-
|
64,412
|
||||||||||||||||||
|
Total operating expenses
|
126,282
|
105,784
|
40,815
|
3,080
|
(22,544
|
)
|
253,417
|
|||||||||||||||||
|
Operating income (loss)
|
$
|
53,356
|
$
|
(29,461
|
)
|
$
|
13,843
|
$
|
(3,080
|
)
|
$
|
-
|
$
|
34,658
|
||||||||||
|
Year ended December 31, 2011
(In thousands)
|
Wireless
|
Cable
|
Wireline
|
Other
|
Eliminations
|
Consolidated
Totals
|
||||||||||||||||||
|
External revenues
|
|
|
|
|
|
|
||||||||||||||||||
|
Service revenues
|
$
|
137,118
|
$
|
59,051
|
$
|
14,428
|
-
|
-
|
$
|
210,597
|
||||||||||||||
|
Other revenues
|
13,129
|
8,733
|
18,686
|
-
|
-
|
40,548
|
||||||||||||||||||
|
Total external revenues
|
150,247
|
67,784
|
33,114
|
-
|
-
|
251,145
|
||||||||||||||||||
|
Internal revenues
|
3,191
|
276
|
16,414
|
-
|
(19,881
|
)
|
-
|
|||||||||||||||||
|
Total operating revenues
|
153,438
|
68,060
|
49,528
|
-
|
(19,881
|
)
|
251,145
|
|||||||||||||||||
|
|
||||||||||||||||||||||||
|
Operating expenses
|
||||||||||||||||||||||||
|
Costs of goods and services, exclusive of depreciation and amortization shown separately below
|
56,705
|
47,417
|
19,702
|
125
|
(17,309
|
)
|
106,640
|
|||||||||||||||||
|
Selling, general and administrative, exclusive of depreciation and amortization shown separately below
|
29,455
|
18,827
|
7,528
|
3,207
|
(2,572
|
)
|
56,445
|
|||||||||||||||||
|
Depreciation and amortization
|
23,906
|
23,198
|
8,453
|
213
|
-
|
55,770
|
||||||||||||||||||
|
Total operating expenses
|
110,066
|
89,442
|
35,683
|
3,545
|
(19,881
|
)
|
218,855
|
|||||||||||||||||
|
Operating income (loss)
|
$
|
43,372
|
$
|
(21,382
|
)
|
$
|
13,845
|
$
|
(3,545
|
)
|
$
|
-
|
$
|
32,290
|
||||||||||
A reconciliation of the total of the reportable segments’ operating income to consolidated income from continuing operations before income taxes is as follows:
|
|
Years Ended December 31,
|
|||||||||||
|
(In thousands)
|
2013
|
2012
|
2011
|
|||||||||
|
Total consolidated operating income
|
$
|
55,407
|
$
|
34,658
|
$
|
32,290
|
||||||
|
Interest expense
|
(8,468
|
)
|
(7,850
|
)
|
(8,289
|
)
|
||||||
|
Non-operating income, net
|
2,525
|
1,803
|
204
|
|||||||||
|
Income from continuing operations before income taxes
|
$
|
49,464
|
$
|
28,611
|
$
|
24,205
|
||||||
The Company’s assets by segment are as follows:
|
(In thousands)
|
December 31,
2013
|
December 31,
2012
|
||||||
|
|
|
|
||||||
|
Wireless
|
$
|
229,038
|
$
|
179,929
|
||||
|
Cable
|
199,184
|
202,436
|
||||||
|
Wireline
|
92,455
|
88,776
|
||||||
|
Other
|
435,804
|
458,650
|
||||||
|
Combined totals
|
956,481
|
929,791
|
||||||
|
Inter-segment eliminations
|
(359,475
|
)
|
(359,051
|
)
|
||||
|
Consolidated totals
|
$
|
597,006
|
$
|
570,740
|
||||
Note 16. Quarterly Results (unaudited)
The following table shows selected quarterly results for the Company.
|
(in thousands except per share data)
|
|
|
|
|
|
|||||||||||||||
|
|
|
|
|
|
|
|||||||||||||||
|
For the year ended December 31, 2013
|
First
|
Second
|
Third
|
Fourth
|
Total
|
|||||||||||||||
|
Operating revenues
|
$
|
76,010
|
$
|
77,454
|
$
|
77,513
|
$
|
77,965
|
$
|
308,942
|
||||||||||
|
Operating income
|
15,209
|
14,500
|
13,262
|
12,436
|
55,407
|
|||||||||||||||
|
Net income
|
8,351
|
7,842
|
6,717
|
6,676
|
29,586
|
|||||||||||||||
|
|
||||||||||||||||||||
|
Net income per share – basic and diluted
|
0.35
|
0.33
|
0.28
|
0.27
|
1.23
|
|||||||||||||||
|
|
||||||||||||||||||||
|
For the year ended December 31, 2012
|
First
|
Second
|
Third
|
Fourth
|
Total
|
|||||||||||||||
|
Operating revenues
|
$
|
68,823
|
$
|
71,378
|
$
|
72,876
|
$
|
74,998
|
$
|
288,075
|
||||||||||
|
Operating income
|
8,817
|
11,137
|
5,407
|
9,297
|
34,658
|
|||||||||||||||
|
Net income from continuing operations
|
4,408
|
5,722
|
1,415
|
5,058
|
16,603
|
|||||||||||||||
|
Net income
|
4,466
|
5,560
|
1,361
|
4,916
|
16,303
|
|||||||||||||||
|
|
||||||||||||||||||||
|
Net income from continuing operations per share – basic and diluted
|
$
|
0.19
|
$
|
0.24
|
$
|
0.06
|
$
|
0.21
|
$
|
0.69
|
||||||||||
|
Net income per share – basic and diluted
|
0.19
|
0.23
|
0.06
|
0.21
|
0.68
|
|||||||||||||||
Exhibits Index
Exhibit
| Number | Exhibit Descriptio n |
| 3.1 | Amended and Restated Articles of Incorporation of Shenandoah Telecommunications Company filed as Exhibit 3.1 to the Company’s Quarterly Report on Form 10-Q for the period ending June 30, 2007. |
| 3.2 | Amended and Restated Bylaws of Shenandoah Telecommunications Company, effective September 17, 2012, filed as Exhibit 3.3 to the Company’s Current Report on Form 8-K dated September 18, 2012. |
| 4.1 | Rights Agreement, dated as of February 8, 2008 between the Company and American Stock Transfer & Trust Company filed as Exhibit 4.1 to the Company's Current Report on Form 8-K, dated January 25, 2008. |
| 4.2 | Specimen representing the Common Stock, no par value, of Shenandoah Telecommunications Company, filed as Exhibit 4.3 to the Company’s Report on Form 10-K for the year ended December 31, 2007. |
| 10.1 | Shenandoah Telecommunications Company Stock Incentive Plan filed as Exhibit 4.1 to the Company’s Registration Statement on Form S-8 (No. 333-21733). |
| 10.2 | Shenandoah Telecommunications Company Dividend Reinvestment Plan filed as Exhibit 4.4 to the Company’s Registration Statement on Form S-3D (No. 333-74297). |
| 10.3 | Settlement Agreement and Mutual Release dated as of January 30, 2004 by and among Sprint Spectrum L.P., Sprint Communications Company L.P., WirelessCo, L.P., APC PCS, LLC, PhillieCo, L.P. and Shenandoah Personal Communications Company and Shenandoah Telecommunications Company, dated January 30, 2004; filed as Exhibit 10.3 to the Company’s Report on Form 10-K for the year ended December 31, 2003. |
| 10.4 | Sprint PCS Management Agreement dated as of November 5, 1999 by and among Sprint Spectrum L.P., WirelessCo, L.P., APC PCS, LLC, PhillieCo, L.P., and Shenandoah Personal Communications Company filed as Exhibit 10.4 to the Company’s Report on Form 10-K for the year ended December 31, 2003. |
| 10.5 | Sprint PCS Services Agreement dated as of November 5, 1999 by and between Sprint Spectrum L.P. and Shenandoah Personal Communications Company filed as Exhibit 10.5 to the Company’s Report on Form 10-K for the year ended December 31, 2003. |
| 10.6 | Sprint Trademark and Service Mark License Agreement dated as of November 5, 1999 by and between Sprint Communications Company, L.P. and Shenandoah Personal Communications Company filed as Exhibit 10.6 to the Company’s Report on Form 10-K for the year ended December 31, 2003. |
| 10.7 | Sprint Spectrum Trademark and Service Mark License Agreement dated as of November 5, 1999 by and between Sprint Spectrum L.P. and Shenandoah Personal Communications Company filed as Exhibit 10.7 to the Company’s Report on Form 10-K for the year ended December 31, 2003. |
| 10.8 | Addendum I to Sprint PCS Management Agreement by and among Sprint Spectrum L.P., WirelessCo, L.P., APC PCS, LLC, PhillieCo, L.P., and Shenandoah Personal Communications Company filed as Exhibit 10.8 to the Company’s Report on Form 10-K for the year ended December 31, 2003. |
| 10.9 | Asset Purchase Agreement dated November 5, 1999 by and among Sprint Spectrum L.P., Sprint Spectrum Equipment Company, L. P., Sprint Spectrum Realty Company, L.P., and Shenandoah Personal Communications Company, serving as Exhibit A to Addendum I to the Sprint PCS Management Agreement and as Exhibit 2.6 to the Sprint PCS Management Agreement filed as Exhibit 10.9 to the Company’s Report on Form 10-K for the year ended December 31, 2003. |
| 10.10 | Addendum II dated August 31, 2000 to Sprint PCS Management Agreement by and among Sprint Spectrum L.P., WirelessCo, L.P., APC PCS, LLC, PhillieCo, L.P., and Shenandoah Personal Communications Company filed as Exhibit 10.10 to the Company’s Report on Form 10-K for the year ended December 31, 2003. |
| 10.11 | Addendum III dated September 26, 2001 to Sprint PCS Management Agreement by and among Sprint Spectrum L.P., WirelessCo, L.P., APC PCS, LLC, PhillieCo, L.P., and Shenandoah Personal Communications Company filed as Exhibit 10.11 to the Company’s Report on Form 10-K for the year ended December 31, 2003. |
| 10.12 | Addendum IV dated May 22, 2003 to Sprint PCS Management Agreement by and among Sprint Spectrum L.P., WirelessCo, L.P., APC PCS, LLC, PhillieCo, L.P., and Shenandoah Personal Communications Company filed as Exhibit 10.12 to the Company’s Report on Form 10-K for the year ended December 31, 2003. |
| 10.13 | Addendum V dated January 30, 2004 to Sprint PCS Management Agreement by and among Sprint Spectrum L.P., WirelessCo, L.P., APC PCS, LLC, PhillieCo, L.P., and Shenandoah Personal Communications Company filed as Exhibit 10.13 to the Company’s Report on Form 10-K for the year ended December 31, 2003. |
| 10.14 | Supplemental Executive Retirement Plan as amended and restated, filed as Exhibit 10.14 to the Company’s Current Report on Form 8-K dated March 23, 2007. |
| 10.15 | Addendum VI dated May 24, 2004 to Sprint PCS Management Agreement by and among Sprint Spectrum L.P., WirelessCo, L.P., APC PCS, LLC, PhillieCo, L.P., and Shenandoah Personal Communications Company filed as Exhibit 10.15 to the Company’s Report on Form 10-Q for the quarterly period ended June 30, 2004. |
| 10.16 | Description of the Shenandoah Telecommunications Company Incentive Plan filed as Exhibit 10.25 to the Company’s Current Report on Form 8-K dated January 21, 2005. |
| 10.17 | Description of Compensation of Non-Employee Directors. Filed as Exhibit 10.26 to the Company’s Current Report on Form 8-K dated May 4, 2005. |
| 10.18 | Description of Management Compensatory Plans and Arrangements. Filed as Exhibit 10.27 to the Company’s current report on Form 8-K dated April 20, 2005. |
| 10.19 | 2005 Stock Incentive Plan filed as Exhibit 10.1 to the Company’s Registration Statement on Form S-8 (No. 333-127342). |
| 10.20 | Form of Incentive Stock Option Agreement under the 2005 Stock Incentive Plan filed as Exhibit 10.29 to the Company’s Report on Form 10-K for the year ended December 31, 2005. |
| 10.21 | Addendum VII dated March 13, 2007 to Sprint PCS Management Agreement by and among Sprint Spectrum L.P., Wireless Co., L.P., APC PCS, LLC, Phillieco, L.P., and Shenandoah Personal Communications Company, filed as Exhibit 10.31 to the Company’s Report on Form 10-K for the year ended December 31, 2006. |
| 10.22 | Settlement Agreement and Mutual Release dated March 13, 2007 by and among Sprint Corporation, Sprint Spectrum L.P., Wireless Co., L.P., Sprint Communications Company L.P., APC PCS, LLC, Phillieco, L.P., and Shenandoah Personal Communications Company and Shenandoah Telecommunications, filed as Exhibit 10.32 to the Company’s Report on Form 10-K for the year ended December 31, 2006. |
| 10.23 | Form of Performance Share Award to Executives filed as Exhibit 10.33 to the Company’s Current Report on Form 8-K dated September 20, 2007. |
| 10.24 | Addendum VIII to the Sprint Management Agreement dated November 19, 2007, filed as Exhibit 10.36 to the Company’s Current Report on Form 8-K dated November 20, 2007. |
| 10.25 | Asset Purchase Agreement dated August 6, 2008, between Rapid Communications, LLC, Rapid Acquisition Company, LLC, and Shentel Cable Company, filed as Exhibit 10.37 to the Company’s Report on Form 10-Q for the period ended June 30, 2008. |
| 10.26 | Amendment Number 1 to the Asset Purchase Agreement dated August 6, 2008, between Rapid Communications, LLC, Rapid Acquisition Company, LLC, and Shentel Cable Company, filed as Exhibit 10.40 to the Company’s Current Report on Form 8-K dated November 7, 2008. |
| 10.27 | Addendum IX to the Sprint Management Agreement dated as of April 14, 2009, and filed as Exhibit 10.42 to the Company’s Annual Report on Form 10-K dated March 8, 2010. |
| 10.28 | Asset Purchase Agreement dated as of April 16, 2010, between JetBroadband VA, LLC, Helicon Cable Communications, LLC, JetBroadband WV, LLC, JetBroadband Holdings, LLC, Helicon Cable Holdings, LLC, Shentel Cable Company and Shenandoah Telecommunications Company, filed as Exhibit 10.43 to the Company’s Current Report on Form 8-K, dated April 16, 2010. |
| 10.29 | Addendum X dated March 15, 2010 to Sprint PCS Management Agreement by and among Sprint Spectrum L.P., WirelessCo, L.P., APC PCS, LLC, PhillieCo, L.P., Sprint Communications Company L.P. and Shenandoah Personal Communications Company, filed as Exhibit 10.44 to the Company’s Current Report on Form 10-Q, dated May 7, 2010. |
| 10.30 | Addendum XI dated July 7, 2010 to Sprint PCS Management Agreement by and among Sprint Spectrum L.P., WirelessCo, L.P., APC PCS, LLC, PhillieCo, L.P., Sprint Communications Company L.P. and Shenandoah Personal Communications Company, filed as Exhibit 10.45 to the Company’s Current Report on Form 8-K dated July 8, 2010. |
| 10.31 | Credit Agreement dated as of July 30, 2010, among Shenandoah Telecommunications Company, CoBank, ACB, Branch Banking and Trust Company, Wells Fargo Bank, N.A., and other Lenders, filed as Exhibit 10.46 to the Company’s Current Report on Form 8-K dated July 30, 2010. |
| 10.32 | Second Amendment to the Credit Agreement dated as of July 30, 2010, among Shenandoah Telecommunications Company, CoBank, ACB, Branch Banking and Trust Company, Wells Fargo Bank, N.A., and other Lenders, filed as Exhibit 10.47 to the Company’s Current Report on Form 8-K dated April 29, 2011. |
| 10.33 | Third Amendment to the Credit Agreement dated as of July 30, 2010, among Shenandoah Telecommunications Company, CoBank, ACB, Branch Banking and Trust Company, Wells Fargo Bank, N.A., and other Lenders, filed as Exhibit 10.48 to the Company’s Quarterly Report on Form 10-Q dated August 8, 2011. |
| 10.34 | Letter Agreement modifying section 10.2.7.2 of Addendum X dated March 15, 2010 to Sprint PCS Management Agreement by and among Sprint Spectrum L.P., WirelessCo, L.P., APC PCS, LLC, PhillieCo, L.P., Sprint Communications Company L.P. and Shenandoah Personal Communications Company, filed as Exhibit 10.49 to the Company’s Quarterly Report on Form 10-Q dated August 8, 2011. |
| 10.35 | Fourth Amendment to the Credit Agreement dated as of July 30, 2010, among Shenandoah Telecommunications Company, CoBank, ACB, Branch Banking and Trust Company, Wells Fargo Bank, N.A., and other Lenders, filed as Exhibit 10.50 to the Company’s Quarterly Report on Form 10-Q dated August 8, 2011. |
| 10.36 | Addendum XII dated February 1, 2012 to Sprint PCS Management Agreement by and among Sprint Spectrum L.P., WirelessCo, L.P., APC PCS, LLC, PhillieCo, L.P., Sprint Communications Company L.P. and Shenandoah Personal Communications Company, filed as Exhibit 10.51 to the Company’s Current Report on Form 8-K dated February 2, 2012. |
| 10.37 | Fifth Amendment to the Credit Agreement dated as of July 30, 2010, among Shenandoah Telecommunications Company, CoBank, ACB, Branch Banking and Trust Company, Wells Fargo Bank, N.A., and other Lenders, filed as Exhibit 10.52 to the Company’s Current Report on Form 8-K dated February 2, 2012. |
| 10.38 | Addendum XIII dated September 14, 2012 to Sprint PCS Management Agreement by and among Sprint Spectrum L.P., WirelessCo, L.P., APC PCS, LLC, PhillieCo, L.P., Sprint Communications Company L.P. and Shenandoah Personal Communications, LLC, filed as Exhibit 10.53 to the Company’s Current Report on Form 8-K dated September 17, 2012. |
| 10.39 | Consent and Agreement dated September 14, 2012 related to Sprint PCS Management Agreement by and among Sprint Spectrum L.P., WirelessCo, L.P., APC PCS, LLC, PhillieCo, L.P., Sprint Communications Company L.P. and Shenandoah Personal Communications, LLC, filed as Exhibit 10.54 to the Company’s Current Report on Form 8-K dated September 17, 2012. |
| 10.40 | Amended and Restated Credit Agreement dated as of September 14, 2012, among Shenandoah Telecommunications Company, CoBank, ACB, and other Lenders, filed as Exhibit 10.55 to the Company’s Current Report on Form 8-K dated September 17, 2012. |
| 10.41 | Addendum XIV dated as of November 19, 2012, to Sprint PCS Management Agreement by and among Sprint Spectrum L.P., WirelessCo, L.P., APC PCS, LLC, PhillieCo, L.P., Sprint Communications Company L.P. and Shenandoah Personal Communications, LLC, filed as Exhibit 10.42 to the Company’s Annual Report on Form 10-K dated March 5, 2013. |
| 10.42 | Addendum XV dated as of March 11, 2013, to Sprint PCS Management Agreement by and among Sprint Spectrum, L.P., WirelessCo, L.P., APC PCS, LLC, PhillieCo, L.P., Sprint Communications Company L.P. and Shenandoah Personal communications, LLC, filed as Exhibit 10.43 to the Company’s Quarterly Report on Form 10-Q dated May 3, 2013. |
| *21 | List of Subsidiaries. |
| *23.1 | Consent of KPMG LLP, Independent Registered Public Accounting Firm. |
| *31.1 | Certification of President and Chief Executive Officer of Shenandoah Telecommunications Company pursuant to Rule 13a-14(a)under the Securities Exchange Act of 1934. |
| *31.2 | Certification of Vice President and Chief Financial Officer of Shenandoah Telecommunications Company pursuant to Rule 13a-14(a)under the Securities Exchange Act of 1934. |
| *32 | Certifications pursuant to Rule 13a-14(b) under the Securities Exchange Act of 1934 and 18 U.S.C. § 1350. |
| (101) | Formatted in XBRL (Extensible Business Reporting Language) |
|
101.INS
|
XBRL Instance Document
|
|
101.SCH
|
XBRL Taxonomy Extension Schema Document
|
|
101.CAL
|
XBRL Taxonomy Extension Calculation Linkbase Document
|
|
101.DEF
|
XBRL Taxonomy Extension Definition Linkbase Document
|
|
101.LAB
|
XBRL Taxonomy Extension Label Linkbase Document
|
|
101.PRE
|
XBRL Taxonomy Extension Presentation Linkbase Document
|
* Filed herewith
TABLE OF CONTENTS
Part IItem 1. BusinessItem 1A. Risk FactorsItem 1B. Unresolved Staff CommentsItem 2. PropertiesItem 3. Legal ProceedingsItem 4. Mine Safety DisclosuresPart IIItem 5. Market For The Registrant's Common Equity, Related Stockholder Matters and Issuer Purchases Of Equity SecuritiesItem 6. Selected Financial DataItem 7. Management's Discussion and Analysis Of Financial Condition and Results Of OperationsItem 7A. Quantitative and Qualitative Disclosures About Market RiskItem 8. Financial Statements and Supplementary DataItem 9. Changes in and Disagreements with Accountants on Accounting and Financial DisclosureItem 9A. Controls and ProceduresItem 9B. Other InformationPart IIIItem 10. Directors, Executive Officers and Corporate GovernanceItem 11. Executive CompensationItem 12. Security Ownership Of Certain Beneficial Owners and Management and Related Stockholder MattersItem 13. Certain Relationships, Related Transactions and Director IndependenceItem 14. Principal Accounting Fees and ServicesPart IVItem 15. Exhibits and Financial Statement SchedulesNote 1. Summary Of Significant Accounting PoliciesNote 2. Discontinued OperationsNote 3. InvestmentsNote 4. Property, Plant and EquipmentNote 5. Long-term Debt and Revolving Lines Of CreditNote 6. Income TaxesNote 7. Significant Contractual RelationshipNote 8. Related Party TransactionsNote 9. Retirement PlansNote 10. Stock Incentive PlansNote 11. Major CustomerNote 12. Shareholder Rights PlanNote 13. Lease CommitmentsNote 14. Derivative Instruments and Hedging ActivitiesNote 15. Segment ReportingNote 16. Quarterly Results (unaudited)