SHENANDOAH TELECOMMUNICATIONS CO/VA/
10-Ks and 10-Qs
|
|
|
|
|
|
|
|
|
|
|
|
|
|
|
|
|
|
|
|
|
|
|
|
|
|
|
|
|
|
|
|
|
|
|
|
|
|
|
|
|
|
|
|
|
|
|
|
|
|
|
|
|
|
|
|
UNITED STATES OF AMERICA
SECURITIES AND EXCHANGE COMMISSION
Washington, D. C. 20549
FORM 10-K
(Mark One)
|
☑
|
ANNUAL REPORT PURSUANT TO SECTION 13 OR 15(d) OF THE SECURITIES EXCHANGE ACT OF 1934
|
|
For the fiscal year ended December 31, 2016
|
|
|
☐
|
TRANSITION REPORT PURSUANT TO SECTION 13 OR 15(d) OF THE SECURITIES EXCHANGE ACT OF 1934
|
|
For the transition period from__________ to __________
|
|
Commission File No.: 000-09881

SHENANDOAH TELECOMMUNICATIONS COMPANY
(Exact name of registrant as specified in its charter)
|
VIRGINIA
|
|
54-1162807
|
|
(State or other jurisdiction of incorporation or organization)
|
|
(I.R.S. Employer Identification No.)
|
|
500 Shentel Way, Edinburg, Virginia
|
|
22824
|
|
(Address of principal executive offices)
|
|
(Zip Code)
|
(540) 984-4141
(Registrant's telephone number, including area code)
SECURITIES REGISTERED PURSUANT TO SECTION 12(B) OF THE ACT:
|
|
Common Stock (No Par Value)
|
NASDAQ Global Select Market
|
|
|
(Title of Class)
|
(Name of Exchange on which Registered)
|
SECURITIES REGISTERED PURSUANT TO SECTION 12(G) OF THE ACT:
NONE
Indicate by check mark if the registrant is a well-known seasoned issuer, as defined in Rule 405 of the Securities Act. Yes ☐ No ☑
Indicate by check mark if the registrant is not required to file reports pursuant to Section 13 or Section 15(d) of the Exchange Act. Yes ☐ No ☑
Indicate by check mark whether the registrant (1) has filed all reports required to be filed by Section 13 or 15(d) of the Securities Exchange Act of 1934 during the preceding 12 months (or for such shorter period that the registrant was required to file such reports), and (2) has been subject to such filing requirements for the past 90 days. Yes ☑ No ☐
Indicate by check mark whether the registrant has submitted electronically and posted on its corporate Web site, if any, every Interactive Data File required to be submitted and posted pursuant to Rule 405 of Regulation S-T (§ 232.405 of this chapter) during the preceding 12 months (or for such shorter period that the registrant was required to submit and post such files). Yes ☑ No ☐
Indicate by check mark if disclosure of delinquent filers pursuant to Item 405 of Regulation S-K is not contained herein, and will not be contained, to the best of registrant’s knowledge, in definitive proxy or information statements incorporated by reference in Part III of this Form 10-K or any amendment to this Form 10-K. ☐
Indicate by check mark whether the registrant is a large accelerated filer, an accelerated filer, a non-accelerated filer, or a smaller reporting company. See the definitions of “large accelerated filer,” “accelerated filer” and “smaller reporting company” in Rule 12b-2 of the Exchange Act. Large accelerated filer ☑ Accelerated filer ☐ Non-accelerated filer ☐ Smaller reporting company ☐
Indicate by check mark whether the registrant is a shell company (as defined in Rule 12b-2 of the Exchange Act). Yes ☐ No ☑
The aggregate market value of the registrant’s voting stock held by non-affiliates of the registrant at June 30, 2016 based on the closing price of such stock on the Nasdaq Global Select Market on such date was approximately $1.8 billion.
The number of shares of the registrant’s common stock outstanding on
March 10, 2017
was 49,097,761.
DOCUMENTS INCORPORATED BY REFERENCE
Portions of the registrant’s definitive proxy statement relating to its 2017 annual meeting of shareholders (the “2017 Proxy Statement”) are incorporated by reference into Part III of this Annual Report on Form 10-K where indicated. The 2017 Proxy Statement will be filed with the U.S. Securities and Exchange Commission within 120 days after the end of the fiscal year to which this report relates.
|
SHENANDOAH TELECOMMUNICATIONS COMPANY
|
||
|
|
TABLE OF CONTENTS
|
|
|
Item
Number
|
|
Page
Number
|
|
|
|
|
|
|
PART I
|
|
|
|
|
|
|
1.
|
||
|
1A.
|
||
|
1B.
|
||
|
2.
|
||
|
3.
|
||
|
4.
|
||
|
|
|
|
|
|
PART II
|
|
|
|
|
|
|
5.
|
||
|
6.
|
||
|
7.
|
||
|
7A.
|
||
|
8.
|
||
|
9.
|
||
|
9A.
|
||
|
9B.
|
||
|
|
|
|
|
|
PART III
|
|
|
|
|
|
|
10.
|
||
|
11.
|
||
|
12.
|
||
|
13.
|
||
|
14.
|
||
|
|
|
|
|
|
PART IV
|
|
|
|
|
|
|
15.
|
||
|
16.
|
||
2
CAUTIONARY NOTE REGARDING FORWARD-LOOKING STATEMENTS
This report includes “forward-looking statements” within the meaning of Section 27A of the Securities Act of 1933 and Section 21E of the Securities Exchange Act of 1934. The words “may,” “will,” “anticipate,” “estimate,” “expect,” “intend,” “plan,” “continue” and similar expressions as they relate to us or our management are intended to identify these forward-looking statements. All statements by us regarding our expected financial position, revenues, cash flow and other operating results, business strategy, financing plans, forecasted trends related to the markets in which we operate and similar matters are forward-looking statements. Our expectations expressed or implied in these forward-looking statements may not turn out to be correct. Our results could be materially different from our expectations because of various risks, including the risks discussed in this report under “Business” and “Risk Factors.” The Company undertakes no obligation to publicly revise these forward-looking statements to reflect subsequent events or circumstances, except as required by law.
3
Some of the information contained in this report concerning the markets and industry in which we operate is derived from publicly available information and from industry sources. Although we believe that this publicly available information and the information provided by these industry sources are reliable, we have not independently verified the accuracy of any of this information.
Unless we indicate otherwise, references in this report to “we,” “us,” “our,” “Shentel” and “the Company” means Shenandoah Telecommunications Company and its subsidiaries.
|
ITEM 1.
|
BUSINESS
|
Overview
Shenandoah Telecommunications Company is a diversified telecommunications holding company that, through its operating subsidiaries, provides both regulated and unregulated telecommunications services to end-user customers and
other telecommunications providers in Virginia, West Virginia, central Pennsylvania, western Maryland, and portions of Kentucky and Ohio. The Company offers a comprehensive suite of voice, video and data communications services based on the products and services provided by the Company’s seven operating subsidiaries.
Acquisition of nTelos and Exchange with Sprint
On May 6, 2016, we completed our previously announced acquisition of NTELOS Holdings Corp. (“nTelos”) for $667.8 million, net of cash acquired. The purchase price was financed by a credit facility arranged by CoBank, ACB, Royal Bank Of Canada, Fifth Third Bank, Bank of America, N.A., Capital One, National Association, Citizens Bank, N.A., and Toronto Dominion (Texas) LLC. We have included the operations of nTelos for financial reporting purposes for the period subsequent to the acquisition.
Shenandoah Personal Communications, LLC ("PCS") a wholly-owned subsidiary of the Company, completed its previously announced transaction with SprintCom, Inc., an affiliate of Sprint Corporation ("Sprint"). Pursuant to this transaction, among other things, we exchanged with Sprint spectrum licenses valued at $198.2 million and customer-based contract rights, valued at $206.7 million, acquired from nTelos, and received an expansion of our affiliate service territory to include most of the service area served by nTelos, valued at $284.1 million, as well as additional customer-based contract rights, valued at $120.9 million, relating to nTelos’ and Sprint’s legacy customers in our newly acquired affiliate service territory. The value of the affiliate agreement expansion is based on changes to the amended affiliate agreement that include an increase in the price to be paid by Sprint from 80% to 90% of the entire business value of Shentel's wireless operations if the affiliate agreement is not renewed and an extension of the affiliate agreement with Sprint by five years to 2029. Also included in the value is the expanded territory in the nTelos service area and the accompanying right to serve all future Sprint customers in the expanded territory, our commitment to upgrade certain coverage and capacity in the newly-acquired service area, the waiver of a portion of the management fee charged by Sprint, as well as other items defined in the amended affiliate agreement.
Operating Segments
The Company provides integrated voice, video and data communications services to end-user customers and other telecommunications providers. Operating segments are defined as components of an enterprise about which separate financial information is available that is evaluated regularly by the chief operating decision maker. The Company has three reportable segments: (1) Wireless, (2) Cable and (3) Wireline; and a fourth segment, Other, which primarily consists of parent company activities.
Wireless Segment
The business of the Wireless segment is conducted principally by the Company’s subsidiary, PCS. This subsidiary provides digital wireless service to a portion of a four-state area extending from Harrisburg, York and Altoona, Pennsylvania, to Harrisonburg, Virginia, and continuing south and west throughout southern and western Virginia and almost the entire state of West Virginia, as well as portions of Kentucky and Ohio. The Company’s Shenandoah
4
Mobile, LLC subsidiary owns 196 towers, leases space on 170 towers to PCS and has 202 leases with other wireless communications providers at December 31, 2016.
PCS has offered personal communications services through a digital wireless telephone and data network since 1995. In 1999, this subsidiary executed a Management Agreement with Sprint. The network, which utilizes code division multiple access, or CDMA, currently covers much of the territory between Pittsburgh and Philadelphia including substantial coverage along Interstates 81, 83 and the Pennsylvania Turnpike in this region, as well as many of the communities near these routes; the Interstate 81 corridor through Maryland, West Virginia, and the Shenandoah Valley region of Virginia, much of south-central and western Virginia south of Interstate 64, and much of West Virginia. The Sprint Affiliate area includes approximately 5.5 million residents, and our network currently covers 4.8 million of them. Under its agreements with Sprint, the Company is the exclusive provider of wireless mobility communications network products and services in the 800 megahertz (MHz), 1900 megahertz (MHz) and 2.5 gigahertz (GHz) spectrum ranges. The Company had 722,562 postpaid PCS customers at December 31, 2016, an increase of 131% compared to December 31, 2015. The Company had 236,138 prepaid wireless customers at December 31, 2016, an increase of 65% compared to December 31, 2015. These increases primarily resulted from the nTelos acquisition. Of the Company’s total operating revenues, 67.2% in 2016, 56.3% in 2015 and 58.5% in 2014 were generated by or through Sprint and its customers using the Company's portion of Sprint’s nationwide network. No other customer relationship generated more than 10.0% of the Company’s total operating revenues in 2016, 2015 or 2014.
Under the Sprint agreements, Sprint provides the Company significant support services, such as customer service, billing, collections, long distance, national network operations support, inventory logistics support, use of the Sprint brand names, national advertising, national distribution and product development.
The Company records its postpaid wireless revenues, with the exception of certain roaming and equipment sales revenues, based on the wireless revenues billed by Sprint, net of an 8% Management Fee and a Net Service Fee retained by Sprint. The Net Service Fee was 14.0% for 2014 and 2015. The Company amended its agreements with Sprint, effective January 1, 2016, in order to better allocate certain costs covered by the Net Service Fee. The Net Service Fee was reduced from 14.0% to 8.6%, and certain costs and revenues previously included within the Net Service Fee were broken out of the Net Service Fee and are now separately settled. Separately settled revenues primarily consist of revenues associated with Sprint’s wholesale subscribers’ use of our network and net travel revenue. In addition, the Company will be charged for the costs of subsidized handsets sold through Sprint’s national channels as well as commissions paid by Sprint to third-party resellers in our service territory. Net wireless revenues billed by Sprint consist of gross monthly recurring charges for service, net of both recurring and non-recurring customer credits, account write offs and other billing adjustments. Neither the Management Fee nor the Net Service Fee is deferred.
Prepaid wireless revenues are recorded net of a 6% Management Fee retained by Sprint. Sprint charges the Company separately to acquire and support prepaid customers. These charges are calculated based on Sprint’s national averages for its prepaid programs, and are billed per user or per gross additional customer, as appropriate. The customer acquisition costs include handset subsidies.
Under our amended affiliate agreement, Sprint agreed to waive the Management Fees charged on both postpaid and prepaid revenues, up to $4.2 million per month, until the total amount waived reaches $252 million, which is expected to take just under six years. The Company is recognizing this fee reduction on a straight-line basis over the remaining initial term of the Management Agreement with Sprint, which ends November 5, 2029.
Cable Segment
The business of the Company’s Cable segment is conducted through Shenandoah Cable Television, LLC (“Shenandoah Cable”). Shenandoah Cable provides video, voice and data services to customers in portions of Virginia, West Virginia and western Maryland, and leases fiber optic facilities throughout its service area. It does not include video, internet and voice services provided to customers in Shenandoah County, Virginia, which are included in the Wireline segment.
The Company has acquired several cable networks since 2008, and as of December 31, 2016, the Company has upgraded substantially all of the markets acquired in these transactions in order to offer robust video, high speed data and telephone services throughout its territory. Most of these markets are connected by a fiber network of 3,137 miles, which interconnects with the Wireline segment’s 1,971 mile fiber network.
5
There were 132,465 cable revenue generating units at December 31, 2016, an increase of 5.5% compared to December 31, 2015. A revenue generating unit consists of each separate service (video, voice and internet) subscribed to by a customer.
Wireline Segment
The Wireline segment provides regulated and unregulated voice services, DSL internet access, cable modem and long distance access services throughout Shenandoah County and portions of Rockingham, Frederick, Warren and Augusta counties, Virginia. The segment also provides video services in portions of Shenandoah County, and leases fiber optic facilities throughout the northern Shenandoah Valley of Virginia, northern Virginia and adjacent areas along the Interstate 81 corridor through West Virginia, Maryland and portions of Pennsylvania.
The business of the Company’s Wireline segment is conducted primarily by its Shenandoah Telephone Company subsidiary. This subsidiary provides both regulated and unregulated telephone services and fiber optic facilities in Virginia, primarily throughout the northern Shenandoah Valley.
Shenandoah Telephone Company provides local telephone services to 18,443 customers as of December 31, 2016, primarily in Shenandoah County and small service areas in Rockingham, Frederick, Warren, and Augusta counties in Virginia. This subsidiary provides access for interexchange carriers to the local exchange network and switching for voice products offered through the Cable segment. This subsidiary has a 20 percent ownership interest in Valley Network Partnership (“ValleyNet”), which offers fiber network facility capacity to business customers and other telecommunications providers in western, central, and northern Virginia, as well as the Interstate 81 corridor from Johnson City, Tennessee to Carlisle, Pennsylvania.
Shentel Cable of Shenandoah County, LLC provides video services to 5,264 customers and high speed data to 1,072 customers as of December 31, 2016. The video services offered in Shenandoah County share much of the network which the regulated telephone company uses to serve its customers in addition to its own coaxial network.
The Wireline segment also includes Shentel Communications, LLC. The following services are provided through this entity:
|
•
|
Internet access to customers in the northern Shenandoah Valley and surrounding areas. The Internet service has 13,242 digital subscriber line, or DSL, customers at December 31, 2016. DSL service is available to all customers in the Company’s regulated telephone service area.
|
|
•
|
Operation of the Maryland, West Virginia and Pennsylvania portions of a fiber optic network along the Interstate 81 corridor. In conjunction with the telephone subsidiary, Shentel Communications, LLC is associated with the ValleyNet fiber optic network. Shentel Communications, LLC’s fiber network also extends south from Harrisonburg, Virginia, through Covington, Virginia, then westward to Charleston, West Virginia. This extension of the fiber network was acquired to connect to and support the Company’s cable business, and the provision of facility leases of fiber optic capacity to end users, in these areas.
|
|
•
|
Resale of long distance service for calls placed to locations outside the regulated telephone service area by telephone customers. There were 9,149 long distance customers at December 31, 2016.
|
|
•
|
Facility leases of fiber optic capacity, owned by itself and affiliates, in surrounding counties and into Herndon, Virginia.
|
Effective for the fourth quarter of 2015, the Company expanded its data offerings in its legacy telephone service area. Previously, the Company only offered DSL-based internet access, and a phone line was required to obtain this service. Subscribers who have access to our video services (the video network overlaps a portion of our legacy telephone network) are able to purchase higher-speed internet packages over the coaxial cable network, while subscribers in our regulated telephone service area who do not have access to our video network can purchase DSL for internet access, without having to purchase telephone service.
6
Other Segment
The Other segment includes Shenandoah Telecommunications Company, which provides investing and management services to its subsidiaries.
Additional information concerning the Company’s operating segments is set forth in Note 17 of the Company’s consolidated financial statements appearing elsewhere in this report.
Competition
The telecommunications industry is highly competitive. We compete primarily on the basis of the price, availability, reliability, variety and quality of our offerings and on the quality of our customer service. Our ability to compete effectively depends on our ability to maintain high-quality services at prices competitive with those charged by our competitors. In particular, price competition in the integrated telecommunications services markets generally has been intense and is expected to increase. Our competitors include, among others, larger providers such as AT&T Inc., Verizon Communications Inc., T-Mobile USA, Inc., U.S. Cellular Corp., CenturyLink, Inc., Frontier Communications Corp., DISH Network Corporation, DIRECTV, and various competitive service providers. The larger providers have substantially greater infrastructure, financial, personnel, technical, marketing and other resources, larger numbers of established customers and more prominent name recognition than the Company.
In markets where we provide video services, we also compete in the provision of telephone and high speed data services against the incumbent local telephone company. Incumbent carriers enjoy substantial competitive advantages arising from their historical monopoly position in the local telephone market, including pre-existing customer relationships with virtually all end-users. Wireless communications providers also are competing with wireline service providers, which further increase competition.
Competition is intense in the wireless communications industry. Competition has caused the market prices for wireless products and services to decrease. This has resulted in some carriers introducing pricing plans that are structurally different and often more aggressively priced than in the past. Wireless providers are upgrading their wireless services to better accommodate real-time and downloadable audio and video content as well as Internet browsing capabilities and other services. Our ability to compete effectively will depend, in part, on our ability to anticipate and respond to various competitive factors affecting the wireless industry.
Competition is also intense and growing in the market for video services. Incumbent cable television companies, which have historically provided video service, face competition from direct broadcast satellite providers, on-line video services and from large wireline providers of telecommunications services (such as Verizon, Centurylink, Frontier and AT&T) which have upgraded their networks to provide video services in addition to voice and high-speed Internet access services. These entities are large and have substantially greater infrastructure, financial, personnel, technical, marketing and other resources, larger numbers of established customers and more prominent name recognition than the Company. Our ability to compete effectively will depend, in part, on the extent to which our service offerings overlap with these entities, and on our ability to anticipate and respond to the competitive forces affecting the market for video and other services.
A continuing trend toward consolidation, mergers, acquisitions and strategic alliances in the telecommunications industry could also increase the level of competition we face by further strengthening our competitors.
Regulation
Our operations are subject to regulation by the Federal Communications Commission (“FCC”), the Virginia State Corporation Commission (“VSCC”), the West Virginia Public Service Commission, the Maryland Public Service Commission, the Pennsylvania Public Utility Commission and other federal, state, and local governmental agencies. The laws governing these agencies, and the regulations and policies that they administer, are subject to constant review and revision, and some of these changes could have material impacts on our revenues and expenses.
Regulation of Wireless Operations
We operate our wireless business using radio spectrum made available by Sprint under the Sprint management agreements. Our wireless business is directly or indirectly subject to, or affected by, a number of regulations and
7
requirements of the FCC and other governmental authorities that apply to providers of commercial mobile radio services (“CMRS”).
Interconnection.
Federal law and FCC regulations impose certain obligations on CMRS providers to interconnect their networks with other telecommunications providers (either directly or indirectly) and to enter into interconnection agreements (“ICAs”) with certain types of telecommunications providers. Interconnection agreements typically are negotiated on a statewide basis and are subject to state approval. If an agreement cannot be reached, parties to interconnection negotiations can submit unresolved issues to federal or state regulators for arbitration. In addition, FCC regulations previously required that local exchange carriers (“LECs”) and CMRS providers establish reciprocal compensation arrangements for the termination of traffic to one another. Disputes regarding intercarrier compensation can be brought in a number of forums (depending on the nature and jurisdiction of the dispute) including state public utility commissions (“PUCs”), FCC and the courts. The Company does not presently have any material interconnection or intercarrier compensation disputes with respect to its wireless operations.
On October 27, 2011, the FCC adopted a report and order which comprehensively reformed and modernized the agency’s intercarrier compensation (“ICC”) rules governing the telecommunications industry. Under the current FCC regime, since December 29, 2011, local traffic between CMRS providers and most LECs must be compensated pursuant to a default bill-and-keep framework if there was no pre-existing agreement between the CMRS provider and the LEC. A federal appeals court has affirmed the FCC’s report and order. Additionally, the FCC is considering a number of petitions for declaratory ruling and other proceedings regarding disputes among carriers relating to interconnection payment obligations. Resolution of these proceedings and any additional FCC rules regarding interconnection could directly affect us in the future. Interconnection costs represent a significant expense item for us and any significant changes in the intercarrier compensation scheme may have a material impact on our business. We are unable to determine with any certainty at this time whether any such changes would be beneficial to or detrimental to our wireless operations.
On December 18, 2014 the FCC issued a declaratory ruling which provides additional guidance concerning how the agency will evaluate the reasonableness of data roaming agreements. The agency clarified that it will consider the reasonableness of data roaming rates based upon, in part, whether such rates exceed retail, international and resale rates, as well as how such rates compare to other providers’ rates. The ruling also clarifies other aspects of the FCC’s 2011 data roaming order concerning the appropriate presumptions applied to certain contract terms and the inclusion of build-out terms when considering the reasonableness of roaming rates and terms. The ruling is expected to provide improved negotiating leverage to Sprint, and other providers, in negotiating new data roaming agreements with AT&T and Verizon. It is unclear whether such leverage will result in lower data roaming rates for Sprint, or whether such reduced rates will accrue to the benefit of our operations. There is also a possibility that the ruling could provide a basis for smaller wireless providers to seek more beneficial terms in their roaming agreements with Sprint, which may impact roaming costs in our territory.
Universal Service Contribution Requirements.
Consistent with the terms of our management agreements, Sprint is required to contribute to the federal universal service fund (the “USF”) based in part on the revenues it receives in connection with our wireless operations. The purpose of this fund is to subsidize telecommunications and broadband services in rural areas, for low-income consumers and for schools, libraries and rural healthcare facilities. Sprint is permitted to, and does, pass through these mandated payments as surcharges paid by our customers.
Transfers, Assignments and Changes of Control of PCS Licenses
. The FCC must give prior approval to the assignment of ownership or control of a PCS license, as well as transfers involving substantial changes in such ownership or control. The FCC also requires licensees to maintain effective working control over their licenses. Our agreements with Sprint reflect an alliance that the parties believe meets the FCC requirements for licensee control of licensed spectrum. If the FCC were to determine that the Sprint management agreements need to be modified to increase the level of licensee control, we have agreed with Sprint under the terms of our Sprint PCS agreements to use our best efforts to modify the agreements as necessary to cause the agreements to comply with applicable law and to preserve to the extent possible the economic arrangements set forth in the agreements. If the agreements cannot be modified, the agreements may be terminated pursuant to their terms. The FCC could also impose sanctions on the Company for failure to meet these requirements.
PCS licenses are granted for ten-year terms. Sprint’s PCS licenses for our service area are scheduled to expire on various dates from the date of publication of this disclosure through June 2025. Licensees have an expectation of license renewal if they have provided “substantial” service during its past license terms, and have “substantially”
8
complied with FCC rules and policies, and with the Communications Act of 1934. All of the PCS licenses used in our wireless business have been successfully renewed since their initial grant.
Construction and Operation of Wireless Facilities.
Wireless systems must comply with certain FCC and Federal Aviation Administration (“FAA”) regulations regarding the registration, siting, marking, lighting and construction of transmitter towers and antennas. The FCC also requires that aggregate radio frequency emissions from every site meet certain standards. These regulations affect site selection for new network build-outs and may increase the costs of improving our network. We cannot predict what impact the costs and delays from these regulations could have on our operations.
The FCC’s decision to authorize a proposed tower may also be subject to environmental review pursuant to the National Environmental Policy Act of 1969 (“NEPA”), which requires federal agencies to evaluate the environmental impacts of their decisions under some circumstances. FCC regulations implementing NEPA place responsibility on each applicant to investigate any potential environmental effects of a proposed operation, including health effects relating to radio frequency emissions, and impacts on endangered species such as certain migratory birds, and to disclose any significant effects on the environment to the agency prior to commencing construction. Pursuant to FCC rules, the public is afforded an opportunity to comment on the environmental effects of a proposed antenna structure that requires registration with the FCC. The FCC may then determine if further environmental review is necessary. In the event that the FCC determines that a proposed tower would have a significant environmental impact, the FCC would require preparation of an environmental impact statement.
In addition, tower construction is subject to regulations implementing the National Historic Preservation Act. Compliance with FAA, environmental or historic preservation requirements could significantly delay or prevent the registration or construction of a particular tower or make tower construction more costly. On July 15, 2016, Congress enacted new tower marking requirements for certain towers located in rural areas, which may increase our operational costs.
In some jurisdictions, local laws or regulations may impose similar requirements.
Wireless Facilities Siting
. States and localities are authorized to engage in forms of regulation, including zoning and land-use regulation, which may affect our ability to select and modify sites for wireless facilities. States and localities may not engage in forms of regulation that effectively prohibit the provision of wireless services, discriminate among functionally equivalent services or regulate the placement, construction or operation of wireless facilities on the basis of the environmental effects of radio frequency emissions. Courts and the FCC are routinely asked to review whether state and local zoning and land-use actions should be preempted by federal law, and the FCC also is routinely asked to consider other issues affecting wireless facilities siting in other proceedings. We cannot predict the outcome of these proceedings or the effect they may have on us.
Communications Assistance for Law Enforcement Act.
The Communications Assistance for Law Enforcement Act (“CALEA”) was enacted in 1994 to preserve electronic surveillance capabilities by law enforcement officials in the face of rapidly changing telecommunications technology. CALEA requires telecommunications carriers, including the Company, to modify their equipment, facilities and services to allow for authorized electronic surveillance based on either industry or FCC standards. Following adoption of interim standards and a lengthy rulemaking proceeding, including an appeal and remand proceeding, all carriers were required to be in compliance with the CALEA requirements as of June 30, 2002. We are currently in compliance with the CALEA requirements.
Local Number Portability
. All covered CMRS providers, including the Company, are required to allow wireless customers to retain their existing telephone numbers when switching from one telecommunications carrier to another. These rules are generally referred to as wireless local number portability (“LNP”). The future volume of any porting requests, and the processing costs related thereto, may increase our operating costs in the future. We are currently in compliance with LNP requirements. The FCC has selected a new Local Number Portability Administrator, and the transition to a new Local Number Portability Administrator may impact our ability to manage number porting and related tasks, or may result in additional costs related to the transition.
Number Pooling
. The FCC regulates the assignment and use of telephone numbers by wireless and other telecommunications carriers to preserve numbering resources. CMRS providers in the top 100 markets are required to be capable of sharing blocks of 10,000 numbers among themselves in subsets of 1,000 numbers (“1000s-block number pooling”); the FCC considers state requests to implement 1000s-block number pooling in smaller markets on a case-by-case basis, and has granted such requests in the past. In addition, all CMRS carriers, including those operating outside the top 100 markets, must be able to support roaming calls on their network placed by users with
9
pooled numbers. Wireless carriers must also maintain detailed records of the numbers they have used, subject to audit. The pooling requirements may impose additional costs and increase operating expenses on us and limit our access to numbering resources. We are currently in compliance with the FCC number pooling requirements.
Telecommunications Relay Services (“TRS”).
Federal law requires wireless service providers to take steps to enable the hearing impaired and other disabled persons to have reasonable access to wireless services. The FCC has adopted rules and regulations implementing this requirement to which we are subject, and requires that we pay a regulatory assessment to support such telecommunications relay services for the disabled. The Company is in compliance with these requirements.
Consumer Privacy.
The Company is subject to various federal and state laws intended to protect the privacy of end-users who subscribe to the Company’s services. For example, the FCC has regulations that place restrictions on the permissible uses that we can make of customer-specific information, known as Customer Proprietary Network Information (“CPNI”), received from subscribers, and that govern procedures for release of such information in order to prevent identity theft schemes. Other laws impose criminal and other penalties for the violation of certain CPNI requirements and related privacy protections. In addition, as explained below, the FCC has determined that broadband Internet access services are subject to the statutory protections afforded to CPNI and has implemented regulations that require broadband internet access service providers to provide additional notice of privacy policies and practices, opt-in and opt-out consent for certain use and disclosure of CPNI and to implement reasonable data security practices. Numerous parties have petitioned for reconsideration of this order, and the FCC may revisit its decision to extend Title II obligations to broadband providers.
Our operations are also subject to federal and state laws governing information security. In the event of an information security breach, such rules may require consumer and government agency notification and may result in regulatory enforcement actions with the potential of monetary forfeitures.
In addition, restrictions exist, and new restrictions are considered from time to time by Congress, federal agencies and states, on the extent to which wireless customers may receive unsolicited telemarketing calls, text messages, junk e-mail or spam. Congress, federal agencies and certain states also are considering, and may in the future consider imposing, additional requirements on entities that possess consumer information to protect the privacy of consumers. The Company is required to file an annual certification of compliance with the FCC’s CPNI rules. Complying with these requirements may impose costs on us or compel us to alter the way we provide or promote our services.
Consumer Protection
. Many members of the wireless industry, including us, have voluntarily committed to comply with the CTIA Consumer Code for Wireless Service, which includes consumer protection provisions regarding the content and format of bills; advance disclosures regarding rates, terms of service, contract provisions, and network coverage; and the right to terminate service after a trial period or after changes to contract provisions are implemented. The FCC and/or some state commissions have considered or are considering imposing additional consumer protection requirements upon wireless service providers, including billing-related disclosures and usage alerts, as well as the adoption of standards for responses to customers and limits on early termination fees. On December 12, 2013, CTIA filed a letter with the FCC detailing voluntary commitments by large wireless providers, including Sprint, which will permit subscribers and former subscribers to unlock their mobile devices, subject to contract fulfillment time frames for postpaid plans, or after one year for prepaid plans. The carriers have agreed to fully implement the voluntary commitments within 12 months of adoption. Subsequently, on February 11, 2014, CTIA-The Wireless Association adopted six standards on mobile wireless device unlocking into the CTIA Consumer Code for Wireless Service. Finally, on August 1, 2014, the Unlocking Consumer Choice and Wireless Competition Act was enacted to make it easier for consumers to change their cell phone service providers without paying for a new phone. This new statute reverses a decision made by the Library of Congress in 2012 that said it was illegal for consumers to “unlock” their cell phones for use on other networks without their service provider’s permission. Adoption of these and other similar, consumer protection requirements could increase the expenses or decrease the revenue of our wireless business.
Courts have also had, and in the future may continue to have, an effect on the extent to which matters pertaining to the content and format of wireless bills can be regulated at the state level. Any further changes to these and similar requirements could increase our costs of doing business and our costs of acquiring and retaining customers.
Net Neutrality
. For information concerning the FCC’s non-discrimination requirements for wireless broadband providers, see the discussion under “Regulation of Wireline Operations – Broadband Services / Net Neutrality” below.
10
Radio Frequency Emission from Handsets
. Some studies (and media reports) have suggested that radio frequency emissions from handsets, wireless data devices and cell sites may raise various health concerns, including cancer, and may interfere with various electronic medical devices, including hearing aids and pacemakers. Most of the expert reviews conducted to date have concluded that the evidence does not support a finding of adverse health effects but that further research is appropriate. Courts have dismissed a number of lawsuits filed against other wireless service operators and manufacturers, asserting claims relating to radio frequency transmissions to and from handsets and wireless data devices. However, there can be no assurance that the outcome of other lawsuits, or general public concerns over these issues, will not have a material adverse effect on the wireless industry, including us.
Accessibility
. The FCC imposes obligations on telecommunications service providers, including broadband internet access service providers and multi-channel video programming distributors ("MVPDs"), intended to ensure that individuals with disabilities are able to access and use telecommunications and video programming services and equipment. FCC rules require telecommunications service providers, including wireless providers, to be capable of transmitting 911 calls from persons who are deaf, hard of hearing or speech disabled, including through TTY capability over the public switched telephone network ("PSTN"), various forms of PSTN-based and internet protocol ("IP")-based TRS, and text-to-911 (where available). The FCC recently amended its rules to allow wireless telecommunications service providers to transition to use of real time text ("RTT") in lieu of TTY technology for communications using wireless IP-based voice services. In addition, telecommunications services, including interconnected voice over internet protocol ("VoIP"), and advanced communications services ("ACS") (such as email and text messaging) must be accessible to and usable by disabled persons, including by ensuring that email and texts are compatible with commonly used screen readers, unless doing so is not achievable. FCC rules require that customer support for covered services (included website based) is accessible and also imposes extensive recordkeeping for both telecommunications services and ACS, and subject providers to significant penalties for non-compliance with accessibility requirements as well as for falsely certifying compliance with recordkeeping obligations. Similarly, existing FCC rules require us to offer a minimum number of hearing aid-compatible handsets to consumers. The FCC recently proposed rules that would update technical specifications for hearing-aid compatible ("HAC") handsets and extend HAC compatibility requirements to VoIP handsets. We cannot predict if or when additional changes will be made to the current FCC accessibility rules, or whether and how such changes will affect us.
911 Services
. We are subject to FCC rules that require wireless carriers to make emergency 911 services available to their subscribers, including enhanced 911 services that convey the caller’s telephone number and detailed location information to emergency responders. The FCC has also sought public comment to investigate further requirements regarding the accuracy of wireless location information transmitted during an emergency 911 call. Additionally, the FCC has recently proposed rules that would require all wireless carriers to support the ability of consumers to send text messages to 911 in all areas of the country where 911 Public Safety Answering Points (“PSAP”) are capable of receiving text messages. Also, in May 2013, the FCC adopted rules which require CMRS providers to provide an automatic “bounce-back” text message when a subscriber attempts to send a text message to 911 in a location where text-to-911 is not available. In August 2014, the FCC ordered that all CMRS and interconnected text providers must be capable of supporting text-to-911 by December 31, 2014. Such covered text providers have until June 30, 2015, to begin delivering text-to-911 messages to PSAPs that have submitted requests for such delivery by December 31, 2014, unless otherwise agreed with the PSAP, and six months to begin delivery after any such request made after December 31, 2014. We are not able to predict the effect that these, or any other, changes to the 911 service rules will have on our operations.
Regulation of Wireline Operations
As an ILEC, Shenandoah Telephone Company’s (“Shenandoah Telephone”) operations are regulated by federal and state regulatory agencies.
State Regulation
. Shenandoah Telephone’s rates for local exchange service, intrastate toll service, and intrastate access charges are subject to the approval of the VSCC. The VSCC also establishes and oversees implementation of certain provisions of the federal and state telecommunications laws, including interconnection requirements, promotion of competition, and consumer protection standards. The VSCC also regulates rates, service areas, service standards, accounting methods, affiliated transactions and certain other financial transactions. Pursuant to the FCC’s October 27, 2011 order adopting comprehensive reforms to the federal intercarrier compensation and universal service policies and rules (as discussed above and further below), the FCC preempted state regulatory commissions’
11
jurisdiction over all terminating access charges, including intrastate terminating access charges, which historically have been within the states’ jurisdiction. However, the FCC vested in the states the obligation to monitor the tariffing of intrastate rate reductions for a transition period, to oversee interconnection negotiations and arbitrations, and to determine the network edge, subject to FCC guidance, for purposes of the new “bill-and-keep” framework. A federal appeals court has affirmed the decision. The outcome of those further challenges could modify or delay the effectiveness of the FCC’s rule changes. Although we are unable to predict the ultimate effect that the FCC’s order will have on the state regulatory landscape or our operations, the rules may decrease or eliminate revenue sources or otherwise limit our ability to recover the full value of our network assets.
Interconnection.
Federal law and FCC regulations impose certain obligations on incumbent local exchange carriers to interconnect their networks with other telecommunications providers (either directly or indirectly) and to enter into ICAs with certain types of telecommunications providers. Interconnection agreements typically are negotiated on a statewide basis and are subject to state approval. If an agreement cannot be reached, parties to interconnection negotiations can submit unresolved issues to federal or state regulators for arbitration. Disputes regarding intercarrier compensation can be brought in a number of forums (depending on the nature and jurisdiction of the dispute) including PUCs, the FCC, and the courts. The Company is working to resolve several routine interconnection and intercarrier compensation-related disputes concerning the appropriate rates and terms for the origination and termination of traffic on third-party networks.
Regulation of Intercarrier Compensation.
Shenandoah Telephone participates in the access revenue pools administered by the FCC-supervised National Exchange Carrier Association (“NECA”), which collects and distributes the revenues from interstate access charges that long-distance carriers pay us for originating and terminating interstate calls over our network. Shenandoah Telephone also participates in some NECA tariffs that govern the rates, terms, and conditions of our interstate access offerings. Some of those tariffs are under review by the FCC, and we may be obligated to refund affected access charges collected in the past or in the future if the FCC ultimately finds that the tariffed rates were unreasonable. We cannot predict whether, when, and to what extent such refunds may be due.
On October 27, 2011, the FCC adopted a number of broad changes to the ICC rules governing the interstate access rates charged by small-to-mid-sized ILECs such as Shenandoah Telephone. For example, the FCC adopted a national “bill-and-keep” framework, which will result in substantial reductions in the access charges paid by long distance carriers and other interconnecting carriers, possibly to zero, accompanied by increases to the subscriber line charges paid by business and residential end users. In addition, the FCC has changed some of the rules that determine what compensation voice service providers, including but not limited to wireless carriers, competitive local exchange carriers, VoIP providers and providers of other Internet-enabled services, should pay and receive for originating and terminating traffic that is interconnected with ILEC networks.
The FCC’s recent changes to the ICC rules have been affirmed by a federal appeals court. These changes, and potential future changes, to such compensation regulations could increase our expenses and/or reduce our revenues. At this time we cannot estimate the amount of such additional expense or revenue changes.
The VSCC has jurisdiction over local telephone companies’ intrastate access charges, and has indicated in the past that it might open a generic proceeding on the rates charged for intrastate access, although the scope and likelihood of such a proceeding is unclear in light of the FCC’s overhaul of the intercarrier compensation rules (discussed above), which affect states’ jurisdiction over intrastate access charges. The VSCC issued a Final Order on August 9, 2011 that required service providers to eliminate their common carrier line charges in three stages. Pursuant to the order, the Company’s intrastate common line revenue had declined in each of the previous three years, and was eliminated in mid-2014.
Interstate and intrastate access charges are important sources of revenue for Shenandoah Telephone’s operations. Unless these revenues can either be replaced through a new universal service mechanism, or unless they can be reflected in higher rates to local end users, or replaced through other newly created methods of cost recovery, the loss of revenues to us could be significant. There can be no assurance that access charges in their present form will be continued or that sufficient substitutes for the lost revenues will be provided. If access charges are reduced without sufficient substitutes for the lost revenues, this could have a material adverse impact on our financial condition, results of operations and cash flows. In addition, changes to the intercarrier compensation rules and policies could have a material impact on our competitive position vis-à-vis other service providers, particularly in our ability to proactively make improvements to our networks and systems.
12
Universal Service Fund.
Shenandoah Telephone receives disbursements from the USF. In October 2011, the FCC adopted comprehensive changes to the universal service program that are intended in part to stabilize the USF, the total funding of which had increased considerably in recent years. Some of the FCC’s reforms impact the rules that govern disbursements from the USF to rural ILECs such as Shenandoah Telephone, and to other providers. Such changes, and additional future changes, may reduce the size of the USF and payments to Shenandoah Telephone, which could have an adverse impact on the Company’s financial position, results of operations, and cash flows. The Company is not able to predict if or when additional changes will be made to the USF, or whether and how such changes would affect the extent of our total federal universal service assessments, the amounts we receive, or our ability to recover costs associated with the USF.
If the Universal Service Administrative Company (“USAC”) were required to account for the USF program in accordance with generally accepted accounting principles for federal agencies under the Anti-Deficiency Act (the “ADA”), it could cause delays in USF payments to fund recipients and significantly increase the amount of USF contribution payments charged to wireline and wireless consumers. Each year since 2004, Congress has adopted short-term exemptions for the USAC from the ADA. Congress has from time to time considered adopting a longer term exemption for the USAC from the ADA, but we cannot predict whether any such exemption will be adopted or the effect it may have on the Company.
In February, 2012, the FCC released an order making substantial changes to the rules and regulations governing the USF Lifeline Program, which provides discounted telephone services to low income consumers. The order imposes greater recordkeeping and reporting obligations, and generally subjects providers of Lifeline-supported services to greater oversight. As a result of our Company providing Lifeline-supported services, it is subject to increased reporting and recordkeeping requirements, and could be subject to increased regulatory oversight, investigations or audits. The FCC, USAC and other authorities have conducted, and in the future are expected to continue to conduct, more extensive audits of USF support recipients, as well as other heightened oversight activities. The impact of these activities on the Company, if any, is uncertain. In 2016, the FCC released a second substantial Lifeline order that amended the program to provide support for broadband services. Included among the new rules was a requirement that any eligible telecommunications carrier (ETC) which offered broadband service, on its own or through an affiliate, must also offer Lifeline-supported broadband service. Due to this requirement, our company will begin offering Lifeline-supported broadband in areas where it operates as an ETC.
Broadband Services.
In December 2010, the FCC adopted so-called “net neutrality” rules that it deemed necessary to ensure an “open” Internet that is not unduly restricted by network “gatekeepers.” Those rules subjected wireline and wireless broadband Internet access service providers to varying regulations (depending upon the nature of the service) including three key requirements: 1) a prohibition against blocking websites or other online applications; 2) a prohibition against unreasonable discrimination among Internet users or among different websites or other sources of information; and 3) a transparency requirement compelling the disclosure of network management policies. Our wireline subsidiaries that provide broadband Internet access services were subject to these rules. However, on January 14, 2014, the U.S. Court of Appeals for the D.C. Circuit, in Verizon v. FCC, struck down major portions of the FCC’s net neutrality rules governing the operating practices of broadband Internet access providers like us. The Court struck down the first two components of the rules, the prohibition against blocking and unreasonable discrimination, concluding that they constitute “common carrier” restrictions that are not permissible given the FCC’s earlier decision to classify Internet access as an “information service,” rather than a “telecommunications service.” The Court simultaneously upheld the FCC’s transparency requirement, concluding that this final requirement does not amount to impermissible common carrier regulation.
On February 26, 2015, in response to the D.C. Circuit’s ruling, the FCC adopted an order imposing new rules to reclassify and regulate broadband Internet access services. The Order reclassifies wireline and wireless broadband services as Title II common carrier services, and asserts legal authority to regulate broadband service offered by ISPs under Title II, Title III, and Section 706 of the Telecommunications Act. In an effort to protect consumers and edge providers, new rules promulgated under the Order would prohibit ISPs from engaging in blocking, throttling, and paid prioritization, and the existing transparency/disclosure rules would be enhanced. For the first time, under this Order the FCC has authority to hear complaints and take enforcement actions if it determines that the interconnection of ISPs are not just and reasonable, or if ISPs fail to meet a new general obligation not to harm consumers or edge providers. The Order forbears from (at least for now) certain Title II regulation, such as rate regulation, tariffs and last-mile unbundling. The Order does not propose assessment of USF fees on broadband at this time. The Order has been appealed by multiple parties, but the rules are currently in effect. The Order could have a significant negative impact on our business and results of operations. There are also legislative proposals in Congress to preempt the Chairman’s proposed “utility-style” regulation, while still addressing many of the
13
underlying concerns. The FCC may revisit its decision to extend Title II obligations to broadband providers at some point in the future. We do not know at the current time if the new regulations will survive judicial review, nor do we know how they would be administered if they do, but they could adversely affect the potential development of advantageous relationships with Internet content providers. Rules or statutes increasing the regulation of our Internet services could limit our ability to efficiently manage our networks and respond to operational and competitive challenges.
As the Internet has matured, it has become the subject of increasing regulatory interest. Congress and Federal regulators have adopted a wide range of measures directly or potentially affecting Internet use. The adoption of new Internet regulations or policies could adversely affect our business.
On January 29, 2015, the FCC, in a nation-wide proceeding evaluating whether “advanced broadband” is being deployed in a reasonable and timely fashion, increased the minimum connection speeds required to qualify as advanced broadband service to 25 Mbps for downloads and 3 Mbps for uploads. As a result, the FCC concluded that advanced broadband was not being sufficiently deployed and initiated a new inquiry into what steps it might take to encourage broadband deployment. This action may lead the FCC to adopt additional measures affecting our broadband business. At the same time, the FCC has ongoing proceedings to allocate additional spectrum for advanced wireless service, which could provide additional wireless competition to our broadband business.
In addition, in 2015 the West Virginia Office of the Attorney General initiated an informal inquiry into the marketing practices and performance of all sizable West Virginia Internet service providers, including Shenandoah Cable Television, LLC, within West Virginia. Pursuant to requests from the Attorney General’s office the Company provided all requested information concerning terms of service, pricing, packaging, advertising, service intervals, infrastructure investments and related information (including the results of internal speed tests). It is unclear when this inquiry will be completed, or whether the Attorney General’s office will request additional information, or take any further action. The impact of these activities on the Company, if any, is uncertain.
Other Regulatory Obligations.
Shenandoah Telephone is subject to requirements relating to CPNI, CALEA implementation, interconnection, access to rights of way, number portability, number pooling, accessibility of telecommunications for those with disabilities, protection for consumer privacy, and other obligations similar to those discussed above for our wireless operations.
The FCC and other authorities continue to consider policies to encourage nationwide advanced broadband infrastructure development. For example, the FCC has largely deregulated DSL and other broadband services offered by ILECs. Such changes benefit our ILEC, but could make it more difficult for us (or for NECA) to tariff and pool DSL costs. Broadband networks and services are subject to CALEA rules, network management disclosure and prohibitions, requirements relating to consumer privacy, and other regulatory mandates.
911 Services
. We are subject to FCC rules that require telecommunications carriers to make emergency 911 services available to their subscribers, including enhanced 911 services that convey the caller’s telephone number and detailed location information to emergency responders. In December 2013 the FCC adopted a rule requiring all 911 service providers that serve a public safety answering point or other local emergency responder, to take reasonable measures to ensure 911 circuit diversity, availability of backup power at central offices that directly serve PSAPs, and diversity of network monitoring links.
Long Distance Services
. We offer long distance service to our customers through our subsidiary, Shentel Communications, LLC. Our long distance rates are not subject to FCC regulation, but we are required to offer long distance service through a subsidiary other than Shenandoah Telephone, to disclose our long distance rates on a website, to maintain geographically averaged rates, to pay contributions to the USF and make other mandatory payments based on our long-distance revenues, and to comply with other filing and regulatory requirements. In November 2013 the FCC issued an order imposing greater recordkeeping and reporting obligations on certain long distance providers delivering calls to rural areas. The order imposes greater recordkeeping and quarterly reporting obligations on such providers, and generally subjects such providers to greater oversight.
CLEC Operations.
We are authorized to operate as a CLEC in Maryland, Virginia, West Virginia and Pennsylvania. CLECs generally are subject to federal and state regulations that are similar to, but not as stringent as, those that apply to our ILEC operations. Both the FCC and the state regulatory authorities require that, in most circumstances, CLEC access charges be no higher than the access charges of the ILECs in areas where they operate.
14
Regulation of Cable Television, Interconnected VoIP and Other Video Service Operations
Through Shenandoah Cable Television, LLC, we provide cable service in a number of jurisdictions throughout West Virginia, numerous communities across southern and southwestern Virginia, and a small area of western Maryland. We also provide cable service in Shenandoah County, Virginia through Shentel Cable of Shenandoah County, LLC.
The provision of cable service generally is subject to regulation by the FCC, and cable operators typically also must comply with the terms of the franchise agreement between the cable operator and the local franchising authority. Some states, including Virginia and West Virginia, have enacted regulations and franchise provisions that also can affect certain aspects of a cable operator’s operations.
Pricing and Packaging
. Federal law limits cable rate regulation to communities that are not subject to “effective competition,” as defined by federal regulation. In the absence of effective competition, federal law authorizes local franchising authorities to regulate the monthly rates charged for the minimum level of video programming service (the “basic service tier”) and for the installation, sale and lease of equipment used by end users to receive the basic service tier, but no additional cable offerings. None of the local franchise authorities presently regulate our rates. Congress and the FCC from time to time have considered imposing new pricing and packaging restrictions on cable operators, including possible requirements to unbundle existing service tiers and provide cable programming on an a la carte basis. We cannot predict whether or when such new pricing and packaging restrictions may be imposed on us or what effect they would have on our ability to provide cable service.
Must-Carry/Retransmission Consent.
Local broadcast television stations can require a cable operator to carry their signals pursuant to federal “must-carry” requirements. Alternatively, local television stations may require that a cable operator obtain “retransmission consent” for carriage of the station’s signal, which can enable a popular local television station to obtain concessions from the cable operator for the right to carry the station’s signal. When stations choose retransmission consent over must-carry, both the station and the cable operator have a duty to negotiate in good faith for such consent. Although some local television stations today are carried by cable operators under the must-carry obligation, popular broadcast network affiliated stations (like ABC, CBS, FOX, CW and NBC) typically are carried pursuant to retransmission consent agreements. The cable industry’s retransmission consent costs are increasing rapidly. In the past, proposals have been advanced in Congress and at the FCC to reform or eliminate retransmission consent. We are unable to predict what future changes, if any, Congress or the FCC might adopt in connection with retransmission consent and how such rules may affect our business.
Copyright Fees.
Cable operators pay compulsory copyright fees (in addition to possible retransmission consent fees) to retransmit broadcast programming. Although the cable compulsory copyright license has been in place for 40 years, there have been legislative and regulatory proposals to replace the compulsory license with privately negotiated licenses. We cannot predict whether such proposals will be enacted and how they might affect our business.
Programming Costs.
Satellite-delivered cable programming, such as ESPN, HBO and the Discovery Channel, is not subject to must-carry/retransmission consent regulations or a compulsory copyright license. The Company negotiates directly or through the National Cable Television Cooperative (“NCTC”) with satellite-delivered cable programmers for the right to carry their programming. The cost of acquiring the right to carry satellite-delivered cable programming can increase as the popularity of such programming increases, or as programmers demand rate increases. We cannot predict the extent to which such programming costs may increase in the future or the effect such cost increases may have on our ability to provide cable service.
Franchise Matters.
Cable operators generally must apply for and obtain non-exclusive franchises from local or state franchising authorities before providing video service. The terms and conditions of franchises vary among jurisdictions, but franchises generally last for a fixed term, subject to renewal; require the cable operator to collect a franchise fee of as much as 5% of the cable operator’s gross revenue from video services; and contain certain service quality and customer service obligations. A significant number of states today have processes in place for obtaining state-wide franchises, and legislation has been introduced from time to time in Congress and in various states, including those in which we provide some form of video service, that would require the implementation of state-wide franchising processes. Although we cannot predict whether state-wide franchising will become ubiquitous, it would, if implemented, likely lower barriers to entry and increase competition in the marketplace for video services. In 2006, the FCC adopted new rules governing the terms and conditions under which franchising authorities can award franchises to entities that compete against incumbent cable service operators. These rules generally limit the ability of franchising authorities to impose certain requirements on and extract certain
15
concessions from new entrants. Also in 2006, Virginia adopted a new franchising statute. This statute largely leaves franchising responsibility in the hands of local municipalities and counties, but it governs the local government entities’ award of such franchises and their conduct of franchise negotiations. We cannot predict the extent to which these rules and other developments will accelerate the pace of new entry into the video market or the effect, if any, they may have on our cable operations.
Leased Access/PEG.
The Communications Act permits franchising authorities to require cable operators to set aside the use of channels for public, education and governmental access (“PEG”) programming. The Communications Act also requires certain cable systems to make available a portion of their capacity for commercial leased access by third parties that would compete with programming offered on other channels of the cable system. Increases in the amount of required commercial leased access or PEG access usage could reduce the number of channels available to us to provide other types of programming to subscribers.
Pole Attachments.
The Communications Act requires most utilities to provide cable systems with access to poles and conduits and simultaneously subjects the rates charged for this access to either federal or state regulation. In 2011 and again in 2015, the FCC amended its existing pole attachment rules to promote broadband deployment. The 2011 order allows for new penalties in certain cases involving unauthorized attachments, but generally strengthens the cable industry’s ability to access investor-owned utility poles on reasonable rates, terms and conditions. Additionally, the 2011 order reduces the federal rate formula previously applicable to “telecommunications” attachments to closely approximate the rate formula applicable to “cable” attachments. The 2015 order, which is currently on appeal by utility pole owners, continues that rate reconciliation, effectively closing the remaining “loophole” that potentially allowed for significantly higher rates for telecommunications attachments in certain scenarios. Neither the 2011 order nor the 2015 order directly affect the rate in states that self-regulate (rather than allow the FCC to regulate) pole rates, but many of those states have substantially the same rate for cable and telecommunications attachments.
Broadband Services
. For information concerning the regulation of Broadband services, see the discussion under “Regulation of Incumbent Local Exchange Carrier Operations – Broadband Services” above.
Net Neutrality
. For information concerning the FCC’s non-discrimination requirements for fixed broadband providers, see the discussion under “Regulation of Wireline Operations – Broadband Services / Net Neutrality” above.
VoIP Services
. We provide voice communications services over our cable network utilizing interconnected VoIP technology and service arrangements. Although similar to telephone service in some ways, our VoIP service arrangement utilizes different technology and is subject to many of the same rules and regulations applicable to traditional telephone service. The FCC order adopted on October 27, 2011, established rules governing intercarrier compensation payments for the origination and termination of telephone traffic between carriers and VoIP providers. In May 2014 the United States Court of Appeals for the Tenth Circuit upheld the FCC order reducing intercarrier compensation payments. The rules are likely to substantially decrease intercarrier compensation payments we may have otherwise received over a multi-year period. The decreases over the multi-year transition will affect both the amounts that we pay to telecommunications carriers and the amounts that we receive from other carriers. The schedule and magnitude of these decreases, however, will vary depending on the nature of the carriers and the telephone traffic at issue. We cannot yet predict with certainty the balance of the impact on our revenues and expenses for voice services at particular times over this multi-year period.
Further regulatory changes are being considered that could impact our VoIP service. The FCC and state regulatory authorities are considering, for example, whether certain common carrier regulations traditionally applied to incumbent local exchange carriers should be modified or reduced, and the extent to which common carrier requirements should be extended to VoIP providers. The FCC has already determined that certain providers of voice services using Internet Protocol technology must comply with requirements relating to 911 emergency services, CALEA, USF contribution, customer privacy and CPNI issues, number portability, network outage, rural call completion, disability access, regulatory fees, and discontinuance of service. In March 2007, a federal appeals court affirmed the FCC’s decision concerning federal regulation of certain VoIP services, but declined to specifically find that VoIP service provided by cable companies, such as we provide, should be regulated only at the federal level. As a result, some states, including West Virginia, began proceedings to subject cable VoIP services to state-level regulation. Although the West Virginia proceeding concluded without any new state-level regulation, it is difficult to predict whether it, or other state regulators, will continue to attempt to regulate our VoIP service. We have registered with, or obtained certificates or authorizations from, the FCC and the state regulatory authorities in those
16
states in which we offer competitive voice services in order to ensure the continuity of our services and to maintain needed network interconnection arrangements. It is not clear how the FCC Order to reclassify wireline and wireless broadband services as Title II common carrier services, and pursuant to Section 706, will affect the regulatory status of our VoIP services. Further, it is also unclear whether and how these and other ongoing regulatory matters ultimately will be resolved. In November 2014, the FCC adopted an order imposing limited backup power obligations on providers of facilities-based fixed, residential voice services that are not otherwise line-powered, including our VoIP services. This Order became effective for providers with fewer than 100,000 U.S. customer lines in August 2016 and now requires the Company to disclose certain information to customers and to make available back up power at the point of sale.
Prospective competitors of Shenandoah Cable may also receive disbursements from the USF. Some of those competitors have requested USF support under the Connect America Fund to build broadband facilities in areas already served by Shenandoah Cable. Although Shenandoah Cable has opposed such requests where we offer service, we cannot predict whether the FCC or another agency will grant such requests or otherwise fund broadband service in areas already served by the company.
Other Issues.
Our ability to provide cable service may be affected by a wide range of additional regulatory and related issues, including FCC regulations pertaining to licensing of systems and facilities, set-top boxes, equipment compatibility, program exclusivity blackouts, advertising, public files, accessibility to persons with disabilities, emergency alerts, pole attachments, equal employment opportunity, privacy, consumer protection, and technical standards. For example, following enactment of the 21st Century Communications and Video Accessibility Act, the FCC has adopted new rules which require MVPDs to ensure that all non-exempt video programming they distribute on television includes closed captions, certain IP delivered programming they delivered includes closed captions, certain video programming delivered on television and to second screen devices includes video descriptions, emergency information is delivered in a format that is accessible to both hearing and vision impaired viewers, program guides are accessible to persons who are visually impaired and/or blind. In addition, proceedings before the FCC and state regulatory bodies have examined the rates that cable operators must pay to use utility poles and conduits, and other terms and conditions of pole attachment agreements. Pole attachment costs are significant and changes in pole attachment regulation and the resulting rates could have an adverse impact on our operations. We cannot predict the nature and pace of these and other developments or the effect they may have on our operations.
Employees
At December 31, 2016, we had approximately 1,236 employees, of whom approximately 1,187 were full-time employees. None of our employees is represented by a union or covered by a collective bargaining agreement.
17
Executive Officers of the Registrant
The following table presents information about our executive officers who, other than Christopher E. French, are not members of our board of directors. Our executive officers serve at the pleasure of the Board of Directors.
|
Name
|
Title
|
Age
|
Date in Position
|
|
Christopher E. French
|
President and Chief Executive Officer
|
59
|
April 1988
|
|
Earle A. MacKenzie
|
Executive Vice President and Chief Operating Officer
|
64
|
June 2003
|
|
Adele M. Skolits
|
Vice President – Finance, Chief Financial Officer and Treasurer
|
58
|
September 2007
|
|
William L. Pirtle
|
Senior Vice President – Wireless
|
57
|
September 2015
|
|
Raymond B. Ostroski
|
General Counsel, Vice President - Legal and Corporate Secretary
|
62
|
January 2013
|
|
Thomas A. Whitaker
|
Senior Vice President – Cable
|
56
|
September 2015
|
|
Edward H. McKay
|
Senior Vice President – Wireline and Engineering
|
44
|
September 2015
|
|
Richard A. Baughman
|
Vice President – Information Technology
|
49
|
June 2010
|
Mr. French is President and Chief Executive Officer of the Company, where he is responsible for the overall leadership and strategic direction of the Company. He has served as President since 1988, and has been a member and Chairman of the Board of Directors since 1996. Prior to appointment as President, Mr. French held a variety of positions with the Company, including Vice President Network Service and Executive Vice President. Mr. French holds a BS in electrical engineering and an MBA, both from the University of Virginia. He has held board and officer positions in both state and national telecommunications associations, including service as a director of the Organization for the Promotion and Advancement of Small Telecommunications Companies (OPASTCO) and was president and director of the Virginia Telecommunications Industry Association. Mr. French is currently a member of the Leadership Committee of the USTelecom Association.
Mr. MacKenzie is Executive Vice President and Chief Operating Officer (COO) of the Company. He joined the Company in 2003, and is responsible for Shentel's daily operations of its subsidiaries. Mr. MacKenzie began his career in the telecommunications industry in 1975. He was the co-founder and President of Broadslate Networks and Essex Communications. He served as COO of Digital Television Services and as Senior Vice President of Contel Cellular. Mr. MacKenzie is a graduate of The College of William and Mary and holds a BBA in accounting. Mr. MacKenzie is a member of the Board of Directors of the American Cable Association.
Ms. Skolits serves as Chief Financial Officer and Vice President - Finance at Shentel. She joined the Company in 2007 and is responsible for Shentel's daily financial decisions. Ms. Skolits’ industry experience began in 1995 and included three years with Revol Wireless where she served as Chief Financial Officer. Ms. Skolits' telecommunications experience also includes serving as Controller for Comcast Metrophone, Director of Financial Operations for Comcast Cellular Communications and Chief Financial Officer of City Signal Communications. Ms. Skolits earned a BS degree in Commerce with a concentration in Accounting from the University of Virginia.
Mr. Pirtle is Senior Vice President - Wireless for Shentel. He was promoted to Senior Vice President in September 2015. He is responsible for sales and marketing of Sprint branded wireless products and services, Shentel branded cable TV, Internet access, and voice products and services offered by the company. He is also responsible for the Shentel brand identity. His previous position was Vice President - Wireless, responsible for Shentel’s Wireless segment. He joined the Company in 1992 as Vice President - Network Services responsible for Shentel's technology decisions, maintenance and operation of its telephone, cable, cellular, paging and fiber optics networks. He helped launch Shentel's Internet business in 1994, and led its participation in its wireless PCS business and Sprint affiliation beginning in 1995. Mr. Pirtle is a co-founder of the Shenandoah Valley Technology Council and
18
has represented the Company on the Board of ValleyNet and on the Board of the Competitive Carriers Association. He is a graduate of the University of Virginia.
Mr. Ostroski is General Counsel and Vice President – Legal and Corporate Secretary for Shentel. He joined Shentel in 2013 and is responsible for all legal and regulatory compliance matters for the Company. He also acts as Corporate Secretary to the Company’s Board of Directors. Mr. Ostroski began his career in the telecommunications industry in 1985 and has served as Executive Vice President and General Counsel for One Communications, Senior Vice President and General Counsel for Commonwealth Telephone Enterprises, Executive Vice President and General Counsel for RCN Corporation and Senior Vice President and General Counsel of C-TEC Corporation. Mr. Ostroski earned a BS degree in Social Science from Wilkes University and also earned a Juris Doctor degree from Temple University School of Law.
Mr. Whitaker is Senior Vice President - Cable for Shentel. He was promoted to Senior Vice President in September 2015. He was previously the Vice President - Cable with responsibility for Shentel cable operations. Mr. Whitaker joined Shentel in 2004 through the Shentel acquisition of NTC Communications. Mr. Whitaker is responsible for Shentel cable operations, sales and marketing. Additionally, he supports the Shentel Network Operations Center. Mr. Whitaker began his career in 1983. He previously was COO of NTC Communications, and served as Vice President of Network Operations at Broadslate Networks, Director of Wireless Operations for nTelos, and was Co-Founder and Vice President of Nat-Com, Incorporated. Mr. Whitaker is a graduate of West Virginia Wesleyan College in Buckhannon, WV.
Mr. McKay is Senior Vice President - Wireline and Engineering for Shentel. He was promoted to Senior Vice President in September 2015. He is responsible for network planning and engineering for all Shentel’s networks and the marketing and sales of Shentel’s fiber and wireline network. Previously he was Vice President - Wireline and Engineering. Mr. McKay joined Shentel in 2004 and began his telecommunications industry career in 1996, including previous engineering management positions at UUNET and Verizon. He is a graduate of the University of Virginia, where he earned ME and BS degrees in Electrical Engineering. He represents the Company on the Board of ValleyNet.
Mr. Baughman is Vice President - Information Technology of Shentel. He began his career in 1991 working with the Navy and entered the telecommunications industry in 1995, working for companies including Bellcore/Telcordia, AT&T, Lucent, WINfirst and SureWest. He joined the Company in 2006 and is responsible for all of the back-office software and infrastructure systems at Shentel. Mr. Baughman has a BS in Electrical Engineering from Lafayette College and an MS in Optics from the University of Rochester.
Websites and Additional Information
The Company maintains a corporate website at
www.shentel.com.
We make available free of charge through our website our annual report on Form 10-K, quarterly reports on Form 10-Q, current reports on Form 8‑K and all amendments to those reports, as soon as reasonably practicable after we electronically file or furnish such reports with or to the SEC. The contents of our website are not a part of this report. In addition, the SEC maintains a website at
www.sec.gov
that contains reports, proxy and information statements and other information regarding the Company.
19
|
ITEM 1A.
|
RISK FACTORS
|
Our business and operations are subject to a number of risks and uncertainties. The risks set forth under "Business-Competition" and the following risk factors should be read carefully in connection with evaluating our business. The following risks (or additional risks and uncertainties not presently known to us or that we currently believe to be immaterial) could materially affect our financial results and conditions.
Risks Related to the Telecommunications Industry
Intensifying competition in all segments of our business may limit our ability to sustain profitable operations.
As new technologies are developed and deployed by competitors in our service area, some of our subscribers may select other providers’ offerings based on price, capabilities or personal preferences. Most of our competitors possess greater resources, have more extensive coverage areas and offer more services than we do. If significant numbers of our subscribers elect to move to competing providers, or if market saturation limits the rate of new subscriber additions, we may not be able to sustain profitable operations.
Nationwide, incumbent local exchange carriers have experienced a decrease in access lines due to the effect of wireless and wireline competition. We have experienced reductions in the number of access lines to date, but based on industry experience we anticipate that the long-term trend toward declining telephone subscriber counts will continue. There is a significant risk that this downward trend will have a material adverse effect on the Company’s landline telephone operations in the future.
The Company’s revenue from fiber leases may be adversely impacted by price competition for these facilities.
Alternative technologies, changes in the regulatory environment and current uncertainties in the marketplace may reduce future demand for existing telecommunication services.
The telecommunications industry is experiencing significant technological change, evolving industry standards, ongoing improvements in the capacity and quality of digital technology, shorter development cycles for new products and enhancements and changes in end-user requirements and preferences. Technological advances, industry changes, changes in the regulatory environment and the availability of additional spectrum or additional flexibility with respect to the use of currently available spectrum could cause the technology we use to become obsolete. We and our vendors may not be able to respond to such changes and implement new technology on a timely basis, or at an acceptable cost.
Adverse economic conditions in the United States and in our market area involving significantly reduced consumer spending could have a negative impact on our results of operations.
Our customers are individual consumers and businesses. Any national economic weakness, restricted credit markets or high unemployment rates could depress consumer spending and harm our operating performance. In addition, our customers are located in a relatively concentrated geographic area; therefore, any adverse economic conditions that affect our geographic markets in particular could have a disproportionately negative impact on our results.
Regulation by government and taxing agencies may increase our costs of providing service or require changes in services, either of which could impair our financial performance.
Our operations are subject to varying degrees of regulation by the FCC, the Federal Trade Commission, the FAA, the Environmental Protection Agency and the Occupational Safety and Health Administration, as well as by state and local regulatory agencies and franchising authorities. Action by these regulatory bodies could negatively affect our operations and our costs of doing business. For example, changes in tax laws or the interpretation of existing tax laws by state and local authorities could increase income, sales, property or other tax costs.
Our access revenue may be adversely impacted by legislative or regulatory actions or by technology developments that decrease access rates or exempt certain traffic from paying for access to our regulated telephone network.
On October 27, 2011, the FCC adopted a number of broad changes to the intercarrier compensation rules governing the interstate access rates charged by small-to-mid-sized ILECs such as Shenandoah Telephone. For example, the
20
FCC adopted a national “bill and keep” framework, which may result in substantial reductions in the access charges paid by long distance carriers and other interconnecting carriers, possibly to zero, accompanied by increases to the subscriber line charges paid by business and residential end users. In addition, the FCC has changed some of the rules that determine what compensation carriers, including but not limited to wireless carriers, competitive local exchange carriers, VoIP providers and providers of other Internet-enabled services, should pay (and receive) for their traffic that is interconnected with ILEC networks. These changes, and potential future changes, to such compensation regulations could increase our expenses or reduce our revenues. In addition, the Company is working to resolve several routine interconnection and intercarrier compensation-related disputes concerning the appropriate access rates and terms for the origination and termination of traffic on third-party networks.
The VSCC has jurisdiction over local telephone companies’ intrastate access charges. The VSCC issued a Final Order on August 9, 2011 that requires elimination of common carrier line charges in three stages. Pursuant to this order, the Company’s intrastate common line revenue declined in 2011, 2012 and 2013 and was ultimately eliminated in mid-2014.
Our distribution networks may be subject to weather-related events that may damage our networks and adversely impact our ability to deliver promised services or increase costs related to such events.
Our distribution networks may be subject to weather-related events that could damage our networks and impact service delivery. Some published reports predict that warming global temperatures will increase the frequency and severity of such weather-related events. Should such predictions be correct or for other reasons there are more weather-related events, and should such events impact the Mid-Atlantic region covered by our networks more frequently than in the past, our revenues and expenses could be materially adversely impacted.
Risks Related to our Overall Business Strategy
We may not benefit from our acquisition strategy.
As part of our business strategy, we regularly evaluate opportunities to enhance the value of the Company by pursuing acquisitions of other businesses. Although we remain subject to financial and other covenants in our credit agreement that may limit our ability to pursue certain strategic opportunities, we intend to continue to evaluate and, when appropriate, pursue strategic acquisition opportunities as they arise. We cannot provide any assurance, however, with respect to the timing, likelihood, size or financial effect of any potential transaction involving the Company, as we may not be successful in identifying and consummating any acquisition or in integrating any newly acquired business into our operations.
The evaluation of business acquisition opportunities and the integration of any acquired businesses pose a number of significant risks, including the following:
|
•
|
acquisitions may place significant strain on our management, financial and other resources by requiring us to expend a substantial amount of time and resources in the pursuit of acquisitions that we may not complete, or to devote significant attention to the various integration efforts of any newly acquired businesses, all of which will require the allocation of limited resources;
|
|
•
|
acquisitions may not have a positive impact on our cash flows or financial performance;
|
|
•
|
even if acquired companies eventually contribute to an increase in our cash flows or profitability, such acquisitions may adversely affect our operating results in the short term as a result of transaction-related expenses we will have to pay or the higher operating and administrative expenses we may incur in the periods immediately following an acquisition as we seek to integrate the acquired business into our operations;
|
|
•
|
we may not be able to realize anticipated synergies or eliminate as many redundant costs as we anticipate;
|
|
•
|
our operating and financial systems and controls and information services may not be compatible with those of the companies we may acquire and may not be adequate to support our integration efforts, and any steps we take to improve these systems and controls may not be sufficient;
|
21
|
•
|
our business plans and projections used to justify the acquisitions and expansion investments are based on assumptions of revenues per subscriber, penetration rates in specific markets where we operate and expected operating costs. These assumptions may not develop as projected, which may negatively impact our profitability or the value of our intangible assets;
|
|
•
|
growth through acquisitions will increase our need for qualified personnel, who may not be available to us or, if they were employed by a business we acquire, remain with us after the acquisition; and
|
|
•
|
acquired businesses may have unexpected liabilities and contingencies, which could be significant.
|
Our ability to comply with the financial covenants in our credit agreement depends primarily on our ability to generate sufficient operating cash flow.
Our ability to comply with the financial covenants under the agreement governing our secured credit facilities will depend primarily on our success in generating sufficient operating cash flow. Under our credit agreement, we are subject to a total leverage ratio covenant, a minimum debt service coverage ratio covenant and a minimum liquidity test. Industry conditions and financial, business and other factors, including those we identify as risk factors in this and our other reports, will affect our ability to generate the cash flows we need to satisfy those financial tests and ratios. Our failure to satisfy the tests or ratios could result in a default and acceleration of repayment of the indebtedness under our credit facilities. If the maturity of our indebtedness were accelerated, we may not have sufficient funds to repay such indebtedness. In such event, to the extent permitted by our credit agreement and applicable law, our lenders would be entitled to proceed against the collateral securing the indebtedness, which includes substantially all of our assets and the assets of our subsidiaries.
Our level of indebtedness could adversely affect our financial health and ability to compete.
As of December 31, 2016, we had $847.9 million of total long-term indebtedness. Our level of indebtedness could have important adverse consequences. For example, it may:
|
•
|
increase our vulnerability to general adverse economic and industry conditions, including interest rate increases, because as of December 31, 2016, a significant portion of our borrowings were, and may continue to be, subject to variable rates of interest;
|
|
•
|
require us to dedicate a substantial portion of our cash flow from operations to payments on our indebtedness, thereby reducing the availability of our cash flow to fund working capital, capital expenditures, dividends and other general corporate purposes;
|
|
•
|
limit our ability to borrow additional funds to alleviate liquidity constraints, as a result of financial and other restrictive covenants in our credit agreement;
|
|
•
|
limit our flexibility in planning for, or reacting to, changes in our business and the industry in which we operate; and
|
|
•
|
place us at a competitive disadvantage relative to companies that have less indebtedness.
|
In addition, our secured credit facilities impose operating and financial restrictions that limit our discretion on some business matters, which could make it more difficult for us to expand, finance our operations and engage in other business activities that may be in our interest. These restrictions limit our ability and that of our subsidiaries to, among other things:
|
•
|
incur additional indebtedness and additional liens on our assets;
|
|
•
|
engage in certain mergers or acquisitions or asset dispositions;
|
|
•
|
pay dividends or make other distributions;
|
|
•
|
voluntarily prepay other indebtedness;
|
|
•
|
enter into transactions with affiliated persons;
|
22
|
•
|
make certain investments; and
|
|
•
|
change the nature of our business.
|
In addition to the term loan secured indebtedness we have incurred and the $75 million of revolving credit indebtedness we may incur from time to time, we may incur additional indebtedness under our credit facilities. Any additional indebtedness we may incur in the future may subject us to similar or even more restrictive conditions.
Our ability to refinance our indebtedness in the future, should circumstances require it, will depend on our ability in the future to generate cash flows from operations and to raise additional funds, including through the offering of equity or debt securities and through our access to bank debt markets. We may not be able to generate sufficient cash flows from operations or to raise additional funds in amounts necessary for us to repay our indebtedness when such indebtedness becomes due and to meet our other cash needs.
Disruptions of our information technology infrastructure could harm our business.
We depend on our information technology infrastructure to achieve our business objectives. A disruption of our infrastructure could be caused by a natural disaster, manufacturing failure, telecommunications system failure, cybersecurity attack, intrusion or incident, or defective or improperly installed new or upgraded business management systems. Portions of our IT infrastructure also may experience interruptions, delays or cessations of service or produce errors in connection with systems integration or migration work that takes place from time to time. In the event of any such disruption, we may be unable to conduct our business in the normal course. Moreover, our business involves the processing, storage and transmission of data, which would also be negatively affected by such an event. A disruption of our infrastructure could cause us to lose customers and revenue, particularly during a period of heavy demand for our services. We also could incur significant expense in repairing system damage and taking other remedial measures.
We could suffer a loss of revenue and increased costs, exposure to significant liability, reputational harm and other serious negative consequences if we sustain cyber-attacks or other data security breaches that disrupt our operations or result in the dissemination of proprietary or confidential information about us or our customers or other third parties.
We utilize our information technology infrastructure to manage and store various proprietary information and sensitive or confidential data relating to our operations. We routinely process, store and transmit large amounts of data for our customers, including sensitive and personally identifiable information. We depend on our information technology infrastructure to conduct business operations and provide customer services. We may be subject to data breaches and disruptions of the information technology systems we use for these purposes. Our industry has witnessed an increase in the number, intensity and sophistication of cybersecurity incidents caused by hackers and other malicious actors such as foreign governments, criminals, hacktivists, terrorists and insider threats. Hackers and other malicious actors may be able to penetrate our network security and misappropriate or compromise our confidential, sensitive, personal or proprietary information, or that of third parties, and engage in the unauthorized use or dissemination of such information. They may be able to create system disruptions, or cause shutdowns. Hackers and other malicious actors may be able to develop and deploy viruses, worms, ransomware and other malicious software programs that attack our products or otherwise exploit any security vulnerabilities of our systems. In addition, sophisticated hardware and operating system software and applications that we procure from third parties may contain defects in design or manufacture, including “bugs,” cybersecurity vulnerabilities and other problems that could unexpectedly interfere with the operation or security of our systems.
The consequences of a breach of our security measures, a cyber-related service or operational disruption, or a breach of personal, confidential, proprietary or sensitive data caused by a hacker or other malicious actor could be significant for us, our customers and other affected third parties. For example, the consequences could include damage to infrastructure and property, impairment of business operations, disruptions to customer service, financial costs and harm to our liquidity, costs associated with remediation, loss of revenues, loss of customers, competitive disadvantage, legal expenses associated with litigation, regulatory action, fines or penalties or damage to our brand and reputation.
In addition, the costs to us to eliminate or address the foregoing security challenges and vulnerabilities before or after a cyber incident could be significant. In addition, our remediation efforts may not be successful and could
23
result in interruptions, delays or cessation of service. We could also lose existing or potential customers for our services in connection with any actual or perceived security vulnerabilities in the services.
We are subject to laws, rules and regulations relating to the collection, use and security of user data. Our operations are also subject to federal and state laws governing information security. In the event of a data breach or operational disruption caused by an information security incident, such rules may require consumer and government agency notification and may result in regulatory enforcement actions with the potential of monetary forfeitures as well as civil litigation. We have incurred, and will continue to incur, expenses to comply with privacy and security standards and protocols imposed by law, regulation, industry standards and contractual obligations.
Our balance sheet contains certain intangible assets including goodwill that we may be required to write off or write down in the future in the event of the impairment of certain of those assets arising from any deterioration in our future performance or other circumstances. Such write-offs or write-downs could adversely impact our earnings and stock price, and our ability to obtain financing in the future.
At December 31, 2016, we had $145.3 million in goodwill capitalized on our balance sheet and $454.5 million of other intangible assets capitalized on our balance sheet, which collectively represented 40.4% of our total assets at that date.
We test our goodwill and other intangible assets for impairment annually or when events or circumstances warrant. If the testing performed indicates that impairment has occurred, we are required to record an impairment charge for the difference between the carrying value of the intangible asset and the fair value of the intangible asset, in the period in which the determination is made.
We may be required in the future to write off or write down certain intangible assets including goodwill in the event of deterioration in our future performance, sustained slower growth or other circumstances. Such a write off or write down could adversely impact our earnings and stock price, and our ability to obtain financing in the future.
We have identified material weaknesses in our internal control over financial reporting that, if not properly corrected, could materially adversely affect our operations and result in material misstatements in our financial statements.
As described in "Item 9A.
Controls and Procedures"
, we have concluded that our internal control over financial reporting was ineffective as of December 31, 2016 because material weaknesses existed in our internal control over financial reporting related to the inadequate design and documentation of management review controls over the accounting for significant, complex and unusual transactions, accounting for income taxes, and the preparation of the consolidated statements of cash flows. For 2016, such transactions included the acquisition of nTelos and asset exchange transaction with Sprint that closed on May 6, 2016. A material weakness is a deficiency, or combination of deficiencies, in internal control over financial reporting such that there is a reasonable possibility that a material misstatement of our annual or interim consolidated financial statements will not be prevented or detected on a timely basis.
The Company is in the process of identifying and implementing certain changes in our internal controls to address the material weaknesses. Specifically, the Company is documenting, implementing, and assessing necessary changes in the risk assessment process and in the design of the controls, and identifying additional controls and additional resources required to ensure effective management and technical review and documentation. Although the Company is taking the foregoing actions to remediate the material weakness and believe, based on our evaluation to date, that the material weakness will be remediated during 2017, we cannot assure you that this will occur within the contemplated timeframe. Moreover, we cannot assure you that we will not identify additional material weaknesses in our internal control over financial reporting in the future. If we are unable to remediate the material weakness, our ability to record, process and report financial information accurately, and to prepare financial statements within the time periods specified by the rules and forms of the Securities and Exchange Commission, could be adversely affected. The occurrence of or failure to remediate the material weakness may adversely affect our reputation and business and the market price of our common stock and any other securities we may issue.
We have an underfunded non-contributory defined benefit pension plan.
Through our acquisition of nTelos, we assumed nTelos’ non-contributory defined benefit pension plan covering all employees who met eligibility requirements and were employed by nTelos prior to October 1, 2003. This pension
24
plan was closed to nTelos employees hired on or after October 1, 2003. As of December 31, 2016, the plan was underfunded under U.S. GAAP measures by $10.3 million. See Note 9 of the Notes to Consolidated Financial Statements for additional information regarding the accounting for the defined benefit pension and other postretirement benefit plans. We do not expect that we will be required to make a cash contribution to the underfunded pension plan in 2017, but we may be required to make cash contributions in future periods depending on the level of interest rates and investment returns on plan assets.
Increases in our costs of providing benefits under our non-contributory defined benefit pension plan and other postretirement benefit plans could negatively impact our results of operations and cash flows.
The measurement of the plan obligations and costs of providing benefits under our defined benefit pension and other postretirement benefit plans involves various factors, including the development of valuation assumptions and accounting policy elections. We are required to make assumptions and estimates that include the discount rate applied to benefit obligations, the long-term expected rate of return on plan assets, the anticipated rate of increase of health care costs, our expected level of contributions to the plans, the incidence of mortality, the expected remaining service period of plan participants, the level of compensation and rate of compensation increases, employee age, length of service, and the long-term expected investment rate credited to employees of certain plans, among other factors. See Note 9 of the Notes to Consolidated Financial Statements for additional information regarding the accounting for the defined benefit pension and other postretirement benefit plans. If our benefit plans' costs increase, due to adverse changes in the U.S. securities markets, resulting in worse-than-assumed investment returns and discount rates, and adverse medical cost trends, our financial condition and operating results could be adversely affected.
Risks Relating to the Recently Completed nTelos Acquisition and the Sprint Transactions
In connection with the nTelos acquisition, we incurred significant additional indebtedness, which could materially and adversely affect us, including by decreasing our business flexibility.
We have substantially increased indebtedness following completion of the nTelos acquisition in comparison to that of the Company on a recent historical basis, which has increased our interest expense and amortization requirements and could have the effect, among other things, of reducing our flexibility to respond to changing business and economic conditions. The amount of cash required to pay interest on our increased indebtedness and the increased amortization requirements to pay down the loan balances following the nTelos acquisition, and thus the demands on our cash resources, could be greater than the amount of cash flows required to service our indebtedness prior to the nTelos acquisition. Our increased levels of indebtedness could also reduce funds available for working capital, capital expenditures, dividends and other general corporate purposes and may create competitive disadvantages for us relative to other companies with lower debt levels. If we do not achieve the expected benefits and cost savings from the nTelos acquisition, or if the financial performance of the combined company does not meet current expectations, then our ability to service this indebtedness may be materially and adversely impacted.
It may be difficult to successfully integrate the business of nTelos and we may fail to realize the anticipated benefits from the nTelos acquisition, which could materially and adversely affect our operating results and the market price of our common stock.
If we experience greater than anticipated costs to integrate nTelos into our existing operations our business and results of operations could be materially and negatively affected. In addition, it is possible that the ongoing integration process could result in the disruption of our ongoing business or inconsistencies in standards, controls, procedures and policies that adversely affect our ability to maintain relationships with customers and employees or to achieve the anticipated benefits of the nTelos acquisition. Integration efforts also may divert management attention and resources.
The success of the nTelos acquisition will also depend, in significant part, on our ability to successfully integrate the acquired business, retain and migrate nTelos’s customers and realize the synergies anticipated with the nTelos acquisition. Many of these synergies are not expected to occur for a period of time and will require capital expenditures to be fully realized. If we are unable to integrate nTelos successfully, we may not realize the anticipated benefits of the nTelos acquisition, including the anticipated synergies.
25
Risks Related to the Wireless Industry
New disclosure or usage requirements could adversely affect the results of our wireless operations.
The FCC is considering imposing additional consumer protection requirements upon wireless service providers, including billing-related disclosures and usage alerts. Such requirements could increase costs related to or impact the amount of revenue we receive from our wireless services.
Customer concerns over radio frequency emissions may discourage use of wireless handsets or expose us to potential litigation.
In the past, media reports and certain professional studies have suggested that certain radio frequency emissions from wireless handsets may be linked to various health problems, including cancer, and may interfere with various electronic medical devices, including hearing aids and pacemakers. Additionally, the FCC has commenced a rulemaking and notice of inquiry that seeks public comment on a variety of issues, including whether revisions to the existing radio frequency standards and testing requirements are warranted. Any decrease in demand for wireless services, increases in the costs of litigation or damage awards resulting from substantiation of harm from such emissions could impair our financial condition and results of operations.
Regulation by governmental authorities or potential litigation relating to the use of wireless handsets while driving could adversely affect the results of our wireless operations.
Some studies have indicated that some aspects of using wireless handsets while driving may impair driver's attention in certain circumstances, making accidents more likely. These concerns could lead to litigation relating to accidents, deaths or serious bodily injuries, or to new restrictions or regulations on wireless phone use. A number of state and local governments are considering or have enacted legislation that would restrict or prohibit the use of a wireless handset while driving a vehicle or, alternatively, require the use of a hands-free handset. Additionally, certain federal agencies have adopted rules and proposed guidelines for the use of wireless handsets while operating commercial and non-commercial vehicles. These rules, and any legislation that could be enacted, may require wireless service providers to supply to their subscribers hands-free enhanced services, such as voice-activated dialing and hands-free speaker phones and headsets, in order to continue generating revenue from subscribers, who make many of their calls while on the road. If we are unable to provide hands-free services and products to subscribers in a timely and adequate fashion, the volume of wireless phone usage would likely decrease, and the ability of our wireless operations to generate revenues would suffer.
Risks Related to our Wireless Services
The performance of our wireless service provider Shenandoah Personal Communications, LLC, our largest operating subsidiary in terms of revenues and assets, may be adversely affected by any interruption in, or other adverse change to, Sprint’s business.
We rely significantly on Sprint’s ongoing operations to continue to offer our wireless subscribers the seamless national services that we currently provide. Any interruption in, or other adverse change to, Sprint’s business could adversely affect our results of operations, liquidity and financial condition. Our business could also be adversely affected if competing national or regional wireless carriers are able to introduce new products and services or otherwise satisfy customers’ service demands more rapidly or more effectively than Sprint.
The costs associated with our ongoing participation in Sprint’s network modernization plan may affect our operating results, liquidity and financial position.
Sprint continues to modernize its wireless network with the intention of improving voice quality, coverage and data speeds and simultaneously reducing future operating costs. We participate in this plan and, to date, we have made significant upgrades in our service areas, but ongoing modernization efforts are expected to continue.
The continuing success of Sprint’s modernization plans will depend on the timing, extent and cost of implementation and the performance of third parties
.
Should Sprint’s implementation plan be delayed, our margins could be adversely affected and such effects could be material. Should Sprint’s future delivery of services expected to be deployed on the upgraded network be delayed, it could potentially result in the loss of customers to our competitors and adversely affect our revenues, profitability and cash flows from operations.
26
Our business may suffer as a result of competitive pressures.
Our revenue growth is primarily dependent on the growth of our subscriber base and monthly recurring charges to subscribers. Since 2014, competitive pressures in the wireless services industry have increased. These competitive pressures in the wireless telecommunications market could cause some major carriers to offer plans with increasingly larger bundles of minutes of use and data services or unlimited plans at lower prices. Increased price competition will lead to lower monthly recurring charges or a loss of subscribers in the future. Continued competitive pressures could require Sprint to lower its prices, which will limit growth in monthly recurring charges to subscribers and could adversely affect our revenues, profitability and cash flows from operations.
We may not be able to implement our business plan successfully if our operating costs are higher than we anticipate.
Increased competition may lead to higher promotional costs to acquire subscribers. If these costs are more than we anticipate, the actual amount of funds available to implement our operating strategy and business plan may fall short of our estimates.
The dynamic nature of the wireless market may limit management’s ability to correctly identify causes of volatility in key operating performance measures.
Our business plan and estimated future operating results are based on estimates of key operating performance measures, including subscriber growth, subscriber turnover (commonly known as churn), average monthly revenue per subscriber, equipment revenue, subscriber acquisition costs and other operating costs. Continued moves by all carriers to offer installment billing and leasing for wireless handsets will have an effect on revenues, cost of goods sold and churn. The dynamic nature of the wireless market, economic conditions, increased competition in the wireless telecommunications industry, the entry of new competitors due to recent or future FCC spectrum auctions, new service offerings by Sprint or competitors at lower prices and other issues facing the wireless telecommunications industry in general have created a level of uncertainty that may adversely affect our ability to predict these key measures of performance.
We may experience a high rate of subscriber turnover, which could adversely affect our future financial performance.
Subscriber loss, or churn, has been relatively stable in recent years. Because of significant competition in the industry, the popularity of prepaid wireless service offerings, changes to Sprint’s competitive position and economic uncertainty, among other factors, this relative stability may not continue and the future rate of subscriber turnover may be higher than in recent periods.
A high rate of subscriber loss could increase the sales and marketing costs we incur in obtaining new subscribers, especially because, consistent with industry practice, even with the introduction of wireless handset installment billing and leasing, we expect to continue to subsidize a portion of the costs related to the purchases of wireless handsets by some subscribers.
We may incur significantly higher wireless handset subsidy costs than we anticipate for existing subscribers who upgrade to a new wireless
handset.
As our subscriber base matures, and technological innovations occur, we anticipate that existing subscribers will continue to upgrade to new wireless handsets. To discourage customer defections to competitors, we offer price plans that subsidize a portion of the price of wireless handsets and, in some cases, incur sales commissions for wireless handset upgrades. If more subscribers upgrade to new subsidized wireless handsets than we project, or if the cost of such wireless handsets increases or the amount of wireless handset subsidies offered in the competitive marketplace increases more than we project, our results of operations will be adversely affected. If we do not continue to offer the option to subsidize the cost of wireless handsets for upgrades, subscribers could choose to deactivate the service and move to our competitors.
27
If we are unable to secure and retain tower sites, the level of service we provide could be adversely affected.
Many of our cell sites are co-located on leased tower facilities shared with one or more wireless providers. A large portion of these leased tower sites are owned by a limited number of companies. If economic conditions adversely affect the leasing company, then our ability to enter into leases at new locations may be affected, which could leave portions of our service area without service and increase customer turnover or adversely affect our ability to expand into new geographic areas.
Most of the towers that we own are located on leased real property. If such leases are not renewed, we may have to relocate those cell sites, which would create significant additional expenses, or leave portions of our service area without service, increasing the likelihood of customer turnover.
Risks Related to Our Relationship with Sprint
Sprint may make business decisions that are not in our best interests, which may adversely affect our business and our relationships with subscribers in our territory, increase our expenses and decrease our revenues.
Under its agreements with us, Sprint has a substantial amount of control over the conduct of our wireless business. Accordingly, Sprint may make decisions that could adversely affect our wireless business, such as the following:
|
•
|
Sprint could price its national plans based on its own objectives and could set price levels or other terms that may not be economically advantageous for us;
|
|
•
|
Sprint could develop products and services that could adversely affect our results of operations;
|
|
•
|
if Sprint’s costs to perform certain services exceed the costs they expect, subject to limitations under our agreements, Sprint could seek to increase the amounts charged to us for such services;
|
|
•
|
Sprint could make decisions that could adversely affect the Sprint brand names, reputation, or products or services, which could adversely affect our business;
|
|
•
|
Sprint could make technology and network decisions that could greatly increase our capital investment requirements and our operating costs to continue offering the seamless national service we provide; and
|
|
•
|
Sprint could restrict our ability to offer new services needed to remain competitive. This could put us at a competitive disadvantage relative to other wireless service providers if those other wireless service providers begin offering those new services in our market areas, increasing our churn, adversely affecting our ability to obtain new subscribers and reducing our revenues and operating income from wireless services.
|
Our dependence on Sprint for services may limit our ability to forecast operating results.
Our dependence on Sprint injects a degree of uncertainty into our business and financial planning. We may, at times, disagree with Sprint concerning the applicability, calculation approach, or accuracy of Sprint-supplied revenue data. It is our practice to reflect the information supplied by Sprint in our financial statements for the applicable periods and to make corrections, if any, no earlier than the period in which Sprint and we agree to the corrections.
Inaccuracies in data provided by Sprint could overstate or understate our expenses or revenues and result in out-of-period adjustments that may adversely affect our financial results.
Because Sprint provides billing and collection services for us, Sprint remits a significant portion of our total revenues. We rely on Sprint to provide accurate, timely and sufficient data and information to enable us to properly record revenues, expenses and accounts receivable which underlie a substantial portion of our financial statements and other financial disclosures. We and Sprint could discover errors or inaccuracies, which, even if not material to Sprint, could be material to us. If we are required in the future to make adjustments or incur charges as a result of errors or inaccuracies in data provided by Sprint, such adjustments or charges could materially affect our financial results for the period with respect to which the adjustments are made or charges are incurred. Such adjustments or charges could require restatement of our financial statements.
28
We are subject to risks relating to Sprint’s provision of back office services and to changes in Sprint's products, services, plans and programs.
Any failure by Sprint to provide high-quality back office services could lead to subscriber dissatisfaction, increased churn or otherwise increased costs or loss of revenue. We rely on Sprint’s internal support systems, including customer care, billing and back office support. Our operations could be disrupted if Sprint is unable to provide or expand its internal support systems while maintaining acceptable service levels, or to efficiently outsource those services and systems through third-party vendors.
In addition, restrictions exist, and new restrictions are considered from time to time by Congress, federal agencies and states, on the extent to which wireless customers may receive unsolicited telemarketing calls, text messages, junk e-mail or spam. Our reliance on Sprint to perform those functions could subject us to potential liabilities. For example, an FCC enforcement action in 2015 resulted in a significant fine assessed upon Sprint following investigations that revealed that Sprint had improperly billed customers millions of dollars in unauthorized third-party premium text messaging services.
The competitiveness of Sprint’s wireless products and services is a key factor in our ability to attract and retain subscribers. Changes in Sprint’s wireless products and services may reduce subscriber additions, increase subscriber churn and decrease subscriber credit quality.
Sprint’s roaming arrangements to provide service outside of the Sprint National Network may not be competitive with other wireless service providers, which may restrict our ability to attract and retain subscribers and may increase our costs of doing business.
We rely on Sprint’s roaming arrangements with other wireless service providers for coverage in areas where Sprint wireless service is not available. If customers are not able to roam quickly or efficiently onto other wireless networks, we may lose current subscribers and Sprint wireless services may be less attractive to new subscribers.
The risks related to our roaming arrangements include the following:
|
•
|
the quality of the service provided by another provider while roaming may not approximate the quality of the service provided by the Sprint wireless network;
|
|
•
|
the price of a roaming call off network may not be competitive with prices of other wireless companies for roaming calls, or may not be “commercially reasonable” (as determined by the FCC);
|
|
•
|
customers may not be able to use Sprint’s advanced features, such as voicemail notification, while roaming; and
|
|
•
|
Sprint or the carriers providing the service may not be able to provide accurate billing information on a timely basis.
|
Some provisions of the Sprint agreements may diminish the value of our common stock and restrict or diminish the value of our business.
Under limited circumstances involving non-renewal of our agreement or a breach by us, Sprint may purchase the operating assets of our wireless operations at a discount of 10% in the event of non-renewal, or 19% in the event of a breach. These discounts would be applied to the “entire business value” (“EBV”) as that term is defined in our agreement with Sprint. EBV is defined as (i) the fair market value of a going concern paid by a willing buyer to a willing seller in a change of control transaction; (ii) valued as if the business will continue to utilize existing brands and operate under existing agreements; and, (iii) valued as if we have continued use of the spectrum then in use in the network. Determination of EBV is made by an independent appraisal process. In addition, Sprint must approve any assignment of the Sprint agreements by us. Sprint also has a right of first refusal to purchase our wireless operating assets if we decide to sell those assets to a third party. These restrictions and other restrictions contained in the Sprint agreements could adversely affect the value of our common stock, may limit our ability to sell our wireless operating assets on advantageous terms, may reduce the value a buyer would be willing to pay to acquire those assets and may reduce the EBV, as described in the Sprint agreements.
29
We may have difficulty in obtaining an adequate supply of wireless handsets from Sprint.
We depend on our relationship with Sprint to obtain wireless handsets. Sprint orders wireless handsets from various manufacturers. We could have difficulty obtaining specific types of wireless handsets in a timely manner if:
|
•
|
Sprint does not adequately project the need for wireless handsets, or enter into arrangements for new types of wireless handsets or other customer equipment, for itself, its wireless affiliates and its other third-party distribution channels, particularly in connection with the transition to new technologies;
|
|
•
|
Sprint gives preference to other distribution channels;
|
|
•
|
we do not adequately project our need for wireless handsets;
|
|
•
|
Sprint modifies its wireless handset logistics and delivery plan in a manner that restricts or delays access to wireless handsets; or
|
|
•
|
there is an adverse development in the relationship between Sprint and its suppliers or vendors.
|
The occurrence of any of the foregoing could disrupt subscribers’ service, result in a decrease in our subscribers or adversely affect our ability to attract new subscribers.
If Sprint does not continue to enhance its nationwide digital wireless network, we may not be able to attract and retain subscribers.
Our wireless operations are dependent on Sprint’s national network. Sprint’s digital wireless network may not provide nationwide coverage to the same extent as the networks of its competitors, which could adversely affect our ability to attract and retain subscribers. Sprint currently covers a significant portion of the population of the United States, Puerto Rico and the U.S. Virgin Islands. Sprint offers wireless services, either on its own network or through its roaming agreements, in every part of the United States.
If Sprint’s wireless licenses are not renewed or are revoked, our wireless business would be harmed.
Non-renewal or revocation by the FCC of Sprint’s wireless licenses would significantly harm us. Wireless spectrum licenses are subject to renewal and revocation by the FCC. There may be opposition to renewal of Sprint’s wireless licenses upon their expiration, and Sprint’s wireless licenses may not be renewed. The FCC has adopted specific standards to apply to wireless license renewals. Any failure by Sprint to comply with these standards could cause revocation or forfeiture of Sprint’s wireless licenses.
If Sprint does not maintain control over its licensed spectrum, our Sprint agreements may be terminated, which would render us unable to continue providing service to our subscribers. Sprint may also need additional spectrum to keep up with customer demands and the availability and cost of this spectrum could impact our wireless business.
Risks Related to Our Cable Services
Our cable segment faces risks from increasing competition for the provision of video services, including competition resulting from new technologies.
Incumbent cable companies, which have historically provided video service, face competition from direct broadcast satellite providers, and more recently from large providers of wireline telecommunications services (such as Verizon, Centurylink and AT&T), which have begun to upgrade their networks to provide video services in addition to voice and broadband services. Wireless providers are also entering the market for video services by making such services available on handsets and tablets. In some areas, direct broadcast satellite providers have partnered with large incumbent telecommunications service providers to offer triple-play services. Moreover, consumers are increasingly accessing video content from alternative sources, such as Internet-based “over the top” providers (such as Netflix, Amazon, and Hulu) and applications. The influx of competitors in this area, together with the development of new technologies to support them, are resulting in significant changes in the video business models and regulatory provisions that have applied to the provision of video and other services. These developments may lead to a decline in the demand, price and profitability of our cable and related video services.
30
Our programming costs are subject to demands for increased payments.
The cable television industry has continued to experience an increase in the cost of programming, especially sports programming. In addition, as we add programming to our video services for existing customers or distribute existing programming to more customers, we incur increased programming expenses. Broadcasters affiliated with major over-the-air network services have been increasing their demands for cash payments and other concessions for the right to carry local network television signals on our cable systems. If we are unable to raise our customers’ rates or offset such increased programming and retransmission consent costs through the sale of additional services, these increased costs could have an adverse impact on our results of operations. Moreover, as our programming contracts and retransmission agreements with programming providers expire, there can be no assurance that they will be renewed on acceptable terms. The Copyright Office adopted rules in 2014 governing private audits of cable operators’ compulsory copyright payments, and any resulting audits initiated by copyright owners could lead to demands for increased copyright payments.
Changes to key regulatory requirements can affect our ability to compete.
As programming and retransmission consent costs and retail rates increase, Congress and the FCC have expressed concern about the impact on consumers, and they could impose restrictions affecting cable rates and programming packages that could adversely impact our existing business model.
The Company operates cable television systems in largely rural areas of Virginia, West Virginia and Maryland. Virginia has adopted legislation to make it easier for companies to obtain local franchises to provide cable television service. The FCC has adopted rules which substantially reduce the cost of obtaining a local franchise. These rules may make it easier for the Company to expand its cable television business, but also may result in increased competition for such business.
Many franchises establish comprehensive facilities and service requirements, as well as specific customer service standards and monetary penalties for non-compliance. In many cases, franchises are terminable if the franchisee fails to comply with significant provisions set forth in the franchise agreement governing system operations. Franchises are generally granted for fixed terms and must be periodically renewed. Franchising authorities may resist granting a renewal if either past performance or the prospective operating proposal is considered inadequate. Franchise authorities often demand concessions or other commitments as a condition to renewal. Our local franchises may not be renewed at expiration in which case we would have to cease operations or, operate under either temporary operating agreements or without a franchise while negotiating renewal terms with the local franchising authorities. We cannot assure you that we will be able to comply with all significant provisions of our franchise agreements. Additionally, although historically we have renewed our franchises without incurring significant costs, we cannot assure you that we will be able to renew, or to renew as favorably, our franchises in the future. A termination of or a sustained failure to renew a franchise in one or more key markets or obtaining such franchise on unfavorable terms could adversely affect our business in the affected geographic area.
Pole attachments are wires and cables that are attached to utility poles. Cable system attachments to investor-owned public utility poles historically have been regulated at the federal or state level, generally resulting in reasonable pole attachment rates for attachments used to provide cable service. In contrast, utility poles owned by municipalities or cooperatives are not subject to federal regulation and are generally exempt from state regulation and their attachment rates tend to be higher. Future regulatory changes in this area could impact the pole attachment rates we pay utility companies.
Since 2014, the FCC has considered proposals for new regulations intended to make our cable set-top boxes open to other service providers. If enacted, such new regulations concerning set-top boxes could increase our cost for equipment, affect our relationship with our customers, and/or enable third parties to try to offer equipment that accesses disaggregated cable content merged with other services delivered over the Internet to compete with our premium service offerings.
Any significant impairment of our non-amortizing cable franchise rights would lead to a decrease in our assets and a reduction in our net operating performance.
At December 31, 2016, we had non-amortizing cable franchise rights of approximately $64.3 million which constituted approximately 4.3% of total assets at that date. If we make changes in our business strategy or if market or other conditions adversely affect our cable operations, we may be forced to record an impairment charge, which
31
would lead to a decrease in the carrying value of the Company’s assets and reduction in our net operating performance. We test non-amortizing intangible assets for impairment annually or whenever events or changes in circumstances indicate impairment may have occurred. If the testing performed indicates that impairment has occurred, we are required to record an impairment charge for the difference between the carrying value of the non-amortizing intangible assets and the fair value of the non-amortizing intangible assets, in the period in which the determination is made. The testing of non-amortizing intangible assets for impairment requires the Company to make significant estimates about the future performance and cash flows of our Cable segment, as well as other assumptions. These estimates can be affected by numerous factors, including changes in economic, industry or market conditions, changes in underlying business operations, future reporting unit operating performance, changes in competition, or changes in technologies. Any changes to key assumptions about our Cable segment’s business and its future prospects, and actual performance compared with those assumptions, or other assumptions, could affect the fair value of our Cable segment non-amortizing intangibles, resulting in an impairment charge.
Risks Related To Our Broadband Services
Our broadband services may be adversely impacted by legislative or regulatory changes that affect our ability to develop and offer services or that could expose us to liability from customers or others.
The Company provides broadband Internet access services to its cable and telephone customers through cable modems and DSL. The FCC has adopted “open Internet” rules, also referred to as “net neutrality,” that could affect the Company’s provision of broadband services.
On February 26, 2015, in response to a federal appellate court ruling invalidating the FCC’s initial “open Internet” rules, the FCC adopted an order imposing new rules regulating broadband Internet access service. The Order reclassifies wireline and wireless broadband services as Title II common carrier services, and asserts legal authority to regulate broadband service offered by ISPs under Title II, Title III, and Section 706 of the Telecommunications Act. In an effort to protect consumers and edge providers, the new rules would prohibit ISPs from engaging in blocking, throttling, and paid prioritization, and the existing transparency rules would be enhanced. Reasonable network management activities would remain permitted. For the first time, under this Order the FCC has authority to hear complaints and take enforcement action if it determines that the interconnection of ISPs are not just and reasonable, or if ISPs fail to meet a new general obligation not to harm consumers or edge providers. The Order forbears (at least for now) from certain Title II regulation, such as rate regulation, tariffs and last-mile unbundling. It does not propose assessment of USF fees on broadband at this time. The Order has been appealed by multiple parties, but the rules are currently in effect. The Order could have a material adverse effect on our business and results of operations. There are also legislative proposals in Congress to preempt the FCC Chairman’s proposed “utility-style” regulation, while still addressing many of the underlying concerns. The FCC may revisit its decision to extend Title II obligations to broadband providers at some point in the future. We do not know at the current time if the new regulations will survive judicial review, nor do we know how they would be administered if they do, but they could limit our ability to efficiently manage our cable systems and respond to operational and competitive challenges. Such rules or statutes could also restrict arrangements between us and Internet content, application, and service providers, including backbone connection arrangements. In addition, if the FCC were to adopt new rules under a Title II framework, the reclassification of broadband services as Title II common carrier services could subject our services to far more extensive and burdensome federal and state regulation.
On January 29, 2015, the FCC, in a nation-wide proceeding evaluating whether “advanced broadband” is being deployed in a reasonable and timely fashion, increased the minimum connection speeds required to qualify as advanced broadband service to 25 Mbps for downloads and 3 Mbps for uploads. As a result, the FCC concluded that advanced broadband was not being sufficiently deployed and initiated a new inquiry into what steps it might take to encourage broadband deployment. This action may lead the FCC to adopt additional measures affecting our broadband business. At the same time, the FCC has ongoing proceedings to allocate additional spectrum for advanced wireless service, which could provide additional wireless competition to our broadband business.
The FCC imposes obligations on telecommunications service providers, including broadband Internet access service providers, and multichannel video program distributors, like our cable company, intended to ensure that individuals with disabilities are able to access and use telecommunications and video programming services and equipment. We cannot predict the nature and pace these requirements and other developments, or the impact they may have on our operations.
32
Risks Related to Our Voice Services
Offering voice communications service may subject us to additional regulatory burdens, causing us to incur additional costs.
We offer voice communications services over our cable broadband network and continue to develop and deploy VoIP services. The FCC has ruled that competitive telephone companies that support VoIP services, such as those we offer our customers, are entitled to interconnect with incumbent providers of traditional telecommunications services, which ensures that our VoIP services can compete in the market. The scope of these interconnection rights are being reviewed in a current FCC proceeding, which may affect our ability to compete in the provision of voice services or result in additional costs. The FCC has also declared that certain VoIP services are not subject to traditional state public utility regulation. The full extent of the FCC preemption of state and local regulation of VoIP services is not yet clear. Expanding our offering of these services may require us to obtain certain additional authorizations. We may not be able to obtain such authorizations in a timely manner, or conditions could be imposed upon such licenses or authorizations that may not be favorable to us. Telecommunications companies generally are subject to other significant regulation which could also be extended to VoIP providers. If additional telecommunications regulations are applied to our VoIP service, it could cause us to incur additional costs.
The FCC has already extended certain traditional telecommunications carrier requirements to many VoIP providers such as us, including E911, USF collection, CALEA, privacy of CPNI, number porting, rural call completion, network outage reporting, disability access, rural call completion and discontinuance of service requirements. In November 2014, the FCC adopted an order imposing limited backup power obligations on providers of facilities-based fixed, residential voice services that are not otherwise line-powered, including our VoIP services. This became effective for providers with fewer than 100,000 U.S. customer lines in August 2016 and now requires the Company to disclose certain information to customers and to make available back up power at the point of sale.
In November 2011, the FCC released an order significantly changing the rules governing intercarrier compensation payments for the origination and termination of telephone traffic between carriers, including VoIP service providers like us. The Tenth Circuit Court of Appeals upheld the rules in May 2014. The new rules will result in a substantial decrease in intercarrier compensation payments over a multi-year period. In addition, the potential transition of Local Number Portability Administrators may impact our ability to manage number porting and related tasks, and/or may result in additional costs arising from the transition to a new administrator.
|
ITEM 1B.
|
UNRESOLVED STAFF COMMENTS
|
None.
|
ITEM 2.
|
PROPERTIES
|
The Company owns its corporate headquarters, which occupies a 60,000-square foot building in Edinburg, Virginia. The Company owns three additional buildings in Edinburg:
|
•
|
a 26,500-square foot building that houses the Company's main switching center and technical staff,
|
|
•
|
a 14,000-square foot building that includes warehouse space and houses operations staff, and
|
|
•
|
a 10,700-square foot building used for customer services and retail sales.
|
With the acquisition of nTelos, the Company acquired three additional buildings in Waynesboro and one in Covington, Virginia:
|
•
|
a 17,500-square foot building that houses a switching and data center and technical staff,
|
|
•
|
a 15,500-square foot building that houses operational staff,
|
|
•
|
a 4,000-square foot building used for retail sales, and
|
|
•
|
a 15,600-square foot building that is leased to a third party
|
The Company owns nine telephone exchange buildings that are located in the major towns and some of the rural communities that are served by the regulated telecommunications operations. These buildings contain switching and fiber optic equipment and associated local exchange telecommunications equipment. The Company owns a building that houses customer service operations in Rustburg, Virginia. The Company has fiber optic hubs or points of presence in Maryland, Virginia and West Virginia.
33
The Company leases land, buildings and tower space in support of its Wireless operations. As of December 31, 2016, the Company had 1,467 PCS sites, including Wireless sites on property owned by the Company, and 48 leased retail locations.
The Company owns or leases other warehouse, office and retail space in various locations to support its operations. The leases for the foregoing land, buildings and tower space expire on various dates between 2017 and 2041. For information about these leases, see Note 14 to the consolidated financial statements appearing elsewhere in this report. The Company plans to lease additional land, equipment space, and retail space in support of its operations.
|
ITEM 3.
|
LEGAL PROCEEDINGS
|
None
|
ITEM 4.
|
MINE SAFETY DISCLOSURES
|
Not applicable
34
|
ITEM 5.
|
MARKET FOR THE REGISTRANT'S COMMON EQUITY, RELATED STOCKHOLDER MATTERS AND ISSUER PURCHASES OF EQUITY SECURITIES
|
The Company's stock is traded on the NASDAQ Global Select Market under the symbol “SHEN.” The following table shows the closing high and low sales prices per share of common stock as reported by the NASDAQ Global Select Market for each quarter during the last two years:
|
2016
|
High
|
Low
|
||||||
|
Fourth Quarter
|
$
|
30.00
|
|
$
|
23.55
|
|
||
|
Third Quarter
|
41.46
|
|
24.78
|
|
||||
|
Second Quarter
|
38.68
|
|
25.74
|
|
||||
|
First Quarter
|
26.80
|
|
20.07
|
|
||||
|
2015
|
High
|
Low
|
||||||
|
Fourth Quarter
|
$
|
25.34
|
|
$
|
20.44
|
|
||
|
Third Quarter
|
21.57
|
|
15.77
|
|
||||
|
Second Quarter
|
18.22
|
|
15.29
|
|
||||
|
First Quarter
|
16.45
|
|
13.78
|
|
||||
As of March 10, 2017, there were 4,216 holders of record of the Company’s common stock.
Shenandoah Telecommunications Company historically has paid annual cash dividends on or about December 1 of each year. The cash dividend was $0.25 per share in 2016 and $0.24 per share in 2015 on a split adjusted basis. Dividends are paid to Shenandoah Telecommunications Company shareholders from accumulated dividends paid to it by its operating subsidiaries. Under the Company’s credit agreement dated December 18, 2015, the Company is restricted in its ability to pay dividends in the future. So long as no Default or Event of Default (as such term is defined in the credit agreement) exists before, or will result after giving effect to such dividends, distributions or redemptions on a pro forma basis, the Company may declare or pay a lawful dividend or other distribution of assets, or retire, redeem, purchase or otherwise acquire capital stock in an aggregate amount which when added to any such dividends, distributions or redemptions of capital stock or other equity interest made, declared or paid from and after January 1, 2016 does not exceed $25 million plus 60% of the Company’s consolidated net income (excluding non-cash extraordinary items such as write-downs or write-ups of assets, other than current assets) from January 1, 2016 to the date of declaration of any such dividends, distributions or redemptions.
The following graph and table show the cumulative total shareholder return on the Company’s common stock compared to the NASDAQ US Index and the NASDAQ Telecommunications Index for the period between December 31, 2011 and December 31, 2016. The NASDAQ Telecommunications Index includes 31 companies that represent a wide mix of telecommunications service and equipment providers and smaller carriers that offer similar products and serve similar markets. The graph assumes $100 was invested on December 31, 2011 in the Company’s common stock, and the other two indexes, and that all dividends were reinvested and market capitalization weighting as of December 31, 2012, 2013, 2014, 2015 and 2016.
35
Our performance graphs use comparable indexes provided by NASDAQ OMX Global Indexes.
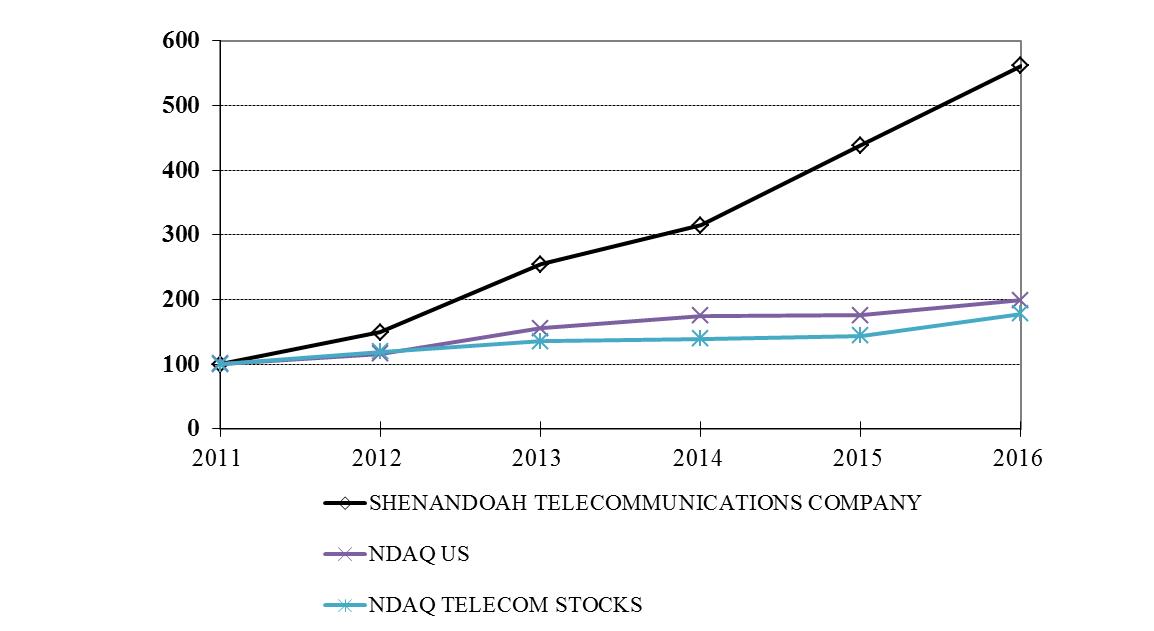
|
|
2011
|
|
2012
|
|
2013
|
|
2014
|
|
2015
|
|
2016
|
|
|
Shenandoah Telecommunications Company
|
100
|
|
150
|
|
255
|
|
315
|
|
438
|
|
561
|
|
|
NDAQ US
|
100
|
|
116
|
|
155
|
|
175
|
|
176
|
|
198
|
|
|
NDAQ Telecom Stocks
|
100
|
|
119
|
|
135
|
|
139
|
|
144
|
|
178
|
|
The Company maintains a dividend reinvestment plan (the “DRIP”) for the benefit of its shareholders. When shareholders remove shares from the DRIP, the Company issues a certificate for whole shares, pays out cash for any fractional shares, and cancels the fractional shares purchased. In addition, in conjunction with the award of shares or exercises of stock options, the Company periodically repurchases shares from certain recipients to cover the minimum statutory tax withholding requirements associated with the transaction. The following table provides information about the Company’s repurchases of shares during the three months ended December 31, 2016:
|
|
Number of
Shares
Purchased
|
|
Average
Price Paid
per Share
|
|
||
|
October 1 to October 31
|
—
|
|
$
|
—
|
|
|
|
November 1 to November 30
|
8
|
|
26.74
|
|
||
|
December 1 to December 31
|
—
|
|
—
|
|
||
|
Total
|
8
|
|
$
|
26.74
|
|
|
36
|
ITEM 6.
|
SELECTED FINANCIAL DATA
|
The following table presents selected financial data as of December 31, 2016, 2015, 2014, 2013, and 2012 and for each of the years in the five-year period ended December 31, 2016.
The selected financial data as of December 31, 2016 and 2015 and for each of the years in the three-year period ended December 31, 2016 are derived from the Company’s audited consolidated financial statements appearing elsewhere in this report. The selected financial data as of December 31, 2014, 2013, and 2012 and for the years ended December 31, 2013 and 2012 are derived from the Company’s audited consolidated financial statements not included in this report.
The selected financial data should be read in conjunction with “Management’s Discussion and Analysis of Financial Condition and Results of Operations” and our consolidated financial statements and related notes thereto appearing elsewhere in this report.
(in thousands, except share and per share data)
|
|
2016
|
2015
|
2014
|
2013
|
2012
|
||||||||||
|
Operating revenues
|
$
|
535,288
|
|
$
|
342,485
|
|
$
|
326,946
|
|
$
|
308,942
|
|
$
|
288,075
|
|
|
Operating expenses
|
512,762
|
|
268,399
|
|
265,003
|
|
253,535
|
|
253,417
|
|
|||||
|
Operating income
|
22,526
|
|
74,086
|
|
61,943
|
|
55,407
|
|
34,658
|
|
|||||
|
Interest expense
|
25,102
|
|
7,355
|
|
8,148
|
|
8,468
|
|
7,850
|
|
|||||
|
Income tax expense
|
2,840
|
|
27,726
|
|
22,151
|
|
19,878
|
|
12,008
|
|
|||||
|
Net income (loss) from continuing operations
|
$
|
(895
|
)
|
$
|
40,864
|
|
$
|
33,883
|
|
$
|
29,586
|
|
$
|
16,603
|
|
|
Discontinued operations, net of tax (a)
|
—
|
|
—
|
|
—
|
|
—
|
|
(300
|
)
|
|||||
|
Net income (loss)
|
$
|
(895
|
)
|
$
|
40,864
|
|
$
|
33,883
|
|
$
|
29,586
|
|
$
|
16,303
|
|
|
Total assets (b)
|
1,484,407
|
|
627,151
|
|
619,242
|
|
597,006
|
|
570,740
|
|
|||||
|
Total debt – including current maturities (b)
|
829,265
|
|
199,661
|
|
224,250
|
|
230,000
|
|
231,977
|
|
|||||
|
Shareholder Information:
|
|
|
|
|
|
|
|
|
|||||||
|
Shares outstanding
|
48,934,708
|
|
48,475,132
|
|
48,264,994
|
|
48,080,554
|
|
47,924,220
|
|
|||||
|
Income (loss) per share from continuing operations-diluted
|
$
|
(0.02
|
)
|
$
|
0.83
|
|
$
|
0.70
|
|
$
|
0.62
|
|
$
|
0.35
|
|
|
Loss per share from discontinued operations-diluted
|
—
|
|
—
|
|
—
|
|
—
|
|
(0.01
|
)
|
|||||
|
Net income (loss) per share-diluted
|
(0.02
|
)
|
0.83
|
|
0.70
|
|
0.61
|
|
0.34
|
|
|||||
|
Cash dividends per share
|
$
|
0.25
|
|
$
|
0.24
|
|
$
|
0.235
|
|
$
|
0.18
|
|
$
|
0.17
|
|
|
(a)
|
Discontinued operations include the operating results of Converged Services. The Company announced its intention to dispose of Converged Services in September 2008, and reclassified its operating results as discontinued operations. The Company completed the disposition of Converged Services properties during 2013.
|
|
(b)
|
As a result of implementing ASU 2015-03 in 2016, the Company reclassified $1.6 million of unamortized loan fees and costs included in deferred charges and other assets as of December 31, 2015 to current and long-term debt. Total assets, as well as total liabilities and shareholders' equity, were also reduced by the same $1.6 million.
|
37
|
ITEM 7.
|
MANAGEMENT'S DISCUSSION AND ANALYSIS OF FINANCIAL CONDITION AND RESULTS OF OPERATIONS
|
This annual report contains forward-looking statements within the meaning of Section 27A of the Securities Act of 1933 and Section 21E of the Securities Exchange Act of 1934, including statements regarding our expectations, hopes, intentions, or strategies regarding the future. These statements are subject to certain risks and uncertainties that could cause actual results to differ materially from those anticipated in the forward-looking statements. Factors that might cause such a difference include those discussed in this report under “Business-Competition” and “Risk Factors.” The Company undertakes no obligation to publicly revise these forward-looking statements to reflect subsequent events or circumstances, except as required by law.
General
Overview.
Shenandoah Telecommunications Company is a diversified telecommunications company providing both regulated and unregulated telecommunications services through its wholly owned subsidiaries. These subsidiaries provide wireless personal communications services (as a Sprint PCS affiliate), local exchange telephone services, video, internet and data services, long distance services, fiber optics facilities and leased tower facilities. We have three reportable segments, which we operate and manage as strategic business units organized by lines of business: (1) Wireless, (2) Cable and (3) Wireline.
|
*
|
The Wireless segment has historically provided digital wireless service as a Sprint PCS Affiliate to a portion of a four-state area covering the region from Harrisburg, York and Altoona, Pennsylvania, to Harrisonburg, Virginia. Following the acquisition of nTelos, the Company’s wireless service area expanded to include south-central and western Virginia, West Virginia, and small portions of Kentucky and Ohio. In these areas, we are the exclusive provider of Sprint-branded wireless mobility communications network products and services on the 800 MHz, 1900 MHz and 2.5 GHz spectrum bands. This segment also owns cell site towers built on leased land, and leases space on these towers to both affiliates and non-affiliated service providers.
|
|
*
|
The Cable segment provides video, internet and voice services in franchise areas in portions of Virginia, West Virginia and western Maryland, and leases fiber optic facilities throughout its service area. It does not include video, internet and voice services provided to customers in Shenandoah County, Virginia.
|
|
*
|
The Wireline segment provides regulated and unregulated voice services, DSL internet access and long distance access services throughout Shenandoah County and portions of Rockingham, Frederick, Warren and Augusta counties, Virginia. The segment also provides video and cable modem internet access services in portions of Shenandoah County, and leases fiber optic facilities throughout the northern Shenandoah Valley of Virginia, northern Virginia and adjacent areas along the Interstate 81 corridor through West Virginia, Maryland and portions of central and southern Pennsylvania.
|
A fourth segment, Other, primarily includes Shenandoah Telecommunications Company, the parent holding company, and includes corporate costs of executive management, information technology, legal, finance and human resources. This segment also includes certain acquisition and integration costs primarily consisting of severance accruals for short-term nTelos employees to be separated as integration activities wind down and transaction related expenses such as investment advisor, legal and other professional fees.
Acquisition of nTelos and Exchange with Sprint
: On May 6, 2016, we completed our previously announced acquisition of NTELOS Holdings Corp. (“nTelos”) for $667.8 million, net of cash acquired. The purchase price was financed by a credit facility arranged by CoBank, ACB. We have included the operations of nTelos for financial reporting purposes for periods subsequent to the acquisition.
Immediately after acquiring nTelos, we exchanged spectrum licenses valued at $198.2 million, and customer based contract rights valued at $206.7 million, acquired from nTelos with Sprint, and received an expansion of our affiliate service territory to include most of the service area served by nTelos, valued at $284.1 million, as well as customer based contract rights, valued at $120.9 million, relating to nTelos’ and Sprint’s legacy customers in the our affiliate service territory. The value of the affiliate agreement expansion is based on changes to the amended affiliate agreement that include an increase in the price to be paid by Sprint from 80% to 90% of the entire business value of PCS if the affiliate agreement is not renewed and an extension of the affiliate agreement with Sprint by five years to 2029. Also included in the value is the expanded territory in the nTelos service area and the accompanying right to serve all future Sprint customers in the expanded territory, our commitment to upgrade certain coverage and capacity in the newly acquired service area, the waiver of a portion of the management fee charged by Sprint, as well as other items defined in the amended affiliate agreement.
38
The Company expects to incur a total of approximately $90 million of integration and acquisition expenses associated with this transaction, excluding approximately $23.0 million of debt issuance costs. In connection with the acquisition, the Company also chose to proactively migrate former nTelos customers to devices that can interact with the Sprint billing and network systems. Expected costs also include the nTelos back office staff and support functions until the nTelos legacy customers are migrated to the Sprint billing platform; cost of the handsets to be provided to nTelos legacy customers as they migrate to the Sprint billing platform; severance costs for back office and other former nTelos employees who will not be retained permanently; and transaction related fees. We have incurred $54.7 million of these costs in the year ended December 31, 2016. These costs include $1.3 million reflected in cost of goods and services and $11.1 million reflected in selling, general and administrative costs in the year ended December 31, 2016.
Critical Accounting Policies
The Company relies on the use of estimates and makes assumptions that affect its financial condition and operating results. These estimates and assumptions are based on historical results and trends as well as the Company's forecasts as to how these might change in the future. The most critical accounting policies that materially affect the Company's results of operations include the following:
Revenue Recognition
The Company recognizes revenue when persuasive evidence of an arrangement exists, services have been rendered or products have been delivered, the price to the buyer is fixed and determinable and collectability is reasonably assured. Revenues are recognized by the Company based on the various types of transactions generating the revenue. For services, revenue is recognized as the services are performed. For equipment sales, revenue is recognized when the sales transaction is complete.
Under the Sprint Management Agreement, postpaid wireless service revenues are reported net of an 8% Management Fee and an 8.6% Net Service Fee, retained by Sprint. Prepaid wireless service revenues are reported net of a 6% Management Fee retained by Sprint. Under our amended affiliate agreement, Sprint agreed to waive the management fee, which is historically presented as a contra-revenue by us, for a period of approximately six years. The impact of Sprint’s waiver of the management fee over the approximate six-year period is reflected as an increase in revenue, offset by the non-cash adjustment to recognize this impact on a straight-line basis over the remaining initial contract term of approximately 14 years.
Allowance for Doubtful Accounts
Estimates are used in determining the allowance for doubtful accounts and are based on historical collection and write-off experience, current trends, credit policies, and the analysis of the accounts receivable by aging category. In determining these estimates, the Company compares historical write-offs in relation to the estimated period in which the subscriber was originally billed. The Company also looks at the historical average length of time that elapses between the original billing date and the date of write-off and the financial position of its larger customers in determining the adequacy of the allowance for doubtful accounts. From this information, the Company assigns specific amounts to be applied against the outstanding receivables. The Company does not carry an allowance for receivables related to Sprint PCS customers. In accordance with the terms of the affiliate contract with Sprint, the Company receives payment from Sprint for the monthly net billings to PCS customers in weekly installments over the following four or five weeks.
Inventories
The Company's inventories consist primarily of items held for resale such as devices and accessories. The Company values its inventory at the lower of cost or market. Inventory cost is computed on an average cost basis. Market value is determined by reviewing current replacement cost, marketability and obsolescence.
Income Taxes
Income taxes are accounted for under the asset and liability method. Deferred tax assets and liabilities are recognized for the future tax consequences attributable to differences between financial statement carrying amounts of existing assets and liabilities and their respective tax bases. Deferred tax assets and liabilities are measured using enacted tax rates expected to apply to taxable income in the years in which those temporary differences are expected to be recovered or settled. The effect on deferred tax assets and liabilities of a change in tax rates is recognized in income in the period that includes the enactment date. The Company evaluates the recoverability of deferred tax assets generated on a state-by-state basis from net operating losses apportioned to that state. Management uses a more likely than not threshold to make the determination if a valuation
39
allowance is warranted for tax assets in each state. Management evaluates the effective rate of taxes based on apportionment factors, the Company’s operating results, and the various state income tax rates.
Leases
The Company recognizes rent expense on a straight-line basis over the initial lease term and renewal periods that are reasonably assured at the inception of the lease. In light of the Company’s investment in each leased site, including acquisition costs and leasehold improvements, the Company includes the exercise of certain renewal options in the recording of operating leases. Where the Company is the lessor, the Company recognizes revenue on a straight line basis over the non-cancelable term of the lease.
Long-lived Assets
The Company views the determination of the carrying value of long-lived assets as a significant accounting estimate since the Company must determine an estimated economic useful life in order to properly amortize or depreciate long-lived assets and because the Company must consider if the value of any long-lived assets have been impaired, requiring adjustment to the carrying value.
Economic useful life is the duration of time the asset is expected to be productively employed by us, which may be less than its physical life. The Company’s assumptions on obsolescence, technological advances, and other factors affect the determination of estimated economic useful life. The estimated economic useful life of an asset is monitored to determine if it continues to be appropriate in light of changes in business circumstances. For example, technological advances may result in a shorter estimated useful life than originally anticipated. In such a case, the Company would depreciate the remaining net book value of the asset over the new estimated remaining life, increasing depreciation expense on a prospective basis. During 2016, based upon recent activity, the Company determined that the antennas deployed at its cell sites would require replacement earlier than previously expected, and accordingly, reduced the remaining useful life of this class of assets. Additional depreciation expense was $0.1 million in 2016 and is expected to be $0.6 million higher in 2017.
Intangible Assets
Cable franchises, included in Intangible assets, net, provide us with the non-exclusive right to provide video services in a specified area. While some cable franchises are issued for a fixed time (generally 10 years), renewals of cable franchises have occurred routinely and at nominal cost. Moreover, we have determined that there are currently no legal, regulatory, contractual, competitive, economic or other factors that limit the useful lives of our cable franchises.
Cable franchise rights and other intangible assets with indefinite lives are not amortized but are tested at least annually for impairment. The testing is performed on the value as of November 1 each year, and is generally composed of comparing the book value of the assets to their estimated fair value. Cable franchises are tested for impairment on an aggregate basis, consistent with the management of the Cable segment as a whole, utilizing a greenfield valuation approach. It is the Company’s practice to engage an independent appraiser to prepare these fair value analyses.
Intangible assets that have finite useful lives are amortized over their useful lives. Acquired subscriber base assets are amortized using accelerated amortization methods over the expected period in which those relationships are expected to contribute to our future cash flows. Other finite-lived intangible assets, including the affiliate expansion asset, are generally amortized using the straight-line method of amortization.
The initial establishment of many intangible assets, as well as subsequent impairment tests for intangibles with indefinite lives, is generally dependent upon forecasts and projections of future activity, and such estimates can be subjective and variable over time as market conditions and operating results change.
Other
The Company does not have any unrecorded off-balance sheet transactions or arrangements; however, the Company has significant commitments under operating leases.
Goodwill
Goodwill is not amortized but is tested for impairment on at least an annual basis. Impairment testing is required more often than annually if an event or circumstance indicates that impairment is more likely than not to have occurred. In conducting our
40
annual impairment testing, we may first perform a qualitative assessment of whether it is more likely than not that a reporting unit’s fair value is less than its carrying amount. If not, no further goodwill impairment testing is required. If it is more likely than not that a reporting unit’s fair value is less than its carrying amount, or if we elect not to perform a qualitative assessment of a reporting unit, we then compare the fair value of the reporting unit to the related net book value. If the net book value of a reporting unit exceeds its fair value, an impairment loss is measured and recognized. We elected not to perform the qualitative assessment and performed a quantitative test comparing the fair value with the carrying amounts and concluded that no impairment existed as of October 1.
Pension Benefits and Retirement Benefits Other Than Pensions
Through our acquisition of nTelos, we assumed nTelos’ non-contributory defined benefit pension plan (“Pension Plan”) covering all employees who met eligibility requirements and were employed by nTelos prior to October 1, 2003. The Pension Plan was closed to nTelos employees hired on or after October 1, 2003. Pension benefits vest after five years of plan service and are based on years of service and an average of the five highest consecutive years of compensation subject to certain reductions if the employee retires before reaching age 65 and elects to receive the benefit prior to age 65. Effective December 31, 2012, nTelos froze future benefit accruals. We use updated mortality tables published by the Society of Actuaries that predict increasing life expectancies in the United States.
IRC Sections 412 and 430 and Sections 302 and 303 of the Employee Retirement Income Security Act of 1974, as amended establish minimum funding requirements for defined benefit pension plans. The minimum required contribution is generally equal to the target normal cost plus the shortfall amortization installments for the current plan year and each of the six preceding plan years less any calculated credit balance. If plan assets (less calculated credits) are equal to or exceed the funding target, the minimum required contribution is the target normal cost reduced by the excess funding, but not below zero. Our policy is to make contributions to stay at or above the threshold required in order to prevent benefit restrictions and related additional notice requirements and is intended to provide not only for benefits based on service to date, but also for those expected to be earned in the future. We also assumed two qualified nonpension postretirement benefit plans that provide certain health care and life benefits for nTelos retired employees that meet eligibility requirements. The health care plan is contributory, with participants’ contributions adjusted annually. The life insurance plan also is contributory. These obligations, along with all of the pension plans and other postretirement benefit plans, are obligations assumed by us. Eligibility for the life insurance plan is restricted to active pension participants age 50-64 as of January 5, 1994. Neither plan is eligible to employees hired after April 1993. The accounting for the plans anticipates that we will maintain a consistent level of cost sharing for the benefits with the retirees. Our share of the projected costs of benefits that will be paid after retirement is generally being accrued by charges to expense over the eligible employees’ service periods to the dates they are fully eligible for benefits.
We record annual amounts relating to the Pension Plan and postretirement benefit plans based on calculations that incorporate various actuarial and other assumptions, including discount rates, mortality, assumed rates of return, turnover rates and health care cost trend rates. We review our assumptions on an annual basis and make modifications to the assumptions based on current rates and trend when it is appropriate to do so. We recognize gains and losses on pension and postretirement plan assets and obligations immediately in our operating results. These gains and losses are measured annually at December 31 and accordingly will be recorded during the fourth quarter, unless earlier re-measurements are required.
41
Results of Continuing Operations
2016 Compared to 2015
Consolidated Results
The Company’s consolidated results from continuing operations for the years ended December 31, 2016 and 2015 are summarized as follows:
|
(in thousands)
|
Years Ended
December 31,
|
Change
|
|||||||||
|
|
2016
|
2015
|
$
|
%
|
|||||||
|
Operating revenues
|
$
|
535,288
|
|
$
|
342,485
|
|
$
|
192,803
|
|
56.3
|
|
|
Operating expenses
|
512,762
|
|
268,399
|
|
244,363
|
|
91.0
|
|
|||
|
Operating income
|
22,526
|
|
74,086
|
|
(51,560
|
)
|
(69.6
|
)
|
|||
|
Other expense, net
|
20,581
|
|
5,496
|
|
15,085
|
|
274.5
|
|
|||
|
Income tax expense
|
2,840
|
|
27,726
|
|
(24,886
|
)
|
(89.8
|
)
|
|||
|
Net income (loss)
|
$
|
(895
|
)
|
$
|
40,864
|
|
$
|
(41,759
|
)
|
(102.2
|
)
|
Operating revenues
Operating revenues increased $192.8 million, or 56.3%, primarily as a result of the nTelos acquisition. Wireless segment revenues increased $179.9 million compared to 2015; this increase was almost entirely due to the acquisition of nTelos on May 6, 2016, combined with the reduction in the Net Service Fee charged by Sprint related to separate settlement of certain revenues and expenses. Cable segment revenue grew $11.1 million, primarily as a result of a 6.3% growth in average subscriber counts and an increase in revenue per subscriber. Wireline segment revenue increased $7.6 million, led by growth in carrier access fees, fiber revenues and internet service revenues. Affiliate revenues increased $5.8 million. Affiliate revenues are eliminated from the consolidated totals shown in the table above.
Operating expenses
Total operating expenses increased $244.4 million, or 91.0%, in 2016 compared to 2015. Wireless segment operating expenses increased $228.7 million while operating expenses in the Other segment increased $13.4 million, both largely due to the acquisition of nTelos. Cable and Wireline segment operating expenses increased $4.6 million and $3.4 million, respectively. Cost of goods and services sold increased $72.2 million, selling, general and administrative expenses increased $60.5 million, depreciation and amortization increased $73.0 million, and acquisition, integration and migration costs increased $38.7 million.
Other Expense, net
Non-operating income increased $2.5 million due to increased patronage income related to higher outstanding balances on our CoBank borrowings and interest accrued on handset finance ("EIP") loans acquired with nTelos. Interest expense increased $17.7 million in 2016 from 2015. The increase resulted primarily from higher outstanding balances due to borrowings to finance and support the nTelos acquisition, as well as slightly higher base rates on the new debt, increases in LIBOR during 2016, increased notional principal subject to interest rate swaps, and amortization of the fees and costs incurred to complete the new debt package.
Income tax expense
The Company’s effective tax rate increased from 40.4% in 2015 to 146.0% in 2016. The increase is primarily attributable to the changes in blended state rates applied to basis differences caused by the nTelos acquisition and the Company's legal entity restructuring that combined the nTelos legal entities into the Company's PCS subsidiary. Additionally, the rate was impacted by the adoption of ASU 2016-09 relating to stock compensation and non-deductible transaction costs incurred during 2016 related to the nTelos acquisition. The impact of these items on the effective tax rate is magnified by the near break-even level of income before taxes.
42
Net income
Net income decreased $41.8 million, or 102.2%, in 2016 from 2015. Increases in depreciation and amortization expenses resulting from the acquisition of nTelos, costs related to the acquisition including acquisition, integration and migration costs, (including those in cost of goods and services sold and selling, general and administrative expenses), and higher interest expense on the increased outstanding debt, offset the positive impact of revenues from new customers less new operating expenses resulting from the nTelos acquisition.
Wireless
Our Wireless segment historically provided digital wireless service to a portion of a four-state area covering the region from Harrisburg, York and Altoona, Pennsylvania, to Harrisonburg, Virginia, through Shenandoah Personal Communications, LLC (“PCS”), a Sprint PCS Affiliate. Following the recent acquisition of nTelos, our wireless service territory expanded to include south-central and western Virginia, West Virginia, and small portions of Kentucky and Ohio. Through Shenandoah Mobile, LLC (“Mobile”), this segment also leases land on which it builds Company-owned cell towers, which it leases to affiliates and non-affiliated wireless service providers, throughout the same four-state area described above.
PCS receives revenues from Sprint for subscribers that obtain service in PCS’s network coverage area. PCS relies on Sprint to provide timely, accurate and complete information to record the appropriate revenue for each financial period. Postpaid revenues received from Sprint are recorded net of certain fees retained by Sprint. Through December 31, 2015, these fees totaled 22% of postpaid net billed revenue (gross customer billings net of credits and adjustments to customer accounts, and write-offs of uncollectible accounts), as defined by the Affiliate Agreement with Sprint. Effective January 1, 2016, the fees charged by Sprint declined to 16.6%, and certain revenue and expense items previously included in these fees became separately settled. The 16.6% fee consisted of a Management Fee of 8% and a Net Service Fee of 8.6%.
We also offer prepaid wireless products and services in our PCS network coverage area. Sprint retains a Management Fee equal to 6% of prepaid customer billings. Prepaid revenues received from Sprint are reported net of the cost of this fee. Other fees charged on a per unit basis are separately recorded as expenses according to the nature of the expense. We pay handset subsidies to Sprint for the difference between the selling price of prepaid handsets and their cost, recorded as a net cost in cost of goods sold. The revenue and expense components reported to us by Sprint are based on Sprint’s national averages for prepaid services, rather than being specifically determined by customers assigned to our geographic service areas.
In connection with the nTelos acquisition and Sprint transactions, Sprint agreed to waive the Management Fees charged on both postpaid and prepaid revenues, up to $4.2 million per month, until the total amount waived reaches $252 million. This is expected to take about six years. The benefit of the fee waivers is being recognized over a straight-line period through the end of the initial term of the Management Agreement, November 30, 2029.
The following tables show selected operating statistics of the Wireless segment as of the dates shown:
|
|
Dec. 31,
2016
|
Dec. 31,
2015 |
Dec. 31,
2014 |
|||
|
Retail PCS Subscribers – Postpaid
|
722,562
|
|
312,512
|
|
287,867
|
|
|
Retail PCS Subscribers – Prepaid
|
236,138
|
|
142,840
|
|
145,162
|
|
|
PCS Market POPS (000) (1)
|
5,536
|
|
2,433
|
|
2,415
|
|
|
PCS Covered POPS (000) (1)
|
4,807
|
|
2,224
|
|
2,207
|
|
|
CDMA Base Stations (sites) (3)
|
1,467
|
|
552
|
|
537
|
|
|
Towers Owned
|
196
|
|
158
|
|
154
|
|
|
Non-affiliate Cell Site Leases
|
202
|
|
202
|
|
198
|
|
|
Gross PCS Subscriber Additions – Postpaid
|
132,593
|
|
77,067
|
|
72,891
|
|
|
Net PCS Subscriber Additions – Postpaid
|
5,085
|
|
24,645
|
|
14,146
|
|
|
PCS Average Monthly Retail Churn % - Postpaid (2)
|
1.84
|
%
|
1.47
|
%
|
1.76
|
%
|
|
Gross PCS Subscriber Additions – Prepaid
|
111,459
|
|
83,796
|
|
74,838
|
|
|
Net PCS Subscriber Additions (Losses) – Prepaid (4)
|
(61,664
|
)
|
(2,322
|
)
|
8,115
|
|
|
PCS Average Monthly Retail Churn % - Prepaid (2)(4)
|
5.19
|
%
|
4.93
|
%
|
4.00
|
%
|
43
The changes from December 31, 2015 to December 31, 2016 shown above include the following amounts acquired in the nTelos acquisition and the exchange with Sprint on May 6, 2016:
|
PCS Subscribers – Postpaid
|
404,965
|
|
|
PCS Subscribers – Prepaid
|
154,944
|
|
|
PCS Market POPS (000) (1)
|
3,099
|
|
|
PCS Covered POPS (000) (1)
|
2,298
|
|
|
CDMA Base Stations (sites) (3)
|
868
|
|
|
Towers
|
20
|
|
|
Non-affiliate Cell Site Leases
|
10
|
|
|
1)
|
POPS refers to the estimated population of a given geographic area and is based on information purchased from third party sources. Market POPS are those within a market area which we are authorized to serve under our Sprint PCS affiliate agreements, and Covered POPS are those covered by our network.
|
|
2)
|
PCS Average Monthly Retail Churn is the average of the monthly subscriber turnover, or churn, calculations for the period.
|
|
3)
|
Net of approximately 160 overlap cell sites we intend to shut down in coming months.
|
|
4)
|
Prepaid losses include 24,348 subscribers purged from customer counts as a result of a one-time reduction of the length of time a customer is inactive before eliminating them from the customer counts.
|
During the twelve months ended December 31, 2016, 5,248 former nTelos prepaid subscribers switched to postpaid subscribers as they migrated to the Sprint back-office platforms.
|
(in thousands)
|
Years Ended
December 31,
|
Change
|
|||||||||
|
|
2016
|
2015
|
$
|
%
|
|||||||
|
Segment operating revenues
|
|
|
|
|
|
||||||
|
Wireless service revenue
|
$
|
359,769
|
|
$
|
192,752
|
|
$
|
167,017
|
|
86.6
|
|
|
Tower lease revenue
|
11,279
|
|
10,505
|
|
774
|
|
7.4
|
|
|||
|
Equipment revenue
|
10,674
|
|
5,175
|
|
5,499
|
|
106.3
|
|
|||
|
Other revenue
|
7,031
|
|
369
|
|
6,662
|
|
NM
|
|
|||
|
Total segment operating revenues
|
$
|
388,753
|
|
$
|
208,801
|
|
$
|
179,952
|
|
86.2
|
|
|
Segment operating expenses
|
|
|
|
|
|
|
|
|
|||
|
Cost of goods and services, exclusive of depreciation and amortization shown separately below
|
133,113
|
|
63,570
|
|
69,543
|
|
109.4
|
|
|||
|
Selling, general and administrative, exclusive of depreciation and amortization shown separately below
|
95,851
|
|
35,792
|
|
60,059
|
|
167.8
|
|
|||
|
Integration and acquisition expenses
|
25,927
|
|
—
|
|
25,927
|
|
NM
|
|
|||
|
Depreciation and amortization
|
107,621
|
|
34,416
|
|
73,205
|
|
212.7
|
|
|||
|
Total segment operating expenses
|
362,512
|
|
133,778
|
|
228,734
|
|
171.0
|
|
|||
|
Segment operating income
|
$
|
26,241
|
|
$
|
75,023
|
|
$
|
(48,782
|
)
|
(65.0
|
)
|
44
Service Revenues
|
(in thousands)
|
Years Ended
December 31, |
Change
|
|||||||||||||
|
Service Revenues
|
2016
|
2015
|
$
|
%
|
|||||||||||
|
Postpaid net billings
(1)
|
$
|
314,579
|
|
$
|
185,174
|
|
$
|
129,405
|
|
69.9
|
|
||||
|
Sprint fees
|
|
|
|
|
|||||||||||
|
Management fee
|
(25,543
|
)
|
(14,805
|
)
|
(10,738
|
)
|
(72.5
|
)
|
|||||||
|
Net Service fee
|
(22,953
|
)
|
(25,909
|
)
|
2,956
|
|
11.4
|
|
|||||||
|
Waiver of management fee
|
20,674
|
|
—
|
|
20,674
|
|
NM
|
|
|||||||
|
|
(27,822
|
)
|
(40,714
|
)
|
12,892
|
|
(31.7
|
)
|
|||||||
|
Prepaid net billings
|
|
|
|
|
|
|
|
|
|||||||
|
Gross billings
|
82,672
|
|
51,081
|
|
31,591
|
|
61.8
|
|
|||||||
|
Sprint management fee
|
(4,960
|
)
|
(3,074
|
)
|
(1,886
|
)
|
(61.4
|
)
|
|||||||
|
Waiver of management fee
|
3,922
|
|
—
|
|
3,922
|
|
NM
|
|
|||||||
|
|
81,634
|
|
48,007
|
|
33,627
|
|
70.0
|
|
|||||||
|
Travel and other revenues
|
17,382
|
|
285
|
|
17,097
|
|
NM
|
|
|||||||
|
Accounting adjustments
|
|
|
|
|
|||||||||||
|
Amortization of expanded affiliate agreement
|
(14,030
|
)
|
—
|
|
(14,030
|
)
|
NM
|
|
|||||||
|
Straight-line adjustment - management fee waiver
|
(11,974
|
)
|
—
|
|
(11,974
|
)
|
NM
|
|
|||||||
|
|
(26,004
|
)
|
—
|
|
(26,004
|
)
|
NM
|
|
|||||||
|
Total Service Revenues
|
$
|
359,769
|
|
$
|
192,752
|
|
$
|
167,017
|
|
86.6
|
|
||||
(1) Postpaid net billings are defined under the terms of the affiliate contract with Sprint to be the gross billings to customers within our service territory less billing credits and adjustments and allocated write-offs of uncollectible accounts.
Operating revenues
Wireless service revenue increased $167.0 million, or 86.6%, in 2016 over 2015, primarily due to the nTelos acquisition. Net postpaid billings increased $129.4 million, or 69.9%, as average subscribers increased 89.2% and average billing rates dropped by 11% primarily due to new customers and upgrading existing customers moving to lower cost service plans that don't include a subsidized phone. Net prepaid billings increased $31.6 million, or 61.8%, due to 53.1% growth in average prepaid subscribers over 2015 and higher average revenue per subscriber due to improvements in product mix. Effective January 1, 2016, the fees retained by Sprint, and deducted from postpaid revenues, decreased from 22.0% to 16.6%, and certain revenue and expense items became settled separately. As a result, despite the growth in net postpaid billings, the net service fee dropped by $2.9 million or 11.4%. Travel and other revenues, now separately settled, increased $17.1 million.
Tower lease revenue increased primarily as a result of amendments to existing leases, as third party co-locators add 4G capabilities to our towers, and rents associated with the towers acquired in the nTelos acquisition.
Equipment revenue increased due primarily to separately settled national device revenues passed to us by Sprint, as well as expanded activity due to the nTelos acquisition.
Operating expenses
Cost of goods and services increased $69.5 million, or 109.4%, in 2016 from 2015. Postpaid handset costs decreased $0.6 million. Prepaid handset costs increased $4.3 million. Network costs increased $47.5 million, while maintenance costs increased $8.7 million. These increases are primarily attributable to the expanded activities and service territory as a result of the nTelos acquisition. Separately settled national handset costs added $4.6 million to 2016's cost of goods and services.
Selling, general and administrative costs increased $60.1 million, or 167.8%, in 2016 over 2015. National channel sales commissions, which we began separately settling with Sprint effective January 1, 2016, added $22.4 million to the current year expense. Expenses associated with prepaid wireless programs increased $3.5 million in 2016 from 2015. Personnel costs increased $20.9 million due to the addition of new retail stores and the need to support the nTelos billing platform and sales and
45
customer service activities for customers prior to migration. Advertising expenses increased $5.5 million, while property taxes increased $1.8 million, both due to the nTelos acquisition.
Acquisition, integration and migration costs of $25.9 million included $18.3 million in handset costs for customers to migrate to the Sprint back office and billing platform, $4.9 million in costs to shutdown overlapping cell sites and replace older backhaul circuits with Ethernet circuits to support increased data volumes at upgraded sites, and $2.7 million in incremental staff to support migration efforts in the stores.
Depreciation and amortization increased $73.2 million, or 212.7%, in 2016 over 2015, reflecting the tangible and intangible assets acquired in the nTelos acquisition.
Cable
The Cable segment provides video, internet and voice services in franchise areas in portions of Virginia, West Virginia and western Maryland, and leases fiber optic facilities throughout its service area. It does not include video, internet and voice services provided to customers in Shenandoah County, Virginia, which are included in the Wireline segment.
On January 1, 2016, we acquired the assets of Colane Cable Company. With the acquisition, we received 3,299 video customers, 1,405 high-speed internet customers, and 302 voice customers. These customers are included in the December 31, 2016 totals shown below.
The following table shows selected operating statistics of the Cable segment as of the dates shown:
|
|
Dec. 31,
2016
|
Dec. 31,
2015 |
Dec. 31,
2014 |
|||
|
Homes Passed (1)
|
184,710
|
|
172,538
|
|
171,589
|
|
|
Customer Relationships (2)
|
|
|
|
|
||
|
Video customers
|
48,512
|
|
48,184
|
|
49,247
|
|
|
Non-video customers
|
28,854
|
|
24,550
|
|
22,051
|
|
|
Total customer relationships
|
77,366
|
|
72,734
|
|
71,298
|
|
|
Video
|
|
|
|
|
|
|
|
Customers (3)
|
50,618
|
|
50,215
|
|
52,095
|
|
|
Penetration (4)
|
27.4
|
%
|
29.1
|
%
|
30.4
|
%
|
|
Digital video penetration (5)
|
77.4
|
%
|
77.9
|
%
|
65.9
|
%
|
|
High-speed Internet
|
|
|
|
|
|
|
|
Available Homes (6)
|
183,826
|
|
172,538
|
|
171,589
|
|
|
Customers (3)
|
60,495
|
|
55,131
|
|
50,686
|
|
|
Penetration (4)
|
32.9
|
%
|
32.0
|
%
|
29.5
|
%
|
|
Voice
|
|
|
|
|
|
|
|
Available Homes (6)
|
181,089
|
|
169,801
|
|
168,852
|
|
|
Customers (3)
|
21,352
|
|
20,166
|
|
18,262
|
|
|
Penetration (4)
|
11.8
|
%
|
11.9
|
%
|
10.8
|
%
|
|
Total Revenue Generating Units (7)
|
132,465
|
|
125,512
|
|
121,043
|
|
|
Fiber Route Miles
|
3,137
|
|
2,844
|
|
2,834
|
|
|
Total Fiber Miles (8)
|
92,615
|
|
76,949
|
|
72,694
|
|
|
Average Revenue Generating Units
|
131,218
|
|
124,054
|
|
117,744
|
|
|
1)
|
Homes and businesses are considered passed (“homes passed”) if we can connect them to our distribution system without further extending the transmission lines. Homes passed is an estimate based upon the best available information.
|
|
2)
|
Customer relationships represent the number of customers who receive at least one of our services.
|
|
3)
|
Generally, a dwelling or commercial unit with one or more television sets connected to our distribution system counts as one video customer. Where services are provided on a bulk basis, such as to hotels and some multi-dwelling units, the revenue charged to the customer is divided by the rate for comparable service in the local market to determine the number of customer equivalents included in the customer counts shown above. During the first quarter of 2016, we
|
46
modified the way we count subscribers when a commercial customer upgrades its internet service via a fiber contract. We retroactively applied the new count methodology to prior periods, and applied similar logic to certain bulk customers; the net result was reductions in internet subscriber counts of 559 and 673 subscribers to December 31, 2015, and December 31, 2014 totals, respectively.
|
4)
|
Penetration is calculated by dividing the number of customers by the number of homes passed or available homes, as appropriate.
|
|
5)
|
Digital video penetration is calculated by dividing the number of digital video customers by total video customers. Digital video customers are video customers who receive any level of video service via digital transmission. A dwelling with one or more digital set-top boxes or digital adapters counts as one digital video customer.
|
|
6)
|
Homes and businesses are considered available (“available homes”) if we can connect them to our distribution system without further extending the transmission lines and if we offer the service in that area.
|
|
7)
|
Revenue generating units are the sum of video, voice and high-speed internet customers.
|
|
8)
|
Total Fiber Miles are measured by taking the number of fiber strands in a cable and multiplying that number by the route distance. For example, a 10 mile route with 144 fiber strands would equal 1,440 fiber miles.
|
|
(in thousands)
|
Years Ended
December 31,
|
Change
|
|||||||||
|
|
2016
|
2015
|
$
|
%
|
|||||||
|
Segment operating revenues
|
|
|
|
|
|
||||||
|
Service revenue
|
$
|
99,070
|
|
$
|
88,980
|
|
$
|
10,090
|
|
11.3
|
|
|
Other revenue
|
9,664
|
|
8,642
|
|
1,022
|
|
11.8
|
|
|||
|
Total segment operating revenues
|
$
|
108,734
|
|
$
|
97,622
|
|
$
|
11,112
|
|
11.4
|
|
|
Segment operating expenses
|
|
|
|
|
|
|
|
|
|||
|
Cost of goods and services, exclusive of depreciation and amortization shown separately below
|
58,581
|
|
54,611
|
|
3,970
|
|
7.3
|
|
|||
|
Selling, general and administrative, exclusive of depreciation and amortization shown separately below
|
19,248
|
|
19,412
|
|
(164
|
)
|
(0.8
|
)
|
|||
|
Depreciation and amortization
|
23,908
|
|
23,097
|
|
811
|
|
3.5
|
|
|||
|
Total segment operating expenses
|
101,737
|
|
97,120
|
|
4,617
|
|
4.8
|
|
|||
|
Segment operating income
|
$
|
6,997
|
|
$
|
502
|
|
$
|
6,495
|
|
1293.8
|
|
Operating revenues
Cable segment service revenue increased $10.1 million, or 11.3% in 2016 from 2015. Internet service revenue increased $9.0 million, or 23.4%, due to an 8.9% increase in average internet subscribers, along with an improved product mix as new and existing customers increasingly move to higher-speed plans with higher monthly recurring charges. Video revenue, including retransmission consent fee surcharges, increased $2.5 million driven by video rate increases in January 2016, offsetting higher programming costs. Voice revenue increased $0.8 million due to 8.4% growth in average voice revenue generating units. These increases were partially offset by a $2.3 million increase in bundle discounts.
Other revenue grew $1.0 million, primarily due to new fiber contracts.
Operating expenses
Cable segment cost of goods and services increased $4.0 million, or 7.3%, in 2016 over 2015. Video programming costs, including retransmission consent fees, increased $1.2 million as the impact of rising rates per subscriber outpaced declining video subscriber counts. Network costs grew $0.7 million, primarily due to $0.5 million in increased line costs and pole rents. Maintenance costs increased $0.9 million.
Depreciation expense increased $0.8 million, partly as a result of assets acquired in the Colane acquisition, and new assets placed in service.
47
Wireline
The Wireline segment provides regulated and unregulated voice services, DSL internet access, cable modem and long distance access services throughout Shenandoah County and portions of Rockingham, Frederick, Warren and Augusta counties, Virginia. The segment also provides video and cable modem internet access services in portions of Shenandoah County, and leases fiber optic facilities throughout the northern Shenandoah Valley of Virginia, northern Virginia and adjacent areas along the Interstate 81 corridor through West Virginia, Maryland and portions of Pennsylvania.
|
|
Dec. 31,
2016
|
Dec. 31,
2015 |
Dec. 31,
2014 |
|||
|
Telephone Access Lines (1)
|
18,443
|
|
20,252
|
|
21,612
|
|
|
Long Distance Subscribers
|
9,149
|
|
9,476
|
|
9,571
|
|
|
Video Customers(2)
|
5,264
|
|
5,356
|
|
5,692
|
|
|
DSL and Cable Modem Subscribers (3)
|
14,314
|
|
13,890
|
|
13,094
|
|
|
Fiber Route Miles
|
1,971
|
|
1,736
|
|
1,556
|
|
|
Total Fiber Miles (4)
|
142,230
|
|
123,891
|
|
99,387
|
|
|
1)
|
Effective October 1, 2015, we launched cable modem services on our cable plant, and ceased the requirement that a customer have a telephone access line to purchase internet service.
|
|
2)
|
The Wireline segment’s video service passes approximately 16,000 homes.
|
|
3)
|
December 2016 and December 2015 totals include 1,072 and 420 customers, respectively, served via the coaxial cable network. During first quarter 2016, we modified the way we count subscribers when a commercial customer upgrades its internet service via a fiber contract. We retroactively applied the new count methodology to prior periods and the net result was increases in internet subscriber counts of 804 and 352 subscribers to December 31, 2015 and December 31, 2014 totals, respectively.
|
|
4)
|
Total Fiber Miles are measured by taking the number of fiber strands in a cable and multiplying that number by the route distance. For example, a 10 mile route with 144 fiber strands would equal 1,440 fiber miles.
|
|
(in thousands)
|
Years Ended
December 31,
|
Change
|
|||||||||
|
|
2016
|
2015
|
$
|
%
|
|||||||
|
Segment operating revenues
|
|
|
|
|
|
||||||
|
Service revenue
|
$
|
21,917
|
|
$
|
21,880
|
|
$
|
37
|
|
0.2
|
|
|
Carrier access and fiber revenues
|
49,532
|
|
42,303
|
|
7,229
|
|
17.1
|
|
|||
|
Other revenue
|
3,525
|
|
3,237
|
|
288
|
|
8.9
|
|
|||
|
Total segment operating revenues
|
$
|
74,974
|
|
$
|
67,420
|
|
$
|
7,554
|
|
11.2
|
|
|
Segment operating expenses
|
|
|
|
|
|
|
|
|
|||
|
Cost of goods and services, exclusive of depreciation and amortization shown separately below
|
36,259
|
|
31,668
|
|
4,591
|
|
14.5
|
|
|||
|
Selling, general and administrative, exclusive of depreciation and amortization shown separately below
|
6,474
|
|
6,612
|
|
(138
|
)
|
(2.1
|
)
|
|||
|
Depreciation and amortization
|
11,717
|
|
12,736
|
|
(1,019
|
)
|
(8.0
|
)
|
|||
|
Total segment operating expenses
|
54,450
|
|
51,016
|
|
3,434
|
|
6.7
|
|
|||
|
Segment operating income
|
$
|
20,524
|
|
$
|
16,404
|
|
$
|
4,120
|
|
25.1
|
|
48
Operating revenues
Total operating revenues in 2016 increased $7.6 million, or 11.2%, over 2015. Carrier access and fiber revenues for affiliate fiber contracts grew by $4.9 million in 2016 while non-affiliate fiber contracts grew by $2.3 million. Internet service revenue grew $1.9 million as customers upgraded to higher-speed plans, while voice revenues declined $1.0 million as customers eliminate landline telephone services, and promotional discounts increased $0.9 million.
Operating expenses
Operating expenses overall increased $3.4 million, or 6.7%, in 2016, compared to 2015. The increase in cost of goods and services resulted primarily from a $3.4 million increase in costs to support affiliate fiber routes, and $1.2 million increase in affiliate costs to support internet revenue services.
49
2015 Compared to 2014
Consolidated Results
The Company’s consolidated results from continuing operations for the years ended December 31, 2015 and 2014 are summarized as follows:
|
(in thousands)
|
Years Ended
December 31,
|
Change
|
||||||||
|
|
2015
|
2014
|
$
|
%
|
||||||
|
Operating revenues
|
$
|
342,485
|
|
$
|
326,946
|
|
$
|
15,539
|
|
4.8
|
|
Operating expenses
|
268,399
|
|
265,003
|
|
3,396
|
|
1.3
|
|||
|
Operating income
|
74,086
|
|
61,943
|
|
12,143
|
|
19.6
|
|||
|
Other expense, net
|
5,496
|
|
5,909
|
|
413
|
|
7.0
|
|||
|
Income tax expense
|
27,726
|
|
22,151
|
|
5,575
|
|
25.2
|
|||
|
Net income
|
$
|
40,864
|
|
$
|
33,883
|
|
$
|
6,981
|
|
20.6
|
Operating revenues
Operating revenues increased $15.5 million, or 4.8%. Cable segment revenue grew $13.1 million, primarily as a result of a 5.4% growth in average subscriber counts and an increase in revenue per subscriber. Wireless segment revenues increased $1.3 million compared to 2014. Net prepaid service revenue increased $4.3 million, primarily due to 4.5% growth in average prepaid subscribers over 2014 and higher average revenue per subscriber due to improvements in product mix. Net postpaid service revenues decreased $2.7 million as a 6.7% increase in average postpaid subscribers was more than offset by lower revenue service plans associated with handset financing and leasing programs. Wireline segment revenue increased $4.4 million, led by growth in carrier access fees, fiber revenues, and internet service revenues. Affiliate revenues increased $3.3 million. Affiliate revenues are eliminated from the consolidated totals shown in the table above.
Operating expenses
Total operating expenses increased $3.4 million, or 1.3%, in 2015 compared to 2014. Cost of goods and services sold decreased $8.4 million, primarily due to an $11.8 million decrease in PCS postpaid and prepaid handset costs, partially offset by a $4.1 million increase in cable programming and retransmission consent costs. Selling, general and administrative expenses increased $3.4 million, driven primarily by a $1.8 million increase to support growth of the wireless prepaid business. Depreciation and amortization expense increased $4.8 million, due to a one-time unfavorable adjustment of $2.0 million cumulative impact of additional depreciation on certain assets placed into service in one year and closed out in the fixed asset system in a subsequent year, and to ongoing projects to expand and upgrade the wireless, cable and fiber networks.
Other Expense, net
Interest expense decreased $0.8 million in 2015 from 2014. The decrease resulted from a combination of lower outstanding balances due to principal paydowns in 2015, as well as a decrease in the base rate of 0.25% effective May of 2015 due to improvements in the Company’s leverage ratio. Each of these factors contributed approximately $0.4 million to the decrease. The reduction in interest expense was partially offset by reduced gains from investments in 2015.
Income tax expense
The Company’s effective tax rate increased from 39.5% in 2014 to 40.4% in 2015. The increase is primarily attributable to the non-deductible costs for tax purposes related to the pending acquisition of nTelos.
Net income
Net income increased $7.0 million, or 20.6%, in 2015 from 2014. Growth in subscriber counts in the Wireless and Cable segments, along with a decrease in cost of goods and services sold in the Wireless segment contributed to the increase, but were
50
partially offset by expenses related to the pending acquisition of nTelos and the unfavorable adjustment to depreciation expense.
Wireless
|
(in thousands)
|
Years Ended
December 31,
|
Change
|
|||||||||
|
|
2015
|
2014
|
$
|
%
|
|||||||
|
Segment operating revenues
|
|
|
|
|
|
||||||
|
Wireless service revenue
|
$
|
192,752
|
|
$
|
191,147
|
|
$
|
1,605
|
|
0.8
|
|
|
Tower lease revenue
|
10,505
|
|
10,201
|
|
304
|
|
3.0
|
|
|||
|
Equipment revenue
|
5,175
|
|
5,729
|
|
(554
|
)
|
(9.7
|
)
|
|||
|
Other revenue
|
369
|
|
377
|
|
(8
|
)
|
(2.1
|
)
|
|||
|
Total segment operating revenues
|
$
|
208,801
|
|
$
|
207,454
|
|
$
|
1,347
|
|
0.6
|
|
|
Segment operating expenses
|
|
|
|
|
|
|
|
|
|||
|
Cost of goods and services, exclusive of depreciation and amortization shown separately below
|
63,570
|
|
73,290
|
|
(9,720
|
)
|
(13.3
|
)
|
|||
|
Selling, general and administrative, exclusive of depreciation and amortization shown separately below
|
35,792
|
|
33,171
|
|
2,621
|
|
7.9
|
|
|||
|
Depreciation and amortization
|
34,416
|
|
31,111
|
|
3,305
|
|
10.6
|
|
|||
|
Total segment operating expenses
|
133,778
|
|
137,572
|
|
(3,794
|
)
|
(2.8
|
)
|
|||
|
Segment operating income
|
$
|
75,023
|
|
$
|
69,882
|
|
$
|
5,141
|
|
7.4
|
|
Operating revenues
Wireless service revenue increased $1.6 million, or 0.8%, in 2015 over 2014. Net prepaid service revenues grew $4.3 million, or 9.9%, due to 4.5% growth in average prepaid subscribers over 2014 and higher average revenue per subscriber due to improvements in product mix. Net postpaid service revenues decreased $2.7 million. Average postpaid subscribers increased 6.7% in 2015 over the 2014 period, but the increase was more than offset by promotional discounts and a switch to lower revenue service plans associated with handset financing and leasing plans. Under these programs, the Company receives less service revenue from the subscriber, while the equipment revenue from the subscriber and the handset expense become Sprint’s responsibility and are not recorded by the Company. The decreases in service revenues are currently more than offset by a decrease in handset expense within cost of goods and services.
Tower lease revenue increased primarily as a result of amendments to existing leases, as third party co-locators add 4G capabilities to our towers.
Equipment revenue decreased due primarily to a lower volume of subsidized handset sales, partially offset by lower discounts on those sales.
Operating expenses
Cost of goods and services decreased $9.7 million, or 13.3%, in 2015 from 2014. Postpaid handset costs decreased $10.9 million, as handset expenses associated with financing and leasing plans are Sprint’s responsibility and are not recorded by the Company. Prepaid handset costs decreased $1.0 million, driven by year-over-year declines in both the volume and average cost of handsets. Network costs increased $1.9 million, due to a decrease in labor capitalized to projects and to increases in rent and power expenses for cell sites and towers. Additionally, the prior year period included a $0.4 million gain on disposal of 3G equipment.
Selling, general and administrative costs increased $2.6 million, or 7.9%, in 2015 over 2014. Costs to support the prepaid wireless business increased $1.8 million, driven by subscriber growth, product mix, and higher general and administrative costs. Personnel costs increased $0.7 million due to the addition of new retail stores. Advertising expenses increased $0.6 million. Property taxes increased $0.5 million due to a prior year refund and a higher tax basis in network assets as a result of
51
recent upgrades. The increases were partially offset by a $1.1 million decline in third party commissions expense due to lower volume of commissionable handsets activated through dealer channels.
Depreciation and amortization increased $3.3 million, or 10.6%, in 2015 over 2014, following completion of Network Vision upgrades.
Cable
|
(in thousands)
|
Years Ended
December 31,
|
Change
|
|||||||||
|
|
2015
|
2014
|
$
|
%
|
|||||||
|
Segment operating revenues
|
|
|
|
|
|
||||||
|
Service revenue (1)
|
$
|
88,980
|
|
$
|
77,179
|
|
$
|
11,801
|
|
15.3
|
|
|
Other revenue (1)
|
8,642
|
|
7,374
|
|
1,268
|
|
17.2
|
|
|||
|
Total segment operating revenues
|
$
|
97,622
|
|
$
|
84,553
|
|
$
|
13,069
|
|
15.5
|
|
|
Segment operating expenses
|
|
|
|
|
|
|
|
|
|||
|
Cost of goods and services, exclusive of depreciation and amortization shown separately below
|
54,611
|
|
51,982
|
|
2,629
|
|
5.1
|
|
|||
|
Selling, general and administrative, exclusive of depreciation and amortization shown separately below
|
19,412
|
|
19,521
|
|
(109
|
)
|
(0.6
|
)
|
|||
|
Depreciation and amortization
|
23,097
|
|
23,148
|
|
(51
|
)
|
(0.2
|
)
|
|||
|
Total segment operating expenses
|
97,120
|
|
94,651
|
|
2,469
|
|
2.6
|
|
|||
|
Segment operating income (loss)
|
$
|
502
|
|
$
|
(10,098
|
)
|
$
|
10,600
|
|
105.0
|
|
|
(1)
|
Prior year service and other revenue amounts have been recast to conform to the current year presentation of video and internet equipment revenues being included in service revenue rather than other revenue.
|
Operating revenues
Cable segment service revenue increased $11.8 million, or 15.3%. Internet service revenue increased $8.5 million, or 29.7%, due to a 9.7% increase in average internet subscribers, along with an improved product mix as customers upgraded to higher-speed plans with higher monthly recurring charges. Video revenue, including retransmission consent fee surcharges, increased $4.0 million driven by video rate increases in January 2015. Voice revenue increased $1.2 million due to 16.7% growth in average voice revenue generating units. These increases were partially offset by a $1.9 million increase in bundle discounts.
Other revenue grew $1.3 million, primarily due to new fiber contracts and higher installation revenue.
Operating expenses
Cable segment cost of goods and services increased $2.6 million, or 5.1%, in 2015 over 2014. Video programming costs, including retransmission consent fees, increased $4.1 million as the impact of rising rates per subscriber outpaced declining video subscriber counts. Network costs grew $0.7 million, primarily due to $0.4 million increase in the Universal Service fees mandated by the U.S. government in the current year. The increases were offset by a $1.5 million decrease in disposal costs following a $1.6 million disposal of obsolete equipment in 2014, along with a $1.0 million decrease in maintenance expense following a multi-year project to upgrade cable network infrastructure.
Selling, general and administrative expenses decreased $0.1 million against the prior year as declines in marketing and customer service costs were largely offset by growth in administrative and operating tax expenses.
52
Wireline
|
(in thousands)
|
Years Ended
December 31,
|
Change
|
||||||||
|
|
2015
|
2014
|
$
|
%
|
||||||
|
Segment operating revenues
|
|
|
|
|
||||||
|
Service revenue (1)
|
$
|
21,880
|
|
$
|
20,986
|
|
$
|
894
|
|
4.3
|
|
Carrier access and fiber revenues (1)
|
42,303
|
|
39,202
|
|
3,101
|
|
7.9
|
|||
|
Other revenue (1)
|
3,237
|
|
2,847
|
|
390
|
|
13.7
|
|||
|
Total segment operating revenues
|
$
|
67,420
|
|
$
|
63,035
|
|
$
|
4,385
|
|
7.0
|
|
Segment operating expenses
|
|
|
|
|
|
|
|
|||
|
Cost of goods and services, exclusive of depreciation and amortization shown separately below
|
31,668
|
|
30,088
|
|
1,580
|
|
5.3
|
|||
|
Selling, general and administrative, exclusive of depreciation and amortization shown separately below
|
6,612
|
|
6,009
|
|
603
|
|
10.0
|
|||
|
Depreciation and amortization
|
12,736
|
|
11,224
|
|
1,512
|
|
13.5
|
|||
|
Total segment operating expenses
|
51,016
|
|
47,321
|
|
3,695
|
|
7.8
|
|||
|
Segment operating income
|
$
|
16,404
|
|
$
|
15,714
|
|
$
|
690
|
|
4.4
|
|
(1)
|
Prior year categories of access revenue and facilities lease revenue have been combined into the new category of carrier access and fiber revenue to conform to current year presentation. Additionally, set-top box revenues included in other revenue in the prior year are now presented within service revenue
|
Operating revenues
Total operating revenues in 2015 increased $4.4 million, or 7.0%, over 2014. Carrier access and fiber revenues grew $3.1 million as growth in affiliate and non-affiliate fiber contracts were partially offset by favorable Universal Service program adjustments that were recorded in the first quarter of 2014. Internet service revenue grew $1.2 million as customers upgraded to higher-speed plans.
Operating expenses
Operating expenses overall increased $3.7 million, or 7.8%, in 2015, compared to 2014. The increase in cost of goods and services resulted primarily from a $2.1 million increase in costs to support affiliate fiber routes. The increase was partially offset by a $0.6 million decrease in affiliate and non-affiliate line costs. Sales, general and administrative expenses increased as a result of growth in sales and customer service support teams.
Depreciation expense grew $1.5 million as a result of continued investment in the construction of fiber facilities. The current year total includes an unfavorable adjustment of $0.4 million related to assets placed into service in one year and closed out in the fixed asset system in a subsequent year.
53
Non-GAAP Financial Measure
In managing our business and assessing our financial performance, management supplements the information provided by financial statement measures prepared in accordance with GAAP with Adjusted OIBDA and Continuing OIBDA, which are considered “non-GAAP financial measures” under SEC rules.
Adjusted OIBDA is defined by us as operating income (loss) before depreciation and amortization, adjusted to exclude the effects of: certain non-recurring transactions; impairment of assets; gains and losses on asset sales; straight-line adjustments for the waived management fee by Sprint; amortization of the affiliate contract expansion intangible reflected as a contra revenue; actuarial gains and losses on pension and other post-retirement benefit plans; and share-based compensation expense. Adjusted OIBDA should not be construed as an alternative to operating income as determined in accordance with GAAP as a measure of operating performance. Continuing OIBDA is defined by us as Adjusted OIBDA, less the benefit received from the waived management fee by Sprint over the next approximately six–year period, showing Sprint's support for our acquisition and our commitments to enhance the network.
In a capital-intensive industry such as telecommunications, management believes that Adjusted OIBDA and Continuing OIBDA and the associated percentage margin calculations are meaningful measures of our operating performance. We use Adjusted OIBDA and Continuing OIBDA as supplemental performance measures because management believes they facilitate comparisons of our operating performance from period to period and comparisons of our operating performance to that of other companies by excluding potential differences caused by the age and book depreciation of fixed assets (affecting relative depreciation expenses) as well as the other items described above for which additional adjustments were made. In the future, management expects that the Company may again report Adjusted OIBDA and Continuing OIBDA excluding these items and may incur expenses similar to these excluded items. Accordingly, the exclusion of these and other similar items from our non-GAAP presentation should not be interpreted as implying these items are non-recurring, infrequent or unusual.
While depreciation and amortization are considered operating costs under generally accepted accounting principles, these expenses primarily represent the current period allocation of costs associated with long-lived assets acquired or constructed in prior periods, and accordingly may obscure underlying operating trends for some purposes. By isolating the effects of these expenses and other items that vary from period to period without any correlation to our underlying performance, or that vary widely among similar companies, management believes Adjusted OIBDA and Continuing OIBDA facilitates internal comparisons of our historical operating performance, which are used by management for business planning purposes, and also facilitates comparisons of our performance relative to that of our competitors. In addition, we believe that Adjusted OIBDA and Continuing OIBDA and similar measures are widely used by investors and financial analysts as measures of our financial performance over time, and to compare our financial performance with that of other companies in our industry.
Adjusted OIBDA and Continuing OIBDA have limitations as an analytical tool, and should not be considered in isolation or as a substitute for analysis of our results as reported under GAAP. These limitations include the following:
|
•
|
they do not reflect capital expenditures;
|
|
•
|
many of the assets being depreciated and amortized will have to be replaced in the future and Adjusted OIBDA and Continuing OIBDA do not reflect cash requirements for such replacements;
|
|
•
|
they do not reflect costs associated with share-based awards exchanged for employee services;
|
|
•
|
they do not reflect interest expense necessary to service interest or principal payments on indebtedness;
|
|
•
|
they do not reflect gains, losses or dividends on investments;
|
|
•
|
they do not reflect expenses incurred for the payment of income taxes; and
|
|
•
|
other companies, including companies in our industry, may calculate Adjusted OIBDA and Continuing OIBDA differently than we do, limiting its usefulness as a comparative measure.
|
In light of these limitations, management considers Adjusted OIBDA and Continuing OIBDA as a financial performance measure that supplements but does not replace the information reflected in our GAAP results.
54
The following table shows Adjusted OIBDA and Continuing OIBDA for the years ended December 31, 2016, 2015 and 2014:
|
|
Years Ended
December 31,
|
||||||||
|
(in thousands)
|
2016
|
2015
|
2014
|
||||||
|
Adjusted OIBDA
|
$
|
246,122
|
|
$
|
150,902
|
|
$
|
132,144
|
|
|
Continuing OIBDA
|
$
|
221,526
|
|
$
|
150,902
|
|
$
|
132,144
|
|
The following table reconciles Adjusted OIBDA and Continuing OIBDA to operating income, which we consider to be the most directly comparable GAAP financial measure, for the years ended December 31, 2016, 2015 and 2014:
|
Consolidated Results:
|
Years Ended
December 31,
|
||||||||
|
(in thousands)
|
2016
|
2015
|
2014
|
||||||
|
Operating income
|
$
|
22,526
|
|
$
|
74,086
|
|
$
|
61,943
|
|
|
Plus depreciation and amortization
|
143,685
|
|
70,702
|
|
65,890
|
|
|||
|
Plus (gain) loss on asset sales
|
(49
|
)
|
235
|
|
2,054
|
|
|||
|
Plus share based compensation expense
|
3,021
|
|
2,333
|
|
2,257
|
|
|||
|
Plus straight line adjustment to management fee waiver
|
11,974
|
|
—
|
|
—
|
|
|||
|
Plus amortization of intangibles netted in rent expense
|
728
|
|
—
|
|
—
|
|
|||
|
Plus amortization of intangible netted in revenue
|
14,030
|
|
—
|
|
—
|
|
|||
|
Plus temporary backoffice costs to support the billing operations through migration (1)
|
12,435
|
|
—
|
|
—
|
|
|||
|
Less actuarial gains on pension plans
|
(4,460
|
)
|
—
|
|
—
|
|
|||
|
Plus integration and acquisition related expenses
|
42,232
|
|
3,546
|
|
—
|
|
|||
|
Adjusted OIBDA
|
246,122
|
|
150,902
|
|
132,144
|
|
|||
|
Less waived management fee
|
(24,596
|
)
|
—
|
|
—
|
|
|||
|
Continuing OIBDA
|
$
|
221,526
|
|
$
|
150,902
|
|
$
|
132,144
|
|
(1) Once former nTelos customers migrate to the Sprint backoffice, the Company incurs certain postpaid fees retained by Sprint and prepaid costs passed to us by Sprint that would offset a portion of these savings. For the year ended December 31, 2016, these offsets were estimated at $4.6 million.
The following tables reconcile Adjusted OIBDA and Continuing OIBDA to operating income by major segment for the years ended December 31, 2016, 2015 and 2014:
|
Wireless Segment:
|
Years Ended
December 31,
|
||||||||
|
(in thousands)
|
2016
|
2015
|
2014
|
||||||
|
Operating income
|
$
|
26,241
|
|
$
|
75,023
|
|
$
|
69,882
|
|
|
Plus depreciation and amortization
|
107,621
|
|
34,416
|
|
31,111
|
|
|||
|
Plus (gain) loss on asset sales
|
(131
|
)
|
62
|
|
(101
|
)
|
|||
|
Plus share based compensation expense
|
1,309
|
|
554
|
|
475
|
|
|||
|
Plus straight line adjustment to management fee waiver
|
11,974
|
|
—
|
|
—
|
|
|||
|
Plus amortization of intangible netted in rent expense
|
728
|
|
|||||||
|
Plus amortization of intangible netted in revenue
|
14,030
|
|
—
|
|
—
|
|
|||
|
Plus temporary backoffice costs to support the billing operations through migration
|
12,435
|
|
—
|
|
—
|
|
|||
|
Plus integration and acquisition related expenses
|
25,927
|
|
—
|
|
—
|
|
|||
|
Adjusted OIBDA
|
200,134
|
|
110,055
|
|
101,367
|
|
|||
|
Less waived management fee
|
(24,596
|
)
|
—
|
|
—
|
|
|||
|
Continuing OIBDA
|
$
|
175,538
|
|
$
|
110,055
|
|
$
|
101,367
|
|
55
|
Cable Segment:
|
Years Ended
December 31,
|
||||||||
|
(in thousands)
|
2016
|
2015
|
2014
|
||||||
|
Operating income (loss)
|
$
|
6,997
|
|
$
|
502
|
|
$
|
(10,098
|
)
|
|
Plus depreciation and amortization
|
23,908
|
|
23,097
|
|
23,148
|
|
|||
|
Plus (gain) loss on asset sales
|
156
|
|
45
|
|
1,500
|
|
|||
|
Plus share based compensation expense
|
756
|
|
811
|
|
848
|
|
|||
|
Adjusted OIBDA and Continuing OIBDA
|
$
|
31,817
|
|
$
|
24,455
|
|
$
|
15,398
|
|
|
Wireline Segment:
|
Years Ended
December 31,
|
||||||||
|
(in thousands)
|
2016
|
2015
|
2014
|
||||||
|
Operating income
|
$
|
20,524
|
|
$
|
16,404
|
|
$
|
15,714
|
|
|
Plus depreciation and amortization
|
11,717
|
|
12,736
|
|
11,224
|
|
|||
|
Plus (gain) loss on asset sales
|
(27
|
)
|
169
|
|
655
|
|
|||
|
Plus share based compensation expense
|
347
|
|
408
|
|
386
|
|
|||
|
Adjusted OIBDA and Continuing OIBDA
|
$
|
32,561
|
|
$
|
29,717
|
|
$
|
27,979
|
|
Financial Condition, Liquidity and Capital Resources
The Company has four principal sources of funds available to meet the financing needs of its operations, capital projects, debt service, investments and potential dividends. These sources include cash flows from operations, existing balances of cash and cash equivalents, the liquidation of investments and borrowings. Management routinely considers the alternatives available to determine what mix of sources are best suited for the long-term benefit of the Company.
Sources and Uses of Cash
. The Company generated $161.5 million of net cash from operations in 2016, an increase from $119.3 million in 2015, which was a $4.3 million increase from 2014. The increases were primarily due to increases in operating income before depreciation and amortization.
During 2016, the Company utilized $820.0 million in net investing activities, including $657.4 million invested in acquisitions of nTelos and Colane. Plant and equipment purchases in 2016, 2015 and 2014 totaled $173.2 million, $69.7 million and $68.2 million, respectively. Capital expenditures in 2016 primarily supported wireless network upgrades and capacity and coverage enhancements as a result of the nTelos acquisition, as well as retail store remodeling, cable segment extensions and investment in customer premises equipment, and expansion and upgrade of our fiber networks. Capital expenditures in 2015 supported projects across all segments, including wireless network capacity and coverage enhancements, new retail stores, cable segment extensions and investment in customer premises equipment, and expansion and upgrade of our fiber networks. Expenditures in 2014 also supported projects across all segments, including wireless network capacity and coverage enhancements, cable plant expansion and upgrades, and wireline fiber builds.
Financing activities provided $617.9 million in 2016 as the Company borrowed $860 million to fund the nTelos acquisition and related activities, repaid debt totaling $213.8 million, and paid $14.9 million to enter into the new debt financing arrangement to acquire nTelos. The Company also paid cash dividends totaling $11.7 million. Financing activities utilized $42.2 million in 2015 as the Company made $23.0 million in principal payments on long-term debt, paid cash dividends totaling $11.1 million and paid $7.9 million in debt issuance fees related to the pending nTelos acquisition. Financing activities utilized $16.8 million in 2014, principally due to $10.8 million in cash dividends paid to shareholders and $5.8 million of principal repayments on long-term debt.
Indebtedness.
As of December 31, 2016, the Company’s gross indebtedness totaled $847.9 million, with an annualized effective interest rate of approximately 3.83% after considering the impact of the interest rate swap contract. The balance consists of the Term Loan A-1 at a variable rate (3.52% as of December 31, 2016) that resets monthly based on one month LIBOR plus a base rate of 2.75% currently, and a Term Loan A-2 at a variable rate (3.77% as of December 31, 2016) that resets monthly based on one month LIBOR plus a base rate of 3.00% currently. The Term Loan A-1 requires quarterly principal repayments of $6.1 million through June 30, 2017, increasing to $12.1 million quarterly through June 2020, with further increases at that time through maturity in 2021. The Term Loan A-2 requires quarterly principal payments of $10.0 million beginning September 30, 2018 through March 31, 2023, with the remaining balance due June 30, 2023.
56
The Company’s credit agreement includes a Revolver Facility that provides for $75 million in availability for future capital expenditures and general corporate needs, and $25 million available under the Term Loan A-2 as a delayed draw term loan. In addition, the credit agreement permits the Company to enter into one or more Incremental Term Loan Facilities in the aggregate principal amount not to exceed $150 million subject to compliance with certain covenants. At December 31, 2016, no draw had been made under the Revolver Facility and the Company had not entered into any Incremental Term Loan Facility. When and if a draw is made, the maturity date and interest rate options would be substantially identical to the Term Loan Facility, though the margin on principal drawn on the revolver is 0.25% less than the corresponding margin on term loans. If the interest rate on an Incremental Term Loan Facility is more than 0.25% greater than the rate on the existing outstanding balances, the interest rate on the existing debt would reset at the same rate as the Incremental Term Loan Facility. Repayment provisions would be agreed to at the time of each draw under the Incremental Term Loan Facility.
The Company is subject to certain financial covenants measured on a trailing twelve month basis each calendar quarter unless otherwise specified. These covenants include:
|
•
|
a limitation on the Company’s total leverage ratio, defined as indebtedness divided by earnings before interest, taxes, depreciation and amortization, or EBITDA, of less than or equal to 3.75 to 1.00 through December 30, 2018, then 3.25 to 1.00 through December 30, 2019, and 3.00 to 1.00 thereafter;
|
|
•
|
a minimum debt service coverage ratio, defined as EBITDA divided by the sum of all scheduled principal payments on the Term Loans and regularly scheduled principal payments on other indebtedness plus cash interest expense, greater than 2.00 to 1.00 at all times;
|
|
•
|
a minimum liquidity balance, defined as availability under the Revolver Facility plus unrestricted cash and cash equivalents on deposit in a deposit account for which a control agreement has been delivered to the administrative agent under the 2016 credit agreement, of greater than $25 million at all times.
|
As of December 31, 2016, the Company was in compliance with the financial covenants in its credit agreements, and ratios at December 31, 2016 were as follows:
|
|
Actual
|
Covenant Requirement
|
||
|
Total Leverage Ratio
|
2.81
|
%
|
3.75 or Lower
|
|
|
Debt Service Coverage Ratio
|
4.23
|
%
|
2.00 or Higher
|
|
|
Minimum Liquidity Balance
|
$136 million
|
|
$25 million or Higher
|
|
Contractual Commitments.
The Company is obligated to make future payments under various contracts it has entered into, primarily amounts pursuant to its long-term debt facility, and non-cancelable operating lease agreements for retail space, tower space and cell sites. Expected future minimum contractual cash obligations for the next five years and in the aggregate at December 31, 2016, are as follows:
Payments due by periods
|
(in thousands)
|
Total
(5)
|
Less than 1
year
|
1-3 years
|
4-5 years
|
After 5 years
|
||||||||||
|
Long-term debt principal (1)
|
$
|
847,875
|
|
$
|
36,375
|
|
$
|
157,000
|
|
$
|
419,500
|
|
$
|
235,000
|
|
|
Interest on long–term debt (1)
|
140,027
|
|
31,349
|
|
56,476
|
|
38,950
|
|
13,252
|
|
|||||
|
“Pay fixed” obligations (2)
|
23,004
|
|
5,244
|
|
9,377
|
|
6,300
|
|
2,083
|
|
|||||
|
Operating leases (3)
|
480,788
|
|
49,006
|
|
96,334
|
|
93,608
|
|
241,840
|
|
|||||
|
Purchase obligations (4)
|
59,794
|
|
39,087
|
|
13,805
|
|
6,902
|
|
—
|
|
|||||
|
Total obligations
|
$
|
1,551,488
|
|
$
|
161,061
|
|
$
|
332,992
|
|
$
|
565,260
|
|
$
|
492,175
|
|
|
1)
|
Includes principal payments and estimated interest payments on the Term Loan Facility based upon outstanding balances and rates in effect at December 31, 2016.
|
|
2)
|
Represents the maximum interest payments we are obligated to make under our derivative agreements. Assumes no receipts from the counterparty to our derivative agreements.
|
|
3)
|
Amounts include payments over reasonably assured renewals. See Note 14 to the consolidated financial statements appearing elsewhere in this report for additional information.
|
|
4)
|
Represents open purchase orders at December 31, 2016.
|
57
Other long-term liabilities have been omitted from the table above due to uncertainty of the timing of payments, combined with the absence of historical trending to be used as a predictor of such payments. The Company has no other off-balance sheet arrangements and has not entered into any transactions involving unconsolidated, limited purpose entities or commodity contracts.
Capital Commitments.
The Company spent $173.2 million on capital projects in 2016, up from $69.7 million spent in 2015 and $68.2 million spent in 2014. Capital expenditures in 2016 primarily supported cell site upgrades and coverage and capacity expansions in the wireless segment following the nTelos acquisition, as well as cable plant expansion and upgrades and wireline segment fiber builds. Capital expenditures in 2015 and 2014 supported projects across all segments, including wireless network capacity and coverage enhancements, cable plant expansion and upgrades, and wireline fiber builds.
Capital expenditures budgeted for 2017 totaled $152.3 million, including $99.2 million in the Wireless segment primarily for upgrades and expansion of the nTelos wireless network. In addition, $25.8 million is budgeted primarily for cable network expansion including new fiber routes and cable market expansion, $18.9 million in Wireline projects including fiber builds in Pennsylvania and other areas, and $8.2 million primarily for IT projects.
We believe that cash on hand, cash flow from operations and borrowings expected to be available under our existing credit facilities will provide sufficient cash to enable us to fund planned capital expenditures, make scheduled principal and interest payments, meet our other cash requirements and maintain compliance with the terms of our financing agreements for at least the next twelve months. Thereafter, capital expenditures will likely continue to be required to continue planned capital upgrades to the acquired wireless network and provide increased capacity to meet our expected growth in demand for our products and services. The actual amount and timing of our future capital requirements may differ materially from our estimate depending on the demand for our products and new market developments and opportunities.
Our cash flows from operations could be adversely affected by events outside our control, including, without limitation, changes in overall economic conditions, regulatory requirements, changes in technologies, demand for our products, availability of labor resources and capital, changes in our relationship with Sprint, and other conditions. The Wireless segment’s operations are dependent upon Sprint’s ability to execute certain functions such as billing, customer care, and collections; our ability to develop and implement successful marketing programs and new products and services; and our ability to effectively and economically manage other operating activities under our agreements with Sprint. Our ability to attract and maintain a sufficient customer base, particularly in the acquired cable markets, is also critical to our ability to maintain a positive cash flow from operations. The foregoing events individually or collectively could affect our results.
Recently Issued Accounting Standards
In May 2014, the FASB issued ASU No. 2014-09, “Revenue from Contracts with Customers”, which requires an entity to recognize the amount of revenue to which it expects to be entitled for the transfer of promised goods or services to customers. The ASU will replace most existing revenue recognition guidance in U.S. GAAP when it becomes effective. In August 2015, the FASB issued ASU No. 2015-14, delaying the effective date of ASU 2014-09. Three other amendments have been issued during 2016 modifying the original ASU. As amended, the new standard is effective for the Company on January 1, 2018, using either a retrospective basis or a modified retrospective basis with early adoption permitted, but not earlier than the original effective date beginning after December 15, 2016. We have formed a project team to evaluate and implement the new standard. As part of our work to date, we have begun contract review and documentation. We currently plan to adopt this guidance using the modified retrospective transition approach, which would result in an adjustment to retained earnings for the cumulative effect, if any, of applying this standard. Additionally, this guidance requires us to provide additional disclosures of the amount by which each financial statement line item is affected in the current reporting period during 2018 as compared to the guidance that was in effect before the change. We continue to assess the impact this new standard will have on our financial position, results of operations and cash flows.
In July 2015, the FASB issued ASU No. 2015-11, "Inventory: Simplifying the Measurement of Inventory", which changes the measurement principle for inventory from the lower of cost or market to lower of cost and net realizable value. The ASU also eliminates the requirement for these entities to consider replacement cost or net realizable value less an approximately normal profit margin when measuring inventory. This guidance is effective for fiscal years and interim periods beginning after December 15, 2016. We are currently in the process of evaluating the impact of adoption of the ASU on our financial statements.
In February 2016, the FASB issued ASU No. 2016-02, “Leases”, which requires the recognition of lease assets and lease liabilities by lessees for those leases classified as operating leases under previous generally accepted accounting principles. This change will result in an increase to recorded assets and liabilities on lessees’ financial statements, as well as changes in the
58
categorization of rental costs, from rent expense to interest and depreciation expense. Other effects may occur depending on the types of leases and the specific terms of them utilized by particular lessees. The ASU is effective for us on January 1, 2019, and early application is permitted. Modified retrospective application is required. We are currently evaluating the ASU, but expect that it will have a material impact on our consolidated financial statements.
In January 2017, the FASB issued ASU 2017-01, “Business Combinations: Clarifying the Definition of a Business”. The standard clarifies the definition of a business to assist entities with evaluating whether transactions should be accounted for as acquisitions (or disposals) of assets or businesses. The ASU will become effective for us on January 1, 2018. We are currently evaluating the impact of this ASU on our consolidated financial statements.
In January 2017, the FASB issued ASU 2017-04, “Intangibles - Goodwill and Other (Topic 350): Simplifying the Test for Goodwill Impairment.” The standard eliminates the requirement to measure the implied fair value of goodwill by assigning the fair value of a reporting unit to all assets and liabilities within that unit (“the Step 2 test”) from the goodwill impairment test. Instead, if the carrying amount of a reporting unit exceeds its fair value, an impairment loss is recognized in an amount equal to that excess, limited by the amount of goodwill in that reporting unit. The standard will become effective for us beginning January 1, 2020 and must be applied to any annual or interim goodwill impairment assessments after that date. Early adoption is permitted. We are currently in the process of evaluating the standard, but expect that it will not have a material impact on our consolidated financial statements.
In addition to the updates outlined above, FASB has issued other Accounting Standards Updates that were reviewed by management and determined to have a minimal impact on the financial statements. We will continue to evaluate the impact of all updates as they are released.
59
|
ITEM 7A.
|
QUANTITATIVE AND QUALITATIVE DISCLOSURES ABOUT MARKET RISK
|
The Company’s market risks relate primarily to changes in interest rates on instruments held for other than trading purposes. The Company’s interest rate risk generally involves two components. The first component is outstanding debt with variable rates. As of December 31, 2016, the Company had $847.9 million of variable rate debt outstanding (excluding unamortized loan fees and costs of $18.6 million), bearing interest at a weighted average rate of 3.63% as determined on a monthly basis. An increase in market interest rates of 1.00% would add approximately $8.5 million to annual interest expense, excluding the effect of the interest rate swap. In May 2016, the Company entered into a pay-fixed, receive-variable interest rate swap with three counterparties totaling $256.6 of notional principal (subject to change based upon expected draws under the delayed draw term loan and principal payments due under our debt agreements). These swaps, combined with the swap purchased in 2012, cover notional principal equal to approximately 50% of the expected outstanding variable rate debt through maturity in 2023. The Company is required to pay a combined fixed rate of approximately 1.16% and receive a variable rate based on one month LIBOR (0.77% as of December 31, 2016), to manage a portion of its interest rate risk. Changes in the net interest paid or received under the swaps would offset approximately 50% of the change in interest expense on the variable rate debt outstanding. The swap agreements currently add approximately $0.9 million to annual interest expense, based on the spread between the fixed rate and the variable rate currently in effect on our debt.
The second component of interest rate risk is marked increases in interest rates that may adversely affect the rate at which the Company may borrow funds for growth in the future. If the Company should borrow additional funds under any Incremental Term Loan Facility to fund its capital investment needs, repayment provisions would be agreed to at the time of each draw under the Incremental Term Loan Facility. If the interest rate margin on any draw exceeds by more than 0.25% the applicable interest rate margin on the Term Loan Facility, the applicable interest rate margin on the Term Loan Facility shall be increased to equal the interest rate margin on the Incremental Term Loan Facility. If interest rates increase generally, or if the rate applied under the Company’s Incremental Term Loan Facility causes the Company’s outstanding debt to be repriced, the Company’s future interest costs could increase.
Management views market risk as having a potentially significant impact on the Company's results of operations, as future results could be adversely affected if interest rates were to increase significantly for an extended period, or if the Company’s need for additional external financing resulted in increases to the interest rates applied to all of its new and existing debt. As of December 31, 2016, the Company has $425.3 million of variable rate debt with no interest rate protection. The Company’s investments in publicly traded stock and bond mutual funds under the rabbi trust, which are subject to market risks and could experience significant swings in market values, are offset by corresponding changes in the liabilities owed to participants in the Supplemental Executive Retirement Plan. General economic conditions affected by regulatory changes, competition or other external influences may pose a higher risk to the Company’s overall results.
|
ITEM 8.
|
FINANCIAL STATEMENTS AND SUPPLEMENTARY DATA
|
The financial statements listed in Item 15 are filed as part of this report and appear on pages F-2 through F-38.
60
|
ITEM 9.
|
CHANGES IN AND DISAGREEMENTS WITH ACCOUNTANTS ON ACCOUNTING AND FINANCIAL DISCLOSURE
|
None
|
ITEM 9A.
|
CONTROLS AND PROCEDURES
|
|
(a)
|
Evaluation of Disclosure Controls and Procedures
|
Our management, including our Chief Executive Officer and Chief Financial Officer, have conducted an evaluation of the effectiveness of the design and operation of our disclosure controls and procedures (as defined in Rule 13a-15(e) under the Securities Exchange Act of 1934, as amended (the Exchange Act)) as of December 31, 2016. Our Chief Executive Officer and Chief Financial Officer concluded that, as a result of the material weaknesses in internal control over financial reporting as described below, our disclosure controls and procedures were not effective as of December 31, 2016.
For purposes of Rule 13a-15(e), the term disclosure controls and procedures means controls and other procedures of an issuer that are designed to ensure that information required to be disclosed by the issuer in the reports that it files or submits under the Exchange Act (15 U.S.C. 78a et seq.) is recorded, processed, summarized and reported within the time periods specified in the SEC’s rules and forms. Disclosure controls and procedures include, without limitation, controls and procedures designed to ensure that information required to be disclosed by an issuer in the reports that it files or submits under the Exchange Act is accumulated and communicated to the issuer’s management, including its Chief Executive Officer and Chief Financial Officer, or persons performing similar functions, as appropriate to allow timely decisions regarding required disclosure.
|
(b)
|
Management’s Report on Internal Control Over Financial Reporting
|
Our management is responsible for establishing and maintaining adequate internal control over financial reporting, as such term is defined in Exchange Act Rules 13a-15(f) and 15d-15(f). The Company’s internal control over financial reporting is a process designed to provide reasonable assurance regarding the reliability of financial reporting and the preparation of financial statements for external purposes in accordance with generally accepted accounting principles. A company’s internal control over financial reporting includes those policies and procedures that:
|
i.
|
Pertain to the maintenance of records that, in reasonable detail, accurately and fairly reflect the transactions and dispositions of the assets of the company;
|
|
ii.
|
Provide reasonable assurance that transactions are recorded as necessary to permit preparation of financial statements in accordance with generally accepted accounting principles, and that receipts and expenditures of the company are being made only in accordance with authorizations of management and directors of the company; and
|
|
iii.
|
Provide reasonable assurance regarding prevention or timely detection of unauthorized acquisition, use or disposition of the company’s assets that could have a material effect on the financial statements.
|
Because of its inherent limitations, internal control over financial reporting may not prevent or detect misstatements. Also, projections of any evaluation of effectiveness to future periods are subject to the risk that controls may become inadequate because of changes in conditions, or that the degree of compliance with the policies or procedures may deteriorate.
A material weakness is a deficiency, or combination of deficiencies, in internal control over financial reporting such that there is a reasonable possibility that a material misstatement of our annual or interim financial statements will not be prevented or detected on a timely basis.
Under the supervision and with the participation of our management, including our Chief Executive Officer and our Chief Financial Officer, we conducted an assessment of our internal control over financial reporting as of December 31, 2016, based on the framework in
Internal Control - Integrated Framework (2013)
, issued by the Committee of Sponsoring Organizations of the Treadway Commission. On May 6, 2016, the Company completed the acquisition of nTelos, whose financial statements constitute $42.9 million of total assets and $67.7 million of total operating revenues of the consolidated financial statements as of and for the year ended December 31, 2016. In accordance with SEC guidance, management has elected to exclude this acquisition from its 2016 assessment of and report on internal control over financial reporting.
Based on this assessment, management has identified the material weaknesses described below:
|
•
|
The Company did not have sufficient number of trained resources with assigned responsibility and accountability for the design, operation and documentation of internal controls over (i) complex, significant non-routine transactions, including
|
61
the business combination of nTelos and the Sprint asset exchange transaction; (ii) the preparation of the consolidated statements of cash flows; and (iii) their interaction with third party service providers.
|
•
|
The Company did not have an effective risk assessment process that identified and assessed necessary changes in the application of generally accepted accounting principles, financial reporting processes and the design and effective operation of internal controls that were responsive to changes in business operations, specifically changes in the business resulting from the acquisition of nTelos and the Sprint asset exchange transaction.
|
|
•
|
The Company did not have an effective information and communication process that identified and assessed the source of reliable information necessary for financial accounting and reporting related to complex, significant non-routine transactions and accurately communicated the information on a timely basis to third party service providers.
|
|
•
|
The Company did not have effective monitoring activities to assess the operation of internal control related to (i) complex, significant non-routine transactions; (ii) accounting for income taxes; and (iii) the preparation of the consolidated statements of cash flows.
|
As a consequence, the Company did not have effective control activities over the following:
|
•
|
The Company did not adequately design and document controls over complex, significant non-routine transactions that include the measurement of the fair value of FCC licenses, property and equipment, customer based intangible assets, leases, and the affiliate contract expansion intangible asset acquired from nTelos and as a result of the Sprint asset exchange transaction. Specifically, the Company did not design and document (i) management review controls that adequately addressed management’s expectations, criteria for investigation, and the level of precision used in the performance of the review controls; and (ii) process level controls that addressed the completeness and accuracy of key assumptions and data provided to its third party service providers and used in measurement of these accounts and in the performance of management review and other controls.
|
|
•
|
The Company did not adequately design and document controls over the accounting for income taxes, specifically (i) controls to ensure the completeness, existence, accuracy and proper disclosure of income tax expense, deferred income taxes and income tax payables and receivables; and (ii) controls that addressed the completeness and accuracy of key assumptions and other data provided to its third party service providers in connection with their preparation of the tax provision and used in the performance of certain management review and other controls.
|
|
•
|
The Company did not adequately operate and document controls over the preparation of the consolidated statements of cash flows.
|
These control deficiencies resulted in an immaterial misstatement in the presentation of operating and investing activities in the unaudited consolidated statements of cash flows included in the Form 10-Q for the six-months ended June 30, 2016 and nine-months ended September 30, 2016. These control deficiencies also resulted in several immaterial and material misstatements in the measurement and disclosure of certain intangible and tangible assets related to the business combination and asset exchange transactions, deferred income taxes, and the presentation of operating and investing activities in the preliminary financial statements, all of which were corrected prior to issuance of the Company’s consolidated financial statements as of December 31, 2016. In addition, these deficiencies resulted in certain immaterial misstatements that were not corrected in the consolidated financial statements as of December 31, 2016. Other deficiencies resulted in no misstatements in the financial statements. However, the control deficiencies described above created a reasonable possibility that a material misstatement to the consolidated financial statements would not be prevented or detected on a timely basis and therefore we concluded that the deficiencies represent material weaknesses in the Company’s internal control over financial reporting and our internal control over financial reporting was not effective as of December 31, 2016.
Our independent registered public accounting firm, KPMG LLP, who audited the consolidated financial statements included in this Annual Report on Form 10-K, issued an adverse report on the effectiveness of the Company’s internal control over financial reporting. KPMG LLP’s report appears on page F-2 of this Annual Report on Form 10-K.
|
(c)
|
Management’s Remediation Plan
|
The Company will execute the following steps in 2017 to remediate the aforementioned material weaknesses in internal control over financial reporting:
|
•
|
Seek, train and retain individuals that have the appropriate skills and experience related to financial reporting and internal control related to (i) complex, significant non-routine transactions; (ii) the preparation of the consolidated statements of cash flows; and (iii) the Company’s internal audit function.
|
62
|
•
|
Evaluate and develop where necessary policies and procedures to ensure our personnel are sufficiently knowledgeable about the design, operation and documentation of internal controls over financial reporting related to (i) complex, significant non-routine transactions; (ii) accounting for income taxes; and (iii) the preparation of the consolidated statements of cash flows.
|
|
•
|
Enhance the design of existing control activities and implement additional control activities to ensure management review controls and other controls (including controls that validate the completeness and accuracy of information, data and assumptions) related to complex, significant non-routine transactions and accounting for income taxes, are properly designed and documented.
|
|
•
|
Evaluate and enhance the Company’s policies, procedures and control activities over communicating with the Company’s third party experts to ensure complete and accurate information is communicated.
|
|
•
|
Evaluate and enhance the Company’s monitoring activities to ensure the components of internal control are present and functioning related to (i) complex, significant non-routine transactions; (ii) accounting for income taxes; and (iii) the preparation of the consolidated statements of cash flows.
|
(d) Changes in Internal Control Over Financial Reporting
Other than the identification and assessment of the material weaknesses noted above, there were no other changes in internal control over financial reporting during the fourth quarter of 2016 that have materially affected, or are reasonably likely to materially affect, our internal control over financial reporting.
|
ITEM 9B.
|
OTHER INFORMATION
|
None
63
|
ITEM 10.
|
DIRECTORS, EXECUTIVE OFFICERS AND CORPORATE GOVERNANCE
|
See “Executive Officers” in Part 1, Item 1 of this report for information about our executive officers, which is incorporated by reference in this Item 10. Other information required by this Item 10 is incorporated by reference to the Company's definitive proxy statement for its 2017 Annual Meeting of Shareholders, referred to as the “2017 proxy statement,” which we will file with the SEC on or before 120 days after our 2016 fiscal year end, and which appears in the 2017 proxy statement under the captions “Election of Directors” and “Section 16(a) Beneficial Ownership Reporting Compliance.”
We have adopted a code of ethics applicable to our chief executive officer and other senior financial officers, who include our principal financial officer, principal accounting officer or controller, and persons performing similar functions. The code of ethics, which is part of our Code of Business Conduct and Ethics, is available on our website at
www.shentel.com
. To the extent required by SEC rules, we intend to disclose any amendments to our code of conduct and ethics, and any waiver of a provision of the code with respect to the Company’s directors, principal executive officer, principal financial officer, principal accounting officer or controller, or persons performing similar functions, on our website referred to above within four business days following such amendment or waiver, or within any other period that may be required under SEC rules from time to time.
|
ITEM 11.
|
EXECUTIVE COMPENSATION
|
Information required by this Item 11 is incorporated herein by reference to the 2017 proxy statement, including the information in the 2017 proxy statement appearing under the captions “Election of Directors-Director Compensation” and “Executive Compensation.”
|
ITEM 12.
|
SECURITY OWNERSHIP OF CERTAIN BENEFICIAL OWNERS AND MANAGEMENT AND RELATED STOCKHOLDER MATTERS
|
Information required by this Item 12 is incorporated herein by reference to the 2017 proxy statement appearing under the caption “Security Ownership.”
The Company awards stock options to its employees meeting certain eligibility requirements under plans approved by its shareholders in 2005 and 2014, referred to as the “2005 stock option plan” and “2014 stock option plan”, respectively. Outstanding options and the number of shares available for future issuance as of December 31, 2016 were as follows:
|
|
Number of securities to
be issued upon exercise
of outstanding options
|
Weighted average
exercise price of
outstanding options
|
Number of securities
remaining available for
future issuance
|
||||||
|
2005 stock option plan
|
524,642
|
|
$
|
6.67
|
|
—
|
|
||
|
2014 stock option plan
|
—
|
|
—
|
|
2,563,523
|
|
|||
Effective April 2014, the 2014 stock option plan was approved by shareholders with 3.0 million shares authorized. As a result of the adoption of the 2014 stock option plan, additional grants will not be made under the 2005 stock option plan, although outstanding grants may continue to vest, be distributed or exercised.
|
ITEM 13.
|
CERTAIN RELATIONSHIPS, RELATED TRANSACTIONS AND DIRECTOR INDEPENDENCE
|
Information required by this Item 13 is incorporated herein by reference to the 2017 proxy statement, including the information in the 2017 proxy statement appearing under the caption “Executive Compensation-Certain Relationships and Related Transactions.”
64
|
ITEM 14.
|
PRINCIPAL ACCOUNTING FEES AND SERVICES
|
Information required by this Item 14 is incorporated herein by reference to the 2017 proxy statement, including the information in the 2017 proxy statement appearing under the caption “Shareholder Ratification of Independent Registered Public Accounting Firm.”
|
ITEM 15.
|
EXHIBITS AND FINANCIAL STATEMENT SCHEDULES
|
(a)(1) The following consolidated financial statements of the Company appear on pages F-2 through F-37 of this report and are incorporated by reference in Part II, Item 8:
Reports of Independent Registered Public Accounting Firm
Consolidated Financial Statements
Consolidated Balance Sheets as of December 31, 2016 and 2015
Consolidated Statements of Operations and Comprehensive Income for the years ended December 31, 2016, 2015 and 2014
Consolidated Statements of Shareholders’ Equity for the years ended December 31, 2016, 2015 and 2014
Consolidated Statements of Cash Flows for the years ended December 31, 2016, 2015 and 2014
Notes to Consolidated Financial Statements
(a)(2) All schedules for which provision is made in the applicable accounting regulations of the Securities and Exchange Commission are not required under the related instructions or are inapplicable and therefore have been omitted.
(a)(3) The following exhibits are either filed with this Form 10-K or incorporated herein by reference. Our Securities Exchange Act file number is 000-09881.
65
Exhibits Index
|
Exhibit
Number
|
Exhibit Description
|
|
|
|
|
|
|
2.1
|
Agreement and Plan of Merger, dated as of August 10, 2015, by and among Shenandoah Telecommunications Company, Gridiron Merger Sub, Inc. and NTELOS Holdings Corp., filed as Exhibit 2.1 to the Company’s Current Report on Form 8-K, dated August 11, 2015.
|
|
|
|
|
|
|
3.1
|
Amended and Restated Articles of Incorporation of Shenandoah Telecommunications Company filed as Exhibit 3.1 to the Company’s Quarterly Report on Form 10-Q for the period ending June 30, 2007, as amended by the Articles of Amendment of Shenandoah Telecommunications Company filed as Exhibit 3.3 to the Company’s Current Report on Form 8-K , filed January 5, 2016.
|
|
|
|
|
|
|
3.20
|
Amended and Restated Bylaws of Shenandoah Telecommunications Company, effective July 18, 2016, filed as Exhibit 3.1 to the Company’s Current Report on Form 8-K dated July 16, 2016.
|
|
|
|
|
|
|
4.1
|
Rights Agreement, dated as of February 8, 2008 between the Company and American Stock Transfer & Trust Company filed as Exhibit 4.1 to the Company's Current Report on Form 8-K, dated January 25, 2008.
|
|
|
|
|
|
|
4.2
|
Specimen representing the Common Stock, no par value, of Shenandoah Telecommunications Company, filed as Exhibit 4.3 to the Company’s Report on Form 10-K for the year ended December 31, 2007.
|
|
|
|
|
|
|
10.1
|
Shenandoah Telecommunications Company Dividend Reinvestment Plan filed as Exhibit 4.4 to the Company’s Registration Statement on Form S-3D (No. 333-74297).
|
|
|
|
|
|
|
10.2
|
Settlement Agreement and Mutual Release dated as of January 30, 2004 by and among Sprint Spectrum L.P., Sprint Communications Company L.P., WirelessCo, L.P., APC PCS, LLC, PhillieCo, L.P. and Shenandoah Personal Communications Company and Shenandoah Telecommunications Company, dated January 30, 2004; filed as Exhibit 10.3 to the Company’s Report on Form 10-K for the year ended December 31, 2003.
|
|
|
|
|
|
|
10.3
|
Sprint PCS Management Agreement dated as of November 5, 1999 by and among Sprint Spectrum L.P., WirelessCo, L.P., APC PCS, LLC, PhillieCo, L.P., and Shenandoah Personal Communications Company filed as Exhibit 10.4 to the Company’s Report on Form 10-K for the year ended December 31, 2003.
|
|
|
|
|
|
|
10.4
|
Sprint PCS Services Agreement dated as of November 5, 1999 by and between Sprint Spectrum L.P. and Shenandoah Personal Communications Company filed as Exhibit 10.5 to the Company’s Report on Form 10-K for the year ended December 31, 2003.
|
|
|
|
|
|
|
10.5
|
Sprint Trademark and Service Mark License Agreement dated as of November 5, 1999 by and between Sprint Communications Company, L.P. and Shenandoah Personal Communications Company filed as Exhibit 10.6 to the Company’s Report on Form 10-K for the year ended December 31, 2003.
|
|
|
|
|
|
|
10.6
|
Sprint Spectrum Trademark and Service Mark License Agreement dated as of November 5, 1999 by and between Sprint Spectrum L.P. and Shenandoah Personal Communications Company filed as Exhibit 10.7 to the Company’s Report on Form 10-K for the year ended December 31, 2003.
|
|
|
|
|
|
|
10.7
|
Addendum I to Sprint PCS Management Agreement by and among Sprint Spectrum L.P., WirelessCo, L.P., APC PCS, LLC, PhillieCo, L.P., and Shenandoah Personal Communications Company filed as Exhibit 10.8 to the Company’s Report on Form 10-K for the year ended December 31, 2003.
|
|
66
|
10.8
|
Asset Purchase Agreement dated November 5, 1999 by and among Sprint Spectrum L.P., Sprint Spectrum Equipment Company, L. P., Sprint Spectrum Realty Company, L.P., and Shenandoah Personal Communications Company, serving as Exhibit A to Addendum I to the Sprint PCS Management Agreement and as Exhibit 2.6 to the Sprint PCS Management Agreement filed as Exhibit 10.9 to the Company’s Report on Form 10-K for the year ended December 31, 2003.
|
|
|
|
|
10.9
|
Addendum II dated August 31, 2000 to Sprint PCS Management Agreement by and among Sprint Spectrum L.P., WirelessCo, L.P., APC PCS, LLC, PhillieCo, L.P., and Shenandoah Personal Communications Company filed as Exhibit 10.10 to the Company’s Report on Form 10-K for the year ended December 31, 2003.
|
|
|
|
|
10.10
|
Addendum III dated September 26, 2001 to Sprint PCS Management Agreement by and among Sprint Spectrum L.P., WirelessCo, L.P., APC PCS, LLC, PhillieCo, L.P., and Shenandoah Personal Communications Company filed as Exhibit 10.11 to the Company’s Report on Form 10-K for the year ended December 31, 2003.
|
|
|
|
|
10.11
|
Addendum IV dated May 22, 2003 to Sprint PCS Management Agreement by and among Sprint Spectrum L.P., WirelessCo, L.P., APC PCS, LLC, PhillieCo, L.P., and Shenandoah Personal Communications Company filed as Exhibit 10.12 to the Company’s Report on Form 10-K for the year ended December 31, 2003.
|
|
|
|
|
10.12
|
Addendum V dated January 30, 2004 to Sprint PCS Management Agreement by and among Sprint Spectrum L.P., WirelessCo, L.P., APC PCS, LLC, PhillieCo, L.P., and Shenandoah Personal Communications Company filed as Exhibit 10.13 to the Company’s Report on Form 10-K for the year ended December 31, 2003.
|
|
|
|
|
10.13
|
Supplemental Executive Retirement Plan as amended and restated, filed as Exhibit 10.14 to the Company’s Current Report on Form 8-K dated March 23, 2007.
|
|
|
|
|
10.14
|
Addendum VI dated May 24, 2004 to Sprint PCS Management Agreement by and among Sprint Spectrum L.P., WirelessCo, L.P., APC PCS, LLC, PhillieCo, L.P., and Shenandoah Personal Communications Company filed as Exhibit 10.15 to the Company’s Report on Form 10-Q for the quarterly period ended June 30, 2004.
|
|
|
|
|
10.15
|
Description of the Shenandoah Telecommunications Company Incentive Plan filed as Exhibit 10.25 to the Company’s Current Report on Form 8-K dated January 21, 2005.
|
|
|
|
|
10.16
|
Description of Compensation of Non-Employee Directors. Filed as Exhibit 10.26 to the Company’s Current Report on Form 8-K dated May 4, 2005.
|
|
|
|
|
10.17
|
Description of Management Compensatory Plans and Arrangements. Filed as Exhibit 10.27 to the Company’s current report on Form 8-K dated April 20, 2005.
|
|
|
|
|
10.18
|
2005 Stock Incentive Plan filed as Exhibit 10.1 to the Company’s Registration Statement on Form S-8 (No. 333-127342).
|
|
|
|
|
10.19
|
Form of Incentive Stock Option Agreement under the 2005 Stock Incentive Plan filed as Exhibit 10.29 to the Company’s Report on Form 10-K for the year ended December 31, 2005.
|
|
|
|
|
10.20
|
Addendum VII dated March 13, 2007 to Sprint PCS Management Agreement by and among Sprint Spectrum L.P., Wireless Co., L.P., APC PCS, LLC, Phillieco, L.P., and Shenandoah Personal Communications Company, filed as Exhibit 10.31 to the Company’s Report on Form 10-K for the year ended December 31, 2006.
|
67
|
10.21
|
Settlement Agreement and Mutual Release dated March 13, 2007 by and among Sprint Corporation, Sprint Spectrum L.P., Wireless Co., L.P., Sprint Communications Company L.P., APC PCS, LLC, Phillieco, L.P., and Shenandoah Personal Communications Company and Shenandoah Telecommunications, filed as Exhibit 10.32 to the Company’s Report on Form 10-K for the year ended December 31, 2006.
|
|
|
|
|
10.22
|
Form of Performance Share Award to Executives filed as Exhibit 10.33 to the Company’s Current Report on Form 8-K dated September 20, 2007.
|
|
|
|
|
10.23
|
Addendum VIII to the Sprint Management Agreement dated November 19, 2007, filed as Exhibit 10.36 to the Company’s Current Report on Form 8-K dated November 20, 2007.
|
|
|
|
|
10.24
|
Asset Purchase Agreement dated August 6, 2008, between Rapid Communications, LLC, Rapid Acquisition Company, LLC, and Shentel Cable Company, filed as Exhibit 10.37 to the Company’s Report on Form 10-Q for the period ended June 30, 2008.
|
|
|
|
|
10.25
|
Amendment Number 1 to the Asset Purchase Agreement dated August 6, 2008, between Rapid Communications, LLC, Rapid Acquisition Company, LLC, and Shentel Cable Company, filed as Exhibit 10.40 to the Company’s Current Report on Form 8-K dated November 7, 2008.
|
|
|
|
|
10.26
|
Addendum IX to the Sprint Management Agreement dated as of April 14, 2009, and filed as Exhibit 10.42 to the Company’s Annual Report on Form 10-K dated March 8, 2010.
|
|
|
|
|
10.27
|
Asset Purchase Agreement dated as of April 16, 2010, between JetBroadband VA, LLC, Helicon Cable Communications, LLC, JetBroadband WV, LLC, JetBroadband Holdings, LLC, Helicon Cable Holdings, LLC, Shentel Cable Company and Shenandoah Telecommunications Company, filed as Exhibit 10.43 to the Company’s Current Report on Form 8-K, dated April 16, 2010.
|
|
|
|
|
10.28
|
Addendum X dated March 15, 2010 to Sprint PCS Management Agreement by and among Sprint Spectrum L.P., WirelessCo, L.P., APC PCS, LLC, PhillieCo, L.P., Sprint Communications Company L.P. and Shenandoah Personal Communications Company, filed as Exhibit 10.44 to the Company’s Current Report on Form 10-Q, dated May 7, 2010.
|
|
|
|
|
10.29
|
Addendum XI dated July 7, 2010 to Sprint PCS Management Agreement by and among Sprint Spectrum L.P., WirelessCo, L.P., APC PCS, LLC, PhillieCo, L.P., Sprint Communications Company L.P. and Shenandoah Personal Communications Company, filed as Exhibit 10.45 to the Company’s Current Report on Form 8-K dated July 8, 2010.
|
|
|
|
|
10.30
|
Credit Agreement dated as of July 30, 2010, among Shenandoah Telecommunications Company, CoBank, ACB, Branch Banking and Trust Company, Wells Fargo Bank, N.A., and other Lenders, filed as Exhibit 10.46 to the Company’s Current Report on Form 8-K dated July 30, 2010.
|
|
|
|
|
10.31
|
Second Amendment to the Credit Agreement dated as of July 30, 2010, among Shenandoah Telecommunications Company, CoBank, ACB, Branch Banking and Trust Company, Wells Fargo Bank, N.A., and other Lenders, filed as Exhibit 10.47 to the Company’s Current Report on Form 8-K dated April 29, 2011.
|
|
|
|
|
10.32
|
Third Amendment to the Credit Agreement dated as of July 30, 2010, among Shenandoah Telecommunications Company, CoBank, ACB, Branch Banking and Trust Company, Wells Fargo Bank, N.A., and other Lenders, filed as Exhibit 10.48 to the Company’s Quarterly Report on Form 10-Q dated August 8, 2011.
|
68
|
10.33
|
Letter Agreement modifying section 10.2.7.2 of Addendum X dated March 15, 2010 to Sprint PCS Management Agreement by and among Sprint Spectrum L.P., WirelessCo, L.P., APC PCS, LLC, PhillieCo, L.P., Sprint Communications Company L.P. and Shenandoah Personal Communications Company, filed as Exhibit 10.49 to the Company’s Quarterly Report on Form 10-Q dated August 8, 2011.
|
|
|
|
|
10.34
|
Fourth Amendment to the Credit Agreement dated as of July 30, 2010, among Shenandoah Telecommunications Company, CoBank, ACB, Branch Banking and Trust Company, Wells Fargo Bank, N.A., and other Lenders, filed as Exhibit 10.50 to the Company’s Quarterly Report on Form 10-Q dated August 8, 2011.
|
|
|
|
|
10.35
|
Addendum XII dated February 1, 2012 to Sprint PCS Management Agreement by and among Sprint Spectrum L.P., WirelessCo, L.P., APC PCS, LLC, PhillieCo, L.P., Sprint Communications Company L.P. and Shenandoah Personal Communications Company, filed as Exhibit 10.51 to the Company’s Current Report on Form 8-K dated February 2, 2012.
|
|
|
|
|
10.36
|
Fifth Amendment to the Credit Agreement dated as of July 30, 2010, among Shenandoah Telecommunications Company, CoBank, ACB, Branch Banking and Trust Company, Wells Fargo Bank, N.A., and other Lenders, filed as Exhibit 10.52 to the Company’s Current Report on Form 8-K dated February 2, 2012.
|
|
|
|
|
10.37
|
Addendum XIII dated September 14, 2012 to Sprint PCS Management Agreement by and among Sprint Spectrum L.P., WirelessCo, L.P., APC PCS, LLC, PhillieCo, L.P., Sprint Communications Company L.P. and Shenandoah Personal Communications, LLC, filed as Exhibit 10.53 to the Company’s Current Report on Form 8-K dated September 17, 2012.
|
|
|
|
|
10.38
|
Consent and Agreement dated September 14, 2012 related to Sprint PCS Management Agreement by and among Sprint Spectrum L.P., WirelessCo, L.P., APC PCS, LLC, PhillieCo, L.P., Sprint Communications Company L.P. and Shenandoah Personal Communications, LLC, filed as Exhibit 10.54 to the Company’s Current Report on Form 8-K dated September 17, 2012.
|
|
|
|
|
10.39
|
Amended and Restated Credit Agreement dated as of September 14, 2012, among Shenandoah Telecommunications Company, CoBank, ACB, and other Lenders, filed as Exhibit 10.55 to the Company’s Current Report on Form 8-K dated September 17, 2012.
|
|
|
|
|
10.40
|
Addendum XIV dated as of November 19, 2012, to Sprint PCS Management Agreement by and among Sprint Spectrum L.P., WirelessCo, L.P., APC PCS, LLC, PhillieCo, L.P., Sprint Communications Company L.P. and Shenandoah Personal Communications, LLC, filed as Exhibit 10.42 to the Company’s Annual Report on Form 10-K dated March 5, 2013.
|
|
|
|
|
10.41
|
Addendum XV dated as of March 11, 2013, to Sprint PCS Management Agreement by and among Sprint Spectrum, L.P., WirelessCo, L.P., APC PCS, LLC, PhillieCo, L.P., Sprint Communications Company L.P. and Shenandoah Personal communications, LLC, filed as Exhibit 10.43 to the Company’s Quarterly Report on Form 10-Q dated May 3, 2013.
|
|
|
|
|
10.42
|
First Amendment dated January 30, 2014, to the Amended and Restated Credit Agreement among Shenandoah Telecommunications Company, CoBank, ACB, and other Lenders, filed as Exhibit 10.43 to the Company’s Quarterly Report on Form 10-Q dated May 2, 2014.
|
|
|
|
|
10.43
|
Joinder Agreement dated January 30, 2014, to the Amended and Restated Credit Agreement among Shenandoah Telecommunications Company, CoBank, ACB, and other Lenders, filed as Exhibit 10.44 to the Company’s Quarterly Report on Form 10-Q dated May 2, 2014.
|
|
|
|
|
10.44
|
Addendum XVI dated as of December 9, 2013 to Sprint PCS Management Agreement by and among Sprint Spectrum, L.P., WirelessCo, L.P., APC PCS, LLC, PhillieCo, L.P., Sprint Communications Company L.P. and Shenandoah Personal Communications, LLC, filed as Exhibit 10.45 to the Company’s Quarterly Report on Form 10-Q dated May 2, 2014.
|
69
|
10.45
|
Addendum XVII dated as of April 11, 2014, to Sprint PCS Management Agreement by and among Sprint Spectrum, L.P., WirelessCo, L.P., APC PCS, LLC, PhillieCo, L.P., Sprint Communications Company L.P. and Shenandoah Personal Communications, LLC, filed as Exhibit 10.46 to the Company’s Quarterly Report on Form 10-Q dated May 2, 2014.
|
|
|
|
|
10.46
|
2014 Equity Plan filed as Appendix A to the Company’s Definitive Proxy Statement filed on March 13, 2014 (No. 333-196990).
|
|
|
|
|
10.47
|
Master Agreement dated as of August 10, 2015, by and among SprintCom, Inc. and Shenandoah Personal Communications, LLC, filed as Exhibit 10.1 to the Company’s Current Report on Form 8-K dated August 11, 2015.
|
|
|
|
|
10.48
|
Addendum XVIII dated as of August 10, 2015, to Sprint PCS Management Agreement by and among SprintCom, Inc., PhillieCo, L.P., and Shenandoah Personal Communications, LLC, filed as Exhibit 10.2 to the Company’s Current Report on Form 8-K, dated August 11, 2015.
|
|
|
|
|
10.49
|
Credit Agreement dated as of December 18, 2015, by and among Shenandoah Telecommunications Company, as Borrower, the guarantors party thereto from time to time, CoBank, ACB, as Administrative Agent, and various other agents and lenders named therein, filed as Exhibit 10.1 to the Company’s Current Report on Form 8-K, dated December 24, 2015.
|
|
10.50
|
First amendment to Credit Agreement, dated as of March 29, 2016, by and among Shenandoah Telecommunications Company, as Borrower, CoBank, ACB, as Administrative Agent, and various other lenders named therein, filed as Exhibit 10.1 to the Company's Current Report on Form 8-K, dated March 29, 2016.
|
|
10.51
|
Amended and Restated Master Agreement, dated as of May 6, 2016, by and between Shenandoah Personal Communications, LLC and SprintCom, Inc, filed as Exhibit 10.1 to the Company's Current Report on Form 8-K, dated May 6, 2016.
|
|
10.52
|
Addendum XIX to Sprint PCS Management Agreement, dated as of May 6, 2016, by and among Sprint Spectrum L.P., WirelessCo, LLC, APC PCS, LLC, PhillieCo, LLC, Sprint Communications Company L.P., Shenandoah Personal Communications, LLC and SprintCom, Inc, filed as Exhibit 10.2 to the Company's Current Report on Form 8-K, dated May 6, 2016.
|
|
|
|
|
10.53
|
Consent and Agreement, dated as of May 6, 2016, by and among Sprint Spectrum L.P., WirelessCo, LLC, APC PCS, LLC, PhillieCo, LLC, Sprint Communications Company L.P., Shenandoah Personal Communications, LLC and SprintCom, Inc. and CoBank, ACB, filed as Exhibit 10.3 to the Company's Current Report on Form 8-K, dated May 6, 2016.
|
|
*21
|
List of Subsidiaries.
|
|
|
|
|
*23.1
|
Consent of KPMG LLP, Independent Registered Public Accounting Firm.
|
|
|
|
|
*31.1
|
Certification of President and Chief Executive Officer of Shenandoah Telecommunications Company pursuant to Rule 13a-14(a)under the Securities Exchange Act of 1934.
|
|
|
|
|
*31.2
|
Certification of Vice President and Chief Financial Officer of Shenandoah Telecommunications Company pursuant to Rule 13a-14(a)under the Securities Exchange Act of 1934.
|
|
|
|
|
*32
|
Certifications pursuant to Rule 13a-14(b) under the Securities Exchange Act of 1934 and 18 U.S.C. § 1350.
|
|
|
|
|
(101)
|
Formatted in XBRL (Extensible Business Reporting Language)
|
70
|
|
101.INS
|
XBRL Instance Document
|
|
|
|
|
|
|
101.SCH
|
XBRL Taxonomy Extension Schema Document
|
|
|
|
|
|
|
101.CAL
|
XBRL Taxonomy Extension Calculation Linkbase Document
|
|
|
|
|
|
|
101.DEF
|
XBRL Taxonomy Extension Definition Linkbase Document
|
|
|
|
|
|
|
101.LAB
|
XBRL Taxonomy Extension Label Linkbase Document
|
|
|
|
|
|
|
101.PRE
|
XBRL Taxonomy Extension Presentation Linkbase Document
|
* Filed herewith
71
ITEM 16.
FORM 10-K SUMMMARY
None
72
SIGNATURES
Pursuant to the requirements of Sections 13 or 15(d) of the Securities Exchange Act of 1934, the Registrant has duly caused this report to be signed on its behalf by the undersigned, thereunto duly authorized.
SHENANDOAH TELECOMMUNICATIONS COMPANY
|
March 23, 2017
|
/S/ CHRISTOPHER E. FRENCH
|
|
|
Christopher E. French, President
|
|
|
(Duly Authorized Officer)
|
Pursuant to the requirements of the Securities Exchange Act of 1934, this report has been signed by the following persons on behalf of the Registrant and in the capacities and on the dates indicated.
|
/s/CHRISTOPHER E. FRENCH
|
President & Chief Executive Officer,
|
|
March 23, 2017
|
Director (Principal Executive Officer)
|
|
Christopher E. French
|
|
|
|
|
|
/s/ADELE M. SKOLITS
|
Vice President – Finance and Chief Financial Officer
|
|
March 23, 2017
|
(Principal Financial Officer and
|
|
Adele M. Skolits
|
Principal Accounting Officer)
|
|
|
|
|
/s/KEN L. BURCH
|
Director
|
|
March 23, 2017
|
|
|
Ken L. Burch
|
|
|
|
|
|
/s/TRACY FITZSIMMONS
|
Director
|
|
March 23, 2017
|
|
|
Tracy Fitzsimmons
|
|
|
|
|
|
/s/JOHN W. FLORA
|
Director
|
|
March 23, 2017
|
|
|
John W. Flora
|
|
|
|
|
|
/s/ RICHARD L. KOONTZ, JR.
|
Director
|
|
March 23, 2017
|
|
|
Richard L. Koontz, Jr.
|
|
|
|
|
|
/s/DALE S. LAM
|
Director
|
|
March 23, 2017
|
|
|
Dale S. Lam
|
|
|
/s/KENNETH L. QUAGLIO
|
Director
|
|
March 23, 2017
|
|
|
Kenneth L. Quaglio
|
|
|
|
|
|
/s/LEIGH ANN SCHULTZ
|
Director
|
|
March 23, 2017
|
|
|
Leigh Ann Schultz
|
|
|
|
|
|
/s/JAMES E. ZERKEL II
|
Director
|
|
March 23, 2017
|
|
|
James E. Zerkel II
|
|
73
SHENANDOAH TELECOMMUNICATIONS COMPANY
AND SUBSIDIARIES
Index to the Consolidated 2016 Financial Statements
|
|
Page
|
|
F-2 and F-3
|
|
|
|
|
|
Consolidated Financial Statements for the Years Ended December 31, 2016, 2015 and 2014
|
|
|
|
|
|
F-4 and F-5
|
|
|
Consolidated Statements of Operations and Comprehensive Income
|
F-6
|
|
F-7
|
|
|
F-8 and F-9
|
|
|
F-10 through F-38
|
|
F-1
Report of Independent Registered Public Accounting Firm
The Board of Directors and Shareholders
Shenandoah Telecommunications Company:
We have audited Shenandoah Telecommunications Company’s internal control over financial reporting as of December 31, 2016, based on criteria established in
Internal Control - Integrated Framework (2013)
issued by the Committee of Sponsoring Organizations of the Treadway Commission (COSO). Shenandoah Telecommunications Company’s management is responsible for maintaining effective internal control over financial reporting and for its assessment of the effectiveness of internal control over financial reporting, included in the accompanying
Management’s Report on Internal Control Over Financial Reporting
(Item 9A). Our responsibility is to express an opinion on the Company’s internal control over financial reporting based on our audit.
We conducted our audit in accordance with the standards of the Public Company Accounting Oversight Board (United States). Those standards require that we plan and perform the audit to obtain reasonable assurance about whether effective internal control over financial reporting was maintained in all material respects. Our audit included obtaining an understanding of internal control over financial reporting, assessing the risk that a material weakness exists, and testing and evaluating the design and operating effectiveness of internal control based on the assessed risk. Our audit also included performing such other procedures as we considered necessary in the circumstances. We believe that our audit provides a reasonable basis for our opinion.
A company’s internal control over financial reporting is a process designed to provide reasonable assurance regarding the reliability of financial reporting and the preparation of financial statements for external purposes in accordance with generally accepted accounting principles. A company’s internal control over financial reporting includes those policies and procedures that (1) pertain to the maintenance of records that, in reasonable detail, accurately and fairly reflect the transactions and dispositions of the assets of the company; (2) provide reasonable assurance that transactions are recorded as necessary to permit preparation of financial statements in accordance with generally accepted accounting principles, and that receipts and expenditures of the company are being made only in accordance with authorizations of management and directors of the company; and (3) provide reasonable assurance regarding prevention or timely detection of unauthorized acquisition, use, or disposition of the company’s assets that could have a material effect on the financial statements.
Because of its inherent limitations, internal control over financial reporting may not prevent or detect misstatements. Also, projections of any evaluation of effectiveness to future periods are subject to the risk that controls may become inadequate because of changes in conditions, or that the degree of compliance with the policies or procedures may deteriorate.
A material weakness is a deficiency, or a combination of deficiencies, in internal control over financial reporting, such that there is a reasonable possibility that a material misstatement of the company’s annual or interim financial statements will not be prevented or detected on a timely basis. The following material weaknesses have been identified and included in
Management’s Report on Internal Control Over Financial Reporting
:
|
•
|
Insufficient number of trained resources with assigned responsibility and accountability for the design, operation and documentation of internal controls over (i) complex, significant non-routine transactions, including the business combination of NTELOS Holdings Corp. (nTelos) and the Sprint asset exchange transaction; (ii) the preparation of the consolidated statements of cash flows; and (iii) their interaction with third party service providers;
|
|
•
|
An ineffective risk assessment process to identify and assess necessary changes in the application of generally accepted accounting principles, financial reporting processes and the design and effective operation of internal controls that were responsive to changes in business operations, specifically changes in the business resulting from the acquisition of nTelos and the Sprint asset exchange transaction;
|
|
•
|
An ineffective information and communication process to identify and assess the source of reliable information necessary for financial accounting and reporting related to complex, significant non-routine transactions and to accurately communicate the information on a timely basis to third party service providers;
|
|
•
|
Ineffective monitoring activities to assess the operation of internal control related to (i) complex, significant non-routine transactions; (ii) accounting for income taxes; and (iii) accuracy of the preparation of the consolidated statements of cash flows;
|
|
•
|
Ineffective design and documentation of process-level controls over complex, significant non-routine transactions including the measurement of the fair value of FCC licenses, property and equipment, customer-based intangible assets, leases, and the affiliate contract expansion intangible asset acquired from nTelos and as result of the Sprint asset exchange transaction;
|
|
•
|
Ineffective design and documentation of process-level controls over the accounting for income taxes; and
|
|
•
|
Ineffective operation and documentation of process-level controls over the accuracy of the preparation of the consolidated statements of cash flows.
|
F-2
We also have audited, in accordance with the standards of the Public Company Accounting Oversight Board (United States), the consolidated balance sheets of Shenandoah Telecommunications Company and subsidiaries as of December 31, 2016 and 2015, and the related consolidated statements of operations and comprehensive income, shareholders’ equity, and cash flows for each of the years in the three‑year period ended December 31, 2016. These material weaknesses were considered in determining the nature, timing, and extent of audit tests applied in our audit of the 2016 consolidated financial statements, and this report does not affect our report dated March 23, 2017, which expressed an unqualified opinion on those consolidated financial statements.
In our opinion, because of the effect of the aforementioned material weaknesses on the achievement of the objectives of the control criteria, Shenandoah Telecommunications Company has not maintained effective internal control over financial reporting as of December 31, 2016, based on criteria established in
Internal Control - Integrated Framework (2013)
issued by the Committee of Sponsoring Organizations of the Treadway Commission (COSO).
Shenandoah Telecommunications Company acquired NTELOS Holdings Corp. (nTelos) on May 6, 2016, and management excluded from its assessment of the effectiveness of Shenandoah Telecommunications Company’s internal control over financial reporting as of December 31, 2016, nTelos’ internal control over financial reporting associated with $42.9 million of total assets and $67.7 million of total operating revenues reflected in the consolidated financial statements of Shenandoah Telecommunications Company and subsidiaries as of and for the year ended December 31, 2016. Our audit of internal control over financial reporting of Shenandoah Telecommunications Company also excluded an evaluation of the internal control over financial reporting of nTelos.
/s/ KPMG LLP
Richmond, Virginia
March 23, 2017
F-3
Report of Independent Registered Public Accounting Firm
The Board of Directors and Shareholders
Shenandoah Telecommunications Company:
We have audited the accompanying consolidated balance sheets of Shenandoah Telecommunications Company and subsidiaries (the Company) as of December 31, 2016 and 2015, and the related consolidated statements of operations and comprehensive income, shareholders’ equity, and cash flows for each of the years in the three‑year period ended December 31, 2016. These consolidated financial statements are the responsibility of the Company’s management. Our responsibility is to express an opinion on these consolidated financial statements based on our audits.
We conducted our audits in accordance with the standards of the Public Company Accounting Oversight Board (United States). Those standards require that we plan and perform the audit to obtain reasonable assurance about whether the financial statements are free of material misstatement. An audit includes examining, on a test basis, evidence supporting the amounts and disclosures in the financial statements. An audit also includes assessing the accounting principles used and significant estimates made by management, as well as evaluating the overall financial statement presentation. We believe that our audits provide a reasonable basis for our opinion.
In our opinion, the consolidated financial statements referred to above present fairly, in all material respects, the financial position of Shenandoah Telecommunications Company and subsidiaries as of December 31, 2016 and 2015, and the results of their operations and their cash flows for each of the years in the three‑year period ended December 31, 2016, in conformity with U.S. generally accepted accounting principles.
As discussed in Note 16 to the consolidated financial statements, on May 6, 2016, the Company completed the acquisition of NTELOS Holdings Corp. and applied the acquisition method of accounting as of the acquisition date and ASU 2015-16,
Simplifying the Accounting for Measurement-Period Adjustments
, during the measurement period.
We also have audited, in accordance with the standards of the Public Company Accounting Oversight Board (United States), Shenandoah Telecommunications Company’s internal control over financial reporting as of December 31, 2016, based on criteria established in
Internal Control - Integrated Framework (2013)
issued by the Committee of Sponsoring Organizations of the Treadway Commission, and our report dated March 23, 2017 expressed an adverse opinion on the effectiveness of the Company’s internal control over financial reporting.
/s/ KPMG LLP
Richmond, Virginia
March 23, 2017
F-4
SHENANDOAH TELECOMMUNICATIONS COMPANY AND SUBSIDIARIES
December 31, 2016
and
2015
in thousands
|
ASSETS
|
2016
|
|
2015
|
|
||
|
Current Assets
|
|
|
||||
|
Cash and cash equivalents
|
$
|
36,193
|
|
$
|
76,812
|
|
|
Accounts receivable, net
|
69,789
|
|
29,778
|
|
||
|
Income taxes receivable
|
—
|
|
7,694
|
|
||
|
Inventory, net
|
39,043
|
|
4,183
|
|
||
|
Prepaid expenses and other
|
16,440
|
|
8,573
|
|
||
|
Deferred income taxes
|
—
|
|
907
|
|
||
|
Total current assets
|
161,465
|
|
127,947
|
|
||
|
Investments, including $2,907 and $2,654 carried at fair value
|
10,276
|
|
10,679
|
|
||
|
Property, plant and equipment, net
|
698,122
|
|
410,018
|
|
||
|
Other Assets
|
|
|
|
|
||
|
Intangible assets, net
|
454,532
|
|
66,993
|
|
||
|
Goodwill
|
145,256
|
|
10
|
|
||
|
Deferred charges and other assets, net
|
14,756
|
|
11,504
|
|
||
|
Total assets
|
$
|
1,484,407
|
|
$
|
627,151
|
|
(Continued)
F-5
SHENANDOAH TELECOMMUNICATIONS COMPANY AND SUBSIDIARIES
CONSOLIDATED BALANCE SHEETS
December 31, 2016
and
2015
in thousands
|
LIABILITIES AND SHAREHOLDERS’ EQUITY
|
2016
|
|
2015
|
|
||
|
Current Liabilities
|
|
|
||||
|
Current maturities of long-term debt, net of unamortized loan fees
|
$
|
32,041
|
|
$
|
22,492
|
|
|
Accounts payable
|
72,810
|
|
13,009
|
|
||
|
Advanced billings and customer deposits
|
20,427
|
|
11,674
|
|
||
|
Accrued compensation
|
9,465
|
|
5,915
|
|
||
|
Income taxes payable
|
435
|
|
—
|
|
||
|
Accrued liabilities and other
|
29,085
|
|
7,639
|
|
||
|
Total current liabilities
|
164,263
|
|
60,729
|
|
||
|
Long-term debt, less current maturities, net of unamortized loan fees
|
797,224
|
|
177,169
|
|
||
|
Other Long-Term Liabilities
|
|
|
|
|
||
|
Deferred income taxes
|
151,837
|
|
74,868
|
|
||
|
Deferred lease payable
|
18,042
|
|
8,142
|
|
||
|
Asset retirement obligations
|
15,666
|
|
7,266
|
|
||
|
Retirement plan obligations
|
17,738
|
|
2,654
|
|
||
|
Other liabilities
|
23,743
|
|
6,385
|
|
||
|
Total other liabilities
|
227,026
|
|
99,315
|
|
||
|
Commitments and Contingencies
|
|
|
|
|
||
|
Shareholders’ Equity
|
|
|
|
|
||
|
Common stock, no par value, authorized 96,000 shares; issued and outstanding 48,935 shares in 2016 and 48,475 shares in 2015
|
45,482
|
|
32,776
|
|
||
|
Retained earnings
|
243,624
|
|
256,747
|
|
||
|
Accumulated other comprehensive income, net of taxes
|
6,788
|
|
415
|
|
||
|
Total shareholders’ equity
|
295,894
|
|
289,938
|
|
||
|
Total liabilities and shareholders’ equity
|
$
|
1,484,407
|
|
$
|
627,151
|
|
See accompanying notes to consolidated financial statements.
F-6
SHENANDOAH TELECOMMUNICATIONS COMPANY AND SUBSIDIARIES
Years Ended
December 31, 2016
,
2015
and
2014
in thousands, except per share amounts
|
|
2016
|
|
2015
|
|
2014
|
|
|||
|
Operating revenues
|
$
|
535,288
|
|
$
|
342,485
|
|
$
|
326,946
|
|
|
Operating expenses
|
|
|
|
|
|
|
|||
|
Cost of goods and services, exclusive of depreciation and amortization shown separately below
|
193,520
|
|
121,330
|
|
129,743
|
|
|||
|
Selling, general and administrative, exclusive of depreciation and amortization shown below
|
133,325
|
|
72,821
|
|
69,370
|
|
|||
|
Integration and acquisition expenses
|
42,232
|
|
3,546
|
|
—
|
|
|||
|
Depreciation and amortization
|
143,685
|
|
70,702
|
|
65,890
|
|
|||
|
Total operating expenses
|
512,762
|
|
268,399
|
|
265,003
|
|
|||
|
Operating income
|
22,526
|
|
74,086
|
|
61,943
|
|
|||
|
Other income (expense)
|
|
|
|
|
|
|
|||
|
Interest expense
|
(25,102
|
)
|
(7,355
|
)
|
(8,148
|
)
|
|||
|
Gain on investments, net
|
271
|
|
105
|
|
208
|
|
|||
|
Non-operating income, net
|
4,250
|
|
1,754
|
|
2,031
|
|
|||
|
Income before income taxes
|
1,945
|
|
68,590
|
|
56,034
|
|
|||
|
Income tax expense
|
2,840
|
|
27,726
|
|
22,151
|
|
|||
|
Net income (loss)
|
$
|
(895
|
)
|
$
|
40,864
|
|
$
|
33,883
|
|
|
Other comprehensive income:
|
|
|
|
|
|
|
|||
|
Unrealized gain (loss) on interest rate hedge, net of tax
|
6,373
|
|
(707
|
)
|
(1,472
|
)
|
|||
|
Comprehensive income
|
$
|
5,478
|
|
$
|
40,157
|
|
$
|
32,411
|
|
|
Earnings (loss) per share:
|
|
|
|
|
|
|
|||
|
Basic
|
$
|
(0.02
|
)
|
$
|
0.84
|
|
$
|
0.70
|
|
|
Diluted
|
$
|
(0.02
|
)
|
$
|
0.83
|
|
$
|
0.70
|
|
|
Weighted average shares outstanding, basic
|
48,807
|
|
48,388
|
|
48,198
|
|
|||
|
Weighted average shares outstanding, diluted
|
48,807
|
|
49,024
|
|
48,720
|
|
|||
See accompanying notes to consolidated financial statements.
F-7
SHENANDOAH TELECOMMUNICATIONS COMPANY AND SUBSIDIARIES
CONSOLIDATED STATEMENTS OF SHAREHOLDERS' EQUITY
Years Ended
December 31, 2016
,
2015
and
2014
in thousands, except per share amounts
|
|
Shares
|
Common
Stock
|
Retained
Earnings
|
Accumulated
Other
Comprehensive
Income (Loss)
|
Total
|
|||||||||
|
Balance, December 31, 2013
|
48,080
|
|
$
|
26,759
|
|
$
|
204,962
|
|
$
|
2,594
|
|
$
|
234,315
|
|
|
Net income
|
—
|
|
—
|
|
33,883
|
|
—
|
|
33,883
|
|
||||
|
Other comprehensive loss, net of tax
|
—
|
|
—
|
|
—
|
|
(1,472
|
)
|
(1,472
|
)
|
||||
|
Dividends declared ($0.235 per share)
|
—
|
|
—
|
|
(11,333
|
)
|
—
|
|
(11,333
|
)
|
||||
|
Dividends reinvested in common stock
|
39
|
|
572
|
|
—
|
|
—
|
|
572
|
|
||||
|
Stock based compensation
|
—
|
|
2,624
|
|
—
|
|
—
|
|
2,624
|
|
||||
|
Common stock issued through exercise of incentive stock options
|
102
|
|
1,141
|
|
—
|
|
—
|
|
1,141
|
|
||||
|
Common stock issued for share awards
|
162
|
|
—
|
|
—
|
|
—
|
|
—
|
|
||||
|
Common stock issued
|
2
|
|
6
|
|
—
|
|
—
|
|
6
|
|
||||
|
Common stock repurchased
|
(120
|
)
|
(1,785
|
)
|
—
|
|
—
|
|
(1,785
|
)
|
||||
|
Net excess tax benefit from stock options exercised
|
—
|
|
395
|
|
—
|
|
—
|
|
395
|
|
||||
|
Balance, December 31, 2014
|
48,265
|
|
29,712
|
|
227,512
|
|
1,122
|
|
258,346
|
|
||||
|
Net income
|
—
|
|
—
|
|
40,864
|
|
—
|
|
40,864
|
|
||||
|
Other comprehensive loss, net of tax
|
—
|
|
—
|
|
—
|
|
(707
|
)
|
(707
|
)
|
||||
|
Dividends declared ($0.24 per share)
|
—
|
|
—
|
|
(11,629
|
)
|
—
|
|
(11,629
|
)
|
||||
|
Dividends reinvested in common stock
|
22
|
|
544
|
|
—
|
|
—
|
|
544
|
|
||||
|
Stock based compensation
|
—
|
|
2,719
|
|
—
|
|
—
|
|
2,719
|
|
||||
|
Common stock issued through exercise of incentive stock options
|
87
|
|
996
|
|
—
|
|
—
|
|
996
|
|
||||
|
Common stock issued for share awards
|
212
|
|
—
|
|
—
|
|
—
|
|
—
|
|
||||
|
Common stock issued
|
1
|
|
11
|
|
—
|
|
—
|
|
11
|
|
||||
|
Common stock repurchased
|
(111
|
)
|
(1,885
|
)
|
—
|
|
—
|
|
(1,885
|
)
|
||||
|
Net excess tax benefit from stock options exercised
|
—
|
|
679
|
|
—
|
|
—
|
|
679
|
|
||||
|
Balance, December 31, 2015
|
48,475
|
|
32,776
|
|
256,747
|
|
415
|
|
289,938
|
|
||||
|
Net loss
|
—
|
|
—
|
|
(895
|
)
|
—
|
|
(895
|
)
|
||||
|
Other comprehensive income, net of tax
|
—
|
|
—
|
|
—
|
|
6,373
|
|
6,373
|
|
||||
|
Dividends declared ($0.25 per share)
|
—
|
|
—
|
|
(12,228
|
)
|
—
|
|
(12,228
|
)
|
||||
|
Dividends reinvested in common stock
|
19
|
|
524
|
|
—
|
|
—
|
|
524
|
|
||||
|
Stock based compensation
|
—
|
|
3,506
|
|
—
|
|
—
|
|
3,506
|
|
||||
|
Stock options exercised
|
371
|
|
3,359
|
|
—
|
|
—
|
|
3,359
|
|
||||
|
Common stock issued for share awards
|
190
|
|
—
|
|
—
|
|
—
|
|
—
|
|
||||
|
Common stock issued
|
2
|
|
14
|
|
—
|
|
—
|
|
14
|
|
||||
|
Common stock issued to acquire non-controlling interests of nTelos
|
76
|
|
10,400
|
|
10,400
|
|
||||||||
|
Common stock repurchased
|
(198
|
)
|
(5,097
|
)
|
—
|
|
—
|
|
(5,097
|
)
|
||||
|
Balance, December 31, 2016
|
48,935
|
|
$
|
45,482
|
|
$
|
243,624
|
|
$
|
6,788
|
|
$
|
295,894
|
|
See accompanying notes to consolidated financial statements.
F-8
SHENANDOAH TELECOMMUNICATIONS COMPANY AND SUBSIDIARIES
Years Ended December 31, 2016, 2015, and 2014
in thousands
|
|
2016
|
|
2015
|
|
2014
|
|
|||
|
Cash Flows from Operating Activities
|
|
|
|
||||||
|
Net income (loss)
|
$
|
(895
|
)
|
$
|
40,864
|
|
$
|
33,883
|
|
|
Adjustments to reconcile net income(loss) to net cash provided by operating activities:
|
|
|
|
|
|
|
|||
|
Depreciation
|
123,995
|
|
69,287
|
|
63,324
|
|
|||
|
Amortization reflected as operating expense
|
19,690
|
|
1,415
|
|
2,566
|
|
|||
|
Amortization reflected as contra revenue
|
14,030
|
|
—
|
|
—
|
|
|||
|
Amortization reflected as rent expense
|
728
|
|
—
|
|
—
|
|
|||
|
Provision for bad debt
|
2,456
|
|
1,640
|
|
1,678
|
|
|||
|
Straight line adjustment to management fee revenue
|
11,974
|
|
—
|
|
—
|
|
|||
|
Stock based compensation expense
|
3,021
|
|
2,333
|
|
2,624
|
|
|||
|
Excess tax benefits on stock option exercises
|
—
|
|
(679
|
)
|
(395
|
)
|
|||
|
Deferred income taxes
|
(52,875
|
)
|
(451
|
)
|
2,975
|
|
|||
|
Net loss (gain) on disposal of equipment
|
(23
|
)
|
235
|
|
1,975
|
|
|||
|
Unrealized (gains) loss on investments
|
(143
|
)
|
141
|
|
51
|
|
|||
|
Net gains from patronage and equity investments
|
(795
|
)
|
(805
|
)
|
(852
|
)
|
|||
|
Amortization of long term debt issuance costs
|
3,914
|
|
567
|
|
605
|
|
|||
|
Net benefit from retirement plans
|
(4,396
|
)
|
—
|
|
—
|
|
|||
|
Other
|
29
|
|
113
|
|
1,515
|
|
|||
|
Changes in assets and liabilities:
|
|
|
|
|
|
|
|||
|
(Increase) decrease in:
|
|
|
|
|
|
|
|||
|
Accounts receivable
|
14,581
|
|
(1,047
|
)
|
(6,225
|
)
|
|||
|
Inventory, net
|
(30,288
|
)
|
492
|
|
1,921
|
|
|||
|
Income taxes receivable
|
7,694
|
|
7,058
|
|
1,824
|
|
|||
|
Other assets
|
5,273
|
|
(6,368
|
)
|
1,055
|
|
|||
|
Increase (decrease) in:
|
|
|
|
|
|
|
|||
|
Accounts payable
|
42,496
|
|
2,753
|
|
5,040
|
|
|||
|
Income taxes payable
|
435
|
|
—
|
|
—
|
|
|||
|
Deferred lease payable
|
4,273
|
|
962
|
|
1,024
|
|
|||
|
Other deferrals and accruals
|
(3,648
|
)
|
811
|
|
405
|
|
|||
|
Net cash provided by operating activities
|
$
|
161,526
|
|
$
|
119,321
|
|
$
|
114,993
|
|
|
(Continued)
|
|||||||||
F-9
SHENANDOAH TELECOMMUNICATIONS COMPANY AND SUBSIDIARIES
CONSOLIDATED STATEMENTS OF CASH FLOWS
Years Ended December 31, 2016, 2015, and 2014
in thousands
|
|
2016
|
|
2015
|
|
2014
|
|
|||
|
Cash Flows From Investing Activities
|
|
|
|
||||||
|
Acquisition of property, plant and equipment
|
$
|
(173,231
|
)
|
$
|
(69,679
|
)
|
$
|
(68,232
|
)
|
|
Proceeds from sale of assets
|
5,510
|
|
363
|
|
551
|
|
|||
|
Cash disbursed for acquisition, net of cash acquired
|
(657,354
|
)
|
—
|
|
—
|
|
|||
|
Release of restricted cash
|
2,167
|
|
—
|
|
—
|
|
|||
|
Cash distributions from investments
|
2,895
|
|
54
|
|
43
|
|
|||
|
Net cash used in investing activities
|
$
|
(820,013
|
)
|
$
|
(69,262
|
)
|
$
|
(67,638
|
)
|
|
Cash Flows From Financing Activities
|
|
|
|
|
|
|
|||
|
Principal payments on long-term debt
|
$
|
(213,793
|
)
|
$
|
(23,000
|
)
|
$
|
(5,750
|
)
|
|
Amounts borrowed under debt agreements
|
860,000
|
|
—
|
|
—
|
|
|||
|
Cash paid for debt issuance costs
|
(14,910
|
)
|
(7,880
|
)
|
—
|
|
|||
|
Dividends paid, net of dividends reinvested
|
(11,705
|
)
|
(11,085
|
)
|
(10,761
|
)
|
|||
|
Excess tax benefits on stock option exercises
|
—
|
|
679
|
|
395
|
|
|||
|
Repurchases of common stock
|
(5,097
|
)
|
(1,885
|
)
|
(1,785
|
)
|
|||
|
Proceeds from issuances of common stock
|
3,373
|
|
1,007
|
|
1,147
|
|
|||
|
Net cash provided by (used in) financing activities
|
$
|
617,868
|
|
$
|
(42,164
|
)
|
$
|
(16,754
|
)
|
|
Net increase (decrease) in cash and cash equivalents
|
$
|
(40,619
|
)
|
$
|
7,895
|
|
$
|
30,601
|
|
|
Cash and cash equivalents:
|
|
|
|
|
|
|
|||
|
Beginning
|
76,812
|
|
68,917
|
|
38,316
|
|
|||
|
Ending
|
$
|
36,193
|
|
$
|
76,812
|
|
$
|
68,917
|
|
|
Supplemental Disclosures of Cash Flow Information
|
|
|
|
|
|
|
|||
|
Cash payments for:
|
|
|
|
|
|
|
|||
|
Interest, net of capitalized interest of $1,374 in 2016, $436 in 2015, and $373 in 2014
|
$
|
21,187
|
|
$
|
6,784
|
|
$
|
7,548
|
|
|
Income taxes paid, net
|
$
|
44,983
|
|
$
|
21,119
|
|
$
|
17,233
|
|
Non-cash investing and financing activities:
At
December 31, 2016
,
2015
and
2014
, accounts payable included approximately
$14,386
,
$5,597
and
$6,492
, respectively, associated with capital expenditures. Cash flows for accounts payable and acquisition of property, plant and equipment exclude this activity.
In conjunction with the acquisition of nTelos, the Company issued common stock to acquire non-controlling interests held by third parties in a subsidiary of nTelos. The transaction was valued at
$10.4 million
.
The Company reclassified
$5.2 million
of unamortized loan fees and costs included in deferred charges and other assets to long term debt in connection with the new Term loan A-1 and A-2 borrowing related to the acquisition of nTelos.
During the year ended December 31, 2016, the Company recorded an increase in the fair value of interest rate swaps of
$10,525
, an increase in deferred tax liabilities of
$4,162
, and an increase to accumulated other comprehensive income of
$6,373
.
See accompanying notes to consolidated financial statements.
F-10
SHENANDOAH TELECOMMUNICATIONS COMPANY AND SUBSIDIARIES
NOTES TO CONSOLIDATED FINANCIAL STATEMENTS
Description of business:
Shenandoah Telecommunications Company and its subsidiaries (collectively, the “Company”) provide wireless personal communications service (“PCS”) under the Sprint brand, and telephone service, cable television, unregulated communications equipment sales and services, and internet access under the Shentel brand. In addition, the Company leases towers and operates and maintains an interstate fiber optic network. Pursuant to a management agreement with Sprint and its related parties (collectively, “Sprint”), the Company has been the exclusive Sprint PCS Affiliate providing wireless mobility communications network products and services on the
800
MHz,
1900
MHz and
2.5
GHz spectrum ranges in the geographic area extending from Altoona, Harrisburg and York, Pennsylvania, south through Western Maryland and the panhandle of West Virginia to Harrisonburg, Virginia.
With the recent acquisition of nTelos (see Note 16), the Company's wireless service has expanded to include south-central and western Virginia, West Virginia, and small portions of Kentucky and Ohio. This segment also owns cell site towers built on leased land, and leases space on these towers to both affiliates and non-affiliated service providers. The Company is licensed to use the Sprint brand name in this territory, and operates its network under the Sprint radio spectrum license. The Company's other operations are located in the
four
-state region surrounding the Northern Shenandoah Valley of Virginia.
A summary of the Company's significant accounting policies follows:
Principles of consolidation:
The consolidated financial statements include the accounts of all wholly owned subsidiaries. All significant intercompany balances and transactions have been eliminated in consolidation. The Company has no involvement with variable interest entities. The Company accounts for investments over which it has significant influence but not a controlling financial interest using the equity method of accounting.
Use of estimates:
Management of the Company has made a number of estimates and assumptions related to the reporting of assets and liabilities, the disclosure of contingent assets and liabilities at the date of the consolidated financial statements and the reported amounts of revenues and expenses during the reporting periods. Management reviews its estimates, including those related to recoverability and useful lives of assets as well as liabilities for income taxes and pension benefits. Changes in facts and circumstances may result in revised estimates, and actual results could differ from those reported estimates.
Cash and cash equivalents:
The Company considers all temporary cash investments purchased with a maturity of three months or less to be cash equivalents. Cash equivalents at
December 31, 2015
included
$40.1 million
invested in institutional cash management funds. The Company places its temporary cash investments with high credit quality financial institutions. Generally, such investments are in excess of FDIC or SIPC insurance limits.
Accounts receivable:
Accounts receivable are recorded at the invoiced amount and generally do not bear interest. The allowance for doubtful accounts is the Company’s best estimate of the amount of probable credit losses in the Company’s existing accounts receivable. The Company determines the allowance based on historical write-off experience and industry and local economic data. The Company reviews its allowance for doubtful accounts monthly. Past due balances meeting specific criteria are reviewed individually for collectability. All other balances are reviewed on a pooled basis. Account balances are charged off against the allowance after all means of collection have been exhausted and the potential for recovery is considered remote. Accounts receivable are concentrated among customers within the Company's geographic service area and large telecommunications companies. Changes in the allowance for doubtful accounts for trade accounts receivable for the years ended
December 31, 2016
,
2015
and
2014
are summarized below (in thousands):
|
|
2016
|
|
2015
|
|
2014
|
|
|||
|
Balance at beginning of year
|
$
|
418
|
|
$
|
762
|
|
$
|
924
|
|
|
Bad debt expense
|
2,456
|
|
1,640
|
|
1,678
|
|
|||
|
Losses charged to allowance
|
(2,743
|
)
|
(2,586
|
)
|
(2,218
|
)
|
|||
|
Recoveries added to allowance
|
628
|
|
602
|
|
378
|
|
|||
|
Balance at end of year
|
$
|
759
|
|
$
|
418
|
|
$
|
762
|
|
F-11
Inventories:
The Company's inventories consist primarily of items held for resale such as devices and accessories. The Company values its inventory at the lower of cost or market. Inventory cost is computed on an average cost basis. Market value is determined by reviewing current replacement cost, marketability and obsolescence.
Investments:
The classifications of debt and equity securities are determined by management at the date individual investments are acquired. The appropriateness of such classification is periodically reassessed. The Company monitors the fair value of all investments, and based on factors such as market conditions, financial information and industry conditions, the Company will reflect impairments in values as is warranted. The classification of those securities and the related accounting policies are as follows:
Investments Carried at Fair Value:
Investments in equity and bond mutual funds and investment trusts held within the Company’s rabbi trust, which is related to the Company’s unfunded Supplemental Executive Retirement Plan, are reported at fair value using net asset value per share. The Company has elected to recognize unrealized gains and losses on investments carried at fair value in earnings, pursuant to the fair value option in Financial Accounting Standards Board (FASB) Accounting Standards Codification (ASC) 820,
Fair Value Measurement
.
Investments Carried at Cost:
Investments in common stock in which the Company does not have a significant ownership (less than
20%
) and for which there is no ready market, are carried at cost. This category includes required investments to obtain services, primarily with CoBank. Information regarding investments carried at cost is reviewed for evidence of impairment in value. Impairments are charged to earnings and a new cost basis for the investment is established.
Equity Method Investments:
Investments in partnerships and in unconsolidated corporations where the Company's ownership is
20%
or more, but less than
50%
, or where the Company otherwise has the ability to exercise significant influence, are reported under the equity method. Under this method, the Company's equity in earnings or losses of investees is reflected in earnings. Distributions received reduce the carrying value of these investments. The Company recognizes a loss when there is a decline in value of the investment which is other than a temporary decline.
Property, plant and equipment:
Property, plant and equipment is stated at cost less accumulated depreciation and amortization. The Company capitalizes all costs associated with the purchase, deployment and installation of property, plant and equipment, including interest costs on major capital projects during the period of their construction. Expenditures, including those on leased assets, which extend the useful life or increase its utility, are capitalized. Maintenance expense is recognized when repairs are performed. Depreciation is calculated on the straight-line method over the estimated useful lives of the assets. Depreciation and amortization is not included in the income statement line items “Cost of goods and services” or “Selling, general and administrative.” Depreciable lives are assigned to assets based on their estimated useful lives. Leasehold improvements are depreciated over the lesser of their useful lives or respective lease terms. The Company takes technology changes into consideration as it assigns the estimated useful lives, and monitors the remaining useful lives of asset groups to reasonably match the remaining economic life with the useful life and makes adjustments when necessary.
Valuation of long-lived assets:
Long‑lived assets, such as property, plant, and equipment, and purchased intangibles subject to amortization, are reviewed for impairment whenever events or changes in circumstances indicate that the carrying amount of an asset may not be recoverable. Recoverability of assets to be held and used is measured by a comparison of the carrying amount of an asset to estimated undiscounted future cash flows expected to be generated by the asset. If the carrying amount of an asset exceeds its estimated future cash flows, an impairment charge is recognized by the amount by which the carrying amount of the asset exceeds the fair value of the asset.
Fair value
: Fair value is defined as the amount that would be received to sell an asset or paid to transfer a liability in an orderly transaction between market participants at the measurement date. Financial instruments presented on the consolidated balance sheets for which the carrying value approximates fair value include: cash and cash equivalents, receivables, investments carried at fair value, payables, accrued liabilities, interest rate swaps and variable-rate long-term debt.
The Company measures its interest rate swaps at fair value and recognizes such derivative instruments as either assets or liabilities on the Company’s consolidated balance sheet. Changes in the fair value of swaps are recognized in other comprehensive income, as the Company has designated these swaps as cash flow hedges for accounting purposes. The Company entered into these swaps to manage a portion of its exposure to interest rate movements by converting a portion of its variable rate long-term debt to fixed rate debt.
Asset retirement obligations:
The Company records the fair value of an asset retirement obligation as a liability in the period in which it incurs a legal obligation associated with the retirement of tangible long-lived assets that results from acquisition,
F-12
construction, development and/or normal use of the assets. The Company also records a corresponding asset, which is depreciated over the life of the tangible long-lived asset. Subsequent to the initial measurement of the asset retirement obligation, the obligation is adjusted at the end of each period to reflect the passage of time and changes in the estimated future cash flows underlying the obligation. The Company records the retirement obligation on towers owned and cell site improvements where there is a legal obligation to remove the tower or cell site improvements and restore the site to its original condition. The terms associated with its operating leases, and applicable zoning ordinances of certain jurisdictions, define the Company’s obligations which are estimated and vary based on the size of the towers. The Company’s cost to remove the tower or cell site improvements is amortized over the life of the tower or cell site assets.
During 2015, new information was received regarding the cost to remove tower site improvements. The Company recorded an adjustment to the wireless segment asset retirement obligation liabilities to reflect changes in the estimated future cash flows underlying the obligation to remove tower site improvements.
Changes in the liability for asset removal obligations for the years ended
December 31, 2016
,
2015
and
2014
are summarized below (in thousands):
|
|
2016
|
|
2015
|
|
2014
|
|
|||
|
Balance at beginning of year
|
$
|
7,266
|
|
$
|
6,928
|
|
$
|
6,485
|
|
|
Liabilities acquired in acquisition
|
14,056
|
|
—
|
|
—
|
|
|||
|
Additional liabilities accrued
|
157
|
|
490
|
|
403
|
|
|||
|
Changes to prior estimates
|
—
|
|
(467
|
)
|
—
|
|
|||
|
Payments made
|
(609
|
)
|
(77
|
)
|
(334
|
)
|
|||
|
Accretion expense
|
637
|
|
392
|
|
374
|
|
|||
|
Balance at end of year
|
$
|
21,507
|
|
$
|
7,266
|
|
$
|
6,928
|
|
The short term portion of the asset retirement obligation of
$5.8 million
is included in accrued liabilities and other for the year ended
December 31, 2016
on the Company's consolidated balance sheets. See note 10 for additional information.
Goodwill and intangible assets:
In connection with the acquisition of a business, a portion of the purchase price may be allocated to identifiable intangible assets with indefinite lives, such as franchise rights, and goodwill, which is an asset representing the future economic benefits arising from other assets acquired in a business combination that are not individually identified and separately recognized. Goodwill is recorded in the segment that was affected by the acquisition.
Goodwill is not amortized but is tested for impairment on at least an annual basis. Impairment testing is required more often than annually if an event or circumstance indicates that impairment is more likely than not to have occurred. In conducting its annual impairment testing, the Company may first perform a qualitative assessment of whether it is more likely than not that a reporting unit’s fair value is less than its carrying amount. If not, no further goodwill impairment testing is required. If it is more likely than not that a reporting unit’s fair value is less than its carrying amount, or if the Company elects not to perform a qualitative assessment of a reporting unit, the Company then compares the fair value of the reporting unit to the related net book value. If the net book value of a reporting unit exceeds its fair value, an impairment loss is measured and recognized. The Company elected not to perform the qualitative assessment and performed a quantitative test comparing the fair value with the carrying amounts and concluded that
no
impairment existed as of October 1, 2016.
Intangible assets with indefinite lives, primarily cable franchise rights, are assessed annually, at November 1, for impairment and in interim periods if certain triggering events occur indicating that the carrying value may be impaired. The Company determined that
no
impairment of cable segment franchise rights was required for the years ended
December 31, 2016
,
2015
and
2014
. The fair value of cable franchise rights, which is determined by a “greenfield” analysis (Level 3 fair value), was determined to exceed its
$64.3 million
carrying value by approximately
$28.2 million
at
December 31, 2016
, and exceeded its
$64.1
carrying value by approximately
$11.3 million
at
December 31, 2015
.
F-13
Changes in the carrying amount of goodwill during the year ended December 31, 2016 are shown below (in thousands):
|
Goodwill as of December 31, 2015, Wireline segment
|
$
|
10
|
|
|
Goodwill recorded January 2016, Cable segment, Colane acquisition
|
104
|
|
|
|
Goodwill recorded May 2016, Wireless segment, nTelos acquisition
|
145,142
|
|
|
|
Goodwill as of December 31, 2016
|
$
|
145,256
|
|
Intangible assets consist of the following at
December 31, 2016
and
2015
(in thousands):
|
|
2016
|
2015
|
|||||||||||||||||||||
|
|
Gross
Carrying
Amount
|
Accumulated
Amortization
|
Net
|
Gross
Carrying
Amount
|
Accumulated
Amortization
|
Net
|
|||||||||||||||||
|
Non-amortizing intangibles:
|
|
|
|
||||||||||||||||||||
|
Cable franchise rights
|
$
|
64,334
|
|
$
|
—
|
|
$
|
64,334
|
|
$
|
64,059
|
|
$
|
—
|
|
$
|
64,059
|
|
|||||
|
Railroad crossing rights
|
97
|
|
—
|
|
97
|
|
39
|
|
—
|
|
39
|
|
|||||||||||
|
64,431
|
|
—
|
|
64,431
|
|
64,098
|
|
—
|
|
64,098
|
|
||||||||||||
|
Finite-lived intangibles:
|
|||||||||||||||||||||||
|
Affiliate contract expansion
|
284,102
|
|
(14,030
|
)
|
270,072
|
|
—
|
|
—
|
|
—
|
|
|||||||||||
|
Acquired subscribers – wireless
|
120,855
|
|
(18,738
|
)
|
102,117
|
|
—
|
|
—
|
|
—
|
|
|||||||||||
|
Favorable leases - wireless
|
16,950
|
|
(1,130
|
)
|
15,820
|
|
—
|
|
—
|
|
—
|
|
|||||||||||
|
Acquired subscribers – cable
|
25,265
|
|
(24,631
|
)
|
634
|
|
25,326
|
|
(23,805
|
)
|
1,521
|
|
|||||||||||
|
Other intangibles
|
2,212
|
|
(754
|
)
|
1,458
|
|
1,938
|
|
(564
|
)
|
1,374
|
|
|||||||||||
|
Total finite-lived intangibles
|
449,384
|
|
(59,283
|
)
|
390,101
|
|
27,264
|
|
(24,369
|
)
|
2,895
|
|
|||||||||||
|
Total intangible assets
|
$
|
513,815
|
|
$
|
(59,283
|
)
|
$
|
454,532
|
|
$
|
91,362
|
|
$
|
(24,369
|
)
|
$
|
66,993
|
|
|||||
For the years ended
December 31, 2016
,
2015
and
2014
, amortization expense, including amortization recorded as a contra revenue and as rent expense, related to intangible assets was approximately
$34.9 million
,
$1.4 million
and
$2.6 million
, respectively. Unfavorable leases in the wireless segment are included in deferred lease payables and amortized to rent expense.
Aggregate amortization expense, including amortization recorded as a contra revenue, for intangible assets for the periods shown is expected to be as follows:
|
Year Ending
December 31, |
Total
|
Amount Reflected as Contra Revenue
|
Amount Reflected as Rent Expense
|
Amount Reflected as Amortization Expense
|
||||||||
|
|
(in thousands)
|
|||||||||||
|
2017
|
$
|
46,807
|
|
$
|
21,045
|
|
$
|
1,695
|
|
$
|
24,067
|
|
|
2018
|
40,797
|
|
21,044
|
|
1,695
|
|
18,058
|
|
||||
|
2019
|
36,561
|
|
21,045
|
|
1,695
|
|
13,821
|
|
||||
|
2020
|
33,685
|
|
21,044
|
|
1,695
|
|
10,946
|
|
||||
|
2021
|
30,923
|
|
21,045
|
|
1,695
|
|
8,183
|
|
||||
|
thereafter
|
201,328
|
|
164,849
|
|
7,345
|
|
29,134
|
|
||||
|
Total
|
$
|
390,101
|
|
$
|
270,072
|
|
$
|
15,820
|
|
$
|
104,209
|
|
Deferred charges and other assets:
Deferred charges and other assets consist of derivatives used for hedging purposes and debt issuance costs related to available lines of credit and other unused funds, which are amortized on a straight-line method over the remaining draw period.
F-14
Retirement plans:
The Company maintains a Supplemental Executive Retirement Plan (“SERP”) for selected employees. This is an unfunded defined contribution plan. The Company created and funded a rabbi trust to hold assets equal to the liabilities under this plan. Participant balances and earnings thereon continue to be maintained for this plan, but no new participants or contributions have been added to the plan since 2010.
Through the Company’s acquisition of nTelos, the Company assumed nTelos’ non-contributory defined benefit pension plan (“Pension Plan”) covering all employees who met eligibility requirements and were employed by nTelos prior to October 1, 2003. The Pension Plan was closed to nTelos employees hired on or after October 1, 2003. Pension benefits vest after five years of plan service and are based on years of service and an average of the five highest consecutive years of compensation subject to certain reductions if the employee retires before reaching age 65 and elects to receive the benefit prior to age 65. Effective December 31, 2012, nTelos froze future benefit accruals. The Company uses updated mortality tables published by the Society of Actuaries that predict increasing life expectancies in the United States.
IRC Sections 412 and 430 and Sections 302 and 303 of the Employee Retirement Income Security Act of 1974, as amended establish minimum funding requirements for defined benefit pension plans. The minimum required contribution is generally equal to the target normal cost plus the shortfall amortization installments for the current plan year and each of the six preceding plan years less any calculated credit balance. If plan assets (less calculated credits) are equal to or exceed the funding target, the minimum required contribution is the target normal cost reduced by the excess funding, but not below zero. The Company’s policy is to make contributions to stay at or above the threshold required in order to prevent benefit restrictions and related additional notice requirements and is intended to provide not only for benefits based on service to date, but also for those expected to be earned in the future. The Company also assumed one qualified nonpension postretirement benefit plan that provides certain health care benefits for nTelos retired employees that meet eligibility requirements. The health care plan is contributory, with participants’ contributions adjusted annually. This plan is not available to employees hired after April 1993. The accounting for the plan anticipates that the Company will maintain a consistent level of cost sharing for the benefits with the retirees. The Company’s share of the projected cost of benefits that will be paid after retirement is generally being accrued by charges to expense over the eligible employees’ service periods to the dates they are fully eligible for benefits.
The Company records annual amounts relating to the Pension Plan and postretirement benefit plan based on calculations that incorporate various actuarial and other assumptions, including discount rates, mortality, assumed rates of return, turnover rates and healthcare cost trend rates. The Company reviews its assumptions on an annual basis and makes modifications to the assumptions based on current rates and trends when it is appropriate to do so. We recognize gains and losses on pension and postretirement plan assets and obligations immediately in our operating results. These gains and losses are measured annually at December 31 and accordingly are recorded during the fourth quarter, unless earlier re-measurements are required.
The Company maintains a defined contribution 401(k) plan under which substantially all employees may defer a portion of their earnings on a pretax basis, up to the allowable federal maximum annual contribution amount. The Company may make matching and discretionary contributions to this plan. The Company acquired nTelos' defined contribution 401(k) plan at the time of the acquisition. The nTelos plan was merged into the Company's plan as of December 31, 2016.
None of these plans directly hold Company common stock in their investment portfolios.
Income taxes:
Income taxes are accounted for under the asset and liability method. Deferred tax assets and liabilities are recognized for the future tax consequences attributable to differences between financial statement carrying amounts of existing assets and liabilities and their respective tax bases. Deferred tax assets and liabilities are measured using enacted tax rates expected to apply to taxable income in the years in which those temporary differences are expected to be recovered or settled. The effect on deferred tax assets and liabilities of a change in tax rates is recognized in income in the period that includes the enactment date. The Company evaluates the recoverability of tax assets generated on a state-by-state basis from net operating losses apportioned to that state. Management uses a more likely than not threshold to make that determination and has concluded that at
December 31, 2016
and
2015
, a valuation allowance against certain state deferred tax assets is necessary, as discussed in Note 6. The Company recognizes the effect of income tax positions only if those positions are more likely than not of being sustained. Recognized income tax positions are measured at the largest amount that is greater than
50%
likely of being realized. Changes in recognition or measurement are reflected in the period in which the change in judgment occurs. The Company’s policy is to record interest related to unrecognized tax benefits in interest expense and penalties in selling, general, and administrative expenses
.
Revenue recognition:
The Company recognizes revenue when persuasive evidence of an arrangement exists, services have been rendered or products have been delivered, the price to the buyer is fixed and determinable and collectability is reasonably assured. Revenues are recognized by the Company based on the various types of transactions generating the revenue. For
F-15
services, revenue is recognized as the services are performed. For equipment sales, revenue is recognized when the sales transaction is complete.
Under the Sprint Management Agreement, postpaid wireless service revenues are reported net of an
8%
Management Fee and an
8.6%
Net Service Fee, retained by Sprint. Prepaid wireless service revenues are reported net of a
6%
Management Fee retained by Sprint.
Under the Company’s amended affiliate agreement, Sprint agreed to waive the management fee, which is historically presented as a contra-revenue by the Company, for a period of approximately
six
years. The impact of Sprint’s waiver of the management fee over the approximate six-year period is reflected as an increase in revenue, offset by the non-cash adjustment to recognize this impact on a straight-line basis over the contract term of approximately
14
years.
Earnings per share:
Basic net income(loss) per share was computed on the weighted average number of shares outstanding. Diluted net income per share was computed under the treasury stock method, assuming the conversion as of the beginning of the period, for all dilutive stock options. Shares and options outstanding were
911 thousand
,
1,312 thousand
, and
1,394 thousand
at December 31,
2016
,
2015
and
2014
, respectively. For 2016, due to the net loss, diluted shares are equal to weighted average shares, and diluted earnings (loss) per share is equal to basic income (loss) per share. At December 31,
2015
and
2014
,
92 thousand
and
22 thousand
shares were anti-dilutive, respectively, and have been excluded from the computation of diluted earnings per share shown below. There were no adjustments to net income in the computation of diluted earnings per share for any of the years presented.
The following tables show the computation of basic and diluted earnings per share for the years ended
December 31, 2016
,
2015
and
2014
:
|
|
2016
|
|
2015
|
|
2014
|
|
|||
|
Basic income (loss) per share
|
(in thousands, except per share amounts)
|
||||||||
|
Net income (loss)
|
$
|
(895
|
)
|
$
|
40,864
|
|
$
|
33,883
|
|
|
Weighted average shares outstanding
|
48,807
|
|
48,388
|
|
48,198
|
|
|||
|
Basic income (loss) per share
|
$
|
(0.02
|
)
|
$
|
0.84
|
|
$
|
0.70
|
|
|
Effect of stock options outstanding:
|
|
|
|
|
|
|
|||
|
Weighted average shares outstanding
|
48,807
|
|
48,388
|
|
48,198
|
|
|||
|
Assumed exercise, at the strike price at the beginning of year
|
—
|
|
1,302
|
|
1,410
|
|
|||
|
Assumed repurchase of shares under treasury stock method
|
—
|
|
(666
|
)
|
(888
|
)
|
|||
|
Diluted weighted average shares
|
48,807
|
|
49,024
|
|
48,720
|
|
|||
|
Diluted income (loss) per share
|
$
|
(0.02
|
)
|
$
|
0.83
|
|
$
|
0.70
|
|
Contingencies:
The Company is involved in various claims and legal actions arising in the ordinary course of business. In the opinion of management, the ultimate disposition of these matters will not have a material adverse effect on the Company’s consolidated financial position, results of operations, or liquidity.
Adoption of New Accounting Principles
During
2016
, the Company adopted four recent accounting principles: Accounting Standards Update 2015-3, “Interest – Imputation of Interest” (ASU 2015-3), ASU 2015-17, “Balance Sheet Classification of Deferred Taxes”, ASU 2016-9, “Improvements to Employee Share-based Payment Accounting,” and ASU 2015-16, “Simplifying the Accounting for Measurement-Period Adjustments.”
ASU 2015-3 requires that premiums, discounts, and loan fees and costs associated with long term debt be reflected as a reduction of the outstanding debt balance. Previous guidance had treated such loan fees and costs as a deferred charge on the balance sheet. As a result of implementing ASU 2015-3, the Company reclassified
$1.6 million
of unamortized loan fees and costs included in deferred charges and other assets as of
December 31, 2015
to long-term debt. Approximately
$0.5 million
was allocated to current maturities of long-term debt, and
$1.1 million
to long term debt. Total assets, as well as total liabilities and shareholders’ equity, were also reduced by the same
$1.6 million
. In addition, the Company reclassified
$4.3 million
of unamortized loan fees and costs included in deferred charges and other assets to long term debt in connection with the new
F-16
Term loan A-1 and A-2 borrowing related to the acquisition of nTelos. Total assets, as well as total liabilities and shareholders’ equity, were also reduced by the same
$4.3 million
. There was no impact on the statements of income or cash flows.
ASU 2015-17 simplifies accounting for deferred taxes by eliminating the requirement to present deferred tax assets and liabilities as current and non-current in a classified balance sheet. Due to the immaterial balance of current deferred tax assets (
$0.9 million
as of
December 31, 2015
), the Company has elected to apply this guidance prospectively, and thus prior periods have not been retrospectively adjusted.
ASU 2016-9 simplifies certain provisions related to the accounting for the tax effects of stock-based compensation transactions. In particular for the Company, it eliminates the requirement to determine for each award whether the difference between book compensation and tax compensation results in an excess tax benefit or a tax deficiency, which generally speaking, result in an entry to additional paid-in-capital. Under the new guidance, all tax effects for exercised or vested awards are recognized as discrete items in income tax expense, and the Company recognized
$1.7 million
of tax benefits through income tax expense in 2016. The new guidance also allows an employer to withhold shares to cover more than the minimum statutory withholding taxes (but not more than the maximum statutory withholding requirements) without causing an equity-classified award to become a liability classified award. The other provisions of the new guidance are either not applicable or have no significant impact on the Company’s accounting for stock-based compensation transactions. The Company has elected to early adopt the new guidance and apply it prospectively to tax effects on share-based compensation transactions.
ASU 2015-16 requires that an acquirer recognize adjustments to provisional amounts that are identified during the measurement period in the reporting period in which the adjustment amounts are determined. See Note 16 for adjustments recorded during 2016.
As part of the acquisition of nTelos, the Company acquired the accounts receivable associated with nTelos’ Equipment Installment Plan, (“EIP”). This plan allowed EIP subscribers to pay for their devices in installments over a
24
-month period. At the time of an installment sale, nTelos imputed interest on the installment receivable using current market interest rate estimates ranging from approximately
5%
to
10%
. Additionally, the customer had the right to trade in their original device after a specified period of time for a new device and have the remaining unpaid balance satisfied. This trade-in right was measured at the estimated fair value of the device being traded in based on current trade-in values and the timing of the trade-in.
Immediately following the acquisition, the Company terminated the EIP offering but has continued to service the installment receivable and trade in obligation until such time that the customer migrates to Sprint. The accounts receivable associated with EIP and the trade-in liability were estimated at its fair value at acquisition date in accordance with ASC 805, “Business Combinations”.
There was
$0.7 million
of unmigrated, acquired EIP receivables as of December 31, 2016. The short term portion of
$0.6 million
is included in accounts receivable, net. The long term portion of
$0.1 million
is included in deferred charges and other assets, net. An additional
$6.7 million
of acquired EIP receivables have been subsequently transferred to Sprint and the resulting receivables from Sprint are also included in accounts receivable, net, as of December 31, 2016.
The Company has three classifications of investments: investments carried at fair value, investments carried at cost, and equity method investments. See Note 1 for definitions of each classification of investment.
At
December 31, 2016
and
2015
, investments carried at fair value consisted of:
|
2016
|
2015
|
||||||
|
|
(in thousands)
|
||||||
|
Taxable bond funds
|
$
|
24
|
|
$
|
24
|
|
|
|
Domestic equity funds
|
2,787
|
|
2,564
|
|
|||
|
International equity funds
|
96
|
|
66
|
|
|||
|
|
$
|
2,907
|
|
$
|
2,654
|
|
|
F-17
Investments carried at fair value were acquired under a rabbi trust arrangement related to the Company’s SERP. The Company purchases investments in the trust to mirror the investment elections of participants in the SERP; gains and losses on the investments in the trust are reflected as increases or decreases in the liability owed to the participants. The Company recorded unrealized gains of $
143 thousand
in
2016
and unrealized losses of
$141 thousand
and
$51 thousand
in
2015
and
2014
, respectively. Dividends received from the investment totaled
$110 thousand
,
$134 thousand
, and
$184 thousand
during
2016
,
2015
and
2014
, respectively. Fair values for these investments are determined by quoted market prices (“Level 1 fair values”) for the underlying mutual funds, which may be based upon net asset value.
At
December 31, 2016
and
2015
, other investments, comprised of equity securities which do not have readily determinable fair values, consist of the following:
|
|
2016
|
2015
|
|||||
|
Cost method:
|
(in thousands)
|
||||||
|
CoBank
|
$
|
6,177
|
|
$
|
4,137
|
|
|
|
Other – Equity in other telecommunications partners
|
742
|
|
760
|
|
|||
|
|
6,919
|
|
4,897
|
|
|||
|
Equity method:
|
|
|
|
|
|||
|
Private equity limited partnerships
|
—
|
|
2,624
|
|
|||
|
Other
|
450
|
|
504
|
|
|||
|
|
450
|
|
3,128
|
|
|||
|
Total other investments
|
$
|
7,369
|
|
$
|
8,025
|
|
|
The Company’s investment in CoBank increased
$540 thousand
and
$388 thousand
in the years ended
December 31, 2016
and
2015
, respectively, due to the ongoing patronage earned from the outstanding investment and loan balances the Company has with CoBank. The Company also recorded an additional
$1.5 million
in CoBank investment as a result of the nTelos acquisition.
During the year ended
December 31, 2016
, the Company received distributions from its investments totaling
$2.9 million
in cash. During 2016, the Company accepted an offer for the sale of the remaining shares of an equity method investment. Equity method investments had a net gain of
$128 thousand
in the year ended
December 31, 2016
.
Property, plant and equipment consisted of the following at
December 31, 2016
and
2015
:
|
|
Estimated
Useful Lives
|
2016
|
|
2015
|
|
||
|
|
|
(in thousands)
|
|||||
|
Land
|
|
$
|
13,057
|
|
$
|
4,181
|
|
|
Buildings and structures
|
10 – 40 years
|
115,960
|
|
108,341
|
|
||
|
Cable and wire
|
4 – 40 years
|
235,471
|
|
214,721
|
|
||
|
Equipment and software
|
2 – 16.7 years
|
720,830
|
|
391,260
|
|
||
|
Plant in service
|
|
1,085,318
|
|
718,503
|
|
||
|
Plant under construction
|
|
73,759
|
|
36,600
|
|
||
|
Total property, plant and equipment
|
|
1,159,077
|
|
755,103
|
|
||
|
Less accumulated amortization and depreciation
|
460,955
|
|
345,085
|
|
|||
|
Property, plant and equipment, net
|
|
$
|
698,122
|
|
$
|
410,018
|
|
F-18
Total debt consists of the following:
|
(In thousands)
|
2016
|
2015
|
||||||
|
Term loan A
|
$
|
—
|
|
$
|
201,250
|
|
||
|
Term loan A-1
|
472,875
|
|
—
|
|
||||
|
Term loan A-2
|
375,000
|
|
—
|
|
||||
|
|
847,875
|
|
201,250
|
|
||||
|
Less: unamortized loan fees
|
18,610
|
|
1,589
|
|
||||
|
Total debt, net of unamortized loan fees
|
$
|
829,265
|
|
$
|
199,661
|
|
||
|
Current maturities of long term debt, net of unamortized loan fees
|
$
|
32,041
|
|
$
|
22,492
|
|
||
|
Long-term debt, less current maturities, net of unamortized loan fees
|
$
|
797,224
|
|
$
|
177,169
|
|
||
On December 18, 2015, the Company entered into a Credit Agreement (as amended, the “2016 credit agreement”) with various banks and other financial institutions party thereto and CoBank, ACB, as administrative agent for the lenders, providing for
three
facilities: (i) a
five
year revolving credit facility of up to
$75 million
; (ii) a
five
-year term loan facility of up to
$485 million
(Term Loan A-1”); and (iii) a
seven
-year term loan facility of up to
$400 million
(“Term Loan A-2”).
In connection with the closing of the nTelos acquisition, the Company borrowed (i)
$485 million
under Term Loan A-1 and (ii)
$325 million
under Term Loan A-2, which amounts were used to, among other things, fund the payment of the nTelos merger consideration, to refinance, in full, all indebtedness under the Company’s existing credit agreement, to repay existing long-term indebtedness of nTelos and to pay fees and expenses in connection with the foregoing. In connection with the consummation of the nTelos acquisition, nTelos and its subsidiaries became guarantors under the 2016 credit agreement and pledged their assets as security for the obligations under the 2016 credit agreement. The 2016 credit agreement also includes
$75 million
available under the Term Loan A-2 as a “delayed draw term loan,” and as of December 2016, the Company drew
$50 million
under this portion of the agreement. Additionally, the 2016 credit agreement includes a
$75 million
Revolver Facility and permits the Company to enter into
one
or more Incremental Term Loan Facilities not to exceed
$150 million
in the aggregate. At December 31, 2016,
no
draw had been made under the Revolver Facility and the Company had not entered into any Incremental Loan Facility.
As of December 31, 2016, the Company’s indebtedness totaled
$829.3 million
, net of unamortized loan fees of
$18.6 million
, with an annualized overall weighted average interest rate of approximately
3.83%
. The Term Loan A-1 bears interest at one-month LIBOR plus a margin of
2.75%
, while the Term Loan A-2 bears interest at one-month LIBOR plus a margin of
3.00%
. LIBOR resets monthly. These loans are more fully described below.
The Term Loan A-1 requires quarterly principal repayments of
$6.1 million
, which began on September 30, 2016, and will continue through June 30, 2017, increasing to
$12.1 million
quarterly from September 30, 2017 through June 30, 2020, increasing to
$18.2 million
quarterly from September 30, 2020 thereafter through March 31, 2021, with the remaining expected balance of approximately
$260.7 million
due June 30, 2021. The Term Loan A-2 requires quarterly principal repayments of
$10.0 million
beginning on September 30, 2018 through March 31, 2023, with the current remaining expected balance of approximately
$185.0 million
due June 30, 2023.
The 2016 credit agreement also required the Company to enter into one or more hedge agreements to manage its exposure to interest rate movements. The Company elected to hedge the minimum required under the 2016 credit agreement, and entered into a pay fixed, receive variable swap on
50%
of the aggregate expected principal balance of the term loans outstanding. The Company will receive one month LIBOR and pay a fixed rate of
1.16%
, in addition to the
2.75%
initial spread on Term Loan A-1 and the
3.00%
initial spread on Term Loan A-2.
The 2016 credit agreement contains affirmative and negative covenants customary to secured credit facilities, including covenants restricting the ability of the Company and its subsidiaries, subject to negotiated exceptions, to incur additional indebtedness and additional liens on their assets, engage in mergers or acquisitions or dispose of assets, pay dividends or make
F-19
other distributions, voluntarily prepay other indebtedness, enter into transactions with affiliated persons, make investments, and change the nature of the Company’s and its subsidiaries’ businesses.
Indebtedness outstanding under any of the facilities may be accelerated by an Event of Default, as defined in the 2016 credit agreement.
The Facilities are secured by a pledge by the Company of its stock in its subsidiaries, a guarantee by the Company’s subsidiaries other than Shenandoah Telephone Company, and a security interest in substantially all of the assets of the Company and the guarantors.
The Company is subject to certain financial covenants to be measured on a trailing twelve month basis each calendar quarter unless otherwise specified. These covenants include:
|
•
|
a limitation on the Company’s total leverage ratio, defined as indebtedness divided by earnings before interest, taxes, depreciation and amortization, or EBITDA, of less than or equal to
3.75
to 1.00 from the closing date through December 30, 2018, then
3.25
to 1.00 through December 30, 2019, and
3.00
to 1.00 thereafter;
|
|
•
|
a minimum debt service coverage ratio, defined as EBITDA minus certain cash taxes divided by the sum of all scheduled principal payments on the Term Loans and scheduled principal payments on other indebtedness plus cash interest expense, greater than
2.00
to 1.00;
|
|
•
|
the Company must maintain a minimum liquidity balance, defined as availability under the revolver facility plus unrestricted cash and cash equivalents on deposit in a deposit account for which a control agreement has been delivered to the administrative agent under the 2016 credit agreement, of greater than
$25 million
at all times.
|
These ratios are generally less restrictive than the covenant ratios the Company had been required to comply with under its previously existing debt arrangements. As shown below, as of
December 31, 2016
, the Company was in compliance with the financial covenants in its credit agreements.
|
|
Actual
|
Covenant Requirement
|
||
|
Total Leverage Ratio
|
2.81
|
%
|
3.75 or Lower
|
|
|
Debt Service Coverage Ratio
|
4.23
|
%
|
2.00 or Higher
|
|
|
Minimum Liquidity Balance
|
$136 million
|
|
$25 million or Higher
|
|
Future maturities of long-term debt principal are as follows (in thousands):
|
2017
|
$
|
36,375
|
|
|
2018
|
68,500
|
|
|
|
2019
|
88,500
|
|
|
|
2020
|
100,625
|
|
|
|
2021
|
318,875
|
|
|
|
2022 and beyond
|
235,000
|
|
|
|
Total
|
$
|
847,875
|
|
The Company has no fixed rate debt instruments as of
December 31, 2016
. The estimated fair value of the variable rate debt approximates its carrying value. The fair value of the Company’s interest rate swap was an asset of
$11.2 million
and
$688 thousand
at
December 31, 2016
and
2015
, respectively. (See Note 15).
The Company receives patronage credits from CoBank and certain of its affiliated Farm Credit institutions, which are not reflected in the stated rates shown above. Patronage credits are a distribution of profits of CoBank as approved by its Board of Directors. During the first quarter of the year, the Company receives patronage credits on its outstanding CoBank debt balance. The Company accrued
$2.2 million
in non-operating income in the year ended
December 31, 2016
, in anticipation of the early
2017
distribution of the credits by CoBank. Patronage credits have historically been paid in a mix of cash and shares of CoBank stock. The
2016
payout mix was
75%
cash and
25%
shares.
F-20
Total income taxes for the years ended
December 31, 2016
,
2015
and
2014
were allocated as follows:
|
|
2016
|
2015
|
2014
|
||||||
|
|
(in thousands)
|
||||||||
|
Income tax expense on continuing operations
|
$
|
2,840
|
|
$
|
27,726
|
|
$
|
22,151
|
|
|
Shareholders’ equity, for compensation expense for tax purposes in excess of amounts recognized for financial reporting purposes
|
—
|
|
(679
|
)
|
(395
|
)
|
|||
|
Other comprehensive income for changes in cash flow hedge
|
4,162
|
|
(476
|
)
|
(993
|
)
|
|||
|
|
$
|
7,002
|
|
$
|
26,571
|
|
$
|
20,763
|
|
The Company and its subsidiaries file income tax returns in several jurisdictions. The provision for the federal and state income taxes attributable to income from continuing operations consists of the following components:
|
|
Years Ended December 31,
|
||||||||
|
|
2016
|
2015
|
2014
|
||||||
|
|
(in thousands)
|
||||||||
|
Current expense
|
|
|
|
||||||
|
Federal taxes
|
$
|
44,779
|
|
$
|
23,579
|
|
$
|
16,592
|
|
|
State taxes
|
10,936
|
|
5,275
|
|
2,562
|
|
|||
|
Total current provision
|
55,715
|
|
28,854
|
|
19,154
|
|
|||
|
Deferred expense (benefit)
|
|
|
|
|
|
|
|||
|
Federal taxes
|
(47,056
|
)
|
(744
|
)
|
1,636
|
|
|||
|
State taxes
|
(5,819
|
)
|
(384
|
)
|
1,361
|
|
|||
|
Total deferred provision
|
(52,875
|
)
|
(1,128
|
)
|
2,997
|
|
|||
|
Income tax expense on continuing operations
|
$
|
2,840
|
|
$
|
27,726
|
|
$
|
22,151
|
|
|
Effective tax rate
|
146.0
|
%
|
40.4
|
%
|
39.5
|
%
|
|||
A reconciliation of income taxes determined by applying the federal and state tax rates to income from continuing operations is as follows for the years ended
December 31, 2016
,
2015
and
2014
:
|
|
Years Ended December 31,
|
||||||||
|
|
2016
|
2015
|
2014
|
||||||
|
|
(in thousands)
|
||||||||
|
Computed “expected” tax expense (35%)
|
$
|
681
|
|
$
|
24,007
|
|
$
|
19,612
|
|
|
State income taxes, net of federal tax effect
|
6
|
|
3,179
|
|
2,550
|
|
|||
|
Changes in state DTL for mergers
|
3,320
|
|
$
|
—
|
|
—
|
|
||
|
Excess share based compensation
|
(1,709
|
)
|
—
|
|
—
|
|
|||
|
Nondeductible merger expenses
|
801
|
|
$
|
—
|
|
—
|
|
||
|
Other, net
|
(259
|
)
|
540
|
|
(11
|
)
|
|||
|
Income tax expense on continuing operations
|
$
|
2,840
|
|
$
|
27,726
|
|
$
|
22,151
|
|
The effective tax rate increased substantially in 2016 primarily due to the minimal base of pre-tax earnings in 2016 accompanied by changes in blended state rates applied to basis differences caused by the nTelos acquisition and the Company's legal entity restructuring that combined the nTelos legal entity into the Company's PCS subsidiary. The rate was further affected by the adoption of ASU 2016-09 regarding share based compensation and non-deductible transaction costs incurred during 2016 related to the nTelos acquisition.
F-21
Net deferred tax assets and liabilities consist of the following temporary differences at
December 31, 2016
and
2015
:
|
|
2016
|
2015
|
||||
|
|
(in thousands)
|
|||||
|
Deferred tax assets:
|
|
|||||
|
Deferred revenues
|
$
|
8,849
|
|
$
|
2,367
|
|
|
Net operating loss carry-forwards
|
29,472
|
|
717
|
|
||
|
Accruals and reserves
|
10,517
|
|
5,658
|
|
||
|
Pension benefits
|
6,994
|
|
1,023
|
|
||
|
Asset retirement obligations
|
8,495
|
|
2,922
|
|
||
|
Intangible assets
|
—
|
|
325
|
|
||
|
Total gross deferred tax assets
|
64,327
|
|
13,012
|
|
||
|
Less valuation allowance
|
(709
|
)
|
(709
|
)
|
||
|
Net deferred tax assets
|
63,618
|
|
12,303
|
|
||
|
Deferred tax liabilities:
|
|
|
|
|
||
|
Plant-in-service
|
139,753
|
|
85,503
|
|
||
|
Intangibles
|
70,799
|
|
—
|
|
||
|
Interest rate swaps
|
4,433
|
|
271
|
|
||
|
Other, net
|
470
|
|
490
|
|
||
|
Total gross deferred tax liabilities
|
215,455
|
|
86,264
|
|
||
|
Net deferred tax liabilities
|
$
|
151,837
|
|
$
|
73,961
|
|
In assessing the ability to realize deferred tax assets, management considers whether it is more likely than not that some portion or all of the deferred tax assets will not be realized. The ultimate realization of deferred tax assets is dependent upon generating future taxable income during the periods in which those temporary differences become deductible. Management considers the scheduled reversal of deferred tax liabilities, projected future taxable income and tax planning strategies in making this assessment. Based upon the level of historical taxable income and projections for future taxable income over the periods for which the deferred tax assets are deductible, management believes it more likely than not that the net deferred tax assets will be realized with the exception of certain state net operating losses in jurisdictions where the Company no longer operates. The Company has a deferred tax asset of
$29.5 million
related to federal and various state net operating losses, of which
$0.7 million
is associated with a valuation allowance. As of December 31, 2016, the Company had approximately
$74 million
of federal net operating losses expiring through 2035. The Company also has state net operating losses expiring through 2035.
As of
December 31, 2016
and
2015
, the Company had
no
unrecognized tax benefits. It is the Company’s policy to record interest and penalties related to unrecognized tax benefits in income before taxes.
The Company files U.S. federal income tax returns and various state and local income tax returns. The Company is not currently subject to state or federal income tax audits as of
December 31, 2016
. The Company's returns are generally open to examination from 2013 forward and the net operating losses acquired in the acquisition of nTelos are open to examination from 2002 forward.
F-22
In 1999, the Company executed a Management Agreement (the “Agreement”) with Sprint whereby the Company committed to construct and operate a PCS network using CDMA air interface technology. Under the Agreement, the Company was the exclusive PCS Affiliate of Sprint providing wireless mobility communications network products and services on the 1900 MHz band in its territory which extends from Altoona, York and Harrisburg, Pennsylvania, and south along the Interstate 81 corridor through Western Maryland, the panhandle of West Virginia, to Harrisonburg, Virginia. With the recent acquisition of nTelos, the Company’s wireless service area has expanded to include south-central and western Virginia, West Virginia, and small portions of Kentucky and Ohio. The Company is authorized to use the Sprint brand in its territory, and operate its network under Sprint’s radio spectrum licenses. As an exclusive PCS Affiliate of Sprint, the Company has the exclusive right to build, own and maintain its portion of Sprint’s nationwide PCS network, in the aforementioned areas, to Sprint’s specifications. The term of the Agreement was initially set for
20
years and was automatically renewable for
three
10
-year options, unless terminated by either party under provisions outlined in the Agreement. Upon non-renewal by either party, the Company has the obligation to sell the business at
90%
of “Entire Business Value” (“EBV”) as defined in the Agreement. EBV is defined as i) the fair market value of a going concern paid by a willing buyer to a willing seller; ii) valued as if the business will continue to utilize existing brands and operate under existing agreements; and, iii) valued as if Manager (Shentel) owns the spectrum. Determination of EBV is made by an independent appraisal process.
The Agreement has been amended numerous times. During 2012, the Company amended its Agreement with Sprint in order to build a 4G LTE network in the Company’s service area. In addition to adding 4G services to the Company’s network, the Company received access to additional
1900
and
800
MHz spectrum, extended the initial term of the contract
five
years from 2019 to 2024 and set the maximum contract length at
45
years. The agreement also increased the cap on the Net Service Fee related to postpaid revenues. Effective August 1, 2013, the Net Service Fee increased to its
14%
maximum. There is also a management fee of
8%
on postpaid revenues which has remained constant for the life of the contract.
During 2014, the Company amended its Agreement with Sprint in order to allow the Company’s PCS stores to begin participating in Sprint’s handset financing programs, whereby Sprint enters into a financing agreement with the subscriber and the subscriber receives a handset from Sprint. The equipment revenue from the subscriber, the handset expense and any related bad debt are Sprint’s responsibility and are not recorded by the Company.
During 2015, effective January 1, 2016, the Company amended its Agreement with Sprint in order to better allocate certain costs covered by the Net Service Fee and extended the initial term to 2029. The Net Service Fee was reduced to
8.6%
, and certain costs and revenues previously included within the Net Service Fee were broken out of the Net Service Fee and will be separately settled in the future. Separately settled revenues primarily consist of revenues associated with Sprint’s wholesale subscribers using the Company’s network and net travel revenue. In addition, the Company will be charged for the costs of subsidized handsets sold through Sprint’s national channels as well as commissions paid by Sprint to third-party resellers in our service territory. This treatment has not resulted in a significant change in wireless postpaid results, though it did increase total revenue and total operating expenses. Additionally, during 2015, the Company received access to certain 2.5GHz spectrum.
Effective with the acquisition of nTelos on May 6, 2016, the Company amended its Agreement with Sprint to expand the Company’s service area to include most of the nTelos territory and include both the nTelos customers and Sprint customers (who were served by nTelos under a wholesale agreement with Sprint) into the Company’s subscriber base. The Company agreed to complete nTelos’ network upgrade to 4G and expand coverage and capacity throughout the nTelos territory. Sprint agreed to waive a portion of the Management Fee charged by Sprint.
Under the Sprint agreements, Sprint provides the Company significant support services such as customer service, billing, collections, long distance, national network operations support, inventory logistics support, use of the Sprint brand names, national advertising, national distribution and product development. Cost of equipment transactions between the Company and Sprint relate to inventory purchased and subsidized costs of handsets. These costs also included transactions related to subsidized costs on handsets and commissions paid to Sprint for sales of handsets through Sprint’s national distribution programs.
PCS is dependent upon Sprint’s ability to execute certain functions such as billing, customer care, collections and other operating activities under the Company's agreements with Sprint. Due to the high degree of integration within many of the Sprint systems, and the Company’s dependency on these systems, in many cases it would be difficult for the Company to perform these services in-house or to outsource the services to another provider. If Sprint is unable to perform any such service, the change could result in increased operating expenses and have an adverse impact on the Company's operating results and cash flow. In addition, the Company's ability to attract and maintain a sufficient customer base is critical to generating
F-23
positive cash flow from operations and profits for its PCS operation. Changes in technology, increased competition, or economic conditions in the wireless industry or the economy in general, individually and/or collectively, could have an adverse effect on the Company's financial position and results of operations.
ValleyNet, an equity method investee of the Company, resells capacity on the Company’s fiber network under an operating lease agreement. Facility lease revenue from ValleyNet was approximately
$2.4 million
,
$2.7 million
and
$3.0 million
in the years ended December 31, 2016, 2015 and 2014, respectively. At both
December 31, 2016
and
2015
, the Company had accounts receivable from ValleyNet of approximately
$0.2 million
. The Company's PCS operating subsidiary leases capacity through ValleyNet. Payment for usage of these facilities was
$3.0 million
,
$2.4 million
and
$2.3 million
in the years ended
December 31, 2016
,
2015
and
2014
, respectively.
The Company assumed, through its acquisition of nTelos, a qualified pension plan and other postretirement benefit plans. We have recorded the fair value of the nTelos plans using assumptions and accounting policies consistent with those disclosed by nTelos. Upon acquisition, the excess of projected benefit obligations over the plan assets was recognized as a liability and previously existing deferred actuarial gains and losses and unrecognized service costs and benefits were eliminated.
The following tables provide the benefit obligations, fair value of assets and a statement of the funded status since the acquisition date (in thousands):
|
|
Defined Benefit Pension Plan
|
Other Postretirement
Benefit Plans |
||||||
|
Benefit obligations, at acquisition
|
$
|
37,443
|
|
$
|
4,298
|
|
||
|
Service cost
|
—
|
|
18
|
|
||||
|
Interest cost
|
956
|
|
108
|
|
||||
|
Benefits paid
|
(340
|
)
|
—
|
|
||||
|
Actuarial gain
|
(3,703
|
)
|
(174
|
)
|
||||
|
Benefit obligations as of December 31, 2016
|
$
|
34,356
|
|
$
|
4,250
|
|
||
|
|
Defined Benefit Pension Plan
|
Other Postretirement
Benefit Plans |
||||||
|
Plan assets, at acquisition
|
$
|
22,813
|
|
$
|
—
|
|
||
|
Actual return on Plan assets
|
1,722
|
|
—
|
|
||||
|
Benefits paid
|
(340
|
)
|
—
|
|
||||
|
Plan expenses
|
(121
|
)
|
—
|
|
||||
|
Plan assets as of December 31, 2016
|
$
|
24,074
|
|
$
|
—
|
|
||
|
Funded status: Net liability as of December 31, 2016
|
$
|
(10,282
|
)
|
$
|
(4,250
|
)
|
||
The funded status is included in other long-term liabilities on the Company's consolidated balance sheets.
The accumulated benefit obligation for the defined benefit pension plan at May 6, 2016 was
$37.4 million
. The accumulated benefit obligation represents the present value of pension benefits based on service and salary earned to date. The defined benefit plan was frozen for future benefit accruals as of December 31, 2012. Accordingly, the accumulated benefit obligation is equal to the projected benefit obligation.
F-24
The following table provides the components of net periodic pension (benefit) cost for the plans for the period from acquisition date to
December 31, 2016
(in thousands):
|
|
Defined Benefit Pension Plan
|
Other Postretirement
Benefit Plans
|
||||||
|
Components of net periodic pension (benefit) cost:
|
|
|
||||||
|
Service cost
|
$
|
—
|
|
$
|
18
|
|
||
|
Interest cost
|
956
|
|
108
|
|
||||
|
Expected return on plan assets
|
(1,018
|
)
|
—
|
|
||||
|
Actuarial gains
|
(4,286
|
)
|
(174
|
)
|
||||
|
Net periodic (benefit) cost
|
$
|
(4,348
|
)
|
$
|
(48
|
)
|
||
We recognize gains and losses on pension and postretirement plan assets and obligations immediately in our operating results. These gains and losses are measured annually as of December 31 and accordingly are recorded during the fourth quarter, unless earlier measurements are required.
The assumptions used in the measurements of the Company’s benefit obligations at December 31, 2016 for the plans are shown in the following table:
|
|
Defined
Benefit
Pension Plan
|
Other
Postretirement
Benefit Plans
|
||||
|
Discount rate
|
4.15
|
%
|
4.11
|
%
|
||
The assumptions used in the measurements of the Company’s net periodic benefit cost (income) for the consolidated statement of operations for the period from acquisition date through
December 31, 2016
are:
|
|
Defined Benefit
Pension Plan
|
Other
Postretirement
Benefit Plans
|
||||
|
Discount rate
|
4.15
|
%
|
4.11
|
%
|
||
|
Expected return on plan assets
|
6.75
|
%
|
—
|
%
|
||
The Company reviews the assumptions noted in the above tables annually or more frequently to reflect anticipated future changes in the underlying economic factors used to determine these assumptions. The discount rates assumed reflect the rate at which the Company could invest in high quality corporate bonds in order to settle future obligations.
The Company uses the RP-2014 mortality table with generational improvement Scale MP-2016 published by the Society of Actuaries.
For measurement purposes, an
8.0%
annual rate of increase in the per capita cost of covered health care benefits was assumed for
2016
for the obligation as of the acquisition date. The rate was assumed to decrease one-half percent per year to a rate of
5.0%
for 2022 and remain at that level thereafter.
Assumed health care cost trend rates may have a significant effect on the amounts reported for the health care plans. The effect of a 1% change on the medical trend rate per future year, while holding all other assumptions constant, to the service and interest cost components of net periodic postretirement health care benefit costs and accumulated postretirement benefit obligation would be a
$41 thousand
increase and a
$800 thousand
increase, respectively, for a 1% increase in medical trend rate and a
$32 thousand
decrease and a
$634 thousand
decrease, respectively, for a 1% decrease in medical trend rate.
The weighted average expected rate of return on plan assets is based on anticipated performance of the various asset in which the plans invest, weighted by target allocation percentages. Anticipated future performance is based on long-term historical returns of the plan assets, adjusted for the long-term expectations on the performance of the markets.
F-25
The actual and target allocation for plan assets is broadly defined and measured as follows:
|
Asset Category
|
Actual
Allocation
|
Target
Allocation
|
||||
|
Equity securities
|
76
|
%
|
65-75
|
|
||
|
Bond securities and cash equivalents
|
24
|
%
|
25-35
|
|
||
|
Total
|
100
|
%
|
100
|
%
|
||
It is the Company’s policy to invest pension plan assets in a diversified portfolio consisting of an array of asset classes. The investment risk of the assets is limited by appropriate diversification both within and between asset classes. The assets are primarily invested in investment funds that invest in a broad mix of publicly traded equities, bonds and cash equivalents (and fair value is based on quoted market prices (“Level 1” input)). The fair value of an investment fund representing
4%
of total plan assets, which is included in bond and cash equivalents, is based on significant other observable inputs ("Level 2" input). The allocation between equity and bonds is reset quarterly to the target allocations. Updates to the allocation are considered in the normal course and changes may be made when appropriate. The bond holdings consist of
two
bond funds split relatively evenly between these funds at December 31, 2016. The maximum holdings of any one asset within these funds is under
4%
of this fund and thus is well under
1%
of the total portfolio. At December 31, 2016, the Company believes that there are no material concentrations of risk within the portfolio of plan assets.
The assumed long-term return noted above is the target long-term return. Overall return, risk adjusted return, and management fees are assessed against a peer group and benchmark indices. There are minimum performance standards that must be attained within the investment portfolio. Reporting on asset performance is provided quarterly and review meetings are held semi-annually. In addition to normal rebalancing to maintain an adequate cash reserve, projected cash flow needs of the plan are reviewed at least annually to ensure liquidity is properly managed.
The Company does not expect to contribute to the pension plan in 2017. The Company expects the net periodic benefit income for the defined benefit pension plan in 2017 to be
$0.2 million
and expects the periodic benefit cost for the other postretirement benefit plans in 2017 to be
$0.2 million
, excluding actuarial gains and losses which will be recorded in the fourth quarter of 2017.
The following estimated future pension benefit payments and other postretirement benefit plan payments which reflect expected future service, as appropriate, are expected to be paid in the years indicated (in thousands):
|
Defined
Benefit
Pension
Plan
|
Other
Postretirement
Benefit Plans
|
|||||||
|
2017
|
$
|
684
|
|
$
|
187
|
|
||
|
2018
|
703
|
|
156
|
|
||||
|
2019
|
752
|
|
160
|
|
||||
|
2020
|
821
|
|
155
|
|
||||
|
2021
|
924
|
|
170
|
|
||||
|
Aggregate of next five years
|
6,409
|
|
925
|
|
||||
The Company plans to make contributions to comply with minimum funding requirements of ERISA. In accordance with such practice, no contributions are required for 2017.
The Company maintains a defined contribution 401(k) plan. The Company's matching and employer discretionary contributions to the defined contribution 401(k) plan were approximately
$3.8 million
,
$2.6 million
and
$2.5 million
for the years ended
December 31, 2016
,
2015
and
2014
, respectively.
The Company maintains an unfunded, non-qualified Supplemental Executive Retirement Plan (the “SERP”) for named executives. In 2010, the Company curtailed future participation in the SERP. Current participants may remain in the SERP and continue to earn returns (either gains or losses) on invested balances, but the Company will make no further contributions to the SERP and no new participants will be eligible to join the SERP.
F-26
In order to provide some protection to the participants, the Company created a rabbi trust to hold assets sufficient to pay obligations under the SERP. Assets within the trust were invested to mirror participant elections as to investment options (a mix of stock and bond mutual funds); investment income, gains and losses in the trust were used to determine investment returns on the participants’ balances in the SERP. At
December 31, 2016
and
2015
, the total liability due to participants in the SERP was
$2.9 million
and
$2.7 million
, respectively.
|
Note 10.
|
Accrued and Other liabilities
|
Accrued liabilities and other include the following (in thousands):
|
December 31, 2016
|
December 31, 2015
|
|||||||
|
Sales and property taxes payable
|
$
|
6,628
|
|
$
|
1,055
|
|
||
|
Severance accrual, current portion
|
4,267
|
|
—
|
|
||||
|
Asset retirement obligations, current portion
|
5,841
|
|
—
|
|
||||
|
Other current liabilities
|
12,349
|
|
6,584
|
|
||||
|
Accrued liabilities and other
|
$
|
29,085
|
|
$
|
7,639
|
|
||
Other liabilities include the following (in thousands):
|
|
December 31, 2016
|
December 31, 2015
|
||||||
|
Non-current portion of deferred revenues
|
$
|
8,933
|
|
$
|
4,156
|
|
||
|
Straight-line management fee waiver
|
11,974
|
|
—
|
|
||||
|
Other
|
2,836
|
|
2,229
|
|
||||
|
Other liabilities
|
$
|
23,743
|
|
$
|
6,385
|
|
||
The Company maintains
two
shareholder-approved Company Stock Incentive Plans allowing for the grant of equity based incentive compensation to essentially all employees. The 2005 Plan authorized grants of up to
2,880,000
shares over a
ten
-year period beginning in 2005. The term of the 2005 Plan expired in February 2014; outstanding awards will continue to vest and options may continue to be exercised, but no additional awards will be granted under the 2005 Plan. The 2014 Plan authorizes grants of up to an additional
3,000,000
shares over a
ten
-year period beginning in 2014. Under these Plans, grants may take the form of stock awards, awards of options to acquire stock, stock appreciation rights, and other forms of equity based compensation; both options to acquire stock and stock awards were granted. The option price for all grants has been the current market price at the time of the grant.
F-27
Option Awards
The Company did not grant stock options during 2016, 2015, or 2014.
A summary of outstanding options at
December 31, 2016
,
2015
and
2014
, and changes during the years ended on those dates, is as follows:
|
|
Number
of
Options
|
Weighted
Average Grant
Price Per Option
|
|||
|
Outstanding December 31, 2013
|
1,101,014
|
|
$
|
8.35
|
|
|
Granted
|
—
|
|
—
|
|
|
|
Cancelled
|
(2,146
|
)
|
12.63
|
|
|
|
Exercised
|
(101,516
|
)
|
11.21
|
|
|
|
Outstanding December 31, 2014
|
997,352
|
|
$
|
8.05
|
|
|
Granted
|
—
|
|
—
|
|
|
|
Cancelled
|
(6,252
|
)
|
12.63
|
|
|
|
Exercised
|
(86,942
|
)
|
11.46
|
|
|
|
Outstanding December 31, 2015
|
904,158
|
|
$
|
7.70
|
|
|
Granted
|
—
|
|
|
|
|
|
Cancelled
|
(8,126
|
)
|
12.63
|
|
|
|
Exercised
|
(371,390
|
)
|
9.04
|
|
|
|
Outstanding December 31, 2016
|
524,642
|
|
$
|
6.67
|
|
There were options for
524,642
shares outstanding at
December 31, 2016
at a weighted average price of
$6.67
per share, an aggregate intrinsic value of
$10.8 million
and a weighted-average remaining contractual life of
5.35
years. There were options for
428,112
shares exercisable at
December 31, 2016
at a weighted average exercise price of
$6.61
per share, an aggregate intrinsic value of
$8.9 million
and a weighted-average remaining contractual life of
5.18
years. The aggregate intrinsic value represents the total pretax intrinsic value of in-the-money options, based on the Company’s closing stock price of
$27.30
as of
December 31, 2016
.
During
2016
, the total fair value of options vested was
$0.3 million
; the total intrinsic value of options exercised was
$6.8 million
. The total cash received as a result of employee stock option exercises was
$3.4 million
. The tax benefit realized from these exercises was
$1.7 million
.
Management recognizes compensation costs only for those awards expected to vest. Compensation cost recognized in
2016
,
2015
and
2014
totaled
$58 thousand
,
$142 thousand
and
$452 thousand
, respectively, and the income tax benefit for option-based compensation arrangements recognized in
2016
,
2015
and
2014
was
$23 thousand
,
$29 thousand
and
$78 thousand
, respectively. The total compensation cost related to non-vested options not yet recognized is
$24 thousand
, which will be recognized over a weighted-average period of less than
two
years.
Stock Awards
In February
2014
,
2015
and
2016
, the Company made grants of
135,562
,
79,946
and
71,936
non-vested shares to
22
,
21
and
23
management employees, respectively. The shares vest
25%
annually; however, if an employee reaches the age of
55
, has achieved
10
years of service with the Company and retires, the unvested shares are not forfeited. The awards were valued at the market price of the Company’s common stock on the date of grant (
$13.00
,
$15.01
and
$21.70
per share, respectively). In May 2016, following the acquisition, the Company made additional grants of
12,210
non-vested shares to
six
former nTelos employees valued at
$30.27
, the market price on the date of the grant. The Company also made grants of non-vested shares to the non-employee members of the Company’s Board of Directors. The Company granted
12,304
,
31,984
and
26,790
shares in
2014
,
2015
and
2016
, respectively, valued at the market price of the Company’s common stock on the grant date (
$13.00
,
F-28
$15.01
and
$21.70
per share, respectively). The
2014
shares vest
33%
annually, while the
2015
and
2016
shares fully vest after
one
year.
In April 2016, retirement provisions were added to the director grants that all directors at that time met, eliminating the future service requirement for vesting in the outstanding grants. All unrecognized stock compensation was fully recognized at that time.
In February
2015
and
2016
, the Company made grants of
48,576
and
44,326
, respectively, of non-vested share units to
eight
management employees. These grants were made under a Relative Total Shareholder Return (“RTSR”) plan structure. Under this structure, the Company’s stock performance over an approximate
three
year period ending on December 31 in the third year following the grant, will be compared to a group of peer companies, and a payout will be determined based upon the Company’s performance relative to the performance of the peer groups. The payout could range anywhere from
zero
shares awarded, up to
150%
of the granted share units, or
72,864
and
66,489
shares for
2015
and
2016
. The fair value of the grants for
2015
and
2016
, (
$15.66
and
$24.10
) were determined as of the grant dates using a Monte Carlo simulation. The following assumptions were utilized in the valuations:
|
2015
|
2016
|
|
|
Stock price (closing price on issue date)
|
$15.01
|
$21.70
|
|
Risk-free interest rate (interpolated rate between 2-year and 3-year U.S. treasury rates)
|
0.95%
|
0.89%
|
|
Dividend yield
|
1.57%
|
1.11%
|
|
Performance period
|
2.87 years
|
2.87 years
|
In May
2014
,
2015
and
2016
, the Company made grants of non-vested shares to select other employees. In May
2014
, the Company granted
33,664
shares, of which
9,390
were vested and distributed immediately. In May
2015
, the Company granted
29,752
shares, of which
10,180
were vested and distributed immediately. In May
2016
, the Company granted
17,258
shares, of which
6,984
were vested and distributed immediately. The remaining shares in each award vest in various schedules over
four
years. Beginning with the
2015
shares, if an employee reaches the age of
55
, has achieved
10
years of service with the Company and retires, the unvested shares are not forfeited. The awards were valued at the market price of the Company’s common stock on the date of grant (
$12.83
,
$17.23
and
$31.33
per share in
2014
,
2015
and
2016
, respectively).
A summary of outstanding share grants at
December 31, 2016
,
2015
, and
2014
, and changes during the years ended on those dates, is as follows:
|
|
Shares
|
|
|
|
|
|
|
Outstanding December 31, 2013
|
426,180
|
|
|
|
|
|
|
Granted
|
181,530
|
|
|
Cancelled
|
(10,764
|
)
|
|
Vested and issued
|
(161,674
|
)
|
|
Outstanding December 31, 2014
|
435,272
|
|
|
|
|
|
|
Granted
|
190,258
|
|
|
Cancelled
|
(6,736
|
)
|
|
Vested and issued
|
(211,498
|
)
|
|
Outstanding December 31, 2015
|
407,296
|
|
|
|
|
|
|
Granted
|
172,520
|
|
|
Cancelled
|
(3,537
|
)
|
|
Vested and issued
|
(190,254
|
)
|
|
Outstanding December 31, 2016
|
386,025
|
|
Compensation cost recognized for share awards during
2016
,
2015
and
2014
, was
$3.4 million
,
$2.6 million
and
$2.2 million
, respectively. The income tax benefit for share-based compensation arrangements was
$1.4 million
,
$1.3 million
, and
$0.9 million
for
2016
,
2015
and
2014
, respectively.
F-29
As of
December 31, 2016
, the total compensation cost related to non-vested share awards not yet recognized is
$2.1 million
which will be recognized over a weighted-average period of
2.0
years.
The Company has
one
major customer relationship with Sprint that is a significant source of revenue. Approximately
69%
of total operating revenues for the year ended
December 31, 2016
,
56%
of total operating revenues for the year ended
December 31, 2015
, and
58%
of total operating revenues for the year ended
December 31, 2014
, were generated by or through Sprint and its customers using the Company's portion of Sprint’s nationwide PCS network.
Effective as of February 8, 2008, the Board of Directors adopted a Shareholder Rights Plan (the “Plan”), with a stated expiration date of February 8, 2018. The Plan provided that, under certain circumstances, holders of each right (granted at
one
right per share of outstanding common stock) were entitled to purchase shares of the Company's common stock at a discounted price. The rights were only exercisable if a person or group became or attempted to become the beneficial owner of
15%
or more of the Company's common stock and, under the terms of the Plan, such a person or group would not be entitled to the benefits of the rights. The Plan required a separate Three-year Independent Director Evaluation committee of the Board of Directors (the “TIDE Committee”), comprised of independent directors of the Company, to review and evaluate the Plan at least every
three
years in order to consider whether the Plan continued to be in the best interests of the Company and its shareholders. As a result of the TIDE Committee's review of the Plan in January 2017, and the Committee's subsequent recommendation to the Board of Directors, the Plan was terminated, effective February 28, 2017, prior to its scheduled expiration date of February 8, 2018.
The Company leases land, buildings and tower space under various non-cancelable agreements, which expire between the years 2017 and 2043 and require various minimum annual rental payments. These leases typically include renewal options and escalation clauses. In general, tower leases have
five
or
ten
year initial terms with
four
renewal terms of
five
years each. The other leases generally contain certain renewal options for periods ranging from
five
to
twenty
years. The total number of leases increased significantly with the acquisition of nTelos.
Future minimum lease payments under non-cancelable operating leases, including renewals that are reasonably assured at the inception of the lease, with initial variable lease terms in excess of one year as of
December 31, 2016
, are as follows:
|
Year Ending
|
Amount
|
||
|
|
(in thousands)
|
||
|
2017
|
$
|
49,006
|
|
|
2018
|
48,557
|
|
|
|
2019
|
47,777
|
|
|
|
2020
|
46,908
|
|
|
|
2021
|
46,700
|
|
|
|
2022 and beyond
|
241,840
|
|
|
|
|
$
|
480,788
|
|
The Company’s total rent expense was
$43.8 million
,
$16.9 million
, and
$16.1 million
for the years ended
December 31, 2016
,
2015
and
2014
, respectively.
As lessor, the Company has leased buildings, tower space and telecommunications equipment to other entities under various non-cancelable agreements, which require various minimum annual payments. The total minimum rental receipts at
December 31, 2016
are as follows:
F-30
|
Year Ending
|
Amount
|
||
|
|
(in thousands)
|
||
|
2017
|
$
|
6,044
|
|
|
2018
|
5,724
|
|
|
|
2019
|
5,435
|
|
|
|
2020
|
4,753
|
|
|
|
2021
|
2,708
|
|
|
|
2022 and beyond
|
3,011
|
|
|
|
|
$
|
27,675
|
|
The Company’s total rental income was
$7.2 million
,
$6.3 million
, and
$6.0 million
for the years ended
December 31, 2016
,
2015
and
2014
, respectively. Total rental income includes month-to-month leases which are excluded from the table above.
The Company’s objectives in using interest rate derivatives are to add stability to cash flows and to manage its exposure to interest rate movements. To accomplish this objective, the Company primarily uses interest rate swaps as part of its interest rate risk management strategy. Interest rate swaps (both those designated as cash flow hedges as well as those not designated as cash flow hedges) involve the receipt of variable-rate amounts from a counterparty in exchange for the Company making fixed-rate payments over the life of the agreements without exchange of the underlying notional amount.
The Company entered into a pay fixed, receive variable interest rate swap of
$174.6 million
of initial notional principal in September 2012. This interest rate swap was designated as a cash flow hedge. The outstanding notional amount of this cash flow hedge was
$135.3 million
and
$152.8 million
as of
December 31, 2016
and
2015
, respectively. The outstanding notional amount decreases as the Company makes scheduled principal payments on the debt.
In May 2016, the Company entered into a pay-fixed, receive-variable interest rate swap of $
256.6 million
of notional principal with
three
counterparties. This interest rate swap was designated as a cash flow hedge. The outstanding notional amount of this cash flow hedge was
$301.1 million
as of December 31, 2016. The outstanding notional amount increases with each expected draw on the term debt and decreases as the Company makes scheduled principal payments on the debt. In combination with the swap entered into in 2012 described above, the Company is hedging approximately
50%
of the expected outstanding debt (including expected draws under the delayed draw term loan).
The effective portion of changes in the fair value of interest rate swaps designated and that qualify as cash flow hedges is recorded in accumulated other comprehensive income and is subsequently reclassified into earnings in the period that the hedged forecasted transaction affects earnings. The Company uses its derivatives to hedge the variable cash flows associated with existing variable-rate debt. The ineffective portion of the change in fair value of the derivative is recognized directly in earnings through interest expense. No hedge ineffectiveness was recognized during any of the periods presented.
Amounts reported in accumulated other comprehensive income related to the interest rate swap designated and that qualify as cash flow hedges are reclassified to interest expense as interest payments are accrued on the Company’s variable-rate debt. As of
December 31, 2016
, the Company estimates that
$0.9 million
will be reclassified as an increase to interest expense during the next twelve months due to the interest rate swap since the hedge interest rate exceeds the variable interest rate on the debt.
The table below presents the fair value of the Company’s derivative financial instruments as well as its classification on the consolidated balance sheet as of
December 31, 2016
and
2015
(in thousands):
F-31
|
|
|
Fair Value as of
|
|||||||
|
Balance Sheet
Location
|
December 31,
2016 |
December 31,
2015 |
|||||||
|
Derivatives designated as hedging instruments:
|
|
|
|
|
|
||||
|
Interest rate swaps
|
|
|
|
|
|
||||
|
Accrued liabilities and other
|
$
|
(895
|
)
|
$
|
(682
|
)
|
|||
|
Deferred charges and other assets, net
|
12,118
|
|
1,370
|
|
|||||
|
Total derivatives designated as hedging instruments
|
|
$
|
11,223
|
|
$
|
688
|
|
||
The fair value of interest rate swaps is determined using a pricing model with inputs that are observable in the market (Level 2 fair value inputs).
The table below presents changes in accumulated other comprehensive income by component for the twelve months ended
December 31, 2016
(in thousands):
|
|
Gains on
Cash Flow
Hedges
|
Income Tax
(Expense)
Benefit
|
Accumulated
Other
Comprehensive
Income
|
||||||||
|
Balance as of December 31, 2015
|
$
|
688
|
|
$
|
(273
|
)
|
$
|
415
|
|
||
|
Other comprehensive income before reclassifications
|
8,370
|
|
(3,306
|
)
|
5,064
|
|
|||||
|
Amounts reclassified from accumulated other comprehensive income (to interest expense)
|
2,165
|
|
(856
|
)
|
1,309
|
|
|||||
|
Net current period other comprehensive income (loss)
|
10,535
|
|
(4,162
|
)
|
6,373
|
|
|||||
|
Balance as of December 31, 2016
|
$
|
11,223
|
|
$
|
(4,435
|
)
|
$
|
6,788
|
|
||
|
Note 16.
|
Acquisition of NTELOS Holdings Corp. and Exchange with Sprint
|
On May 6, 2016, the Company completed its previously announced acquisition of NTELOS Holdings Corp. (“nTelos”) for
$667.8 million
, net of cash acquired. The acquisition was entered into to improve shareholder value through the expansion of the Company's wireless service area and customer base while strengthening our relationship with Sprint. The purchase price was financed by a credit facility arranged by CoBank, ACB, Royal Bank of Canada, Fifth Third Bank, Bank of America, N.A., Capital One, National Association, Citizens Bank N.A., and Toronto Dominion (Texas) LLC. The Company has included the operations of nTelos for financial reporting purposes for the period subsequent to the acquisition. The Company has accounted for the acquisition of nTelos under the acquisition method of accounting, in accordance with Financial Accounting Standards Board (“FASB”) Accounting Standards Codification (“ASC”) 805, “Business Combinations”, and will account for any measurement period adjustments under Accounting Standards Update (“ASU”) 2015-16, “Simplifying the Accounting for Measurement Period Adjustments”. Under the acquisition method of accounting, the total purchase price is allocated to the tangible and intangible assets acquired and liabilities assumed in connection with the acquisition based on their estimated fair values.
F-32
The following table shows the initial estimate of value and changes recorded through December 31, 2016 (in thousands):
|
Initial Estimate
|
Revisions
|
Revised Estimate
|
|||||||
|
Accounts receivable
|
$
|
48,476
|
|
$
|
(2,788
|
)
|
$
|
45,688
|
|
|
Inventory
|
3,810
|
|
762
|
|
4,572
|
|
|||
|
Restricted cash
|
2,167
|
|
—
|
|
2,167
|
|
|||
|
Investments
|
1,501
|
|
—
|
|
1,501
|
|
|||
|
Prepaid expenses and other assets
|
14,835
|
|
—
|
|
14,835
|
|
|||
|
Building held for sale
|
4,950
|
|
—
|
|
4,950
|
|
|||
|
Property, plant and equipment
|
223,900
|
|
4,376
|
|
228,276
|
|
|||
|
Spectrum licenses
|
198,200
|
|
—
|
|
198,200
|
|
|||
|
Customer based contract rights
|
198,200
|
|
8,546
|
|
206,746
|
|
|||
|
Favorable lease intangible assets
|
11,000
|
|
6,029
|
|
17,029
|
|
|||
|
Goodwill
|
151,627
|
|
(6,485
|
)
|
145,142
|
|
|||
|
Other long term assets
|
10,288
|
|
555
|
|
10,843
|
|
|||
|
Total assets acquired
|
$
|
868,954
|
|
$
|
10,995
|
|
$
|
879,949
|
|
|
|
|
|
|||||||
|
Accounts payable
|
$
|
8,648
|
|
$
|
(105
|
)
|
$
|
8,543
|
|
|
Advanced billings and customer deposits
|
12,477
|
|
—
|
|
12,477
|
|
|||
|
Accrued expenses
|
25,230
|
|
(345
|
)
|
24,885
|
|
|||
|
Capital lease liability
|
418
|
|
—
|
|
418
|
|
|||
|
Deferred tax liabilities
|
124,964
|
|
1,625
|
|
126,589
|
|
|||
|
Retirement benefits
|
19,461
|
|
(263
|
)
|
19,198
|
|
|||
|
Other long-term liabilities
|
14,056
|
|
6,029
|
|
20,085
|
|
|||
|
Total liabilities assumed
|
205,254
|
|
6,941
|
|
212,195
|
|
|||
|
|
|
|
|||||||
|
Net assets acquired
|
$
|
663,700
|
|
$
|
4,054
|
|
$
|
667,754
|
|
The fair values of the net assets acquired and the liabilities assumed were based on management’s preliminary estimates and assumptions that are subject to change within the purchase price allocation period (generally one year from the acquisition date). While substantially complete, the primary area of the purchase price allocation not yet finalized includes construction in process and income taxes.
Closing on the sale of the former nTelos headquarters building held for sale was completed in the fourth quarter of 2016.
Revisions to the provisional estimates shown above reflect:
|
•
|
revisions to fair value adjustments for financed handset receivables to reflect customer behavior at the time of the acquisition, applied to both the current and long-term portions of these receivables;
|
|
•
|
a reduction in the estimated loss on Android inventory to be sold for salvage post-closing;
|
|
•
|
adjustments to construction materials and inventory, less other fixed assets;
|
|
•
|
an increase to opening taxes receivable based upon completing the 2015 returns
|
|
•
|
the increase in net assets acquired resulting from the settlement of the appraisal rights dispute and an increase in the net debt payoff;
|
|
•
|
reduction in the reserve for health care claims expected to be paid post-closing for medical expenses incurred pre-closing;
|
|
•
|
an adjustment to move unfavorable lease liabilities from assets to other long-term liabilities
|
|
•
|
the value assigned to certain customer based intangibles increased, with an offset to goodwill; and
|
|
•
|
the increase in deferred taxes payable (offset by an increase in goodwill) resulting from several of the changes shown above as well as true-ups in the net tax basis of fixed assets resulting from completion of nTelos' 2015 tax returns.
|
F-33
In addition to the changes in balances reflected above, the Company revised the provisional estimated useful lives of certain assets and recorded an adjustment to depreciation expense of
$4.6 million
relating to the second quarter for these assets.
Concurrently with acquiring nTelos, PCS completed its previously announced transaction with SprintCom, Inc., an affiliate of Sprint Corporation (“Sprint”). Pursuant to this transaction, among other things, the Company exchanged spectrum licenses, valued at
$198.2 million
and customer based contract rights, valued at
$206.7 million
, acquired from nTelos with Sprint, and received an expansion of its affiliate service territory to include most of the service area served by nTelos, valued at
$284.1 million
, as well as additional customer based contract rights, valued at
$120.9 million
, relating to nTelos’ and Sprint’s legacy customers in the Company’s affiliate service territory. These exchanges were accounted for in accordance with ASC 845, “Nonmonetary Transactions”. The transfer of spectrum to Sprint resulted in a taxable gain to the Company which will be recognized as the Company recognizes the cash benefit of the waived management fees over the next approximately
six
years.
The value of the affiliate agreement expansion is based on changes to the amended affiliate agreement that include:
|
•
|
an increase in the price to be paid by Sprint from
80%
to
90%
of the entire business value of PCS if the affiliate agreement is not renewed;
|
|
•
|
extension of the affiliate agreement with Sprint by
five
years to 2029;
|
|
•
|
expanded territory in the nTelos service area;
|
|
•
|
rights to serve all future Sprint customers in the affiliate service territory;
|
|
•
|
the Company’s commitment to upgrade certain coverage and capacity in its newly acquired service area; and
|
|
•
|
a reduction of the management fee charged by Sprint under the amended affiliate agreement; not to exceed
$4.2 million
in an individual month until the total waived fee equals
$251.8 million
, as well as an additional waiver of the management fee charged with respect to the former nTelos customers until the earlier of migration to the Sprint back-office billing and related systems or
six
months following the acquisition; not to exceed
$5.0 million
.
|
Intangible assets resulting from the acquisition of nTelos and the Sprint exchange, both described above, are noted below (dollars in thousands):
|
Useful Life
|
Basis
|
||||
|
Affiliate contract agreement
|
14 years
|
$
|
284,100
|
|
|
|
Customer based contract rights
|
4-10 years
|
120,855
|
|
||
|
Favorable lease intangible assets
|
3-19 years
|
17,029
|
|
||
The affiliate contract agreement intangible asset value was increased by
$29.7 million
during the third quarter of 2016 and reduced by
$3.7 million
during the fourth quarter of 2016, and will be amortized on a straight-line basis and recorded as a contra-revenue over the remaining
14
year initial contract term. The Company recorded an adjustment of
$0.4 million
of additional amortization expense on this asset based on the increase during the third quarter of 2016 that related to the second quarter of 2016, while the fourth quarter decrease resulted in reduced amortization expense of
$0.1 million
in the third quarter of 2016. The favorable lease intangible assets will be amortized on a straight-line basis and recorded through rent expense. The customer based contract rights will be amortized over the life of the customers, gradually decreasing over the expected life of this asset, and recorded through amortization expense. The customer based contract rights value was reduced by
$24.5 million
during the third quarter of 2016, and amortization expense was reduced by
$0.5 million
during the third quarter that related to second quarter 2016. These assets were increased by
$7.1 million
during the fourth quarter of 2016, resulting in additional amortization expense of
$0.3 million
and
$0.4 million
in the second and third quarters, respectively, of 2016. The value of these two assets changed primarily due to the effect on the initial provisional values of where certain cash flows should be reflected in those valuations.
The Company has recorded goodwill in its Wireless segment as a result of the nTelos acquisition. This goodwill is not amortizable for tax purposes, as the Company acquired the common stock of nTelos.
Prior to the acquisition, nTelos was eligible to receive up to
$5.0 million
in connection with its winning bid in the Connect America Fund's Mobility Fund Phase I Auction ("Auction 901"). Pursuant to the terms of Auction 901, nTelos obtained a Letter of Credit (“LOC”) in the amount of
$2.2 million
for the benefit of the Universal Service Administrative Company (“USAC”) to cover each disbursement plus the amount of the performance default penalty (
10%
of the total eligible award). In accordance with the terms of the LOC, nTelos deposited
$2.2 million
into a separate account at the issuing bank to serve as cash collateral and this balance was presented as restricted cash. These funds were released to the Company during the fourth quarter of 2016 when the LOC was terminated.
F-34
Prior to the acquisition, certain third party investors held a non-controlling interest in one of nTelos’ subsidiaries. Concurrently with the acquisition of nTelos, the Company acquired these interests in exchange for
380,000
shares of Company common stock, to be paid in
five
equal installments, with the first installment paid immediately and the remaining
four
to be paid over the next
4
years. This transaction was valued at
$10.4 million
.
In connection with the acquisition, at closing, the Company borrowed
$810.0 million
in term loans with a weighted average effective interest rate of approximately
3.84%
. The proceeds were used to finance in part the acquisition, including the repayment of the Company’s term loan of
$195.5 million
, and the repayment of nTelos’ term loans at the outstanding principal amount of
$521.6 million
, without penalty.
Following are the unaudited pro forma results of the Company for the years ended December 31, 2016 and 2015, as if the acquisition of nTelos had occurred at the beginning of each of the periods presented. (in thousands)
|
|
Years Ended
December 31, |
|||||||
|
|
2016
|
2015
|
||||||
|
Operating revenues
|
$
|
646,769
|
|
$
|
678,475
|
|
||
|
Income before income taxes
|
$
|
2,989
|
|
$
|
54,716
|
|
||
The pro forma disclosures shown above are based upon estimated preliminary valuations of the assets acquired and liabilities assumed as well as preliminary estimates of depreciation and amortization charges thereon, that may differ from the final fair values of the acquired assets and assumed liabilities and the resulting depreciation and amortization charges thereon. Other pro forma adjustments include the following:
|
•
|
changes in nTelos’ reported revenues from cancelling nTelos’ wholesale contract with Sprint;
|
|
•
|
the incorporation of the Sprint-homed customers formerly serviced under the wholesale agreement into the Company’s affiliate service territory under the Company’s affiliate agreement with Sprint;
|
|
•
|
the effect of other changes to revenues and expenses due to various provisions of the affiliate agreement, including fees charged under the affiliate agreement on revenues from former nTelos customers, a reduction of the net service fee charged by Sprint, the straight-line impact of the waived management fee, and the amortization of the affiliate agreement expansion intangible asset; and the elimination of non-recurring transaction related expenses incurred by the Company and nTelos;
|
|
•
|
the elimination of certain nTelos operating costs associated with billing and care that are covered under the fees charged by Sprint under the affiliate agreement;
|
|
•
|
historical depreciation expense was reduced for the fair value adjustment decreasing the basis of property, plant and equipment; this decrease was offset by a shorter estimated useful life to conform to the Company’s standard policy and the acceleration of depreciation on certain equipment; and
|
|
•
|
incremental amortization due to the customer-based contract rights associated with acquired customers.
|
In connection with these transactions, the Company chose to proactively migrate the former nTelos customers to devices which can interact with the Sprint billing and network systems, and expects to incur a total of approximately
$90 million
of integration and acquisition expenses associated with this transaction, excluding approximately
$23 million
of debt issuance costs. These costs include the nTelos back office staff and support functions until the nTelos legacy customers are migrated to the Sprint billing platform; costs of the handsets to be provided to nTelos legacy customers as they migrate to the Sprint billing platform; severance costs for back office and other former nTelos employees who will not be retained permanently; transaction related fees; net of proceeds from the sale of the former nTelos headquarters building. We have incurred
$54.7 million
of these costs in the year ended December 31, 2016, including
$1.3 million
reflected in cost of goods and services and
$11.1 million
reflected in selling, general and administrative costs in the year ended December 31, 2016.
The amounts of operating revenue and income or loss before income taxes related to the former nTelos entity are not readily determinable due to intercompany transactions, allocations and integration activities that have occurred in connection with the operations of the combined company.
F-35
Operating segments are defined as components of an enterprise about which separate financial information is available that is evaluated regularly by the chief operating decision maker. The Company has
three
reportable segments, which the Company operates and manages as strategic business units organized by lines of business: (1) Wireless, (2) Cable, and (3) Wireline. A fourth segment, Other, primarily includes Shenandoah Telecommunications Company, the parent holding company.
The Wireless segment had provided digital wireless service to a portion of a
four
-state area covering the region from Harrisburg, York and Altoona, Pennsylvania, to Harrisonburg, Virginia, as a Sprint PCS Affiliate. With the recent acquisition of nTelos, the Company's wireless service has expanded to include south-central and western Virginia, West Virginia, and small portions of Kentucky and Ohio. This segment also owns cell site towers built on leased land, and leases space on these towers to both affiliates and non-affiliated service providers.
The Cable segment provides video, internet and voice services in Virginia, West Virginia and Maryland, and leases fiber optic facilities throughout southern Virginia and West Virginia. It does not include video, internet and voice services provided to customers in Shenandoah County, Virginia.
The Wireline segment provides regulated and unregulated voice services, DSL internet access, and long distance access services throughout Shenandoah County and portions of Rockingham, Frederick, Warren and Augusta counties, Virginia. The segment also provides video and cable modem services in portions of Shenandoah County, and leases fiber optic facilities throughout the northern Shenandoah Valley of Virginia, northern Virginia and adjacent areas along the Interstate 81 corridor through West Virginia, Maryland and portions of central and southern Pennsylvania.
Year ended
December 31, 2016
(In thousands)
|
Wireless
|
Cable
|
Wireline
|
Other
|
Eliminations
|
Consolidated
Totals
|
|||||||||||||
|
External revenues
|
|
|
|
|
|
|
||||||||||||
|
Service revenues
|
$
|
359,769
|
|
$
|
99,070
|
|
$
|
19,646
|
|
—
|
|
—
|
|
$
|
478,485
|
|
||
|
Other revenues
|
24,364
|
|
7,927
|
|
24,512
|
|
—
|
|
—
|
|
56,803
|
|
||||||
|
Total external revenues
|
384,133
|
|
106,997
|
|
44,158
|
|
—
|
|
—
|
|
535,288
|
|
||||||
|
Internal revenues
|
4,620
|
|
1,737
|
|
30,816
|
|
—
|
|
(37,173
|
)
|
—
|
|
||||||
|
Total operating revenues
|
388,753
|
|
108,734
|
|
74,974
|
|
—
|
|
(37,173
|
)
|
535,288
|
|
||||||
|
Operating expenses
|
|
|
|
|
|
|
|
|
|
|
|
|
||||||
|
Costs of goods and services, exclusive of depreciation and amortization shown separately below
|
133,113
|
|
58,581
|
|
36,259
|
|
—
|
|
(34,433
|
)
|
193,520
|
|
||||||
|
Selling, general and administrative, exclusive of depreciation and amortization shown below
|
95,851
|
|
19,248
|
|
6,474
|
|
14,492
|
|
(2,740
|
)
|
133,325
|
|
||||||
|
Integration and acquisition expenses
|
25,927
|
|
—
|
|
—
|
|
16,305
|
|
—
|
|
42,232
|
|
||||||
|
Depreciation and amortization
|
107,621
|
|
23,908
|
|
11,717
|
|
439
|
|
—
|
|
143,685
|
|
||||||
|
Total operating expenses
|
362,512
|
|
101,737
|
|
54,450
|
|
31,236
|
|
(37,173
|
)
|
512,762
|
|
||||||
|
Operating income (loss)
|
$
|
26,241
|
|
$
|
6,997
|
|
$
|
20,524
|
|
$
|
(31,236
|
)
|
$
|
—
|
|
$
|
22,526
|
|
F-36
Year ended
December 31, 2015
(In thousands)
|
Wireless
|
Cable
|
Wireline
|
Other
|
Eliminations
|
Consolidated
Totals
|
|||||||||||||
|
External revenues
|
|
|
|
|
|
|
|
|
|
|
|
|
||||||
|
Service revenues
|
$
|
192,752
|
|
$
|
88,980
|
|
$
|
19,386
|
|
—
|
|
—
|
|
$
|
301,118
|
|
||
|
Other revenues
|
11,609
|
|
7,793
|
|
21,965
|
|
—
|
|
—
|
|
41,367
|
|
||||||
|
Total external revenues
|
204,361
|
|
96,773
|
|
41,351
|
|
—
|
|
—
|
|
342,485
|
|
||||||
|
Internal revenues
|
4,440
|
|
849
|
|
26,069
|
|
—
|
|
(31,358
|
)
|
—
|
|
||||||
|
Total operating revenues
|
208,801
|
|
97,622
|
|
67,420
|
|
—
|
|
(31,358
|
)
|
342,485
|
|
||||||
|
Operating expenses
|
|
|
|
|
|
|
|
|
|
|
|
|
||||||
|
Costs of goods and services, exclusive of depreciation and amortization shown separately below
|
63,570
|
|
54,611
|
|
31,668
|
|
—
|
|
(28,519
|
)
|
121,330
|
|
||||||
|
Selling, general and administrative, exclusive of depreciation and amortization shown below
|
35,792
|
|
19,412
|
|
6,612
|
|
13,844
|
|
(2,839
|
)
|
72,821
|
|
||||||
|
Integration and acquisition expenses
|
—
|
|
—
|
|
—
|
|
3,546
|
|
—
|
|
3,546
|
|
||||||
|
Depreciation and amortization
|
34,416
|
|
23,097
|
|
12,736
|
|
453
|
|
—
|
|
70,702
|
|
||||||
|
Total operating expenses
|
133,778
|
|
97,120
|
|
51,016
|
|
17,843
|
|
(31,358
|
)
|
268,399
|
|
||||||
|
Operating income (loss)
|
$
|
75,023
|
|
$
|
502
|
|
$
|
16,404
|
|
$
|
(17,843
|
)
|
$
|
—
|
|
$
|
74,086
|
|
Year ended
December 31, 2014
(In thousands)
|
|
Wireless
|
Cable
|
Wireline
|
Other
|
Eliminations
|
Consolidated
Totals
|
||||||||||||
|
External revenues
|
|
|
|
|
|
|
||||||||||||
|
Service revenues
|
$
|
191,147
|
|
$
|
77,179
|
|
$
|
18,919
|
|
—
|
|
—
|
|
$
|
287,245
|
|
||
|
Other revenues
|
11,867
|
|
7,224
|
|
20,610
|
|
—
|
|
—
|
|
39,701
|
|
||||||
|
Total external revenues
|
203,014
|
|
84,403
|
|
39,529
|
|
—
|
|
—
|
|
326,946
|
|
||||||
|
Internal revenues
|
4,440
|
|
150
|
|
23,506
|
|
—
|
|
(28,096
|
)
|
—
|
|
||||||
|
Total operating revenues
|
207,454
|
|
84,553
|
|
63,035
|
|
—
|
|
(28,096
|
)
|
326,946
|
|
||||||
|
Operating expenses
|
|
|
|
|
|
|
|
|
|
|
|
|
||||||
|
Costs of goods and services, exclusive of depreciation and amortization shown separately below
|
73,290
|
|
51,982
|
|
30,088
|
|
—
|
|
(25,617
|
)
|
129,743
|
|
||||||
|
Selling, general and administrative, exclusive of depreciation and amortization shown below
|
33,171
|
|
19,521
|
|
6,009
|
|
13,148
|
|
(2,479
|
)
|
69,370
|
|
||||||
|
Depreciation and amortization
|
31,111
|
|
23,148
|
|
11,224
|
|
407
|
|
—
|
|
65,890
|
|
||||||
|
Total operating expenses
|
137,572
|
|
94,651
|
|
47,321
|
|
13,555
|
|
(28,096
|
)
|
265,003
|
|
||||||
|
Operating income (loss)
|
$
|
69,882
|
|
$
|
(10,098
|
)
|
$
|
15,714
|
|
$
|
(13,555
|
)
|
$
|
—
|
|
$
|
61,943
|
|
F-37
A reconciliation of the total of the reportable segments’ operating income to consolidated income from continuing operations before income taxes is as follows:
|
|
Years Ended December 31,
|
||||||||
|
(In thousands)
|
2016
|
2015
|
2014
|
||||||
|
Total consolidated operating income
|
$
|
22,526
|
|
$
|
74,086
|
|
$
|
61,943
|
|
|
Interest expense
|
(25,102
|
)
|
(7,355
|
)
|
(8,148
|
)
|
|||
|
Non-operating income, net
|
4,521
|
|
1,859
|
|
2,239
|
|
|||
|
Income from continuing operations before income taxes
|
$
|
1,945
|
|
$
|
68,590
|
|
$
|
56,034
|
|
The Company’s assets by segment are as follows:
(In thousands)
|
|
December 31,
2016 |
December 31,
2015 |
||||
|
Wireless
|
$
|
1,101,716
|
|
$
|
205,718
|
|
|
Cable
|
218,471
|
|
209,132
|
|
||
|
Wireline
|
115,282
|
|
105,369
|
|
||
|
Other
|
1,059,898
|
|
463,390
|
|
||
|
Combined totals
|
2,495,367
|
|
983,609
|
|
||
|
Inter-segment eliminations
|
(1,010,960
|
)
|
(356,458
|
)
|
||
|
Consolidated totals
|
$
|
1,484,407
|
|
$
|
627,151
|
|
The following table shows selected quarterly results for the Company.
(in thousands except per share data)
|
For the year ended December 31, 2016
|
First
|
|
Second
|
|
Third
|
|
Fourth
|
|
Total
|
|
|||||
|
Operating revenues
|
$
|
92,571
|
|
$
|
130,309
|
|
$
|
156,836
|
|
$
|
155,572
|
|
$
|
535,288
|
|
|
Operating income (loss)
|
21,312
|
|
(7,046
|
)
|
(3,929
|
)
|
12,189
|
|
22,526
|
|
|||||
|
Net income (loss)
|
13,880
|
|
(6,995
|
)
|
(7,596
|
)
|
(184
|
)
|
(895
|
)
|
|||||
|
Net income (loss) per share – basic
|
0.29
|
|
(0.14
|
)
|
(0.16
|
)
|
0.00
|
|
(0.02
|
)
|
|||||
|
Net income (loss) per share – diluted
|
0.28
|
|
(0.14
|
)
|
(0.16
|
)
|
0.00
|
|
(0.02
|
)
|
|||||
|
For the year ended December 31, 2015
|
First
|
|
Second
|
|
Third
|
|
Fourth
|
|
Total
|
|
|||||
|
Operating revenues
|
$
|
84,287
|
|
$
|
85,701
|
|
$
|
85,212
|
|
$
|
87,285
|
|
$
|
342,485
|
|
|
Operating income
|
18,526
|
|
18,750
|
|
15,089
|
|
21,721
|
|
74,086
|
|
|||||
|
Net income
|
10,286
|
|
10,474
|
|
7,996
|
|
12,108
|
|
40,864
|
|
|||||
|
Net income per share - basic
|
0.21
|
|
0.22
|
|
0.17
|
|
0.24
|
|
0.84
|
|
|||||
|
Net income per share - diluted
|
0.21
|
|
0.21
|
|
0.17
|
|
0.24
|
|
0.83
|
|
|||||
F-38
On March 9, 2017, the Company and Sprint entered into Addendum XX to the Sprint PCS Management Agreement. Addendum XX provides for (i) an expansion of the Company’s “Service Area” (as defined in the Sprint PCS Management Agreement) to include certain areas in Kentucky, Maryland, Ohio and West Virginia (the “
Expansion Area
”), (ii) certain network build out requirements in the Expansion Area over the next three years, (iii) the Company’s provision of prepaid field sales support to Sprint and its affiliates in the Service Area, (iv) Sprint’s provision of spectrum use to the Company in the Expansion Area, (v) the addition of Horizon as a party to the Sprint PCS Management Agreement and the Sprint PCS Services Agreement (collectively, the “
Affiliate Agreements
”) and (vi) certain other amendments to the Affiliate Agreements.
In connection with the execution of Addendum XX, on March 9, 2017, the Company and Sprint entered into an agreement to, among other things, transfer to Sprint certain customers in the Expansion Area and the underlying customer agreements and transition the provision of network coverage in the Expansion Area from Sprint to the Company. The completion of the transfer of customers in the Expansion Area is expected to occur during the second quarter of 2017.
F-39
Exhibits Index
|
Exhibit
Number
|
Exhibit Description
|
|
|
|
|
2.1
|
Agreement and Plan of Merger, dated as of August 10, 2015, by and among Shenandoah Telecommunications Company, Gridiron Merger Sub, Inc. and NTELOS Holdings Corp., filed as Exhibit 2.1 to the Company’s Current Report on Form 8-K, dated August 11, 2015.
|
|
|
|
|
3.1
|
Amended and Restated Articles of Incorporation of Shenandoah Telecommunications Company filed as Exhibit 3.1 to the Company’s Quarterly Report on Form 10-Q for the period ending June 30, 2007, as amended by the Articles of Amendment of Shenandoah Telecommunications Company filed as Exhibit 3.3 to the Company’s Current Report on Form 8-K , filed January 5, 2016.
|
|
|
|
|
3.2
|
Amended and Restated Bylaws of Shenandoah Telecommunications Company, effective July 18, 2016, filed as Exhibit 3.1 to the Company’s Current Report on Form 8-K dated July 16, 2016.
|
|
|
|
|
4.1
|
Rights Agreement, dated as of February 8, 2008 between the Company and American Stock Transfer & Trust Company filed as Exhibit 4.1 to the Company's Current Report on Form 8-K, dated January 25, 2008.
|
|
|
|
|
4.2
|
Specimen representing the Common Stock, no par value, of Shenandoah Telecommunications Company, filed as Exhibit 4.3 to the Company’s Report on Form 10-K for the year ended December 31, 2007.
|
|
|
|
|
10.1
|
Shenandoah Telecommunications Company Dividend Reinvestment Plan filed as Exhibit 4.4 to the Company’s Registration Statement on Form S-3D (No. 333-74297).
|
|
|
|
|
10.2
|
Settlement Agreement and Mutual Release dated as of January 30, 2004 by and among Sprint Spectrum L.P., Sprint Communications Company L.P., WirelessCo, L.P., APC PCS, LLC, PhillieCo, L.P. and Shenandoah Personal Communications Company and Shenandoah Telecommunications Company, dated January 30, 2004; filed as Exhibit 10.3 to the Company’s Report on Form 10-K for the year ended December 31, 2003.
|
|
|
|
|
10.3
|
Sprint PCS Management Agreement dated as of November 5, 1999 by and among Sprint Spectrum L.P., WirelessCo, L.P., APC PCS, LLC, PhillieCo, L.P., and Shenandoah Personal Communications Company filed as Exhibit 10.4 to the Company’s Report on Form 10-K for the year ended December 31, 2003.
|
|
|
|
|
10.4
|
Sprint PCS Services Agreement dated as of November 5, 1999 by and between Sprint Spectrum L.P. and Shenandoah Personal Communications Company filed as Exhibit 10.5 to the Company’s Report on Form 10-K for the year ended December 31, 2003.
|
|
|
|
|
10.5
|
Sprint Trademark and Service Mark License Agreement dated as of November 5, 1999 by and between Sprint Communications Company, L.P. and Shenandoah Personal Communications Company filed as Exhibit 10.6 to the Company’s Report on Form 10-K for the year ended December 31, 2003.
|
|
10.6
|
Sprint Spectrum Trademark and Service Mark License Agreement dated as of November 5, 1999 by and between Sprint Spectrum L.P. and Shenandoah Personal Communications Company filed as Exhibit 10.7 to the Company’s Report on Form 10-K for the year ended December 31, 2003.
|
|
|
|
|
10.7
|
Addendum I to Sprint PCS Management Agreement
by and among Sprint Spectrum L.P., WirelessCo, L.P., APC PCS, LLC, PhillieCo, L.P., and Shenandoah Personal Communications Company filed as Exhibit 10.8 to the Company’s Report on Form 10-K for the year ended December 31, 2003.
|
|
|
|
|
10.8
|
Asset Purchase Agreement dated November 5, 1999 by and among Sprint Spectrum L.P., Sprint Spectrum Equipment Company, L. P., Sprint Spectrum Realty Company, L.P., and Shenandoah Personal Communications Company, serving as Exhibit A to Addendum I to the Sprint PCS Management Agreement and as Exhibit 2.6 to the Sprint PCS Management Agreement filed as Exhibit 10.9 to the Company’s Report on Form 10-K for the year ended December 31, 2003.
|
|
|
|
|
10.9
|
Addendum II dated August 31, 2000 to Sprint PCS Management Agreement by and among Sprint Spectrum L.P., WirelessCo, L.P., APC PCS, LLC, PhillieCo, L.P., and Shenandoah Personal Communications Company filed as Exhibit 10.10 to the Company’s Report on Form 10-K for the year ended December 31, 2003.
|
|
|
|
|
10.10
|
Addendum III dated September 26, 2001 to Sprint PCS Management Agreement by and among Sprint Spectrum L.P., WirelessCo, L.P., APC PCS, LLC, PhillieCo, L.P., and Shenandoah Personal Communications Company filed as Exhibit 10.11 to the Company’s Report on Form 10-K for the year ended December 31, 2003.
|
|
|
|
|
10.11
|
Addendum IV dated May 22, 2003 to Sprint PCS Management Agreement by and among Sprint Spectrum L.P., WirelessCo, L.P., APC PCS, LLC, PhillieCo, L.P., and Shenandoah Personal Communications Company filed as Exhibit 10.12 to the Company’s Report on Form 10-K for the year ended December 31, 2003.
|
|
|
|
|
10.12
|
Addendum V dated January 30, 2004 to Sprint PCS Management Agreement by and among Sprint Spectrum L.P., WirelessCo, L.P., APC PCS, LLC, PhillieCo, L.P., and Shenandoah Personal Communications Company filed as Exhibit 10.13 to the Company’s Report on Form 10-K for the year ended December 31, 2003.
|
|
|
|
|
10.13
|
Supplemental Executive Retirement Plan as amended and restated, filed as Exhibit 10.14 to the Company’s Current Report on Form 8-K dated March 23, 2007.
|
|
|
|
|
10.14
|
Addendum VI dated May 24, 2004 to Sprint PCS Management Agreement by and among Sprint Spectrum L.P., WirelessCo, L.P., APC PCS, LLC, PhillieCo, L.P., and Shenandoah Personal Communications Company filed as Exhibit 10.15 to the Company’s Report on Form 10-Q for the quarterly period ended June 30, 2004.
|
|
|
|
|
10.15
|
Description of the Shenandoah Telecommunications Company Incentive Plan filed as Exhibit 10.25 to the Company’s Current Report on Form 8-K dated January 21, 2005.
|
|
|
|
|
10.16
|
Description of Compensation of Non-Employee Directors. Filed as Exhibit 10.26 to the Company’s Current Report on Form 8-K dated May 4, 2005.
|
|
10.17
|
Description of Management Compensatory Plans and Arrangements. Filed as Exhibit 10.27 to the Company’s current report on Form 8-K dated April 20, 2005.
|
|
|
|
|
10.18
|
2005 Stock Incentive Plan filed as Exhibit 10.1 to the Company’s Registration Statement on Form S-8 (No. 333-127342).
|
|
|
|
|
10.19
|
Form of Incentive Stock Option Agreement under the 2005 Stock Incentive Plan filed as Exhibit 10.29 to the Company’s Report on Form 10-K for the year ended December 31, 2005.
|
|
|
|
|
10.20
|
Addendum VII dated March 13, 2007 to Sprint PCS Management Agreement by and among Sprint Spectrum L.P., Wireless Co., L.P., APC PCS, LLC, Phillieco, L.P., and Shenandoah Personal Communications Company, filed as Exhibit 10.31 to the Company’s Report on Form 10-K for the year ended December 31, 2006.
|
|
|
|
|
10.21
|
Settlement Agreement and Mutual Release dated March 13, 2007 by and among Sprint Corporation, Sprint Spectrum L.P., Wireless Co., L.P., Sprint Communications Company L.P., APC PCS, LLC, Phillieco, L.P., and Shenandoah Personal Communications Company and Shenandoah Telecommunications, filed as Exhibit 10.32 to the Company’s Report on Form 10-K for the year ended December 31, 2006.
|
|
|
|
|
10.22
|
Form of Performance Share Award to Executives filed as Exhibit 10.33 to the Company’s Current Report on Form 8-K dated September 20, 2007.
|
|
|
|
|
10.23
|
Addendum VIII to the Sprint Management Agreement dated November 19, 2007, filed as Exhibit 10.36 to the Company’s Current Report on Form 8-K dated November 20, 2007.
|
|
|
|
|
10.24
|
Asset Purchase Agreement dated August 6, 2008, between Rapid Communications, LLC, Rapid Acquisition Company, LLC, and Shentel Cable Company, filed as Exhibit 10.37 to the Company’s Report on Form 10-Q for the period ended June 30, 2008.
|
|
|
|
|
10.25
|
Amendment Number 1 to the Asset Purchase Agreement dated August 6, 2008, between Rapid Communications, LLC, Rapid Acquisition Company, LLC, and Shentel Cable Company, filed as Exhibit 10.40 to the Company’s Current Report on Form 8-K dated November 7, 2008.
|
|
|
|
|
10.26
|
Addendum IX to the Sprint Management Agreement dated as of April 14, 2009, and filed as Exhibit 10.42 to the Company’s Annual Report on Form 10-K dated March 8, 2010.
|
|
|
|
|
10.27
|
Asset Purchase Agreement dated as of April 16, 2010, between JetBroadband VA, LLC, Helicon Cable Communications, LLC, JetBroadband WV, LLC, JetBroadband Holdings, LLC, Helicon Cable Holdings, LLC, Shentel Cable Company and Shenandoah Telecommunications Company, filed as Exhibit 10.43 to the Company’s Current Report on Form 8-K, dated April 16, 2010.
|
|
|
|
|
10.28
|
Addendum X dated March 15, 2010 to Sprint PCS Management Agreement by and among Sprint Spectrum L.P., WirelessCo, L.P., APC PCS, LLC, PhillieCo, L.P., Sprint Communications Company L.P. and Shenandoah Personal Communications Company, filed as Exhibit 10.44 to the Company’s Current Report on Form 10-Q, dated May 7, 2010.
|
|
10.29
|
Addendum XI dated July 7, 2010 to Sprint PCS Management Agreement by and among Sprint Spectrum L.P., WirelessCo, L.P., APC PCS, LLC, PhillieCo, L.P., Sprint Communications Company L.P. and Shenandoah Personal Communications Company, filed as Exhibit 10.45 to the Company’s Current Report on Form 8-K dated July 8, 2010.
|
|
|
|
|
10.30
|
Credit Agreement dated as of July 30, 2010, among Shenandoah Telecommunications Company, CoBank, ACB, Branch Banking and Trust Company, Wells Fargo Bank, N.A., and other Lenders, filed as Exhibit 10.46 to the Company’s Current Report on Form 8-K dated July 30, 2010.
|
|
|
|
|
10.31
|
Second Amendment to the Credit Agreement dated as of July 30, 2010, among Shenandoah Telecommunications Company, CoBank, ACB, Branch Banking and Trust Company, Wells Fargo Bank, N.A., and other Lenders, filed as Exhibit 10.47 to the Company’s Current Report on Form 8-K dated April 29, 2011.
|
|
|
|
|
10.32
|
Third Amendment to the Credit Agreement dated as of July 30, 2010, among Shenandoah Telecommunications Company, CoBank, ACB, Branch Banking and Trust Company, Wells Fargo Bank, N.A., and other Lenders, filed as Exhibit 10.48 to the Company’s Quarterly Report on Form 10-Q dated August 8, 2011.
|
|
|
|
|
10.33
|
Letter Agreement modifying section 10.2.7.2 of Addendum X dated March 15, 2010 to Sprint PCS Management Agreement by and among Sprint Spectrum L.P., WirelessCo, L.P., APC PCS, LLC, PhillieCo, L.P., Sprint Communications Company L.P. and Shenandoah Personal Communications Company, filed as Exhibit 10.49 to the Company’s Quarterly Report on Form 10-Q dated August 8, 2011.
|
|
|
|
|
10.34
|
Fourth Amendment to the Credit Agreement dated as of July 30, 2010, among Shenandoah Telecommunications Company, CoBank, ACB, Branch Banking and Trust Company, Wells Fargo Bank, N.A., and other Lenders, filed as Exhibit 10.50 to the Company’s Quarterly Report on Form 10-Q dated August 8, 2011.
|
|
|
|
|
10.35
|
Addendum XII dated February 1, 2012 to Sprint PCS Management Agreement by and among Sprint Spectrum L.P., WirelessCo, L.P., APC PCS, LLC, PhillieCo, L.P., Sprint Communications Company L.P. and Shenandoah Personal Communications Company, filed as Exhibit 10.51 to the Company’s Current Report on Form 8-K dated February 2, 2012.
|
|
|
|
|
10.36
|
Fifth Amendment to the Credit Agreement dated as of July 30, 2010, among Shenandoah Telecommunications Company, CoBank, ACB, Branch Banking and Trust Company, Wells Fargo Bank, N.A., and other Lenders, filed as Exhibit 10.52 to the Company’s Current Report on Form 8-K dated February 2, 2012.
|
|
|
|
|
10.37
|
Addendum XIII dated September 14, 2012 to Sprint PCS Management Agreement by and among Sprint Spectrum L.P., WirelessCo, L.P., APC PCS, LLC, PhillieCo, L.P., Sprint Communications Company L.P. and Shenandoah Personal Communications, LLC, filed as Exhibit 10.53 to the Company’s Current Report on Form 8-K dated September 17, 2012.
|
|
|
|
|
10.38
|
Consent and Agreement dated September 14, 2012 related to Sprint PCS Management Agreement by and among Sprint Spectrum L.P., WirelessCo, L.P., APC PCS, LLC, PhillieCo, L.P., Sprint Communications Company L.P. and Shenandoah Personal Communications, LLC, filed as Exhibit 10.54 to the Company’s Current Report on Form 8-K dated September 17, 2012.
|
|
10.39
|
Amended and Restated Credit Agreement dated as of September 14, 2012, among Shenandoah Telecommunications Company, CoBank, ACB, and other Lenders, filed as Exhibit 10.55 to the Company’s Current Report on Form 8-K dated September 17, 2012.
|
|
|
|
|
10.40
|
Addendum XIV dated as of November 19, 2012, to Sprint PCS Management Agreement by and among Sprint Spectrum L.P., WirelessCo, L.P., APC PCS, LLC, PhillieCo, L.P., Sprint Communications Company L.P. and Shenandoah Personal Communications, LLC, filed as Exhibit 10.42 to the Company’s Annual Report on Form 10-K dated March 5, 2013.
|
|
|
|
|
10.41
|
Addendum XV dated as of March 11, 2013, to Sprint PCS Management Agreement by and among Sprint Spectrum, L.P., WirelessCo, L.P., APC PCS, LLC, PhillieCo, L.P., Sprint Communications Company L.P. and Shenandoah Personal communications, LLC, filed as Exhibit 10.43 to the Company’s Quarterly Report on Form 10-Q dated May 3, 2013.
|
|
|
|
|
10.42
|
First Amendment dated January 30, 2014, to the Amended and Restated Credit Agreement among Shenandoah Telecommunications Company, CoBank, ACB, and other Lenders, filed as Exhibit 10.43 to the Company’s Quarterly Report on Form 10-Q dated May 2, 2014.
|
|
|
|
|
10.43
|
Joinder Agreement dated January 30, 2014, to the Amended and Restated Credit Agreement among Shenandoah Telecommunications Company, CoBank, ACB, and other Lenders, filed as Exhibit 10.44 to the Company’s Quarterly Report on Form 10-Q dated May 2, 2014.
|
|
|
|
|
10.44
|
Addendum XVI dated as of December 9, 2013 to Sprint PCS Management Agreement by and among Sprint Spectrum, L.P., WirelessCo, L.P., APC PCS, LLC, PhillieCo, L.P., Sprint Communications Company L.P. and Shenandoah Personal Communications, LLC, filed as Exhibit 10.45 to the Company’s Quarterly Report on Form 10-Q dated May 2, 2014.
|
|
|
|
|
10.45
|
Addendum XVII dated as of April 11, 2014, to Sprint PCS Management Agreement by and among Sprint Spectrum, L.P., WirelessCo, L.P., APC PCS, LLC, PhillieCo, L.P., Sprint Communications Company L.P. and Shenandoah Personal Communications, LLC, filed as Exhibit 10.46 to the Company’s Quarterly Report on Form 10-Q dated May 2, 2014.
|
|
|
|
|
10.46
|
2014 Equity Incentive Plan filed as Appendix A to the Company’s Definitive Proxy Statement filed on March 13, 2014 (No. 333-196990).
|
|
|
|
|
10.47
|
Master Agreement dated as of August 10, 2015, by and among SprintCom, Inc. and Shenandoah Personal Communications, LLC, filed as Exhibit 10.1 to the Company’s Current Report on Form 8-K dated August 11, 2015.
|
|
|
|
|
10.48
|
Addendum XVIII dated as of August 10, 2015, to Sprint PCS Management Agreement by and among SprintCom, Inc., PhillieCo, L.P., and Shenandoah Personal Communications, LLC, filed as Exhibit 10.2 to the Company’s Current Report on Form 8-K, dated August 11, 2015.
|
|
|
|
|
10.49
|
Credit Agreement dated as of December 18, 2015, by and among Shenandoah Telecommunications Company, as Borrower, the guarantors party thereto from time to time, CoBank, ACB, as Administrative Agent, and various other agents and lenders named therein, filed as Exhibit 10.1 to the Company’s Current Report on Form 8-K, dated December 24, 2015.
|
|
|
|
|
10.50
|
First amendment to Credit Agreement, dated as of March 29, 2016, by and among Shenandoah Telecommunications Company, as Borrower, CoBank, ACB, as Administrative Agent, and various other lenders named therein, filed as Exhibit 10.1 to the Company's Current Report on Form 8-K, dated March 29, 2016.
|
|
10.51
|
Amended and Restated Master Agreement, dated as of May 6, 2016, by and between Shenandoah Personal Communications, LLC and SprintCom, Inc, filed as Exhibit 10.1 to the Company's Current Report on Form 8-K, dated May 6, 2016.
|
|
10.52
|
Addendum XIX to Sprint PCS Management Agreement, dated as of May 6, 2016, by and among Sprint Spectrum L.P., WirelessCo, LLC, APC PCS, LLC, PhillieCo, LLC, Sprint Communications Company L.P., Shenandoah Personal Communications, LLC and SprintCom, Inc, filed as Exhibit 10.2 to the Company's Current Report on Form 8-K, dated May 6, 2016.
|
|
10.53
|
Consent and Agreement, dated as of May 6, 2016, by and among Sprint Spectrum L.P., WirelessCo, LLC, APC PCS, LLC, PhillieCo, LLC, Sprint Communications Company L.P., Shenandoah Personal Communications, LLC and SprintCom, Inc. and CoBank, ACB, filed as Exhibit 10.3 to the Company's Current Report on Form 8-K, dated May 6, 2016.
|
|
*21
|
List of Subsidiaries.
|
|
*23.1
|
Consent of KPMG LLP, Independent Registered Public Accounting Firm.
|
|
|
|
|
Certification of President and Chief Executive Officer of Shenandoah Telecommunications Company pursuant to Rule 13a-14(a)under the Securities Exchange Act of 1934.
|
|
|
|
|
|
Certification of Vice President and Chief Financial Officer of Shenandoah Telecommunications Company pursuant to Rule 13a-14(a)under the Securities Exchange Act of 1934.
|
|
|
|
|
|
Certifications pursuant to Rule 13a-14(b) under the Securities Exchange Act of 1934 and 18 U.S.C. § 1350.
|
|
|
|
|
|
(101)
|
Formatted in XBRL (Extensible Business Reporting Language)
|
|
|
101.INS
|
XBRL Instance Document
|
|
|
|
|
|
|
101.SCH
|
XBRL Taxonomy Extension Schema Document
|
|
|
|
|
|
|
101.CAL
|
XBRL Taxonomy Extension Calculation Linkbase Document
|
|
|
|
|
|
|
101.DEF
|
XBRL Taxonomy Extension Definition Linkbase Document
|
|
|
|
|
|
|
101.LAB
|
XBRL Taxonomy Extension Label Linkbase Document
|
|
|
|
|
|
|
101.PRE
|
XBRL Taxonomy Extension Presentation Linkbase Document
|
* Filed herewith.
TABLE OF CONTENTS
Part IItem 1. BusinessItem 1A. Risk FactorsItem 1B. Unresolved Staff CommentsItem 2. PropertiesItem 3. Legal ProceedingsItem 4. Mine Safety DisclosuresPart IIItem 5. Market For The Registrant's Common Equity, Related Stockholder Matters and Issuer Purchases Of Equity SecuritiesItem 6. Selected Financial DataItem 7. Management's Discussion and Analysis Of Financial Condition and Results Of OperationsItem 7A. Quantitative and Qualitative Disclosures About Market RiskItem 8. Financial Statements and Supplementary DataItem 9. Changes in and Disagreements with Accountants on Accounting and Financial DisclosureItem 9A. Controls and ProceduresItem 9B. Other InformationPart IIIItem 10. Directors, Executive Officers and Corporate GovernanceItem 11. Executive CompensationItem 12. Security Ownership Of Certain Beneficial Owners and Management and Related Stockholder MattersItem 13. Certain Relationships, Related Transactions and Director IndependenceItem 14. Principal Accounting Fees and ServicesPart IVItem 15. Exhibits and Financial Statement SchedulesItem 16. Form 10-k SummmaryNote 1. Description Of Business and Summary Of Significant Accounting PoliciesNote 2. Equipment Installment Plan ReceivablesNote 3. InvestmentsNote 4. Property, Plant and EquipmentNote 5. Long-term Debt and Revolving Lines Of CreditNote 6. Income TaxesNote 7. Significant Contractual RelationshipNote 8. Related Party TransactionsNote 9. Retirement PlansNote 10. Accrued and Other LiabilitiesNote 11. Stock Incentive PlansNote 12. Major CustomerNote 13. Shareholder Rights PlanNote 14. Lease CommitmentsNote 15. Derivative Instruments and Hedging ActivitiesNote 16. Acquisition Of Ntelos Holdings Corp. and Exchange with SprintNote 17. Segment ReportingNote 18. Quarterly Results (unaudited)Note 19. Subsequent Event