Securities and Exchange Commission
Washington, D.C. 20549
FORM 10-K
|
x
|
Annual Report Pursuant to Section 13 or 15(d) of the Securities Exchange Act of 1934
|
For the Fiscal Year Ended
February 2, 2013
or
|
o
|
Transition Report Pursuant to Section 13 or 15(d) of the Securities Exchange Act of 1934
|
Commission file number 000-51217
SEARS HOLDINGS CORPORATION
(Exact Name of Registrant as Specified in Its Charter)
|
Delaware
|
|
20-1920798
|
|
(State of Incorporation)
|
|
(I.R.S. Employer Identification No.)
|
|
3333 Beverly Road, Hoffman Estates, Illinois
|
|
60179
|
|
(Address of principal executive offices)
|
|
(Zip Code)
|
Registrant’s Telephone Number, Including Area Code: (847) 286-2500
Securities registered pursuant to Section 12(b) of the Act:
|
Title of each class
|
Name of Each Exchange on Which Registered
|
|
|
Common Shares, par value $0.01 per share
|
The NASDAQ Stock Market
|
|
Securities registered pursuant to Section 12(g) of the Act:
None
Indicate by check mark if the registrant is a well-known seasoned issuer, as defined in Rule 405 of the Securities Act. Yes
x
No
¨
Indicate by check mark if the registrant is not required to file reports pursuant to Section 13 or Section 15(d) of the Act. Yes
¨
No
x
Indicate by check mark whether the registrant (1) has filed all reports required to be filed by Section 13 or 15(d) of the Securities Exchange Act of 1934 during the preceding 12 months and (2) has been subject to such filing requirements for the past 90 days. Yes
x
No
¨
Indicate by check mark whether the registrant has submitted electronically and posted on its corporate Web site, if any, every Interactive Data File required to be submitted and posted pursuant to Rule 405 of Regulation S-T (§232.405 of this chapter) during the preceding 12 months (or for such shorter period that the registrant was required to submit and post such files). Yes
x
No
¨
Indicate by check mark if disclosure of delinquent filers pursuant to Item 405 of Regulation S-K (§229.405 of this chapter) is not contained herein, and will not be contained, to the best of the Registrant's knowledge, in definitive proxy or information statements incorporated by reference in Part III of this Form 10-K or any amendment to this Form 10-K.
x
Indicate by check mark whether the registrant is a large accelerated filer, an accelerated filer, a non-accelerated filer, or a smaller reporting company. See the definitions of “large accelerated filer,” “accelerated filer” and “smaller reporting company” in Rule 12b-2 of the Exchange Act.
Large accelerated filer
x
Accelerated filer
¨
Non-accelerated filer
¨
Smaller reporting company
¨
Indicate by check mark whether the registrant is a shell company (as defined in Rule 12b-2 of the Exchange Act). Yes
¨
No
x
On
March 2, 2013
, the registrant had
106,386,171
common shares outstanding. The aggregate market value (based on the closing price of the Registrant's common shares for stocks quoted on the NASDAQ Global Select Market) of the Registrant's common shares owned by non-affiliates (which are assumed, solely for the purpose of this calculation, to be stockholders other than (i) directors and executive officers of the Registrant and (ii) any person known by the Registrant to beneficially own five percent or more of the Registrant's common shares), as of the last business day of the Registrant's most recently completed second fiscal quarter, was approximately
$1.1 billion
.
Documents Incorporated By Reference
Part III of this Form 10-K incorporates by reference certain information from the Registrant’s definitive proxy statement relating to our Annual Meeting of Stockholders to be held on May 1, 2013 (the “2013 Proxy Statement”), which will be filed with the Securities and Exchange Commission within 120 days after the end of the fiscal year to which this Form 10-K relates.
|
Item 1.
|
Business
|
General
Sears Holdings Corporation (“Holdings”) is the parent company of Kmart Holding Corporation (“Kmart”) and Sears, Roebuck and Co. (“Sears”). Holdings (together with its subsidiaries, “we,” “us,” “our,” or the “Company”) was formed as a Delaware corporation in 2004 in connection with the merger of Kmart and Sears (the “Merger”) on March 24, 2005. We are an integrated retailer with significant physical and intangible assets, as well as virtual capabilities enabled through technology. We currently operate a national network of stores with
2,019
full-line and
54
specialty retail stores in the United States operating through Kmart and Sears and
475
full-line and specialty retail stores in Canada operating through Sears Canada Inc. (“Sears Canada”), a
51%
-owned subsidiary. Further, we operate a number of websites under the sears.com and kmart.com banners which offer more than 60 million products and provide the capability for our customers to engage in cross-channel transactions such as
buy online/pick-up in store; buy in store/ship to home; and buy online, return in store.
We are also the home of SHOP YOUR WAY™, a social shopping experience where Members have the ability to earn points, receive additional benefits and interact/shop with each other through shopyourway.com. The Company is the leading home appliance retailer as well as a leader in tools, lawn and garden, fitness equipment and automotive repair and maintenance. Key proprietary brands include
Kenmore
®
,
Craftsman
®
and
DieHard
®
. We also maintain a broad apparel offering including such well-known labels as
Lands' End
®
, the Kardashian Kollection, Jaclyn Smith, Joe Boxer, Sandra Lee and Levi's, as well as Sofia by Sofia Vergara and the Country Living Home Collection. We are the nation's largest provider of home services, with more than 14 million service calls made annually.
The retail industry is changing rapidly. The progression of the Internet, mobile technology, social networking and social media is fundamentally reshaping the way we interact with our core customers and members. As a result, we are transitioning to a Membership company. Our focus continues to be on our core customers, our Members, and finding ways to provide them value and convenience through Integrated Retail and our SHOP YOUR WAY Membership platform. We have invested significantly in our online ecommerce platforms, our Membership rewards program and the technology needed to support these initiatives.
Business Segments
During 2012, we operated three reportable segments: Kmart, Sears Domestic and Sears Canada. Financial information, including revenues, operating income (loss), total assets and capital expenditures for each of these business segments is contained in Note 17 of Notes to Consolidated Financial Statements. Information regarding the components of revenue for Holdings is included in Item 7, “Management's Discussion and Analysis of Financial Condition and Results of Operations” as well as Note 17.
Kmart
At
February 2, 2013
, the Company operated a total of
1,221
Kmart stores across
49
states,
Guam, Puerto Rico, and the U.S. Virgin Islands
. This store count consists of
1,196
discount stores, averaging
94,000
square feet, and
25
Super Centers, averaging
168,000
square feet. Most Kmart stores are one-floor, free-standing units that carry a wide array of products across many merchandise categories, including consumer electronics, seasonal merchandise, outdoor living, toys, lawn and garden equipment, food and consumables and apparel, including products sold under such well-known labels as Jaclyn Smith and Joe Boxer, and certain proprietary Sears brand products (such as Kenmore, Craftsman, and DieHard) and services. We also offer an assortment of major appliances, including Kenmore-branded products, in virtually all of our locations. There are
896
Kmart stores that also operate in-store pharmacies. The Super Centers generally operate 24 hours a day and combine a full-service grocery along with the merchandise selection of a discount store. There are also
21
Sears Auto Centers operating in Kmart stores. Sears Auto Centers offer a variety of professional automotive repair and maintenance services, as well as a full assortment of automotive accessories. Kmart continues to offer its layaway program, which allows customers to cost-effectively finance their purchases both in-store and online. In addition, we have expanded the ways our customers can receive their purchases, allowing our customers to buy online and pick up in store. This service, powered by MyGofer, is now available in over
956
Kmart stores via either mygofer.com or kmart.com. Kmart also sells its products through
2
its kmart.com website and provides customers the option of buying through a mobile app or online and picking up their merchandise in one of our Kmart stores.
Sears Domestic
At
February 2, 2013
, Sears Domestic operations consisted of the following:
|
•
|
Full-line Stores—
798
stores, of which
788
are Full-line stores located across all
50
states and
Puerto Rico
. These stores are primarily mall-based locations averaging
136,000
square feet. Full-line stores offer a wide array of products and service offerings across many merchandise categories, including appliances, consumer electronics, tools, sporting goods, outdoor living, lawn and garden equipment, certain automotive services and products, such as tires and batteries, home fashion products, as well as apparel, footwear, jewelry and accessories for the whole family. Our product offerings include our proprietary Kenmore, Craftsman, DieHard, Lands' End, Covington, Apostrophe, and Canyon River Blues brand merchandise. In addition, at
February 2, 2013
, we operated
10
Sears Essentials/Grand stores located in
10
states. In 2012, we converted
eight
Sears Essentials/Grand stores to Kmart stores. These stores are primarily free-standing units averaging
157,000
square feet, offering health and beauty products, pantry goods, household products and toys in addition to the offerings of the typical mall-based store. We also have
714
Sears Auto Centers operating in association with Full-line stores and
eight
Sears Auto Centers operating out of Sears Essentials/Grand stores. In addition, there are
36
free standing Sears Auto Centers that operate independently of Full-line stores. Sears also extends the availability of its product selection through the use of its sears.com website, which offers an assortment of home, apparel and accessory merchandise and provides customers the option of buying through a mobile app or online and picking up their merchandise in one of our Full-line stores.
|
|
•
|
Specialty Stores—
54
specialty stores (primarily consisting of the
36
free standing Sears Auto Centers noted above and
14
Lands' End retail stores noted below) located in free-standing, off-mall locations or high-traffic neighborhood shopping centers.
|
|
•
|
Lands' End—Lands' End, Inc. (“Lands' End”) is a leading direct merchant of traditionally styled casual clothing, accessories and footwear for men, women and children, as well as home products and soft luggage. These products are offered through multiple selling channels including landsend.com, one of the leading apparel websites, as well as catalog mailings, and international businesses. Lands' End has
14
retail stores, averaging
8,600
square feet, which offer Lands' End merchandise primarily from catalog and Internet channel overstocks. In addition, Lands' End has
280
“store within a store” departments primarily inside Sears Domestic Full-line locations.
|
|
•
|
Commercial Sales—We sell Sears merchandise, parts, and services to commercial customers through our business-to-business Sears Commercial Sales and Appliance Builder/Distributor businesses.
|
|
•
|
Sears Commercial Sales
provides appliances and services to commercial customers in the single-family residential construction/remodel, property management, multi-family new construction, and government/military sectors.
|
|
•
|
Our
Appliance Builder/Distributor
business offers premium appliance and plumbing fixtures to architects, designers, and new construction or remodeling customers, and is currently operating in nine markets with 17 facilities.
|
|
•
|
Home Services—Product Repair Services, the nation's largest product repair service provider, is a key element in our active relationship with more than 43 million households. With almost 8,000 service technicians making over 14 million service and installation calls annually, this business delivers a broad range of retail-related residential and commercial services across all 50 states, Puerto Rico, Guam and the Virgin Islands under either the Sears Parts & Repair Services or A&E Factory Service brand names. Commercial and residential customers can obtain parts and repair services for all major brands of products within the appliances, lawn and garden equipment, consumer electronics, floor care products, and heating and cooling systems categories. We also provide repair parts with supporting instructions for “do-it-yourself” customers through our searspartsdirect.com website. This business also offers protection agreements, product installation services and Kenmore and Carrier brand residential heating
|
3
and cooling systems. Home Services also includes home improvement services (primarily siding, windows, cabinet refacing, kitchen remodeling, roofing, carpet and upholstery cleaning, air duct cleaning, and garage door installation and repair) provided through Sears Home Improvement Services and Sears Home & Business Franchises.
Sears Canada
Sears Canada, a consolidated,
51%
-owned subsidiary of Sears, conducts retail operations in Canada similar to those conducted by Sears Domestic, with a greater emphasis on apparel and other softlines than in the U.S. stores.
At
February 2, 2013
, Sears Canada operated a total of
118
full-line stores,
357
specialty stores (including
48
furniture and appliance stores,
261
dealer stores operated under independent local ownership,
four
appliance and mattress stores,
33
Corbeil stores, and
11
outlet stores),
nine
home services showrooms,
1,512
catalog pick-up locations and
101
travel offices. Sears Canada also sells its products through its sears.ca website.
Separation of Sears Hometown and Outlet Businesses
On October 11, 2012, we completed the separation of our Sears Hometown and Outlet businesses through a rights offering transaction. Holdings received gross proceeds of
$446.5 million
with respect to the transaction, consisting of
$346.5 million
for the sale of Sears Hometown and Outlet Stores, Inc. ("SHO") common shares and
$100 million
through a dividend from SHO prior to the separation. Prior to the separation, SHO entered into an asset-based senior secured revolving credit facility with a group of financial institutions to provide (subject to availability under a borrowing base) for aggregate maximum borrowings of
$250 million
. Borrowings of
$100 million
from this revolving credit facility were used to fund the dividend paid to Holdings. We accounted for this separation in accordance with accounting standards applicable to common control transactions as ESL Investments, Inc. (together with its affiliated funds, "ESL") is a majority shareholder of Holdings and became a majority shareholder of SHO as a result of exercising subscription rights pursuant to the rights offering. Accordingly, we classified the difference between the proceeds received and the carrying value of net assets contributed to SHO as a reduction of capital in excess of par value in the Consolidated Statement of Equity for the period ended February 2, 2013.
In connection with the separation, Holdings and certain of its subsidiaries entered into various agreements with SHO under the terms described in Note 15. Because of the various agreements with SHO, the Company has determined that it has significant continuing cash flows with SHO. Accordingly, the operating results for SHO through the date of the separation are presented within the consolidated continuing operations of Holdings and the Sears Domestic segment in the accompanying Consolidated Financial Statements. See Note 15 of Notes to Consolidated Financial Statements for further information related to the agreements with SHO.
Partial Spin-Off of Interest in Sears Canada
On November 13, 2012, we completed a partial spin-off (the “spin-off”) of our interest in Sears Canada. Prior to the spin-off, Holdings beneficially owned approximately
96%
of the issued and outstanding common shares of Sears Canada. In connection with the spin-off, we distributed approximately
45 million
common shares of Sears Canada held by Holdings on a pro rata basis to holders of Holdings' common stock. Following the spin-off, Holdings was the beneficial holder of approximately
51%
of the issued and outstanding common shares of Sears Canada, and as such, Holdings has maintained control of Sears Canada and will continue to consolidate the results of Sears Canada. We accounted for the spin-off as an equity transaction in accordance with accounting standards applicable to noncontrolling interests. Accordingly, we reclassified a portion of our ownership interest in Sears Canada and accumulated other comprehensive loss to noncontrolling interest in the Consolidated Statement of Equity at February 2, 2013.
At
February 2, 2013
,
January 28, 2012
and
January 29, 2011
, Holdings was the beneficial holder of approximately
52 million
, or
51%
,
97 million
, or
95%
, and
97 million
, or
92%
, respectively, of the common shares of Sears Canada.
4
Acquisition of Noncontrolling Interest
During the first quarter of 2010, we acquired approximately
19 million
additional common shares of Sears Canada. We paid a total of
$560 million
for the additional shares and accounted for the acquisition of additional interest in Sears Canada as an equity transaction in accordance with accounting standards applicable to noncontrolling interests. Accordingly, we reclassified an accumulated other comprehensive loss from noncontrolling interest to controlling interest in the Consolidated Statement of Equity for the period ended January 29, 2011.
Spin-Off of Orchard Supply Hardware Stores Corporation
On December 30, 2011, we completed the spin-off to our shareholders of all the capital stock of Orchard Supply Hardware Stores Corporation (“Orchard”) that was owned by Holdings immediately prior to the spin-off, consisting of common stock that represented approximately 80% of the voting power of Orchard's outstanding capital stock and preferred stock that represented 100% of Orchard's outstanding nonvoting capital stock. In connection with the spin-off, Holdings and certain of its subsidiaries entered into various agreements with Orchard, including a distribution agreement, a transition services agreement, an appliance sale and consignment agreement and brand license agreements. In addition, certain tax matters between Holdings and Orchard are governed by a tax sharing agreement entered into in 2005.
Real Estate Transactions
In the normal course of business, we consider opportunities to purchase leased operating properties, as well as offers to sell owned, or assign leased, operating and non-operating properties. These transactions may, individually or in the aggregate, result in material proceeds or outlays of cash. In addition, we review leases that will expire in the short term in order to determine the appropriate action to take with respect to them.
Further information concerning our real estate transactions is contained in Note 11 of Notes to Consolidated Financial Statements.
Trademarks and Trade Names
The KMART
®
and SEARS
®
trade names, service marks and trademarks, used by us both in the United States and internationally, are material to our retail and other related businesses.
We sell proprietary branded merchandise under a number of brand names that are important to our operations. Our KENMORE
®
, CRAFTSMAN
®
, DIEHARD
®
and LANDS' END
®
brands are among the most recognized proprietary brands in retailing. These marks are the subject of numerous United States and foreign trademark registrations. Other well recognized Company trademarks and service marks include CANYON RIVER BLUES
®
, COVINGTON
®
, SHOP YOUR WAY™, SMART SENSE
®
, STRUCTURE
®
, THOM MCAN
®
and TOUGHSKINS
®
, which also are registered or are the subject of pending registration applications in the United States. Generally, our rights in our trade names and marks continue so long as we use them.
Seasonality
The retail business is seasonal in nature, and we generate a high proportion of our revenues, operating income and operating cash flows during the fourth quarter of our year, which includes the holiday season. As a result, our overall profitability is heavily impacted by our fourth quarter operating results. Additionally, in preparation for the fourth quarter holiday season, we significantly increase our merchandise inventory levels, which are financed from operating cash flows, credit terms received from vendors and borrowings under our domestic credit agreement (described in the “Uses and Sources of Liquidity” section below). Fourth quarter reported revenues accounted for 30% of total reported revenues in each of the years 2012, 2011 and 2010. See Note 19 to our Consolidated Financial Statements for further information on revenues earned by quarter in 2012 and 2011.
Competition
Our business is subject to highly competitive conditions. We compete with a wide variety of retailers, including other department stores, discounters, home improvement stores, consumer electronics dealers, auto service providers, specialty retailers, wholesale clubs, as well as many other retailers operating on a national, regional or
5
local level in the U.S. and Canada. Online and catalog businesses, which handle similar lines of merchandise, also compete with us. Walmart, Target, Kohl's, J.C. Penney, Macy's, The Home Depot, Lowe's, Best Buy and Amazon are some of the national retailers and businesses with which we compete. The Home Depot and Lowe's are major competitors in relation to our home appliance business, which accounted for approximately 15% of our 2012 and 16% of our 2011 and 2010 reported revenues. Sears Canada competes in Canada with Hudson's Bay Company, other Canadian-based store and online retailers, as well as certain U.S.-based competitors, including some of those mentioned above, that are expanding into Canada. Success in these competitive marketplaces is based on factors such as price, product assortment and quality, service and convenience, including availability of retail-related services such as access to credit, product delivery, repair and installation. Additionally, we are influenced by a number of factors including, but not limited to, the cost of goods, consumer debt availability and buying patterns, economic conditions, customer preferences, inflation, currency exchange fluctuations, weather patterns, and catastrophic events. Item 1A in this report on Form 10-K contains further information regarding risks to our business.
Employees
At
February 2, 2013
, subsidiaries of Holdings had approximately 246,000 employees in the United States and U.S. territories, and approximately 28,000 employees in Canada through Sears Canada. These employee counts include part-time employees.
Our Website; Availability of SEC Reports and Other Information
Our corporate website is located at searsholdings.com. Our Annual Reports on Form 10-K, Quarterly Reports on Form 10-Q, Current Reports on Form 8-K and any amendments to these reports are available, free of charge, through the “SEC Filings” portion of the Investor Information section of our website as soon as reasonably practicable after they are electronically filed with, or furnished to, the Securities and Exchange Commission (“SEC”).
The Corporate Governance Guidelines of our Board of Directors, the charters of the Audit, Compensation, Finance and Nominating and Corporate Governance Committees of the Board of Directors, our Code of Conduct and the Board of Directors Code of Conduct are available in the Corporate Governance section of searsholdings.com. References to our website address do not constitute incorporation by reference of the information contained on the website, and the information contained on the website is not part of this document.
|
Item 1A.
|
Risk Factors
|
Our operations and financial results are subject to various risks and uncertainties, including those described below, which could adversely affect our business, results of operations and financial condition.
If we fail to offer merchandise and services that our customers want, our sales may be limited, which would reduce our revenues and profits.
In order for our business to be successful, we must identify, obtain supplies of, and offer to our customers, attractive, innovative and high-quality merchandise on a continuous basis. Our products and services must satisfy the desires of our customers, whose preferences may change in the future. If we misjudge either the demand for products and services we sell or our customers' purchasing habits and tastes, we may be faced with excess inventories of some products and missed opportunities for products and services we chose not to offer. In addition, our sales may decline or we may be required to sell the merchandise we have obtained at lower prices. This would have a negative effect on our business and results of operations.
Our integrated retail strategy is based on a number of initiatives, including our SHOP YOUR WAY program, that depend on our ability to respond quickly to ongoing technology developments and implement new ways to understand and rely on the data to interact with our members and customers in order to achieve expected benefits.
6
If we do not successfully manage our inventory levels, our operating results will be adversely affected.
We must maintain sufficient inventory levels to operate our business successfully. However, we also must guard against accumulating excess inventory as we seek to minimize out-of-stock levels across all product categories and to maintain in-stock levels. In addition, we have plans to reduce peak domestic inventory in fiscal year 2013 by $500 million from $8.6 billion at the end of the third quarter of fiscal year 2012. We obtain a significant portion of our inventory from vendors located outside the United States. Some of these vendors often require lengthy advance notice of our requirements in order to be able to supply products in the quantities we request. This usually requires us to order merchandise, and enter into purchase order contracts for the purchase and manufacture of such merchandise, well in advance of the time these products will be offered for sale. As a result, we may experience difficulty in responding to a changing retail environment, which makes us vulnerable to changes in price. If we do not accurately anticipate the future demand for a particular product or the time it will take to obtain new inventory, our inventory levels will not be appropriate and our results of operations may be negatively impacted.
If we are unable to compete effectively in the highly competitive retail industry, our business and results of operations could be materially adversely affected.
The retail industry is highly competitive with few barriers to entry. We compete with a wide variety of retailers, including other department stores, discounters, home improvement stores, appliances and consumer electronics retailers, auto service providers, specialty retailers, wholesale clubs and many other competitors operating on a national, regional or local level in the U.S. and Canada. Some of our competitors are actively engaged in new store expansion. Online and catalog businesses, which handle similar lines of merchandise, and some of which are not required to collect sales taxes on purchases made by their customers, also compete with us. In this competitive marketplace, success is based on factors such as price, product assortment and quality, service and convenience.
Our success depends on our ability to differentiate ourselves from our competitors with respect to shopping convenience, a quality assortment of available merchandise and superior customer service. We must also successfully respond to our customers' changing tastes. The performance of our competitors, as well as changes in their pricing policies, marketing activities, new store openings and other business strategies, could have a material adverse effect on our business, financial condition and results of operations.
Our business has been and will continue to be affected by worldwide economic conditions; a failure of the economy to sustain its recovery, a renewed decline in consumer-spending levels and other conditions, including inflation and changing prices of energy, could lead to reduced revenues and gross margins, and negatively impact our liquidity.
Many economic and other factors are outside of our control, including consumer and commercial credit availability, consumer confidence and spending levels, including the impact of payroll tax increases on U.S. consumers, inflation, employment levels, housing sales and remodels, consumer debt levels, fuel costs and other challenges currently affecting the global economy, the full impact of which on our business, results of operations and financial condition cannot be predicted with certainty. These economic conditions adversely affect the disposable income levels of, and the credit available to, our customers, which could lead to reduced demand for our merchandise. Changing fuel and energy costs may have a significant impact on our operations. We require significant quantities of fuel for the vehicles used by technicians in our home services business and we are exposed to the risk associated with variations in the market price for petroleum products. We could experience a disruption in energy supplies, including our supply of gasoline, as a result of factors that are beyond our control, which could have an adverse effect on our business. Certain of our vendors also could experience increases in the cost of various raw materials, such as cotton, oil-related materials, steel and rubber, which could result in increases in the prices that we pay for merchandise, particularly apparel, appliances and tires. The domestic and international political situation also affects consumer confidence. The threat, outbreak or escalation of terrorism, military conflicts or other hostilities could lead to a decrease in consumer spending. Any of these events and factors could cause us to increase inventory markdowns and promotional expenses, thereby reducing our gross margins and operating results.
7
The lack of willingness of our vendors to provide acceptable payment terms could negatively impact our liquidity and/or reduce the availability of products or services we seek to procure.
We depend on our vendors to provide us with financing on our purchases of inventory and services. Our vendors could seek to limit the availability of vendor credit to us or other terms under which they sell to us, or both, which could negatively impact our liquidity. In addition, the inability of vendors to access liquidity, or the insolvency of vendors, could lead to their failure to deliver inventory or other services. Certain of our vendors finance their operations and/or reduce the risk associated with collecting accounts receivable from us by selling or “factoring” the receivables or by purchasing credit insurance or other forms of protection from loss associated with our credit risks. The ability of our vendors to do so is subject to the perceived credit quality of the Company. Such vendors could be limited in their ability to factor receivables or obtain credit protection in the future because of our perceived financial position and creditworthiness, which could reduce the availability of products or services we seek to procure.
Certain factors, including changes in market conditions and our credit ratings, may limit our access to capital markets and other financing sources and materially increase our borrowing costs.
In addition to credit terms from vendors, our liquidity needs are funded by our operating cash flows and, to the extent necessary, borrowings under our credit agreements and commercial paper program and access to capital markets. The availability of financing depends on numerous factors, including economic and market conditions, our operating performance, our credit ratings, and lenders' assessments of our prospects and the prospects of the retail industry in general. Changes in these factors may affect our cost of financing, liquidity and our ability to access financing sources, including the accordion feature of our domestic revolving credit facility and possible second lien indebtedness that is permitted under the domestic revolving credit facility. Rating agencies revise their ratings for the companies that they follow from time to time and our ratings may be revised or withdrawn in their entirety at any time.
While the Company's domestic revolving credit facility currently provides for up to $3.275 billion of lender commitments, our ability to borrow funds under this facility is limited by a borrowing base determined relative to the value, from time to time, of eligible inventory, accounts receivable and certain other assets. If, through asset sales or other means, the value of these eligible assets is not sufficient to support borrowings of up to the full amount of the commitments under this facility, we will not have full access to the facility, but rather could have access to a lesser amount determined by the borrowing base.
The lenders under our credit facilities may not be able to meet their commitments if they experience shortages of capital and liquidity and there can be no assurance that our ability to otherwise access the credit markets will not be adversely affected by changes in the financial markets and the global economy.
We cannot predict whether our plans to generate liquidity, reduce inventory and reduce fixed costs will be successful.
We have plans to generate at least $500 million of additional liquidity over the next 12 months, reduce peak domestic inventory in fiscal year 2013 by $500 million from $8.6 billion at the end of the third quarter of fiscal year 2012 and reduce our fixed cost base by $200 million during fiscal year 2013. The achievement of these objectives is subject to risks and uncertainties with respect to market conditions and other factors that may cause our actual results, performance or achievements to be materially different from our plans, and there can be no assurance that transactions to monetize assets or other actions to generate liquidity will become available on acceptable terms. Our ability to reduce fixed costs, which include occupancy costs and certain payroll costs, may be limited by our contractual obligations and other factors.
Due to the seasonality of our business, our annual operating results would be adversely affected if our business performs poorly in the fourth quarter.
Our business is seasonal, with a high proportion of revenues, operating income and operating cash flows being generated during the fourth quarter of our year, which includes the holiday season. As a result, our fourth quarter operating results significantly impact our annual operating results. Our fourth quarter operating results may fluctuate significantly, based on many factors, including holiday spending patterns and weather conditions.
8
Our sales may fluctuate for a variety of reasons, which could adversely affect our results of operations.
Our business is sensitive to customers' spending patterns, which in turn are subject to prevailing economic conditions. Our sales and results of operations have fluctuated in the past, and we expect them to continue to fluctuate in the future. A variety of other factors affect our sales and financial performance, including:
|
•
|
actions by our competitors, including opening of new stores in our existing markets or changes to the way these competitors go to market online,
|
|
•
|
seasonal fluctuations due to weather conditions,
|
|
•
|
changes in our merchandise strategy and mix,
|
|
•
|
changes in population and other demographics, and
|
|
•
|
timing of our promotional events.
|
Accordingly, our results for any one quarter are not necessarily indicative of the results to be expected for any other quarter, and comparable store sales for any particular future period may increase or decrease. For more information on our results of operations, see “Management's Discussion and Analysis of Financial Condition and Results of Operations” in Item 7 of this report on Form 10-K.
We rely on foreign sources for significant amounts of our merchandise, and our business may therefore be negatively affected by the risks associated with international trade.
We depend on a large number of products produced in foreign markets. We face risks, including reputational risks, associated with the delivery of merchandise originating outside the United States, including:
|
•
|
potential economic and political instability in countries where our suppliers are located,
|
|
•
|
increases in shipping costs,
|
|
•
|
manufacturing and transportation delays and interruptions,
|
|
•
|
supplier compliance with applicable laws, including labor and environmental laws, and with our global compliance program for suppliers and factories,
|
|
•
|
adverse fluctuations in currency exchange rates, and
|
|
•
|
changes in U.S. and foreign laws affecting the importation and taxation of goods, including duties, tariffs and quotas, or changes in the enforcement of those laws.
|
We rely extensively on computer systems to implement our integrated retail strategy, process transactions, summarize results and otherwise manage our business. Disruptions in these systems could harm our ability to run our business.
Given the significance of our online and mobile capabilities and the number of individual transactions we have each year, it is critical that we maintain uninterrupted operation of our computer and communications hardware and software systems, some of which are based on end-of-life or legacy technology, operate with minimal or no vendor support and are otherwise difficult to maintain. Our systems are subject to damage or interruption from power outages, computer and telecommunications failures, computer viruses, security breaches, catastrophic events such as fires, tornadoes and hurricanes, and usage errors by our employees. Operating legacy systems subject us to inherent costs and risks associated with maintaining, upgrading and replacing these systems and retaining sufficiently skilled personnel to maintain and operate the systems, demands on management time, and other risks and costs. Cyber-security risks such as malicious software and attempts to gain unauthorized access to data are rapidly evolving and could lead to disruptions in our systems, unauthorized release of confidential or otherwise protected information or corruption of data. If individuals are successful in infiltrating, breaking into, disrupting, damaging or otherwise stealing from the computer systems of the Company or its third-party providers, or if our systems are otherwise damaged or cease to function properly, we may have to make a significant investment to fix or replace them, we may suffer interruptions in our operations in the interim, we may face costly litigation, and our reputation with our members and customers may be harmed. Any material interruption in our computer operations may have a material adverse effect on our business or results of operations. In addition, we are pursuing initiatives to transform our
9
information technology processes and systems. These initiatives are highly complex and include replacing legacy systems, upgrading existing systems, and acquiring new systems and hardware with updated functionality. The risk of disruption is increased in periods when such complex and significant systems changes are undertaken.
If we do not maintain the security of our member and customer, associate or company information, we could damage our reputation, incur substantial additional costs and become subject to litigation.
Any significant security compromise or breach of member and customer, associate or company data, either held or maintained by the Company or our third-party providers, could significantly damage our reputation and brands and result in additional costs, lost sales, fines and/or lawsuits. The regulatory environment related to information security and privacy is increasingly rigorous, with new and constantly changing requirements applicable to our business, and compliance with those requirements could result in additional costs. There is no guarantee that the procedures that we have implemented to protect against unauthorized access to secured data are adequate to safeguard against all data security breaches. A data security breach could negatively impact our business and our results of operations.
We rely on third parties to provide us with services in connection with the administration of certain aspects of our business.
We have entered into agreements with third-party service providers (both domestic and overseas) to provide processing and administrative functions over a broad range of areas, and we may continue to do so in the future. These areas include finance and accounting, information technology, including IT development, call center, human resources and procurement functions. Services provided by third parties as a part of outsourcing initiatives could be interrupted as a result of many factors, such as acts of God or contract disputes, and any failure by third parties to provide us with these services on a timely basis or within our service level expectations and performance standards could result in a disruption of our business. In addition, to the extent we are unable to maintain our outsourcing arrangements; we would incur substantial costs, including costs associated with hiring new employees, in order to return these services in-house. These outsourcing arrangements also carry the risk that the Company will fail to adequately retain the significant internal historical knowledge of our business and systems that is transferred to the service providers as the employment of the Company's personnel who possess such knowledge ends.
We could incur charges due to impairment of goodwill, intangible and long-lived assets.
At February 2, 2013, we had goodwill and intangible asset balances of $3.3 billion, which are subject to periodic testing for impairment. Our long-lived assets, primarily stores, also are subject to periodic testing for impairment. A significant amount of judgment is involved in the periodic testing. Failure to achieve sufficient levels of cash flow within each of our reporting units, or sales of our branded products or cash flow generated from operations at individual store locations could result in impairment charges for goodwill and intangible assets or fixed asset impairment for long-lived assets, which could have a material adverse effect on our reported results of operations. Impairment charges, if any, resulting from the periodic testing are non-cash. A significant and sustained decline in our stock price could result in goodwill impairment charges. During times of financial market volatility, significant judgment is used to determine the underlying cause of the decline and whether stock price declines are short-term in nature or indicative of an event or change in circumstances. See Notes 12 and 13 of Notes to Consolidated Financial Statements for further information.
The loss of key personnel may disrupt our business and adversely affect our financial results.
We depend on the contributions of key personnel, including Edward S. Lampert, our Chairman and Chief Executive Officer, and other key employees, for our future success. Although certain executives have employment agreements with us, changes in our senior management and any future departures of key employees may disrupt our business and materially adversely affect our results of operations.
10
Affiliates of our Chairman and Chief Executive Officer, whose interests may be different than your interests, exert substantial influence over our Company.
Affiliates of Edward S. Lampert, our Chairman and Chief Executive Officer, beneficially own approximately 55% of the outstanding shares of our common stock. These affiliates are controlled, directly or indirectly, by Mr. Lampert. Accordingly, these affiliates, and thus Mr. Lampert, have substantial influence over many, if not all, actions to be taken or approved by our stockholders, including the election of directors and any transactions involving a change of control.
The interests of these affiliates, which have investments in other companies, including our former subsidiary, Sears Hometown and Outlet Stores, Inc., may from time to time diverge from the interests of our other stockholders, particularly with regard to new investment opportunities. This substantial influence may have the effect of discouraging offers to acquire our Company because the consummation of any such acquisition would likely require the consent of these affiliates.
We may be unable to protect or preserve the image of our brands and our intellectual property rights, which could have a negative impact on our business.
We regard our copyrights, service marks, trademarks, trade dress, trade secrets, patents and similar intellectual property as critical to our success, particularly those that relate to our private branded merchandise. As such, we rely on trademark and copyright law, patent law, trade secret protection and confidentiality agreements with our associates, consultants, vendors, and others to protect our proprietary rights. Nevertheless, the steps we take to protect our proprietary rights may be inadequate. If we are unable to protect or preserve the value of our trademarks, copyrights, trade secrets, patents or other proprietary rights for any reason, or if we fail to maintain the image of our brands due to merchandise and service quality issues, actual or perceived, adverse publicity, governmental investigations or litigation, or other reasons, our brands and reputation could be damaged and we could lose customers.
We may be subject to product liability claims if people or properties are harmed by the products we sell or the services we offer.
Some of the products we sell may expose us to product liability claims relating to personal injury, death, or property damage caused by such products, and may require us to take actions such as product recalls. We also provide various services, which could also give rise to such claims. Although we maintain liability insurance, we cannot be certain that our coverage will be adequate for liabilities actually incurred or that insurance will continue to be available to us on economically reasonable terms, or at all.
We may be subject to periodic litigation and other regulatory proceedings. These proceedings may be affected by changes in laws and government regulations or changes in the enforcement thereof.
From time to time, we may be involved in lawsuits and regulatory actions relating to our business, certain of which may be in jurisdictions with reputations for aggressive application of laws and procedures against corporate defendants. Our pharmacy, home services and grocery businesses, in particular, are subject to numerous federal, state and local regulations. We are impacted by trends in litigation, including class-action allegations brought under various consumer protection and employment laws, including wage and hour laws, and investigations and actions that are based on allegations of untimely compliance or noncompliance with applicable regulations or statutes. Due to the inherent uncertainties of litigation and regulatory proceedings, we cannot accurately predict the ultimate outcome of any such proceedings. An unfavorable outcome could have a material adverse impact on our business, financial condition and results of operations. In addition, regardless of the outcome of any litigation or regulatory proceedings, these proceedings could result in substantial costs and may require that we devote substantial resources to defend our Company. Further, changes in governmental regulations both in the United States and in the other countries where we operate could have adverse effects on our business and subject us to additional regulatory actions. For a description of current legal proceedings, see Item 3, “Legal Proceedings,” as well as Note 18 of Notes to Consolidated Financial Statements in this report on Form 10-K.
11
Our pension and postretirement benefit plan obligations are currently underfunded, and we may have to make significant cash payments to some or all of these plans, which would reduce the cash available for our businesses.
We have unfunded obligations under our domestic and foreign pension and postretirement benefit plans. The funded status of our pension plans is dependent upon many factors, including returns on invested assets, the level of certain market interest rates and the discount rate used to determine pension obligations. Unfavorable returns on the plan assets or unfavorable changes in applicable laws or regulations could materially change the timing and amount of required plan funding, which would reduce the cash available for our businesses. In addition, a decrease in the discount rate used to determine pension obligations could result in an increase in the valuation of pension obligations, which could affect the reported funding status of our pension plans and future contributions, as well as the periodic pension cost in subsequent years. Moreover, unfavorable regulatory action could materially change the timing and amount of required plan funding and negatively impact our business operations and impair our business strategy.
|
Item 1B.
|
Unresolved Staff Comments
|
Not applicable.
12
|
Item 2.
|
Properties
|
The following table summarizes the locations of our Kmart and Sears Domestic stores at
February 2, 2013
:
|
|
Kmart
|
Sears Domestic
|
|||||||||||||
|
State/Territory
|
Discount
Stores
|
Super
Centers
|
Full-line
Mall Stores
|
Sears
Essentials/
Grand Stores
|
Specialty
Stores
|
||||||||||
|
Alabama
|
24
|
|
—
|
|
10
|
|
—
|
|
—
|
|
|||||
|
Alaska
|
—
|
|
—
|
|
3
|
|
—
|
|
—
|
|
|||||
|
Arizona
|
16
|
|
—
|
|
14
|
|
—
|
|
—
|
|
|||||
|
Arkansas
|
5
|
|
—
|
|
7
|
|
—
|
|
1
|
|
|||||
|
California
|
102
|
|
—
|
|
79
|
|
1
|
|
5
|
|
|||||
|
Colorado
|
13
|
|
—
|
|
11
|
|
1
|
|
1
|
|
|||||
|
Connecticut
|
8
|
|
—
|
|
8
|
|
—
|
|
—
|
|
|||||
|
Delaware
|
6
|
|
—
|
|
4
|
|
—
|
|
—
|
|
|||||
|
District of Columbia
|
—
|
|
—
|
|
—
|
|
—
|
|
—
|
|
|||||
|
Florida
|
69
|
|
—
|
|
51
|
|
—
|
|
1
|
|
|||||
|
Georgia
|
28
|
|
—
|
|
19
|
|
—
|
|
—
|
|
|||||
|
Hawaii
|
7
|
|
—
|
|
6
|
|
—
|
|
—
|
|
|||||
|
Idaho
|
8
|
|
—
|
|
5
|
|
—
|
|
—
|
|
|||||
|
Illinois
|
46
|
|
4
|
|
35
|
|
1
|
|
9
|
|
|||||
|
Indiana
|
31
|
|
3
|
|
18
|
|
—
|
|
1
|
|
|||||
|
Iowa
|
21
|
|
—
|
|
9
|
|
—
|
|
2
|
|
|||||
|
Kansas
|
11
|
|
—
|
|
8
|
|
—
|
|
1
|
|
|||||
|
Kentucky
|
27
|
|
—
|
|
9
|
|
—
|
|
—
|
|
|||||
|
Louisiana
|
11
|
|
—
|
|
13
|
|
—
|
|
1
|
|
|||||
|
Maine
|
6
|
|
—
|
|
5
|
|
—
|
|
—
|
|
|||||
|
Maryland
|
21
|
|
—
|
|
19
|
|
—
|
|
—
|
|
|||||
|
Massachusetts
|
19
|
|
—
|
|
21
|
|
—
|
|
—
|
|
|||||
|
Michigan
|
69
|
|
6
|
|
24
|
|
—
|
|
—
|
|
|||||
|
Minnesota
|
21
|
|
—
|
|
12
|
|
—
|
|
4
|
|
|||||
|
Mississippi
|
7
|
|
—
|
|
5
|
|
—
|
|
—
|
|
|||||
|
Missouri
|
27
|
|
—
|
|
10
|
|
1
|
|
—
|
|
|||||
|
Montana
|
9
|
|
—
|
|
3
|
|
—
|
|
—
|
|
|||||
|
Nebraska
|
8
|
|
—
|
|
4
|
|
—
|
|
—
|
|
|||||
|
Nevada
|
10
|
|
—
|
|
4
|
|
1
|
|
1
|
|
|||||
|
New Hampshire
|
6
|
|
—
|
|
6
|
|
—
|
|
—
|
|
|||||
|
New Jersey
|
35
|
|
—
|
|
20
|
|
—
|
|
5
|
|
|||||
|
New Mexico
|
15
|
|
—
|
|
7
|
|
—
|
|
—
|
|
|||||
|
New York
|
52
|
|
1
|
|
45
|
|
—
|
|
6
|
|
|||||
|
North Carolina
|
43
|
|
—
|
|
21
|
|
—
|
|
—
|
|
|||||
|
North Dakota
|
7
|
|
—
|
|
4
|
|
—
|
|
—
|
|
|||||
|
Ohio
|
52
|
|
7
|
|
38
|
|
1
|
|
1
|
|
|||||
|
Oklahoma
|
9
|
|
—
|
|
10
|
|
—
|
|
—
|
|
|||||
|
Oregon
|
13
|
|
—
|
|
8
|
|
—
|
|
1
|
|
|||||
|
Pennsylvania
|
95
|
|
2
|
|
42
|
|
1
|
|
2
|
|
|||||
|
Rhode Island
|
1
|
|
—
|
|
2
|
|
—
|
|
—
|
|
|||||
|
South Carolina
|
25
|
|
—
|
|
12
|
|
—
|
|
—
|
|
|||||
|
South Dakota
|
9
|
|
—
|
|
2
|
|
—
|
|
—
|
|
|||||
|
Tennessee
|
32
|
|
—
|
|
18
|
|
—
|
|
—
|
|
|||||
|
Texas
|
20
|
|
—
|
|
58
|
|
1
|
|
1
|
|
|||||
|
Utah
|
15
|
|
—
|
|
4
|
|
1
|
|
1
|
|
|||||
|
Vermont
|
3
|
|
—
|
|
2
|
|
—
|
|
—
|
|
|||||
|
Virginia
|
39
|
|
1
|
|
20
|
|
1
|
|
1
|
|
|||||
|
Washington
|
15
|
|
—
|
|
20
|
|
—
|
|
2
|
|
|||||
|
West Virginia
|
15
|
|
1
|
|
7
|
|
—
|
|
—
|
|
|||||
|
Wisconsin
|
28
|
|
—
|
|
15
|
|
—
|
|
6
|
|
|||||
|
Wyoming
|
9
|
|
—
|
|
2
|
|
—
|
|
—
|
|
|||||
|
Puerto Rico
|
23
|
|
—
|
|
9
|
|
—
|
|
1
|
|
|||||
|
U.S. Virgin Islands
|
4
|
|
—
|
|
—
|
|
—
|
|
—
|
|
|||||
|
Guam
|
1
|
|
—
|
|
—
|
|
—
|
|
—
|
|
|||||
|
Totals
|
1,196
|
|
25
|
|
788
|
|
10
|
|
54
|
|
|||||
|
|
|
|
|
|
|
||||||||||
13
|
|
Kmart
|
Sears Domestic
|
Sears Canada
|
Total
|
|||||||||||||||||||
|
|
Discount
Stores
|
Super
Centers
|
Full-line
Mall Stores
|
Sears
Essentials/
Grand Stores
|
Specialty
Stores
|
Full-line
Stores
|
Specialty
Stores
|
||||||||||||||||
|
Owned
|
184
|
|
19
|
|
497
|
|
8
|
|
26
|
|
14
|
|
2
|
|
750
|
|
|||||||
|
Leased
|
1,012
|
|
6
|
|
291
|
|
2
|
|
28
|
|
104
|
|
77
|
|
1,520
|
|
|||||||
|
Independently-owned and operated stores
|
—
|
|
—
|
|
—
|
|
—
|
|
—
|
|
—
|
|
278
|
|
278
|
|
|||||||
|
Stores at February 2, 2013
|
1,196
|
|
25
|
|
788
|
|
10
|
|
54
|
|
118
|
|
357
|
|
2,548
|
|
|||||||
|
|
|
|
|
|
|
|
|
|
|||||||||||||||
In addition, at
February 2, 2013
, we had 38 domestic supply chain distribution centers, of which 12 were owned and 26 were leased for terms ranging from three to five years. Of the total, 10 primarily support Kmart stores, 24 primarily support Sears stores and four support both Sears and Kmart stores. We also had 465 domestic store warehouses, customer call centers and service facilities (including 17 facilities related to our appliance builder/distributor business), most of which are leased for terms ranging generally from three to five years or are part of other facilities included in the above table. Many of our facilities are also used to support our online channels.
Our principal executive offices are located on a 200-acre site owned by us at the Prairie Stone office park in Hoffman Estates, Illinois. The complex consists of six interconnected office buildings totaling approximately two million gross square feet of office space. In addition, we have a campus in Dodgeville, Wisconsin supporting the corporate headquarters, distribution center and customer sales/service operations for Lands' End. We also own an 86,000 square foot office building in Troy, Michigan. We operate numerous buying offices throughout the world that procure product internationally, as well as an information technology center in Pune, India.
At
February 2, 2013
, Sears Canada operated a total of
118
full-line stores,
357
specialty stores (including
48
furniture and appliance stores,
261
hometown dealer stores operated under independent local ownership, four appliance and mattress stores,
33
Corbeil stores, and
11
outlet stores), nine home services showrooms,
1,512
catalog pick-up locations and
101
travel offices.
A description of our leasing arrangements and commitments appears in Note 14 of Notes to Consolidated Financial Statements.
|
Item 3.
|
Legal Proceedings
|
Item 103 of SEC Regulation S-K requires that we disclose legal proceedings to which the Company and a governmental authority is a party and that arise under laws dealing with the discharge of materials into the environment or the protection of the environment, if the proceeding reasonably involves potential monetary sanctions of $100,000 or more. Disclosure also is required as to any such proceedings known by us to be contemplated by governmental authorities. In that connection, we note that Sears was a party to administrative actions brought by the California Air Resources Board (“CARB”) that alleged that Sears offered for sale certain mini bikes and stand-up scooters that were not certified by CARB. The parties have entered into a settlement agreement that provides for the payment by Sears of a $285,200 penalty. The vendor of this merchandise has agreed to reimburse Sears for the full amount of the penalty pursuant to its indemnification obligations to Sears.
See Part II, Item 8, “Financial Statements—Notes to Consolidated Financial Statements,” Note 18—“Legal Proceedings,” for additional information regarding legal proceedings, which information is incorporated herein by this reference.
|
Item 4.
|
Mine Safety Disclosures
|
Not applicable.
14
EXECUTIVE OFFICERS OF THE REGISTRANT
The following table and information sets forth the names of our executive officers, their current positions and offices with the Company, the date they first became executive officers of the Company, their current ages, and their principal employment during the past five years.
|
Name
|
Position
|
Date First Became an Executive Officer
|
Age
|
|||
|
Edward S. Lampert
|
Chairman of the Board and Chief Executive Officer
|
2013
|
50
|
|||
|
Ronald D. Boire
|
Executive Vice President, Chief Merchandising Officer and President, Sears Full Line Stores and Kmart Formats
|
2012
|
51
|
|||
|
Imran Jooma
|
Executive Vice President and President, Online, Marketing, Pricing & Financial Services
|
2012
|
40
|
|||
|
Robert A. Schriesheim
|
Executive Vice President and Chief Financial Officer
|
2011
|
52
|
|||
|
Dane A. Drobny
|
Senior Vice President, General Counsel and Corporate Secretary
|
2010
|
45
|
|||
|
William K. Phelan
|
Senior Vice President, Finance
|
2005
|
50
|
|||
|
Robert A. Riecker
|
Vice President, Controller and Chief Accounting Officer
|
2012
|
48
|
|||
__________________
Mr. Lampert has served as Chairman of the Company's Board of Directors since 2004 and as our Chief Executive Officer since February 2013. He also is the Chairman and Chief Executive Officer of ESL Investments, Inc., which he founded in April 1988.
Mr. Boire joined the Company as Executive Vice President, Chief Merchandising Officer and President, Sears Full Line Stores and Kmart Formats in January 2012. He served from October 2009 until January 2012 as President and Chief Executive Officer of Brookstone, a consumer products company. He served as President, U.S. Toys, North America, for Toys “R” Us, a specialty retailer of toys and juvenile products, from July 2006 until September 2009. He previously served as Executive Vice President, Global Merchandise Manager of Best Buy Co., Inc., a retailer of consumer electronics and related products from May 2003 to June 2006. Prior to joining Best Buy Co., Inc., Mr. Boire served for 17 years in a variety of increasingly senior roles at Sony Electronics Inc., a marketer of electronic products and services.
Mr. Jooma joined the Company in June 2007 as Vice President, e-Commerce, and has served in his current position since November 2011. He was elected Executive Vice President in November 2012. From May 2010 until November 2011, he served as the Company's Senior Vice President and President, e-Commerce. From August 2009 until May 2010, he served as Senior Vice President, e-Commerce, of the Company. Prior to joining the Company, he served as Vice President of eCommerce at Circuit City Stores, Inc. and prior thereto as the Divisional Vice President of eCommerce at OfficeMax Incorporated.
Mr. Schriesheim joined the Company as Executive Vice President in August 2011 and became Executive Vice President and Chief Financial Officer that same month. Prior to joining the Company, he served as the Chief Financial Officer of Hewitt Associates, Inc., a global human resources consulting and outsourcing company, from January 2010 to October 2010. From October 2006 to January 2010, he served as Executive Vice President and Chief Financial Officer of Lawson Software, Inc., an ERP software provider. From August 2002 to October 2006, he was affiliated with ARCH Development Partners, LLC, a seed stage venture capital fund. Before joining ARCH, Mr. Schriesheim held executive positions at Global TeleSystems, SBC Equity Partners, Ameritech, AC Nielsen and Brooke Group Ltd. Mr. Schriesheim has served as a director of Skyworks Solutions, Inc. since May 2006 and is chairman of its audit committee. He also served as a director of Dobson Communications Corp. from 2004 to 2007, a director of Lawson Software from 2006 to 2011, a director and Co-Chairman of MSC.Software Corporation from 2007 to 2009 and a director of Georgia Gulf Corporation from 2009 to 2010.
15
Mr. Drobny joined us as Senior Vice President, General Counsel and Corporate Secretary in May 2010. Prior to joining the Company, he practiced law with the law firm of Winston & Strawn LLP, most recently as Capital Partner, from September 1993 until May 2010.
Mr. Phelan was elected Senior Vice President, Finance of the Company in January 2012. From September 2007 until January 2012, he served as Senior Vice President and Controller of the Company. From May 2011 until August 2011, Mr. Phelan served as our acting Chief Financial Officer, while from May 2009 until May 2011 and from August 2011 until January 2012, he also served as our Chief Accounting Officer. From December 2007 until December 2008, Mr. Phelan also served as the Company's Treasurer. From the consummation of the Merger until September 2007, Mr. Phelan served as Vice President and Controller. Prior to the consummation of the Merger, he served as Assistant Controller of Sears.
Mr. Riecker was elected Vice President, Controller and Chief Accounting Officer in January 2012. He joined the Company as Assistant Controller in October 2005 and served as Vice President and Assistant Controller from May 2007 to October 2011. From October 2011 until his election as Vice President, Controller and Chief Accounting Officer, he served as the Company's Vice President, Internal Audit.
16
|
Item 5.
|
Market for Registrant's Common Equity, Related Stockholder Matters and Issuer Purchases of Equity Securities
|
Holdings' common stock is quoted on The NASDAQ Stock Market under the ticker symbol SHLD. There were 14,217 shareholders of record at March 2, 2013. The quarterly high and low sales prices for Holdings' common stock are set forth below.
|
|
Fiscal Year 2012
|
||||||||||||||
|
|
Sears Holdings
|
||||||||||||||
|
|
First
Quarter
|
Second
Quarter
|
Third
Quarter
|
Fourth
Quarter
|
|||||||||||
|
Common stock price
|
|
|
|
|
|||||||||||
|
High
|
$
|
85.90
|
|
$
|
65.70
|
|
$
|
67.20
|
|
$
|
68.77
|
|
|||
|
Low
|
$
|
41.14
|
|
$
|
46.28
|
|
$
|
47.01
|
|
$
|
38.40
|
|
|||
|
|
Fiscal Year 2011
|
||||||||||||||
|
|
Sears Holdings
|
||||||||||||||
|
|
First
Quarter
|
Second
Quarter
|
Third
Quarter
|
Fourth
Quarter
|
|||||||||||
|
Common stock price
|
|
|
|
|
|||||||||||
|
High
|
$
|
94.79
|
|
$
|
86.72
|
|
$
|
83.25
|
|
$
|
80.37
|
|
|||
|
Low
|
$
|
73.59
|
|
$
|
66.15
|
|
$
|
51.14
|
|
$
|
28.89
|
|
|||
Holdings has not paid and does not expect to pay cash dividends in the foreseeable future.
Equity Compensation Plan Information
The following table reflects information about securities authorized for issuance under our equity compensation plans at
February 2, 2013
.
|
Plan Category
|
(a)
Number of securities
to be issued upon
exercise of
outstanding options,
warrants and
rights
|
(b)
Weighted-average
exercise price of
outstanding
options,
warrants and
rights
|
(c)
Number of securities
remaining available for
future issuance
under equity
compensation plans*
|
||
|
Equity compensation plans approved by security holders
|
—
|
—
|
261,774
|
||
|
Equity compensation plans not approved by security holders
|
—
|
—
|
—
|
||
|
Total
|
—
|
—
|
261,774
|
||
__________________
|
*
|
Represents shares of common stock that may be issued pursuant to our 2006 Stock Plan. Excludes shares covered by an outstanding plan award that, subsequent to February 2, 2013, ultimately are not delivered on an unrestricted basis (for example, because the award is forfeited, canceled, settled in cash or used to satisfy tax withholding obligations). Awards under the 2006 Stock Plan may be restricted stock awards, a grant of shares of our common stock in connection with an award made under a long-term incentive plan, or certain other awards.
|
17
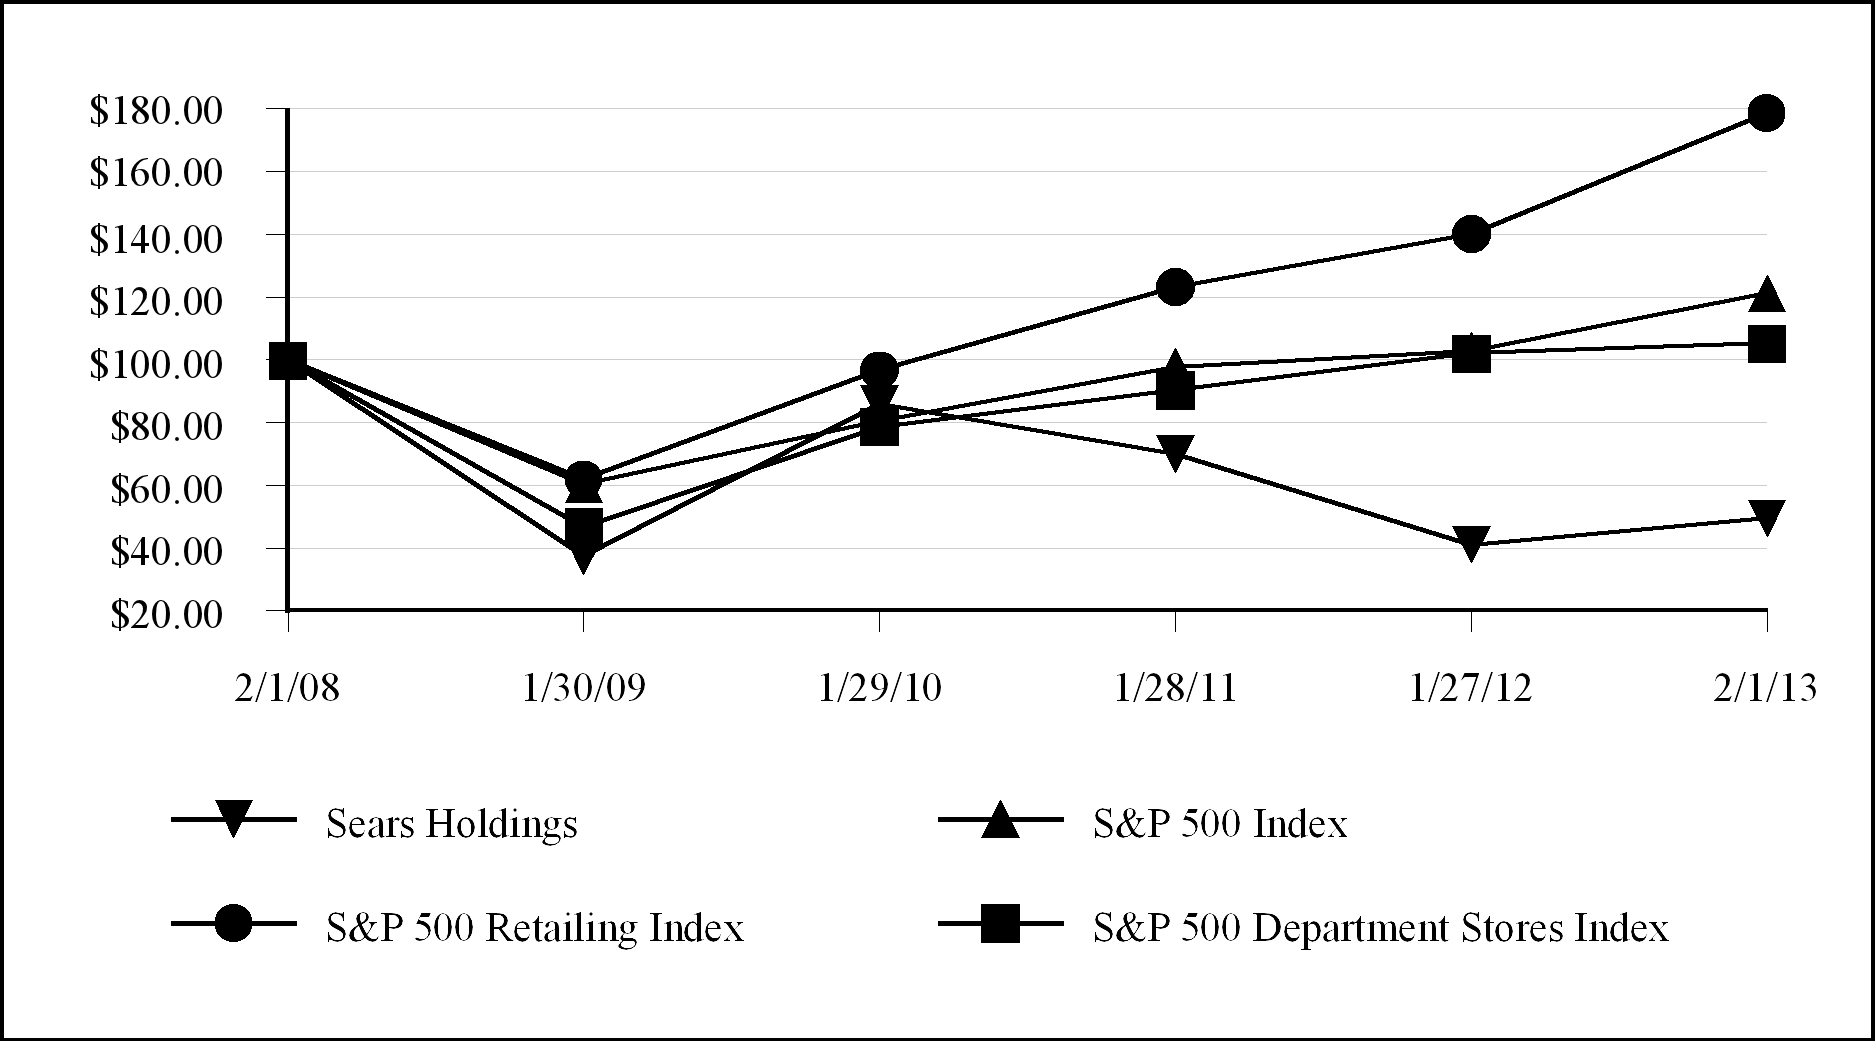
Stock Performance Graph
Comparison of Five-Year Cumulative Stockholder Return
The following graph compares the cumulative total return to stockholders on Holdings' common stock from February 1, 2008 through February 1, 2013, the last trading day before the end of our 2012 year, with the return on the S&P 500 Stock Index, the S&P 500 Retailing Index and the S&P 500 Department Stores Index for the same period. The graph assumes an initial investment of $100 on February 1, 2008 in each of our common stock, the S&P 500 Stock Index, the S&P Retailing Index and the S&P 500 Department Stores Index.
The S&P 500 Retailing Index consists of companies included in the S&P 500 Stock Index in the broadly defined retail sector, which includes competing retailers of softlines (apparel and domestics) and hardlines (appliances, electronics and home improvement products), as well as food and drug retailers. The S&P 500 Department Stores Index consists primarily of department stores that compete with our full-line stores.
|
|
Feb. 1,
2008
|
Jan. 30,
2009
|
Jan. 29,
2010
|
Jan. 28,
2011
|
Jan. 27,
2012
|
Feb. 1,
2013
|
|||||||||||||||||
|
Sears Holdings
|
$
|
100.00
|
|
$
|
37.78
|
|
$
|
86.12
|
|
$
|
70.24
|
|
$
|
41.55
|
|
$
|
49.89
|
|
|||||
|
S&P 500 Stock Index
|
$
|
100.00
|
|
$
|
60.64
|
|
$
|
80.72
|
|
$
|
97.89
|
|
$
|
103.10
|
|
$
|
121.25
|
|
|||||
|
S&P 500 Retailing Index
|
$
|
100.00
|
|
$
|
62.28
|
|
$
|
96.85
|
|
$
|
123.37
|
|
$
|
140.16
|
|
$
|
178.46
|
|
|||||
|
S&P 500 Department Stores Index
|
$
|
100.00
|
|
$
|
47.25
|
|
$
|
78.97
|
|
$
|
90.57
|
|
$
|
102.24
|
|
$
|
105.40
|
|
|||||
18
Purchase of Equity Securities
The following table provides information about shares of common stock we acquired during the fourth quarter of 2012. During the quarter ended
February 2, 2013
, we did not repurchase any shares of our common stock under our common share repurchase program. At
February 2, 2013
, we had approximately $504 million of remaining authorization under the program.
|
Total
Number of Shares Purchased (1) |
Average
Price Paid per Share |
Total Number of
Shares Purchased as Part of Publicly Announced Program (2) |
Average
Price Paid per Share for Publicly Announced Program |
Approximate
Dollar Value of Shares that May Yet Be Purchased Under the Program |
|||||||||||||
|
October 28, 2012 to November 24, 2012
|
706
|
|
$
|
64.54
|
|
—
|
|
$
|
—
|
|
|||||||
|
November 25, 2012 to December 29, 2012
|
1,824
|
|
42.01
|
|
—
|
|
—
|
|
|||||||||
|
December 30, 2012 to February 2, 2013
|
18,919
|
|
43.99
|
|
—
|
|
—
|
|
|||||||||
|
Total
|
21,449
|
|
$
|
44.50
|
|
—
|
|
$
|
—
|
|
$
|
504,000,000
|
|
||||
__________________
|
(1)
|
Consists entirely of
21,449
shares acquired from associates to meet withholding tax requirements from the vesting of restricted stock.
|
|
(2)
|
Our common share repurchase program was initially announced on September 14, 2005 and has a total authorization since inception of the program of $6.5 billion, including the authorizations to purchase up to an additional $500 million of common stock on each of December 17, 2009 and May 2, 2011. The program has no stated expiration date.
|
The domestic credit agreement (described in the “Uses and Sources of Liquidity” section below) limits our ability to make restricted payments, including dividends and share repurchases, under certain circumstances, including if availability under the credit facility, as defined, is less than 15%. It also imposes various other requirements which take effect if availability falls below designated thresholds, including a cash dominion requirement and a requirement that the fixed charge ratio at the last day of any quarter be not less than 1.0 to 1.0.
19
|
Item 6.
|
Selected Financial Data
|
The table below summarizes our recent financial information. The data set forth below should be read in conjunction with “Management's Discussion and Analysis of Financial Condition and Results of Operations” in Item 7 and our Consolidated Financial Statements and notes thereto in Item 8.
|
|
Fiscal
|
||||||||||||||||||
|
dollars in millions, except per share and store data
|
2012
|
2011
|
2010
|
2009
|
2008
|
||||||||||||||
|
Summary of Operations
|
|
|
|
|
|
||||||||||||||
|
Revenues
(1)
|
$
|
39,854
|
|
$
|
41,567
|
|
$
|
42,664
|
|
$
|
43,360
|
|
$
|
46,007
|
|
||||
|
Domestic comparable store sales %
|
(2.5
|
)%
|
(2.2
|
)%
|
(1.3
|
)%
|
(4.7
|
)%
|
(7.7
|
)%
|
|||||||||
|
Net income (loss) from continuing operations attributable to Holdings' shareholders
(2)
|
(930
|
)
|
(3,113
|
)
|
122
|
|
218
|
|
295
|
|
|||||||||
|
Per Common Share
|
|
|
|
|
|
|
|
|
|
|
|||||||||
|
Basic:
|
|
|
|
|
|
|
|
|
|
|
|||||||||
|
Net income (loss) from continuing operations attributable to Holdings' shareholders
|
$
|
(8.78
|
)
|
$
|
(29.15
|
)
|
$
|
1.09
|
|
$
|
1.85
|
|
$
|
2.32
|
|
||||
|
Diluted:
|
|
|
|
|
|
|
|
|
|
|
|||||||||
|
Net income (loss) from continuing operations attributable to Holdings' shareholders
|
$
|
(8.78
|
)
|
$
|
(29.15
|
)
|
$
|
1.09
|
|
$
|
1.85
|
|
$
|
2.32
|
|
||||
|
Holdings' book value per common share
|
$
|
25.89
|
|
$
|
40.26
|
|
$
|
78.19
|
|
$
|
79.21
|
|
$
|
76.91
|
|
||||
|
Financial Data
|
|
|
|
|
|
|
|
|
|||||||||||
|
Total assets
|
$
|
19,340
|
|
$
|
21,381
|
|
$
|
24,360
|
|
$
|
24,901
|
|
$
|
25,444
|
|
||||
|
Long-term debt
|
1,579
|
|
1,693
|
|
1,872
|
|
949
|
|
1,220
|
|
|||||||||
|
Long-term capital lease obligations
|
364
|
|
395
|
|
472
|
|
510
|
|
552
|
|
|||||||||
|
Capital expenditures
|
378
|
|
432
|
|
426
|
|
350
|
|
486
|
|
|||||||||
|
Adjusted EBITDA
|
626
|
|
277
|
|
1,385
|
|
1,744
|
|
1,524
|
|
|||||||||
|
Number of stores
|
2,548
|
|
4,010
|
|
3,949
|
|
3,862
|
|
3,862
|
|
|||||||||
__________________
|
(1)
|
We follow a retail-based financial reporting calendar. Accordingly, the fiscal year ended February 2, 2013 contained 53 weeks, while all other years presented contained 52 weeks.
|
|
(2)
|
The periods presented were impacted by certain significant items, which affected the comparability of amounts reflected in the above selected financial data. For 2012, 2011 and 2010, these significant items are discussed within Item 7, “Management's Discussion and Analysis of Financial Condition and Results of Operations.” 2009 results include the impact of domestic pension expense of $170 million, a $131 million charge related to store closings and severance, a gain on the sale of Sears Canada Headquarters of $44 million, a gain of $32 million recorded in connection with the settlement of Visa/MasterCard antitrust litigation, mark-to-market losses of $33 million on Sears Canada hedge transactions and a tax benefit of $41 million related to the resolution of certain income tax matters. 2008 results include the impact of a $98 million charge related to asset impairments, a $77 million charge related to store closings and severance, mark-to-market gains of $81 million on Sears Canada hedge transactions, the reversal of a $62 million reserve because of the overturning of an adverse jury verdict relating to the redemption of certain Sears, Roebuck and Co. bonds in 2004, a tax benefit of $8 million related to the resolution of certain income tax matters and gains of $13 million on negotiated repurchases of debt securities prior to maturity.
|
20
|
Item 7.
|
Management's Discussion and Analysis of Financial Condition and Results of Operations
|
We have divided our “Management's Discussion and Analysis of Financial Condition and Results of Operations” into the following six sections:
|
•
|
Overview of Holdings
|
|
•
|
Results of Operations:
|
Fiscal Year
Holdings' Consolidated Results
Business Segment Results
|
•
|
Analysis of Consolidated Financial Condition
|
|
•
|
Contractual Obligations and Off-Balance Sheet Arrangements
|
|
•
|
Application of Critical Accounting Policies and Estimates
|
|
•
|
Cautionary Statement Regarding Forward-Looking Information
|
The discussion that follows should be read in conjunction with the consolidated financial statements and notes thereto included in Item 8.
OVERVIEW OF HOLDINGS
Holdings, the parent company of Kmart and Sears, was formed in connection with the March 24, 2005 Merger of these two companies. We are an integrated retailer with significant physical and intangible assets, as well as virtual capabilities enabled through technology. We currently operate a national network of stores with
2,019
full-line and
54
specialty retail stores in the United States, operating through Kmart and Sears, and
475
full-line and specialty retail stores in Canada operating through Sears Canada Inc. (“Sears Canada”), a
51%
-owned subsidiary. Further, we operate a number of websites under the Sears.com and Kmart.com banners which offer more than 60 million products and provide the capability for our customers to engage in cross-channel transactions such as
buy online/pick-up in store; buy in store/ship to home; and buy online, return in store.
We are also the home of SHOP YOUR WAY™, a social shopping experience where members have the ability to earn points, receive additional benefits and interact/shop with each other through shopyourway.com. The Company is the leading home appliance retailer as well as a leader in tools, lawn and garden, fitness equipment and automotive repair and maintenance. Key proprietary brands include
Kenmore
®
,
Craftsman
®
and DieHard
®
. We also maintain a broad apparel offering including such well-known labels as
Lands' End
®
, the Kardashian Kollection, Jaclyn Smith, Joe Boxer, Sandra Lee and Levi's, as well as Sofia by Sofia Vergara and the Country Living Home Collection. We are the nation's largest provider of home services, with more than 14 million service calls made annually.
We currently conduct our operations in three business segments: Kmart, Sears Domestic and Sears Canada. The nature of operations conducted within each of these segments is discussed within the “Business Segments” section of Item 1 in this report on Form 10-K. Our business segments have been determined in accordance with accounting standards regarding the determination, and reporting, of business segments.
Our focus continues to be on our core customers, our Members, and finding ways to provide them value and convenience through Integrated Retail and our SHOP YOUR WAY Membership platform. We have invested significantly in our online ecommerce platforms, our Membership rewards program and the technology needed to support these initiatives. Our actions in 2012 were guided by the following strategic priorities:
Innovation Around Our Customers and Members
We continue to focus on building and growing a deeply engaging membership program, called SHOP YOUR WAY. SHOP YOUR WAY is more than just a typical loyalty program. It is a comprehensive platform that transforms customer transactions into relationships and allows us to know our Members better and to serve them better as well. It includes the rewards program, our shopyourway.com social shopping platform, our SHOP YOUR WAY Max free
21
shipping platform and a variety of other applications and components. Collectively, these elements change the way we do business both inside and outside the Company.
We are also focused on providing integrated retail solutions for our Members and customers. We rolled out tablets and mobile devices to Sears Domestic stores across the country. The tablets are equipped to help our store associates provide a better overall shopping experience. Our associates can use tablets to look at product specifications, compare products side-by-side and search for inventory if it is not readily available at the store. More information about products, inventory, pricing and reviews is now available at their fingertips, which means Members can have more confidence in their product selection.
We have designed other experiences that provide seamless and convenient integrated experiences for our Members. Building on our Buy Online Pick Up In Store and Ready in 5 promise, we developed a Return/Exchange in 5 capability that allows Members to fill out the product return information online. Members simply drop off or exchange the item they want to return at our Merchandise Pick Up area within five minutes or less.
Core Retail Excellence
We are also focused on providing great merchandise value to our customers and Members. In 2012, we launched several innovative brand offerings such as Outdoor Life, Alphaline electronics accessories, and RoadHandler tires. In January 2013, we announced that we would be developing two new apparel lines in a collaborative effort between SHOP YOUR WAY and our Kmart format. We have a long heritage of building celebrity brands, both at Sears and Kmart. We chose to partner with Nicki Minaj and Adam Levine for this collaboration because of their creativity, their global appeal and their strong interest in developing their clothing brands in a unique and innovative manner.
We are focused on providing flexibility and convenience for our Members through such things as buy online/pick-up in store, buy in store/ship to home, digital receipts and returns and exchanges in five minutes or less. We enhanced our layaway program and added the capability for our Members to make layaway payments online and have the items from their layaway shipped directly to their homes when their contract has been completed. We also provide our customers with easy access to a broad and diverse range of products and categories through marketplace on sears.com.
Financial and Operational Discipline
In 2012, we also demonstrated our financial flexibility by positively impacting our liquidity by $1.8 billion, while unlocking the value in our asset portfolio, as part of our on-going asset re-configuration where we are re-deploying our capital in support of our member-centric, integrated retail strategy. Actions taken included:
|
•
|
the separation of our Sears Hometown and Outlet businesses through a rights offering transaction, which generated gross proceeds of approximately $447 million;
|
|
•
|
the partial spin-off of 45% of Sears Canada;
|
|
•
|
the execution of various real estate transactions which generated cash proceeds of approximately $440 million;
|
|
•
|
Reducing inventory by nearly $1.0 billion below last year's level and adjusting our promotional cadence to be more targeted;
|
|
•
|
Reducing our fixed cost structure by over $500 million; and
|
|
•
|
Capitalizing on an opportunity to reduce risk related to our legacy pension obligation by making a voluntary offer to former employees to pay a lump sum.
|
We are an asset-rich enterprise with substantial liquidity, unencumbered real estate and well-established stand-alone businesses, including Lands' End and Sears Canada. We expect to generate at least $500 million of additional liquidity through monetization of assets over the next 12 months. In addition to our asset monetizations, we currently expect to reduce 2013 peak domestic inventory by $500 million from the 2012 level of $8.6 billion at the end of the third quarter as a result of stores already or expected to be closed, initiatives underway to reduce slow-moving inventory and modest productivity improvement. This action is expected to generate $300 million of cash after consideration of related payables. We also expect to further reduce our fixed cost base by another $200 million in 2013.
22
RESULTS OF OPERATIONS
Fiscal Year
Our fiscal year end is the Saturday closest to January 31 each year. Fiscal year 2012 consisted of 53 weeks while fiscal years 2011 and 2010 consisted of 52 weeks. Unless otherwise stated, references to years in this report relate to fiscal years rather than to calendar years. The following fiscal periods are presented in this report.
|
Fiscal year
|
Ended
|
Weeks
|
|
|
2012
|
February 2, 2013
|
53
|
|
|
2011
|
January 28, 2012
|
52
|
|
|
2010
|
January 29, 2011
|
52
|
|
23
Holdings' Consolidated Results
Holdings' consolidated results of operations for 2012, 2011 and 2010 are summarized as follows:
|
millions, except per share data
|
2012
|
2011
|
2010
|
|||||||||
|
REVENUES
|
||||||||||||
|
Merchandise sales and services
|
$
|
39,854
|
|
$
|
41,567
|
|
$
|
42,664
|
|
|||
|
COSTS AND EXPENSES
|
||||||||||||
|
Cost of sales, buying and occupancy
|
29,340
|
|
30,966
|
|
31,000
|
|
||||||
|
Gross margin dollars
|
10,514
|
|
10,601
|
|
11,664
|
|
||||||
|
Gross margin rate
|
26.4
|
%
|
25.5
|
%
|
27.3
|
%
|
||||||
|
Selling and administrative
|
10,660
|
|
10,664
|
|
10,425
|
|
||||||
|
Selling and administrative expense as a percentage of revenues
|
26.7
|
%
|
25.7
|
%
|
24.4
|
%
|
||||||
|
Depreciation and amortization
|
830
|
|
853
|
|
869
|
|
||||||
|
Impairment charges
|
330
|
|
649
|
|
—
|
|
||||||
|
Gain on sales of assets
|
(468
|
)
|
(64
|
)
|
(67
|
)
|
||||||
|
Total costs and expenses
|
40,692
|
|
43,068
|
|
42,227
|
|
||||||
|
Operating income (loss)
|
(838
|
)
|
(1,501
|
)
|
437
|
|
||||||
|
Interest expense
|
(267
|
)
|
(289
|
)
|
(293
|
)
|
||||||
|
Interest and investment income
|
94
|
|
41
|
|
36
|
|
||||||
|
Other income (loss)
|
1
|
|
(2
|
)
|
(14
|
)
|
||||||
|
Income (loss) from continuing operations before income taxes
|
(1,010
|
)
|
(1,751
|
)
|
166
|
|
||||||
|
Income tax expense
|
(44
|
)
|
(1,369
|
)
|
(27
|
)
|
||||||
|
Income (loss) from continuing operations
|
(1,054
|
)
|
(3,120
|
)
|
139
|
|
||||||
|
Income (loss) from discontinued operations, net of tax
|
—
|
|
(27
|
)
|
11
|
|
||||||
|
Net income (loss)
|
(1,054
|
)
|
(3,147
|
)
|
150
|
|
||||||
|
(Income) loss attributable to noncontrolling interests
|
124
|
|
7
|
|
(17
|
)
|
||||||
|
NET INCOME (LOSS) ATTRIBUTABLE TO HOLDINGS’ SHAREHOLDERS
|
$
|
(930
|
)
|
$
|
(3,140
|
)
|
$
|
133
|
|
|||
|
Amounts attributable to Holdings’ shareholders:
|
||||||||||||
|
Income (loss) from continuing operations, net of tax
|
$
|
(930
|
)
|
$
|
(3,113
|
)
|
$
|
122
|
|
|||
|
Income (loss) from discontinued operations, net of tax
|
—
|
|
(27
|
)
|
11
|
|
||||||
|
Net income (loss)
|
$
|
(930
|
)
|
$
|
(3,140
|
)
|
$
|
133
|
|
|||
|
NET INCOME (LOSS) PER COMMON SHARE ATTRIBUTABLE TO HOLDINGS’ SHAREHOLDERS
|
||||||||||||
|
Diluted income (loss) per share from continuing operations
|
$
|
(8.78
|
)
|
$
|
(29.15
|
)
|
$
|
1.09
|
|
|||
|
Diluted income (loss) per share from discontinued operations
|
—
|
|
(0.25
|
)
|
0.10
|
|
||||||
|
$
|
(8.78
|
)
|
$
|
(29.40
|
)
|
$
|
1.19
|
|
||||
|
Diluted weighted average common shares outstanding
|
105.9
|
|
106.8
|
|
111.7
|
|
||||||
References to comparable store sales amounts within the following discussion include sales for all stores operating for a period of at least 12 full months, including remodeled and expanded stores, but excluding store relocations and stores that have undergone format changes. In addition, comparable store sales amounts include sales from sears.com and kmart.com shipped directly to customers and have been adjusted for the change in the unshipped sales reserves recorded at the end of each reporting period. Comparable store sales results for
2012
were calculated based on the 52-week period ended January 26, 2013 as compared to the comparable 52-week period in the prior year.
24
2012
Compared to
2011
Net Loss from Continuing Operations Attributable to Holdings' Shareholders
We recorded a net loss from continuing operations attributable to Holdings' shareholders of $930 million ($8.78 loss per diluted share from continuing operations) and $3.1 billion ($29.15 loss per diluted share from continuing operations) for 2012 and 2011, respectively. Our results for
2012
and
2011
were affected by a number of significant items, including non-cash charges related to pension settlements and the impairment of goodwill balances and a $1.8 billion non-cash charge to establish a valuation allowance against our domestic deferred tax assets in 2011. Our net loss from continuing operations as adjusted for these significant items was $215 million ($2.03 loss per diluted share from continuing operations) for 2012 and $482 million ($4.52 loss per diluted share from continuing operations) for 2011. The improvement in net loss for the year reflected an improvement in gross margin rate of 90 basis points and a decrease in selling and administrative expenses, which were partially offset by a decline in gross margin dollars, given lower sales.
In addition to our net income (loss) from continuing operations determined in accordance with GAAP, for purposes of evaluating operating performance, we use an Adjusted Earnings Before Interest, Taxes, Depreciation and Amortization ("Adjusted EBITDA") measurement as well as Adjusted Earnings per Share (“Adjusted EPS”).
Adjusted EBITDA is computed as net income (loss) attributable to Sears Holdings Corporation appearing on the Statements of Operations excluding income (loss) attributable to noncontrolling interest, income tax expense, interest expense, interest and investment income, other income (loss), depreciation and amortization and gain on sales of assets. In addition, it is adjusted to exclude certain significant items as set forth below. Our management uses Adjusted EBITDA to evaluate the operating performance of our businesses, as well as executive compensation metrics, for comparable periods. Adjusted EBITDA should not be used by investors or other third parties as the sole basis for formulating investment decisions as it excludes a number of important cash and non-cash recurring items.
While Adjusted EBITDA is a non-GAAP measurement, management believes that it is an important indicator of operating performance because:
|
•
|
EBITDA excludes the effects of financings and investing activities by eliminating the effects of interest and depreciation costs;
|
|
•
|
Management considers gains/(losses) on the sale of assets to result from investing decisions rather than ongoing operations; and
|
|
•
|
Other significant items, while periodically affecting our results, may vary significantly from period to period and have a disproportionate effect in a given period, which affects comparability of results.
|
25
Adjusted EBITDA was determined as follows:
|
millions
|
2012
|
2011
|
2010
|
||||||||
|
Net income (loss) attributable to SHC per statement of operations
|
$
|
(930
|
)
|
$
|
(3,140
|
)
|
$
|
133
|
|
||
|
Income (loss) attributable to noncontrolling interest
|
(124
|
)
|
(7
|
)
|
17
|
|
|||||
|
(Income) loss from discontinued operations, net of tax
|
—
|
|
27
|
|
(11
|
)
|
|||||
|
Income tax expense
|
44
|
|
1,369
|
|
27
|
|
|||||
|
Interest expense
|
267
|
|
289
|
|
293
|
|
|||||
|
Interest and investment income
|
(94
|
)
|
(41
|
)
|
(36
|
)
|
|||||
|
Other income (loss)
|
(1
|
)
|
2
|
|
14
|
|
|||||
|
Operating income (loss)
|
(838
|
)
|
(1,501
|
)
|
437
|
|
|||||
|
Depreciation and amortization
|
830
|
|
853
|
|
869
|
|
|||||
|
Gain on sales of assets
|
(468
|
)
|
(64
|
)
|
(67
|
)
|
|||||
|
Before excluded items
|
(476
|
)
|
(712
|
)
|
1,239
|
|
|||||
|
Impairment charges
|
330
|
|
649
|
|
—
|
|
|||||
|
Pension settlements
|
455
|
|
—
|
|
—
|
|
|||||
|
Closed store reserve and severance
|
140
|
|
254
|
|
26
|
|
|||||
|
Domestic pension expense
|
165
|
|
74
|
|
120
|
|
|||||
|
Transaction costs
|
12
|
|
—
|
|
—
|
|
|||||
|
Hurricane losses
|
—
|
|
12
|
|
—
|
|
|||||
|
Adjusted EBITDA as defined
|
$
|
626
|
|
$
|
277
|
|
$
|
1,385
|
|
||
|
% to revenues
|
1.6
|
%
|
0.7
|
%
|
3.2
|
%
|
|||||
Adjusted EBITDA for our segments was as follows:
|
2012
|
2011
|
2010
|
||||||||||||||||||||||||||||||||||||||||||||||
|
millions
|
Kmart
|
Sears Domestic
|
Sears Canada
|
Sears Holdings
|
Kmart
|
Sears Domestic
|
Sears Canada
|
Sears Holdings
|
Kmart
|
Sears Domestic
|
Sears Canada
|
Sears Holdings
|
||||||||||||||||||||||||||||||||||||
|
Operating income (loss) per statement of operations
|
$
|
5
|
|
$
|
(656
|
)
|
$
|
(187
|
)
|
$
|
(838
|
)
|
$
|
(34
|
)
|
$
|
(1,447
|
)
|
$
|
(20
|
)
|
$
|
(1,501
|
)
|
$
|
353
|
|
$
|
(149
|
)
|
$
|
233
|
|
$
|
437
|
|
||||||||||||
|
Depreciation and amortization
|
147
|
|
578
|
|
105
|
|
830
|
|
149
|
|
601
|
|
103
|
|
853
|
|
149
|
|
620
|
|
100
|
|
869
|
|
||||||||||||||||||||||||
|
Gain on sales of assets
|
(37
|
)
|
(261
|
)
|
(170
|
)
|
(468
|
)
|
(34
|
)
|
(30
|
)
|
—
|
|
(64
|
)
|
(7
|
)
|
(46
|
)
|
(14
|
)
|
(67
|
)
|
||||||||||||||||||||||||
|
Before excluded items
|
115
|
|
(339
|
)
|
(252
|
)
|
(476
|
)
|
81
|
|
(876
|
)
|
83
|
|
(712
|
)
|
495
|
|
425
|
|
319
|
|
1,239
|
|
||||||||||||||||||||||||
|
Closed store reserve and severance
|
76
|
|
44
|
|
20
|
|
140
|
|
76
|
|
160
|
|
18
|
|
254
|
|
13
|
|
13
|
|
—
|
|
26
|
|
||||||||||||||||||||||||
|
Impairment charges
|
10
|
|
25
|
|
295
|
|
330
|
|
15
|
|
634
|
|
—
|
|
649
|
|
—
|
|
—
|
|
—
|
|
—
|
|
||||||||||||||||||||||||
|
Pension settlements
|
—
|
|
452
|
|
3
|
|
455
|
|
—
|
|
—
|
|
—
|
|
—
|
|
—
|
|
—
|
|
—
|
|
—
|
|
||||||||||||||||||||||||
|
Domestic pension expense
|
—
|
|
165
|
|
—
|
|
165
|
|
—
|
|
74
|
|
—
|
|
74
|
|
—
|
|
120
|
|
—
|
|
120
|
|
||||||||||||||||||||||||
|
Transaction costs
|
—
|
|
9
|
|
3
|
|
12
|
|
—
|
|
—
|
|
—
|
|
—
|
|
—
|
|
—
|
|
—
|
|
—
|
|
||||||||||||||||||||||||
|
Hurricane losses
|
—
|
|
—
|
|
—
|
|
—
|
|
—
|
|
12
|
|
—
|
|
12
|
|
$
|
—
|
|
$
|
—
|
|
$
|
—
|
|
$
|
—
|
|
||||||||||||||||||||
|
Adjusted EBITDA as defined
|
$
|
201
|
|
$
|
356
|
|
$
|
69
|
|
$
|
626
|
|
$
|
172
|
|
$
|
4
|
|
$
|
101
|
|
$
|
277
|
|
$
|
508
|
|
$
|
558
|
|
$
|
319
|
|
$
|
1,385
|
|
||||||||||||
|
% to revenues
|
1.4
|
%
|
1.7
|
%
|
1.6
|
%
|
1.6
|
%
|
1.1
|
%
|
—%
|
|
2.2
|
%
|
0.7
|
%
|
3.3
|
%
|
2.5
|
%
|
6.7
|
%
|
3.2
|
%
|
||||||||||||||||||||||||
26
We also believe that use of Adjusted EPS improves the comparability of year-to-year results and is representative of our underlying performance. We have chosen to provide this supplemental information to illustrate the results of operations giving effect to the non-GAAP adjustments shown in the reconciliations below, and to provide an additional measure of performance.
The following tables set forth results of operations on a GAAP and “As Adjusted” basis, as well as the impact each significant item used in calculating Adjusted EBITDA had on specific income and expense amounts reported in our Consolidated Statements of Operations during the years
2012
,
2011
and
2010
.
|
|
Year Ended February 2, 2013
|
|||||||||||||||||||||||||||||||||||||||
|
millions, except per share data
|
GAAP
|
Closed Store
Reserve, Store Impairments and Severance |
Gain on Sales of Assets
|
Transaction Costs
|
Goodwill Impairment
|
Pension Settlements
|
Domestic
Pension Expense |
Gain on Sale of Canadian Joint Venture
|
Tax Matters
|
As
Adjusted |
||||||||||||||||||||||||||||||
|
Cost of sales, buying and occupancy impact
|
$
|
29,340
|
|
$
|
(35
|
)
|
$
|
—
|
|
$
|
—
|
|
$
|
—
|
|
$
|
—
|
|
$
|
—
|
|
$
|
—
|
|
$
|
—
|
|
$
|
29,305
|
|
||||||||||
|
Selling and administrative impact
|
10,660
|
|
(105
|
)
|
—
|
|
(12
|
)
|
—
|
|
(455
|
)
|
(165
|
)
|
—
|
|
—
|
|
9,923
|
|
||||||||||||||||||||
|
Depreciation and amortization impact
|
830
|
|
(22
|
)
|
—
|
|
—
|
|
—
|
|
—
|
|
—
|
|
—
|
|
—
|
|
808
|
|
||||||||||||||||||||
|
Impairment charges impact
|
330
|
|
(35
|
)
|
—
|
|
—
|
|
(295
|
)
|
—
|
|
—
|
|
—
|
|
—
|
|
—
|
|
||||||||||||||||||||
|
Gain on sales of assets impact
|
(468
|
)
|
—
|
|
419
|
|
—
|
|
—
|
|
—
|
|
—
|
|
—
|
|
—
|
|
(49
|
)
|
||||||||||||||||||||
|
Operating loss impact
|
(838
|
)
|
197
|
|
(419
|
)
|
12
|
|
295
|
|
455
|
|
165
|
|
—
|
|
—
|
|
(133
|
)
|
||||||||||||||||||||
|
Interest and investment income impact
|
94
|
|
—
|
|
—
|
|
—
|
|
—
|
|
—
|
|
—
|
|
(25
|
)
|
—
|
|
69
|
|
||||||||||||||||||||
|
Income tax expense impact
|
(44
|
)
|
(74
|
)
|
157
|
|
(5
|
)
|
—
|
|
—
|
|
(62
|
)
|
9
|
|
143
|
|
124
|
|
||||||||||||||||||||
|
Loss attributable to noncontrolling interest impact
|
124
|
|
(7
|
)
|
8
|
|
—
|
|
(145
|
)
|
(1
|
)
|
—
|
|
12
|
|
—
|
|
(9
|
)
|
||||||||||||||||||||
|
After tax and noncontrolling interest impact
|
(930
|
)
|
116
|
|
(254
|
)
|
7
|
|
150
|
|
454
|
|
103
|
|
(4
|
)
|
143
|
|
(215
|
)
|
||||||||||||||||||||
|
Diluted loss per share impact
|
$
|
(8.78
|
)
|
$
|
1.09
|
|
$
|
(2.40
|
)
|
$
|
0.07
|
|
$
|
1.42
|
|
$
|
4.29
|
|
$
|
0.97
|
|
$
|
(0.04
|
)
|
$
|
1.35
|
|
$
|
(2.03
|
)
|
||||||||||
|
|
Year Ended January 28, 2012
|
|||||||||||||||||||||||||||||||||||||||
|
millions, except per share data
|
GAAP
|
Domestic
Pension Expense |
Closed Store
Reserve, Store Impairments and Severance |
Mark-to-Market Losses
|
Gain on Sales of Assets
|
Hurricane Losses
|
Goodwill Impairment
|
Tax Matters
|
Discontinued Operations
|
As Adjusted
|
||||||||||||||||||||||||||||||
|
Cost of sales, buying and occupancy impact
|
$
|
30,966
|
|
$
|
—
|
|
$
|
(130
|
)
|
$
|
—
|
|
$
|
—
|
|
$
|
—
|
|
$
|
—
|
|
$
|
—
|
|
$
|
—
|
|
$
|
30,836
|
|
||||||||||
|
Selling and administrative impact
|
10,664
|
|
(74
|
)
|
(124
|
)
|
—
|
|
—
|
|
(12
|
)
|
—
|
|
—
|
|
—
|
|
10,454
|
|
||||||||||||||||||||
|
Depreciation and amortization impact
|
853
|
|
—
|
|
(8
|
)
|
—
|
|
—
|
|
—
|
|
—
|
|
—
|
|
—
|
|
845
|
|
||||||||||||||||||||
|
Impairment charges impact
|
649
|
|
—
|
|
(98
|
)
|
—
|
|
—
|
|
—
|
|
(551
|
)
|
—
|
|
—
|
|
—
|
|
||||||||||||||||||||
|
Gain on sales of assets impact
|
(64
|
)
|
—
|
|
—
|
|
—
|
|
33
|
|
—
|
|
—
|
|
—
|
|
—
|
|
(31
|
)
|
||||||||||||||||||||
|
Operating loss impact
|
(1,501
|
)
|
74
|
|
360
|
|
—
|
|
(33
|
)
|
12
|
|
551
|
|
—
|
|
—
|
|
(537
|
)
|
||||||||||||||||||||
|
Other loss impact
|
(2
|
)
|
—
|
|
—
|
|
6
|
|
—
|
|
—
|
|
—
|
|
—
|
|
—
|
|
4
|
|
||||||||||||||||||||
|
Income tax expense impact
|
(1,369
|
)
|
(28
|
)
|
(134
|
)
|
(2
|
)
|
13
|
|
(5
|
)
|
—
|
|
1,819
|
|
—
|
|
294
|
|
||||||||||||||||||||
|
Loss from discontinued operations, net of tax impact
|
(27
|
)
|
—
|
|
—
|
|
—
|
|
—
|
|
—
|
|
—
|
|
—
|
|
27
|
|
—
|
|
||||||||||||||||||||
|
Loss attributable to noncontrolling interest impact
|
7
|
|
—
|
|
(1
|
)
|
(1
|
)
|
—
|
|
—
|
|
—
|
|
—
|
|
—
|
|
5
|
|
||||||||||||||||||||
|
After tax and noncontrolling interest impact
|
(3,140
|
)
|
46
|
|
225
|
|
3
|
|
(20
|
)
|
7
|
|
551
|
|
1,819
|
|
27
|
|
(482
|
)
|
||||||||||||||||||||
|
Diluted loss per share impact
|
$
|
(29.40
|
)
|
$
|
0.43
|
|
$
|
2.10
|
|
$
|
0.03
|
|
$
|
(0.19
|
)
|
$
|
0.07
|
|
$
|
5.16
|
|
$
|
17.03
|
|
$
|
0.25
|
|
$
|
(4.52
|
)
|
||||||||||
27
|
|
Year Ended January 29, 2011
|
|||||||||||||||||||||||||||||||||||
|
millions, except per share data
|
GAAP
|
Domestic
Pension Expense |
Closed Store
Reserve and Severance |
Mark-to-Market Losses
|
Gain on Sales
of Real Estate |
Canadian
Dividend Tax Impact |
Tax
Matters |
Discontinued Operations
|
As
Adjusted |
|||||||||||||||||||||||||||
|
Cost of sales, buying and occupancy impact
|
$
|
31,000
|
|
$
|
—
|
|
$
|
(12
|
)
|
$
|
—
|
|
$
|
—
|
|
$
|
—
|
|
$
|
—
|
|
$
|
—
|
|
$
|
30,988
|
|
|||||||||
|
Selling and administrative impact
|
10,425
|
|
(120
|
)
|
(14
|
)
|
—
|
|
—
|
|
—
|
|
—
|
|
—
|
|
10,291
|
|
||||||||||||||||||
|
Depreciation and amortization impact
|
869
|
|
—
|
|
(10
|
)
|
—
|
|
—
|
|
—
|
|
—
|
|
—
|
|
859
|
|
||||||||||||||||||
|
Gain on sales of assets impact
|
(67
|
)
|
—
|
|
—
|
|
—
|
|
35
|
|
—
|
|
—
|
|
—
|
|
(32
|
)
|
||||||||||||||||||
|
Operating income impact
|
437
|
|
120
|
|
36
|
|
—
|
|
(35
|
)
|
—
|
|
—
|
|
—
|
|
558
|
|
||||||||||||||||||
|
Other loss impact
|
(14
|
)
|
—
|
|
—
|
|
6
|
|
—
|
|
—
|
|
—
|
|
—
|
|
(8
|
)
|
||||||||||||||||||
|
Income tax expense impact
|
(27
|
)
|
(24
|
)
|
(6
|
)
|
(1
|
)
|
7
|
|
9
|
|
(13
|
)
|
—
|
|
(55
|
)
|
||||||||||||||||||
|
Income from discontinued operations, net of tax, impact
|
11
|
|
—
|
|
—
|
|
—
|
|
—
|
|
—
|
|
—
|
|
(11
|
)
|
—
|
|
||||||||||||||||||
|
Income attributable to noncontrolling interest impact
|
(17
|
)
|
—
|
|
—
|
|
(1
|
)
|
—
|
|
—
|
|
—
|
|
—
|
|
(18
|
)
|
||||||||||||||||||
|
After tax and noncontrolling interest impact
|
133
|
|
96
|
|
30
|
|
4
|
|
(28
|
)
|
9
|
|
(13
|
)
|
(11
|
)
|
220
|
|
||||||||||||||||||
|
Diluted income per share impact
|
$
|
1.19
|
|
$
|
0.86
|
|
$
|
0.27
|
|
$
|
0.04
|
|
$
|
(0.25
|
)
|
$
|
0.08
|
|
$
|
(0.12
|
)
|
$
|
(0.10
|
)
|
$
|
1.97
|
|
|||||||||
During 2012, we recorded a $455 million non-cash charge related to pension settlements as a result of the requirement to expense the unrealized actuarial losses. The charge had no effect on equity because the unrealized actuarial losses were already recognized in accumulated other comprehensive income/(loss). Accordingly, the effect on retained earnings was offset by a corresponding reduction in accumulated other comprehensive loss.
During 2011, we recorded a $1.8 billion non-cash charge to establish a valuation allowance against our domestic deferred tax assets. Accounting rules generally require that a valuation reserve be established when income has not been generated over a three-year cumulative period to support the deferred tax asset. While an accounting loss was recorded, we believe no economic loss has occurred as these net operating losses and tax benefits remain available to reduce future taxes as income is generated in subsequent periods.
Contributions to our pension plans remain a significant use of our cash on an annual basis. While the Company's pension plan is frozen, and thus associates do not currently earn pension benefits, we have a legacy pension obligation for past service performed by Kmart and Sears associates. The annual pension expense included in our financial statements related to these legacy domestic pension plans was relatively minimal in years prior to 2009. However, due to the severe decline in the capital markets that occurred in the latter part of 2008, our domestic pension expense was $165 million in 2012, $74 million in 2011 and $120 million in 2010.
During 2010, Sears Canada paid $754 million in dividends of which Holdings received $639 million. As Sears Canada is a consolidated subsidiary of Holdings, no income was recognized on the receipt of the dividend. However, Holdings did record $9 million of income tax expense related to the dividend.
Revenues and Comparable Store Sales
Revenues decreased $1.7 billion, or 4.1%, to
$39.9 billion
, as compared to revenues of
$41.6 billion
in 2011. The decline in revenue was primarily the result of having fewer Kmart and Sears Full-line stores in operation, a decrease in domestic comparable store sales of 2.5% and the separation of the Sears Hometown and Outlet businesses, partially offset by the inclusion of an additional week of revenues in 2012. The Company recorded approximately $500 million of revenues during the 53rd week of 2012. The separation of the Sears Hometown and Outlet businesses resulted in a net decrease in revenues of approximately $100 million. Additionally, Sears Canada had a 5.6% decline in comparable stores sales and revenues for the year included a decrease of $37 million due to changes in foreign currency exchange rates.
Domestic comparable store sales declined 2.5% with declines of 1.4% at Sears Domestic and 3.7% at Kmart. Excluding the consumer electronics category, total domestic comparable store sales decreased 1.4% with Sears Domestic decreasing only 0.1% and Kmart decreasing 2.8%.
The decline in comparable store sales of 1.4% at Sears Domestic was driven by decreases in consumer electronics, lawn and garden and home appliances as well as at Sears Auto Centers. These decreases were partially offset by increases in apparel and home. The Kmart decline in comparable store sales of 3.7% reflects decreases in a
28
majority of its categories, most notably the consumer electronics, pharmacy, grocery and household and drug store categories.
Gross Margin
Gross margin declined $87 million to $
10.5 billion
in 2012 from $
10.6 billion
in 2011 and included charges of $35 million and $130 million related to store closures for 2012 and 2011, respectively. Excluding these items, gross margin declined $182 million as the above noted decline in revenues was only partially offset by an improvement in gross margin rate. In addition, Sears Canada's gross margin included a decrease of $11 million related to the impact of foreign currency exchange rates.
Sears Domestic's gross margin rate improved 120 basis points in 2012 primarily due to improved margins in the apparel, home appliance and footwear categories, which were partially offset by declines in the consumer electronics category and the Lands' End customer direct business. Kmart’s gross margin rate improved 70 basis points in 2012 due to the improvement in the apparel, pharmacy and toys categories which were partially offset by a decline in the consumer electronics category. Sears Canada’s gross margin rate decreased 10 basis points in 2012 due to declines in the fitness and recreation, children's wear, jewelry, accessories and luggage and footwear categories.
Selling and Administrative Expenses
Selling and administrative expenses for 2012 were flat with the prior year and included expenses related to pension plans, store closings and severance of $725 million in 2012 and $198 million in 2011. The current year also included $12 million of transaction costs associated with strategic initiatives while 2011 included expense of $12 million related to hurricane losses in 2011. Excluding these items, selling and administrative expenses declined $531 million due to reductions in advertising, supplies and payroll expenses. Selling and administrative expenses at Sears Canada for 2012 included a decrease of $10 million related to the impact of foreign currency exchange rates.
Selling and administrative expenses as a percentage of revenues ("selling and administrative expense rate") were
26.7%
and
25.7%
for 2012 and 2011, respectively, and increased primarily as a result of the above noted charges.
Depreciation and Amortization
Depreciation and amortization expense decreased by $23 million during 2012 to $830 million and included charges of $22 million and $8 million in 2012 and 2011, respectively, taken in connection with store closings. The decrease is primarily due to having fewer assets available for depreciation.
Impairment Charges
During 2012, we recorded impairment charges of $295 million and $35 million related to the impairment of goodwill and long-lived assets, respectively. We also recorded impairment charges during 2011 of $551 million and $98 million related to the impairment of goodwill and long-lived assets, respectively. Impairment charges recorded in both years are described further in Notes 12 and 13 in Notes to Consolidated Financial Statements.
Gain on Sales of Assets
We recorded total gains on sales of assets of $468 million in 2012 and $64 million in 2011, which were primarily attributable to several real estate transactions. The gain on sale of assets in 2012 included a gain of $223 million recognized on the sale of eleven (six owned and five leased) Sears Full-line store locations to General Growth Properties for $270 million in cash proceeds, and a gain of $163 million recognized on the surrender and early termination of the leases on three properties operated by Sears Canada, under an agreement with The Cadillac Fairview Corporation Limited for which Sears Canada received $170 million Canadian in cash proceeds. In connection with these transactions, we surrendered substantially all of our rights and obligations under our preexisting lease agreements and agreed to surrender each of the premises in periods ranging from six to 23 months from the date of closing. Gain on sales of assets recorded in 2012 also included a gain of $33 million related to the sale of a store operated under The Great Indoors format, one Sears Full-line store and one Kmart store. During 2011,
29
the gain on sales of assets included a gain of $21 million recognized on the sale of two stores operated under The Great Indoors format and $12 million recognized on the sale of a store operated under the Kmart format.
Operating Loss
We recorded an operating loss of $838 million and $1.5 billion in 2012 and 2011, respectively. Operating loss for 2012 included non-cash charges related to pension settlements and the impairment of Sears Canada goodwill balances, expenses related to domestic pension plans, store closings and store impairments and severance and transaction costs, as well as the gains on sales of assets which aggregated to $705 million. Operating loss for 2011 included a non-cash charge of $551 million related to goodwill balances of certain reporting units, expenses related to domestic pension plans, store closings, severance and hurricane losses and a net gain on the sales of assets which aggregated to $964 million. Excluding these items, operating loss improved $404 million primarily due to the improvement in gross margin rate and a decrease in selling and administrative expenses, which were partially offset by a decline in gross margin dollars, given lower sales.
Interest Expense
We incurred $267 million and $289 million in interest expense during 2012 and 2011, respectively. The decrease is due to lower average outstanding borrowings.
Income Taxes
Our income tax effective rate was 4.4% in 2012 and 78.2% in 2011. The 2012 tax rate continues to reflect the effect of not recognizing the benefit of current period losses in certain domestic jurisdictions where it is not more likely than not that such benefits will be realized. The prior year tax rate is the result of significant tax matters in 2011 which included a non-cash charge of $1.8 billion to establish a valuation allowance against certain deferred income tax assets.
2011 Compared to 2010
Net Income (Loss) from Continuing Operations Attributable to Holdings' Shareholders
We recorded a net loss from continuing operations attributable to Holdings' shareholders of $3.1 billion ($29.15 loss per diluted share from continuing operations) for 2011, as compared to net income from continuing operations of $122 million ($1.09 per diluted share from continuing operations) in 2010. Our results for 2011 and 2010 were affected by a number of significant items, including a $1.8 billion non-cash charge to establish a valuation allowance against our domestic deferred tax assets in 2011. Our net loss from continuing operations as adjusted for these significant items was $482 million ($4.52 loss per diluted share from continuing operations) for 2011 and our net income from continuing operations adjusted for these similar significant items was $220 million ($1.97 per diluted share from continuing operations) for 2010. The decrease in net income for the year reflected a decrease in operating income of $1.9 billion, including the impact of non-cash impairment charges and charges related to store closures. Excluding these items, operating income declined $1.1 billion, primarily related to a decline in our gross margin dollars, given lower sales, and a decline in gross margin rate of 180 basis points, and an increase in selling and administrative expenses.
Revenues and Comparable Store Sales
Revenues decreased $1.1 billion, or 2.6%, to $41.6 billion in 2011, as compared to revenues of $42.7 billion in 2010. The decline in revenues was primarily a result of a 2.2% decrease in domestic comparable stores sales and the effect of having fewer Kmart and Sears Full-line stores in operation. Additionally, Sears Canada had a 7.7% decline in comparable store sales, which was partially offset by an increase of $171 million due to changes in the Canadian foreign exchange rate.
For the year, domestic comparable store sales declined 2.2%, with declines of 3.0% at Sears Domestic and 1.4% at Kmart. Decreases in sales at Sears Domestic were driven by appliances and consumer electronics, and were partially offset by increases in the home category. The Kmart declines in comparable store sales included decreases
30
in the consumer electronics, pharmacy, home, apparel and jewelry categories, partially offset by an increase in the grocery and household category.
Gross Margin
We generated gross margin of $10.6 billion in 2011 and $11.7 billion in 2010. The total decline in gross margin dollars of $1.1 billion was primarily driven by decreases in the gross margin rate across all of our segments, and included charges of $130 million and $12 million in 2011 and 2010, respectively, related to store closures and an increase of $51 million related to the impact of foreign currency exchange rates on gross margin at Sears Canada.
Kmart's gross margin rate declined 190 basis points in 2011 mainly due to higher commodity costs and markdowns in apparel and home, markdowns in consumer electronics, as well as declines in most other categories. Sears Domestic's gross margin rate declined 180 basis points in 2011 primarily due to reduced margins in the home appliance, consumer electronics, and Lands' End categories and declines in home services. Sears Canada's gross margin rate declined 170 basis points in 2011 as a result of clearing inventory, due to an enhanced focus on improving inventory productivity.
Selling and Administrative Expenses
Our selling and administrative expenses increased $239 million in 2011 to $10.7 billion. Domestic selling and administrative expenses increased $132 million from last year predominately due to increases in insurance and store closing expenses. Selling and administrative expenses at Sears Canada for 2011 increased $107 million from last year, and included an increase of $42 million related to the impact of foreign currency exchange rates. On a Canadian dollar basis, selling and administrative expenses increased by $65 million primarily due to increased investment in strategic projects and severance expense.
Selling and administrative expenses for 2011 included domestic pension plan expense of $74 million, store closing costs and severance of $124 million and $12 million of hurricane losses. Selling and administrative expenses for 2010 included domestic pension plan expense of $120 million and store closing costs and severance of $14 million.
Selling and administrative expenses as a percentage of revenues (“selling and administrative expense rate”) were 25.7% for 2011 and 24.4% for 2010, and increased as a result of the above noted increase in selling and administrative expenses, as well as the decline in revenues.
Depreciation and Amortization
Depreciation and amortization expense decreased by $16 million during 2011 to $853 million and included charges of $8 million and $10 million in 2011 and 2010, respectively, taken in connection with store closings. The decrease is primarily attributable to having fewer assets available for depreciation.
Impairment Charges
We recorded impairment charges of $551 million and $98 million during 2011 related to impairment of goodwill and long-lived assets, respectively. We did not record any such impairments in 2010. Impairment charges recorded during 2011 are further described in Notes 12 and 13 in Notes to Consolidated Financial Statements.
Gain on Sales of Assets
We recorded a gain on the sales of assets of $64 million during 2011 and $67 million in 2010. Gain on sales of assets for 2011 included a gain of $21 million recognized on the sale of two stores operated under The Great Indoors format and $12 million recognized on the sale of a store operated under the Kmart format. Gain on sales of assets for 2010 was impacted by the recognition of previously deferred gains on sales of assets. We sold a Sears Auto Center in October 2006, at which time we leased back the property for a period of time. Given the terms of the contract, for accounting purposes, the excess of proceeds received over the carrying value of the associated property was deferred. We closed our operations at this location during the first quarter of 2010 and, as a result, recognized a gain of $35 million on this sale at that time.
31
Operating Income (Loss)
We recorded an operating loss of $1.5 billion in 2011, as compared to operating income of $437 million in 2010. Operating loss for 2011 included a $551 million non-cash impairment charge related to goodwill balances of certain reporting units, expenses related to domestic pension plans, store closings, severance and hurricane losses, and a net gain on sales of assets, which aggregated to $964 million. Operating income for 2010 included expenses related to domestic pension plans, store closings and severance and a gain on sale of assets, which aggregated to $121 million. The decline in operating income of $1.9 billion was primarily the result of a decline in our gross margin dollars, given lower overall sales, and a decline in our gross margin rate of 180 basis points and an increase in the above noted charges.
Other Loss
Other loss is primarily comprised of mark-to-market and settlement gains and losses on Sears Canada hedge transactions. Total net mark-to-market and settlement losses of $1 million and $15 million were recorded on these transactions in 2011 and 2010, respectively. See Notes 4 and 5 to the Consolidated Financial Statements for further information regarding these transactions.
Income Taxes
Our income tax expense effective tax rate for the year was 78.2% in 2011 and 16.3% in 2010. The increase in our tax rate was primarily due to several significant tax matters, which included a non-cash charge of $1.8 billion to establish a valuation allowance against certain deferred income tax assets and the nondeductible nature of our goodwill impairment.
Business Segment Results
Kmart
Kmart results and key statistics were as follows:
|
millions, except number of stores
|
2012
|
2011
|
2010
|
||||||||
|
Merchandise sales and services
|
$
|
14,567
|
|
$
|
15,285
|
|
$
|
15,593
|
|
||
|
Comparable store sales %
|
(3.7
|
)%
|
(1.4
|
)%
|
0.8
|
%
|
|||||
|
Cost of sales, buying and occupancy
|
11,158
|
|
11,818
|
|
11,757
|
|
|||||
|
Gross margin dollars
|
3,409
|
|
3,467
|
|
3,836
|
|
|||||
|
Gross margin rate
|
23.4
|
%
|
22.7
|
%
|
24.6
|
%
|
|||||
|
Selling and administrative
|
3,284
|
|
3,371
|
|
3,341
|
|
|||||
|
Selling and administrative expense as a percentage of revenues
|
22.5
|
%
|
22.1
|
%
|
21.4
|
%
|
|||||
|
Depreciation and amortization
|
147
|
|
149
|
|
149
|
|
|||||
|
Impairment charges
|
10
|
|
15
|
|
—
|
|
|||||
|
Gain on sales of assets
|
(37
|
)
|
(34
|
)
|
(7
|
)
|
|||||
|
Total costs and expenses
|
14,562
|
|
15,319
|
|
15,240
|
|
|||||
|
Operating income (loss)
|
$
|
5
|
|
$
|
(34
|
)
|
$
|
353
|
|
||
|
Adjusted EBITDA
|
$
|
201
|
|
$
|
172
|
|
$
|
508
|
|
||
|
Total Kmart stores
|
1,221
|
|
1,305
|
|
1,307
|
|
|||||
32
2012
Compared to
2011
Revenues and Comparable Store Sales
Kmart’s revenues decreased by $718 million to
$14.6 billion
as comparable store sales decreased 3.7% in 2012. The decrease in revenue was also due to the impact of Kmart having fewer stores in operation during 2012. These declines were partially offset by the inclusion of approximately $190 million of revenues recorded in the 53rd week of 2012.
The decrease in comparable store sales of 3.7% reflects decreases in a majority of its categories, most notably in the consumer electronics, pharmacy, grocery and household, and drug store categories. Excluding the consumer electronics category, Kmart comparable store sales decreased 2.8%. The decrease in consumer electronics sales continue to be negatively impacted by price compression as well as market shifts such as moves to smartphone technology and away from digital cameras, GPS devices, MP3 players and camcorders in addition to transitions to online gaming and applications while the decrease in pharmacy sales was driven by the conversion of brand name drugs to equivalent generic drugs. The decrease in the grocery and household category was primarily attributable to competitive pressures in this category.
Gross Margin
Kmart generated $
3.4 billion
in gross margin in 2012 and $
3.5 billion
in 2011. The decrease in Kmart’s gross margin is due to the above noted decrease in sales which was partially offset an improvement in gross margin rate and included $21 million and $46 million for markdowns recorded in connection with store closings during 2012 and 2011, respectively.
Kmart’s gross margin rate increased 70 basis points to
23.4%
in 2012 from
22.7%
in 2011 mainly due to improvements in the apparel, pharmacy and toys categories which were partially offset by a decline in the consumer electronics category.
Selling and Administrative Expenses
Kmart’s selling and administrative expenses decreased $87 million in 2012. The decrease primarily reflects decreases in payroll and advertising expenses. Selling and administrative expenses for 2012 and 2011 were impacted by expenses of $55 million and $30 million, respectively, related to store closings and severance.
Kmart’s selling and administrative expense rate was
22.5%
in 2012 and
22.1%
in 2011 and increased primarily as a result of lower expense leverage due to the sales decline noted above.
Depreciation and Amortization
Depreciation and amortization expense decreased $2 million in 2012 to $147 million and included $9 million of charges taken in connection with store closings. The decrease is primarily due to having fewer assets to depreciate.
Impairment charges
We recorded impairment charges of $10 million and $15 million in 2012 and 2011, respectively, related to impairment of long-lived assets. Impairment charges recorded during 2012 and 2011 are further described in Note 13 of Notes to Consolidated Financial Statements.
Gain on Sales of Assets
Kmart recorded a total net gain on sales of assets of $37 million and $34 million in 2012 and 2011, respectively. The gains on sales of assets in 2012 included a gain of $11 million recognized on the sale of one store while 2011 included a gain of $12 million recognized on the sale of one store.
33
Operating Income (Loss)
Kmart recorded operating income of $5 million in 2012 as compared to an operating loss of $34 million in 2011. This improvement was primarily driven by the improvement in gross margin rate and a decrease in selling and administrative expenses which more than offset the above noted decrease in revenues. Operating income in 2012 included expenses related to store closing and severance costs of $85 million and store impairments of $10 million as well as a gain of $11 million related to the sale of one store. Kmart's operating loss for 2011 included expenses related to store impairments of $15 million, store closing and severance costs of $76 million as well as a gain of $12 million related to the sale of one store.
2011
Compared to
2010
Revenues and Comparable Store Sales
Kmart's total sales decreased by $308 million, as comparable store sales decreased 1.4% in 2011. The declines in revenue were primarily due to lower comparable store sales and the effect of having fewer Kmart stores in operation. The Kmart declines in comparable store sales included decreases in the consumer electronics, pharmacy, home, apparel and jewelry categories, partially offset by an increase in the grocery and household category.
Gross Margin
Kmart generated $3.5 billion in gross margin in 2011 and $3.8 billion in 2010. The decrease in gross margin dollars of $369 million was mainly driven by a decline in the gross margin rate and included charges of $46 million and $6 million for markdowns recorded in connection with store closings announced during 2011 and 2010, respectively.
Kmart's gross margin rate was 22.7% in 2011 and 24.6% in 2010. The decline of 190 basis points was mainly due to higher commodity costs and markdowns in apparel and home, as well as markdowns in consumer electronics.
Selling and Administrative Expenses
Kmart's selling and administrative expenses increased $30 million in 2011. The increase was mainly due to an increase in store closing expenses. Selling and administrative expenses were impacted by store closing costs and severance of $30 million and $7 million, in 2011 and 2010, respectively.
Kmart's selling and administrative expense rate was 22.1% in 2011 and 21.4% in 2010, and increased primarily as a result of Kmart's decline in revenues.
Impairment Charges
We recorded impairment charges of $15 million during 2011 related to impairment of long-lived assets. We did not record any such impairments in 2010. Impairment charges recorded during 2011 are further described in Note 13 in Notes to Consolidated Financial Statements.
Gain on Sales of Assets
Kmart recorded a total net gain on sales of assets of $34 million in 2011 and $7 million in 2010. The gains on sales of assets in 2011 included a gain of $12 million recognized on the sale of one store.
Operating Income (Loss)
Kmart recorded an operating loss of $34 million in 2011, as compared to operating income of $353 million in 2010. The decrease in Kmart's operating results was primarily the result of a decline in gross margin dollars, driven by the declines in the gross margin rate and revenues, and an increase in selling and administrative expenses. Kmart's operating loss for 2011 included expenses related to impairments of $15 million, store closing and severance costs of $76 million as well as a gain of $12 million related to the sale of one store. Operating income in 2010 included store closing and severance costs of $13 million.
34
Sears Domestic
Sears Domestic results and key statistics were as follows:
|
millions, except number of stores
|
2012
|
2011
|
2010
|
||||||||
|
Merchandise sales and services
|
$
|
20,977
|
|
$
|
21,649
|
|
$
|
22,275
|
|
||
|
Comparable store sales %
|
(1.4
|
)%
|
(3.0
|
)%
|
(3.1
|
)%
|
|||||
|
Cost of sales, buying and occupancy
|
15,107
|
|
15,849
|
|
15,910
|
|
|||||
|
Gross margin dollars
|
5,870
|
|
5,800
|
|
6,365
|
|
|||||
|
Gross margin rate
|
28.0
|
%
|
26.8
|
%
|
28.6
|
%
|
|||||
|
Selling and administrative
|
6,184
|
|
6,042
|
|
5,940
|
|
|||||
|
Selling and administrative expense as a percentage of revenues
|
29.5
|
%
|
27.9
|
%
|
26.7
|
%
|
|||||
|
Depreciation and amortization
|
578
|
|
601
|
|
620
|
|
|||||
|
Impairment charges
|
25
|
|
634
|
|
—
|
|
|||||
|
Gain on sales of assets
|
(261
|
)
|
(30
|
)
|
(46
|
)
|
|||||
|
Total costs and expenses
|
21,633
|
|
23,096
|
|
22,424
|
|
|||||
|
Operating loss
|
$
|
(656
|
)
|
$
|
(1,447
|
)
|
$
|
(149
|
)
|
||
|
Adjusted EBITDA
|
$
|
356
|
|
$
|
4
|
|
$
|
558
|
|
||
|
Number of:
|
|||||||||||
|
Full-line stores
(1)
|
798
|
|
867
|
|
894
|
|
|||||
|
Specialty stores
(2)
|
54
|
|
1,338
|
|
1,265
|
|
|||||
|
Total Domestic Sears Stores
|
852
|
|
2,205
|
|
2,159
|
|
|||||
__________________
|
(1)
|
2012
included
788
Full-line stores and
10
Sears Essentials/Grand stores;
2011
included
834
Full-line stores and
33
Sears Essentials/Grand stores;
2010
included
842
Full-line stores and
52
Sears Essentials/Grand stores
|
|
(2)
|
2011
and
2010
included 1,273 and 1,205 stores, respectively, of Sears Hometown and Outlet Stores, Inc.
|
2012
Compared to
2011
Revenues and Comparable Store Sales
Sears Domestic’s revenues decreased by $672 million as comparable store sales decreased 1.4%. The decline in revenue is mainly due to the impact of having fewer Sears Full-line stores in operation, the decline in comparable store sales and the separation of the Sears Hometown and Outlet businesses, partially offset by the inclusion of approximately $275 million of revenues recorded in the 53rd week of 2012. The separation of the Sears Hometown and Outlet businesses resulted in a net decrease in revenues of approximately $100 million.
The decrease of 1.4% in comparable store sales was driven by decreases in the consumer electronics, lawn and garden and home appliances categories, as well as at Sears Auto Centers. These decreases were partially offset by increases in apparel and home. Consumer electronics continues to be negatively impacted by price compression, as well as market shifts such as moves to smartphone technology and away from digital cameras, GPS devices, MP3 Players and camcorders in addition to transitions to online gaming and applications. Excluding the consumer electronics category, Sears Domestic comparable stores sales decreased only 0.1%.
Gross Margin
Sears Domestic generated gross margin dollars of $
5.9 billion
in 2012 and $
5.8 billion
in 2011 as the decline in revenues in 2012 noted above was offset by an improvement in gross margin rate. Gross margin for 2012 and 2011 included charges of $14 million and $84 million, respectively, for markdowns recorded in connection with store closings.
35
Sears Domestic’s gross margin rate was
28.0%
in 2012 and
26.8%
in 2011. The increase of 120 basis points was mainly due to improvements in the apparel, home appliance and footwear categories, which were partially offset by declines in the consumer electronics category and our Lands' End customer direct business.
Selling and Administrative Expenses
Sears Domestic’s selling and administrative expenses increased $142 million in 2012 as compared to 2011. Selling and administrative expenses for 2012 were impacted by expenses of $617 million related to pension plans and $30 million related to store closings and severance, while 2011 was impacted by expenses of $74 million related to pension plans and $76 million related to store closings and severance. Selling and administrative expenses for 2012 also included $9 million of transaction costs associated with strategic initiatives while 2011 included expense of $12 million related to hurricane losses. Excluding these items, selling and administrative expenses decreased $352 million due to declines in advertising and payroll expenses.
Sears Domestic’s selling and administrative expense rate was
29.5%
in 2012 and
27.9%
in 2011 and increased as a result of the above noted expenses.
Depreciation and Amortization
Depreciation and amortization expense decreased $23 million to $578 million during 2012 and included charges of $13 million and $8 million in 2012 and 2011, respectively, taken in connection with store closings. The decrease is primarily attributable to having fewer assets available for depreciation.
Impairment Charges
During 2012, we recorded impairment charges of $25 million related to the impairment of long-lived assets. We also recorded impairment charges during 2011 of $551 million and $98 million related to the impairment of goodwill and long-lived assets, respectively. Impairment charges recorded in both years are described further in Notes 12 and 13 in Notes to Consolidated Financial Statements.
Gain on Sales of Assets
We recorded total gains on sales of assets of $261 million in 2012 and $30 million in 2011 which were primarily attributable to several real estate transactions. The gain on sale of assets in 2012 included a gain of $223 million recognized on the sale of eleven (six owned and five leased) Sears Full-line store locations to General Growth Properties for $270 million in cash proceeds. In connection with this transaction, we surrendered substantially all of our rights and obligations under our preexisting lease agreements and agreed to surrender each of the premises in periods ranging from six to 23 months from the date of closing. Gain on sales of assets recorded in 2012 also included a gain of $22 million related to the sale of a store operated under The Great Indoors format and one Sears Full-line store. The gain on sales of assets in 2011 included a gain of $21 million recognized on the sale of two stores operated under the Great Indoors format.
Operating Loss
Sears Domestic reported an operating loss of $656 million in 2012 compared to $1.4 billion in 2011. Sears Domestic’s operating loss improved as the increase in selling and administrative expenses noted above was more than offset by lower impairment charges, an increase in the gains on sales of assets and an increase in gross margin dollars. Sears Domestic’s operating loss included expenses related to domestic pension plans and store closings and severance of $674 million and $242 million in 2012 and 2011, respectively, impairments of $25 million and $634 million in 2012 and 2011 respectively, $9 million of transaction costs associated with strategic initiatives in 2012 and hurricane losses of $12 million in 2011, as well as a gains of $245 million and $21 million in 2012 and 2011, respectively, related to the sale of real estate assets.
36
2011
Compared to
2010
Revenues and Comparable Store Sales
Sears Domestic's total sales decreased by $626 million to $21.6 billion in 2011, as comparable store sales decreased 3.0%. The decline in revenue was mainly due to the decrease in comparable store sales, as well as the impact of having fewer Sears Full-line stores in operation. The decrease in comparable store sales was primarily driven by declines in the appliances and consumer electronics categories, and were partially offset by an increase in the home category.
Gross Margin
Sears Domestic generated gross margin dollars of $5.8 billion in 2011 and $6.4 billion in 2010. The decrease of $565 million was mainly a result of a decline in Sears Domestic's gross margin rate during 2011 and included charges of $84 million and $6 million for markdowns recorded in connection with store closings announced during 2011 and 2010, respectively.
Sears Domestic's gross margin rate was 26.8% in 2011 and 28.6% in 2010. The decline of 180 basis points was primarily due to reduced margins in the home appliance, consumer electronics, and Lands' End categories and declines in home services.
Selling and Administrative Expenses
Sears Domestic's selling and administrative expenses increased $102 million to $6.0 billion in 2011. The increase was mainly due to increases in insurance and store closing expenses. Selling and administrative expenses included domestic pension plan expense of $74 million in 2011 and $120 million in 2010, store closing costs and severance of $76 in 2011 and $7 million in 2010, and hurricane losses of $12 million in 2011.
Our selling and administrative expense rate was 27.9% for 2011 and 26.7% for 2010, and increased due to the above noted increase in expense and decline in sales.
Depreciation and Amortization
Depreciation and amortization expense decreased by $19 million to $601 million during 2011, and included charges of $8 million and $10 million in 2011 and 2010, respectively, taken in connection with store closings. The decrease is primarily attributable to having fewer assets available for depreciation.
Gain on Sales of Assets
Sears Domestic recorded a total net gain on sales of assets of $30 million in 2011 and $46 million in 2010. The gains on sales of assets in 2011 included a gain of $21 million recognized on the sale of two stores operated under The Great Indoors format. The gain on sales of assets in 2010 was due to the recognition of a previously deferred gain from the October 2006 sale of one of our Sears Auto Centers. At the time of the sale, we leased back the property for a period of time. Given the terms of the contract, for accounting purposes, the excess of proceeds received over the carrying value of the associated property was deferred. We closed our operations at this location during the first quarter of 2010 and, as a result, recognized a gain of $35 million on this sale at that time.
Impairment Charges
We recorded impairment charges of $551 million and $83 million during 2011 related to impairment of goodwill and long-lived assets, respectively. We did not record any such impairments in 2010. Impairment charges recorded during 2011 are further described in Notes 12 and 13 in Notes to Consolidated Financial Statements.
Operating Loss
Sears Domestic reported an operating loss of $1.4 billion in 2011 and $149 million in 2010. The increase in Sears Domestic's operating loss was primarily the result of lower gross margin dollars, driven by declines in the gross margin rate and revenues, and the impairment charges noted above. Sears Domestic's operating loss included
37
expenses related to impairments of $634 million in 2011, domestic pension plans and store closing costs and severance of $242 million in 2011 and $143 million in 2010, hurricane losses of $12 million in 2011, as well as gains of $21 million and $35 million in 2011 and 2010, respectively, related to the sale of real estate.
Sears Canada
Sears Canada, a consolidated,
51%
-owned subsidiary of Sears, conducts similar retail operations as Sears Domestic. Sears Canada results and key statistics were as follows:
|
millions, except number of stores
|
2012
|
2011
|
2010
|
||||||||
|
Merchandise sales and services
|
$
|
4,310
|
|
$
|
4,633
|
|
$
|
4,796
|
|
||
|
Comparable store sales %
|
(5.6
|
)%
|
(7.7
|
)%
|
(4.0
|
)%
|
|||||
|
Cost of sales, buying and occupancy
|
3,075
|
|
3,299
|
|
3,333
|
|
|||||
|
Gross margin dollars
|
1,235
|
|
1,334
|
|
1,463
|
|
|||||
|
Gross margin rate
|
28.7
|
%
|
28.8
|
%
|
30.5
|
%
|
|||||
|
Selling and administrative
|
1,192
|
|
1,251
|
|
1,144
|
|
|||||
|
Selling and administrative expense as a percentage of revenues
|
27.7
|
%
|
27.0
|
%
|
23.9
|
%
|
|||||
|
Depreciation and amortization
|
105
|
|
103
|
|
100
|
|
|||||
|
Impairment charges
|
295
|
|
—
|
|
—
|
|
|||||
|
Gain on sales of assets
|
(170
|
)
|
—
|
|
(14
|
)
|
|||||
|
Total costs and expenses
|
4,497
|
|
4,653
|
|
4,563
|
|
|||||
|
Operating income (loss)
|
$
|
(187
|
)
|
$
|
(20
|
)
|
$
|
233
|
|
||
|
Adjusted EBITDA
|
$
|
69
|
|
$
|
101
|
|
$
|
319
|
|
||
|
Number of:
|
|
||||||||||
|
Full-line stores
|
118
|
|
122
|
|
122
|
|
|||||
|
Specialty stores
|
357
|
|
378
|
|
361
|
|
|||||
|
Total Sears Canada Stores
|
475
|
|
500
|
|
483
|
|
|||||
2012
Compared to
2011
Revenues and Comparable Store Sales
Sears Canada’s revenues decreased $323 million for 2012 as compared to the same period last year and included a $37 million decrease due to the impact of exchange rates during the year. On a Canadian dollar basis, revenues decreased by $286 million predominately due to a 5.6% decrease in comparable store sales primarily due to sales decreases in the tools, lawn and garden, electronics, bed and bath, women's apparel and menswear categories, partially offset by an increase in major appliances. These declines were partially offset by the inclusion of approximately $35 million of revenues recorded in the 53rd week of 2012.
Gross Margin
Gross margin dollars decreased $99 million in 2012 to $
1.2 billion
and included an $11 million decrease due to the impact of exchange rates. Gross margin decreased $88 million on a Canadian dollar basis. Sears Canada’s gross margin rate decreased 10 basis points to
28.7%
, in 2012 from
28.8%
in 2011, due to decreases in the fitness and recreation, children's wear, jewelry, accessories and luggage, and footwear categories.
Selling and Administrative Expenses
For 2012, Sears Canada’s selling and administrative expenses decreased $59 million, and included a decrease of $10 million due to the impact of exchange rates. On a Canadian dollar basis, selling and administrative expenses
38
decreased by $49 million primarily due to decreases in advertising. Selling and administrative expenses for 2012 included expenses of $20 million related to store closings and severance, $3 million related to pension settlements and $3 million of transaction costs associated with strategic initiatives. Selling and administrative expenses for 2011 included severance expenses of $18 million.
Sears Canada’s selling and administrative expense rate was
27.7%
in 2012 and
27.0%
in 2011 and increased primarily due to the above noted decline in revenues.
Impairment Charges
We recorded impairment charges of $295 million in 2012 related to goodwill. We did not record any such impairments in 2011. Impairment charges recorded are further described in Note12 of Notes to Consolidated Financial Statements.
Gain on Sales of Assets
We recorded a total gain on sales of assets of $170 million in 2012 which included a gain of $163 million recognized on the surrender and early termination of the leases on three properties under an agreement with The Cadillac Fairview Corporation Limited for which Sears Canada received $170 million Canadian in cash proceeds. In connection with this transaction, we surrendered substantially all of our rights and obligations under our preexisting lease agreements and agreed to surrender each of the premises in six months from the date of closing.
Operating Loss
Sears Canada recorded an operating loss of $187 million and $20 million in 2012 and 2011, respectively. Operating loss in 2012 included expenses of $20 million related to store closings and severance, $3 million related to pension settlements and $3 million of transaction costs associated with strategic initiatives, as well as an impairment charge of $295 million and a gain on sales of assets of $163 million in 2012. Operating loss in 2011 included expenses related to store closings and severance of $18 million. The increase in operating loss was primarily due to the decline in sales, partially offset by the gain on sales of assets noted above as well as the decrease in selling and administrative expenses.
2011 Compared to 2010
Revenues and Comparable Store Sales
Sears Canada's revenues decreased by $163 million in 2011 to $4.6 billion and included a $171 million increase due to the impact of exchange rates. On a Canadian dollar basis, revenues decreased by $334 million, due to a 7.7% decline in comparable store sales primarily attributable to sales declines in the hardlines and home categories, with industry-wide price compression and aggressive competition affecting sales in major appliances, electronics and home décor products. Revenue in the apparel and accessories categories also experienced declines primarily in women's wear and men's wear.
Gross Margin
Total gross margin dollars decreased $129 million to $1.3 billion for 2011 and included a $51 million increase due to the impact of exchange rates. Gross margin decreased $180 million on a Canadian dollar basis primarily as a result of a decline in gross margin rate. Sears Canada's margin rate decreased 170 basis points to 28.8% in 2011, from 30.5% in 2010, as a result of clearing inventory, due to an enhanced focus on improving inventory productivity.
Selling and Administrative Expenses
Sears Canada's selling and administrative expenses increased $107 million to $1.3 billion in 2011, and included an increase of $42 million due to the impact of exchange rates and severance expenses of $18 million recorded during 2011. On a Canadian dollar basis, selling and administrative expenses increased by $65 million primarily due to increased investment in strategic projects and the above noted severance expense.
39
Sears Canada's selling and administrative expense rate was 27.0% in 2011 and 23.9% in 2010, and increased primarily due to the above noted increase in expenses and decrease in sales.
Operating Income (Loss)
Sears Canada recorded an operating loss of $20 million in 2011 and operating income of $233 million in 2010. The $253 million decrease in operating results primarily reflects the above noted declines, on a Canadian dollar basis, in sales and gross margin, and the increase in selling and administrative expenses.
ANALYSIS OF CONSOLIDATED FINANCIAL CONDITION
Cash Balances
Our cash and cash equivalents include all highly liquid investments with original maturities of three months or less at the date of purchase. Our cash balances as of
February 2, 2013
and
January 28, 2012
are detailed in the following table.
|
millions
|
February 2,
2013 |
January 28,
2012 |
|||||
|
Domestic
|
|||||||
|
Cash and equivalents
|
$
|
227
|
|
$
|
182
|
|
|
|
Cash posted as collateral
|
20
|
|
20
|
|
|||
|
Credit card deposits in transit
|
133
|
|
155
|
|
|||
|
Total domestic cash and cash equivalents
|
380
|
|
357
|
|
|||
|
Sears Canada
|
229
|
|
390
|
|
|||
|
Total cash and cash equivalents
|
609
|
|
747
|
|
|||
|
Restricted cash
|
9
|
|
7
|
|
|||
|
Total cash balances
|
$
|
618
|
|
$
|
754
|
|
|
We had total cash balances of
$618 million
at
February 2, 2013
and
$754 million
at
January 28, 2012
. The decrease in cash during 2012 was primarily due to uses of cash for contributions to our pension and postretirement benefit plans of $593 million, capital expenditures of $378 million and repayments of long-term debt of $335 million, partially offset by cash generated from the sale of properties of $532 million and from the separation of Sears Hometown and Outlet Stores, Inc. of $447 million, as well as reductions in working capital needs.
At various times, we have posted cash collateral for certain outstanding letters of credit and self-insurance programs. Such cash collateral is classified within cash and cash equivalents given we have the ability to substitute letters of credit at any time for this cash collateral and it is therefore readily available to us.
Our invested cash may include, from time to time, investments in, but not limited to, commercial paper, federal, state and municipal government securities, floating-rate notes, repurchase agreements and money market funds. Cash amounts held in these short-term investments are readily available to us.
Credit card deposits in transit include deposits in transit from banks for payments related to third-party credit card and debit card transactions.
Restricted cash consists of cash related to Sears Canada’s balances, which have been pledged as collateral for letters of credit obligations issued under its offshore merchandise purchasing program and with counterparties related to outstanding derivative contracts, as well as funds held in trust in accordance with regulatory requirements governing advance ticket sales related to Sears Canada’s travel business.
We classify outstanding checks in excess of funds on deposit within other current liabilities and reduce cash balances when these checks clear the bank on which they were drawn. Outstanding checks in excess of funds on deposit were $114 million and $68 million as of
February 2, 2013
and
January 28, 2012
, respectively.
40
Investment of Available Capital
Since the Merger, we have continued to invest in our businesses to transform the customer experience as the retail industry evolves and provide the opportunity for attractive returns. Further, through February 2, 2013, we have repurchased approximately $6.0 billion of our common shares since the Merger and may continue to repurchase shares subject to market conditions and board authorization. In addition, we may pursue investments in the form of acquisitions, joint ventures, and partnerships where we believe appropriate returns can be obtained.
Our Board of Directors has delegated authority to direct investment of our surplus cash to our Chairman and Chief Executive Officer, Edward S. Lampert, subject to various limitations that have been or may be from time to time adopted by the Board of Directors and/or Finance Committee of the Board of Directors.
Operating Activities and Cash Flows
The Company used $303 million of cash in its continuing operations during 2012 and $307 million during 2011 as the decrease in our net loss in 2012 compared to the prior year was offset by increases in contributions to our pension and postretirement benefit plans. Our primary source of operating cash flows is the sale of goods and services to customers, while the primary use of cash in operations is the purchase of merchandise inventories.
The Company used $307 million in cash flows in its continuing operations during 2011 and generated $77 million of cash in its continuing operations in 2010. We used more cash in 2011 compared to 2010 mainly as a result of our net loss in 2011 and an increase in contributions to our pension and postretirement benefit plans, partially offset by a decrease in other working capital needs.
Merchandise inventories were $
7.6 billion
at
February 2, 2013
and $
8.4 billion
at
January 28, 2012
. Merchandise payables were $
2.8 billion
at
February 2, 2013
and $
2.9 billion
at
January 28, 2012
. Our Domestic inventory balances decreased approximately $895 million from $7.7 billion at
January 28, 2012
to $6.8 billion at
February 2, 2013
. Excluding the inventory related to the Sears Hometown and Outlet store businesses, domestic inventory decreased $501 million from the prior year due to both improved productivity and store closures. Sears Domestic inventory decreased in virtually all categories, with the most notable decreases in the consumer electronics, home appliances, home and tools and paint categories. Kmart inventory also decreased in virtually all categories with the most notable decreases in the consumer electronics, pharmacy and drug and grocery and household categories. Sears Canada’s inventory levels increased approximately $46 million from $745 million at
January 28, 2012
to $791 million at
February 2, 2013
, primarily due to the timing of merchandise receipts and a reduction in reserves due to improved inventory quality.
Investing Activities and Cash Flows
We generated net cash flows from investing activities from continuing operations of $191 million in 2012, compared to net cash flows used in investing activities from continuing operations of $352 million and $391 million in 2011 and 2010, respectively.
For 2012, net cash flows generated from investing activities included cash proceeds from the sales of properties of $532 million and $37 million from changes in investments and restricted cash, which were partially offset by cash used for capital expenditures of $378 million. Net cash flows used in investing activities from continuing operations in 2011and 2010 was primarily used for purchases of property and equipment.
We spent $378 million, $432 million, and $ 426 million during 2012, 2011 and 2010, respectively. Capital expenditures during 2012 included investments in online and mobile shopping capabilities, enhancements to the SHOP YOUR WAY Membership platform, information technology infrastructure, and store maintenance. Capital expenditures in 2011 included investments in online initiatives, information technology infrastructure, in-home consultative sales technology, and maintenance for stores and distribution centers. Capital expenditures during 2010 included investments in online initiatives, information technology and infrastructure for stores and distribution centers.
We anticipate 2013 capital expenditure levels to be similar to 2012 levels. It should be noted that in the normal course of business, we consider opportunities to purchase leased operating properties, as well as offers to sell owned, or assign leased, operating and non-operating properties. These transactions may, individually or in the aggregate, result in material proceeds or outlays of cash and cause our capital expenditure levels to vary from period
41
to period. In addition, we review leases that will expire in the short term in order to determine the appropriate action to take with respect to them. During 2012, we purchased one previously leased operating property for $6 million while in 2011, we purchased five previously leased operating properties for $17 million. We did not make any such purchases 2010.
Financing Activities and Cash Flows
Net cash used in financing activities from continuing operations was $27 million in 2012 and $64 million in 2010, while, in 2011, the Company generated net cash from financing activities of $47 million. Financing activities for 2012 included gross cash proceeds of $446.5 million as a result of the separation of SHO, which consisted of $346.5 million in cash proceeds received for the sale of SHO common shares and $100 million received through a dividend from SHO prior to the separation. The proceeds received were used to fund repayments on our domestic revolving credit facility. The financing activities in 2011 reflect an increase in debt to fund operations, and common share repurchase activity while the financing activities in 2010 reflect purchases of Sears Canada shares, debt repayments and common share repurchase activity, which were funded in part from $1.25 billion of proceeds from our senior secured notes offering in October 2010.
Repayments of long-term debt were $335 million, $611 million and $358 million in 2012, 2011 and 2010, respectively. These repayments were offset by gross cash proceeds of $446.5 million as a result of the separation of SHO in 2012, an increase of $815 million in total short-term borrowings and proceeds of $104 million from Sears Canada's credit facility in 2011, and $1.4 billion in proceeds from debt issuance in 2010.
In 2010, we took various financing actions to extend our capital structure. These actions included Holdings issuing $1.25 billion of 6 5/8% senior secured notes due 2018 which are secured by domestic inventory and credit card accounts receivable and Sears Canada entering into a five-year $800 million Canadian credit facility which is secured by a first lien on Sears Canada's inventory and receivable balances.
During 2010, we acquired approximately 19 million additional Sears Canada common shares. We paid a total of $560 million for the additional shares. In addition, Sears Canada purchased and cancelled approximately 2.2 million common shares during 2010 under its Normal Course Issuer Bid, at a cost of $43 million. Sears Canada declared and paid cash dividends of $7.00 Canadian per common share, or approximately $754 million Canadian ($708 million U.S.). Accordingly, Sears Canada paid $69 million to minority shareholders in connection with these dividends. For further information, see Note 2 of Notes to Consolidated Financial Statements.
During 2012, we did not repurchase any of our common shares under our share repurchase program. We did repurchase
$183 million
and $394 million of our common stock pursuant to our common share repurchase program in 2011 and 2010, respectively. The common share repurchase program was initially announced in 2005 and had a total authorization since inception of the program of $6.5 billion. At
February 2, 2013
, we had approximately
$504 million
of remaining authorization under the program. The common share repurchase program has no stated expiration date and share repurchases may be implemented using a variety of methods, which may include open market purchases, privately negotiated transactions, block trades, accelerated share repurchase transactions, the purchase of call options, the sale of put options or otherwise, or by any combination of such methods.
Uses and Source of Liquidity
Our primary need for liquidity is to fund working capital requirements of our businesses, capital expenditures and for general corporate purposes, including debt repayment, pension plan contributions and common share repurchases. We consider ourselves to be an asset-rich enterprise with substantial liquidity and financial flexibility benefiting from multiple funding resources such as our $3.275 billion domestic revolving credit facility through April 2016, an $800 million Canadian revolving credit facility through September 2015, which may be subject to potential reserves, and $1.24 billion of senior secured notes due in 2018. Further, there is approximately $338 million of remaining Sears debt from the Merger. These funding resources are described in more detail below. At
February 2, 2013
, we had liquid assets of $5.4 billion consisting of cash balances of
$618 million
and $4.8 billion of inventory, net of payables.
The domestic revolving credit facility and senior secured notes are firmly in place for the next several years and are supported by an asset base which includes $6.8 billion of inventory, owned and leased real estate assets,
42
market leading proprietary brands such as Kenmore, Craftsman and DieHard, and well-established stand-alone businesses such as Lands’ End and Sears Canada. This asset base provides us flexibility as we continue to transform our business.
We took several actions in 2012 to enhance our financial flexibility, generate liquidity and financially de-risk our Company. By transforming our Company to a more nimble, less asset-intensive business model, we are reducing the level of risk in our operational structure and balance sheet while concurrently improving the returns on our invested capital. The focus of this model is to win in the new retail marketplace by leveraging our stores, brands, online channels, social media assets and membership programs as an integrated retailer.
In summary, our actions positively impacted our liquidity by $1.8 billion, even after consideration of the $203 million domestic pension contribution we chose to make in September 2012, while unlocking the value in our asset portfolio. These actions have included:
|
•
|
the separation of our Sears Hometown and Outlet businesses through a rights offering transaction, which generated gross proceeds of approximately $447 million;
|
|
•
|
the partial spin-off of 45% of Sears Canada;
|
|
•
|
the execution of various real estate transactions which generated cash proceeds of approximately $440 million;
|
|
•
|
Reducing inventory by nearly $1.0 billion below last year's level and adjusting our promotional cadence to be more targeted;
|
|
•
|
Reducing our fixed cost structure by over $500 million; and
|
|
•
|
Capitalizing on an opportunity to reduce risk related to our legacy pension obligation by making a voluntary offer to former employees to pay a lump sum.
|
We expect to generate at least $500 million in additional liquidity through monetization of assets over the next 12 months through selective actions that are consistent with our focus on creating long-term value. The exact form and amount will depend on specific circumstances and opportunities, including market conditions. In addition to our asset monetizations, we currently expect to reduce 2013 peak domestic inventory by $500 million from the 2012 level of $8.6 billion at the end of the third quarter as a result of stores already or expected to be closed, initiatives underway to reduce slow-moving inventory and modest productivity improvement. This action is expected to generate $300 million of cash after consideration of related payables. We also expect to further reduce our fixed cost base by another $200 million in 2013.
Our outstanding borrowings at
February 2, 2013
and
January 28, 2012
were as follows:
|
millions
|
February 2,
2013 |
January 28,
2012 |
|||||
|
Short-term borrowings:
|
|||||||
|
Unsecured commercial paper
|
$
|
345
|
|
$
|
337
|
|
|
|
Secured borrowings
|
749
|
|
838
|
|
|||
|
Long-term debt, including current portion:
|
|||||||
|
Notes and debentures outstanding
|
1,593
|
|
1,863
|
|
|||
|
Capitalized lease obligations
|
433
|
|
455
|
|
|||
|
Total borrowings
|
$
|
3,120
|
|
$
|
3,493
|
|
|
Domestic Credit Agreement
During the first quarter of 2011, we entered into a
$3.275 billion
credit agreement (the “Domestic Credit Agreement”) which expires in April 2016. We view this credit facility as our most cost efficient funding mechanism and therefore use it as a primary source of funding.
Advances under the Domestic Credit Agreement bear interest at a rate equal to, at the election of the Borrowers, either the London Interbank Offered Rate (“LIBOR”) or a base rate, in either case plus an applicable margin. The Domestic Credit Agreement’s interest rates for LIBOR-based borrowings vary based on leverage in the range of LIBOR plus
2.0%
to
2.5%
. Interest rates for base rate-based borrowings vary based on leverage in the
43
range of the applicable base rate plus
1.0%
to
1.5%
. Commitment fees are in a range of
0.375%
to
0.625%
based on usage.
The Domestic Credit Agreement includes a
$1.5 billion
letter of credit sub-limit and an uncommitted accordion feature that provides us the flexibility, subject to certain terms and conditions, to use the existing collateral under the credit facility to obtain an aggregate amount of up to
$1.0 billion
in additional borrowing capacity. The Domestic Credit Agreement permits aggregate second lien indebtedness of up to
$2.0 billion
, of which
$1.2 billion
in second lien notes were outstanding at
February 2, 2013
, providing the Company the capacity to issue up to an additional
$760 million
in second lien indebtedness. The Domestic Credit Agreement is in place as a funding source for general corporate purposes and is an asset based revolving credit facility under which Sears Roebuck Acceptance Corp. (“SRAC”) and Kmart Corporation are the borrowers. The Domestic Credit Agreement is secured by a first lien on most of our domestic inventory and credit card and pharmacy receivables, and is subject to a borrowing base formula to determine availability.
The Domestic Credit Agreement limits our ability to make restricted payments, including dividends and share repurchases, under certain circumstances, including if availability under the credit facility, as defined, is less than
15%
. It also imposes various other requirements, which take effect if availability falls below designated thresholds, including a cash dominion requirement and a requirement that the fixed charge ratio at the last day of any quarter be not less than
1.0
to 1.0.
At
February 2, 2013
and
January 28, 2012
, we had
$749 million
and
$838 million
respectively, of borrowings and
$754 million
and
$626 million
, respectively, of letters of credit outstanding under the Domestic Credit Agreement. As a result, our availability under the agreement was
$1.8 billion
at both
February 2, 2013
and
January 28, 2012
. The majority of the letters of credit outstanding are used to provide collateral for our insurance programs.
Senior Secured Notes
In October 2010, we sold
$1 billion
aggregate principal amount of senior secured notes (the “Notes”), which bear interest at 6 5/8% per annum and mature on
October 15, 2018
. Concurrent with the closing of the sale of the Notes, the Company sold
$250 million
aggregate principal amount of Notes to the Company’s domestic pension plan in a private placement. The Notes are guaranteed by certain subsidiaries of the Company and are secured by a security interest in certain assets consisting primarily of domestic inventory and credit card receivables (the “Collateral”). The lien that secures the Notes is junior in priority to the lien on such assets that secures obligations under the Domestic Credit Agreement, as well as certain other first priority lien obligations. The Company used the net proceeds of this offering to repay borrowings outstanding under a previous domestic credit agreement on the settlement date and to fund the working capital requirements of our retail businesses, capital expenditures and for general corporate purposes. The indenture under which the Notes were issued contains restrictive covenants that, among other things, (1) limit the ability of the Company and certain of its domestic subsidiaries to create liens and enter into sale and leaseback transactions and (2) limit the ability of the Company to consolidate with or merge into, or sell other than for cash or lease all or substantially all of its assets to, another person. The indenture also provides for certain events of default, which, if any were to occur, would permit or require the principal and accrued and unpaid interest on all the then outstanding notes to be due and payable immediately. Generally, the Company is required to offer to repurchase all outstanding Notes at a purchase price equal to
101%
of the principal amount if the borrowing base (as calculated pursuant to the indenture) falls below the principal value of the notes plus any other indebtedness for borrowed money that is secured by liens on the Collateral for two consecutive quarters or upon the occurrence of certain change of control triggering events. The Company may call the Notes at a premium based on the “Treasury Rate” as defined in the indenture, plus
50
basis points. On September 6, 2011, we completed our offer to exchange the Notes held by nonaffiliates for a new issue of substantially identical notes registered under the Securities Act of 1933, as amended.
Sears Canada Credit Agreement
In September 2010, Sears Canada entered into a
five
-year,
$800 million
Canadian senior secured revolving credit facility (the “Sears Canada Facility”). The Sears Canada Facility is available for Sears Canada’s general corporate purposes and is secured by a first lien on inventory and credit card receivables. Availability under the
44
Sears Canada Facility is determined pursuant to a borrowing base formula based on inventory and credit card receivables, subject to certain limitations. At
February 2, 2013
we had
no
borrowings outstanding under the Sears Canada Facility. At
January 28, 2012
, we had approximately
$101 million
(
$101 million
Canadian) of borrowings outstanding under the Sears Canada Facility. Availability under this agreement was approximately
$503 million
(
$502 million
Canadian) and
$415 million
(
$415 million
Canadian), respectively, at
February 2, 2013
and
January 28, 2012
. The current availability may be reduced by reserves currently estimated by the Company to be approximately
$300 million
, which may be applied by the lenders at their discretion pursuant to the Credit Facility agreement. As a result of judicial developments relating to the priorities of pension liability relative to certain secured obligations, Sears Canada has executed an amendment to the Sears Canada Credit Facility which would provide additional security to lenders, with respect to the Company's unfunded pension liability by pledging certain real estate assets as collateral thereby partially reducing the potential reserve amounts by up to
$150 million
the lenders could apply. The potential additional reserve amount may increase or decrease in the future based on estimated net pension liabilities.
Letters of Credit Facility
Effective March 15, 2013, we agreed to terminate our $500 million uncommitted letter of credit facility dated January 20, 2011 with Wells Fargo Bank, National Association ("Wells Fargo") in advance of the scheduled termination date of January 20, 2014, as no letters of credit have been issued and outstanding under the facility since May 2011. The facility was secured by a first priority lien on cash placed on deposit at Wells Fargo in an amount equal to 103% of the face value of all issued and outstanding letters of credit.
Debt Repurchase Authorization
In 2005, our Finance Committee of the Board of Directors authorized the repurchase, subject to market conditions and other factors, of up to
$500 million
of our outstanding indebtedness in open market or privately negotiated transactions. Our wholly owned finance subsidiary, Sears Roebuck Acceptance Corp. (“SRAC”), has repurchased
$215 million
of its outstanding notes. In 2011, Sears Holdings repurchased
$10 million
of senior secured notes, recognizing a gain of
$2 million
. The unused balance of this authorization is
$275 million
Unsecured Commercial Paper
We borrow through the commercial paper markets. At
February 2, 2013
and
January 28, 2012
, we had outstanding commercial paper borrowings of
$345 million
and
$337 million
, respectively. ESL held
$285 million
and
$250 million
, respectively, of our commercial paper at
February 2, 2013
and
January 28, 2012
, including
$169 million
and
$130 million
, respectively, held by Edward S. Lampert. See Note 15 for further discussion of these borrowings.
Debt Ratings
Our corporate family debt ratings at
February 2, 2013
appear in the table below:
|
Moody’s
Investors Service |
|
Standard & Poor’s
Ratings Services |
|
Fitch Ratings
|
|
B3
|
|
CCC+
|
|
CCC
|
Domestic Pension Plan Funding
Contributions to our pension plans remain a significant use of our cash on an annual basis. While the Company's pension plan is frozen, and thus associates do not currently earn pension benefits, the company has a legacy pension obligation for past service performed by Kmart and Sears associates. During
2012
, we contributed
$516 million
to our domestic pension plans. We estimate that the domestic pension contribution will be
$352 million
in
2013
and approximately
$510 million
in
2014
, though the ultimate amount of pension contributions could be affected by changes in the applicable regulations as well as financial market and investment performance.
45
As previously reported, on July 6, 2012, federal legislation signed into law allows pension plan sponsors to use higher interest rate assumptions in valuing plan liabilities and determining funding obligations. As a result of this legislation, the Company's domestic pension plan was within
$203 million
of being
80%
funded under applicable law. In order to reduce the risks of gross pension obligations, the Company elected to contribute an additional
$203 million
to its domestic pension plan on September 14, 2012, after which its domestic pension plan was
80%
funded under applicable law.
Effective September 17, 2012, the Company amended its domestic pension plan, primarily related to lump sum benefit eligibility, and began notifying certain former employees of the Company of its offer to pay those employees' pension benefit in a lump sum. These amendments did not have a significant impact on our plan. Former employees eligible for the voluntary lump sum payment option are generally those who are vested traditional formula participants of the Plan who terminated employment prior to January 1, 2012 and who have not yet started receiving monthly payments of their pension benefits.
The Company offered the one-time voluntary lump sum window in an effort to reduce its long-term pension obligations and ongoing annual pension expense. This voluntary offer was made to approximately
86,000
eligible terminated vested participants, representing approximately
$2.0 billion
of the Company's total qualified pension plan liabilities. Eligible participants had until November 19, 2012 to make their election. The Company made payments of approximately $1.5 billion to employees who made the election in December 2012 and funded the payments from existing pension plan assets. In connection with this transaction, the Company incurred a non-cash charge to operations of approximately $452 million pre-tax in the fourth quarter of 2012 as a result of the requirement to expense the unrealized actuarial losses. The charge had no effect on equity because the unrealized actuarial losses are already recognized in accumulated other comprehensive income/(loss). Accordingly, the effect on retained earnings was offset by a corresponding reduction in accumulated other comprehensive loss.
Wholly owned Insurance Subsidiary and Intercompany Securities
We have numerous types of insurable risks, including workers’ compensation, product and general liability, automobile, warranty, asbestos and environmental claims and the extended service contracts we sell to our customers. In addition, we provide credit insurance to third party creditors of the Company to mitigate their credit risk with the Company. The associated risks are managed through Holdings’ wholly owned insurance subsidiary, Sears Reinsurance Company Ltd. (“Sears Re”), a Bermuda Class 3 insurer.
In accordance with applicable insurance regulations, Sears Re holds marketable securities to support the insurance coverage it provides. Sears utilizes two securitization structures to issue specific securities in which Sears Re invests its capital to fund its insurance obligations. In November 2003, Sears formed a Real Estate Mortgage Investment Conduit, or REMIC. The real estate associated with
125
Full-line stores was contributed to indirect wholly owned subsidiaries of Sears, and then leased back to Sears. The contributed stores were mortgaged and the REMIC issued securities that are secured by the mortgages and collateral assignments of the store leases. Sears Re and two other indirect wholly owned subsidiaries of Holdings own
$1.3 billion
(par value) of these mortgage-backed securities. Payments to Sears Re on these securities are funded by the lease payments. In May 2006, a subsidiary of Holdings contributed the rights to use the Kenmore, Craftsman and DieHard trademarks in the U.S. and its possessions and territories to KCD IP, LLC, an indirect wholly owned subsidiary of Holdings. KCD IP, LLC has licensed the use of the trademarks to subsidiaries of Holdings, including Sears and Kmart. Asset-backed securities with a par value of
$1.8 billion
were issued by KCD IP, LLC and subsequently purchased by Sears Re, the collateral for which includes the trademark rights and royalty income. Payments to Sears Re on these asset-backed securities are funded by the royalty payments. The issuers of these mortgage-backed and asset-backed securities and the owners of these real estate and trademark assets are bankruptcy remote, special purpose entities that are indirect wholly owned subsidiaries of Holdings. Cash flows received from rental streams and licensing fee streams paid by Sears, Kmart, other affiliates and third parties, are used for the payment of fees and interest on these securities. Since the inception of the REMIC and KCD IP, LLC, these mortgage-backed and asset-backed securities have been entirely held by our wholly owned consolidated subsidiaries in support of our insurance activities. At
February 2, 2013
and
January 28, 2012
, the net book value of the securitized trademark rights was approximately
$1.0 billion
. The net book value of the securitized real estate assets was approximately
$0.8 billion
at
February 2, 2013
and
January 28, 2012
.
46
Contractual Obligations and Off-Balance Sheet Arrangements
Information concerning our obligations and commitments to make future payments under contracts such as debt and lease agreements, and under contingent commitments, is aggregated in the following tables.
|
|
Total
|
Payments Due by Period
|
|||||||||||||||||||||
|
Contractual Obligations
|
Within 1 Year
|
1-3 Years
|
4-5 Years
|
After 5 Years
|
Other
|
||||||||||||||||||
|
millions
|
|
|
|
|
|
|
|||||||||||||||||
|
Operating leases
|
$
|
4,535
|
|
$
|
720
|
|
$
|
1,148
|
|
$
|
739
|
|
$
|
1,928
|
|
$
|
—
|
|
|||||
|
Short-term debt
|
1,094
|
|
1,094
|
|
—
|
|
—
|
|
—
|
|
—
|
|
|||||||||||
|
Capital lease obligations
|
643
|
|
113
|
|
201
|
|
125
|
|
204
|
|
—
|
|
|||||||||||
|
Royalty license fees
(1)
|
91
|
|
59
|
|
30
|
|
2
|
|
—
|
|
—
|
|
|||||||||||
|
Purchase obligations
|
102
|
|
19
|
|
41
|
|
40
|
|
2
|
|
—
|
|
|||||||||||
|
Pension funding obligations
|
2,475
|
|
381
|
|
928
|
|
660
|
|
506
|
|
—
|
|
|||||||||||
|
Long-term debt including current portion and interest
|
2,095
|
|
47
|
|
71
|
|
116
|
|
1,861
|
|
—
|
|
|||||||||||
|
Liability and interest related to uncertain tax positions
(2)
|
218
|
|
—
|
|
—
|
|
—
|
|
—
|
|
218
|
|
|||||||||||
|
Total contractual obligations
|
$
|
11,253
|
|
$
|
2,433
|
|
$
|
2,419
|
|
$
|
1,682
|
|
$
|
4,501
|
|
$
|
218
|
|
|||||
__________________
|
(1)
|
We pay royalties under various merchandise license agreements, which are generally based on sales of products covered under these agreements. We currently have license agreements for which we pay royalties, including those to use American Greetings and Joe Boxer. Royalty license fees represent the minimum the Company is obligated to pay, regardless of sales, as guaranteed royalties under these license agreements.
|
|
(2)
|
At February 2, 2013, our uncertain tax position liability and gross interest payable were $161 million and $57 million, respectively. We are unable to reasonably estimate the timing of liabilities and interest payments arising from uncertain tax positions in individual years due to the uncertainties in the timing of the effective settlement of tax positions.
|
Other Commercial Commitments
We issue various types of guarantees in the normal course of business. We had the following guarantees outstanding at February 2, 2013:
|
millions
|
Bank
Issued
|
SRAC
Issued
|
Other
|
Total
|
|||||||||||
|
Standby letters of credit
|
$
|
774
|
|
$
|
47
|
|
$
|
—
|
|
$
|
821
|
|
|||
|
Commercial letters of credit
|
8
|
|
133
|
|
—
|
|
141
|
|
|||||||
|
Secondary lease obligations and performance guarantee
|
—
|
|
—
|
|
77
|
|
77
|
|
|||||||
The secondary lease obligations relate to certain store leases of previously divested Sears businesses. We remain secondarily liable if the primary obligor defaults.
47
Application of Critical Accounting Policies and Estimates
In preparing the financial statements, certain accounting policies require considerable judgment to select the appropriate assumptions to calculate financial estimates. These estimates are complex and subject to an inherent degree of uncertainty. We base our estimates on historical experience, terms of existing contracts, evaluation of trends and other assumptions that we believe to be reasonable under the circumstances. We continually evaluate the information used to make these estimates as our business and the economic environment change. Although the use of estimates is pervasive throughout the financial statements, we consider an accounting estimate to be critical if:
|
•
|
it requires assumptions to be made about matters that were highly uncertain at the time the estimate was made, and
|
|
•
|
changes in the estimate that are reasonably likely to occur from period to period or different estimates that could have been selected would have a material effect on our financial condition, cash flows or results of operations.
|
Management believes the current assumptions and other considerations used to estimate amounts reflected in the financial statements are appropriate. However, if actual experience differs from the assumptions and the considerations used in estimating amounts, the resulting changes could have a material adverse effect on our consolidated results of operations, and in certain situations, could have a material adverse effect on our financial condition.
Management has discussed the development and selection of these critical accounting estimates with the Audit Committee of our Board of Directors and the Audit Committee has reviewed the disclosure presented below relating to the selection of these estimates.
The following is a summary of our most critical policies and estimates. See Note 1 of Notes to Consolidated Financial Statements for a listing of our other significant accounting policies.
Valuation of Inventory
Our inventory is valued at the lower of cost or market determined primarily using the retail inventory method (“RIM”). RIM is an averaging method that is commonly used in the retail industry. To determine inventory cost under RIM, inventory at its retail selling value is segregated into groupings of merchandise having similar characteristics, which are then converted to a cost basis by applying specific average cost factors for each grouping of merchandise. Cost factors represent the average cost-to-retail ratio for each merchandise group based upon the year purchasing activity for each store location. Accordingly, a significant assumption under the retail method is that inventory in each group is similar in terms of its cost-to-retail relationship and has similar turnover rates. Management monitors the content of merchandise in these groupings to prevent distortions that would have a material effect on inventory valuation.
RIM inherently requires management judgment and certain estimates that may significantly affect the ending inventory valuation, as well as gross margin. Among others, two significant estimates used in inventory valuation are the level and timing of permanent markdowns (clearance markdowns used to clear unproductive or slow-moving inventory) and shrinkage. Amounts are charged to cost of sales, buying and occupancy at the time the retail value of inventory is reduced through the use of permanent markdowns.
Factors considered in the determination of permanent markdowns include current and anticipated demand, customer preferences, age of the merchandise, fashion trends and weather conditions. In addition, inventory is also evaluated against corporate pre-determined historical markdown cadences. When a decision is made to permanently markdown merchandise, the resulting gross margin reduction is recognized in the period the markdown is recorded. The timing of the decision, particularly surrounding the balance sheet date, can have a significant effect on the results of operations.
Shrinkage is estimated as a percentage of sales for the period from the date of the last physical inventory to the end of the year. Physical inventories are taken annually for all stores and inventory records are adjusted accordingly. The shrinkage rate from the most recent physical inventory, in combination with historical experience, is used as the basis for the shrinkage accrual following the physical inventory.
48
Self Insurance Reserves
We use a combination of third-party insurance and/or self-insurance for a number of risks including workers' compensation, asbestos and environmental, automobile, warranty, product and general liability claims. General liability costs relate primarily to litigation that arises from store operations. Self-insurance reserves include actuarial estimates of both claims filed and carried at their expected ultimate settlement value and claims incurred but not yet reported. Our estimated claim amounts are discounted using a rate with a duration that approximates the duration of our self-insurance reserve portfolio. Our liability reflected on the Consolidated Balance Sheets represents an estimate of the ultimate cost of claims incurred at the balance sheet date. In estimating this liability, we utilize loss development factors based on Company-specific data to project the future development of incurred losses. Loss estimates are adjusted based upon actual claims settlements and reported claims. These projections are subject to a high degree of variability based upon future inflation rates, litigation trends, legal interpretations, benefit level changes and claim settlement patterns. Although we do not expect the amounts ultimately paid to differ significantly from our estimates, self-insurance reserves could be affected if future claim experience differs significantly from the historical trends and the actuarial assumptions.
Defined Benefit Pension Plans
The fundamental components of accounting for defined benefit pension plans consist of the compensation cost of the benefits earned, the interest cost from deferring payment of those benefits into the future and the results of investing any assets set aside to fund the obligation. Such retirement benefits were earned by associates ratably over their service careers. Therefore, the amounts reported in the income statement for these retirement plans have historically followed the same pattern. Accordingly, changes in the obligations or the value of assets to fund them have been recognized systematically and gradually over the associate's estimated period of service. The largest drivers of losses or charges in recent years have been the discount rate used to determine the present value of the obligation and the actual return on pension assets. We recognize the changes by amortizing experience gains/losses in excess of the 10% corridor into expense over the associated service period.
The Company's actuarial valuations utilize key assumptions including discount rates and expected returns on plan assets. We are required to consider current market conditions, including changes in interest rates and plan asset investment returns, in determining these assumptions. Actuarial assumptions may differ materially from actual results due to changing market and economic conditions, changes in investment strategies, higher or lower withdrawal rates, and longer or shorter life spans of participants.
The Sears Holdings Corporation Investment Committee is responsible for the investment of the assets of Holdings' domestic pension plan. The Investment Committee, made up primarily of select members of senior management, has appointed a non-affiliated third party professional to advise the Investment Committee with respect to the SHC domestic pension plan assets. The plan's overall investment objective is to provide a long-term return that, along with Company contributions, is expected to meet future benefit payment requirements. A long-term horizon has been adopted in establishing investment policy such that the likelihood and duration of investment losses are carefully weighed against the long-term potential for appreciation of assets. The plan's investment policy requires investments to be diversified across individual securities, industries, market capitalization and valuation characteristics. In addition, various techniques are utilized to monitor, measure and manage risk.
For purposes of determining the periodic expense of our defined benefit plan, we use the fair value of plan assets as the market related value. A one-percentage-point change in the assumed discount rate would have the following effects on the pension liability:
|
millions
|
1 percentage-point
Increase
|
1 percentage-point
Decrease
|
|||||
|
Effect on interest cost component
|
$
|
30
|
|
$
|
(39
|
)
|
|
|
Effect on pension benefit obligation
|
$
|
(674
|
)
|
$
|
814
|
|
|
For 2013 and beyond, the domestic weighted-average health care cost trend rates used in measuring the postretirement benefit expense are a 8.5% trend rate in 2013 to an ultimate trend rate of 6.5% in 2017. A one-
49
percentage-point change in the assumed health care cost trend rate would have the following effects on the postretirement liability:
|
millions
|
1 percentage-point
Increase
|
1 percentage-point
Decrease
|
|||||
|
Effect on total service and interest cost components
|
$
|
1
|
|
$
|
(1
|
)
|
|
|
Effect on postretirement benefit obligation
|
$
|
31
|
|
$
|
(27
|
)
|
|
Income Taxes
We account for income taxes according to accounting standards for such taxes. Deferred tax assets and liabilities are recognized for the future tax consequences attributable to differences between the book basis and tax basis of assets and liabilities. Deferred tax assets and liabilities are measured using enacted tax rates expected to apply to taxable income in the years in which those temporary differences are expected to be recovered or settled. If future utilization of deferred tax assets is uncertain, the Company may record a valuation allowance against certain deferred tax assets. In evaluating our ability to recover our deferred tax assets within the jurisdiction from which they arise, we consider all available positive and negative evidence, including scheduled reversals of deferred tax liabilities, projected future taxable income, tax planning strategies, and results of recent operations. In projecting future taxable income, we begin with historical results adjusted for the results of discontinued operations and changes in accounting policies and incorporate assumptions including the amount of future state, federal and foreign pre-tax operating income, the reversal of temporary differences, and the implementation of feasible and prudent tax planning strategies. In evaluating the objective evidence that historical results provide, we consider cumulative operating income (loss) over the past several years. These assumptions require significant judgment about the forecasts of future taxable income. After consideration of evidence regarding the ability to realize our deferred tax assets, we established a valuation allowance against certain deferred income tax assets in 2012 and 2011. The Company continues to monitor its operating performance and evaluate the likelihood of the future realization of these deferred tax assets. At the end of 2012, we had a state separate entity deferred tax asset of $145 million. In the event the Company does not achieve its forecasted results for 2013, an additional valuation allowance may be required.
In accordance with accounting standards for uncertain tax positions, we record unrecognized tax benefits for positions taken or expected to be taken on tax returns, including the decision to exclude certain income or transactions from a return, when a more-likely-than-not threshold is met for a tax position and management believes that the position will be sustained upon examination by the taxing authorities. Further, we record the largest amount of the unrecognized tax benefit that is greater than 50% likely of being realized upon settlement. Management evaluates each position based solely on the technical merits and facts and circumstances of the position, assuming the position will be examined by a taxing authority having full knowledge of all relevant information. Significant management judgment is required to determine whether the recognition threshold has been met and, if so, the appropriate amount of unrecognized tax benefits to be recorded in the Consolidated Financial Statements. Management reevaluates tax positions each period in which new information about recognition or measurement becomes available.
Significant management judgment is required in determining our provision for income taxes, deferred tax assets and liabilities and the valuation allowance recorded against our net deferred tax assets, if any. As further described above, management considers estimates of the amount and character of future taxable income in assessing the likelihood of realization of deferred tax assets. Our actual effective tax rate and income tax expense could vary from estimated amounts due to the future impacts of various items, including changes in income tax laws, tax planning and the Company's forecasted financial condition and results of operations in future periods. Although management believes current estimates are reasonable, actual results could differ from these estimates.
Domestic and foreign tax authorities periodically audit our income tax returns. These audits include questions regarding our tax filing positions, including the timing and amount of deductions and the allocation of income among various tax jurisdictions. In evaluating the exposures associated with our various tax filing positions, we record reserves in accordance with accounting standards for uncertain tax positions. A number of years may elapse before a particular matter, for which we have established a reserve, is audited and fully resolved. Management's
50
estimates at the date of the financial statements reflect our best judgment, giving consideration to all currently available facts and circumstances. As such, these estimates may require adjustment in the future, as additional facts become known or as circumstances change. For further information, see Note 10 of Notes to Consolidated Financial Statements.
Goodwill and Intangible Asset Impairment Assessments
At February 2, 2013 and January 28, 2012, we had goodwill balances of
$379 million
and $
841 million
, respectively, and intangible asset balances of $2.9 billion at both periods. The Company evaluates the carrying value of goodwill and intangible assets for possible impairment under accounting standards governing goodwill and other intangible assets. The majority of our goodwill and intangible assets relate to Kmart's acquisition of Sears in March 2005. We allocated goodwill, which is defined as the total purchase price less the fair value of all assets and liabilities acquired, to reporting units at the acquisition date. As required by accounting standards, we perform annual goodwill and intangible impairment tests in the fourth quarter and update the tests between annual tests if events or circumstances occur that would more likely than not reduce the fair value of a reporting unit below its carrying amount.
A significant amount of judgment is involved in determining if an indicator of impairment has occurred. Such indicators may include, among others: a significant decline in our expected future cash flows; a sustained, significant decline in our stock price and market capitalization; a significant adverse change in legal factors or in the business climate; unanticipated competition; and the testing for recoverability of a significant asset group within a reporting unit. Any adverse change in these factors could have a significant impact on the recoverability of these assets and could have a material impact on our consolidated financial statements.
Goodwill Impairment Assessments
Our goodwill resides in multiple reporting units. The goodwill impairment test involves a two-step process. The first step is a comparison of each reporting unit's fair value to its carrying value. We estimate fair value using the best information available, using both a market approach, as well as a discounted cash flow model, commonly referred to as the income approach. The market approach determines the value of a reporting unit by deriving market multiples for reporting units based on assumptions potential market participants would use in establishing a bid price for the unit. This approach therefore assumes strategic initiatives will result in improvements in operational performance in the event of purchase, and includes the application of a discount rate based on market participant assumptions with respect to capital structure and access to capital markets. The income approach uses a reporting unit's projection of estimated operating results and cash flows that is discounted using a weighted-average cost of capital that reflects current market conditions appropriate to each of our reporting units. The projection uses management's best estimates of economic and market conditions over the projected period, including growth rates in sales, costs, estimates of future expected changes in operating margins and cash expenditures. Other significant estimates and assumptions include terminal value growth rates, future estimates of capital expenditures and changes in future working capital requirements. Our final estimate of fair value of reporting units is developed by weighting the fair values determined through both the market participant and income approaches, where comparable market participant information is available.
If the carrying value of the reporting unit is higher than its fair value, there is an indication that impairment may exist and the second step must be performed to measure the amount of impairment loss. The amount of impairment is determined by comparing the implied fair value of reporting unit goodwill to the carrying value of the goodwill in the same manner as if the reporting unit was being acquired in a business combination. Specifically, we allocate the fair value to all of the assets and liabilities of the reporting unit, including any unrecognized intangible assets, in a hypothetical analysis that would calculate the implied fair value of goodwill. If the implied fair value of goodwill is less than the recorded goodwill, we record an impairment charge for the difference.
After performing the first step of the process, we determined goodwill recorded at reporting units within the Sears Canada and Sears Domestic segments in 2012 and 2011, respectively, was potentially impaired. The impairment determination was primarily driven by the combination of lower sales and continued margin pressure coupled with expense increases which led to a decline in our operating profit. After performing the second step of the process, we determined that the total amount of goodwill recorded at these reporting units was impaired and
51
recorded charges of $295 million and $551 million in 2012 and 2011, respectively. We did not record any goodwill impairment charges in 2010.
The use of different assumptions, estimates or judgments in either step of the goodwill impairment testing process, such as the estimated future cash flows of our reporting units, the discount rate used to discount such cash flows, or the estimated fair value of the reporting units' tangible and intangible assets and liabilities, could significantly increase or decrease the estimated fair value of a reporting unit or its net assets, and therefore, impact the related impairment charge. At the 2012 annual impairment test date, the conclusion that no indication of goodwill impairment existed for the remaining reporting units would not have changed had the test been conducted assuming: (1) a 100 basis point increase in the discount rate used to discount the aggregate estimated cash flows of our reporting units to their net present value in determining their estimated fair values and/or (2) a 100 basis point decrease in the estimated sales growth rate and/or terminal period growth rate.
Based on our sensitivity analysis, we do not believe that the remaining recorded goodwill balance is at risk of impairment at any reporting unit at the end of the year because the fair value is substantially in excess of the carrying value and not at risk of failing step one. However, goodwill impairment charges may be recognized in future periods in one or more of the reporting units to the extent changes in factors or circumstances occur, including deterioration in the macroeconomic environment, retail industry or in the equity markets, which includes the market value of our common shares, deterioration in our performance or our future projections, or changes in our plans for one or more reporting units.
Intangible Asset Impairment Assessments
We review indefinite-lived intangible assets, primarily trade names, for impairment by comparing the carrying amount of each asset to the sum of undiscounted cash flows expected to be generated by the asset. We consider the income approach when testing intangible assets with indefinite lives for impairment on an annual basis. We determined that the income approach, specifically the Relief from Royalty Method, was most appropriate for analyzing our indefinite-lived assets. This method is based on the assumption that, in lieu of ownership, a firm would be willing to pay a royalty in order to exploit the related benefits of this asset class. The Relief from Royalty Method involves two steps: (1) estimation of reasonable royalty rates for the assets and (2) the application of these royalty rates to a net sales stream and discounting the resulting cash flows to determine a value. We multiplied the selected royalty rate by the forecasted net sales stream to calculate the cost savings (relief from royalty payment) associated with the assets. The cash flows are then discounted to present value by the selected discount rate and compared to the carrying value of the assets. We did not record any intangible asset impairment charges in 2012, 2011 or 2010.
The use of different assumptions, estimates or judgments in our intangible asset impairment testing process, such as the estimated future cash flows of assets and the discount rate used to discount such cash flows, could significantly increase or decrease the estimated fair value of an asset, and therefore, impact the related impairment charge. At the 2012 annual impairment test date, the above-noted conclusion that no indication of significant intangible asset impairment existed at the test date would not have changed had the test been conducted assuming: (1) a 100 basis point increase in the discount rate used to discount the aggregate estimated cash flows of our assets to their net present value in determining their estimated fair values (without any change in the aggregate estimated cash flows of our intangibles), (2) a 100 basis point decrease in the terminal period growth rate without a change in the discount rate of each intangible, or (3) a 10 basis point decrease in the royalty rate applied to the forecasted net sales stream of our assets.
Based on our sensitivity analysis, we do not believe that the indefinite-lived intangible balance is at risk of impairment at the end of the year because the fair values are substantially in excess of the carrying values. However, indefinite-lived intangible impairment charges may be recognized in future periods to the extent changes in factors or circumstances occur, including deterioration in the macroeconomic environment, retail industry, deterioration in our performance or our future projections, or changes in our plans for one or more indefinite-lived intangible asset.
New Accounting Pronouncements
See Note 1 of Notes to Consolidated Financial Statements for information regarding new accounting pronouncements.
52
CAUTIONARY STATEMENT REGARDING FORWARD-LOOKING INFORMATION
Certain statements made in this Annual Report on Form 10-K and in other public announcements by us contain forward-looking statements within the meaning of the Private Securities Litigation Reform Act of 1995. Forward-looking statements are subject to risks and uncertainties that may cause our actual results, performance or achievements to be materially different from any future results, performance or achievements expressed or implied by these forward-looking statements. Forward-looking statements include information concerning our future financial performance, business strategy, plans, goals and objectives. Statements preceded or followed by, or that otherwise include, the words “believes,” “expects,” “anticipates,” “intends,” “estimates,” “plans,” “forecast,” “is likely to” and similar expressions or future or conditional verbs such as “will,” “may” and “could” are generally forward-looking in nature and not historical facts. Such statements are based upon the current beliefs and expectations of the Company's management and are subject to significant risks and uncertainties. Actual results may differ materially from those set forth in the forward-looking statements.
The following factors, among others, could cause actual results to differ from those set forth in the forward-looking statements: our ability to offer merchandise and services that our customers want, including our proprietary brand products; our ability to successfully implement initiatives to improve our liquidity through inventory management and other actions; competitive conditions in the retail and related services industries; worldwide economic conditions and business uncertainty, including the availability of consumer and commercial credit, changes in consumer confidence and spending, the impact of rising fuel prices, and changes in vendor relationships; vendors’ lack of willingness to provide acceptable payment terms or otherwise restricting financing to purchase inventory or services; possible limits on our access to capital markets and other financing sources, including incremental financings under the accordion feature of our domestic credit agreement and additional second lien financings, with respect to which we do not have commitments from lenders; our ability to successfully achieve our plans to generate liquidity, reduce inventory and reduce fixed costs; the impact of seasonal buying patterns, including seasonal fluctuations due to weather conditions, which are difficult to forecast with certainty; our dependence on sources outside the United States for significant amounts of our merchandise; our extensive reliance on computer systems, including legacy systems, to implement our integrated retail strategy, process transactions, summarize results and manage our business, which may be subject to disruptions or security breaches; our reliance on third parties to provide us with services in connection with the administration of certain aspects of our business and the transfer of significant internal historical knowledge to such parties; impairment charges for goodwill and intangible assets or fixed-asset impairment for long-lived assets; our ability to attract, motivate and retain key executives and other associates; our ability to protect or preserve the image of our brands; the outcome of pending and/or future legal proceedings, including product liability claims and proceedings with respect to which the parties have reached a preliminary settlement; and the timing and amount of required pension plan funding.
Certain of these and other factors are discussed in more detail in Part I, Item 1A of this Annual Report on Form 10-K. While we believe that our forecasts and assumptions are reasonable, we caution that actual results may differ materially. We intend the forward-looking statements to speak only as of the time made and do not undertake to update or revise them as more information becomes available.
53
|
Item 7A.
|
Quantitative and Qualitative Disclosures about Market Risk
|
We face market risk exposure in the form of interest rate risk. This market risk arises from our debt obligations.
Interest Rate Risk
We manage interest rate risk through the use of fixed and variable-rate funding. All debt securities are considered non-trading. At
February 2, 2013
,
35%
of our debt portfolio was variable rate. Based on the size of this variable rate debt portfolio at
February 2, 2013
, which totaled approximately
$1.1 billion
, an immediate 100 basis point change in interest rates would have affected annual pretax funding costs by
$11 million
. These estimates do not take into account the effect on income resulting from invested cash or the returns on assets being funded. These estimates also assume that the variable rate funding portfolio remains constant for an annual period and that the interest rate change occurs at the beginning of the period.
54
|
Page
|
|
55
SEARS HOLDINGS CORPORATION
|
millions, except per share data
|
2012
|
2011
|
2010
|
||||||||
|
REVENUES
|
|||||||||||
|
Merchandise sales and services
|
$
|
39,854
|
|
$
|
41,567
|
|
$
|
42,664
|
|
||
|
COSTS AND EXPENSES
|
|||||||||||
|
Cost of sales, buying and occupancy
|
29,340
|
|
30,966
|
|
31,000
|
|
|||||
|
Selling and administrative
|
10,660
|
|
10,664
|
|
10,425
|
|
|||||
|
Depreciation and amortization
|
830
|
|
853
|
|
869
|
|
|||||
|
Impairment charges
|
330
|
|
649
|
|
—
|
|
|||||
|
Gain on sales of assets
|
(468
|
)
|
(64
|
)
|
(67
|
)
|
|||||
|
Total costs and expenses
|
40,692
|
|
43,068
|
|
42,227
|
|
|||||
|
Operating income (loss)
|
(838
|
)
|
(1,501
|
)
|
437
|
|
|||||
|
Interest expense
|
(267
|
)
|
(289
|
)
|
(293
|
)
|
|||||
|
Interest and investment income
|
94
|
|
41
|
|
36
|
|
|||||
|
Other income (loss)
|
1
|
|
(2
|
)
|
(14
|
)
|
|||||
|
Income (loss) from continuing operations before income taxes
|
(1,010
|
)
|
(1,751
|
)
|
166
|
|
|||||
|
Income tax expense
|
(44
|
)
|
(1,369
|
)
|
(27
|
)
|
|||||
|
Income (loss) from continuing operations
|
(1,054
|
)
|
(3,120
|
)
|
139
|
|
|||||
|
Income (loss) from discontinued operations, net of tax
|
—
|
|
(27
|
)
|
11
|
|
|||||
|
Net income (loss)
|
(1,054
|
)
|
(3,147
|
)
|
150
|
|
|||||
|
(Income) loss attributable to noncontrolling interests
|
124
|
|
7
|
|
(17
|
)
|
|||||
|
NET INCOME (LOSS) ATTRIBUTABLE TO HOLDINGS’ SHAREHOLDERS
|
$
|
(930
|
)
|
$
|
(3,140
|
)
|
$
|
133
|
|
||
|
Amounts attributable to Holdings’ shareholders:
|
|||||||||||
|
Income (loss) from continuing operations, net of tax
|
$
|
(930
|
)
|
$
|
(3,113
|
)
|
$
|
122
|
|
||
|
Income (loss) from discontinued operations, net of tax
|
—
|
|
(27
|
)
|
11
|
|
|||||
|
Net income (loss)
|
$
|
(930
|
)
|
$
|
(3,140
|
)
|
$
|
133
|
|
||
|
NET INCOME (LOSS) PER COMMON SHARE ATTRIBUTABLE TO HOLDINGS’ SHAREHOLDERS
|
|||||||||||
|
Basic:
|
|||||||||||
|
Continuing operations
|
$
|
(8.78
|
)
|
$
|
(29.15
|
)
|
$
|
1.09
|
|
||
|
Discontinued operations
|
—
|
|
(0.25
|
)
|
0.10
|
|
|||||
|
$
|
(8.78
|
)
|
$
|
(29.40
|
)
|
$
|
1.19
|
|
|||
|
Diluted:
|
|||||||||||
|
Continuing operations
|
$
|
(8.78
|
)
|
$
|
(29.15
|
)
|
$
|
1.09
|
|
||
|
Discontinued operations
|
—
|
|
(0.25
|
)
|
0.10
|
|
|||||
|
$
|
(8.78
|
)
|
$
|
(29.40
|
)
|
$
|
1.19
|
|
|||
|
Basic weighted average common shares outstanding
|
105.9
|
|
106.8
|
|
111.5
|
|
|||||
|
Diluted weighted average common shares outstanding
|
105.9
|
|
106.8
|
|
111.7
|
|
|||||
See accompanying Notes to Consolidated Financial Statements.
56
SEARS HOLDINGS CORPORATION
Consolidated Statements of Comprehensive Income (Loss)
|
millions
|
2012
|
2011
|
2010
|
||||||||
|
Net income (loss)
|
$
|
(1,054
|
)
|
$
|
(3,147
|
)
|
$
|
150
|
|
||
|
Other comprehensive income (loss)
|
|||||||||||
|
Pension and postretirement adjustments, net of tax
|
74
|
|
(789
|
)
|
(12
|
)
|
|||||
|
Deferred gain (loss) on derivatives, net of tax
|
5
|
|
(6
|
)
|
(9
|
)
|
|||||
|
Currency translation adjustments, net of tax
|
5
|
|
(38
|
)
|
93
|
|
|||||
|
Total other comprehensive income (loss)
|
84
|
|
(833
|
)
|
72
|
|
|||||
|
Comprehensive income (loss)
|
(970
|
)
|
(3,980
|
)
|
222
|
|
|||||
|
Comprehensive (income) loss attributable to noncontrolling interests
|
124
|
|
12
|
|
(71
|
)
|
|||||
|
Comprehensive income (loss) attributable to Holdings’ shareholders
|
$
|
(846
|
)
|
$
|
(3,968
|
)
|
$
|
151
|
|
||
See accompanying Notes to Consolidated Financial Statements.
57
SEARS HOLDINGS CORPORATION
|
millions
|
February 2,
2013 |
January 28,
2012 |
|||||
|
ASSETS
|
|||||||
|
Current assets
|
|||||||
|
Cash and cash equivalents
|
$
|
609
|
|
$
|
747
|
|
|
|
Restricted cash
|
9
|
|
7
|
|
|||
|
Accounts receivable
|
635
|
|
695
|
|
|||
|
Merchandise inventories
|
7,558
|
|
8,407
|
|
|||
|
Prepaid expenses and other current assets
|
454
|
|
388
|
|
|||
|
Total current assets
|
9,265
|
|
10,244
|
|
|||
|
Property and equipment
|
|||||||
|
Land
|
1,875
|
|
1,924
|
|
|||
|
Buildings and improvements
|
6,072
|
|
6,186
|
|
|||
|
Furniture, fixtures and equipment
|
2,950
|
|
2,786
|
|
|||
|
Capital leases
|
347
|
|
314
|
|
|||
|
Gross property and equipment
|
11,244
|
|
11,210
|
|
|||
|
Less accumulated depreciation and amortization
|
(5,191
|
)
|
(4,633
|
)
|
|||
|
Total property and equipment, net
|
6,053
|
|
6,577
|
|
|||
|
Goodwill
|
379
|
|
841
|
|
|||
|
Trade names and other intangible assets
|
2,881
|
|
2,937
|
|
|||
|
Other assets
|
762
|
|
782
|
|
|||
|
TOTAL ASSETS
|
$
|
19,340
|
|
$
|
21,381
|
|
|
|
LIABILITIES
|
|||||||
|
Current liabilities
|
|||||||
|
Short-term borrowings
(1)
|
$
|
1,094
|
|
$
|
1,175
|
|
|
|
Current portion of long-term debt and capitalized lease obligations
|
83
|
|
230
|
|
|||
|
Merchandise payables
|
2,761
|
|
2,912
|
|
|||
|
Other current liabilities
|
2,683
|
|
2,892
|
|
|||
|
Unearned revenues
|
931
|
|
964
|
|
|||
|
Other taxes
|
480
|
|
523
|
|
|||
|
Short-term deferred tax liabilities
|
382
|
|
516
|
|
|||
|
Total current liabilities
|
8,414
|
|
9,212
|
|
|||
|
Long-term debt and capitalized lease obligations
(2)
|
1,943
|
|
2,088
|
|
|||
|
Pension and postretirement benefits
|
2,730
|
|
2,738
|
|
|||
|
Other long-term liabilities
|
2,126
|
|
2,186
|
|
|||
|
Long-term deferred tax liabilities
|
955
|
|
816
|
|
|||
|
Total Liabilities
|
16,168
|
|
17,040
|
|
|||
|
Commitments and contingencies
|
|
|
|
|
|||
|
EQUITY
|
|||||||
|
Sears Holdings Corporation equity
|
|||||||
|
Preferred stock, 20 shares authorized; no shares outstanding
|
—
|
|
—
|
|
|||
|
Common stock $0.01 par value; 500 shares authorized; 106 and 106 shares outstanding, respectively
|
1
|
|
1
|
|
|||
|
Treasury stock—at cost
|
(5,970
|
)
|
(5,981
|
)
|
|||
|
Capital in excess of par value
|
9,298
|
|
10,005
|
|
|||
|
Retained earnings
|
885
|
|
1,865
|
|
|||
|
Accumulated other comprehensive loss
|
(1,459
|
)
|
(1,609
|
)
|
|||
|
Total Sears Holdings Corporation equity
|
2,755
|
|
4,281
|
|
|||
|
Noncontrolling interest
|
417
|
|
60
|
|
|||
|
Total Equity
|
3,172
|
|
4,341
|
|
|||
|
TOTAL LIABILITIES AND EQUITY
|
$
|
19,340
|
|
$
|
21,381
|
|
|
(1)
Includes
$285 million
and
$250 million
at February 2, 2013 and January 28, 2012, respectively, of unsecured commercial paper held by ESL
and its affiliates.
(2)
Includes
$95 million
at both February 2, 2013 and January 28, 2012 of senior secured notes held by ESL and its affiliates; and
$3 million
and
$14 million
at February 2, 2013 and January 28, 2012, respectively, of subsidiary notes held by ESL and its affiliates.
See accompanying Notes to Consolidated Financial Statements.
58
SEARS HOLDINGS CORPORATION
|
millions
|
2012
|
2011
|
2010
|
||||||||
|
CASH FLOWS FROM OPERATING ACTIVITIES
|
|||||||||||
|
Net income (loss)
|
$
|
(1,054
|
)
|
$
|
(3,147
|
)
|
$
|
150
|
|
||
|
(Income) loss from discontinued operations, net of tax
|
—
|
|
27
|
|
(11
|
)
|
|||||
|
Income (loss) from continuing operations
|
(1,054
|
)
|
(3,120
|
)
|
139
|
|
|||||
|
Adjustments to reconcile net income (loss) to net cash provided by (used in) operating activities:
|
|||||||||||
|
Deferred tax valuation allowance
|
237
|
|
1,798
|
|
—
|
|
|||||
|
Depreciation and amortization
|
830
|
|
853
|
|
869
|
|
|||||
|
Impairment charges
|
330
|
|
649
|
|
—
|
|
|||||
|
Gain on sales of assets
|
(468
|
)
|
(64
|
)
|
(67
|
)
|
|||||
|
Gain on sales of investments
|
(28
|
)
|
—
|
|
—
|
|
|||||
|
Pension and postretirement plan contributions
|
(593
|
)
|
(390
|
)
|
(316
|
)
|
|||||
|
Pension and postretirement plan settlements
|
455
|
|
—
|
|
—
|
|
|||||
|
Settlement of Canadian dollar hedges
|
6
|
|
—
|
|
(3
|
)
|
|||||
|
Change in operating assets and liabilities (net of acquisitions and dispositions):
|
|||||||||||
|
Deferred income taxes
|
(206
|
)
|
(533
|
)
|
(15
|
)
|
|||||
|
Merchandise inventories
|
427
|
|
545
|
|
(353
|
)
|
|||||
|
Merchandise payables
|
(117
|
)
|
(134
|
)
|
(285
|
)
|
|||||
|
Income and other taxes
|
(63
|
)
|
(50
|
)
|
(34
|
)
|
|||||
|
Mark-to-market adjustments and settlements on Sears Canada U.S. dollar collar contracts
|
1
|
|
2
|
|
7
|
|
|||||
|
Other operating assets
|
(100
|
)
|
67
|
|
(7
|
)
|
|||||
|
Other operating liabilities
|
40
|
|
70
|
|
142
|
|
|||||
|
Net cash provided by (used in) operating activities—continuing operations
|
(303
|
)
|
(307
|
)
|
77
|
|
|||||
|
Net cash provided by operating activities—discontinued operations
|
—
|
|
32
|
|
46
|
|
|||||
|
Net cash provided by (used in) operating activities
|
(303
|
)
|
(275
|
)
|
123
|
|
|||||
|
CASH FLOWS FROM INVESTING ACTIVITIES
|
|||||||||||
|
Proceeds from sales of property and investments
|
532
|
|
72
|
|
35
|
|
|||||
|
Net decrease in investments and restricted cash
|
37
|
|
8
|
|
—
|
|
|||||
|
Purchases of property and equipment
|
(378
|
)
|
(432
|
)
|
(426
|
)
|
|||||
|
Net cash provided by (used in) investing activities—continuing operations
|
191
|
|
(352
|
)
|
(391
|
)
|
|||||
|
Net cash provided by (used in) investing activities—discontinued operations
|
—
|
|
43
|
|
(15
|
)
|
|||||
|
Net cash provided by (used in) investing activities
|
191
|
|
(309
|
)
|
(406
|
)
|
|||||
|
CASH FLOWS FROM FINANCING ACTIVITIES
|
|||||||||||
|
Proceeds from debt issuances
|
5
|
|
104
|
|
1,353
|
|
|||||
|
Repayments of long-term debt
|
(335
|
)
|
(611
|
)
|
(358
|
)
|
|||||
|
Increase (decrease) in short-term borrowings, primarily 90 days or less
|
(81
|
)
|
815
|
|
35
|
|
|||||
|
Sears Hometown and Outlet Stores, Inc. pre-separation funding
|
100
|
|
—
|
|
—
|
|
|||||
|
Proceeds from the sale of Sears Hometown and Outlet Stores, Inc.
|
347
|
|
—
|
|
—
|
|
|||||
|
Debt issuance costs
|
(3
|
)
|
(35
|
)
|
(28
|
)
|
|||||
|
Purchase of Sears Canada shares
|
(10
|
)
|
(43
|
)
|
(603
|
)
|
|||||
|
Sears Canada dividends paid to minority shareholders
|
(50
|
)
|
—
|
|
(69
|
)
|
|||||
|
Purchase of treasury stock
|
—
|
|
(183
|
)
|
(394
|
)
|
|||||
|
Net cash provided by (used in) financing activities—continuing operations
|
(27
|
)
|
47
|
|
(64
|
)
|
|||||
|
Net cash used in financing activities—discontinued operations
|
—
|
|
(75
|
)
|
(31
|
)
|
|||||
|
Net cash used in financing activities
|
(27
|
)
|
(28
|
)
|
(95
|
)
|
|||||
|
Effect of exchange rate changes on cash and cash equivalents
|
1
|
|
—
|
|
57
|
|
|||||
|
NET DECREASE IN CASH AND CASH EQUIVALENTS
|
(138
|
)
|
(612
|
)
|
(321
|
)
|
|||||
|
CASH AND CASH EQUIVALENTS, BEGINNING OF YEAR
|
747
|
|
1,359
|
|
1,680
|
|
|||||
|
CASH AND CASH EQUIVALENTS, END OF YEAR
|
$
|
609
|
|
$
|
747
|
|
$
|
1,359
|
|
||
|
SUPPLEMENTAL INFORMATION:
|
|||||||||||
|
Capital lease obligation incurred
|
$
|
61
|
|
$
|
3
|
|
$
|
15
|
|
||
|
Supplemental Cash Flow Data:
|
|||||||||||
|
Income taxes paid, net of refunds
|
$
|
40
|
|
$
|
94
|
|
$
|
47
|
|
||
|
Cash interest paid
|
199
|
|
223
|
|
164
|
|
|||||
|
Unpaid liability to acquire equipment and software
|
30
|
|
52
|
|
56
|
|
|||||
|
Non-cash dividend in connection with Spin-Off transactions
|
(542
|
)
|
(74
|
)
|
—
|
|
|||||
See accompanying Notes to Consolidated Financial Statements.
59
SEARS HOLDINGS CORPORATION
Consolidated Statements of Equity
|
|
Equity Attributable to Holdings’ Shareholders
|
|
|
|||||||||||||||||||||||||||
|
dollars and shares in millions
|
Number
of Shares |
Common
Stock |
Treasury
Stock |
Capital in
Excess of Par Value |
Retained
Earnings |
Accumulated
Other Comprehensive Income (Loss) |
Noncontrolling
Interests |
Total
|
||||||||||||||||||||||
|
Balance at January 30, 2010
|
115
|
|
$
|
1
|
|
$
|
(5,446
|
)
|
$
|
10,465
|
|
$
|
4,797
|
|
$
|
(721
|
)
|
$
|
339
|
|
$
|
9,435
|
|
|||||||
|
Comprehensive income
|
||||||||||||||||||||||||||||||
|
Net income
|
—
|
|
—
|
|
—
|
|
—
|
|
133
|
|
—
|
|
17
|
|
150
|
|
||||||||||||||
|
Pension and postretirement adjustments, net of tax
|
—
|
|
—
|
|
—
|
|
—
|
|
—
|
|
(41
|
)
|
29
|
|
(12
|
)
|
||||||||||||||
|
Deferred loss on derivatives, net of tax
|
—
|
|
—
|
|
—
|
|
—
|
|
—
|
|
(9
|
)
|
—
|
|
(9
|
)
|
||||||||||||||
|
Currency translation adjustments, net of tax
|
—
|
|
—
|
|
—
|
|
—
|
|
—
|
|
68
|
|
25
|
|
93
|
|
||||||||||||||
|
Total Comprehensive Income
|
222
|
|
||||||||||||||||||||||||||||
|
Stock awards
|
—
|
|
—
|
|
10
|
|
(11
|
)
|
—
|
|
—
|
|
—
|
|
(1
|
)
|
||||||||||||||
|
Purchase of Sears Canada shares
|
—
|
|
—
|
|
—
|
|
(269
|
)
|
—
|
|
(76
|
)
|
(236
|
)
|
(581
|
)
|
||||||||||||||
|
Sears Canada dividend paid to minority shareholders
|
—
|
|
—
|
|
—
|
|
—
|
|
—
|
|
—
|
|
(69
|
)
|
(69
|
)
|
||||||||||||||
|
Shares repurchased
|
(6
|
)
|
—
|
|
(394
|
)
|
—
|
|
—
|
|
—
|
|
—
|
|
(394
|
)
|
||||||||||||||
|
Associate stock purchase
|
—
|
|
—
|
|
4
|
|
—
|
|
—
|
|
—
|
|
—
|
|
4
|
|
||||||||||||||
|
Other
|
—
|
|
—
|
|
—
|
|
—
|
|
—
|
|
—
|
|
(2
|
)
|
(2
|
)
|
||||||||||||||
|
Balance at January 29, 2011
|
109
|
|
$
|
1
|
|
$
|
(5,826
|
)
|
$
|
10,185
|
|
$
|
4,930
|
|
$
|
(779
|
)
|
$
|
103
|
|
$
|
8,614
|
|
|||||||
|
Comprehensive loss
|
||||||||||||||||||||||||||||||
|
Net loss
|
—
|
|
—
|
|
—
|
|
—
|
|
(3,140
|
)
|
—
|
|
(7
|
)
|
(3,147
|
)
|
||||||||||||||
|
Pension and postretirement adjustments, net of tax
|
—
|
|
—
|
|
—
|
|
—
|
|
—
|
|
(789
|
)
|
—
|
|
(789
|
)
|
||||||||||||||
|
Deferred loss on derivatives, net of tax
|
—
|
|
—
|
|
—
|
|
—
|
|
—
|
|
(6
|
)
|
—
|
|
(6
|
)
|
||||||||||||||
|
Currency translation adjustments, net of tax
|
—
|
|
—
|
|
—
|
|
—
|
|
—
|
|
(33
|
)
|
(5
|
)
|
(38
|
)
|
||||||||||||||
|
Total Comprehensive Loss
|
(3,980
|
)
|
||||||||||||||||||||||||||||
|
Stock awards
|
—
|
|
—
|
|
23
|
|
(19
|
)
|
—
|
|
—
|
|
—
|
|
4
|
|
||||||||||||||
|
Purchase of Sears Canada shares
|
—
|
|
—
|
|
—
|
|
(24
|
)
|
—
|
|
(2
|
)
|
(17
|
)
|
(43
|
)
|
||||||||||||||
|
Shares repurchased
|
(3
|
)
|
—
|
|
(183
|
)
|
—
|
|
—
|
|
—
|
|
—
|
|
(183
|
)
|
||||||||||||||
|
Associate stock purchase
|
—
|
|
—
|
|
5
|
|
—
|
|
—
|
|
—
|
|
—
|
|
5
|
|
||||||||||||||
|
Non-cash dividend issued in connection with Spin-Off
|
—
|
|
—
|
|
—
|
|
(137
|
)
|
75
|
|
—
|
|
(12
|
)
|
(74
|
)
|
||||||||||||||
|
Other
|
—
|
|
—
|
|
—
|
|
—
|
|
—
|
|
—
|
|
(2
|
)
|
(2
|
)
|
||||||||||||||
|
Balance at January 28, 2012
|
106
|
|
$
|
1
|
|
$
|
(5,981
|
)
|
$
|
10,005
|
|
$
|
1,865
|
|
$
|
(1,609
|
)
|
$
|
60
|
|
$
|
4,341
|
|
|||||||
|
Comprehensive loss
|
||||||||||||||||||||||||||||||
|
Net loss
|
—
|
|
—
|
|
—
|
|
—
|
|
(930
|
)
|
—
|
|
(124
|
)
|
(1,054
|
)
|
||||||||||||||
|
Pension and postretirement adjustments, net of tax
|
—
|
|
—
|
|
—
|
|
—
|
|
—
|
|
74
|
|
—
|
|
74
|
|
||||||||||||||
|
Deferred gain on derivatives, net of tax
|
—
|
|
—
|
|
—
|
|
—
|
|
—
|
|
5
|
|
—
|
|
5
|
|
||||||||||||||
|
Currency translation adjustments, net of tax
|
—
|
|
—
|
|
—
|
|
—
|
|
—
|
|
5
|
|
—
|
|
5
|
|
||||||||||||||
|
Total Comprehensive Loss
|
(970
|
)
|
||||||||||||||||||||||||||||
|
Stock awards
|
—
|
|
—
|
|
7
|
|
(1
|
)
|
—
|
|
—
|
|
—
|
|
6
|
|
||||||||||||||
|
Purchase of Sears Canada shares
|
—
|
|
—
|
|
—
|
|
(3
|
)
|
—
|
|
(1
|
)
|
(6
|
)
|
(10
|
)
|
||||||||||||||
|
Associate stock purchase
|
—
|
|
—
|
|
4
|
|
—
|
|
—
|
|
—
|
|
—
|
|
4
|
|
||||||||||||||
|
Separation of Sears Hometown and Outlet Stores, Inc.
|
—
|
|
—
|
|
—
|
|
(149
|
)
|
—
|
|
—
|
|
—
|
|
(149
|
)
|
||||||||||||||
|
Sears Canada dividend paid to minority shareholders
|
—
|
|
—
|
|
—
|
|
—
|
|
(50
|
)
|
—
|
|
—
|
|
(50
|
)
|
||||||||||||||
|
Non-cash dividend issued in connection with spin-off of 45 million common shares of Sears Canada
|
—
|
|
—
|
|
—
|
|
(554
|
)
|
—
|
|
67
|
|
487
|
|
—
|
|
||||||||||||||
|
Balance at February 2, 2013
|
106
|
|
$
|
1
|
|
$
|
(5,970
|
)
|
$
|
9,298
|
|
$
|
885
|
|
$
|
(1,459
|
)
|
$
|
417
|
|
$
|
3,172
|
|
|||||||
See accompanying Notes to Consolidated Financial Statements.
60
SEARS HOLDINGS CORPORATION
Notes to Consolidated Financial Statements
Nature of Operations, Consolidation and Basis of Presentation
Sears Holdings Corporation (“Holdings”) is the parent company of Kmart Holding Corporation (“Kmart”) and Sears, Roebuck and Co. (“Sears”). Holdings (together with its subsidiaries, “we,” “us,” “our,” or the “Company”) was formed as a Delaware corporation in 2004 in connection with the merger of Kmart and Sears (the “Merger”), on March 24, 2005. We are an integrated retailer with
2,019
full-line and
54
specialty retail stores in the United States, operating through Kmart and Sears, and
475
full-line and specialty retail stores in Canada operating through Sears Canada Inc. (“Sears Canada”), a
51%
-owned subsidiary. We have
three
reportable segments: Kmart, Sears Domestic and Sears Canada.
The consolidated financial statements include all majority-owned subsidiaries in which Holdings exercises control. Investments in companies in which Holdings exercises significant influence, but which we do not control (generally
20%
to
50%
ownership interest), are accounted for under the equity method of accounting. Investments in companies in which we have less than a
20%
ownership interest and do not exercise significant influence are accounted for at cost. All intercompany transactions and balances have been eliminated.
Separation of Sears Hometown and Outlet Businesses
On October 11, 2012, we completed the separation of our Sears Hometown and Outlet businesses through a rights offering transaction. Holdings received gross proceeds of
$446.5 million
with respect to the transaction, consisting of
$346.5 million
for the sale of Sears Hometown and Outlet Stores, Inc. ("SHO") common shares and
$100 million
through a dividend from SHO prior to the separation. Prior to the separation, SHO entered into an asset-based senior secured revolving credit facility with a group of financial institutions to provide (subject to availability under a borrowing base) for aggregate maximum borrowings of
$250 million
. Borrowings of
$100 million
from this revolving credit facility were used to fund the dividend paid to Holdings. We accounted for this separation in accordance with accounting standards applicable to common control transactions as ESL Investments, Inc. (together with its affiliated fund, "ESL") is a majority shareholder of Holdings and became a majority shareholder of SHO as a result of exercising subscription rights pursuant to the rights offering. Accordingly, we classified the difference between the proceeds received and the carrying value of net assets contributed to SHO as a reduction of capital in excess of par value in the Consolidated Statement of Equity for the period ended February 2, 2013.
In connection with the separation, Holdings and certain of its subsidiaries entered into various agreements with SHO under the terms described in Note 15. Because of the various agreements with SHO, the Company has determined that it has significant continuing cash flows with SHO. Accordingly, the operating results for SHO through the date of the separation are presented within the consolidated continuing operations of Holdings and the Sears Domestic segment in the accompanying Consolidated Financial Statements. See Note 15 to the Consolidated Financial Statements for further information related to the agreements with SHO.
Spin-Off of Orchard Supply Hardware Stores Corporation
On December 30, 2011, we completed the spin-off to our shareholders of all the capital stock of Orchard Supply Hardware Stores Corporation (“Orchard”) that was owned by Holdings immediately prior to the spin-off, consisting of common stock that represented approximately
80%
of the voting power of Orchard's outstanding capital stock and preferred stock that represented
100%
of Orchard's outstanding nonvoting capital stock. In connection with the spin-off, Holdings and certain of its subsidiaries entered into various agreements with Orchard, including a distribution agreement, a transition services agreement, an appliance sale and consignment agreement and brand license agreements. In addition, certain tax matters between Holdings and Orchard are governed by a tax sharing agreement entered into in 2005.
Holdings has no significant continuing involvement in the operations of Orchard. Accordingly, the operating results for Orchard are presented as discontinued operations in the accompanying Consolidated Statements of Operations for the years ended
January 28, 2012
and
January 29, 2011
. In addition, the cash flows from operating, investing and financing activities for Orchard have been separately stated as discontinued operations in the
61
SEARS HOLDINGS CORPORATION
Notes to Consolidated Financial Statements—(Continued)
accompanying Consolidated Statement of Cash Flows for the years ended
January 28, 2012
and
January 29, 2011
. The Notes to Consolidated Financial Statements exclude the impact of Orchard for all periods presented. Prior to completion of the spin-off, Orchard’s results of operations, financial position and cash flows were presented within the Sears Domestic segment.
Fiscal Year
Our fiscal year ends on the Saturday closest to January 31 each year. Unless otherwise stated, references to years in this report relate to fiscal years rather than to calendar years. The following fiscal periods are presented in this report.
|
Fiscal Year
|
Ended
|
Weeks
|
|
|
2012
|
February 2, 2013
|
53
|
|
|
2011
|
January 28, 2012
|
52
|
|
|
2010
|
January 29, 2011
|
52
|
|
Use of Estimates
The preparation of financial statements in conformity with accounting principles generally accepted in the United States of America requires management to make estimates and assumptions about future events. The estimates and assumptions affect the reported amounts of assets and liabilities and disclosure of contingent assets and liabilities at the date of the financial statements, as well as reported amounts of revenues and expenses during the reporting period. We evaluate our estimates and assumptions on an ongoing basis using historical experience and other factors that management believes to be reasonable under the circumstances. Adjustments to estimates and assumptions are made when facts and circumstances dictate. As future events and their effects cannot be determined with absolute certainty, actual results may differ from the estimates used in preparing the accompanying consolidated financial statements. Significant estimates and assumptions are required as part of determining inventory and accounts receivable valuation, estimating depreciation, amortization and recoverability of long-lived assets, establishing self-insurance, warranty, legal and other reserves, performing goodwill, intangible and long-lived asset impairment analyses, and in establishing valuation allowances on deferred income tax assets and reserves for tax examination exposures, and calculating retirement benefits.
Cash and Cash Equivalents
Cash equivalents include all highly liquid investments with original maturities of three months or less at the date of purchase. We also include deposits in-transit from banks for payments related to third-party credit card and debit card transactions within cash equivalents. The deposits in-transit balances included within cash equivalents were
$148 million
and
$173 million
at
February 2, 2013
and
January 28, 2012
, respectively.
We classify cash balances which have been pledged as collateral, and for which we do not have the ability to substitute letters of credit, as restricted cash on our Consolidated Balance Sheet.
We classify outstanding checks in excess of funds on deposit within other current liabilities and reduce cash and cash equivalents when these checks clear the bank on which they were drawn. Outstanding checks in excess of funds on deposit included in other current liabilities were
$114 million
and
$68 million
at
February 2, 2013
and
January 28, 2012
, respectively.
Allowance for Doubtful Accounts
We provide an allowance for doubtful accounts based on both historical experience and a specific identification basis. Allowances for doubtful accounts on accounts receivable balances were
$26 million
and
$28 million
at
February 2, 2013
and
January 28, 2012
, respectively. Our accounts receivable balance on our Consolidated Balance Sheet is presented net of our allowance for doubtful accounts and is comprised of various vendor-related and customer-related accounts receivable, including receivables related to our pharmacy operations.
62
SEARS HOLDINGS CORPORATION
Notes to Consolidated Financial Statements—(Continued)
Merchandise Inventories
Merchandise inventories are valued at the lower of cost or market. For Kmart and Sears Domestic, cost is primarily determined using the retail inventory method (“RIM”). Kmart merchandise inventories are valued under the RIM using primarily a first-in, first-out (“FIFO”) cost flow assumption. Sears Domestic merchandise inventories are valued under the RIM using primarily a last-in, first-out (“LIFO”) cost flow assumption. For Sears Canada, cost is determined using the average cost method based on individual items.
Inherent in the RIM calculation are certain significant management judgments and estimates including, among others, merchandise markons, markups, markdowns and shrinkage, which significantly impact the ending inventory valuation at cost, as well as resulting gross margins. The methodologies utilized by us in our application of the RIM are consistent for all periods presented. Such methodologies include the development of the cost-to-retail ratios, the groupings of homogenous classes of merchandise, the development of shrinkage and obsolescence reserves, the accounting for price changes and the computations inherent in the LIFO adjustment (where applicable). Management believes that the RIM provides an inventory valuation that reasonably approximates cost and results in carrying inventory at the lower of cost or market.
Approximately
45%
of consolidated merchandise inventories are valued using LIFO. To estimate the effects of inflation on inventories, we utilize external price indices determined by an outside source, the Bureau of Labor Statistics. If the FIFO method of inventory valuation had been used instead of the LIFO method, merchandise inventories would have been
$72 million
higher at
February 2, 2013
and
$70 million
higher at
January 28, 2012
.
Vendor Rebates and Allowances
We receive rebates and allowances from certain vendors through a variety of programs and arrangements intended to offset our costs of promoting and selling certain vendor products. These vendor payments are recognized and recorded as a reduction to the cost of merchandise inventories when earned and, thereafter, as a reduction of cost of sales, buying and occupancy as the merchandise is sold. Upfront consideration received from vendors linked to purchases or other commitments is initially deferred and amortized ratably to cost of sales, buying and occupancy over the life of the contract or as performance of the activities specified by the vendor to earn the fee is completed.
Property and Equipment
Property and equipment are recorded at cost, less accumulated depreciation. Additions and substantial improvements are capitalized and include expenditures that materially extend the useful lives of existing facilities and equipment. Maintenance and repairs that do not materially improve or extend the lives of the respective assets are expensed as incurred.
Depreciation expense, which includes depreciation on assets under capital leases, is recorded over the estimated useful lives of the respective assets using the straight-line method for financial statement purposes, and accelerated methods for tax purposes. The range of lives are generally
20
to
50
years for buildings,
3
to
10
years for furniture, fixtures and equipment, and
3
to
5
years for computer systems and computer equipment. Leasehold improvements are depreciated over the shorter of the associated lease term or the estimated useful life of the asset. Depreciation expense included within depreciation and amortization expense reported on the Consolidated Statements of Operations was
$778 million
,
$798 million
, and
$809 million
for the years ended
February 2, 2013
,
January 28, 2012
and
January 29, 2011
, respectively.
Primarily as a result of store closing actions, certain property and equipment are considered held for sale. The value of assets held for sale was
$57 million
and
$55 million
at
February 2, 2013
and
January 28, 2012
, respectively. These assets were included in prepaid expenses and other current assets in the Consolidated Balance Sheets at
February 2, 2013
and
January 28, 2012
at the lower of their historical net book value or their estimated fair value, less estimated costs to sell. We expect to sell the properties within a year and we continually remarket them. Substantially all assets held for sale are held within the Sears Domestic segment.
Impairment of Long-Lived Assets and Costs Associated with Exit Activities
In accordance with accounting standards governing the impairment or disposal of long-lived assets, the carrying value of long-lived assets, including property and equipment and definite-lived intangible assets, is
63
SEARS HOLDINGS CORPORATION
Notes to Consolidated Financial Statements—(Continued)
evaluated whenever events or changes in circumstances indicate that a potential impairment has occurred relative to a given asset or assets. Factors that could result in an impairment review include, but are not limited to, a current period cash flow loss combined with a history of cash flow losses, current cash flows that may be insufficient to recover the investment in the property over the remaining useful life, or a projection that demonstrates continuing losses associated with the use of a long-lived asset, significant changes in the manner of use of the assets or significant changes in business strategies. An impairment loss is recognized when the estimated undiscounted cash flows expected to result from the use of the asset plus net proceeds expected from disposition of the asset (if any) are less than the carrying value of the asset. When an impairment loss is recognized, the carrying amount of the asset is reduced to its estimated fair value as determined based on quoted market prices or through the use of other valuation techniques. See Note 13 for further information regarding long-lived asset impairment charges recorded during
2012
.
We account for costs associated with location closings in accordance with accounting standards pertaining to accounting for costs associated with exit or disposal activities. As such, we record a liability for costs associated with location closings, which includes employee severance, inventory markdowns and other liquidation fees when management makes the decision to exit a location. We record a liability for future lease costs (net of estimated sublease income) when we cease to use the location.
Goodwill, Trade Names, Other Intangible Assets and Related Impairments
Trade names acquired as part of the Merger account for the majority of our intangible assets recognized in the Consolidated Balance Sheet. The majority of these trade name assets, such as Kenmore, Craftsman and Lands' End, are expected to generate cash flows indefinitely, do not have estimable or finite useful lives and, therefore, are accounted for as indefinite-lived assets not subject to amortization. Certain intangible assets, including favorable lease rights, contractual arrangements and customer lists, have estimable, finite useful lives, which are used as the basis for their amortization. The estimated useful lives of such assets are determined using a number of factors, including the demand for the asset, competition and the level of expenditure required to maintain the cash flows associated with the asset.
Our goodwill results from the Merger. We perform annual goodwill and indefinite-lived intangible asset impairment tests at the last day of our November accounting period each year and assess the need to update the tests between annual tests if events or circumstances occur that would more likely than not reduce the fair value of a reporting unit or indefinite-lived intangible asset below its carrying amount. A significant amount of judgment is involved in determining if an indicator of impairment has occurred. Such indicators may include, among others: a significant decline in our expected future cash flows; a sustained, significant decline in our stock price and market capitalization; a significant adverse change in legal factors or in the business climate; unanticipated competition; and the testing for recoverability of a significant asset group within a reporting unit. Any adverse change in these factors could have a significant impact on the recoverability of these assets and could have a material impact on our consolidated financial statements.
Goodwill Impairment Assessments
Our goodwill resides in multiple reporting units. The goodwill impairment test involves a two-step process. The first step is a comparison of each reporting unit's fair value to its carrying value. We estimate fair value using the best information available, using both a market approach, as well as a discounted cash flow model, commonly referred to as the income approach. The market approach determines the value of a reporting unit by deriving market multiples for reporting units based on assumptions potential market participants would use in establishing a bid price for the unit. This approach therefore assumes strategic initiatives will result in improvements in operational performance in the event of purchase, and includes the application of a discount rate based on market participant assumptions with respect to capital structure and access to capital markets. The income approach uses a reporting unit's projection of estimated operating results and cash flows that is discounted using a weighted-average cost of capital that reflects current market conditions appropriate for the reporting unit. The projection uses management's best estimates of economic and market conditions over the projected period, including growth rates in sales, costs, estimates of future expected changes in operating margins and cash expenditures. Other significant estimates and assumptions include terminal value growth rates, future estimates of capital expenditures and changes in future
64
SEARS HOLDINGS CORPORATION
Notes to Consolidated Financial Statements—(Continued)
working capital requirements. Our final estimate of fair value of reporting units is developed by weighting the fair values determined through both the market and income approaches.
If the carrying value of the reporting unit is higher than its fair value, there is an indication that impairment may exist and the second step must be performed to measure the amount of impairment loss, if any. The amount of impairment is determined by comparing the implied fair value of reporting unit goodwill to the carrying value of the goodwill in the same manner as if the reporting unit was being acquired in a business combination. See Note 12 for further information regarding goodwill and related impairment charges recorded during
2012
and 2011.
Intangible Asset Impairment Assessments
We consider the income approach when testing intangible assets with indefinite lives for impairment on an annual basis. We utilize the income approach, specifically the relief from royalty method, for analyzing our indefinite-lived assets. This method is based on the assumption that, in lieu of ownership, a firm would be willing to pay a royalty in order to exploit the related benefits of this asset class. The relief from royalty method involves two steps: (1) estimation of reasonable royalty rates for the assets and (2) the application of these royalty rates to a net sales stream and discounting the resulting cash flows to determine a value. We multiplied the selected royalty rate by the forecasted net sales stream to calculate the cost savings (relief from royalty payment) associated with the assets. The cash flows are then discounted to present value by the selected discount rate and compared to the carrying value of the assets.
Financial Instruments and Hedging Activities
We are exposed to fluctuations in foreign currency exchange rates as a result of our net investment in Sears Canada. Further, Sears Canada is exposed to fluctuations in foreign currency exchange rates due to inventory purchase contracts denominated in U.S. dollars. As a result, we primarily use derivatives as a risk management tool to decrease our exposure to fluctuations in the foreign currency market. We primarily use foreign currency forward contracts to hedge the foreign currency exposure of our net investment in Sears Canada against adverse changes in exchange rates and foreign currency collar contracts to hedge against foreign currency exposure arising from Sears Canada's inventory purchase contracts denominated in U.S. dollars.
Hedges of Net Investment in Sears Canada
When applying hedge accounting treatment to our derivative transactions, we formally document our hedge relationships, including identification of the hedging instruments and the hedged items, as well as our risk management objectives and strategies for undertaking the hedge transaction. We also formally assess, both at inception and at least quarterly thereafter, whether the derivatives that are used in hedging transactions are highly effective in offsetting changes in either the fair value or cash flows of the hedged item. If it is determined that a derivative ceases to be a highly effective hedge, we discontinue hedge accounting.
For derivatives that are designated as hedges of our net investment in Sears Canada, we assess effectiveness based on changes in spot currency exchange rates. Changes in spot rates on the derivatives are recorded in the currency translation adjustments line in Accumulated Other Comprehensive Income (Loss) and remain there until such time that we substantially liquidate or sell our holdings in Sears Canada.
Sears Canada Hedges of Merchandise Purchases
Sears Canada mitigates the risk of currency fluctuations on offshore merchandise purchases denominated in U.S. currency by purchasing U.S. dollar denominated collar contracts for a portion of its expected requirements. Since the Company's functional currency is the U.S. dollar, we are not directly exposed to the risk of exchange rate changes due to Sears Canada's merchandise purchases, and therefore we do not account for these instruments as a hedge of our foreign currency exposure risk. Changes in the fair value of these contracts are recorded in the Consolidated Statements of Operations as a component of other income (loss) each period.
65
SEARS HOLDINGS CORPORATION
Notes to Consolidated Financial Statements—(Continued)
Hedges of Foreign Currency
The foreign currency forward contracts are recorded on the Consolidated Balance Sheet at fair value and, to the extent they have been designated and qualify for hedge accounting treatment, an offsetting amount is recorded as a component of other comprehensive income, net of income tax effects. Changes in the fair value of those forward contracts for which hedge accounting is not applied are recorded in the Consolidated Statements of Operations as a component of other income (loss). Certain of our currency forward contracts require collateral to be posted in the event our liability under such contracts reaches a predetermined threshold. Cash collateral posted under these contracts is recorded as part of our restricted cash balance.
Counterparty Credit Risk
We actively manage the risk of nonpayment by our derivative counterparties by limiting our exposure to individual counterparties based on credit ratings, value at risk and maturities. The counterparties to these instruments are major financial institutions with credit ratings of single-A or better at
January 28, 2012
. We had no derivative instruments at
February 2, 2013
.
Fair Value of Financial Instruments
We determine the fair value of financial instruments in accordance with standards pertaining to fair value measurements. Such standards define fair value and establish a framework for measuring fair value in GAAP. Under fair value measurement accounting standards, fair value is considered to be the exchange price in an orderly transaction between market participants to sell an asset or transfer a liability at the measurement date. We report the fair value of financial assets and liabilities based on the fair value hierarchy prescribed by accounting standards for fair value measurements, which prioritizes the inputs to valuation techniques used to measure fair value into three levels. See Note 4 to the Consolidated Financial Statements for further information regarding our derivative positions.
Financial instruments that potentially subject the Company to concentration of credit risk consist principally of temporary cash investments, accounts receivable and derivative financial instruments. We place our cash and cash equivalents in investment-grade, short-term instruments with high quality financial institutions and, by policy, limit the amount of credit exposure in any one financial instrument. We use high credit quality counterparties to transact our derivative transactions.
Cash and cash equivalents, accounts receivable, merchandise payables, credit facility borrowings and accrued liabilities are reflected in the Consolidated Balance Sheet at cost, which approximates fair value due to the short-term nature of these instruments. The fair value of our debt is disclosed in Note 3 to the Consolidated Financial Statements.
66
SEARS HOLDINGS CORPORATION
Notes to Consolidated Financial Statements—(Continued)
Self-insurance Reserves
We are self-insured for certain costs related to workers' compensation, asbestos and environmental, automobile, warranty, product and general liability claims. We obtain third-party insurance coverage to limit our exposure to certain of these self-insured risks. A portion of these self-insured risks is managed through a wholly-owned insurance subsidiary. Our liability reflected on the Consolidated Balance Sheet, classified within other liabilities (current and long-term), represents an estimate of the ultimate cost of claims incurred at the balance sheet date. In estimating this liability, we utilize loss development factors based on Company-specific data to project the future development of incurred losses. Loss estimates are adjusted based upon actual claims settlements and reported claims. The liabilities for self-insured risks are discounted to their net present values using an interest rate which is based upon the expected duration of the liabilities. Expected payments as of
February 2, 2013
were as follows:
|
millions
|
|||
|
2013
|
$
|
266
|
|
|
2014
|
163
|
|
|
|
2015
|
120
|
|
|
|
2016
|
87
|
|
|
|
2017
|
66
|
|
|
|
Later years
|
371
|
|
|
|
Total undiscounted obligation
|
1,073
|
|
|
|
Less—discount
|
(95
|
)
|
|
|
Net obligation
|
$
|
978
|
|
Loss Contingencies
We account for contingent losses in accordance with accounting standards pertaining to loss contingencies. Under accounting standards, loss contingency provisions are recorded for probable losses at management's best estimate of a loss, or when a best estimate cannot be made, a minimum loss contingency amount is recorded. These estimates are often initially developed substantially earlier than the ultimate loss is known, and the estimates are refined each accounting period, as additional information is known.
Revenue Recognition
Revenues include sales of merchandise, services and extended service contracts, net commissions earned from leased departments in retail stores, delivery and handling revenues related to merchandise sold, and fees earned from co-branded credit card programs. We recognize revenues from retail operations at the later of the point of sale or the delivery of goods to the customer. Direct to customer revenues are recognized when the merchandise is delivered to the customer. Revenues from product installation and repair services are recognized at the time the services are provided. Revenues from the sale of service contracts and the related direct acquisition costs are deferred and amortized over the lives of the associated contracts, while the associated service costs are expensed as incurred.
We earn revenues through arrangements with third-party financial institutions that manage and directly extend credit relative to our co-branded credit card programs. The third-party financial institutions pay us for generating new accounts and sales activity on co-branded cards, as well as for selling other financial products to cardholders. We recognize these revenues in the period earned, which is when our related performance obligations have been met. We sell gift cards to customers at our retail stores and through our direct to customer operations. The gift cards generally do not have expiration dates. Revenues from gift cards are recognized when (i) the gift card is redeemed by the customer, or (ii) the likelihood of the gift card being redeemed by the customer is remote (gift card breakage) based on historical redemption patterns and we determine that we do not have a legal obligation to remit the value of the unredeemed gift cards to the relevant jurisdictions.
Revenues from merchandise sales and services are reported net of estimated returns and allowances and exclude sales taxes. The reserve for returns and allowances is calculated as a percentage of sales based on historical
67
SEARS HOLDINGS CORPORATION
Notes to Consolidated Financial Statements—(Continued)
return percentages. Estimated returns are recorded as a reduction of sales and cost of sales. We defer the recognition of layaway sales and profit until the period in which the customer takes possession of the merchandise.
Cost of Sales, Buying and Occupancy Costs
Cost of sales, buying and occupancy are comprised principally of the costs of merchandise, buying, warehousing and distribution (including receiving and store delivery costs), retail store occupancy costs, product repair, and home service and installation costs, customer shipping and handling costs, vendor allowances, markdowns and physical inventory losses.
The Company has a SHOP YOUR WAY program in which customers earn points on purchases which may be redeemed to pay for future purchases. The expense for customer points earned is recognized as customers earn them and recorded in cost of sales.
Selling and Administrative Expenses
Selling and administrative expenses are comprised principally of payroll and benefits costs for retail and corporate employees, occupancy costs of corporate facilities, advertising, pre-opening costs and other administrative expenses.
Pre-Opening Costs
Pre-opening and start-up activity costs are expensed in the period in which they occur.
Advertising Costs
Advertising costs are expensed as incurred, generally the first time the advertising occurs, and amounted to
$1.6 billion
,
$1.9 billion
and
$2.0 billion
for
2012
,
2011
and
2010
, respectively. These costs are included within selling and administrative expenses in the accompanying Consolidated Statements of Operations.
Income Taxes
We account for income taxes in accordance with accounting standards pertaining to such taxes. Accordingly, we provide deferred income tax assets and liabilities based on the estimated future tax effects of differences between the financial and tax basis of assets and liabilities based on currently enacted tax laws in effect for the year in which the differences are expected to reverse. The tax balances and income tax expense recognized by us are based on management's interpretation of the tax laws of multiple jurisdictions. Income tax expense also reflects our best estimates and assumptions regarding, among other things, the level of future taxable income, tax planning, and any valuation allowance. Future changes in tax laws, changes in projected levels of taxable income, tax planning, and adoption and implementation of new accounting standards could impact the effective tax rate and tax balances recorded by us. In evaluating our ability to recover our deferred tax assets within the jurisdiction from which they arise, we consider all available positive and negative evidence, including scheduled reversals of deferred tax liabilities, projected future taxable income, tax planning strategies, and results of recent operations. In projecting future taxable income, we begin with historical results adjusted for the results of discontinued operations and changes in accounting policies and incorporate assumptions including the amount of future state, federal and foreign pre-tax operating income, the reversal of temporary differences, and the implementation of feasible and prudent tax planning strategies. In evaluating the objective evidence that historical results provide, we consider cumulative operating income (loss) over the past three years. These assumptions require significant judgment about the forecasts of future taxable income.
Stock-based Compensation
We account for stock-based compensation arrangements in accordance with accounting standards pertaining to share-based payment transactions, which requires us to both recognize as expense the fair value of all stock-based compensation awards (which includes stock options, although there were no options outstanding in
2012
) and to classify excess tax benefits associated with share-based compensation deductions as cash from financing activities
68
SEARS HOLDINGS CORPORATION
Notes to Consolidated Financial Statements—(Continued)
rather than cash from operating activities. We recognize compensation expense as awards vest on a straight-line basis over the requisite service period of the award.
Earnings Per Common Share
Basic earnings per common share is calculated by dividing net income attributable to Holdings' shareholders by the weighted average number of common shares outstanding for each period. Diluted earnings per common share also includes the dilutive effect of potential common shares, exercise of stock options and the effect of restricted stock when dilutive.
New Accounting Pronouncements
Disclosures about Reclassification Adjustments out of Accumulated Other Comprehensive Income
In February 2013, the Financial Accounting Standards Board (“FASB”) issued an accounting standards update which adds new disclosure requirements for items reclassified out of accumulated other comprehensive income. The update requires entities to disclose additional information about reclassification adjustments, including changes in accumulated other comprehensive income balances by component and significant items reclassified out of accumulated other comprehensive income. The update will be effective for us in the first quarter of 2013, but early adoption is permitted. The update will primarily impact our disclosures, but otherwise is not expected to have a material impact on our consolidated financial position, results of operations or cash flows.
Testing Indefinite-Lived Intangible Assets for Impairment
In July 2012, the FASB issued an accounting standards update which provides, subject to certain conditions, the option to perform a qualitative, rather than quantitative, assessment to determine whether it is more likely than not that the fair value of an indefinite-lived intangible asset is less than its carrying amount. The update will be effective for us in the first quarter of 2013, but early adoption is permitted. The update may, under certain circumstances, reduce the complexity and costs of testing indefinite-lived intangible assets for impairment, but otherwise is not expected to have a material impact on the Company’s condensed consolidated financial position, results of operations or cash flows.
Testing Goodwill for Impairment
In September 2011, the FASB issued an accounting standards update which provides, subject to certain conditions, the option to perform a qualitative, rather than quantitative, assessment to determine whether it is more likely than not that the fair value of a reporting unit is less than its carrying amount. This update was effective and adopted by the Company in the first quarter of 2012 and did not have a material impact on the Company’s condensed consolidated financial position, results of operations or cash flows.
Presentation of Comprehensive Income
In June 2011, the FASB issued an accounting standards update which revises the manner in which entities present comprehensive income in their financial statements. The new guidance removes the presentation options in existing guidance and requires entities to report components of comprehensive income in either (1) a continuous statement of comprehensive income or (2) two separate but consecutive statements. Under the two-statement approach, the first statement would include components of net income, which is consistent with the income statement format previously used by us, and the second statement would include components of other comprehensive income (“OCI”). The update does not change the items that must be reported in OCI and must be applied retrospectively for all periods presented in the financial statements. This update was effective and adopted by the Company in the first quarter of 2012 and impacted the Company’s financial statement presentation, but otherwise did not impact the Company’s condensed consolidated financial position, results of operations or cash flows.
69
SEARS HOLDINGS CORPORATION
Notes to Consolidated Financial Statements—(Continued)
Disclosures about Fair Value Measurements
In May 2011, the FASB issued an accounting standards update which amends the definition of fair value measurement principles and disclosure requirements to eliminate differences between U.S. GAAP and International Financial Reporting Standards. The update requires new quantitative and qualitative disclosures about the sensitivity of recurring Level 3 measurement disclosures, as well as disclosures of transfers between Level 1 and Level 2 of the fair value hierarchy. This update was effective and adopted by the Company in the first quarter of 2012 and impacted the Company’s disclosures, but otherwise did not have a material impact on the Company’s condensed consolidated financial position, results of operations or cash flows.
Sears Canada Share Repurchases
During the second quarter of 2011, Sears Canada renewed its Normal Course Issuer Bid with the Toronto Stock Exchange that permits it to purchase for cancellation up to
5%
of its issued and outstanding common shares, representing approximately
5.3 million
common shares. The purchase authorization expired on
May 24, 2012
. Prior to the expiration, Sears Canada purchased and canceled approximately
0.9 million
common shares for
$10 million
, approximately
2.7 million
common shares for
$43 million
and approximately
2.2 million
common shares for
$43 million
during
2012
,
2011
and
2010
, respectively.
Sears Holdings Ownership of Sears Canada
At
February 2, 2013
and
January 28, 2012
, Sears Holdings was the beneficial holder of approximately
52 million
, or
51%
and
97 million
, or
95%
, respectively, of the common shares of Sears Canada.
Partial Spin-Off
On November 13, 2012, we completed a partial spin-off (the “spin-off”) of our interest in Sears Canada. Prior to the spin-off, Holdings beneficially owned approximately
96%
of the issued and outstanding common shares of Sears Canada. In connection with the spin-off, we distributed approximately
45 million
common shares of Sears Canada held by Holdings on a pro rata basis to holders of Holdings' common stock. Following the spin-off, Holdings was the beneficial holder of approximately
51%
of the issued and outstanding common shares of Sears Canada, and as such, Holdings has maintained control of Sears Canada and will continue to consolidate the results of Sears Canada. We accounted for the spin-off as an equity transaction in accordance with accounting standards applicable to noncontrolling interests. Accordingly, we reclassified a portion of our ownership interest in Sears Canada and accumulated other comprehensive loss to noncontrolling interest in the Consolidated Statement of Equity for the period ended February 2, 2013.
Acquisition of Noncontrolling Interest
During the first quarter of 2010, we acquired approximately
19 million
additional common shares of Sears Canada. We paid a total of
$560 million
for the additional shares and accounted for the acquisition of additional interest in Sears Canada as an equity transaction in accordance with accounting standards applicable to noncontrolling interests. Accordingly, we reclassified an accumulated other comprehensive loss from noncontrolling interest to controlling interest in the Consolidated Statement of Equity for the period ended January 29, 2011.
Dividends
On December 12, 2012, Sears Canada announced that its Board of Directors declared a cash dividend of
$1
Canadian per common share, or approximately
$102 million
Canadian (
$102 million
U.S.) which was paid on December 31, 2012 to shareholders of record at the close of business on December 24, 2012. Accordingly, the Company received dividends of
$52 million
and minority shareholders in Sears Canada received dividends of
$50 million
during the fourth quarter of 2012.
On May 18, 2010, Sears Canada announced that its Board of Directors declared a cash dividend of
$3.50
Canadian per common share, or approximately
$377 million
Canadian (
$352 million
U.S.), which was paid on
70
SEARS HOLDINGS CORPORATION
Notes to Consolidated Financial Statements—(Continued)
June 4, 2010 to shareholders of record at the close of business on May 31, 2010. Accordingly, the Company received dividends of
$318 million
and minority shareholders in Sears Canada received dividends of
$34 million
during the second quarter of 2010.
On September 10, 2010, Sears Canada announced that its Board of Directors declared an additional cash dividend of
$3.50
Canadian per common share, or approximately
$377 million
Canadian (
$356 million
U.S.), which was paid on
September 24, 2010
to shareholders of record at the close of business on
September 22, 2010
. Accordingly, the Company received dividends of
$321 million
and minority shareholders in Sears Canada received dividends of
$35 million
during the third quarter of 2010.
Sears Canada declared and paid total dividends of
$754 million
Canadian (
$708 million
U.S.) during 2010, of which the Company received
$639 million
and minority shareholders received
$69 million
.
Total borrowings outstanding at
February 2, 2013
and
January 28, 2012
were
$3.1 billion
and
$3.5 billion
, respectively. At
February 2, 2013
, total short-term borrowings were
$1.1 billion
, consisting of
$749 million
secured borrowings and
$345 million
of unsecured commercial paper. At
January 28, 2012
, total short-term borrowings were
$1.2 billion
, consisting of
$838 million
secured borrowings and
$337 million
of unsecured commercial paper. The weighted-average annual interest rate paid on short-term debt was
2.7%
in
2012
and
2.3%
in
2011
.
Long-term debt was as follows:
|
ISSUE
|
February 2,
2013 |
January 28,
2012 |
|||||
|
millions
|
|
|
|||||
|
SEARS ROEBUCK ACCEPTANCE CORP.
|
|
|
|||||
|
6.50% to 7.50% Notes, due 2017 to 2043
|
$
|
327
|
|
$
|
398
|
|
|
|
7.05% to 7.50% Medium-Term Notes, due 2013
|
11
|
|
80
|
|
|||
|
SEARS HOLDINGS CORP.
|
|
||||||
|
6.625% Senior Secured Notes, due 2018
|
1,237
|
|
1,237
|
|
|||
|
SEARS DC CORP.
|
|
||||||
|
9.07% to 9.20% Medium-Term Notes
|
—
|
|
23
|
|
|||
|
SEARS CANADA INC.
|
|
||||||
|
Credit Facility, expires 2015
|
—
|
|
101
|
|
|||
|
CAPITALIZED LEASE OBLIGATIONS
|
433
|
|
455
|
|
|||
|
OTHER NOTES AND MORTGAGES
|
18
|
|
24
|
|
|||
|
Total long-term borrowings
|
2,026
|
|
2,318
|
|
|||
|
Current maturities
|
(83
|
)
|
(230
|
)
|
|||
|
Long-term debt and capitalized lease obligations
|
$
|
1,943
|
|
$
|
2,088
|
|
|
|
Weighted-average annual interest rate on long-term debt
|
6.7
|
%
|
7.1
|
%
|
|||
The fair value of long-term debt, excluding capitalized lease obligations, was
$1.4 billion
at
February 2, 2013
and
$1.5 billion
at
January 28, 2012
. The fair value of our debt was estimated based on quoted market prices for the same or similar issues or on current rates offered to us for debt of the same remaining maturities. Our long-term debt instruments are valued using Level 2 measurements as defined in Note 5.
71
SEARS HOLDINGS CORPORATION
Notes to Consolidated Financial Statements—(Continued)
At
February 2, 2013
, long-term debt maturities for the next five years and thereafter were as follows:
|
millions
|
|
||
|
2013
|
$
|
83
|
|
|
2014
|
67
|
|
|
|
2015
|
61
|
|
|
|
2016
|
50
|
|
|
|
2017
|
89
|
|
|
|
Thereafter
|
1,676
|
|
|
|
|
$
|
2,026
|
|
Interest
Interest expense for years
2012
,
2011
and
2010
was as follows:
|
millions
|
2012
|
2011
|
2010
|
|||||||||
|
COMPONENTS OF INTEREST EXPENSE
|
|
|
|
|||||||||
|
Interest expense
|
$
|
232
|
|
$
|
248
|
|
$
|
242
|
|
|||
|
Accretion of lease obligations at net present value
|
17
|
|
20
|
|
21
|
|
||||||
|
Amortization of debt issuance costs
|
18
|
|
21
|
|
30
|
|
||||||
|
Interest expense
|
$
|
267
|
|
$
|
289
|
|
$
|
293
|
|
|||
Debt Repurchase Authorization
In 2005, our Finance Committee of the Board of Directors authorized the repurchase, subject to market conditions and other factors, of up to
$500 million
of our outstanding indebtedness in open market or privately negotiated transactions. Our wholly owned finance subsidiary, Sears Roebuck Acceptance Corp. (“SRAC”), has repurchased
$215 million
of its outstanding notes. In 2011, Sears Holdings repurchased
$10 million
of senior secured notes, recognizing a gain of
$2 million
. The unused balance of this authorization is
$275 million
.
Unsecured Commercial Paper
We borrow through the commercial paper markets. At
February 2, 2013
and
January 28, 2012
, we had outstanding commercial paper borrowings of
$345 million
and
$337 million
, respectively. ESL held
$285 million
and
$250 million
, respectively, of our commercial paper at
February 2, 2013
and
January 28, 2012
, including
$169 million
and
$130 million
, respectively, held by Edward S. Lampert. See Note 15 for further discussion of these borrowings.
Domestic Credit Agreement
During the first quarter of 2011, we entered into a
$3.275 billion
credit agreement (the “Domestic Credit Agreement”) which expires in April 2016. We view this credit facility as our most cost efficient funding mechanism and therefore use it as a primary source of funding.
Advances under the Domestic Credit Agreement bear interest at a rate equal to, at the election of the Borrowers, either the London Interbank Offered Rate (“LIBOR”) or a base rate, in either case plus an applicable margin. The Domestic Credit Agreement’s interest rates for LIBOR-based borrowings vary based on leverage in the range of LIBOR plus
2.0%
to
2.5%
. Interest rates for base rate-based borrowings vary based on leverage in the range of the applicable base rate plus
1.0%
to
1.5%
. Commitment fees are in a range of
0.375%
to
0.625%
based on usage.
The Domestic Credit Agreement includes a
$1.5 billion
letter of credit sub-limit and an uncommitted accordion feature that provides us the flexibility, subject to certain terms and conditions, to use the existing collateral under the
72
SEARS HOLDINGS CORPORATION
Notes to Consolidated Financial Statements—(Continued)
credit facility to obtain an aggregate amount of up to
$1.0 billion
in additional borrowing capacity. The Domestic Credit Agreement permits aggregate second lien indebtedness of up to
$2.0 billion
, of which
$1.2 billion
in second lien notes were outstanding at
February 2, 2013
, providing the Company the capacity to issue up to an additional
$760 million
in second lien indebtedness. The Domestic Credit Agreement is in place as a funding source for general corporate purposes and is an asset based revolving credit facility under which Sears Roebuck Acceptance Corp. (“SRAC”) and Kmart Corporation are the borrowers. The Domestic Credit Agreement is secured by a first lien on most of our domestic inventory and credit card and pharmacy receivables, and is subject to a borrowing base formula to determine availability.
The Domestic Credit Agreement limits our ability to make restricted payments, including dividends and share repurchases, under certain circumstances, including if availability under the credit facility, as defined, is less than
15%
. It also imposes various other requirements, which take effect if availability falls below designated thresholds, including a cash dominion requirement and a requirement that the fixed charge ratio at the last day of any quarter be not less than
1.0
to 1.0.
At
February 2, 2013
and
January 28, 2012
, we had
$749 million
and
$838 million
, respectively, of borrowings and
$754 million
and
$626 million
, respectively, of letters of credit outstanding under the Domestic Credit Agreement. As a result, our availability under the agreement was
$1.8 billion
at both
February 2, 2013
and
January 28, 2012
. The majority of the letters of credit outstanding are used to provide collateral for our insurance programs.
Senior Secured Notes
In October 2010, we sold
$1 billion
aggregate principal amount of senior secured notes (the “Notes”), which bear interest at 6 5/8% per annum and mature on
October 15, 2018
. Concurrent with the closing of the sale of the Notes, the Company sold
$250 million
aggregate principal amount of Notes to the Company’s domestic pension plan in a private placement. The Notes are guaranteed by certain subsidiaries of the Company and are secured by a security interest in certain assets consisting primarily of domestic inventory and credit card receivables (the “Collateral”). The lien that secures the Notes is junior in priority to the lien on such assets that secures obligations under the Domestic Credit Agreement, as well as certain other first priority lien obligations. The Company used the net proceeds of this offering to repay borrowings outstanding under a previous domestic credit agreement on the settlement date and to fund the working capital requirements of our retail businesses, capital expenditures and for general corporate purposes. The indenture under which the Notes were issued contains restrictive covenants that, among other things, (1) limit the ability of the Company and certain of its domestic subsidiaries to create liens and enter into sale and leaseback transactions and (2) limit the ability of the Company to consolidate with or merge into, or sell other than for cash or lease all or substantially all of its assets to, another person. The indenture also provides for certain events of default, which, if any were to occur, would permit or require the principal and accrued and unpaid interest on all the then outstanding notes to be due and payable immediately. Generally, the Company is required to offer to repurchase all outstanding Notes at a purchase price equal to
101%
of the principal amount if the borrowing base (as calculated pursuant to the indenture) falls below the principal value of the notes plus any other indebtedness for borrowed money that is secured by liens on the Collateral for two consecutive quarters or upon the occurrence of certain change of control triggering events. The Company may call the Notes at a premium based on the “Treasury Rate” as defined in the indenture, plus
50
basis points. On September 6, 2011, we completed our offer to exchange the Notes held by nonaffiliates for a new issue of substantially identical notes registered under the Securities Act of 1933, as amended.
Sears Canada Credit Agreement
In September 2010, Sears Canada entered into a
five
-year,
$800 million
Canadian senior secured revolving credit facility (the “Sears Canada Facility”). The Sears Canada Facility is available for Sears Canada’s general corporate purposes and is secured by a first lien on inventory and credit card receivables. Availability under the Sears Canada Facility is determined pursuant to a borrowing base formula based on inventory and credit card receivables, subject to certain limitations. At
February 2, 2013
we had
no
borrowings outstanding under the Sears Canada Facility. At
January 28, 2012
, we had approximately
$101 million
(
$101 million
Canadian) of borrowings outstanding under the Sears Canada Facility. Availability under this agreement was approximately
$503 million
(
$502 million
Canadian) and
$415 million
(
$415 million
Canadian), respectively, at
February 2, 2013
and
73
SEARS HOLDINGS CORPORATION
Notes to Consolidated Financial Statements—(Continued)
January 28, 2012
. The current availability may be reduced by reserves currently estimated by the Company to be approximately
$300 million
, which may be applied by the lenders at their discretion pursuant to the Credit Facility agreement. As a result of judicial developments relating to the priorities of pension liability relative to certain secured obligations, Sears Canada has executed an amendment to the Sears Canada Credit Facility which would provide additional security to lenders, with respect to the Company's unfunded pension liability by pledging certain real estate assets as collateral thereby partially reducing the potential reserve amounts by up to
$150 million
the lenders could apply. The potential additional reserve amount may increase or decrease in the future based on estimated net pension liabilities.
Letters of Credit Facility
Effective March 15, 2013, we agreed to terminate our
$500 million
uncommitted letter of credit facility dated January 20, 2011 with Wells Fargo Bank, National Association ("Wells Fargo") in advance of the scheduled termination date of
January 20, 2014
, as
no
letters of credit have been issued and outstanding under the facility since May 2011. The facility was secured by a first priority lien on cash placed on deposit at Wells Fargo in an amount equal to
103%
of the face value of all issued and outstanding letters of credit.
Cash Collateral
We post cash collateral for certain self-insurance programs. We continue to classify the cash collateral posted for self-insurance programs as cash and cash equivalents due to our ability to substitute letters of credit for the cash at any time at our discretion. At February 2, 2013 and January 28, 2012,
$19 million
and
$20 million
of cash, respectively, was posted as collateral for self-insurance programs.
Wholly owned Insurance Subsidiary and Intercompany Securities
We have numerous types of insurable risks, including workers’ compensation, product and general liability, automobile, warranty, asbestos and environmental claims and the extended service contracts we sell to our customers. In addition, we provide credit insurance to third party creditors of the Company to mitigate their credit risk with the Company. The associated risks are managed through Holdings’ wholly owned insurance subsidiary, Sears Reinsurance Company Ltd. (“Sears Re”), a Bermuda Class 3 insurer.
In accordance with applicable insurance regulations, Sears Re holds marketable securities to support the insurance coverage it provides. Sears utilizes two securitization structures to issue specific securities in which Sears Re invests its capital to fund its insurance obligations. In November 2003, Sears formed a Real Estate Mortgage Investment Conduit, or REMIC. The real estate associated with
125
Full-line stores was contributed to indirect wholly owned subsidiaries of Sears, and then leased back to Sears. The contributed stores were mortgaged and the REMIC issued securities that are secured by the mortgages and collateral assignments of the store leases. Sears Re and two other indirect wholly owned subsidiaries of Holdings own
$1.3 billion
(par value) of these mortgage-backed securities. Payments to Sears Re on these securities are funded by the lease payments. In May 2006, a subsidiary of Holdings contributed the rights to use the Kenmore, Craftsman and DieHard trademarks in the U.S. and its possessions and territories to KCD IP, LLC, an indirect wholly owned subsidiary of Holdings. KCD IP, LLC has licensed the use of the trademarks to subsidiaries of Holdings, including Sears and Kmart. Asset-backed securities with a par value of
$1.8 billion
were issued by KCD IP, LLC and subsequently purchased by Sears Re, the collateral for which includes the trademark rights and royalty income. Payments to Sears Re on these asset-backed securities are funded by the royalty payments. The issuers of these mortgage-backed and asset-backed securities and the owners of these real estate and trademark assets are bankruptcy remote, special purpose entities that are indirect wholly owned subsidiaries of Holdings. Cash flows received from rental streams and licensing fee streams paid by Sears, Kmart, other affiliates and third parties, are used for the payment of fees and interest on these securities. Since the inception of the REMIC and KCD IP, LLC, these mortgage-backed and asset-backed securities have been entirely held by our wholly owned consolidated subsidiaries in support of our insurance activities. At
February 2, 2013
and
January 28, 2012
, the net book value of the securitized trademark rights was approximately
$1.0 billion
. The net book value of the securitized real estate assets was approximately
$0.8 billion
at
February 2, 2013
and
January 28, 2012
.
74
SEARS HOLDINGS CORPORATION
Notes to Consolidated Financial Statements—(Continued)
Trade Creditor Matters
We have ongoing discussions concerning our liquidity and financial position with the vendor community and third parties that offer various credit protection services to our vendors. The topics discussed have included such areas as pricing, payment terms and ongoing business arrangements. As of the date of this report, we have not experienced any significant disruption in our access to merchandise or our operations.
We primarily use derivatives as a risk management tool to decrease our exposure to fluctuations in the foreign currency market. We are exposed to fluctuations in foreign currency exchange rates as a result of our net investment in Sears Canada. Further, Sears Canada is exposed to fluctuations in foreign currency exchange rates due to inventory purchase contracts denominated in U.S. dollars.
Earnings Effects of Derivatives on the Statements of Operations
For derivatives that were designated as hedges of our net investment in Sears Canada, we assess effectiveness based on changes in forward currency exchange rates. Changes in forward rates on the derivatives are recorded in the currency translation adjustments line in accumulated other comprehensive loss and will remain there until we substantially liquidate or sell our holdings in Sears Canada.
Changes in the fair value of any derivatives that are not designated as hedges are recorded in earnings each period. Sears Canada mitigates the risk of currency fluctuations on offshore merchandise purchases denominated in U.S. currency by purchasing U.S. dollar denominated collar contracts for a portion of its expected requirements. Since the Company's functional currency is the U.S. dollar, we are not directly exposed to the risk of exchange rate changes due to Sears Canada’s merchandise purchases, and therefore we do not account for these instruments as a hedge of our foreign currency exposure risk.
Sears Canada Hedges of Merchandise Purchases
Sears Canada had
no
outstanding foreign currency collar contracts at
February 2, 2013
or
January 28, 2012
. As discussed previously, these collar contracts were used to hedge Sears Canada’s purchase of inventory under U.S. dollar denominated contracts. We record mark-to-market adjustments based on the total notional value of these outstanding collar contracts at the end of each period.
We record the earnings impact of mark-to-market and settlement adjustments for foreign currency collar contracts in other income (loss) at the end of each period. We recorded
no
mark-to-market and settlement gains on these contracts for the year ended
February 2, 2013
. We recorded mark-to-market and settlement gains on these contracts of
$4 million
in other loss for the year ended
January 28, 2012
, and mark-to-market and settlement losses on these contracts of
$14 million
in other loss for the year ended
January 29, 2011
.
Sears Canada’s above noted foreign currency collar contracts were entered into as a hedge of merchandise purchase contracts denominated in U.S. currency. We also record mark-to-market adjustments for the value of the merchandise purchase contracts (considered embedded derivatives under relevant accounting rules) at the end of each period. We recorded
no
assets at
February 2, 2013
, and assets of
$1 million
at
January 28, 2012
related to the fair value of these embedded derivatives.
We record the earnings impact of mark-to-market and settlement adjustments related to the embedded derivative in the merchandise purchase contracts in other income (loss) at the end of each period. We recorded mark-to-market and settlement gains of
$2 million
for the year ended
February 2, 2013
. We recorded mark-to-market and settlement losses of
$5 million
and
$1 million
for the years ended
January 28, 2012
and
January 29, 2011
, respectively.
We recorded total mark-to-market gains and settlements of
$2 million
in other loss for the year ended
February 2, 2013
. We recorded total mark-to-market losses and settlements of
$1 million
and
$15 million
in other loss for the years ended
January 28, 2012
and
January 29, 2011
, respectively. At
February 2, 2013
, we had
no
derivative mark-to-market assets related to the embedded derivatives, and at
January 28, 2012
, we had total derivative mark-to-market assets related to the collar contracts and embedded derivatives of
$1 million
. See Note 5
75
SEARS HOLDINGS CORPORATION
Notes to Consolidated Financial Statements—(Continued)
for further information regarding fair value of these collar and merchandise purchase contracts and the respective balance sheet classifications.
Hedges of Net Investment in Sears Canada
We had
no
foreign currency forward contracts outstanding at
February 2, 2013
. At
January 28, 2012
, we had a foreign currency forward contract outstanding with a total Canadian notional value of
$629 million
, and with a weighted-average remaining life of
0.1 years
. This contract was designated and qualified as a hedge of the foreign currency exposure of our net investment in Sears Canada. Accordingly, we recorded
no
liability related to the forward contracts at
February 2, 2013
, and the aggregate fair value of the forward contract outstanding at
January 28, 2012
of approximately
$(6) million
was recorded as a liability on our Consolidated Balance Sheet. The change in fair value of approximately
$6 million
related to these forward contracts, net of tax, was recorded as a component of other comprehensive loss for the year ended
February 2, 2013
.
We settled foreign currency forward contracts during
2012
and
2011
and received net amounts of
$6 million
and
$0.1 million
, respectively, relative to these contract settlements. We settled foreign currency forward contracts during
2010
and paid net amounts of
$3 million
relative to these contract settlements. As hedge accounting was applied to these contracts, an offsetting amount was recorded as a component of other comprehensive loss.
Our currency forward contracts require collateral be posted in the event our liability under such contracts reaches a predetermined threshold. Cash collateral posted under these contracts is recorded as part of our accounts receivable balance. We had
no
cash collateral posted under these contracts at
February 2, 2013
and
$5 million
at
January 28, 2012
.
Counterparty Credit Risk
We actively manage the risk of nonpayment by our derivative counterparties by limiting our exposure to individual counterparties based on credit ratings, value at risk and maturities. The counterparties to these instruments are major financial institutions with credit ratings of single-A or better at
January 28, 2012
. We had no derivative instruments at
February 2, 2013
.
Financial Guarantees
We issue various types of guarantees in the normal course of business. We had the following guarantees outstanding at
February 2, 2013
:
|
millions
|
Bank
Issued |
SRAC
Issued |
Other
|
Total
|
||||||||||||
|
Standby letters of credit
|
$
|
774
|
|
$
|
47
|
|
$
|
—
|
|
$
|
821
|
|
||||
|
Commercial letters of credit
|
8
|
|
133
|
|
—
|
|
141
|
|
||||||||
|
Secondary lease obligations
|
—
|
|
—
|
|
77
|
|
77
|
|
||||||||
The secondary lease obligations related to certain store leases of previously divested Sears businesses. We remain secondarily liable if the primary obligor defaults.
We determine fair value of financial assets and liabilities based on the following fair value hierarchy, which prioritizes the inputs to valuation techniques used to measure fair value into three levels:
Level 1 inputs
– unadjusted quoted prices in active markets for identical assets or liabilities that we have the ability to access. An active market for the asset or liability is one in which transactions for the asset or liability occur with sufficient frequency and volume to provide ongoing pricing information.
Level 2 inputs
– inputs other than quoted market prices included in Level 1 that are observable, either directly or indirectly, for the asset or liability. Level 2 inputs include, but are not limited to, quoted prices for similar assets or liabilities in an active market, quoted prices for identical or similar assets or liabilities in markets that
76
SEARS HOLDINGS CORPORATION
Notes to Consolidated Financial Statements—(Continued)
are not active and inputs other than quoted market prices that are observable for the asset or liability, such as interest rate curves and yield curves observable at commonly quoted intervals, volatilities, credit risk and default rates.
Level 3 inputs
– unobservable inputs for the asset or liability.
Accounts receivable, merchandise payables, short-term borrowings, accrued liabilities and domestic cash and cash equivalents are reflected in the Consolidated Balance Sheets at cost, which approximates fair value due to the short-term nature of these instruments. The fair value of our debt is disclosed in Note 3 to the Consolidated Financial Statements. The following tables provide the fair value measurement amounts for other financial assets and liabilities recorded in our Consolidated Balance Sheets at fair value at
February 2, 2013
and
January 28, 2012
:
|
Total Fair Value
Amounts at
|
|||||||||||||||
|
millions
|
February 2, 2013
|
Level 1
|
Level 2
|
Level 3
|
|||||||||||
|
Cash equivalents
(1)
|
$
|
181
|
|
$
|
181
|
|
$
|
—
|
|
$
|
—
|
|
|||
|
Restricted cash
(2)
|
9
|
|
9
|
|
—
|
|
—
|
|
|||||||
|
Total
|
$
|
190
|
|
$
|
190
|
|
$
|
—
|
|
$
|
—
|
|
|||
|
Total Fair Value
Amounts at
|
|||||||||||||||
|
millions
|
January 28, 2012
|
Level 1
|
Level 2
|
Level 3
|
|||||||||||
|
Cash equivalents
(1)
|
$
|
341
|
|
$
|
341
|
|
$
|
—
|
|
$
|
—
|
|
|||
|
Restricted cash
(2)
|
7
|
|
7
|
|
—
|
|
—
|
|
|||||||
|
Foreign currency derivative assets
(3)
|
1
|
|
—
|
|
1
|
|
—
|
|
|||||||
|
Foreign currency derivative liabilities
(4)
|
(6
|
)
|
—
|
|
(6
|
)
|
—
|
|
|||||||
|
Total
|
$
|
343
|
|
$
|
348
|
|
$
|
(5
|
)
|
$
|
—
|
|
|||
__________________
|
(1)
|
Included within Cash and cash equivalents on the Consolidated Balance Sheets.
|
|
(2)
|
Included within Restricted cash on the Consolidated Balance Sheets.
|
|
(3)
|
Included within Prepaid expenses and other current assets on the Consolidated Balance Sheets.
|
|
(4)
|
Included within Accrued expenses and other current liabilities on the Consolidated Balance Sheets.
|
The fair values of derivative assets and liabilities traded in the over-the-counter market are determined using quantitative models that require the use of multiple inputs including interest rates, prices and indices to generate pricing and volatility factors. The predominance of market inputs are actively quoted and can be validated through external sources, including brokers, market transactions and third-party pricing services. Our derivative instruments are valued using Level 2 measurements.
Assets and Liabilities that are Measured at Fair Value on a Nonrecurring Basis
Assets and liabilities that are measured at fair value on a nonrecurring basis relate primarily to our tangible fixed assets, goodwill and other intangible assets, which are remeasured when the derived fair value is below carrying value on our Consolidated Balance Sheets. For these assets, we do not periodically adjust carrying value to fair value except in the event of impairment. When we determine that impairment has occurred, we measure the impairment and adjust the carrying value as discussed in Note 1. With the exception of the goodwill and fixed asset impairments described in Note 12 and Note 13, respectively, we had no significant remeasurements of such assets or liabilities to fair value during
2012
and
2011
.
All of the fair value remeasurements were based on significant unobservable inputs (Level 3). Fixed asset fair values were derived based on discussions with real estate brokers, review of comparable properties, if available, and internal expertise related to the current marketplace conditions. Inputs for the goodwill included discounted cash flow analyses, comparable marketplace fair value data, as well as management's assumptions in valuing significant tangible and intangible assets, as described in Note 1, Summary of Significant Accounting Policies.
77
SEARS HOLDINGS CORPORATION
Notes to Consolidated Financial Statements—(Continued)
The following table sets forth the components of interest and investment income as reported in our Consolidated Statements of Operations:
|
millions
|
2012
|
2011
|
2010
|
|||||||||
|
Interest income on cash and cash equivalents
|
$
|
7
|
|
$
|
4
|
|
$
|
4
|
|
|||
|
Other investment income
|
87
|
|
37
|
|
32
|
|
||||||
|
Total
|
$
|
94
|
|
$
|
41
|
|
$
|
36
|
|
|||
Interest Income on Cash and Cash Equivalents
We recorded interest income of
$7 million
in
2012
,
$4 million
in
2011
, and
$4 million
in
2010
, primarily related to interest earned on cash and cash equivalents. These cash and cash equivalents consist of highly liquid investments with original maturities of three months or less at the date of purchase. Our invested cash may include, from time to time, investments in, but not limited to, commercial paper, federal, state and municipal government securities, floating-rate notes, repurchase agreements and money market funds. All invested cash amounts are readily available to us.
Other Investment Income
Other investment income primarily includes income generated by (and sales of investments in) certain real estate joint ventures and other equity investments in which we do not have a controlling interest. Investment income from equity investments was
$47 million
,
$27 million
and
$17 million
in
2012
,
2011
and
2010
, respectively. During 2012, the investment income from equity investments included a gain of
$25 million
related to the sale of a real estate joint venture held by Sears Canada. Other investment income also included a
$30 million
,
$4 million
and
$6 million
dividend received on our cost method investment in Sears Mexico for
2012
,
2011
and
2010
, respectively.
We sponsor a number of pension and postretirement benefit plans. Expenses for retirement and savings-related benefit plans were as follows:
|
millions
|
2012
|
2011
|
2010
|
||||||||
|
Retirement/401(k) Savings Plans
|
$
|
10
|
|
$
|
11
|
|
$
|
11
|
|
||
|
Pension plans
|
630
|
|
78
|
|
119
|
|
|||||
|
Postretirement benefits
|
24
|
|
24
|
|
27
|
|
|||||
|
Total
|
$
|
664
|
|
$
|
113
|
|
$
|
157
|
|
||
Retirement Savings Plans
We sponsor Sears and Kmart 401(k) retirement savings plans for employees meeting service eligibility requirements. The Company does not match employee contributions.
Other Benefit Plans
Certain domestic full-time and part-time employees of Sears are eligible to participate in noncontributory defined benefit plans after meeting age and service requirements. Effective January 1, 2006, the Sears domestic pension plan was frozen and domestic associates no longer earn additional benefits under the plan.
Substantially all full-time Canadian employees, as well as some part-time employees, are eligible to participate in contributory defined benefit plans. Effective July 1, 2008, the Sears Canada defined pension plan was amended and a defined contribution component was added. The defined benefit service accrual ceased and all plan
78
SEARS HOLDINGS CORPORATION
Notes to Consolidated Financial Statements—(Continued)
members earn pensionable service under the defined contribution component of the Sears Canada Inc. Registered Retirement Plan.
Pension benefits are based on length of service, compensation and, in certain plans, social security or other benefits. Funding for the various plans is determined using various actuarial cost methods.
In addition to providing pension benefits, Sears provides domestic and Canadian employees and retirees certain medical benefits. These benefits provide access to medical plans, with Company subsidies for certain eligible retirees. Certain domestic Sears retirees are also provided life insurance benefits. To the extent we share the cost of the retiree medical benefits with retirees, such cost sharing is based on years of service and year of retirement. Sears' postretirement benefit plans are not funded. We have the right to modify or terminate these plans.
Pension Plans
|
|
2012
|
2011
|
||||||||||||||||||||||
|
millions
|
SHC
Domestic |
Sears
Canada |
Total
|
SHC
Domestic |
Sears
Canada |
Total
|
||||||||||||||||||
|
Change in projected benefit obligation:
|
|
|
|
|
|
|
||||||||||||||||||
|
Beginning balance
|
$
|
6,109
|
|
$
|
1,426
|
|
$
|
7,535
|
|
$
|
5,623
|
|
$
|
1,401
|
|
$
|
7,024
|
|
||||||
|
Interest cost
|
291
|
|
65
|
|
356
|
|
314
|
|
74
|
|
388
|
|
||||||||||||
|
Actuarial loss
|
639
|
|
64
|
|
703
|
|
531
|
|
70
|
|
601
|
|
||||||||||||
|
Benefits paid
|
(323
|
)
|
(122
|
)
|
(445
|
)
|
(359
|
)
|
(120
|
)
|
(479
|
)
|
||||||||||||
|
Settlements
|
(1,405
|
)
|
—
|
|
(1,405
|
)
|
—
|
|
—
|
|
—
|
|
||||||||||||
|
Foreign currency exchange impact
|
—
|
|
5
|
|
5
|
|
—
|
|
1
|
|
1
|
|
||||||||||||
|
Balance at the measurement date
|
$
|
5,311
|
|
$
|
1,438
|
|
$
|
6,749
|
|
$
|
6,109
|
|
$
|
1,426
|
|
$
|
7,535
|
|
||||||
|
|
|
|
|
|
|
|
|
|
|
|
|
|
||||||||||||
|
Change in assets at fair value:
|
|
|
|
|
|
|
|
|
|
|
|
|
||||||||||||
|
Beginning balance
|
$
|
4,051
|
|
$
|
1,227
|
|
$
|
5,278
|
|
$
|
4,054
|
|
$
|
1,288
|
|
$
|
5,342
|
|
||||||
|
Actual return on plan assets
|
382
|
|
130
|
|
512
|
|
4
|
|
51
|
|
55
|
|
||||||||||||
|
Company contributions
|
516
|
|
33
|
|
549
|
|
352
|
|
6
|
|
358
|
|
||||||||||||
|
Benefits paid
|
(323
|
)
|
(122
|
)
|
(445
|
)
|
(359
|
)
|
(120
|
)
|
(479
|
)
|
||||||||||||
|
Settlements
|
(1,405
|
)
|
—
|
|
(1,405
|
)
|
—
|
|
—
|
|
—
|
|
||||||||||||
|
Foreign currency exchange impact
|
—
|
|
4
|
|
4
|
|
—
|
|
2
|
|
2
|
|
||||||||||||
|
Balance at the measurement date
|
$
|
3,221
|
|
$
|
1,272
|
|
$
|
4,493
|
|
$
|
4,051
|
|
$
|
1,227
|
|
$
|
5,278
|
|
||||||
|
Net amount recognized
|
$
|
(2,090
|
)
|
$
|
(166
|
)
|
$
|
(2,256
|
)
|
$
|
(2,058
|
)
|
$
|
(199
|
)
|
$
|
(2,257
|
)
|
||||||
The accumulated benefit obligation for the SHC Domestic pension plan was
$5.3 billion
at
February 2, 2013
and
$6.1 billion
at
January 28, 2012
. The accumulated benefit obligation for the Sears Canada pension plan was
$1.4 billion
at both
February 2, 2013
and
January 28, 2012
.
79
SEARS HOLDINGS CORPORATION
Notes to Consolidated Financial Statements—(Continued)
Postretirement Obligations
|
|
2012
|
2011
|
||||||||||||||||||||||
|
millions
|
SHC
Domestic |
Sears
Canada |
Total
|
SHC
Domestic |
Sears
Canada |
Total
|
||||||||||||||||||
|
Change in accumulated postretirement benefit obligation:
|
||||||||||||||||||||||||
|
Beginning balance
|
$
|
253
|
|
$
|
321
|
|
$
|
574
|
|
$
|
286
|
|
$
|
303
|
|
$
|
589
|
|
||||||
|
Interest cost
|
10
|
|
14
|
|
24
|
|
13
|
|
16
|
|
29
|
|
||||||||||||
|
Plan participants' contributions
|
42
|
|
—
|
|
42
|
|
43
|
|
—
|
|
43
|
|
||||||||||||
|
Actuarial (gain) loss
|
9
|
|
16
|
|
25
|
|
(15
|
)
|
19
|
|
4
|
|
||||||||||||
|
Settlement gain
|
—
|
|
(22
|
)
|
(22
|
)
|
—
|
|
—
|
|
—
|
|
||||||||||||
|
Benefits paid
|
(67
|
)
|
(17
|
)
|
(84
|
)
|
(74
|
)
|
(17
|
)
|
(91
|
)
|
||||||||||||
|
Benefits paid - settlements
|
—
|
|
(18
|
)
|
(18
|
)
|
—
|
|
—
|
|
—
|
|
||||||||||||
|
Foreign currency exchange rate impact and other
|
—
|
|
1
|
|
1
|
|
—
|
|
—
|
|
—
|
|
||||||||||||
|
Balance at the measurement date
|
$
|
247
|
|
$
|
295
|
|
$
|
542
|
|
$
|
253
|
|
$
|
321
|
|
$
|
574
|
|
||||||
|
|
||||||||||||||||||||||||
|
Change in plan assets at fair value:
|
||||||||||||||||||||||||
|
Beginning of year balance
|
$
|
—
|
|
$
|
69
|
|
$
|
69
|
|
$
|
—
|
|
$
|
90
|
|
$
|
90
|
|
||||||
|
Actual return on plan assets
|
—
|
|
—
|
|
—
|
|
—
|
|
3
|
|
3
|
|
||||||||||||
|
Company contributions
|
25
|
|
19
|
|
44
|
|
31
|
|
1
|
|
32
|
|
||||||||||||
|
Plan participants' contributions
|
42
|
|
—
|
|
42
|
|
43
|
|
—
|
|
43
|
|
||||||||||||
|
Benefits paid
|
(67
|
)
|
(17
|
)
|
(84
|
)
|
(74
|
)
|
(17
|
)
|
(91
|
)
|
||||||||||||
|
Benefits paid - settlements
|
—
|
|
(18
|
)
|
(18
|
)
|
—
|
|
—
|
|
—
|
|
||||||||||||
|
Foreign currency exchange rate impact and other
|
—
|
|
(8
|
)
|
(8
|
)
|
—
|
|
(8
|
)
|
(8
|
)
|
||||||||||||
|
Balance at the measurement date
|
$
|
—
|
|
$
|
45
|
|
$
|
45
|
|
$
|
—
|
|
$
|
69
|
|
$
|
69
|
|
||||||
|
Funded status
|
$
|
(247
|
)
|
$
|
(250
|
)
|
$
|
(497
|
)
|
$
|
(253
|
)
|
$
|
(252
|
)
|
$
|
(505
|
)
|
||||||
The current portion of our liability for postretirement obligations is
$27 million
, which we expect to pay during fiscal 2013.
Weighted-average assumptions used to determine plan obligations were as follows:
|
2012
|
2011
|
2010
|
||||||||||
|
SHC
Domestic |
Sears
Canada |
SHC
Domestic |
Sears
Canada |
SHC
Domestic |
Sears
Canada |
|||||||
|
Pension benefits:
|
||||||||||||
|
Discount Rate
|
4.25%
|
4.20%
|
4.90%
|
4.70%
|
5.75%
|
5.40%
|
||||||
|
Rate of compensation increases
|
N/A
|
3.50%
|
N/A
|
3.50%
|
N/A
|
3.50%
|
||||||
|
Postretirement benefits:
|
||||||||||||
|
Discount Rate
|
3.55%
|
4.20%
|
4.20%
|
4.60%
|
5.00%
|
5.40%
|
||||||
|
Rate of compensation increases
|
N/A
|
3.50%
|
N/A
|
3.50%
|
N/A
|
3.50%
|
||||||
80
SEARS HOLDINGS CORPORATION
Notes to Consolidated Financial Statements—(Continued)
Net Periodic Benefit Cost
The components of net periodic benefit cost were as follows:
|
|
2012
|
2011
|
2010
|
|||||||||||||||||||||||||||||||||
|
millions
|
SHC
Domestic |
Sears
Canada |
Total
|
SHC
Domestic |
Sears
Canada |
Total
|
SHC
Domestic |
Sears
Canada |
Total
|
|||||||||||||||||||||||||||
|
Pension benefits:
|
||||||||||||||||||||||||||||||||||||
|
Interest cost
|
$
|
291
|
|
$
|
65
|
|
$
|
356
|
|
$
|
314
|
|
$
|
74
|
|
$
|
388
|
|
$
|
320
|
|
$
|
76
|
|
$
|
396
|
|
|||||||||
|
Expected return on plan assets
|
(291
|
)
|
(76
|
)
|
(367
|
)
|
(302
|
)
|
(80
|
)
|
(382
|
)
|
(287
|
)
|
(77
|
)
|
(364
|
)
|
||||||||||||||||||
|
Cost of settlements
|
452
|
|
—
|
|
452
|
|
—
|
|
—
|
|
—
|
|
—
|
|
—
|
|
—
|
|
||||||||||||||||||
|
Recognized net loss
|
165
|
|
24
|
|
189
|
|
63
|
|
9
|
|
72
|
|
87
|
|
—
|
|
87
|
|
||||||||||||||||||
|
Net periodic benefit cost (benefit)
|
$
|
617
|
|
$
|
13
|
|
$
|
630
|
|
$
|
75
|
|
$
|
3
|
|
$
|
78
|
|
$
|
120
|
|
$
|
(1
|
)
|
$
|
119
|
|
|||||||||
|
|
||||||||||||||||||||||||||||||||||||
|
Postretirement benefits:
|
||||||||||||||||||||||||||||||||||||
|
Benefits earned during the period
|
$
|
—
|
|
$
|
—
|
|
$
|
—
|
|
$
|
—
|
|
$
|
—
|
|
$
|
—
|
|
$
|
—
|
|
$
|
1
|
|
$
|
1
|
|
|||||||||
|
Interest cost
|
10
|
|
14
|
|
24
|
|
13
|
|
16
|
|
29
|
|
16
|
|
16
|
|
32
|
|
||||||||||||||||||
|
Expected return on assets
|
—
|
|
(3
|
)
|
(3
|
)
|
—
|
|
(5
|
)
|
(5
|
)
|
—
|
|
(6
|
)
|
(6
|
)
|
||||||||||||||||||
|
Cost of settlements
|
—
|
|
3
|
|
3
|
|
—
|
|
—
|
|
—
|
|
—
|
|
—
|
|
—
|
|
||||||||||||||||||
|
Net periodic benefit cost
|
$
|
10
|
|
$
|
14
|
|
$
|
24
|
|
$
|
13
|
|
$
|
11
|
|
$
|
24
|
|
$
|
16
|
|
$
|
11
|
|
$
|
27
|
|
|||||||||
Weighted-average assumptions used to determine net cost were as follows:
|
2012
|
2011
|
2010
|
||||||||||
|
SHC
Domestic |
Sears
Canada |
SHC
Domestic |
Sears
Canada |
SHC
Domestic |
Sears
Canada |
|||||||
|
Pension benefits:
|
||||||||||||
|
Discount Rate
|
4.90%
|
4.70%
|
5.75%
|
5.40%
|
6.00%
|
6.00%
|
||||||
|
Return of plan assets
|
7.25%
|
6.50%
|
7.50%
|
6.50%
|
8.00%
|
6.50%
|
||||||
|
Rate of compensation increases
|
N/A
|
3.50%
|
N/A
|
3.50%
|
N/A
|
3.50%
|
||||||
|
Postretirement benefits:
|
||||||||||||
|
Discount Rate
|
4.20%
|
4.60%
|
5.00%
|
5.40%
|
6.00%
|
6.00%
|
||||||
|
Return of plan assets
|
N/A
|
3.75%
|
N/A
|
6.50%
|
N/A
|
6.50%
|
||||||
|
Rate of compensation increases
|
N/A
|
3.50%
|
N/A
|
3.50%
|
N/A
|
3.50%
|
||||||
For purposes of determining the periodic expense of our defined benefit plans, we use the fair value of plan assets as the market related value. A one-percentage-point change in the assumed discount rate would have the following effects on the pension liability:
|
millions
|
1 percentage-point
Increase |
1 percentage-point
Decrease |
||||||
|
Effect on interest cost component
|
$
|
30
|
|
$
|
(39
|
)
|
||
|
Effect on pension benefit obligation
|
$
|
(674
|
)
|
$
|
814
|
|
||
81
SEARS HOLDINGS CORPORATION
Notes to Consolidated Financial Statements—(Continued)
For 2013 and beyond, the domestic weighted-average health care cost trend rates used in measuring the postretirement benefit expense are an
8.5%
trend rate in 2013 to an ultimate trend rate of
6.5%
in 2017. A one-percentage-point change in the assumed health care cost trend rate would have the following effects on the postretirement liability:
|
millions
|
1 percentage-point
Increase |
1 percentage-point
Decrease |
||||||
|
Effect on total service and interest cost components
|
$
|
1
|
|
$
|
(1
|
)
|
||
|
Effect on postretirement benefit obligation
|
$
|
31
|
|
$
|
(27
|
)
|
||
$195 million
of the unrecognized net losses in accumulated other comprehensive income are expected to be amortized as a component of net periodic benefit cost during 2013.
Investment Strategy
The Investment Committee, made up of select members of senior management, has appointed a non-affiliated third party professional to advise the Committee with respect to the SHC domestic pension plan assets. The plan's overall investment objective is to provide a long-term return that, along with Company contributions, is expected to meet future benefit payment requirements. A long-term horizon has been adopted in establishing investment policy such that the likelihood and duration of investment losses are carefully weighed against the long-term potential for appreciation of assets. The plan's investment policy requires investments to be diversified across individual securities, industries, market capitalization and valuation characteristics. In addition, various techniques are utilized to monitor, measure and manage risk.
Domestic plan assets were invested in the following classes of securities:
|
|
Plan Assets at
|
|||||
|
|
February 2,
2013 |
January 28,
2012 |
||||
|
Equity securities
|
31
|
%
|
32
|
%
|
||
|
Fixed income and other debt securities
|
64
|
|
67
|
|
||
|
Other
|
5
|
|
1
|
|
||
|
Total
|
100
|
%
|
100
|
%
|
||
The domestic plan's target allocation is determined by taking into consideration the amounts and timing of projected liabilities, our funding policies and expected returns on various asset classes. At
February 2, 2013
, the plan's target asset allocation was
35%
equity and
65%
fixed income. To develop the expected long-term rate of return on assets assumption, we considered the historical returns and the future expectations for returns for each asset class, as well as the target asset allocation of the pension portfolio.
Sears Canada plan assets were invested in the following classes of securities (none of which were securities of the Company):
|
|
Plan Assets at
|
|||||
|
|
February 2,
2013 |
January 28,
2012 |
||||
|
Equity securities
|
26
|
%
|
27
|
%
|
||
|
Fixed income and other debt securities
|
74
|
|
72
|
|
||
|
Alternative investment securities
|
—
|
|
1
|
|
||
|
Total
|
100
|
%
|
100
|
%
|
||
The Sears Canada plans' target allocation is determined by taking into consideration the amounts and timing of projected liabilities, our funding policies and expected returns on various asset classes. At
February 2, 2013
, the
82
SEARS HOLDINGS CORPORATION
Notes to Consolidated Financial Statements—(Continued)
plan's target asset allocation was
55%
to
75%
fixed income and
25%
to
45%
equity. To develop the expected long-term rate of return on assets assumption, we considered the historical returns and the future expectations for returns for each asset class, as well as the target asset allocation of the pension portfolio.
Future Cash Flows of Benefit Plans
Information regarding expected future cash flows for our benefit plans is as follows:
|
millions
|
SHC
Domestic |
Sears
Canada |
Total
|
|||||||||
|
Pension benefits:
|
|
|
|
|||||||||
|
Employer contributions:
|
|
|
|
|||||||||
|
2013 (expected)
|
$
|
352
|
|
$
|
29
|
|
$
|
381
|
|
|||
|
Expected benefit payments:
|
|
|
|
|
|
|
||||||
|
2013
|
$
|
335
|
|
$
|
93
|
|
$
|
428
|
|
|||
|
2014
|
337
|
|
93
|
|
430
|
|
||||||
|
2015
|
340
|
|
92
|
|
432
|
|
||||||
|
2016
|
342
|
|
92
|
|
434
|
|
||||||
|
2017
|
344
|
|
91
|
|
435
|
|
||||||
|
2018-2022
|
1,725
|
|
450
|
|
2,175
|
|
||||||
|
Postretirement benefits:
|
|
|
|
|
|
|
||||||
|
Employer contributions:
|
|
|
|
|
|
|
||||||
|
2013 (expected)
|
$
|
28
|
|
$
|
1
|
|
$
|
29
|
|
|||
|
Expected employer contribution for benefit payments:
|
|
|
|
|
|
|
||||||
|
2013
|
$
|
28
|
|
$
|
17
|
|
$
|
45
|
|
|||
|
2014
|
26
|
|
17
|
|
43
|
|
||||||
|
2015
|
25
|
|
17
|
|
42
|
|
||||||
|
2016
|
24
|
|
18
|
|
42
|
|
||||||
|
2017
|
22
|
|
18
|
|
40
|
|
||||||
|
2018-2022
|
90
|
|
88
|
|
178
|
|
||||||
Domestic Pension Plan Funding
Contributions to our pension plans remain a significant use of our cash on an annual basis. While the Company's pension plan is frozen, and thus associates do not currently earn pension benefits, the Company has a legacy pension obligation for past service performed by Kmart and Sears associates. During
2012
, we contributed
$516 million
to our domestic pension plans. We estimate that the domestic pension contribution will be
$352 million
in
2013
and approximately
$510 million
in
2014
, though the ultimate amount of pension contributions could be affected by changes in the applicable regulations as well as financial market and investment performance.
As previously reported, on July 6, 2012, federal legislation signed into law allows pension plan sponsors to use higher interest rate assumptions in valuing plan liabilities and determining funding obligations. As a result of this legislation, the Company's domestic pension plan was within
$203 million
of being
80%
funded under applicable law. In order to reduce the risks of gross pension obligations, the Company elected to contribute an additional
$203 million
to its domestic pension plan on September 14, 2012, after which its domestic pension plan was
80%
funded under applicable law.
Effective September 17, 2012, the Company amended its domestic pension plan, primarily related to lump sum benefit eligibility, and began notifying certain former employees of the Company of its offer to pay those employees' pension benefit in a lump sum. These amendments did not have a significant impact on our plan. Former employees eligible for the voluntary lump sum payment option are generally those who are vested traditional formula
83
SEARS HOLDINGS CORPORATION
Notes to Consolidated Financial Statements—(Continued)
participants of the Plan who terminated employment prior to January 1, 2012 and who have not yet started receiving monthly payments of their pension benefits.
The Company offered the one-time voluntary lump sum window in an effort to reduce its long-term pension obligations and ongoing annual pension expense. This voluntary offer was made to approximately
86,000
eligible terminated vested participants, representing approximately
$2.0 billion
of the Company's total qualified pension plan liabilities. Eligible participants had until November 19, 2012 to make their election. The Company made payments of approximately
$1.5 billion
to employees who made the election in December 2012 and funded the payments from existing pension plan assets. In connection with this transaction, the Company incurred a non-cash charge to operations of approximately
$452 million
pre-tax in the fourth quarter of 2012 as a result of the requirement to expense the unrealized actuarial losses. The charge had no effect on equity because the unrealized actuarial losses are already recognized in accumulated other comprehensive income/(loss). Accordingly, the effect on retained earnings was offset by a corresponding reduction in accumulated other comprehensive loss.
Fair Value of Pension and Postretirement Benefit Plan Assets
The following table presents our plan assets using the fair value hierarchy at
February 2, 2013
and
January 28, 2012
:
|
Investment Assets at Fair Value at
|
||||||||||||||||
|
SHC Domestic
|
February 2, 2013
|
|||||||||||||||
|
millions
|
Total
|
Level 1
|
Level 2
|
Level 3
|
||||||||||||
|
Cash equivalents and short-term investments
|
$
|
187
|
|
$
|
—
|
|
$
|
187
|
|
$
|
—
|
|
||||
|
Equity securities:
|
|
|
|
|
|
|
|
|
||||||||
|
U.S. companies
|
848
|
|
848
|
|
—
|
|
—
|
|
||||||||
|
International companies
|
138
|
|
138
|
|
—
|
|
—
|
|
||||||||
|
Registered investment companies
|
1
|
|
1
|
|
—
|
|
—
|
|
||||||||
|
Fixed income securities:
|
||||||||||||||||
|
Corporate bonds and notes
|
1,840
|
|
—
|
|
1,840
|
|
—
|
|
||||||||
|
Sears Holdings Corporation senior secured notes
|
176
|
|
—
|
|
176
|
|
—
|
|
||||||||
|
U.S. government and agencies
|
1
|
|
—
|
|
1
|
|
—
|
|
||||||||
|
Mortgage-backed and asset-backed
|
6
|
|
—
|
|
6
|
|
—
|
|
||||||||
|
Ventures and partnerships
|
12
|
|
—
|
|
—
|
|
12
|
|
||||||||
|
Total investment assets at fair value
|
$
|
3,209
|
|
$
|
987
|
|
$
|
2,210
|
|
$
|
12
|
|
||||
|
Accounts receivable
|
44
|
|
|
|
|
|||||||||||
|
Accounts payable
|
(32
|
)
|
|
|
|
|||||||||||
|
Net assets available for plan benefits
|
$
|
3,221
|
|
|
|
|
|
|
||||||||
84
SEARS HOLDINGS CORPORATION
Notes to Consolidated Financial Statements—(Continued)
|
Investment Assets at Fair Value at
|
||||||||||||||||
|
SHC Domestic
|
January 28, 2012
|
|||||||||||||||
|
millions
|
Total
|
Level 1
|
Level 2
|
Level 3
|
||||||||||||
|
Cash equivalents and short-term investments
|
$
|
216
|
|
$
|
—
|
|
$
|
216
|
|
$
|
—
|
|
||||
|
Equity securities:
|
|
|
|
|
|
|
|
|
||||||||
|
U.S. companies
|
1,102
|
|
1,102
|
|
—
|
|
—
|
|
||||||||
|
International companies
|
120
|
|
120
|
|
—
|
|
—
|
|
||||||||
|
Registered investment companies
|
1
|
|
1
|
|
—
|
|
—
|
|
||||||||
|
Fixed income securities:
|
||||||||||||||||
|
Corporate bonds and notes
|
2,186
|
|
—
|
|
2,184
|
|
2
|
|
||||||||
|
Sears Holdings Corporation senior secured notes
|
203
|
|
—
|
|
203
|
|
—
|
|
||||||||
|
U.S. government and agencies
|
39
|
|
—
|
|
39
|
|
—
|
|
||||||||
|
Mortgage-backed and asset-backed
|
9
|
|
—
|
|
9
|
|
—
|
|
||||||||
|
Municipal and foreign government
|
20
|
|
—
|
|
20
|
|
—
|
|
||||||||
|
Ventures and partnerships
|
15
|
|
—
|
|
—
|
|
15
|
|
||||||||
|
Total investment assets at fair value
|
$
|
3,911
|
|
$
|
1,223
|
|
$
|
2,671
|
|
$
|
17
|
|
||||
|
Cash
|
111
|
|
|
|
|
|||||||||||
|
Accounts receivable
|
54
|
|
|
|
|
|||||||||||
|
Accounts payable
|
(25
|
)
|
|
|
|
|||||||||||
|
Net assets available for plan benefits
|
$
|
4,051
|
|
|
|
|
|
|
||||||||
|
Investment Assets at Fair Value at
|
||||||||||||||||
|
Sears Canada
|
February 2, 2013
|
|||||||||||||||
|
millions
|
Total
|
Level 1
|
Level 2
|
Level 3
|
||||||||||||
|
Cash equivalents and short-term investments
|
$
|
67
|
|
$
|
—
|
|
$
|
67
|
|
$
|
—
|
|
||||
|
Equity securities:
|
|
|
|
|
|
|
|
|
||||||||
|
U.S. companies
|
177
|
|
177
|
|
—
|
|
—
|
|
||||||||
|
International companies
|
5
|
|
5
|
|
—
|
|
—
|
|
||||||||
|
Common collective trusts
|
277
|
|
—
|
|
277
|
|
—
|
|
||||||||
|
Fixed income securities:
|
||||||||||||||||
|
Corporate bonds and notes
|
613
|
|
—
|
|
612
|
|
1
|
|
||||||||
|
U.S. government and agencies
|
1
|
|
—
|
|
1
|
|
—
|
|
||||||||
|
Mortgage-backed and asset-backed
|
66
|
|
—
|
|
7
|
|
59
|
|
||||||||
|
Municipal and foreign government
|
34
|
|
—
|
|
34
|
|
—
|
|
||||||||
|
Hedge and pooled equity funds
|
3
|
|
—
|
|
—
|
|
3
|
|
||||||||
|
Total investment assets at fair value
|
$
|
1,243
|
|
$
|
182
|
|
$
|
998
|
|
$
|
63
|
|
||||
|
Cash
|
42
|
|
|
|
|
|||||||||||
|
Refundable deposits
|
25
|
|
||||||||||||||
|
Accounts receivable
|
567
|
|
|
|
|
|||||||||||
|
Accounts payable
|
(560
|
)
|
|
|
|
|||||||||||
|
Net assets available for plan benefits
|
$
|
1,317
|
|
|
|
|
|
|
||||||||
85
SEARS HOLDINGS CORPORATION
Notes to Consolidated Financial Statements—(Continued)
|
Investment Assets at Fair Value at
|
||||||||||||||||
|
Sears Canada
|
January 28, 2012
|
|||||||||||||||
|
millions
|
Total
|
Level 1
|
Level 2
|
Level 3
|
||||||||||||
|
Cash equivalents and short-term investments
|
$
|
7
|
|
$
|
—
|
|
$
|
7
|
|
$
|
—
|
|
||||
|
Equity securities:
|
|
|
|
|
|
|
|
|
||||||||
|
U.S. companies
|
190
|
|
189
|
|
1
|
|
—
|
|
||||||||
|
International companies
|
30
|
|
30
|
|
—
|
|
—
|
|
||||||||
|
Common collective trusts
|
306
|
|
—
|
|
306
|
|
—
|
|
||||||||
|
Fixed income securities:
|
||||||||||||||||
|
Corporate bonds and notes
|
560
|
|
—
|
|
560
|
|
—
|
|
||||||||
|
U.S. government and agencies
|
2
|
|
—
|
|
2
|
|
—
|
|
||||||||
|
Mortgage-backed and asset-backed
|
73
|
|
—
|
|
9
|
|
64
|
|
||||||||
|
Municipal and foreign government
|
57
|
|
—
|
|
57
|
|
—
|
|
||||||||
|
Hedge and pooled equity funds
|
16
|
|
—
|
|
—
|
|
16
|
|
||||||||
|
Total investment assets at fair value
|
$
|
1,241
|
|
$
|
219
|
|
$
|
942
|
|
$
|
80
|
|
||||
|
Cash
|
26
|
|
|
|
|
|||||||||||
|
Refundable deposits
|
25
|
|
||||||||||||||
|
Accounts receivable
|
484
|
|
|
|
|
|||||||||||
|
Accounts payable
|
(480
|
)
|
|
|
|
|||||||||||
|
Net assets available for plan benefits
|
$
|
1,296
|
|
|
|
|
|
|
||||||||
Equity securities, which include common and preferred stocks and registered investment companies (mutual funds), are actively traded and valued at the closing price reported in the active market in which the security is traded and are assigned to Level 1.
Common collective trusts are portfolios of underlying investments held by investment managers and are valued at the unit value reported by the investment managers as of the end of each period presented. Collective short-term investment funds are stated at net asset value (NAV) as determined by the investment managers. Investment managers value the underlying investments of the funds at amortized cost, which approximates fair value, and have assigned a Level 2 to the valuation of those investments. Fixed income securities are assigned to Level 2 as they are primarily valued by institutional bid evaluation, which determines the estimated price a dealer would pay for a security and which is developed using proprietary models established by the pricing vendors for this purpose.
Certain corporate and mortgage-backed debt securities are assigned to Level 3 based on the relatively low position in the preferred hierarchy of the pricing source. Valuation of the Plan's non-public limited partnerships requires significant judgment by the general partners due to the absence of quoted market value, inherent lack of liquidity, and the long-term nature of the assets, and may result in fair value measurements that are not indicative of ultimate realizable value. Hedge funds consist of fund-of-funds investments and direct hedge funds and are assigned to Level 3. The fund-of-funds investments are primarily valued using a market approach based on the NAVs calculated by the fund and are not publicly available. Direct hedge funds are primarily valued by each fund's third party administrator based on the valuation of the underlying type of security held and are not publicly available. All hedge fund investments are in the process of being redeemed.
86
SEARS HOLDINGS CORPORATION
Notes to Consolidated Financial Statements—(Continued)
A rollforward of our Level 3 assets each year is as follows:
|
SHC Domestic
|
January 28,
2012 Balance |
Net Realized and
Unrealized Gains/(Losses) |
Purchases
|
Sales and
Settlements |
Net Transfers
Into/(Out of) Level 3 |
February 2, 2013 Balance
|
||||||||||||||||||
|
millions
|
||||||||||||||||||||||||
|
Fixed income securities:
|
|
|
|
|
|
|
||||||||||||||||||
|
Corporate bonds and notes
|
$
|
2
|
|
$
|
(2
|
)
|
$
|
—
|
|
$
|
—
|
|
$
|
—
|
|
$
|
—
|
|
||||||
|
Mortgage-backed and asset-backed
|
—
|
|
—
|
|
—
|
|
—
|
|
—
|
|
—
|
|
||||||||||||
|
Venture and partnerships
|
15
|
|
1
|
|
—
|
|
(4
|
)
|
—
|
|
12
|
|
||||||||||||
|
Total Level 3 investments
|
$
|
17
|
|
$
|
(1
|
)
|
$
|
—
|
|
$
|
(4
|
)
|
$
|
—
|
|
$
|
12
|
|
||||||
|
SHC Domestic
|
January 29,
2011 Balance |
Net Realized and
Unrealized Losses |
Purchases
|
Sales and
Settlements |
Net Transfers
Into/(Out of) Level 3 |
January 28,
2012 Balance |
||||||||||||||||||
|
millions
|
||||||||||||||||||||||||
|
Fixed income securities:
|
|
|
|
|
|
|
||||||||||||||||||
|
Corporate bonds and notes
|
$
|
—
|
|
$
|
—
|
|
$
|
2
|
|
$
|
—
|
|
$
|
—
|
|
$
|
2
|
|
||||||
|
Mortgage-backed and asset-backed
|
1
|
|
—
|
|
—
|
|
(1
|
)
|
—
|
|
—
|
|
||||||||||||
|
Venture and partnerships
|
20
|
|
(3
|
)
|
—
|
|
(2
|
)
|
—
|
|
15
|
|
||||||||||||
|
Total Level 3 investments
|
$
|
21
|
|
$
|
(3
|
)
|
$
|
2
|
|
$
|
(3
|
)
|
$
|
—
|
|
$
|
17
|
|
||||||
|
Sears Canada
|
January 28,
2012 Balance |
Net Realized and
Unrealized Gains |
Purchases
|
Sales and
Settlements |
Net Transfers
Into/(Out of) Level 3 |
February 2, 2013 Balance
|
||||||||||||||||||
|
millions
|
||||||||||||||||||||||||
|
Fixed income securities:
|
|
|
|
|
|
|
||||||||||||||||||
|
Corporate bonds and notes
|
$
|
—
|
|
$
|
—
|
|
$
|
1
|
|
$
|
—
|
|
$
|
—
|
|
$
|
1
|
|
||||||
|
Mortgage-backed and asset-backed
|
64
|
|
5
|
|
—
|
|
(10
|
)
|
—
|
|
59
|
|
||||||||||||
|
Hedge and pooled equity funds
|
16
|
|
—
|
|
—
|
|
(13
|
)
|
—
|
|
3
|
|
||||||||||||
|
Total Level 3 investments
|
$
|
80
|
|
$
|
5
|
|
$
|
1
|
|
$
|
(23
|
)
|
$
|
—
|
|
$
|
63
|
|
||||||
87
SEARS HOLDINGS CORPORATION
Notes to Consolidated Financial Statements—(Continued)
|
Sears Canada
|
January 29,
2011 Balance |
Net Realized and
Unrealized Gains/(Losses) |
Purchases
|
Sales and
Settlements |
Net Transfers
Into/(Out of) Level 3 |
January 28,
2012 Balance |
||||||||||||||||||
|
millions
|
||||||||||||||||||||||||
|
Fixed income securities:
|
|
|
|
|
|
|
||||||||||||||||||
|
Corporate bonds and notes
|
$
|
2
|
|
$
|
—
|
|
$
|
—
|
|
$
|
—
|
|
$
|
(2
|
)
|
$
|
—
|
|
||||||
|
Mortgage backed-and asset-backed
|
69
|
|
5
|
|
—
|
|
(10
|
)
|
—
|
|
64
|
|
||||||||||||
|
Hedge and pooled equity funds
|
113
|
|
(3
|
)
|
—
|
|
(94
|
)
|
—
|
|
16
|
|
||||||||||||
|
Total Level 3 investments
|
$
|
184
|
|
$
|
2
|
|
$
|
—
|
|
$
|
(104
|
)
|
$
|
(2
|
)
|
$
|
80
|
|
||||||
The following tables set forth the components used to calculate basic and diluted earnings (loss) per share from continuing operations attributable to Holdings' shareholders. Restricted stock awards for
2012
and
2011
were not included in the computation of diluted loss per share from continuing operations attributable to Holdings' shareholders because the effect of their inclusion would have been antidilutive.
|
millions, except earnings per share
|
2012
|
2011
|
2010
|
|||||||||
|
Basic weighted average shares
|
105.9
|
|
106.8
|
|
111.5
|
|
||||||
|
Dilutive effect of restricted stock and stock options
|
—
|
|
—
|
|
0.2
|
|
||||||
|
Diluted weighted average shares
|
105.9
|
|
106.8
|
|
111.7
|
|
||||||
|
Net income (loss) from continuing operations attributable to Holdings' shareholders
|
$
|
(930
|
)
|
$
|
(3,113
|
)
|
$
|
122
|
|
|||
|
Earnings (loss) per share from continuing operations attributable to Holdings' shareholders:
|
|
|
|
|
|
|
||||||
|
Basic
|
$
|
(8.78
|
)
|
$
|
(29.15
|
)
|
$
|
1.09
|
|
|||
|
Diluted
|
$
|
(8.78
|
)
|
$
|
(29.15
|
)
|
$
|
1.09
|
|
|||
Stock-based Compensation
We account for stock-based compensation using the fair value method in accordance with accounting standards regarding share-based payment transactions. We recorded
$15 million
,
$14 million
and
$9 million
in total compensation expense relative to stock-based compensation arrangements during
2012
,
2011
, and
2010
, respectively. At
February 2, 2013
, we had
$10 million
in total compensation cost related to nonvested awards, which is expected to be recognized over approximately the next
three
years.
We do not currently have an employee stock option plan and at
February 2, 2013
, there are
no
outstanding options.
88
SEARS HOLDINGS CORPORATION
Notes to Consolidated Financial Statements—(Continued)
We granted restricted stock awards to certain associates. These restricted stock awards typically vest in one to three years from the date of grant, provided the grantee remains employed by us at the vesting date. The fair value of these awards is equal to the market price of our common stock on the date of grant. We do not currently have a broad-based program that provides for restricted stock awards on an annual basis. Changes in restricted stock awards for
2012
,
2011
, and
2010
were as follows:
|
|
2012
|
2011
|
2010
|
||||||||||||||||||
|
(Shares in thousands)
|
Shares
|
Weighted-
Average Fair Value on Date of Grant |
Shares
|
Weighted-
Average Fair Value on Date of Grant |
Shares
|
Weighted-
Average Fair Value on Date of Grant |
|||||||||||||||
|
Beginning of year balance
|
496
|
|
$
|
65.02
|
|
313
|
|
$
|
74.09
|
|
279
|
|
$
|
80.73
|
|
||||||
|
Granted
|
175
|
|
49.20
|
|
386
|
|
59.60
|
|
176
|
|
83.09
|
|
|||||||||
|
Vested
|
(172
|
)
|
60.89
|
|
(72
|
)
|
81.55
|
|
(110
|
)
|
103.19
|
|
|||||||||
|
Forfeited
|
(75
|
)
|
78.59
|
|
(131
|
)
|
61.62
|
|
(32
|
)
|
81.38
|
|
|||||||||
|
End of year balance
|
424
|
|
$
|
57.72
|
|
496
|
|
$
|
65.02
|
|
313
|
|
$
|
74.09
|
|
||||||
|
millions
|
2012
|
2011
|
2010
|
|||||||||
|
Aggregate fair value of shares granted based on weighted average fair value at date of grant
|
$
|
9
|
|
$
|
23
|
|
$
|
15
|
|
|||
|
Aggregate fair value of shares vesting during period
|
10
|
|
5
|
|
10
|
|
||||||
|
Aggregate fair value of shares forfeited during period
|
4
|
|
8
|
|
2
|
|
||||||
A
pproximately
205,000
shares of the
424,000
shares of unvested restricted stock outstanding at
February 2, 2013
are scheduled to vest during
2013
, subject to satisfaction of applicable vesting conditions.
Common Share Repurchase Program
From time to time, we repurchase shares of our common stock under a common share repurchase program authorized by our Board of Directors. The common share repurchase program was initially announced in 2005 with a total authorization since inception of the program of
$6.5 billion
. During
2012
, we repurchased
no
shares of our common stock under our common share repurchase program. During
2011
, we repurchased approximately
2.8 million
of our common shares at a total cost of approximately
$183 million
, or an average price
$65.66
per share. During
2010
, we repurchased approximately
5.5 million
of our common shares at a total cost of approximately
$394 million
, or an average price of
$71.76
per share. At
February 2, 2013
, we had approximately
$504 million
of remaining authorization under our common share repurchase program.
The share repurchase program has no stated expiration date and share repurchases may be implemented using a variety of methods, which may include open market purchases, privately negotiated transactions, block trades, accelerated share repurchase transactions, the purchase of call options, the sale of put options or otherwise, or by any combination of such methods.
89
SEARS HOLDINGS CORPORATION
Notes to Consolidated Financial Statements—(Continued)
Accumulated Other Comprehensive Loss
The following table displays the components of accumulated other comprehensive loss:
|
millions
|
February 2,
2013 |
January 28,
2012 |
January 29,
2011 |
||||||||
|
Pension and postretirement adjustments (net of tax of $(443), $(492) and $(480), respectively)
|
$
|
(1,408
|
)
|
$
|
(1,575
|
)
|
$
|
(783
|
)
|
||
|
Cumulative unrealized derivative gain (loss) (net of tax of $0, $0 and $0, respectively)
|
—
|
|
(5
|
)
|
1
|
|
|||||
|
Currency translation adjustments (net of tax of $(39), $(26) and $(7), respectively)
|
(51
|
)
|
(29
|
)
|
3
|
|
|||||
|
Accumulated other comprehensive loss
|
$
|
(1,459
|
)
|
$
|
(1,609
|
)
|
$
|
(779
|
)
|
||
Pension and postretirement adjustments relate to the net actuarial loss on our pension and postretirement plans recognized as a component of accumulated other comprehensive loss.
Accumulated other comprehensive loss attributable to noncontrolling interests at
February 2, 2013
,
January 28, 2012
, and
January 29, 2011
was
$(64) million
,
$(9) million
and
$(4) million
, respectively.
Income Tax Expense Allocated to Each Component of Other Comprehensive Income (Loss)
Income tax expense allocated to each component of other comprehensive income (loss) was as follows:
|
|
2012
|
||||||||||
|
millions
|
Before
Tax Amount |
Tax
Expense |
Net of
Tax Amount |
||||||||
|
Other comprehensive income
|
|||||||||||
|
Pension and postretirement adjustments
|
|||||||||||
|
Experience gain (loss)
|
$
|
(564
|
)
|
$
|
1
|
|
$
|
(563
|
)
|
||
|
Less: cost of settlements
|
454
|
|
—
|
|
454
|
|
|||||
|
Less: amortization of prior service cost included in net period pension cost
|
189
|
|
(6
|
)
|
183
|
|
|||||
|
Pension and postretirement adjustments, net of tax
|
79
|
|
(5
|
)
|
74
|
|
|||||
|
Deferred gain on derivatives
|
5
|
|
—
|
|
5
|
|
|||||
|
Currency translation adjustments
|
(8
|
)
|
13
|
|
5
|
|
|||||
|
Total other comprehensive income
|
$
|
76
|
|
$
|
8
|
|
$
|
84
|
|
||
90
SEARS HOLDINGS CORPORATION
Notes to Consolidated Financial Statements—(Continued)
|
|
2011
|
||||||||||
|
millions
|
Before
Tax Amount |
Tax
Benefit |
Net of
Tax Amount |
||||||||
|
Other comprehensive income (loss)
|
|||||||||||
|
Pension and postretirement adjustments
|
|||||||||||
|
Experience gain (loss)
|
$
|
(872
|
)
|
$
|
14
|
|
$
|
(858
|
)
|
||
|
Less: amortization of prior service cost included in net period pension cost
|
72
|
|
(3
|
)
|
69
|
|
|||||
|
Pension and postretirement adjustments, net of tax
|
(800
|
)
|
11
|
|
(789
|
)
|
|||||
|
Deferred loss on derivatives
|
(6
|
)
|
—
|
|
(6
|
)
|
|||||
|
Currency translation adjustments
|
(57
|
)
|
19
|
|
(38
|
)
|
|||||
|
Total other comprehensive income (loss)
|
$
|
(863
|
)
|
$
|
30
|
|
$
|
(833
|
)
|
||
|
|
2010
|
||||||||||
|
millions
|
Before
Tax Amount |
Tax
(Expense) or Benefit |
Net of
Tax Amount |
||||||||
|
Other comprehensive income
|
|||||||||||
|
Pension and postretirement adjustments
|
|||||||||||
|
Experience gain (loss)
|
$
|
(116
|
)
|
$
|
51
|
|
$
|
(65
|
)
|
||
|
Less: amortization of prior service cost included in net period pension cost
|
87
|
|
(34
|
)
|
53
|
|
|||||
|
Pension and postretirement adjustments, net of tax
|
(29
|
)
|
17
|
|
(12
|
)
|
|||||
|
Deferred gain (loss) on derivatives
|
(15
|
)
|
6
|
|
(9
|
)
|
|||||
|
Currency translation adjustments
|
115
|
|
(22
|
)
|
93
|
|
|||||
|
Total other comprehensive income
|
$
|
71
|
|
$
|
1
|
|
$
|
72
|
|
||
91
SEARS HOLDINGS CORPORATION
Notes to Consolidated Financial Statements—(Continued)
|
millions
|
2012
|
2011
|
2010
|
|||||||||
|
Income (loss) before income taxes:
|
|
|
|
|||||||||
|
U.S.
|
$
|
(1,226
|
)
|
$
|
(1,809
|
)
|
$
|
(157
|
)
|
|||
|
Foreign
|
216
|
|
58
|
|
323
|
|
||||||
|
Total
|
$
|
(1,010
|
)
|
$
|
(1,751
|
)
|
$
|
166
|
|
|||
|
|
|
|
|
|
|
|
||||||
|
Income tax expense (benefit):
|
|
|
|
|
|
|
||||||
|
Current:
|
|
|
|
|
|
|
||||||
|
Federal
|
$
|
17
|
|
$
|
19
|
|
$
|
1
|
|
|||
|
State and local
|
15
|
|
—
|
|
(7
|
)
|
||||||
|
Foreign
|
27
|
|
2
|
|
110
|
|
||||||
|
Total current
|
59
|
|
21
|
|
104
|
|
||||||
|
|
|
|
|
|
||||||||
|
Deferred:
|
|
|
|
|
||||||||
|
Federal
|
8
|
|
1,357
|
|
(84
|
)
|
||||||
|
State and local
|
(41
|
)
|
(35
|
)
|
7
|
|
||||||
|
Foreign
|
18
|
|
26
|
|
—
|
|
||||||
|
Total deferred
|
(15
|
)
|
1,348
|
|
(77
|
)
|
||||||
|
Total
|
$
|
44
|
|
$
|
1,369
|
|
$
|
27
|
|
|||
|
|
2012
|
2011
|
2010
|
||||||
|
Effective tax rate reconciliation:
|
|
|
|
||||||
|
Federal income tax rate (benefit rate)
|
(35.0
|
)%
|
(35.0
|
)%
|
35.0
|
%
|
|||
|
State and local tax (benefit) net of federal tax benefit
|
(3.0
|
)
|
(1.3
|
)
|
0.1
|
|
|||
|
Federal and state valuation allowance
|
23.5
|
|
104.1
|
|
—
|
|
|||
|
Tax on separation of Sears Hometown and Outlet Stores, Inc.
|
10.3
|
|
—
|
|
—
|
|
|||
|
Nondeductible goodwill impairment
|
10.2
|
|
11.4
|
|
—
|
|
|||
|
Tax on partial spin-off of Sears Canada
|
3.9
|
|
—
|
|
—
|
|
|||
|
Adjust foreign statutory rates
|
(3.2
|
)
|
—
|
|
—
|
|
|||
|
Tax credits
|
(1.0
|
)
|
(1.5
|
)
|
(13.0
|
)
|
|||
|
Long life land and intangibles
|
(0.8
|
)
|
—
|
|
—
|
|
|||
|
Resolution of income tax matters
|
(0.5
|
)
|
0.7
|
|
(9.2
|
)
|
|||
|
Canadian repatriation cost on Sears Canada dividend received
|
0.5
|
|
—
|
|
5.3
|
|
|||
|
Canadian rate differential on noncontrolling interest
|
—
|
|
—
|
|
(0.1
|
)
|
|||
|
Other
|
(0.5
|
)
|
(0.2
|
)
|
(1.8
|
)
|
|||
|
|
4.4
|
%
|
78.2
|
%
|
16.3
|
%
|
|||
92
SEARS HOLDINGS CORPORATION
Notes to Consolidated Financial Statements—(Continued)
|
millions
|
February 2,
2013 |
January 28,
2012 |
||||||
|
Deferred tax assets and liabilities:
|
|
|
||||||
|
Deferred tax assets:
|
|
|
||||||
|
Federal benefit for state and foreign taxes
|
$
|
151
|
|
$
|
151
|
|
||
|
Accruals and other liabilities
|
179
|
|
188
|
|
||||
|
Capital leases
|
114
|
|
125
|
|
||||
|
NOL carryforwards
|
722
|
|
672
|
|
||||
|
Postretirement benefit plans
|
78
|
|
134
|
|
||||
|
Pension
|
1,208
|
|
818
|
|
||||
|
Deferred revenue
|
202
|
|
236
|
|
||||
|
Credit carryforwards
|
605
|
|
385
|
|
||||
|
Other
|
163
|
|
216
|
|
||||
|
Total deferred tax assets
|
3,422
|
|
2,925
|
|
||||
|
Valuation allowance
|
(2,743
|
)
|
(2,268
|
)
|
||||
|
Net deferred tax assets
|
679
|
|
657
|
|
||||
|
|
|
|
|
|
||||
|
Deferred tax liabilities:
|
|
|
|
|
||||
|
Trade names/Intangibles
|
1,071
|
|
1,097
|
|
||||
|
Property and equipment
|
156
|
|
166
|
|
||||
|
Inventory
|
453
|
|
378
|
|
||||
|
Other
|
117
|
|
104
|
|
||||
|
Total deferred tax liabilities
|
1,797
|
|
1,745
|
|
||||
|
Net deferred tax liability
|
$
|
(1,118
|
)
|
$
|
(1,088
|
)
|
||
We account for income taxes in accordance with accounting standards for such taxes, which requires that deferred tax assets and liabilities be recognized using enacted tax rates for the effect of temporary differences between the financial reporting and tax bases of recorded assets and liabilities. Accounting standards also require that deferred tax assets be reduced by a valuation allowance if it is more likely than not that some portion of or all of the deferred tax asset will not be realized.
Management assesses the available positive and negative evidence to estimate if sufficient future taxable income will be generated to use the existing deferred tax assets. A significant piece of objective negative evidence evaluated was the cumulative loss incurred over the three-year periods ended February 2, 2013 and January 28, 2012. Such objective evidence limits the ability to consider other subjective evidence such as our projections for future growth.
On the basis of this analysis and the significant negative objective evidence, for the year ended January 28, 2012, a valuation allowance of
$2.1 billion
was added to record only the portion of the deferred tax asset that more likely than not will be realized. Of the total valuation allowance recorded,
$317 million
was recorded through other comprehensive income. For the year ended February 2, 2013,
$213 million
of the valuation allowance increase was recorded through other comprehensive income.
At February 2, 2013 and January 28, 2012, we had a valuation allowance of
$2.7 billion
and
$2.3 billion
, respectively, to record only the portion of the deferred tax asset that more likely than not will be realized. The amount of the deferred tax asset considered realizable, however, could be adjusted in the future if estimates of future taxable income during the carryforward period are reduced or increased, or if the objective negative evidence is in the form of cumulative losses is no longer present and additional weight may be given to subjective evidence such as our projections for growth. We will continue to evaluate our valuation allowance in future years for any change in circumstances that causes a change in judgment about the realizability of the deferred tax asset.
93
SEARS HOLDINGS CORPORATION
Notes to Consolidated Financial Statements—(Continued)
At the end of 2012 and 2011, we had a federal and state net operating loss (“NOL”) deferred tax asset of
$722 million
and
$672 million
, respectively, which will expire predominately between
2019
and
2033
. We have credit carryforwards of
$605 million
, which will expire between
2015
and
2033
.
In connection with the separation of SHO, the Company incurred a taxable gain of
$266 million
. The gain primarily related to the determination that the fair value of the consideration received exceeded the tax basis of the net assets of SHO at the date of the separation. The amount of taxes otherwise payable resulting from the gain was reduced by utilization of
$105 million
of deferred tax assets, primarily NOL carryforwards. As the Company had previously recorded a valuation allowance against these NOL carryforwards,
$105 million
of the related valuation allowance was released upon their utilization.
In connection with the taxable spin of approximately
45 percent
of the Company's common shares in Sears Canada Inc., the Company incurred a taxable gain of
$367 million
. The gain primarily relates to the determination that the fair market value of the common shares distributed to the public shareholders exceeded the tax basis of the shares distributed. The amount of taxes otherwise payable resulting from the gain was reduced by utilization of
$40 million
of net deferred tax assets, primarily NOL carryforwards. As the Company had previously recorded a valuation allowance against these NOL carryforwards,
$40 million
of the related valuation allowance was released upon their utilization.
Accounting for Uncertainties in Income Taxes
We account for uncertainties in income taxes according to accounting standards for uncertain tax positions. We are present in a large number of taxable jurisdictions, and at any point in time, can have audits underway at various stages of completion in any of these jurisdictions. We evaluate our tax positions and establish liabilities for uncertain tax positions that may be challenged by federal, foreign and/or local authorities and may not be fully sustained, despite our belief that the underlying tax positions are fully supportable. Unrecognized tax benefits are reviewed on an ongoing basis and are adjusted in light of changing facts and circumstances, including progress of tax audits, developments in case law, and closing of statute of limitations. Such adjustments are reflected in the tax provision as appropriate. We are generally not able to reliably estimate the ultimate settlement amounts until the close of the audit. While we do not expect material changes, it is possible that the amount of unrecognized benefit with respect to our uncertain tax positions will significantly increase or decrease within the next 12 months related to the audits described above. At this time, we are not able to make a reasonable estimate of the range of impact on the balance of unrecognized tax benefits or the impact on the effective tax rate related to these items. A reconciliation of the beginning and ending amount of gross unrecognized tax benefits (“UTB”) is as follows:
|
|
Federal, State, and Foreign Tax
|
|||||||||||
|
millions
|
February 2,
2013 |
January 28,
2012 |
January 29, 2011
|
|||||||||
|
Gross UTB Balance at Beginning of Period
|
$
|
192
|
|
$
|
192
|
|
$
|
310
|
|
|||
|
Tax positions related to the current period:
|
|
|
|
|
|
|
||||||
|
Gross increases
|
21
|
|
22
|
|
25
|
|
||||||
|
Gross decreases
|
(8
|
)
|
(8
|
)
|
(10
|
)
|
||||||
|
Tax positions related to prior periods:
|
|
|
|
|
||||||||
|
Gross increases
|
—
|
|
20
|
|
51
|
|
||||||
|
Gross decreases
|
(33
|
)
|
(19
|
)
|
(161
|
)
|
||||||
|
Settlements
|
(1
|
)
|
(4
|
)
|
(13
|
)
|
||||||
|
Lapse of statute of limitations
|
(10
|
)
|
(10
|
)
|
(10
|
)
|
||||||
|
Exchange rate fluctuations
|
—
|
|
(1
|
)
|
—
|
|
||||||
|
Gross UTB Balance at End of Period
|
$
|
161
|
|
$
|
192
|
|
$
|
192
|
|
|||
At the end of 2012, we had gross unrecognized tax benefits of
$161 million
. Of this amount,
$94 million
would, if recognized, impact our effective tax rate, with the remaining amount being comprised of unrecognized tax benefits related to gross temporary differences or any other indirect benefits. We expect that our unrecognized tax
94
SEARS HOLDINGS CORPORATION
Notes to Consolidated Financial Statements—(Continued)
benefits could decrease up to
$30 million
over the next 12 months for tax audit settlements and the expiration of the statute of limitations for certain jurisdictions.
We classify interest expense and penalties related to unrecognized tax benefits and interest income on tax overpayments as components of income tax expense. At February 2, 2013, the total amount of interest and penalties recognized within the related tax liability in our Consolidated Balance Sheet was
$57 million
(
$39 million
net of federal benefit). The total amount of net interest expense recognized in our Consolidated Statement of Operations for 2012 was
$2 million
.
We file income tax returns in both the United States and various foreign jurisdictions.
The U.S. Internal Revenue Service (“IRS”) has completed its examination of Holdings' 2006 through 2009 federal income tax returns, and we are currently working with the IRS appeals division to resolve a single issue arising from these exams. We have resolved all matters arising from prior IRS exams. In addition, Holdings and Sears are under examination by various state, local and foreign income tax jurisdictions for the years 2002 through 2010, and Kmart is under examination by such jurisdictions for the years 2003 through 2010.
Gain on Sales of Assets
We recognized
$468 million
,
$64 million
, and
$67 million
in gains on sales of assets during 2012, 2011, and 2010, respectively. These gains were primarily a function of several large real estate transactions. During 2012, the gain on sales of assets included gains of
$386 million
recognized in connection with real estate transactions which included a gain of
$223 million
recognized on the sale of
eleven
(
6
owned and
5
leased) Sears Full-line store locations to General Growth Properties for
$270 million
in cash proceeds, and a gain of
$163 million
recognized on the surrender and early termination of the leases on
three
properties operated by Sears Canada, under an agreement with The Cadillac Fairview Corporation Limited for which Sears Canada received
$170 million
Canadian in cash proceeds. In connection with these transactions, we surrendered substantially all of our rights and obligations under our preexisting lease agreements and agreed to surrender each of the premises in periods ranging from
6
to
23 months
from the date of closing. The gain on sales of assets recorded during 2012 also included a gain of
$33 million
related to the sale of a store operated under The Great Indoors format,
one
Sears Full-line store, and
one
Kmart store.
During 2011, the gain on sales of assets included a gain of
$33 million
recognized on the sale of
two
stores operated under The Great Indoors format and
one
Kmart store.
During 2010, the gain on sales of assets included a gain recognized on a Sears Auto Center we sold in October 2006, at which time we leased back the property for a period of time. Given the terms of the contract, for accounting purposes, the excess of proceeds received over the carrying value of the associated property was deferred. We closed our operations at this location during the first quarter of 2010 and, as a result, recognized a gain of
$35 million
on this sale at that time.
Property Acquisitions
During 2012, we purchased
one
previously leased operating property for
$6 million
. During 2011, we purchased
five
previously leased operating properties for
$17 million
. During 2010, we did not purchase any previously leased operating properties. In the normal course of business, we consider opportunities to purchase leased operating properties, as well as offers to sell owned, or assign leased, operating and non-operating properties. These transactions may, individually or in the aggregate, result in material proceeds or outlays of cash. In addition, we review leases that will expire in the short-term in order to determine the appropriate action to take with respect to them.
95
SEARS HOLDINGS CORPORATION
Notes to Consolidated Financial Statements—(Continued)
The following summarizes our intangible assets at
February 2, 2013
and
January 28, 2012
, respectively, the amortization expenses recorded for the years then ended, as well as our estimated amortization expense for the next five years and thereafter.
|
|
|
February 2, 2013
|
January 28, 2012
|
|||||||||||||||
|
millions
|
Weighted
Average Life |
Gross
Carrying Amount |
Accumulated
Amortization |
Gross
Carrying Amount |
Accumulated
Amortization |
|||||||||||||
|
Amortizing intangible assets:
|
|
|
|
|
|
|||||||||||||
|
Favorable lease rights
|
29
|
$
|
293
|
|
$
|
148
|
|
$
|
360
|
|
$
|
194
|
|
|||||
|
Contractual arrangements and customer lists
|
9
|
218
|
|
188
|
|
224
|
|
170
|
|
|||||||||
|
Trade names
|
7
|
74
|
|
71
|
|
74
|
|
60
|
|
|||||||||
|
|
|
585
|
|
407
|
|
658
|
|
424
|
|
|||||||||
|
Non-amortizing intangible assets:
|
|
|
|
|
|
|
|
|
|
|||||||||
|
Trade names
|
|
2,703
|
|
—
|
|
2,703
|
|
—
|
|
|||||||||
|
Total
|
|
$
|
3,288
|
|
$
|
407
|
|
$
|
3,361
|
|
$
|
424
|
|
|||||
|
Annual Amortization Expense
|
|
||
|
2012
|
$
|
56
|
|
|
2011
|
56
|
|
|
|
2010
|
60
|
|
|
|
Estimated Amortization
|
|
||
|
2013
|
$
|
29
|
|
|
2014
|
22
|
|
|
|
2015
|
10
|
|
|
|
2016
|
8
|
|
|
|
2017
|
7
|
|
|
|
Thereafter
|
102
|
|
|
Goodwill is the excess of the purchase price over the fair value of the net assets acquired in business combinations accounted for under the purchase method. We recorded
$1.7 billion
in goodwill in connection with the Merger. We recorded
$12 million
in connection with our acquisition of an additional
3%
interest in Sears Canada during 2008.
96
SEARS HOLDINGS CORPORATION
Notes to Consolidated Financial Statements—(Continued)
Changes in the carrying amount of goodwill by segment during years 2011 and 2012 were as follows:
|
millions
|
Sears Domestic
|
Sears
Canada |
Total
|
||||||||
|
Balance, January 29, 2011:
|
|||||||||||
|
Goodwill
|
$
|
1,097
|
|
$
|
295
|
|
$
|
1,392
|
|
||
|
2011 activity:
|
|||||||||||
|
Impairment charges
|
(551
|
)
|
—
|
|
(551
|
)
|
|||||
|
Balance, January 28, 2012
|
546
|
|
295
|
|
841
|
|
|||||
|
2012 activity:
|
|||||||||||
|
Separation of Sears Hometown and Outlet Stores, Inc.
|
(167
|
)
|
—
|
|
(167
|
)
|
|||||
|
Impairment charges
|
—
|
|
(295
|
)
|
(295
|
)
|
|||||
|
Balance, February 2, 2013
|
$
|
379
|
|
$
|
—
|
|
$
|
379
|
|
||
In accordance with accounting standards for goodwill and other intangible assets, goodwill is not amortized but requires testing for potential impairment, at a minimum on an annual basis, or when indications of potential impairment exist. The impairment test for goodwill utilizes a fair value approach. The impairment test for identifiable intangible assets not subject to amortization is also performed annually or when impairment indications exist, and consist of a comparison of the fair value of the intangible asset with its carrying amount. Identifiable intangible assets that are subject to amortization are evaluated for impairment using a process similar to that used to evaluate other long-lived assets. Our annual impairment analysis is performed at the last day of our November accounting period each year.
We perform our annual goodwill and intangible impairment test required under accounting standards at the last day of our November accounting period each year, or when an indication of potential impairment exists. The goodwill impairment test involves a two-step process as described in the “Summary of Significant Accounting Policies” in Note 1. The first step is a comparison of each reporting unit's fair value to its carrying value. If the carrying value of the reporting unit is higher than its fair value, there is an indication that impairment may exist and the second step must be performed to measure the amount of impairment loss.
After performing the first step of the process, we determined goodwill recorded at reporting units within the Sears Canada segment in 2012 and the Sears Domestic segment in 2011 were potentially impaired. The impairment charge was primarily driven by the combination of lower sales and continued margin pressure coupled with expense increases which led to a decline in our operating profit. After performing the second step of the process, we determined that the total amount of goodwill recorded at these reporting units was impaired and recorded charges of
$295 million
and
$551 million
in 2012 and 2011, respectively.
A significant amount of judgment is involved in determining if an indicator of impairment has occurred at a date other than the annual impairment test date. Such indicators may include, among others: a significant decline in our stock price and market capitalization; a significant adverse change in legal factors or in the business climate; unanticipated competition; the testing for recoverability of a significant asset group within a reporting unit; and slower growth rates.
97
SEARS HOLDINGS CORPORATION
Notes to Consolidated Financial Statements—(Continued)
Store Closings and Severance
We made the decision to close
48
,
74
and
11
stores in our Kmart segment, and
12
,
173
and
15
stores in our Sears Domestic segment during
2012
,
2011
and
2010
, respectively, and changed the format of
22
Essentials/Grands stores in our Sears Domestic segment during
2011
. Store closing costs recorded during
2012
,
2011
and
2010
were as follows:
|
millions
|
Markdowns
(1)
|
Severance Costs
(2)
|
Lease Termination Costs
(2)
|
Other Charges
(2)
|
Impairment and Accelerated Depreciation
(3)
|
Total
Store Closing Costs
|
|||||||||||||||||
|
Kmart
|
$
|
21
|
|
$
|
13
|
|
$
|
34
|
|
$
|
8
|
|
$
|
9
|
|
$
|
85
|
|
|||||
|
Sears Domestic
|
14
|
|
2
|
|
34
|
|
(6
|
)
|
13
|
|
57
|
|
|||||||||||
|
Sears Canada
|
—
|
|
16
|
|
(1
|
)
|
5
|
|
—
|
|
20
|
|
|||||||||||
|
Total 2012 costs
|
$
|
35
|
|
$
|
31
|
|
$
|
67
|
|
$
|
7
|
|
$
|
22
|
|
$
|
162
|
|
|||||
|
Kmart
|
$
|
46
|
|
$
|
14
|
|
$
|
1
|
|
$
|
15
|
|
$
|
5
|
|
$
|
81
|
|
|||||
|
Sears Domestic
|
84
|
|
41
|
|
4
|
|
31
|
|
85
|
|
245
|
|
|||||||||||
|
Sears Canada
|
—
|
|
18
|
|
—
|
|
—
|
|
—
|
|
18
|
|
|||||||||||
|
Total 2011 costs
|
$
|
130
|
|
$
|
73
|
|
$
|
5
|
|
$
|
46
|
|
$
|
90
|
|
$
|
344
|
|
|||||
|
Kmart
|
$
|
6
|
|
$
|
1
|
|
$
|
4
|
|
$
|
2
|
|
$
|
—
|
|
$
|
13
|
|
|||||
|
Sears Domestic
|
6
|
|
2
|
|
2
|
|
3
|
|
10
|
|
23
|
|
|||||||||||
|
Total 2010 costs
|
$
|
12
|
|
$
|
3
|
|
$
|
6
|
|
$
|
5
|
|
$
|
10
|
|
$
|
36
|
|
|||||
_____________
|
(1)
|
Recorded within Cost of sales, buying and occupancy on the Consolidated Statements of Operations.
|
|
(2)
|
Recorded within Selling and administrative on the Consolidated Statements of Operations. Lease termination costs are net of estimated sublease income, and include the reversal of closed store reserves for which the lease agreement has been terminated and the reversal of deferred rent balances related to closed stores.
|
|
(3)
|
2011 costs include
$82 million
recorded within impairment charges and
$8 million
recorded within Depreciation and amortization on the Consolidated Statements of Operations. 2012 and 2010 costs are recorded within Depreciation and amortization on the Consolidated Statements of Operations.
|
In accordance with accounting standards governing costs associated with exit or disposal activities, expenses related to future rent payments for which we no longer intend to receive any economic benefit are accrued for when we cease to use the leased space and have been reduced for any income that we believe can be realized through sub-leasing the leased space. We do not expect additional charges recorded during 2013 related to stores we made the decision to close in 2012 to be material.
98
SEARS HOLDINGS CORPORATION
Notes to Consolidated Financial Statements—(Continued)
Store closing cost accruals of
$193 million
and
$159 million
at
February 2, 2013
and
January 28, 2012
, respectively, were as follows:
|
millions
|
Severance
Costs
|
Lease
Termination
Costs
|
Other
Charges
|
Total
|
|||||||||||
|
Balance at January 29, 2011
|
$
|
2
|
|
$
|
68
|
|
$
|
2
|
|
$
|
72
|
|
|||
|
Store closing costs
|
73
|
|
5
|
|
46
|
|
124
|
|
|||||||
|
Payments/utilizations
|
(16
|
)
|
(9
|
)
|
(12
|
)
|
(37
|
)
|
|||||||
|
Balance at January 28, 2012
|
59
|
|
64
|
|
36
|
|
159
|
|
|||||||
|
Store closing costs
|
31
|
|
86
|
|
7
|
|
124
|
|
|||||||
|
Store closing capital lease obligations
|
—
|
|
9
|
|
—
|
|
9
|
|
|||||||
|
Payments/utilizations
|
(49
|
)
|
(21
|
)
|
(29
|
)
|
(99
|
)
|
|||||||
|
Balance at February 2, 2013
|
$
|
41
|
|
$
|
138
|
|
$
|
14
|
|
$
|
193
|
|
|||
Goodwill
See Note 12 for further information regarding our goodwill impairment charges recorded in 2012 and 2011.
Long-Lived Assets
In accordance with accounting standards governing the impairment or disposal of long-lived assets, we performed an impairment test of certain of our long-lived assets (principally the value of buildings and other fixed assets associated with our stores) due to events and changes in circumstances during 2012 and 2011 that indicated an impairment might have occurred. The impairment review was triggered by the non-cash charges related to impairment of goodwill balances and establishing a valuation allowance against certain deferred income tax assets as well as a decline in operating performance at certain locations. As a result of this impairment testing, the Company recorded impairment charges of
$35 million
and
$16 million
during 2012 and 2011, respectively. The impairment charges recorded during 2012 included a
$10 million
charge at Kmart and a
$25 million
charge at Sears Domestic. The impairment charges recorded during 2011 included a
$10 million
charge at Kmart and a
$6 million
charge at Sears Domestic.
We lease certain stores, office facilities, warehouses, computers and transportation equipment.
Operating and capital lease obligations are based upon contractual minimum rents and, for certain stores, amounts in excess of these minimum rents are payable based upon specified percentages of sales. Contingent rent is accrued over the lease term, provided that the achievement of the specified sales level that triggers the contingent rental is probable. Certain leases include renewal or purchase options.
Rental expense for operating leases was as follows:
|
millions
|
2012
|
2011
|
2010
|
|||||||||
|
Minimum rentals
|
$
|
824
|
|
$
|
837
|
|
$
|
844
|
|
|||
|
Percentage rentals
|
17
|
|
19
|
|
21
|
|
||||||
|
Less-Sublease rentals
|
(47
|
)
|
(30
|
)
|
(52
|
)
|
||||||
|
Total
|
$
|
794
|
|
$
|
826
|
|
$
|
813
|
|
|||
99
SEARS HOLDINGS CORPORATION
Notes to Consolidated Financial Statements—(Continued)
Minimum lease obligations, excluding taxes, insurance and other expenses payable directly by us, for leases in effect at
February 2, 2013
, were as follows:
|
|
Minimum Lease Commitments
|
|||||||
|
millions
|
Capital
|
Operating
|
||||||
|
2013
|
$
|
113
|
|
$
|
720
|
|
||
|
2014
|
107
|
|
621
|
|
||||
|
2015
|
94
|
|
527
|
|
||||
|
2016
|
74
|
|
422
|
|
||||
|
2017
|
51
|
|
317
|
|
||||
|
Later years
|
204
|
|
1,928
|
|
||||
|
Total minimum lease payments
(1)
|
643
|
|
4,535
|
|
||||
|
Less-minimum sublease income
|
|
|
(192
|
)
|
||||
|
Net minimum lease payments
|
|
|
$
|
4,343
|
|
|||
|
Less:
|
|
|
|
|
||||
|
Estimated executory costs
|
(56
|
)
|
|
|
||||
|
Interest at a weighted average rate of 7.2%
|
(154
|
)
|
|
|
||||
|
Capital lease obligations
|
433
|
|
|
|
||||
|
Less current portion of capital lease obligations
|
(69
|
)
|
|
|
||||
|
Long-term capital lease obligations
|
$
|
364
|
|
|
|
|||
_____________
|
(1)
|
Sears Canada: Total operating minimum lease payments of
$433 million
.
|
Investment of Surplus Cash
Our Board has delegated authority to direct investment of our surplus cash to Edward S. Lampert, subject to various limitations that have been or may be from time to time adopted by the Board of Directors and/or the Finance Committee of the Board of Directors. Mr. Lampert is Chairman of our Board of Directors and its Finance Committee and is the Chairman and Chief Executive Officer of ESL. Additionally, on February 1, 2013, Mr. Lampert became our Chief Executive Officer, in addition to his role as Chairman of the Board. Neither Mr. Lampert nor ESL will receive compensation for any such investment activities undertaken on our behalf, other than Mr. Lampert's compensation as our Chief Executive Officer. ESL beneficially owned approximately
55%
of our outstanding common stock at March 11, 2013.
Further, to clarify the expectations that the Board of Directors has with respect to the investment of our surplus cash, the Board has renounced, in accordance with Delaware law, any interest or expectancy of the Company associated with any investment opportunities in securities that may come to the attention of Mr. Lampert or any employee, officer, director or advisor to ESL and its affiliated investment entities (each, a “Covered Party”) who also serves as an officer or director of the Company other than (a) investment opportunities that come to such Covered Party’s attention directly and exclusively in such Covered Party’s capacity as a director, officer or employee of the Company, (b) control investments in companies in the mass merchandising, retailing, commercial appliance distribution, product protection agreements, residential and commercial product installation and repair services and automotive repair and maintenance industries and (c) investment opportunities in companies or assets with a significant role in our retailing business, including investment in real estate currently leased by the Company or in suppliers for which the Company is a substantial customer representing over
10%
of such companies’ revenues, but excluding investments of ESL that were existing as of May 23, 2005.
100
SEARS HOLDINGS CORPORATION
Notes to Consolidated Financial Statements—(Continued)
Unsecured Commercial Paper
During
2012
and
2011
, ESL and its affiliates purchased unsecured commercial paper issued by Sears Roebuck Acceptance Corp. (“SRAC”), an indirect wholly owned subsidiary of Holdings. For the commercial paper outstanding to ESL, the weighted average of each of maturity, annual interest rate, and principal amount outstanding for this commercial paper was
31.6
days,
2.38%
and
$202 million
and
29.2
days,
1.51%
and
$230 million
, respectively, in
2012
and
2011
. The largest aggregate amount of principal outstanding to ESL at any time since the beginning of
2012
was
$325 million
and the aggregate amount of interest paid by SRAC to ESL during
2012
was
$4 million
. ESL held
$285 million
, and
$250 million
, respectively, in principal amount of commercial paper at
February 2, 2013
, and
January 28, 2012
, which included
$169 million
, and
$130 million
, respectively, held by Mr. Lampert. The commercial paper purchases were made in the ordinary course of business on substantially the same terms, including interest rates, as terms prevailing for comparable transactions with other persons, and did not present features unfavorable to the Company.
Senior Secured Notes
In 2011, Mr. Lampert and ESL purchased an aggregate of
$95 million
of principal amount of the Company’s
6
5/8%
Senior Secured Notes due
2018
(the "
6
5
/
8%
Notes") and
$10 million
of principal amount of unsecured notes issued by SRAC and another indirect wholly owned subsidiary of Sears Holdings, Sears DC Corp. (the “Subsidiary Notes”). At
February 2, 2013
, Mr. Lampert and ESL held an aggregate of
$95 million
of principal amount of
6
5
/
8%
Notes and
$1 million
and
$2 million
, respectively, of principal amount of Subsidiary Notes. At
January 28, 2012
, Mr. Lampert and ESL held an aggregate of
$95 million
of principal amount of
6
5
/
8%
Notes and
$4 million
and
$10 million
, respectively, of principal amount of Subsidiary Notes.
Trade Receivable Put Agreements
On January 26, 2012, ESL entered into an agreement with a financial institution to acquire from the financial institution an undivided participating interest in a certain percentage of its rights and obligations under trade receivable put agreements that were entered into with certain vendors of the Company. These agreements generally provide that, in the event of a bankruptcy filing by the Company, the financial institution will purchase such vendors’ accounts receivable arising from the sale of goods or services to the Company. ESL may from time to time choose to purchase an
80%
undivided participating interest in the rights and obligations primarily arising under future trade receivable put agreements that the financial institution enters into with our vendors during the term of its agreement. The Company is neither a party nor will it become a party to any of these agreements. At
February 2, 2013
and
January 28, 2012
, ESL held a participation interest totaling
$234 million
and
$93 million
, respectively, in the financial institution’s agreements relating to the Company.
Sears Canada
ESL owns approximately
28%
of the outstanding common shares of Sears Canada.
SHO
Holdings, and certain of its subsidiaries, engage in transactions with SHO pursuant to various agreements with SHO which, among other things, (1) govern the principal transactions relating to the rights offering and certain aspects of our relationship with SHO following the separation, (2) establish terms under which Holdings and certain of its subsidiaries will provide SHO with services, and (3) establish terms pursuant to which Holdings and certain of its subsidiaries will obtain merchandise for SHO. ESL owns approximately
63%
of the outstanding common stock of SHO (based on publicly available information as of October 11, 2012).
These agreements were made in the context of a parent-subsidiary relationship and were negotiated in the overall context of the separation. The Company believes that the methods by which costs are allocated are reasonable and are based on prorated estimates of costs expected to be incurred by the Company. A summary of the nature of related party transactions involving SHO is as follows:
|
•
|
SHO obtains a significant amount of its merchandise from the Company. We have also entered into certain agreements with SHO to provide logistics, handling, warehouse and transportation services. SHO also pays a royalty related to the sale of Kenmore, Craftsman and DieHard products and fees for participation in the SHOP YOUR WAY program.
|
101
SEARS HOLDINGS CORPORATION
Notes to Consolidated Financial Statements—(Continued)
|
•
|
SHO receives commissions from the Company for the sale of merchandise made through www.sears.com, extended service agreements, delivery and handling services and credit revenues.
|
|
•
|
The Company provides SHO with shared corporate services. These services include accounting and finance, legal, human resources, information technology and real estate.
|
Amounts due to or from SHO are non-interest bearing, settled on a net basis, and have payment terms of
10
days after the invoice date. The Company invoices SHO on a weekly basis. At February 2, 2013, Holdings reported a net amount receivable from SHO of
$79 million
in the Accounts receivable line of the Consolidated Balance Sheet. Amounts related to the sale of inventory and related services, royalties, and corporate shared services was
$513 million
, and the net amounts SHO earned related to commissions was
$60 million
during the period following the separation of SHO from October 12, 2012 through February 2, 2013. Additionally, the Company has guaranteed lease obligations for certain SHO store leases that were assigned as a result of the separation. See Note 4 for further information related to these guarantees.
Also in connection with the separation, the Company entered into an agreement with SHO and the agent under SHO's secured credit facility, whereby the Company committed to continue to provide services to SHO in connection with a realization on the lender's collateral after default under the secured credit facility, notwithstanding SHO's default under the underlying agreement with us, and to provide certain notices and services to the agent, for so long as any obligations remain outstanding under the secured credit facility.
Other long-term liabilities at
February 2, 2013
and
January 28, 2012
consisted of the following:
|
millions
|
February 2,
2013 |
January 28,
2012 |
|||||
|
Unearned revenues
|
$
|
843
|
|
$
|
778
|
|
|
|
Self-insurance reserves
|
714
|
|
743
|
|
|||
|
Other
|
569
|
|
665
|
|
|||
|
Total
|
$
|
2,126
|
|
$
|
2,186
|
|
|
These reportable segment classifications are based on our business formats, as described in Note 1. The Kmart and Sears Canada formats each represent both an operating and reportable segment. The Sears Domestic reportable segment consists of the aggregation of several business formats. These formats are evaluated by our Chief Operating Decision Maker ("CODM") to make decisions about resource allocation and to assess performance.
On February 1, 2013, Mr. Lampert became Chief Executive Officer in addition to his role as Chairman of the Board. We will assess any potential impact on the business segment information used by our CODM to operate the Company on an ongoing basis.
Each of these segments derives its revenues from the sale of merchandise and related services to customers, primarily in the United States and Canada. The merchandise and service categories are as follows:
|
(i)
|
Hardlines—consists of appliances, consumer electronics, lawn and garden, tools and hardware, automotive parts, household goods, toys, housewares and sporting goods;
|
|
(ii)
|
Apparel and Soft Home—includes women’s, men’s, kids, footwear, jewelry, accessories and soft home;
|
|
(iii)
|
Food and Drug—consists of grocery and household, pharmacy and drugstore; and
|
|
(iv)
|
Service and Other—includes repair, installation and automotive service and extended contract revenue as well as revenues earned in connection with our agreements with SHO.
|
102
SEARS HOLDINGS CORPORATION
Notes to Consolidated Financial Statements—(Continued)
|
|
2012
|
|||||||||||||||
|
millions
|
Kmart
|
Sears Domestic
|
Sears Canada
|
Sears Holdings
|
||||||||||||
|
Merchandise sales and services:
|
||||||||||||||||
|
Hardlines
|
$
|
4,486
|
|
$
|
11,870
|
|
$
|
2,246
|
|
$
|
18,602
|
|
||||
|
Apparel and Soft Home
|
4,588
|
|
5,434
|
|
1,856
|
|
11,878
|
|
||||||||
|
Food and Drug
|
5,398
|
|
38
|
|
—
|
|
5,436
|
|
||||||||
|
Service and Other
|
95
|
|
3,635
|
|
208
|
|
3,938
|
|
||||||||
|
Total merchandise sales and services
|
14,567
|
|
20,977
|
|
4,310
|
|
39,854
|
|
||||||||
|
Costs and expenses:
|
||||||||||||||||
|
Cost of sales, buying and occupancy
|
11,158
|
|
15,107
|
|
3,075
|
|
29,340
|
|
||||||||
|
Selling and administrative
|
3,284
|
|
6,184
|
|
1,192
|
|
10,660
|
|
||||||||
|
Depreciation and amortization
|
147
|
|
578
|
|
105
|
|
830
|
|
||||||||
|
Impairment charges
|
10
|
|
25
|
|
295
|
|
330
|
|
||||||||
|
Gain on sales of assets
|
(37
|
)
|
(261
|
)
|
(170
|
)
|
(468
|
)
|
||||||||
|
Total costs and expenses
|
14,562
|
|
21,633
|
|
4,497
|
|
40,692
|
|
||||||||
|
Operating income (loss)
|
$
|
5
|
|
$
|
(656
|
)
|
$
|
(187
|
)
|
$
|
(838
|
)
|
||||
|
Total assets
|
$
|
4,304
|
|
$
|
12,648
|
|
$
|
2,388
|
|
$
|
19,340
|
|
||||
|
Capital expenditures
|
$
|
122
|
|
$
|
171
|
|
$
|
85
|
|
$
|
378
|
|
||||
|
|
2011
|
|||||||||||||||
|
millions
|
Kmart
|
Sears Domestic
|
Sears Canada
|
Sears Holdings
|
||||||||||||
|
Merchandise sales and services:
|
||||||||||||||||
|
Hardlines
|
$
|
4,765
|
|
$
|
13,022
|
|
$
|
2,377
|
|
$
|
20,164
|
|
||||
|
Apparel and Soft Home
|
4,723
|
|
5,471
|
|
2,011
|
|
12,205
|
|
||||||||
|
Food and Drug
|
5,705
|
|
41
|
|
—
|
|
5,746
|
|
||||||||
|
Service and Other
|
92
|
|
3,115
|
|
245
|
|
3,452
|
|
||||||||
|
Total merchandise sales and services
|
15,285
|
|
21,649
|
|
4,633
|
|
41,567
|
|
||||||||
|
Costs and expenses:
|
||||||||||||||||
|
Cost of sales, buying and occupancy
|
11,818
|
|
15,849
|
|
3,299
|
|
30,966
|
|
||||||||
|
Selling and administrative
|
3,371
|
|
6,042
|
|
1,251
|
|
10,664
|
|
||||||||
|
Depreciation and amortization
|
149
|
|
601
|
|
103
|
|
853
|
|
||||||||
|
Impairment charges
|
15
|
|
634
|
|
—
|
|
649
|
|
||||||||
|
Gain on sales of assets
|
(34
|
)
|
(30
|
)
|
—
|
|
(64
|
)
|
||||||||
|
Total costs and expenses
|
15,319
|
|
23,096
|
|
4,653
|
|
43,068
|
|
||||||||
|
Operating loss
|
$
|
(34
|
)
|
$
|
(1,447
|
)
|
$
|
(20
|
)
|
$
|
(1,501
|
)
|
||||
|
Total assets
|
$
|
4,548
|
|
$
|
13,913
|
|
$
|
2,920
|
|
$
|
21,381
|
|
||||
|
Capital expenditures
|
$
|
118
|
|
$
|
225
|
|
$
|
89
|
|
$
|
432
|
|
||||
103
SEARS HOLDINGS CORPORATION
Notes to Consolidated Financial Statements—(Continued)
|
|
2010
|
|||||||||||||||
|
millions
|
Kmart
|
Sears Domestic
|
Sears Canada
|
Sears Holdings
|
||||||||||||
|
Merchandise sales and services:
|
||||||||||||||||
|
Hardlines
|
$
|
4,879
|
|
$
|
13,692
|
|
$
|
2,440
|
|
$
|
21,011
|
|
||||
|
Apparel and Soft Home
|
4,809
|
|
5,454
|
|
2,088
|
|
12,351
|
|
||||||||
|
Food and Drug
|
5,810
|
|
38
|
|
—
|
|
5,848
|
|
||||||||
|
Service and Other
|
95
|
|
3,091
|
|
268
|
|
3,454
|
|
||||||||
|
Total merchandise sales and services
|
15,593
|
|
22,275
|
|
4,796
|
|
42,664
|
|
||||||||
|
Costs and expenses:
|
||||||||||||||||
|
Cost of sales, buying and occupancy
|
11,757
|
|
15,910
|
|
3,333
|
|
31,000
|
|
||||||||
|
Selling and administrative
|
3,341
|
|
5,940
|
|
1,144
|
|
10,425
|
|
||||||||
|
Depreciation and amortization
|
149
|
|
620
|
|
100
|
|
869
|
|
||||||||
|
Gain on sales of assets
|
(7
|
)
|
(46
|
)
|
(14
|
)
|
(67
|
)
|
||||||||
|
Total costs and expenses
|
15,240
|
|
22,424
|
|
4,563
|
|
42,227
|
|
||||||||
|
Operating income (loss)
|
$
|
353
|
|
$
|
(149
|
)
|
$
|
233
|
|
$
|
437
|
|
||||
|
Total assets
|
$
|
6,085
|
|
$
|
15,299
|
|
$
|
2,976
|
|
$
|
24,360
|
|
||||
|
Capital expenditures
|
$
|
153
|
|
$
|
216
|
|
$
|
57
|
|
$
|
426
|
|
||||
We are a defendant in several lawsuits containing class or collective action allegations in which the plaintiffs are current and former hourly and salaried associates who allege violations of various wage and hour laws, rules and regulations pertaining to alleged misclassification of certain of our employees and the failure to pay overtime and/or the failure to pay for missed meal and rest periods. The complaints generally seek unspecified monetary damages, injunctive relief, or both. Further, certain of these proceedings are in jurisdictions with reputations for aggressive application of laws and procedures against corporate defendants. We also are a defendant in several putative or certified class action lawsuits in California relating to alleged failure to comply with California laws pertaining to certain operational, marketing and payroll practices. The California laws alleged to have been violated in each of these lawsuits provide the potential for significant statutory penalties. At this time, the Company is not able to either predict the outcome of these lawsuits or reasonably estimate a potential range of loss with respect to the lawsuits.
We are subject to various other legal and governmental proceedings and investigations, including some involving the practices and procedures in our more highly regulated businesses and many involving litigation incidental to those and other businesses. Some matters contain class action allegations, environmental and asbestos exposure allegations and other consumer-based, regulatory or qui tam claims, each of which may seek compensatory, punitive or treble damage claims (potentially in large amounts), as well as other types of relief.
In accordance with accounting standards regarding loss contingencies, we accrue an undiscounted liability for those contingencies where the incurrence of a loss is probable and the amount can be reasonably estimated, and we disclose the amount accrued and the amount of a reasonably possible loss in excess of the amount accrued, if such disclosure is necessary for our financial statements to not be misleading. We do not record liabilities when the likelihood that the liability has been incurred is probable but the amount cannot be reasonably estimated, or when the liability is believed to be only reasonably possible or remote.
Because litigation outcomes are inherently unpredictable, our evaluation of legal proceedings often involves a series of complex assessments by management about future events and can rely heavily on estimates and assumptions. If the assessments indicate that loss contingencies that could be material to any one of our financial statements are not probable, but are reasonably possible, or are probable, but cannot be estimated, then we disclose the nature of the loss contingencies, together with an estimate of the range of possible loss or a statement that such loss is not reasonably estimable. While the consequences of certain unresolved proceedings are not presently
104
SEARS HOLDINGS CORPORATION
Notes to Consolidated Financial Statements—(Continued)
determinable, and an estimate of the probable and reasonably possible loss or range of loss in excess of amounts accrued for such proceedings cannot be reasonably made, an adverse outcome from such proceedings could have a material effect on our earnings in any given reporting period. However, in the opinion of our management, after consulting with legal counsel, and taking into account insurance and reserves, the ultimate liability related to current outstanding matters is not expected to have a material effect on our financial position, liquidity or capital resources.
|
|
2012
|
|||||||||||||||
|
millions, except per share data
|
First
Quarter |
Second
Quarter |
Third
Quarter |
Fourth
Quarter |
||||||||||||
|
Revenues
|
$
|
9,270
|
|
$
|
9,467
|
|
$
|
8,857
|
|
$
|
12,260
|
|
||||
|
Cost of sales, buying and occupancy
|
6,703
|
|
6,936
|
|
6,604
|
|
9,097
|
|
||||||||
|
Selling and administrative
|
2,445
|
|
2,437
|
|
2,496
|
|
3,282
|
|
||||||||
|
Net income (loss) from continuing operations attributable to Holdings' shareholders
|
189
|
|
(132
|
)
|
(498
|
)
|
(489
|
)
|
||||||||
|
Basic net income (loss) per share from continuing operations attributable to Holdings' shareholders
|
1.78
|
|
(1.25
|
)
|
(4.70
|
)
|
(4.61
|
)
|
||||||||
|
Diluted net income (loss) per share from continuing operations attributable to Holdings' shareholders
|
1.78
|
|
(1.25
|
)
|
(4.70
|
)
|
(4.61
|
)
|
||||||||
|
|
2011
|
|||||||||||||||
|
millions, except per share data
|
First
Quarter |
Second
Quarter |
Third
Quarter |
Fourth
Quarter |
||||||||||||
|
Revenues
|
$
|
9,540
|
|
$
|
10,138
|
|
$
|
9,405
|
|
$
|
12,484
|
|
||||
|
Cost of sales, buying and occupancy
|
6,996
|
|
7,537
|
|
7,011
|
|
9,422
|
|
||||||||
|
Selling and administrative
|
2,507
|
|
2,601
|
|
2,635
|
|
2,921
|
|
||||||||
|
Net loss from continuing operations attributable to Holdings' shareholders
|
(165
|
)
|
(152
|
)
|
(410
|
)
|
(2,386
|
)
|
||||||||
|
Basic net loss per share from continuing operations attributable to Holdings' shareholders
|
(1.53
|
)
|
(1.42
|
)
|
(3.85
|
)
|
(22.47
|
)
|
||||||||
|
Diluted net loss per share from continuing operations attributable to Holdings' shareholders
|
(1.53
|
)
|
(1.42
|
)
|
(3.85
|
)
|
(22.47
|
)
|
||||||||
Earnings (loss) per share amounts for each quarter are required to be computed independently and may not equal the amount computed for the total year.
At
February 2, 2013
, the principal amount outstanding of the Company’s 6
5/8% senior secured notes due
2018
was
$1.24 billion
. These notes were issued in 2010 by Sears Holdings Corporation (“Parent”). The 6
5/8% Notes are guaranteed by certain of our
100%
owned domestic subsidiaries that own the collateral for the notes, as well as by Sears Holdings Management Corporation and SRAC (the “guarantor subsidiaries”). The following condensed consolidated financial information presents the Condensed Consolidating Balance Sheets at
February 2, 2013
and
January 28, 2012
, and the Condensed Consolidating Statements of Operations, the Consolidating Statements of Comprehensive Income (Loss) and the Condensed Consolidating Statements of Cash flows for
2012
,
2011
and
2010
of (i) Parent; (ii) the guarantor subsidiaries; (iii) the non-guarantor subsidiaries; (iv) eliminations and (v) the Company on a consolidated basis.
The following condensed consolidated financial statements had total assets and total liabilities of approximately
$650 million
and
$115 million
, respectively, at January 28, 2012 attributable to SHO. Merchandise
105
SEARS HOLDINGS CORPORATION
Notes to Consolidated Financial Statements—(Continued)
sales and services included revenues of
$1.7 billion
,
$2.3 billion
and
$2.3 billion
from SHO for 2012, 2011 and 2010, respectively. Net income (loss) attributable to Holdings' shareholders included net income of approximately
$51 million
,
$33 million
and
$50 million
from SHO for 2012, 2011 and 2010, respectively. The financial information for SHO is reflected within the guarantor subsidiaries balances for these periods. The condensed consolidated financial information as of and for the periods ended February 2, 2013 reflect the effects of the separation of SHO.
The principal elimination entries relate to investments in subsidiaries and intercompany balances and transactions including transactions with our wholly-owned non-guarantor insurance subsidiary. The Company has accounted for investments in subsidiaries under the equity method. The guarantor subsidiaries are
100%
owned directly or indirectly by the Parent and all guarantees are joint, several and unconditional. Additionally, the notes are secured by a security interest in certain assets consisting primarily of domestic inventory and credit card receivables of the guarantor subsidiaries, and consequently may not be available to satisfy the claims of the Company’s general creditors. Certain investments primarily held by non-guarantor subsidiaries are recorded by the issuers at historical cost and are recorded at fair value by the holder.
106
SEARS HOLDINGS CORPORATION
Notes to Consolidated Financial Statements—(Continued)
Condensed Consolidating Balance Sheet
February 2, 2013
|
millions
|
Parent
|
Guarantor
Subsidiaries |
Non-
Guarantor Subsidiaries |
Eliminations
|
Consolidated
|
|||||||||||||||
|
Current assets
|
||||||||||||||||||||
|
Cash and cash equivalents
|
$
|
—
|
|
$
|
320
|
|
$
|
289
|
|
$
|
—
|
|
$
|
609
|
|
|||||
|
Intercompany receivables
|
—
|
|
—
|
|
25,553
|
|
(25,553
|
)
|
—
|
|
||||||||||
|
Accounts receivable
|
—
|
|
506
|
|
129
|
|
—
|
|
635
|
|
||||||||||
|
Merchandise inventories
|
—
|
|
6,709
|
|
849
|
|
—
|
|
7,558
|
|
||||||||||
|
Prepaid expenses and other current assets
|
92
|
|
970
|
|
461
|
|
(1,060
|
)
|
463
|
|
||||||||||
|
Total current assets
|
92
|
|
8,505
|
|
27,281
|
|
(26,613
|
)
|
9,265
|
|
||||||||||
|
Total property and equipment, net
|
—
|
|
4,412
|
|
1,641
|
|
—
|
|
6,053
|
|
||||||||||
|
Goodwill and intangible assets
|
—
|
|
968
|
|
2,292
|
|
—
|
|
3,260
|
|
||||||||||
|
Other assets
|
17
|
|
223
|
|
3,147
|
|
(2,625
|
)
|
762
|
|
||||||||||
|
Investment in subsidiaries
|
16,413
|
|
24,988
|
|
—
|
|
(41,401
|
)
|
—
|
|
||||||||||
|
TOTAL ASSETS
|
$
|
16,522
|
|
$
|
39,096
|
|
$
|
34,361
|
|
$
|
(70,639
|
)
|
$
|
19,340
|
|
|||||
|
Current liabilities
|
||||||||||||||||||||
|
Short-term borrowings
|
$
|
—
|
|
$
|
1,094
|
|
$
|
—
|
|
$
|
—
|
|
$
|
1,094
|
|
|||||
|
Current portion of long-term debt and capitalized lease obligations
|
—
|
|
66
|
|
17
|
|
—
|
|
83
|
|
||||||||||
|
Merchandise payables
|
—
|
|
2,392
|
|
369
|
|
—
|
|
2,761
|
|
||||||||||
|
Intercompany payables
|
12,594
|
|
12,959
|
|
—
|
|
(25,553
|
)
|
—
|
|
||||||||||
|
Short-term deferred tax liabilities
|
3
|
|
412
|
|
—
|
|
(33
|
)
|
382
|
|
||||||||||
|
Other current liabilities
|
26
|
|
2,640
|
|
2,455
|
|
(1,027
|
)
|
4,094
|
|
||||||||||
|
Total current liabilities
|
12,623
|
|
19,563
|
|
2,841
|
|
(26,613
|
)
|
8,414
|
|
||||||||||
|
Long-term debt and capitalized lease obligations
|
1,237
|
|
3,081
|
|
135
|
|
(2,510
|
)
|
1,943
|
|
||||||||||
|
Pension and postretirement benefits
|
—
|
|
2,310
|
|
420
|
|
—
|
|
2,730
|
|
||||||||||
|
Long-term deferred tax liabilities
|
—
|
|
—
|
|
914
|
|
41
|
|
955
|
|
||||||||||
|
Other long-term liabilities
|
—
|
|
861
|
|
1,513
|
|
(248
|
)
|
2,126
|
|
||||||||||
|
Total Liabilities
|
13,860
|
|
25,815
|
|
5,823
|
|
(29,330
|
)
|
16,168
|
|
||||||||||
|
EQUITY
|
||||||||||||||||||||
|
Shareholder’s equity
|
2,662
|
|
13,281
|
|
28,538
|
|
(41,726
|
)
|
2,755
|
|
||||||||||
|
Noncontrolling interest
|
—
|
|
—
|
|
—
|
|
417
|
|
417
|
|
||||||||||
|
Total Equity
|
2,662
|
|
13,281
|
|
28,538
|
|
(41,309
|
)
|
3,172
|
|
||||||||||
|
TOTAL LIABILITIES AND EQUITY
|
$
|
16,522
|
|
$
|
39,096
|
|
$
|
34,361
|
|
$
|
(70,639
|
)
|
$
|
19,340
|
|
|||||
107
SEARS HOLDINGS CORPORATION
Notes to Consolidated Financial Statements—(Continued)
Condensed Consolidating Balance Sheet
January 28, 2012
|
millions
|
Parent
|
Guarantor
Subsidiaries |
Non-
Guarantor Subsidiaries |
Eliminations
|
Consolidated
|
|||||||||||||||
|
Current assets
|
||||||||||||||||||||
|
Cash and cash equivalents
|
$
|
—
|
|
$
|
336
|
|
$
|
411
|
|
$
|
—
|
|
$
|
747
|
|
|||||
|
Intercompany receivables
|
—
|
|
—
|
|
25,129
|
|
(25,129
|
)
|
—
|
|
||||||||||
|
Accounts receivable
|
—
|
|
486
|
|
209
|
|
—
|
|
695
|
|
||||||||||
|
Merchandise inventories
|
—
|
|
7,590
|
|
817
|
|
—
|
|
8,407
|
|
||||||||||
|
Prepaid expenses and other current assets
|
42
|
|
760
|
|
458
|
|
(865
|
)
|
395
|
|
||||||||||
|
Total current assets
|
42
|
|
9,172
|
|
27,024
|
|
(25,994
|
)
|
10,244
|
|
||||||||||
|
Total property and equipment, net
|
—
|
|
4,837
|
|
1,740
|
|
—
|
|
6,577
|
|
||||||||||
|
Goodwill and intangible assets
|
—
|
|
1,178
|
|
2,600
|
|
—
|
|
3,778
|
|
||||||||||
|
Other assets
|
22
|
|
190
|
|
2,589
|
|
(2,019
|
)
|
782
|
|
||||||||||
|
Investment in subsidiaries
|
17,332
|
|
25,648
|
|
—
|
|
(42,980
|
)
|
—
|
|
||||||||||
|
TOTAL ASSETS
|
$
|
17,396
|
|
$
|
41,025
|
|
$
|
33,953
|
|
$
|
(70,993
|
)
|
$
|
21,381
|
|
|||||
|
Current liabilities
|
||||||||||||||||||||
|
Short-term borrowings
|
$
|
—
|
|
$
|
1,175
|
|
$
|
—
|
|
$
|
—
|
|
$
|
1,175
|
|
|||||
|
Current portion of long-term debt and capitalized lease obligations
|
—
|
|
213
|
|
17
|
|
—
|
|
230
|
|
||||||||||
|
Merchandise payables
|
—
|
|
2,476
|
|
436
|
|
—
|
|
2,912
|
|
||||||||||
|
Intercompany payables
|
11,844
|
|
13,285
|
|
—
|
|
(25,129
|
)
|
—
|
|
||||||||||
|
Short-term deferred tax liabilities
|
5
|
|
541
|
|
—
|
|
(30
|
)
|
516
|
|
||||||||||
|
Other current liabilities
|
29
|
|
2,856
|
|
2,329
|
|
(835
|
)
|
4,379
|
|
||||||||||
|
Total current liabilities
|
11,878
|
|
20,546
|
|
2,782
|
|
(25,994
|
)
|
9,212
|
|
||||||||||
|
Long-term debt and capitalized lease obligations
|
1,237
|
|
2,396
|
|
240
|
|
(1,785
|
)
|
2,088
|
|
||||||||||
|
Pension and postretirement benefits
|
—
|
|
2,283
|
|
455
|
|
—
|
|
2,738
|
|
||||||||||
|
Long-term deferred tax liabilities
|
—
|
|
5
|
|
817
|
|
(6
|
)
|
816
|
|
||||||||||
|
Other long-term liabilities
|
—
|
|
900
|
|
1,514
|
|
(228
|
)
|
2,186
|
|
||||||||||
|
Total Liabilities
|
13,115
|
|
26,130
|
|
5,808
|
|
(28,013
|
)
|
17,040
|
|
||||||||||
|
EQUITY
|
||||||||||||||||||||
|
Shareholder’s equity
|
4,281
|
|
14,895
|
|
28,145
|
|
(43,040
|
)
|
4,281
|
|
||||||||||
|
Noncontrolling interest
|
—
|
|
—
|
|
—
|
|
60
|
|
60
|
|
||||||||||
|
Total Equity
|
4,281
|
|
14,895
|
|
28,145
|
|
(42,980
|
)
|
4,341
|
|
||||||||||
|
TOTAL LIABILITIES AND EQUITY
|
$
|
17,396
|
|
$
|
41,025
|
|
$
|
33,953
|
|
$
|
(70,993
|
)
|
$
|
21,381
|
|
|||||
108
SEARS HOLDINGS CORPORATION
Notes to Consolidated Financial Statements—(Continued)
Condensed Consolidating Statement of Operations
For the Year Ended
February 2, 2013
|
millions
|
Parent
|
Guarantor
Subsidiaries |
Non-
Guarantor Subsidiaries |
Eliminations
|
Consolidated
|
|||||||||||||||
|
Merchandise sales and services
|
$
|
—
|
|
$
|
35,417
|
|
$
|
8,032
|
|
$
|
(3,595
|
)
|
$
|
39,854
|
|
|||||
|
Cost of sales, buying and occupancy
|
—
|
|
26,531
|
|
4,619
|
|
(1,810
|
)
|
29,340
|
|
||||||||||
|
Selling and administrative
|
2
|
|
10,054
|
|
2,389
|
|
(1,785
|
)
|
10,660
|
|
||||||||||
|
Depreciation and amortization
|
—
|
|
634
|
|
196
|
|
—
|
|
830
|
|
||||||||||
|
Impairment charges
|
—
|
|
35
|
|
295
|
|
—
|
|
330
|
|
||||||||||
|
Gain on sales of assets
|
—
|
|
(298
|
)
|
(170
|
)
|
—
|
|
(468
|
)
|
||||||||||
|
Total costs and expenses
|
2
|
|
36,956
|
|
7,329
|
|
(3,595
|
)
|
40,692
|
|
||||||||||
|
Operating income (loss)
|
(2
|
)
|
(1,539
|
)
|
703
|
|
—
|
|
(838
|
)
|
||||||||||
|
Interest expense
|
(227
|
)
|
(391
|
)
|
(107
|
)
|
458
|
|
(267
|
)
|
||||||||||
|
Interest and investment income
|
—
|
|
43
|
|
509
|
|
(458
|
)
|
94
|
|
||||||||||
|
Other income
|
—
|
|
—
|
|
1
|
|
—
|
|
1
|
|
||||||||||
|
Income (loss) from continuing operations before income taxes
|
(229
|
)
|
(1,887
|
)
|
1,106
|
|
—
|
|
(1,010
|
)
|
||||||||||
|
Income tax (expense) benefit
|
89
|
|
527
|
|
(660
|
)
|
—
|
|
(44
|
)
|
||||||||||
|
Equity in earnings in subsidiaries
|
(914
|
)
|
65
|
|
—
|
|
849
|
|
—
|
|
||||||||||
|
Net income (loss)
|
(1,054
|
)
|
(1,295
|
)
|
446
|
|
849
|
|
(1,054
|
)
|
||||||||||
|
Loss attributable to noncontrolling interests
|
—
|
|
—
|
|
—
|
|
124
|
|
124
|
|
||||||||||
|
NET INCOME (LOSS) ATTRIBUTABLE TO HOLDINGS’ SHAREHOLDERS
|
$
|
(1,054
|
)
|
$
|
(1,295
|
)
|
$
|
446
|
|
$
|
973
|
|
$
|
(930
|
)
|
|||||
109
SEARS HOLDINGS CORPORATION
Notes to Consolidated Financial Statements—(Continued)
Condensed Consolidating Statement of Operations
For the Year Ended
January 28, 2012
|
millions
|
Parent
|
Guarantor
Subsidiaries |
Non-
Guarantor Subsidiaries |
Eliminations
|
Consolidated
|
|||||||||||||||
|
Merchandise sales and services
|
$
|
—
|
|
$
|
36,714
|
|
$
|
8,354
|
|
$
|
(3,501
|
)
|
$
|
41,567
|
|
|||||
|
Cost of sales, buying and occupancy
|
—
|
|
27,850
|
|
4,862
|
|
(1,746
|
)
|
30,966
|
|
||||||||||
|
Selling and administrative
|
2
|
|
9,926
|
|
2,491
|
|
(1,755
|
)
|
10,664
|
|
||||||||||
|
Depreciation and amortization
|
—
|
|
680
|
|
173
|
|
—
|
|
853
|
|
||||||||||
|
Impairment charges
|
—
|
|
649
|
|
—
|
|
—
|
|
649
|
|
||||||||||
|
Gain on sales of assets
|
—
|
|
(63
|
)
|
(1
|
)
|
—
|
|
(64
|
)
|
||||||||||
|
Total costs and expenses
|
2
|
|
39,042
|
|
7,525
|
|
(3,501
|
)
|
43,068
|
|
||||||||||
|
Operating income (loss)
|
(2
|
)
|
(2,328
|
)
|
829
|
|
—
|
|
(1,501
|
)
|
||||||||||
|
Interest expense
|
(224
|
)
|
(388
|
)
|
(112
|
)
|
435
|
|
(289
|
)
|
||||||||||
|
Interest and investment income
|
—
|
|
41
|
|
435
|
|
(435
|
)
|
41
|
|
||||||||||
|
Other loss
|
—
|
|
—
|
|
(2
|
)
|
—
|
|
(2
|
)
|
||||||||||
|
Income (loss) from continuing operations before income taxes
|
(226
|
)
|
(2,675
|
)
|
1,150
|
|
—
|
|
(1,751
|
)
|
||||||||||
|
Income tax (expense) benefit
|
43
|
|
(785
|
)
|
(627
|
)
|
—
|
|
(1,369
|
)
|
||||||||||
|
Equity in earnings in subsidiaries
|
(2,964
|
)
|
151
|
|
—
|
|
2,813
|
|
—
|
|
||||||||||
|
Income (loss) from continuing operations
|
(3,147
|
)
|
(3,309
|
)
|
523
|
|
2,813
|
|
(3,120
|
)
|
||||||||||
|
Loss from discontinued operations, net of tax
|
—
|
|
—
|
|
(27
|
)
|
—
|
|
(27
|
)
|
||||||||||
|
Net income (loss)
|
(3,147
|
)
|
(3,309
|
)
|
496
|
|
2,813
|
|
(3,147
|
)
|
||||||||||
|
Loss attributable to noncontrolling interests
|
—
|
|
—
|
|
—
|
|
7
|
|
7
|
|
||||||||||
|
NET INCOME (LOSS) ATTRIBUTABLE TO HOLDINGS’ SHAREHOLDERS
|
$
|
(3,147
|
)
|
$
|
(3,309
|
)
|
$
|
496
|
|
$
|
2,820
|
|
$
|
(3,140
|
)
|
|||||
110
SEARS HOLDINGS CORPORATION
Notes to Consolidated Financial Statements—(Continued)
Condensed Consolidating Statement of Operations
For the Year Ended
January 29, 2011
|
millions
|
Parent
|
Guarantor
Subsidiaries |
Non-
Guarantor Subsidiaries |
Eliminations
|
Consolidated
|
|||||||||||||||
|
Merchandise sales and services
|
$
|
—
|
|
$
|
37,587
|
|
$
|
8,573
|
|
$
|
(3,496
|
)
|
$
|
42,664
|
|
|||||
|
Cost of sales, buying and occupancy
|
—
|
|
27,877
|
|
4,830
|
|
(1,707
|
)
|
31,000
|
|
||||||||||
|
Selling and administrative
|
2
|
|
9,794
|
|
2,418
|
|
(1,789
|
)
|
10,425
|
|
||||||||||
|
Depreciation and amortization
|
—
|
|
694
|
|
175
|
|
—
|
|
869
|
|
||||||||||
|
Gain on sales of assets
|
—
|
|
(52
|
)
|
(15
|
)
|
—
|
|
(67
|
)
|
||||||||||
|
Total costs and expenses
|
2
|
|
38,313
|
|
7,408
|
|
(3,496
|
)
|
42,227
|
|
||||||||||
|
Operating income (loss)
|
(2
|
)
|
(726
|
)
|
1,165
|
|
—
|
|
437
|
|
||||||||||
|
Interest expense
|
(166
|
)
|
(429
|
)
|
(113
|
)
|
415
|
|
(293
|
)
|
||||||||||
|
Interest and investment income
|
—
|
|
38
|
|
413
|
|
(415
|
)
|
36
|
|
||||||||||
|
Other income (loss)
|
1
|
|
1
|
|
(16
|
)
|
—
|
|
(14
|
)
|
||||||||||
|
Income (loss) from continuing operations before income taxes
|
(167
|
)
|
(1,116
|
)
|
1,449
|
|
—
|
|
166
|
|
||||||||||
|
Income tax (expense) benefit
|
58
|
|
422
|
|
(507
|
)
|
—
|
|
(27
|
)
|
||||||||||
|
Equity in earnings in subsidiaries
|
259
|
|
567
|
|
—
|
|
(826
|
)
|
—
|
|
||||||||||
|
Income (loss) from continuing operations
|
150
|
|
(127
|
)
|
942
|
|
(826
|
)
|
139
|
|
||||||||||
|
Income from discontinued operations, net of tax
|
—
|
|
—
|
|
11
|
|
—
|
|
11
|
|
||||||||||
|
Net income (loss)
|
150
|
|
(127
|
)
|
953
|
|
(826
|
)
|
150
|
|
||||||||||
|
Income attributable to noncontrolling interests
|
—
|
|
—
|
|
—
|
|
(17
|
)
|
(17
|
)
|
||||||||||
|
NET INCOME (LOSS) ATTRIBUTABLE TO HOLDINGS’ SHAREHOLDERS
|
$
|
150
|
|
$
|
(127
|
)
|
$
|
953
|
|
$
|
(843
|
)
|
$
|
133
|
|
|||||
111
SEARS HOLDINGS CORPORATION
Notes to Consolidated Financial Statements—(Continued)
Consolidating Statement of Comprehensive Income (Loss)
For the Year Ended
February 2, 2013
|
millions
|
Parent
|
Guarantor
Subsidiaries |
Non-
Guarantor Subsidiaries |
Eliminations
|
Consolidated
|
|||||||||||||||
|
Net income (loss)
|
$
|
(1,054
|
)
|
$
|
(1,295
|
)
|
$
|
446
|
|
$
|
849
|
|
$
|
(1,054
|
)
|
|||||
|
Other comprehensive income:
|
||||||||||||||||||||
|
Pension and postretirement adjustments, net of tax
|
—
|
|
60
|
|
14
|
|
—
|
|
74
|
|
||||||||||
|
Deferred gain on derivatives, net of tax
|
5
|
|
—
|
|
—
|
|
—
|
|
5
|
|
||||||||||
|
Currency translation adjustments, net of tax
|
6
|
|
—
|
|
(1
|
)
|
—
|
|
5
|
|
||||||||||
|
Unrealized net gain (loss), net of tax
|
—
|
|
(270
|
)
|
177
|
|
93
|
|
—
|
|
||||||||||
|
Total other comprehensive income
|
11
|
|
(210
|
)
|
190
|
|
93
|
|
84
|
|
||||||||||
|
Comprehensive income (loss)
|
(1,043
|
)
|
(1,505
|
)
|
636
|
|
942
|
|
(970
|
)
|
||||||||||
|
Comprehensive income attributable to noncontrolling interest
|
—
|
|
—
|
|
—
|
|
124
|
|
124
|
|
||||||||||
|
Comprehensive income (loss) attributable to Holdings’ shareholders
|
$
|
(1,043
|
)
|
$
|
(1,505
|
)
|
$
|
636
|
|
$
|
1,066
|
|
$
|
(846
|
)
|
|||||
112
SEARS HOLDINGS CORPORATION
Notes to Consolidated Financial Statements—(Continued)
Consolidating Statement of Comprehensive Income (Loss)
For the Year Ended
January 28, 2012
|
millions
|
Parent
|
Guarantor
Subsidiaries |
Non-
Guarantor Subsidiaries |
Eliminations
|
Consolidated
|
|||||||||||||||
|
Net income (loss)
|
$
|
(3,147
|
)
|
$
|
(3,309
|
)
|
$
|
496
|
|
$
|
2,813
|
|
$
|
(3,147
|
)
|
|||||
|
Other comprehensive loss:
|
||||||||||||||||||||
|
Pension and postretirement adjustments, net of tax
|
—
|
|
(750
|
)
|
(39
|
)
|
—
|
|
(789
|
)
|
||||||||||
|
Deferred loss on derivatives, net of tax
|
(6
|
)
|
—
|
|
—
|
|
—
|
|
(6
|
)
|
||||||||||
|
Currency translation adjustments, net of tax
|
—
|
|
—
|
|
(38
|
)
|
—
|
|
(38
|
)
|
||||||||||
|
Unrealized net gain (loss), net of tax
|
—
|
|
320
|
|
(320
|
)
|
—
|
|
—
|
|
||||||||||
|
Total other comprehensive loss
|
(6
|
)
|
(430
|
)
|
(397
|
)
|
—
|
|
(833
|
)
|
||||||||||
|
Comprehensive income (loss)
|
(3,153
|
)
|
(3,739
|
)
|
99
|
|
2,813
|
|
(3,980
|
)
|
||||||||||
|
Comprehensive loss attributable to noncontrolling interest
|
—
|
|
—
|
|
—
|
|
12
|
|
12
|
|
||||||||||
|
Comprehensive income (loss) attributable to Holdings’ shareholders
|
$
|
(3,153
|
)
|
$
|
(3,739
|
)
|
$
|
99
|
|
$
|
2,825
|
|
$
|
(3,968
|
)
|
|||||
113
SEARS HOLDINGS CORPORATION
Notes to Consolidated Financial Statements—(Continued)
Consolidating Statement of Comprehensive Income (Loss)
For the Year Ended
January 29, 2011
|
millions
|
Parent
|
Guarantor
Subsidiaries |
Non-
Guarantor Subsidiaries |
Eliminations
|
Consolidated
|
|||||||||||||||
|
Net income (loss)
|
$
|
150
|
|
$
|
(127
|
)
|
$
|
953
|
|
$
|
(826
|
)
|
$
|
150
|
|
|||||
|
Other comprehensive income (loss):
|
||||||||||||||||||||
|
Pension and postretirement adjustments, net of tax
|
—
|
|
38
|
|
(50
|
)
|
—
|
|
(12
|
)
|
||||||||||
|
Deferred loss on derivatives, net of tax
|
(9
|
)
|
—
|
|
—
|
|
—
|
|
(9
|
)
|
||||||||||
|
Currency translation adjustments, net of tax
|
(3
|
)
|
—
|
|
96
|
|
—
|
|
93
|
|
||||||||||
|
Unrealized net gain (loss), net of tax
|
—
|
|
62
|
|
(62
|
)
|
—
|
|
—
|
|
||||||||||
|
Total other comprehensive income (loss)
|
(12
|
)
|
100
|
|
(16
|
)
|
—
|
|
72
|
|
||||||||||
|
Comprehensive income (loss)
|
138
|
|
(27
|
)
|
937
|
|
(826
|
)
|
222
|
|
||||||||||
|
Comprehensive income attributable to noncontrolling interest
|
—
|
|
—
|
|
—
|
|
(71
|
)
|
(71
|
)
|
||||||||||
|
Comprehensive income (loss) attributable to Holdings’ shareholders
|
$
|
138
|
|
$
|
(27
|
)
|
$
|
937
|
|
$
|
(897
|
)
|
$
|
151
|
|
|||||
114
SEARS HOLDINGS CORPORATION
Notes to Consolidated Financial Statements—(Continued)
Condensed Consolidating Statement of Cash Flows
For the Year Ended
February 2, 2013
|
millions
|
Parent
|
Guarantor
Subsidiaries |
Non-
Guarantor Subsidiaries |
Eliminations
|
Consolidated
|
|||||||||||||||
|
Net cash provided by (used in) operating activities
|
$
|
—
|
|
$
|
(1,356
|
)
|
$
|
1,053
|
|
$
|
—
|
|
$
|
(303
|
)
|
|||||
|
Proceeds from sales of property and investments
|
—
|
|
353
|
|
179
|
|
—
|
|
532
|
|
||||||||||
|
Net increase in investments and restricted cash
|
—
|
|
—
|
|
37
|
|
—
|
|
37
|
|
||||||||||
|
Purchases of property and equipment
|
—
|
|
(293
|
)
|
(85
|
)
|
—
|
|
(378
|
)
|
||||||||||
|
Net investing with Affiliates
|
—
|
|
—
|
|
(236
|
)
|
236
|
|
—
|
|
||||||||||
|
Net cash provided by (used in) investing activities
|
—
|
|
60
|
|
(105
|
)
|
236
|
|
191
|
|
||||||||||
|
Proceeds from debt issuances
|
—
|
|
—
|
|
5
|
|
—
|
|
5
|
|
||||||||||
|
Repayments of long-term debt
|
—
|
|
(214
|
)
|
(121
|
)
|
—
|
|
(335
|
)
|
||||||||||
|
Increase in short-term borrowings, primarily 90 days or less
|
—
|
|
(81
|
)
|
—
|
|
—
|
|
(81
|
)
|
||||||||||
|
Sears Hometown and Outlet Stores, Inc. pre-separation funding
|
—
|
|
100
|
|
—
|
|
—
|
|
100
|
|
||||||||||
|
Intercompany dividend
|
100
|
|
(100
|
)
|
—
|
|
—
|
|
—
|
|
||||||||||
|
Proceeds from the sale of Sears Hometown and Outlet Stores, Inc.
|
347
|
|
—
|
|
—
|
|
—
|
|
347
|
|
||||||||||
|
Debt issuance costs
|
—
|
|
(3
|
)
|
—
|
|
—
|
|
(3
|
)
|
||||||||||
|
Purchase of Sears Canada shares
|
—
|
|
—
|
|
(10
|
)
|
—
|
|
(10
|
)
|
||||||||||
|
Sears Canada dividend paid to minority shareholders
|
—
|
|
52
|
|
(102
|
)
|
—
|
|
(50
|
)
|
||||||||||
|
Net borrowing with Affiliates
|
(447
|
)
|
1,526
|
|
(843
|
)
|
(236
|
)
|
—
|
|
||||||||||
|
Net cash provided by (used in) financing activities
|
—
|
|
1,280
|
|
(1,071
|
)
|
(236
|
)
|
(27
|
)
|
||||||||||
|
Effect of exchange rate changes on cash and cash equivalents
|
—
|
|
—
|
|
1
|
|
—
|
|
1
|
|
||||||||||
|
NET DECREASE IN CASH AND CASH EQUIVALENTS
|
—
|
|
(16
|
)
|
(122
|
)
|
—
|
|
(138
|
)
|
||||||||||
|
CASH AND CASH EQUIVALENTS, BEGINNING OF YEAR
|
—
|
|
336
|
|
411
|
|
—
|
|
747
|
|
||||||||||
|
CASH AND CASH EQUIVALENTS, END OF YEAR
|
$
|
—
|
|
$
|
320
|
|
$
|
289
|
|
$
|
—
|
|
$
|
609
|
|
|||||
115
SEARS HOLDINGS CORPORATION
Notes to Consolidated Financial Statements—(Continued)
Condensed Consolidating Statement of Cash Flows
For the Year Ended
January 28, 2012
|
millions
|
Parent
|
Guarantor
Subsidiaries |
Non-
Guarantor Subsidiaries |
Eliminations
|
Consolidated
|
|||||||||||||||
|
Net cash provided by (used in) operating activities – continuing operations
|
$
|
—
|
|
$
|
(1,506
|
)
|
$
|
1,199
|
|
$
|
—
|
|
$
|
(307
|
)
|
|||||
|
Net cash provided by operating activities – discontinued operations
|
—
|
|
—
|
|
32
|
|
—
|
|
32
|
|
||||||||||
|
Net cash provided by (used in) operating activities
|
—
|
|
(1,506
|
)
|
1,231
|
|
—
|
|
(275
|
)
|
||||||||||
|
Proceeds from sales of property and investments
|
—
|
|
72
|
|
—
|
|
—
|
|
72
|
|
||||||||||
|
Net increase in investments and restricted cash
|
—
|
|
—
|
|
8
|
|
—
|
|
8
|
|
||||||||||
|
Purchases of property and equipment
|
—
|
|
(342
|
)
|
(90
|
)
|
—
|
|
(432
|
)
|
||||||||||
|
Net investing with Affiliates
|
—
|
|
—
|
|
(275
|
)
|
275
|
|
—
|
|
||||||||||
|
Net cash used in investing activities – continuing operations
|
—
|
|
(270
|
)
|
(357
|
)
|
275
|
|
(352
|
)
|
||||||||||
|
Net cash provided by investing activities – discontinued operations
|
—
|
|
—
|
|
43
|
|
—
|
|
43
|
|
||||||||||
|
Net cash used in investing activities
|
—
|
|
(270
|
)
|
(314
|
)
|
275
|
|
(309
|
)
|
||||||||||
|
Proceeds from debt issuances
|
—
|
|
—
|
|
104
|
|
—
|
|
104
|
|
||||||||||
|
Repayments of long-term debt
|
—
|
|
(481
|
)
|
(130
|
)
|
—
|
|
(611
|
)
|
||||||||||
|
Increase in short-term borrowings, primarily 90 days or less
|
—
|
|
815
|
|
—
|
|
—
|
|
815
|
|
||||||||||
|
Debt issuance costs
|
—
|
|
(35
|
)
|
—
|
|
—
|
|
(35
|
)
|
||||||||||
|
Purchase of Sears Canada shares
|
—
|
|
—
|
|
(43
|
)
|
—
|
|
(43
|
)
|
||||||||||
|
Purchase of treasury stock
|
—
|
|
(183
|
)
|
—
|
|
—
|
|
(183
|
)
|
||||||||||
|
Net borrowing with Affiliates
|
(140
|
)
|
1,190
|
|
(775
|
)
|
(275
|
)
|
—
|
|
||||||||||
|
Net cash provided by (used in) financing activities – continuing operations
|
(140
|
)
|
1,306
|
|
(844
|
)
|
(275
|
)
|
47
|
|
||||||||||
|
Net cash provided by (used in) financing activities – discontinued operations
|
—
|
|
28
|
|
(103
|
)
|
—
|
|
(75
|
)
|
||||||||||
|
Net cash provided by (used in) financing activities
|
(140
|
)
|
1,334
|
|
(947
|
)
|
(275
|
)
|
(28
|
)
|
||||||||||
|
NET DECREASE IN CASH AND CASH EQUIVALENTS
|
(140
|
)
|
(442
|
)
|
(30
|
)
|
—
|
|
(612
|
)
|
||||||||||
|
CASH AND CASH EQUIVALENTS, BEGINNING OF YEAR
|
140
|
|
778
|
|
441
|
|
—
|
|
1,359
|
|
||||||||||
|
CASH AND CASH EQUIVALENTS, END OF YEAR
|
$
|
—
|
|
$
|
336
|
|
$
|
411
|
|
$
|
—
|
|
$
|
747
|
|
|||||
116
SEARS HOLDINGS CORPORATION
Notes to Consolidated Financial Statements—(Continued)
Condensed Consolidating Statement of Cash Flows
For the Year Ended
January 29, 2011
|
millions
|
Parent
|
Guarantor
Subsidiaries |
Non-
Guarantor Subsidiaries |
Eliminations
|
Consolidated
|
|||||||||||||||
|
Net cash provided by (used in) operating activities – continuing operations
|
$
|
—
|
|
$
|
(1,115
|
)
|
$
|
1,192
|
|
$
|
—
|
|
$
|
77
|
|
|||||
|
Net cash provided by operating activities – discontinued operations
|
—
|
|
—
|
|
46
|
|
—
|
|
46
|
|
||||||||||
|
Net cash provided by (used in) operating activities
|
—
|
|
(1,115
|
)
|
1,238
|
|
—
|
|
123
|
|
||||||||||
|
Proceeds from sales of property and investments
|
—
|
|
16
|
|
19
|
|
—
|
|
35
|
|
||||||||||
|
Net (decrease) increase in investments and restricted cash
|
—
|
|
3
|
|
(3
|
)
|
—
|
|
—
|
|
||||||||||
|
Purchases of property and equipment
|
—
|
|
(369
|
)
|
(57
|
)
|
—
|
|
(426
|
)
|
||||||||||
|
Net investing with Affiliates
|
—
|
|
—
|
|
(288
|
)
|
288
|
|
—
|
|
||||||||||
|
Net cash used in investing activities – continuing operations
|
—
|
|
(350
|
)
|
(329
|
)
|
288
|
|
(391
|
)
|
||||||||||
|
Net cash used in investing activities – discontinued operations
|
—
|
|
—
|
|
(15
|
)
|
—
|
|
(15
|
)
|
||||||||||
|
Net cash used in investing activities
|
—
|
|
(350
|
)
|
(344
|
)
|
288
|
|
(406
|
)
|
||||||||||
|
Proceeds from debt issuances
|
1,246
|
|
—
|
|
107
|
|
—
|
|
1,353
|
|
||||||||||
|
Repayments of long-term debt
|
—
|
|
(51
|
)
|
(307
|
)
|
—
|
|
(358
|
)
|
||||||||||
|
Increase in short-term borrowings, primarily 90 days or less
|
—
|
|
35
|
|
—
|
|
—
|
|
35
|
|
||||||||||
|
Debt issuance costs
|
—
|
|
(18
|
)
|
(10
|
)
|
—
|
|
(28
|
)
|
||||||||||
|
Purchase of Sears Canada shares
|
—
|
|
(560
|
)
|
(43
|
)
|
—
|
|
(603
|
)
|
||||||||||
|
Sears Canada dividends paid to minority shareholders
|
—
|
|
639
|
|
(708
|
)
|
(69
|
)
|
||||||||||||
|
Purchase of treasury stock
|
—
|
|
(394
|
)
|
—
|
|
—
|
|
(394
|
)
|
||||||||||
|
Net borrowing with Affiliates
|
(1,106
|
)
|
2,207
|
|
(813
|
)
|
(288
|
)
|
—
|
|
||||||||||
|
Net cash provided by (used in) financing activities – continuing operations
|
140
|
|
1,858
|
|
(1,774
|
)
|
(288
|
)
|
(64
|
)
|
||||||||||
|
Net cash provided by (used in) financing activities – discontinued operations
|
—
|
|
15
|
|
(46
|
)
|
—
|
|
(31
|
)
|
||||||||||
|
Net cash provided by (used in) financing activities
|
140
|
|
1,873
|
|
(1,820
|
)
|
(288
|
)
|
(95
|
)
|
||||||||||
|
Effect of exchange rate changes on cash and cash equivalents
|
—
|
|
—
|
|
57
|
|
—
|
|
57
|
|
||||||||||
|
NET INCREASE (DECREASE) IN CASH AND CASH EQUIVALENTS
|
140
|
|
408
|
|
(869
|
)
|
—
|
|
(321
|
)
|
||||||||||
|
CASH AND CASH EQUIVALENTS, BEGINNING OF YEAR
|
—
|
|
370
|
|
1,310
|
|
—
|
|
1,680
|
|
||||||||||
|
CASH AND CASH EQUIVALENTS, END OF YEAR
|
$
|
140
|
|
$
|
778
|
|
$
|
441
|
|
$
|
—
|
|
$
|
1,359
|
|
|||||
117
Sears Holdings Corporation
Schedule II-Valuation and Qualifying Accounts
Years
2012
,
2011
and
2010
|
millions
|
Balance at
beginning of period |
Additions
charged to costs and expenses |
(Deductions)
|
Balance at
end of period |
||||||||||||
|
Allowance for Doubtful Accounts
(1)
:
|
|
|
|
|
||||||||||||
|
2012
|
$
|
28
|
|
$
|
5
|
|
$
|
(5
|
)
|
$
|
28
|
|
||||
|
2011
|
35
|
|
1
|
|
(8
|
)
|
28
|
|
||||||||
|
2010
|
38
|
|
7
|
|
(10
|
)
|
35
|
|
||||||||
|
Allowance for Deferred Tax Assets
(2)
:
|
|
|
|
|
|
|
|
|
||||||||
|
2012
|
2,268
|
|
531
|
|
(56
|
)
|
2,743
|
|
||||||||
|
2011
|
153
|
|
2,118
|
|
(3
|
)
|
2,268
|
|
||||||||
|
2010
|
131
|
|
27
|
|
(5
|
)
|
153
|
|
||||||||
__________________
|
(1)
|
Charges to the account are for the purposes for which the reserves were created.
|
|
(2)
|
At the end of 2011 we had a federal and state net operating loss (“NOL”) deferred tax asset of
$672 million
and a valuation allowance of
$2,268 million
. In 2012, there was a net increase to the federal and state NOL deferred tax asset of
$50 million
, bringing the ending balance to
$722 million
. The increase in NOLs resulted from federal utilization and state NOL expirations, netted against additional state losses incurred during 2012. The valuation allowance increased to
$2,743 million
at the end of 2012. Included in the 2012 increase was
$213 million
recorded to other accumulated comprehensive income for minimum pension adjustments. Additional valuation allowances for federal and state were created against expiring state NOLs and other deferred assets, and were netted against state valuation allowance reversals due to expiring state NOLs and federal utilization of NOLs.
|
118
MANAGEMENT'S ANNUAL REPORT ON INTERNAL CONTROL OVER FINANCIAL REPORTING
The management of Sears Holdings Corporation is responsible for establishing and maintaining adequate internal control over financial reporting. Internal control over financial reporting is a process designed by, or under the supervision of, the Company's principal executive and principal financial officers and effected by the Company's board of directors, management and other personnel to provide reasonable assurance regarding the reliability of financial reporting and the preparation of financial statements for external purposes in accordance with generally accepted accounting principles and includes those policies and procedures that:
|
•
|
pertain to the maintenance of records that in reasonable detail accurately and fairly reflect the transactions and dispositions of the assets of the Company;
|
|
•
|
provide reasonable assurance that transactions are recorded as necessary to permit preparation of financial statements in accordance with generally accepted accounting principles, and that receipts and expenditures of the Company are being made only in accordance with authorizations of management and directors of the Company; and
|
|
•
|
provide reasonable assurance regarding prevention or timely detection of unauthorized acquisition, use or disposition of the Company's assets that could have a material effect on the financial statements.
|
Because of inherent limitations, internal control over financial reporting may not prevent or detect misstatements. Projections of any evaluation of effectiveness to future periods are subject to the risks that controls may become inadequate because of changes in conditions, or that the degree of compliance with the policies or procedures may deteriorate.
Management assessed the effectiveness of the Company's internal control over financial reporting at
February 2, 2013
. In making its assessment, management used the criteria set forth in the
Internal Control-Integrated Framework
issued by the Committee of Sponsoring Organizations of the Treadway Commission (“COSO”). The assessment included the documentation and understanding of the Company's internal control over financial reporting. Management evaluated the design effectiveness and tested the operating effectiveness of internal controls over financial reporting to form its conclusion.
Based on this evaluation, management concluded that, at
February 2, 2013
, the Company's internal control over financial reporting is effective to provide reasonable assurance that the Company's financial statements are fairly presented in conformity with generally accepted accounting principles.
Deloitte & Touche LLP, independent registered public accounting firm, has reported on the effectiveness of the Company's internal control over financial reporting at
February 2, 2013
, as stated in their report included herein.
119
REPORT OF INDEPENDENT REGISTERED PUBLIC ACCOUNTING FIRM
To the Board of Directors and Shareholders of Sears Holdings Corporation
Hoffman Estates, Illinois
We have audited the accompanying consolidated balance sheets of Sears Holdings Corporation and subsidiaries (the “Company”) as of
February 2, 2013
and
January 28, 2012
, and the related consolidated statements of operations, comprehensive income (loss), equity, and cash flows for each of the three years in the period ended
February 2, 2013
. Our audits also included the consolidated financial statement schedule listed in the Index at Item 8. We also have audited the Company's internal control over financial reporting as of
February 2, 2013
, based on criteria established in
Internal Control—Integrated Framework
issued by the Committee of Sponsoring Organizations of the Treadway Commission. The Company's management is responsible for these financial statements and financial statement schedule, for maintaining effective internal control over financial reporting, and for its assessment of the effectiveness of internal control over financial reporting, included in the accompanying Management's Annual Report on Internal Control Over Financial Reporting. Our responsibility is to express an opinion on these financial statements and financial statement schedules and an opinion on the Company's internal control over financial reporting based on our audits.
We conducted our audits in accordance with the standards of the Public Company Accounting Oversight Board (United States). Those standards require that we plan and perform the audit to obtain reasonable assurance about whether the financial statements are free of material misstatement and whether effective internal control over financial reporting was maintained in all material respects. Our audits of the financial statements included examining, on a test basis, evidence supporting the amounts and disclosures in the financial statements, assessing the accounting principles used and significant estimates made by management, and evaluating the overall financial statement presentation. Our audit of internal control over financial reporting included obtaining an understanding of internal control over financial reporting, assessing the risk that a material weakness exists, testing and evaluating the design and operating effectiveness of internal control based on the assessed risk. Our audits also included performing such other procedures as we considered necessary in the circumstances. We believe that our audits provide a reasonable basis for our opinions.
A company's internal control over financial reporting is a process designed by, or under the supervision of, the company's principal executive and principal financial officers, or persons performing similar functions, and effected by the company's board of directors, management, and other personnel to provide reasonable assurance regarding the reliability of financial reporting and the preparation of financial statements for external purposes in accordance with generally accepted accounting principles. A company's internal control over financial reporting includes those policies and procedures that (1) pertain to the maintenance of records that, in reasonable detail, accurately and fairly reflect the transactions and dispositions of the assets of the company; (2) provide reasonable assurance that transactions are recorded as necessary to permit preparation of financial statements in accordance with generally accepted accounting principles and that receipts and expenditures of the company are being made only in accordance with authorizations of management and directors of the company; and (3) provide reasonable assurance regarding prevention or timely detection of unauthorized acquisition, use, or disposition of the company's assets that could have a material effect on the financial statements.
Because of the inherent limitations of internal control over financial reporting, including the possibility of collusion or improper management override of controls, material misstatements due to error or fraud may not be prevented or detected on a timely basis. Also, projections of any evaluation of the effectiveness of the internal control over financial reporting to future periods are subject to the risk that the controls may become inadequate because of changes in conditions, or that the degree of compliance with the policies or procedures may deteriorate.
In our opinion, the consolidated financial statements referred to above present fairly, in all material respects, the financial position of the Sears Holdings Corporation and subsidiaries as of
February 2, 2013
and
January 28, 2012
, and the results of their operations and their cash flows for each of the three years in the period ended
February 2, 2013
, in conformity with accounting principles generally accepted in the United States of America. Also, in our opinion, such financial statement schedule, when considered in relation to the basic consolidated financial statements taken as a whole, present fairly, in all material respects, the information set forth therein. Also, in our opinion, the Company maintained, in all material respects, effective internal control over financial reporting at
120
February 2, 2013
, based on the criteria established in
Internal Control—Integrated Framework
issued by the Committee of Sponsoring Organizations of the Treadway Commission.
As disclosed in Note 1 to the Consolidated Financial Statements, the Company completed the spin-off of Orchard Supply Hardware Stores Corporation during 2011.
|
/s/ DELOITTE & TOUCHE LLP
|
Deloitte & Touche LLP
Chicago, Illinois
March 19, 2013
121
SEARS HOLDINGS CORPORATION
|
Item 9.
|
Changes in and Disagreements with Accountants on Accounting and Financial Disclosure
|
None.
Our management, with the participation of our principal executive and financial officers, conducted an evaluation of the effectiveness of the design and operation of our disclosure controls and procedures, as defined in Rule 13a-15(e) under the Securities Exchange Act of 1934, as amended (the “Exchange Act”), as of the end of the period covered by this report (the “Evaluation Date”). Based on this evaluation, the principal executive and financial officers concluded that, as of the Evaluation Date, our disclosure controls and procedures were effective in ensuring that information required to be disclosed by us in the reports that we file or submit under the Exchange Act (i) is recorded, processed, summarized and reported within the time periods specified in the SEC’s rules and forms and (ii) is accumulated and communicated to our management, including our principal executive and financial officers, as appropriate to allow timely decisions regarding required disclosure.
In addition, based on that evaluation, no changes in our internal control over financial reporting have occurred during our last quarter that have materially affected, or are reasonably likely to materially affect, our internal control over financial reporting.
|
Item 9B.
|
Other Information
|
On March 18, 2013, the Compensation Committee of Holdings' Board of Directors (the “Board”) and the Board, with Edward S. Lampert recusing himself, approved the terms of an offer letter with Mr. Lampert under which he will continue to serve as the Company's Chief Executive Officer. Under the offer letter, Mr. Lampert will be paid an annual base salary of $1, effective as of February 1, 2013, the date on which Mr. Lampert began to serve as our Chief Executive Officer. In addition, during each of the first three years of Mr. Lampert's service as our Chief Executive Officer, Mr. Lampert will (1) participate in the Company's Annual Incentive Plan, with a target incentive opportunity of $2,000,000, payouts under which (if any) may be paid, at Mr. Lampert's election, in cash or in common stock of Holdings, and (2) receive Holdings common stock with value of $4,500,000 per annum, payable in equal monthly installments subject to his continued service as Chief Executive Officer. The number of shares issued to Mr. Lampert will be based on the value of Holdings' common stock on March 18, 2013 for shares issued through January 31, 2014, and on the February 1
st
of each successive 12-month period of his employment. To the extent there is not a sufficient number of shares available under the Company's equity plans to make any award contemplated under Mr. Lampert's offer letter, Mr. Lampert will be entitled to receive compensation of substantially equivalent economic value in such form as the Company and Mr. Lampert agree upon. Mr. Lampert's primary place of employment will be located in the Miami, Florida metropolitan area. He is not eligible to participate in the Company's long-term incentive programs. Mr. Lampert is not entitled to severance benefits if his employment with the Company is terminated for any reason, and has not entered into a severance agreement with the Company.
122
|
Item 10.
|
Directors, Executive Officers and Corporate Governance
|
Information required by Item 10 with respect to directors, the audit committee, audit committee financial experts and Section 16(a) beneficial ownership reporting compliance is included under the headings “Item 1. Election of Directors,” “Committees of the Board of Directors,” “Director Independence” and “Section 16(a) Beneficial Ownership Reporting Compliance” of our definitive proxy statement for our annual meeting of stockholders to be held on May 1, 2013 (the “2013 Proxy Statement.”) and is incorporated herein by reference.
The information required by this Item 10 regarding the Company's executive officers is set forth under the heading “Executive Officers of the Registrant” in Part I of this Form 10-K and is incorporated herein by reference.
Holdings has adopted a Code of Conduct, which applies to all employees, including our principal executive officer, principal financial officer and principal accounting officer, and a Code of Conduct for its Board of Directors. Directors who are also officers of Holdings are subject to both codes of conduct. Each code of conduct is a code of ethics as defined in Item 406 of SEC Regulation S-K. The codes of conduct are available on the Corporate Governance section of our website at
www.searsholdings.com.
Any amendment to, or waiver from, a provision of the codes of conduct will be posted to the above-referenced website.
There were no changes to the process by which stockholders may recommend nominees to the Board of Directors during the last year.
|
Item 11.
|
Executive Compensation
|
Information regarding executive and director compensation is incorporated by reference to the material under the headings “Executive Compensation,” “Compensation of Directors,” and “Compensation Committee Report” of the 2013 Proxy Statement.
|
Item 12.
|
Security Ownership of Certain Beneficial Owners and Management and Related Stockholder Matters
|
Information regarding security ownership of certain beneficial owners and management is incorporated herein by reference to the material under the heading “Amount and Nature of Beneficial Ownership” of the 2013 Proxy Statement.
See also “Equity Compensation Plan Information” in Item 5 of this Report for a discussion of securities authorized for issuance under equity compensation plans.
|
Item 13.
|
Certain Relationships and Related Transactions, and Director Independence
|
Information regarding certain relationships and related transactions and director independence is incorporated herein by reference to the material under the headings “Certain Relationships and Transactions,” “Review and Approval of Transactions with Related Persons” and “Corporate Governance” of the 2013 Proxy Statement.
|
Item 14.
|
Principal Accountant Fees and Services
|
Information regarding principal accountant fees and services is incorporated herein by reference to the material under the heading “Independent Registered Public Accounting Firm Fees” of the 2013 Proxy Statement.
123
|
Item 15.
|
Exhibits and Financial Statement Schedules
|
|
(a)
|
The following documents are filed as part of this report:
|
|
1.
|
Financial Statements
|
Financial statements filed as part of this Form 10-K are listed under Item 8.
|
2.
|
Financial Statement Schedule
|
The financial statement schedule filed as part of this Form 10-K is listed under Item 8.
The separate financial statements and summarized financial information of majority-owned subsidiaries not consolidated and of 50% or less owned persons have been omitted because they are not required pursuant to conditions set forth in Rules 3-09 and 1-02(w) of Regulation S-X.
All other schedules have been omitted because they are not required under the instructions contained in Regulation S-X because the information called for is contained in the financial statements and notes thereto.
|
(b)
|
Exhibits
|
An “Exhibit Index” has been filed as part of this Report beginning on Page E-1 and is incorporated herein by this reference.
Certain of the agreements incorporated by reference into this report contain representations and warranties and other agreements and undertakings by us and third parties. These representations and warranties, agreements and undertakings have been made as of specific dates, may be subject to important qualifications and limitations agreed to by the parties to the agreement in connection with negotiating the terms of the agreement, and have been included in the agreement for the purpose of allocating risk between the parties to the agreement rather than to establish matters as facts. Any such representations and warranties, agreements, and undertakings have been made solely for the benefit of the parties to the agreement and should not be relied upon by any other person.
124
SIGNATURES
Pursuant to the requirements of Section 13 or 15(d) of the Securities Exchange Act of 1934, the registrant has duly caused this report to be signed on its behalf by the undersigned, thereunto duly authorized.
|
S
EARS
H
OLDINGS
C
ORPORATION
|
|
|
By:
|
/S/
R
OBERT
A. R
IECKER
|
|
Name:
|
Robert A. Riecker
|
|
Title:
|
Vice President, Controller and
Chief Accounting Officer
|
|
Date: March 19, 2013
|
|
Pursuant to the requirements of the Securities Exchange Act of 1934, this report has been signed below by the following persons on behalf of the registrant and in the capacities stated and on the dates indicated.
|
* E
DWARD
S. L
AMPERT
|
Director, Chairman of the Board of Directors, and Chief Executive Officer (principal executive officer)
|
March 19, 2013
|
|
|
Edward S. Lampert
|
|
||
|
* R
OBERT
A. S
CHRIESHEIM
|
Executive Vice President and Chief Financial Officer (principal financial officer)
|
March 19, 2013
|
|
|
Robert A. Schriesheim
|
|
||
|
* R
OBERT
A. R
IECKER
|
Vice President, Controller and Chief Accounting Officer (principal accounting officer)
|
March 19, 2013
|
|
|
Robert A. Riecker
|
|
||
|
* L
OUIS
J. D'
AMBROSIO
|
Director
|
March 19, 2013
|
|
|
Louis J. D'Ambrosio
|
|
|
|
|
* P
AUL
G. D
E
P
ODESTA
|
Director
|
March 19, 2013
|
|
|
Paul G. DePodesta
|
|
|
|
|
* W
ILLIAM
C. K
UNKLER
, III
|
Director
|
March 19, 2013
|
|
|
William C. Kunkler, III
|
|
|
|
|
* S
TEVEN
T. M
NUCHIN
|
Director
|
March 19, 2013
|
|
|
Steven T. Mnuchin
|
|
|
|
|
* A
NN
N. R
EESE
|
Director
|
March 19, 2013
|
|
|
Ann N. Reese
|
|
|
|
|
* E
MILY
S
COTT
|
Director
|
March 19, 2013
|
|
|
Emily Scott
|
|
|
|
|
* T
HOMAS
J. T
ISCH
|
Director
|
March 19, 2013
|
|
|
Thomas J. Tisch
|
|
|
|
|
By
|
/S/
R
OBERT
A. R
IECKER
|
|
|
|
|
* Robert A. Riecker
|
|
|
|
|
Individually and as Attorney-in-fact
|
|
|
125
EXHIBIT INDEX
|
3.1
|
|
Restated Certificate of Incorporation (incorporated by reference to Exhibit 3.1 to Registrant's Current Report on Form 8-K, dated March 24, 2005, filed on March 24, 2005 (File No. 000-51217)).
|
|
|
3.2
|
|
Amended and Restated By-Laws (incorporated by reference to Exhibit 3.2 to Registrant's Current Report on Form 8-K, dated December 2, 2009, filed on December 4, 2009 (File No. 000-51217)).
|
|
|
4.1
|
|
Registrant hereby agrees to furnish to the Commission, upon request, the instruments defining the rights of holders of each issue of long-term debt of Registrant and its consolidated subsidiaries.
|
|
|
4.2
|
|
Indenture, dated as of October 12, 2010, among Sears Holdings Corporation, the guarantors party thereto and Wells Fargo Bank, National Association, as Trustee and Collateral Agent (incorporated by reference to Exhibit 4.1 to Registrant's Current Report on Form 8-K, dated October 12, 2010, filed on October 15, 2010 (File No. 000-51217)).
|
|
|
4.3
|
|
Security Agreement, dated as of October 12, 2010, among Sears Holdings Corporation, the guarantors party thereto and Wells Fargo Bank, National Association, as Collateral Agent (incorporated by reference to Exhibit 4.2 to Registrant's Current Report on Form 8-K, dated October 12, 2010, filed on October 15, 2010 (File No. 000-51217)).
|
|
|
4.4
|
|
Intercreditor Agreement, dated as of October 12, 2010, among Bank of America, N.A., Wells Fargo Retail Finance, LLC and General Electric Capital Corporation, as ABL Agents, and Wells Fargo Bank, National Association, as Second Lien Agent (incorporated by reference to Exhibit 4.3 to Registrant's Current Report on Form 8-K, dated October 12, 2010, filed on October 15, 2010 (File No. 000-51217)).
|
|
|
4.5
|
|
Registration Rights Agreement, dated as of October 12, 2010, by and among Sears Holdings Corporation and the guarantors party thereto and Banc of America Securities LLC (incorporated by reference to Exhibit 4.4 to Registrant's Current Report on Form 8-K, dated October 12, 2010, filed on October 15, 2010 (File No. 000-51217)).
|
|
|
4.6
|
|
Registration Rights Agreement, dated as of October 12, 2010, by and among Sears Holdings Corporation and the guarantors party thereto, Sears Holdings Corporation Investment Committee on behalf of the Sears Holdings Pension Plan and Sears Holdings Pension Trust (incorporated by reference to Exhibit 4.5 to Registrant's Current Report on Form 8-K, dated October 12, 2010, filed on October 15, 2010 (File No. 000-51217)).
|
|
|
10.1
|
|
Guarantee executed by Sears, Roebuck and Co. under the Indenture, dated as of May 15, 1995, between Sears Roebuck Acceptance Corp. and JP Morgan Chase Bank (successor to The Chase Manhattan Bank, N.A.), as supplemented by the First Supplemental Indenture, dated as of November 3, 2003 (incorporated by reference to Exhibit 4(g) to Sears Roebuck Acceptance Corp.'s Quarterly Report on Form 10-Q for the fiscal quarter ended September 27, 2003 (File No. 1-4040)).
|
|
|
10.2
|
|
Guarantee executed by Sears, Roebuck and Co. under the Indenture, dated as of October 1, 2002, between Sears Roebuck Acceptance Corp. and BNY Midwest Trust Company, as supplemented by the First Supplemental Indenture, dated as of November 3, 2003 (incorporated by reference to Exhibit 4(h) to Sears Roebuck Acceptance Corp.'s Quarterly Report on Form 10-Q for the fiscal quarter ended September 27, 2003 (File No. 1-4040)).
|
|
|
10.3
|
|
Guarantee dated as of November 3, 2003 by Sears, Roebuck and Co. of the commercial paper master notes of Sears Roebuck Acceptance Corp. (incorporated by reference to Exhibit 10.38 to Sears, Roebuck and Co.'s Annual Report on Form 10-K for the fiscal year ended January 3, 2004 (File No. 1-416)).
|
|
E-1
|
10.4
|
|
Second Amended and Restated Credit Agreement, dated as of April 8, 2011, among Sears Holdings Corporation, Sears Roebuck Acceptance Corp., Kmart Corporation, the lenders party thereto, Wells Fargo Bank, National Association and General Electric Capital Corporation, as Co-Collateral Agents, Wells Fargo Capital Finance, LLC and General Electric Capital Corporation, as Co-Syndication Agents, Barclays Bank PLC, JPMorgan Chase Bank, N.A. and Citigroup Global Markets Inc. as Co-Documentation Agents, and Bank of America, N.A. as Agent, Co-Collateral Agent and Swingline Lender (incorporated by reference to Exhibit 10.3 to Registrant's Quarterly Report on Form 10-Q for the fiscal quarter ended April 30, 2011 (File No. 000-51217)).
(1)
|
|
|
10.5
|
|
Second Amended and Restated Guarantee and Collateral Agreement, dated as of April 8, 2011, among Sears Holdings Corporation, Sears, Roebuck and Co., Sears Roebuck Acceptance Corp., Kmart Holding Corporation, Kmart Corporation and certain of their respective subsidiaries, as Grantors, and Bank of America, N.A., Wells Fargo Bank, National Association and General Electric Capital Corporation, as Co-Collateral Agents (incorporated by reference to Exhibit 10.4 to Registrant's Quarterly Report on Form 10-Q for the fiscal quarter ended April 30, 2011 (File No. 000-51217)).
|
|
|
10.6
|
|
Purchase, Sale and Servicing Transfer Agreement, dated as of July 15, 2003, by and among Sears, Roebuck and Co., certain subsidiaries of Sears, Roebuck and Co. and Citicorp (incorporated by reference to Exhibit 10.1 to Sears, Roebuck and Co.'s Current Report on Form 8-K, dated July 15, 2003, filed on July 17, 2003 (File No. 1-416)).
|
|
|
10.7
|
|
Amendment No. 1, dated as of November 3, 2003, to the Purchase, Sale and Servicing Transfer Agreement, by and among Sears, Roebuck and Co., certain subsidiaries of Sears, Roebuck and Co. and Citicorp (incorporated by reference to Exhibit 2(b) to Sears, Roebuck and Co.'s Quarterly Report on Form 10-Q for the fiscal quarter ended September 27, 2003 (File No. 1-416)).
|
|
|
10.8
|
|
Amended and Restated Program Agreement, dated as of July 15, 2003, amended and restated as of November 3, 2003, by and between Sears, Roebuck and Co., Sears Intellectual Property Management Company and Citibank (USA) N.A. (incorporated by reference to Exhibit 10(a) to Sears, Roebuck and Co.'s Quarterly Report on Form 10-Q for the fiscal quarter ended September 27, 2003 (File No. 1-416).
|
|
|
10.9
|
|
Terms Sheet For Revision of Program Agreement Between Sears, Roebuck and Co. and Citibank USA, N.A., dated April 29, 2005 (incorporated by reference to Exhibit 10.40 to Registrant's Quarterly Report on Form 10-Q for the fiscal quarter ended April 30, 2005 (File No. 000-51217)).
|
|
|
10.10
|
|
Sears Holdings Corporation Director Compensation Program, as amended (incorporated by reference to Exhibit 10.5 to Registrant's Quarterly Report on Form 10-Q for the fiscal quarter ended May 1, 2010 (File No. 000-51217)).**
|
|
|
10.11
|
|
Sears Holdings Corporation 2006 Stock Plan, as amended (incorporated by reference to Appendix C to Registrant's Proxy Statement dated March 15, 2006 (File No. 00051217)).**
|
|
|
10.12
|
|
Sears Holdings Corporation Umbrella Incentive Program (Amended and Restated Effective March 7, 2012) (incorporated by reference to Appendix A to Registrant's Proxy Statement dated March 16, 2012 (File No. 000-51217)).**
|
|
|
10.13
|
|
Form of Sears Holdings Corporation Restricted Stock Award Agreement (incorporated by reference to Exhibit 10.44 to Registrant's Annual Report on Form 10-K for the fiscal year ended February 3, 2007 (the “2006 10-K”)) (File No. 000-51217).**
|
|
|
10.14
|
|
Form of Sears Holdings Corporation Restricted Stock Award Agreement (incorporated by reference to Exhibit 10.14 to Registrant's Annual Report on Form 10-K for the fiscal year ended January 30, 2010 (the “2009 10-K”))**
|
|
|
10.15
|
|
Form of Sears Holdings Corporation Restricted Stock Award Agreement (incorporated by reference to Exhibit 10.1 to Registrant's Quarterly Report on Form 10-Q for the fiscal quarter ended July 30, 2011(File No. 000-51217)).**
|
|
|
10.16
|
|
Form of Cash Right - Addendum to Restricted Stock Award Agreement (incorporated by reference to Exhibit 10.17 to Registrant's Annual Report on Form 10-K for the fiscal year ended January 28, 2012 (the “2011 10-K”)).**
|
|
E-2
|
10.17
|
|
Form of Cash Award - Addendum to Restricted Stock Award Agreement (incorporated by reference to Exhibit 10.1 to Registrant's Current Report on Form 8-K, dated September 28, 2012, filed on September 28, 2012 (File No. 000-51217)).**
|
|
|
10.18
|
|
Form of Cash Award - Addendum to Restricted Stock Award Agreement (incorporated by reference to Exhibit 10.1 to Registrant's Current Report on Form 8-K, dated November 30, 2012, filed on November 30, 2012 (File No. 000-51217)).**
|
|
|
10.19
|
|
Form of LTIP Award Agreement (incorporated by reference to Exhibit 10.45 to the 2006 10-K) (File No. 000-51217).**
|
|
|
10.20
|
|
Sears Holdings Corporation 2010 Long-Term Incentive Program (incorporated by reference to Exhibit 10.2 to Registrant's Quarterly Report on Form 10-Q for the fiscal quarter ended May 1, 2010 (File No. 000-51217)).**
|
|
|
10.21
|
|
Sears Holdings Corporation Long-Term Incentive Program, effective April 27, 2011 (incorporated by reference to Exhibit 10.2 to Registrant's Quarterly Report on Form 10-Q for the fiscal quarter ended April 30, 2011 (File No. 000-51217)).**
|
|
|
10.22
|
|
2012 Additional Definitions under the Sears Holdings Corporation Long-Term Incentive Program (incorporated by reference to Exhibit 99.1 to Registrant's Current Report on Form 8-K, dated September 15, 2012, filed on September 20, 2012 (File No. 000-51217)).**
|
|
|
10.23
|
|
2013 Additional Definitions under Sears Holdings Corporation Long-Term Incentive Program (Amended and Restated Effective February 12, 2013) (incorporated by reference to Exhibit 10.3 to Registrant's Current Report on Form 8-K, dated February 12, 2013, filed on February 19, 2013 (File No. 000-51217)).**
|
|
|
10.24
|
|
Sears Holdings Corporation Cash Long-Term Incentive Plan (Effective February 12, 2013) (incorporated by reference to Exhibit 10.4 to Registrant's Current Report on Form 8-K, dated February 12, 2013, filed on February 19, 2013 (File No. 000-51217)).**
|
|
|
10.25
|
|
Sears Holdings Corporation Annual Incentive Plan, Amended and Restated Effective March 7, 2012 (incorporated by reference to Exhibit 10.1 to Registrant's Quarterly Report on Form 10-Q for the fiscal quarter ended April 28, 2012 (File No. 000-51217)).**
|
|
|
10.26
|
|
2012 Additional Definitions Under Sears Holdings Corporation Annual Incentive Plan (incorporated by reference to Exhibit 10.2 to Registrant's Quarterly Report on Form 10-Q for the fiscal quarter ended April 28, 2012 (File No. 000-51217)).**
|
|
|
10.27
|
|
Sears Holdings Corporation Annual Incentive Plan (Amended and Restated Effective February 12, 2013) (incorporated by reference to Exhibit 10.1 to Registrant's Current Report on Form 8-K, dated February 12, 2013, filed on February 19, 2013 (File No. 000-51217)).**
|
|
|
10.28
|
|
2013 Additional Definitions under Sears Holdings Corporation Annual Incentive Plan (Amended and Restated Effective February 12, 2013) (incorporated by reference to Exhibit 10.2 to Registrant's Current Report on Form 8-K, dated February 12, 2013, filed on February 19, 2013 (File No. 000-51217)).**
|
|
|
10.29
|
|
Form of Executive Severance Agreement (incorporated by reference to Exhibit 10.26 to the 2011 10-K).**
|
|
|
*10.30
|
|
Form of letter from Registrant to Edward S. Lampert relating to employment dated March 18, 2013.**
|
|
|
10.31
|
|
Letter from Registrant to Louis J. D'Ambrosio relating to employment dated February 23, 2011 (incorporated by reference to Exhibit 10.1 to Registrant's Current Report on Form 8-K, dated February 23, 2011, filed on February 25, 2011 (File No. 000-51217)).**
|
|
|
*10.32
|
|
Letter Agreement between Registrant and Louis J. D'Ambrosio dated January 7, 2013 and amendment thereto dated January 14, 2013.**
|
|
|
10.33
|
|
Letter from Registrant to Ronald D. Boire relating to employment dated February 10, 2012 (incorporated by reference to Exhibit 10.38 to the 2011 10-K).**
|
|
E-3
|
10.34
|
|
Executive Severance Agreement, dated and effective as of January 8, 2012, between Sears Holdings Corporation and its affiliates and subsidiaries and Ronald D. Boire (incorporated by reference to Exhibit 10.39 to the 2011 10-K).**
(1)
|
|
|
*10.35
|
|
Letter from Registrant to Imran Jooma relating to employment dated December 20, 2011.**
|
|
|
*10.36
|
|
Letter from Registrant to Imran Jooma relating to employment dated February 5, 2013.**
|
|
|
10.37
|
|
Letter from Registrant to Robert A. Schriesheim relating to employment dated August 15, 2011 (incorporated by reference to Exhibit 10.2 to Registrant's Quarterly Report on Form 10-Q for the fiscal quarter ended July 30, 2011(File No. 000-51217)).**
|
|
|
10.38
|
|
Executive Severance Agreement, dated and effective as of August 16, 2011, between Sears Holdings Corporation and its affiliates and subsidiaries and Robert A. Schriesheim (incorporated by reference to Exhibit 10.3 to Registrant's Quarterly Report on Form 10-Q for the fiscal quarter ended July 30, 2011(File No. 000-51217)).**
(1)
|
|
|
10.39
|
|
Letter from Registrant to Dane A. Drobny relating to employment dated April 30, 2010 (incorporated by reference to Exhibit 10.38 to Registrant's Annual Report on Form 10-K for the fiscal year ended January 29, 2011).**
|
|
|
*10.40
|
|
Letter from Registrant to Dane A. Drobny relating to employment dated February 5, 2013.**
|
|
|
*12
.11
|
|
Computation of ratio of earnings to fixed charges for Registrant and consolidated subsidiaries.
|
|
|
*21
.11
|
|
Subsidiaries of the Registrant.
|
|
|
*23
.11
|
|
Consent of Deloitte & Touche LLP.
|
|
|
*24
.11
|
|
Powers of Attorney of certain officers and directors of Registrant.
|
|
|
*31.1
11
|
|
Certifications of Chief Executive Officer Pursuant to Section 302 of the Sarbanes-Oxley Act of 2002.
|
|
|
*31.2
11
|
|
Certifications of Chief Financial Officer Pursuant to Section 302 of the Sarbanes-Oxley Act of 2002.
|
|
|
*32
.11
|
|
Certification of Chief Executive Officer and Chief Financial Officer Pursuant to 18 U.S.C. Section 1350, as adopted pursuant to Section 906 of the Sarbanes-Oxley Act of 2002.
|
|
|
101
.11
|
|
The following financial information from the Annual Report on Form 10-K for the year ended February 2, 2013, formatted in XBRL (eXtensible Business Reporting Language) and furnished electronically herewith: (i) the Consolidated Statements of Operations for the years ended February 2, 2013, January 28, 2012 and January 29, 2011; (ii) the Consolidated Statements of Comprehensive Income (Loss) for the years ended February 2, 2013, January 28, 2012 and January 29, 2011; (iii) the Consolidated Balance Sheets at February 2, 2013 and January 28, 2012; (iv) the Consolidated Statements of Cash Flows for the years ended February 2, 2013, January 28, 2012 and January 29, 2011; (v) the Consolidated Statements of Equity for the years ended February 2, 2013, January 28, 2012 and January 29, 2011; and (vi) the Notes to Consolidated Financial Statements, tagged as blocks of text.
|
|
__________________
|
*
|
Filed herewith
|
|
**
|
A management contract or compensatory plan or arrangement required to be filed as an exhibit to this report pursuant to Item 15(b) of Form 10-K.
|
|
(1)
|
Confidential treatment was granted as to omitted portions of this Exhibit. The omitted material has been filed separately with the Securities and Exchange Commission.
|
E-4
TABLE OF CONTENTS
Part IItem 1. BusinessItem 1A. Risk FactorsItem 1B. Unresolved Staff CommentsItem 2. PropertiesItem 3. Legal ProceedingsItem 4. Mine Safety DisclosuresPart IIItem 5. Market For Registrant's Common Equity, Related Stockholder Matters and Issuer Purchases Of Equity SecuritiesItem 6. Selected Financial DataItem 7. Management's Discussion and Analysis Of Financial Condition and Results Of OperationsItem 7A. Quantitative and Qualitative Disclosures About Market RiskItem 8. Financial Statements and Supplementary DataNote 1 Summary Of Signficant Accounting PoliciesNote 2 Sears CanadaNote 3 BorrowingsNote 4 Derivative Financial Instruments and Financial GuaranteesNote 5 Fair Value Of Financial Assets and LiabilitiesNote 6 Interest and Investment IncomeNote 7 Benefit PlansNote 8 Earnings Per ShareNote 9 EquityNote 10 Income TaxesNote 11 Real Estate TransactionsNote 12 Goodwill and Intangible AssetsNote 13 Store Closing Charges, Severance Costs and ImpairmentsNote 14 LeasesNote 15 Related Party DisclosureNote 16 Supplemental Financial InformationNote 17 Summary Of Segment DataNote 18 Legal ProceedingsNote 19 Quarterly Financial Information (unaudited)Note 20 Guarantor/non-guarantor Subsidiary Financial InformationItem 9. Changes in and Disagreements with Accountants on Accounting and Financial DisclosureItem 9A. Controls and ProceduresItem 9B. Other InformationPart IIIItem 10. Directors, Executive Officers and Corporate GovernanceItem 11. Executive CompensationItem 12. Security Ownership Of Certain Beneficial Owners and Management and Related Stockholder MattersItem 13. Certain Relationships and Related Transactions, and Director IndependenceItem 14. Principal Accountant Fees and ServicesPart IVItem 15. Exhibits and Financial Statement Schedules