Securities and Exchange Commission
Washington, D.C. 20549
FORM 10-K
|
x
|
Annual Report Pursuant to Section 13 or 15(d) of the Securities Exchange Act of 1934
|
For the Fiscal Year Ended
February 3, 2018
or
|
o
|
Transition Report Pursuant to Section 13 or 15(d) of the Securities Exchange Act of 1934
|
Commission file number 000-51217, 001-36693
SEARS HOLDINGS CORPORATION
(Exact Name of Registrant as Specified in Its Charter)
|
Delaware
|
|
20-1920798
|
|
(State of Incorporation)
|
|
(I.R.S. Employer Identification No.)
|
|
3333 Beverly Road, Hoffman Estates, Illinois
|
|
60179
|
|
(Address of principal executive offices)
|
|
(Zip Code)
|
Registrant’s Telephone Number, Including Area Code: (847) 286-2500
Securities registered pursuant to Section 12(b) of the Act:
|
Title of each class
|
Name of Each Exchange on Which Registered
|
|
|
Common Stock, par value $0.01 per share
|
The NASDAQ Stock Market
|
|
|
Warrants to Purchase Common Stock
|
The NASDAQ Stock Market
|
|
Securities registered pursuant to Section 12(g) of the Act:
None
Indicate by check mark if the registrant is a well-known seasoned issuer, as defined in Rule 405 of the Securities Act. Yes
¨
No
x
Indicate by check mark if the registrant is not required to file reports pursuant to Section 13 or Section 15(d) of the Act. Yes
¨
No
x
Indicate by check mark whether the registrant (1) has filed all reports required to be filed by Section 13 or 15(d) of the Securities Exchange Act of 1934 during the preceding 12 months (or for such shorter period that the registrant was required to file such response) and (2) has been subject to such filing requirements for the past 90 days. Yes
x
No
¨
Indicate by check mark whether the registrant has submitted electronically and posted on its corporate Web site, if any, every Interactive Data File required to be submitted and posted pursuant to Rule 405 of Regulation S-T (§232.405 of this chapter) during the preceding 12 months (or for such shorter period that the registrant was required to submit and post such files). Yes
x
No
¨
Indicate by check mark if disclosure of delinquent filers pursuant to Item 405 of Regulation S-K (§229.405) is not contained herein, and will not be contained, to the best of the Registrant's knowledge, in definitive proxy or information statements incorporated by reference in Part III of this Form 10-K or any amendment to this Form 10-K.
x
Indicate by check mark whether the registrant is a large accelerated filer, an accelerated filer, a non-accelerated filer, a smaller reporting company or emerging growth company. See the definitions of "large accelerated filer," "accelerated filer," "smaller reporting company," and "emerging growth company" in Rule 12b-2 of the Exchange Act.
Large accelerated filer
¨
Accelerated filer
x
Non-accelerated filer (Do not check if a smaller reporting company)
¨
Smaller reporting company
¨
Emerging growth company
¨
If an emerging growth company, indicate by check mark if the registrant has elected not to use the extended transition period for complying with any new or revised financial accounting standards provided pursuant to Section 13(a) of the Exchange Act.
¨
Indicate by check mark whether the registrant is a shell company (as defined in Rule 12b-2 of the Exchange Act). Yes
¨
No
x
On
March 16, 2018
, the registrant had
107,957,410
shares of common stock outstanding. The aggregate market value (based on the closing price of the Registrant's common stock for stocks quoted on the NASDAQ Global Select Market) of shares of the Registrant's common stock owned by non-affiliates as of the last business day of the Registrant's most recently completed second fiscal quarter, was approximately
$200 million
.
Documents Incorporated By Reference
Part III of this Form 10-K incorporates by reference certain information from the Registrant’s definitive proxy statement relating to our Annual Meeting of Stockholders to be held on
May 9, 2018
(the "2018 Proxy Statement"), which will be filed with the Securities and Exchange Commission within 120 days after the end of the fiscal year to which this Form 10-K relates.
|
Item 1.
|
Business
|
General
Sears Holdings Corporation ("Holdings") is the parent company of Kmart Holding Corporation ("Kmart") and Sears, Roebuck and Co. ("Sears"). Holdings (together with its subsidiaries, "we," "us," "our," or the "Company") was formed as a Delaware corporation in 2004 in connection with the merger of Kmart and Sears (the "Merger") on March 24, 2005. We are an integrated retailer with significant physical and intangible assets, as well as virtual capabilities enabled through technology. At
February 3, 2018
, we operated a national network of stores with
1,002
full-line and specialty retail stores in the United States operating through Kmart and Sears. Further, we operate a number of websites under the sears.com and kmart.com banners which offer millions of products and provide the capability for our members and customers to engage in cross-channel transactions such as
free store pickup; buy in store/ship to home; and buy online, return in store.
We are also the home of Shop Your Way
®
,
a free membership program that connects its members to personalized products, programs and partners that help them save time and money every day. Through an extensive network of national and local partners, members can shop thousands of their favorite brands, dine out and access an array of exclusive partners like Uber
®
and fuboTV
®
to earn CASHBACK in points to redeem for savings on future purchases at
Sears, Kmart, Lands' End and at ShopYourWay.com. T
he Sears MasterCard with Shop Your Way
®
features an industry-leading 5-3-2-1 rewards offer, where members can earn rewards points on all purchases everywhere they shop.
The Company is a leading home appliance retailer, as well as a leader in tools, lawn and garden, fitness equipment, automotive repair and maintenance, and is a significant player in the rapidly emerging connected solutions market. We offer key proprietary brands including Kenmore
®
and DieHard
®
, as well as Craftsman
®
branded product offerings. Our Kenmore and DieHard brands are also now available on Amazon.com. We also maintain a broad apparel and home offering including such well-known labels as Jaclyn Smith
®
, Joe Boxer
®
, Route 66
®
, Cannon
®
, Adam Levine
®
and Levi's
®
and also offer Lands' End
®
merchandise in some of our Full-line stores. We are the nation's No. 1 provider of appliance and product repair services, with over five million service calls made annually.
The retail industry is changing rapidly. The progression of the Internet, mobile technology, social networking and social media is fundamentally reshaping the way we interact with our core customers and members. As a result, we are transitioning to a member-centric company. Our focus continues to be on our core customers, our members, and finding ways to provide them value and convenience through Integrated Retail and our Shop Your Way membership platform. We have invested significantly in our membership program, our online ecommerce platforms and the technology needed to support these initiatives.
Business Segments
We operate in two reportable segments, Kmart and Sears Domestic. Financial information, including revenues, operating loss, total assets and capital expenditures for each of these business segments is contained in Note 17 of Notes to Consolidated Financial Statements. Information regarding the components of revenue for Holdings is included in Item 7, Management's Discussion and Analysis of Financial Condition and Results of Operations as well as Note 17 of Notes to Consolidated Financial Statements.
Kmart
At
February 3, 2018
, the Company operated a total of
432
Kmart stores across
47
states,
Guam, Puerto Rico and the U.S. Virgin Islands
. This store count consists of
431
discount stores, averaging
94,000
square feet, and
one
Super Center, approximately
185,000
square feet. Most Kmart stores are one-floor, free-standing units that carry a wide array of products across many merchandise categories, including consumer electronics, seasonal merchandise, outdoor living, toys, lawn and garden equipment, food and consumables and apparel, including products sold under such well-known labels as Craftsman, Jaclyn Smith, Adam Levine, Joe Boxer, Basic Editions and certain proprietary Sears branded products (such as Kenmore and DieHard) and services. We also offer an assortment of major
2
appliances, including Kenmore-branded products, in all of our locations. There are
183
Kmart stores that also operate in-store pharmacies. The Super Center combines a full-service grocery along with the merchandise selection of a discount store. There are also
three
Sears Auto Centers operating in Kmart stores, offering a variety of professional automotive repair and maintenance services, as well as a full assortment of automotive accessories. Kmart offers a layaway program, which allows members and customers to cost-effectively finance their purchases both in-store and online. In addition, our members and customers have the ability to buy online and pick up in store via mygofer.com, kmart.com or shopyourway.com. Kmart also sells its products through its kmart.com website and provides members and customers enhanced cross-channel options such as buying through a mobile app or online and picking up merchandise in one of our Kmart or Sears Full-line stores.
Sears Domestic
At
February 3, 2018
, Sears Domestic operations consisted of the following:
|
•
|
Full-line Stores—
547
stores located across
49
states and
Puerto Rico
, primarily mall-based locations averaging
159,000
square feet. Full-line stores offer a wide array of products and service offerings across many merchandise categories, including appliances, consumer electronics/connected solutions, tools, sporting goods, outdoor living, lawn and garden equipment, certain automotive services and products, such as tires and batteries, home fashion products, as well as apparel, footwear, jewelry and accessories for the whole family. Our product offerings include our proprietary Kenmore, DieHard, WallyHome, Bongo, Covington, Simply Styled, Everlast, Metaphor, Roebuck & Co., Outdoor Life and Structure brand merchandise, and other brand merchandise such as Craftsman, Roadhandler and Levi's. Lands' End, Inc. continues to operate
151
"store within a store" departments inside Sears Domestic Full-line locations. We also have
423
Sears Auto Centers operating in association with Full-line stores. In addition, there are
19
free-standing Auto Centers that operate independently of Full-line stores. Sears extends the availability of its product selection through the use of its sears.com and shopyourway.com websites, which offer an assortment of home, apparel and accessory merchandise and provide members and customers the option of buying through a mobile app or online and picking up their merchandise in one of our Sears Full-line or Kmart stores.
|
|
•
|
Specialty Stores—
23
specialty stores (primarily consisting of the
19
free-standing Auto Centers noted above) located in free-standing, off-mall locations or high-traffic neighborhood shopping centers, including three DieHard Auto Centers - two in Detroit and one in San Antonio. Specialty stores also include Sears Appliances and Mattresses stores in Ft. Collins, Colorado, Camp Hill, Pennsylvania, Pharr, Texas and Honolulu, Hawaii.
|
|
•
|
Commercial Sales—We sell Kenmore appliances to home builders and property managers through Kenmore Direct, the business-to-business sales organization of KCD Brands. Kenmore Direct operates using a number of sales channels including an Amazon Business sales account. We also sell a wide assortment of appliance brands including luxury brands, parts and services to builders, developers, designers, among other commercial and residential customers through Monark Premium Appliance Co., which includes California Builder Appliances, Inc. (d/b/a Monark Premium Appliance Co. of California), Florida Builder Appliances, Inc. (d/b/a Monark Premium Appliance Co.) and Starwest, LLC. (d/b/a Monark Premium Appliance Co. of Arizona).
|
|
•
|
Home Services—Product Repair Services, the nation's No. 1 provider of appliance and product repair services, is a key element in our active relationship with nearly 30 million households. With approximately 5,200 service technicians making over five million service calls annually, this business delivers a broad range of retail-related residential and commercial services across all 50 states, Puerto Rico, Guam and the Virgin Islands under either the Sears Parts & Repair Services or A&E Factory Service trade names. Commercial and residential customers can obtain parts and repair services for all major brands of products within the appliances, lawn and garden equipment, consumer electronics, floor care products, and heating and cooling systems categories. We also provide repair parts with supporting instructions for "do-it-yourself" members and customers through our searspartsdirect.com website. This business also offers protection agreements, home warranties and Kenmore and Carrier brand residential heating and cooling systems. Home Services also includes home improvement services (primarily siding, windows, cabinet refacing, kitchen remodeling, roofing, carpet and upholstery cleaning, air duct
|
3
cleaning, and garage door installation and repair) provided through Sears Home Improvement and Sears Home & Business Franchises.
|
•
|
Delivery and Installation—Provides both home delivery and retail installation services for Holdings' retail operations with over three million deliveries and installation calls made annually. Also includes Innovel Solutions, which provides delivery services for third party customers.
|
Real Estate Transactions
In the normal course of business, we consider opportunities to purchase leased operating properties, as well as offers to sell owned, or assign leased, operating and non-operating properties. These transactions may, individually or in the aggregate, result in material proceeds or outlays of cash. In addition, we review leases that will expire in the short term in order to determine the appropriate action to take.
Further information concerning our real estate transactions is contained in Note 11 of Notes to Consolidated Financial Statements.
Trademarks and Trade Names
The KMART
®
and SEARS
®
trade names, service marks and trademarks, used by us both in the United States and internationally, are material to our retail and other related businesses.
We sell proprietary branded merchandise under a number of brand names that are important to our operations. Our KENMORE
®
and DIEHARD
®
brands are among the most recognized proprietary brands in retailing. These marks are the subject of numerous United States and foreign trademark registrations. Other well recognized Company trademarks and service marks include ATHLETECH
®
, BLUELIGHT
®
, COVINGTON
®
, ROEBUCK & CO.
®
, SHOP YOUR WAY
®
, SMART SENSE
®
, STRUCTURE
®
, THOM MCAN
®
, and WALLY
®
, which also are registered or are the subject of pending registration applications in the United States. Generally, our rights in our trade names and marks continue so long as we use them.
Seasonality
The retail business is seasonal in nature, and we generate a high proportion of our revenues, operating income and operating cash flows during the fourth quarter of our year, which includes the holiday season. As a result, our overall profitability is heavily impacted by our fourth quarter operating results. Additionally, in preparation for the fourth quarter holiday season, we significantly increase our merchandise inventory levels, which are financed from operating cash flows, credit terms received from vendors and borrowings under our domestic credit agreement (described in the "Uses and Sources of Liquidity" section below). Fourth quarter reported revenues accounted for approximately
26%
of total reported revenues in
2017
,
27%
of total reported revenues in
2016
and
29%
of total reported revenues in
2015
. See Note 19 of Notes to Consolidated Financial Statements for further information on revenues earned by quarter in
2017
and
2016
.
Competition
Our business is subject to highly competitive conditions. We compete with a wide variety of retailers, including other department stores, discounters, home improvement stores, consumer electronics dealers, auto service providers, specialty retailers, wholesale clubs, as well as many other retailers operating on a national, regional or local level in the United States. Online and catalog businesses, which handle similar lines of merchandise, also compete with us. Walmart, Target, Kohl's, J.C. Penney, Macy's, The Home Depot, Lowe's, Best Buy and Amazon are some of the national retailers and businesses with which we compete. The Home Depot and Lowe's are major competitors in relation to our home appliance business, which accounted for approximately
16%
of our
2017
,
15%
of our
2016
and
15%
of our
2015
reported revenues. Success in these competitive marketplaces is based on factors such as price, product assortment and quality, service and convenience, including availability of retail-related services such as access to credit, product delivery, repair and installation. Additionally, we are influenced by a number of factors, including, but not limited to, the cost of goods, consumer debt availability and buying patterns, economic conditions, customer preferences, inflation, currency exchange fluctuations, weather patterns, and
4
catastrophic events. Item 1A in this Annual Report on Form 10-K contains further information regarding risks to our business.
Employees
At
February 3, 2018
, subsidiaries of Holdings had approximately
89,000
employees in the United States and U.S. territories. This employee count includes part-time employees.
Our Website; Availability of SEC Reports and Other Information
Our corporate website is located at searsholdings.com. Our Annual Reports on Form 10-K, Quarterly Reports on Form 10-Q, Current Reports on Form 8-K and any amendments to these reports are available, free of charge, through the "SEC Filings" portion of the Investors Home section of our website as soon as reasonably practicable after they are electronically filed with, or furnished to, the Securities and Exchange Commission ("SEC").
The Corporate Governance Guidelines of our Board of Directors, the charters of the Audit, Compensation and Nominating and Corporate Governance Committees of the Board of Directors, our Code of Conduct and the Board of Directors Code of Conduct are available in the "Corporate Governance" portion of the Investors Home section of searsholdings.com. References to our website address do not constitute incorporation by reference of the information contained on such website, and the information contained on the website is not part of this document.
5
|
Item 1A.
|
Risk Factors
|
Our operations and financial results are subject to various risks and uncertainties, including those described below, which could adversely affect our business, results of operations and financial condition.
We cannot predict whether our plans to enhance our financial flexibility and liquidity to fund our transformation will be successful.
We are continuing to pursue a transformation strategy and to explore potential initiatives to enhance our financial flexibility and liquidity. We have incurred significant losses and experienced negative operating cash flows for the past several years, and accordingly we have taken a number of actions to fund our continued transformation and meet our obligations, including: the amendment and extension of our revolving credit facility; the extension of our first lien term loan facility from June 2018 to January 2019 (with a right on our part to further extend such maturity, subject to the satisfaction of certain conditions, to July 2019); the entrance into the first lien term loan facility due 2020, the second lien term loan facility due 2020 and the second lien line of credit loan facility due 2020, the amendment of the senior secured letter of credit facility; the extension of our real estate term loan facility from July 2017 to July 2018; the entrance into the real estate term loan facility due 2020, the incremental real estate term loan facility due 2018 and the intellectual property/ground lease term loan facility due 2020; the private exchange offers relating to our senior secured notes and senior unsecured notes, the negotiated exchanges of other indebtedness; the entrance into the REMIC real estate term loan facility due December 2018 and the REMIC mezzanine loan facility due 2020; the sale of the Craftsman brand; the rights offering and sale-leaseback transaction with Seritage Growth Properties; the separation of our Lands' End subsidiary; the Sears Canada rights offering; the rights offering for senior unsecured notes with warrants; and various real estate transactions. As a result, we are, and we expect to continue to be, highly leveraged. We expect to pursue other near-term actions to bolster liquidity. If we continue to incur losses, additional actions may be required to further enhance our financial flexibility and liquidity. The success of our initiatives is subject to risks and uncertainties with respect to market conditions and other factors that may cause our actual results, performance or achievements to differ materially from our plans. We cannot assure that cash flows and other internal and external sources of liquidity will at all times be sufficient for our cash requirements. If necessary, we may need to consider further actions and steps to improve our cash position, mitigate any potential liquidity shortfall, pursue additional sources of liquidity, and reduce costs. There can be no assurance that these actions would be successful. Any refinancing of our debt could be at higher interest rates and may require us to comply with more onerous covenants, which could further restrict our business operations. In addition, there can be no assurance that the evaluation and/or completion of any potential transactions will not have a negative impact on our other businesses.
We cannot predict the outcome of any actions to generate liquidity, whether such actions would generate the expected liquidity as currently planned, or the availability of additional debt financing. The specific actions taken or assets involved, the timing, and the overall amount will depend on a variety of factors, including market conditions, interest in specific assets, valuations of those assets and our underlying operating performance.
If we continue to experience operating losses and we are not able to generate additional liquidity through the mechanisms described above or through some combination of other actions, including real estate or other asset sales, while not expected, then our liquidity needs may exceed availability under our Amended Domestic Credit Agreement, our second lien line of credit loan facility and our other existing facilities, and we might need to secure additional sources of funds, which may or may not be available to us. If we are unable to secure such additional funds, we may not be able to meet our obligations as they become due. Additionally, a failure to generate additional liquidity could negatively impact our access to inventory or services that are important to the operation of our business.
Certain factors, including changes in market conditions and our credit ratings, may continue to limit our access to capital markets and other financing sources and materially increase our borrowing costs.
In addition to credit terms from vendors, our liquidity needs are funded by our operating cash flows and borrowings under our credit agreements and commercial paper program, asset sales and access to capital markets. The availability of financing depends on numerous factors, including economic and market conditions, our operating performance, our credit ratings, and lenders' assessments of our prospects and the prospects of the retail industry in
6
general. Changes in these factors may affect our cost of financing, liquidity and our ability to access financing sources, including our commercial paper program and possible second lien indebtedness that is permitted under the domestic revolving credit facility, with respect to each of which we have no lender commitments. Rating agencies revise their ratings for the companies that they follow from time to time. Several ratings agencies have previously downgraded the credit rating on certain of our outstanding debt instruments and may further downgrade or otherwise revise such ratings in the future. In addition, our ratings may be withdrawn in their entirety at any time.
The Company's domestic credit facility currently provides up to $2.5 billion of lender commitments, $1.5 billion of which are revolving commitments. Our ability to borrow funds under this facility is limited by a borrowing base determined by the value, from time to time, of eligible inventory and certain accounts receivable. The value of these eligible assets has not always been sufficient to support borrowings of up to the full amount of the commitments under this facility, and we have not always had full access to the facility, but rather have had access to a lesser amount determined by the borrowing base. A decline in the value of eligible assets has also resulted in our inability to borrow up to the full amount of second lien indebtedness permitted by the domestic credit facility as our second-lien borrowings are limited by a borrowing base requirement under the indenture that governs our senior secured notes due 2018. The domestic revolving credit facility imposes various other requirements, which take effect if availability falls below designated thresholds, including a cash dominion requirement. The domestic credit facility also effectively limits full access to the facility if our fixed charge ratio at the last day of any fiscal month is less than 1.0 to 1.0. As of February 3, 2018, our fixed charge ratio continues to be less than 1.0 to 1.0. If availability under the domestic revolving credit facility were to fall below 10%, the Company would be required to test the fixed charge coverage ratio, and would not comply with the facility, and the lenders under the facility could demand immediate payment in full of all amounts outstanding and terminate their obligations under the facility. In addition, the domestic credit facility provides that in the event we make certain prepayments of indebtedness, for a period of one year thereafter we must maintain availability under the facility of at least 12.5%, and it prohibits certain other prepayments of indebtedness. Moreover, if the borrowing base (as calculated pursuant to the indenture relating to our 6 5/8% senior secured notes due 2019, which were issued in March 2018 (the "New Senior Secured Notes")) falls below the principal amount of the New Senior Secured Notes plus the principal amount of any other indebtedness for borrowed money that is secured by liens on the collateral for the New Senior Secured Notes on the last day of any two consecutive quarters beginning with the second quarter of our 2018 fiscal year, it could trigger an obligation to offer to repurchase all outstanding New Senior Secured Notes at a purchase price equal to 101% of the principal amount, plus accrued and unpaid interest.
The lenders under our various credit facilities may not be able to meet their commitments if they experience shortages of capital and liquidity. Disruptions or turmoil in the financial markets could reduce our ability to meet our capital requirements. There can be no assurance that our ability to otherwise access the credit markets will not be adversely affected by changes in the financial markets and the global economy.
Our business results and ability to fund our transformation depend on our ability to achieve cost savings initiatives and complete our previously announced restructuring program.
In 2017, we initiated a restructuring program targeted to deliver at least $1.25 billion in annualized cost savings. Under the restructuring program, we
reduced our corporate overhead, more closely integrated our Sears and Kmart operations and improved our merchandising, supply chain and inventory management.
The savings also included cost reductions resulting from the closure of 303 Kmart and 132 Sears stores. In January 2018, we identified an additional $200 million of cost savings, unrelated to store closings. However, if we are unable to deliver the additional cost reductions, while continuing to invest in business growth, our financial results could be adversely impacted. Our ability to successfully manage and execute these initiatives and realize expected savings and benefits in the amounts and at the times anticipated is important to our business success, and any failure to do so, which could result from our inability to successfully execute plans, changes in global or regional economic conditions, competition, changes in the industries in which we compete, unanticipated costs or charges and other factors described herein, could adversely affect our business, financial condition and results of operations. As part of our overhead reduction, we have reduced our corporate and operations headcount, including management level, distribution and field employees. These reductions, as well as employee attrition, could result in the potential loss of specific knowledge relating to our company, operations and industry that could be difficult to replace. Also, we now operate with fewer employees, who have assumed additional duties and responsibilities. The restructuring program and workforce changes may negatively impact communication, morale, management cohesiveness and effective
7
decision-making, which could have an adverse impact on our business operations, customer experience, sales and results of operations.
The lack of willingness of our vendors to do business with us or to provide acceptable payment terms could negatively impact our liquidity and/or reduce the availability of products or services we seek to procure.
We depend on our vendors to provide us with financing on our purchases of inventory and services. From time to time, certain of our vendors have sought to limit the availability of vendor credit to us or to modify the other terms under which they sell to us, or both, which has negatively impacted our liquidity. In addition, the inability of vendors to access liquidity, or the insolvency of vendors, could lead to their failure to deliver inventory or other services. Certain of our vendors finance their operations and/or reduce the risk associated with collecting accounts receivable from us by selling or "factoring" the receivables or by purchasing credit insurance or other forms of protection from loss associated with our credit risks. The ability of our vendors to do so is subject to the perceived credit quality of the Company. Such vendors could be limited in their ability to factor receivables or obtain credit protection in the future because of our perceived financial position and creditworthiness, which could reduce the availability of products or services we seek to procure, increase the cost to us of those products and services, or both.
We have ongoing discussions concerning our liquidity and financial position with the vendor community and third parties that offer various credit protection services to our vendors. The topics discussed have included such areas as pricing, payment terms and ongoing business arrangements. As of the date of this report, we have not experienced any significant disruption in our access to merchandise or our operations due to vendors slowing or ceasing merchandise shipments or requiring or conditioning the sale or shipment of merchandise on new payment terms or other assurances. However, there can be no assurances that there will not be a future disruption, and such circumstances could have a negative effect on our business, financial condition and results of operations.
If we are unable to compete effectively in the highly competitive retail industry, our business and results of operations could be materially adversely affected.
The retail industry is highly competitive with few barriers to entry. We compete with a wide variety of retailers, including other department stores, discounters, home improvement stores, appliances and consumer electronics retailers, auto service providers, specialty retailers, wholesale clubs, online and catalog retailers and many other competitors operating on a national, regional or local level. Some of our competitors are actively engaged in new store expansion or increasing their online presence. Online and catalog businesses, which handle similar lines of merchandise, and some of which are not required to collect sales taxes on purchases made by their customers, also compete with us. Competition may intensify as competitors enter into business combinations or alliances. We also experience significant competition from promotional activities of our competitors, and some competitors may be able to devote greater resources to sourcing, promoting and selling their products. In this competitive marketplace, success is based on factors such as price, advertising, product assortment, quality, service, reputation and convenience.
Our success depends on our ability to differentiate ourselves from our competitors with respect to shopping convenience, a quality assortment of available merchandise, functionality of digital channels, and superior customer service and experience. We must also successfully respond to our members' and customers' changing tastes and expectations. The performance of our competitors, as well as changes in their pricing policies, marketing activities, new store openings, online presence, use of purchasing data and other business strategies, could have a material adverse effect on our business, financial condition and results of operations.
8
If we fail to offer merchandise and services that our members and customers want, our sales may be limited, which would reduce our revenues and profits.
In order for our business to be successful, we must identify, obtain supplies of, and offer to our members and customers, attractive, innovative and high-quality merchandise. Our products and services must satisfy the desires of our members and customers, whose preferences may change in the future. Our sales and operating results depend in part on our ability to predict consumer demand for products and services we sell, availability of merchandise, product trends, and our members' and customers' purchasing habits, tastes and preferences. If we misjudge these predictions, our relationship with our members and customers may be negatively impacted, and we may be faced with excess inventories of some products, which may impact our sales or require us to sell the merchandise we have obtained at lower prices, and missed opportunities for products and services we chose not to offer. In addition, merchandise misjudgments may adversely impact the perception or reputation of our company, which could result in declines in member and customer loyalty and vendor relationships. These factors could have a negative effect on our business, financial condition and results of operations.
If our integrated retail strategy to transform into a member-centric retailer is not successful, our business and results of operations could be adversely affected.
We are seeking to transform into a member-centric retailer through our integrated retail strategy, which is based on a number of initiatives, including our Shop Your Way program, that depend on, among other things, our ability to respond quickly to ongoing technology developments and implement new ways to understand and rely on the data to interact with our members and customers and our ability to provide attractive, convenient and consistent online and mobile experiences for our members. We must anticipate and meet our members' and customers' evolving expectations, while counteracting developments by our competitors and striving to deliver a seamless experience across all of our sales channels. We may need to adjust our strategic initiatives depending on our members' and customers' reactions to and level of engagement with our initiatives. Failure to execute these initiatives or provide our members with positive experiences may result in a loss of active members, failure to attract new members and lower than anticipated sales. There is no assurance that our initiatives and strategies will improve our operating results.
If we do not successfully manage our inventory levels, our operating results will be adversely affected.
We must maintain sufficient inventory levels to operate our business successfully. However, we also must guard against accumulating excess inventory as we seek to minimize out-of-stock levels across all product categories and to maintain in-stock levels. We obtain a significant portion of our inventory from vendors located outside the United States. Some of these vendors require lengthy advance notice of our requirements in order to be able to supply products in the quantities we request. This usually requires us to order merchandise, and enter into purchase order contracts for the purchase and manufacture of such merchandise, well in advance of the time these products will be offered for sale. As a result, we may experience difficulty in responding quickly to a changing retail environment, which makes us vulnerable to changes in price and demand. If we do not accurately anticipate the future demand for a particular product or the time it will take to obtain new inventory, our inventory levels will not be appropriate and our results of operations may be negatively impacted.
Our business has been and will continue to be affected by worldwide economic conditions; an economic downturn, a renewed decline in consumer-spending levels and other conditions, including inflation and changing prices of energy, could lead to reduced revenues and gross margins, and negatively impact our liquidity.
Many economic and other factors are outside of our control, including consumer and commercial credit availability, consumer confidence and spending levels, as well as the impact of payroll tax and medical cost increases on U.S. consumers, recession, inflation, deflation, employment levels, housing sales and remodels, interest rates, tax rates, rates of economic growth, fiscal and monetary government policies, consumer debt levels, consumer debt payment behaviors, fuel costs and other challenges currently affecting the global economy, the full impact of which on our business, results of operations and financial condition cannot be predicted with certainty. These economic conditions adversely affect the disposable income levels of, and the credit available to, our members and customers, which could lead to reduced demand for our merchandise. Increases in fuel and energy costs may have a
9
significant impact on our operations. We require significant quantities of fuel for the vehicles used by technicians in our home services business, and we are exposed to the risk associated with variations in the market price for petroleum products. We could experience a disruption in energy supplies, including our supply of gasoline, as a result of factors that are beyond our control, which could have an adverse effect on our business. Certain of our vendors also could experience increases in the cost of various raw materials, such as cotton, oil-related materials, steel and rubber, which could result in increases in the prices that we pay for merchandise, particularly apparel, appliances and tires. Domestic and international political events also affect consumer confidence. The threat, outbreak or escalation of terrorism, civil unrest, military conflicts or other hostilities could lead to a decrease in consumer spending. Any of these events and conditions could inhibit sales or cause us to increase inventory markdowns and promotional expenses, thereby reducing our gross margins.
Failure to execute effective advertising efforts may adversely impact our financial performance.
Effective advertising and marketing efforts play a crucial role in maintaining high customer traffic both in store and online. We are focused on developing new marketing initiatives and maintaining effective promotional strategies that target further growth in our business. Failure to execute effective advertising efforts to attract new customers or retain existing customers may adversely impact our financial performance.
Our business results may be negatively impacted as a result of the recapture rights included in the Master Leases in connection with the Seritage transaction and JV transactions.
In 2015, we entered into various sale-lease back transactions with respect to certain of our real properties with Seritage Growth Properties ("Seritage") and certain joint ventures we formed with affiliates of Simon Property Group, Inc., General Growth Properties, Inc. and the Macerich Company (collectively, the "JVs"). In connection with the Seritage transaction and JV transactions, Holdings entered into agreements with Seritage and the JVs pursuant to which Holdings leased 255 of the properties (the "Master Leases"). The Master Leases include recapture provisions that allow Seritage or the JVs, as applicable, to reclaim approximately 50% of the space within these properties (subject to certain exceptions, including reclamation rights as to 100% of the space at 21 properties, and further subject to a lease termination payment by Seritage), in addition to all of the automotive care centers which are free-standing or attached as "appendages," and all outparcels or outlots, as well as certain portions of parking areas and common areas. While we believe these provisions are generally beneficial for Holdings as they facilitate the transformation of our physical stores, potentially enable us to rationalize our footprint by reducing the space we occupy in a given location, and provide us with substantial flexibility in how we manage our store network moving forward, if we are unable to successfully manage and execute our plans to operate our stores in the smaller footprint, our business, financial condition and results of operations could be adversely impacted. Additionally, the recapture rights are within the control of Seritage and the JVs and we cannot predict the timing on which the recapture rights may be exercised, if at all, or whether the timing of any such exercise of these rights will align well with the timing of our transformation, which could create disruptions in our operations.
Potential liabilities in connection with the separations of Sears Hometown and Outlet Stores and Lands' End or other asset transactions may arise under fraudulent conveyance and transfer laws and legal capital requirements.
With respect to the separations of our Sears Hometown and Outlet Stores and Lands' End, Inc. subsidiaries, the sale of real estate assets to real estate investment trusts and other third parties, the sale of the Craftsman brand, and any future dispositions of other similar assets, if the Company, Lands' End, or any asset purchaser subsequently fails to pay its creditors or enters insolvency proceedings, the transaction may be challenged under U.S. federal, U.S. state and foreign fraudulent conveyance and transfer laws, as well as legal capital requirements governing distributions and similar transactions. If a court were to determine under these laws that, (a) at the time of the transaction, the entity in question: (1) was insolvent; (2) was rendered insolvent by reason of the transaction; (3) had remaining assets constituting unreasonably small capital; (4) intended to incur, or believed it would incur, debts beyond its ability to pay these debts as they matured; or (b) the transaction in question failed to satisfy applicable legal capital requirements, the court could determine that the transaction was voidable, in whole or in part. Subject to various defenses, the court could then require the Company, Lands' End, the respective purchaser, or other recipients of value in connection with any such transaction, as the case may be, to turn over value to other entities
10
involved in the transaction and contemplated transactions for the benefit of unpaid creditors. The measure of insolvency and applicable legal capital requirements will vary depending upon the jurisdiction whose law is being applied.
Certain dividend payments received by us from Sears Canada Inc., and other transactions involving Sears Canada Inc., may be subject to challenge.
In 2012 and 2013, we received dividend payments from our former subsidiary, Sears Canada Inc. ("Sears Canada") in the aggregate amount of $295 million. The payments of these dividends by Sears Canada, as well as "the surrender by Sears Canada of its exclusive right to use the Craftsman trademark in Canada in connection with the sale by Holdings of the Craftsman business to Stanley Black & Decker in March 2017," have been identified by the court-appointed monitor for Sears Canada in connection with its bankruptcy liquidation as potential "transactions of interest" subject to review. In addition, the Canadian bankruptcy court has appointed a litigation advisor to investigate and potentially recommend claims relating to dividend payments made by Sears Canada. In the event that a court of competent jurisdiction were to determine that any dividend payments made by, or other transactions involving, Sears Canada were subject to recapture, we could suffer financial liability, which could have a materially adverse impact on our liquidity or financial condition.
We rely extensively on computer systems to implement our integrated retail strategy, process transactions, summarize results and otherwise manage our business. Disruptions in these systems could harm our ability to run our business.
Given the significance of our online and mobile capabilities, our collection and use of data to create personalized experiences, and the number of individual transactions we have each year, including in our stores, it is critical that we maintain uninterrupted operation of our computer and communications hardware and software systems, some of which are based on end-of-life or legacy technology, operate with minimal or no vendor support and are otherwise difficult to maintain. Our systems are subject to damage or interruption from power outages, computer and telecommunications failures, computer viruses, worms, other malicious computer programs, denial-of-service attacks, security breaches, catastrophic events such as fires, tornadoes, hurricanes, acts of terrorism and usage errors by our employees. If our systems are damaged, breached or cease to function properly, we may have to make a significant investment to repair or replace them, and we may suffer loss of critical data and interruptions or delays in our operations. Operating legacy systems subjects us to inherent costs and risks associated with maintaining, upgrading and replacing these systems and retaining sufficiently skilled personnel to maintain and operate the systems, demands on management time, and other risks and costs. Any material interruption in our computer operations may have a material adverse effect on our business or results of operations, including on our Shop Your Way program and participation in or engagement with that program. We are pursuing initiatives to transform our information technology processes and systems. These initiatives are highly complex and include replacing legacy systems, upgrading existing systems, and acquiring new systems and hardware with updated functionality. The risk of disruption is increased in periods when such complex and significant systems changes are undertaken.
If we do not maintain the security of our member and customer, associate or company information, we could damage our reputation, incur substantial additional costs and become subject to litigation.
The protection of member, customer, employee, and company data is critical to the Company. We have systems and processes in place that are designed to protect information and protect against security and data breaches as well as fraudulent transactions and other activities. Nevertheless, cyber-security risks such as malicious software and attempts to gain unauthorized access to data are rapidly evolving and becoming increasingly sophisticated. Techniques or software used to gain unauthorized access, and/or disable, degrade or harm our systems may be difficult to detect or scope for prolonged periods of time, and we may be unable to anticipate these techniques or put in place protective or preventive measures. These attempts to gain unauthorized access could lead to disruptions in our systems, unauthorized release of confidential or otherwise protected information or corruption of data. If individuals are successful in infiltrating, breaking into, disrupting, damaging or otherwise stealing from the computer systems of the Company or its third-party providers we may have to make a significant investment to fix or replace them, we may suffer interruptions in our operations in the interim, we may face costly litigation,
11
government investigations, government enforcement actions, fines and/or lawsuits, the ability for our members to earn or redeem points in our Shop Your Way program may be impacted or halted, and our reputation with our members and customers may be significantly harmed. There is no guarantee that the procedures that we have implemented to protect against unauthorized access to secured data are adequate to safeguard against all data security breaches. A data security breach or any failure by us to comply with applicable privacy and information security laws and regulations could result in a loss of customer or member confidence and negatively impact our business, including our Shop Your Way program, and our results of operations. Moreover, a data security breach could require us to devote significant management resources to address the problems created by the breach and to expend significant additional resources to upgrade further the security measures that we employ to guard against such breaches, which could disrupt our business, operations and financial condition.
We are subject to payment-related risks that could increase our operating costs, expose us to fraud or theft, subject us to potential liability and potentially disrupt our business operations.
As a retailer that accepts payments using a variety of methods, including credit and debit cards, PayPal, and gift cards, the Company is subject to rules, regulations, contractual obligations and compliance requirements, including payment network rules and operating guidelines, data security standards and certification requirements, and rules governing electronic funds transfers. The regulatory environment related to information security and privacy is increasingly rigorous, with new and constantly changing requirements applicable to our business, and compliance with those requirements could result in additional costs or accelerate these costs. For certain payment methods, including credit and debit cards, we pay interchange and other fees, which could increase over time and raise our operating costs. We rely on third parties to provide payment processing services, including the processing of credit cards, debit cards, and other forms of electronic payment. If these companies become unable to provide these services to us, or if their systems are compromised, it could disrupt our business.
The Payment Card Industry ("PCI") has established standards for securing payment card data through the PCI Data Security Standards ("DSS"). The Company is required to conduct an annual assessment with a PCI Qualified Security Assessor to assess compliance with the PCI DSS. Based on the 2016 assessment, the Company was determined to be non-compliant with PCI DSS. For 2017, we delivered 6 out of 7 compliant reports for PCI. The only outstanding report for automotive is to be delivered in the first quarter of 2018 as has been agreed upon with the relevant processor and card brands. While the Company took corrective actions which allowed it to regain compliance with PCI DSS, there can be no assurance that the Company will achieve compliance in the future. A failure to achieve compliance with PCI DSS could result in the incurrence of fines, penalties or other liabilities by the Company.
Due to the seasonality of our business, our annual operating results would be adversely affected to a heightened degree if our business performs poorly in the fourth quarter.
Due to the seasonality of our business, our operating results vary considerably from quarter to quarter. We generate a high proportion of revenues, operating income and operating cash flows during the fourth quarter of our year, which includes the holiday season. In addition, our Company incurs significant additional expenses for inventory, advertising and employees in the period leading up to the months of November and December in anticipation of higher sales volume in the fourth quarter. As a result, our fourth quarter operating results significantly impact our annual operating results. Our fourth quarter operating results may fluctuate significantly, based on many factors, including holiday spending patterns and weather conditions.
Our sales may fluctuate for a variety of reasons, which could adversely affect our results of operations.
Our business is sensitive to customers' spending patterns, which in turn are subject to prevailing economic conditions. Our sales and results of operations have fluctuated in the past, and we expect them to continue to fluctuate in the future. A variety of other factors affect our sales and financial performance, including:
|
•
|
actions by our competitors, including opening of new stores in our existing markets or changes to the way these competitors go to market online;
|
|
•
|
our ability to integrate and deliver an attractive online retail experience;
|
|
•
|
seasonal fluctuations due to weather conditions;
|
|
•
|
changes in our merchandise strategy and mix;
|
12
|
•
|
changes in population and other demographics; and
|
|
•
|
timing of our promotional events.
|
Accordingly, our results for any one quarter are not necessarily indicative of the results to be expected for any other quarter, and comparable store sales for any particular future period may increase or decrease. For more information on our results of operations, see Management's Discussion and Analysis of Financial Condition and Results of Operations in Item 7 of this Annual Report on Form 10-K.
We rely on foreign sources for significant amounts of our merchandise, and our business may therefore be negatively affected by the risks associated with international trade.
We depend on a large number of products produced in foreign markets. We face risks, including reputational risks, associated with sourcing, purchasing, and the delivery of merchandise originating outside the United States, including:
|
•
|
potential economic and political instability in countries where our suppliers are located;
|
|
•
|
increases in shipping costs;
|
|
•
|
manufacturing and transportation delays and interruptions, including without limitation, delays and interruptions resulting from labor slowdowns, strikes, or other disruptions at any port where merchandise we purchase enters the U.S.;
|
|
•
|
the availability of raw materials to suppliers;
|
|
•
|
supplier financial instability;
|
|
•
|
supplier compliance with applicable laws, including labor and environmental laws, and with our global compliance program for suppliers and factories;
|
|
•
|
merchandise safety and quality issues, adverse fluctuations in currency exchange rates; and
|
|
•
|
changes in U.S. and foreign laws affecting the importation and taxation of goods, including duties, tariffs and quotas, or changes in the enforcement of those laws.
|
U.S. foreign trade policies, trade restrictions, other impositions on imported goods, trade sanctions imposed on certain countries, the limitation on the importation of certain types of goods or of goods containing certain materials from other countries, and other factors relating to foreign trade are beyond our control. These and other factors affecting our suppliers and our access to products could adversely affect our results of operations.
We rely on third parties to provide us with services in connection with the administration of certain aspects of our business.
We have entered into agreements with third-party service providers (both domestic and overseas) to provide processing and administrative functions over a broad range of areas, and we may continue to do so in the future. These areas include finance and accounting, information technology, including IT development, call center, human resources and procurement functions. Services provided by third parties could be interrupted as a result of many factors, such as acts of God or contract disputes, and any failure by third parties to provide us with these services on a timely basis or within our service level expectations and performance standards could result in a disruption of our business. In addition, to the extent we are unable to maintain our outsourcing arrangements, we could incur substantial costs, including costs associated with hiring new employees or finding an alternative outsourced solution. Moreover, the Company cannot make any assurances that it would be able to arrange for alternate or replacement outsourcing arrangements on terms as favorable as the Company’s existing agreements, if at all. Any inability on the part of the Company to do so could negatively affect our results of operations. These outsourcing arrangements also carry the risk that the Company will fail to adequately retain the significant internal historical knowledge of our business and systems that is transferred to the service providers as the employment of the Company's personnel who possess such knowledge ends.
We could incur charges due to impairment of goodwill, intangible and long-lived assets.
At
February 3, 2018
, we had goodwill and intangible asset balances of
$1.4 billion
, which are subject to periodic testing for impairment. Our long-lived assets, primarily stores, also are subject to periodic testing for impairment. A significant amount of judgment is involved in the periodic testing. Failure to achieve sufficient levels of cash flow within our reporting unit, or sales of our branded products or cash flow generated from operations at
13
individual store locations could result in impairment charges for goodwill and intangible assets or fixed asset impairment for long-lived assets, which could have a material adverse effect on our reported results of operations. Impairment charges, if any, resulting from the periodic testing are non-cash. A significant decline in the property fair values could result in long-lived asset impairment charges. See Notes 12 and 13 of Notes to Consolidated Financial Statements for further information.
Our failure to attract or retain employees, including key personnel, may disrupt our business and adversely affect our financial results.
Our business is dependent on our ability to attract, develop, and retain qualified employees, many of whom are entry-level or part-time positions with historically high turnover rates. Our ability to meet our labor needs and control labor costs is subject to external factors such as unemployment levels, prevailing wage rates, collective bargaining efforts, health care and other benefit costs, changing demographics, and our reputation within the labor market. If we are unable to attract and retain adequate numbers and an appropriate mix of qualified employees, the quality of service we provide to our customers may decrease and our financial performance may be adversely affected. Further, we depend on the contributions of key personnel, including Edward S. Lampert, our Chairman and Chief Executive Officer, and other key employees, for our future success. Over the past several years, the departures of a number of our executive officers have caused disruptions to, and uncertainty in, our business and operations. Future changes in our senior management team or the departures of other key employees may further disrupt our business and materially adversely affect our results of operations.
Affiliates of our Chairman and Chief Executive Officer, whose interests may be different than your interests, exert substantial influence over our Company.
Affiliates of Edward S. Lampert, our Chairman and Chief Executive Officer, collectively own approximately
49%
of the outstanding shares of our common stock at February 3, 2018. These affiliates are controlled, directly or indirectly, by Mr. Lampert. Accordingly, these affiliates, and thus Mr. Lampert, have substantial influence over many, if not all, actions to be taken or approved by our stockholders, including the election of directors and any transactions involving a change of control.
The interests of these affiliates, which have investments in other companies, including Seritage and our former subsidiaries, Sears Hometown and Outlet Stores, Inc., Lands' End, Inc. and Sears Canada, may from time to time diverge from the interests of our other stockholders, particularly with regard to new investment opportunities. This substantial influence may also have the effect of discouraging offers to acquire our Company because the consummation of any such acquisition would likely require the consent of these affiliates.
In addition, as of February 3, 2018, these affiliates collectively hold approximately $1.8 billion of our outstanding indebtedness. As long as these affiliates continue to hold significant amounts of our indebtedness, such affiliates’ interests may be different than those of our other stockholders and debtholders.
We may be unable to protect or preserve the image of our brands and our intellectual property rights, which could have a negative impact on our business.
We regard our copyrights, service marks, trademarks, trade dress, trade secrets, patents and similar intellectual property as critical to our success, particularly those that relate to our private branded merchandise. As such, we rely on trademark and copyright law, patent law, trade secret protection and confidentiality agreements with our associates, consultants, vendors, and others to protect our proprietary rights. Nevertheless, the steps we take to protect our proprietary rights may be inadequate. If we are unable to protect or preserve the value of our trademarks, copyrights, trade secrets, patents or other proprietary rights for any reason, or if we fail to maintain the image of our brands due to merchandise and service quality issues, actual or perceived, adverse publicity, governmental investigations or litigation, or other reasons, our brands and reputation could be damaged and we could lose members and customers.
14
Our sales and operating results could be adversely affected by product safety concerns or claims concerning the services we offer.
If our merchandise offerings do not meet applicable safety standards or consumer expectations regarding safety, we could experience decreased sales, increased costs, and exposure to reputational risk and personal injury, death, or property damage claims related to such merchandise. Such matters may require us to take actions such as product recalls and could give rise to government enforcement actions. We also provide various services to our members and customers, which could also give rise to such claims and government actions. Although we maintain liability insurance, we cannot be certain that our coverage will be adequate for liabilities actually incurred or that insurance will continue to be available to us on economically reasonable terms, or at all. Reputational damage caused by, and claims arising from, real or perceived product safety concerns or from the services we offer could negatively affect our business and results of operations.
We may be subject to periodic litigation and other regulatory proceedings. These proceedings may be affected by changes in laws and government regulations or changes in the enforcement thereof.
From time to time, we may be involved in lawsuits and regulatory actions relating to our business, certain of which may be in jurisdictions with reputations for aggressive application of laws and procedures against corporate defendants. Some of these actions have the potential for significant statutory penalties, and compensatory, treble or punitive damages. Our pharmacy, home services and grocery businesses, in particular, are subject to numerous federal, state and local regulations, and a significant change in, or noncompliance with, these regulations could have a material adverse effect on our compliance costs and results of operations. We are impacted by trends in litigation, including class-action allegations brought under various consumer protection and employment laws, including wage and hour laws, patent infringement claims, and investigations and actions that are based on allegations of untimely compliance or noncompliance with applicable regulations or statutes. Due to the inherent uncertainties of litigation and regulatory proceedings, we cannot accurately predict the ultimate outcome of any such proceedings. An unfavorable outcome could have a material adverse impact on our business, financial condition, and results of operations. In addition, regardless of the outcome of any litigation or regulatory proceedings, these proceedings could result in substantial costs and may require that we devote substantial resources to defend our Company. Further, changes in governmental regulations both in the United States and in the other countries where we operate could have adverse effects on our business and subject us to additional regulatory actions. For a description of current legal proceedings, see Item 3, Legal Proceedings, as well as Note 18 of Notes to Consolidated Financial Statements in this Annual Report on Form 10-K.
Our pension and postretirement benefit plan obligations are currently underfunded, and we may have to make significant cash payments to some or all of these plans, which would reduce the cash available for our businesses.
We have unfunded obligations under our domestic pension and postretirement benefit plans. The funded status of our pension plans is dependent upon many factors, including returns on invested assets, the level of certain market interest rates and the discount rate used to determine pension obligations. Unfavorable returns on the plan assets or unfavorable changes in applicable laws or regulations could materially change the timing and amount of required plan funding, which would reduce the cash available for our businesses. In addition, a decrease in the discount rate used to determine pension obligations could result in an increase in the valuation of pension obligations, which could affect the reported funding status of our pension plans and future contributions, as well as the periodic pension cost in subsequent years. Moreover, unfavorable regulatory action could materially change the timing and amount of required plan funding and negatively impact our business operations and impair our business strategy.
On March 18, 2016, we entered into a five-year pension plan protection and forbearance agreement (the “PPPFA”) with the Pension Benefit Guaranty Corporation ("PBGC"), pursuant to which the Company has agreed to continue to protect, or "ring-fence," pursuant to customary covenants, the assets of certain special purpose subsidiaries (the "Relevant Subsidiaries") holding real estate and/or intellectual property assets. Also under the agreement, the Relevant Subsidiaries granted PBGC a springing lien on the ring-fenced assets, which lien will be triggered only by (a) failure to make required contributions to the Company's pension plans (the "Plans"), (b)
15
prohibited transfers of ownership interests in the Relevant Subsidiaries, (c) termination events with respect to the Plans, or (d) bankruptcy events with respect to the Company or certain of its material subsidiaries.
In connection with the closing of our sale of the Craftsman brand, we agreed to grant the PBGC a lien on, and subsequently contribute to the Plans, the value of the $250 million cash payment payable to the Company on the third anniversary of the Craftsman closing. We subsequently sold the right to receive such payment to a third-party purchaser and deposited the proceeds from such sale into an escrow for the benefit of the Plans. We also granted a lien to the PBGC on the 15-year income stream relating to new Stanley Black & Decker sales of Craftsman products, and agreed to contribute the payments from Stanley Black & Decker under such income stream to the Plans. We also agreed to grant the PBGC a lien on $100 million of real estate assets to secure the Company's minimum pension funding obligations through the end of 2019, and agreed to certain other amendments to the PPPFA.
In November 2017, we entered into an amendment to the PPPFA that allowed the Company to pursue the monetization of 138 of our properties that were subject to a ring-fence arrangement created under the PPPFA. In March 2018, the Company closed on the Secured Loan and the Mezzanine Loan, which transactions released the properties from the ring-fence arrangement. The Company contributed approximately $282 million of the proceeds of such loans to our pension plans, and deposited $125 million into an escrow for the benefit of the Plans. Under our agreement with the PBGC, the escrowed amount will also be contributed to the Plans and, when so contributed, will be fully credited against the Company’s minimum pension funding obligations in 2018 and 2019. Following such transactions, the Company has been relieved of contributions to the Plans for approximately two years (other than the contributions from escrow described above and a $20 million supplemental payment due in the second quarter of 2018). The ultimate amount of pension contributions could be affected by factors such as changes in applicable laws, as well as financial market and investment performance and demographic changes.
The Company will continue to make required contributions to the Plans, the scheduled amounts of which are not, other than as described above, affected by the arrangement. Under the PPPFA, the PBGC has agreed to forbear from initiating an involuntary termination of the Plans, except upon the occurrence of specified conditions, one of which is based on the aggregate market value of the Company’s issued and outstanding stock. As of the date of this report, the Company’s stock price is such that the PBGC would be permitted to cease forbearance. The PBGC has been given notice in accordance with the terms of the PPPFA and has not communicated any intention to cease its forbearance; however, if the PBGC were to initiate an involuntary termination of the Plans, our financial condition could be materially and adversely affected.
We may not realize the full anticipated benefits of the Craftsman sale transaction.
We may not realize the full anticipated benefits of the Craftsman sale transaction (the "Craftsman Sale"), in which case our business, financial results or operations could be adversely affected. Under the terms of our Acquired IP License Agreement with Stanley Black & Decker, we have the right to continue to use the Licensed IP (as defined in such agreement) and sell Craftsman-branded products in certain distribution channels. If the license is terminated, or if the terms of the license agreement are otherwise modified, we may not be able to continue to market, procure or sell Craftsman-branded products on favorable terms or at all, and our business may be adversely affected.
Our failure to comply with federal, state, local and international laws, or changes in these laws could adversely affect our results of operations.
Our business is subject to a wide array of laws and regulations. If we fail to comply with applicable laws and regulations, we could be subject to legal risk, including government enforcement action and class action civil litigation that could increase our cost of doing business. Changes in the regulatory environment regarding topics such as privacy and information security, product safety, environmental protection, payment methods and related fees, responsible sourcing, supply chain transparency, wage and hour laws, health care mandates and other applicable laws and regulations could also cause our compliance costs to increase and adversely affect our results of operations.
Our performance could further be impacted by changes in legislation, trade policies and agreements, energy and environmental standards, and tax laws and regulations. The current U.S. Administration has signaled that it may alter trade agreements and terms with foreign countries, and recently limited trade by announcing upcoming tariffs
16
on imported steel and aluminum and imposing tariffs and quotas on imports of residential washers from certain foreign countries. These restrictions and tariffs, as well as future additional tariffs and/or quotas, on products that we import may require that we raise our prices, which could result in decreased sales. Further, changes in environmental and energy efficiency standards and regulations applicable to products that we develop and/or sell, and potential changes in the size and availability of tax incentives applicable to such products, may impact the types, characteristics, and consumer interest in such products, which may negatively impact our results of operations. Moreover, future legislation or regulations, including environmental matters, product certification, product liability, tariffs, duties, taxes, tax incentives and other matters, may impact our results. Major developments in tax policy or trade relations, such as the imposition of unilateral tariffs on imported products, could have a material adverse effect on our business, results of operations and liquidity.
Weather conditions and natural disasters may impact consumer shopping patterns and could adversely affect our results of operations.
Significant weather conditions where our stores are located could negatively affect the Company's business and results of operations. Heavy snowfall, ice storms, rainstorms or other extreme weather conditions over a prolonged period could make it difficult for our members and customers to travel to our stores, thus leading to decreased sales. Our business is also susceptible to unseasonable weather conditions, such as unseasonably warm temperatures during the winter season or cool weather during the summer season, which could reduce demand for certain inventory and compromise our efforts to predict and manage inventory levels effectively. In addition, extreme weather conditions could result in disruption or delay of production and delivery of materials and products in our supply chain. In addition, natural disasters such as hurricanes, tornadoes and earthquakes, or a combination of these or other factors, could damage or destroy our facilities or make it difficult for members and customers to travel to our stores, thereby negatively affecting our business and results of operations as well as causing us to incur significant expenses to repair or replace such facilities.
Our stock price has been and may continue to be volatile.
The market price of our common stock has fluctuated substantially and may continue to fluctuate significantly. Future announcements or disclosures concerning us or any of our competitors, our strategic initiatives, our sales and profitability, any quarterly variations in actual or anticipated operating results or comparable sales, any failure to meet analysts' expectations and sales of large blocks of our common stock, among other factors, could cause the market price of our common stock to fluctuate substantially.
Increases in employee wages and the cost of employee benefits could impact our financial results and cash flow.
Our expenses relating to employee health benefits are significant. Increases in minimum wages or unfavorable changes in the cost of such benefits could negatively affect our financial results and cash flow. Healthcare costs have risen significantly in recent years, and various legislative and private sector initiatives regarding healthcare reform have resulted, and could continue to result, in significant changes to the U.S. healthcare system. Due to the breadth and complexity of the healthcare reform legislation, and the potential for change in this regard under the current U.S. Administration, we are unable at this time to fully determine the impact that further healthcare reform will have on our employee health benefit plans.
|
Item 1B.
|
Unresolved Staff Comments
|
Not applicable.
17
|
Item 2.
|
Properties
|
The following table summarizes the locations of our Kmart and Sears Domestic stores at
February 3, 2018
:
|
|
Sears Domestic
|
||||||||
|
State / Territory
|
Kmart
|
Full-line Stores
|
Specialty Stores
|
||||||
|
Alabama
|
—
|
|
2
|
|
—
|
|
|||
|
Alaska
|
—
|
|
3
|
|
—
|
|
|||
|
Arizona
|
4
|
|
12
|
|
—
|
|
|||
|
Arkansas
|
2
|
|
2
|
|
—
|
|
|||
|
California
|
55
|
|
70
|
|
3
|
|
|||
|
Colorado
|
4
|
|
9
|
|
1
|
|
|||
|
Connecticut
|
3
|
|
6
|
|
—
|
|
|||
|
Delaware
|
4
|
|
3
|
|
—
|
|
|||
|
Florida
|
20
|
|
45
|
|
1
|
|
|||
|
Georgia
|
6
|
|
13
|
|
—
|
|
|||
|
Hawaii
|
2
|
|
4
|
|
1
|
|
|||
|
Idaho
|
3
|
|
4
|
|
—
|
|
|||
|
Illinois
|
12
|
|
21
|
|
4
|
|
|||
|
Indiana
|
12
|
|
10
|
|
—
|
|
|||
|
Iowa
|
9
|
|
5
|
|
—
|
|
|||
|
Kansas
|
3
|
|
2
|
|
—
|
|
|||
|
Kentucky
|
5
|
|
4
|
|
—
|
|
|||
|
Louisiana
|
4
|
|
8
|
|
—
|
|
|||
|
Maine
|
4
|
|
3
|
|
—
|
|
|||
|
Maryland
|
11
|
|
15
|
|
—
|
|
|||
|
Massachusetts
|
9
|
|
17
|
|
—
|
|
|||
|
Michigan
|
15
|
|
17
|
|
1
|
|
|||
|
Minnesota
|
5
|
|
6
|
|
—
|
|
|||
|
Mississippi
|
2
|
|
3
|
|
1
|
|
|||
|
Missouri
|
5
|
|
8
|
|
—
|
|
|||
|
Montana
|
5
|
|
1
|
|
—
|
|
|||
|
Nebraska
|
1
|
|
4
|
|
—
|
|
|||
|
Nevada
|
5
|
|
5
|
|
1
|
|
|||
|
New Hampshire
|
4
|
|
5
|
|
—
|
|
|||
|
New Jersey
|
17
|
|
16
|
|
1
|
|
|||
|
New Mexico
|
7
|
|
4
|
|
—
|
|
|||
|
New York
|
30
|
|
28
|
|
3
|
|
|||
|
North Carolina
|
15
|
|
16
|
|
—
|
|
|||
|
North Dakota
|
5
|
|
2
|
|
—
|
|
|||
|
Ohio
|
14
|
|
19
|
|
—
|
|
|||
|
Oklahoma
|
2
|
|
3
|
|
—
|
|
|||
|
Oregon
|
5
|
|
6
|
|
1
|
|
|||
|
Pennsylvania
|
47
|
|
23
|
|
2
|
|
|||
|
Rhode Island
|
—
|
|
—
|
|
—
|
|
|||
|
South Carolina
|
6
|
|
6
|
|
—
|
|
|||
|
South Dakota
|
1
|
|
2
|
|
—
|
|
|||
|
Tennessee
|
7
|
|
13
|
|
—
|
|
|||
|
Texas
|
3
|
|
46
|
|
2
|
|
|||
|
Utah
|
1
|
|
2
|
|
—
|
|
|||
|
Vermont
|
2
|
|
1
|
|
—
|
|
|||
|
Virginia
|
6
|
|
16
|
|
—
|
|
|||
|
Washington
|
6
|
|
16
|
|
1
|
|
|||
|
West Virginia
|
7
|
|
3
|
|
—
|
|
|||
|
Wisconsin
|
7
|
|
8
|
|
—
|
|
|||
|
Wyoming
|
4
|
|
1
|
|
—
|
|
|||
|
Puerto Rico
|
21
|
|
9
|
|
—
|
|
|||
|
U.S. Virgin Islands
|
4
|
|
—
|
|
—
|
|
|||
|
Guam
|
1
|
|
—
|
|
—
|
|
|||
|
Totals
|
432
|
|
547
|
|
23
|
|
|||
18
|
|
Sears Domestic
|
||||||||
|
Kmart
|
Full-line Stores
|
Specialty Stores
|
|||||||
|
Owned
|
48
|
|
243
|
|
16
|
|
|||
|
Leased
|
384
|
|
304
|
|
7
|
|
|||
|
February 3, 2018
|
432
|
|
547
|
|
23
|
|
|||
In addition, at
February 3, 2018
, we had
30
domestic supply chain distribution centers, of which
10
were owned and
20
were leased with remaining lease terms ranging up to
10
years. Of the total,
six
primarily support Kmart stores,
20
primarily support Sears stores and
four
support both Sears and Kmart stores. We also had
400
domestic store warehouses, customer call centers and service facilities (including
20
facilities related to our Monark Premium Appliance Co. of California, Monark Premium Appliance Co., and Monark Premium Appliance Co. of Arizona businesses), most of which are leased for terms ranging from one to six years or are part of other facilities included in the above table. Many of our facilities are also used to support our online channels.
Our principal executive offices are located on a 200-acre site owned by us at the Prairie Stone office park in Hoffman Estates, Illinois. The complex consists of six interconnected office buildings totaling approximately two million gross square feet of office space. We also own an 86,000 square foot office building in Troy, Michigan. We operate numerous buying offices throughout the world that procure product internationally, as well as an information technology center in Pune, India.
A description of our leasing arrangements and commitments appears in Note 14 of Notes to Consolidated Financial Statements.
|
Item 3.
|
Legal Proceedings
|
See Part II, Item 8, Financial Statements—Notes to Consolidated Financial Statements, Note 18—Legal Proceedings, for additional information regarding legal proceedings, which information is incorporated herein by this reference.
|
Item 4.
|
Mine Safety Disclosures
|
Not applicable.
19
EXECUTIVE OFFICERS OF THE REGISTRANT
The following table and information sets forth the names of our executive officers, their current positions and offices with the Company, the date they first became executive officers of the Company, their current ages, and their principal employment during the past five years.
|
Name
|
Position
|
Date First Became an Executive Officer
|
Age
|
|||
|
Edward S. Lampert
|
Chairman of the Board and Chief Executive Officer
|
2013
|
55
|
|||
|
Robert A. Riecker
|
Chief Financial Officer
|
2012
|
53
|
|||
|
Julie Ainsworth
|
Chief People Officer
|
2017
|
46
|
|||
|
J. Mitchell Bowling
|
Chief Executive Officer, Sears Home Services
|
2017
|
51
|
|||
|
Leena Munjal
|
Chief Digital Officer
|
2013
|
41
|
|||
|
Robert (B.J.) Naedele
|
Chief Commercial Officer, Shop Your Way
|
2017
|
39
|
|||
|
Perry (Dean) Schwartz
|
President, Hardlines
|
2017
|
49
|
|||
|
Stephen L. Sitley
|
General Counsel and Chief Compliance Officer
|
2017
|
54
|
|||
__________________
Mr. Lampert has served as Chairman of the Company's Board of Directors since 2004 and as our Chief Executive Officer since February 2013. He also is the Chairman and Chief Executive Officer of ESL Investments, Inc., which he founded in April 1988.
Mr. Riecker was appointed to his current position in April 2017, and had served as Controller and Head of Capital Markets Activities since October 2016. He joined the Company as Assistant Controller in October 2005 and served as Vice President and Assistant Controller from May 2007 to October 2011. From October 2011 until his election as Vice President, Controller and Chief Accounting Officer in January 2012, he served as the Company's Vice President, Internal Audit.
Ms. Ainsworth joined the Company in March 2017 as Chief People Officer. Prior to joining the Company, she was Chief Executive Officer of celectiv LLC, a recruiting platform for technology-based companies, which she co-founded in 2014. From 2010 until 2013 she served as President of Warranty Division and Chief Marketing Officer of North American Services Division of Centrica plc, an energy and services company.
Mr. Bowling joined the Company in November 2017 as Chief Executive Officer, Sears Home Services. Prior to joining the Company, he served as Senior Vice President and Chief Operating Officer of Apollo Education Group, a leading provider of higher education for working adults, from December 2013 until April 2017, and prior to that, served as Senior Vice President and General Manager of New Businesses at Comcast, a global telecommunications provider, from 2009 until 2013.
Ms. Munjal was appointed to her current position in January 2018. She previously served as Senior Vice President, Customer Experience and Integrated Retail, since October 2012. She was appointed as Divisional Vice President, Integrated Retail and Member Experience, in July 2011 and was promoted to Vice President in June 2012. From October 2009 to June 2011, she served as Divisional Vice President, and Chief of Staff, Office of the Chairman, and served as Chief of Staff, Office of the CEO, from November 2007 to November 2009. Ms. Munjal joined Sears as Director, Information Technology, in March 2003.
Mr. Naedele joined the Company in March 2017. Prior to joining the Company, he served in a variety of roles with Nike, Inc., a company engaged in the design, development, marketing and sales of athletic gear and apparel, which he joined in July 2008, most recently as Vice President, Strategic Growth Initiatives from March 2016 until February 2017, and prior to that as Vice President, Global Brand Marketing from July 2014 until March 2016 and Global Business General Manager from July 2012 until July 2014.
Mr. Schwartz was appointed to his current position in April 2017. He previously served as President, Tools, Lawn & Garden, Fitness, Sporting Goods and Children's Entertainment from January 2017 until April 2017, as Vice President, Tools and Lawn & Garden from August 2016 until January 2017, as Vice President, Tools from May 2013 until August 2016, and as Vice President, Lawn & Garden from March 2009 until May 2013.
20
Mr. Sitley was appointed General Counsel in November 2017 and became Chief Compliance Officer in December 2017. From June 2016 until November 2017, he served as Vice President, Human Resources Operations, Compliance and Associate Relations, and prior to that, was Deputy General Counsel, Litigation and Employment from June 2011 until June 2016.
21
|
Item 5.
|
Market for Registrant's Common Equity, Related Stockholder Matters and Issuer Purchases of Equity Securities
|
Holdings' common stock is quoted on The NASDAQ Stock Market under the ticker symbol SHLD. There were 9,502 shareholders of record at
March 16, 2018
. The quarterly high and low sales prices for Holdings' common stock are set forth below.
|
|
Fiscal Year 2017
|
||||||||||||||
|
|
Sears Holdings
|
||||||||||||||
|
|
First
Quarter |
Second
Quarter |
Third
Quarter |
Fourth
Quarter |
|||||||||||
|
Common stock price
|
|
|
|
|
|||||||||||
|
High
|
$
|
14.32
|
|
$
|
11.49
|
|
$
|
9.63
|
|
$
|
5.85
|
|
|||
|
Low
|
$
|
5.50
|
|
$
|
6.20
|
|
$
|
5.48
|
|
$
|
2.31
|
|
|||
|
|
Fiscal Year 2016
|
||||||||||||||
|
|
Sears Holdings
|
||||||||||||||
|
|
First
Quarter |
Second
Quarter |
Third
Quarter |
Fourth
Quarter |
|||||||||||
|
Common stock price
|
|
|
|
|
|||||||||||
|
High
|
$
|
19.12
|
|
$
|
16.55
|
|
$
|
18.18
|
|
$
|
13.84
|
|
|||
|
Low
|
$
|
14.05
|
|
$
|
10.52
|
|
$
|
10.50
|
|
$
|
7.08
|
|
|||
Holdings has not paid cash dividends over the two most recent fiscal years and does not expect to pay cash dividends in the foreseeable future.
Equity Compensation Plan Information
The following table reflects information about securities authorized for issuance under our equity compensation plans at
February 3, 2018
.
|
Plan Category
|
Number of securities
to be issued upon
exercise of
outstanding options,
warrants and
rights
|
Weighted-average
exercise price of
outstanding
options,
warrants and
rights
|
Number of securities
remaining available for
future issuance
under equity
compensation plans*
|
||
|
Equity compensation plans approved by security holders
|
—
|
—
|
3,778,115
|
||
|
Equity compensation plans not approved by security holders
|
—
|
—
|
—
|
||
|
Total
|
—
|
—
|
3,778,115
|
||
__________________
|
*
|
Represents shares of common stock that may be issued pursuant to our 2013 Stock Plan. Awards under the 2013 Stock Plan may be restricted stock, stock unit awards, incentive stock options, nonqualified stock options, stock appreciation rights, or certain other stock-based awards. The 2013 Stock Plan also allows common stock of Holdings to be awarded in settlement of an incentive award under the Sears Holdings Corporation Umbrella Incentive Program (and any incentive program established thereunder). The shares shown exclude shares covered by an outstanding plan award that, subsequent to
February 3, 2018
, ultimately are not delivered on an unrestricted basis (for example, because the award is forfeited, canceled, settled in cash or used to satisfy tax withholding obligations).
|
22
Stock Performance Graph
Comparison of Five-Year Cumulative Stockholder Return
The following graph compares the cumulative total return to stockholders on Holdings' common stock from February 1, 2013 through February 2, 2018, the last trading day before the end of fiscal year
2017
, based on the market prices at the last trading day before the end of each fiscal year through and including fiscal year
2017
, with the return on the S&P 500 Index, the S&P 500 Retailing Index and the S&P 500 Department Stores Index for the same period. The graph assumes an initial investment of $100 on February 1, 2013 in each of our common stock, the S&P 500 Index, the S&P Retailing Index and the S&P 500 Department Stores Index. The graph further assumes reinvestment of the value of: (i) subscription rights to purchase shares of common stock of Sears Hometown and Outlet Stores, Inc. on September 13, 2012, the ex-distribution date of the distribution of such rights to Holdings’ shareholders; (ii) common shares of Sears Canada on November 13, 2012, the distribution date of such shares to Holdings’ shareholders; (iii) shares of Lands' End on April 7, 2014, the ex-distribution date of the distribution of such shares to Holdings' shareholders; (iv) subscription rights to purchase shares of common stock of Sears Canada on October 17, 2014, the ex-distribution date of the distribution of such rights to Holdings' shareholders; (v) subscription rights to purchase up to $625 million in aggregate principal amount of 8% senior unsecured notes due 2019 and warrants to purchase shares of Holdings' common stock on November 3, 2014, the ex-distribution date of the distribution of such rights to Holdings' shareholders; and (vi) subscription rights to purchase shares of common stock of Seritage Growth Properties on June 12, 2015, the distribution date of such rights to Holdings’ shareholders.
The S&P 500 Retailing Index consists of companies included in the S&P 500 Index in the broadly defined retail sector, which includes competing retailers of softlines (apparel and domestics) and hardlines (appliances, electronics and home improvement products), as well as food and drug retailers. The S&P 500 Department Stores Index consists primarily of department stores that compete with our full-line stores.
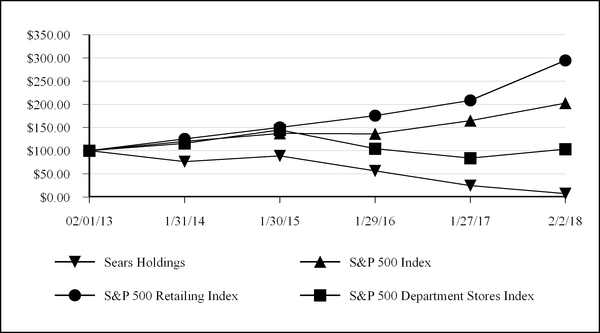
|
|
Feb 1, 2013
|
Jan 31, 2014
|
Jan 30, 2015
|
Jan 29, 2016
|
Jan 27, 2017
|
Feb 2, 2018
|
|||||||||||||||||
|
Sears Holdings
|
$
|
100.00
|
|
$
|
76.49
|
|
$
|
88.75
|
|
$
|
56.75
|
|
$
|
24.84
|
|
$
|
7.87
|
|
|||||
|
S&P 500 Index
|
$
|
100.00
|
|
$
|
120.29
|
|
$
|
137.39
|
|
$
|
136.47
|
|
$
|
164.93
|
|
$
|
202.57
|
|
|||||
|
S&P 500 Retailing Index
|
$
|
100.00
|
|
$
|
125.31
|
|
$
|
150.49
|
|
$
|
175.76
|
|
$
|
208.37
|
|
$
|
294.43
|
|
|||||
|
S&P 500 Department Stores Index
|
$
|
100.00
|
|
$
|
116.05
|
|
$
|
144.80
|
|
$
|
104.42
|
|
$
|
84.22
|
|
$
|
103.54
|
|
|||||
23
Purchase of Equity Securities
During the quarter ended
February 3, 2018
, we did not repurchase any shares of our common stock under our common share repurchase program. At
February 3, 2018
, we had approximately $504 million of remaining authorization under the program.
|
Total
Number of Shares Purchased (1) |
Average
Price Paid per Share |
Total Number of
Shares Purchased as Part of Publicly Announced Program (2) |
Average
Price Paid per Share for Publicly Announced Program |
Approximate
Dollar Value of Shares that May Yet Be Purchased Under the Program |
|||||||||||||
|
October 29, 2017 to November 25, 2017
|
—
|
|
$
|
—
|
|
—
|
|
$
|
—
|
|
|||||||
|
November 26, 2017 to December 30, 2017
|
—
|
|
—
|
|
—
|
|
—
|
|
|||||||||
|
December 31, 2017 to February 3, 2018
|
—
|
|
—
|
|
—
|
|
—
|
|
|||||||||
|
Total
|
—
|
|
$
|
—
|
|
—
|
|
$
|
—
|
|
$
|
503,907,832
|
|
||||
__________________
|
(1)
|
Consists entirely of
0
shares acquired from associates to meet withholding tax requirements from the vesting of restricted stock.
|
|
(2)
|
Our common share repurchase program was initially announced on September 14, 2005 and has a total authorization since inception of the program of $6.5 billion, including the authorizations to purchase up to an additional $500 million of common stock on each of December 17, 2009 and May 2, 2011. The program has no stated expiration date.
|
The Amended Domestic Credit Agreement (described in Management's Discussion and Analysis of Financial Condition and Results of Operations - Uses and Sources of Liquidity section below) limits our ability to make restricted payments, including dividends and share repurchases, subject to specified exceptions that are available if, in each case, no event of default under the credit facility exists immediately before or after giving effect to the restricted payment. These include exceptions that require that projected availability under the credit facility, as defined, is at least 15%, exceptions that may be subject to certain maximum amounts and an exception that requires that the restricted payment is funded from cash on hand and not from borrowings under the credit facility. Further, the Amended Domestic Credit Agreement includes customary covenants that restrict our ability to make dispositions, prepay debt and make investments, subject, in each case, to various exceptions. The Amended Domestic Credit Agreement also imposes various other requirements, which take effect if availability falls below designated thresholds, including a cash dominion requirement and a requirement that the fixed charge ratio at the last day of any quarter be not less than 1.0 to 1.0.
24
|
Item 6.
|
Selected Financial Data
|
The table below summarizes our recent financial information. The data set forth below should be read in conjunction with Management's Discussion and Analysis of Financial Condition and Results of Operations in Item 7 and our Consolidated Financial Statements and notes thereto in Item 8.
|
|
Fiscal
|
||||||||||||||||||
|
dollars in millions, except per share data
|
2017
|
2016
|
2015
|
2014
|
2013
|
||||||||||||||
|
Summary of Operations
|
|
|
|
|
|
||||||||||||||
|
Revenues
(1)
|
$
|
16,702
|
|
$
|
22,138
|
|
$
|
25,146
|
|
$
|
31,198
|
|
$
|
36,188
|
|
||||
|
Domestic comparable store sales %
|
(13.5
|
)%
|
(7.4
|
)%
|
(9.2
|
)%
|
(1.8
|
)%
|
(3.8
|
)%
|
|||||||||
|
Net loss from continuing operations attributable to Holdings' shareholders
|
(383
|
)
|
(2,221
|
)
|
(1,129
|
)
|
(1,682
|
)
|
(1,365
|
)
|
|||||||||
|
Per Common Share
|
|
|
|
|
|
|
|
|
|
|
|||||||||
|
Basic:
|
|
|
|
|
|
|
|
|
|
|
|||||||||
|
Net loss from continuing operations attributable to Holdings' shareholders
|
$
|
(3.57
|
)
|
$
|
(20.78
|
)
|
$
|
(10.59
|
)
|
$
|
(15.82
|
)
|
$
|
(12.87
|
)
|
||||
|
Diluted:
|
|
|
|
|
|
|
|
|
|
|
|||||||||
|
Net loss from continuing operations attributable to Holdings' shareholders
|
$
|
(3.57
|
)
|
$
|
(20.78
|
)
|
$
|
(10.59
|
)
|
$
|
(15.82
|
)
|
$
|
(12.87
|
)
|
||||
|
Holdings' book value per common share
|
$
|
(34.54
|
)
|
$
|
(35.71
|
)
|
$
|
(18.40
|
)
|
$
|
(8.93
|
)
|
$
|
16.34
|
|
||||
|
Financial Data
|
|
|
|
|
|
|
|
|
|||||||||||
|
Total assets
|
$
|
7,262
|
|
$
|
9,362
|
|
$
|
11,337
|
|
$
|
13,185
|
|
$
|
18,234
|
|
||||
|
Long-term debt
|
2,199
|
|
3,470
|
|
1,971
|
|
2,878
|
|
2,531
|
|
|||||||||
|
Long-term capital lease obligations
|
50
|
|
103
|
|
137
|
|
210
|
|
275
|
|
|||||||||
|
Capital expenditures
|
80
|
|
142
|
|
211
|
|
270
|
|
329
|
|
|||||||||
|
Adjusted EBITDA
(2)
|
(562
|
)
|
(808
|
)
|
(836
|
)
|
(718
|
)
|
(487
|
)
|
|||||||||
|
Number of stores
|
1,002
|
|
1,430
|
|
1,672
|
|
1,725
|
|
2,429
|
|
|||||||||
|
(1)
|
We follow a retail-based financial reporting calendar. Accordingly, the fiscal year ended February 3, 2018 contained 53 weeks, while all other years presented contained 52 weeks.
|
|
(2)
|
See "Management's Discussion and Analysis of Financial Condition and Results of Operations" in Item 7 for a reconciliation of this measure to GAAP and a discussion of management’s reasoning for using such measure. The periods presented were impacted by certain significant items, which affected the comparability of amounts reflected in the above selected financial data. For
2017
,
2016
and
2015
, these significant items are discussed within Item 7, "Management's Discussion and Analysis of Financial Condition and Results of Operations." 2014 results include the impact of domestic pension expense of $89 million, store closings and severance of $224 million, other expenses of $50 million and the results of Lands' End and Sears Canada that were included in the results of operations prior to the separations of $(10) million and $71 million, respectively. 2013 results include the impact of domestic pension expense of $162 million, domestic store closings and severance of $130 million, and the results of Lands' End and Sears Canada that were included in the results of our operations prior to the separations of $(150) million and $(3) million, respectively. Both 2014 and 2013 also included charges related to impairments, as well as gains on sales of assets.
|
25
|
Item 7.
|
Management's Discussion and Analysis of Financial Condition and Results of Operations
|
We have divided our Management's Discussion and Analysis of Financial Condition and Results of Operations into the following six sections:
|
•
|
Overview of Holdings
|
|
•
|
Results of Operations:
|
Fiscal Year
Holdings' Consolidated Results
Business Segment Results
|
•
|
Analysis of Consolidated Financial Condition
|
|
•
|
Contractual Obligations and Off-Balance Sheet Arrangements
|
|
•
|
Application of Critical Accounting Policies and Estimates
|
|
•
|
Cautionary Statement Regarding Forward-Looking Information
|
The discussion that follows should be read in conjunction with the Consolidated Financial Statements and notes thereto included in Item 8.
OVERVIEW OF HOLDINGS
Holdings, the parent company of Kmart and Sears, was formed in connection with the March 24, 2005 merger of these two companies. We are an integrated retailer with significant physical and intangible assets, as well as virtual capabilities enabled through technology. We operate a national network of stores, with
1,002
full-line and specialty retail stores in the United States, operating as Kmart and Sears. Further, we operate a number of websites under the sears.com and kmart.com banners which offer millions of products and provide the capability for our members and customers to engage in cross-channel transactions such as
free store pickup; buy in store/ship to home; and buy online, return in store.
We are also the home of Shop Your Way
®
,
a free membership program that connects its members to personalized products, programs and partners that help them save time and money every day. Through an extensive network of national and local partners, members can shop thousands of their favorite brands, dine out and access an array of exclusive partners to earn points to redeem for savings on future purchases at
Sears, Kmart, Lands' End and at ShopYourWay.com.
We conduct our operations in two business segments: Kmart and Sears Domestic. The nature of operations conducted within each of these segments is discussed within the Business Segments section of Item 1 in this Annual Report on Form 10-K. Our business segments have been determined in accordance with accounting standards regarding the determination, and reporting, of business segments.
RESULTS OF OPERATIONS
Fiscal Year
Our fiscal year end is the Saturday closest to January 31 each year. Fiscal year
2017
consisted of 53 weeks. Fiscal years
2016
and
2015
consisted of 52 weeks. Unless otherwise stated, references to years in this report relate to fiscal years rather than to calendar years.
26
Holdings' Consolidated Results
Holdings' consolidated results of operations for
2017
,
2016
and
2015
are summarized as follows:
|
dollars in millions, except per share data
|
2017
|
2016
|
2015
|
|||||||||
|
REVENUES
|
||||||||||||
|
Merchandise sales
|
$
|
13,409
|
|
$
|
18,236
|
|
$
|
20,936
|
|
|||
|
Services and other
|
3,293
|
|
3,902
|
|
4,210
|
|
||||||
|
Total revenues
|
16,702
|
|
22,138
|
|
25,146
|
|
||||||
|
COSTS AND EXPENSES
|
||||||||||||
|
Cost of sales, buying and occupancy - merchandise sales
|
11,349
|
|
15,184
|
|
16,817
|
|
||||||
|
Gross margin dollars - merchandise sales
|
2,060
|
|
3,052
|
|
4,119
|
|
||||||
|
Gross margin rate - merchandise sales
|
15.4
|
%
|
16.7
|
%
|
19.7
|
%
|
||||||
|
Cost of sales and occupancy - services and other
|
1,826
|
|
2,268
|
|
2,519
|
|
||||||
|
Gross margin dollars - services and other
|
1,467
|
|
1,634
|
|
1,691
|
|
||||||
|
Gross margin rate - services and other
|
44.5
|
%
|
41.9
|
%
|
40.2
|
%
|
||||||
|
Total cost of sales, buying and occupancy
|
13,175
|
|
17,452
|
|
19,336
|
|
||||||
|
Total gross margin dollars
|
3,527
|
|
4,686
|
|
5,810
|
|
||||||
|
Total gross margin rate
|
21.1
|
%
|
21.2
|
%
|
23.1
|
%
|
||||||
|
Selling and administrative
|
5,131
|
|
6,109
|
|
6,857
|
|
||||||
|
Selling and administrative expense as a percentage of total revenues
|
30.7
|
%
|
27.6
|
%
|
27.3
|
%
|
||||||
|
Depreciation and amortization
|
332
|
|
375
|
|
422
|
|
||||||
|
Impairment charges
|
142
|
|
427
|
|
274
|
|
||||||
|
Gain on sales of assets
|
(1,648
|
)
|
(247
|
)
|
(743
|
)
|
||||||
|
Total costs and expenses
|
17,132
|
|
24,116
|
|
26,146
|
|
||||||
|
Operating loss
|
(430
|
)
|
(1,978
|
)
|
(1,000
|
)
|
||||||
|
Interest expense
|
(539
|
)
|
(404
|
)
|
(323
|
)
|
||||||
|
Interest and investment loss
|
(12
|
)
|
(26
|
)
|
(62
|
)
|
||||||
|
Other income
|
—
|
|
13
|
|
—
|
|
||||||
|
Loss before income taxes
|
(981
|
)
|
(2,395
|
)
|
(1,385
|
)
|
||||||
|
Income tax benefit
|
598
|
|
174
|
|
257
|
|
||||||
|
Net loss
|
(383
|
)
|
(2,221
|
)
|
(1,128
|
)
|
||||||
|
Income attributable to noncontrolling interests
|
—
|
|
—
|
|
(1
|
)
|
||||||
|
NET LOSS ATTRIBUTABLE TO HOLDINGS’ SHAREHOLDERS
|
$
|
(383
|
)
|
$
|
(2,221
|
)
|
$
|
(1,129
|
)
|
|||
|
NET LOSS PER COMMON SHARE ATTRIBUTABLE TO HOLDINGS’ SHAREHOLDERS
|
||||||||||||
|
Diluted loss per share
|
$
|
(3.57
|
)
|
$
|
(20.78
|
)
|
$
|
(10.59
|
)
|
|||
|
Diluted weighted average common shares outstanding
|
107.4
|
|
106.9
|
|
106.6
|
|
||||||
27
References to comparable store sales amounts within the following discussion include sales for all stores operating for a period of at least 12 full months, including remodeled and expanded stores, but excluding store relocations and stores that have undergone format changes. Comparable store sales amounts include sales from sears.com and kmart.com shipped directly to customers. These online sales resulted in a
negative impact
to our comparable store sales results of approximately 70 basis points and 20 basis points for
2017
and
2016
, respectively. In addition, comparable store sales have been adjusted for the change in the unshipped sales reserves recorded at the end of each reporting period, which resulted in a benefit of 30 basis points in
2017
and did not have any impact in
2016
.
Comparable store sales results for
2017
were calculated based on the 52-week period ended January 27, 2018 as compared to the comparable 52-week period in the prior year, while comparable store sales results for
2016
were calculated based on the 52-week period ended
January 28, 2017
as compared to the comparable 52-week period in the prior year.
2017
Compared to
2016
Net Loss Attributable to Holdings' Shareholders
We recorded a net loss attributable to Holdings' shareholders of
$383 million
(
$3.57
loss per diluted share) and
$2.2 billion
(
$20.78
loss per diluted share) for
2017
and
2016
, respectively. The decrease in net loss for the year primarily reflected an increase in gain on sales of assets, a decrease in selling and administrative expenses and an increase in income tax benefit, partially offset by a decline in gross margin, which was primarily driven by the decline in revenues. Our results for
2017
and
2016
were affected by a number of significant items.
In addition to our net loss attributable to Holdings' shareholders determined in accordance with Generally Accepted Accounting Principles ("GAAP"), for purposes of evaluating operating performance, we use Adjusted Earnings Before Interest, Taxes, Depreciation and Amortization ("Adjusted EBITDA").
Adjusted EBITDA was determined as follows:
|
millions
|
2017
|
2016
|
2015
|
||||||||
|
Net loss attributable to Holdings per statement of operations
|
$
|
(383
|
)
|
$
|
(2,221
|
)
|
$
|
(1,129
|
)
|
||
|
Income attributable to noncontrolling interests
|
—
|
|
—
|
|
1
|
|
|||||
|
Income tax benefit
|
(598
|
)
|
(174
|
)
|
(257
|
)
|
|||||
|
Interest expense
|
539
|
|
404
|
|
323
|
|
|||||
|
Interest and investment loss
|
12
|
|
26
|
|
62
|
|
|||||
|
Other income
|
—
|
|
(13
|
)
|
—
|
|
|||||
|
Operating loss
|
(430
|
)
|
(1,978
|
)
|
(1,000
|
)
|
|||||
|
Depreciation and amortization
|
332
|
|
375
|
|
422
|
|
|||||
|
Gain on sales of assets
|
(1,648
|
)
|
(247
|
)
|
(743
|
)
|
|||||
|
Impairment charges
|
142
|
|
427
|
|
274
|
|
|||||
|
Before excluded items
|
(1,604
|
)
|
(1,423
|
)
|
(1,047
|
)
|
|||||
|
Closed store reserve and severance
|
462
|
|
384
|
|
98
|
|
|||||
|
Pension expense
|
656
|
|
288
|
|
229
|
|
|||||
|
Other
(1)
|
2
|
|
31
|
|
(64
|
)
|
|||||
|
Amortization of deferred Seritage gain
|
(78
|
)
|
(88
|
)
|
(52
|
)
|
|||||
|
Adjusted EBITDA
|
$
|
(562
|
)
|
$
|
(808
|
)
|
$
|
(836
|
)
|
||
(1)
Consisted of items associated with legal matters, expenses associated with natural disasters, transaction costs associated with strategic initiatives, one-time credits from vendors and other expenses.
28
Adjusted EBITDA for our segments was as follows:
|
2017
|
2016
|
2015
|
|||||||||||||||||||||||||||
|
millions
|
Kmart
|
Sears Domestic
|
Sears Holdings
|
Kmart
|
Sears Domestic
|
Sears Holdings
|
Kmart
|
Sears Domestic
|
Sears Holdings
|
||||||||||||||||||||
|
Operating income (loss) per statement of operations
|
$
|
367
|
|
$
|
(797
|
)
|
$
|
(430
|
)
|
$
|
(530
|
)
|
$
|
(1,448
|
)
|
$
|
(1,978
|
)
|
$
|
(292
|
)
|
$
|
(708
|
)
|
$
|
(1,000
|
)
|
||
|
Depreciation and amortization
|
60
|
|
272
|
|
332
|
|
71
|
|
304
|
|
375
|
|
72
|
|
350
|
|
422
|
|
|||||||||||
|
Gain on sales of assets
|
(881
|
)
|
(767
|
)
|
(1,648
|
)
|
(181
|
)
|
(66
|
)
|
(247
|
)
|
(185
|
)
|
(558
|
)
|
(743
|
)
|
|||||||||||
|
Impairment charges
|
16
|
|
126
|
|
142
|
|
22
|
|
405
|
|
427
|
|
14
|
|
260
|
|
274
|
|
|||||||||||
|
Before excluded items
|
(438
|
)
|
(1,166
|
)
|
(1,604
|
)
|
(618
|
)
|
(805
|
)
|
(1,423
|
)
|
(391
|
)
|
(656
|
)
|
(1,047
|
)
|
|||||||||||
|
Closed store reserve and severance
|
281
|
|
181
|
|
462
|
|
318
|
|
66
|
|
384
|
|
86
|
|
12
|
|
98
|
|
|||||||||||
|
Pension expense
|
—
|
|
656
|
|
656
|
|
—
|
|
288
|
|
288
|
|
—
|
|
229
|
|
229
|
|
|||||||||||
|
Other
(1)
|
(23
|
)
|
25
|
|
2
|
|
15
|
|
16
|
|
31
|
|
43
|
|
(107
|
)
|
(64
|
)
|
|||||||||||
|
Amortization of deferred Seritage gain
|
(11
|
)
|
(67
|
)
|
(78
|
)
|
(17
|
)
|
(71
|
)
|
(88
|
)
|
(11
|
)
|
(41
|
)
|
(52
|
)
|
|||||||||||
|
Adjusted EBITDA
|
$
|
(191
|
)
|
$
|
(371
|
)
|
$
|
(562
|
)
|
$
|
(302
|
)
|
$
|
(506
|
)
|
$
|
(808
|
)
|
$
|
(273
|
)
|
$
|
(563
|
)
|
$
|
(836
|
)
|
||
|
% to revenues
|
(3.4
|
)%
|
(3.3
|
)%
|
(3.4
|
)%
|
(3.5
|
)%
|
(3.8
|
)%
|
(3.6
|
)%
|
(2.7
|
)%
|
(3.8
|
)%
|
(3.3
|
)%
|
|||||||||||
(1)
Consisted of items associated with legal matters, expenses associated with natural disasters, transaction costs associated with strategic initiatives, one-time credits from vendors and other expenses.
The following tables set forth the impact each excluded item used in calculating Adjusted EBITDA had on specific income and expense amounts reported in our Consolidated Statements of Operations during the years
2017
,
2016
and
2015
.
|
millions
|
Year Ended February 3, 2018
|
|||||||||||||||||||
|
Other Excluded Items:
|
Closed store reserve and severance
|
Pension expense
|
Other
(1)
|
Amortization of deferred Seritage gain
|
Total
|
|||||||||||||||
|
Gross margin impact
|
$
|
227
|
|
$
|
—
|
|
$
|
—
|
|
$
|
(78
|
)
|
$
|
149
|
|
|||||
|
Selling and administrative impact
|
235
|
|
656
|
|
2
|
|
—
|
|
893
|
|
||||||||||
|
Total
|
$
|
462
|
|
$
|
656
|
|
$
|
2
|
|
$
|
(78
|
)
|
$
|
1,042
|
|
|||||
|
millions
|
Year Ended January 28, 2017
|
|||||||||||||||||||
|
Other Excluded Items:
|
Closed store reserve and severance
|
Pension expense
|
Other
(1)
|
Amortization of deferred Seritage gain
|
Total
|
|||||||||||||||
|
Gross margin impact
|
$
|
226
|
|
$
|
—
|
|
$
|
(33
|
)
|
$
|
(88
|
)
|
$
|
105
|
|
|||||
|
Selling and administrative impact
|
158
|
|
288
|
|
64
|
|
—
|
|
510
|
|
||||||||||
|
Total
|
$
|
384
|
|
$
|
288
|
|
$
|
31
|
|
$
|
(88
|
)
|
$
|
615
|
|
|||||
|
millions
|
Year Ended January 30, 2016
|
|||||||||||||||||||
|
Other Excluded Items:
|
Closed store reserve and severance
|
Pension expense
|
Other
(1)
|
Amortization of deferred Seritage gain
|
Total
|
|||||||||||||||
|
Gross margin impact
|
$
|
44
|
|
$
|
—
|
|
$
|
(146
|
)
|
$
|
(52
|
)
|
$
|
(154
|
)
|
|||||
|
Selling and administrative impact
|
54
|
|
229
|
|
82
|
|
—
|
|
365
|
|
||||||||||
|
Total
|
$
|
98
|
|
$
|
229
|
|
$
|
(64
|
)
|
$
|
(52
|
)
|
$
|
211
|
|
|||||
(1)
Consisted of items associated with legal matters, expenses associated with natural disasters, transaction costs associated with strategic initiatives, one-time credits from vendors and other expenses.
29
Adjusted EBITDA is computed as net loss attributable to Sears Holdings Corporation appearing on the Statements of Operations excluding income attributable to noncontrolling interests, income tax benefit, interest expense, interest and investment loss, other income, depreciation and amortization, gain on sales of assets and impairment charges. In addition, it is adjusted to exclude certain significant items as set forth below. Our management uses Adjusted EBITDA to evaluate the operating performance of our businesses, as well as executive compensation metrics, for comparable periods. Adjusted EBITDA should not be used by investors or other third parties as the sole basis for formulating investment decisions as it excludes a number of important cash and non-cash recurring items.
While Adjusted EBITDA is a non-GAAP measurement, management believes that it is an important indicator of ongoing operating performance, and useful to investors, because:
|
•
|
EBITDA excludes the effects of financings and investing activities by eliminating the effects of interest and depreciation costs;
|
|
•
|
Management considers gains/(losses) on the sale of assets to result from investing decisions rather than ongoing operations; and
|
|
•
|
Other significant items, while periodically affecting our results, may vary significantly from period to period and have a disproportionate effect in a given period, which affects comparability of results. We have adjusted our results for these items to make our statements more comparable and therefore more useful to investors as the items are not representative of our ongoing operations and reflect past investment decisions.
|
These other significant items included in Adjusted EBITDA are further explained as follows:
|
•
|
Closed store reserve and severance – We are transforming our Company to a less asset-intensive business model. Throughout this transformation, we continue to make choices related to our stores, which could result in sales, closures, lease terminations or a variety of other decisions.
|
|
•
|
Pension expense – Contributions to our pension plans remain a significant use of our cash on an annual basis. Cash contributions to our pension and postretirement plans are separately disclosed on the cash flow statement. While the Company's pension plan is frozen, and thus associates do not currently earn pension benefits, we have a legacy pension obligation for past service performed by Kmart and Sears associates. The annual pension expense included in our statement of operations related to these legacy domestic pension plans was relatively minimal in years prior to 2009. However, due to the severe decline in the capital markets that occurred in the latter part of 2008, and the resulting abnormally low interest rates, which continue to persist, our domestic pension expense was
$656 million
in
2017
,
$288 million
in
2016
and
$229 million
in
2015
. Pension expense is comprised of interest cost, expected return on plan assets and recognized net loss and other. This adjustment eliminates the entire pension expense from the statement of operations to improve comparability. Pension expense is included in the determination of net loss.
|
As further described in Note 7 of Notes to Consolidated Financial Statements, settlement charges also impacted pension expense in 2017. In conjunction with executing two separate agreements to purchase group annuity contracts in May 2017 and August 2017, the Company recorded non-cash charges of $200 million and $203 million, respectively, during the second and third quarters of 2017 for losses previously accumulated in other comprehensive income (loss), which were recognized through the statement of operations upon settlement. In addition, in conjunction with a lump sum offer completed in 2017, the Company recorded a non-cash charge of $76 million for losses previously accumulated in other comprehensive income (loss), which was recognized through the statement of operations immediately upon settlement during the fourth quarter of 2017.
30
The components of the adjustments to EBITDA related to pension expense were as follows:
|
millions
|
2017
|
2016
|
2015
|
||||||||
|
Components of net periodic expense:
|
|||||||||||
|
Interest cost
|
$
|
180
|
|
$
|
227
|
|
$
|
210
|
|
||
|
Expected return on plan assets
|
(190
|
)
|
(202
|
)
|
(249
|
)
|
|||||
|
Settlements
|
479
|
|
—
|
|
—
|
|
|||||
|
Recognized net loss and other
|
187
|
|
263
|
|
268
|
|
|||||
|
Net periodic expense
|
$
|
656
|
|
$
|
288
|
|
$
|
229
|
|
||
In accordance with GAAP, we recognize on the balance sheet actuarial gains and losses for defined benefit pension plans annually in the fourth quarter of each fiscal year and whenever a plan is determined to qualify for a remeasurement during a fiscal year. For income statement purposes, these actuarial gains and losses are recognized throughout the year through an amortization process. The Company recognizes in its results of operations, as a corridor adjustment, any unrecognized actuarial net gains or losses that exceed 10% of the larger of projected benefit obligations or plan assets. Accumulated gains/losses that are inside the 10% corridor are not recognized, while accumulated actuarial gains/losses that are outside the 10% corridor are amortized over the "average future service" of the population and are included in the recognized net loss and other line item above.
Actuarial gains and losses occur when actual experience differs from the estimates used to allocate the change in value of pension plans to expense throughout the year or when assumptions change, as they may each year. Significant factors that can contribute to the recognition of actuarial gains and losses include changes in discount rates used to remeasure pension obligations on an annual basis or upon a qualifying remeasurement, differences between actual and expected returns on plan assets and other changes in actuarial assumptions. Management believes these actuarial gains and losses are primarily financing activities that are more reflective of changes in current conditions in global financial markets (and in particular interest rates) that are not directly related to the underlying business and that do not have an immediate, corresponding impact on the benefits provided to eligible retirees. For further information on the actuarial assumptions and plan assets referenced above, see Management's Discussion and Analysis of Financial Condition and Results of Operations - Application of Critical Accounting Policies and Estimates - Defined Benefit Pension Plans, and Note 7 of Notes to Consolidated Financial Statements.
|
•
|
Other – Consisted of items associated with legal matters, expenses associated with natural disasters, transaction costs associated with strategic initiatives, one-time credits from vendors and other expenses.
|
|
•
|
Amortization of deferred Seritage gain – A portion of the gain on the Seritage transaction and certain other sale-leaseback transactions were deferred and will be recognized in proportion to the related rent expense, which is a component of cost of sales, buying and occupancy in the Consolidated Statements of Operations, over the lease terms. Management considers the amortization of the deferred Seritage gain to result from investing decisions rather than ongoing operations.
|
Revenues and Comparable Store Sales
Total revenues decreased
$5.4 billion
, or
24.6%
, to
$16.7 billion
in
2017
compared to
2016
primarily driven by the decline in merchandise sales of
$4.8 billion
. The decline in merchandise sales included a decrease of approximately
$3.2 billion
as a result of having fewer Kmart and Sears Full-line stores in operation. For the full year, comparable store sales declined
13.5%
, which contributed to
$1.9 billion
of the revenue decline relative to the prior year. The Company recognized approximately
$189 million
of revenues during the 53rd week of
2017
. Services and other revenues declined
$609 million
during 2017 as compared to 2016, primarily driven by a decline in service-related revenues of approximately
$295 million
, as well as a decline in revenues from Sears Hometown and Outlet Stores, Inc. ("SHO") of approximately
$208 million
during
2017
as compared to
2016
.
Kmart comparable store sales declined
11.4%
for the full year primarily driven by declines in the pharmacy, grocery & household, home, drugstore, consumer electronics and apparel categories. Sears Domestic comparable
31
store sales for the year declined
15.2%
primarily driven by decreases in the home appliances, apparel, consumer electronics and lawn & garden categories.
Gross Margin
Total gross margin declined
$1.2 billion
to $
3.5 billion
in
2017
as compared to the prior year primarily as a result of the above noted decline in sales, as well as a slight decline in gross margin rate, as the decline in gross margin rate for merchandise sales was partially offset by an improvement in gross margin rate for services and other. Gross margin for
2017
and
2016
included charges of
$227 million
and
$226 million
, respectively, related to store closures. Gross margin for
2017
and
2016
also included credits of
$78 million
and
$88 million
, respectively, related to the amortization of the deferred gain on sale of assets associated with the Seritage transaction, while
2016
also included one-time vendor credits of
$33 million
.
As compared to the prior year, Kmart's gross margin rate for
2017
increased
10
basis points, while Sears Domestic's gross margin rate
decreased
60
basis points. Gross margin for Kmart and Sears Domestic were negatively impacted by expenses associated with store closures. Excluding the impact of significant items as noted in the Adjusted EBITDA tables, Kmart's gross margin rate would have improved 60 basis points in 2017 as compared to the prior year, while Sears Domestic's gross margin rate would have been flat to the prior year. The improvement in Kmart's gross margin rate was primarily driven by margin rate improvement in the apparel, home and drugstore categories, partially offset by a decline in the pharmacy category. Sears Domestic's gross margin rate for
2017
reflects improvement in the apparel category, which was offset by declines in the home appliances and tools categories. Kmart experienced lower clearance markdowns and Shop Your Way points expense, partially offset by an increase in promotional markdowns, while Sears Domestic experienced lower clearance markdowns, offset by an increase in both promotional markdowns and Shop Your Way points expense.
In addition, as a result of the Seritage and JV transactions,
2017
and 2016 included additional rent expense of approximately $169 million and $197 million, respectively. Due to the structure of the leases, we expect that our cash rent obligations to Seritage and the joint venture partners will decline, over time, as space in these stores is recaptured. From the inception of the Seritage transaction to date, we have received recapture notices on 55 properties and we also exercised our right to terminate the lease on 56 properties.
Selling and Administrative Expenses
Selling and administrative expenses decreased
$978 million
to
$5.1 billion
in
2017
from
$6.1 billion
in
2016
and included significant items, as noted in the Adjusted EBITDA tables, which aggregated to an expense of
$893 million
and
$510 million
for
2017
and
2016
, respectively. Excluding these items, selling and administrative expenses declined
$1.4 billion
, primarily due to a decrease in payroll expense. In addition, advertising expense also declined as we continued to shift away from traditional advertising to use of Shop Your Way points expense, which is included within gross margin.
Selling and administrative expenses as a percentage of total revenues ("selling and administrative expense rate") were
30.7%
and
27.6%
for
2017
and
2016
, respectively, as the decreases in overall selling and administrative expenses were more than offset by the above noted decline in revenues.
Depreciation and Amortization
Depreciation and amortization expense decreased by
$43 million
during
2017
to
$332 million
, as compared to
2016
, primarily due to having fewer assets to depreciate.
Impairment Charges
We recorded impairment charges of
$142 million
in
2017
, which consisted of impairment of $72 million related to the Sears trade name, as well as
$70 million
related to the impairment of long-lived assets. We recorded impairment charges of
$427 million
in
2016
, which consisted of impairment of $381 million related to the Sears trade name, as well as
$46 million
related to the impairment of long-lived assets. Impairment charges recorded in both years are described further in Notes 1 and 13 of Notes to Consolidated Financial Statements.
32
Gain on Sales of Assets
We recorded total gains on sales of assets of
$1.6 billion
in
2017
and
$247 million
in
2016
, which were primarily attributable to several significant real estate transactions. The gains recorded during 2017 included gains of $708 million recognized on the sale or amendment and lease terminations of 95 locations, $492 million recognized on the Craftsman Sale, $253 million as a result of recapture and lease termination activity and two stores that qualified for sales recognition and sale-leaseback accounting and $79 million related to other asset sales. Gains on sales of assets are described further in Note 11 of Notes to Consolidated Financial Statements.
Operating Loss
We recorded an operating loss of
$430 million
and
$2.0 billion
in
2017
and
2016
, respectively. The operating loss for
2017
included significant items, as noted in the Adjusted EBITDA tables, which totaled
$1.0 billion
, while operating loss for
2016
included significant items which totaled
$615 million
. Both 2017 and 2016 also included charges related to impairments, as well as gains on sales of assets. Taking these significant items into consideration, the decrease in operating loss in
2017
was primarily driven by the decrease in selling and administrative expenses, partially offset by the decline in gross margin noted above.
Interest Expense
We incurred
$539 million
and
$404 million
in interest expense during
2017
and
2016
, respectively. The increase is due to an increase in average outstanding borrowings in
2017
, as well as an increase in the annual weighted-average interest rate for our borrowings.
Interest and Investment Loss
We recorded interest and investment loss of
$12 million
during
2017
compared to
$26 million
during
2016
. Interest and investment loss is described further in Note 6 of Notes to Consolidated Financial Statements.
Income Taxes
We recorded an income tax benefit of
$598 million
in
2017
compared with an income tax benefit of
$174 million
in
2016
. Our effective tax rate for
2017
was a benefit of
61.0%
compared to a benefit of
7.3%
for 2016. On December 22, 2017, the U.S. government enacted comprehensive tax legislation commonly referred to as the Tax Cuts and Jobs Act (the "Tax Act"). The Tax Act makes broad and complex changes to the U.S. tax code that affected our fiscal year ended February 3, 2018, including, but not limited to, (1) reducing the U.S. federal corporate tax rate to 21%, (2) requiring a one-time transition tax on certain unrepatriated earnings of foreign subsidiaries that is payable over eight years and (3) various other miscellaneous changes that are effective in fiscal 2017. With the lower U.S. federal corporate rate effective beginning January 1, 2018, our U.S. federal corporate tax rate for fiscal 2017 is a blended rate of 33.717%. The income tax benefit for the period ended February 3, 2018 included a tax benefit of approximately $470 million related to the impacts of the Tax Act. In addition to the impact of the Tax Act, the Company also realized a significant tax benefit during 2017 on the reversal of deferred taxes mainly related to the Craftsman Sale, but also related to indefinite-life assets associated with property sold. Our tax rate in
2017
continues to reflect the effect of not recognizing the benefit of current period losses in certain domestic and foreign jurisdictions where it is more likely than not that such benefits would be realized. In addition,
2017
was negatively impacted by foreign branch taxes and state income taxes.
During 2016, the Company realized a significant tax benefit on the deferred taxes related to the partial impairment of the Sears trade name.
I
n addition, the Company recorded a tax benefit related to the net gain on pension and other postretirement benefits in continuing operations and a corresponding tax expense of the same amount in other comprehensive income.
A
lso, the application of the requirements for accounting for income taxes, after consideration of our valuation allowance, caused a significant variation in the typical relationship between income tax expense and pretax income. Our tax rate in 2016 reflected the effect of not recognizing the benefit of current period losses in certain domestic and foreign jurisdictions where it was not more likely than not that such benefits would be realized. In addition, 2016 was negatively impacted by foreign branch taxes and state income taxes.
33
2016
Compared to
2015
Net Loss Attributable to Holdings' Shareholders
We recorded a net loss attributable to Holdings' shareholders of $2.2 billion ($20.78 loss per diluted share) and $1.1 billion ($10.59 loss per diluted share) for 2016 and 2015, respectively. The increase in net loss for the year primarily reflected a decline in gross margin, which was driven by a decline in both revenues and gross margin rate, partially offset by a decrease in selling and administrative expenses.
Revenues and Comparable Store Sales
Total revenues decreased $3.0 billion, or 12.0%, to $22.1 billion in 2016, as compared to revenues of $25.1 billion in 2015, primarily driven by the decline in merchandise sales of
$2.7 billion
. The decline in merchandise sales included a decrease of $1.3 billion as a result of having fewer Kmart and Sears Full-line stores in operation. For the full year, comparable store sales declined 7.4%, which contributed to $1.4 billion of the revenue decline relative to the prior year. Services and other revenues declined
$308 million
during 2016 as compared to 2015, primarily driven by a decline in service-related revenues of approximately
$30 million
, as well as a decline in revenues from SHO of approximately $238 million during 2016 as compared to 2015.
Kmart comparable store sales declined 5.3% for the full year primarily driven by declines in the grocery & household, consumer electronics and pharmacy categories. Sears Domestic comparable store sales for the year declined 9.3% primarily driven by decreases in the home appliances, apparel and consumer electronics categories.
Gross Margin
Total gross margin declined $1.1 billion to $4.7 billion in 2016 from $5.8 billion in 2015 as a result of the above noted decline in sales, as well as a decline in gross margin rate, as the decline in gross margin rate for merchandise sales was partially offset by an improvement in gross margin rate for services and other. Gross margin for 2016 included one-time vendor credits of $33 million, as well as a credit of $88 million related to the amortization of the deferred gain on sale of assets associated with the Seritage transaction, while 2015 included one-time vendor credits of $146 million, as well as a credit of $52 million related to the amortization of the deferred gain on sale of assets associated with the Seritage transaction. Gross margin for 2016 and 2015 also included charges of $226 million and $44 million, respectively, related to store closures.
As compared to the prior year, Kmart's gross margin rate for 2016 declined 310 basis points. Excluding significant items primarily related to store closures as noted in the Adjusted EBITDA tables, Kmart's gross margin rate would have declined 130 basis points with margin rate declines experienced across most categories, most notably in the apparel, grocery & household, drugstore, home and pharmacy categories. Sears Domestic's gross margin rate for 2016 decreased 130 basis points. Excluding the impact of significant items in both years primarily related to the amortization of the deferred gain on sale of assets associated with the Seritage transaction, one-time vendor credits and store closures, Sears Domestic's gross margin rate declined 60 basis points, with the most notable decreases experienced in the apparel, home appliances and footwear categories. The decline in margin rate experienced in both Kmart and Sears Domestic is primarily attributable to increased markdowns, including an increase in Shop Your Way points expense.
In addition, as a result of the Seritage and JV transactions, 2016 and 2015 included additional rent expense and assigned sub-tenant rental income of approximately $197 million and $133 million, respectively.
Selling and Administrative Expenses
Selling and administrative expenses decreased $748 million to $6.1 billion in 2016 from $6.9 billion in 2015 and included significant items, as noted in the Adjusted EBITDA tables, which aggregated to an expense of $510 million and $365 million for 2016 and 2015, respectively. Excluding these items, selling and administrative expenses declined $893 million, primarily due to a decrease in payroll expense. In addition, advertising expense also declined as we continued to shift away from traditional advertising to use of Shop Your Way points expense, which is included within gross margin.
34
Selling and administrative expenses as a percentage of total revenues ("selling and administrative expense rate") were 27.6% and 27.3% for 2016 and 2015, respectively, as the decreases in overall selling and administrative expenses were more than offset by the above noted decline in revenues.
Depreciation and Amortization
Depreciation and amortization expense decreased by $47 million during 2016 to $375 million, as compared to 2015, primarily due to having fewer assets to depreciate.
Impairment Charges
We recorded impairment charges of $427 million in 2016, which consisted of impairment of $381 million related to the Sears trade name, as well as $46 million related to the impairment of long-lived assets. We recorded impairment charges of $274 million in 2015, which consisted of impairment of $180 million related to the Sears trade name, as well as $94 million related to the impairment of long-lived assets. Impairment charges recorded in both years are described further in Notes 1 and 13 of Notes to Consolidated Financial Statements.
Gain on Sales of Assets
We recorded total gains on sales of assets of $247 million in 2016 and $743 million in 2015, which were primarily attributable to several significant real estate transactions. The gains recorded in 2015 included $508 million recognized in connection with the joint venture transactions and the sale-leaseback transaction with Seritage. Gains on sales of assets recorded in both years are described further in Note 11 of Notes to Consolidated Financial Statements.
Operating Loss
We recorded an operating loss of $2.0 billion and $1.0 billion in 2016 and 2015, respectively. The operating loss for 2016 included significant items, as noted in the Adjusted EBITDA tables, which totaled
$615 million
, while operating loss for 2015 included significant items which totaled
$211 million
. Both 2016 and 2015 also included charges related to impairments, as well as gains on sales of assets. Taking these significant items into consideration, the decrease in operating loss in 2016 was primarily driven by the decrease in selling and administrative expenses, partially offset by the decline in gross margin noted above.
Interest Expense
We incurred $404 million and $323 million in interest expense during 2016 and 2015, respectively. The increase is due to an increase in average outstanding borrowings in 2016.
Interest and Investment Loss
We recorded interest and investment loss of $26 million during 2016 compared to interest and investment loss of $62 million during 2015. Interest and investment income loss is described further in Note 6 of Notes to Consolidated Financial Statements.
Income Taxes
We recorded an income tax benefit of $174 million in 2016 compared with an income tax benefit of $257 million in 2015. Our effective tax rate for 2016 was a benefit of 7.3% compared to a benefit of 18.6% for 2015. During 2016, the Company realized a significant tax benefit on the deferred taxes related to the partial impairment of the Sears trade name. In addition, the Company recorded a tax benefit related to the net gain on pension and other postretirement benefits in continuing operations and a corresponding tax expense of the same amount in other comprehensive income. Also, the application of the requirements for accounting for income taxes, after consideration of our valuation allowance, caused a significant variation in the typical relationship between income tax expense and pretax income. Our tax rate in 2016 reflected the effect of not recognizing the benefit of current period losses in certain domestic and foreign jurisdictions where it was not more likely than not that such benefits would be realized. In addition, 2016 was negatively impacted by foreign branch taxes and state income taxes.
35
The 2015 rate was favorably impacted by the significant tax benefit realized on the deferred taxes related to indefinite-life assets associated with the property sold in the transaction with Seritage and the tax benefit realized on the deferred taxes related to the partial impairment of the Sears trade name. These items were partially offset by foreign branch taxes and state income taxes.
Business Segment Results
Kmart
Kmart results and key statistics were as follows:
|
dollars in millions
|
2017
|
2016
|
2015
|
||||||||
|
Total revenues
|
$
|
5,618
|
|
$
|
8,650
|
|
$
|
10,188
|
|
||
|
Comparable store sales %
|
(11.4
|
)%
|
(5.3
|
)%
|
(7.3
|
)%
|
|||||
|
Cost of sales, buying and occupancy
|
4,601
|
|
7,093
|
|
8,042
|
|
|||||
|
Gross margin dollars
|
1,017
|
|
1,557
|
|
2,146
|
|
|||||
|
Gross margin rate
|
18.1
|
%
|
18.0
|
%
|
21.1
|
%
|
|||||
|
Selling and administrative
|
1,455
|
|
2,175
|
|
2,537
|
|
|||||
|
Selling and administrative expense as a percentage of total revenues
|
25.9
|
%
|
25.1
|
%
|
24.9
|
%
|
|||||
|
Depreciation and amortization
|
60
|
|
71
|
|
72
|
|
|||||
|
Impairment charges
|
16
|
|
22
|
|
14
|
|
|||||
|
Gain on sales of assets
|
(881
|
)
|
(181
|
)
|
(185
|
)
|
|||||
|
Total costs and expenses
|
5,251
|
|
9,180
|
|
10,480
|
|
|||||
|
Operating income (loss)
|
$
|
367
|
|
$
|
(530
|
)
|
$
|
(292
|
)
|
||
|
Adjusted EBITDA
|
$
|
(191
|
)
|
$
|
(302
|
)
|
$
|
(273
|
)
|
||
|
Total Kmart stores
|
432
|
|
735
|
|
941
|
|
|||||
2017
Compared to
2016
Revenues and Comparable Store Sales
Kmart’s revenues decreased by
$3.0 billion
to
$5.6 billion
in
2017
, primarily due to the effect of having fewer stores in operation, which accounted for approximately
$2.4 billion
of the decline. Revenues were also impacted by a decrease in comparable store sales of
11.4%
, which accounted for approximately
$689 million
of the decline. The Company recognized approximately
$64 million
of revenues during the 53rd week of
2017
. The decline in comparable store sales was primarily driven by declines in the pharmacy, grocery & household, home, drugstore, consumer electronics and apparel categories.
Gross Margin
Kmart generated
$1.0 billion
in gross margin in
2017
compared to
$1.6 billion
in
2016
. The decrease in Kmart’s gross margin is due to the above noted decrease in sales, partially offset by an increase in gross margin rate. Gross margin included charges related to store closures of $154 million and $187 million in 2017 and 2016, respectively, as well as credits of $11 million and $17 million in 2017 and 2016, respectively, related to the amortization of the deferred gain on sale of assets associated with the Seritage transaction.
Kmart's gross margin rate
increased
10
basis points to
18.1%
in
2017
from
18.0%
in
2016
. Excluding the impact of significant items, as noted in the Adjusted EBITDA tables, Kmart's gross margin rate would have improved 60 basis points in 2017 as compared to the prior year, primarily driven by margin rate improvement in the apparel, home and drugstore categories, partially offset by a decline in the pharmacy category. Kmart experienced lower clearance markdowns and Shop Your Way points expense, partially offset by an increase in promotional markdowns.
36
In addition, as a result of the Seritage and JV transactions, 2017 and 2016 included additional rent expense of approximately $21 million and $35 million, respectively.
Selling and Administrative Expenses
Kmart's selling and administrative expenses decreased
$720 million
in
2017
. Selling and administrative expenses included significant items, as noted in the Adjusted EBITDA tables, which aggregated to expense of $104 million and $146 million for
2017
and
2016
, respectively. Excluding these items, selling and administrative expenses decreased $678 million primarily due to decreases in payroll and advertising expenses.
Kmart's selling and administrative expense rate was
25.9%
in
2017
and
25.1%
in
2016
and increased primarily as a result of lower expense leverage due to the sales decline noted above.
Impairment charges
Kmart recorded impairment charges of
$16 million
and
$22 million
in
2017
and
2016
, respectively, related to the impairment of long-lived assets. Impairment charges recorded during
2017
and
2016
are further described in Note 13 of Notes to Consolidated Financial Statements.
Gain on Sales of Assets
Kmart recorded total gains on sales of assets of
$881 million
and
$181 million
in
2017
and
2016
, respectively. The gains recorded during 2017 included gains of $492 million recognized on the Craftsman Sale, $164 million recognized on the sale or amendment and lease terminations of 43 locations, $43 million as a result of recapture and lease termination activity and $79 million related to other asset sales. Gains on sales of assets are described further in Note 11 of Notes to Consolidated Financial Statements.
Operating Income (Loss)
Kmart recorded operating income of
$367 million
in
2017
as compared to an operating loss of
$530 million
in
2016
. Operating income for
2017
included significant items, as noted in the Adjusted EBITDA tables, which totaled $247 million, while operating loss for
2016
included significant items which totaled $316 million. Both 2017 and 2016 also included gains on sales of assets, as well as charges related to impairments. Taking these significant items into consideration, the decrease in Kmart's operating loss was primarily driven by the decrease in selling and administrative expenses, partially offset by a decline in gross margin noted above.
2016
Compared to
2015
Revenues and Comparable Store Sales
Kmart’s revenues decreased by $1.5 billion to $8.7 billion in 2016, primarily due to the effect of having fewer stores in operation, which accounted for approximately $1.0 billion of the decline. Revenues were also impacted by a decrease in comparable store sales of 5.3%, which accounted for approximately $477 million of the decline. The decline in comparable store sales was primarily driven by declines in the grocery & household, consumer electronics and pharmacy categories.
Gross Margin
Kmart generated $1.6 billion in gross margin in 2016 compared to $2.1 billion in 2015. The decrease in Kmart’s gross margin is due to the above noted decrease in sales, as well as a decline in gross margin rate. Gross margin included significant items which aggregated to expense of $170 million and $28 million for 2016 and 2015, respectively.
Kmart's gross margin rate declined 310 basis points to 18.0% in 2016 from 21.1% in 2015. Excluding the impact of significant items primarily related to store closures, as noted in the Adjusted EBITDA tables, Kmart's gross margin rate would have declined 130 basis points due to margin rate declines experienced across most
37
categories, most notably in the apparel, grocery & household, drugstore, home and pharmacy categories driven by increased markdowns, including an increase in Shop Your Way points expense.
In addition, as a result of the Seritage and JV transactions, 2016 and 2015 included additional rent expense and assigned sub-tenant rental income of approximately $35 million and $25 million, respectively.
Selling and Administrative Expenses
Kmart's selling and administrative expenses decreased $362 million in 2016. Selling and administrative expenses included significant items, as noted in the Adjusted EBITDA tables, which aggregated to expense of $146 million and $90 million for 2016 and 2015, respectively. Excluding these items, selling and administrative expenses decreased $418 million primarily due to decreases in payroll and advertising expenses.
Kmart's selling and administrative expense rate was 25.1% in 2016 and 24.9% in 2015 and increased primarily as a result of lower expense leverage due to the sales decline noted above.
Impairment charges
Kmart recorded impairment charges of $22 million and $14 million in 2016 and 2015, respectively, related to the impairment of long-lived assets. Impairment charges recorded during 2016 and 2015 are further described in Note 13 of Notes to Consolidated Financial Statements.
Gain on Sales of Assets
Kmart recorded total gains on sales of assets of $181 million and $185 million in 2016 and 2015, respectively. Gains on sales of assets recorded in both years are described further in Note 11 of Notes to Consolidated Financial Statements.
Operating Loss
Kmart recorded an operating loss of $530 million in 2016 as compared to $292 million in 2015. Operating loss for 2016 included significant items, as noted in the Adjusted EBITDA tables, which totaled $316 million, while operating loss for 2015 included significant items which totaled $118 million. Both 2016 and 2015 also included gains on sales of assets, as well as charges related to impairments. Taking these significant items into consideration, the decrease in Kmart's operating loss was primarily driven by the decrease in selling and administrative expenses, partially offset by a decline in gross margin.
38
Sears Domestic
Sears Domestic results and key statistics were as follows:
|
dollars in millions
|
2017
|
2016
|
2015
|
||||||||
|
Total revenues
|
$
|
11,084
|
|
$
|
13,488
|
|
$
|
14,958
|
|
||
|
Comparable store sales %
|
(15.2
|
)%
|
(9.3
|
)%
|
(11.1
|
)%
|
|||||
|
Cost of sales, buying and occupancy
|
8,574
|
|
10,359
|
|
11,294
|
|
|||||
|
Gross margin dollars
|
2,510
|
|
3,129
|
|
3,664
|
|
|||||
|
Gross margin rate
|
22.6
|
%
|
23.2
|
%
|
24.5
|
%
|
|||||
|
Selling and administrative
|
3,676
|
|
3,934
|
|
4,320
|
|
|||||
|
Selling and administrative expense as a percentage of total revenues
|
33.2
|
%
|
29.2
|
%
|
28.9
|
%
|
|||||
|
Depreciation and amortization
|
272
|
|
304
|
|
350
|
|
|||||
|
Impairment charges
|
126
|
|
405
|
|
260
|
|
|||||
|
Gain on sales of assets
|
(767
|
)
|
(66
|
)
|
(558
|
)
|
|||||
|
Total costs and expenses
|
11,881
|
|
14,936
|
|
15,666
|
|
|||||
|
Operating loss
|
$
|
(797
|
)
|
$
|
(1,448
|
)
|
$
|
(708
|
)
|
||
|
Adjusted EBITDA
|
$
|
(371
|
)
|
$
|
(506
|
)
|
$
|
(563
|
)
|
||
|
Number of:
|
|||||||||||
|
Full-line stores
|
547
|
|
670
|
|
705
|
|
|||||
|
Specialty stores
|
23
|
|
25
|
|
26
|
|
|||||
|
Total Sears Stores
|
570
|
|
695
|
|
731
|
|
|||||
2017
Compared to
2016
Revenues and Comparable Store Sales
Sears Domestic's revenues decreased by
$2.4 billion
to
$11.1 billion
in
2017
as compared to
2016
. This decline in revenues was primarily driven by a decrease in comparable store sales of
15.2%
, which accounted for
$1.2 billion
of the decline, and the effect of having fewer Full-line stores in operation, which accounted for
$760 million
of the decline. The decline in Sears Domestic comparable store sales was primarily driven by decreases in the home appliances, apparel, consumer electronics and lawn & garden categories. The Company recognized approximately
$125 million
of revenues during the 53rd week of
2017
. In addition, we also experienced a decline in revenues from SHO of approximately
$208 million
during
2017
as compared to
2016
.
Gross Margin
Sears Domestic generated gross margin of
$2.5 billion
and
$3.1 billion
in
2017
and
2016
, respectively, which included charges related to store closures of $73 million and $39 million in
2017
and
2016
, respectively. Gross margin also included credits of $67 million and $71 million in
2017
and
2016
, respectively, related to the amortization of the deferred gain on sale of assets associated with the Seritage transaction, while
2016
also included one-time vendor credits of $33 million.
Sears Domestic's gross margin rate for the year declined
60
basis points to
22.6%
in
2017
from
23.2%
in
2016
. Excluding the impact of significant items in both years primarily related to store closures, the amortization of the deferred gain on sales of assets associated with the Seritage transaction and one-time vendor credits, Sears Domestic's gross margin rate in 2017 would have been flat to the prior year, which reflects improvement in the apparel category, which was offset by declines in the home appliances and tools categories. Sears Domestic experienced lower clearance markdowns, offset by an increase in both promotional markdowns and Shop Your Way points expense.
39
In addition, as a result of the Seritage and JV transactions,
2017
and
2016
included additional rent expense of approximately $148 million and $162 million, respectively.
Selling and Administrative Expenses
Sears Domestic’s selling and administrative expenses decreased
$258 million
in
2017
as compared to
2016
and included significant items, as noted in the Adjusted EBITDA tables, which aggregated to $789 million and $364 million for
2017
and
2016
, respectively. Excluding these items, selling and administrative expenses decreased $683 million, primarily due to decreases in payroll and advertising expenses.
Sears Domestic's selling and administrative expense rate was
33.2%
in
2017
and
29.2%
in
2016
and increased as the above noted expense reduction was more than offset by the decline in sales noted above.
Depreciation and Amortization
Depreciation and amortization expense decreased by
$32 million
during
2017
to
$272 million
, as compared to
2016
, primarily due to having fewer assets to depreciate.
Impairment Charges
Sears Domestic recorded impairment charges of
$126 million
in
2017
which consisted of impairment of $72 million related to the Sears trade name, as well as $54 million related to the impairment of long-lived assets. We recorded impairment charges of
$405 million
in
2016
which consisted of impairment of $381 million related to the Sears trade name, as well as $24 million related to the impairment of long-lived assets. Impairment charges recorded in both years are described further in Notes 1 and 13 of Notes to Consolidated Financial Statements.
Gain on Sales of Assets
Sears Domestic recorded total gains on sales of assets of
$767 million
and
$66 million
in
2017
and
2016
, respectively. The gains recorded during 2017 included gains of $544 million recognized on the sale or amendment and lease terminations of 52 locations and $210 million as a result of recapture and lease termination activity and two stores that qualified for sales recognition and sale-leaseback accounting. Gains on sales of assets are described further in Note 11 of Notes to Consolidated Financial Statements.
Operating Loss
Sears Domestic reported an operating loss of
$797 million
in
2017
compared to
$1.4 billion
in
2016
. Sears Domestic's operating loss in
2017
included significant items, as noted in the Adjusted EBITDA tables, which totaled $795 million, while operating loss for
2016
included significant items which totaled $299 million. Both
2017
and
2016
also included charges related to impairments, as well as gains on sales of assets. Taking these significant items into consideration, the decrease in Sears Domestic's operating loss in
2017
was driven by the decrease in selling and administrative expenses, partially offset by the decline in gross margin noted above.
2016
Compared to
2015
Revenues and Comparable Store Sales
Sears Domestic's revenues decreased by $1.5 billion to $13.5 billion in 2016 as compared to 2015. This decline in revenues was primarily driven by a decrease in comparable store sales of 9.3%, which accounted for $890 million of the decline, and the effect of having fewer Full-line stores in operation, which accounted for $241 million of the decline. The decline in Sears Domestic comparable store sales was primarily driven by decreases in the home appliances, apparel and consumer electronics categories. In addition, we also experienced a decline in revenues from SHO of approximately $238 million during 2016 as compared to 2015.
40
Gross Margin
Sears Domestic generated gross margin of $3.1 billion and $3.7 billion in 2016 and 2015, respectively, which included significant items which aggregated to additional gross margin of $65 million and $182 million for 2016 and 2015, respectively.
Sears Domestic's gross margin rate for the year declined 130 basis points to 23.2% in 2016 from 24.5% in 2015. Excluding the impact of significant items in both years primarily related to the amortization of the deferred gain on sales of assets associated with the Seritage transaction, one-time vendor credits and store closures, s noted in the Adjusted EBITDA tables, Sears Domestic's gross margin rate declined 60 basis points, with the most notable decreases experienced in the apparel, home appliances and footwear categories driven by increased markdowns, including an increase in Shop Your Way points expense.
In addition, as a result of the Seritage and JV transactions, 2016 and 2015 included additional rent expense and assigned sub-tenant rental income of approximately $162 million and $108 million, respectively.
Selling and Administrative Expenses
Sears Domestic’s selling and administrative expenses decreased $386 million in 2016 as compared to 2015 and included significant items, as noted in the Adjusted EBITDA tables, which aggregated to $364 million and $275 million for 2016 and 2015, respectively. Excluding these items, selling and administrative expenses decreased $475 million, primarily due to decreases in payroll and advertising expenses.
Sears Domestic's selling and administrative expense rate was 29.2% in 2016 and 28.9% in 2015 and increased as the above noted expense reduction was more than offset by the decline in sales noted above.
Depreciation and Amortization
Depreciation and amortization expense decreased by $46 million during 2016 to $304 million, as compared to 2015, primarily due to having fewer assets to depreciate.
Impairment Charges
Sears Domestic recorded impairment charges of $405 million in 2016 which consisted of impairment of $381 million related to the Sears trade name, as well as $24 million related to the impairment of long-lived assets. We recorded impairment charges of $260 million in 2015 which consisted of impairment of $180 million related to the Sears trade name, as well as $80 million related to the impairment of long-lived assets. Impairment charges recorded in both years are described further in Notes 1 and 13 of Notes to Consolidated Financial Statements.
Gain on Sales of Assets
Sears Domestic recorded total gains on sales of assets of $66 million and $558 million in 2016 and 2015, respectively. The gains recorded in 2015 included $371 million recognized in connection with the joint venture transactions and the sale-leaseback transaction with Seritage. Gains on sales of assets recorded in both years are described further in Note 11 of Notes to Consolidated Financial Statements.
Operating Loss
Sears Domestic reported an operating loss of $1.4 billion in 2016 compared to $708 million in 2015. Sears Domestic's operating loss in 2016 included significant items, as noted in the Adjusted EBITDA tables, which totaled $299 million, while operating loss for 2015 included significant items which totaled $93 million. Both 2016 and 2015 also included charges related to impairments, as well as gains on sales of assets. Taking these significant items into consideration, the decrease in Sears Domestic's operating loss in 2016 was driven by the decrease in selling and administrative expenses, partially offset by the above noted decline in gross margin.
41
ANALYSIS OF CONSOLIDATED FINANCIAL CONDITION
Cash Balances
Our cash and cash equivalents include all highly liquid investments with original maturities of three months or less at the date of purchase. Our cash balances as of
February 3, 2018
and
January 28, 2017
are detailed in the following table.
|
millions
|
February 3,
2018 |
January 28,
2017 |
|||||
|
Cash and equivalents
|
$
|
113
|
|
$
|
196
|
|
|
|
Cash posted as collateral
|
4
|
|
3
|
|
|||
|
Credit card deposits in transit
|
65
|
|
87
|
|
|||
|
Total cash and cash equivalents
|
182
|
|
286
|
|
|||
|
Restricted cash
|
154
|
|
—
|
|
|||
|
Total cash balances
|
$
|
336
|
|
$
|
286
|
|
|
We had total cash balances of
$336 million
and
$286 million
at
February 3, 2018
and
January 28, 2017
, respectively.
At various times, we have posted cash collateral for certain outstanding letters of credit and self-insurance programs. Such cash collateral is classified within cash and cash equivalents given we have the ability to substitute letters of credit at any time for this cash collateral and it is therefore readily available to us. Our invested cash may include, from time to time, investments in, but not limited to, commercial paper, federal, state and municipal government securities, floating-rate notes, repurchase agreements and money market funds. Cash amounts held in these short-term investments are readily available to us. Credit card deposits in transit include deposits in transit from banks for payments related to third-party credit card and debit card transactions. The Company classifies cash balances that are legally restricted pursuant to contractual arrangements as restricted cash. The restricted cash balance relates to amounts deposited into an escrow for the benefit of our pension plans.
We classify outstanding checks in excess of funds on deposit within other current liabilities and reduce cash balances when these checks clear the bank on which they were drawn. Outstanding checks in excess of funds on deposit were
$74 million
and
$29 million
as of
February 3, 2018
and
January 28, 2017
, respectively.
Operating Activities
The Company used
$1.8 billion
of cash in its operations during
2017
,
$1.4 billion
during
2016
and
$2.2 billion
during
2015
. Our primary source of operating cash flows is the sale of goods and services to customers, while the primary use of cash in operations is the purchase of merchandise inventories and the payment of operating expenses. We used more cash in operations in
2017
compared to
2016
primarily due to declines in merchandise payables and other liabilities, partially offset by a decline in merchandise inventories. We used less cash in operations in
2016
compared to
2015
primarily due to a decrease in our net inventory.
Merchandise inventories were
$2.8 billion
and
$4.0 billion
, respectively, at
February 3, 2018
and
January 28, 2017
, while merchandise payables were approximately
$0.6 billion
and
$1.0 billion
, respectively, at
February 3, 2018
and
January 28, 2017
. Our inventory balances decreased approximately
$1.2 billion
primarily due to both store closures and improved productivity. Sears Domestic inventory decreased in virtually all categories, with the most notable decreases in the apparel, tools and home appliances categories. Kmart inventory decreased in all categories with the most notable decreases in the apparel, home, drugstore and grocery & household categories.
Investing Activities
We generated net cash flows from investing activities of
$1.9 billion
in
2017
,
$244 million
in
2016
and
$2.5 billion
in
2015
.
For
2017
, net cash flows from investing activities consisted of cash proceeds from the sale of properties and investments of
$1.1 billion
, proceeds from the Craftsman Sale of
$572 million
and proceeds from the sale of
42
receivables of
$293 million
, partially offset by cash used for capital expenditures of
$80 million
. For
2016
, net cash flows from investing activities primarily consisted of cash proceeds from the sale of properties and investments of
$386 million
, partially offset by cash used for capital expenditures of
$142 million
. For
2015
, net cash flows from investing activities primarily consisted of cash proceeds from the sale of properties and investments of $2.7 billion, partially offset by cash used for capital expenditures of $211 million. Proceeds from the sales of properties and investments in 2015 included approximately $2.6 billion of net proceeds from the Seritage transaction.
We spent
$80 million
,
$142 million
and
$211 million
during
2017
,
2016
and
2015
, respectively, for capital expenditures. Capital expenditures during all three years primarily included investments in online and mobile shopping capabilities, enhancements to the Shop Your Way platform, information technology infrastructure and store maintenance.
We anticipate 2018 capital expenditure levels to be similar to 2017 levels. In the normal course of business, we consider opportunities to purchase leased operating properties, as well as offers to sell owned, or assign leased, operating and non-operating properties. These transactions may, individually or in the aggregate, result in material proceeds or outlays of cash and cause our capital expenditure levels to vary from period to period. In addition, we review leases that will expire in the short term in order to determine the appropriate action to take with respect to them.
Financing Activities
During
2017
, the Company used net cash flows in financing activities of
$2 million
, which consisted of debt repayments of
$1.4 billion
and the payment of debt issuance costs of
$43 million
, offset by proceeds from debt issuances of
$1.0 billion
, an increase in short-term borrowings of
$271 million
and
$106 million
of net cash proceeds received from sale-leaseback financing transactions.
During
2016
, we generated net cash flows from financing activities of
$1.2 billion
, which consisted of proceeds from debt issuances of
$2.0 billion
and
$71 million
of net cash proceeds received from a sale-leaseback financing transaction for five Sears Full-line stores and two Sears Auto Centers that have continuing involvement, partially offset by a decrease in short-term borrowings of
$797 million
, debt repayments of
$66 million
and the payment of debt issuance costs of
$51 million
.
During
2015
, the Company used net cash flows in financing activities of $364 million, which consisted of debt repayments of $1.4 billion, of which $927 million was the purchase of Senior Secured Notes pursuant to the tender offer and $400 million was the repayment of the secured short-term loan, the payment of debt issuance costs of $50 million related to the amendment and extension of our Domestic Credit Facility and fees related to the tender offer related to our Senior Secured Notes. These uses of cash were partially offset by an increase in short-term borrowings of $583 million and $508 million of net cash proceeds from sale-leaseback financing, which consisted of $426 million of proceeds from the JV transactions received during 2015 and $82 million of proceeds received in 2015 related to four joint venture properties that have continuing involvement.
During
2017
,
2016
and
2015
, we did not repurchase any of our common shares under our share repurchase program. The common share repurchase program was initially announced in 2005 and had a total authorization since inception of the program of $6.5 billion. At
February 3, 2018
, we had approximately
$504 million
of remaining authorization under the program. The common share repurchase program has no stated expiration date and share repurchases may be implemented using a variety of methods, which may include open market purchases, privately negotiated transactions, block trades, accelerated share repurchase transactions, the purchase of call options, the sale of put options or otherwise, or by any combination of such methods.
Uses and Sources of Liquidity
Our primary need for liquidity is to fund working capital requirements of our businesses, capital expenditures and for general corporate purposes, including debt repayments and pension plan contributions. The Company has taken a number of actions to support its ongoing transformation efforts, while continuing to support its operations and meet its obligations in light of the incurred losses and negative cash flows experienced over the past several years. These actions included:
43
|
•
|
The completion of various secured and unsecured financing transactions, the extension of the maturity of certain of our indebtedness, and the amendment to other terms of certain of our indebtedness to increase our overall financial flexibility, including:
|
|
◦
|
a $750 million Senior Secured Term Loan (the "2016 Term Loan") under its domestic credit facility maturing in July 2020;
|
|
◦
|
a $500 million real estate loan facility in April 2016 (the "2016 Secured Loan Facility"), initially maturing in July 2017, initially extended to January 2018, subsequently extended to April 2018, and then further extended to July 2018, subject to the payment of an extension fee;
|
|
◦
|
an additional $500 million real estate loan facility in January 2017 (the "2017 Secured Loan Facility"), maturing in July 2020;
|
|
◦
|
a Second Lien Credit Agreement in September 2016, pursuant to which the Company borrowed $300 million under a term loan (the "Second Lien Term Loan"), maturing in July 2020;
|
|
◦
|
an amendment in July 2017 to the Second Lien Credit Agreement to provide for the creation of a $500 million uncommitted second-lien line of credit loan facility under which the Company may borrow line of credit loans (the "Line of Credit Loans"), and a subsequent amendment to that facility to extend the maximum duration of the Line of Credit Loans from 180 days to 270 days and permit total borrowings of up to $600 million;
|
|
◦
|
a Letter of Credit and Reimbursement Agreement in December 2016, originally providing for up to a $500 million secured standby letter of credit facility (the "LC Facility") from certain affiliates of ESL Investments, Inc. ("ESL");
|
|
◦
|
a $200 million real estate loan facility (the "Incremental Loans") in October 2017, with the Incremental Loans maturing in April 2018, with the option to extend to July 2018, subject to the extension of the 2016 Secured Loan Facility;
|
|
◦
|
the extension of the maturity date of the initial $1.0 billion term loan (the "Term Loan") under our Amended Domestic Credit Agreement from June 2018 to January 2019 (with a right of the borrowers thereunder to further extend such maturity, subject to the satisfaction of certain conditions, to July 2019);
|
|
◦
|
amendments to our Amended Domestic Credit Agreement and certain other indebtedness which reduced the aggregate revolver commitments from $1.971 billion to $1.5 billion, but also implemented other modifications to covenants and reserves against the domestic credit facility borrowing base that improved net liquidity, and increased the maximum permissible short-term borrowings of the Company from $750 million to $1.25 billion;
|
|
◦
|
a Term Loan Credit Agreement in January 2018 providing for a secured term loan facility (the "Term Loan Facility"), secured by substantially all of the unencumbered intellectual property of the Company and its subsidiaries, other than intellectual property relating to the Kenmore and DieHard brands, as well as by certain real property interests, in each case subject to certain exclusions. An aggregate principal amount of $250 million was borrowed with the ability to borrow an additional $50 million against the same collateral;
|
|
◦
|
an amendment to the indenture governing our 6 5/8% Senior Secured Notes due 2018 to increase the maximum permissible borrowings secured by inventory to 75% of book value of such inventory from 65% and defer the collateral coverage test for purposes of the repurchase offer covenant in the indenture to restart it with the second quarter of 2018 (such that no collateral coverage event can occur until the end of the third quarter of 2018);
|
|
◦
|
an amendment to the March 2016 Pension Plan Protection and Forbearance Agreement (the "PPPFA") with the Pension Benefit Guaranty Corporation (the "PBGC") providing for the release of 138 of our properties from a ring-fence arrangement created under our five-year PPPFA in exchange for the payment of approximately $407 million into the Sears pension plans. This agreement provides the Company with financial flexibility through the ability to monetize properties, and, in addition, provides funding relief from contributions to the pension plans for the next two years
; and
|
44
|
◦
|
various commercial paper issuances to meet short-term liquidity needs, with the maximum amount outstanding during fiscal 2017 of $160 million.
|
|
•
|
Achievement of $1.25 billion in annualized cost savings in 2017 as part of the restructuring program announced earlier this year. Actions taken to realize the annualized cost savings have included simplification of the organizational structure of Holdings, streamlining of operations, reducing unprofitable categories and the closure of under-performing stores. In 2017, we closed approximately 435 stores, and an additional 103 stores previously announced for closure are expected to be closed by the end of the first quarter of 2018. As a result of these actions, the Company has begun to see improvement in the operations in fiscal 2017, as the restructuring program actions, including the closing of unprofitable stores, have begun to take effect.
|
|
•
|
The sale of the Craftsman brand to Stanley Black & Decker for consideration consisting of cash payments and a royalty.
|
|
•
|
Sales of properties and investments for proceeds of
$1.1 billion
and
$386 million
in 2017 and 2016, respectively.
|
On March 8, 2018, the Company secured an additional $100 million incremental real estate loan (the "Second Incremental Loan"), pursuant to an amendment to the Second Amended and Restated Loan Agreement, dated as of October 18, 2017, with JPP, LLC and JPP II, LLC, entities affiliated with ESL Investments, Inc. The Second Incremental Loan is secured by the same real estate properties as the 2017 Secured Loan Facility, and certain properties under the previous Incremental Loans outstanding, and matures in July 2020. The Company used the proceeds from the Incremental Loan for general corporate purposes.
In March 2018, the Company also closed on the $200 million Secured Loan and the $240 million Mezzanine Loan
, both as defined in Note 3 of Notes to Consolidated Financial Statements, in connection with the release of 138 of our properties from the ring-fence arrangement with the PBGC as described above. The properties, which have an aggregate appraised value of nearly $980 million, serve as collateral for the Secured Loan, and the Mezzanine Loan is secured by
pledge of the equity interests in the direct parent company of the entities that own such properties. The Company contributed approximately $282 million of the proceeds of such loans to our pension plans, and deposited $125 million into an escrow for the benefit of our pension plans. The Mezzanine Loan Agreement, as defined in Note 3 of Notes to Consolidated Financial Statements, contains an uncommitted accordion feature pursuant to which we may incur additional loans of not more than $200 million in aggregate, subject to certain conditions, including that such additional loans not exceed an amount equal to the principal amount of the Secured Loan repaid.
The Company expects to pay down the Secured Loan over the next three to six months using proceeds generated from the sale of the underlying properties.
In February 2018, the Company commenced private exchange offers for its outstanding 8% Senior Unsecured Notes Due 2019 and 6 5/8% Senior Secured Notes Due 2018 (the "Exchange Offers"),
pursuant to which it offered to (1) issue in exchange for its outstanding 8% Senior Unsecured Notes Due 2019 (the "Old Senior Unsecured Notes") new 8% Senior Unsecured Notes Due 2019, of a like principal amount, convertible into common stock of the Company, with interest on such notes to be payable in kind at the Company's option (the "New Senior Unsecured Notes"), and (2) issue in exchange for its outstanding 6 5/8% Senior Secured Notes Due 2018 (the "Old Senior Secured Notes") new 6 5/8% Senior Secured Notes Due 2019, of a like principal amount, convertible into common stock of the Company, with interest on such notes to be payable in kind at the Company's option (the "New Senior Secured Notes"). The Exchange Offers expired on March 15, 2018. Approximately $214 million aggregate principal amount of the Old Senior Unsecured Notes and approximately $170 million aggregate principal amount of the Old Senior Secured Notes were validly tendered, accepted and canceled in the Exchange Offers, and the Company issued a like principal amount of New Senior Unsecured Notes and New Senior Secured Notes. The New Senior Unsecured Notes and New Senior Secured Notes are optionally convertible by the holders thereof into shares of the Company’s common stock at conversion prices of $8.33 and $5.00, respectively, per share of common stock, and are mandatorily convertible at the Company's option if the volume weighted average trading price of the common stock on the NASDAQ exceeds $10.00 for a prescribed period. In connection with the closing of the Exchange Offers, the Company also obtained the requisite consent of holders of Old Senior Secured Notes to adopt amendments to the indenture governing those notes to eliminate substantially all of the restrictive covenants and certain events of default in the indenture, and make the liens securing senior second lien obligations, including the new Senior
45
Secured Notes and the Second Lien Term Loan described below, effectively senior to the liens securing junior second lien obligations, including the Old Senior Secured Notes.
Also in connection with the closing of the Exchange Offers, the Company entered into an amendment to its Second Lien Credit Agreement. The amendment provides the Company with the option to pay interest on its outstanding $300 million principal amount Second Lien Term Loan in kind, and also provides that the Company's obligation under the Second Lien Term Loan is convertible into common stock of the Company, on the same conversion terms as the New Senior Secured Notes. Also in connection with the closing of the Exchange Offers, the Company’s subsidiary, Sears Roebuck Acceptance Corp. ("SRAC"), consummated a private exchange with certain third parties of approximately $100 million in principal amount of senior unsecured notes issued by SRAC maturing between 2027 and 2043 and bearing interest at rates between 6.50% and 7.50% per annum, pursuant to which SRAC issued a like principal amount of new unsecured notes (the "SRAC Exchange Notes"). The SRAC Exchange Notes mature in March 2028 and bear interest at a rate of 7.0% per annum, and provide the Company with the option to pay such interest in kind at an interest rate of 12.0% per annum. The SRAC Exchange Notes are also guaranteed by the same subsidiaries of the Company that guarantee the New Senior Secured Notes.
On March 21, 2018, we obtained a $125 million FILO term loan (the "FILO Loan") from JPP, LLC and JPP II, LLC, entities affiliated with ESL, and Benefit Street 2018 LLC, an entity affiliated with Thomas J. Tisch, under our Amended Domestic Credit Agreement. The Company received approximately $122 million in net proceeds from the FILO Loan, which proceeds were using to reduce outstanding borrowings under our revolving credit facility. The FILO Loan has a maturity date of July 20, 2020, which is the same maturity date as the Company's revolving credit facility commitments, and does not amortize.
In addition to pursuing several transactions to adjust our capital structure in order to enhance our liquidity and financial position, the Company is also taking incremental actions to further streamline operations to drive profitability, including cost reductions of $200 million on an annualized basis in 2018 unrelated to store closures.
In addition to the actions taken above, the Company has other resources available to support its operations. Our domestic credit facility permits us up to $2.0 billion of second lien loan capacity (of which
$1.1 billion
was utilized at February 3, 2018) outside the credit agreement, all depending on the applicable and available borrowing base as defined in our applicable debt agreements, as well as our ability to secure commitments from lenders. We also have the ability to obtain longer-term secured financing maturing outside of the domestic credit facility maturity date which would not be subject to borrowing base limitations (see Note 3 of Notes to Consolidated Financial Statements). Other options available to us, which we will evaluate and execute as appropriate,
include refinancing existing debt, borrowing against facilities in place with availability and additional real estate loans against unencumbered properties, which we have successfully executed in the past.
We also continue to explore ways to unlock value across a range of assets, including entering into or renegotiating commercial arrangements, and exploring ways to maximize the value of our Home Services, Innovel and Sears Auto Centers businesses, as well as our Kenmore and DieHard brands, through partnerships, sales or other means of externalization that could expand distribution of our brands and service offerings to realize significant growth. We expect to continue to right-size, redeploy and highlight the value of our assets, including monetizing our real estate portfolio and exploring potential asset sales, in our transition from an asset intensive, historically "store-only" based retailer to a more asset light, integrated membership-focused company.
We expect to continue to face a challenging competitive environment. While we continue to focus on our overall profitability, including managing expenses, we reported a loss in 2017, and were required to fund cash used in operating activities with cash from investing and financing activities. If we continue to experience operating losses, and we are not able to generate additional liquidity through the actions described below or through some combination of other actions, including real estate or other asset sales, while not expected, then our liquidity needs may exceed availability under our Amended Domestic Credit Agreement, our second lien line of credit loan facility and our other existing facilities, and we might need to secure additional sources of funds, which may or may not be available to us. A failure to secure such additional funds could cause us to be in default under the Amended Domestic Credit Agreement. Moreover, if the borrowing base (as calculated pursuant to our outstanding second lien debt) falls below the principal amount of such second lien debt plus the principal amount of any other indebtedness for borrowed money that is secured by liens on the collateral for such debt on the last day of any two consecutive quarters, it could trigger an obligation to repurchase our New Senior Secured Notes in an amount equal to such
46
deficiency. As of February 3, 2018, we are in a deferral period of the collateral coverage test and the calculation restarts in the second quarter of 2018 (such that no collateral coverage event can occur until the end of the third quarter of 2018). Additionally, a failure to generate additional liquidity could negatively impact our access to inventory or services that are important to the operation of our business.
We believe the following actions, some of which we expect, subject to our governance processes, to include related party participation and funding, are probable of occurring and will be sufficient to satisfy our liquidity needs for the next twelve months from the issuance of the financial statements:
|
•
|
Sales of the properties securing the $200 million Secured Loan to fund the repayment of such Secured Loan;
|
|
•
|
Additional borrowings under the Mezzanine Loan Agreement and the Term Loan Facility;
|
|
•
|
Renegotiation of certain commercial arrangements;
|
|
•
|
Monetization of the Kenmore brand;
|
|
•
|
Extension of maturities beyond March 2019 of Line of Credit Loans under the Second Lien Credit Agreement, the 2016 Secured Loan Facility, the Incremental Secured Loan Facility and the LC Facility and the Term Loan under the Amended Domestic Credit Agreement;
|
|
•
|
Additional borrowings secured by real estate assets or borrowings under the short-term basket; and
|
|
•
|
Further restructurings to help manage expenses and improve profitability.
|
The PPPFA contains certain limitations on our ability to sell assets, which could impact our ability to complete asset sale transactions or our ability to use proceeds from those transactions to fund our operations. Therefore, the analysis of liquidity needs includes consideration of the applicable restrictions under the PPPFA
.
We expect that the actions outlined above will further enhance our liquidity and financial flexibility and we expect that these actions will be executed in alignment with the anticipated timing of our liquidity needs.
Our outstanding borrowings at
February 3, 2018
and
January 28, 2017
were as follows:
|
millions
|
February 3,
2018 |
January 28,
2017 |
|||||
|
Short-term borrowings:
|
|||||||
|
Unsecured commercial paper
|
$
|
—
|
|
$
|
—
|
|
|
|
Secured borrowings
|
271
|
|
—
|
|
|||
|
Line of credit loans
|
500
|
|
—
|
|
|||
|
Incremental loans
|
144
|
|
—
|
|
|||
|
Long-term debt, including current portion:
|
|||||||
|
Notes, term loan and debentures outstanding
|
3,145
|
|
4,018
|
|
|||
|
Capitalized lease obligations
|
72
|
|
145
|
|
|||
|
Total borrowings
|
$
|
4,132
|
|
$
|
4,163
|
|
|
47
We fund our peak sales season working capital needs through our domestic revolving credit facility and commercial paper markets and secured short-term debt.
|
millions
|
2017
|
2016
|
|||||
|
Secured borrowings:
|
|||||||
|
Maximum daily amount outstanding during the period
|
$
|
799
|
|
$
|
1,150
|
|
|
|
Average amount outstanding during the period
|
374
|
|
334
|
|
|||
|
Amount outstanding at period-end
|
271
|
|
—
|
|
|||
|
Weighted average interest rate
|
6.2
|
%
|
4.6
|
%
|
|||
|
Unsecured commercial paper:
|
|||||||
|
Maximum daily amount outstanding during the period
|
$
|
160
|
|
$
|
250
|
|
|
|
Average amount outstanding during the period
|
26
|
|
106
|
|
|||
|
Amount outstanding at period-end
|
—
|
|
—
|
|
|||
|
Weighted average interest rate
|
9.1
|
%
|
7.9
|
%
|
|||
|
Line of credit loans:
|
|||||||
|
Maximum daily amount outstanding during the period
|
$
|
500
|
|
$
|
—
|
|
|
|
Average amount outstanding during the period
|
214
|
|
—
|
|
|||
|
Amount outstanding at period-end
|
500
|
|
—
|
|
|||
|
Weighted average interest rate
|
10.2
|
%
|
—
|
%
|
|||
Information about our Domestic Credit Agreement, Letter of Credit Facility, Secured Loan and Mezzanine Loan, Term Loan Facility, 2017 Secured Loan Facility, 2016 Secured Loan Facility, Second Lien Credit Agreement, Old Senior Secured Notes and New Senior Secured Notes, Old Senior Unsecured Notes and New Senior Unsecured Notes, Unsecured Commercial Paper, Secured Short-Term Loan and Wholly-owned Insurance Subsidiary and Intercompany Securities is included in Note 3 of Notes to Consolidated Financial Statements.
Domestic Pension Plans Funding
Contributions to our pension plans remain a significant use of our cash on an annual basis. While the Company's pension plans are frozen, and thus associates do not currently earn pension benefits, the Company has a legacy pension obligation for past service performed by Kmart and Sears associates. During
2017
, we contributed
$295 million
to our domestic pension plans, including amounts contributed from the escrow created pursuant to the PPPFA. We estimate that our minimum pension funding obligations will be approximately
$280 million
in
2018
(excluding the $20 million supplemental payment described below) and approximately
$276 million
in
2019
. As previously noted, the Company agreed to grant the PBGC a lien on, and subsequently contribute to the Company's pension plans, the value of the $250 million cash payment payable to the Company on the third anniversary of the Craftsman closing (the "Craftsman Receivable"). During the 13 weeks ended July 29, 2017, we sold the Craftsman Receivable to a third-party purchaser, and deposited the proceeds into an escrow for the benefit of our pension plans. We subsequently contributed a portion of the proceeds received from the sale of the Craftsman Receivable to our pension plans, which contribution was credited against the Company's minimum pension funding obligations in 2017. Under our agreement with the PBGC, the remaining proceeds will also be contributed to our pension plans, and when so contributed, will be fully credited against the Company's minimum pension funding obligations in 2018 and 2019.
The Company also agreed to grant a lien to the PBGC on the 15-year income stream relating to new Stanley Black & Decker sales of Craftsman products, and agreed to contribute the payments from Stanley Black & Decker under such income stream to the Company's pension plans, with such payments to be credited against the Company's minimum pension funding obligations starting no later than five years from the closing date. The Company also
48
agreed to grant the PBGC a lien on $100 million of real estate assets to secure the Company's minimum pension obligations through the end of 2019.
In November 2017, the Company announced an amendment to the PPPFA that allowed the Company to pursue the monetization of 138 of our properties that were subject to a ring-fence arrangement created under the PPPFA. In March 2018, the Company closed on the Secured Loan and the Mezzanine Loan, which transactions released the properties from the ring-fence arrangement. The Company contributed approximately $282 million of the proceeds of such loans to our pension plans, and deposited $125 million into an escrow for the benefit of our pension plans. Under our agreement with the PBGC, the escrowed amount will also be contributed to our pension plans and, when so contributed, will be fully credited against the Company’s minimum pension funding obligations in 2018 and 2019 described above. Following such transactions, the Company has been relieved of contributions to our pension plans for approximately two years (other than the contributions from escrow described above and a $20 million supplemental payment due in the second quarter of 2018). The ultimate amount of pension contributions could be affected by factors such as changes in applicable laws, as well as financial market and investment performance and demographic changes.
49
Contractual Obligations and Off-Balance Sheet Arrangements
Information concerning our obligations and commitments to make future payments under contracts such as debt and lease agreements, and under contingent commitments, is aggregated in the following table.
|
|
Total
|
Payments Due by Period
|
|||||||||||||||||||||
|
Contractual Obligations
|
Within 1 Year
|
1-3 Years
|
3-5 Years
|
After 5 Years
|
Other
|
||||||||||||||||||
|
millions
|
|
|
|
|
|
|
|||||||||||||||||
|
Operating leases
|
$
|
2,839
|
|
$
|
537
|
|
$
|
807
|
|
$
|
534
|
|
$
|
961
|
|
$
|
—
|
|
|||||
|
Short-term borrowings
|
915
|
|
915
|
|
—
|
|
—
|
|
—
|
|
—
|
|
|||||||||||
|
Capital lease obligations
|
115
|
|
28
|
|
21
|
|
8
|
|
58
|
|
—
|
|
|||||||||||
|
Royalty license fees
(1)
|
60
|
|
36
|
|
24
|
|
—
|
|
—
|
|
—
|
|
|||||||||||
|
Other
|
2
|
|
2
|
|
—
|
|
—
|
|
—
|
|
—
|
|
|||||||||||
|
Pension funding obligations
(2)
|
1,682
|
|
280
|
|
485
|
|
431
|
|
486
|
|
—
|
|
|||||||||||
|
Long-term debt including current portion and interest
|
4,155
|
|
1,222
|
|
2,381
|
|
40
|
|
512
|
|
—
|
|
|||||||||||
|
Liability and interest related to uncertain tax positions
(3)
|
181
|
|
—
|
|
—
|
|
—
|
|
—
|
|
181
|
|
|||||||||||
|
Total contractual obligations
|
$
|
9,949
|
|
$
|
3,020
|
|
$
|
3,718
|
|
$
|
1,013
|
|
$
|
2,017
|
|
$
|
181
|
|
|||||
|
(1)
|
We pay royalties under various merchandise license agreements, which are generally based on sales of products covered under these agreements. We currently have license agreements for which we pay royalties, including those to use Joe Boxer and Everlast. Royalty license fees represent the minimum the Company is obligated to pay, regardless of sales, as guaranteed royalties under these license agreements.
|
|
(2)
|
In March 2018, the Company contributed approximately
$282 million
to our pension plans and deposited
$125 million
into an escrow for the benefit of our pension plans, both from proceeds of the Secured Loan and the Mezzanine Loan. The remaining proceeds from the sale of the Craftsman Receivable are also held within an escrow for the benefit of our pension plans. Under our agreement with the PBGC, these escrowed amounts will be contributed to our pension plans and, when so contributed, will be fully credited against the Company’s minimum pension funding obligations in 2018 and 2019. As a result of these transactions, the Company has been relieved of contributions to our pension plans for approximately two years (other than the contributions from escrow described above and a
$20 million
supplemental payment due in the second quarter of 2018). See Note 7 of Notes to Consolidated Financial Statements for further information.
|
|
(3)
|
At
February 3, 2018
, our uncertain tax position liability and gross interest payable were
$130 million
and
$51 million
, respectively. We are unable to reasonably estimate the timing of liabilities and interest payments arising from uncertain tax positions in individual years due to the uncertainties in the timing of the effective settlement of tax positions.
|
Other Commercial Commitments
We issue various types of guarantees in the normal course of business. We had the following guarantees outstanding at
February 3, 2018
:
|
millions
|
Bank
Issued
|
SRAC
Issued
|
Other
|
Total
|
|||||||||||
|
Standby letters of credit
|
$
|
647
|
|
$
|
6
|
|
$
|
—
|
|
$
|
653
|
|
|||
|
Commercial letters of credit
|
—
|
|
31
|
|
—
|
|
31
|
|
|||||||
|
Secondary lease obligations and performance guarantee
|
—
|
|
—
|
|
164
|
|
164
|
|
|||||||
50
The secondary lease obligations relate to certain store leases that have been assigned and previously divested Sears businesses. The secondary lease obligations represent the maximum potential amount of future payments, including renewal option periods pursuant to the lease agreements. We remain secondarily liable if the primary obligor defaults.
51
Application of Critical Accounting Policies and Estimates
In preparing the financial statements, certain accounting policies require considerable judgment to select the appropriate assumptions to calculate financial estimates. These estimates are complex and subject to an inherent degree of uncertainty. We base our estimates on historical experience, terms of existing contracts, evaluation of trends and other assumptions that we believe to be reasonable under the circumstances. We continually evaluate the information used to make these estimates as our business and the economic environment change. Although the use of estimates is pervasive throughout the financial statements, we consider an accounting estimate to be critical if:
|
•
|
it requires assumptions to be made about matters that were highly uncertain at the time the estimate was made; and
|
|
•
|
changes in the estimate that are reasonably likely to occur from period to period or different estimates that could have been selected would have a material effect on our financial condition, cash flows or results of operations.
|
Management believes the current assumptions and other considerations used to estimate amounts reflected in the financial statements are appropriate. However, if actual experience differs from the assumptions and the considerations used in estimating amounts, the resulting changes could have a material adverse effect on our consolidated results of operations, and in certain situations, could have a material adverse effect on our financial condition.
Management has discussed the development and selection of these critical accounting estimates with the Audit Committee of our Board of Directors and the Audit Committee has reviewed the disclosure presented below relating to the selection of these estimates.
The following is a summary of our most critical policies and estimates. See Note 1 of Notes to Consolidated Financial Statements for a listing of our other significant accounting policies.
Valuation of Inventory
Our inventory is valued at the lower of cost or market determined primarily using the retail inventory method ("RIM"). RIM is an averaging method that is commonly used in the retail industry. To determine inventory cost under RIM, inventory at its retail selling value is segregated into groupings of merchandise having similar characteristics, which are then converted to a cost basis by applying specific average cost factors for each grouping of merchandise. Cost factors represent the average cost-to-retail ratio for each merchandise group based upon the year purchasing activity for each store location. Accordingly, a significant assumption under the retail method is that inventory in each group is similar in terms of its cost-to-retail relationship and has similar turnover rates. Management monitors the content of merchandise in these groupings to prevent distortions that would have a material effect on inventory valuation.
RIM inherently requires management judgment and certain estimates that may significantly affect the ending inventory valuation, as well as gross margin. Among others, two significant estimates used in inventory valuation are the level and timing of permanent markdowns (clearance markdowns used to clear unproductive or slow-moving inventory) and shrinkage. Amounts are charged to cost of sales, buying and occupancy at the time the retail value of inventory is reduced through the use of permanent markdowns.
Factors considered in the determination of permanent markdowns include current and anticipated demand, customer preferences, age of the merchandise, fashion trends and weather conditions. In addition, inventory is also evaluated against corporate pre-determined historical markdown cadences. When a decision is made to permanently markdown merchandise, the resulting gross margin reduction is recognized in the period the markdown is recorded. The timing of the decision, particularly surrounding the balance sheet date, can have a significant effect on the results of operations.
Shrinkage is estimated as a percentage of sales for the period from the date of the last physical inventory to the end of the year. Physical inventories are taken annually for all stores and inventory records are adjusted accordingly. The shrinkage rate from the most recent physical inventory, in combination with historical experience, is used as the basis for the shrinkage accrual following the physical inventory.
52
Self-insurance Reserves
We use a combination of third-party insurance and/or self-insurance for a number of risks including workers' compensation, asbestos, environmental, automobile, warranty, product and general liability claims. General liability costs relate primarily to litigation that arises from store operations. Self-insurance reserves include actuarial estimates of both claims filed and carried at their expected ultimate settlement value and claims incurred but not yet reported. Our estimated claim amounts are discounted using a rate with a duration that approximates the duration of our self-insurance reserve portfolio. Our liability reflected in the Consolidated Balance Sheets represents an estimate of the ultimate cost of claims incurred at the balance sheet date. In estimating this liability, we utilize loss development factors based on Company-specific data to project the future development of incurred losses. Loss estimates are adjusted based upon actual claims settlements and reported claims. These projections are subject to a high degree of variability based upon future inflation rates, litigation trends, legal interpretations, benefit level changes and claim settlement patterns. Although we do not expect the amounts ultimately paid to differ significantly from our estimates, self-insurance reserves could be affected if future claim experience differs significantly from the historical trends and the actuarial assumptions. A 10% change in our self-insurance reserves would have impacted net loss by approximately
$65 million
.
Defined Benefit Pension Plans
The fundamental components of accounting for defined benefit pension plans consist of the compensation cost of the benefits earned, the interest cost from deferring payment of those benefits into the future and the results of investing any assets set aside to fund the obligation. Such retirement benefits were earned by associates ratably over their service careers. Therefore, the amounts reported in the income statement for these retirement plans have historically followed the same pattern. Accordingly, changes in the obligations or the value of assets to fund them have been recognized systematically and gradually over the associate's estimated period of service. The largest drivers of losses or charges in recent years have been the discount rate used to determine the present value of the obligation and the actual return on pension assets. We recognize the changes by amortizing experience gains/losses in excess of the 10% corridor into expense over the associated service period.
The Company's actuarial valuations utilize key assumptions including discount rates and expected returns on plan assets. We are required to consider current market conditions, including changes in interest rates and plan asset investment returns, in determining these assumptions. The determination of our obligations and expense for pension benefits is dependent upon certain assumptions used in calculating such amounts. Key assumptions used in the actuarial valuations include the discount rate, expected long-term rate of return on plan assets and mortality rate assumptions. To determine the discount rate used in the development of the benefit obligation and net periodic benefit cost, a cash flow matching analysis of the expected future benefit payments is performed. In addition to considering the results that cash flow matching produces, the Company gives consideration to changes in industry benchmark yield curve rates. Actuarial assumptions may differ materially from actual results due to changing market and economic conditions, changes in investment strategies, higher or lower withdrawal rates, and longer or shorter life spans of participants. For further information, see Note 7 of Notes to Consolidated Financial Statements.
The actual and expected return on plan assets for
2017
,
2016
and
2015
were as follows:
|
|
2017
|
2016
|
2015
|
||||||
|
Actual return on plan assets
|
7.98
|
%
|
16.08
|
%
|
(7.35
|
)%
|
|||
|
Expected return on plan assets
|
6.50
|
%
|
6.50
|
%
|
7.00
|
%
|
|||
The Sears Holdings Corporation Investment Committee is responsible for the investment of the assets of Holdings' domestic pension plans. The Investment Committee, made up primarily of select members of senior management, has appointed a non-affiliated third party professional to advise the Investment Committee with respect to the assets of Holdings' domestic pension plans. The plans' overall investment objective is to provide a long-term return that, along with Company contributions, is expected to meet future benefit payment requirements. A long-term horizon has been adopted in establishing investment policy such that the likelihood and duration of investment losses are carefully weighed against the long-term potential for appreciation of assets. The plans' investment policies require investments to be diversified across individual securities, industries, market
53
capitalization and valuation characteristics. In addition, various techniques are utilized to monitor, measure and manage risk.
For purposes of determining the periodic expense of our defined benefit plans, we use the fair value of plan assets as the market related value. A one-percentage-point change in the assumed discount rate would have the following effects on the pension liabilities:
|
millions
|
1 percentage-point
Increase
|
1 percentage-point
Decrease
|
|||||
|
Effect on interest cost component
|
$
|
20
|
|
$
|
(26
|
)
|
|
|
Effect on pension benefit obligation
|
$
|
(384
|
)
|
$
|
460
|
|
|
Income Taxes
We account for income taxes according to accounting standards for such taxes. Deferred tax assets and liabilities are recognized for the future tax consequences attributable to differences between the book basis and tax basis of assets and liabilities. Deferred tax assets and liabilities are measured using enacted tax rates expected to apply to taxable income in the years in which those temporary differences are expected to be recovered or settled. If future utilization of deferred tax assets is uncertain, the Company may record a valuation allowance against its deferred tax assets. Our accounting policies related to the valuation allowance are further described in Note 1 of Notes to Consolidated Financial Statements. After consideration of evidence regarding the ability to realize our deferred tax assets, we established a valuation allowance against deferred income tax assets in
2017
,
2016
and
2015
. For the year ended
February 3, 2018
, the valuation allowance decreased by
$1.3 billion
of which an increase of
$62 million
was recorded through other comprehensive income. The Company continues to monitor its operating performance and evaluate the likelihood of the future realization of these deferred tax assets.
Significant management judgment is required in determining our provision for income taxes, deferred tax assets and liabilities and the valuation allowance recorded against our net deferred tax assets, if any. Management considers estimates of the amount and character of future taxable income in assessing the likelihood of realization of deferred tax assets. Our actual effective tax rate and income tax expense could vary from estimated amounts due to the future impacts of various items, including changes in income tax laws, tax planning and the Company's forecasted financial condition and results of operations in future periods. Although management believes current estimates are reasonable, actual results could differ from these estimates.
Domestic and foreign tax authorities periodically audit our income tax returns. These audits include questions regarding our tax filing positions, including the timing and amount of deductions and the allocation of income among various tax jurisdictions. In evaluating the exposures associated with our various tax filing positions, we record reserves in accordance with accounting standards for uncertain tax positions. A number of years may elapse before a particular matter, for which we have established a reserve, is audited and fully resolved. Management's estimates at the date of the financial statements reflect our best judgment, giving consideration to all currently available facts and circumstances. As such, these estimates may require adjustment in the future, as additional facts become known or as circumstances change. For further information, see Note 10 of Notes to Consolidated Financial Statements.
Goodwill and Intangible Asset Impairment Assessments
At both
February 3, 2018
and
January 28, 2017
, we had goodwill balances of
$269 million
. At
February 3, 2018
and
January 28, 2017
, we had intangible asset balances of
$1.2 billion
and
$1.5 billion
, respectively. The Company evaluates the carrying value of goodwill and intangible assets for possible impairment under accounting standards governing goodwill and other intangible assets. Our accounting policies related to goodwill and intangible asset impairment assessments are further described in Note 1 of Notes to Consolidated Financial Statements.
Goodwill Impairment Assessments
Our goodwill balance relates to our Home Services business. We did not record any goodwill impairment charges in
2017
,
2016
or
2015
.
54
The use of different assumptions, estimates or judgments in either step of the goodwill impairment testing process, such as the estimated future cash flows of the reporting unit, the discount rate used to discount such cash flows, or the estimated fair value of the reporting unit's tangible and intangible assets and liabilities, could significantly increase or decrease the estimated fair value of the reporting unit or its net assets. At the
2017
annual impairment test date, the conclusion that no indication of goodwill impairment existed for the reporting unit would not have changed had the test been conducted assuming: (1) a 100 basis point increase in the discount rate used to discount the aggregate estimated cash flows of the reporting unit to its net present value in determining their estimated fair values; and/or (2) a 100 basis point decrease in the estimated sales growth rate and/or terminal period growth rate.
Based on our sensitivity analysis, we do not believe that the remaining recorded goodwill balance is at risk of impairment at the reporting unit at the end of the year because the fair value is in excess of the carrying value and not at risk of failing step one. However, goodwill impairment charges may be recognized in future periods in the reporting unit to the extent changes in factors or circumstances occur, including deterioration in the macroeconomic environment, retail industry or in the equity markets, which includes the market value of our common shares, deterioration in our performance or our future projections, or changes in our plans for the reporting unit.
Intangible Asset Impairment Assessments
The majority of our indefinite-lived intangible assets relate to the Sears, Kenmore
and
DieHard
trade names. In 2017, 2016 and 2015, we recorded impairment related to the Sears trade name of
$72 million
,
$381 million
and
$180 million
, respectively, which reduced the carrying value to
$359 million
at February 3, 2018 and
$431 million
at January 28, 2017.
The use of different assumptions, estimates or judgments in our intangible asset impairment testing process, such as the estimated future cash flows of assets and the discount rate used to discount such cash flows, could significantly increase or decrease the estimated fair value of an asset, and therefore, impact the related impairment charge. At the
2017
annual impairment test date, the above-noted conclusion that no indication of intangible asset impairment existed at the test date for the Kenmore and DieHard
trade names would have changed had the test been conducted assuming: (1) a 100 basis point increase in the discount rate used to discount the aggregate estimated cash flows of our assets to their net present value in determining their estimated fair values (without any change in the aggregate estimated cash flows of our intangibles); (2) a 100 basis point decrease in the terminal period growth rate; (3) a 10% decrease in the revenue growth rate for fiscal year 2018; or (4) a 10 basis point decrease in the royalty rate applied to the forecasted net sales stream of our assets and would have resulted in a potential impairment of up to $99 million under any combination of those scenarios. Also, the above-noted impairment related to the Sears trade name would have changed under any combination of those scenarios and would have resulted in potential incremental impairment of up to $102 million.
We believe the impairment charges of
$72 million
,
$381 million
and
$180 million
in 2017, 2016 and 2015, respectively, are appropriate based on the judgments and estimates used in our analysis. We do not believe that the other indefinite-lived intangible balances are impaired at the end of the year because the fair values are in excess of the carrying values based on our analysis. However, further indefinite-lived intangible impairment charges may be recognized in future periods to the extent changes in factors or circumstances occur, including deterioration in the macroeconomic environment, retail industry, deterioration in our performance or our future projections, if actual results are not consistent with our estimates and assumptions used in the analysis, or changes in our plans for one or more indefinite-lived intangible assets. We will continue to monitor for such changes in facts or circumstances, which may be indicators of potential impairment triggers, and may result in impairment charges in the future, which could be material to our results of operations.
Impairment of Long-Lived Assets
In accordance with accounting standards governing the impairment or disposal of long-lived assets, the carrying value of long-lived assets, including property and equipment and definite-lived intangible assets, is evaluated whenever events or changes in circumstances indicate that a potential impairment has occurred relative to a given asset or assets. Our accounting policies related to long-lived asset impairment assessments are further described in Note 1 of Notes to Consolidated Financial Statements. As a result of this impairment testing, the
55
Company recorded impairment charges of
$70 million
,
$46 million
and
$94 million
during
2017
,
2016
and
2015
, respectively. Our impairment testing includes uncertainty because it requires management to make assumptions and to apply judgment to estimate future cash flows and asset fair values. If actual results are not consistent with our estimates and assumptions used in estimating future cash flows and asset fair values, we may be exposed to additional impairment charges in the future, which could be material to our results of operations.
New Accounting Pronouncements
See Note 1 of Notes to Consolidated Financial Statements for information regarding new accounting pronouncements.
CAUTIONARY STATEMENT REGARDING FORWARD-LOOKING INFORMATION
Certain statements made in this Annual Report on Form 10-K and in other public announcements by us contain forward-looking statements within the meaning of the Section 27A of the Securities Act of 1933, as amended, Section 21E of the Securities Act of 1934, as amended, and the Private Securities Litigation Reform Act of 1995. Forward-looking statements include information concerning our future financial performance, business strategy, plans, goals and objectives. Statements preceded or followed by, or that otherwise include, the words "believes," "expects," "anticipates," "intends," "estimates," "plans," "forecast," "is likely to" and similar expressions or future or conditional verbs such as "will," "may" and "could" are generally forward-looking in nature and not historical facts. Such statements are based upon the current beliefs and expectations of the Company's management and are subject to significant risks and uncertainties, many of which are beyond the Company's control, which may cause our actual results, performance or achievements to be materially different from any future results, performance or achievements expressed or implied by these forward-looking statements. Actual results may differ materially from those set forth in the forward-looking statements.
The following factors, among others, could cause actual results to differ from those set forth in the forward-looking statements: our ability to offer merchandise and services that meet our customers and members' needs; our ability to successfully implement our integrated retail strategy to transform our business; our ability to successfully manage our inventory levels; initiatives to improve our liquidity through inventory management and other actions; our substantial level of indebtedness and related debt service obligations and restrictions imposed by covenants in our debt agreements, vendors' lack of willingness to provide acceptable payment terms or otherwise restricting financing to purchase inventory or services; possible limits on our access to our domestic credit facility, which is subject to a borrowing base limitation and a springing fixed charge coverage ratio covenant, capital markets and other financing sources, including additional second lien financings, with respect to which we do not have commitments from lenders; our ability to successfully achieve our plans to generate liquidity through potential transactions or otherwise; our ability to achieve cost savings initiatives; our failure to implement and execute an effective advertising and marketing strategy; potential liabilities in connection with the separations of Sears Hometown and Outlet Stores and Lands' End and disposition of a portion of our ownership interest in Sears Canada or other transactions; failure to realize the anticipated benefits from the Craftsman Sale; payment-related risks that could increase our operating costs, expose us to fraud or theft, subject us to potential liability and potentially disrupt our business operations; the impact of seasonal buying patterns, including seasonal fluctuations due to weather conditions, which are difficult to forecast with certainty; fluctuations in our sales due to changes in customers’ spending patterns and prevailing economic conditions; risks and uncertainties related to the Seritage transaction and the amendment and extension of our credit facility, such as the impact of the evaluation of any such transaction on our other businesses; our dependence on sources outside the United States for significant amounts of our merchandise; our reliance on third parties to provide us with services in connection with the administration of certain aspects of our business and the transfer of significant internal historical knowledge to such parties; impairment charges for goodwill and intangible assets or fixed-asset impairment for long-lived assets; our ability to attract, motivate and retain key executives and other associates; the substantial influence exerted over the Company by affiliates of our Chairman and Chief Executive Officer, whose interests may diverge from other stockholders' interests; our ability to protect or preserve the image of our brands and our intellectual property; the outcome of pending and/or future legal proceedings; our failure to comply with federal, state, local and international laws, or changes in these laws; and the timing, amount and other risks related to required pension plan funding.
56
Certain of these and other factors are discussed in more detail in Part I, Item 1A of this Annual Report on Form 10-K. While we believe that our forecasts and assumptions are reasonable, we caution that actual results may differ materially. We intend the forward-looking statements to speak only as of the time made and do not undertake to update or revise them as more information becomes available, except as required by law.
|
Item 7A.
|
Quantitative and Qualitative Disclosures about Market Risk
|
We face market risk exposure in the form of interest rate risk. This market risk arises from our debt obligations.
Interest Rate Risk
We manage interest rate risk through the use of fixed and variable-rate funding. All debt securities are considered non-trading. At
February 3, 2018
, 42% of our debt portfolio was variable rate. Based on the size of this variable rate debt portfolio at
February 3, 2018
, which totaled approximately $1.8 billion, an immediate 100 basis point change in interest rates would have affected annual pretax funding costs by $18 million. These estimates do not take into account the effect on income resulting from invested cash or the returns on assets being funded. These estimates also assume that the variable rate funding portfolio remains constant for an annual period and that the interest rate change occurs at the beginning of the period.
57
|
Page
|
|
58
SEARS HOLDINGS CORPORATION
|
dollars in millions, except per share data
|
2017
|
2016
|
2015
|
||||||||
|
REVENUES
|
|||||||||||
|
Merchandise sales
|
$
|
13,409
|
|
$
|
18,236
|
|
$
|
20,936
|
|
||
|
Services and other
(1)(2)
|
3,293
|
|
3,902
|
|
4,210
|
|
|||||
|
Total revenues
|
16,702
|
|
22,138
|
|
25,146
|
|
|||||
|
COSTS AND EXPENSES
|
|||||||||||
|
Cost of sales, buying and occupancy - merchandise sales
(3)
|
11,349
|
|
15,184
|
|
16,817
|
|
|||||
|
Cost of sales and occupancy - services and other
(1)
|
1,826
|
|
2,268
|
|
2,519
|
|
|||||
|
Total cost of sales, buying and occupancy
|
13,175
|
|
17,452
|
|
19,336
|
|
|||||
|
Selling and administrative
|
5,131
|
|
6,109
|
|
6,857
|
|
|||||
|
Depreciation and amortization
|
332
|
|
375
|
|
422
|
|
|||||
|
Impairment charges
|
142
|
|
427
|
|
274
|
|
|||||
|
Gain on sales of assets
|
(1,648
|
)
|
(247
|
)
|
(743
|
)
|
|||||
|
Total costs and expenses
|
17,132
|
|
24,116
|
|
26,146
|
|
|||||
|
Operating loss
|
(430
|
)
|
(1,978
|
)
|
(1,000
|
)
|
|||||
|
Interest expense
|
(539
|
)
|
(404
|
)
|
(323
|
)
|
|||||
|
Interest and investment loss
|
(12
|
)
|
(26
|
)
|
(62
|
)
|
|||||
|
Other income
|
—
|
|
13
|
|
—
|
|
|||||
|
Loss before income taxes
|
(981
|
)
|
(2,395
|
)
|
(1,385
|
)
|
|||||
|
Income tax benefit
|
598
|
|
174
|
|
257
|
|
|||||
|
Net loss
|
(383
|
)
|
(2,221
|
)
|
(1,128
|
)
|
|||||
|
Income attributable to noncontrolling interests
|
—
|
|
—
|
|
(1
|
)
|
|||||
|
NET LOSS ATTRIBUTABLE TO HOLDINGS’ SHAREHOLDERS
|
$
|
(383
|
)
|
$
|
(2,221
|
)
|
$
|
(1,129
|
)
|
||
|
NET LOSS PER COMMON SHARE ATTRIBUTABLE TO HOLDINGS’ SHAREHOLDERS
|
|||||||||||
|
Basic loss per share
|
$
|
(3.57
|
)
|
$
|
(20.78
|
)
|
$
|
(10.59
|
)
|
||
|
Diluted loss per share
|
$
|
(3.57
|
)
|
$
|
(20.78
|
)
|
$
|
(10.59
|
)
|
||
|
Basic weighted average common shares outstanding
|
107.4
|
|
106.9
|
|
106.6
|
|
|||||
|
Diluted weighted average common shares outstanding
|
107.4
|
|
106.9
|
|
106.6
|
|
|||||
|
(1)
|
Includes merchandise sales to Sears Hometown and Outlet Stores, Inc. ("SHO") of
$918 million
,
$1.1 billion
and
$1.3 billion
in
2017
,
2016
and
2015
, respectively. Pursuant to the terms of the separation, merchandise is sold to SHO at cost.
|
(2)
Includes revenue from Lands' End, Inc. ("Lands' End") for retail services and rent for Lands' End Shops at Sears, participation in the Shop Your Way program and corporate shared services of
$47 million
,
$52 million
and
$59 million
in
2017
,
2016
and
2015
, respectively.
(3)
Includes rent expense (consisting of straight-line rent expense offset by amortization of a deferred gain on sale-leaseback) of
$70 million
,
$83 million
and
$49 million
in
2017
,
2016
, and
2015
, respectively, and installment expenses of
$43 million
,
$64 million
and
$40 million
in
2017
,
2016
and
2015
, respectively, pursuant to the master lease with Seritage Growth Properties ("Seritage").
See accompanying Notes to Consolidated Financial Statements.
59
SEARS HOLDINGS CORPORATION
Consolidated Statements of Comprehensive Income (Loss)
|
millions
|
2017
|
2016
|
2015
|
||||||||
|
Net loss
|
$
|
(383
|
)
|
$
|
(2,221
|
)
|
$
|
(1,128
|
)
|
||
|
Other comprehensive income (loss)
|
|||||||||||
|
Pension and postretirement adjustments, net of tax
|
478
|
|
366
|
|
113
|
|
|||||
|
Currency translation adjustments, net of tax
|
2
|
|
—
|
|
(1
|
)
|
|||||
|
Dissolution of noncontrolling interest
|
—
|
|
(7
|
)
|
—
|
|
|||||
|
Total other comprehensive income
|
480
|
|
359
|
|
112
|
|
|||||
|
Comprehensive income (loss)
|
97
|
|
(1,862
|
)
|
(1,016
|
)
|
|||||
|
Comprehensive (income) loss attributable to noncontrolling interests
|
—
|
|
7
|
|
(1
|
)
|
|||||
|
Comprehensive income (loss) attributable to Holdings' shareholders
|
$
|
97
|
|
$
|
(1,855
|
)
|
$
|
(1,017
|
)
|
||
See accompanying Notes to Consolidated Financial Statements.
60
SEARS HOLDINGS CORPORATION
|
millions
|
February 3,
2018 |
January 28,
2017 |
|||||
|
ASSETS
|
|||||||
|
Current assets
|
|||||||
|
Cash and cash equivalents
|
$
|
182
|
|
$
|
286
|
|
|
|
Restricted cash
|
154
|
|
—
|
|
|||
|
Accounts receivable
(1)
|
343
|
|
466
|
|
|||
|
Merchandise inventories
|
2,798
|
|
3,959
|
|
|||
|
Prepaid expenses and other current assets
(2)
|
335
|
|
285
|
|
|||
|
Total current assets
|
3,812
|
|
4,996
|
|
|||
|
Property and equipment
|
|||||||
|
Land
|
659
|
|
770
|
|
|||
|
Buildings and improvements
|
2,432
|
|
2,954
|
|
|||
|
Furniture, fixtures and equipment
|
868
|
|
1,133
|
|
|||
|
Capital leases
|
151
|
|
224
|
|
|||
|
Gross property and equipment
|
4,110
|
|
5,081
|
|
|||
|
Less accumulated depreciation and amortization
|
(2,381
|
)
|
(2,841
|
)
|
|||
|
Total property and equipment, net
|
1,729
|
|
2,240
|
|
|||
|
Goodwill
|
269
|
|
269
|
|
|||
|
Trade names and other intangible assets
|
1,168
|
|
1,521
|
|
|||
|
Other assets
|
284
|
|
336
|
|
|||
|
TOTAL ASSETS
|
$
|
7,262
|
|
$
|
9,362
|
|
|
|
LIABILITIES
|
|||||||
|
Current liabilities
|
|||||||
|
Short-term borrowings
(3)
|
$
|
915
|
|
$
|
—
|
|
|
|
Current portion of long-term debt and capitalized lease obligations
(4)
|
968
|
|
590
|
|
|||
|
Merchandise payables
|
576
|
|
1,048
|
|
|||
|
Other current liabilities
(5)
|
1,568
|
|
1,956
|
|
|||
|
Unearned revenues
|
641
|
|
748
|
|
|||
|
Other taxes
|
247
|
|
339
|
|
|||
|
Total current liabilities
|
4,915
|
|
4,681
|
|
|||
|
Long-term debt and capitalized lease obligations
(6)
|
2,249
|
|
3,573
|
|
|||
|
Pension and postretirement benefits
|
1,619
|
|
1,750
|
|
|||
|
Deferred gain on sale-leaseback
|
362
|
|
563
|
|
|||
|
Sale-leaseback financing obligation
|
247
|
|
235
|
|
|||
|
Other long-term liabilities
|
1,467
|
|
1,641
|
|
|||
|
Long-term deferred tax liabilities
|
126
|
|
743
|
|
|||
|
Total Liabilities
|
10,985
|
|
13,186
|
|
|||
|
Commitments and contingencies
|
|
|
|
|
|||
|
DEFICIT
|
|||||||
|
Sears Holdings Corporation deficit
|
|||||||
|
Preferred stock, 20 shares authorized; no shares outstanding
|
—
|
|
—
|
|
|||
|
Common stock $0.01 par value; 500 shares authorized; 108 and 107 shares outstanding, respectively
|
1
|
|
1
|
|
|||
|
Treasury stock—at cost
|
(5,820
|
)
|
(5,891
|
)
|
|||
|
Capital in excess of par value
|
9,063
|
|
9,130
|
|
|||
|
Retained deficit
|
(5,895
|
)
|
(5,512
|
)
|
|||
|
Accumulated other comprehensive loss
|
(1,072
|
)
|
(1,552
|
)
|
|||
|
Total Deficit
|
(3,723
|
)
|
(3,824
|
)
|
|||
|
TOTAL LIABILITIES AND DEFICIT
|
$
|
7,262
|
|
$
|
9,362
|
|
|
|
(1)
|
Includes
$28 million
and
$81 million
at
February 3, 2018
and
January 28, 2017
, respectively, of net amounts receivable from SHO,
$1 million
and
$14 million
of amounts receivable from Seritage at
February 3, 2018
and
January 28, 2017
, respectively, and
$1 million
of net amounts receivable from Lands' End at February 3, 2018.
|
|
(2)
|
Includes
$6 million
of prepaid rent to Seritage at
February 3, 2018
.
|
(3)
Includes balances held by related parties of
$645 million
at
February 3, 2018
related to our Line of Credit Loans and Incremental Loans (each as defined in Note 3). See Notes 3 and 15 for further information.
(4)
Includes balances held by related parties of
$146 million
and
$216 million
at
February 3, 2018
and
January 28, 2017
, respectively, related to our 2016 Secured Loan Facility for both periods and also related to our Senior Secured Notes at February 3, 2018. See Note 3 for defined terms.
(5)
Includes
$1 million
of net amounts payable to Lands' End and
$11 million
of amounts payable to Seritage at
January 28, 2017
.
(6)
Includes balances held by related parties of
$1.5 billion
and
$1.7 billion
at
February 3, 2018
and
January 28, 2017
, respectively, related to our Subsidiary Notes, Senior Unsecured Notes, Second Lien Term Loan, 2016 Term Loan and 2017 Secured Loan Facility for both periods and also related to our Term Loan Facility at February 3, 2018 and our Senior Secured Notes at January 28, 2017. See Note 3 for defined terms and Notes 3 and 15 for further information.
See accompanying Notes to Consolidated Financial Statements.
61
SEARS HOLDINGS CORPORATION
|
millions
|
2017
|
2016
|
2015
|
||||||||
|
CASH FLOWS FROM OPERATING ACTIVITIES
|
|||||||||||
|
Net loss
|
$
|
(383
|
)
|
$
|
(2,221
|
)
|
$
|
(1,128
|
)
|
||
|
Adjustments to reconcile net loss to net cash used in operating activities:
|
|||||||||||
|
Deferred tax valuation allowance
|
(1,395
|
)
|
836
|
|
217
|
|
|||||
|
Tax benefit resulting from Other Comprehensive Income allocation
|
—
|
|
(71
|
)
|
—
|
|
|||||
|
Depreciation and amortization
|
332
|
|
375
|
|
422
|
|
|||||
|
Impairment charges
|
142
|
|
427
|
|
274
|
|
|||||
|
Gain on sales of assets
|
(1,648
|
)
|
(247
|
)
|
(743
|
)
|
|||||
|
Pension and postretirement plan contributions
|
(312
|
)
|
(334
|
)
|
(311
|
)
|
|||||
|
Pension plan settlements
|
479
|
|
—
|
|
—
|
|
|||||
|
Mark-to-market adjustments of financial instruments
|
17
|
|
15
|
|
66
|
|
|||||
|
Amortization of deferred gain on sale-leaseback
|
(78
|
)
|
(88
|
)
|
(52
|
)
|
|||||
|
Amortization of debt issuance costs and accretion of debt discount
|
124
|
|
81
|
|
60
|
|
|||||
|
Other
|
(36
|
)
|
—
|
|
—
|
|
|||||
|
Change in operating assets and liabilities (net of acquisitions and dispositions):
|
|||||||||||
|
Deferred income taxes
|
778
|
|
(987
|
)
|
(519
|
)
|
|||||
|
Merchandise inventories
|
1,144
|
|
1,213
|
|
(229
|
)
|
|||||
|
Merchandise payables
|
(472
|
)
|
(526
|
)
|
(47
|
)
|
|||||
|
Income and other taxes
|
(108
|
)
|
80
|
|
(95
|
)
|
|||||
|
Other operating assets
|
51
|
|
(52
|
)
|
54
|
|
|||||
|
Other operating liabilities
|
(477
|
)
|
118
|
|
(136
|
)
|
|||||
|
Net cash used in operating activities
|
(1,842
|
)
|
(1,381
|
)
|
(2,167
|
)
|
|||||
|
CASH FLOWS FROM INVESTING ACTIVITIES
|
|||||||||||
|
Proceeds from sales of property and investments
(1)
|
1,109
|
|
386
|
|
2,730
|
|
|||||
|
Proceeds from Craftsman Sale
|
572
|
|
—
|
|
—
|
|
|||||
|
Proceeds from sales of receivables
(2)
|
293
|
|
—
|
|
—
|
|
|||||
|
Purchases of property and equipment
|
(80
|
)
|
(142
|
)
|
(211
|
)
|
|||||
|
Net cash provided by investing activities
|
1,894
|
|
244
|
|
2,519
|
|
|||||
|
CASH FLOWS FROM FINANCING ACTIVITIES
|
|||||||||||
|
Proceeds from debt issuances
(3)
|
1,020
|
|
2,028
|
|
—
|
|
|||||
|
Repayments of debt
(4)
|
(1,356
|
)
|
(66
|
)
|
(1,405
|
)
|
|||||
|
Increase (decrease) in short-term borrowings, primarily 90 days or less
|
271
|
|
(797
|
)
|
583
|
|
|||||
|
Proceeds from sale-leaseback financing
(1)
|
106
|
|
71
|
|
508
|
|
|||||
|
Debt issuance costs
(5)
|
(43
|
)
|
(51
|
)
|
(50
|
)
|
|||||
|
Net cash provided by (used in) financing activities
|
(2
|
)
|
1,185
|
|
(364
|
)
|
|||||
|
NET INCREASE (DECREASE) IN CASH, CASH EQUIVALENTS, AND RESTRICTED CASH
|
50
|
|
48
|
|
(12
|
)
|
|||||
|
CASH, CASH EQUIVALENTS, AND RESTRICTED CASH BEGINNING OF YEAR
|
286
|
|
238
|
|
250
|
|
|||||
|
CASH, CASH EQUIVALENTS, AND RESTRICTED CASH END OF YEAR
|
$
|
336
|
|
$
|
286
|
|
$
|
238
|
|
||
|
SUPPLEMENTAL INFORMATION:
|
|||||||||||
|
Capital lease obligation incurred
|
$
|
—
|
|
$
|
25
|
|
$
|
6
|
|
||
|
Supplemental Cash Flow Data:
|
|||||||||||
|
Income taxes paid, net of refunds
|
$
|
37
|
|
$
|
23
|
|
$
|
45
|
|
||
|
Cash interest paid
(6)
|
412
|
|
275
|
|
252
|
|
|||||
|
Unpaid liability to acquire equipment and software
|
10
|
|
18
|
|
27
|
|
|||||
(1)
Holdings received cash proceeds of
$2.7 billion
(
$2.6 billion
, net of closing costs) from the Seritage transaction (including
$745 million
and
$297 million
, respectively, received from ESL Investments, Inc. and its affiliates ("ESL") and Fairholme Capital Management, LLC and its affiliates ("Fairholme")), and
$429 million
(
$426 million
, net of closing costs) from the JV transactions. Proceeds from the Seritage transaction are included in proceeds from sales of property and investments (
$2.6 billion
), and proceeds from sale-leaseback financing (
$82 million
) for 2015. Proceeds from the JV transactions are included in proceeds from sale-leaseback financing (
$426 million
) for 2015. See Note 11 for further information and defined terms.
(2)
Proceeds in 2017 include
$63 million
from JPP, LLC and JPP II, LLC, entities affiliated with ESL (as defined in Note 1), for the sale of receivables.
(3)
Proceeds in 2017 and 2016, respectively, include amounts from related parties of
$876 million
in connection with the Term Loan Facility, Line of Credit Loans and Incremental Loans and
$1.3 billion
received from the 2017 Secured Loan Facility, 2016 Secured Loan Facility, 2016 Term Loan and Second Lien Term Loan. See Notes 3 and 15 for further information and defined terms.
(4)
Repayments in 2017 and 2015, respectively, include
$345 million
to related parties in connection with the 2017 Secured Loan Facility, 2016 Secured Loan Facility, Incremental Loans, 2016 Term Loan and Line of Credit Loans and
$400 million
of the Secured Short-Term Loan with related parties and
$482 million
of Senior Secured Notes tendered by related parties, respectively. See Notes 3 and 15 for further information and defined terms.
(5)
Includes one-time extension fees equal to
$5 million
to JPP, LLC and JPP II, LLC, entities affiliated with ESL during 2017. See Note 3 for further information.
(6)
Cash interest paid includes
$180 million
,
$94 million
and
$83 million
interest paid to related parties related to our borrowings in
2017
,
2016
and
2015
, respectively. See Notes 3 and 15 for further information.
See accompanying Notes to Consolidated Financial Statements.
62
SEARS HOLDINGS CORPORATION
Consolidated Statements of Deficit
|
|
Deficit Attributable to Holdings’ Shareholders
|
|
|
||||||||||||||||||||
|
dollars and shares in millions
|
Number
of Shares |
Common
Stock |
Treasury
Stock |
Capital in
Excess of Par Value |
Retained Deficit
|
Accumulated
Other Comprehensive Income (Loss) |
Noncontrolling
Interests |
Total
|
|||||||||||||||
|
Balance at January 31, 2015
|
107
|
|
$
|
1
|
|
$
|
(5,949
|
)
|
$
|
9,189
|
|
$
|
(2,162
|
)
|
$
|
(2,030
|
)
|
$
|
6
|
|
$
|
(945
|
)
|
|
Comprehensive loss
|
|||||||||||||||||||||||
|
Net loss
|
—
|
|
—
|
|
—
|
|
—
|
|
(1,129
|
)
|
—
|
|
1
|
|
(1,128
|
)
|
|||||||
|
Pension and postretirement adjustments, net of tax
|
—
|
|
—
|
|
—
|
|
—
|
|
—
|
|
113
|
|
—
|
|
113
|
|
|||||||
|
Currency translation adjustments, net of tax
|
—
|
|
—
|
|
—
|
|
—
|
|
—
|
|
(1
|
)
|
—
|
|
(1
|
)
|
|||||||
|
Total Comprehensive Loss
|
(1,016
|
)
|
|||||||||||||||||||||
|
Stock awards
|
—
|
|
—
|
|
16
|
|
(16
|
)
|
—
|
|
—
|
|
—
|
|
—
|
|
|||||||
|
Associate stock purchase
|
—
|
|
—
|
|
5
|
|
—
|
|
—
|
|
—
|
|
—
|
|
5
|
|
|||||||
|
Balance at January 30, 2016
|
107
|
|
$
|
1
|
|
$
|
(5,928
|
)
|
$
|
9,173
|
|
$
|
(3,291
|
)
|
$
|
(1,918
|
)
|
$
|
7
|
|
$
|
(1,956
|
)
|
|
Comprehensive loss
|
|||||||||||||||||||||||
|
Net loss
|
—
|
|
—
|
|
—
|
|
—
|
|
(2,221
|
)
|
—
|
|
—
|
|
(2,221
|
)
|
|||||||
|
Pension and postretirement adjustments, net of tax
|
—
|
|
—
|
|
—
|
|
—
|
|
—
|
|
366
|
|
—
|
|
366
|
|
|||||||
|
Dissolution of noncontrolling interest
|
—
|
|
—
|
|
—
|
|
—
|
|
—
|
|
—
|
|
(7
|
)
|
(7
|
)
|
|||||||
|
Total Comprehensive Loss
|
(1,862
|
)
|
|||||||||||||||||||||
|
Stock awards
|
—
|
|
—
|
|
29
|
|
(30
|
)
|
—
|
|
—
|
|
—
|
|
(1
|
)
|
|||||||
|
Reclassification of warrants
|
—
|
|
—
|
|
—
|
|
(13
|
)
|
—
|
|
—
|
|
—
|
|
(13
|
)
|
|||||||
|
Associate stock purchase
|
—
|
|
—
|
|
8
|
|
—
|
|
—
|
|
—
|
|
—
|
|
8
|
|
|||||||
|
Balance at January 28, 2017
|
107
|
|
$
|
1
|
|
$
|
(5,891
|
)
|
$
|
9,130
|
|
$
|
(5,512
|
)
|
$
|
(1,552
|
)
|
$
|
—
|
|
$
|
(3,824
|
)
|
|
Comprehensive income
|
|||||||||||||||||||||||
|
Net loss
|
—
|
|
—
|
|
—
|
|
—
|
|
(383
|
)
|
—
|
|
—
|
|
(383
|
)
|
|||||||
|
Pension and postretirement adjustments, net of tax
|
—
|
|
—
|
|
—
|
|
—
|
|
—
|
|
478
|
|
—
|
|
478
|
|
|||||||
|
Currency translation adjustments, net of tax
|
—
|
|
—
|
|
—
|
|
—
|
|
—
|
|
2
|
|
—
|
|
2
|
|
|||||||
|
Total Comprehensive Income
|
97
|
|
|||||||||||||||||||||
|
Stock awards
|
1
|
|
—
|
|
63
|
|
(67
|
)
|
—
|
|
—
|
|
—
|
|
(4
|
)
|
|||||||
|
Associate stock purchase
|
—
|
|
—
|
|
8
|
|
—
|
|
—
|
|
—
|
|
—
|
|
8
|
|
|||||||
|
Balance at February 3, 2018
|
108
|
|
$
|
1
|
|
$
|
(5,820
|
)
|
$
|
9,063
|
|
$
|
(5,895
|
)
|
$
|
(1,072
|
)
|
$
|
—
|
|
$
|
(3,723
|
)
|
See accompanying Notes to Consolidated Financial Statements.
63
SEARS HOLDINGS CORPORATION
Notes to Consolidated Financial Statements
Nature of Operations, Consolidation and Basis of Presentation
Sears Holdings Corporation ("Holdings") is the parent company of Kmart Holding Corporation ("Kmart") and Sears, Roebuck and Co. ("Sears"). Holdings (together with its subsidiaries, "we," "us," "our," or the "Company") was formed as a Delaware corporation in 2004 in connection with the merger of Kmart and Sears (the "Merger"), on March 24, 2005. We are an integrated retailer with
1,002
full-line and specialty retail stores in the United States, operating through Kmart and Sears. We operate in
two
reportable segments: Kmart and Sears Domestic.
The consolidated financial statements include all majority-owned subsidiaries in which Holdings exercises control. Investments in companies in which Holdings exercises significant influence, but which we do not control (generally
20%
to
50%
ownership interest), are accounted for under the equity method of accounting. Investments in companies in which we have less than a
20%
ownership interest and do not exercise significant influence are accounted for at cost. All intercompany transactions and balances have been eliminated.
Fiscal Year
Our fiscal year ends on the Saturday closest to January 31 each year. Fiscal year
2017
consisted of 53 weeks. Fiscal years
2016
and
2015
consisted of 52 weeks. Unless otherwise stated, references to years in this report relate to fiscal years rather than to calendar years.
Pension Benefit Guaranty Corporation Agreement
On March 18, 2016, we entered into a
five
-year pension plan protection and forbearance agreement (the "PPPFA") with the Pension Benefit Guaranty Corporation ("PBGC"), pursuant to which the Company has agreed to continue to protect, or "ring-fence," pursuant to customary covenants, the assets of certain special purpose subsidiaries (the "Relevant Subsidiaries") holding real estate and/or intellectual property assets. Also under the agreement, the Relevant Subsidiaries granted the PBGC a springing lien on the ring-fenced assets, which lien will be triggered only by (a) failure to make required contributions to the Company's pension plans (the "Plans"), (b) prohibited transfers of ownership interests in the Relevant Subsidiaries, (c) termination events with respect to the Plans, or (d) bankruptcy events with respect to the Company or certain of its material subsidiaries. In November 2017, the Company announced an amendment to the PPPFA which is further described below and in Note 7. Under the PPPFA, the PBGC has agreed to forbear from initiating an involuntary termination of the Plans, except upon the occurrence of specified conditions, one of which is based on the aggregate market value of the Company's issued and outstanding stock. As of the date of this report, the Company's stock price is such that the PBGC would be permitted to cease forbearance. The PBGC has been given notice in accordance with the terms of the PPPFA and has not communicated any intention to cease its forbearance. In November 2017, we entered into an amendment to the PPPFA which provided for the release of
138
of our properties from a ring-fence arrangement, which is further described below and in Note 7. In March 2018, we closed on the
$200 million
Secured Loan and the
$240 million
Mezzanine Loan, both as defined in Note 3, in connection with the release of
138
properties from the ring-fence arrangement with the PBGC.
Craftsman Brand Sale
On January 5, 2017, Holdings announced that it had entered into a definitive agreement under which Stanley Black & Decker would purchase the Craftsman brand from Holdings (the "Craftsman Sale"). On March 8, 2017, the Company closed its sale of the Craftsman brand to Stanley Black & Decker. The transaction provides Stanley Black & Decker with the right to develop, manufacture and sell Craftsman-branded products outside of Holdings and Sears Hometown & Outlet Stores, Inc. distribution channels. As part of the agreement, Holdings is permitted to continue to offer Craftsman-branded products, sourced from existing suppliers, through its current retail channels via a perpetual license from Stanley Black & Decker, which will be royalty-free for the first
15
years after closing and royalty-bearing thereafter.
The Company received an initial upfront payment of
$525 million
, subject to closing costs and an adjustment for working capital changes, at closing. In addition, Stanley Black & Decker will pay a further
$250 million
in cash
64
SEARS HOLDINGS CORPORATION
Notes to Consolidated Financial Statements—(Continued)
in
three
years (the "Craftsman Receivable") and Holdings will receive payments of between
2.5%
and
3.5%
on new Stanley Black & Decker sales of Craftsman products made during the
15
year period following the closing. In connection with the Craftsman Sale, we recognized a gain in our Kmart segment of
$492 million
within gain on sales of assets in the Consolidated Statements of Operations during 2017, and initially established a receivable of
$234 million
for the net present value of the Craftsman Receivable. During the 13 weeks ended July 29, 2017, we sold the Craftsman Receivable to a third-party purchaser.
In connection with the closing of the Craftsman Sale, Holdings reached an agreement with the PBGC pursuant to which the PBGC consented to the sale of the Craftsman-related assets that had been "ring-fenced" under the PPPFA and certain related transactions. As a condition to obtaining this consent, the Company agreed to grant the PBGC a lien on, and subsequently contribute to the Company's pension plans, the value of the Craftsman Receivable, with such payments being fully credited against certain of the Company's minimum pension funding obligations in 2017, 2018 and 2019.
The Company also granted a lien to the PBGC on the
15
-year income stream relating to new Stanley Black & Decker sales of Craftsman products, and agreed to contribute the payments from Stanley Black & Decker under such income stream to the Company's pension plans, with such payments to be credited against the Company's minimum pension funding obligations starting no later than
five
years from the closing date. The Company also agreed to grant the PBGC a lien on
$100 million
of real estate assets to secure the Company's minimum pension funding obligations through the end of 2019, and agreed to certain other amendments to the PPPFA.
Uses and Sources of Liquidity
Our primary need for liquidity is to fund working capital requirements of our businesses, capital expenditures and for general corporate purposes, including debt repayments and pension plan contributions. The Company has taken a number of actions to support its ongoing transformation efforts, while continuing to support its operations and meet its obligations in light of the incurred losses and negative cash flows experienced over the past several years. These actions included:
|
•
|
The completion of various secured and unsecured financing transactions, the extension of the maturity of certain of our indebtedness, and the amendment to other terms of certain of our indebtedness to increase our overall financial flexibility, including:
|
|
◦
|
a
$750 million
Senior Secured Term Loan (the "2016 Term Loan") under its domestic credit facility maturing in July 2020;
|
|
◦
|
a
$500 million
real estate loan facility in April 2016 (the "2016 Secured Loan Facility"), initially maturing in July 2017, initially extended to January 2018, subsequently extended to April 2018, and then further extended to July 2018, subject to the payment of an extension fee;
|
|
◦
|
an additional
$500 million
real estate loan facility in January 2017 (the "2017 Secured Loan Facility"), maturing in July 2020;
|
|
◦
|
a Second Lien Credit Agreement in September 2016, pursuant to which the Company borrowed
$300 million
under a term loan (the "Second Lien Term Loan"), maturing in July 2020;
|
|
◦
|
an amendment in July 2017 to the Second Lien Credit Agreement to provide for the creation of a
$500 million
uncommitted second-lien line of credit loan facility under which the Company may borrow line of credit loans (the "Line of Credit Loans"), and a subsequent amendment to that facility to extend the maximum duration of the Line of Credit Loans from
180
days to
270
days and permit total borrowings of up to
$600 million
;
|
|
◦
|
a Letter of Credit and Reimbursement Agreement in December 2016, originally providing for up to a
$500 million
secured standby letter of credit facility (the "LC Facility") from certain affiliates of ESL Investments, Inc. ("ESL");
|
|
◦
|
a
$200 million
real estate loan facility (the "Incremental Loans") in October 2017, with the Incremental Loans maturing in April 2018, with the option to extend to July 2018, subject to the extension of the 2016 Secured Loan Facility;
|
65
SEARS HOLDINGS CORPORATION
Notes to Consolidated Financial Statements—(Continued)
|
◦
|
the extension of the maturity date of the initial
$1.0 billion
term loan (the "Term Loan") under our Amended Domestic Credit Agreement from June 2018 to January 2019 (with a right of the borrowers thereunder to further extend such maturity, subject to the satisfaction of certain conditions, to July 2019);
|
|
◦
|
amendments to our Amended Domestic Credit Agreement and certain other indebtedness which reduced the aggregate revolver commitments from
$1.971 billion
to
$1.5 billion
, but also implemented other modifications to covenants and reserves against the domestic credit facility borrowing base that improved net liquidity, and increased the maximum permissible short-term borrowings of the Company from
$750 million
to
$1.25 billion
;
|
|
◦
|
a Term Loan Credit Agreement in January 2018 providing for a secured term loan facility (the "Term Loan Facility"), secured by substantially all of the unencumbered intellectual property of the Company and its subsidiaries, other than intellectual property relating to the Kenmore and DieHard brands, as well as by certain real property interests, in each case subject to certain exclusions. An aggregate principal amount of
$250 million
was borrowed with the ability to borrow an additional
$50 million
against the same collateral;
|
|
◦
|
an amendment to the indenture governing our 6 5/8% Senior Secured Notes due 2018 to increase the maximum permissible borrowings secured by inventory to
75%
of book value of such inventory from
65%
and defer the collateral coverage test for purposes of the repurchase offer covenant in the indenture to restart it with the second quarter of 2018 (such that no collateral coverage event can occur until the end of the third quarter of 2018);
|
|
◦
|
an amendment to the PPPFA with the PBGC providing for the release of
138
of our properties from a ring-fence arrangement created under our
five
-year PPPFA in exchange for the payment of approximately
$407 million
into the Sears pension plans. This agreement provides the Company with financial flexibility through the ability to monetize properties, and, in addition, provides funding relief from contributions to the pension plans for the next
two
years
; and
|
|
◦
|
various commercial paper issuances to meet short-term liquidity needs, with the maximum amount outstanding during fiscal 2017 of
$160 million
.
|
|
•
|
Achievement of
$1.25 billion
in annualized cost savings in 2017 as part of the restructuring program announced earlier this year. Actions taken to realize the annualized cost savings have included simplification of the organizational structure of Holdings, streamlining of operations, reducing unprofitable categories and the closure of under-performing stores. In 2017, we closed approximately
435
stores, and an additional
103
stores previously announced for closure are expected to be closed by the end of the first quarter of 2018. As a result of these actions, the Company has begun to see improvement in the operations in fiscal 2017, as the restructuring program actions, including the closing of unprofitable stores, have begun to take effect.
|
|
•
|
The sale of the Craftsman brand to Stanley Black & Decker for consideration consisting of cash payments and a royalty.
|
|
•
|
Sales of properties and investments for proceeds of
$1.1 billion
and
$386 million
in 2017 and 2016, respectively.
|
On March 8, 2018, the Company secured an additional
$100 million
incremental real estate loan (the "Second Incremental Loan"), pursuant to an amendment to the Second Amended and Restated Loan Agreement, dated as of October 18, 2017, with JPP, LLC and JPP II, LLC, entities affiliated with ESL Investments, Inc. The Second Incremental Loan is secured by the same real estate properties as the 2017 Secured Loan Facility, and certain properties under the previous Incremental Loans outstanding, and matures in July 2020. The Company used the proceeds from the Incremental Loan for general corporate purposes.
In March 2018, the Company also closed on the
$200 million
Secured Loan and the
$240 million
Mezzanine Loan
, both as defined in Note 3, in connection with the release of
138
of our properties from the ring-fence arrangement with the PBGC as described above. The properties, which have an aggregate appraised value of nearly
$980 million
, serve as collateral for the Secured Loan, and the Mezzanine Loan is secured by
pledge of the equity interests in the direct parent company of the entities that own such properties. The Company contributed approximately
$282 million
of the proceeds of such loans to our pension plans, and deposited
$125 million
into an escrow for the benefit of our pension plans. The Mezzanine Loan Agreement, as defined in Note 3, contains an uncommitted accordion feature pursuant to which we may incur additional loans of not more than
$200 million
in
66
SEARS HOLDINGS CORPORATION
Notes to Consolidated Financial Statements—(Continued)
aggregate, subject to certain conditions, including that such additional loans not exceed an amount equal to the principal amount of the Secured Loan repaid.
The Company expects to pay down the Secured Loan over the next
three
to
six
months using proceeds generated from the sale of the underlying properties.
In February 2018, the Company commenced private exchange offers for its outstanding
8%
Senior Unsecured Notes Due 2019 and 6 5/8% Senior Secured Notes Due 2018 (the "Exchange Offers"),
pursuant to which it offered to (1) issue in exchange for its outstanding
8%
Senior Unsecured Notes Due 2019 (the "Old Senior Unsecured Notes") new
8%
Senior Unsecured Notes Due 2019, of a like principal amount, convertible into common stock of the Company, with interest on such notes to be payable in kind at the Company's option (the "New Senior Unsecured Notes"), and (2) issue in exchange for its outstanding 6 5/8% Senior Secured Notes Due 2018 (the "Old Senior Secured Notes") new 6 5/8% Senior Secured Notes Due 2019, of a like principal amount, convertible into common stock of the Company, with interest on such notes to be payable in kind at the Company's option (the "New Senior Secured Notes"). The Exchange Offers expired on March 15, 2018. Approximately
$214 million
aggregate principal amount of the Old Senior Unsecured Notes and approximately
$170 million
aggregate principal amount of the Old Senior Secured Notes were validly tendered, accepted and canceled in the Exchange Offers, and the Company issued a like principal amount of New Senior Unsecured Notes and New Senior Secured Notes. The New Senior Unsecured Notes and New Senior Secured Notes are optionally convertible by the holders thereof into shares of the Company’s common stock at conversion prices of
$8.33
and
$5.00
, respectively, per share of common stock, and are mandatorily convertible at the Company's option if the volume weighted average trading price of the common stock on the NASDAQ exceeds
$10.00
for a prescribed period. In connection with the closing of the Exchange Offers, the Company also obtained the requisite consent of holders of Old Senior Secured Notes to adopt amendments to the indenture governing those notes to eliminate substantially all of the restrictive covenants and certain events of default in the indenture, and make the liens securing senior second lien obligations, including the new Senior Secured Notes and the Second Lien Term Loan described below, effectively senior to the liens securing junior second lien obligations, including the Old Senior Secured Notes.
Also in connection with the closing of the Exchange Offers, the Company entered into an amendment to its Second Lien Credit Agreement. The amendment provides the Company with the option to pay interest on its outstanding
$300 million
principal amount Second Lien Term Loan in kind, and also provides that the Company's obligation under the Second Lien Term Loan is convertible into common stock of the Company, on the same conversion terms as the New Senior Secured Notes. Also in connection with the closing of the Exchange Offers, the Company’s subsidiary, Sears Roebuck Acceptance Corp. ("SRAC"), consummated a private exchange with certain third parties of approximately
$100 million
in principal amount of senior unsecured notes issued by SRAC maturing between 2027 and 2043 and bearing interest at rates between
6.50%
and
7.50%
per annum, pursuant to which SRAC issued a like principal amount of new unsecured notes (the "SRAC Exchange Notes"). The SRAC Exchange Notes mature in March 2028 and bear interest at a rate of
7.0%
per annum, and provide the Company with the option to pay such interest in kind at an interest rate of
12.0%
per annum. The SRAC Exchange Notes are also guaranteed by the same subsidiaries of the Company that guarantee the New Senior Secured Notes.
On March 21, 2018, we obtained a
$125 million
FILO term loan (the "FILO Loan") from JPP, LLC and JPP II, LLC, entities affiliated with ESL, and Benefit Street 2018 LLC, an entity affiliated with Thomas J. Tisch, under our Amended Domestic Credit Agreement. The Company received approximately
$122 million
in net proceeds from the FILO Loan, which proceeds were using to reduce outstanding borrowings under our revolving credit facility. The FILO Loan has a maturity date of July 20, 2020, which is the same maturity date as the Company's revolving credit facility commitments, and does not amortize.
In addition to pursuing several transactions to adjust our capital structure in order to enhance our liquidity and financial position, the Company is also taking incremental actions to further streamline operations to drive profitability, including cost reductions of
$200 million
on an annualized basis in 2018 unrelated to store closures.
In addition to the actions taken above, the Company has other resources available to support its operations. Our domestic credit facility permits us up to
$2.0 billion
of second lien loan capacity (of which
$1.1 billion
was utilized at February 3, 2018) outside the credit agreement, all depending on the applicable and available borrowing base as defined in our applicable debt agreements, as well as our ability to secure commitments from lenders. We also have the ability to obtain longer-term secured financing maturing outside of the domestic credit facility maturity date which would not be subject to borrowing base limitations (see Note 3 of Notes to Consolidated Financial Statements). Other options available to us, which we will evaluate and execute as appropriate, include refinancing
67
SEARS HOLDINGS CORPORATION
Notes to Consolidated Financial Statements—(Continued)
existing debt, borrowing against facilities in place with availability and additional real estate loans against unencumbered properties, which we have successfully executed in the past.
We also continue to explore ways to unlock value across a range of assets, including entering into or renegotiating commercial arrangements, and exploring ways to maximize the value of our Home Services, Innovel and Sears Auto Centers businesses, as well as our Kenmore and DieHard brands, through partnerships, sales or other means of externalization that could expand distribution of our brands and service offerings to realize significant growth. We expect to continue to right-size, redeploy and highlight the value of our assets, including monetizing our real estate portfolio and exploring potential asset sales, in our transition from an asset intensive, historically "store-only" based retailer to a more asset light, integrated membership-focused company.
We expect to continue to face a challenging competitive environment. While we continue to focus on our overall profitability, including managing expenses, we reported a loss in 2017, and were required to fund cash used in operating activities with cash from investing and financing activities. If we continue to experience operating losses, and we are not able to generate additional liquidity through the actions described below or through some combination of other actions, including real estate or other asset sales, while not expected, then our liquidity needs may exceed availability under our Amended Domestic Credit Agreement, our second lien line of credit loan facility and our other existing facilities, and we might need to secure additional sources of funds, which may or may not be available to us. A failure to secure such additional funds could cause us to be in default under the Amended Domestic Credit Agreement. Moreover, if the borrowing base (as calculated pursuant to our outstanding second lien debt) falls below the principal amount of such second lien debt plus the principal amount of any other indebtedness for borrowed money that is secured by liens on the collateral for such debt on the last day of any two consecutive quarters, it could trigger an obligation to repurchase our New Senior Secured Notes in an amount equal to such deficiency. As of February 3, 2018, we are in a deferral period of the collateral coverage test and the calculation restarts in the second quarter of 2018 (such that no collateral coverage event can occur until the end of the third quarter of 2018). Additionally, a failure to generate additional liquidity could negatively impact our access to inventory or services that are important to the operation of our business.
We believe the following actions, some of which we expect, subject to our governance processes, to include related party participation and funding, are probable of occurring and will be sufficient to satisfy our liquidity needs for the next twelve months from the issuance of the financial statements:
|
•
|
Sales of the properties securing the
$200 million
Secured Loan to fund the repayment of such Secured Loan;
|
|
•
|
Additional borrowings under the Mezzanine Loan Agreement and the Term Loan Facility;
|
|
•
|
Renegotiation of certain commercial arrangements;
|
|
•
|
Monetization of the Kenmore brand;
|
|
•
|
Extension of maturities beyond March 2019 of Line of Credit Loans under the Second Lien Credit Agreement, the 2016 Secured Loan Facility, the Incremental Secured Loan Facility, and the LC Facility and the Term Loan under the Amended Domestic Credit Agreement;
|
|
•
|
Additional borrowings secured by real estate assets or borrowings under the short-term basket; and
|
|
•
|
Further restructurings to help manage expenses and improve profitability.
|
The PPPFA contains certain limitations on our ability to sell assets, which could impact our ability to complete asset sale transactions or our ability to use proceeds from those transactions to fund our operations. Therefore, the analysis of liquidity needs includes consideration of the applicable restrictions under the PPPFA
.
We expect that the actions outlined above will further enhance our liquidity and financial flexibility and we expect that these actions will be executed in alignment with the anticipated timing of our liquidity needs.
Use of Estimates
The preparation of financial statements in conformity with accounting principles generally accepted in the United States of America requires management to make estimates and assumptions about future events. The estimates and assumptions affect the reported amounts of assets and liabilities and disclosure of contingent assets and liabilities at the date of the financial statements, as well as reported amounts of revenues and expenses during the reporting period. We evaluate our estimates and assumptions on an ongoing basis using historical experience and other factors that management believes to be reasonable under the circumstances. Adjustments to estimates and assumptions are made when facts and circumstances dictate. As future events and their effects cannot be determined
68
SEARS HOLDINGS CORPORATION
Notes to Consolidated Financial Statements—(Continued)
with absolute certainty, actual results may differ from the estimates used in preparing the accompanying consolidated financial statements. Significant estimates and assumptions are required as part of determining inventory and accounts receivable valuation, estimating depreciation, amortization and recoverability of long-lived assets, establishing self-insurance, warranty, legal and other reserves, performing goodwill and intangible impairment analyses, and in establishing valuation allowances on deferred income tax assets and reserves for tax examination exposures, and calculating retirement benefits.
Cash and Cash Equivalents
Cash equivalents include all highly liquid investments with original maturities of three months or less at the date of purchase. The Company classifies cash balances that are legally restricted pursuant to contractual arrangements as restricted cash. The restricted cash balance relates to amounts deposited into an escrow for the benefit of our pension plans. We also include deposits in-transit from banks for payments related to third-party credit card and debit card transactions within cash equivalents. The deposits in-transit balances included within cash equivalents were
$65 million
and
$87 million
at
February 3, 2018
and
January 28, 2017
, respectively.
We classify outstanding checks in excess of funds on deposit within other current liabilities and reduce cash and cash equivalents when these checks clear the bank on which they were drawn. Outstanding checks in excess of funds on deposit included in other current liabilities were
$74 million
and
$29 million
at
February 3, 2018
and
January 28, 2017
, respectively.
The following table provides a reconciliation of cash, cash equivalents, and restricted cash reported within the Consolidated Balance Sheets that sum to the total of the same such amounts shown in the Consolidated Statements of Cash Flows at
February 3, 2018
and
January 28, 2017
, respectively.
|
millions
|
February 3,
2018 |
January 28,
2017 |
|||||
|
Cash and equivalents
|
$
|
113
|
|
$
|
196
|
|
|
|
Cash posted as collateral
|
4
|
|
3
|
|
|||
|
Credit card deposits in transit
|
65
|
|
87
|
|
|||
|
Total cash and cash equivalents
|
182
|
|
286
|
|
|||
|
Restricted cash
|
154
|
|
—
|
|
|||
|
Total cash balances
|
$
|
336
|
|
$
|
286
|
|
|
Allowance for Doubtful Accounts
We provide an allowance for doubtful accounts based on both historical experience and a specific identification basis. Allowances for doubtful accounts on accounts receivable balances were
$35 million
and
$37 million
at
February 3, 2018
and
January 28, 2017
, respectively. Our accounts receivable balance on our Consolidated Balance Sheet is presented net of our allowance for doubtful accounts and is comprised of various vendor-related and customer-related accounts receivable, including receivables related to our pharmacy operations.
Merchandise Inventories
Merchandise inventories are valued at the lower of cost or market. For Kmart and Sears Domestic, cost is primarily determined using the retail inventory method ("RIM"). Kmart merchandise inventories are valued under the RIM using primarily a first-in, first-out ("FIFO") cost flow assumption. Sears Domestic merchandise inventories are valued under the RIM using primarily a last-in, first-out ("LIFO") cost flow assumption.
Inherent in the RIM calculation are certain significant management judgments and estimates including, among others, merchandise markons, markups, markdowns and shrinkage, which significantly impact the ending inventory valuation at cost, as well as resulting gross margins. The methodologies utilized by us in our application of the RIM are consistent for all periods presented. Such methodologies include the development of the cost-to-retail ratios, the groupings of homogenous classes of merchandise, the development of shrinkage and obsolescence reserves, the accounting for price changes and the computations inherent in the LIFO adjustment (where applicable).
69
SEARS HOLDINGS CORPORATION
Notes to Consolidated Financial Statements—(Continued)
Management believes that the RIM provides an inventory valuation that reasonably approximates cost and results in carrying inventory at the lower of cost or market.
Approximately
58%
of consolidated merchandise inventories are valued using LIFO. To estimate the effects of inflation on inventories, we utilize external price indices determined by an outside source, the Bureau of Labor Statistics. If the FIFO method of inventory valuation had been used instead of the LIFO method, merchandise inventories would have been
$31 million
higher at
February 3, 2018
and
$33 million
higher at
January 28, 2017
. During
2017
and
2016
, a reduction in inventory quantities resulted in a liquidation of applicable LIFO inventory quantities carried at lower costs in prior years. This LIFO liquidation resulted in a decrease in cost of sales of approximately
$6 million
and
$12 million
in
2017
and
2016
, respectively.
Vendor Rebates and Allowances
We receive rebates and allowances from certain vendors through a variety of programs and arrangements intended to offset our costs of promoting and selling certain vendor products. These vendor payments are recognized and recorded as a reduction to the cost of merchandise inventories when earned and, thereafter, as a reduction of cost of sales, buying and occupancy as the merchandise is sold. Upfront consideration received from vendors linked to purchases or other commitments is initially deferred and amortized ratably to cost of sales, buying and occupancy over the life of the contract or as performance of the activities specified by the vendor to earn the fee is completed.
Property and Equipment
Property and equipment are recorded at cost, less accumulated depreciation. Additions and substantial improvements are capitalized and include expenditures that materially extend the useful lives of existing facilities and equipment. Maintenance and repairs that do not materially improve or extend the lives of the respective assets are expensed as incurred.
Depreciation expense, which includes depreciation on assets under capital leases, is recorded over the estimated useful lives of the respective assets using the straight-line method for financial statement purposes, and accelerated methods for tax purposes. The range of lives are generally
20
to
50
years for buildings,
3
to
10
years for furniture, fixtures and equipment, and
3
to
5
years for computer systems and computer equipment. Leasehold improvements are depreciated over the shorter of the associated lease term or the estimated useful life of the asset. Depreciation expense included within depreciation and amortization expense reported in the Consolidated Statements of Operations was
$328 million
,
$370 million
and
$415 million
for the years ended
February 3, 2018
,
January 28, 2017
and
January 30, 2016
, respectively.
Primarily as a result of store closing actions, certain property and equipment are considered held for sale. The value of assets held for sale was
$70 million
and
$96 million
at
February 3, 2018
and
January 28, 2017
, respectively. These assets were included in prepaid expenses and other current assets in the Consolidated Balance Sheets at
February 3, 2018
and
January 28, 2017
at the lower of their historical net book value or their estimated fair value, less estimated costs to sell. We expect to sell the properties within a year and we continually remarket them. The majority of assets held for sale are held within the Sears Domestic segment.
Impairment of Long-Lived Assets and Costs Associated with Exit Activities
In accordance with accounting standards governing the impairment or disposal of long-lived assets, the carrying value of long-lived assets, including property and equipment, is evaluated whenever events or changes in circumstances indicate that a potential impairment has occurred relative to a given asset or assets. Factors that could result in an impairment review include, but are not limited to, a current period cash flow loss combined with a history of cash flow losses, current cash flows that may be insufficient to recover the investment in the property over the remaining useful life, or a projection that demonstrates continuing losses associated with the use of a long-lived asset, significant changes in the manner of use of the asset or significant changes in business strategies. An impairment loss is recognized when the estimated undiscounted cash flows expected to result from the use of the asset plus net proceeds expected from disposition of the asset (if any) are less than the carrying value of the asset. When an impairment loss is recognized, the carrying amount of the asset is reduced to its estimated fair value as determined based on quoted market prices or through the use of other valuation techniques. See Note 13 for further information regarding long-lived asset impairment charges recorded.
70
SEARS HOLDINGS CORPORATION
Notes to Consolidated Financial Statements—(Continued)
We account for costs associated with location closings in accordance with accounting standards pertaining to accounting for costs associated with exit or disposal activities. As such, we record a liability for costs associated with location closings, which includes employee severance and other liquidation fees when management makes the decision to exit a location. We record a liability for future lease costs (net of estimated sublease income) when we cease to use the location.
Goodwill, Trade Names and Related Impairments
Trade names acquired as part of the Merger account for the majority of our intangible assets recognized in the Consolidated Balance Sheet. The majority of these trade name assets, such as Sears and Kenmore, are expected to generate cash flows indefinitely, do not have estimable or finite useful lives and, therefore, are accounted for as indefinite-lived assets not subject to amortization. Certain intangible assets, including favorable lease rights, have estimable, finite useful lives, which are used as the basis for their amortization. The estimated useful lives of such assets are determined using a number of factors, including the demand for the asset, competition and the level of expenditure required to maintain the cash flows associated with the asset.
Our goodwill results from the Merger. We perform an annual goodwill impairment test at the last day of our November accounting period each year and assess the need to update the tests between annual tests if events or circumstances occur that would more likely than not reduce the fair value of the reporting unit or an indefinite-lived intangible asset below its carrying amount. A significant amount of judgment is involved in determining if an indicator of impairment has occurred. Such indicators may include, among others: a significant decline in our expected future cash flows; a sustained, significant decline in our stock price and market capitalization; a significant adverse change in legal factors or in the business climate; unanticipated competition; and the testing for recoverability of a significant asset group within the reporting unit. Any adverse change in these factors could have a significant impact on the recoverability of these assets and could have a material impact on our consolidated financial statements.
Goodwill Impairment Assessments
Our goodwill balance relates to our Home Services business. The goodwill impairment test involves a two-step process. The first step is a comparison of the reporting unit's fair value to its carrying value. We estimate fair value using the best information available, using a discounted cash flow model, commonly referred to as the income approach. The income approach uses the reporting unit's projection of estimated operating results and cash flows that is discounted using a weighted-average cost of capital that reflects current market conditions appropriate for the reporting unit. The projection uses management's best estimates of economic and market conditions over the projected period, including growth rates in sales, costs, estimates of future expected changes in operating margins and cash expenditures. Other significant estimates and assumptions include terminal value growth rates, future estimates of capital expenditures and changes in future working capital requirements. We were unable to use a market approach due to there being no market comparables.
If the carrying value of the reporting unit is higher than its fair value, there is an indication that impairment may exist and the second step must be performed to measure the amount of impairment loss, if any. The amount of impairment is determined by comparing the implied fair value of reporting unit goodwill to the carrying value of the goodwill in the same manner as if the reporting unit was being acquired in a business combination. See Note 12 for further information.
Intangible Asset Impairment Assessments
We consider the income approach when testing intangible assets with indefinite lives for impairment on an annual basis. We utilize the income approach, specifically the relief from royalty method, for analyzing our indefinite-lived assets. This method is based on the assumption that, in lieu of ownership, a firm would be willing to pay a royalty in order to exploit the related benefits of this asset class. The relief from royalty method involves two steps: (1) estimation of reasonable royalty rates for the assets; and (2) the application of these royalty rates to a net sales stream and discounting the resulting cash flows to determine a value. We multiplied the selected royalty rate by the forecasted net sales stream to calculate the cost savings (relief from royalty payment) associated with the assets.
71
SEARS HOLDINGS CORPORATION
Notes to Consolidated Financial Statements—(Continued)
The cash flows are then discounted to present value by the selected discount rate and compared to the carrying value of the assets.
In our quarterly reports on Form 10-Q filed during 2017, the Company disclosed that if its results continued to decline it could result in revisions in management's estimates of the fair value of the Company's trade names and may result in impairment charges. As a result of recently announced store closures and the further decline in revenue experienced in the fourth quarter at Sears Domestic, our analysis indicated that the fair value of the Sears trade name was less than its carrying value. Accordingly, we recorded impairment related to the Sears trade name during 2017 of
$72 million
, which reduced the carrying value to
$359 million
at
February 3, 2018
. We also recorded impairment charges of
$381 million
and
$180 million
in 2016 and 2015, respectively. See Note 12 for further information.
Fair Value of Financial Instruments
We determine the fair value of financial instruments in accordance with standards pertaining to fair value measurements. Such standards define fair value and establish a framework for measuring fair value in GAAP. Under fair value measurement accounting standards, fair value is considered to be the exchange price in an orderly transaction between market participants to sell an asset or transfer a liability at the measurement date. We report the fair value of financial assets and liabilities based on the fair value hierarchy prescribed by accounting standards for fair value measurements, which prioritizes the inputs to valuation techniques used to measure fair value into three levels.
Financial instruments that potentially subject the Company to concentration of credit risk consist principally of temporary cash investments and accounts receivable. We place our cash and cash equivalents in investment-grade, short-term instruments with high quality financial institutions and, by policy, limit the amount of credit exposure in any one financial instrument.
Self-insurance Reserves
We are self-insured for certain costs related to workers' compensation, asbestos, environmental, automobile, warranty, product and general liability claims. We obtain third-party insurance coverage to limit our exposure to certain of these self-insured risks. A portion of these self-insured risks is managed through a wholly-owned insurance subsidiary. Our liability reflected in the Consolidated Balance Sheet, classified within other liabilities (current and long-term), represents an estimate of the ultimate cost of claims incurred at the balance sheet date. In estimating this liability, we utilize loss development factors based on Company-specific data to project the future development of incurred losses. Loss estimates are adjusted based upon actual claims settlements and reported claims. The liabilities for self-insured risks are discounted to their net present values using an interest rate which is based upon the expected duration of the liabilities. Expected payments as of
February 3, 2018
were as follows:
|
millions
|
|||
|
2018
|
$
|
148
|
|
|
2019
|
100
|
|
|
|
2020
|
74
|
|
|
|
2021
|
54
|
|
|
|
2022
|
42
|
|
|
|
Later years
|
311
|
|
|
|
Total undiscounted obligation
|
729
|
|
|
|
Less—discount
|
(83
|
)
|
|
|
Net obligation
|
$
|
646
|
|
Loss Contingencies
Under accounting standards, loss contingency provisions are recorded for probable losses at management's best estimate of a loss, or when a best estimate cannot be made, the minimum amount in the estimated range is
72
SEARS HOLDINGS CORPORATION
Notes to Consolidated Financial Statements—(Continued)
recorded. These estimates are often initially developed substantially earlier than the ultimate loss is known, and the estimates are refined each accounting period, as additional information is known.
Revenue Recognition
Revenues include sales of merchandise, services and extended service contracts, net commissions earned from leased departments in retail stores, delivery and handling revenues related to merchandise sold, and fees earned from co-branded credit card programs. We recognize revenues from retail operations at the later of the point of sale or the delivery of goods to the customer. Direct to customer revenues are recognized when the merchandise is delivered to the customer. Revenues from product installation and repair services are recognized at the time the services are provided. Revenues from the sale of service contracts and the related direct acquisition costs are deferred and amortized over the lives of the associated contracts, while the associated service costs are expensed as incurred.
We earn revenues through arrangements with third-party financial institutions that manage and directly extend credit relative to our co-branded credit card programs. The third-party financial institutions pay us for generating new accounts and sales activity on co-branded cards, as well as for selling other financial products to cardholders. We recognize these revenues in the period earned, which is when our related performance obligations have been met. We sell gift cards to customers at our retail stores and through our direct to customer operations. The gift cards generally do not have expiration dates. Revenues from gift cards are recognized when (i) the gift card is redeemed by the customer, or (ii) the likelihood of the gift card being redeemed by the customer is remote (gift card breakage) based on historical redemption patterns and we determine that we do not have a legal obligation to remit the value of the unredeemed gift cards to the relevant jurisdictions.
Revenues from merchandise sales and services are reported net of estimated returns and allowances and exclude sales taxes. The reserve for returns and allowances is calculated as a percentage of sales based on historical return percentages. Estimated returns are recorded as a reduction of sales and cost of sales. We defer the recognition of layaway sales and profit until the period in which the customer takes possession of the merchandise.
Cost of Sales, Buying and Occupancy
Cost of sales, buying and occupancy are comprised principally of the costs of merchandise, buying, warehousing and distribution (including receiving and store delivery costs), retail store occupancy costs, product repair, and home service and installation costs, customer shipping and handling costs, vendor allowances, markdowns and physical inventory losses.
The Company has a Shop Your Way program in which customers earn points on purchases which may be redeemed to pay for future purchases. The expense for customer points earned is recognized as customers earn them and recorded in cost of sales.
During
2016
and 2015, respectively, the Company received
$33 million
and
$146 million
related to one-time credits from vendors associated with prior supply arrangements, which have been reflected as credits within cost of sales, buying and occupancy in the Consolidated Statements of Operations.
Selling and Administrative Expenses
Selling and administrative expenses are comprised principally of payroll and benefits costs for retail and corporate employees, occupancy costs of corporate facilities, advertising, pre-opening costs and other administrative expenses.
Pre-Opening Costs
Pre-opening and start-up activity costs are expensed in the period in which they occur.
Advertising Costs
Advertising costs are expensed as incurred, generally the first time the advertising occurs, and amounted to
$415 million
,
$684 million
and
$850 million
for
2017
,
2016
and
2015
, respectively. These costs are included within selling and administrative expenses in the Consolidated Statements of Operations.
73
SEARS HOLDINGS CORPORATION
Notes to Consolidated Financial Statements—(Continued)
Income Taxes
We provide deferred income tax assets and liabilities based on the estimated future tax effects of differences between the financial and tax basis of assets and liabilities based on currently enacted tax laws in effect for the year in which the differences are expected to reverse. The tax balances and income tax expense recognized by us are based on management's interpretation of the tax laws of multiple jurisdictions. Income tax expense also reflects our best estimates and assumptions regarding, among other things, the level of future taxable income, tax planning, and any valuation allowance. Future changes in tax laws, changes in projected levels of taxable income, tax planning, and adoption and implementation of new accounting standards could impact the effective tax rate and tax balances recorded by us. In evaluating our ability to recover our deferred tax assets within the jurisdiction from which they arise, we consider all available positive and negative evidence, including scheduled reversals of deferred tax liabilities, projected future taxable income, tax planning strategies, and results of recent operations. In projecting future taxable income, we begin with historical results adjusted for the results of discontinued operations and changes in accounting policies and incorporate assumptions including the amount of future state, federal and foreign pre-tax operating income, the reversal of temporary differences, and the implementation of feasible and prudent tax planning strategies. In evaluating the objective evidence that historical results provide, we consider cumulative operating income (loss) over the past three years. These assumptions require significant judgment about the forecasts of future taxable income.
Income tax expense or benefit from continuing operations is generally determined without regard to other categories of earnings, such as discontinued operations and other comprehensive income ("OCI"). An exception is provided in the authoritative accounting guidance when there is income from categories other than continuing operations and a loss from continuing operations in the current year. In this case, the tax benefit allocated to continuing operations is the amount by which the loss from continuing operations reduces the tax expense recorded with respect to the other categories of earnings, even when a valuation allowance has been established against the deferred tax assets. In instances where a valuation allowance is established against current year losses, income from other sources, including gain from pension and other postretirement benefits recorded as a component of OCI or the creation of a deferred tax liability through additional paid-in capital for the book to tax difference for the original issue discount relating to the
$625 million
8%
senior unsecured notes due
2019
, is considered when determining whether sufficient future taxable income exists to realize the deferred tax assets.
Stock-based Compensation
We account for stock-based compensation arrangements in accordance with accounting standards pertaining to share-based payment transactions, which requires us to both recognize as expense the fair value of all stock-based compensation awards (which includes stock options, although there were no options outstanding in
2017
) and to classify excess tax benefits associated with share-based compensation deductions as cash from financing activities rather than cash from operating activities. We recognize compensation expense as awards vest on a straight-line basis over the requisite service period of the award.
Earnings Per Common Share
Basic earnings per common share is calculated by dividing net income attributable to Holdings' shareholders by the weighted average number of common shares outstanding for each period. Diluted earnings per common share also includes the dilutive effect of potential common shares, exercise of stock options, warrants and the effect of restricted stock when dilutive.
New Accounting Pronouncements
Reclassification of Certain Tax Effects from Accumulated Other Comprehensive Income
In February 2018, the Financial Accounting Standards Board ("FASB") issued an accounting standards update which allows a reclassification from accumulated other comprehensive income to retained earnings for stranded tax effects resulting from the Tax Cuts and Jobs Act. This update is effective for fiscal years beginning after December 15, 2018, and interim periods within those fiscal years, with early adoption permitted. The amendments in this update should be applied either in the period of adoption or retrospectively to each period (or periods) in which the
74
SEARS HOLDINGS CORPORATION
Notes to Consolidated Financial Statements—(Continued)
effect of the change in the U.S. federal corporate income tax rate in the Tax Cuts and Jobs Act is recognized. We are currently evaluating the effect the update will have on our consolidated financial statements.
Compensation - Retirement Benefits
In March 2017, the FASB issued an accounting standards update which requires an employer to report the service cost component in the same line item or items as other compensation costs arising from services rendered by the pertinent employees during the period. It also requires the other components of net periodic pension cost and net periodic postretirement benefit cost to be presented in the income statement separately from the service cost component and outside a subtotal of income from operations, if one is presented. This update is effective for fiscal years beginning after December 15, 2017, and interim periods within those fiscal years, with early adoption permitted. The amendments in the update must be applied retrospectively. We are currently evaluating the effect the update will have on our consolidated financial statements.
Goodwill
In January 2017, the FASB issued an accounting standards update which simplifies the test for goodwill impairment. To address concerns over the cost and complexity of the two-step goodwill impairment test, the amendments in this update remove the second step of the test. An entity will apply a one-step quantitative test and record the amount of goodwill impairment as the excess of a reporting unit's carrying amount over its fair value, not to exceed the total amount of goodwill allocated to the reporting unit. The new guidance does not amend the optional qualitative assessment of goodwill impairment. This update is effective for annual or any interim goodwill impairment tests in fiscal years beginning after December 15, 2019. Early adoption is permitted for interim or annual goodwill impairment tests performed on testing dates after January 1, 2017. The Company adopted the update in the fourth quarter of 2017. The adoption of the new standard did not have an impact on our consolidated financial statements.
Business Combinations
In January 2017, the FASB issued an accounting standards update which clarifies the definition of a business with the objective of adding guidance to assist entities with evaluating whether transactions should be accounted for as acquisitions (or disposals) of businesses. The amendments in this update provide a screen to determine when a set is not a business. The screen requires that when substantially all of the fair value of the gross assets acquired (or disposed of) is concentrated in a single identifiable asset or a group of similar identifiable assets, the set is not a business. This screen reduces the number of transactions that need to be further evaluated. If the screen is not met, the amendments in this update require that to be considered a business, a set must include, at a minimum, an input and a substantive process that together significantly contribute to the ability to create outputs. This update is effective for fiscal years beginning after December 15, 2017, and interim periods within those fiscal years, with early adoption permitted. The amendments in the update must be applied prospectively. We are currently evaluating the effect the updates will have on our consolidated financial statements.
Statement of Cash Flows
In November 2016, the FASB issued accounting standards updates which address diversity in practice in the classification and presentation of changes in restricted cash in the statement of cash flows. The amendments in this update require that a statement of cash flows explain the change during the period in the total of cash, cash equivalents, and restricted cash. Therefore, restricted cash should be included with cash and cash equivalents when reconciling the beginning-of-period and end-of-period total amounts shown on the statement of cash flows. These updates are effective for fiscal years beginning after December 15, 2017, and interim periods within those fiscal years, with early adoption permitted. The amendments in the updates must be applied using a retrospective transition method to each period presented. The Company adopted the update in the first quarter of 2017. The adoption of the new standard impacted the presentation of the Condensed Consolidated Statements of Cash Flows.
75
SEARS HOLDINGS CORPORATION
Notes to Consolidated Financial Statements—(Continued)
Consolidation - Interests held through related parties that are under common control
In October 2016, the FASB issued an accounting standards update to amend the accounting standards on how a reporting entity that is the single decision maker of a variable interest entity ("VIE") should treat indirect interests in the entity held through related parties that are under common control with the reporting entity when determining whether it is the primary beneficiary of that VIE. The primary beneficiary of a VIE is the reporting entity that has a controlling financial interest in a VIE and, therefore, consolidates the VIE. A reporting entity has an indirect interest in a VIE if it has a direct interest in a related party that, in turn, has a direct interest in the VIE. Under the amendments, a single decision maker is not required to consider indirect interests held through related parties that are under common control with the single decision maker to be the equivalent of direct interests in their entirety. Instead, a single decision maker is required to include those interests on a proportionate basis consistent with indirect interests held through other related parties. The Company adopted the update in the first quarter of 2017. The adoption of the new standard did not have an impact on the Company's consolidated financial position, results of operations or cash flows.
Income Taxes - Intra-entity transfers of assets other than inventory
In October 2016, the FASB issued an accounting standards update to improve the accounting for the income tax consequences of intra-entity transfers of assets other than inventory. Current accounting standards prohibit the recognition of current and deferred income taxes for an intra-entity asset transfer until the asset has been sold to an outside party. In addition, interpretations of this guidance have developed in practice for transfers of certain intangible and tangible assets. This prohibition on recognition is an exception to the principle of comprehensive recognition of current and deferred income taxes in accounting standards. To more faithfully represent the economics of intra-entity asset transfers, the amendments in this update require that entities recognize the income tax consequences of an intra-entity transfer of an asset other than inventory when the transfer occurs. The amendments in this update do not change accounting standards for the pre-tax effects of an intra-entity asset transfer under accounting standards applicable to consolidation, or for an intra-entity transfer of inventory. The update is effective for fiscal years beginning after December 15, 2017, and interim periods within those fiscal years, with early adoption permitted as of the beginning of an annual reporting period. The amendments in this update should be applied on a modified retrospective basis through a cumulative-effect adjustment directly to retained earnings as of the beginning of the period of adoption. We are currently evaluating the effect the update will have on our consolidated financial statements.
Statement of Cash Flows - Classification of Certain Cash Receipts and Cash Payments
In August 2016, the FASB issued accounting standards updates which address diversity in practice in how certain cash receipts and cash payments are presented and classified in the statement of cash flows, including: debt prepayment or debt extinguishment costs; settlement of zero-coupon debt instruments or other debt instruments with coupon interest rates that are insignificant in relation to the effective interest rate of the borrowing; contingent consideration payments made after a business combination; proceeds from the settlement of insurance claims; proceeds from the settlement of corporate-owned life insurance policies; distributions received from equity method investees; beneficial interests in securitization transactions; and separately identifiable cash flows and application of the predominance principle. These updates are effective for fiscal years beginning after December 15, 2017, and interim periods within those fiscal years, with early adoption permitted. The amendments in the update must be applied using a retrospective transition method to each period presented. If an entity early adopts the amendments in an interim period, any adjustments should be reflected as of the beginning of the fiscal year that includes that interim period. We are currently evaluating the effect the update will have on our consolidated financial statements.
Leases
In February 2016, the FASB issued an accounting standards update which replaces the current lease accounting standard. The update will require, among other items, lessees to recognize a right-of-use asset and a lease liability for most leases. Extensive quantitative and qualitative disclosures, including significant judgments made by management, will be required to provide greater insight into the extent of revenue and expense recognized and expected to be recognized from existing contracts. The update is effective for fiscal years beginning after December 15, 2018, and interim periods within those fiscal years, with early adoption permitted. The new standard must be
76
SEARS HOLDINGS CORPORATION
Notes to Consolidated Financial Statements—(Continued)
adopted using a modified retrospective transition, and provides for certain practical expedients. Transition will require application of the new guidance at the beginning of the earliest comparative period presented. We are currently evaluating the effect the update will have on our consolidated financial statements, and expect the update will have a material impact on our consolidated financial statements.
Fair Value Measurements
In May 2015, the FASB issued an accounting standards update which requires certain investments measured at net asset value to be removed from the fair value hierarchy categorization and presented as a single reconciling line item between the fair value of the pension plans assets and the amounts reported in the fair value hierarchy table. The Company adopted the update in fiscal 2016. The adoption of the new standard did not have an impact on the Company’s consolidated financial position, results of operations, or cash flows.
Presentation of Financial Statements - Going Concern
In August 2014, the FASB issued an accounting standards update which requires management to assess whether there are conditions or events, considered in the aggregate, that raise substantial doubt about the entity’s ability to continue as a going concern within one year after the financial statements are issued. If substantial doubt exists, additional disclosures are required. This update was effective for the Company's annual period ended January 28, 2017. The Company's assessment of our ability to continue as a going concern is further discussed in the "Uses and Sources of Liquidity" paragraph above. The adoption of the new standard did not have a material impact on the Company’s consolidated financial position, results of operations, cash flows or disclosures.
Revenue from Contracts with Customers
In May 2014, the FASB issued an accounting standards update which replaces the current revenue recognition standards. Subsequently, the FASB has also issued accounting standards updates which clarify the guidance. The new revenue recognition standard provides a five-step analysis of transactions to determine when and how revenue is recognized. The core principle is that a company should recognize revenue to depict the transfer of promised goods or services to customers in an amount that reflects the consideration to which the entity expects to be entitled in exchange for those goods or services. This standard was initially released as effective for fiscal years beginning after December 15, 2016; however, the FASB has decided to defer the effective date of this accounting standard update for one year. Early adoption of the update is permitted, but not before the original date for fiscal years beginning after December 15, 2016. The update may be applied retrospectively for each period presented or as a cumulative-effect adjustment at the date of adoption.
The Company has completed its evaluation of the standard and will apply the update retrospectively for each period presented, beginning in the first quarter of 2018. Based on our assessment, we determined the adoption will impact the accounting for our Shop Your Way program, revenues from gift cards and merchandise returns. The expense for Shop Your Way points is currently recognized as customers earn them and recorded in cost of sales. The new guidance will require the Company to allocate the transaction price to products and points on a relative standalone selling price basis, deferring the portion of revenue allocated to the points and recognizing a contract liability for unredeemed points. The change in the accounting for the Shop Your Way program will reduce revenue by approximately
2.7%
and
2.6%
in 2017 and 2016, respectively, but will have no impact to gross margin. The new guidance will also change the timing of recognition of the unredeemed portion of our gift cards, which is currently recognized using the remote method. The new guidance will require application of the proportional method. The Company currently reports revenues from merchandise sales net of estimated returns. The new guidance will require the Company to record both an asset and a liability for anticipated customer returns. These changes will not have a material impact on the Company’s consolidated financial position, results of operations, or cash flows, with the exception of the Shop Your Way program described above.
At both
February 3, 2018
and
January 28, 2017
, the Company was the beneficial holder of approximately
12 million
, or
12%
, of the common shares of Sears Canada. Sears Canada filed for court protection and in July 2017 trading of its common shares was suspended. Accordingly, we recognized other-than-temporary impairment of
$12
77
SEARS HOLDINGS CORPORATION
Notes to Consolidated Financial Statements—(Continued)
million
within interest and investment loss in our Consolidated Statements of Operations during 2017. Our equity method investment in Sears Canada was
$17 million
at
January 28, 2017
, and was included within other assets in the Consolidated Balance Sheets. The fair value of our equity method investment in Sears Canada was determined based on quoted market prices for its common stock. Our equity method investment in Sears Canada was valued using Level 1 measurements as defined in Note 5.
Total borrowings outstanding at
February 3, 2018
and
January 28, 2017
were
$4.1 billion
and
$4.2 billion
, respectively. At
February 3, 2018
, total short-term borrowings were
$915 million
, consisting of secured borrowings, line of credit loans and incremental loans. At
January 28, 2017
, we had
no
short-term borrowings outstanding. The weighted-average annual interest rate paid on short-term borrowings was
8.0%
in
2017
and
5.4%
in
2016
.
Long-term debt was as follows:
|
ISSUE
|
February 3,
2018 |
January 28,
2017 |
|||||
|
millions
|
|
|
|||||
|
SEARS ROEBUCK ACCEPTANCE CORP.
|
|
|
|||||
|
6.50% to 7.50% Notes, due 2027 to 2043
|
$
|
284
|
|
$
|
327
|
|
|
|
Term Loan (Credit Facility), $1.0B due 2019
|
391
|
|
963
|
|
|||
|
2016 Term Loan (Credit Facility), $750M due 2020
|
559
|
|
726
|
|
|||
|
Second Lien Term Loan (Credit Facility), $300M due 2020
|
294
|
|
292
|
|
|||
|
SEARS HOLDINGS CORP.
|
|
||||||
|
8% Secured Loan Facility, due 2018
|
251
|
|
494
|
|
|||
|
6.625% Senior Secured Notes, due 2018
|
303
|
|
303
|
|
|||
|
8% Senior Unsecured Notes, due 2019
|
483
|
|
428
|
|
|||
|
8% Secured Loan Facility, due 2020
|
374
|
|
485
|
|
|||
|
Term Loan Facility (Credit Facility), $300M due 2020
|
206
|
|
—
|
|
|||
|
CAPITALIZED LEASE OBLIGATIONS
|
72
|
|
145
|
|
|||
|
Total long-term borrowings
|
3,217
|
|
4,163
|
|
|||
|
Current maturities
|
(968
|
)
|
(590
|
)
|
|||
|
Long-term debt and capitalized lease obligations
|
$
|
2,249
|
|
$
|
3,573
|
|
|
|
Weighted-average annual interest rate on long-term debt
|
7.6
|
%
|
7.2
|
%
|
|||
The fair value of long-term debt, excluding capitalized lease obligations, was
$2.8 billion
at
February 3, 2018
and
$4.0 billion
at
January 28, 2017
. The fair value of our debt was estimated based on quoted market prices for the same or similar issues or on current rates offered to us for debt of the same remaining maturities. Our long-term debt instruments are valued using Level 2 measurements as defined in Note 5.
78
SEARS HOLDINGS CORPORATION
Notes to Consolidated Financial Statements—(Continued)
At
February 3, 2018
, long-term debt maturities for the next five years and thereafter were as follows:
|
millions
|
|
||
|
2018
|
$
|
979
|
|
|
2019
|
637
|
|
|
|
2020
|
1,471
|
|
|
|
2021
|
3
|
|
|
|
2022
|
3
|
|
|
|
Thereafter
|
312
|
|
|
|
Total maturities
|
3,405
|
|
|
|
Unamortized debt discount
|
(152
|
)
|
|
|
Unamortized debt issuance costs
|
(36
|
)
|
|
|
Long-term debt, net of discount & debt issuance costs
|
$
|
3,217
|
|
Interest
Interest expense for years
2017
,
2016
and
2015
was as follows:
|
millions
|
2017
|
2016
|
2015
|
|||||||||
|
COMPONENTS OF INTEREST EXPENSE
|
|
|
|
|||||||||
|
Interest expense
(1)
|
$
|
377
|
|
$
|
288
|
|
$
|
223
|
|
|||
|
Amortization of debt issuance costs
|
58
|
|
31
|
|
25
|
|
||||||
|
Accretion of debt discount
|
66
|
|
50
|
|
35
|
|
||||||
|
Accretion of self-insurance obligations at net present value
|
19
|
|
16
|
|
19
|
|
||||||
|
Accretion of lease obligations at net present value
|
19
|
|
19
|
|
21
|
|
||||||
|
Interest expense
|
$
|
539
|
|
$
|
404
|
|
$
|
323
|
|
|||
(1)
Includes paid-in-kind interest of
$1 million
for
2017
.
Unsecured Commercial Paper
We borrow through the commercial paper markets. At both
February 3, 2018
and
January 28, 2017
, we had
no
commercial paper borrowings outstanding.
Secured Short-Term Loan
On September 15, 2014, the Company, through Sears, Sears Development Co. and Kmart Corporation ("Short-Term Borrowers"), entities wholly-owned and controlled, directly or indirectly by the Company, entered into a
$400 million
secured short-term loan (the "Short-Term Loan'") with JPP II, LLC and JPP, LLC (collectively, the "Lenders"), entities affiliated with ESL. Proceeds of the Short-Term Loan were used for general corporate purposes.
The Short-Term Loan was originally scheduled to mature on December 31, 2014, and was subsequently amended and extended. We repaid the Short-Term Loan during 2015, resulting in
no
balance outstanding at February 3, 2018 or January 28, 2017.
Letter of Credit Facility
On December 28, 2016, the Company, through Sears Roebuck Acceptance Corp. ("SRAC") and Kmart Corporation (together with SRAC, the "Borrowers"), entities wholly-owned and controlled, directly or indirectly by the Company, entered into the Letter of Credit and Reimbursement Agreement (the "LC Facility") providing for a
$500 million
secured standby letter of credit facility (of which
$271 million
was committed at February 3, 2018) from the Lenders, with Citibank, N.A., serving as administrative agent and issuing bank (the "Issuing Bank").
79
SEARS HOLDINGS CORPORATION
Notes to Consolidated Financial Statements—(Continued)
In August 2017, the Company executed amendments to the LC Facility. The amendments, among other things, extended the maturity to December 28, 2018, eliminated the unused portion of the facility and released the real estate collateral that secured the original LC Facility. The amended LC Facility also permits the Lenders to syndicate all or a portion of their commitments under the facility to other lenders, of which
$138 million
has been syndicated to unaffiliated third party lenders as of February 3, 2018.
The amended LC Facility is guaranteed by the same subsidiaries of the Company that guarantee the obligations under the Amended Domestic Credit Agreement, as defined below. The amended LC Facility is secured by substantially the same collateral as the Amended Domestic Credit Agreement. The amended LC Facility contains a borrowing base calculation, pursuant to which the borrowers are required to cash collateralize the LC Facility if the aggregate obligations under the Amended Domestic Credit Agreement, amended LC Facility and certain other cash management and similar obligations exceed the Modified Borrowing Base, as defined in the amended LC Facility, as of the end of any calendar month.
To secure their obligation to participate in letters of credit issued under the LC Facility, the lenders under the LC Facility are required to maintain cash collateral on deposit with the Issuing Bank in an amount equal to
102%
of the commitments under the LC Facility (the "Lender Deposit"). The Borrowers paid the Lenders an upfront fee equal to
1.00%
of the aggregate amount of the Lender Deposit. In addition, the Borrowers are required to pay a commitment fee on the average daily amount of the Lender Deposit (as such amount may be increased or decreased from time to time) equal to the Eurodollar Rate (as defined under the Amended Domestic Credit Facility) plus
11.0%
, as well as certain other fees. In the event of reductions of the commitments under the LC Facility or a termination of the LC Facility prior to the six month anniversary of the effective date of the amendments, under certain circumstances the Borrowers will be required to pay an early reduction/termination fee equal to the commitment fee that would have accrued with respect to the reduced or terminated commitments from the date of reduction or termination until the six month anniversary.
The LC Facility includes certain representations and warranties, affirmative and negative covenants and other undertakings, which are subject to important qualifications and limitations set forth in the LC Facility. The LC Facility also contains certain events of default, including (subject to certain materiality thresholds and grace periods) payment default, failure to comply with covenants, material inaccuracy of representation or warranty, and bankruptcy or insolvency proceedings. If an event of default occurs, the Lenders may terminate all or any portion of the commitments under the LC Facility, require the Borrowers to cash collateralize the LC Facility and/or exercise any rights they might have under any of the related facility documents (including against the collateral), subject to certain limitations. At
February 3, 2018
and
January 28, 2017
, respectively, we had
$271 million
and
$200 million
of letters of credit outstanding under the LC Facility.
Secured Loan and Mezzanine Loan
On March 14, 2018, the Company, through SRC O.P. LLC, SRC Facilities LLC and SRC Real Estate (TX), LLC (collectively, the "Secured Loan Borrowers"), entities wholly-owned and controlled indirectly by the Company, entered into a Credit Agreement (the "Credit Agreement") with the lenders party thereto (collectively, the "Secured Lenders"). The Credit Agreement provides for a
$200 million
term loan (the "Secured Loan") that is secured by the Secured Loan Borrowers' interests in
138
real properties that were released from a ring-fence arrangement with the PBGC. The Secured Loan matures on December 14, 2018. The Company used the proceeds of the Secured Loan to make a contribution to the Company's pension plans and for general corporate purposes.
Also on March 14, 2018, the Company, through SRC Sparrow 2 LLC (the "Mezzanine Loan Borrower"), an entity wholly-owned and controlled indirectly by the Company, entered into a Mezzanine Loan Agreement (the "Mezzanine Loan Agreement") with the Lenders, entities affiliated with ESL. The Mezzanine Loan Agreement provides for a
$240 million
term loan (the "Mezzanine Loan") that is secured by a pledge of the equity interests in SRC O.P. LLC, the direct parent company of the entities that own the
138
real properties that secure the obligations of the Secured Loan Borrowers under the Credit Agreement. The Mezzanine Loan matures on July 20, 2020. The Company used the proceeds of the Mezzanine Loan to make a contribution to the Company’s pension plans.
The Mezzanine Loan Agreement contains an uncommitted accordion feature pursuant to which the Mezzanine Loan Borrower may incur additional loans ("Additional Mezzanine Loans") of not more than
$200 million
in aggregate, subject to certain conditions set forth in the Mezzanine Loan Agreement and the Credit Agreement,
80
SEARS HOLDINGS CORPORATION
Notes to Consolidated Financial Statements—(Continued)
including that the Additional Mezzanine Loans shall not exceed an amount equal to the principal amount of the Secured Loan repaid by the Secured Loan Borrowers.
The Secured Loan and the Mezzanine Loan are both guaranteed by the Company and certain of its subsidiaries. The Secured Loan bears interest at an annual interest rate of LIBOR plus
6.5%
for the first three months the Secured Loan is outstanding, LIBOR plus
7.5%
for the fourth through the sixth month the Secured Loan is outstanding and LIBOR plus
8.5%
for the seventh through the ninth month the Secured Loan is outstanding. Accrued interest is payable monthly during the term of the Secured Loan. The Mezzanine Loan bears interest at an annual interest rate of LIBOR plus
11.0%
, with accrued interest payable monthly during the term of the Mezzanine Loan. The Company paid an upfront commitment fee of
1.5%
of the principal amount of the Secured Loan, and paid an arrangement fee. The Mezzanine Borrowers paid an upfront commitment fee equal to
1.8%
of the principal amount of the Mezzanine Loan.
To the extent permitted under other debt of the Company or its affiliates, the Secured Loan and the Mezzanine Loan may be prepaid at any time in whole or in part, without penalty or premium. The Secured Loan Borrowers are required to apply the net proceeds of the sale of any real property collateral for the Secured Loan to repay the Secured Loan. Following repayment in full of the Secured Loan, the Mezzanine Loan Borrower is required to apply the net proceeds of the sale of any real property that served as collateral for the Secured Loan to repay the Mezzanine Loan.
The Credit Agreement and the Mezzanine Loan Agreement include certain representations and warranties, indemnities and covenants, including with respect to the condition and maintenance of the real property collateral.
The Credit Agreement and the Mezzanine Loan Agreement have certain events of default, including (subject to certain materiality thresholds and grace periods) payment default, failure to comply with covenants, material inaccuracy of representation or warranty, and bankruptcy or insolvency proceedings. If there is an event of default, the Secured Loan Lenders and the Mezzanine Lenders may declare all or any portion of the outstanding indebtedness to be immediately due and payable, exercise any rights they might have (including against the collateral), and require the Secured Loan Borrowers or Mezzanine Loan Borrower to pay a default interest rate of
2.0%
in excess of the base interest rate.
Term Loan Facility
On January 4, 2018, the Borrowers entered into a Term Loan Credit Agreement (the “Term Loan Credit Agreement”) providing for a secured term loan facility (the “Term Loan Facility”) from the Lenders, entities affiliated with ESL. The Term Loan Facility is guaranteed by the Company and certain of its subsidiaries that guarantee the Company’s other material debt or own material intellectual property. The Term Loan Facility is secured by substantially all of the unencumbered intellectual property of the Company and its subsidiaries, other than intellectual property relating to the Kenmore and DieHard brands, as well as by certain real property interests, in each case subject to certain exclusions. On January 4, 2018,
$100 million
was borrowed under the Term Loan Facility. The Term Loan Facility also contains an uncommitted incremental loan feature that, subject to the satisfaction of certain conditions, including the consent of the Agent, would permit up to an additional
$200 million
to be borrowed from other counterparties and secured by the same collateral as the initial loan under the Term Loan Facility. An additional
$30 million
was borrowed under the Term Loan Facility on January 19, 2018.
On January 29, 2018, the Company entered into an Amendment to the Term Loan Credit Agreement (the "Amendment"), pursuant to which an additional
$20 million
was borrowed from the Lenders and a further
$60 million
was borrowed from certain unaffiliated lenders, bringing the total amount borrowed under the Term Loan Facility to
$210 million
at February 3, 2018. The Amendment, among other changes, separates the loans under the Term Loan Facility into
two
tranches. On February 26, 2018, the Company entered into another amendment to the Term Loan Credit Agreement pursuant to which an additional
$40 million
was borrowed from the Lenders.
The loans under the Term Loan Facility bear interest at a weighted average annual interest rate of LIBOR plus
12.5%
, which during the first year must be paid in kind by capitalizing interest. The loans under the Term Loan Facility mature on July 20, 2020. The Company used the proceeds of the Term Loan Facility for general corporate purposes. No upfront or arrangement fees were paid in connection with the Term Loan Facility. The loans under the Term Loan Facility are prepayable without premium or penalty.
81
SEARS HOLDINGS CORPORATION
Notes to Consolidated Financial Statements—(Continued)
The Term Loan Facility includes certain representations and warranties, indemnities and covenants, including with respect to the condition and maintenance of the intellectual property and real property collateral. The Term Loan Facility has certain events of default, including (subject to certain materiality thresholds and grace periods) payment default, failure to comply with covenants, material inaccuracy of representation or warranty, and bankruptcy or insolvency proceedings. If there is an event of default, the Lenders may declare all or any portion of the outstanding indebtedness to be immediately due and payable, exercise any rights they might have (including against the collateral), and require the Borrowers to pay a default interest rate.
At
February 3, 2018
, the carrying value of the Term Loan Facility, net of the remaining debt issuance costs, was
$206 million
. The carrying value includes paid-in-kind interest of
$1 million
at
February 3, 2018
.
2017 Secured Loan Facility
On January 3, 2017, the Company, through Sears, Kmart Stores of Illinois LLC, Kmart of Washington LLC and Kmart Corporation (collectively, "2017 Secured Loan Borrowers"), entities wholly-owned and controlled, directly or indirectly by the Company, obtained a
$500 million
real estate loan facility (the "2017 Secured Loan Facility") from the Lenders, entities affiliated with ESL. On January 3, 2017,
$321 million
was funded under the 2017 Secured Loan Facility, and an additional
$179 million
was drawn by the Company prior to January 28, 2017. The 2017 Secured Loan Facility matures on July 20, 2020. The Company used the proceeds of the 2017 Secured Loan Facility for general corporate purposes.
During October 2017, the Company, through the 2017 Secured Loan Borrowers and SHC Desert Springs, LLC, Innovel Solutions, Inc., Sears Holdings Management Corporation, Maxserv, Inc., Troy Coolidge No. 13, LLC, Sears Development Co. and Big Beaver of Florida Development, LLC (collectively, "Incremental Loan Borrowers"), entities wholly-owned and controlled, directly or indirectly by the Company, entered into amended and restated loan agreements (the "Incremental Loans") with the Lenders, entities affiliated with ESL. The Company borrowed
$200 million
pursuant to the Incremental Loans, and used the proceeds for general corporate purposes. The Incremental Loans mature on April 23, 2018, except that if the maturity date of the 2016 Secured Loan Facility (as defined below) is extended to July 6, 2018, then the Incremental Loans will mature on July 6, 2018.
On March 8, 2018, the Company, through the 2017 Secured Loan Borrowers and SHC Desert Springs, LLC, Innovel Solutions, Inc., Sears Holdings Management Corporation, Maxserv, Inc. and Troy Coolidge No. 13, LLC (collectively, "Second Incremental Loan Borrowers"), entities wholly-owned and controlled, directly or indirectly by the Company, entered into a second amendment to the Incremental Loans (the "Second Amendment") with the Lenders, entities affiliated with ESL. Pursuant to the Second Amendment, the Second Incremental Loan Borrowers borrowed an additional
$100 million
from the Lenders (the "Second Incremental Loan") and used the proceeds for general corporate purposes. The Second Incremental Loan matures on July 20, 2020.
Initially, the 2017 Secured Loan Facility had an annual base interest rate of
8%
, with accrued interest payable monthly during the term of the 2017 Secured Loan Facility. Pursuant to the Second Amendment, the interest rate increased to LIBOR plus
9%
. The Borrowers paid an upfront commitment fee equal to
1.0%
of the full principal amount of the 2017 Secured Loan Facility and paid a funding fee equal to
1.0%
of the amounts drawn under the 2017 Secured Loan Facility at the time such amounts were drawn. The Incremental Loans have an annual interest rate of
11%
, with accrued interest payable monthly. The Second Incremental Loan has an annual interest rate of LIBOR plus
9%
, with accrued interest payable monthly. No upfront or funding fees were paid in connection with the Incremental Loans or Second Incremental Loan.
The 2017 Secured Loan Facility, Incremental Loans and Second Incremental Loan are guaranteed by the Company and certain of its subsidiaries, and were secured by a first priority lien on
69
real properties owned by the 2017 Secured Loan Borrowers and Incremental Loan Borrowers and guarantors at inception of the 2017 Secured Loan Facility, and an additional
7
real properties owned by the Incremental Loan Borrowers at inception of the Incremental Loans. In certain circumstances, the Lenders and the 2017 Secured Loan Borrowers, Incremental Loan Borrowers and Second Incremental Loan Borrowers may elect to substitute one or more properties as collateral. To the extent permitted under other debt of the Company or its affiliates, the 2017 Secured Loan Facility may be prepaid at any time in whole or in part, without penalty or premium. The 2017 Secured Loan Borrowers are required to apply the net proceeds of the sale of any real property collateral for the 2017 Secured Loan Facility to repay the
82
SEARS HOLDINGS CORPORATION
Notes to Consolidated Financial Statements—(Continued)
loan. The Company used proceeds of
$116 million
to pay interest and a portion of the 2017 Secured Loan Facility and
$55 million
to pay interest and a portion of the Incremental Loans during 2017.
The 2017 Secured Loan Facility, Incremental Loans and Second Incremental Loan include certain representations and warranties, indemnities and covenants, including with respect to the condition and maintenance of the real property collateral. The 2017 Secured Loan Facility, Incremental Loans and Second Incremental Loan have certain events of default, including (subject to certain materiality thresholds and grace periods) payment default, failure to comply with covenants, material inaccuracy of representation or warranty, and bankruptcy or insolvency proceedings. If there is an event of default, the Lenders may declare all or any portion of the outstanding indebtedness to be immediately due and payable, exercise any rights they might have under any of the 2017 Secured Loan Facility, Incremental Loan or Second Incremental Loan documents (including against the collateral), and require the 2017 Secured Loan Borrowers, Incremental Loan Borrowers or Second Incremental Loan Borrowers to pay a default interest rate equal to the greater of (i)
2.5%
in excess of the base interest rate and (ii) the prime rate plus
1%
.
The carrying value of the 2017 Secured Loan Facility, net of the remaining debt issuance costs, was
$374 million
and
$485 million
at
February 3, 2018
and
January 28, 2017
, respectively. The carrying value of the Incremental Loans, net of the remaining debt issuance costs, was
$144 million
at
February 3, 2018
. The Incremental Loans are included within short-term borrowings in the Consolidated Balance Sheets for all periods presented.
2016 Secured Loan Facility
On April 8, 2016, the Company, through Sears, Sears Development Co., Innovel, Big Beaver of Florida Development, LLC and Kmart Corporation (collectively, "2016 Secured Loan Borrowers"), entities wholly-owned and controlled, directly or indirectly by the Company, obtained a
$500 million
real estate loan facility (the "2016 Secured Loan Facility") from JPP, LLC, JPP II, LLC, and Cascade Investment, LLC (collectively, the "2016 Secured Loan Lenders"). JPP, LLC and JPP II, LLC are entities affiliated with ESL. The first
$250 million
of the 2016 Secured Loan Facility was funded on April 8, 2016 and the remaining
$250 million
was funded on April 22, 2016. The funds were used to reduce outstanding borrowings under the Company's asset-based revolving credit facility and for general corporate purposes. The 2016 Secured Loan Facility had an original maturity date of July 7, 2017. In May 2017, the Company reached an agreement to extend the maturity of
$400 million
of the 2016 Secured Loan Facility to January 2018, with options to further extend the maturity of the loan for up to an additional six months, to July 6, 2018, subject to the satisfaction of certain conditions and the payment of certain fees. On November 21, 2017, the Company notified the 2016 Secured Loan Lenders of its exercise of the first such option to extend the maturity to April 6, 2018, subject to the payment of an extension fee on January 8, 2018, which fee was paid on January 8, 2018. On February 5, 2018, the Company notified the 2016 Secured Loan Lenders of its exercise of the second such option to extend the maturity to July 6, 2018, subject to the payment of an extension fee on April 6, 2018. The 2016 Secured Loan Facility is included within current portion of long-term debt in the Consolidated Balance Sheets for all periods presented. The carrying value of the 2016 Secured Loan Facility, net of the remaining debt issuance costs, was
$251 million
and
$494 million
at
February 3, 2018
and
January 28, 2017
, respectively.
The 2016 Secured Loan Facility has an annual base interest rate of
8%
, with accrued interest payable monthly during the term of the 2016 Secured Loan Facility. The 2016 Secured Loan Borrowers paid an upfront commitment fee equal to
1.0%
of the full principal amount of the 2016 Secured Loan Facility and paid a funding fee equal to
1.0%
at the time such amounts were drawn. In connection with the May 2017 maturity extension, the Company paid a one-time extension fee equal to
$8 million
to the extending lenders.
The 2016 Secured Loan Facility is guaranteed by the Company and was originally secured by a first priority lien on
21
real properties owned by the 2016 Secured Loan Borrowers. The 2016 Secured Loan Facility includes customary representations and warranties, indemnities and covenants, including with respect to the condition and maintenance of the real property collateral.
The 2016 Secured Loan Facility has customary events of default, including (subject to certain materiality thresholds and grace periods) payment default, failure to comply with covenants, material inaccuracy of representation or warranty, and bankruptcy or insolvency proceedings. If there is an event of default, the 2016 Secured Loan Lenders may declare all or any portion of the outstanding indebtedness to be immediately due and payable, exercise any rights they might have under any of the 2016 Secured Loan Facility documents (including
83
SEARS HOLDINGS CORPORATION
Notes to Consolidated Financial Statements—(Continued)
against the collateral), and require the 2016 Secured Loan Borrowers to pay a default interest rate equal to the greater of (i)
2.5%
in excess of the base interest rate and (ii) the prime rate plus
1%
. The 2016 Secured Loan Facility may be prepaid at any time in whole or in part, without penalty or premium and
$250 million
of proceeds from real estate transactions was used to pay interest and a portion of the loan during the 2017.
Domestic Credit Agreement
The Borrowers and Holdings are party to an amended and restated credit agreement (the "Amended Domestic Credit Agreement") with a syndicate of lenders. Pursuant to the Amended Domestic Credit Agreement, the Borrowers have borrowed
two
senior secured term loan facilities having original principal amounts of
$1.0 billion
and
$750 million
(the "Term Loan" and "2016 Term Loan," respectively). The Amended Domestic Credit Agreement currently provides for a
$1.5 billion
asset-based revolving credit facility (the "Revolving Facility") with a
$1.0 billion
letter of credit sub-facility, which matures on July 20, 2020. The Term Loan had an original maturity of June 30, 2018 and the 2016 Term Loan matures on July 20, 2020. In December 2017, the Company entered into an agreement to extend the maturity of the Term Loan to January 20, 2019, with the option to further extend the maturity to July 20, 2019, subject to certain conditions, including payment of an extension fee equal to
2.0%
of the principal amount of the Term Loan outstanding at the time of such extension. The Amended Domestic Credit Agreement includes an accordion feature that allows the Borrowers to use, subject to borrowing base requirements, existing collateral for the facility to obtain up to
$1.0 billion
of additional borrowing capacity, of which
$750 million
was utilized for the 2016 Term Loan (described below). The Amended Domestic Credit Agreement also includes a FILO tranche feature that allows up to an additional
$500 million
of borrowing capacity and allows Holdings and its subsidiaries to undertake short-term borrowings outside the facility up to
$1.0 billion
. In February 2018, the Borrowers entered into an amendment that increased the size of the general debt basket to
$1.25 billion
.
Revolving advances under the Amended Domestic Credit Agreement bear interest at a rate equal to, at the election of the Borrowers, either the London Interbank Offered Rate ("LIBOR") or a base rate, in either case plus an applicable margin dependent on Holdings' consolidated leverage ratio (as measured under the Amended Domestic Credit Agreement). The margin with respect to borrowings ranges from
3.50%
to
4.00%
for LIBOR loans and from
2.50%
to
3.00%
for base rate loans. The Amended Domestic Credit Agreement also provides for the payment of fees with respect to issued and undrawn letters of credit at a rate equal to the margin applicable to LIBOR loans and a commitment fee with respect to unused amounts of the Revolving Facility at a rate equal to
0.625%
per annum.
The Revolving Facility is in place as a funding source for general corporate purposes and is secured by a first lien on substantially all of our domestic inventory and credit card and pharmacy receivables, and is subject to a borrowing base formula to determine availability. The Revolving Facility is guaranteed by all domestic subsidiaries of Holdings that own inventory or credit card or pharmacy receivables. The Revolving Facility also permits aggregate second lien indebtedness of up to
$2.0 billion
, of which
$1.1 billion
in second lien notes were outstanding at
February 3, 2018
, resulting in
$896 million
of permitted second lien indebtedness, subject to limitations contained in our other outstanding indebtedness. If, through asset sales or other means, the value of the above eligible assets is not sufficient to support borrowings of up to the full amount of the commitments under this facility, we will not have full access to the facility, but rather could have access to a lesser amount determined by the borrowing base. Such a decline in the value of eligible assets also could result in our inability to borrow up to the full amount of second lien indebtedness permitted by the domestic credit facility, but rather we could be limited to borrowing a lesser amount determined by the borrowing base as calculated pursuant to the terms of such indenture.
The Term Loan bears interest at a rate equal to, at the election of the Borrowers, either LIBOR (subject to a
1.00%
LIBOR floor) or a base rate, plus an applicable margin for LIBOR loans of
4.50%
and for base rate loans of
3.50%
. Currently, the Borrowers are required to repay the Term Loan in quarterly installments of
$2.5 million
, with the remainder of the Term Loan maturing January 20, 2019, subject to the right of the Borrowers to extend the maturity to July 20, 2019. Additionally, the Borrowers are required to make certain mandatory repayments of the Term Loan from excess cash flow (as defined in the Amended Domestic Credit Agreement). The Term Loan may be prepaid in whole or part without penalty. The Term Loan is secured by the same collateral as the Revolving Facility on a pari passu basis with the Revolving Facility, and is guaranteed by the same subsidiaries of the Company that guarantee the Revolving Facility. At
February 3, 2018
and
January 28, 2017
, respectively, we had borrowings of
$400 million
and
$970 million
under the Term Loan, and carrying value, net of the remaining discount and debt issuance costs, of
$391 million
and
$963 million
. During the fourth quarter, the Company paid down the Term Loan
84
SEARS HOLDINGS CORPORATION
Notes to Consolidated Financial Statements—(Continued)
by
$325 million
, reducing the outstanding balance, and bringing our total Term Loan repayment during 2017 to approximately
$570 million
. The Company made additional repayments in 2018 of
$97 million
through the date of this report. A portion of the proceeds received from the Craftsman Sale were also used to reduce outstanding borrowings under the Term Loan.
Amounts borrowed pursuant to the 2016 Term Loan bear interest at a rate equal to LIBOR plus 750 basis points, subject to a
1.00%
LIBOR floor. The Company received approximately
$722 million
in net proceeds from the 2016 Term Loan, which proceeds were used to reduce outstanding borrowings under its asset-based revolving credit facility. The 2016 Term Loan has a maturity date of July 20, 2020, which is the same maturity date as the Company's revolving credit facility commitments, and does not amortize. The 2016 Term Loan is subject to a prepayment premium of
2%
of the aggregate principal amount of the 2016 Term Loan prepaid on or prior to April 8, 2017 and
1%
of the aggregate principal amount of the 2016 Term Loan prepaid after April 8, 2017 and on or prior to April 8, 2018. The obligations under the Amended Domestic Credit Agreement, including the 2016 Term Loan, are secured by a first lien on substantially all of the domestic inventory and credit card and pharmacy receivables of the Company and its subsidiaries and aggregate advances under the Amended Domestic Credit Agreement are subject to a borrowing base formula. The carrying value of the 2016 Term Loan, net of the remaining discount and debt issuance costs, was
$559 million
and
$726 million
at
February 3, 2018
and
January 28, 2017
, respectively. A portion of the proceeds received from the Craftsman Sale were used to reduce outstanding borrowings under the 2016 Term Loan.
The Amended Domestic Credit Agreement limits our ability to make restricted payments, including dividends and share repurchases, subject to specified exceptions that are available if, in each case, no event of default under the credit facility exists immediately before or after giving effect to the restricted payment. These include exceptions that require that projected availability under the credit facility, as defined, to be at least
15%
, exceptions that may be subject to certain maximum amounts and an exception that requires that the restricted payment is funded from cash on hand and not from borrowings under the credit facility. Further, the Amended Domestic Credit Agreement includes customary covenants that restrict our ability to make dispositions, prepay debt and make investments, subject, in each case, to various exceptions. The Amended Domestic Credit Agreement also imposes various other requirements, which take effect if availability falls below designated thresholds, including a cash dominion requirement and a requirement that the fixed charge ratio at the last day of any quarter be not less than
1.0
to 1.0. As of
February 3, 2018
, our fixed charge ratio continues to be less than
1.0
to 1.0, and we are subject to these other requirements based on our availability. If availability under the domestic revolving credit facility were to fall below
10%
, the Company would be required to test the fixed charge coverage ratio, and would not comply with the facility, and the lenders under the facility could demand immediate payment in full of all amounts outstanding and terminate their obligations under the facility. In addition, the domestic credit facility provides that in the event we make certain prepayments of indebtedness, for a period of
one
year thereafter we must maintain availability under the facility of at least
12.5%
, and it prohibits certain other prepayments of indebtedness.
At
February 3, 2018
, we had
$271 million
of Revolving Facility borrowings, and at
January 28, 2017
, we had
no
borrowings outstanding under the Revolving Facility. We had
$377 million
and
$464 million
at
February 3, 2018
and
January 28, 2017
, respectively, of letters of credit outstanding under the Revolving Facility. At
February 3, 2018
and
January 28, 2017
, the amount available to borrow under the Revolving Facility was
$69 million
and
$165 million
, respectively, which reflects the effect of the springing fixed charge coverage ratio covenant and the borrowing base limitation. The majority of the letters of credit outstanding are used to provide collateral for our insurance programs.
Second Lien Credit Agreement
On September 1, 2016, the Company, SRAC, and Kmart Corporation (together with SRAC, the "ABL Borrowers") entered into a Second Lien Credit Agreement with the Lenders thereunder, entities affiliated with ESL, pursuant to which the ABL Borrowers borrowed
$300 million
under a term loan (the "Second Lien Term Loan"). The Company received net proceeds of
$291 million
, which were used for general corporate purposes.
The maturity date for the Second Lien Term Loan is July 20, 2020 and the Second Lien Term Loan will not amortize. The Second Lien Term Loan bears interest at a rate equal to, at the election of the ABL Borrowers, either LIBOR (subject to a
1.00%
floor) or a specified prime rate ("Base Rate"), in either case plus an applicable margin. The margin with respect to the Second Lien Term Loan is
7.50%
for LIBOR loans and
6.50%
for Base Rate loans.
85
SEARS HOLDINGS CORPORATION
Notes to Consolidated Financial Statements—(Continued)
The Second Lien Credit Agreement was amended on July 7, 2017, providing an uncommitted line of credit facility under which subsidiaries of the Company may from time to time borrow line of credit loans ("Line of Credit Loans") with maturities less than
180
days, subject to applicable borrowing base limitations, in an aggregate principal amount not to exceed
$500 million
at any time outstanding. In February 2018, the Second Lien Credit Agreement was further amended to, among other things, increase the maximum aggregate principal amount of the Line of Credit Loans to
$600 million
, extend the maximum duration of the Line of Credit Loans to
270
days and increase the size of the general debt basket to
$1.25 billion
. During 2017, the Company received aggregate proceeds of
$610 million
from the issuance of Line of Credit Loans from various lenders, some of which are entities affiliated with ESL, Bruce R. Berkowitz, and Thomas J. Tisch. The Company made repayments of
$110 million
during 2017, some of which were to related parties. See Note 15 for further information. The proceeds were used for the repayment of indebtedness and general corporate purposes.
The Second Lien Credit Agreement was further amended on January 9, 2018. This amendment amended the borrowing base definition in the Second Lien Credit Agreement to increase the advance rate for inventory to
75%
from
65%
and also deferred the collateral coverage test for purposes of the mandatory repayment covenant in the Second Lien Credit Agreement such that no such mandatory repayment can be required until the end of the third quarter of 2018. In connection with the closing of the Exchange Offers, the Company also entered into an amendment to its Second Lien Credit Agreement. The amendment provides the Company with the option to pay interest on its outstanding
$300 million
principal amount Second Lien Term Loan in kind, and also provides that the Company's obligation under the term loan is convertible into common stock of the Company, on the same conversion terms as the New Senior Secured Notes.
Following consummation of the Exchange Offers, the Company's obligations under the Second Lien Credit Agreement are secured on a pari passu basis with the Company’s obligations under that certain Indenture, dated as of March 20, 2018, pursuant to which the Company issued its New Senior Secured Notes (defined below). The collateral includes inventory, receivables and other related assets of the Company and its subsidiaries which are obligated on the Second Lien Term Loan and the New Senior Secured Notes. The Second Lien Credit Agreement is guaranteed by all domestic subsidiaries of the Company that guarantee the Company’s obligations under its existing Revolving Facility.
The Second Lien Credit Agreement includes representations and warranties, covenants and other undertakings, and events of default that are substantially similar to those contained in the Amended Domestic Credit Agreement. The Second Lien Credit Agreement requires the ABL Borrowers to prepay amounts outstanding under the Amended Domestic Credit Agreement and/or the Second Lien Credit Agreement in order to avoid a Collateral Coverage Event (as defined below). The carrying value of the Second Lien Term Loan, net of the remaining debt issuance costs, was
$294 million
and
$292 million
at
February 3, 2018
and
January 28, 2017
, respectively. The carrying value of the Line of Credit Loans was
$500 million
at
February 3, 2018
.
Old Senior Secured Notes and New Senior Secured Notes
In October 2010, we sold
$1.0 billion
aggregate principal amount of senior secured notes (the "Old Senior Secured Notes"), which bear interest at 6 5/8% per annum and mature on
October 15, 2018
. Concurrent with the closing of the sale of the Old Senior Secured Notes, the Company sold
$250 million
aggregate principal amount of Old Senior Secured Notes to the Company's domestic pension plan in a private placement,
none
of which remain in the domestic pension plan as a result of the Tender Offer discussed below. The Old Senior Secured Notes are guaranteed by certain subsidiaries of the Company and are secured by a security interest in certain assets consisting primarily of domestic inventory and receivables (the "Collateral"). The lien that secures the Old Senior Secured Notes is junior in priority to the liens on such assets that secure obligations under the Amended Domestic Credit Agreement, as well as certain other first priority lien obligations, and, following consummation of the Exchange Offers, obligations under the indenture relating to the New Senior Secured Notes. The Company used the net proceeds of this offering to repay borrowings outstanding under a previous domestic credit agreement on the settlement date and to fund the working capital requirements of our retail businesses, capital expenditures and for general corporate purposes. Prior to consummation of the Exchange Offers, the indenture under which the Old Senior Secured Notes (the "Old Senior Secured Notes Indenture") were issued contained restrictive covenants that, among other things, (1) limited the ability of the Company and certain of its domestic subsidiaries to create liens and enter into sale and leaseback transactions and (2) limited the ability of the Company to consolidate with or merge
86
SEARS HOLDINGS CORPORATION
Notes to Consolidated Financial Statements—(Continued)
into, or sell other than for cash or lease all or substantially all of its assets to, another person. The indenture also provided for certain events of default, which, if any were to occur, would permit or require the principal and accrued and unpaid interest on all the then outstanding Senior Secured Notes to be due and payable immediately. In connection with the consummation of the Exchange Offers, we entered into a supplemental indenture to the Old Senior Secured Notes Indenture that eliminated substantially all of the restrictive covenants and certain events of default in the Old Senior Secured Notes Indenture. The supplemental indenture, among other things, eliminated the obligation of the Company to offer to repurchase all outstanding Old Senior Secured Notes at a purchase price equal to
101%
of the principal amount, plus accrued and unpaid interest, if the borrowing base (as calculated pursuant to the indenture) falls below the principal value of the Old Senior Secured Notes plus any other indebtedness for borrowed money that is secured by liens on the Collateral for two consecutive quarters or upon the occurrence of certain change of control triggering events. The Company may call the Old Senior Secured Notes at a premium based on the "Treasury Rate" as defined in the indenture, plus 50 basis points.
On August 3, 2015, the Company commenced a tender offer (the "Tender Offer") to purchase for cash up to
$1.0 billion
principal amount of its Old Senior Secured Notes, which expired on August 28, 2015. Approximately
$936 million
principal amount of the Old Senior Secured Notes were validly tendered and not validly withdrawn in the Tender Offer. Holders who validly tendered and did not validly withdraw Old Senior Secured Notes at or prior to the early tender date of August 14, 2015 received total consideration of
$990
per
$1,000
principal amount of Old Senior Secured Notes that were accepted for purchase, which included an early tender payment of
$30
per
$1,000
principal amount of Old Senior Secured Notes accepted for purchase, plus accrued and unpaid interest up to, but excluding, the settlement date. Holders who validly tendered and did not validly withdraw Old Senior Secured Notes after the early tender date but at or prior to the expiration date of August 28, 2015 received total consideration of
$960
per
$1,000
principal amount of Old Senior Secured Notes accepted for purchase, plus accrued and unpaid interest up to, but excluding, the settlement date.
We accounted for the Tender Offer in accordance with accounting standards applicable to extinguishment of liabilities and debt modifications and extinguishments. Accordingly, we de-recognized the net carrying amount of Old Senior Secured Notes of
$929 million
(comprised of the principal amount of
$936 million
, offset by unamortized debt issuance costs and discount of
$7 million
), and the reacquisition cost was
$929 million
.
On January 9, 2018, the Company and certain of its subsidiaries entered into a Fourth Supplemental Indenture (the "Supplemental Indenture") with Wilmington Trust, National Association, as successor trustee and collateral agent, amending the Old Senior Secured Notes Indenture. The Supplemental Indenture amended the borrowing base definition in the Old Senior Secured Notes Indenture to increase the advance rate for inventory to
75%
from
65%
. The Supplemental Indenture also defers the collateral coverage test for purposes of the repurchase offer covenant in the Indenture and restarts it with the second quarter of 2018 (such that no collateral coverage event can occur until the end of the third quarter of 2018).
The carrying value of Old Senior Secured Notes, net of the remaining discount and debt issuance costs, was
$303 million
and
$303 million
at
February 3, 2018
and
January 28, 2017
, respectively. The carrying value of Old Senior Secured Notes is included within current portion of long-term debt in the Consolidated Balance Sheets at February 3, 2018.
In February 2018, the Company commenced the Exchange Offers
pursuant to which it offered to issue in exchange for its outstanding Senior Secured Notes new 6 5/8% Senior Secured Notes Due 2019, of a like principal amount, convertible into common stock of the Company, with interest on such notes to be payable in kind at the Company's option. The Exchange Offers expired on March 15, 2018. Approximately
$169.8 million
principal amount of the Senior Secured Notes were validly tendered, accepted and canceled, including
$20 million
principal amount of Old Senior Secured Notes held by ESL, and the Company issued a like principal amount of New Senior Secured Notes. The New Senior Secured Notes are optionally convertible by the holders thereof into shares of the Company’s common stock at a conversion price of
$5.00
per share of common stock, and are mandatorily convertible at the Company's option if the volume weighted average trading price of the common stock on the NASDAQ exceeds
$10.00
for a prescribed period.
The New Senior Unsecured Notes bear interest at a rate of
6.625%
per annum and the Company will pay interest semi-annually on April 15 and October 15 of each year, which interest may, at the option of the Company, be paid in kind
. The New Senior Secured Notes mature in October 2019.
87
SEARS HOLDINGS CORPORATION
Notes to Consolidated Financial Statements—(Continued)
The New Senior Secured Notes are guaranteed by certain subsidiaries of the Company and are secured by a security interest in the Collateral. The lien that secures the New Senior Secured Notes is junior in priority to the liens on such assets that secure obligations under the Amended Domestic Credit Agreement, as well as certain other first priority lien obligations, and senior to the lien on such assets that secure obligations under the Old Senior Secured Notes Indenture. The indenture under which the New Senior Secured Notes (the "New Senior Secured Notes Indenture") were issued contains restrictive covenants that, among other things, (1) limit the ability of the Company and certain of its domestic subsidiaries to create liens and enter into sale and leaseback transactions and (2) limit the ability of the Company to consolidate with or merge into, or sell other than for cash or lease all or substantially all of its assets to, another person. The New Senior Secured Notes Indenture also provides for certain events of default, which, if any were to occur, would permit or require the principal and accrued and unpaid interest on all the then outstanding New Senior Secured Notes to be due and payable immediately. The New Senior Secured Notes Indenture also requires the Company to offer to repurchase all outstanding New Senior Secured Notes at a purchase price equal to
101%
of the principal amount, plus accrued and unpaid interest, if the borrowing base (as calculated pursuant to the indenture) falls below the principal value of the New Senior Secured Notes plus any other indebtedness for borrowed money that is secured by liens on the Collateral for two consecutive quarters or upon the occurrence of certain change of control triggering events.
Old Senior Unsecured Notes and New Senior Unsecured Notes
On October 20, 2014, the Company announced its Board of Directors had approved a rights offering allowing its stockholders to purchase up to
$625 million
in aggregate principal amount of
8%
senior unsecured notes due
2019
and warrants to purchase shares of its common stock. The subscription rights were distributed to all stockholders of the Company as of October 30, 2014, the record date for this rights offering, and every stockholder had the right to participate on the same terms in accordance with its pro rata ownership of the Company's common stock, except that holders of the Company's restricted stock that was unvested as of the record date received cash awards in lieu of subscription rights. This rights offering closed on November 18, 2014 and was oversubscribed.
Accordingly, on November 21, 2014, the Company issued
$625 million
aggregate original principal amount of
8%
senior unsecured notes due
2019
(the "Old Senior Unsecured Notes") and received proceeds of
$625 million
which were used for general corporate purposes. The Old Senior Unsecured Notes are the unsecured and unsubordinated obligations of the Company and rank equal in right of payment with the existing and future unsecured and unsubordinated indebtedness of the Company. The Old Senior Unsecured Notes bear interest at a rate of
8%
per annum and the Company will pay interest semi-annually on June 15 and December 15 of each year. The Old Senior Unsecured Notes are not guaranteed.
We accounted for the Old Senior Unsecured Notes in accordance with accounting standards applicable to distinguishing liabilities from equity and debt with conversion and other options. Accordingly, we allocated the proceeds received for the Senior Unsecured Notes based on the relative fair values of the Old Senior Unsecured Notes and warrants, which resulted in a discount to the notes of approximately
$278 million
. The fair value of the Old Senior Unsecured Notes and warrants was estimated based on quoted market prices for the same issues using Level 1 measurements as defined in Note 5. The discount is being amortized over the life of the Old Senior Unsecured Notes using the effective interest method with an effective interest rate of
11.55%
. Approximately
$55 million
and
$44 million
of the discount was amortized during
2017
and
2016
, respectively. The remaining discount was approximately
$140 million
and
$195 million
at
February 3, 2018
and
January 28, 2017
, respectively. The carrying value of the Old Senior Unsecured Notes net of the remaining discount and debt issuance costs was approximately
$483 million
and
$428 million
at
February 3, 2018
and
January 28, 2017
, respectively.
In February 2018, the Company commenced the Exchange Offers,
pursuant to which it offered to issue in exchange for its outstanding Senior Unsecured Notes new
8%
Senior Unsecured Notes Due 2019, of a like principal amount, convertible into common stock of the Company, with interest on such notes to be payable in kind at the Company's option. The Exchange Offers expired on March 15, 2018. Approximately
$214 million
principal amount of the Old Senior Unsecured Notes were validly tendered, accepted and canceled, including
$187.6 million
principal amount of Old Senior Unsecured Notes by ESL, and the Company issued a like principal amount of New Senior Unsecured Notes. The New Senior Unsecured Notes are optionally convertible by the holders thereof into shares of the Company’s common stock at a conversion price of
$8.33
per share of common stock, and are mandatorily
88
SEARS HOLDINGS CORPORATION
Notes to Consolidated Financial Statements—(Continued)
convertible at the Company's option if the volume weighted average trading price of the common stock on the NASDAQ exceeds
$10.00
for a prescribed period.
The New Senior Unsecured Notes are the unsecured and unsubordinated obligations of the Company and rank equal in right of payment with the existing and future unsecured and unsubordinated indebtedness of the Company. The New Senior Unsecured Notes bear interest at a rate of
8%
per annum and the Company will pay interest semi-annually on June 15 and December 15 of each year, which interest may, at the option of the Company, be paid in kind. The Senior Unsecured Notes are not guaranteed.
Cash Collateral
We post cash collateral for certain self-insurance programs. We continue to classify the cash collateral posted for self-insurance programs as cash and cash equivalents due to our ability to substitute letters of credit for the cash at any time at our discretion. At
February 3, 2018
and
January 28, 2017
,
$4 million
and
$3 million
of cash, respectively, was posted as collateral for self-insurance programs.
Wholly-owned Insurance Subsidiary and Intercompany Securities
We have numerous types of insurable risks, including workers’ compensation, product and general liability, automobile, warranty, asbestos and environmental claims and the extended service contracts we sell to our customers. Certain of the associated risks are managed through Holdings’ wholly-owned insurance subsidiary, Sears Reinsurance Company Ltd. ("Sears Re"), a Bermuda Class 3 insurer.
In accordance with applicable insurance regulations, Sears Re holds marketable securities to support the insurance coverage it provides. Sears has utilized
two
securitization structures to issue specific securities in which Sears Re has invested its capital to fund its insurance obligations. In November 2003, Sears formed a Real Estate Mortgage Investment Conduit, or REMIC. The real estate associated with
138
properties was contributed to indirect wholly-owned subsidiaries of Sears, and then leased back to Sears. The contributed stores were mortgaged and the REMIC issued to wholly-owned subsidiaries of Sears (including Sears Re)
$1.3 billion
(par value) of securities (the "REMIC Securities") that were secured by the mortgages and collateral assignments of the store leases. Payments to the holders on the REMIC Securities were funded by the lease payments. In March 2018, in connection with the Credit Agreement and Mezzanine Loan Agreement described above, the REMIC was unwound and the REMIC Securities were extinguished.
In May 2006, a subsidiary of Holdings contributed the rights to use the Kenmore, Craftsman and DieHard trademarks in the U.S. and its possessions and territories to KCD IP, LLC, an indirect wholly-owned subsidiary of Holdings. KCD IP, LLC has licensed the use of the trademarks to subsidiaries of Holdings, including Sears and Kmart. Asset-backed securities with a par value of
$1.8 billion
(the "KCD Securities") were issued by KCD IP, LLC and subsequently purchased by Sears Re, the collateral for which includes the trademark rights and royalty income. Payments to the holders on the KCD Securities are funded by the royalty payments. In connection with the Craftsman Sale, KCD Securities with par value of
$900 million
were redeemed in March 2017.
The issuers of the REMIC Securities and KCD Securities and the owners of these real estate and trademark assets are bankruptcy remote, special purpose entities that are indirect wholly-owned subsidiaries of Holdings. Cash flows received from rental streams and licensing fee streams paid by Sears, Kmart, other affiliates and third parties, are used for the payment of fees and interest on these securities, through the extinguishment of the REMIC Securities in March 2018. Since the inception of the REMIC and KCD IP, LLC, the REMIC Securities and the KCD Securities have been entirely held by our wholly-owned consolidated subsidiaries, through the extinguishment of the REMIC Securities in March 2018. At
February 3, 2018
and
January 28, 2017
, respectively, the net book value of the securitized trademark rights was approximately
$0.7 billion
and
$1.0 billion
. The net book value of the securitized real estate assets was approximately
$0.5 billion
and
$0.6 billion
at
February 3, 2018
and
January 28, 2017
, respectively.
89
SEARS HOLDINGS CORPORATION
Notes to Consolidated Financial Statements—(Continued)
Trade Creditor Matters
We have ongoing discussions concerning our liquidity and financial position with the vendor community and third parties that offer various credit protection services to our vendors. The topics discussed have included such areas as pricing, payment terms and ongoing business arrangements. As of the date of this report, we have not experienced any significant disruption in our access to merchandise or our operations.
Financial Guarantees
We issue various types of guarantees in the normal course of business. We had the following guarantees outstanding at
February 3, 2018
:
|
millions
|
Bank
Issued |
SRAC
Issued |
Other
|
Total
|
||||||||||||
|
Standby letters of credit
|
$
|
647
|
|
$
|
6
|
|
$
|
—
|
|
$
|
653
|
|
||||
|
Commercial letters of credit
|
—
|
|
31
|
|
—
|
|
31
|
|
||||||||
|
Secondary lease obligations
|
—
|
|
—
|
|
164
|
|
164
|
|
||||||||
The secondary lease obligations related to certain store leases that have been assigned and previously divested Sears businesses. The secondary lease obligations represent the maximum potential amount of future payments, including renewal option periods pursuant to the lease agreements. We remain secondarily liable if the primary obligor defaults.
We determine fair value of financial assets and liabilities based on the following fair value hierarchy, which prioritizes the inputs to valuation techniques used to measure fair value into three levels:
Level 1 inputs
– unadjusted quoted prices in active markets for identical assets or liabilities that we have the ability to access. An active market for the asset or liability is one in which transactions for the asset or liability occur with sufficient frequency and volume to provide ongoing pricing information.
Level 2 inputs
– inputs other than quoted market prices included in Level 1 that are observable, either directly or indirectly, for the asset or liability. Level 2 inputs include, but are not limited to, quoted prices for similar assets or liabilities in an active market, quoted prices for identical or similar assets or liabilities in markets that are not active and inputs other than quoted market prices that are observable for the asset or liability, such as interest rate curves and yield curves observable at commonly quoted intervals, volatilities, credit risk and default rates.
Level 3 inputs
– unobservable inputs for the asset or liability.
90
SEARS HOLDINGS CORPORATION
Notes to Consolidated Financial Statements—(Continued)
Cash and cash equivalents, accounts receivable, merchandise payables, short-term borrowings and accrued liabilities are reflected in the Consolidated Balance Sheets at cost, which approximates fair value due to the short-term nature of these instruments. The fair value of our equity method investment in Sears Canada is disclosed in Note 2. The fair value of our long-term debt is disclosed in Note 3. The fair value of pension and other postretirement benefit plan assets is disclosed in Note 7.
Assets and Liabilities that are Measured at Fair Value on a Nonrecurring Basis
Assets and liabilities that are measured at fair value on a nonrecurring basis relate primarily to our tangible fixed assets, goodwill and other intangible assets, which are remeasured when the derived fair value is below carrying value on our Consolidated Balance Sheets. For these assets, we do not periodically adjust carrying value to fair value except in the event of impairment. When we determine that impairment has occurred, we measure the impairment and adjust the carrying value as discussed in Note 1. With the exception of the indefinite-lived intangible asset impairments and fixed asset impairments described in Note 12 and Note 13, respectively, we had no significant remeasurements of such assets or liabilities to fair value during
2017
and
2016
.
All of the fair value remeasurements were based on significant unobservable inputs (Level 3). Fixed asset fair values were derived based on discussions with real estate brokers, review of comparable properties, if available, and internal expertise related to the current marketplace conditions. Inputs for the goodwill and intangible asset analyses included discounted cash flow analyses, comparable marketplace fair value data, as well as management's assumptions in valuing significant tangible and intangible assets, as described in Note 1, Summary of Significant Accounting Policies.
The following table sets forth the components of interest and investment loss as reported in our Consolidated Statements of Operations:
|
millions
|
2017
|
2016
|
2015
|
|||||||||
|
Interest income on cash and cash equivalents
|
$
|
2
|
|
$
|
1
|
|
$
|
1
|
|
|||
|
Other investment loss
|
(14
|
)
|
(27
|
)
|
(63
|
)
|
||||||
|
Total
|
$
|
(12
|
)
|
$
|
(26
|
)
|
$
|
(62
|
)
|
|||
Interest Income on Cash and Cash Equivalents
We recorded interest income of
$2 million
,
$1 million
and
$1 million
in
2017
,
2016
and
2015
, respectively, primarily related to interest earned on cash and cash equivalents. These cash and cash equivalents consist of highly liquid investments with original maturities of three months or less at the date of purchase. Our invested cash may include, from time to time, investments in, but not limited to, commercial paper, federal, state and municipal government securities, floating-rate notes, repurchase agreements and money market funds. All invested cash amounts are readily available to us.
Other Investment Loss
Other investment loss primarily includes income or loss generated by (and sales of investments in) certain real estate joint ventures and other equity investments in which we do not have a controlling interest. During 2017, 2016 and 2015, respectively, the investment loss from equity investments included a loss of
$17 million
,
$35 million
and
$59 million
.
91
SEARS HOLDINGS CORPORATION
Notes to Consolidated Financial Statements—(Continued)
We sponsor a number of pension and postretirement benefit plans. We account for our retirement programs in accordance with employers' accounting for defined benefit pension and other postretirement plans under Generally Accepted Accounting Principles ("GAAP"). GAAP requires that amounts recognized in financial statements be determined using an actuarial basis. As a result, our pension benefit programs are based on a number of statistical and judgmental assumptions that attempt to anticipate future events and are used in calculating the expense and liability related to our plans each year at January 31. These assumptions include, but are not limited to, discount rates used to value liabilities, assumed rates of return on plan assets, actuarial assumptions relating to retirement age and participant turnover, and mortality rates. The actuarial assumptions we use may differ significantly from actual results. These differences may result in a material impact to the amount of net periodic benefit cost to be recorded in our consolidated financial statements in the future.
Expenses for retirement and savings-related benefit plans were as follows:
|
millions
|
2017
|
2016
|
2015
|
|||||||||
|
Pension plans
|
$
|
657
|
|
$
|
289
|
|
$
|
230
|
|
|||
|
Postretirement benefits
|
—
|
|
28
|
|
(2
|
)
|
||||||
|
Total
|
$
|
657
|
|
$
|
317
|
|
$
|
228
|
|
|||
Retirement Savings Plans
Holdings sponsors retirement savings plans for employees meeting service eligibility requirements. The Company does not match employee contributions.
Other Benefit Plans
Certain full-time and part-time employees of Kmart and Sears are eligible to participate in noncontributory defined benefit plans after meeting age and service requirements. Effective January 31, 1996 and January 1, 2006, respectively, the Kmart tax-qualified defined benefit pension plan and the Sears domestic pension plan were frozen and associates no longer earn additional benefits under the plan. The Kmart tax-qualified defined benefit pension plan was merged with and into the Sears domestic pension plan effective as of January 30, 2008. The merged plan was renamed as the Sears Holdings Pension Plan ("SHC Domestic plan") and Holdings accepted sponsorship of the SHC Domestic plan effective as of that date.
Pension benefits are based on length of service, compensation and, in certain plans, social security or other benefits. Funding for the various plans is determined using various actuarial cost methods.
In addition to providing pension benefits, Sears provides employees and retirees certain medical benefits. These benefits provide access to medical plans. Certain Sears retirees are also provided life insurance benefits. To the extent we share the cost of the retiree medical benefits with retirees, such cost sharing is based on years of service and year of retirement. Sears' postretirement benefit plans are not funded. We have the right to modify or terminate these plans. Effective December 31, 2014, the Company amended its retiree medical plan to eliminate Company subsidies to the plan.
Pension Plan Amendment
Effective December 1, 2016, the Sears Holdings Pension Plan was amended to change its plan year from a calendar year end to a November 30th year end, to spin off a new Sears Holdings Pension Plan 2 ("Plan 2") and to rename the Sears Holdings Pension Plan as Sears Holdings Pension Plan 1 ("Plan 1"). In conjunction with these amendments, the Company requested that the Internal Revenue Service ("IRS") approve the foregoing change in plan year and to approve a change in actuarial funding method in connection with the spin-off and change in plan year. The Company has received IRS approval of both changes.
92
SEARS HOLDINGS CORPORATION
Notes to Consolidated Financial Statements—(Continued)
Pension Plan Settlements
In May 2017, the Company executed an irrevocable agreement to purchase a group annuity contract from Metropolitan Life Insurance Company ("MLIC"), under which MLIC will pay future pension benefit payments to approximately
51,000
retirees from Plan 2. The agreement calls for a transfer of approximately
$515 million
of Plan 2's benefit obligations to MLIC. This action had an immaterial impact on the funded status of our total pension obligations, but reduced the size of the Company's combined pension plan, reduced future cost volatility, and reduced future plan administrative expenses. Due to the annuity purchase, we were required to remeasure our pension obligations. In connection with the remeasurement, we updated the effective discount rate assumption to
3.85%
as of May 31, 2017. The annuity purchase resulted in a non-cash charge of
$200 million
for losses previously accumulated in other comprehensive income (loss), which were recognized through the statement of operations upon settlement during the 13 week period ending July 29, 2017.
In August 2017, the Company reached another agreement with MLIC to annuitize an additional
$512 million
of its pension liability, under which MLIC will pay future pension benefit payments to an additional approximately
20,000
retirees from Plan 2. This action had an immaterial impact on the funded status of our total pension obligations, but reduced the size of the Company's combined pension plan, reduced future cost volatility, and reduced future plan administrative expenses. Due to the annuity purchase, we were required to remeasure our pension obligations. In connection with the remeasurement, we updated the effective discount rate assumption to
3.75%
as of August 31, 2017. This annuity purchase resulted in a non-cash charge of
$203 million
for losses previously accumulated in other comprehensive income (loss), which were recognized through the statement of operations immediately upon settlement during the 13 week period ending October 28, 2017.
Effective August 25, 2017, the Company amended Plan 2, primarily related to lump sum benefit eligibility, and began notifying certain former employees of the Company of its offer to pay those employees' pension benefit in lump sum. Former employees eligible for the voluntary lump sum payment option are generally those who are vested traditional formula participants of Plan 2 who terminated employment prior to January 1, 2017 and who have not yet started receiving monthly payments of their pension benefits. The Company offered the one-time voluntary lump sum window in an effort to reduce its long-term pension obligations and ongoing annual pension expense. This voluntary offer was made to approximately
20,000
eligible terminated vested participants representing approximately
$300 million
of the Company's total qualified pension plan liabilities. Eligible participants had until November 1, 2017 to make their election. The Company made payments of approximately
$209 million
to employees who made the election and funded the payments from existing assets of Plan 2. This lump sum offer resulted in a non-cash charge of
$76 million
for losses previously accumulated in other comprehensive income (loss), which were recognized through the statement of operations immediately upon settlement during the 14 week period ending February 3, 2018.
93
SEARS HOLDINGS CORPORATION
Notes to Consolidated Financial Statements—(Continued)
Pension Plans
|
millions
|
2017
|
2016
|
||||||
|
Change in projected benefit obligation:
|
|
|
||||||
|
Beginning balance
|
$
|
5,165
|
|
$
|
5,265
|
|
||
|
Interest cost
|
180
|
|
227
|
|
||||
|
Actuarial loss
|
227
|
|
108
|
|
||||
|
Benefits paid
|
(316
|
)
|
(435
|
)
|
||||
|
Settlements
|
(1,249
|
)
|
—
|
|
||||
|
Other
|
(4
|
)
|
—
|
|
||||
|
Balance at the measurement date
|
$
|
4,003
|
|
$
|
5,165
|
|
||
|
|
|
|
|
|
||||
|
Change in assets at fair value:
|
|
|
|
|
||||
|
Beginning balance
|
$
|
3,567
|
|
$
|
3,189
|
|
||
|
Actual return on plan assets
|
231
|
|
499
|
|
||||
|
Company contributions
|
295
|
|
314
|
|
||||
|
Benefits paid
|
(316
|
)
|
(435
|
)
|
||||
|
Settlements
|
(1,249
|
)
|
—
|
|
||||
|
Balance at the measurement date
|
$
|
2,528
|
|
$
|
3,567
|
|
||
|
Net amount recognized
|
$
|
(1,475
|
)
|
$
|
(1,598
|
)
|
||
The accumulated benefit obligation for the SHC Domestic plan was
$4.0 billion
at
February 3, 2018
and
$5.2 billion
at
January 28, 2017
.
Postretirement Benefit Obligations
|
millions
|
2017
|
2016
|
||||||
|
Change in accumulated postretirement benefit obligation:
|
||||||||
|
Beginning balance
|
$
|
168
|
|
$
|
143
|
|
||
|
Interest cost
|
6
|
|
5
|
|
||||
|
Plan participants' contributions
|
—
|
|
—
|
|
||||
|
Benefits paid
|
(17
|
)
|
(19
|
)
|
||||
|
Actuarial loss
|
1
|
|
9
|
|
||||
|
Other
|
—
|
|
30
|
|
||||
|
Balance at the measurement date
|
$
|
158
|
|
$
|
168
|
|
||
|
|
||||||||
|
Change in plan assets at fair value:
|
||||||||
|
Beginning of year balance
|
$
|
—
|
|
$
|
—
|
|
||
|
Company contributions
|
17
|
|
19
|
|
||||
|
Plan participants' contributions
|
—
|
|
—
|
|
||||
|
Benefits paid
|
(17
|
)
|
(19
|
)
|
||||
|
Balance at the measurement date
|
$
|
—
|
|
$
|
—
|
|
||
|
Funded status
|
$
|
(158
|
)
|
$
|
(168
|
)
|
||
The current portion of our liability for postretirement benefit obligations is
$16 million
, which we expect to pay during fiscal
2018
.
94
SEARS HOLDINGS CORPORATION
Notes to Consolidated Financial Statements—(Continued)
Weighted-average assumptions used to determine plan obligations were as follows:
|
2017
|
2016
|
2015
|
||||
|
Pension benefits:
|
||||||
|
Discount rate
|
3.75%
|
4.15%
|
4.50%
|
|||
|
Postretirement benefits:
|
||||||
|
Discount rate
|
3.60%
|
3.85%
|
4.00%
|
|||
The decrease in the discount rate in
2017
resulted in an increase in the
2017
year-end pension obligation of approximately
$229 million
.
Net Periodic Benefit Cost
The components of net periodic benefit cost were as follows:
|
millions
|
2017
|
2016
|
2015
|
|||||||||
|
Pension benefits:
|
||||||||||||
|
Interest cost
|
$
|
180
|
|
$
|
227
|
|
$
|
211
|
|
|||
|
Expected return on plan assets
|
(190
|
)
|
(202
|
)
|
(249
|
)
|
||||||
|
Settlements
|
479
|
|
—
|
|
—
|
|
||||||
|
Recognized net loss and other
|
188
|
|
264
|
|
268
|
|
||||||
|
Net periodic benefit cost
|
$
|
657
|
|
$
|
289
|
|
$
|
230
|
|
|||
|
|
||||||||||||
|
Postretirement benefits:
|
||||||||||||
|
Interest cost
|
$
|
6
|
|
$
|
5
|
|
$
|
5
|
|
|||
|
Recognized net loss and other
|
(6
|
)
|
23
|
|
(7
|
)
|
||||||
|
Net periodic benefit cost
|
$
|
—
|
|
$
|
28
|
|
$
|
(2
|
)
|
|||
Weighted-average assumptions used to determine net cost were as follows:
|
2017
|
2016
|
2015
|
||||
|
Pension benefits:
|
||||||
|
Discount Rate
(1)
|
4.15%
|
4.50%
|
3.70%
|
|||
|
Return of plan assets
|
6.50%
|
6.50%
|
7.00%
|
|||
|
Postretirement benefits:
|
||||||
|
Discount Rate
|
3.85%
|
4.00%
|
3.30%
|
|||
(1)
In connection with the annuitizations noted above, we updated the effective discount rate assumption to
3.85%
as of May 31, 2017 and to
3.75%
as of August 31, 2017 for Plan 2.
95
SEARS HOLDINGS CORPORATION
Notes to Consolidated Financial Statements—(Continued)
For purposes of determining the periodic expense of our defined benefit plans, we use the fair value of plan assets as the market-related value. A one-percentage-point change in the assumed discount rate would have the following effects on the pension liability:
|
millions
|
1 percentage-point
Increase |
1 percentage-point
Decrease |
||||||
|
Effect on interest cost component
|
$
|
20
|
|
$
|
(26
|
)
|
||
|
Effect on pension benefit obligation
|
$
|
(384
|
)
|
$
|
460
|
|
||
Approximately
$146 million
of the unrecognized net losses in accumulated other comprehensive income are expected to be amortized as a component of net periodic benefit cost during
2018
.
Investment Strategy
The Investment Committee, made up of select members of senior management, has delegated to a non-affiliated third party professional, as a limited-purpose named fiduciary, the authority to provide certain investment-related services with respect to the assets of Holdings' domestic pension plans. The plans' overall investment objective is to provide a long-term return that, along with Company contributions, is expected to meet future benefit payment requirements. A long-term horizon has been adopted in establishing investment policy such that the likelihood and duration of investment losses are carefully weighed against the long-term potential for appreciation of assets. The plans' investment policy requires investments to be diversified across individual securities, industries, market capitalization and valuation characteristics. In addition, various techniques are utilized to monitor, measure and manage risk.
Domestic plan assets were invested in the following classes of securities:
|
|
Plan Assets at
|
|||||
|
|
February 3,
2018 |
January 28,
2017 |
||||
|
Equity securities
|
36
|
%
|
35
|
%
|
||
|
Fixed income and other debt securities
|
63
|
|
63
|
|
||
|
Other
|
1
|
|
2
|
|
||
|
Total
|
100
|
%
|
100
|
%
|
||
The domestic plans' target allocation is determined by taking into consideration the amounts and timing of projected liabilities, our funding policies and expected returns on various asset classes. At
February 3, 2018
, the plans' target asset allocation was
35%
equity and
65%
fixed income. To develop the expected long-term rate of return on assets assumption, we considered the historical returns and the future expectations for returns for each asset class, as well as the target asset allocation of the pension portfolio.
96
SEARS HOLDINGS CORPORATION
Notes to Consolidated Financial Statements—(Continued)
Future Cash Flows of Benefit Plans
Information regarding expected future cash flows for the SHC Domestic plan is as follows:
|
millions
|
||||
|
Pension benefits:
|
|
|||
|
Employer contributions:
|
|
|||
|
2018 (expected)
|
$
|
280
|
|
|
|
Expected benefit payments:
|
|
|
||
|
2018
|
$
|
334
|
|
|
|
2019
|
308
|
|
||
|
2020
|
298
|
|
||
|
2021
|
291
|
|
||
|
2022
|
283
|
|
||
|
2023-2027
|
1,289
|
|
||
|
Postretirement benefits:
|
|
|
||
|
Employer contributions:
|
|
|
||
|
2018 (expected)
|
$
|
16
|
|
|
|
Expected employer contribution for benefit payments:
|
|
|
||
|
2018
|
$
|
16
|
|
|
|
2019
|
17
|
|
||
|
2020
|
17
|
|
||
|
2021
|
16
|
|
||
|
2022
|
15
|
|
||
|
2023-2027
|
58
|
|
||
Domestic Pension Plans Funding
Contributions to our pension plans remain a significant use of our cash on an annual basis. While the Company's pension plan is frozen, and thus associates do not currently earn pension benefits, the Company has a legacy pension obligation for past service performed by Kmart and Sears associates. During
2017
, we contributed
$295 million
to our domestic pension plans, including amounts contributed from the escrow created pursuant to the PPPFA. We estimate that our minimum pension funding obligations will be
$280 million
in
2018
(excluding the
$20 million
supplemental payment described below) and approximately
$276 million
in
2019
. As discussed in Note 1, the Company agreed to grant the PBGC a lien on, and subsequently contribute to the Company's pension plans, the Craftsman Receivable. During the second quarter of 2017, we sold the Craftsman Receivable to a third-party purchaser, and deposited the proceeds into an escrow for the benefit of our pension plans. We subsequently contributed a portion of the proceeds received from the sale of the Craftsman Receivable to our pension plans, which contribution was credited against the Company's minimum pension funding obligations in 2017. Under our agreement with the PBGC, the remaining proceeds will also be contributed to our pension plans, and when so contributed, will be fully credited against the Company's minimum pension funding obligations in 2018 and 2019.
The Company also agreed to grant a lien to the PBGC on the
15
-year income stream relating to new Stanley Black & Decker sales of Craftsman products, and agreed to contribute the payments from Stanley Black & Decker under such income stream to the Company's pension plans, with such payments to be credited against the Company's minimum pension funding obligations starting no later than
five
years from the closing date. The Company also agreed to grant the PBGC a lien on
$100 million
of real estate assets to secure the Company's minimum pension obligations through the end of 2019.
In November 2017, the Company announced an amendment to the PPPFA that allowed the Company to pursue the monetization of
138
of our properties that were subject to a ring-fence arrangement created under the PPPFA. In
97
SEARS HOLDINGS CORPORATION
Notes to Consolidated Financial Statements—(Continued)
March 2018, the Company closed on the Secured Loan and the Mezzanine Loan, which transactions released the properties from the ring-fence arrangement. The Company contributed approximately
$282 million
of the proceeds of such loans to our pension plans, and deposited
$125 million
into an escrow for the benefit of our pension plans. Under our agreement with the PBGC, the escrowed amount will also be contributed to our pension plans and, when so contributed, will be fully credited against the Company’s minimum pension funding obligations in 2018 and 2019 described above. Following such transactions, the Company has been relieved of contributions to our pension plans for approximately
two
years (other than the contributions from escrow described above and a
$20 million
supplemental payment due in the second quarter of 2018). The ultimate amount of pension contributions could be affected by factors such as changes in applicable laws, as well as financial market and investment performance and demographic changes.
Fair Value of Pension Plan Assets
The following table presents our plan assets using the fair value hierarchy at
February 3, 2018
and
January 28, 2017
:
|
Investment Assets at Fair Value at
|
||||||||||||||||
|
February 3, 2018
|
||||||||||||||||
|
millions
|
Total
|
Level 1
|
Level 2
|
Level 3
|
||||||||||||
|
Equity securities:
|
|
|
|
|
|
|
|
|
||||||||
|
U.S. companies
|
$
|
727
|
|
$
|
720
|
|
$
|
—
|
|
$
|
7
|
|
||||
|
International companies
|
164
|
|
164
|
|
—
|
|
—
|
|
||||||||
|
U.S. registered investment companies
|
6
|
|
6
|
|
—
|
|
—
|
|
||||||||
|
Fixed income securities:
|
||||||||||||||||
|
Corporate bonds and notes
|
1,423
|
|
—
|
|
1,423
|
|
—
|
|
||||||||
|
Sears Holdings Corporation 2016 Term Loan
|
77
|
|
—
|
|
77
|
|
—
|
|
||||||||
|
Mortgage-backed and asset-backed
|
9
|
|
—
|
|
6
|
|
3
|
|
||||||||
|
Other
|
(3
|
)
|
—
|
|
(3
|
)
|
—
|
|
||||||||
|
Total investment assets at fair value
|
$
|
2,403
|
|
$
|
890
|
|
$
|
1,503
|
|
$
|
10
|
|
||||
|
Cash
|
4
|
|
||||||||||||||
|
Accounts receivable
|
39
|
|
|
|
|
|||||||||||
|
Accounts payable
|
(28
|
)
|
|
|
|
|||||||||||
|
Investments measured at NAV:
|
||||||||||||||||
|
Cash equivalents and short-term investments
|
110
|
|
||||||||||||||
|
Net assets available for plan benefits
|
$
|
2,528
|
|
|
|
|
|
|
||||||||
98
SEARS HOLDINGS CORPORATION
Notes to Consolidated Financial Statements—(Continued)
|
Investment Assets at Fair Value at
|
||||||||||||||||
|
January 28, 2017
|
||||||||||||||||
|
millions
|
Total
|
Level 1
|
Level 2
|
Level 3
|
||||||||||||
|
Equity securities:
|
|
|
|
|
|
|
|
|
||||||||
|
U.S. companies
|
$
|
980
|
|
$
|
978
|
|
$
|
—
|
|
$
|
2
|
|
||||
|
International companies
|
224
|
|
224
|
|
—
|
|
—
|
|
||||||||
|
U.S. registered investment companies
|
3
|
|
3
|
|
—
|
|
—
|
|
||||||||
|
Fixed income securities:
|
||||||||||||||||
|
Corporate bonds and notes
|
1,994
|
|
—
|
|
1,994
|
|
—
|
|
||||||||
|
Sears Holdings Corporation 2016 Term Loan
|
100
|
|
—
|
|
100
|
|
—
|
|
||||||||
|
Mortgage-backed and asset-backed
|
3
|
|
—
|
|
1
|
|
2
|
|
||||||||
|
Other
|
1
|
|
—
|
|
1
|
|
—
|
|
||||||||
|
Ventures and partnerships
|
1
|
|
—
|
|
—
|
|
1
|
|
||||||||
|
Total investment assets at fair value
|
$
|
3,306
|
|
$
|
1,205
|
|
$
|
2,096
|
|
$
|
5
|
|
||||
|
Cash
|
8
|
|
||||||||||||||
|
Accounts receivable
|
65
|
|
|
|
|
|||||||||||
|
Accounts payable
|
(69
|
)
|
|
|
|
|||||||||||
|
Investments measured at NAV:
|
||||||||||||||||
|
Cash equivalents and short-term investments
|
257
|
|
||||||||||||||
|
Net assets available for plan benefits
|
$
|
3,567
|
|
|
|
|
|
|
||||||||
Equity securities, which include common and preferred stocks, are actively traded and valued at the closing price reported in the active market in which the security is traded and are assigned to Level 1.
Fixed income securities are assigned to Level 2 as they are primarily valued by institutional bid evaluation, which determines the estimated price a dealer would pay for a security and which is developed using proprietary models established by the pricing vendors for this purpose.
Certain mortgage-backed and other asset-backed debt securities are assigned to Level 3 based on the relatively low position in the preferred hierarchy of the pricing source. Valuation of the Plan's non-public limited partnerships requires significant judgment by the general partners due to the absence of quoted market value, inherent lack of liquidity, and the long-term nature of the assets, and may result in fair value measurements that are not indicative of ultimate realizable value. Our Level 3 assets, including activity related to our Level 3 assets, are immaterial.
Collective short-term investment funds are stated at net asset value (NAV) as determined by the investment managers and have not been classified in the fair value hierarchy. Investment managers value the underlying investments of the funds at amortized cost, which approximates fair value.
99
SEARS HOLDINGS CORPORATION
Notes to Consolidated Financial Statements—(Continued)
The following table sets forth the components used to calculate basic and diluted loss per share attributable to Holdings' shareholders. Warrants, restricted stock awards and restricted stock units, totaling
2 thousand
shares in
2016
and
5 million
shares in
2015
were not included in the computation of diluted loss per share attributable to Holdings' shareholders because the effect of their inclusion would have been anti-dilutive.
|
millions, except earnings per share
|
2017
|
2016
|
2015
|
|||||||||
|
Basic weighted average shares
|
107.4
|
|
106.9
|
|
106.6
|
|
||||||
|
Dilutive effect of restricted stock awards, restricted stock units and warrants
|
—
|
|
—
|
|
—
|
|
||||||
|
Diluted weighted average shares
|
107.4
|
|
106.9
|
|
106.6
|
|
||||||
|
Net loss attributable to Holdings' shareholders
|
$
|
(383
|
)
|
$
|
(2,221
|
)
|
$
|
(1,129
|
)
|
|||
|
Loss per share attributable to Holdings' shareholders:
|
|
|
|
|
|
|
||||||
|
Basic
|
$
|
(3.57
|
)
|
$
|
(20.78
|
)
|
$
|
(10.59
|
)
|
|||
|
Diluted
|
$
|
(3.57
|
)
|
$
|
(20.78
|
)
|
$
|
(10.59
|
)
|
|||
Stock-based Compensation
We account for stock-based compensation using the fair value method in accordance with accounting standards regarding share-based payment transactions. We do not currently have an employee stock option plan and at
February 3, 2018
, there are
no
outstanding options. Compensation expense related to stock-based compensation arrangements was immaterial during
2017
,
2016
and
2015
.
We granted restricted stock awards and restricted stock units to certain associates. These restricted stock awards and restricted stock units typically vest in
zero
to
three
years from the date of grant, provided the grantee remains employed by us at the vesting date. The fair value of these awards and units is equal to the market price of our common stock on the date of grant. We do not currently have a broad-based program that provides for restricted stock awards or restricted stock units on an annual basis. Changes in restricted stock awards and restricted stock units for
2017
,
2016
and
2015
were as follows:
|
|
2017
|
2016
|
2015
|
||||||||||||||||||
|
(Shares in thousands)
|
Shares
|
Weighted-
Average Fair Value on Date of Grant |
Shares
|
Weighted-
Average Fair Value on Date of Grant |
Shares
|
Weighted-
Average Fair Value on Date of Grant |
|||||||||||||||
|
Beginning of year balance
|
151
|
|
$
|
28.89
|
|
60
|
|
$
|
42.88
|
|
73
|
|
$
|
45.82
|
|
||||||
|
Granted
|
606
|
|
7.15
|
|
384
|
|
16.87
|
|
198
|
|
31.26
|
|
|||||||||
|
Vested
|
(623
|
)
|
8.10
|
|
(293
|
)
|
16.00
|
|
(200
|
)
|
32.01
|
|
|||||||||
|
Forfeited
|
(119
|
)
|
25.27
|
|
—
|
|
—
|
|
(11
|
)
|
51.39
|
|
|||||||||
|
End of year balance
|
15
|
|
$
|
42.09
|
|
151
|
|
$
|
28.89
|
|
60
|
|
$
|
42.88
|
|
||||||
|
millions
|
2017
|
2016
|
2015
|
|||||||||
|
Aggregate fair value of shares granted based on weighted average fair value at date of grant
|
$
|
4
|
|
$
|
6
|
|
$
|
6
|
|
|||
|
Aggregate fair value of shares vesting during period
|
4
|
|
4
|
|
6
|
|
||||||
|
Aggregate fair value of shares forfeited during period
|
1
|
|
—
|
|
—
|
|
||||||
100
SEARS HOLDINGS CORPORATION
Notes to Consolidated Financial Statements—(Continued)
A
pproximately
15,000
shares of the
15,000
shares of unvested restricted stock and restricted stock units outstanding at
February 3, 2018
are scheduled to vest during
2018
, subject to satisfaction of applicable vesting conditions.
Common Share Repurchase Program
From time to time, we repurchase shares of our common stock under a common share repurchase program authorized by our Board of Directors. The common share repurchase program was initially announced in 2005 with a total authorization since inception of the program of
$6.5 billion
. During
2017
,
2016
and
2015
, we repurchased
no
shares of our common stock under our common share repurchase program. At
February 3, 2018
, we had approximately
$504 million
of remaining authorization under our common share repurchase program.
The share repurchase program has no stated expiration date and share repurchases may be implemented using a variety of methods, which may include open market purchases, privately negotiated transactions, block trades, accelerated share repurchase transactions, the purchase of call options, the sale of put options or otherwise, or by any combination of such methods.
Accumulated Other Comprehensive Loss
The following table displays the components of accumulated other comprehensive loss:
|
millions
|
February 3,
2018 |
January 28,
2017 |
January 30,
2016 |
||||||||
|
Pension and postretirement adjustments (net of tax of $(225), $(225) and $(296), respectively)
|
$
|
(1,071
|
)
|
$
|
(1,549
|
)
|
$
|
(1,915
|
)
|
||
|
Currency translation adjustments (net of tax of $0 for all periods presented)
|
(1
|
)
|
(3
|
)
|
(3
|
)
|
|||||
|
Accumulated other comprehensive loss
|
$
|
(1,072
|
)
|
$
|
(1,552
|
)
|
$
|
(1,918
|
)
|
||
Pension and postretirement adjustments relate to the net actuarial loss on our pension and postretirement plans recognized as a component of accumulated other comprehensive loss.
Income Tax Expense Allocated to Each Component of Other Comprehensive Income (Loss)
Income tax expense allocated to each component of other comprehensive income (loss) was as follows:
|
|
2017
|
||||||||||
|
millions
|
Before
Tax Amount |
Tax
Expense |
Net of
Tax Amount |
||||||||
|
Other comprehensive income
|
|||||||||||
|
Pension and postretirement adjustments
|
|||||||||||
|
Experience loss
|
$
|
(182
|
)
|
$
|
—
|
|
$
|
(182
|
)
|
||
|
Less: cost of settlements
|
479
|
|
—
|
|
479
|
|
|||||
|
Less: recognized net loss and other included in net periodic benefit cost
(1)
|
181
|
|
—
|
|
181
|
|
|||||
|
Pension and postretirement adjustments, net of tax
|
478
|
|
—
|
|
478
|
|
|||||
|
Currency translation adjustments
|
2
|
|
—
|
|
2
|
|
|||||
|
Total other comprehensive income
|
$
|
480
|
|
$
|
—
|
|
$
|
480
|
|
||
101
SEARS HOLDINGS CORPORATION
Notes to Consolidated Financial Statements—(Continued)
|
|
2016
|
||||||||||
|
millions
|
Before
Tax Amount |
Tax Expense
|
Net of
Tax Amount |
||||||||
|
Other comprehensive income
|
|||||||||||
|
Pension and postretirement adjustments
|
|||||||||||
|
Experience gain
|
$
|
181
|
|
$
|
(71
|
)
|
$
|
110
|
|
||
|
Less: recognized net loss and other included in net periodic benefit cost
(1)
|
256
|
|
—
|
|
256
|
|
|||||
|
Pension and postretirement adjustments, net of tax
|
437
|
|
(71
|
)
|
366
|
|
|||||
|
Dissolution of noncontrolling interest
|
(7
|
)
|
—
|
|
(7
|
)
|
|||||
|
Total other comprehensive income
|
$
|
430
|
|
$
|
(71
|
)
|
$
|
359
|
|
||
|
(1)
|
Included in the computation of net periodic benefit expense. See Note 7 to the Consolidated Financial Statements.
|
|
|
2015
|
||||||||||
|
millions
|
Before
Tax Amount |
Tax Expense
|
Net of
Tax Amount |
||||||||
|
Other comprehensive income
|
|||||||||||
|
Pension and postretirement adjustments
|
|||||||||||
|
Experience loss
|
$
|
(148
|
)
|
$
|
—
|
|
$
|
(148
|
)
|
||
|
Less: recognized net loss and other included in net periodic benefit cost
(1)
|
261
|
|
—
|
|
261
|
|
|||||
|
Pension and postretirement adjustments, net of tax
|
113
|
|
—
|
|
113
|
|
|||||
|
Currency translation adjustments
|
(1
|
)
|
—
|
|
(1
|
)
|
|||||
|
Total other comprehensive income
|
$
|
112
|
|
$
|
—
|
|
$
|
112
|
|
||
|
(1)
|
Included in the computation of net periodic benefit expense. See Note 7 to the Consolidated Financial Statements.
|
Issuance of Warrants to Purchase Common Stock
On November 21, 2014, the Company issued an aggregate of approximately
22 million
warrants pursuant to the exercise of rights in the rights offering for
$625 million
in aggregate principal amount of
8%
Senior Unsecured Notes due
2019
and warrants to purchase shares of its common stock. The exercise price and the number of shares of common stock issuable upon exercise of a warrant are both subject to adjustment in certain circumstances. As of October 31, 2015, each warrant, when exercised, will entitle the holder thereof to purchase
1.11
shares of the Company's common stock at an exercise price of
$25.686
per share under the terms of the warrant agreement, adjusted from the previously disclosed
one
share of the Company's common stock at an exercise price of
$28.41
per share. The exercise price is payable in cash or by surrendering Old Senior Unsecured Notes or New Senior Unsecured Notes, in each case with a principal amount at least equal to the exercise price. The warrants may be exercised at any time after November 24, 2014. Unless earlier exercised, the warrants will expire on December 15, 2019.
We accounted for the warrants in accordance with accounting standards applicable to distinguishing liabilities from equity and debt with conversion and other options. Accordingly, the warrants have been classified as additional paid-in capital in the Consolidated Balance Sheets based on the relative fair value of the warrants and the related 8% Senior Unsecured Notes due 2019 at the time of issuance. We monitor changes in circumstances that could cause the classification of the warrants to change. The fair value of the warrants and the related
8%
Senior Unsecured Notes due 2019 was estimated based on quoted market prices for the same issues using Level 1 measurements as defined in Note 5.
102
SEARS HOLDINGS CORPORATION
Notes to Consolidated Financial Statements—(Continued)
|
millions
|
2017
|
2016
|
2015
|
|||||||||
|
Loss before income taxes:
|
|
|
|
|||||||||
|
U.S.
|
$
|
(1,012
|
)
|
$
|
(2,429
|
)
|
$
|
(1,420
|
)
|
|||
|
Foreign
|
31
|
|
34
|
|
35
|
|
||||||
|
Total
|
$
|
(981
|
)
|
$
|
(2,395
|
)
|
$
|
(1,385
|
)
|
|||
|
|
|
|
|
|
|
|
||||||
|
Income tax benefit:
|
|
|
|
|
|
|
||||||
|
Current:
|
|
|
|
|
|
|
||||||
|
Federal
|
$
|
9
|
|
$
|
13
|
|
$
|
11
|
|
|||
|
State and local
|
(3
|
)
|
16
|
|
20
|
|
||||||
|
Foreign
|
13
|
|
18
|
|
17
|
|
||||||
|
Total current
|
19
|
|
47
|
|
48
|
|
||||||
|
|
|
|
|
|
||||||||
|
Deferred:
|
|
|
|
|
||||||||
|
Federal
|
(429
|
)
|
(87
|
)
|
(239
|
)
|
||||||
|
State and local
|
(187
|
)
|
(134
|
)
|
(66
|
)
|
||||||
|
Foreign
|
(1
|
)
|
—
|
|
—
|
|
||||||
|
Total deferred
|
(617
|
)
|
(221
|
)
|
(305
|
)
|
||||||
|
Total
|
$
|
(598
|
)
|
$
|
(174
|
)
|
$
|
(257
|
)
|
|||
|
|
2017
|
2016
|
2015
|
||||||
|
Effective tax rate reconciliation:
|
|
|
|
||||||
|
Federal income tax rate (benefit rate)
|
(33.7
|
)%
|
(35.0
|
)%
|
(35.0
|
)%
|
|||
|
State and local tax (benefit) net of federal tax benefit
|
(11.8
|
)
|
(3.0
|
)
|
(1.8
|
)
|
|||
|
Federal tax rate change
|
(22.6
|
)
|
—
|
|
—
|
|
|||
|
Federal and state valuation allowance
|
21.2
|
|
41.1
|
|
37.4
|
|
|||
|
Land and indefinite-lived intangibles
|
(12.1
|
)
|
(0.2
|
)
|
(16.9
|
)
|
|||
|
Impairment of indefinite-lived trade names
|
(1.8
|
)
|
(6.0
|
)
|
(4.9
|
)
|
|||
|
Loss disallowance
|
—
|
|
—
|
|
3.5
|
|
|||
|
Tax credits
|
(0.4
|
)
|
(0.3
|
)
|
(0.7
|
)
|
|||
|
Resolution of income tax matters
|
(0.8
|
)
|
—
|
|
(0.3
|
)
|
|||
|
Adjust foreign statutory rates
|
(1.0
|
)
|
0.1
|
|
(0.3
|
)
|
|||
|
Repatriation toll charge
|
1.8
|
|
—
|
|
—
|
|
|||
|
Tax benefit resulting from other comprehensive income allocation
|
—
|
|
(2.9
|
)
|
—
|
|
|||
|
Other
|
0.2
|
|
(1.1
|
)
|
0.4
|
|
|||
|
|
(61.0
|
)%
|
(7.3
|
)%
|
(18.6
|
)%
|
|||
103
SEARS HOLDINGS CORPORATION
Notes to Consolidated Financial Statements—(Continued)
|
millions
|
February 3,
2018 |
January 28,
2017 |
||||||
|
Deferred tax assets and liabilities:
|
|
|
||||||
|
Deferred tax assets:
|
|
|
||||||
|
Federal benefit for state and foreign taxes
|
$
|
117
|
|
$
|
148
|
|
||
|
Accruals and other liabilities
|
142
|
|
135
|
|
||||
|
Net operating loss carryforwards
|
1,736
|
|
2,255
|
|
||||
|
Pension and postretirement benefit plans
|
972
|
|
1,244
|
|
||||
|
Property and equipment
|
139
|
|
231
|
|
||||
|
Deferred income
|
266
|
|
479
|
|
||||
|
Credit carryforwards
|
899
|
|
875
|
|
||||
|
Other
|
208
|
|
218
|
|
||||
|
Total deferred tax assets
|
4,479
|
|
5,585
|
|
||||
|
Valuation allowance
|
(4,187
|
)
|
(5,519
|
)
|
||||
|
Net deferred tax assets
|
292
|
|
66
|
|
||||
|
|
|
|
|
|
||||
|
Deferred tax liabilities:
|
|
|
|
|
||||
|
Trade names/Intangibles
|
285
|
|
573
|
|
||||
|
Inventory
|
105
|
|
193
|
|
||||
|
Other
|
28
|
|
43
|
|
||||
|
Total deferred tax liabilities
|
418
|
|
809
|
|
||||
|
Net deferred tax liability
|
$
|
(126
|
)
|
$
|
(743
|
)
|
||
On December 22, 2017, the U.S. government enacted comprehensive tax legislation commonly referred to as the Tax Cuts and Jobs Act (the "Tax Act"). The Tax Act makes broad and complex changes to the U.S. tax code that will affect our fiscal year ended February 3, 2018, including, but not limited to, (1) reducing the U.S. federal corporate tax rate to 21%, (2) requiring a one-time transition tax on certain unrepatriated earnings of foreign subsidiaries that is payable over eight years and (3) various other miscellaneous changes that are effective in fiscal 2017. With the lower U.S. federal corporate rate effective beginning January 1, 2018, our U.S. federal corporate tax rate for 2017 is a blended rate of
33.717%
.
In addition to the 21% reduced federal corporate tax rate, the Tax Act also establishes new tax laws that will affect fiscal 2018, including, but not limited to, (1) the creation of the base erosion anti-abuse tax ("BEAT"), a new minimum tax; (2) a general elimination of U.S. federal income taxes on dividends from foreign subsidiaries; (3) a new provision designed to tax global intangible low-taxed income ("GILTI"); (4) a new limitation on deductible interest expense; (5) limitations on the deductibility of certain executive compensation; (6) limitations on the use of foreign tax credits ("FTCs") to reduce the U.S. income tax liability; and (7) limitations on net operating losses ("NOLs") generated in tax years beginning after December 31, 2017, to
80%
of taxable income with indefinite carryovers.
The SEC staff issued Staff Accounting Bulletin ("SAB") 118, which provides guidance on accounting for the tax effects of the Tax Act. SAB 118 provides a measurement period that should not extend beyond one year from the Tax Act enactment date for companies to complete the accounting in accordance with accounting standards applicable to income taxes. In accordance with SAB 118, a company must reflect the income tax effects of those aspects of the Tax Act for which the accounting under accounting standards applicable to income taxes is complete. To the extent that a company’s accounting for certain income tax effects of the Tax Act is incomplete but is able to determine a reasonable estimate, it must record a provisional estimate in the financial statements. If a company cannot determine a provisional estimate to be included in the financial statements, it should continue to apply accounting standards applicable to income taxes on the basis of the provisions of the tax laws that were in effect immediately before the enactment of the Tax Act.
104
SEARS HOLDINGS CORPORATION
Notes to Consolidated Financial Statements—(Continued)
The income tax benefit for the period ended February 3, 2018 included a tax benefit of approximately
$470 million
related to the impacts of the Tax Act. The impacts of the Tax Act primarily consist of a net benefit for the corporate rate reduction of
$222 million
, a net tax benefit for the valuation allowance release of
$270 million
, and a net expense for the transition tax of
$11 million
.
For various reasons that are discussed below, our accounting for the following elements of the Tax Act is incomplete. However, we were able to make reasonable estimates of certain effects and, therefore, recorded provisional adjustments as follows:
Reduction of U.S. federal corporate tax rate
: As a result of the reduced corporate rate, our deferred tax assets, liabilities and valuation allowance decreased. Further, as we had a net deferred tax liability after valuation allowance, these decreases resulted in a deferred income tax benefit of
$222 million
for the year ended February 3, 2018. While we were able to make a reasonable estimate of the impact of the reduction in the corporate rate, it may be affected by other analyses related to the Tax Act, including, but not limited to, our calculation of deemed repatriation of deferred foreign income and state tax effect of adjustments made to federal temporary differences.
Deemed Repatriation Transition Tax:
The Deemed Repatriation Transition Tax ("Transition Tax") is a tax on previously untaxed accumulated and current earnings and profits ("E&P") of certain of our foreign subsidiaries. To determine the amount of the Transition Tax, we must determine, in addition to other factors, the amount of post-1986 E&P of the relevant subsidiaries, as well as the amount of non-U.S. income taxes paid on such earnings. We are able to make a reasonable estimate of the Transition Tax and recorded a provisional Transition Tax obligation of
$6 million
and a provisional withholding tax obligation of
$11 million
. As a result of our valuation allowance on NOLs, only the
$11 million
withholding tax obligation resulted in a current tax expense. However, we are continuing to gather additional information to more precisely compute the amount of the Transition Tax.
Valuation Allowances:
The Company assessed whether its valuation allowance analyses are affected by various aspects of the Tax Act (e.g., deemed repatriation of deferred foreign income, new categories of FTCs, and other miscellaneous provisions of the Tax Act), any corresponding determination of the need for or change in a valuation allowance is also provisional.
Global Intangible Low Taxes Income (GILTI):
The Tax Act creates a new requirement that certain income (i.e., GILTI) earned by controlled foreign corporations ("CFCs") must be included currently in the gross income of the CFC’s U.S. shareholder. GILTI is the excess of the shareholder’s "net CFC tested income" over the net deemed tangible income return, which is currently defined as the excess of (1) 10% of the aggregate of the U.S. shareholder’s pro rata share of the qualified business asset investment of each CFC with respect to which it is a U.S. shareholder over (2) the amount of certain interest expense taken into account in the determination of net CFC-tested income.
Because of the complexity of the new GILTI tax rules, we are continuing to evaluate this provision of the Tax Act and the application of accounting standards applicable to income taxes. In accordance with accounting standards applicable to income taxes, we are allowed to make an accounting policy choice of either (1) treating taxes due on future U.S. inclusions in taxable income related to GILTI as a current-period expense when incurred (the "period cost method") or (2) factoring such amounts into a company’s measurement of its deferred taxes (the "deferred method"). We selected the period cost method.
Income tax expense or benefit from continuing operations is generally determined without regard to other categories of earnings, such as discontinued operations and other comprehensive income ("OCI"). An exception is provided in the authoritative accounting guidance when there is income from categories other than continuing operations and a loss from continuing operations in the current year. In this case, the tax benefit allocated to continuing operations is the amount by which the loss from continuing operations reduces the tax expense recorded with respect to the other categories of earnings, even when a valuation allowance has been established against the deferred tax assets. In instances where a valuation allowance is established against current year losses, income from other sources, including gain from pension and other postretirement benefits recorded as a component of OCI and creation of a deferred tax liability through additional paid in capital, is considered when determining whether sufficient future taxable income exists to realize the deferred tax assets. As a result, for the year ended January 28, 2017, the Company recorded a tax expense of
$71 million
in OCI related to the net gain on pension and other postretirement benefits, and recorded a corresponding tax benefit of
$71 million
in continuing operations. The Company did not have this situation for the year ended February 3, 2018.
105
SEARS HOLDINGS CORPORATION
Notes to Consolidated Financial Statements—(Continued)
Accounting standards for income taxes require that deferred tax assets and liabilities be recognized using enacted tax rates for the effect of temporary differences between the financial reporting and tax bases of recorded assets and liabilities. Accounting standards also require that deferred tax assets be reduced by a valuation allowance if it is more likely than not that some portion of or all of the deferred tax asset will not be realized.
Management assesses the available positive and negative evidence to estimate if sufficient future taxable income will be generated to use the existing deferred tax assets. A significant piece of objective negative evidence evaluated was the cumulative loss incurred over the
three
-year periods ended
February 3, 2018
,
January 28, 2017
and
January 30, 2016
. Such objective evidence limits the ability to consider other subjective evidence such as our projections for future income.
On the basis of this analysis and the significant negative objective evidence, the Company has a valuation allowance to record only the portion of the deferred tax asset that more likely than not will be realized.
For the year ended
January 30, 2016
, the valuation allowance increased by
$279 million
of which
$63 million
was recorded through other comprehensive income. For the year ended
January 28, 2017
, the valuation allowance increased by
$762 million
of which
$3 million
was recorded through other comprehensive income and paid in capital. For the year ended
February 3, 2018
, the valuation allowance decreased by
$1.3 billion
, primarily due to the reduction of the U.S. corporate tax rate from 35% to 21% and the re-characterization of future net operating losses to indefinite life resulting in a valuation allowance release of
80%
of our remaining indefinite life deferred tax liability. Included within the net decrease in the valuation allowance was an increase of
$62 million
recorded through other comprehensive income.
At
February 3, 2018
and
January 28, 2017
, we had a valuation allowance of
$4.2 billion
and
$5.5 billion
, respectively. The amount of the deferred tax asset considered realizable, however, could be adjusted in the future if estimates of future taxable income during the carryforward period are reduced or increased, or if the objective negative evidence in the form of cumulative losses is no longer present and additional weight may be given to subjective evidence such as our projections for growth. We will continue to evaluate our valuation allowance in future years for any change in circumstances that causes a change in judgment about the realizability of the deferred tax asset.
At the end of 2017 and 2016, respectively, we had a federal and state net operating loss ("NOL") deferred tax asset of
$1.7 billion
and
$2.3 billion
, which will expire predominately between 2019 and 2037. We have credit carryforwards of
$899 million
, which will expire between 2018 and 2037.
In connection with the Craftsman Sale in the first quarter of 2017, the Company realized a tax benefit of
$101 million
on the deferred taxes related to the indefinite-life intangible for the trade name sold to Stanley Black & Decker. In addition, the Company incurred a taxable gain of approximately
$963 million
. There was
no
federal income tax payable resulting from the taxable gain due to the utilization of NOL tax attributes of approximately
$361 million
with a valuation allowance release of the same amount. However, there was state income tax of
$4 million
payable after the utilization of state tax attributes.
In July, 2016, the Company sold shares of an investment for
$106 million
. The sale resulted in a U.S. taxable gain of
$105 million
, but
no
current income tax is payable due to the utilization of NOL attributes of
$37 million
with a valuation allowance release of the same amount.
On July 7, 2015, Holdings completed the Seritage transaction. As part of the transaction, Holdings sold
235
properties to Seritage along with Holdings'
50%
interests in the JVs, which hold an additional
31
properties (See Note 11 for additional information and defined terms).
In connection with the Seritage transaction and the JV transactions, the Company realized a tax benefit of
$229 million
on the deferred taxes related to the indefinite-life assets associated with the property sold. In addition, the Company incurred a taxable gain of approximately
$2.2 billion
, taking into account any related party loss disallowance, on these transactions. There was
no
federal income tax payable resulting from the taxable gain due to the utilization of NOL tax attributes of approximately
$856 million
with a valuation allowance release of the same amount. However, there was a minor amount of state and city income tax payable of
$4 million
after the utilization of state and city tax attributes. As a result of all the effects from the Seritage transaction and the JV transactions in 2015, the impact to the net valuation allowance was a release of approximately
$500 million
.
106
SEARS HOLDINGS CORPORATION
Notes to Consolidated Financial Statements—(Continued)
Accounting for Uncertainties in Income Taxes
We are present in a large number of taxable jurisdictions, and at any point in time, can have audits underway at various stages of completion in any of these jurisdictions. We evaluate our tax positions and establish liabilities for uncertain tax positions that may be challenged by federal, foreign and/or local authorities and may not be fully sustained, despite our belief that the underlying tax positions are fully supportable. Unrecognized tax benefits are reviewed on an ongoing basis and are adjusted in light of changing facts and circumstances, including progress of tax audits, developments in case law, and closing of statute of limitations. Such adjustments are reflected in the tax provision as appropriate. While we do not expect material changes, it is possible that the amount of unrecognized benefit with respect to our uncertain tax positions will significantly increase or decrease within the next 12 months related to the audits described above. At this time, our estimated range of impact on the balance of unrecognized tax benefits for 2018 is a change of
$1 million
to
$14 million
, which would impact the effective tax rate by
$1 million
to
$11 million
. A reconciliation of the beginning and ending amount of gross unrecognized tax benefits ("UTB") is as follows:
|
|
Federal, State and Foreign Tax
|
|||||||||||
|
millions
|
February 3,
2018 |
January 28,
2017 |
January 30, 2016
|
|||||||||
|
Gross UTB Balance at Beginning of Period
|
$
|
142
|
|
$
|
137
|
|
$
|
131
|
|
|||
|
Tax positions related to the current period:
|
|
|
|
|
|
|
||||||
|
Gross increases
|
20
|
|
12
|
|
14
|
|
||||||
|
Gross decreases
|
—
|
|
—
|
|
—
|
|
||||||
|
Tax positions related to prior periods:
|
|
|
|
|
||||||||
|
Gross increases
|
—
|
|
—
|
|
—
|
|
||||||
|
Gross decreases
|
(26
|
)
|
—
|
|
—
|
|
||||||
|
Settlements
|
(1
|
)
|
—
|
|
—
|
|
||||||
|
Lapse of statute of limitations
|
(5
|
)
|
(7
|
)
|
(8
|
)
|
||||||
|
Gross UTB Balance at End of Period
|
$
|
130
|
|
$
|
142
|
|
$
|
137
|
|
|||
At the end of
2017
, we had gross unrecognized tax benefits of
$130 million
. Of this amount,
$103 million
would, if recognized, impact our effective tax rate, with the remaining amount being comprised of unrecognized tax benefits related to indirect tax benefits. During
2017
and
2016
, the gross unrecognized tax benefits increased by
$20 million
and
$12 million
, respectively, due to current year accruals for existing tax positions. We expect that our unrecognized tax benefits could decrease up to
$10 million
over the next 12 months for tax audit settlements and the expiration of the statute of limitations for certain jurisdictions.
We classify interest expense and penalties related to unrecognized tax benefits and interest income on tax overpayments as components of income tax expense. At
February 3, 2018
and
January 28, 2017
, the total amount of interest and penalties recognized within the related tax liability in our Consolidated Balance Sheet was
$51 million
(
$40 million
net of federal benefit) and
$61 million
(
$40 million
net of federal benefit), respectively. The total amount of net interest benefit recognized in our Consolidated Statements of Operations was
$6 million
in 2017. The total amount of net interest expense recognized in our Consolidated Statements of Operations was
$3 million
and
$4 million
in 2016 and 2015, respectively.
We file income tax returns in both the United States and various foreign jurisdictions.
The U.S. Internal Revenue Service ("IRS") has completed its examination of all federal tax returns of Holdings through the 2009 return, and all matters arising from such examinations have been resolved. In addition, Holdings and Sears are under examination by various state, local and foreign income tax jurisdictions for the years 2003 through 2016, and Kmart is under examination by such jurisdictions for the years 2006 through 2016.
107
SEARS HOLDINGS CORPORATION
Notes to Consolidated Financial Statements—(Continued)
Gain on Sales of Assets
We recognized
$1.6 billion
,
$247 million
and
$743 million
in gains on sales of assets during
2017
,
2016
and
2015
, respectively. These gains were primarily a result of several real estate transactions. Real estate transactions in 2017 included properties that served as collateral for our real estate facilities for which proceeds of
$250 million
,
$116 million
and
$55 million
were used to pay interest and a portion of the 2016 Secured Loan Facility, 2017 Secured Loan Facility and Incremental Loans, respectively. Gains in 2017 also included a gain of
$492 million
in connection with the Craftsman Sale, which is further described in Note 1.
Seritage transaction and JV transactions
On April 1, 2015, April 13, 2015, and April 30, 2015, Holdings and General Growth Properties, Inc. ("GGP"), Simon Property Group, Inc. ("Simon") and The Macerich Company ("Macerich"), respectively, announced that they entered into
three
distinct real estate joint ventures (collectively, the "JVs"). Holdings contributed
31
properties to the JVs where Holdings currently operates stores (the "JV properties"), in exchange for a
50%
interest in the JVs and
$429 million
in cash (
$426 million
, net of closing costs) (the "JV transactions"). The JV transactions valued the JV properties at
$858 million
in the aggregate.
On July 7, 2015, Holdings completed its rights offering and sale-leaseback transaction (the "Seritage transaction") with Seritage Growth Properties ("Seritage"), an independent publicly traded real estate investment trust ("REIT"). As part of the Seritage transaction, Holdings sold
235
properties to Seritage (the "REIT properties") along with Holdings'
50%
interest in the JVs. Holdings received aggregate gross proceeds from the Seritage transaction of
$2.7 billion
(
$2.6 billion
, net of closing costs). The Seritage transaction was partially financed through the sale of common shares and limited partnership units, totaling
$1.6 billion
, including
$745 million
received from ESL and its affiliates and
$297 million
received from Fairholme and its affiliates as further described in Note 15. The Seritage transaction valued the REIT properties at
$2.3 billion
in the aggregate.
In connection with the Seritage transaction and JV transactions, Holdings entered into agreements with Seritage and the JVs under which Holdings initially leased
255
of the properties (the "Master Leases"), with the remaining properties being leased by Seritage to third parties. Holdings has closed
19
stores pursuant to recapture notices from Seritage or the JVs and
56
stores pursuant to lease terminations. An additional
11
stores will close in 2018 pursuant to recapture notices from Seritage or the JVs. Also, in July 2017, Seritage sold a
50%
joint venture interest in
five
of the properties and Holdings will pay rent to the new landlord.
We accounted for the Seritage transaction and JV transactions in accordance with accounting standards applicable to real estate sales and sale-leaseback transactions. We determined that the Seritage transaction qualifies for sales recognition and sale-leaseback accounting. Because of our initial ownership interest in the JVs and continuing involvement in the properties, we determined that the JV transactions, which occurred in the first quarter of 2015, did not initially qualify for sale-leaseback accounting and, therefore, accounted for the JV transactions as financing transactions and, accordingly, recorded a sale-leaseback financing obligation of
$426 million
and continued to report the real property assets on our Condensed Consolidated Balance Sheets at May 2, 2015. Upon the sale of our
50%
interest in the JVs to Seritage, the continuing involvement through an ownership interest in the buyer-lessor no longer existed, and Holdings determined that the JV transactions then qualified for sales recognition and sale-leaseback accounting, with the exception of
four
properties for which we had continuing involvement as a result of an obligation to redevelop the stores for a third-party tenant and pay rent on behalf of the third-party tenant until it commences rent payments to the JVs.
With the exception of the
four
properties that had continuing involvement, in accordance with accounting standards related to sale-leaseback transactions, Holdings recognized any loss on sale immediately, any gain on sale in excess of the present value of minimum lease payments immediately, and any remaining gain was deferred and will be recognized in proportion to the related rent expense over the lease term. Holdings received aggregate net proceeds of
$3.1 billion
for the Seritage transaction and JV transactions. The carrying amount of property and equipment, net and lease balances related to third-party leases that were assigned to Seritage and the JVs was
$1.5 billion
at July 7, 2015, of which
$1.3 billion
was recorded in our Sears Domestic segment and
$175 million
in our Kmart segment. Accordingly, during the second quarter of 2015, Holdings recognized an immediate net gain of
$508
108
SEARS HOLDINGS CORPORATION
Notes to Consolidated Financial Statements—(Continued)
million
within gain on sales of assets in the Consolidated Statements of Operations for 2015, comprised of a gain for the amount of gain on sale in excess of the present value of minimum lease payments, offset by a loss for properties where the fair value was less than the carrying value and the write-off of lease balances related to third-party leases that were assigned to Seritage and the JVs, as shown in the table below.
|
2015
|
|||||||||||
|
millions
|
Kmart
|
Sears Domestic
|
Sears Holdings
|
||||||||
|
Gain
|
$
|
154
|
|
$
|
471
|
|
$
|
625
|
|
||
|
Loss
|
(17
|
)
|
(100
|
)
|
(117
|
)
|
|||||
|
Immediate Net Gain
|
$
|
137
|
|
$
|
371
|
|
$
|
508
|
|
||
The remaining gain of
$894 million
was deferred and will be recognized in proportion to the related rent expense, which is a component of cost of sales, buying and occupancy, in the Consolidated Statements of Operations, over the lease term.
During
2017
and
2016
, respectively, Holdings recorded gains of
$253 million
and
$72 million
related to recapture and termination activity in connection with REIT properties and JV properties. The Master Leases provide Seritage and the JVs rights to recapture
100%
of certain stores. The Master Leases also provide Seritage and the JVs a recapture right with respect to approximately
50%
of the space within the stores at the REIT properties and JV properties (subject to certain exceptions), in addition to all of the automotive care centers, all outparcels or outlots, and certain portions of parking areas and common areas, except as set forth in the Master Leases, for no additional consideration. As space is recaptured pursuant to the recapture right, Holdings' obligation to pay rent is reduced proportionately. Accordingly, Holdings recognizes gains equal to the unamortized portion of the gain that had previously been deferred which exceeds the present value of minimum lease payments, as reduced due to recapture activity. The Master Leases also provide Holdings certain rights to terminate the Master Leases with respect to REIT properties or JV properties that cease to be profitable for operation. In order to terminate the Master Lease for a certain property, Holdings must make a payment to Seritage or the JV of an amount equal to
one
year of rent (together with taxes and other expenses) with respect to such property. The Company recognizes the corresponding expenses for termination payments to Seritage when we notify Seritage of our intention to terminate the leases and the stores are announced for closure. We recorded expense of
$24 million
and
$21 million
for termination payments to Seritage in
2017
and
2016
, respectively, of which
$11 million
was reported as an amount payable to Seritage at January 28, 2017.
Holdings also recorded immediate gains of
$40 million
during the 2017, for the amount of gains on sale in excess of the present value of minimum lease payments for
two
of the properties that were previously accounted for as financing transactions. As the redevelopment at the stores had been completed and the third-party tenant had commenced rent payments to the JVs, the Company determined that the continuing involvement no longer existed and that the properties qualified for sales recognition and sale-leaseback accounting.
Sale-leaseback financing transactions
Holdings received cash proceeds for sale-leaseback financing transactions of
$106 million
,
$71 million
and
$508 million
in
2017
,
2016
and
2015
, respectively, including the Seritage transaction and JV transactions in 2015, as further described above. We accounted for the other transactions as financing transactions in accordance with accounting standards applicable to sale-leaseback transactions as a result of other forms of continuing involvement, including an earn-out provision and the requirement to prepay rent for
one
year. Accordingly, Holdings recorded a sale-leaseback financing obligation of
$247 million
and
$235 million
, at
February 3, 2018
and
January 28, 2017
, respectively, which is classified as a long-term sale-leaseback financing obligation in the Consolidated Balance Sheets. The sale-leaseback financing obligation related to the
four
properties that had continuing involvement decreased to
$70 million
at February 3, 2018 as
two
of the properties qualified for sales recognition and sale-leaseback accounting as further described above. We continued to report real property assets of
$66 million
and
$96 million
at
February 3, 2018
and
January 28, 2017
, respectively, in our Consolidated Balance Sheets, which are included in our Sears Domestic segment. The obligation for future minimum lease payments at
February 3, 2018
is
$59 million
over the lease terms, and
$6 million
in 2018,
$11 million
in 2019,
$9 million
in 2020,
$6 million
in
109
SEARS HOLDINGS CORPORATION
Notes to Consolidated Financial Statements—(Continued)
2021,
$6 million
in 2022 and
$21 million
thereafter, excluding
$6 million
was that was prepaid upon closing the transactions.
Other real estate transactions
In addition to the Seritage transaction, JV transactions and other sale-leaseback financing transactions described above, we recorded gains on the sales of assets for other items described as follows.
During 2017, we recorded gains on the sales of assets of
$544 million
recognized on the sale or amendment and lease termination of
48
Sears Full-line stores and
four
non-retail locations in our Sears Domestic segment for which we received
$711 million
cash proceeds. During 2017, we also recorded gains on the sales of assets of
$164 million
recognized on the sale or amendment and lease termination of
41
Kmart stores and
two
non-retail locations in our Kmart segment for which we received
$190 million
cash proceeds.
During 2016, we recorded gains on the sales of assets of
$15 million
recognized on the sale of
two
Sears Full-line stores for which we received
$27 million
of cash proceeds,
$12 million
recognized on the sale of
one
distribution center for which we received
$23 million
of cash proceeds and
$10 million
on the sale of
one
Kmart store for which we received
$10 million
of cash proceeds.
During 2015, we recorded gains on the sales of assets of
$83 million
recognized on the sale of
one
Sears Full-line store for which we received
$102 million
of cash proceeds,
$90 million
of which was received during the third quarter of 2014. As the leaseback ended and the remaining cash proceeds of
$12 million
were received during 2015, we recognized the gain that had previously been deferred. We also recorded gains on the sales of assets of
$86 million
recognized on the sale of
two
Sears Full-line stores for which we received
$96 million
of cash proceeds, and
$10 million
recognized on the surrender and early termination of
one
Kmart store lease.
Certain sales of our properties had leaseback arrangements. We determined that the transactions with leaseback arrangements qualify for sales recognition and sale-leaseback accounting. In accordance with accounting standards related to sale-leaseback transactions, Holdings recognized any loss on sale immediately, any gain on sale in excess of the present value of minimum lease payments immediately, and any remaining gain was deferred and will be recognized in proportion to the related rent expense over the lease term. At
February 3, 2018
and
January 28, 2017
, respectively,
$138 million
and
$132 million
of the deferred gain on sale-leaseback is classified as current within other current liabilities, and
$362 million
and
$563 million
is classified as long-term deferred gain on sale-leaseback in the Consolidated Balance Sheets. For the other transactions, we determined that we have surrendered substantially all of our rights and obligations, and, therefore, immediate gain recognition is appropriate.
Holdings recorded rent expense in connection with sale-lease back transactions with gains that were initially deferred and are being recognized in proportion to the related rent expense over the lease term of
$82 million
,
$96 million
and
$68 million
in
2017
,
2016
and
2015
, respectively, in cost of sales, buying and occupancy in the Consolidated Statements of Operations. Rent expense consisted of straight-line rent expense offset by amortization of a deferred gain on sale-leaseback, as shown in the table below.
|
2017
|
2016
|
2015
|
|||||||||||||||||||||||||||||||||
|
millions
|
Kmart
|
Sears Domestic
|
Sears Holdings
|
Kmart
|
Sears Domestic
|
Sears Holdings
|
Kmart
|
Sears Domestic
|
Sears Holdings
|
||||||||||||||||||||||||||
|
Straight-line rent expense
|
$
|
20
|
|
$
|
140
|
|
$
|
160
|
|
$
|
32
|
|
$
|
152
|
|
$
|
184
|
|
$
|
20
|
|
$
|
100
|
|
$
|
120
|
|
||||||||
|
Amortization of deferred gain on sale-leaseback
|
(11
|
)
|
(67
|
)
|
(78
|
)
|
(17
|
)
|
(71
|
)
|
(88
|
)
|
(11
|
)
|
(41
|
)
|
(52
|
)
|
|||||||||||||||||
|
Rent expense
|
$
|
9
|
|
$
|
73
|
|
$
|
82
|
|
$
|
15
|
|
$
|
81
|
|
$
|
96
|
|
$
|
9
|
|
$
|
59
|
|
$
|
68
|
|
||||||||
110
SEARS HOLDINGS CORPORATION
Notes to Consolidated Financial Statements—(Continued)
The following summarizes our intangible assets at
February 3, 2018
and
January 28, 2017
, respectively, the amortization expenses recorded for the years then ended, as well as our estimated amortization expense for the next five years and thereafter.
|
|
February 3, 2018
|
January 28, 2017
|
||||||||||||||
|
millions
|
Gross
Carrying Amount |
Accumulated
Amortization |
Gross
Carrying Amount |
Accumulated
Amortization |
||||||||||||
|
Amortizing intangible assets:
|
|
|
|
|
||||||||||||
|
Favorable lease rights
|
$
|
121
|
|
$
|
44
|
|
$
|
143
|
|
$
|
52
|
|
||||
|
Non-amortizing intangible assets:
|
|
|
|
|
|
|
|
|
||||||||
|
Trade names
|
1,091
|
|
—
|
|
1,430
|
|
—
|
|
||||||||
|
Total
|
$
|
1,212
|
|
$
|
44
|
|
$
|
1,573
|
|
$
|
52
|
|
||||
|
Annual Amortization Expense
|
|
||
|
2017
|
$
|
4
|
|
|
2016
|
5
|
|
|
|
2015
|
7
|
|
|
|
Estimated Amortization
|
|
||
|
2018
|
$
|
3
|
|
|
2019
|
3
|
|
|
|
2020
|
3
|
|
|
|
2021
|
3
|
|
|
|
2022
|
3
|
|
|
|
Thereafter
|
56
|
|
|
Goodwill is the excess of the purchase price over the fair value of the net assets acquired in business combinations accounted for under the purchase method. Goodwill is recorded at Sears Domestic and had a balance of
$269 million
at both
February 3, 2018
and
January 28, 2017
.
As described in Summary of Significant Accounting Policies in Note 1, goodwill and indefinite-lived intangible assets are not amortized but require testing for potential impairment, at a minimum on an annual basis, or when indications of potential impairment exist. As a result of our annual testing of indefinite-lived intangible assets, we recorded impairment related to the Sears trade name of
$72 million
,
$381 million
and
$180 million
in 2017, 2016 and 2015, respectively, which reduced the carrying value to
$359 million
at
February 3, 2018
and
$431 million
at
January 28, 2017
. The impairment is recorded at Sears Domestic and included within impairment charges on our Consolidated Statements of Operations.
Store Closings and Severance
During
2017
,
2016
and
2015
, respectively, we closed
303
,
206
and
38
stores in our Kmart segment and
123
,
37
and
12
stores in our Sears Domestic segment. An additional
66
stores in our Kmart segment and
40
stores in our Sears Domestic segment will close during the first quarter of 2018 that we previously announced would close. We also made the decision to close
one
domestic supply chain distribution center in our Sears Domestic segment during 2016.
111
SEARS HOLDINGS CORPORATION
Notes to Consolidated Financial Statements—(Continued)
In accordance with accounting standards governing costs associated with exit or disposal activities, expenses related to future rent payments for which we no longer intend to receive any economic benefit are accrued for when we cease to use the leased space and have been reduced for any estimated sublease income. We expect to record additional charges of approximately
$55 million
during 2018 related to stores we had previously made the decision to close, but have not yet closed.
Store closing costs and severance recorded for
2017
,
2016
and
2015
were as follows:
|
millions
|
Markdowns
(1)
|
Severance Costs
(2)
|
Lease Termination Costs
(2)
|
Other Charges
(2)
|
Impairment and Accelerated Depreciation
(3)
|
Total
Store Closing Costs
|
|||||||||||||||||
|
Kmart
|
$
|
154
|
|
$
|
25
|
|
$
|
80
|
|
$
|
22
|
|
$
|
19
|
|
$
|
300
|
|
|||||
|
Sears Domestic
|
73
|
|
58
|
|
40
|
|
10
|
|
21
|
|
202
|
|
|||||||||||
|
Total 2017 costs
|
$
|
227
|
|
$
|
83
|
|
$
|
120
|
|
$
|
32
|
|
$
|
40
|
|
$
|
502
|
|
|||||
|
Kmart
|
$
|
187
|
|
$
|
28
|
|
$
|
71
|
|
$
|
32
|
|
$
|
13
|
|
$
|
331
|
|
|||||
|
Sears Domestic
|
39
|
|
13
|
|
5
|
|
9
|
|
7
|
|
73
|
|
|||||||||||
|
Total 2016 costs
|
$
|
226
|
|
$
|
41
|
|
$
|
76
|
|
$
|
41
|
|
$
|
20
|
|
$
|
404
|
|
|||||
|
Kmart
|
$
|
39
|
|
$
|
16
|
|
$
|
21
|
|
$
|
10
|
|
$
|
1
|
|
$
|
87
|
|
|||||
|
Sears Domestic
|
5
|
|
21
|
|
(15
|
)
|
1
|
|
2
|
|
14
|
|
|||||||||||
|
Total 2015 costs
|
$
|
44
|
|
$
|
37
|
|
$
|
6
|
|
$
|
11
|
|
$
|
3
|
|
$
|
101
|
|
|||||
_____________
|
(1)
|
Recorded within cost of sales, buying and occupancy in the Consolidated Statements of Operations.
|
|
(2)
|
Recorded within selling and administrative in the Consolidated Statements of Operations. Lease termination costs are net of estimated sublease income, and include the reversal of closed store reserves for which the lease agreement has been terminated and the reversal of deferred rent balances related to closed stores.
|
|
(3)
|
2017, 2016 and 2015 costs are recorded within depreciation and amortization on the Consolidated Statements of Operations.
|
Store closing cost accruals of
$261 million
,
$216 million
and
$180 million
at
February 3, 2018
,
January 28, 2017
and
January 30, 2016
, respectively, were as shown in the table below. Store closing accruals included
$126 million
,
$122 million
and
$81 million
within other current liabilities and
$135 million
,
$94 million
and
$99 million
within other long-term liabilities in the Consolidated Balance Sheets at
February 3, 2018
,
January 28, 2017
and
January 30, 2016
, respectively.
|
millions
|
Severance
Costs
|
Lease
Termination
Costs
|
Other
Charges
|
Total
|
|||||||||||
|
Balance at January 30, 2016
|
$
|
58
|
|
$
|
114
|
|
$
|
8
|
|
$
|
180
|
|
|||
|
Store closing costs
|
41
|
|
85
|
|
41
|
|
167
|
|
|||||||
|
Payments/utilizations/other
|
(45
|
)
|
(55
|
)
|
(31
|
)
|
(131
|
)
|
|||||||
|
Balance at January 28, 2017
|
54
|
|
144
|
|
18
|
|
216
|
|
|||||||
|
Store closing costs
|
83
|
|
162
|
|
32
|
|
277
|
|
|||||||
|
Store closing capital lease obligations
|
—
|
|
33
|
|
—
|
|
33
|
|
|||||||
|
Payments/utilizations/other
|
(88
|
)
|
(139
|
)
|
(38
|
)
|
(265
|
)
|
|||||||
|
Balance at February 3, 2018
|
$
|
49
|
|
$
|
200
|
|
$
|
12
|
|
$
|
261
|
|
|||
112
SEARS HOLDINGS CORPORATION
Notes to Consolidated Financial Statements—(Continued)
Impairment of Long-Lived Assets
As described in the Summary of Significant Accounting Policies in Note 1, we performed impairment tests of certain of our long-lived assets during
2017
,
2016
and
2015
(principally the value of land, buildings and other fixed assets associated with our stores). As a result of this impairment testing, the Company recorded impairment charges as shown in the table below.
|
millions
|
2017
|
2016
|
2015
|
||||||||
|
Kmart
|
$
|
16
|
|
$
|
22
|
|
$
|
14
|
|
||
|
Sears Domestic
|
54
|
|
24
|
|
80
|
|
|||||
|
Sears Holdings
|
$
|
70
|
|
$
|
46
|
|
$
|
94
|
|
||
We lease certain stores, office facilities, warehouses, computers and transportation equipment.
Operating and capital lease obligations are based upon contractual minimum rents and, for certain stores, amounts in excess of these minimum rents are payable based upon specified percentages of sales. Contingent rent is accrued over the lease term, provided that the achievement of the specified sales level that triggers the contingent rental is probable. Certain leases include renewal or purchase options.
Rental expense for operating leases was as follows:
|
millions
|
2017
|
2016
|
2015
|
|||||||||
|
Minimum rentals
|
$
|
666
|
|
$
|
739
|
|
$
|
713
|
|
|||
|
Percentage rentals
|
5
|
|
7
|
|
8
|
|
||||||
|
Less-Sublease rentals
|
(43
|
)
|
(51
|
)
|
(46
|
)
|
||||||
|
Less-Amortization of deferred gain on sale-leaseback
|
(78
|
)
|
(88
|
)
|
(52
|
)
|
||||||
|
Total
|
$
|
550
|
|
$
|
607
|
|
$
|
623
|
|
|||
Minimum lease obligations, excluding taxes, insurance and other expenses payable directly by us, for leases in effect at
February 3, 2018
, were as follows:
|
|
Minimum Lease Commitments
|
|||||||
|
millions
|
Capital
|
Operating
|
||||||
|
2018
|
$
|
28
|
|
$
|
537
|
|
||
|
2019
|
15
|
|
439
|
|
||||
|
2020
|
6
|
|
368
|
|
||||
|
2021
|
4
|
|
297
|
|
||||
|
2022
|
4
|
|
237
|
|
||||
|
Later years
|
58
|
|
961
|
|
||||
|
Total minimum lease payments
|
115
|
|
2,839
|
|
||||
|
Less minimum sublease income
|
|
|
(92
|
)
|
||||
|
Net minimum lease payments
|
|
|
$
|
2,747
|
|
|||
|
Less:
|
|
|
|
|
||||
|
Estimated executory costs
|
(4
|
)
|
|
|
||||
|
Interest at a weighted average rate of 4.9%
|
(39
|
)
|
|
|
||||
|
Capital lease obligations
|
72
|
|
|
|
||||
|
Less current portion of capital lease obligations
|
(22
|
)
|
|
|
||||
|
Long-term capital lease obligations
|
$
|
50
|
|
|
|
|||
113
SEARS HOLDINGS CORPORATION
Notes to Consolidated Financial Statements—(Continued)
Mr. Lampert is our Chief Executive Officer and Chairman of our Board of Directors. Mr. Lampert is also the Chairman and Chief Executive Officer of ESL. ESL owned approximately
49%
of our outstanding common stock at
February 3, 2018
(excluding shares of common stock that ESL may acquire within
60
days upon the exercise of warrants to purchase shares of our common stock).
Bruce R. Berkowitz was a member of our Board of Directors from February 2016 through October 2017. Mr. Berkowitz serves as the Chief Investment Officer of Fairholme Capital Management, LLC, an investment adviser registered with the SEC, and is the President and a Director of Fairholme Funds, Inc., a SEC-registered investment company providing investment management services to
three
mutual funds (together with Fairholme Capital Management, LLC and other affiliates, "Fairholme"). Fairholme owned approximately
18%
of our outstanding common stock at
February 3, 2018
(excluding shares of common stock that Fairholme may acquire within
60
days upon the exercise of warrants to purchase shares of our common stock).
Thomas J. Tisch has been an independent member of our Board of Directors since 2005. Mr. Tisch owned approximately
3%
of our outstanding common stock at
February 3, 2018
.
Unsecured Commercial Paper
During
2017
and
2016
, ESL and its affiliates held unsecured commercial paper issued by SRAC, an indirect wholly-owned subsidiary of Holdings. For the commercial paper outstanding to ESL, the weighted average of each of maturity, annual interest rate, and principal amount outstanding for this commercial paper was
8
days,
8.22%
and
$28 million
and
21
days,
7.87%
and
$100 million
, respectively, in
2017
and
2016
. The largest aggregate amount of principal outstanding to ESL at any time since the beginning of
2017
was
$160 million
and
$3 million
of interest was paid by SRAC to ESL during
2017
.
During
2016
, Fairholme and its affiliates held unsecured commercial paper issued by SRAC. For the commercial paper outstanding to Fairholme, the weighted average of each of maturity, annual interest rate, and principal amount outstanding for this commercial paper was
63
days,
7.42%
and
$1 million
in
2016
.
The commercial paper purchases were made in the ordinary course of business on substantially the same terms, including interest rates, as terms prevailing for comparable transactions with other persons, and did not present features unfavorable to the Company.
Secured Short-Term Loan
In September 2014, the Company, through the Short-Term Borrowers, entities wholly-owned and controlled, directly or indirectly by the Company, entered into the
$400 million
Short-Term Loan with the Short-Term Lender, entities affiliated with ESL and Fairholme. The Company repaid the Short-Term Loan during 2015, resulting in
no
balance outstanding at
February 3, 2018
or
January 28, 2017
. See Note 3 for additional information regarding the Short-Term Loan.
LC Facility
On December 28, 2016, the Company, through the Borrowers, entered into the LC Facility, which was subsequently amended in August 2017, and which provides for the amended LC Facility. At
February 3, 2018
, and
January 28, 2017
, we had
$271 million
and
$200 million
, respectively, of letters of credit outstanding under the LC Facility, which amounts were initially committed by entities affiliated with ESL, and the Lenders under the LC Facility maintain cash collateral on deposit with the Issuing Bank of
$133 million
and
$204 million
at
February 3, 2018
and
January 28, 2017
, respectively. As of
February 3, 2018
,
$138 million
of the amount originally committed by entities affiliated with ESL under the LC Facility has been syndicated to unaffiliated third party lenders. See Note 3 for additional information regarding the LC Facility, as amended.
Term Loan Facility
On January 4, 2018, the Company, through the Borrowers, obtained a
$300 million
loan facility from the Lenders, entities affiliated with ESL. At
February 3, 2018
, JPP LLC and JPP II, LLC, entities affiliated with ESL,
114
SEARS HOLDINGS CORPORATION
Notes to Consolidated Financial Statements—(Continued)
held
$151 million
of principal amount of the Term Loan Facility. See Note 3 for additional information regarding the Term Loan Facility.
2017 Secured Loan Facility
On January 3, 2017, the Company, through the 2017 Secured Loan Borrowers, obtained a
$500 million
real estate loan facility from the Lenders, entities affiliated with ESL. At
February 3, 2018
and
January 28, 2017
, JPP LLC and JPP II, LLC, entities affiliated with ESL, held
$384 million
and
$500 million
of principal amount of the 2017 Secured Loan Facility, respectively. Approximately
$116 million
of proceeds received from real estate transactions were used to reduce outstanding borrowings under the 2017 Secured Loan Facility, all of which were repaid to entities affiliated with ESL. During October 2017, the Company, through the Incremental Loan Borrowers, obtained Incremental Loans totaling
$200 million
from the Lenders. At
February 3, 2018
, JPP LLC and JPP II, LLC, held
$145 million
of principal amount of the Incremental Loans. Approximately
$55 million
of proceeds received from real estate transactions were used to reduce outstanding borrowings under the Incremental Loans, all of which were repaid to entities affiliated with ESL. See Note 3 for additional information regarding the 2017 Secured Loan Facility and Incremental Loans.
2016 Secured Loan Facility
In April 2016, the Company, through the 2016 Secured Loan Borrowers, obtained a
$500 million
real estate loan facility from the 2016 Secured Loan Lenders, some of which are entities affiliated with ESL. At
February 3, 2018
and
January 28, 2017
, entities affiliated with ESL held
$126 million
and
$216 million
, respectively, of principal amount of the 2016 Secured Loan Facility. Proceeds received from real estate transactions were used to reduce outstanding borrowings under the 2016 Secured Loan Facility, of which
$89 million
was repaid to entities affiliated with ESL. See Note 3 for additional information regarding the 2016 Secured Loan Facility, as amended.
2016 Term Loan
In April 2016, the Company, through the ABL Borrowers, obtained a
$750 million
senior secured term loan under the Amended Domestic Credit Agreement with a syndicate of lenders, including
$146 million
(net of original issue discount) from JPP, LLC and JPP II, LLC, entities affiliated with ESL, and
$100 million
from the Company's domestic pension plans. At
February 3, 2018
, JPP LLC and JPP II, LLC, and the Company's domestic pension plans held
$38 million
and
$77 million
, respectively, of principal amount of the 2016 Term Loan. At
January 28, 2017
, JPP LLC and JPP II, LLC, and the Company's domestic pension plans held
$150 million
and
$100 million
, respectively, of principal amount of the 2016 Term Loan. As disclosed in Note 3, a portion of the proceeds received from the Craftsman Sale were used to reduce outstanding borrowings under the 2016 Term Loan, of which
$36 million
and
$24 million
was repaid to JPP LLC and JPP II, LLC, and the Company's domestic pension plans, respectively. See Note 3 for additional information regarding the 2016 Term Loan.
Second Lien Credit Agreement
In September 2016, the Company, through the ABL Borrowers, obtained a
$300 million
Second Lien Term Loan from the Lenders, entities affiliated with ESL. At both
February 3, 2018
and
January 28, 2017
, JPP LLC and JPP II, LLC, held
$300 million
of principal amount of the Second Lien Term Loan.
Additionally, as further discussed in Note 3, in July 2017, the Company amended its Second Lien Credit Agreement to create an additional Line of Credit Facility. The Company received
$610 million
in net proceeds from Line of Credit Loans during 2017, including
$480 million
,
$25 million
and
$20 million
from ESL and its affiliates, Mr. Berkowitz and his affiliates, and Mr. Tisch and his affiliates, respectively, which also represents the principal amount of Line of Credit Loans held by ESL and its affiliates and Mr. Tisch and his affiliates at
February 3, 2018
. The Company made repayments of
$25 million
during 2017 to Mr. Berkowitz and his affiliates. See Note 3 for additional information regarding the Second Lien Credit Agreement, as amended.
115
SEARS HOLDINGS CORPORATION
Notes to Consolidated Financial Statements—(Continued)
Old Senior Secured Notes
At
February 3, 2018
and
January 28, 2017
, Mr. Lampert and ESL held an aggregate of approximately
$20 million
and
$11 million
, respectively, of principal amount of the Company's Old Senior Secured Notes. Mr. Lampert and ESL tendered approximately
$165 million
of the Company's Old Senior Secured Notes in the Offer, which is further discussed in Note 3.
At
January 28, 2017
, Fairholme held an aggregate of approximately
$46 million
of principal amount of the Company's Old Senior Secured Notes, respectively. Fairholme tendered approximately
$207 million
of the Company's Old Senior Secured Notes in the Tender Offer, which is further discussed in Note 3.
Subsidiary Notes
At
January 28, 2017
, Mr. Lampert and ESL held an aggregate of
$3 million
of principal amount of unsecured notes issued by SRAC (the "Subsidiary Notes").
At
February 3, 2018
and
January 28, 2017
, Fairholme held an aggregate of
$9 million
and
$14 million
, respectively, of principal amount of the Subsidiary Notes.
Old Senior Unsecured Notes and Warrants
At both
February 3, 2018
and
January 28, 2017
, Mr. Lampert and ESL held an aggregate of approximately
$188 million
of principal amount of the Company's Old Senior Unsecured Notes, and
10,033,472
warrants to purchase shares of Holdings' common stock at both
February 3, 2018
and
January 28, 2017
.
At
February 3, 2018
and
January 28, 2017
, respectively, Fairholme held an aggregate of approximately
$336 million
and
$357 million
of principal amount of the Company's Old Senior Unsecured Notes, and
5,768,185
and
6,713,725
warrants to purchase shares of Holdings' common stock.
At both
February 3, 2018
and
January 28, 2017
, Mr. Tisch held an aggregate of approximately
$10 million
of principal amount of the Company's Old Senior Unsecured Notes, and
136,272
warrants to purchase shares of Holdings' common stock.
Sears Canada
ESL owns approximately
45%
of the outstanding common shares of Sears Canada (based on publicly available information as of
July 27, 2017
).
Lands' End
ESL owns approximately
67%
of the outstanding common stock of Lands' End (based on publicly available information as of
January 24, 2018
). Holdings and certain of its subsidiaries entered into a transition services agreement in connection with the spin-off pursuant to which Lands' End and Holdings agreed to provide, on an interim, transitional basis, various services, including but not limited to, tax services, logistics services, auditing and compliance services, inventory management services, information technology services and continued participation in certain contracts shared with Holdings and its subsidiaries, as well as agreements related to Lands' End Shops at Sears and participation in the Shop Your Way program. The majority of the services under the transition services agreement with Lands' End have expired or been terminated. In July 2016, the Company and Lands' End executed an agreement pursuant to which the Company will provide foreign buying office support and sourcing services to Lands' End. The agreement expires on June 30, 2020.
Amounts due to or from Lands' End are non-interest bearing, and generally settled on a net basis. Holdings invoices Lands' End on at least a monthly basis. At
February 3, 2018
, Holdings reported a net amount receivable from Lands' End of
$1 million
within accounts receivable in the Consolidated Balance Sheets. At
January 28, 2017
, Holdings reported a net amount payable to Lands' End of
$1 million
within other current liabilities in the Consolidated Balance Sheets. Amounts related to revenue from retail services and rent for Lands' End Shops at Sears, participation in the Shop Your Way program and corporate shared services were
$60 million
,
$65 million
and
$69 million
, respectively, during
2017
,
2016
and
2015
. The amounts Lands' End earned related to call center services and commissions were
$2 million
,
$10 million
and
$10 million
, respectively, during
2017
,
2016
and
2015
.
116
SEARS HOLDINGS CORPORATION
Notes to Consolidated Financial Statements—(Continued)
SHO
ESL owns approximately
58%
of the outstanding common stock of SHO (based on publicly available information as of
November 8, 2017
). Holdings and certain of its subsidiaries engage in transactions with SHO pursuant to various agreements with SHO which, among other things: (1) govern the principal transactions relating to the rights offering and certain aspects of our relationship with SHO following the separation; (2) establish terms under which Holdings and certain of its subsidiaries will provide SHO with services; and (3) establish terms pursuant to which Holdings and certain of its subsidiaries will obtain merchandise for SHO.
These agreements were originally made in the context of a parent-subsidiary relationship and were negotiated in the overall context of the separation. In May 2016, the Company and SHO agreed to changes to a number of their related agreements, including extending the merchandise and services agreement until February 1, 2020.
A summary of the nature of related party transactions involving SHO is as follows:
|
•
|
SHO obtains a significant amount of its merchandise from the Company. We have also entered into certain agreements with SHO to provide logistics, handling, warehouse and transportation services. SHO also pays a royalty related to the sale of Kenmore, Craftsman and DieHard products and fees for participation in the Shop Your Way program.
|
|
•
|
SHO receives commissions from the Company for the sale of merchandise made through www.sears.com, extended service agreements, delivery and handling services and credit revenues.
|
|
•
|
The Company provides SHO with shared corporate services. These services include accounting and finance, human resources and information technology.
|
Amounts due to or from SHO are non-interest bearing, settled on a net basis, and have payment terms of
10
days after the invoice date. The Company invoices SHO on a weekly basis. At
February 3, 2018
and
January 28, 2017
, Holdings reported a net amount receivable from SHO of
$28 million
and
$81 million
, respectively, within accounts receivable in the Consolidated Balance Sheets. Amounts related to the sale of inventory and related services, royalties, and corporate shared services were
$1.0 billion
,
$1.2 billion
and
$1.5 billion
, respectively, during
2017
,
2016
and
2015
. The net amounts SHO earned related to commissions were
$66 million
,
$82 million
and
$91 million
, respectively, during
2017
,
2016
and
2015
. Additionally, the Company has guaranteed lease obligations for certain SHO store leases that were assigned as a result of the separation. See Note 4 for further information related to these guarantees.
Also in connection with the separation, the Company entered into an agreement with SHO and the agent under SHO's secured credit facility, whereby the Company committed to continue to provide services to SHO in connection with a realization on the lender's collateral after default under the secured credit facility, notwithstanding SHO's default under the underlying agreement with us, and to provide certain notices and services to the agent, for so long as any obligations remain outstanding under the secured credit facility.
Seritage
ESL owns approximately
7.2%
of the total voting power of Seritage, and approximately
43.5%
of the limited partnership units of Seritage Growth Properties, L.P. (the "Operating Partnership"), the entity that now owns the properties sold by the Company in the Seritage transaction and through which Seritage conducts its operations (based on publicly available information as of
December 27, 2017
). Mr. Lampert is also currently the Chairman of the Board of Trustees of Seritage. Fairholme owns approximately
11%
of the outstanding Class A common shares of Seritage and
100%
of the outstanding Class C non-voting common shares of Seritage (based on publicly available information as of
February 14, 2018
).
In connection with the Seritage transaction as described in Note 11, Holdings entered into the Master Leases with Seritage. The initial amount of aggregate annual base rent under the Master Leases is
$134 million
for the REIT properties, with increases of
2%
per year beginning in the second lease year. At February 3, 2018, Holdings reported prepaid rent of
$6 million
within prepaid expenses and other current assets in the Consolidated Balance Sheets. Holdings recorded rent expense of
$70 million
,
$83 million
and
$49 million
in cost of sales, buying and occupancy for
2017
,
2016
and
2015
, respectively. Rent expense consists of straight-line rent expense of
$117 million
,
$142
117
SEARS HOLDINGS CORPORATION
Notes to Consolidated Financial Statements—(Continued)
million
and
$84 million
, offset by amortization of a deferred gain recognized pursuant to the sale and leaseback of properties from Seritage of
$47 million
,
$59 million
and
$35 million
for
2017
,
2016
and
2015
, respectively.
In addition to base rent under the Master Leases, Holdings pays monthly installment expenses for property taxes and insurance at all REIT properties where Holdings is a tenant and installment expenses for common area maintenance, utilities and other operating expenses at REIT properties that are multi-tenant locations where Holdings and other third parties are tenants. The initial amount of aggregate installment expenses under the Master Leases was
$70 million
, based on estimated installment expenses, and currently is
$41 million
as a result of recapture activity and reconciling actual installment expenses. Holdings paid
$43 million
,
$64 million
and
$40 million
for
2017
,
2016
and
2015
, respectively, recorded in cost of sales, buying and occupancy.
At
February 3, 2018
and
January 28, 2017
, respectively, Holdings reported an amount receivable from Seritage of
$1 million
and
$14 million
within accounts receivable in the Consolidated Balance Sheets. Holdings reported an amount payable to Seritage of
$11 million
within other current liabilities in the Consolidated Balance Sheets at January 28, 2017.
Other long-term liabilities at
February 3, 2018
and
January 28, 2017
consisted of the following:
|
millions
|
February 3,
2018 |
January 28,
2017 |
|||||
|
Unearned revenues
|
$
|
539
|
|
$
|
639
|
|
|
|
Self-insurance reserves
|
491
|
|
535
|
|
|||
|
Other
|
437
|
|
467
|
|
|||
|
Total
|
$
|
1,467
|
|
$
|
1,641
|
|
|
The Company sells service contracts that provide for preventative maintenance and repair/replacement coverage on consumer products over periods of time ranging from
12
to
144
months. Revenues from the sale of service contracts, and the related direct acquisition costs, are deferred and amortized on a straight-line basis over the lives of the associated contracts, while the associated service costs are expensed as incurred. The table below shows activity related to unearned revenues for service contracts, which are recorded within unearned revenues and other long-term liabilities in the Consolidated Balance Sheets.
|
millions
|
Unearned Revenues
|
||
|
Balance at January 30, 2016
|
$
|
1,405
|
|
|
Sales of service contracts
|
855
|
|
|
|
Revenue recognized on existing service contracts
|
(961
|
)
|
|
|
Balance at January 28, 2017
|
1,299
|
|
|
|
Sales of service contracts
|
691
|
|
|
|
Revenue recognized on existing service contracts
|
(876
|
)
|
|
|
Balance at February 3, 2018
|
$
|
1,114
|
|
118
SEARS HOLDINGS CORPORATION
Notes to Consolidated Financial Statements—(Continued)
These reportable segment classifications are based on our business formats, as described in Note 1. The Kmart format represents both an operating and reportable segment. The Sears Domestic reportable segment consists of the aggregation of several business formats. These formats are evaluated by our Chief Operating Decision Maker ("CODM") to make decisions about resource allocation and to assess performance.
Each of these segments derives its revenues from the sale of merchandise and related services to customers, primarily in the United States. The merchandise and service categories are as follows:
|
(i)
|
Hardlines—consists of home appliances, consumer electronics, lawn & garden, tools & hardware, automotive parts, household goods, toys, housewares and sporting goods;
|
|
(ii)
|
Apparel and Soft Home—includes women's, men's, kids', footwear, jewelry, accessories and soft home;
|
|
(iii)
|
Food and Drug—consists of grocery & household, pharmacy and drugstore;
|
|
(iv)
|
Service—includes repair, installation and automotive service and extended contract revenue; and
|
|
(v)
|
Other—includes revenues earned in connection with our agreements with SHO and Lands' End, as well as online commissions, licensed business revenues, wholesale revenues, rental income and credit revenues.
|
|
|
2017
|
|||||||||||
|
millions
|
Kmart
|
Sears Domestic
|
Sears Holdings
|
|||||||||
|
Merchandise sales
|
||||||||||||
|
Hardlines
|
$
|
1,550
|
|
$
|
5,656
|
|
$
|
7,206
|
|
|||
|
Apparel and Soft Home
|
2,096
|
|
2,182
|
|
4,278
|
|
||||||
|
Food and Drug
|
1,918
|
|
7
|
|
1,925
|
|
||||||
|
Total merchandise sales
|
5,564
|
|
7,845
|
|
13,409
|
|
||||||
|
Services and other
|
||||||||||||
|
Services
|
4
|
|
1,811
|
|
1,815
|
|
||||||
|
Other
|
50
|
|
1,428
|
|
1,478
|
|
||||||
|
Total services and other
|
54
|
|
3,239
|
|
3,293
|
|
||||||
|
Total revenues
|
5,618
|
|
11,084
|
|
16,702
|
|
||||||
|
Costs and expenses:
|
||||||||||||
|
Cost of sales, buying and occupancy - merchandise sales
|
4,592
|
|
6,757
|
|
11,349
|
|
||||||
|
Cost of sales and occupancy - services and other
|
9
|
|
1,817
|
|
1,826
|
|
||||||
|
Total cost of sales, buying and occupancy
|
4,601
|
|
8,574
|
|
13,175
|
|
||||||
|
Selling and administrative
|
1,455
|
|
3,676
|
|
5,131
|
|
||||||
|
Depreciation and amortization
|
60
|
|
272
|
|
332
|
|
||||||
|
Impairment charges
|
16
|
|
126
|
|
142
|
|
||||||
|
Gain on sales of assets
|
(881
|
)
|
(767
|
)
|
(1,648
|
)
|
||||||
|
Total costs and expenses
|
5,251
|
|
11,881
|
|
17,132
|
|
||||||
|
Operating income (loss)
|
$
|
367
|
|
$
|
(797
|
)
|
$
|
(430
|
)
|
|||
|
Total assets
|
$
|
1,576
|
|
$
|
5,686
|
|
$
|
7,262
|
|
|||
|
Capital expenditures
|
$
|
18
|
|
$
|
62
|
|
$
|
80
|
|
|||
119
SEARS HOLDINGS CORPORATION
Notes to Consolidated Financial Statements—(Continued)
|
|
2016
|
|||||||||||
|
millions
|
Kmart
|
Sears Domestic
|
Sears Holdings
|
|||||||||
|
Merchandise sales
|
||||||||||||
|
Hardlines
|
$
|
2,445
|
|
$
|
7,126
|
|
$
|
9,571
|
|
|||
|
Apparel and Soft Home
|
3,044
|
|
2,522
|
|
5,566
|
|
||||||
|
Food and Drug
|
3,088
|
|
11
|
|
3,099
|
|
||||||
|
Total merchandise sales
|
8,577
|
|
9,659
|
|
18,236
|
|
||||||
|
Services and other
|
||||||||||||
|
Services
|
9
|
|
2,101
|
|
2,110
|
|
||||||
|
Other
|
64
|
|
1,728
|
|
1,792
|
|
||||||
|
Total services and other
|
73
|
|
3,829
|
|
3,902
|
|
||||||
|
Total revenues
|
8,650
|
|
13,488
|
|
22,138
|
|
||||||
|
Costs and expenses:
|
||||||||||||
|
Cost of sales, buying and occupancy - merchandise sales
|
7,075
|
|
8,109
|
|
15,184
|
|
||||||
|
Cost of sales and occupancy - services and other
|
18
|
|
2,250
|
|
2,268
|
|
||||||
|
Total cost of sales, buying and occupancy
|
7,093
|
|
10,359
|
|
17,452
|
|
||||||
|
Selling and administrative
|
2,175
|
|
3,934
|
|
6,109
|
|
||||||
|
Depreciation and amortization
|
71
|
|
304
|
|
375
|
|
||||||
|
Impairment charges
|
22
|
|
405
|
|
427
|
|
||||||
|
Gain on sales of assets
|
(181
|
)
|
(66
|
)
|
(247
|
)
|
||||||
|
Total costs and expenses
|
9,180
|
|
14,936
|
|
24,116
|
|
||||||
|
Operating loss
|
$
|
(530
|
)
|
$
|
(1,448
|
)
|
$
|
(1,978
|
)
|
|||
|
Total assets
|
$
|
2,134
|
|
$
|
7,228
|
|
$
|
9,362
|
|
|||
|
Capital expenditures
|
$
|
43
|
|
$
|
99
|
|
$
|
142
|
|
|||
120
SEARS HOLDINGS CORPORATION
Notes to Consolidated Financial Statements—(Continued)
|
|
2015
|
|||||||||||
|
millions
|
Kmart
|
Sears Domestic
|
Sears Holdings
|
|||||||||
|
Merchandise sales
|
||||||||||||
|
Hardlines
|
$
|
2,936
|
|
$
|
7,915
|
|
$
|
10,851
|
|
|||
|
Apparel and Soft Home
|
3,434
|
|
2,907
|
|
6,341
|
|
||||||
|
Food and Drug
|
3,735
|
|
9
|
|
3,744
|
|
||||||
|
Total merchandise sales
|
10,105
|
|
10,831
|
|
20,936
|
|
||||||
|
Services and other
|
||||||||||||
|
Services
|
13
|
|
2,127
|
|
2,140
|
|
||||||
|
Other
|
70
|
|
2,000
|
|
2,070
|
|
||||||
|
Total services and other
|
83
|
|
4,127
|
|
4,210
|
|
||||||
|
Total revenues
|
10,188
|
|
14,958
|
|
25,146
|
|
||||||
|
Costs and expenses:
|
||||||||||||
|
Cost of sales, buying and occupancy - merchandise sales
|
8,023
|
|
8,794
|
|
16,817
|
|
||||||
|
Cost of sales and occupancy - services and other
|
19
|
|
2,500
|
|
2,519
|
|
||||||
|
Total cost of sales, buying and occupancy
|
8,042
|
|
11,294
|
|
19,336
|
|
||||||
|
Selling and administrative
|
2,537
|
|
4,320
|
|
6,857
|
|
||||||
|
Depreciation and amortization
|
72
|
|
350
|
|
422
|
|
||||||
|
Impairment charges
|
14
|
|
260
|
|
274
|
|
||||||
|
Gain on sales of assets
|
(185
|
)
|
(558
|
)
|
(743
|
)
|
||||||
|
Total costs and expenses
|
10,480
|
|
15,666
|
|
26,146
|
|
||||||
|
Operating loss
|
$
|
(292
|
)
|
$
|
(708
|
)
|
$
|
(1,000
|
)
|
|||
|
Total assets
|
$
|
3,059
|
|
$
|
8,278
|
|
$
|
11,337
|
|
|||
|
Capital expenditures
|
$
|
42
|
|
$
|
169
|
|
$
|
211
|
|
|||
We are a defendant in several lawsuits containing class or collective action allegations in which the plaintiffs are current and former hourly and salaried associates who allege violations of various wage and hour laws, rules and regulations pertaining to alleged misclassification of certain of our employees, the failure to pay overtime, and/or the failure to pay for missed meal and rest periods, and other payroll violations. The complaints generally seek unspecified monetary damages, injunctive relief, or both. Further, certain of these proceedings are in jurisdictions with reputations for aggressive application of laws and procedures against corporate defendants. We also are a defendant in putative class action or representative lawsuits in California relating to alleged failure to comply with California laws pertaining to certain operational, marketing, and pricing practices. The California laws alleged to have been violated in each of these lawsuits provide the potential for significant statutory penalties. At this time, the Company is not able to either predict the outcome of these lawsuits or reasonably estimate a potential range of loss with respect to the lawsuits.
We are subject to various other legal and governmental proceedings and investigations, including some involving the practices and procedures in our more highly regulated businesses. Some matters contain class action allegations, environmental and asbestos exposure allegations and other consumer-based, regulatory claims, each of which may seek compensatory, punitive or treble damage claims (potentially in large amounts), as well as other types of relief. At this time, the Company is not able to either predict the outcome of these lawsuits or reasonably estimate a potential range of loss with respect to these lawsuits.
In accordance with accounting standards regarding loss contingencies, we accrue an undiscounted liability for those contingencies where the incurrence of a loss is probable and the amount can be reasonably estimated, and we
121
SEARS HOLDINGS CORPORATION
Notes to Consolidated Financial Statements—(Continued)
disclose the amount accrued and the amount of a reasonably possible loss in excess of the amount accrued, if such disclosure is necessary for our financial statements to not be misleading. We do not record liabilities when the likelihood that the liability has been incurred is probable but the amount cannot be reasonably estimated, or when the liability is believed to be only reasonably possible or remote.
Because litigation outcomes are inherently unpredictable, our evaluation of legal proceedings often involves a series of complex assessments by management about future events and can rely heavily on estimates and assumptions. If the assessments indicate that loss contingencies that could be material to any one of our financial statements are not probable, but are reasonably possible, or are probable, but cannot be estimated, then we disclose the nature of the loss contingencies, together with an estimate of the range of possible loss or a statement that such loss is not reasonably estimable. While the consequences of certain unresolved proceedings are not presently determinable, and an estimate of the probable and reasonably possible loss or range of loss in excess of amounts accrued for such proceedings cannot be reasonably made, an adverse outcome from such proceedings could have a material effect on our earnings in any given reporting period. However, in the opinion of our management, after consulting with legal counsel, and taking into account insurance and reserves, the ultimate liability related to current outstanding matters is not expected to have a material effect on our financial position, liquidity or capital resources.
|
|
2017
|
|||||||||||||||
|
millions, except per share data
|
First
Quarter |
Second
Quarter |
Third
Quarter |
Fourth
Quarter |
||||||||||||
|
Revenues
|
$
|
4,301
|
|
$
|
4,365
|
|
$
|
3,660
|
|
$
|
4,376
|
|
||||
|
Cost of sales, buying and occupancy
|
3,371
|
|
3,394
|
|
2,958
|
|
3,452
|
|
||||||||
|
Selling and administrative
|
1,267
|
|
1,369
|
|
1,339
|
|
1,156
|
|
||||||||
|
Net income (loss) attributable to Holdings' shareholders
|
244
|
|
(251
|
)
|
(558
|
)
|
182
|
|
||||||||
|
Basic net income (loss) per share attributable to Holdings' shareholders
|
2.28
|
|
(2.34
|
)
|
(5.19
|
)
|
1.69
|
|
||||||||
|
Diluted net income (loss) per share attributable to Holdings' shareholders
|
2.28
|
|
(2.34
|
)
|
(5.19
|
)
|
1.69
|
|
||||||||
|
|
2016
|
|||||||||||||||
|
millions, except per share data
|
First
Quarter |
Second
Quarter |
Third
Quarter |
Fourth
Quarter |
||||||||||||
|
Revenues
|
$
|
5,394
|
|
$
|
5,663
|
|
$
|
5,029
|
|
$
|
6,052
|
|
||||
|
Cost of sales, buying and occupancy
|
4,217
|
|
4,403
|
|
4,067
|
|
4,765
|
|
||||||||
|
Selling and administrative
|
1,503
|
|
1,484
|
|
1,543
|
|
1,579
|
|
||||||||
|
Net loss attributable to Holdings' shareholders
|
(471
|
)
|
(395
|
)
|
(748
|
)
|
(607
|
)
|
||||||||
|
Basic net loss per share attributable to Holdings' shareholders
|
(4.41
|
)
|
(3.70
|
)
|
(6.99
|
)
|
(5.67
|
)
|
||||||||
|
Diluted net loss per share attributable to Holdings' shareholders
|
(4.41
|
)
|
(3.70
|
)
|
(6.99
|
)
|
(5.67
|
)
|
||||||||
Per share amounts for each quarter are required to be computed independently and may not equal the amount computed for the total year. In the first quarter of 2017, we recorded a gain on the Craftsman Sale of
$492 million
. Refer to Note 1 for more information related to the Craftsman Sale. In addition, in the fourth quarter of 2017, the income tax benefit included a tax benefit of approximately
$470 million
related to the impacts of the Tax Act. Refer to Note 10 for more information. In the fourth quarter of
2017
and
2016
, we recorded impairment related to the Sears trade name of
$72 million
and
$381 million
, respectively. Refer to Note 12 for more information related to these impairment charges.
122
SEARS HOLDINGS CORPORATION
Notes to Consolidated Financial Statements—(Continued)
At
February 3, 2018
, the principal amount outstanding of the Company’s 6
5/8% senior secured notes due
2018
was
$303 million
. These notes were issued in 2010 by Sears Holdings Corporation ("Parent"). The Old Senior Secured Notes are guaranteed by certain of our
100%
owned domestic subsidiaries that own the collateral for the Senior Secured Notes, as well as by Sears Holdings Management Corporation and SRAC (the "guarantor subsidiaries"). The following condensed consolidated financial information presents the Condensed Consolidating Balance Sheets at
February 3, 2018
and
January 28, 2017
, and the Condensed Consolidating Statements of Operations, the Consolidating Statements of Comprehensive Income (Loss) and the Condensed Consolidating Statements of Cash flows for
2017
,
2016
and
2015
of (i) Parent; (ii) the guarantor subsidiaries; (iii) the non-guarantor subsidiaries; (iv) eliminations and (v) the Company on a consolidated basis.
The principal elimination entries relate to investments in subsidiaries and intercompany balances and transactions including transactions with our wholly-owned non-guarantor insurance subsidiary. The Company has accounted for investments in subsidiaries under the equity method. The guarantor subsidiaries are
100%
owned directly or indirectly by the Parent and all guarantees are joint, several and unconditional. Additionally, the notes are secured by a security interest in certain assets consisting primarily of domestic inventory and credit card receivables of the guarantor subsidiaries, and consequently may not be available to satisfy the claims of the Company’s general creditors. Certain investments primarily held by non-guarantor subsidiaries are recorded by the issuers at historical cost and are recorded at fair value by the holder.
123
SEARS HOLDINGS CORPORATION
Notes to Consolidated Financial Statements—(Continued)
Condensed Consolidating Balance Sheet
February 3, 2018
|
millions
|
Parent
|
Guarantor
Subsidiaries |
Non-
Guarantor Subsidiaries |
Eliminations
|
Consolidated
|
|||||||||||||||
|
Current assets
|
||||||||||||||||||||
|
Cash and cash equivalents
|
$
|
—
|
|
$
|
152
|
|
$
|
30
|
|
$
|
—
|
|
$
|
182
|
|
|||||
|
Restricted cash
|
154
|
|
—
|
|
—
|
|
—
|
|
154
|
|
||||||||||
|
Intercompany receivables
|
—
|
|
—
|
|
27,993
|
|
(27,993
|
)
|
—
|
|
||||||||||
|
Accounts receivable
|
—
|
|
322
|
|
21
|
|
—
|
|
343
|
|
||||||||||
|
Merchandise inventories
|
—
|
|
2,798
|
|
—
|
|
—
|
|
2,798
|
|
||||||||||
|
Prepaid expenses and other current assets
|
309
|
|
899
|
|
478
|
|
(1,351
|
)
|
335
|
|
||||||||||
|
Total current assets
|
463
|
|
4,171
|
|
28,522
|
|
(29,344
|
)
|
3,812
|
|
||||||||||
|
Total property and equipment, net
|
—
|
|
1,043
|
|
686
|
|
—
|
|
1,729
|
|
||||||||||
|
Goodwill and intangible assets
|
—
|
|
346
|
|
1,189
|
|
(98
|
)
|
1,437
|
|
||||||||||
|
Other assets
|
179
|
|
1,331
|
|
1,159
|
|
(2,385
|
)
|
284
|
|
||||||||||
|
Investment in subsidiaries
|
8,790
|
|
27,752
|
|
—
|
|
(36,542
|
)
|
—
|
|
||||||||||
|
TOTAL ASSETS
|
$
|
9,432
|
|
$
|
34,643
|
|
$
|
31,556
|
|
$
|
(68,369
|
)
|
$
|
7,262
|
|
|||||
|
Current liabilities
|
||||||||||||||||||||
|
Short-term borrowings
|
$
|
144
|
|
$
|
937
|
|
$
|
—
|
|
$
|
(166
|
)
|
$
|
915
|
|
|||||
|
Current portion of long-term debt and capitalized lease obligations
|
303
|
|
897
|
|
—
|
|
(232
|
)
|
968
|
|
||||||||||
|
Merchandise payables
|
—
|
|
576
|
|
—
|
|
—
|
|
576
|
|
||||||||||
|
Intercompany payables
|
11,099
|
|
16,894
|
|
—
|
|
(27,993
|
)
|
—
|
|
||||||||||
|
Other current liabilities
|
16
|
|
1,941
|
|
1,448
|
|
(949
|
)
|
2,456
|
|
||||||||||
|
Total current liabilities
|
11,562
|
|
21,245
|
|
1,448
|
|
(29,340
|
)
|
4,915
|
|
||||||||||
|
Long-term debt and capitalized lease obligations
|
1,991
|
|
2,734
|
|
—
|
|
(2,476
|
)
|
2,249
|
|
||||||||||
|
Pension and postretirement benefits
|
—
|
|
1,616
|
|
3
|
|
—
|
|
1,619
|
|
||||||||||
|
Deferred gain on sale-leaseback
|
—
|
|
360
|
|
2
|
|
—
|
|
362
|
|
||||||||||
|
Sale-leaseback financing obligation
|
—
|
|
158
|
|
89
|
|
—
|
|
247
|
|
||||||||||
|
Long-term deferred tax liabilities
|
—
|
|
—
|
|
349
|
|
(223
|
)
|
126
|
|
||||||||||
|
Other long-term liabilities
|
—
|
|
1,131
|
|
514
|
|
(178
|
)
|
1,467
|
|
||||||||||
|
Total Liabilities
|
13,553
|
|
27,244
|
|
2,405
|
|
(32,217
|
)
|
10,985
|
|
||||||||||
|
EQUITY (DEFICIT)
|
||||||||||||||||||||
|
Shareholder's equity (deficit)
|
(4,121
|
)
|
7,399
|
|
29,151
|
|
(36,152
|
)
|
(3,723
|
)
|
||||||||||
|
Total Equity (Deficit)
|
(4,121
|
)
|
7,399
|
|
29,151
|
|
(36,152
|
)
|
(3,723
|
)
|
||||||||||
|
TOTAL LIABILITIES AND EQUITY (DEFICIT)
|
$
|
9,432
|
|
$
|
34,643
|
|
$
|
31,556
|
|
$
|
(68,369
|
)
|
$
|
7,262
|
|
|||||
124
SEARS HOLDINGS CORPORATION
Notes to Consolidated Financial Statements—(Continued)
Condensed Consolidating Balance Sheet
January 28, 2017
|
millions
|
Parent
|
Guarantor
Subsidiaries |
Non-
Guarantor Subsidiaries |
Eliminations
|
Consolidated
|
|||||||||||||||
|
Current assets
|
||||||||||||||||||||
|
Cash and cash equivalents
|
$
|
—
|
|
$
|
260
|
|
$
|
26
|
|
$
|
—
|
|
$
|
286
|
|
|||||
|
Intercompany receivables
|
—
|
|
—
|
|
27,415
|
|
(27,415
|
)
|
—
|
|
||||||||||
|
Accounts receivable
|
—
|
|
441
|
|
25
|
|
|
|
466
|
|
||||||||||
|
Merchandise inventories
|
—
|
|
3,959
|
|
—
|
|
—
|
|
3,959
|
|
||||||||||
|
Prepaid expenses and other current assets
|
23
|
|
692
|
|
856
|
|
(1,286
|
)
|
285
|
|
||||||||||
|
Total current assets
|
23
|
|
5,352
|
|
28,322
|
|
(28,701
|
)
|
4,996
|
|
||||||||||
|
Total property and equipment, net
|
—
|
|
1,504
|
|
736
|
|
—
|
|
2,240
|
|
||||||||||
|
Goodwill and intangible assets
|
—
|
|
360
|
|
1,528
|
|
(98
|
)
|
1,790
|
|
||||||||||
|
Other assets
|
4
|
|
285
|
|
931
|
|
(884
|
)
|
336
|
|
||||||||||
|
Investment in subsidiaries
|
9,110
|
|
26,703
|
|
—
|
|
(35,813
|
)
|
—
|
|
||||||||||
|
TOTAL ASSETS
|
$
|
9,137
|
|
$
|
34,204
|
|
$
|
31,517
|
|
$
|
(65,496
|
)
|
$
|
9,362
|
|
|||||
|
Current liabilities
|
||||||||||||||||||||
|
Short-term borrowings
|
$
|
—
|
|
$
|
108
|
|
$
|
—
|
|
$
|
(108
|
)
|
$
|
—
|
|
|||||
|
Current portion of long-term debt and capitalized lease obligations
|
—
|
|
1,189
|
|
—
|
|
(599
|
)
|
590
|
|
||||||||||
|
Merchandise payables
|
—
|
|
1,048
|
|
—
|
|
—
|
|
1,048
|
|
||||||||||
|
Intercompany payables
|
11,830
|
|
15,585
|
|
—
|
|
(27,415
|
)
|
—
|
|
||||||||||
|
Other current liabilities
|
17
|
|
2,479
|
|
1,219
|
|
(672
|
)
|
3,043
|
|
||||||||||
|
Total current liabilities
|
11,847
|
|
20,409
|
|
1,219
|
|
(28,794
|
)
|
4,681
|
|
||||||||||
|
Long-term debt and capitalized lease obligations
|
1,215
|
|
3,160
|
|
—
|
|
(802
|
)
|
3,573
|
|
||||||||||
|
Pension and postretirement benefits
|
—
|
|
1,746
|
|
4
|
|
—
|
|
1,750
|
|
||||||||||
|
Deferred gain on sale-leaseback
|
—
|
|
563
|
|
—
|
|
—
|
|
563
|
|
||||||||||
|
Sale-leaseback financing obligation
|
—
|
|
235
|
|
—
|
|
—
|
|
235
|
|
||||||||||
|
Long-term deferred tax liabilities
|
48
|
|
—
|
|
724
|
|
(29
|
)
|
743
|
|
||||||||||
|
Other long-term liabilities
|
—
|
|
808
|
|
1,038
|
|
(205
|
)
|
1,641
|
|
||||||||||
|
Total Liabilities
|
13,110
|
|
26,921
|
|
2,985
|
|
(29,830
|
)
|
13,186
|
|
||||||||||
|
EQUITY (DEFICIT)
|
||||||||||||||||||||
|
Shareholder's equity (deficit)
|
(3,973
|
)
|
7,283
|
|
28,532
|
|
(35,666
|
)
|
(3,824
|
)
|
||||||||||
|
Total Equity (Deficit)
|
(3,973
|
)
|
7,283
|
|
28,532
|
|
(35,666
|
)
|
(3,824
|
)
|
||||||||||
|
TOTAL LIABILITIES AND EQUITY (DEFICIT)
|
$
|
9,137
|
|
$
|
34,204
|
|
$
|
31,517
|
|
$
|
(65,496
|
)
|
$
|
9,362
|
|
|||||
125
SEARS HOLDINGS CORPORATION
Notes to Consolidated Financial Statements—(Continued)
Condensed Consolidating Statement of Operations
For the Year Ended
February 3, 2018
|
millions
|
Parent
|
Guarantor
Subsidiaries |
Non-
Guarantor Subsidiaries |
Eliminations
|
Consolidated
|
||||||||||||||
|
Merchandise sales
|
$
|
—
|
|
$
|
13,375
|
|
$
|
—
|
|
$
|
34
|
|
$
|
13,409
|
|
||||
|
Services and other
|
—
|
|
3,303
|
|
2,283
|
|
(2,293
|
)
|
3,293
|
|
|||||||||
|
Total revenues
|
—
|
|
16,678
|
|
2,283
|
|
(2,259
|
)
|
16,702
|
|
|||||||||
|
Cost of sales, buying and occupancy - merchandise sales
|
1
|
|
11,237
|
|
—
|
|
111
|
|
11,349
|
|
|||||||||
|
Cost of sales and occupancy - services and other
|
—
|
|
2,228
|
|
876
|
|
(1,278
|
)
|
1,826
|
|
|||||||||
|
Total cost of sales, buying and occupancy
|
1
|
|
13,465
|
|
876
|
|
(1,167
|
)
|
13,175
|
|
|||||||||
|
Selling and administrative
|
(27
|
)
|
5,409
|
|
841
|
|
(1,092
|
)
|
5,131
|
|
|||||||||
|
Depreciation and amortization
|
—
|
|
270
|
|
62
|
|
—
|
|
332
|
|
|||||||||
|
Impairment charges
|
—
|
|
70
|
|
72
|
|
—
|
|
142
|
|
|||||||||
|
Gain on sales of assets
|
(486
|
)
|
(1,142
|
)
|
(20
|
)
|
—
|
|
(1,648
|
)
|
|||||||||
|
Total costs and expenses
|
(512
|
)
|
18,072
|
|
1,831
|
|
(2,259
|
)
|
17,132
|
|
|||||||||
|
Operating income (loss)
|
512
|
|
(1,394
|
)
|
452
|
|
—
|
|
(430
|
)
|
|||||||||
|
Interest expense
|
(600
|
)
|
(994
|
)
|
(19
|
)
|
1,074
|
|
(539
|
)
|
|||||||||
|
Interest and investment income (loss)
|
45
|
|
195
|
|
412
|
|
(664
|
)
|
(12
|
)
|
|||||||||
|
Income (loss) before income taxes
|
(43
|
)
|
(2,193
|
)
|
845
|
|
410
|
|
(981
|
)
|
|||||||||
|
Income tax (expense) benefit
|
232
|
|
765
|
|
(399
|
)
|
—
|
|
598
|
|
|||||||||
|
Equity (deficit) in earnings in subsidiaries
|
(982
|
)
|
460
|
|
—
|
|
522
|
|
—
|
|
|||||||||
|
NET INCOME (LOSS) ATTRIBUTABLE TO HOLDINGS' SHAREHOLDERS
|
$
|
(793
|
)
|
$
|
(968
|
)
|
$
|
446
|
|
$
|
932
|
|
$
|
(383
|
)
|
||||
126
SEARS HOLDINGS CORPORATION
Notes to Consolidated Financial Statements—(Continued)
Condensed Consolidating Statement of Operations
For the Year Ended
January 28, 2017
|
millions
|
Parent
|
Guarantor
Subsidiaries |
Non-
Guarantor Subsidiaries |
Eliminations
|
Consolidated
|
||||||||||||||
|
Merchandise sales
|
$
|
—
|
|
$
|
18,218
|
|
$
|
—
|
|
$
|
18
|
|
$
|
18,236
|
|
||||
|
Services and other
|
—
|
|
3,985
|
|
2,796
|
|
(2,879
|
)
|
3,902
|
|
|||||||||
|
Total revenues
|
—
|
|
22,203
|
|
2,796
|
|
(2,861
|
)
|
22,138
|
|
|||||||||
|
Cost of sales, buying and occupancy - merchandise sales
|
—
|
|
15,104
|
|
—
|
|
80
|
|
15,184
|
|
|||||||||
|
Cost of sales and occupancy - services and other
|
—
|
|
2,824
|
|
1,056
|
|
(1,612
|
)
|
2,268
|
|
|||||||||
|
Total cost of sales, buying and occupancy
|
—
|
|
17,928
|
|
1,056
|
|
(1,532
|
)
|
17,452
|
|
|||||||||
|
Selling and administrative
|
6
|
|
6,506
|
|
926
|
|
(1,329
|
)
|
6,109
|
|
|||||||||
|
Depreciation and amortization
|
—
|
|
303
|
|
72
|
|
—
|
|
375
|
|
|||||||||
|
Impairment charges
|
—
|
|
46
|
|
381
|
|
—
|
|
427
|
|
|||||||||
|
Gain on sales of assets
|
—
|
|
(343
|
)
|
(2
|
)
|
98
|
|
(247
|
)
|
|||||||||
|
Total costs and expenses
|
6
|
|
24,440
|
|
2,433
|
|
(2,763
|
)
|
24,116
|
|
|||||||||
|
Operating income (loss)
|
(6
|
)
|
(2,237
|
)
|
363
|
|
(98
|
)
|
(1,978
|
)
|
|||||||||
|
Interest expense
|
(385
|
)
|
(645
|
)
|
(13
|
)
|
639
|
|
(404
|
)
|
|||||||||
|
Interest and investment income (loss)
|
20
|
|
152
|
|
441
|
|
(639
|
)
|
(26
|
)
|
|||||||||
|
Other income (loss)
|
13
|
|
—
|
|
(217
|
)
|
217
|
|
13
|
|
|||||||||
|
Income (loss) before income taxes
|
(358
|
)
|
(2,730
|
)
|
574
|
|
119
|
|
(2,395
|
)
|
|||||||||
|
Income tax (expense) benefit
|
28
|
|
529
|
|
(383
|
)
|
—
|
|
174
|
|
|||||||||
|
Equity (deficit) in earnings in subsidiaries
|
(2,010
|
)
|
5
|
|
—
|
|
2,005
|
|
—
|
|
|||||||||
|
NET INCOME (LOSS) ATTRIBUTABLE TO HOLDINGS' SHAREHOLDERS
|
$
|
(2,340
|
)
|
$
|
(2,196
|
)
|
$
|
191
|
|
$
|
2,124
|
|
$
|
(2,221
|
)
|
||||
127
SEARS HOLDINGS CORPORATION
Notes to Consolidated Financial Statements—(Continued)
Condensed Consolidating Statement of Operations
For the Year Ended
January 30, 2016
|
millions
|
Parent
|
Guarantor
Subsidiaries |
Non-
Guarantor Subsidiaries |
Eliminations
|
Consolidated
|
||||||||||||||
|
Merchandise sales
|
$
|
—
|
|
$
|
20,925
|
|
$
|
—
|
|
$
|
11
|
|
$
|
20,936
|
|
||||
|
Services and other
|
—
|
|
4,339
|
|
2,861
|
|
(2,990
|
)
|
4,210
|
|
|||||||||
|
Total revenues
|
—
|
|
25,264
|
|
2,861
|
|
(2,979
|
)
|
25,146
|
|
|||||||||
|
Cost of sales, buying and occupancy - merchandise sales
|
—
|
|
16,749
|
|
—
|
|
68
|
|
16,817
|
|
|||||||||
|
Cost of sales and occupancy - services and other
|
—
|
|
3,070
|
|
1,131
|
|
(1,682
|
)
|
2,519
|
|
|||||||||
|
Total cost of sales, buying and occupancy
|
—
|
|
19,819
|
|
1,131
|
|
(1,614
|
)
|
19,336
|
|
|||||||||
|
Selling and administrative
|
3
|
|
7,322
|
|
897
|
|
(1,365
|
)
|
6,857
|
|
|||||||||
|
Depreciation and amortization
|
—
|
|
350
|
|
72
|
|
—
|
|
422
|
|
|||||||||
|
Impairment charges
|
—
|
|
94
|
|
180
|
|
—
|
|
274
|
|
|||||||||
|
Gain on sales of assets
|
—
|
|
(735
|
)
|
(8
|
)
|
—
|
|
(743
|
)
|
|||||||||
|
Total costs and expenses
|
3
|
|
26,850
|
|
2,272
|
|
(2,979
|
)
|
26,146
|
|
|||||||||
|
Operating income (loss)
|
(3
|
)
|
(1,586
|
)
|
589
|
|
—
|
|
(1,000
|
)
|
|||||||||
|
Interest expense
|
(265
|
)
|
(481
|
)
|
(83
|
)
|
506
|
|
(323
|
)
|
|||||||||
|
Interest and investment income (loss)
|
(19
|
)
|
44
|
|
419
|
|
(506
|
)
|
(62
|
)
|
|||||||||
|
Income (loss) before income taxes
|
(287
|
)
|
(2,023
|
)
|
925
|
|
—
|
|
(1,385
|
)
|
|||||||||
|
Income tax (expense) benefit
|
115
|
|
480
|
|
(338
|
)
|
—
|
|
257
|
|
|||||||||
|
Equity (deficit) in earnings in subsidiaries
|
(956
|
)
|
158
|
|
—
|
|
798
|
|
—
|
|
|||||||||
|
Net income (loss)
|
(1,128
|
)
|
(1,385
|
)
|
587
|
|
798
|
|
(1,128
|
)
|
|||||||||
|
Income attributable to noncontrolling interests
|
—
|
|
—
|
|
—
|
|
(1
|
)
|
(1
|
)
|
|||||||||
|
NET INCOME (LOSS) ATTRIBUTABLE TO HOLDINGS' SHAREHOLDERS
|
$
|
(1,128
|
)
|
$
|
(1,385
|
)
|
$
|
587
|
|
$
|
797
|
|
$
|
(1,129
|
)
|
||||
128
SEARS HOLDINGS CORPORATION
Notes to Consolidated Financial Statements—(Continued)
Consolidating Statement of Comprehensive Income (Loss)
For the Year Ended
February 3, 2018
|
millions
|
Parent
|
Guarantor
Subsidiaries |
Non-
Guarantor Subsidiaries |
Eliminations
|
Consolidated
|
||||||||||||||
|
Net income (loss)
|
$
|
(793
|
)
|
$
|
(968
|
)
|
$
|
446
|
|
$
|
932
|
|
$
|
(383
|
)
|
||||
|
Other comprehensive income:
|
|||||||||||||||||||
|
Pension and postretirement adjustments, net of tax
|
—
|
|
478
|
|
—
|
|
—
|
|
478
|
|
|||||||||
|
Unrealized net gain, net of tax
|
6
|
|
—
|
|
45
|
|
(51
|
)
|
—
|
|
|||||||||
|
Currency translation adjustments, net of tax
|
—
|
|
—
|
|
2
|
|
—
|
|
2
|
|
|||||||||
|
Total other comprehensive income
|
6
|
|
478
|
|
47
|
|
(51
|
)
|
480
|
|
|||||||||
|
Comprehensive income (loss) attributable to Holdings' shareholders
|
$
|
(787
|
)
|
$
|
(490
|
)
|
$
|
493
|
|
$
|
881
|
|
$
|
97
|
|
||||
129
SEARS HOLDINGS CORPORATION
Notes to Consolidated Financial Statements—(Continued)
Consolidating Statement of Comprehensive Income (Loss)
For the Year Ended
January 28, 2017
|
millions
|
Parent
|
Guarantor
Subsidiaries |
Non-
Guarantor Subsidiaries |
Eliminations
|
Consolidated
|
||||||||||||||
|
Net income (loss)
|
$
|
(2,340
|
)
|
$
|
(2,196
|
)
|
$
|
191
|
|
$
|
2,124
|
|
$
|
(2,221
|
)
|
||||
|
Other comprehensive income:
|
|||||||||||||||||||
|
Pension and postretirement adjustments, net of tax
|
—
|
|
366
|
|
—
|
|
—
|
|
366
|
|
|||||||||
|
Dissolution of noncontrolling interest
|
—
|
|
—
|
|
(7
|
)
|
—
|
|
(7
|
)
|
|||||||||
|
Unrealized net gain, net of tax
|
—
|
|
—
|
|
122
|
|
(122
|
)
|
—
|
|
|||||||||
|
Total other comprehensive income
|
—
|
|
366
|
|
115
|
|
(122
|
)
|
359
|
|
|||||||||
|
Comprehensive income (loss)
|
(2,340
|
)
|
(1,830
|
)
|
306
|
|
2,002
|
|
(1,862
|
)
|
|||||||||
|
Comprehensive income attributable to noncontrolling interest
|
—
|
|
—
|
|
—
|
|
7
|
|
7
|
|
|||||||||
|
Comprehensive income (loss) attributable to Holdings' shareholders
|
$
|
(2,340
|
)
|
$
|
(1,830
|
)
|
$
|
306
|
|
$
|
2,009
|
|
$
|
(1,855
|
)
|
||||
130
SEARS HOLDINGS CORPORATION
Notes to Consolidated Financial Statements—(Continued)
Consolidating Statement of Comprehensive Income (Loss)
For the Year Ended
January 30, 2016
|
millions
|
Parent
|
Guarantor
Subsidiaries |
Non-
Guarantor Subsidiaries |
Eliminations
|
Consolidated
|
||||||||||||||
|
Net income (loss)
|
$
|
(1,128
|
)
|
$
|
(1,385
|
)
|
$
|
587
|
|
$
|
798
|
|
$
|
(1,128
|
)
|
||||
|
Other comprehensive income (loss):
|
|||||||||||||||||||
|
Pension and postretirement adjustments, net of tax
|
—
|
|
113
|
|
—
|
|
—
|
|
113
|
|
|||||||||
|
Currency translation adjustments, net of tax
|
—
|
|
—
|
|
(1
|
)
|
—
|
|
(1
|
)
|
|||||||||
|
Unrealized net loss, net of tax
|
—
|
|
(3
|
)
|
(65
|
)
|
68
|
|
—
|
|
|||||||||
|
Total other comprehensive income (loss)
|
—
|
|
110
|
|
(66
|
)
|
68
|
|
112
|
|
|||||||||
|
Comprehensive income (loss)
|
(1,128
|
)
|
(1,275
|
)
|
521
|
|
866
|
|
(1,016
|
)
|
|||||||||
|
Comprehensive loss attributable to noncontrolling interest
|
—
|
|
—
|
|
—
|
|
(1
|
)
|
(1
|
)
|
|||||||||
|
Comprehensive income (loss) attributable to Holdings' shareholders
|
$
|
(1,128
|
)
|
$
|
(1,275
|
)
|
$
|
521
|
|
$
|
865
|
|
$
|
(1,017
|
)
|
||||
131
SEARS HOLDINGS CORPORATION
Notes to Consolidated Financial Statements—(Continued)
Condensed Consolidating Statement of Cash Flows
For the Year Ended
February 3, 2018
|
millions
|
Parent
|
Guarantor
Subsidiaries
|
Non-
Guarantor
Subsidiaries
|
Eliminations
|
Consolidated
|
|||||||||||||||
|
Net cash provided by (used in) operating activities
|
$
|
1
|
|
$
|
(2,404
|
)
|
$
|
682
|
|
$
|
(121
|
)
|
$
|
(1,842
|
)
|
|||||
|
Proceeds from sales of property and investments
|
—
|
|
1,093
|
|
16
|
|
—
|
|
1,109
|
|
||||||||||
|
Proceeds from Craftsman Sale
|
572
|
|
—
|
|
—
|
|
—
|
|
572
|
|
||||||||||
|
Proceeds from sales of receivables
|
293
|
|
—
|
|
—
|
|
—
|
|
293
|
|
||||||||||
|
Purchases of property and equipment
|
—
|
|
(70
|
)
|
(10
|
)
|
—
|
|
(80
|
)
|
||||||||||
|
Net investing with Affiliates
|
(934
|
)
|
—
|
|
(563
|
)
|
1,497
|
|
—
|
|
||||||||||
|
Net cash provided by (used in) investing activities
|
(69
|
)
|
1,023
|
|
(557
|
)
|
1,497
|
|
1,894
|
|
||||||||||
|
Proceeds from debt issuances
|
410
|
|
610
|
|
—
|
|
—
|
|
1,020
|
|
||||||||||
|
Repayments of long-term debt
|
(171
|
)
|
(1,185
|
)
|
—
|
|
—
|
|
(1,356
|
)
|
||||||||||
|
Increase in short-term borrowings, primarily 90 days or less
|
—
|
|
271
|
|
—
|
|
—
|
|
271
|
|
||||||||||
|
Proceeds from sale-leaseback financing
|
—
|
|
106
|
|
—
|
|
—
|
|
106
|
|
||||||||||
|
Debt issuance costs
|
(17
|
)
|
(26
|
)
|
—
|
|
—
|
|
(43
|
)
|
||||||||||
|
Intercompany dividend
|
—
|
|
—
|
|
(121
|
)
|
121
|
|
—
|
|
||||||||||
|
Net borrowing with Affiliates
|
—
|
|
1,497
|
|
—
|
|
(1,497
|
)
|
—
|
|
||||||||||
|
Net cash provided by (used in) financing activities
|
222
|
|
1,273
|
|
(121
|
)
|
(1,376
|
)
|
(2
|
)
|
||||||||||
|
NET INCREASE (DECREASE) IN CASH, CASH EQUIVALENTS, AND RESTRICTED CASH
|
154
|
|
(108
|
)
|
4
|
|
—
|
|
50
|
|
||||||||||
|
CASH, CASH EQUIVALENTS, AND RESTRICTED CASH BEGINNING OF YEAR
|
—
|
|
260
|
|
26
|
|
—
|
|
286
|
|
||||||||||
|
CASH, CASH EQUIVALENTS, AND RESTRICTED CASH END OF YEAR
|
$
|
154
|
|
$
|
152
|
|
$
|
30
|
|
$
|
—
|
|
$
|
336
|
|
|||||
132
SEARS HOLDINGS CORPORATION
Notes to Consolidated Financial Statements—(Continued)
Condensed Consolidating Statement of Cash Flows
For the Year Ended
January 28, 2017
|
millions
|
Parent
|
Guarantor
Subsidiaries |
Non-
Guarantor Subsidiaries |
Eliminations
|
Consolidated
|
|||||||||||||||
|
Net cash provided by (used in) operating activities
|
$
|
244
|
|
$
|
(2,137
|
)
|
$
|
820
|
|
$
|
(308
|
)
|
$
|
(1,381
|
)
|
|||||
|
Proceeds from sales of property and investments
|
—
|
|
273
|
|
113
|
|
—
|
|
386
|
|
||||||||||
|
Purchases of property and equipment
|
—
|
|
(133
|
)
|
(9
|
)
|
—
|
|
(142
|
)
|
||||||||||
|
Net investing with Affiliates
|
(239
|
)
|
—
|
|
(627
|
)
|
866
|
|
—
|
|
||||||||||
|
Net cash provided by (used in) investing activities
|
(239
|
)
|
140
|
|
(523
|
)
|
866
|
|
244
|
|
||||||||||
|
Proceeds from debt issuances
|
—
|
|
2,028
|
|
—
|
|
—
|
|
2,028
|
|
||||||||||
|
Repayments of long-term debt
|
—
|
|
(65
|
)
|
(1
|
)
|
—
|
|
(66
|
)
|
||||||||||
|
Decrease in short-term borrowings, primarily 90 days or less
|
—
|
|
(797
|
)
|
—
|
|
—
|
|
(797
|
)
|
||||||||||
|
Proceeds from sale-leaseback financing
|
—
|
|
71
|
|
—
|
|
—
|
|
71
|
|
||||||||||
|
Debt issuance costs
|
(5
|
)
|
(46
|
)
|
—
|
|
—
|
|
(51
|
)
|
||||||||||
|
Intercompany dividend
|
—
|
|
—
|
|
(308
|
)
|
308
|
|
—
|
|
||||||||||
|
Net borrowing with Affiliates
|
—
|
|
866
|
|
—
|
|
(866
|
)
|
—
|
|
||||||||||
|
Net cash provided by (used in) financing activities
|
(5
|
)
|
2,057
|
|
(309
|
)
|
(558
|
)
|
1,185
|
|
||||||||||
|
NET INCREASE (DECREASE) IN CASH, CASH EQUIVALENTS, AND RESTRICTED CASH
|
—
|
|
60
|
|
(12
|
)
|
—
|
|
48
|
|
||||||||||
|
CASH, CASH EQUIVALENTS, AND RESTRICTED CASH BEGINNING OF YEAR
|
—
|
|
200
|
|
38
|
|
—
|
|
238
|
|
||||||||||
|
CASH, CASH EQUIVALENTS, AND RESTRICTED CASH END OF YEAR
|
$
|
—
|
|
$
|
260
|
|
$
|
26
|
|
$
|
—
|
|
$
|
286
|
|
|||||
133
SEARS HOLDINGS CORPORATION
Notes to Consolidated Financial Statements—(Continued)
Condensed Consolidating Statement of Cash Flows
For the Year Ended
January 30, 2016
|
millions
|
Parent
|
Guarantor
Subsidiaries |
Non-
Guarantor Subsidiaries |
Eliminations
|
Consolidated
|
|||||||||||||||
|
Net cash provided by (used in) operating activities
|
$
|
395
|
|
$
|
(3,021
|
)
|
$
|
938
|
|
$
|
(479
|
)
|
$
|
(2,167
|
)
|
|||||
|
Proceeds from sales of property and investments
|
—
|
|
2,725
|
|
5
|
|
—
|
|
2,730
|
|
||||||||||
|
Purchases of property and equipment
|
—
|
|
(202
|
)
|
(9
|
)
|
—
|
|
(211
|
)
|
||||||||||
|
Net investing with Affiliates
|
(395
|
)
|
—
|
|
(446
|
)
|
841
|
|
—
|
|
||||||||||
|
Net cash provided by (used in) investing activities
|
(395
|
)
|
2,523
|
|
(450
|
)
|
841
|
|
2,519
|
|
||||||||||
|
Repayments of long-term debt
|
—
|
|
(1,403
|
)
|
(2
|
)
|
—
|
|
(1,405
|
)
|
||||||||||
|
Increase in short-term borrowings, primarily 90 days or less
|
—
|
|
583
|
|
—
|
|
—
|
|
583
|
|
||||||||||
|
Proceeds from sale-leaseback financing
|
—
|
|
508
|
|
—
|
|
—
|
|
508
|
|
||||||||||
|
Debt issuance costs
|
—
|
|
(50
|
)
|
—
|
|
—
|
|
(50
|
)
|
||||||||||
|
Intercompany dividend
|
—
|
|
|
|
(479
|
)
|
479
|
|
—
|
|
||||||||||
|
Net borrowing with Affiliates
|
—
|
|
841
|
|
—
|
|
(841
|
)
|
—
|
|
||||||||||
|
Net cash provided by (used in) financing activities
|
—
|
|
479
|
|
(481
|
)
|
(362
|
)
|
(364
|
)
|
||||||||||
|
NET INCREASE (DECREASE) IN CASH, CASH EQUIVALENTS, AND RESTRICTED CASH
|
—
|
|
(19
|
)
|
7
|
|
—
|
|
(12
|
)
|
||||||||||
|
CASH, CASH EQUIVALENTS, AND RESTRICTED CASH BEGINNING OF YEAR
|
—
|
|
219
|
|
31
|
|
—
|
|
250
|
|
||||||||||
|
CASH, CASH EQUIVALENTS, AND RESTRICTED CASH END OF YEAR
|
$
|
—
|
|
$
|
200
|
|
$
|
38
|
|
$
|
—
|
|
$
|
238
|
|
|||||
134
Sears Holdings Corporation
Schedule II-Valuation and Qualifying Accounts
Years
2017
,
2016
and
2015
|
millions
|
Balance at
beginning
of period
|
Additions
charged to
costs and
expenses
|
(Deductions)
|
Balance at
end of period
|
||||||||||||
|
Allowance for Doubtful Accounts
(1)
:
|
|
|
|
|
||||||||||||
|
2017
|
$
|
37
|
|
$
|
7
|
|
$
|
(9
|
)
|
$
|
35
|
|
||||
|
2016
|
34
|
|
9
|
|
(6
|
)
|
37
|
|
||||||||
|
2015
|
25
|
|
10
|
|
(1
|
)
|
34
|
|
||||||||
|
Allowance for Deferred Tax Assets
(2)
:
|
|
|
|
|
|
|
|
|
||||||||
|
2017
|
$
|
5,519
|
|
$
|
86
|
|
$
|
(1,418
|
)
|
$
|
4,187
|
|
||||
|
2016
|
4,757
|
|
1,000
|
|
(238
|
)
|
5,519
|
|
||||||||
|
2015
|
4,478
|
|
603
|
|
(324
|
)
|
4,757
|
|
||||||||
__________________
|
(1)
|
Charges to the account are for the purposes for which the reserves were created.
|
|
(2)
|
In 2017, the deferred tax assets and liabilities, along with the valuation allowance, decreased due to the reduction in the corporate income tax rate from 35% to 21% pursuant to the Tax Act. In addition, the pension liability and other federal and state deferred tax assets decreased during the year.
|
135
MANAGEMENT'S ANNUAL REPORT ON INTERNAL CONTROL OVER FINANCIAL REPORTING
The management of Sears Holdings Corporation is responsible for establishing and maintaining adequate internal control over financial reporting. Internal control over financial reporting is a process designed by, or under the supervision of, the Company's principal executive and principal financial officers and effected by the Company's Board of Directors, management and other personnel to provide reasonable assurance regarding the reliability of financial reporting and the preparation of financial statements for external purposes in accordance with generally accepted accounting principles and includes those policies and procedures that:
|
•
|
pertain to the maintenance of records that in reasonable detail accurately and fairly reflect the transactions and dispositions of the assets of the Company;
|
|
•
|
provide reasonable assurance that transactions are recorded as necessary to permit preparation of financial statements in accordance with generally accepted accounting principles, and that receipts and expenditures of the Company are being made only in accordance with authorizations of management and directors of the Company; and
|
|
•
|
provide reasonable assurance regarding prevention or timely detection of unauthorized acquisition, use or disposition of the Company's assets that could have a material effect on the financial statements.
|
Because of inherent limitations, internal control over financial reporting may not prevent or detect misstatements. Projections of any evaluation of effectiveness to future periods are subject to the risks that controls may become inadequate because of changes in conditions, or that the degree of compliance with the policies or procedures may deteriorate.
Management assessed the effectiveness of the Company's internal control over financial reporting at
February 3, 2018
. In making its assessment, management used the criteria set forth in the
Internal Control -Integrated Framework (2013)
issued by the Committee of Sponsoring Organizations of the Treadway Commission ("COSO"). The assessment included the documentation and understanding of the Company's internal control over financial reporting. Management evaluated the design effectiveness and tested the operating effectiveness of internal controls over financial reporting to form its conclusion.
Based on this evaluation, management concluded that, at
February 3, 2018
, the Company's internal control over financial reporting is effective to provide reasonable assurance that the Company's financial statements are fairly presented in conformity with generally accepted accounting principles.
Deloitte & Touche LLP, independent registered public accounting firm, has reported on the effectiveness of the Company's internal control over financial reporting at
February 3, 2018
, as stated in their report included herein.
136
REPORT OF INDEPENDENT REGISTERED PUBLIC ACCOUNTING FIRM
To the shareholders and the Board of Directors of Sears Holdings Corporation
Opinions on the Financial Statements and Internal Control over Financial Reporting
We have audited the accompanying consolidated balance sheets of Sears Holdings Corporation and subsidiaries (the "Company") as of February 3, 2018 and January 28, 2017, the related consolidated statements of operations, comprehensive income (loss), deficit, and cash flows, for each of the three years in the period ended February 3, 2018, and the related notes and the schedule listed in the Index at Item 8 (collectively referred to as the "financial statements"). We also have audited the Company’s internal control over financial reporting as of February 3, 2018, based on criteria established in
Internal Control - Integrated Framework (2013)
issued by the Committee of Sponsoring Organizations of the Treadway Commission (COSO).
In our opinion, the financial statements referred to above present fairly, in all material respects, the financial position of the Company as of February 3, 2018 and January 28, 2017, and the results of its operations and its cash flows for each of the three years in the period ended February 3, 2018, in conformity with accounting principles generally accepted in the United States of America. Also, in our opinion, the Company maintained, in all material respects, effective internal control over financial reporting as of February 3, 2018, based on criteria established in
Internal Control - Integrated Framework (2013)
issued by COSO.
Basis for Opinions
The Company’s management is responsible for these financial statements, for maintaining effective internal control over financial reporting, and for its assessment of the effectiveness of internal control over financial reporting, included in the accompanying Management’s Annual Report on Internal Control over Financial Reporting. Our responsibility is to express an opinion on these financial statements and an opinion on the Company’s internal control over financial reporting based on our audits. We are a public accounting firm registered with the Public Company Accounting Oversight Board (United States) (PCAOB) and are required to be independent with respect to the Company in accordance with the U.S. federal securities laws and the applicable rules and regulations of the Securities and Exchange Commission and the PCAOB.
We conducted our audits in accordance with the standards of the PCAOB. Those standards require that we plan and perform the audits to obtain reasonable assurance about whether the financial statements are free of material misstatement, whether due to error or fraud, and whether effective internal control over financial reporting was maintained in all material respects.
Our audits of the financial statements included performing procedures to assess the risks of material misstatement of the financial statements, whether due to error or fraud, and performing procedures to respond to those risks. Such procedures included examining, on a test basis, evidence regarding the amounts and disclosures in the financial statements. Our audits also included evaluating the accounting principles used and significant estimates made by management, as well as evaluating the overall presentation of the financial statements. Our audit of internal control over financial reporting included obtaining an understanding of internal control over financial reporting, assessing the risk that a material weakness exists, and testing and evaluating the design and operating effectiveness of internal control based on the assessed risk. Our audits also included performing such other procedures as we considered necessary in the circumstances. We believe that our audits provide a reasonable basis for our opinions.
Definition and Limitations of Internal Control over Financial Reporting
A company’s internal control over financial reporting is a process designed to provide reasonable assurance regarding the reliability of financial reporting and the preparation of financial statements for external purposes in accordance with generally accepted accounting principles. A company’s internal control over financial reporting includes those policies and procedures that (1) pertain to the maintenance of records that, in reasonable detail, accurately and fairly reflect the transactions and dispositions of the assets of the company; (2) provide reasonable assurance that transactions are recorded as necessary to permit preparation of financial statements in accordance with generally accepted accounting principles, and that receipts and expenditures of the company are being made
137
only in accordance with authorizations of management and directors of the company; and (3) provide reasonable assurance regarding prevention or timely detection of unauthorized acquisition, use, or disposition of the company’s assets that could have a material effect on the financial statements.
Because of its inherent limitations, internal control over financial reporting may not prevent or detect misstatements. Also, projections of any evaluation of effectiveness to future periods are subject to the risk that controls may become inadequate because of changes in conditions, or that the degree of compliance with the policies or procedures may deteriorate.
|
/s/ DELOITTE & TOUCHE LLP
|
Deloitte & Touche LLP
Chicago, Illinois
March 23, 2018
We have served as the Company's auditor since 2005.
138
SEARS HOLDINGS CORPORATION
|
Item 9.
|
Changes in and Disagreements with Accountants on Accounting and Financial Disclosure
|
None.
Our management, with the participation of our principal executive and principal financial officers, conducted an evaluation of the effectiveness of the design and operation of our disclosure controls and procedures, as defined in Rule 13a-15(e) under the Securities Exchange Act of 1934, as amended (the "Exchange Act"), as of the end of the period covered by this Annual Report on Form 10-K (the "Evaluation Date"). Based on this evaluation, the principal executive and principal financial officers concluded that, as of the Evaluation Date, our disclosure controls and procedures were effective in ensuring that information required to be disclosed by us in the reports that we file or submit under the Exchange Act (i) is recorded, processed, summarized and reported within the time periods specified in the SEC’s rules and forms and (ii) is accumulated and communicated to our management, including our principal executive and financial officers, as appropriate to allow timely decisions regarding required disclosure.
In addition, based on that evaluation, no changes in our internal control over financial reporting have occurred during our last quarter that have materially affected, or are reasonably likely to materially affect, our internal control over financial reporting.
Management's annual report on internal control over financial reporting and the report of our independent registered public accounting firm appears in Part II, Item 8. Financial Statements and Supplementary Data of this Annual Report on Form 10-K.
|
Item 9B.
|
Other Information
|
Not applicable.
139
|
Item 10.
|
Directors, Executive Officers and Corporate Governance
|
Information required by this Item 10 with respect to members of our Board of Directors and our Audit Committee will be included under the headings "Election of Directors," "Election of Directors - Committees of the Board of Directors," and "Corporate Governance - Director Independence" of our definitive proxy statement for our annual meeting of stockholders to be held on
May 9, 2018
(the "2018 Proxy Statement") and is incorporated herein by reference. Information required by this Item 10 with respect to Section 16(a) beneficial ownership reporting compliance will be included under the heading "Other Information - Section 16(a) Beneficial Ownership Reporting Compliance" of the 2018 Proxy Statement and is incorporated herein by reference.
The information required by this Item 10 regarding the Company's executive officers is set forth under the heading Executive Officers of the Registrant in Part I of this Annual Report on Form 10-K and is incorporated herein by reference.
Holdings has adopted a Code of Conduct, which applies to all employees, including our principal executive officer, principal financial officer and principal accounting officer, and a Code of Conduct for its Board of Directors. Directors who are also officers of Holdings are subject to both codes of conduct. Each code of conduct is a code of ethics as defined in Item 406 of SEC Regulation S-K. The codes of conduct are available in the "Investors - Corporate Governance" section of our website at
www.searsholdings.com.
Any amendment to, or waiver from, a provision of the codes of conduct will be posted to the above-referenced website.
There were no material changes to the process by which stockholders may recommend nominees to the Board of Directors during the last year.
|
Item 11.
|
Executive Compensation
|
Information regarding named executive officer and director compensation will be included under the headings "Executive Compensation," "Compensation of Directors," and "Compensation Committee Report" of the 2018 Proxy Statement and is incorporated herein by reference.
|
Item 12.
|
Security Ownership of Certain Beneficial Owners and Management and Related Stockholder Matters
|
Information regarding security ownership of certain beneficial owners and management will be included under the heading "Amount and Nature of Beneficial Ownership" of the 2018 Proxy Statement and is incorporated herein by reference.
See also Equity Compensation Plan Information in Item 5 of this Report for a discussion of securities authorized for issuance under equity compensation plans.
|
Item 13.
|
Certain Relationships and Related Transactions, and Director Independence
|
Information regarding certain relationships and related transactions and director independence will be included under the headings "Certain Relationships and Transactions," "Review and Approval of Transactions with Related Persons" and "Corporate Governance" of the 2018 Proxy Statement and is incorporated herein by reference.
|
Item 14.
|
Principal Accounting Fees and Services
|
Information regarding principal accountant fees and services will be included under the heading "Independent Registered Public Accounting Firm Fees" of the 2018 Proxy Statement and is incorporated herein by reference.
140
|
Item 15.
|
Exhibits, Financial Statement Schedules
|
|
(a)
|
The following documents are filed as part of this report:
|
|
1.
|
Financial Statements
|
Financial statements filed as part of this Annual Report on Form 10-K are listed under Item 8.
|
2.
|
Financial Statement Schedule
|
The financial statement schedule filed as part of this Annual Report on Form 10-K is listed under Item 8.
The separate financial statements and summarized financial information of majority-owned subsidiaries not consolidated and of 50% or less owned persons have been omitted because they are not required pursuant to conditions set forth in Rules 3-09 and 1-02(w) of Regulation S-X.
All other schedules have been omitted because they are not required under the instructions contained in Regulation S-X because the information called for is contained in the financial statements and notes thereto.
|
(b)
|
Exhibits
|
An "Exhibit Index" has been filed as part of this Report beginning on Page E-1 and is incorporated herein by this reference.
Certain of the agreements incorporated by reference into this report contain representations and warranties and other agreements and undertakings by us and third parties. These representations and warranties, agreements and undertakings have been made as of specific dates, may be subject to important qualifications and limitations agreed to by the parties to the agreement in connection with negotiating the terms of the agreement, and have been included in the agreement for the purpose of allocating risk between the parties to the agreement rather than to establish matters as facts. Any such representations and warranties, agreements, and undertakings have been made solely for the benefit of the parties to the agreement and should not be relied upon by any other person.
|
Item 16.
|
Form 10-K Summary
|
None.
141
SIGNATURES
Pursuant to the requirements of Section 13 or 15(d) of the Securities Exchange Act of 1934, the registrant has duly caused this report to be signed on its behalf by the undersigned, thereunto duly authorized.
|
S
EARS
H
OLDINGS
C
ORPORATION
|
|
|
By:
|
/S/
R
OBERT
A. R
IECKER
|
|
Name:
|
Robert A. Riecker
|
|
Title:
|
Chief Financial Officer
|
|
Date: March 23, 2018
|
|
Pursuant to the requirements of the Securities Exchange Act of 1934, this report has been signed below by the following persons on behalf of the registrant and in the capacities stated and on the dates indicated.
|
/S/
E
DWARD
S. L
AMPERT
|
Director, Chairman of the Board of Directors, and Chief Executive Officer (principal executive officer)
|
March 23, 2018
|
|
|
Edward S. Lampert
|
|
||
|
/S/ ROBERT A. RIECKER
|
Chief Financial Officer (principal financial officer and principal accounting officer)
|
March 23, 2018
|
|
|
Robert A. Riecker
|
|
||
|
/S/ PAUL G. DEPODESTA
|
Director
|
March 23, 2018
|
|
|
Paul G. DePodesta
|
|
|
|
|
/S/
KUNAL S. KAMLANI
|
Director
|
March 23, 2018
|
|
|
Kunal S. Kamlani
|
|
|
|
|
/S/
W
ILLIAM
C. K
UNKLER
, III
|
Director
|
March 23, 2018
|
|
|
William C. Kunkler, III
|
|
|
|
|
/S/
A
NN
N. R
EESE
|
Director
|
March 23, 2018
|
|
|
Ann N. Reese
|
|
|
|
|
/S/
T
HOMAS
J. T
ISCH
|
Director
|
March 23, 2018
|
|
|
Thomas J. Tisch
|
|
|
|
142
EXHIBIT INDEX
|
2.1
|
|
|||
|
2.2
|
|
|||
|
2.3
|
|
|||
|
3.1
|
|
|||
|
3.2
|
|
|||
|
4.1
|
|
Registrant hereby agrees to furnish to the Commission, upon request, the instruments defining the rights of holders of each issue of long-term debt of Registrant and its consolidated subsidiaries.
|
||
|
4.2
|
|
|||
|
4.3
|
|
|||
|
4.4
|
|
Fifth Supplemental Indenture, dated as of March 20, 2018, among Sears Holdings Corporation, the guarantors party thereto and Wilmington Trust, National Association, as successor trustee and collateral agent (incorporated by reference to Exhibit 4.1 to Registrant's Current Report on Form 8-K, dated March 20, 2018, filed March 23, 2018 (File No. 001-36693))
|
||
|
4.5
|
|
Indenture, dated as of March 20, 2018, by and among Sears Holdings Corporation, the guarantors party thereto and Computershare Trust Company, N.A. (including form of note) (incorporated by reference to Exhibit 4.2 to Registrant's Current Report on Form 8-K, dated March 20, 2018, filed March 23, 2018 (File No. 001-36693)).
|
||
|
4.6
|
|
Amended and Restated Security Agreement, dated as of March 20, 2018, among Sears Holdings Corporation, the guarantors party thereto and National Association, as Collateral Agent (incorporated by reference to Exhibit 10.2 to Registrant's Current Report on Form 8-K, dated March 20, 2018, filed on March 23, 2018 (File No. 001-36693)).
|
||
|
4.7
|
|
Second Amended and Restated Intercreditor Agreement, dated as of March 20, 2018, by and among Bank of America, N.A. and Wells Fargo Bank, National Association as ABL Agents, and Wilmington Trust, National Association, as trustee (incorporated by reference to Exhibit 10.3 to Registrant’s Current Report on Form 8-K, dated March 20, 2018, filed on March 23, 2018 (File No. 001-36693)).
|
||
|
4.8
|
|
|||
|
4.90
|
|
|||
E-1
|
4.10
|
|
|||
|
4.11
|
|
Second Supplemental Indenture, dated as of March 20, 2018, by and by and between Sears Holdings Corporation and Computershare Trust Company, N.A., as Trustee (including form of note) (incorporated by reference to Exhibit 4.4 to Registrant’s Current Report on Form 8-K, dated March 20, 2018, filed on March 23, 2018 (File No. 001-36693)).
|
||
|
4.12
|
|
|||
|
10.1
|
|
|||
|
10.2
|
|
|||
|
10.3
|
|
|||
|
10.4
|
|
|||
|
10.5
|
|
|||
|
10.6
|
|
|||
|
10.7
|
|
|||
|
10.8
|
|
|||
E-2
|
10.9
|
|
|||
|
10.10
|
|
|||
|
10.11
|
|
|||
|
10.12
|
|
|||
|
10.13
|
|
|||
|
10.14
|
|
|||
|
10.15
|
|
|||
|
10.16
|
|
|||
|
10.17
|
|
|||
|
10.18
|
|
|||
|
10.19
|
|
|||
|
10.20
|
|
|||
|
10.21
|
|
|||
|
10.22
|
|
|||
E-3
|
10.23
|
|
|||
|
10.24
|
|
|||
|
10.25
|
|
|||
|
10.26
|
|
|||
|
10.27
|
|
|||
|
10.28
|
|
|||
|
10.29
|
|
|||
|
10.30
|
|
|||
|
10.31
|
|
|||
|
10.32
|
|
|||
|
10.33
|
|
|||
|
10.34
|
|
|||
|
10.35
|
|
|||
|
10.36
|
|
|||
|
10.37
|
|
|||
|
10.38
|
|
|||
E-4
|
10.39
|
|
|||
|
10.40
|
|
|||
|
10.41
|
|
|||
|
10.42
|
|
|||
|
10.44
|
|
|||
|
10.45
|
|
|||
|
10.46
|
|
|||
|
10.47
|
|
|||
|
10.48
|
|
|||
|
10.49
|
|
|||
|
10.50
|
|
|||
|
10.51
|
|
|||
|
10.52
|
|
|||
|
10.53
|
|
|||
|
*10.54
|
|
|||
|
*10.55
|
|
|||
|
*10.56
|
|
|||
|
*10.57
|
|
|||
E-5
|
*10.58
|
|
|||
|
*10.59
|
|
|||
|
*10.60
|
|
|||
|
10.61
|
|
|||
|
10.62
|
|
|||
|
10.63
|
|
|||
|
10.64
|
|
|||
|
10.65
|
|
|||
|
10.66
|
|
|||
|
10.67
|
|
|||
|
10.68
|
|
|||
|
10.69
|
|
|||
|
10.70
|
|
|||
E-6
|
10.71
|
|
|||
|
10.72
|
|
|||
|
10.73
|
|
|||
|
10.74
|
|
Fourth Amendment to Second Lien Credit Agreement, dated as of March 20, 2018, among Sears Holdings Corporation, Sears Roebuck Acceptance Corp. and Kmart Corporation, as borrowers, the subsidiaries of Sears Holdings Corporation party thereto, the lenders party thereto, and JPP, LLC, as administrative and collateral administrator (incorporated by reference to Exhibit 10.1 to Registrant’s Current Report on Form 8-K, dated March 20, 2018, filed on March 23, 2018 (File No. 001-36693)).
|
||
|
10.75
|
|
|||
|
10.76
|
|
|||
|
10.77
|
|
|||
|
10.78
|
|
|||
|
*10.79
|
|
|||
|
10.80
|
|
|||
E-7
|
10.81
|
|
|||
|
10.82
|
|
|||
|
10.83
|
|
|||
|
10.84
|
|
|||
|
10.85
|
|
|
||
|
10.86
|
|
|||
|
*10.87
|
|
|
||
|
10.88
|
|
|||
|
10.89
|
|
|||
E-8
|
*10.90
|
|
|
||
|
*10.91
|
|
|
||
|
*10.92
|
|
|
||
|
10.93
|
|
|||
|
10.94
|
|
|||
|
10.95
|
|
|||
|
10.96
|
|
|||
|
*12
|
|
|||
|
*21
|
|
|||
|
*23
|
|
|||
|
*31.1
|
|
|||
|
*31.2
|
|
|||
|
*32.1
|
|
|||
|
*32.2
|
|
|||
|
101
|
|
The following financial information from the Annual Report on Form 10-K for the fiscal year ended February 3, 2018, formatted in XBRL (eXtensible Business Reporting Language) and furnished electronically herewith: (i) the Consolidated Statements of Operations for the fiscal years ended February 3, 2018, January 28, 2017 and January 30, 2016; (ii) the Consolidated Statements of Comprehensive Loss for the fiscal years ended February 3, 2018, January 28, 2017 and January 30, 2016; (iii) the Consolidated Balance Sheets at February 3, 2018 and January 28, 2017; (iv) the Consolidated Statements of Cash Flows for the fiscal years ended February 3, 2018, January 28, 2017 and January 30, 2016; (v) the Consolidated Statements of Equity (Deficit) for the fiscal years ended February 3, 2018, January 28, 2017 and January 30, 2016; and (vi) the Notes to Consolidated Financial Statements, tagged as blocks of text and including detailed tags.
|
||
__________________
E-9
|
*
|
Filed herewith
|
|
**
|
A management contract or compensatory plan or arrangement required to be filed as an exhibit to this report pursuant to Item 15(b) of Form 10-K.
|
|
(1)
|
Confidential treatment was granted as to omitted portions of this Exhibit. The omitted material has been filed separately with the Securities and Exchange Commission.
|
E-10
TABLE OF CONTENTS
Part IItem 1. BusinessItem 1A. Risk FactorsItem 1B. Unresolved Staff CommentsItem 2. PropertiesItem 3. Legal ProceedingsItem 4. Mine Safety DisclosuresPart IIItem 5. Market For Registrant's Common Equity, Related Stockholder Matters and Issuer Purchases Of Equity SecuritiesItem 6. Selected Financial DataItem 7. Management's Discussion and Analysis Of Financial Condition and Results Of OperationsItem 7A. Quantitative and Qualitative Disclosures About Market RiskItem 8. Financial Statements and Supplementary DataNote 1 Summary Of Significant Accounting PoliciesNote 2 Sears CanadaNote 3 BorrowingsNote 4 Financial GuaranteesNote 5 Fair Value Of Financial Assets and LiabilitiesNote 6 Interest and Investment LossNote 7 Benefit PlansNote 8 Earnings Per ShareNote 9 EquityNote 10 Income TaxesNote 11 Real Estate TransactionsNote 12 Goodwill and Intangible AssetsNote 13 Store Closing Charges, Severance Costs and ImpairmentsNote 14 LeasesNote 15 Related Party DisclosureNote 16 Supplemental Financial InformationNote 17 Summary Of Segment DataNote 18 Legal ProceedingsNote 19 Quarterly Financial Information (unaudited)Note 20 Guarantor/non-guarantor Subsidiary Financial InformationItem 9. Changes in and Disagreements with Accountants on Accounting and Financial DisclosureItem 9A. Controls and ProceduresItem 9B. Other InformationPart IIIItem 10. Directors, Executive Officers and Corporate GovernanceItem 11. Executive CompensationItem 12. Security Ownership Of Certain Beneficial Owners and Management and Related Stockholder MattersItem 13. Certain Relationships and Related Transactions, and Director IndependenceItem 14. Principal Accounting Fees and ServicesPart IVItem 15. Exhibits, Financial Statement SchedulesItem 16. Form 10-k Summary