UNITED STATES
SECURITIES AND EXCHANGE COMMISSION
Washington, D.C. 20549
FORM 10‑K
(Mark One)
|
x
|
ANNUAL REPORT PURSUANT TO SECTION 13 OR 15(d) OF THE SECURITIES EXCHANGE ACT OF 1934
|
For the fiscal year ended December 31, 2018
OR
|
☐
|
TRANSITION REPORT PURSUANT TO SECTION 13 OR 15(d) OF THE SECURITIES EXCHANGE ACT OF 1934 FOR THE TRANSITION PERIOD FROM TO
|
Commission File Number
001‑38701
SI-BONE, Inc.
(Exact name of Registrant as specified in its Charter)
|
Delaware
|
26-2216351
|
|
(State or other jurisdiction
of incorporation or organization) |
(I.R.S. Employer
Identification No.) |
471 El Camino Real, Suite 101, Santa Clara, California 95050
(Address of principal executive offices including zip code)
Registrant’s telephone number, including area code: (408) 207‑0700
Securities registered pursuant to Section 12(b) of the Act: Common Stock, Par Value $0.0001 Per Share; Common stock traded on the Nasdaq Stock Market
Securities registered pursuant to Section 12(g) of the Act:
None
Indicate by check mark if the Registrant is a well-known seasoned issuer, as defined in Rule 405 of the Securities Act. YES
☐
NO
x
Indicate by check mark if the Registrant is not required to file reports pursuant to Section 13 or 15(d) of the Act. YES
☐
NO
x
Indicate by check mark whether the Registrant: (1) has filed all reports required to be filed by Section 13 or 15(d) of the Securities Exchange Act of 1934 during the preceding 12 months (or for such shorter period that the Registrant was required to file such reports), and (2) has been subject to such filing requirements for the past 90 days. YES
x
NO
☐
Indicate by check mark whether the Registrant has submitted electronically every Interactive Data File required to be submitted pursuant to Rule 405 of Regulation S-T (§232.405 of this chapter) during the preceding 12 months (or for such shorter period that the Registrant was required to submit such files). YES
x
NO
☐
Indicate by check mark if disclosure of delinquent filers pursuant to Item 405 of Regulation S-K (§229.405) is not contained herein, and will not be contained, to the best of Registrant’s knowledge, in definitive proxy or information statements incorporated by reference in Part III of this Form 10‑K or any amendment to this Form 10‑K.
x
Indicate by check mark whether the Registrant is a large accelerated filer, an accelerated filer, a non-accelerated filer, a smaller reporting company, or an emerging growth company. See the definitions of “large accelerated filer”, “accelerated filer”, “smaller reporting company,” and “emerging growth company” in Rule 12b‑2 of the Exchange Act:
|
Large accelerated filer
|
☐
|
Accelerated filer
|
☐
|
|||
|
Non-accelerated filer
|
x
|
Smaller reporting company
|
x
|
|||
|
Emerging growth company
|
x
|
|||||
|
If an emerging growth company, indicate by check mark if the registrant has elected not to use the extended transition period for complying with any new or revised financial accounting standards provided pursuant to Section 13(a) of the Exchange Act.
☐
|
☐
|
|||||
Indicate by check mark whether the Registrant is a shell company (as defined in Rule 12b‑2 of the Exchange Act). YES
☐
NO
x
The registrant’s common stock was not publicly traded as of the last business day of the registrant’s most recently completed second fiscal quarter.
The number of shares of Registrant’s Common Stock outstanding as of
March 13, 2019
was
24,458,938
.
DOCUMENTS INCORPORATED BY REFERENCE
Portions of the Registrant’s Definitive Proxy Statement relating to the Annual Meeting of Shareholders, which will be filed with the Securities and Exchange Commission within 120 days after the end of the Registrant’s fiscal year ended December 31, 2018, are incorporated by reference into Part III of this Report
.
TABLE OF CONTENTS
|
|
Page
|
||
|
PART I
|
|
||
|
PART II
|
|||
|
PART III
|
|||
|
PART IV
|
|||
In this Annual Report on Form 10-K, “we,” “our,” “us,” “SI-BONE,” and “the Company” refer to SI-BONE, Inc. The SI-BONE logo and other trade names, trademarks or service marks of SI-BONE are the property of SI-BONE, Inc. This report contains references to our trademarks and to trademarks belonging to other entities. Trade names, trademarks and service marks of other companies appearing in this report are the property of their respective holders. We do not intend our use or display of other companies’ trade names or trademarks to imply a relationship with, or endorsement or sponsorship of us by, any other companies.
1
Forward-Looking Statements
This Annual Report on Form 10‑K contains forward-looking statements concerning our business, operations and financial performance and condition, as well as our plans, objectives and expectations for our business operations and financial performance and condition. Any statements contained herein that are not statements of historical facts may be deemed to be forward-looking statements. In some cases, you can identify forward-looking statements by terminology such as “aim,” “anticipate,” “assume,” “believe,” “continue,” “could,” “due,” “estimate,” “expect,” “goal,” “intend,” “may,” “objective,” “plan,” “predict,” “potential,” “positioned,” “seek,” “should,” “will,” “would,” and other similar expressions that are predictions of or indicate future events and future trends, or the negative of these terms or other comparable terminology, although not all forward-looking statements contain these words. These forward-looking statements include, but are not limited to, statements about:
|
•
|
our expectation that, for the foreseeable future, a significant portion of our revenues will be derived from sales of the iFuse Implant System, or iFuse;
|
|
•
|
our ability to expand our sales and marketing capabilities to increase demand for iFuse, expand geographically, and obtain favorable coverage and reimbursement determinations from third-party payors;
|
|
•
|
our estimates of our market opportunity;
|
|
•
|
developments or disputes concerning our intellectual property or other proprietary rights;
|
|
•
|
competition in the markets we serve;
|
|
•
|
our expectations of the reliability and performance of iFuse;
|
|
•
|
our expectations of the benefits to patients, providers, and payors of iFuse;
|
|
•
|
our reliance on a limited number of suppliers, including sole source suppliers, which may impact the availability of replacement instruments and materials;
|
|
•
|
the factors we believe drive demand for iFuse and our ability to sustain or increase such demand;
|
|
•
|
our ability to develop additional revenue opportunities, including new devices;
|
|
•
|
the scope of protection we establish and maintain for intellectual property rights covering iFuse and any other device we may develop;
|
|
•
|
our estimates regarding our costs and risks associated with our international operations and international expansion;
|
|
•
|
our ability to retain and recruit key personnel and expand our sales force;
|
|
•
|
our expectations regarding acquisitions and strategic operations;
|
|
•
|
our ability to fund our working capital requirements;
|
|
•
|
our compliance with, and the cost of, federal, state, and foreign regulatory requirements;
|
|
•
|
the factors that may impact our financial results; and
|
|
•
|
anticipated trends and challenges in our business and the markets in which we operate.
|
Forward-looking statements are based on management’s current expectations, estimates, forecasts, and projections about our business and the industry in which we operate, and management’s beliefs and assumptions are not guarantees of future performance or development and involve known and unknown risks, uncertainties, and other factors that are in some cases beyond our control. As a result, any or all of our forward-looking statements in this report may turn out to be inaccurate. Furthermore, if the forward-looking statements prove to be inaccurate, the inaccuracy may be material. In light of the significant uncertainties in these forward-looking statements, you should not regard these statements as a representation or warranty by us or any other person that we will achieve our objectives and plans in any specified time frame, or at all. Factors that may cause actual results to differ materially from current expectations include, among other things, those listed under “Risk Factors” and elsewhere in this report. These statements, like all statements in this report, speak only as of their date, and we undertake no obligation to update or revise these statements in light of future developments. We caution investors that our business and financial performance are subject to substantial risks and uncertainties. Except as required by law, we assume no obligation to update or revise these forward-looking statements for any reason, even if new information becomes available in the future.
2
PART I
Item 1. Business.
Overview
We are a medical device company that has pioneered a proprietary minimally invasive surgical implant system, which we call iFuse, to fuse the sacroiliac joint to treat sacroiliac joint dysfunction that often causes severe lower back pain. Since we introduced iFuse in 2009, more than 37,000 procedures have been performed by over 1,800 surgeons, in the United States and 33 other countries. Published clinical studies have shown that 15% to 30% of all chronic lower back pain is associated with the sacroiliac joint. We believe iFuse is currently used in the majority of minimally invasive surgical fusions of the sacroiliac joint in the United States.
The two sacroiliac joints are the largest joints in the body and connect the sacrum, near the base of the spine, to the iliac bones, the two major bones of the pelvis. The iFuse system includes a series of patented triangular implants, the instruments we have developed to enable the procedure, as well as the diagnostic and surgical techniques we have developed to enable physicians to perform the procedure. We introduced our second generation implant, the iFuse-3D, in 2017. We market our products with a direct sales force and a number of distributors in the United States, and with a combination of a direct sales force and distributors in other countries.
Our growth rate has recently increased, which we attribute in part to more widespread insurance coverage for sacroiliac fusion procedures, with many recent positive payor coverage policies exclusive to our iFuse system, as well as our efforts to educate the market regarding sacroiliac dysfunction. Since January 1, 2018, because of the strength of published clinical evidence on iFuse, 31 U.S. payors have published reimbursement policies exclusively covering the patented triangular design of our iFuse implants and excluding coverage of other products that are intended to fuse the sacroiliac joint. We believe that the full impact of each exclusive coverage decision grows over time as we continue to educate surgeons about the coverage and the medical criteria they need to follow, and train them on the diagnosis and how to perform the iFuse procedure.
In 2018 and 2017, we generated revenue of
$55.4 million
and
$48.0 million
, respectively, a growth rate of
15%
, and incurred net losses of
$17.5 million
and
$23.0 million
, respectively. Our gross margins were
91%
and
89%
for 2018 and 2017, respectively. The number of iFuse procedures performed in 2018 and 2017 was
6,659
and
5,739
respectively.
Our implants have a triangular cross section, which resists twisting of the implant within the bone in which it is implanted, helping stabilize the joint even before fixation of the bone onto the implant, or bony ingrowth, which results in fusion. Products from our competitors use screws to treat the sacroiliac joint, which do not resist twisting within the bone as well as our patented triangular implants. A study we performed showed that our iFuse implants have more than six times the rotation resistance of a screw designed for sacroiliac joint fusion. We hold issued patents on implants with cross-sections of many non-round shapes, including the triangular shape we use for iFuse. We also hold issued patents for the method of placing those implants across the sacroiliac joint, as well as other parts of the spine and pelvis. Each titanium iFuse implant is at least three times the strength of a typical eight-millimeter surgical screw and the larger porous surface area of our implants allows for bony ingrowth. Three of our implants are typically used in each procedure.
The safety, clinical effectiveness, durability of pain relief and reduction in disability, cost effectiveness, and reduction in opioid users that result from iFuse are supported by a large number of studies that have resulted in more than 60 published papers. Several of these papers publish results from three prospective multicenter studies (INSITE, SIFI, and iMIA), two of which were randomized controlled clinical trials. Additionally, there have been several studies showing longer-term follow-up of up to six years.
3
|
•
|
INSITE is a randomized controlled study conducted in the United States. Positive 24-month follow-up results were published in August 2016 in the
International Journal of Spine Surgery
showing statistically significant and clinically important reduction in pain and disability after sacroiliac joint fusion but very little response to maximal non-surgical treatment. In April 2015, INSITE was awarded the “Best Overall Paper” out of approximately 450 submitted clinical study papers at the International Society for Advancement of Spine Surgery, or ISASS, conference
|
||
|
•
|
iMIA is a randomized controlled study conducted in Europe. Positive 24-month results were published in March 2019 in
The Journal of Bone and Joint Surgery
. Like INSITE, results from iMIA show statistically significant and clinically profound reduction in pain and disability after SI joint fusion but little improvement after non-surgical treatment.
|
||
|
•
|
SIFI is a single-arm study conducted in the United States. Positive 24-month follow-up results were published in the
International Journal of Spine Surgery
in April 2016, showing substantial and sustained reduction in pain and disability.
|
||
|
•
|
LOIS is a prospective follow-on study, enrolling subjects at a subset of INSITE and SIFI sites treated with iFuse. Study outcomes at four years were published in July 2018 in Medical Devices: Evidence and Research. Among 103 enrolled subjects, mean sacroiliac joint pain at three years decreased from 82 preoperatively to 28 (a 54-point improvement from baseline, p<.0001).
|
||
|
•
|
A study in
Neurosurgery
published in April 2017 showed similar improvements in pain and disability in patients followed for up to six years. The study also showed a substantial reduction in the number of subjects using opioids in patients treated with iFuse at their last follow-up visit. At the last follow-up visit, 84% of patients who received non-surgical management were using opioids, while only 7% of patients treated with iFuse were using opioids.
|
||
The INSITE clinical trial included 148 subjects treated at 19 centers in the United States, with subjects randomized in a two-to-one ratio to either immediate sacroiliac joint fusion with iFuse or non-surgical management. The study design allowed subjects in the non-surgical management group to cross over and have surgery after six months. By 24 months after the start of the clinical trial, 89% of the non-surgical management group subjects still participating in the trial had elected to cross over to have the iFuse procedure, primarily because they derived little clinical benefit from non-surgical treatments. The study’s results can be summarized as follows:
|
•
|
Reduction in Pain
. There was a statistically significant and clinically important pain reduction in subjects treated with iFuse as compared to very small responses in those treated with non-surgical management. Subjects surgically treated with iFuse had mean 52- 54- and 55-point reductions in sacroiliac joint pain at 6, 12 and 24 months, respectively, as measured by the VAS. By contrast, subjects in the non-surgical management group had only a mean 12-point reduction (p<0.0001) at six months. 12 points is below the commonly accepted 20-point threshold for clinically important improvement. In addition, the non-surgical management group subjects who elected after six months to cross over to have the iFuse procedure had pain reduction similar to that seen in subjects originally assigned to sacroiliac joint fusion with iFuse. At 24 months, the proportion of subjects with a reduction in VAS sacroiliac joint pain of 20 or more points due to the assigned treatment only was 83% in the iFuse group and 10% in the non-surgical management group.
|
||
|
•
|
Reduction in Disability
. There was a statistically significant and clinically important reduction in disability in subjects treated with iFuse as compared to very little response in those treated with non-surgical management. Subjects surgically treated with iFuse had a mean 27-point reduction in disability at six months, on the 0–100 Oswestry Disability Index, or ODI, while subjects in the non-surgical management group had only a mean five-point reduction (p<0.0001). Five points is less than the commonly accepted 15-point threshold to denote a clinically important response. At 24 months, the iFuse group had a mean 28-point reduction in ODI. At six months, the proportion of subjects with ODI improvements of at least 15 points was 72.5% with iFuse treatment and only 13.0% in those undergoing non-surgical management (p<0.0001 for difference in response rate). In addition, the subjects who elected after six months to cross over to have the iFuse procedure had similar reduction in disability as the subjects originally assigned to sacroiliac joint fusion with iFuse. At 24 months, the proportion of subjects with an ODI improvement of at least 15 points with the assigned treatment only was 68.2% and 7.5% in the iFuse and non-surgical management groups, respectively (p<0.0001 for difference in response rate). These are very large differences.
|
||
Patients from certain sites participating in the INSITE study will be followed for up to five years as part of LOIS, a separate long-term study.
4
Surgical revision rate is an important measurement of a treatment’s effectiveness for patients. Studies on lumbar, or lower back, fusion, a different type of spine procedure from iFuse, have shown revision rates as approximately 12%. A study published in
Medical Devices: Evidence and Research
in November 2015 showed that the cumulative four-year revision rate with iFuse was 3.5%. A single surgeon retrospective study published in the
International Journal of Spine Surgery
in January 2017 showed that the cumulative four-year revision rate for screw-based treatment of the sacroiliac joint was five times higher than the cumulative four-year revision rate for iFuse.
Market Opportunity
We estimate that over 30 million American adults have chronic lower back pain
.
For patients whose chronic lower back pain stems from the sacroiliac joint,
our experience in both clinical trials and commercial settings indicates that iFuse could be beneficial for at least 30% of patients who are properly diagnosed and screened for surgery by trained healthcare providers. Approximately 282,000 patients in the United States were estimated to have received multiple non-surgical steroid injections for sacroiliac joint pain in 2018. Based on our market experience and internal estimates, and the assumption that the average person suffering from sacroiliac joint dysfunction has been in pain for five years, we estimate that the potential market for iFuse in the United States could be 279,000 patients annually, for a potential annual market in the United States of approximately $2.7 billion. While we have made significant inroads at penetrating this market, U.S. patients received only 5,094 iFuse procedures in 2018.
Patients with sacroiliac joint dysfunction may experience debilitating pain. We believe that the sacroiliac joint is the last major joint to be addressed by the orthopedic implant industry. Studies have shown that the disability that results from disease of the sacroiliac joint is comparable to the disability associated with a number of other serious orthopedic conditions, such as knee and hip arthritis and degenerative disc disease, each of which has surgical solutions where an implant is used and a multi-billion dollar market exists.
Frequently, sacroiliac joint patients are aging and/or may have experienced one or more of the following events that have contributed to disruption or degeneration of the sacroiliac joint: falls, previous lumbar surgery, automobile accidents, and/or pregnancies. We believe that Americans spend approximately $85.9 billion per year on spine problems and that approximately 65% of people who suffer from sacroiliac pain are women. In the United States, iFuse is intended for sacroiliac joint fusion for conditions including sacroiliac joint dysfunction that is a direct result of sacroiliac joint disruption and degenerative sacroiliitis. This includes conditions whose symptoms began during pregnancy or in the peripartum period and have persisted postpartum for more than six months. In all other countries where iFuse is available commercially, the system is indicated for sacroiliac joint fusion.
Diagnosis
It is often difficult to identify the source of lower back pain. As a result, some surgical procedures performed on the spine have a sub-optimal success rate. For example, published studies of lumbar fusion have shown success rates of only approximately 60%. Unsuccessful spine surgery may result in failed back surgery syndrome, which has been shown to result in high healthcare costs with poor overall relief of pain. Published studies have shown that the sacroiliac joint is a cause of the pain in 32% to 43% of patients who have previously had lumbar fusion surgery and are experiencing recurrent low back pain. We believe low success rates of lumbar fusion are likely related, in many cases, to failure to diagnose the sacroiliac joint as the correct cause of pain.
Since we launched iFuse, we have made considerable investments in teaching healthcare professionals to accurately diagnose sacroiliac joint disorders. We provide instruction and training on how to perform the provocative maneuvers in a physician’s office that can help establish the sacroiliac joint as the source of pain. If provocative tests are positive, surgeons confirm the diagnosis by injecting a small amount of local anesthetic into the joint under fluoroscopic guidance. The sacroiliac joint is confirmed as a pain source if the local anesthetic produces immediate and significant pain reduction. In addition to the differentiated characteristics of our iFuse procedure and triangular iFuse implants, we believe that more accurate diagnosis is part of the reason for the high success and patient satisfaction rates of the iFuse procedure.
Surgical Treatment of Sacroiliac Joint Disease
Patients with sacroiliac joint dysfunction or sacroiliac joint arthritis frequently experience significant pain simply from sitting, standing, or rolling over in bed. These activities result in small movements of the sacroiliac joints and pressure transferred across the joints. The pain can be exacerbated with activity—when a patient walks or runs, for example, the shock from each step is transmitted up the leg, through the iliac bones of the pelvis to the sacroiliac joint. The initial goal in fusion of the sacroiliac joint is to immediately stabilize the joint which very quickly decreases the pain. Following initial stabilization of the sacroiliac joint, the goal is to permanently fuse the joint. We believe our proprietary triangular implants stabilize the joint better and more quickly than competing technologies such as screws.
5
Surgical fusion of the sacroiliac joint with an open surgical technique was first reported in 1908, with further reports in the 1920s. The open procedure uses plates and screws, requires a 6- to 12-inch incision and is extremely invasive. The iFuse procedure involves a 1- to 2-inch incision and is much less invasive. For these reasons, we believe that open surgery for elective sacroiliac joint fusion has become less common in the United States since we introduced iFuse.
Due to its invasiveness, pain, long recovery time, and infrequent use, the open sacroiliac joint fusion procedure was rarely taught in medical school or residency programs. Prior to our launch of iFuse, most spine surgeons were unfamiliar with the sacroiliac joint and had never performed a sacroiliac joint fusion. As a result, when patients presented with lower back pain, spine surgeons often did not include evaluation of the sacroiliac joint in their diagnostic work-up. Surgeons who did recognize the condition typically told their patients they had nothing to offer surgically.
Non-Surgical Treatment of Sacroiliac Joint Disease
Although a number of non-surgical treatments exist for sacroiliac joint pain, they did not provide the level of pain or disability relief seen with the iFuse procedure for the patients participating in the INSITE study. Non-surgical treatments include:
|
•
|
Medical therapy, including opiates and non-steroidal anti-inflammatory medications.
|
||||||||
|
•
|
Physical therapy, which can involve exercises as well as massage.
|
||||||||
|
•
|
Intra-articular injections of steroid medications, which are typically performed by physicians who specialize in pain treatment or anesthesia.
|
||||||||
|
•
|
Radiofrequency ablation, or the cauterizing, of the lateral branches of the sacral nerve roots.
|
||||||||
Our Solution—The iFuse Implant System
Our iFuse system, which includes our implants and instruments, is designed to address the shortcomings of alternative treatments, including open surgery, non-surgical management, and screw-based fusion procedures. As shown in the graphic below, our iFuse implants are triangular, and three implants are typically used in each procedure. Our implants are made of titanium and have a porous surface. Each iFuse implant is at least three times the strength of a typical eight-millimeter surgical screw and the large porous surface area allows fixation of the bone to the implants. We introduced the original iFuse implants in 2009, and our second generation iFuse-3D implants in 2017.
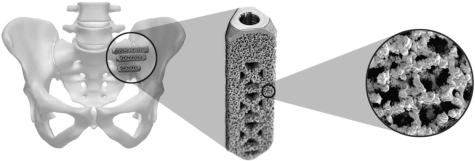
The iFuse procedure is typically performed under general anesthesia. The surgeon uses a custom instrument set we provide to prepare a triangular channel for each implant through the ilium, across the sacroiliac joint, and into the sacrum. An iFuse implant is then pressed into the triangular channel, which is slightly smaller than the implant, creating what is known as an interference fit. The triangular cross section of our iFuse implants, as shown below, prevents them from rotating. Our triangular iFuse implants cross the sacroiliac joint and provide immediate joint stability, which is why we believe pain diminishes soon after the iFuse procedure. Over time, bone grows onto the implants and across the joint, permanently stabilizing or fusing the joint.
By contrast, open fusion of the sacroiliac joint, as well as the minimally invasive solutions offered by other companies, typically use screws and/or plates for fixation. When placed across the sacroiliac joint, standard orthopedic screws, which lack features to encourage biologic fixation, have an exhibited propensity to rotate and loosen over time. Because of the triangular shape, porous surface, strength, and other differentiating factors of our iFuse implants, we believe that our published clinical data do not apply to other minimally invasive solutions. Little published evidence of safety, clinical effectiveness, durability, or economic utility currently exists for sacroiliac fusion devices other than iFuse. We are unaware of any data to show that our competitors’ sacroiliac joint screws, with features allowing biologic fixation, have a lower rate of loosening than standard orthopedic screws. In addition, placement of plates for open fusion procedures typically requires larger incisions and more invasive dissection, which results in longer recovery times and increased morbidity. We believe that the differences between iFuse and other products, as well as the substantial published
6
clinical evidence showing the safety and effectiveness of iFuse, are the reason why a growing number of payors have recommended that iFuse be reimbursed for sacroiliac surgery to the exclusion of other technologies that are designed for the procedure.
Our implants cross the sacroiliac joint and provide immediate stability, which is why we believe pain diminishes soon after the iFuse procedure. Typically, surgeons recommend protected weight-bearing for three weeks. However, post-operative instructions are patient-specific and some patients are allowed to perform weight-bearing activities sooner. Follow-up studies have shown that bony bridging across the sacroiliac joint is present in the majority of cases five years after the iFuse procedure.
Three implants are used in most iFuse procedures. Each implant bridges across the joint from the iliac bone to the sacrum. Placing each implant requires four basic steps:
|
•
|
Pin
. The surgeon inserts a guide pin through the iliac bone, across the sacroiliac joint and into the sacrum.
|
|||||
|
•
|
Drill
. Surgeons drill over the guide pin, through the iliac bone, across the sacroiliac joint and just into the sacrum. This step is optional if using the sharp-tip broach.
|
|||||
|
•
|
Broach
. The surgeon impacts a triangular broach over the pin which prepares a triangular channel that is slightly smaller than the iFuse implant.
|
|||||
|
•
|
Implant
. The surgeon impacts the implant into the triangular channel thereby spanning the sacroiliac joint and docking the implant in the sacrum. The channel is slightly smaller than the implant, which produces an interference fit.
|
|||||
iFuse is a cannulated system, which means that the drill, broach and implants have hollow channels which fit over the pin for guidance purposes. As is typical across the orthopedic implant industry, a member of our team is normally present in the operating suite during surgery to provide technical assistance for the use of iFuse.
We currently offer three custom instrument sets for surgical placement of iFuse implants in the body. The standard set comprises largely stainless steel materials; the XL (Extra Long) set is the same as the standard set but most instruments are elongated by three inches for treatment of larger patients; and the radiolucent set comprises instruments made with more radiolucent materials, such as PEEK and aluminum to improve visualization under fluoroscopy during an iFuse procedure. We also have instrument sets which have been cleared for use with Medtronic’s surgical navigation system and with the Mazor surgical robot.
Our Published Studies
iFuse is the only minimally invasive product for sacroiliac joint fusion commercially available in the United States that, to our knowledge, is supported by substantial high-quality published evidence of safety, clinical effectiveness, durability, and economic utility.
These benefits are supported by more than 65 published papers (48 of which we financially supported), including two prospective, randomized controlled multi-center clinical trials referred to as “INSITE” and “iMIA” respectively, and a prospective multi-center clinical study referred to as “SIFI.” INSITE 24-month follow-up results were published in August 2016 in
International Journal of Spine Surgery
. Six-month and one-year summaries were also published in reputable journals. Twenty-four month results from iMIA were published in the March 2019 issue of
The Journal of Bone and Joint Surgery
, a general orthopedics journal. A prospective, follow-on study called “LOIS” tracks certain study participants from INSITE and SIFI for up to five years after their initial surgery. A four-year summary from LOIS was published in
Medical Devices Evidence & Research
in July 2018. Published results from each of these studies demonstrate clinically important and statistically significant improvement in sacroiliac joint pain, disability due to lower back pain, quality of life, and patient satisfaction. Moreover, the level of published evidence supporting the safety and effectiveness of sacroiliac joint fusion using iFuse is high.
In the United States, the iFuse Implant System is FDA-cleared with the following indication statement: The iFuse Implant System
®
is intended for sacroiliac fusion for conditions including sacroiliac joint dysfunction that is a direct result of sacroiliac joint disruption and degenerative sacroiliitis. This includes conditions whose symptoms began during pregnancy or in the peripartum period and have persisted postpartum for more than six months. Clinical studies have demonstrated that treatment with the iFuse Implant System improved pain, patient function, and quality of life.
iFuse-3D, which was FDA-cleared in 2017, has a very similar indication statement but does not have the statement regarding improvement in pain, function, and quality of life. In the United States, our marketing strategies must adhere to the above statements. In all other countries, the indication statement for the iFuse Implant System (including iFuse-3D) more broadly indicates that the device is indicated for sacroiliac joint fusion.
7
INSITE Study Design
INSITE is a prospective multicenter randomized controlled trial conducted in the US. This section describes INSITE in more detail.
INSITE enrollment took place between January 2013 and May 2014 at 19 sites in the United States. Adults between 21 and 70 years old were eligible to participate if they had a confirmed diagnosis of sacroiliac dysfunction due to degenerative sacroiliitis and/or sacroiliac joint disruption. Diagnosis was based on the subject’s history, provocative tests performed in the surgeon’s office, and at least a 50% decrease in sacroiliac joint pain 30 to 60 minutes after local anesthetic was injected into the joint under image guidance. Eligibility required a sacroiliac VAS pain score of at least 50, where zero represents no pain and 100 represents the worst pain imaginable, as well as a baseline ODI score of at least 30, which has a scale of 0-100, where zero represents no disability and scores greater than 60 represent very severe disability.
Exclusion criteria included inability to diagnose pain related to the sacroiliac joint, sacroiliac joint pain due to inflammatory conditions, severe back pain deemed to be due primarily to other causes, history of recent major trauma to the pelvis, metabolic bone disease, or any condition that made treatment with the study devices infeasible or interfered with the ability to participate in physical therapy. Subjects involved in litigation, on disability leave, or receiving workers’ compensation related to their back or sacroiliac joint pain were also excluded.
Subjects were randomly assigned to sacroiliac joint fusion or non-surgical management in a two to one ratio. After six months of follow-up, subjects could elect to receive sacroiliac joint fusion surgery using iFuse. All of the subjects who were randomized to non-surgical management completed at least six months of follow-up before electing to cross over to surgery. There was no early crossover. Baseline assessments included medical history and physical examination. Subjects were scheduled for follow-up at 1, 3, 6, 12, 18, and 24 months after enrollment. At each follow-up, the subjects evaluated their pain and disability by completing questionnaires to assess pain and disability.
Subjects assigned to non-surgical management began immediately with treatment consisting of one or more of the following: 1) management of pain with medication, including narcotics; 2) physical therapy; 3) steroid injections in the sacroiliac joint; and 4) radiofrequency ablation of local nerves. Physical therapy followed American Physical Therapy Association, or APTA, guidelines. Not all non-surgical management interventions were provided to all non-surgical management subjects. Non-surgical management interventions were provided serially, typically in order of increasing invasiveness, according to individual needs.
A high-resolution pelvic CT scan was performed at the 24-month follow-up for those subjects randomized to and treated with iFuse. The primary purpose of the CT scan is to judge the adherence of bone onto the implants on both the sacral and iliac sides of the sacroiliac joint and to determine whether there is bone bridging across the joint. Other radiographic endpoints were assessed as well.
The study required that subjects receive only the assigned treatment to month six. After six months, the study allowed subjects assigned to non-surgical treatment to cross over to surgery. Crossover was allowed because the anticipated success rate for non- surgical management was low, and many subjects would not have participated without the ability to cross over to surgical care within the study. One-hundred percent of subjects who crossed over to surgical treatment in the study did so shortly after their six-month visit was complete in compliance with the design of the study. Nearly 90% of non-surgical management subjects still participating at month six crossed over to surgical care. All subjects who crossed over had sacroiliac joint fusion using iFuse and were subsequently evaluated with follow-up visits. No early crossover occurred.
In the study, 442 subjects at 19 centers were screened for participation, of which 148 were enrolled and treated. Mean subject age was 51 years and 18 (12%) were 65 years of age or older. Most subjects (94.6%) were Caucasian and approximately two-thirds were female. Follow-up was excellent with 96% of non-surgical subjects having 6-month follow-up and 87% of sacroiliac joint fusion patients having 24-month follow-up.
The primary endpoint was a composite success or failure endpoint. Success was defined as reduction from baseline VAS sacroiliac joint pain by at least 20 points, absence of device-related serious adverse events, absence of neurological worsening related to the sacral spine, and absence of surgical re-intervention (removal, revision, reoperation, or supplemental fixation) for sacroiliac joint pain. Secondary endpoints included improvement from baseline in VAS, ODI, as well as treatment satisfaction and other criteria. Other important measures included quality of life assessments.
Enrolled subjects were highly debilitated by sacroiliac joint pain as indicated by high baseline VAS scores (mean 82.3) and ODI scores (mean 56.8). Nineteen percent were not working due to chronic pain. The duration of pain prior to enrollment averaged 6.4 years (range 0.5 to 40.7 years), and 87.2% had had pain for more than one year and 73.6% had pain for more than two years.
8
Trial subjects had previously undergone sacroiliac-specific physical therapy (72.3% of subjects), sacroiliac steroid injections (85.8%) and radiofrequency ablation of the sacroiliac joint (16.2%). Approximately two-thirds were taking opioid pain medications at baseline and all reported that multiple activities commonly caused or worsened their sacroiliac joint pain.
All subjects assigned to sacroiliac joint fusion underwent the procedure. Of the subjects assigned to surgery, 76 had the iFuse procedure on one sacroiliac joint, while 26 underwent the procedure on both sacroiliac joints. Mean procedure time was 45 minutes (range 14 to 140 minutes). Mean estimated blood loss was 33 ml (range 0.5 to 250 ml). Three implants were used in 91.2% of cases and most implants were seven millimeters in diameter. The hospital length of stay ranged from zero to seven days, and 97.1% were discharged in two days or less.
Of the 46 subjects assigned to non-surgical management:
|
•
|
All but one received physical therapy during the six months after treatment assignment;
|
|||||
|
•
|
73.9% underwent at least one steroid injection;
|
|||||
|
•
|
45.7% underwent radiofrequency ablation of the sacroiliac joint; and
|
|||||
|
•
|
87.0% underwent at least two types of non-surgical management treatments in addition to pain medications.
|
|||||
The above data suggests that the intensity of non-surgical management interventions was high and representative of that provided in standard clinical practice.
INSITE clinical outcomes can be summarized as follows.
|
•
|
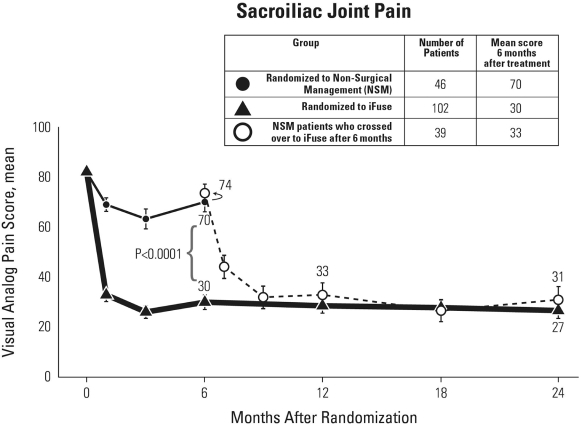
Reduction in Pain
. There was a statistically significant and clinically important reduction in pain among subjects treated with iFuse as compared to non-surgical management. As shown in the graph below, subjects surgically treated with iFuse had a mean 52-point VAS reduction in sacroiliac joint pain at six months. The reduction in pain was sustained with a mean 54- and 55-point reduction in sacroiliac joint pain observed at 12 and 24 months, respectively. By contrast, subjects in the non-surgical management group had only a mean 12-point reduction (p<0.0001) at six months. In addition, the non-surgical management group subjects who elected after six months to cross over to have the iFuse procedure had pain reduction similar to that seen in subjects originally assigned to sacroiliac joint fusion with iFuse. At 24 months, the proportion of subjects with a reduction in VAS sacroiliac joint pain of 20 or more points was 83% in the iFuse group and 10% in the non-surgical management group.
|
||
9
Subjects who elected not to cross over to surgery had reduced pain at six months, but their pain worsened somewhat over time. In contrast, the non-surgical management group subjects who elected to cross over to have the iFuse procedure had pain reduction similar to that seen in subjects originally assigned to sacroiliac joint fusion with iFuse. These clinically important differences show the effectiveness of sacroiliac joint fusion with iFuse.
|
•
|
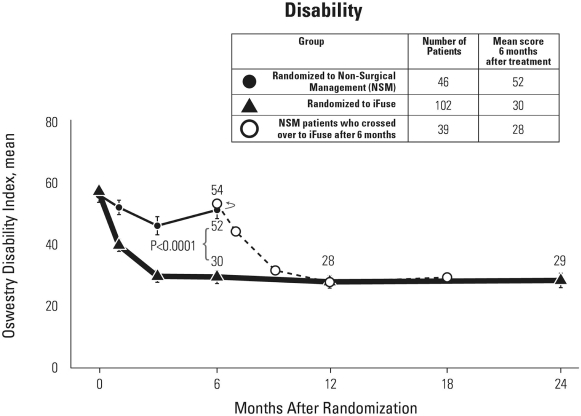
Reduction in Disability
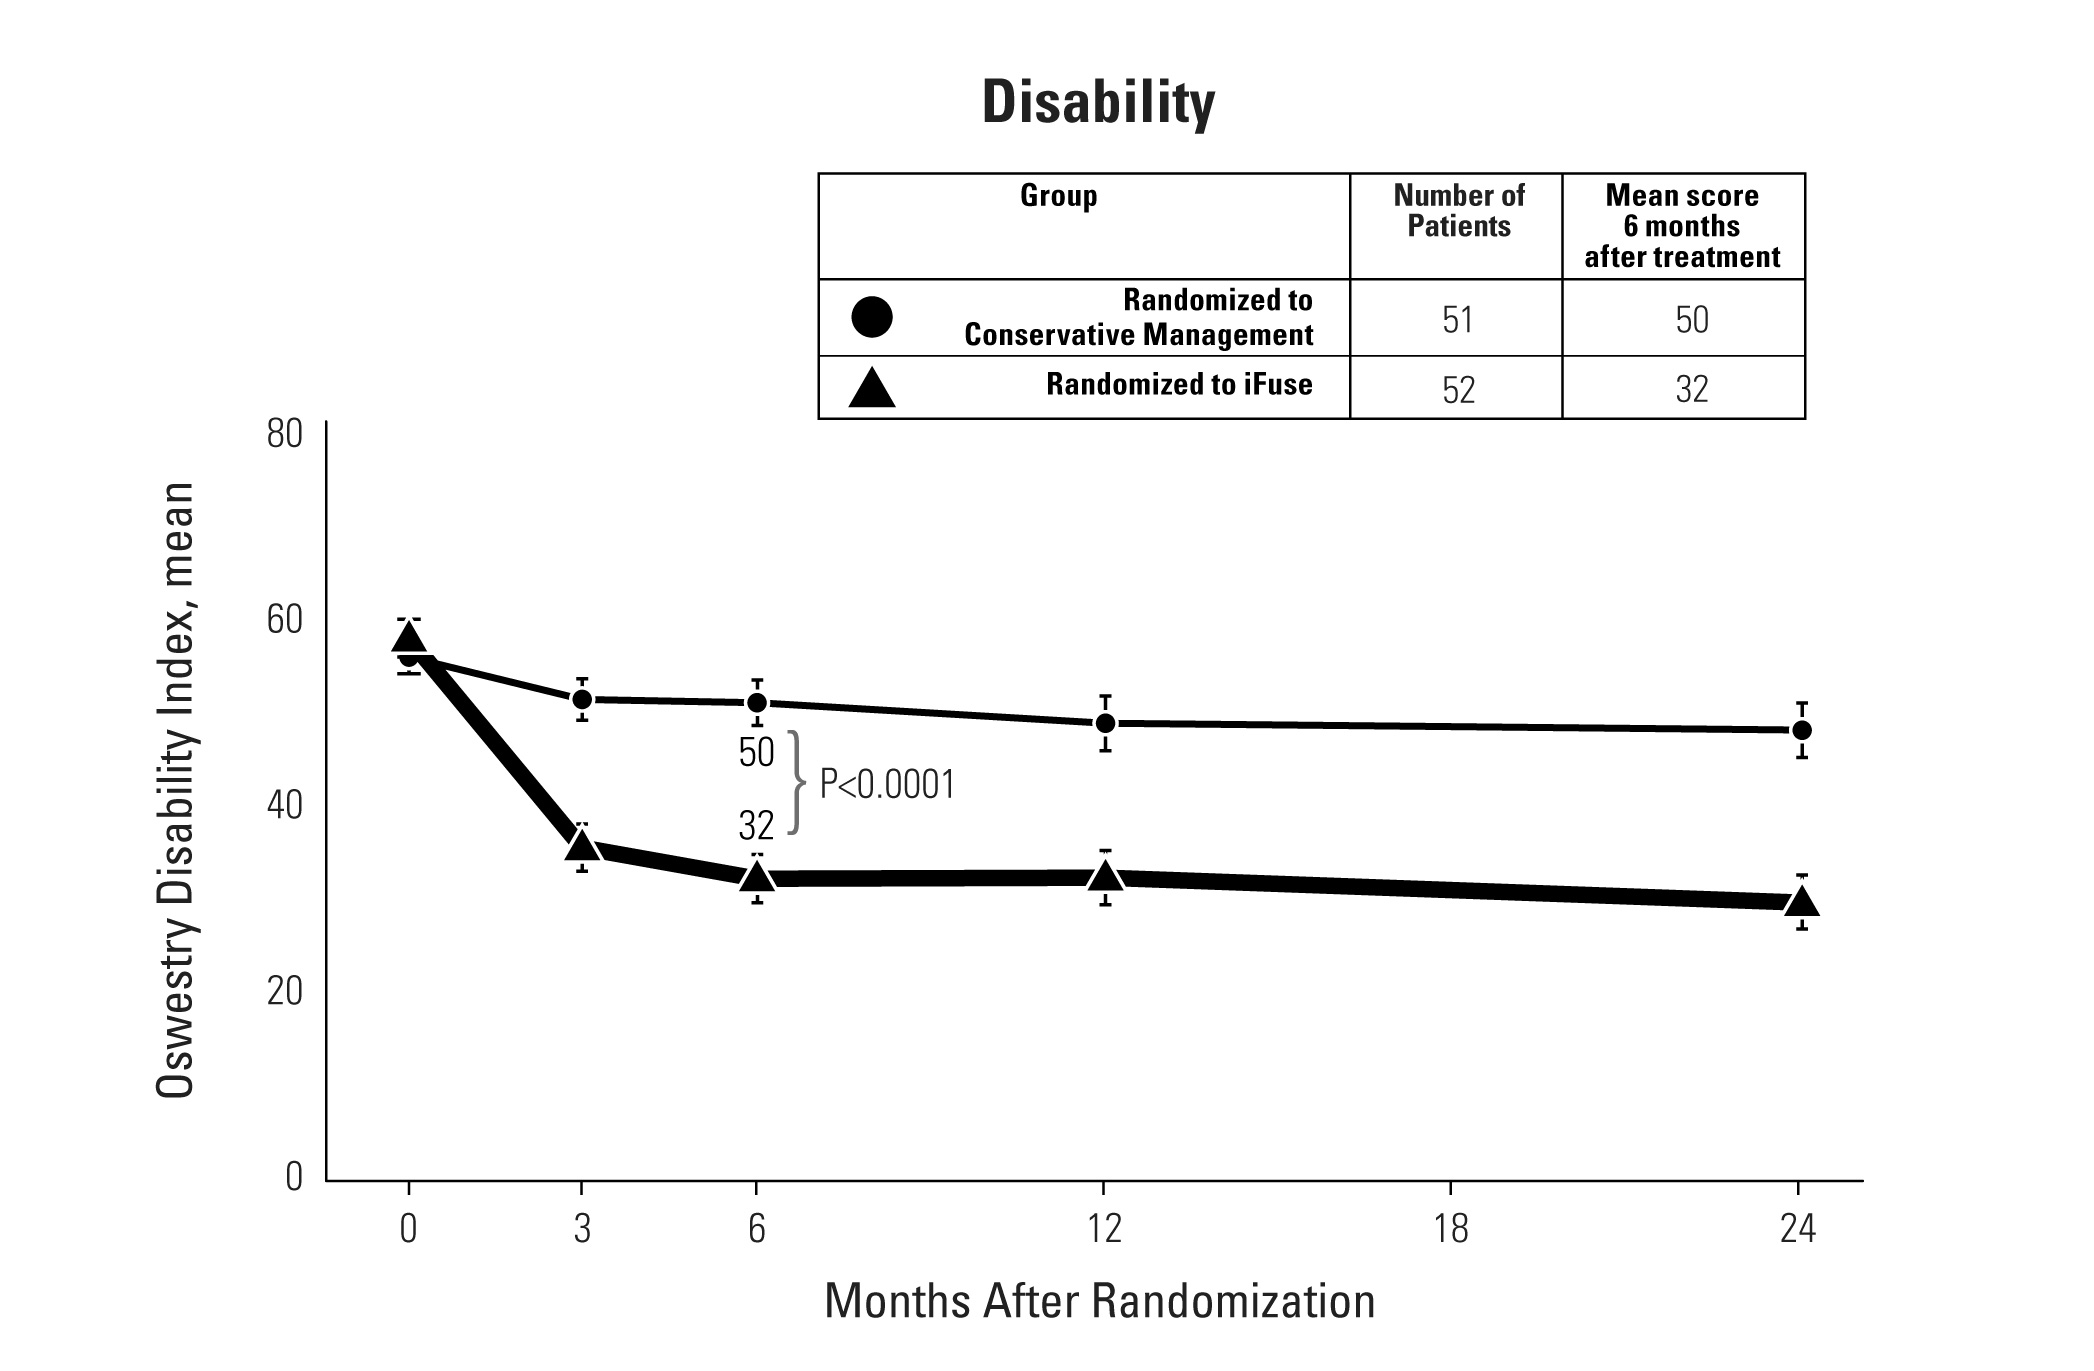
. There was a statistically significant reduction in disability with iFuse as compared to non-surgical management. As shown in the graph below, subjects surgically treated with iFuse had a mean 27-point ODI reduction in disability at six months, while subjects in the non-surgical management group had only a mean 4.6-point decrease (p<0.0001). At 12 and 24 months, the iFuse group had a mean 29- and 28-point reduction in disability, respectively. At six months, the proportion of subjects with ODI improvements of at least 15 points was 72.5% and 13.0% in the iFuse and non-surgical management groups, respectively. At 24 months, the proportion of subjects with an improvement of at least 15 points due to the assigned treatment was 68.2% and 7.5% in the iFuse and non-surgical management groups, respectively (p<0.0001).
|
||
As shown in the figure below, the subjects who elected after six months to cross over to have the iFuse procedure had similar reduction in disability as the subjects originally assigned to sacroiliac joint fusion with iFuse. These clinically important differences show the effectiveness of sacroiliac joint fusion with iFuse.
10
Patient Satisfaction
Patient satisfaction was assessed by asking subjects whether they were very satisfied, somewhat satisfied, somewhat dissatisfied or very dissatisfied with the treatment received. At six months, 79.0% of subjects who had received the iFuse procedure were very satisfied, compared with 27.3% of subjects in the non-surgical management group. At six months, 81.0% of surgery subjects said they would definitely have the procedure again. At 24 months, satisfaction rates were high, with 73.3% reporting being very satisfied with surgical treatment of the sacroiliac joint, and 71.1% indicated they would have the procedure again. These results are consistent with the satisfaction results from other iFuse studies, covering approximately 500 subjects.
Adverse Events
During the first six months, the mean number of adverse events per subject was slightly but not statistically significantly higher in the surgery group (1.3 events) as compared to the non-surgical management group (1.1 events, p=0.3063). The most common adverse event related to our implant was leg pain resulting from misplacement of the implant, resulting in impingement of the implant on a lumbar spine nerve root. The most common adverse event for our implant procedure has been minor wound infections. None of these adverse events required surgical treatment. The following table shows the number and percentages of subjects who had adverse events related to the iFuse device and the iFuse procedure.
11
|
Non-Surgical
Management (n=46) |
Sacroiliac
Joint Fusion (n=102) |
|||||||||||
|
N (%*)
|
N (%)
|
|||||||||||
|
Category
|
||||||||||||
|
Related to iFuse implant
|
||||||||||||
|
Definitely related
|
—
|
|
2 (2.0%)
|
|||||||||
|
Probably related
|
—
|
|
1 (1.0%)
|
|||||||||
|
Total
|
—
|
|
3 (2.9%)
|
|||||||||
|
Related to non-surgical management or iFuse procedure**
|
||||||||||||
|
Definitely related
|
3 (6.5%)
|
|
6 (5.9%)
|
|||||||||
|
Probably related
|
1 (2.2%)
|
|
10 (9.8%)
|
|||||||||
|
Total
|
4 (8.7%)
|
|
16 (15.7%)
|
|||||||||
|
*
|
Percent reported as number of events divided by number assigned to treatment.
|
|||||||||||
|
**
|
Events from first 180 days shown.
|
|||||||||||
In summary, we believe the INSITE study, a prospective, randomized controlled multi-center clinical trial, provides substantial evidence of clinically important and statistically significant efficacy supporting the superiority of sacroiliac joint fusion using iFuse as compared to non-surgical management. Further, the fact that subjects who crossed over responded, as well as those who were originally assigned to the iFuse group, adds significantly to the trial’s validity and importance.
iMIA European Clinical Trial
iMIA is a second prospective, randomized clinical trial of sacroiliac joint fusion using iFuse compared to non-surgical management with a design very similar to that of INSITE. iMIA enrolled and included treatment of 103 subjects at nine sites in four European countries. The trial’s six-month results were published in European Spine Journal in May 2016 and 12-month results were published in August 2017 in
Pain Physician
. Twenty-four month results were published in March 2019 in
The Journal of Bone and Joint Surgery
.
In iMIA, 103 adults with chronic sacroiliac joint pain at nine sites in four European countries were randomly assigned in a one-to-one ratio to either immediate sacroiliac joint fusion with iFuse or conservative management. Conservative management was performed according to the European guidelines for the diagnosis and management of pelvic girdle pain and consisted of optimization of medical therapy, individualized physical therapy and adequate information and reassurance as part of a multifactorial treatment.
At 24 months, low back pain in the surgically treated group improved by 45 points and ODI improved by 26 points (p<.0001 from baseline). Adverse events occurred at a low rate and the frequency of adverse events did not differ meaningfully between groups. One case of postoperative nerve impingement occurred in the surgical group, which was resolved by repositioning the implant.
The figure below shows low back pain scores at baseline and throughout follow-up, as well as several other endpoints. The results show clinically profound, rapid and sustained reduction in pain following treatment with iFuse, in contrast with conservative management. The results also show parallel improvements in disability and quality of life.
12
The figure below shows mean ODI scores at baseline and throughout follow-up. The results show clinically profound, rapid and sustained reduction in disability following treatment with iFuse, in contrast with conservative management.
13
SIFI Clinical Trial
Sacroiliac Joint Fusion with iFuse Implant System, or SIFI, is a prospective, multicenter single-arm clinical trial. Eligibility criteria and endpoints were identical to INSITE. A manuscript summarizing 24-month results was published in
International Journal of Spine Surgery
in April 2016. Each of the 172 enrolled subjects received the iFuse procedure at one of 26 participating sites between August 2012 and December 2013. Mean subject age was 51 years and 96.5% of subjects were Caucasian and approximately 70% were female. Follow-up rates at month 6, 12, and 24 were 97%, 91%, and 87%, respectively.
Baseline sacroiliac pain and disability scores were high. The mean baseline VAS score was 79.8, while the mean baseline ODI score was 55.2. The mean duration of pain prior to enrollment was five years (range 0.4 to 41 years), and 84.3% had had pain for more than one year and 64.5% had had pain for more than two years.
Seventy-six percent were taking opioid pain medications at baseline and all reported that multiple activities commonly caused their sacroiliac joint pain. Many subjects (44.2%) had a history of prior lumbar fusion, and concomitant spine disease was common. Sacroiliac joint pain persisted despite prior treatments with physical therapy (64.5% of subjects), sacroiliac joint steroid injections (94.2%), and prior radiofrequency ablation of the joint (15.7%).
Hospital length of stay ranged from zero to seven days, and 95.3% were discharged in two days or less. Prolonged hospital stays were related to subject comorbidities, not procedure-related adverse events.
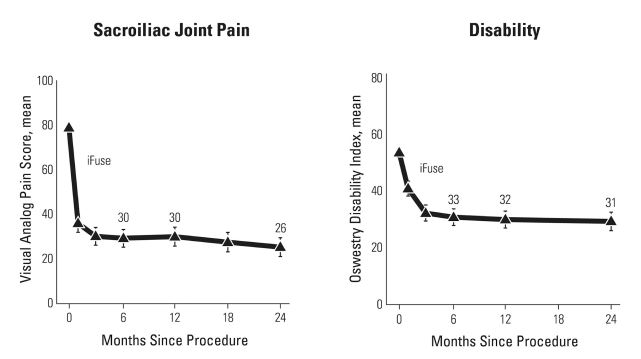
The figure on the left below shows mean VAS pain scores at baseline and throughout follow-up. The figure on the right shows mean ODI scores at baseline and throughout follow-up. The results for both VAS pain and ODI scores each show clinically important and sustained reduction in disability across the subject population and follow-up period, consistent with the results observed in the surgical group in INSITE.
14
Satisfaction rates were high, with 78.1% reporting being very satisfied with sacroiliac joint treatment by month 24 and 93.8% being very or somewhat satisfied. 74.7% indicated they would definitely have the procedure again; 88.4% indicated they would probably or definitely have the procedure again.
The most common adverse events were wound infection, irritation or drainage, sacroiliac joint pain related to implant malposition, and recurrent sacroiliac joint pain related to inadequate device placement. One subject had a deep wound infection that required surgical debridement. Four adverse events (2.4% of all subjects) were rated by the investigator to be definitely device-related and three (1.8%) were probably device-related. Pain related to implant impingement on sacral nerve roots occurred in three cases (including one non-study-related side), all of which resolved with immediate repositioning of implants. In four cases, sacroiliac joint or hip pain was attributed to the presence of an implant or bone growth around the implant. Twenty-six events were rated as probably or definitely related to the placement procedure.
LOIS Clinical Trial
LOIS is a prospective follow-on study, enrolling subjects at a subset of INSITE and SIFI sites who underwent sacroiliac joint fusion. Enrolled subjects will be followed out to five years following surgery. Study outcomes at four years were published in
Medical Devices: Evidence and Research
in August 2018. Among 103 enrolled subjects, mean sacroiliac joint pain at four years decreased from 82 preoperatively to 27 (a 54-point improvement from baseline, p<.0001), as shown in the graph below.
15
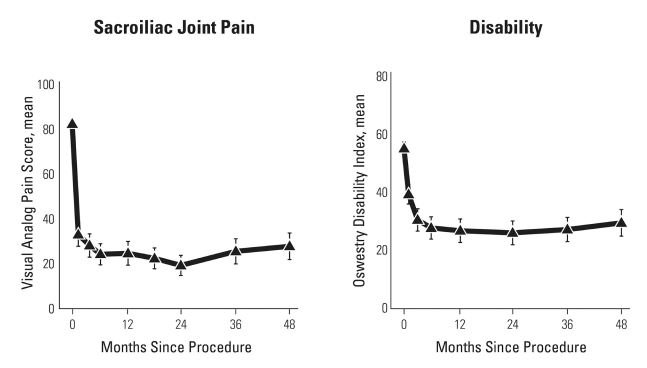
Subjects in the LOIS study experienced similar improvements in disability and quality of life. As shown in the graph above on the right, average disability prior to treatment as measured on the ODI scale was 56 and fell to an average of 30 by 48 months following treatment, a 26 point improvement compared to the commonly accepted 15-point threshold for meaningful change in this measure. Quality of life scores also improved markedly in this study. Average quality of life as measured by the EuroQol-5D prior to treatment was 0.45 and had improved to 0.75 by 48 months following treatment with iFuse.
Additional Published Clinical Studies
We have demonstrated the long-term durability of pain relief resulting from treatment with iFuse in several other published studies. A study published in the
Open Orthopedics Journal
in 2014, which we financially supported, showed that significant clinical pain relief observed at 12 months was maintained for five years. Similar results with four and one-half year follow-up were published in the
Journal of Spine
in 2014. A retrospective multicenter analysis of three-year outcomes after sacroiliac joint fusion with iFuse showed similar responses.
Among eleven clinical studies including more than 500 patients in which satisfaction with the iFuse procedure was measured, an average of 92% of participants were satisfied or very satisfied with the results of the surgery. We financially supported nine of these 11 studies.
To date, several studies, some of which we did not sponsor, have been published on the safety and effectiveness of sacroiliac joint fusion using iFuse. These are prospective or retrospective, single site or multi-site, and U.S.- or Europe-based. These clinical studies demonstrate the iFuse procedure to be safe and effective. These studies demonstrate pain reduction and/or ODI improvement that is statistically significant and clinically important. The type and rate of reported adverse events were similar to those reported in INSITE, iMIA, and SIFI. These additional studies are consistent with the results of INSITE, iMIA, and SIFI.
A study published in April 2017 in
Neurosurgery
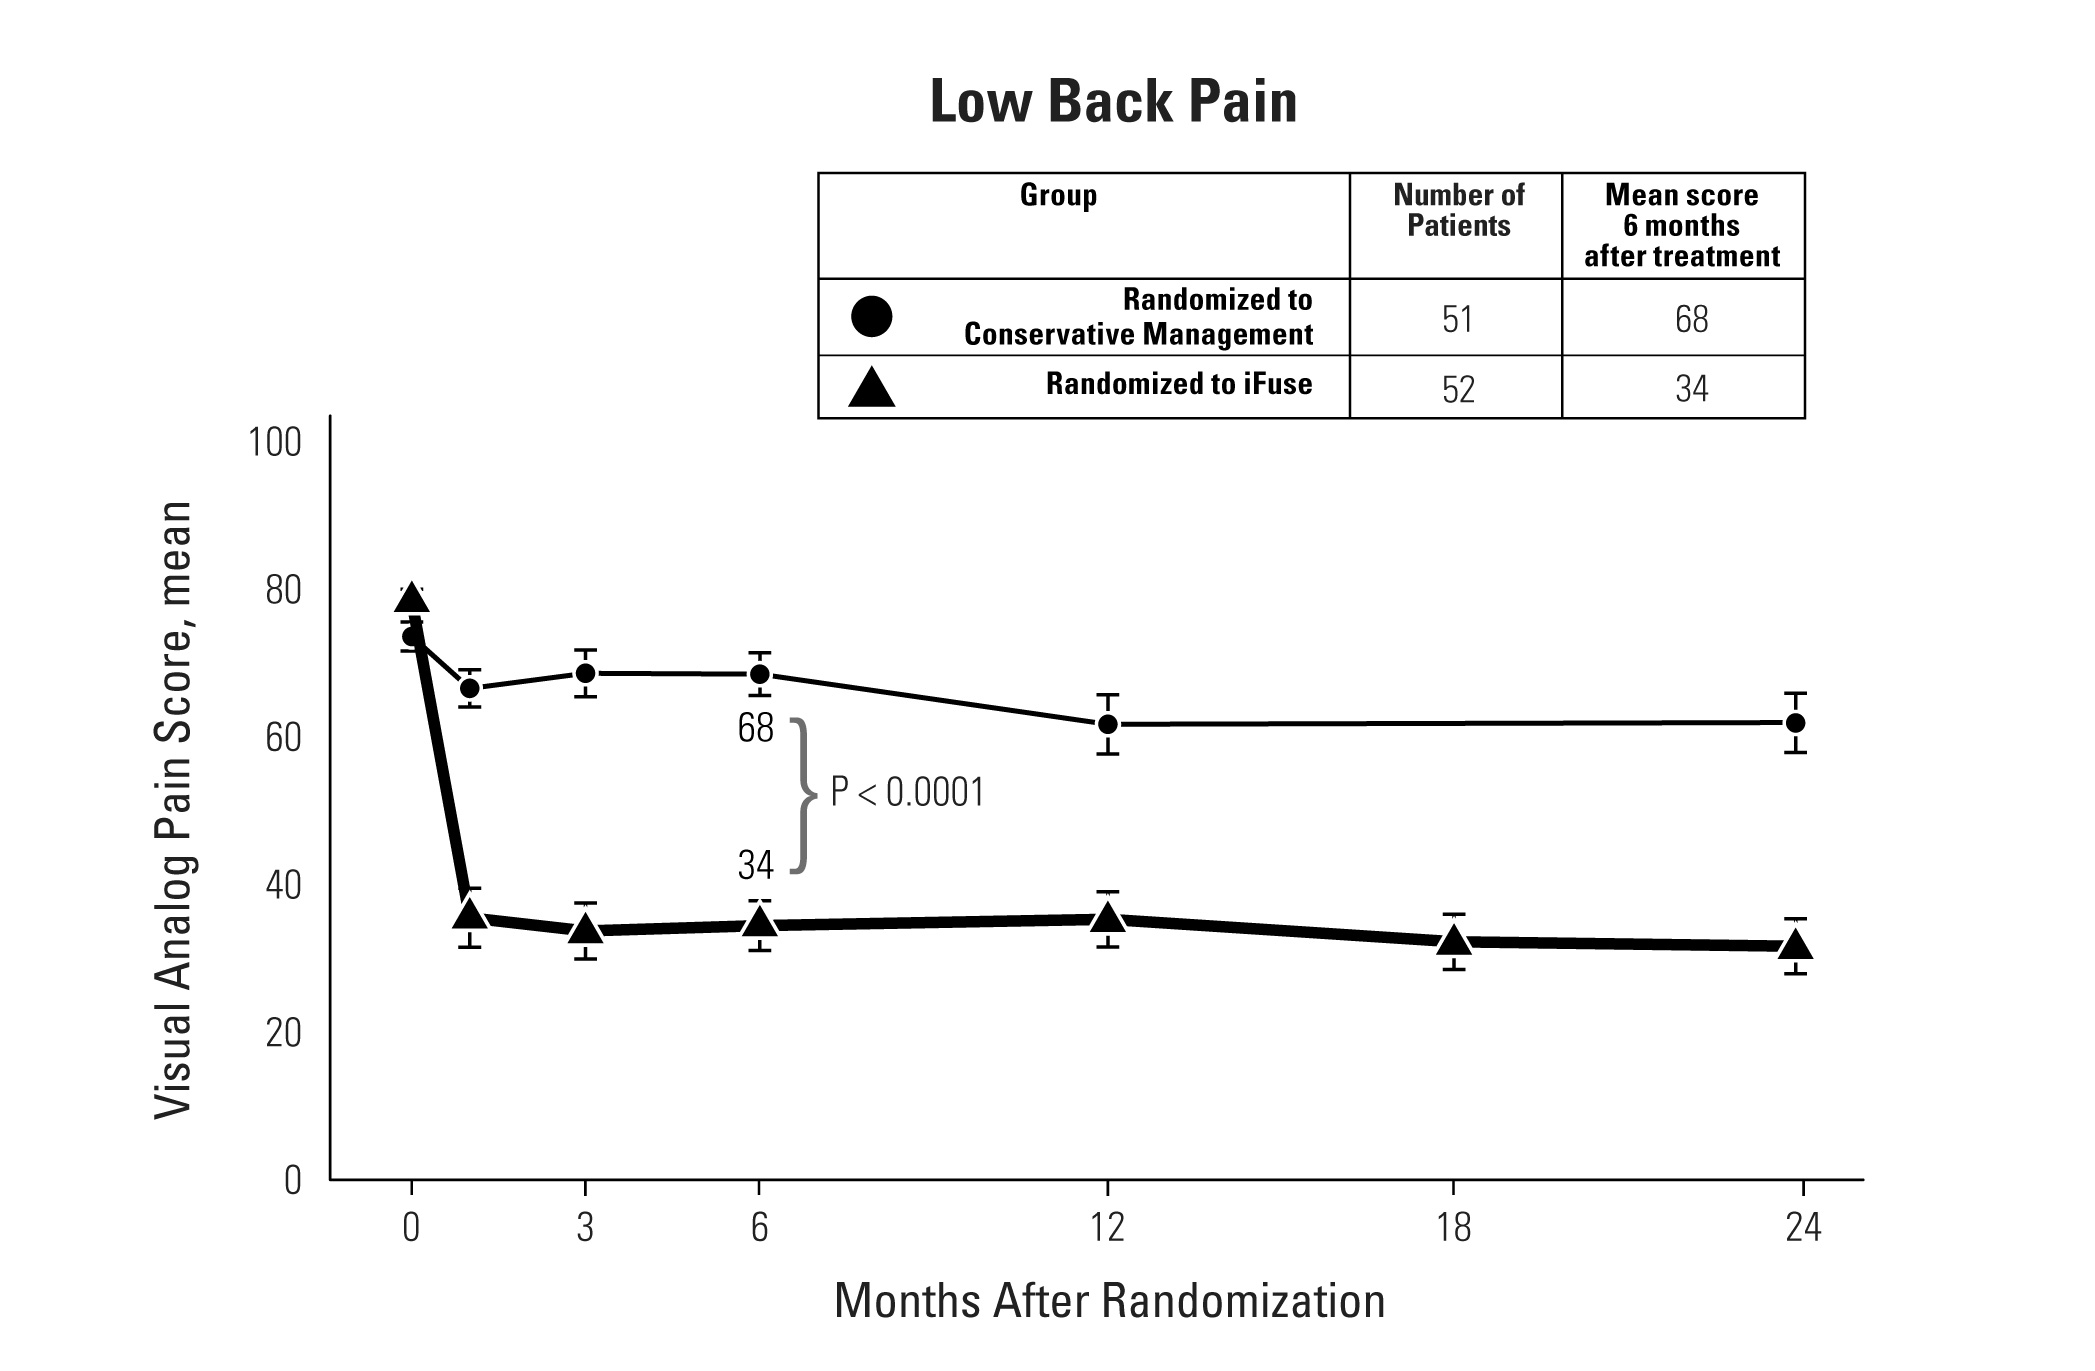
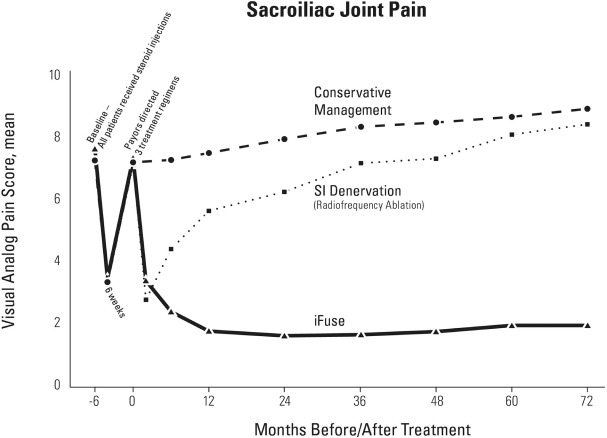
shows the impact of non-coverage of sacroiliac joint fusion by the healthcare system. In this study, a Spanish neurosurgeon reports the clinical experience of 423 patients seen in his clinic for sacroiliac joint pain. While many patients’ pain resolved without intervention, 152 of the patients (36%) had continued sacroiliac joint pain. Of these patients, 74 did not have access to the procedure due to their insurers’ denial of coverage and instead were only able to pursue continued non-surgical treatment. Of the remaining 78 patients, 51 underwent radiofrequency ablation of lateral branches of sacral nerve roots and 27 underwent sacroiliac joint fusion with iFuse.
16
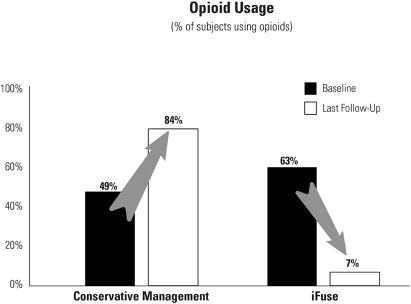
The group treated non-surgically had poor outcomes, including increased pain, disability, and opioid use, as well as worsened work status. By contrast, patients who were able to undergo the iFuse procedure had very large improvements in pain and disability, improved work status, and a decreased incidence of opioid use. The differences in all outcomes (pain, disability, work status, and opioid use) were both statistically significant and clinically profound. The graph below shows the pain scores of the three treatment cohorts followed in this study.
The graph below shows the changes in the percentage of subjects using opioids among the iFuse and conservative care groups in the study. Forty-nine percent of subjects who were not able to access treatment with iFuse were using opioids at the beginning of the study, whereas 80% of them were using opioids at the time of their final follow-up. In contrast, 63% of the subjects who were able to obtain treatment with iFuse were using opioids prior to treatment, whereas only 7% were using opioids at their final follow-up visit.
17
There are several important aspects to this study:
|
•
|
It can be considered a “pseudorandomized trial” in that insurance denials (which dictated which treatment the patient could receive) was not clearly related to any important predictor of clinical outcomes. This enhances the comparability of groups.
|
|||||
|
•
|
It is the longest reported cohort of non-surgical treatment of sacroiliac joint pain published to date.
|
|||||
|
•
|
Non-surgical treatment was clearly associated with poor outcomes, consistent with our experience in the US, in which patients receive repeated, and sometimes expensive, non-surgical treatments but do not derive significant benefit.
|
|||||
We recently finished enrollment in SALLY, a prospective single-arm multicenter trial of iFuse-3D for the treatment of sacroiliac joint dysfunction. The enrolled patient population was very similar to that of INSITE, SIFI and iMIA. Early results from SALLY show preoperative and six-month pain scores that are nearly identical to those of the three earlier prospective trials of iFuse. In addition, SALLY showed improvements in physical function tests and a larger reduction in opioid usage. A manuscript describing early SALLY results was submitted for publication in a peer-reviewed journal in February 2019.
In addition to clinical evidence, a number of economic publications we financially supported, including those in
ClinicoEconomics and Outcomes Research,
demonstrate that the iFuse procedure provides a cost savings to the healthcare system when compared to non-surgical management over time. One of these studies used data from INSITE to calculate the incremental cost-effectiveness of the iFuse procedure and found it to be similar to that of hip and knee arthroplasty, commonly known as total joint replacement. The two latter procedures are generally accepted as being safe, effective, and highly cost-effective. The incremental cost effectiveness ratio, or ICER, of a procedure or therapy is a common way of quantifying its cost-effectiveness and represents the incremental cost to the healthcare system of providing one additional quality adjusted life-year, obtained by dividing the average cost of the therapy by the average increase in quality-adjusted life years that it achieves. Therapies with ICERs below $50,000 are considered cost-effective and generally gain acceptance. For example, studies have shown that the ICER of total joint replacement surgery for knees is approximately $12,000 and that for hip replacements is approximately $10,000. One study showed the ICER of the iFuse procedure to be $13,000, nearly as cost-effective as knee and hip surgeries, which are both common and well-accepted procedures. The ICER of iFuse derived from data from the INSITE trial is significantly better than the published ICERs of other common spine surgeries derived from one of the few other randomized controlled clinical trials of spine surgeries. Published analyses of the data from this trial showed the ICER of discectomy to be approximately $21,000, the ICER of standard decompressive laminectomy to be approximately $64,000, and the ICER of posterior decompressive laminectomy to be approximately $59,000. Each of these is a commonly performed spine surgery.
A second study detailed a health economics model examining the cost impact of failing to consider the sacroiliac joint in the diagnosis of patients with low back pain in patients seeking surgery. Taking into account both the prevalence of sacroiliac joint dysfunction and the costs of diagnostic workup and surgical treatment, if a surgeon evaluating a patient with chronic low back pain fails to consider the sacroiliac joint, on average $3,100 more healthcare expenditures will ensue. The study concluded that taking the sacroiliac joint into account can save healthcare systems substantial amounts due primarily to reduction in misdiagnosis and its attendant costs.
A third study used data from our two prospective trials conducted in the United States to examine the impact of sacroiliac joint fusion on worker productivity. Results suggest that sacroiliac joint fusion can increase the productivity of affected workers by an average of $6,900 compared to continued non-surgical care.
A fourth health economic study conducted by Optum, a division of UnitedHealth Group, and published in October 2018 examined healthcare costs for low back pain before and after sacroiliac joint fusion in patients in a commercial insurance database. Analysis showed reductions in median low back pain-related healthcare costs after sacroiliac joint fusion compared to before. A break-even analysis for health plan reimbursements for patients undergoing minimally invasive sacroiliac joint fusion on an outpatient basis showed similar cumulative claims for patients not undergoing the procedure within approximately 2.5 years. Following the procedure, per patient costs related to sacroiliac joint pain decrease to approximately $250 per quarter among the group who underwent sacroiliac joint fusion.
18
Our Second-Generation Implant
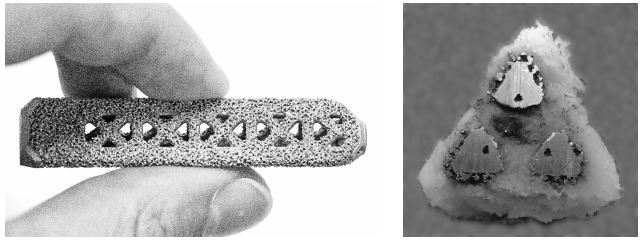
Our second-generation iFuse implant, iFuse-3D, shown on the left below, was cleared for marketing by the U.S. Food and Drug Administration in March 2017 and the European Union in May 2017. This patented titanium implant combines the triangular cross-section of the iFuse implant with a proprietary 3D-printed porous surface and fenestrated design. This design also allows the surgeon to fill the implant with ground-up bone before implanting it, which some surgeons believe accelerates bone through-growth. iFuse-3D implants have shown positive bony ingrowth in cell culture and animal studies, whether or not ground-up bone is used, as shown in two peer reviewed studies published in June 2017 in the
International Journal of Spine Surgery
. The image on the right below shows the cross section cut from an iFuse-3D implant removed from an animal as part of the study and reveals robust growth of bone into and through the implant. We have completed enrollment of SALLY, described above, a clinical trial to evaluate the performance of iFuse-3D.
19
Coverage and Reimbursement
Coverage and reimbursement for iFuse products and related procedures vary by setting of care, payor type, and region. In the United States, healthcare providers that purchase iFuse products look to various third-party payors, such as Medicare, Medicaid, private commercial insurance companies, health maintenance organizations, accountable care organization, or ACOs, and other healthcare-related organizations, to cover and pay for all or part of the costs of these procedures. These providers bill patients for any applicable deductibles or co-payments. Sales volumes and prices of company products will continue to depend in large part on the availability of coverage and reimbursement from such third-party payors.
The Medicare program is commonly used as a model for how private payors and other governmental payors develop their coverage and reimbursement policies for healthcare items and services, including iFuse procedures. Unless a national coverage policy exists for a particular technology, each of the Medicare Administrative Contractors is permitted to make its own determination of whether that item or service is covered by Medicare.
Medicare’s reimbursement rates for the iFuse procedure vary due to geographic location, the nature of facility in which the procedure is performed (i.e., hospital inpatient department, hospital outpatient department, or ambulatory surgical center) and other factors. Medicare reviews and updates its payment rates and methodologies for these settings of care annually, and rates can change from year to year. In addition, Congress can alter reimbursement rates at any time by mandating changes to Medicare’s payment methodologies.
Similarly, private payor coverage policies and reimbursement rates tend to vary across payors and settings of care. Payors continually review the clinical evidence for new technologies and can change their coverage policies without notice or deny payment if the product was not used in accordance with the payor’s coverage policy. Payors also review and challenge the prices charged for products and procedures.
In the United States, the American Medical Association, or AMA, generally creates specific billing codes for surgical procedures under a coding system known as Current Procedure Terminology, or CPT, which surgeons must use to bill and receive reimbursement for our iFuse procedure. Once the CPT code is established, the Centers for Medicare & Medicaid Services, or CMS, establishes payment levels and coverage rules under Medicare while private payors establish rates and coverage rules independently.
Prior to our launch of iFuse, Medicare and most private insurance companies reimbursed surgeons for sacroiliac joint fusions using either an established Category I CPT code or an unlisted code. A Category I CPT code is typically assigned to procedures that are consistent with contemporary medical practice and are widely performed. Procedures with a longstanding Category I CPT code are usually reimbursed.
However, effective July 1, 2013, the AMA’s CPT Editorial Panel created a new Category III CPT code for fusion of the sacroiliac joint using a minimally invasive or percutaneous approach. Category III CPT codes are used for new and emerging technologies and are reimbursed sporadically. This new code functionally redefined coding for sacroiliac joint fusions because it meant that minimally invasive or percutaneous fusion procedures should not be billed using the general Category I CPT code for sacroiliac fusion surgery. This coding change was accompanied by the establishment of a Medicare hospital outpatient prospective payment rate for the new code.
Following the creation of the new Category III CPT code, a number of papers demonstrating the clinical success of the iFuse procedure were published. As a result of these studies, along with the support of several professional medical specialty societies and leading academic surgeons, the AMA CPT Editorial Panel established a new Category I CPT code specifically for sacroiliac joint fusion surgery using a minimally invasive or percutaneous approach. This new Category I CPT code became effective on January 1, 2015. However, the new code did not immediately lead to positive coverage decisions by payors. In many cases, the payors wanted additional published evidence before deciding to cover the procedure. As a result, positive reimbursement decisions covering the procedure have occurred over the last few years, and some payors are still in the process of making decisions based on the most recent evidence.
In March 2015, our INSITE prospective, randomized controlled multi-center clinical trial was published. In June 2015, the largest spine society in the world, the North American Spine Society, or NASS, published a positive coverage recommendation, based on the clinical evidence, advocating to insurance companies and Medicare Administrative Contractors that sacroiliac joint fusion using a minimally invasive surgical approach should be routinely reimbursed. In March 2015, the International Society for Advancement of Spine Surgery, or ISASS, also published a similar, updated positive advocacy document intended to encourage insurance companies in the United States to reimburse for the procedure.
20
Coverage decisions for this code are made independently by each private insurance company and each of the Medicare Administrative Contractors that help manage Medicare. The process of obtaining coverage is laborious. As of June 30, 2016, because of the iFuse clinical evidence, all Medicare Administrative Contractors were covering the procedure. At the time, very few private payors were covering. As of December 31, 2017, U.S. payors covering 162 million lives regularly reimbursed for the iFuse procedure. However, by December 31, 2018, U.S. payors covering 256.5 million lives regularly reimbursed for the iFuse procedures, a 58% increase over December 31, 2017. Of the 65 largest private payors that we track, 45 had positive coverage policies for the procedure, were consistently covering the procedure, or had announced coming future coverage.
Third-party payors, whether governmental or commercial, are also developing increasingly sophisticated methods of controlling healthcare costs. In addition, in the United States, no uniform policy of coverage and reimbursement for medical device products and services exists among third-party payors. Therefore, coverage and reimbursement for medical device products and services can differ significantly from payor to payor. In addition, payors continually review new technologies for possible coverage and can, without notice, deny coverage for these new products and procedures. As a result, the coverage determination process is often a time-consuming and costly process that requires us to provide scientific and clinical support for the use of our products to each payor separately, with no assurance that coverage and adequate reimbursement will be obtained, or maintained if obtained.
In addition to uncertainties surrounding coverage policies, there are periodic changes to reimbursement. Third-party payors regularly update reimbursement amounts and also from time to time revise the methodologies used to determine reimbursement amounts. This includes annual updates to payments to physicians, hospitals, and ambulatory surgical centers for procedures during which our products are used. An example of payment updates is the Medicare program’s updates to hospital and physician payments, which are done on an annual basis using a prescribed statutory formula.
Specialty benefit managers and companies which perform healthcare technology assessments have significant influence on coverage decisions. In May 2016, the ECRI Institute Health Technology Assessment Information Service published a positive review of the iFuse Implant System, citing our clinical evidence. In January 2018, the Blue Cross Blue Shield Association, the licensor to all 36 Blue Cross and Blue Shield insurers across the United States, wrote a favorable review of the clinical evidence conferring a positive coverage recommendation for minimally invasive sacroiliac fusion, but only when performed with iFuse. In February 2018, Milliman Care Guidelines, a Hearst Company publication, also recommended coverage and in May 2018, AIM Specialty Health, owned by Anthem, established coverage for only iFuse and none of our competitors. In October 2018, eviCore recommended our iFuse system exclusively for sacroiliac joint fusion or stabilization.
Private Payors
. Private payors also decide whether to cover and how much to pay on an individual basis. We target and track 65 of the largest private payors that cover 256.5 million lives in the United States as of December 31, 2018. Of the targeted and tracked payors, 45 were covering regularly, or had announced coverage for, the iFuse procedure, while the remaining private payors were reevaluating their coverage policies. Of the private payors who are covering regularly, 26 have issued positive coverage policies exclusive to iFuse for sacroiliac joint fusion because of the clinical evidence. Twenty of these exclusive coverage policies have published since January 1, 2018. The private payors covering iFuse exclusively are:
21
|
•
|
SelectHealth
|
||
|
•
|
BCBS-Health Care Service Corporation [IL]
|
||
|
•
|
BCBS-Health Care Service Corporation [NM]
|
||
|
•
|
BCBS-Health Care Service Corporation [OK]
|
||
|
•
|
BCBS-Health Care Service Corporation [TX]
|
||
|
•
|
BCBS-Health Care Service Corporation [MT]
|
||
|
•
|
BCBS-NJ- Horizon Blue Cross Blue Shield of New Jersey
|
||
|
•
|
BCBS-SC-Blue Cross Blue Shield of South Carolina
|
||
|
•
|
BCBS-WY-BlueCross BlueShield of Wyoming
|
||
|
•
|
BCBS-MS-Blue Cross Blue Shield of Mississippi
|
||
|
•
|
BCBS-KC-Blue Cross and Blue Shield of Kansas City
|
||
|
•
|
BCBS-FL-BlueCross BlueShield of Florida (Florida Blue)
|
||
|
•
|
Capital Health Blue Cross (Florida)
|
||
|
•
|
BCBS-MN-Blue Cross Blue Shield of Minnesota
|
||
|
•
|
BCBS-LA-BlueCross BlueShield of Louisiana
|
||
|
•
|
BCBS-ID-Blue Cross of Idaho
|
||
|
•
|
BCBS-TN-BlueCross BlueShield of Tennessee
|
||
|
•
|
BCBS-PA-Capital Blue Cross (Central Pennsylvania)
|
||
|
•
|
BCBS-KS-BlueCross BlueShield of Kansas
|
||
|
•
|
BCBS-PA-Independence Blue Cross (Philadelphia, Southeastern Pennsylvania)
|
||
|
•
|
BCBS-MA-Blue Cross Blue Shield of Massachusetts
|
||
|
•
|
BCBS-Regence Blue Cross/Cambia Solutions
|
||
|
•
|
BCBS-NY-HealthNow NY: BlueShield of Northeastern New York/BCBS - BCBS of Western NY
|
||
|
•
|
BCBS-NC-Blue Cross Blue Shield of North Carolina
|
||
|
•
|
Neighborhood Health
|
||
|
•
|
BCBS-AZ-BlueCross BlueShield of Arizona
|
||
The private payors covering iFuse and other sacroiliac joint fusion products are:
|
•
|
Priority Health
|
||
|
•
|
Kaiser California
|
||
|
•
|
Kaiser Northwest
|
||
|
•
|
Health New England
|
||
|
•
|
Geisinger Health Plan
|
||
|
•
|
BCBS-MI-Blue Cross Blue Shield of Michigan
|
||
|
•
|
Harvard Pilgrim
|
||
|
•
|
BCBS-NE-Blue Cross Blue Shield of Nebraska
|
||
|
•
|
Kern Health Systems
|
||
|
•
|
Network Health
|
||
|
•
|
BCBS-VT-BlueCross BlueShield of Vermont
|
||
|
•
|
BCBS-Blue Cross of Northeastern Pennsylvania (Highmark)
|
||
|
•
|
Utah Public Employee Health Plan
|
||
|
•
|
BCBS-ND-Blue Cross Blue Shield of North Dakota
|
||
|
•
|
Emblem Health
|
||
|
•
|
United Healthcare
|
||
|
•
|
Medical Mutual of Ohio
|
||
|
•
|
HealthPartners
|
||
|
•
|
Scott & White
|
||
22
As of December 31, 2018, U.S. payors covering 256.5 million lives reimburse for iFuse, 121.7 million of which are covered by private payors. The chart below shows the overall coverage as of December 31, 2018:
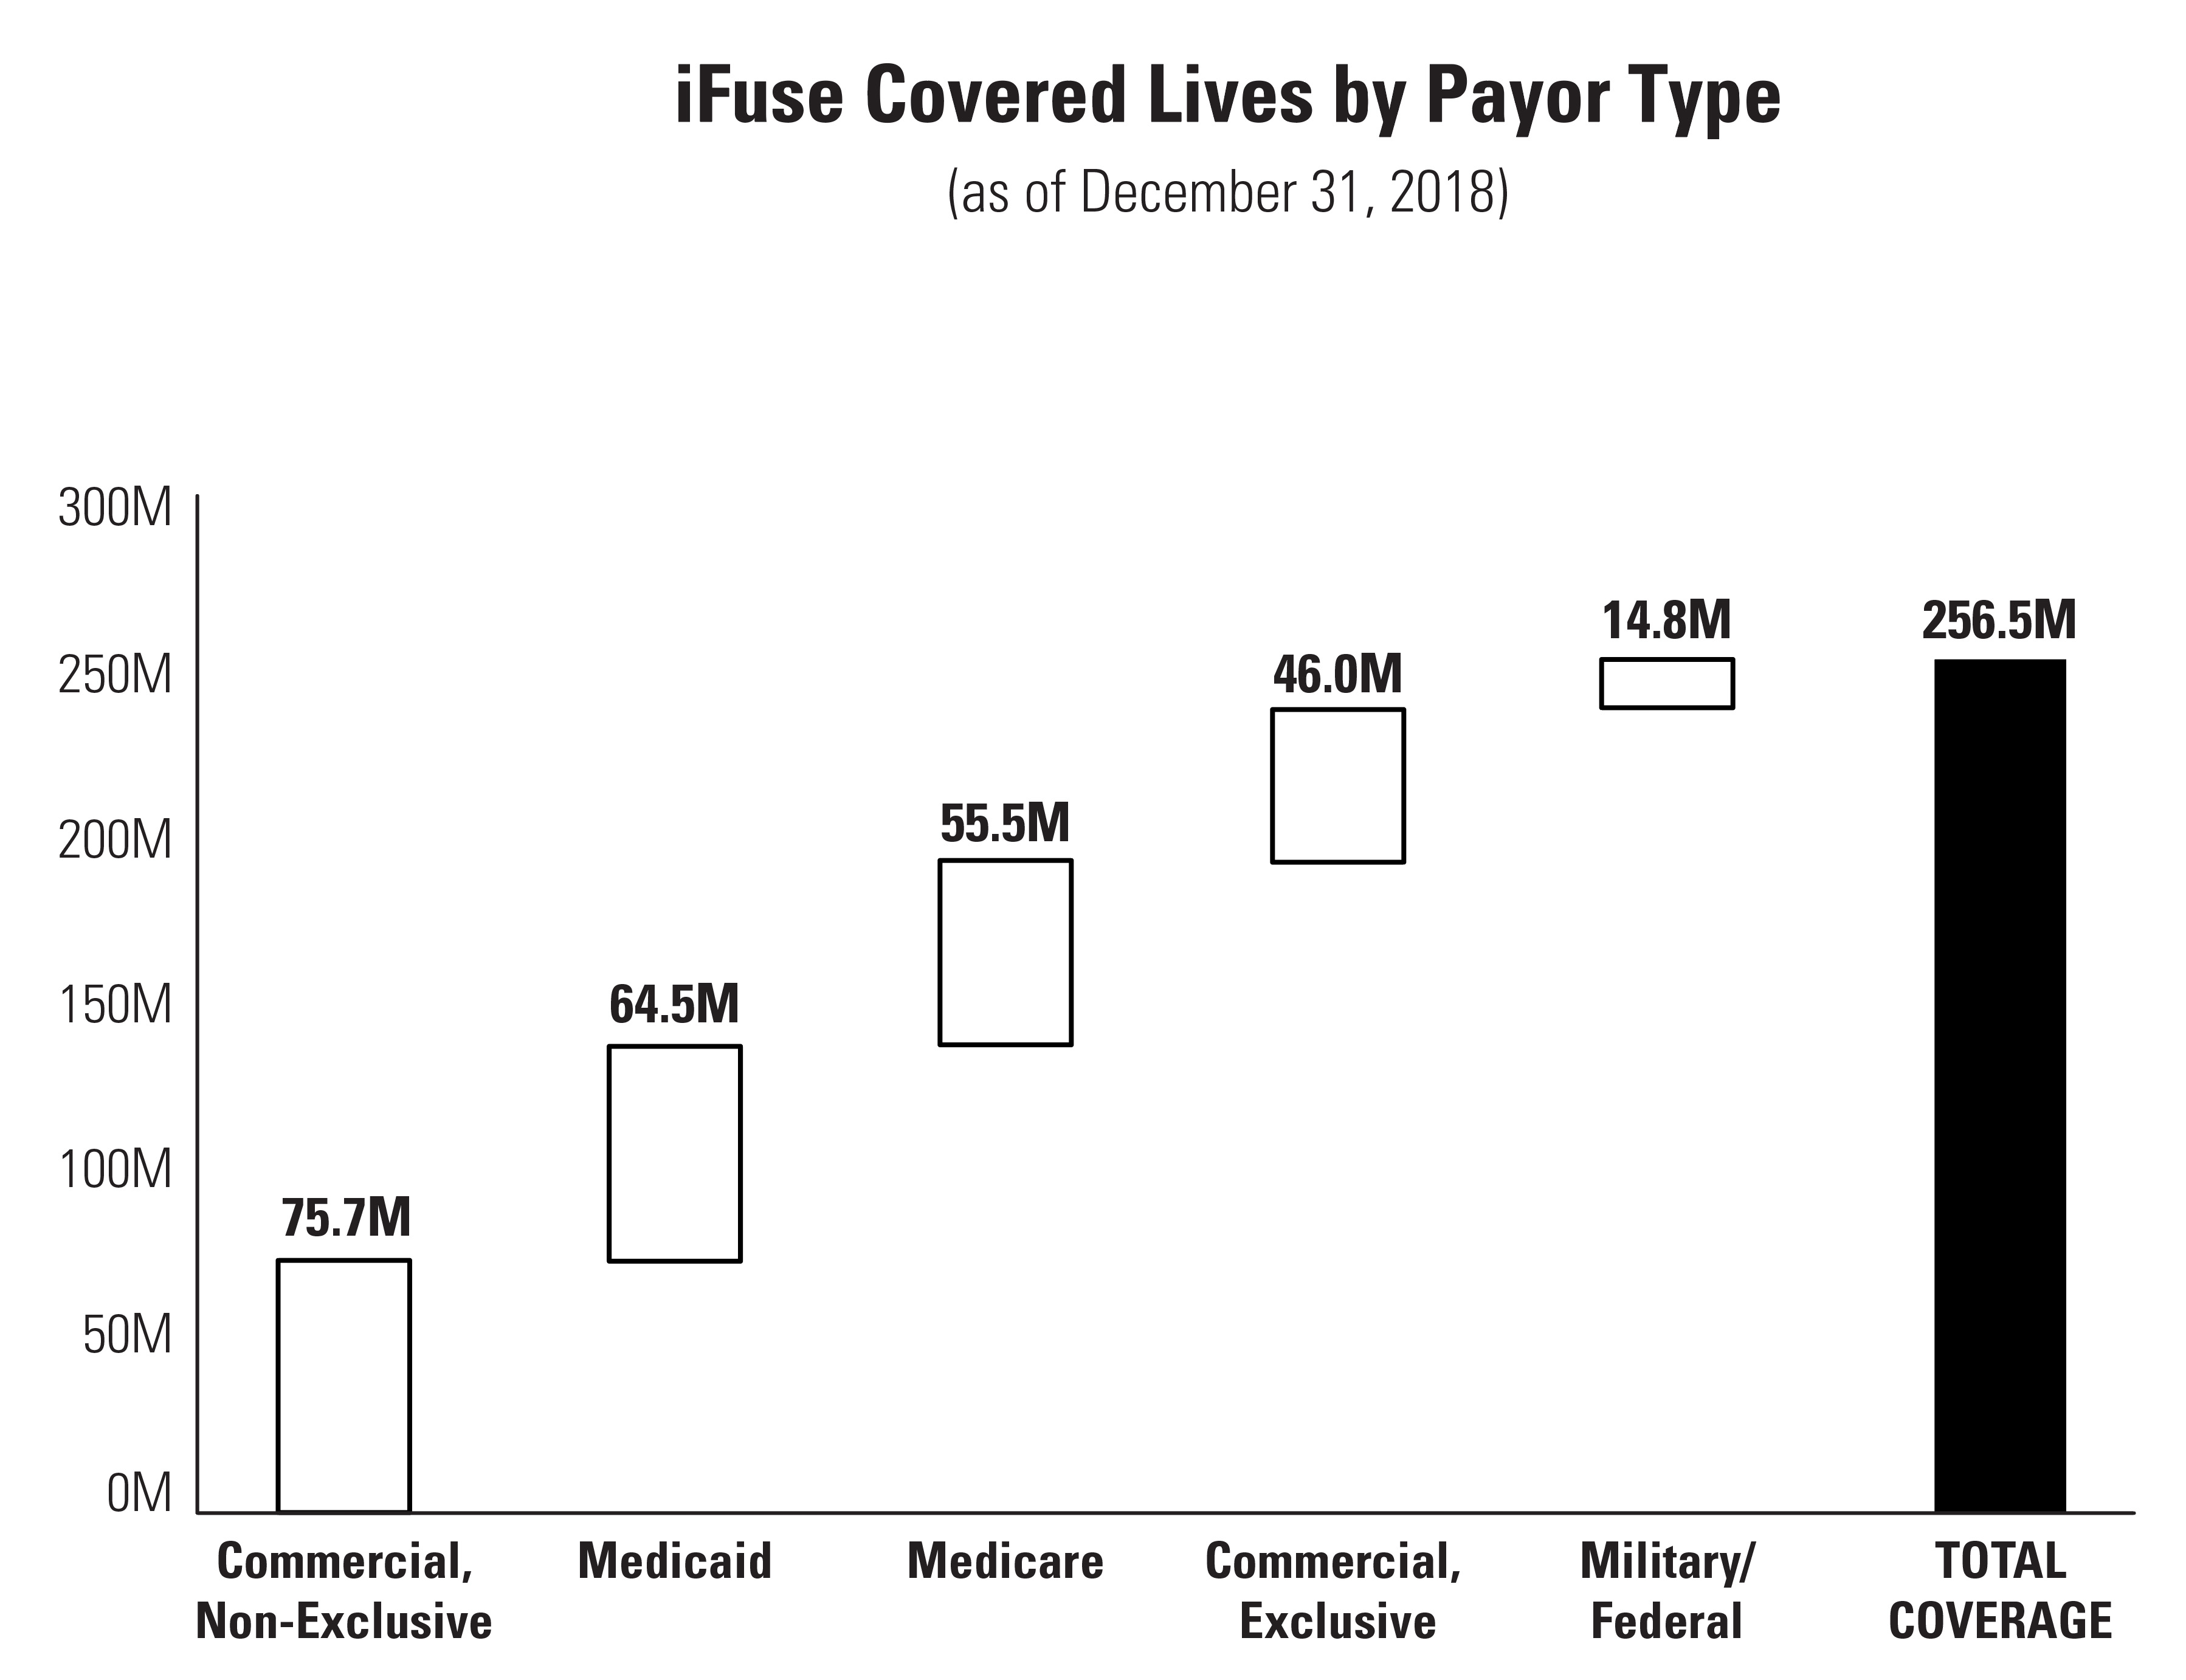
Note that because many individuals are covered by more than one health insurance plan or may switch plans during the year, the total number of covered lives reported by the payors represented above may be larger than the number of individuals who have access to the iFuse procedure through their health insurance provider at any given time.
There are a number of large and small private payors, including Aetna, Cigna, Humana, and Anthem, that are not yet reimbursing for the procedure. Some of these non-covering payors are reevaluating coverage given the latest data, but there can be no assurance they will reach positive coverage decisions. In most cases, the payors who are not covering are reevaluating coverage. Many payors will only review their coverage policies for a procedure on a scheduled basis, which can be every few months or as infrequently as once per year.
23
Prior to payor coverage, surgeons have been reluctant to get trained on a procedure for which they could not reliably be reimbursed. While we believe the increased coverage described above will have a positive effect on the number of iFuse procedures and our associated revenue in the future, the effect likely will happen with a lag time: after a positive coverage decision is made, a number of months may pass before it impacts the number of procedures and associated revenue, since the surgeons have to be made aware of the coverage decision, schedule re-examinations of patients who were candidates for surgery and subsequently schedule surgeries for the patients who are still candidates. We believe it takes between 6 and 24 months for surgeons to fully incorporate iFuse into their practices after payors initiate coverage. Further, the administrative burden on surgical practices can be substantial for patients where reimbursement coverage is new, and some surgeons do not believe that the current average surgeon reimbursement is yet adequate to compensate them. However, as reimbursement coverage has improved, surgeon interest in learning to diagnose the sacroiliac joint and perform iFuse procedures has been increasing.
Coverage Outside the United States
Outside the United States, reimbursement levels vary significantly by country, and by region within some countries. Reimbursement is obtained from a variety of sources, including government-sponsored and private health insurance plans, and combinations of both. Some countries will require us to gather additional clinical data before recognizing and granting broader coverage and reimbursement for our products.
In April 2017, the UK’s National Institute for Health and Care Excellence, or NICE, published guidance on minimally invasive sacroiliac joint fusion, recommending that the procedure be available to properly diagnosed patients in the UK National Health System. NICE develops guidance and quality standards in health and social care and is a worldwide leader in technology evaluations. The recommendation states that the safety and efficacy of minimally invasive sacroiliac joint fusion surgery is adequate provided that standard arrangements are in place. Use with standard arrangements is the most positive recommendation that NICE can make for an interventional procedure such as MIS SI joint fusion. In October 2018, NICE published medical technology guidance specific to the iFuse Implant System, recommending that it be used in the National Health System because of the evidence demonstrating that treatment with iFuse improves pain, quality of life, and disability in properly selected patients. Additionally, in August 2018, the public hospital system in France announced it would initiate coverage for iFuse exclusively beginning September 6, 2018. Some countries will require us to gather additional clinical data before recognizing and granting broader coverage and reimbursement for our products. It is our intent to complete the requisite clinical studies and obtain coverage and reimbursement approval beyond what we have today in countries where it makes economic sense to do so.
Medical Affairs and Education
We have created a medical affairs team that focuses both internally and externally. Internally, specialized medical knowledge, and practical experience with iFuse are used to help train our sales, marketing, quality, reimbursement, clinical, regulatory, engineering, and product development teams. This same specialized medical knowledge and practical experience allow us to create and execute a wide variety of programs to train the relevant external medical community, to assist them in identifying and diagnosing patients with sacroiliac joint dysfunction and in performing the iFuse procedure. The medical affairs team is led by a board-certified fellowship trained orthopedic spine surgeon. As of December 31, 2018, our U.S. faculty consisted of 82 surgeons, 22 pain management physicians, 15 nurse practitioners/physician’s assistants, and 90 physical therapists. These third-party consultants educate surgeons, physician’s assistants, nurses, physical therapists, and other healthcare professionals regarding sacroiliac joint diagnosis and the iFuse procedure.
Our surgeon training programs are for orthopedic spine surgeons, neurosurgeons, general orthopedic surgeons, and orthopedic trauma surgeons. Since its introduction, over 1,800 surgeons have treated patients with iFuse. We also have a large number of educational programs for the broader medical community including primary care physicians and other healthcare practitioners that may manage a sacroiliac joint patient non-surgically, such as physical therapists, pain management physicians, and chiropractors. As of December 31, 2018, our medical affairs team and physical therapist consultants have educated over 4,600 physical therapists on sacroiliac joint dysfunction, its diagnosis and iFuse as a potential treatment. We also work to educate case managers, facilities where the iFuse procedure is performed such as hospitals, as well as payors and health plans. For example, as of December 31, 2018, we have trained over 1,200 case managers across the United States. Case managers help patients navigate the healthcare system so that they receive the appropriate treatment. In addition to the continuing education program for case managers, we have created continuing education programs for physical therapists and chiropractors. As of December 31, 2018, our physical therapy continuing education programs were approved in 47 states. These programs include instruction on the diagnosis and non-surgical treatment of sacroiliac joint dysfunction due to degenerative sacroiliitis and sacroiliac joint disruptions. Our medical affairs programs focus on working with leading spine surgeons to educate other surgeons on the differential diagnosis of sacroiliac joint disorders and the use of iFuse. We also work closely with medical societies to raise the awareness of and the appropriate diagnosis of sacroiliac joint dysfunction and the associated treatment options.
24
Sales and Marketing
We market and sell iFuse primarily through a direct sales force and a small number of third-party distributors. Our target customer base includes approximately 7,500 surgeons who perform spine and/or pelvic surgery, including orthopedic spine surgeons, neurosurgeons, general orthopedic surgeons, and orthopedic trauma surgeons.
Our direct sales organization in the United States was comprised of seven sales regions as of December 31, 2018. Each region is comprised of a number of territory sales managers who act as the primary customer contact. Our territory sales managers have extensive training and experience selling medical devices for spine problems and pain management, generally focusing on emerging technologies and markets. For large and/or high volume territories, we also employ territory associate representatives who cover cases. As of December 31, 2018, our territory sales managers were led by seven regional sales managers who reported to our Vice President of U.S. Sales. The Vice President of U.S. Sales reports to our Chief Commercial Officer. As of December 31, 2018, our U.S. sales force consisted of 45 sales representatives directly employed by us, and 30 third-party distributors.
In addition to general sales and marketing training, we provide our sales organization with comprehensive, hands-on cadaveric and dry-lab training sessions focusing on the clinical benefits of our products and how to use them. We believe our robust training and professional development programs have been an important component of our success to date and will help support our anticipated future growth. We expect to continue to increase the size of our sales organization in order to increase sales and market penetration and to provide the significant, ongoing level of customer support required by our sales and marketing strategy.
As of December 31, 2018, we had 27 employees working in our European operations, and have established operations in Italy (2010), Germany (2014), and the United Kingdom (2015). As of December 31, 2018, our international sales force consisted of 14 sales representatives directly employed by us and 23 exclusive third-party distributors, which together had sales in 33 countries through December 31, 2018. We anticipate continuing to build our operations in the major European countries while establishing distributor arrangements in smaller ones. We intend to follow a similar model in Europe to the one established in the United States, working with internationally recognized healthcare professional experts as we expand our training and reimbursement activities. As of December 31, 2018, beyond Europe and the United States, surgeons had performed the first iFuse procedures in Australia, Cayman Islands, Hong Kong, Israel, Japan, Kuwait, New Zealand, Saudia Arabia, Taiwan and Turkey.
Research and Development
Since our initial launch of the iFuse system, we have introduced a number of new instrument enhancements, product enhancements and procedure enhancements. An example is the iFuse-3D implant, which we developed over several years and launched in 2017. The most notable instrument enhancement was the release of the revamped instruments set which included a number of radiolucent instruments.
In 2017, we introduced an instrument set which is cleared for use with Medtronic’s surgical navigation system, allowing the surgeon to visualize the positioning of certain instruments intra-operatively. In March 2018, we introduced surgical pins cleared for use with the Mazor surgical robot, allowing the surgeon to robotically place the guide pin according to a computer-generated surgical plan. We expect to continue developing enhancements to iFuse to meet our customers’ changing needs and improve the surgery’s effectiveness. For example, we know that some surgeons use iFuse to treat SI joint dysfunction in patients in whom the surgeon is also implanting other devices to treat other spine conditions. We are developing products and techniques to help surgeons improve the treatment of these patients, and we will seek any additional regulatory clearances which may be required. We also design and manufacture, Class I instruments for our surgeon customers based on special request under our “Non-Standard Product” program.
Competition
We believe we were the first company to develop, manufacture, and market a minimally invasive implant cleared by the FDA expressly for sacroiliac joint fusion other than a modified screw. Over the past several years, other companies have subsequently recognized the opportunity and have entered the minimally invasive sacroiliac joint fusion market. However, all of these products are either screw-based or allograft products. We expect more competitors to enter into the market and an increased number of new product introductions by existing competitors. Many of our competitors are large, publicly traded companies that can dedicate far greater resources to the minimally invasive sacroiliac joint market than we can. These companies often have wide product offerings for spine and orthopedic surgery, which allow them to bundle products in order to win large hospital group contracts and can increase the barrier to entry for us. For example, some of our competitors offer sacroiliac joint fusion products which integrate with their surgical navigation and robotics platforms, enabling navigation of their procedures or performance of aspects of these procedures by surgical robots. Many of these companies also have much larger sales forces than ours, which allow them to reach more surgeons. We also expect there to be a continued push for non-surgical alternatives.
25
In the United States, we believe that our primary competitors currently are Globus Medical, Inc., Medtronic plc, XTant Medical Holdings, Inc., and RTI Surgical, Inc. Our primary competitors in Europe are Globus Medical, SIGNUS Medizintechnik GmbH, and XTant Medical Holdings. However, they sell screw-based products, which we believe to be weaker and less able to resist rotation than our triangular iFuse implants. We also compete against non-hardware products, such as allograft bone implants. These allograft products comprise human cells or tissues and are regulated by the FDA differently from implantable medical devices made of metallic or other non-tissue based materials, unless they include specific claims about their intended use which exceed a homologous use, or use consistent with the original function of the donor tissue.
Based on our commercial experience and market research, we believe iFuse is currently used in the majority of minimally invasive surgical fusions of the sacroiliac joint in the United States. iFuse is the only minimally invasive product for sacroiliac joint fusion commercially available in the United States that, to our knowledge, is supported by published clinical evidence including randomized controlled studies that demonstrate the safety, clinical effectiveness, durability, and economic utility. These benefits are supported by more than 65 published papers.
The following are the primary competitive factors on which companies compete in our industry:
|
•
|
product and clinical procedure effectiveness;
|
|||||||||||
|
•
|
ease of surgical technique and use of associated instruments;
|
|||||||||||
|
•
|
safety;
|
|||||||||||
|
•
|
published clinical outcomes and evidence;
|
|||||||||||
|
•
|
sales force knowledge;
|
|||||||||||
|
•
|
product support and service, and customer service;
|
|||||||||||
|
•
|
comprehensive training, including disease, anatomy, diagnosis and treatment;
|
|||||||||||
|
•
|
product innovation and the speed of innovation;
|
|||||||||||
|
•
|
intellectual property;
|
|||||||||||
|
•
|
accountability and responsiveness to customers’ demands;
|
|||||||||||
|
•
|
pricing and reimbursement;
|
|||||||||||
|
•
|
scientific (biomechanics) data; and
|
|||||||||||
|
•
|
attracting and retaining key personnel.
|
|||||||||||
Intellectual Property
We protect our intellectual property through our pending patent applications and issued patents. As of December 31, 2018, we had been issued 35 patents in the United States, five patents in Japan, three in Europe and one in China. Also, as of December 31, 2018, we have 14 pending patent applications in the United States and five pending patent applications outside of United States. We have focused the majority of our foreign patent efforts in China, Europe, and Japan. Generally, our current U.S. patents are expected to expire between August 2024 and September 2035, and our Japanese patents are expected to expire between August 2025 and October 2031.
We have 12 registered trademarks in the United States and have filed for two more. In other countries, we have focused on registering three primary trademarks: “iFuse Implant System,” “SI-BONE,” and the SI-BONE logo. As of December 31, 2018, we have sought protection for at least two of these trademarks in 60 countries including the 28 European member countries of the Madrid Protocol.
We also rely upon trade secrets, know-how and continuing technological innovation, and may rely upon licensing opportunities in the future, to develop and maintain our competitive position. We may seek to protect our proprietary rights through a variety of methods, including confidentiality agreements and proprietary information agreements with suppliers, employees, consultants and others who may have access to proprietary information, under which they are bound to assign to us inventions made during the term of their employment.
26
The term of individual patents depends on the legal term for patents in the countries in which they are granted. In most countries, including the United States, the patent term is generally 20 years from the earliest claimed filing date of a non-provisional patent application in the applicable country. There can be no assurance that patents will be issued from any of our pending applications or that, if patents are issued, they will be of sufficient scope or strength to provide meaningful protection for our technology. Notwithstanding the scope of the patent protection available to us, a competitor could develop treatment methods or devices that are not covered by our patents but that compete with our proprietary technology and products. Furthermore, numerous U.S. and foreign issued patents and patent applications owned by third parties exist in the fields in which we are developing products. Because patent applications can take many years to issue, there may be applications unknown to us, which applications may later result in issued patents that our existing or future products or proprietary technologies may be alleged and/or found to infringe.
There has been substantial litigation regarding patent and other intellectual property rights in the medical device industry. In the future, we may need to engage in litigation to enforce patents issued or licensed to us, to protect our trade secrets or know-how and brands, to defend against claims of infringement of the rights of others or to determine the scope and validity of the proprietary rights of others. Litigation could be costly and could divert our attention from other functions and responsibilities. Adverse determinations in litigation could reduce the barriers to entry that we have established for iFuse, or subject us to significant liabilities to third parties, require us to seek licenses from third parties or prevent us from manufacturing, selling or using iFuse, any of which could severely harm our business.
27
Regulation
Domestic Regulation of Our Products and Business
Our research, development and clinical programs, as well as our manufacturing and marketing operations, are subject to extensive regulation in the United States and other countries. Most notably, all of our products sold in the United States are subject to the FDCA as implemented and enforced by the FDA. The FDA governs the following activities that we perform or that are performed on our behalf, to ensure that medical products distributed domestically or exported internationally are safe and effective for their intended uses:
|
•
|
product design, development, and manufacture;
|
||||||||
|
•
|
product safety, testing, labeling, and storage;
|
||||||||
|
•
|
record keeping procedures;
|
||||||||
|
•
|
product marketing, sales, distribution and export; and
|
||||||||
|
•
|
post-marketing surveillance, complaint handling, medical device reporting, reporting of deaths, serious injuries or device malfunctions, and repair or recall of products.
|
||||||||
There are numerous FDA regulatory requirements governing the clearance or approval and marketing of our products. These include:
|
•
|
product listing and establishment registration, which helps facilitate FDA inspections and other regulatory action;
|
|||||
|
•
|
investigational device exemptions to conduct premarket clinical trials, which include extensive monitoring, recordkeeping, and reporting requirements;
|
|||||
|
•
|
QSR, which requires manufacturers, including third-party manufacturers, to follow stringent design, testing, control, documentation and other quality assurance procedures during all aspects of the manufacturing process;
|
|||||
|
•
|
labeling regulations and FDA prohibitions against the promotion of products for uncleared, unapproved or off-label use or indication;
|
|||||
|
•
|
clearance of product modifications that could significantly affect safety or effectiveness or that would constitute a major change in intended use of one of our cleared devices;
|
|||||
|
•
|
approval of product modifications that affect the safety or effectiveness of one of our approved devices;
|
|||||
|
•
|
medical device reporting regulations, which require that manufacturers comply with FDA requirements to report if their device may have caused or contributed to a death or serious injury, or has malfunctioned in a way that would likely cause or contribute to a death or serious injury if the malfunction of the device or a similar device were to recur;
|
|||||
|
•
|
post-approval restrictions or conditions, including post-approval study commitments;
|
|||||
|
•
|
post-market surveillance regulations, which apply when necessary to protect the public health or to provide additional safety and effectiveness data for the device;
|
|||||
|
•
|
the FDA’s recall authority, whereby it can ask, or under certain conditions order, device manufacturers to recall from the market a product that is in violation of governing laws and regulations;
|
|||||
|
•
|
regulations pertaining to voluntary recalls; and
|
|||||
|
•
|
notices of corrections or removals.
|
|||||
We have registered our facility with the FDA as a medical device manufacturer. The FDA has broad post-market and regulatory enforcement powers. We and our third-party manufacturers are subject to announced and unannounced inspections by the FDA to determine our compliance with the QSR and other regulations and these inspections may include the manufacturing facilities of our suppliers.
28
FDA Premarket Clearance and Approval Requirements
Unless an exemption applies, each medical device we wish to commercially distribute in the United States will require either premarket notification, or 510(k), clearance or approval of a PMA from the FDA. The FDA classifies medical devices into one of three classes. Devices deemed to pose lower risks are placed in either Class I or II, which typically requires the manufacturer to submit to the FDA a premarket notification requesting permission to commercially distribute the device. This process is generally known as 510(k) clearance. Some low risk devices are exempted from this requirement. Devices deemed by the FDA to pose the greatest risks, such as life-sustaining, life-supporting or implantable devices, or devices deemed not substantially equivalent to a previously cleared 510(k) device, are placed in Class III, requiring a PMA. If the FDA agrees that the device is substantially equivalent to a predicate device currently on the market, it will grant 510(k) clearance to commercially market the device. If the FDA determines that the device is “not substantially equivalent” to a previously cleared device, the device is automatically designated as a Class III device. The device sponsor must then fulfill more rigorous PMA requirements, or can request a risk-based classification determination for the device in accordance with the “de novo” process, which is a route to market for novel medical devices that are low to moderate risk and are not substantially equivalent to a predicate device. All of our currently marketed products are Class II devices, subject to 510(k) clearance.
After a device receives 510(k) marketing clearance, any modification that could significantly affect its safety or effectiveness, or that would constitute a major change or modification in its intended use, will require a new 510(k) marketing clearance or, depending on the modification, PMA approval. The determination as to whether or not a modification could significantly affect the device’s safety or effectiveness is initially left to the manufacturer using available FDA guidance. Many minor modifications today are accomplished by a “letter to file” in which the manufacture documents the rationale for the change and why a new 510(k) is not required. However, the FDA may review such letters to file to evaluate the regulatory status of the modified product at any time and may require the manufacturer to cease marketing and recall the modified device until 510(k) clearance or PMA approval is obtained. The manufacturer may also be subject to significant regulatory fines or penalties.
Clinical Trials
Clinical trials are generally required to support a PMA application and are sometimes required for 510(k) clearance. Such trials for implanted devices such as iFuse generally require an investigational device exemption application, or IDE, approved in advance by the FDA for a specified number of subjects and study sites, unless the product is deemed a nonsignificant risk device eligible for more abbreviated IDE requirements. Clinical trials are subject to extensive monitoring, recordkeeping and reporting requirements. Clinical trials must be conducted under the oversight of an institutional review board, or IRB, for the relevant clinical trial sites and must comply with FDA regulations, including but not limited to those relating to good clinical practices. To conduct a clinical trial, we also are required to obtain the subjects’ informed consent in form and substance that complies with both FDA requirements and state and federal privacy and human subject protection regulations. We, the FDA, or the institutional review board, or IRB, could suspend a clinical trial at any time for various reasons, including a belief that the risks to study subjects outweigh the anticipated benefits. Even if a trial is completed, the results of clinical testing may not adequately demonstrate the safety and effectiveness of the device or may otherwise not be sufficient to obtain FDA clearance or approval to market the product in the United States. Similarly, in Europe the clinical study must be approved by a local ethics committee and in some cases, including studies with high- risk devices, by the ministry of health in the applicable country.
29
Pervasive and Continuing Regulation
After a device is placed on the market, numerous regulatory requirements continue to apply. These include:
|
•
|
Product listing and establishment registration, which helps facilitate FDA inspections and other regulatory action;
|
|||||||
|
•
|
QSR, which requires manufacturers, including third-party manufacturers, to follow stringent design, testing, control, documentation, and other quality assurance procedures during all aspects of the manufacturing process;
|
|||||||
|
•
|
labeling regulations and FDA prohibitions against the promotion of products for uncleared, unapproved or off-label use or indication;
|
|||||||
|
•
|
clearance of product modifications that could significantly affect safety or effectiveness or that would constitute a major change in intended use of one of our cleared devices;
|
|||||||
|
•
|
approval of product modifications that affect the safety or effectiveness of one of our approved devices;
|
|||||||
|
•
|
medical device reporting regulations, which require that manufacturers comply with FDA requirements to report if their device may have caused or contributed to a death or serious injury, or has malfunctioned in a way that would likely cause or contribute to a death or serious injury if the malfunction of the device or a similar device were to recur;
|
|||||||
|
•
|
post-approval restrictions or conditions, including post-approval study commitments;
|
|||||||
|
•
|
post-market surveillance regulations, which apply when necessary to protect the public health or to provide additional safety and effectiveness data for the device;
|
|||||||
|
•
|
the FDA’s recall authority, whereby it can ask, or under certain conditions order, device manufacturers to recall from the market a product that is in violation of governing laws and regulations;
|
|||||||
|
•
|
regulations pertaining to voluntary recalls; and
|
|||||||
|
•
|
notices of corrections or removals.
|
|||||||
The FDA has broad post-market and regulatory enforcement powers. We are subject to unannounced inspections by the FDA to determine our compliance with the QSR and other regulations, and these inspections may include the manufacturing facilities of some of our subcontractors. Failure by us or by our suppliers to comply with applicable regulatory requirements can result in enforcement action by the FDA or other regulatory authorities, which may result in sanctions including, but not limited to:
|
•
|
untitled letters, warning letters, fines, injunctions, consent decrees, and civil penalties;
|
|||||
|
•
|
unanticipated expenditures to address or defend such actions
|
|||||
|
•
|
customer notifications for repair, replacement, refunds;
|
|||||
|
•
|
recall, detention or seizure of our products;
|
|||||
|
•
|
operating restrictions or partial suspension or total shutdown of production;
|
|||||
|
•
|
refusing or delaying our requests for 510(k) clearance or PMA approval of new products or modified products;
|
|||||
|
•
|
operating restrictions;
|
|||||
|
•
|
withdrawing 510(k) clearances or PMA approvals that have already been granted;
|
|||||
|
•
|
refusal to grant export approval for our products; or
|
|||||
|
•
|
criminal prosecution.
|
|||||
The FDA inspected our facilities in May 2014. As a result, we received a Form 483 with three observations that have been since been corrected following a corrective and preventative action plan. We responded to the Agency in writing and the matter was closed as of October 2014. To date, the FDA has not taken any further actions with respect to the May 2014 inspection or its findings. The FDA inspected our facilities again in December 2016. As a result, no findings were noted.
Promotional Materials—“Off-Label” Promotion
Advertising and promotion of medical devices, in addition to being regulated by the FDA, are also regulated by the Federal Trade Commission and by state regulatory and enforcement authorities. If the FDA determines that our promotional materials or training constitutes promotion of an unapproved use, it could request that we modify our training or promotional materials or subject us to regulatory or enforcement actions, including the issuance of an untitled letter, a warning letter, injunction, seizure, civil fine, or criminal penalties. It is also possible that other federal, state, or foreign enforcement authorities might take action if they consider our promotional or training materials to constitute promotion of an unapproved use, which could result in significant fines or penalties under other statutory authorities, such as laws prohibiting false claims for reimbursement. In that event, our reputation could be damaged and adoption of the products would be impaired.
30
In addition, under the federal Lanham Act and similar state laws, competitors, and others can initiate litigation relating to advertising claims.
International Regulation of Our Products
Our research, development and clinical programs, as well as our manufacturing and marketing operations, are subject to extensive regulation in other countries. For example, in the EEA our devices are required to comply with the Essential Requirements concerning medical devices. Compliance with these requirements entitles us to affix the CE mark to our medical devices, without which they cannot be commercialized in the EEA.
To demonstrate compliance with the Essential Requirements, we must undergo a conformity assessment procedure, which varies according to the type of medical device and its classification. Except for low risk medical devices (Class I with no measuring function and which are not sterile), where the manufacturer can issue an EC Declaration of Conformity based on a self-assessment of the conformity of its products with the Essential Requirements, a conformity assessment procedure requires the intervention of a Notified Body, which is an organization designated by the competent authorities of a EEA country to conduct conformity assessments. The Notified Body typically audits and examines products’ Technical File and the quality system for the manufacture, design and final inspection of our devices before issuing a CE Certificate of Conformity demonstrating compliance with the relevant Essential Requirements. Following the issuance of this CE Certificate of Conformity, we can draw up an EC Declaration of Conformity and affix the CE mark to the products covered by this CE Certificate of Conformity and the EC Declaration of Conformity. We have successfully completed several Notified Body audits since our original certification in November 2010. Following these audits, our Notified Body issued International Standards Organization Certificates and CE Certificates of Conformity allowing us to draw up an EC Declaration of Conformity and affix the CE mark to certain of our devices.
After the product has been CE marked and placed on the market in the EEA, we must comply with a number of regulatory requirements relating to:
|
•
|
registration of medical devices in individual EEA countries;
|
|||||
|
•
|
pricing and reimbursement of medical devices;
|
|||||
|
•
|
establishment of post-marketing surveillance and adverse event reporting procedures;
|
|||||
|
•
|
Field Safety Corrective Actions, including product recalls and withdrawals; and
|
|||||
|
•
|
interactions with physicians.
|
|||||
Failure to comply with these requirements may result in enforcement measures being taken against us by the competent authorities of the EEA countries. These can include fines, administrative penalties, compulsory product withdraws, injunctions, and criminal prosecution. Such enforcement measures would have an adverse effect on our capacity to market our products in the EEA and, consequently, on our business and financial position.
Further, the advertising and promotion of our products in the EEA is subject to the provisions of the Medical Devices Directive, Directive 2006/114/EC concerning misleading and comparative advertising, and Directive 2005/29/EC on unfair commercial practices, as well as other national legislation in the EEA countries governing the advertising and promotion of medical devices. These laws may limit or restrict the advertising and promotion of our products to the general public and may impose limitations on our promotional activities with healthcare professionals.
Regulatory Status
In November 2008, we received 510(k) clearance to market our first generation iFuse implant from the FDA. Since 2008, we have received additional FDA 510(k) clearances for new instruments, additional implant sizes and labeling changes. In the United States, the iFuse Implant System is intended for sacroiliac fusion for conditions, including sacroiliac joint dysfunction that is a direct result of sacroiliac joint disruptions and degenerative sacroiliitis. This includes conditions where symptoms began during pregnancy or in the peripartum period and have persisted postpartum for more than six months. Clinical Studies have demonstrated that treatment with the iFuse Implant System improved pain, patient function, and quality of life. In the future, we plan to pursue additional 510(k) clearances for new products and changes to the current indication for iFuse.
In November 2010, we obtained a CE Certificate of Conformity and affixed a CE mark to our iFuse Implant System to allow commercialization of iFuse in the EEA. In the EEA and Switzerland, iFuse is intended for sacroiliac joint fusion. Since 2010, we have added additional instruments, implant sizes and labeling updates and iFuse-3D, our second generation iFuse implant, to our product offerings in Europe. We plan to continue to work with our Notified Body to incorporate new products and labeling updates in our Technical Files for CE marking in European.
31
Since July 2013, we have obtained approval for iFuse in regions beyond the United States and the EEA, including Australia, Canada, Hong Kong, Israel, Malaysia, New Zealand, Saudi Arabia, Singapore and Taiwan. We are currently collecting information to determine our regulatory strategy in Japan.
Healthcare Fraud and Abuse
Federal and state governmental agencies and equivalent foreign authorities subject the healthcare industry to intense regulatory scrutiny, including heightened civil and criminal enforcement efforts. These laws constrain the sales, marketing and other promotional activities of medical device manufacturers by limiting the kinds of financial arrangements we may have with hospitals, physicians and other potential purchases of our products. Federal healthcare fraud and abuse laws apply to our business when a customer submits a claim for an item or service that is reimbursed under Medicare, Medicaid, or other federally funded healthcare programs. Descriptions of some of the laws and regulations that may affect our ability to operate follows.
The federal Anti-Kickback Statute prohibits, among other things, persons from knowingly and willfully soliciting, receiving, offering or paying remuneration, directly or indirectly, in cash or in kind, to induce or reward either the referral of an individual for, or the purchase, order or recommendation of, items or services for which payment may be made, in whole or in part, under federal healthcare programs. The term “remuneration” has been broadly interpreted to include anything of value, and the government can establish a violation of the Anti-Kickback Statute without proving that a person or entity had actual knowledge of, or a specific intent to violate, the law. The Anti-Kickback Statute is subject to evolving interpretations and has been applied by government enforcement officials to a number of common business arrangements in the medical device industry. There are a number of statutory exceptions and regulatory safe harbors protecting some common activities from prosecution; however, those exceptions and safe harbors are drawn narrowly, and there is no exception or safe harbor for many common business activities. Failure to meet all of the requirements of a particular statutory exception or regulatory safe harbor does not make the conduct per se illegal under the Anti-Kickback Statute, but the legality of the arrangement will be evaluated on a case-by-case basis based on the totality of the facts and circumstances. A number of states also have anti-kickback laws that establish similar prohibitions that may apply to items or services reimbursed by government programs, as well as by any third-party payors, including commercial payors.
The civil False Claims Act prohibits, among other things, knowingly presenting or causing the presentation of a false or fraudulent claim for payment of federal funds, or knowingly making, or causing to be made, a false record or statement material to a false or fraudulent claim to avoid, decrease or conceal an obligation to pay money to the federal government. A claim including items or services resulting from a violation of the Anti- Kickback Statute constitutes a false or fraudulent claim for purposes of the False Claims Act. Actions under the False Claims Act may be brought by the government or as a
qui tam
action by a private individual in the name of the government.
Qui tam
actions are filed under seal and impose a mandatory duty on the U.S. Department of Justice to investigate such allegations. Most private citizen actions are declined by the Department of Justice or dismissed by federal courts. However, the investigation costs for a company can be significant and material even if the allegations are without merit. There are also criminal penalties, including imprisonment and criminal fines, for making or presenting a false or fictitious or fraudulent claim to the federal government.
False Claims Act liability is potentially significant in the healthcare industry because the statute provides for treble damages and mandatory penalties of $11,181 to $22,363 per claim (adjusted annually for inflation). Because of the potential for large monetary exposure, healthcare companies often resolve allegations without admissions of liability for significant and sometimes material amounts to avoid the uncertainty of treble damages and per claim penalties that may awarded in litigation proceedings. Moreover, to avoid the risk of exclusion from federal healthcare programs as a result of a False Claims Act settlement, companies may enter into corporate integrity agreements with the government, which may impose substantial costs on companies to ensure compliance.
In addition, HIPAA created federal criminal statutes that prohibit, among other actions, knowingly and willfully executing, or attempting to execute, a scheme to defraud any healthcare benefit program, including private third-party payors, knowingly and willfully embezzling or stealing from a healthcare benefit program, willfully obstructing a criminal investigation of a healthcare offense, and knowingly and willfully falsifying, concealing or covering up a material fact or making any materially false, fictitious or fraudulent statement in connection with the delivery of or payment for healthcare benefits, items or services.
The federal Physician Payment Sunshine Act, implemented by CMS as the Open Payments program, requires manufacturers of drugs, devices, biologics and medical supplies for which payment is available under Medicare, Medicaid, or the Children’s Health Insurance Program to report annually to CMS information related to payments or other “transfers of value” made to physicians and teaching hospitals, and requires applicable manufacturers to report annually to CMS ownership and investment interests held by physicians and their immediate family members and payments or other “transfers of value” to such physician owners.
Certain states also mandate implementation of corporate compliance programs, impose restrictions on device manufacturer marketing practices, and/or require tracking and reporting of gifts, compensation, and other remuneration to healthcare professionals and entities.
32
The FCPA and similar anti-bribery laws in other countries, such as the UKBA, generally prohibit companies and their intermediaries from making improper payments to government officials and/or other persons for the purpose of obtaining or retaining business. Our policies mandate compliance with these anti-bribery laws.
Violations of these federal and state fraud and abuse laws can subject us to administrative, civil, and criminal penalties, including imprisonment, substantial fines, penalties, damages, and exclusion from participation in federal healthcare programs, including Medicare and Medicaid.
Data Privacy and Security Laws
We are also subject to various federal, state and foreign laws that protect the confidentiality of certain patient health information, including patient medical records, and restrict the use and disclosure of patient health information by healthcare providers, such as HIPAA, as amended by HITECH, in the United States.
HIPAA requires the notification of patients, and other compliance actions, in the event of a breach of unsecured PHI. If notification to patients of a breach is required, such notification must be provided without unreasonable delay and in no event later than 60 calendar days after discovery of the breach. In addition, if the PHI of 500 or more individuals is improperly used or disclosed, we could be required to report the improper use or disclosure to the U.S. Department of Health and Human Services, or HHS, which would post the violation on its website, and to the media. Failure to comply with the HIPAA privacy and security standards can result in civil monetary penalties up to $55,910 per violation, not to exceed $1.68 million per calendar year for non-compliance of an identical provision, and, in certain circumstances, criminal penalties with fines up to $250,000 per violation and/or imprisonment.
In addition, even when HIPAA does not apply, according to the FTC, failing to take appropriate steps to keep consumers’ personal information secure constitutes unfair acts or practices in or affecting commerce in violation of Section 5(a) of the FTCA, 15 U.S.C § 45(a). The FTC expects a company’s data security measures to be reasonable and appropriate in light of the sensitivity and volume of consumer information it holds, the size and complexity of its business, and the cost of available tools to improve security and reduce vulnerabilities. Medical data is considered sensitive data that merits stronger safeguards. The FTC’s guidance for appropriately securing consumers’ personal information is similar to what is required by the HIPAA Security Rule.
In the European Union, we may be subject to laws relating to our collection, control, processing and other use of personal data (i.e. data relating to an identifiable living individual). We process personal data in relation to our operations. We process data of our employees, consultants and certain individuals who may be affiliated with our customers, including physician users of our products. The personal data may include sensitive personal data including health information. The data privacy regime in the EU includes the EU General Data Protection Regulation, or the GDPR, effective on May 25, 2018 and the E-Privacy Directive 2002/58/EC and national laws implementing each of them. Each EU Member State may adopt additional legislation implementing these regulations into its own national data privacy regime and therefore the laws may differ by jurisdiction, sometimes significantly. We need to ensure compliance with the rules in each jurisdiction where we are established or are otherwise subject to local privacy laws.
The new EU-wide GDPR became applicable on May 25, 2018, replacing the data protection laws previously issued by each EU member state based on the Directive 95/46/EC. Unlike the Directive (which needed to be transposed at national level), the GDPR text is directly applicable in each EU Member State, resulting in a more uniform application of data privacy laws across the EU. The GDPR imposes onerous accountability obligations requiring data controllers and processors to maintain a record of their data processing and policies. It requires data controllers to be transparent and disclose to data subjects (in a concise, intelligible and easily accessible form) how their personal information is to be used, imposes limitations on retention of information, increases requirements pertaining to pseudonymized (i.e., key-coded) data, introduces mandatory data breach notification requirements and sets higher standards for data controllers to demonstrate that they have obtained valid consent for certain data processing activities. Fines for non-compliance with the GDPR will be significant—the greater of EUR 20 million or 4% of global turnover. The GDPR provides that EU member states may introduce further conditions, including limitations, to the processing of genetic, biometric, or health data, which could limit our ability to collect, use and share personal data, or could cause our compliance costs to increase, ultimately having an adverse impact on our business.
We are subject to the supervision of local data protection authorities in those jurisdictions where we are established or otherwise subject to applicable law. We depend on a number of third parties in relation to our provision of our services, a number of which process personal data on our behalf. With each such provider we enter into contractual arrangements to ensure that they only process personal data according to our instructions, and that they have sufficient technical and organizational security measures in place. Where we transfer personal data outside the EEA, we do so in compliance with the relevant data export requirements. We take our data protection obligations seriously, as any improper disclosure, particularly with regard to our customers’ sensitive personal data, could negatively impact our business and/or our reputation.
33
Manufacturing and Supply
We use third-party manufacturers to produce our instruments and implants. The majority of our instruments have secondary manufacturing suppliers and we continually work with additional manufacturers to establish secondary suppliers. Our iFuse implants are currently provided by a single source, Orchid Bio-Coat, a division of Orchid Orthopedic Solutions LLC. In April 2016, we entered into a Quality and Manufacturing Agreement with Orchid MPS Holdings, LLC, or Orchid, which agreement was amended in March 2017, pursuant to which Orchid manufactures certain of our implants in accordance with our specifications. We purchase product under the agreement pursuant to purchase orders we are required to deliver against a blanket purchase order we provide based on our product forecast. However, while we are required to purchase the amounts forecast in the blanket purchase order, we are not required to purchase product in excess of a specified amount of inventory based on our original forecast. During the first year of the agreement, the prices we pay for products are fixed under the agreement; provided that on an annual basis thereafter we will meet with Orchid to review changes in direct costs beyond certain thresholds and may negotiate changes to prices based on such changes in costs. In addition, the prices we pay for product may be increased with our consent to the extent such products are ordered with delivery timelines shorter than agreed upon order timelines. The initial term of the agreement is three years; provided, however, the agreement may be terminated immediately by (a)(i) either party as the result of the other party’s bankruptcy or insolvency, (ii) in the case of Orchid, our failure to make payments for products purchased under the agreement if such failure continues for a specified period after notice from Orchid, or (iii) either party as the result of a material breach of the agreement and such breaching party fails to cure such breach within a specified period after notice from the non-breaching party, (b) us in the event Orchid fails to remedy any deficiencies we may identify pursuant to our right to inspect Orchid’s facilities under the agreement, and (c) either party with prior written notice as provided under the agreement. To mitigate supply risk, we carry a minimum of two months of reserve stock based on current sales estimates and typically place implant orders with Orchid prior to estimated demand.
We have also added a second source supplier for machine parts. On February 1, 2017, we entered into a non-exclusive Manufacturing, Quality and Supply Agreement with rms Company, or RMS, pursuant to which RMS manufactures certain of our implants in accordance with our specifications, including both purchased and sterilized iFuse-3D implants, as well as uncoated machined implants which are subsequently coated to become our finished first generation iFuse implants. We amended this agreement on July 7, 2017 to provide for our purchase of product pursuant to purchase orders we must deliver against a blanket purchase order we provide based on our product forecast. While we are required to purchase the amounts forecast in the blanket purchase order, we are not required to purchase product in excess of a specified amount of inventory based on our original forecast. During the initial three-year term of the agreement, the prices we pay for products are fixed under the agreement provided that if order volumes deviate from forecasted amounts beyond certain thresholds we or RMS may request to negotiate further price changes. After the initial term, the agreement automatically renews for successive one-year periods; provided, however, the agreement may be terminated early by either party in the event of a material breach of the agreement by the other party or by the insolvency of the other party. We may terminate the agreement at any time in the event (i) RMS fails to ship conforming product and such failure results in delays as specified in the agreement, (ii) RMS changes its manufacturing site without our prior approval, (iii) of a change of control of RMS, or (iv) RMS breaches a non-solicit covenant with respect to our employees or consultants. With respect to our first generation iFuse implant, the parts manufactured by RMS need to be coated by Orchid to finish the goods. RMS is currently our only supplier of iFuse-3D implants.
Aside from quality agreements, we do not currently have manufacturing agreements with any of our other manufacturers and orders are controlled through purchase orders.
We believe that our manufacturing operations, and those of our suppliers, comply with regulations mandated by the FDA, as well as Medical Devices Directive regulations in the EEA. Manufacturing facilities that produce medical devices or component parts intended for distribution world-wide are subject to regulation and periodic planned and unannounced inspection by the FDA and other domestic and international regulatory agencies.
In the United States, products we sell are required to be manufactured in compliance with the FDA’s QSR, which covers the methods used in, and the facilities used for, the design, testing, control, manufacturing, labeling, quality assurance, packaging, storage, and shipping. In international markets, we are required to obtain and maintain various quality assurance and quality management certifications. We have obtained the following international certifications: Quality Management System ISO13485, Full Quality Assurance Certification for the design and manufacture of iFuse, and a Design Examination certificate for iFuse.
34
We are required to demonstrate continuing compliance with applicable regulatory requirements to maintain these certifications and will continue to be periodically inspected by international regulatory authorities for certification purposes. Further, we and certain of our suppliers are required to comply with all applicable regulations and current good manufacturing practices. As set forth above, these FDA and international regulations cover, among other things, the methods and documentation of the design, testing, production, control, quality assurance, labeling, packaging, sterilization, storage, and shipping of our products. Compliance with applicable regulatory requirements is subject to continual review and is monitored rigorously through periodic inspections. If we or our manufacturers fail to adhere to current good manufacturing practice requirements, this could delay production of our products and lead to fines, difficulties in obtaining regulatory approvals, recalls, enforcement actions, including injunctive relief or consent decrees, or other consequences, which could, in turn, have a material adverse effect on our financial condition or results of operations.
Product Liability and Insurance
The manufacture and sale of our products subjects us to the risk of financial exposure to product liability claims. Our products are used in situations in which there is a risk of serious injury or death. We carry insurance policies which we believe to be customary for similar companies in our industry. We cannot assure you that these policies will be sufficient to cover all or substantially all losses that we experience.
We endeavor to maintain executive and organization liability insurance in a form and with aggregate coverage limits that we believe are adequate for our business purposes, but our coverage limits may prove not to be adequate in some circumstances.
Employees
As of December 31, 2018, we had 183 employees, including sales and marketing, product development, general administrative and accounting, both domestically and internationally. As of December 31, 2018, we had a direct field sales organization of 83 in the United States and 19 in Europe. In the United States, we sell primarily through our direct field organization, and we have 30 third-party distributors. None of our employees is subject to a collective bargaining agreement, and we consider our relationship with our employees to be good.
Company History
SI-BONE was founded in 2008 by the main inventor of iFuse and member of our board of directors, orthopedist Mark A. Reiley, M.D., our President, Chief Executive Officer, and Chairman, Jeffrey W. Dunn, and orthopedic surgeon Leonard Rudolf, M.D. Dr. Reiley previously invented balloon kyphoplasty and founded Kyphon Inc., which was sold to Medtronic plc in 2007. He also invented the INBONE total ankle replacement system, which was sold to Wright Medical Technology, Inc. in 2008.
Corporate Information
We were incorporated in March 2008 in Delaware. Our principal executive offices are located at 471 El Camino Real, Suite 101, Santa Clara, California 95050 and our telephone number is (408) 207-0700. Our website address is www.si-bone.com. The information on, or that can be accessed through, our website is not part of this prospectus. We have included our website address as an inactive textual reference only.
Our Annual Report on Form 10-K, Quarterly reports on Form 10-Q, current reports on Form 8-K, and amendments to those reports filed or furnished pursuant to Section 13(a) or 15(d) of the Exchange Act are available free of charge on our website. The information contained on or that can be accessed through our website is not incorporated by reference into this report, and you should not consider information on our website to be part of this report.
35
Item 1A. Risk Factors
Investing in our common stock involves a high degree of risk. Investors should carefully consider the risks described below, as well as the other information in this Annual Report on Form 10-K, including our consolidated financial statements and the related notes and the section “Management’s Discussion and Analysis of Financial Condition and Results of Operations,” before deciding whether to invest in our common stock. The occurrence of any of the events or developments described below could materially and adversely affect our business, financial condition, results of operations, and growth prospects. In such an event, the market price of our common stock could decline, and our stockholders may lose all or part of their investment. Additional risks and uncertainties not presently known to us or that we currently deem immaterial may also impair our business operations.
Risks Related to Our Business and Our Industry
We have incurred significant operating losses since inception, we expect to continue to incur operating losses in the future, and we may not be able to achieve or sustain future profitability.
We have incurred net losses since our inception in 2008. For
2018
and
2017
, we had net losses of
$17.5 million
and
$23.0 million
, respectively. As of
December 31, 2018
, we had an accumulated deficit of
$157.2 million
. To date, we have financed our operations primarily through the proceeds of our initial public offering of our common stock, or IPO, private placements of equity securities, certain debt-related financing arrangements, and from sales of our products. We have devoted substantially all of our resources to research and development of our products, sales and marketing activities, investments in training and educating surgeons and other healthcare providers, and clinical and regulatory matters for our products. There can be no assurances that we will be able to generate sufficient revenue from our existing products or from any of our product candidates in development, and to transition to profitability and generate consistent positive cash flows. We expect that our operating expenses will continue to increase as we continue to build our commercial infrastructure, develop, enhance, and commercialize our existing and new products and incur additional operational and reporting costs associated with being a public company. As a result, we expect to continue to incur operating losses for the foreseeable future and may never achieve profitability. Furthermore, even if we do achieve profitability, we may not be able to sustain or increase profitability on an ongoing basis. If we do not achieve profitability, it will be more difficult for us to finance our business and accomplish our strategic objectives.
Our expected future capital requirements may depend on many factors including expanding our surgeon base, the expansion of our sales force, and the timing and extent of spending on the development of our technology to increase our product offerings. We may need additional funding to fund our operations but additional funds may not be available to us on acceptable terms on a timely basis, if at all. We may seek funds through borrowings or through additional rounds of financing, including private or public equity or debt offerings. If we raise additional funds by issuing equity securities, our stockholders may experience dilution. Any future debt financing into which we enter may impose upon us additional covenants that restrict our operations, including limitations on our ability to incur liens or additional debt, pay dividends, repurchase our common stock, make certain investments, and engage in certain merger, consolidation or asset sale transactions. Any future debt financing or additional equity that we raise may contain terms that are not favorable to us or our stockholders. Furthermore, we cannot be certain that additional funding will be available on acceptable terms, if
at all. If we are unable to raise additional capital or generate sufficient cash from operations to adequately fund our operations, we will need to curtail planned activities to reduce costs, which will likely harm our ability to execute on our business plan and continue operations.
If hospitals, surgeons, and other healthcare providers are unable to obtain coverage and reimbursement from third-party payors for procedures performed using our products, adoption of our products may be delayed, and it is unlikely that they will gain further acceptance.
Maintaining and growing sales of our products depends on the availability of adequate coverage and reimbursement from third-party payors, including government programs such as Medicare and Medicaid, private insurance plans, and managed care programs. Hospitals, surgeons, and other healthcare providers that purchase or use medical devices generally rely on third-party payors to pay for all or part of the costs and fees associated with the procedures performed with these devices.
Adequate coverage and reimbursement for procedures performed with our products is central to the acceptance of our current and future products. We may be unable to sell our products on a profitable basis if third-party payors deny coverage, continue to deny coverage or reduce their current levels of payment, or if our costs of production increase faster than increases in reimbursement levels. For example, our sales decreased significantly after minimally invasive sacroiliac joint fusion was assigned to a Category III Current Procedure Terminology, or CPT, code effective July 1, 2013. After implementation of this Category III CPT Code, surgeons were no longer able to consistently obtain reimbursement for procedures performed using our products. However, effective January 1, 2015, minimally invasive sacroiliac joint fusion was assigned to a Category I CPT Code.
Many private payors refer to coverage decisions and payment amounts determined by the Centers for Medicare and Medicaid Services, or CMS, which administers the Medicare program, as guidelines for setting their coverage and reimbursement policies. By
December 31, 2016
, all Medicare Administrative Contractors were regularly reimbursing for minimally invasive sacroiliac joint fusion.
36
Private payors that do not follow the Medicare guidelines may adopt different coverage and reimbursement policies for procedures performed with our products. Private commercial payors have been slower to adopt positive coverage policies for minimally invasive sacroiliac joint fusion, and many private payors still have policies that treat the procedure as experimental or investigational and do not regularly reimburse for the procedure. Future action by CMS or third-party payors may further reduce the availability of payments to physicians, outpatient surgery centers, and/or hospitals for procedures using our products.
The healthcare industry in the United States has experienced a trend toward cost containment as government and private insurers seek to control healthcare costs. Payors are imposing lower payment rates and negotiating reduced contract rates with service providers and being increasingly selective about the technologies and procedures they chose to cover. For example, several Blue Cross Blue Shield payors have recently adopted policies that treat 3D-printed orthopedic implants that come in standard sizes, rather than customized to the patient’s anatomy, such as our iFuse-3D implant, as experimental and investigational and therefore not eligible for reimbursement. There can be no guarantee that we will be able to provide the scientific and clinical data necessary to overcome these policies. Such policies may contribute to a decrease in sales of our iFuse-3D implants. Payors may adopt policies in the future restricting access to medical technologies like ours and/or the procedures performed using such technologies. Therefore, we cannot be certain that the procedures performed with each of our products will be reimbursed. There can be no guarantee that, should we introduce additional products in the future, payors will cover those products or the procedures in which they are used.
Market acceptance of our products in foreign markets may depend, in part, upon the availability of coverage and reimbursement within prevailing healthcare payment systems. Reimbursement and healthcare payment systems in international markets vary significantly by country and include both government-sponsored healthcare and private insurance. We may not obtain additional international coverage and reimbursement approvals in a timely manner, if at all. Our failure to receive such approvals would negatively impact market acceptance of our products in the international markets in which those approvals are sought.
If the reimbursement provided by third-party payors to hospitals, surgeons, and other healthcare providers for procedures performed using our products is insufficient, adoption and use of our products and the prices paid for our implants may decline.
When an iFuse procedure is performed, both the surgeon and the healthcare facility, either a hospital or ambulatory surgical center, submit claims for reimbursement to the healthcare payor. Generally, the facility obtains a lump sum payment, or facility fee, for minimally invasive sacroiliac joint fusions. Our products are purchased by the facility, along with other supplies used in the procedure. The facility must also pay for its own fixed costs of operation, including certain operating room personnel involved in the procedure. If these costs exceed the facility fee reimbursement, the facility’s managers may discourage or restrict surgeons from performing the procedure in the facility or using certain technologies, such as our iFuse implants, to perform the procedure.
The national average Medicare payment per procedure to hospital outpatient departments increased from $10,538 to $14,704 effective January 1, 2017. Effective January 1, 2019, the national average Medicare payment to hospital outpatient departments is $15,402. Effective January 1, 2019, the Medicare payment to an ambulatory surgical center for a sacroiliac joint fusion is $12,481. We believe that payments to facilities are generally adequate for these facilities to offer the iFuse procedure. However, there can be no guarantee that these facility fee payments will not decline in the future. The number of iFuse procedures performed and the prices paid for our implants may in the future decline if payments to facilities for minimally invasive sacroiliac joint fusions decline.
Surgeons are reimbursed separately for their professional time and effort to perform a surgical procedure. Prior to reassignment of minimally invasive sacroiliac joint fusion to a Category III CPT Code, the national average Medicare physician fee schedule payment to surgeons for CPT codes commonly used to submit claims for reimbursement for the iFuse procedure was approximately $1,000 and the procedure was commonly covered by both government and private commercial payors in the United States. In 2015, the national average physician payment for the new Category I CPT Code for minimally invasive sacroiliac fusion was $574, and we believe that this payment caused adoption of the procedure to slow. Effective January 1, 2016, the national average Medicare payment for the Category I CPT code increased to $718, and the national average payment effective January 1, 2019, is $720. Many private payors set their payment amounts with reference to the Medicare payment, often approximately 10% to 33% higher than the Medicare payment for a procedure. For some governmental programs, such as Medicaid, coverage and reimbursement differ from state to state, and some state Medicaid programs may not pay an adequate amount for the procedures performed with our products, if any payment is made at all.
We believe that some surgeons view the current Medicare reimbursement amount as insufficient for the procedure, given the work effort involved with the procedure, including the time to diagnose the patient and obtain prior authorization from the patient’s health insurer if necessary. Many private payors require extensive documentation of a multi-step diagnosis before authorizing minimally invasive sacroiliac joint fusion for a patient. We believe that some private payors apply their own coverage policies and criteria inconsistently, and surgeons may not be able to consistently have minimally invasive sacroiliac fusions approved and covered. The perception by physicians that the reimbursement for minimally invasive sacroiliac joint fusion is insufficient to compensate them for the work required, including diagnosis, documentation, obtaining payor approval for the procedure, and burden on their office staff, may negatively affect the number of procedures performed and may therefore impede the growth of our revenues or cause them to decline.
{{
37
If healthcare payors reverse decisions to cover minimally invasive sacroiliac joint fusion exclusively when performed with iFuse and choose to reimburse for procedures performed with competitive products, our market share could decline, adversely affecting our revenues.
As of
December 31, 2018
, 48 of the largest 65 U.S. private payors that we track and target have issued positive coverage policies covering the patented triangular design of our iFuse implants and excluding coverage of other products that are intended to fuse the sacroiliac joint because of the clinical evidence supporting the use of iFuse and the lack of clinical evidence supporting the use of other products. Additionally, the public hospital system in France initiated coverage for iFuse exclusively beginning September 6, 2018. We believe that payors have adopted these exclusive coverage decisions due to the strength of our clinical evidence and in part due to recommendations of specialty benefit managers and healthcare technology assessment organizations. In 2018, AIM Specialty Health, Blue Cross Blue Shield Association Evidence Street, and eviCore Healthcare published positive coverage recommendations to their constituents and payor customers, recommending that iFuse be covered exclusively. Clinical trials of the type and size necessary to offer evidence of the safety and efficacy of competing products could be performed and could show that other products for sacroiliac joint fusion are as effective as, or more effective than, iFuse. Payors could also abandon their decisions to cover iFuse exclusively for other reasons.
We may not be able to convince physicians that iFuse is an attractive alternative to our competitors’ products and that our procedure is an attractive alternative to existing surgical and non-surgical treatments of the sacroiliac joint.
Surgeons play the primary role in determining the course of treatment in consultation with their patients and, ultimately, the product that will be used to treat a patient. In order for us to sell our iFuse solution successfully, we must convince surgeons through education and training that treatment with iFuse is beneficial, safe, and cost-effective for patients as compared to our competitors’ products. If we are not successful in convincing surgeons of the merits of iFuse, they may not use our product, and we will be unable to increase our sales and achieve or grow profitability.
Historically, most spine surgeons did not include sacroiliac joint pain in their diagnostic work-up because they did not have an adequate surgical procedure to perform for patients diagnosed with the condition. As a result, some patients with lower back pain resulting from sacroiliac joint dysfunction are misdiagnosed. We believe that educating surgeons and other healthcare professionals about the clinical merits and patient benefits of iFuse is an important element of our growth. If we fail to effectively educate surgeons and other medical professionals, they may not include a sacroiliac joint evaluation as part of their diagnosis and, as a result, those patients may continue to receive unnecessary or only non-surgical treatment.
Surgeons may also hesitate to change their medical treatment practices for other reasons, including the following:
|
•
|
lack of experience with minimally invasive procedures;
|
|
•
|
perceived liability risks generally associated with the use of new products and procedures;
|
|
•
|
costs associated with the purchase of new products; and
|
|
•
|
time commitment that may be required for training.
|
Furthermore, we believe surgeons will not widely use iFuse unless they determine, based on experience, clinical data, and published peer-reviewed publications, that surgical intervention provides benefits or is an attractive alternative to non-surgical treatments of sacroiliac joint dysfunction. In addition, we believe support of our products relies heavily on long-term data showing the benefits of using our products. If we are unable to provide that data, surgeons may not use our products. In such circumstances, we may not achieve expected sales and may be unable to achieve profitability.
38
Surgeons and payors may not find our clinical evidence to be compelling, which could limit our sales and revenue, and on-going and future research may prove our products to be less safe and effective than initially anticipated.
The products we currently market in the United States have either received premarket clearance under Section 510(k) of the U.S. Federal Food, Drug, and Cosmetic Act, or FDCA, or are exempt from premarket review. Those marketed in the European Union, or EU, have been the subject of a CE Certificate of Conformity. The 510(k) clearance process of the U.S. Food and Drug Administration, or FDA, requires us to document that our product is “substantially equivalent” to another 510(k)-cleared products. The 510(k) process is shorter and typically requires the submission of less supporting documentation than other FDA approval processes, such as a premarket approval, or PMA, and does not usually require pre-clinical or clinical studies. Additionally, to date, we have not been required to complete clinical studies in connection with the sale of our products outside the United States. As a result, while there are a number of published studies relating to iFuse and minimally invasive sacroiliac joint surgery that support the safety and effectiveness of our products and the benefits they offer, our clinical studies may lack the size and scope of randomized controlled clinical trials required to support approval of a PMA. For these reasons, surgeons may be slow to adopt our products, third-party payors may be slow to provide coverage, and we may be subject to greater regulatory and product liability risks. Further, future patient studies or clinical experience may indicate that treatment with our products does not improve patient outcomes. Such results would slow the adoption of our products by surgeons, significantly reduce our ability to achieve expected sales, and could prevent us from achieving profitability. Moreover, if future results and experience indicate that our products cause unexpected or serious complications or other unforeseen negative effects, we could be subject to mandatory product recalls, suspension, or withdrawal of FDA clearance, and suspension, variation, or withdrawal of our CE Certificates of Conformity, significant legal liability or harm to our business reputation, which could have a material adverse effect on our results or operations and financial condition. Similar risks apply to product approvals and registrations in other countries outside the United States and the EU as well.
Pricing pressure from our competitors, changes in third-party coverage and reimbursement, healthcare provider consolidation, payor consolidation and the proliferation of “physician-owned distributorships” may impact our ability to sell our product at prices necessary to support our current business strategies.
If competitive forces drive down the prices we are able to charge for our product, our profit margins will shrink, which will adversely affect our ability to invest in and grow our business. The sacroiliac joint fusion market has attracted numerous new companies and technologies. As a result of this increased competition, we believe there will be continuing increased pricing pressure, resulting in lower gross margins, with respect to our products.
Even to the extent our product and procedures using our product are currently covered and reimbursed by third-party private and public payors, adverse changes in coverage and reimbursement policies that affect our products, discounts, and number of implants used may also drive our prices down and harm our ability to market and sell our products.
We are unable to predict what changes will be made to the reimbursement methodologies used by third-party payors. We cannot be certain that under current and future payment systems, in which healthcare providers may be reimbursed a set amount based on the type of procedure performed, such as those utilized by Medicare and in many privately managed care systems, the cost of our products will be justified and incorporated into the overall cost of the procedure. In addition, to the extent there is a shift from inpatient setting to outpatient settings, we may experience pricing pressure and a reduction in the number of iFuse procedures performed.
Consolidation in the healthcare industry, including both third-party payors and healthcare providers, could lead to demands for price concessions or to the exclusion of some suppliers from certain of our markets, which could have an adverse effect on our business, results of operations, or financial condition. Because healthcare costs have risen significantly over the past several years, numerous initiatives and reforms initiated by legislators, regulators, and third-party payors to curb these costs have resulted in a consolidation trend in the healthcare industry to aggregate purchasing power. As the healthcare industry consolidates, competition to provide products and services to industry participants has become and will continue to become more intense. This in turn has resulted and will likely continue to result in greater pricing pressures and the exclusion of certain suppliers from important market segments as group purchasing organizations, independent delivery networks, and large single accounts continue to use their market power to consolidate purchasing decisions for hospitals. We expect that market demand, government regulation, third-party coverage, and reimbursement policies and societal pressures will continue to change the worldwide healthcare industry, resulting in further business consolidations and alliances among our customers, which may reduce competition, exert further downward pressure on the prices of our products, and adversely impact our business, results of operations, or financial condition. As we continue to expand into international markets, we will face similar risks relating to adverse changes in coverage and reimbursement procedures and policies in those markets.
Physician-owned distributorships, or PODs, are medical device distributors that are owned, directly or indirectly, by physicians. These physicians profit from selling or arranging the sale of medical devices for use in procedures they perform on their own patients at hospitals that purchase the devices from the POD. We currently do not engage with PODs. The proliferation of PODs could result in increased pricing pressure on our products or harm our ability to sell our products to physicians who own or are affiliated with those distributorships.
39
We operate in a very competitive business environment and if we are unable to compete successfully against our existing or potential competitors, our sales and operating results may be negatively affected and we may not grow.
Our currently marketed products are, and any future products we commercialize will likely be, subject to intense competition. Our field is subject to rapid change and highly sensitive to the introduction of new products or other market activities of industry participants. Our ability to compete successfully will depend on our ability to develop proprietary products that reach the market in a timely manner, receive adequate coverage and reimbursement from third-party payors, and are safer, less invasive, and more effective than alternatives available for similar purposes as demonstrated in peer-reviewed clinical publications. Because of the size of the potential market, we anticipate that other companies will dedicate significant resources to developing competing products.
The number of competitors that we are aware of marketing sacroiliac joint fusion products in the United States has grown from zero to 22 since 2008. Many of our current and potential competitors are major medical device companies that have substantially greater financial, technical, and marketing resources than we do, and they may succeed in developing products that would render our products obsolete or noncompetitive. In addition, many of these competitors have significantly longer operating history and more established reputations than we do. Some of these companies sell a broad suite of products that can be used together in the operating room in order to facilitate surgery, such as surgical imaging, navigation and robotic systems, or a large number of implants intended to treat different conditions affecting the spine and pelvis. The ability of these competitors to sell these products together or as part of larger purchasing arrangements may put as at a disadvantage.
In the United States, we believe that our primary competitors currently are Globus Medical, Inc., Medtronic plc, XTant Medical Holdings and RTI Surgical, Inc. Our primary competitors in Europe are Globus Medical, SIGNUS Medizintechnik GmbH, and XTant Medical Holdings. At any time, these or other industry participants may develop alternative treatments, products or procedures for the treatment of the sacroiliac joint that compete directly or indirectly with our products. They may also develop and patent processes or products earlier than we can or obtain domestic and international regulatory clearances or approvals and CE Certificates of Conformity for competing products in the European Economic Area, or EEA, more rapidly than we can, which could impair our ability to develop and commercialize similar processes or products. If alternative treatments are, or are perceived to be, superior to our products, sales of our products and our results of operations could be negatively affected.
Some of our larger competitors are either publicly traded or divisions or subsidiaries of publicly traded companies. These competitors may enjoy several competitive advantages over us, including:
|
•
|
greater financial, human, and other resources for product research and development, sales and marketing, and legal matters;
|
|
•
|
significantly greater name recognition;
|
|
•
|
established relationships with surgeons, hospitals, and other healthcare providers;
|
|
•
|
large and established sales and marketing and distribution networks;
|
|
•
|
greater experience in obtaining and maintaining domestic and international regulatory clearances or approvals, or CE Certificates of Conformity for products and product enhancements;
|
|
•
|
more expansive portfolios of intellectual property rights; and
|
|
•
|
greater ability to cross-sell their products or to incentivize hospitals or surgeons to use their products.
|
New participants have increasingly entered the medical device industry. Many of these new competitors specialize in a specific product or focus on a particular market segment, making it more difficult for us to increase our overall market position. The frequent introduction by competitors of products that are or claim to be superior to our products or that are alternatives to our existing or planned products may make it difficult to differentiate the benefits of our products over competing products. In addition, the entry of multiple new products and competitors may lead some of our competitors to employ pricing strategies that could adversely affect the pricing of our products and pricing in the market generally.
As a result, without the timely introduction of new products and enhancements, our products may become obsolete over time. If we are unable to develop innovative new products, maintain competitive pricing, and offer products that surgeons and other physicians perceive to be as reliable as those of our competitors, our sales or margins could decrease, thereby harming our business.
40
We currently manufacture and sell products used in a single procedure, which could negatively affect our operations and financial condition.
We do not sell any product other than iFuse and related tools and instruments. Therefore, we are solely dependent on widespread market adoption of iFuse and we will continue to be dependent on the success of this single product for the foreseeable future. There can be no assurance that iFuse will gain a substantial degree of market acceptance among surgeons, patients or healthcare providers. Our failure to successfully increase sales of iFuse or any other event impeding our ability to sell iFuse, would result in a material adverse effect on our results of operations, financial condition and continuing operations.
If we are unable to maintain and expand our network of direct sales representatives and third-party distributors, we may not be able to generate anticipated sales.
As of
December 31, 2018
, our U.S. sales force consisted of 45 sales representatives directly employed by us and 30 third-party distributors. As of
December 31, 2018
, our international sales force consisted of 14 sales representatives and 23 exclusive third-party distributors, which together have had sales in 33 countries through
December 31, 2018
. Our operating results are directly dependent upon the sales and marketing efforts of both our direct sales force and of our third-party distributors.
As we launch new products and increase our marketing efforts with respect to existing products, we will need to expand the reach of our marketing and sales networks. Our future success will depend largely on our ability to continue to hire, train, retain and motivate skilled direct sales representatives and third-party distributors with significant technical knowledge in various areas, such as spine health and treatment. New hires require training and take time to achieve full productivity. If we fail to train new hires adequately, or if we experience high turnover in our sales force in the future, we cannot be certain that new hires will become as productive as may be necessary to maintain or increase our sales. Our intention is for our direct sales representatives and third-party distributors to develop long-lasting relationships with the surgeons they serve. If our direct sales representatives or third-party distributors fail to adequately promote, market and sell our products or decide to leave or cease to do business with us, our sales could significantly decrease.
We face significant challenges and risks in managing our geographically dispersed distribution network and retaining the individuals who make up that network. Some of our international third-party distributors account for a significant portion of our international sales volume, and if any such third-party distributor were to cease to distribute our products, our sales could be adversely affected. In such a situation, we may need to seek alternative third-party distributors or increase our reliance on our direct sales representatives, which may not prevent our sales from being adversely affected. If a direct sales representative or third-party distributor were to depart and be retained by one of our competitors, we may be unable to prevent them from helping competitors solicit business from our existing customers, which could further adversely affect our sales. Because of the intense competition for their services, we may be unable to recruit or retain additional qualified third-party distributors or to hire additional direct sales representatives to work with us. Furthermore, we may not be able to enter into agreements with them on favorable or commercially reasonable terms, if at all. Failure to hire or retain qualified direct sales representatives or third-party distributors would prevent us from expanding our business and generating sales.
In addition, distribution arrangements are complex and time consuming to negotiate and document, especially outside the United States. We may not be able to negotiate distribution arrangements on a timely basis, on acceptable terms, or at all. If we are unable to do so, we may have to curtail the development of our products, delay their potential commercialization or reduce the scope of any sales or marketing activities, or increase our expenditures and undertake development or commercialization activities at our own expense. If we elect to increase our expenditures to fund development or commercialization activities on our own, we may need to obtain additional capital, which may not be available to us on acceptable terms or at all. If we do not have sufficient funds, we may not be able to further develop our products or bring them to market and generate revenue.
If we are unable to expand our sales and marketing capabilities domestically and internationally, we may not be able to effectively commercialize our products, which would adversely affect our business, results of operations, and financial condition.
We have a limited operating history and may face difficulties encountered by early stage companies in new and rapidly evolving markets.
We were formed in 2008. Accordingly, we have a limited operating history upon which to base an evaluation of our business and prospects. In assessing our prospects, investors must consider the risks and difficulties frequently encountered by early stage companies in new and rapidly evolving markets, particularly companies engaged in the development and sales of medical devices. These risks include our inability to:
|
•
|
increase coverage by third-party, private, and government payors;
|
|
•
|
establish and increase awareness of our brand and strengthen customer loyalty;
|
|
•
|
obtain domestic and international regulatory clearances or approvals, and CE Certificates of Conformity;
|
41
|
•
|
conformity to commercialize new products and enhance our existing products;
|
|
•
|
manage rapidly changing and expanding operations;
|
|
•
|
grow our direct sales force and increase the number of our third-party distributors to expand sales of our products in the United States and in targeted international markets;
|
|
•
|
implement and successfully execute our business and marketing strategy;
|
|
•
|
respond effectively to competitive pressures and developments;
|
|
•
|
continue to develop and enhance our products and product candidates;
|
|
•
|
expand our presence and commence operations in international markets;
|
|
•
|
perform clinical research and trials on our existing products and current and future product candidates; and
|
|
•
|
attract and retain qualified personnel.
|
We can also be negatively affected by general economic conditions. Because of our limited operating history, we may not have insight into trends that could emerge and negatively affect our business. As a result of these or other risks, our business strategy might not be successful.
Our sales volumes and our operating results may fluctuate over the course of the year.
We have experienced and continue to experience meaningful variability in our sales and gross profit from quarter to quarter, as well as within each quarter. Our sales and results of operations will be affected by numerous factors, including, among other things:
|
•
|
payor coverage and reimbursement;
|
|
•
|
the number of products sold in the quarter and our ability to drive increased sales of our products;
|
|
•
|
our ability to establish and maintain an effective and dedicated sales force;
|
|
•
|
pricing pressure applicable to our products, including adverse third-party coverage and reimbursement outcomes;
|
|
•
|
results of clinical research and trials on our existing products and products in development;
|
|
•
|
the mix of our products sold because profit margins differ amongst our products;
|
|
•
|
timing of new product offerings, acquisitions, licenses or other significant events by us or our competitors;
|
|
•
|
the ability of our suppliers to timely provide us with an adequate supply of materials and components;
|
|
•
|
the evolving product offerings of our competitors;
|
|
•
|
the demand for, and pricing of, our products and the products of our competitors;
|
|
•
|
factors that may affect the sale of our products, including seasonality and budgets of our customers;
|
|
•
|
domestic and international regulatory clearances or approvals, or CE Certificates of Conformity, and legislative changes affecting the products we may offer or those of our competitors;
|
|
•
|
interruption in the manufacturing or distribution of our products;
|
|
•
|
the effect of competing technological, industry and market developments;
|
|
•
|
our ability to expand the geographic reach of our sales and marketing efforts;
|
|
•
|
the costs of maintaining adequate insurance coverage, including product liability insurance;
|
|
•
|
the availability and cost of components and materials;
|
|
•
|
the number of selling days in the quarter;
|
|
•
|
fluctuation in foreign currency exchange rates; and
|
|
•
|
impairment and other special charges.
|
42
Some of the products we may seek to develop and introduce in the future will require FDA clearance or approval before commercialization in the United States, and commercialization of such products outside of the United States would likely require additional regulatory approvals, or Certificates of Conformity and import licenses. As a result, it will be difficult for us to forecast demand for these products with any degree of certainty. In addition, we will be increasing our operating expenses as we expand our commercial capabilities. Accordingly, we may experience significant, unanticipated losses. If our quarterly or annual operating results fall below the expectations of investors or securities analysts, the price of our common stock could decline substantially. Furthermore, any quarterly or annual fluctuations in our operating results may, in turn, cause the price of our common stock to fluctuate substantially. Quarterly comparisons of our financial results may not always be meaningful and should not be relied upon as an indication of our future performance.
If our business strategy proves to be flawed, or if we do not successfully implement our business strategy, our business and results of operations will be adversely affected
Our business strategy was based on assumptions about the market that might prove wrong. We believe that various demographics and industry-specific trends will help drive growth in the market and our business, but these demographics and trends have been and will continue to be uncertain. Actual demand for our products could differ materially from projected demand if our assumptions regarding these factors prove to be incorrect or do not materialize, or if alternative treatments to those offered by our products gain widespread acceptance.
To implement our business strategy we need to, among other things, develop and introduce new products, find new applications for and improve our existing products, obtain new domestic and international regulatory clearances or approvals and CE Certificates of Conformity and domestic and international regulatory clearance or approval for new products and applications, and educate surgeons and payors about the clinical benefits and cost effectiveness of our products. We may not be able to successfully implement our business strategy. Also, our strategy of focusing exclusively on the sacroiliac joint market may limit our ability to grow. In addition, in order to increase our sales, we will need to commercialize additional products and expand our direct and third-party distributor sales forces in existing and new regions, all of which could result in our becoming subject to additional or different foreign and domestic regulatory requirements, with which we may not be able to comply. Moreover, we may decide to alter or discontinue aspects of our business strategy and may adopt different strategies due to business or competitive factors not currently foreseen, such as new medical technologies that would make our products obsolete. Any failure to implement our business strategy may adversely affect our business, results of operations, and financial condition.
Our business could suffer if we lose the services of key members of our senior management, key advisors or personnel.
We are dependent upon the continued services of key members of our senior management and a limited number of key advisors and personnel. In particular, we are highly dependent on the skills and leadership of our President, Chief Executive Officer, and Chairman, Jeffrey W. Dunn. The loss of members of our senior management team, key advisors or personnel, or our inability to attract or retain other qualified personnel or advisors, could have a material adverse effect on our business, results of operations, and financial condition. We do not maintain “key person” insurance for any of our executives or employees. In addition, several of the members of our executive management team are not subject to non-competition agreements that restrict their ability to compete with us. Accordingly, the adverse effect resulting from the loss of certain executives could be compounded by our inability to prevent them from competing with us.
Although currently subject to lock-up agreements and other restrictions on trading, a portion of the equity of our management team will not contain other contractual transfer restrictions and may become tradable in April 2019 after the expiration of the lock-up agreements entered into with the underwriters in our IPO. This liquidity may represent material wealth to such individuals and impact retention and focus of existing key members of management.
Our products may have undesirable side effects which may require them to be taken off the market, require them to include safety warnings or otherwise limit their sales.
Unforeseen adverse events related to our products could arise either during clinical development or, if cleared, approved, or subject to CE Certificate of Conformity, after the product has been marketed. In clinical research, the most common adverse event related to our implant was leg pain resulting from misplacement. The most common adverse event for our implant procedure has been minor wound infections. Additional adverse effects from iFuse or any of our other products could arise either during clinical development or, if approved, cleared, or subject to CE Certificate of Conformity, after the product has been marketed.
If we or others later identify adverse events caused by our products:
|
•
|
sales of the product may decrease significantly and we may not achieve the anticipated market share;
|
|
•
|
regulatory authorities or our Notified Body may require changes to the labeling of our product. This may include the addition of labeling statements, specific warnings, and contraindications and issuing field alerts to physicians and patients;
|
43
|
•
|
we may be required to change instructions regarding the way the product is implanted or conduct additional clinical trials;
|
|
•
|
we may be subject to limitations on how we may promote the product;
|
|
•
|
regulatory authorities may require us to take our approved product off the market (temporarily or permanently) or to conduct other field safety corrective actions;
|
|
•
|
we may be required to modify our product;
|
|
•
|
we may be subject to litigation fines or product liability claims; and
|
|
•
|
our reputation may suffer.
|
Any of these events could prevent us from achieving or maintaining market acceptance of the affected product or could substantially increase commercialization costs and expenses, which in turn could delay or prevent us from generating significant revenue from the sale of our products.
Various factors outside our direct control may adversely affect manufacturing, sterilization, and distribution of our products.
The manufacture, sterilization, and distribution of our products is challenging. Changes that our suppliers may make outside the purview of our direct control can have an impact on our processes, quality of our products, and the successful delivery of products to our customers. Mistakes and mishandling are not uncommon and can affect supply and delivery. Some of these risks include:
|
•
|
failure to complete sterilization on time or in compliance with the required regulatory standards;
|
|
•
|
transportation and import and export risk;
|
|
•
|
delays in analytical results or failure of analytical techniques that we will depend on for quality control and release of products;
|
|
•
|
natural disasters, labor disputes, financial distress, raw material availability, issues with facilities and equipment, or other forms of disruption to business operations affecting our manufacturers or suppliers; and
|
|
•
|
latent defects that may become apparent after products have been released and that may result in a recall of such products.
|
If any of these risks were to materialize, our ability to provide our products to customers on a timely basis would be adversely impacted.
We are dependent on a limited number of third-party suppliers, some of them single-source and some of them in single locations, for most of our products and components, and the loss of any of these suppliers, or their inability to provide us with an adequate supply of materials in a timely and cost-effective manner, could materially adversely affect our business.
We rely on third-party suppliers to supply substantially all of our products. For us to be successful, our suppliers must be able to provide us with products and components in substantial quantities, in compliance with regulatory requirements, in accordance with agreed upon specifications, at acceptable prices, and on a timely basis. We do not have long-term supply contracts for some of our suppliers, and in some cases, even where we do have agreements in place, we purchase important parts of the iFuse Implant System from a single supplier. Therefore, we cannot assure investors that we will be able to obtain sufficient quantities of product in the future.
In addition, our anticipated growth could strain the ability of our suppliers to deliver an increasingly large supply of products, materials, and components. Suppliers often experience difficulties in scaling up production, including financial issues, or problems with production yields and quality control and assurance. For example, from time to time, we have experienced certain delays and may experience delays from our suppliers in the future.
We generally use a small number of suppliers for our instruments and rely on one supplier, Orchid Bio-Coat, a division of Orchid Orthopedic Solutions LLC, for our iFuse implants and one supplier, rms Company, for our second-generation iFuse-3D implants. Our dependence on such a limited number of suppliers exposes us to risks, including, among other things:
|
•
|
third-party contract manufacturers or suppliers may fail to comply with regulatory requirements or make errors in manufacturing that could negatively affect the safety or effectiveness of our products or cause delays in shipments of our products;
|
|
•
|
third-party contract manufacturers or suppliers may fail to maintain good manufacturing practices, leading to quality control problems or regulatory findings that could cause disruptions in their manufacturing processes and lead to delays in shipments of our products;
|
|
•
|
we or our third-party manufacturers and suppliers may not be able to respond to unanticipated changes in customer orders, and if orders do not match forecasts, we or our suppliers may have excess or inadequate inventory of materials and components;
|
44
|
•
|
we or our third-party manufacturers and suppliers may be subject to price fluctuations due to a lack of long-term supply arrangements for key components;
|
|
•
|
we or our third-party manufacturers and suppliers may lose access to critical services and components, resulting in an interruption in the manufacture, assembly and shipment of our systems;
|
|
•
|
we may experience delays in delivery by our third-party manufacturers and suppliers due to changes in demand from us or their other customers;
|
|
•
|
fluctuations in demand for products that our third-party manufacturers and suppliers manufacture for others may affect their ability or willingness to deliver components to us in a timely manner;
|
|
•
|
our third-party manufacturers and suppliers may wish to discontinue supplying components or services to us for risk management reasons;
|
|
•
|
we may not be able to find new or alternative components or reconfigure our system and manufacturing processes in a timely manner if the necessary components become unavailable; and
|
|
•
|
our third-party manufacturers and suppliers may encounter financial hardships unrelated to our demand, which could inhibit their ability to fulfill our orders and meet our requirements.
|
If any one or more of these risks materialize, it could significantly increase our costs and impact our ability to meet demand for our products. If we are unable to satisfy commercial demand for our system in a timely manner, our ability to generate revenue would be impaired, market acceptance of our products could be adversely affected, and customers may instead purchase or use our competitors’ products. Additionally, we could be forced to seek alternative sources of supply.
In addition, most of our supply and manufacturing agreements do not have minimum manufacturing or purchase obligations. As such, with many of our suppliers, we have no obligation to buy any given quantity of products, and the suppliers have no obligation to sell us or to manufacture for us any given quantity of components or products. As a result, our ability to purchase adequate quantities of components or our products may be limited and we may not be able to convince suppliers to make components and products available to us in some instances. Our suppliers may also encounter problems that limit their ability to supply components or manufacture products for us, including financial difficulties, damage to their manufacturing equipment or facilities, product discontinuations or adverse findings in quality audits. As a result, there is a risk that certain components could be discontinued and no longer available to us. We may be required to make significant “last time” purchases of component inventory that is being discontinued by the supplier to ensure supply continuity. If we fail to obtain sufficient quantities of high quality components to meet demand for our products in a timely manner or on terms acceptable to us, we would have to seek alternative sources of supply. Securing a replacement third-party manufacturer or supplier could be difficult. The introduction of new or alternative manufacturers or suppliers also may require design changes to our iFuse system that are subject to domestic and international regulatory clearances or approvals and the review of our Notified Body.
Because of the nature of our internal quality control requirements, regulatory requirements, and the custom and proprietary nature of the parts, we may not be able to quickly engage additional or replacement suppliers for many of our critical components. We may also be required to assess any potential new manufacturer’s compliance with all applicable regulations and guidelines, which could further impede our ability to manufacture our products in a timely manner. As a result, we could incur increased production costs, experience delays in deliveries of our products, suffer damage to our reputation, and experience an adverse effect on our business and financial results. Failure of any of our third-party suppliers to meet our product demand level would limit our ability to meet our sales commitments to our customers and could have a material adverse effect on our business.
We may also have difficulty obtaining similar components from other suppliers that are acceptable to the FDA our Notified Body the competent authorities in the countries of the EEA, or other foreign regulatory authorities, and the failure of our suppliers to comply with strictly enforced regulatory requirements could expose us to delays in obtaining clearances or approvals, regulatory action including warning letters, product recalls, termination of distribution, product seizures, civil, administrative, or criminal penalties and the suspension, variation, or withdrawal of our CE Certificates of Conformity. We could incur delays while we locate and engage qualified alternative suppliers, and we may be unable to engage alternative suppliers on favorable terms or at all. Any such disruption or increased expenses could harm our commercialization efforts and adversely affect our ability to generate sales.
In addition, each of our third-party suppliers operates at a facility in a single location and substantially all of our inventory of component supplies and finished goods is held at these locations. We, and our suppliers, take precautions to safeguard facilities, including acquiring insurance, employing back-up generators, adopting health and safety protocols, and utilizing off-site storage of computer data. However, vandalism, terrorism, or a natural or other disaster, such as an earthquake, fire, or flood, could damage or destroy equipment or our inventory of component supplies or finished products, cause substantial delays in our operations, result in the loss of key information, and cause us to incur additional expenses. Our insurance may not cover our losses in any particular case. In addition, regardless of the level of insurance coverage, damage to our or our suppliers’ facilities could harm our business, financial condition, and operating results.
45
As our sales grow, we may encounter problems or delays in the assembly of our products or fail to meet certain regulatory requirements which could result in an adverse effect on our business and financial results.
To become profitable, we must assemble our products in adequate quantities in compliance with regulatory requirements and at an acceptable cost. Increasing our capacity to assemble and test our products will require us to improve internal efficiencies. We may encounter a number of difficulties in increasing our assembly and testing capacity, including:
|
•
|
managing production yields;
|
|
•
|
maintaining quality control and assurance;
|
|
•
|
providing component and service availability;
|
|
•
|
maintaining adequate control policies and procedures;
|
|
•
|
hiring and retaining qualified personnel; and
|
|
•
|
complying with state, federal, and foreign regulations.
|
If we are unable to satisfy commercial demand for our iFuse solution due to our inability to assemble and test, our ability to generate revenue would be impaired, market acceptance of our products could be adversely affected and customers may instead purchase or use our competitors’ products.
If we do not enhance our product offerings through our research and development efforts, we may be unable to compete effectively.
In order to increase our market share in the sacroiliac joint fusion market, we must enhance and broaden our product offerings in response to changing customer demands and competitive pressures and technologies. We might not be able to successfully develop, obtain domestic and international regulatory clearances or approvals, or CE Certificates of Conformity for, or market new products, and our future products might not be accepted by the surgeons or the third-party payors who reimburse for many of the procedures performed with our products. The success of any new product offering or enhancement to an existing product will depend on numerous factors, including our ability to:
|
•
|
properly identify and anticipate surgeon and patient needs;
|
|
•
|
develop and introduce new products or product enhancements in a timely manner;
|
|
•
|
adequately protect our intellectual property and avoid infringing upon the intellectual property rights of third parties;
|
|
•
|
demonstrate the safety and effectiveness of new products; and
|
|
•
|
obtain the necessary domestic and international regulatory clearances or approvals and CE Certificates of Conformity for new products or product enhancements.
|
If we do not develop and obtain domestic and international regulatory clearances or approvals and CE Certificates of Conformity for new products or product enhancements in time to meet market demand, or if there is insufficient demand for these products or enhancements, our results of operations will suffer. Our research and development efforts may require a substantial investment of time and resources before we are adequately able to determine the commercial viability of a new product, technology, material, or other innovation. In addition, even if we are able to successfully develop enhancements or new generations of our products, these enhancements or new generations of products may not produce sales in excess of the costs of development and they may be quickly rendered obsolete by changing customer preferences or the introduction by our competitors of products embodying new technologies or features.
We are required to maintain adequate levels of inventory, the failure of which could consume our resources and reduce our cash flows.
As a result of the need to maintain adequate levels of inventory, we are subject to the risk of inventory obsolescence. Many of our products come in sets, which feature components in a variety of sizes so that the implant or device may be customized to the patient’s needs. In order to market our products effectively, we often maintain and provide surgeons and hospitals with back-up products and products of different sizes. For each surgery, fewer than all of the components of the set are used, and therefore certain portions of the set may become obsolete before they can be used. In the event that a substantial portion of our inventory becomes obsolete, it could have a material adverse effect on our earnings and cash flows due to the resulting costs associated with the inventory impairment charges and costs required to replace such inventory.
46
The size and future growth in the market for iFuse has not been established with precision and may be smaller than we estimate, possibly materially. In addition, our estimates of cost savings to the economy and healthcare system as a result of the iFuse procedure are based on our internal estimates and market research and could also be smaller than we estimate, possibly materially. If our estimates and projections overestimate the size of this market or cost savings, our sales growth may be adversely affected.
We are not aware of an independent third-party study that reliably reports the potential market size for iFuse or cost savings as a result of the iFuse procedure. Therefore, our estimates of the size and future growth in the market for our iFuse products, including cost savings to the economy overall, including patients and employers, and to the healthcare system and the number of people currently suffering from lower back pain who may benefit from and be amenable to our iFuse procedure, is based on a number of internal and third-party studies, surveys, reports, and estimates. While we believe these factors have historically provided and may continue to provide us with effective tools in estimating the total market for our iFuse products and procedures and health cost savings, these estimates may not be correct and the conditions supporting our estimates may change at any time, thereby reducing the predictive accuracy of these underlying factors. For example, the surveys we have conducted are based on a small number of respondents and are not statistically significant and may have other limitations. The actual incidence of lower back pain, and the actual demand for our products or competitive products, could differ materially from our projections if our assumptions and estimates are incorrect. As a result, our estimates of the size and future growth in the market for our iFuse products may prove to be incorrect. In addition, actual health cost savings to the healthcare system as a result of the iFuse procedure may materially differ from those we expect. If the actual number of people with lower back pain who would benefit from our iFuse products and the size and future growth in the market for iFuse products and related costs savings to the healthcare system is smaller than we have estimated, it may impair our projected sales growth and have an adverse impact on our business.
Our results of operations could suffer if we are unable to manage our planned international expansion effectively.
Expansion into international markets is an element of our business strategy and involves risk. The sale and shipment of our products across international borders, as well as the purchase of components and products from international sources, subject us to extensive U.S. and foreign governmental trade, import, and export and customs regulations and laws. Compliance with these regulations and laws is costly and exposes us to penalties for non-compliance. Other laws and regulations that can significantly affect us include various anti-bribery laws, including the U.S. Foreign Corrupt Practices Act, or FCPA, and the United Kingdom Bribery Act, or UKBA, anti-boycott laws, anti-money laundering laws, and regulations relating to economic sanctions imposed by the United States, including the Office of Foreign Asset Control of the U.S. Treasury. Any failure to comply with applicable legal and regulatory obligations in the United States or abroad could adversely affect us in a variety of ways that include, but are not limited to, significant criminal, civil and administrative penalties, including imprisonment of individuals, fines and penalties, denial of export privileges, seizure of shipments and restrictions on certain business activities. Also, the failure to comply with applicable legal and regulatory obligations could result in the disruption of our distribution and sales activities.
In addition, some of the countries in which we sell or plan to sell our products are, to some degree, subject to various risks, including:
|
•
|
exposure to different legal and regulatory standards;
|
|
•
|
lack of stringent protection of intellectual property;
|
|
•
|
obstacles to obtaining domestic and foreign export, import, and other governmental approvals, permits, and licenses and compliance with foreign laws;
|
|
•
|
potentially adverse tax consequences and the complexities of foreign value-added tax systems;
|
|
•
|
adverse changes in tariffs and trade restrictions;
|
|
•
|
limitations on the repatriation of earnings;
|
|
•
|
difficulties in staffing and managing foreign operations;
|
|
•
|
transportation delays and difficulties of managing international distribution channels;
|
|
•
|
longer collection periods and difficulties in collecting receivables from foreign entities;
|
|
•
|
increased financing costs;
|
|
•
|
currency risks; and
|
|
•
|
political, social, and economic instability and increased security concerns.
|
These risks may limit or disrupt our expansion, restrict the movement of funds or result in the deprivation of contractual rights or the taking of property by nationalization or expropriation without fair compensation.
47
Our goal of a successful international expansion depends, in part, on our ability to develop and implement policies and strategies that are effective in anticipating and managing these and other risks in the countries in which we plan to do business. Failure to manage these and other risks may have a material adverse effect on our operations in any particular country and on our business as a whole.
In the future our products may become obsolete, which would negatively affect operations and financial condition.
The medical device industry is characterized by rapid and significant change. There can be no assurance that other companies will not succeed in developing or marketing devices, and products that are more effective than our iFuse system or that would render the iFuse system obsolete or noncompetitive. Additionally, new surgical procedures, medications and other therapies could be developed that replace or reduce the importance of our product. Accordingly, our success will depend in part on our ability to respond quickly to medical and changes through the development and introduction of new products. Product development involves a high degree of risk and there can be no assurance that our new product development efforts will result in any commercially successful products.
If we experience significant disruptions in our information technology systems, our business, results of operations, and financial condition could be adversely affected.
The efficient operation of our business depends on our information technology systems. We rely on our information technology systems to effectively manage:
|
•
|
sales and marketing, accounting, and financial functions;
|
|
•
|
inventory management;
|
|
•
|
engineering and product development tasks; and
|
|
•
|
our research and development data.
|
Our information technology systems are vulnerable to damage or interruption from:
|
•
|
earthquakes, fires, floods, and other natural disasters;
|
|
•
|
terrorist attacks and attacks by computer viruses or hackers;
|
|
•
|
power losses; and
|
|
•
|
computer systems, or Internet, telecommunications, or data network failures.
|
The failure of our information technology systems to perform as we anticipate or our failure to effectively implement new systems could disrupt our entire operation and could result in decreased sales, increased overhead costs, excess inventory and product shortages, and legal liability issues, all of which could have a material adverse effect on our reputation, business, results of operations, and financial condition.
In addition, we accept payments for many of our sales through credit card transactions, which are handled through a third-party payment processor. As a result, we are subject to a number of risks related to credit card payments. As a result of these transactions, we pay interchange and other fees, which may increase over time and could require us to either increase the prices we charge for our products or experience an increase in our costs and expenses. In addition, as part of the payment processing process, we transmit our customers’ credit card information to our third-party payment processor. We may in the future become subject to lawsuits or other proceedings for purportedly fraudulent transactions arising out of the actual or alleged theft of our customers’ credit card information if the security of our third-party credit card payment processor is breached. We and our third-party credit card payment processor are also subject to payment card association operating rules, certification requirements and rules governing electronic funds transfers, which could change or be reinterpreted to make it difficult or impossible for us to comply. If we or our third-party credit card payment processor fail to comply with these rules or requirements, we may be subject to fines and higher transaction fees and lose our ability to accept credit card payments from our customers, and there may be an adverse impact on our business.
We may seek to grow our business through acquisitions of or investments in new or complementary businesses, products or technologies, and the failure to manage acquisitions or investments, or the failure to integrate them with our existing business, could have a material adverse effect on us.
From time to time, we expect to consider opportunities to acquire or make investments in other technologies, products, and businesses that may enhance our capabilities, complement our current products, or expand the breadth of our markets or customer base. Potential and completed acquisitions and strategic investments involve numerous risks, including:
|
•
|
problems assimilating the purchased technologies, products, or business operations;
|
|
•
|
issues maintaining uniform standards, procedures, controls, and policies;
|
48
|
•
|
unanticipated costs and liabilities associated with acquisitions;
|
|
•
|
diversion of management’s attention from our core business;
|
|
•
|
adverse effects on existing business relationships with suppliers and customers;
|
|
•
|
risks associated with entering new markets in which we have limited or no experience;
|
|
•
|
potential loss of key employees of acquired businesses; and
|
|
•
|
increased legal and accounting compliance costs.
|
We have no current commitments with respect to any acquisition or investment. We do not know if we will be able to identify acquisitions we deem suitable, whether we will be able to successfully complete any such acquisitions on favorable terms or at all, or whether we will be able to successfully integrate any acquired business, product, or technology into our business or retain any key personnel, suppliers, or distributors. Our ability to successfully grow through acquisitions depends upon our ability to identify, negotiate, complete, and integrate suitable target businesses and to obtain any necessary financing. These efforts could be expensive and time consuming, and may disrupt our ongoing business and prevent management from focusing on our operations. If we are unable to successfully integrate any acquired businesses, products, or technologies effectively, our business, results of operations, and financial condition will be materially adversely affected.
We may enter into collaborations, in-licensing arrangements, joint ventures, strategic alliances, or partnerships with third-parties that may not result in the development of commercially viable products or the generation of significant future revenue.
In the ordinary course of our business, we may enter into collaborations, in-licensing arrangements, joint ventures, strategic alliances, partnerships, or other arrangements to develop products and to pursue new markets. We have not entered into any collaboration arrangements to date. Proposing, negotiating, and implementing collaborations, in-licensing arrangements, joint ventures, strategic alliances, or partnerships may be a lengthy and complex process. Other companies, including those with substantially greater financial, marketing, sales, technology, or other business resources, may compete with us for these opportunities or arrangements. We may not identify, secure, or complete any such transactions or arrangements in a timely manner, on a cost-effective basis, on acceptable terms or at all. We have limited institutional knowledge and experience with respect to these business development activities, and we may also not realize the anticipated benefits of any such transaction or arrangement. In particular, these collaborations may not result in the development of products that achieve commercial success or result in significant revenue and could be terminated prior to developing any products.
Additionally, we may not be in a position to exercise sole decision-making authority regarding the transaction or arrangement, which could create the potential risk of creating impasses on decisions, and our future collaborators may have economic or business interests or goals that are, or that may become, inconsistent with our business interests or goals. It is possible that conflicts may arise with our collaborators, such as conflicts concerning the achievement of performance milestones, or the interpretation of significant terms under any agreement, such as those related to financial obligations or the ownership or control of intellectual property developed during the collaboration. If any conflicts arise with any future collaborators, they may act in their self- interest, which may be adverse to our best interest, and they may breach their obligations to us. In addition, we may have limited control over the amount and timing of resources that any future collaborators devote to our or their future products.
Disputes between us and our collaborators may result in litigation or arbitration which would increase our expenses and divert the attention of our management. Further, these transactions and arrangements will be contractual in nature and will generally be terminable under the terms of the applicable agreements and, in such event, we may not continue to have rights to the products relating to such transaction or arrangement or may need to purchase such rights at a premium. If we enter into in-bound intellectual property license agreements, we may not be able to fully protect the licensed intellectual property rights or maintain those licenses. Future licensors could retain the right to prosecute and defend the intellectual property rights licensed to us, in which case we would depend on the ability of our licensors to obtain, maintain and enforce intellectual property protection for the licensed intellectual property. These licensors may determine not to pursue litigation against other companies or may pursue such litigation less aggressively than we would. Further, entering into such license agreements could impose various diligence, commercialization, royalty, or other obligations on us. Future licensors may allege that we have breached our license agreement with them, and accordingly seek to terminate our license, which could adversely affect our competitive business position and harm our business prospects.
49
Risks Related to Our Legal and Regulatory Environment
We, our suppliers, and our third-party manufacturers are subject to extensive governmental regulation both in the United States and abroad, and failure to comply with applicable requirements could cause our business to suffer.
The medical device industry is regulated extensively by governmental authorities, principally the FDA and corresponding state and foreign regulatory agencies. The FDA and other U.S. and foreign governmental agencies regulate, among other things, with respect to medical devices:
|
•
|
design, development, and manufacturing;
|
|
•
|
testing, labeling, content, and language of instructions for use and storage;
|
|
•
|
clinical trials;
|
|
•
|
product safety;
|
|
•
|
marketing, sales, and distribution;
|
|
•
|
premarket clearance and approval;
|
|
•
|
conformity assessment procedures;
|
|
•
|
record keeping procedures;
|
|
•
|
advertising and promotion;
|
|
•
|
compliance with good manufacturing practices requirements;
|
|
•
|
recalls and field safety corrective actions;
|
|
•
|
post-market surveillance, including reporting of deaths or serious injuries and malfunctions that, if they were to recur, could lead to death or serious injury;
|
|
•
|
post-market approval studies; and
|
|
•
|
product import and export.
|
The regulations to which we are subject are complex and have tended to become more stringent over time. Regulatory changes could result in restrictions on our ability to carry on or expand our operations, difficulties achieving new product clearances, higher than anticipated costs or lower than anticipated sales.
Before we can market or sell a new regulated product or make a significant modification to an existing product in the United States, with very limited exception, we must obtain either clearance under Section 510(k) of the FDCA for Class II devices or approval of a premarket approval, or PMA, application from the FDA for a Class III device. In the 510(k) clearance process, the FDA must determine that a proposed device is “substantially equivalent” to a device legally on the market, known as a “predicate” device, with respect to intended use, technology, and safety and effectiveness, in order to clear the proposed device for marketing. Clinical data is sometimes required to support substantial equivalence. The PMA pathway requires an applicant to demonstrate the safety and effectiveness of the device based, in part, on extensive data, including, but not limited to, technical, preclinical, clinical trial, manufacturing, and labeling data. The PMA process is typically required for devices that are deemed to pose the greatest risk, such as life-sustaining, life-supporting, or implantable devices. Products that are approved through a PMA application generally need FDA approval before they can be modified. Similarly, some modifications made to products cleared through a 510(k) may require a new 510(k). Both the 510(k) and PMA processes can be expensive and lengthy and require the payment of significant fees, unless exempt. The FDA’s 510(k) clearance process usually takes from three to 12 months, but may last longer. The process of obtaining a PMA is much more costly and uncertain than the 510(k) clearance process and generally takes from one to three years, or even longer, from the time the application is submitted to the FDA until an approval is obtained. The process of obtaining domestic and international regulatory clearances or approvals to market a medical device can be costly and time consuming, and we may not be able to obtain these clearances or approvals on a timely basis, if at all.
In the United States, our currently commercialized products have either received premarket clearance under Section 510(k) of the FDCA or are exempt from premarket review. If the FDA requires us to go through a lengthier, more rigorous examination for future products or modifications to existing products than we had expected, our product introductions or modifications could be delayed or canceled, which could cause our sales to decline. In addition, the FDA may determine that future products will require the more costly, lengthy, and uncertain PMA process. Although we do not currently market any devices under PMA, the FDA may demand that we obtain a PMA prior to marketing certain of our future products. In addition, if the FDA disagrees with our determination that a product we currently market is subject to an exemption from premarket review, the FDA may require us to submit a 510(k) or PMA in order to continue marketing the product. Further, even with respect to those future products where a PMA is not required, we cannot assure investors that we will be able to obtain the 510(k) clearances with respect to those products.
50
The FDA can delay, limit or deny clearance or approval of a device for many reasons, including:
|
•
|
we may not be able to demonstrate to the FDA’s satisfaction that our products are safe and effective for their intended users;
|
|
•
|
the data from our pre-clinical studies and clinical trials may be insufficient to support clearance or approval, where required; and
|
|
•
|
the manufacturing process or facilities we use may not meet applicable requirements.
|
In addition, the FDA may change its clearance and approval policies, adopt additional regulations or revise existing regulations, or take other actions which may prevent or delay clearance or approval of our products under development or impact our ability to modify our currently approved or cleared products on a timely basis.
Any delay in, or failure to receive or maintain, clearance or approval for our products under development could prevent us from generating revenue from these products or achieving profitability.
In addition, even after we have obtained the proper regulatory clearance or approval to market a product, the FDA has the power to require us to conduct postmarketing studies. These studies can be very expensive and time consuming to conduct. Failure to comply with those studies in a timely manner could result in the revocation of the 510(k) clearance for a product that is subject to such a 522 Order and the recall or withdrawal of the product, which could prevent us from generating sales from that product in the United States.
In the EEA, our medical devices must comply with the Essential Requirements set forth in Annex I to the EU Medical Devices Directive (Council Directive 93/42/EEC), or Essential Requirements. Compliance with these requirements is a prerequisite to be able to affix the CE mark to our medical devices, without which they cannot be marketed or sold in the EEA. To demonstrate compliance with the Essential Requirements we must undergo a conformity assessment procedure, which varies according to the type of medical device and its classification. Except for low risk medical devices (Class I), where the manufacturer can issue an EC Declaration of Conformity based on a self-assessment of the conformity of its products with the Essential Requirements, a conformity assessment procedure requires the intervention of a third-party organization designated by the competent authorities of a EEA country to conduct conformity assessments, known as a Notified Body. The Notified Body would typically audit and examine the medical device’s Technical File, the quality system for the manufacture, design and conduct a final inspection of our medical devices before issuing a CE Certificate of Conformity demonstrating compliance with the Essential Requirements or the QSR of the Medical Devices Directive.
Additionally, as part of the conformity assessment process, medical device manufacturers must carry out a clinical evaluation of their medical devices to verify that they comply with the relevant Essential Requirements covering safety and performance. A clinical evaluation includes an assessment of whether a medical device’s performance is in accordance with its intended use and that the known and foreseeable risks linked to the use of the device under normal conditions are minimized and acceptable when weighed against the benefits of its intended purpose. The clinical evaluation conducted by the manufacturer must also address any clinical claims, the adequacy of the device labeling and information (particularly claims, contraindications, precautions/ warnings) and the suitability of related Instructions for Use. This assessment must be based on clinical data, which can be obtained from (i) clinical studies conducted on the devices being assessed; (ii) scientific literature from similar devices whose equivalence with the assessed device can be demonstrated; or (iii) both clinical studies and scientific literature. With respect to implantable devices, or devices classified as Class III in the EU, the manufacturer must conduct clinical studies to obtain the required clinical data, unless the relying on existing clinical data from similar devices can be justified. As part of the conformity assessment procedure, depending on the type of devices, the Notified Body will review the manufacturer’s clinical evaluation for the medical device. The conduct of clinical studies to obtain clinical data that might be required as part of the described clinical evaluation process can be expensive and time consuming.
The FDA and other regulatory authorities have broad enforcement powers. Regulatory enforcement or inquiries, or other increased scrutiny on us, could dissuade some surgeons from using our products and adversely affect our reputation and the perceived safety and effectiveness of our products.
Failure to comply with applicable regulations could jeopardize our ability to sell our products and result in enforcement actions such as:
|
•
|
warning letters;
|
|
•
|
fines;
|
|
•
|
injunctions;
|
|
•
|
civil penalties;
|
|
•
|
termination of distribution;
|
|
•
|
recalls or seizures of products;
|
51
|
•
|
delays in the introduction of products into the market;
|
|
•
|
total or partial suspension of production;
|
|
•
|
facility closures;
|
|
•
|
refusal of the FDA or our Notified Body or other regulator to grant future clearances or approvals or to issue CE Certificates of Conformity;
|
|
•
|
withdrawals or suspensions of current clearances or approvals and CE Certificates of Conformity, resulting in prohibitions on sales of our products; and
|
|
•
|
in the most serious cases, criminal penalties.
|
Adverse action by an applicable regulatory agency, our Notified Body or the FDA could result in inability to produce our products in a cost-effective and timely manner, or at all, decreased sales, higher prices, lower margins, additional unplanned costs or actions, damage to our reputation, and could have material adverse effect on our reputation, business, results of operations, and financial condition.
We and our sales representatives must comply with U.S. federal and state fraud and abuse laws, including those relating to physician kickbacks and false claims for reimbursement, as well as equivalent foreign laws.
Healthcare providers, distributors, physicians, and third-party payors play a primary role in the distribution, recommendation, ordering, and purchasing of any implant or other medical device for which we have or obtain marketing clearance or approval. Through our arrangements with customers and third-party payors, we are exposed to the risk that our employees, independent contractors, principal investigators, consultants, vendors, or third-party distributors may engage in fraudulent or other illegal activity. Misconduct by these parties could include, among other infractions or violations, intentional, reckless and/or negligent conduct or unauthorized activity that violates FDA regulations, manufacturing standards, federal and state healthcare fraud and abuse laws and regulations, laws that require the true, complete, and accurate reporting of financial information or data, other commercial or regulatory laws or requirements, and equivalent foreign rules. We have a compliance program, Code of Conduct, and associated policies and procedures, but it is not always possible to identify and deter misconduct by our employees and other third parties, and the precautions we take to detect and prevent this activity may not be effective in controlling unknown or unmanaged risks or losses or in protecting us from governmental investigations or other actions or lawsuits stemming from a failure to be in compliance with such laws or regulations, and government authorities may conclude that our business practices do not comply with applicable fraud and abuse or other healthcare laws and regulations or guidance despite our good faith efforts to comply.
There are numerous U.S. federal and state laws pertaining to healthcare fraud and abuse, including anti-kickback and false claims laws. Our relationships and our distributors’ relationships with surgeons, other healthcare professionals, and hospitals are subject to scrutiny under these laws.
Healthcare fraud and abuse laws and related regulations are complex, and even minor irregularities can potentially give rise to claims that a statute or prohibition has been violated. The laws that may affect our ability to operate include:
|
•
|
the federal Anti-Kickback Statute, which prohibits, among other things, knowingly and willfully soliciting, receiving, offering or paying remuneration, directly or indirectly, in cash or in kind, to induce or reward either the referral of an individual for, or the purchase, order or recommendation of, items or services for which payment may be made, in whole or in part, under federal healthcare programs, such as the Medicare and Medicaid programs;
|
|
•
|
the federal False Claims Act, which prohibits, among other things, individuals or entities from knowingly presenting, or causing to be presented, false or fraudulent claims for payment of government funds; knowingly making, using, or causing to be made or used, a false record or statement to get a false claim paid or to avoid, decrease, or conceal an obligation to pay money to the federal government. A claim including items or services resulting from a violation of the federal Anti-Kickback Statute constitutes a false or fraudulent claim for purposes of the False Claims Act. There are also criminal penalties for making or presenting a false or fictitious or fraudulent claim to the federal government;
|
|
•
|
the federal Health Insurance Portability and Accountability Act of 1996, which imposes criminal and civil liability for, among other actions, knowingly and willfully executing, or attempting to execute, a scheme to defraud any healthcare benefit program including private third-party payors, or knowingly and willfully falsifying, concealing, or covering up a material fact or making a materially false, fictitious, or fraudulent statement or representation, or making or using any false writing or document knowing the same to contain any materially false, fictitious, or fraudulent statement or entry in connection with the delivery of or payment for healthcare benefits, items, or services;
|
52
|
•
|
the federal Physician Payment Sunshine Act, which requires manufacturers of drugs, devices, biologics and medical supplies for which payment is available under Medicare, Medicaid, or the Children’s Health Insurance Program to report annually to the Centers for Medicare & Medicaid Services, or CMS, information related to payments or other “transfers of value” made to physicians and teaching hospitals, and requires applicable manufacturers to report annually to CMS ownership and investment interests held by physicians and their immediate family members and payments or other “transfers of value” to such physician owners; and
|
|
•
|
analogous state and foreign law equivalents of each of the above federal laws, such as anti-kickback and false claims laws, which may apply to items or services reimbursed by any third-party payor, including commercial insurers; state laws that require device companies to comply with the industry’s voluntary compliance guidelines and the applicable compliance guidance promulgated by the federal government or otherwise restrict payments that may be made to healthcare providers and other potential referral sources; state beneficiary inducement laws, and state laws that require device manufacturers to report information related to payments and other transfers of value to physicians and other healthcare providers or marketing expenditures, many of which differ from each other in significant ways and may not have the same effect, thus complicating compliance efforts.
|
If we or our employees are found to have violated any of the above laws we may be subjected to administrative, civil and criminal penalties, including imprisonment, exclusion from participation in federal healthcare programs, such as Medicare and Medicaid, and significant fines, monetary penalties and damages, and damage to our reputation.
We have entered into consulting agreements and royalty agreements with surgeons, including some who are customers. We also engage in co-marketing arrangements with certain surgeons who use our products. In addition, a small number of our current customer surgeons own less than 1.0% of our stock, which they either purchased in an arm’s length transaction on terms identical to those offered to others or received from us as fair market value consideration for consulting services performed. While all of these transactions were structured with the intention of complying with all applicable laws, including the federal Anti-Kickback Statute, state anti-kickback laws and other applicable laws, to the extent applicable, it is possible that regulatory agencies may view these transactions as prohibited arrangements that must be restructured, or discontinued, or for which we could be subject to significant penalties. We would be materially and adversely affected if regulatory agencies interpret our financial relationships with surgeons who order our products to be in violation of applicable laws and we were unable to comply with such laws, which could subject us to, among other things, monetary penalties for non-compliance, the cost of which could be substantial.
In certain cases, federal and state authorities pursue actions for false claims on the basis that manufacturers and distributors are promoting unapproved, or “off-label” uses of their products. Pursuant to FDA regulations, we can only market our products for cleared or approved uses. Although surgeons are permitted to use medical devices for indications other than those cleared or approved by the FDA, we are prohibited from promoting products for “off-label” uses. We market our products and provide promotional materials and training programs to surgeons regarding the use of our products. If it is determined that our marketing, promotional materials or training programs constitute promotion of unapproved uses, we could be subject to significant fines in addition to regulatory enforcement actions, including the issuance of a warning letter, injunction, seizure, criminal penalty, and damage to our reputation. Federal and state authorities also pursue actions for false claims based upon improper billing and coding advice or recommendations, as well as decisions related to the medical necessity of procedures, including the site-of-service where procedures are performed. Actions under the federal False Claims Act may also be brought by whistleblowers under its
qui tam
provisions.
To enforce compliance with the federal laws, the U.S. Department of Justice has increased its scrutiny of interactions between healthcare companies and healthcare providers, which has led to a number of investigations, prosecutions, convictions and settlements in the healthcare industry. Dealing with investigations can be time- and resource-consuming and can divert management’s attention from the business. Additionally, if a healthcare company settles an investigation with the Department of Justice or other law enforcement agencies, it may need to agree to additional onerous compliance and reporting requirements as part of a consent decree or corporate integrity agreement. Any such investigation or settlement could increase our costs or otherwise have an adverse effect on our business. Even if we are not determined to have violated these laws, government investigations into these issues typically require the expenditure of significant resources and generate negative publicity, which could harm our financial condition and divert resources and the attention of our management from operating our business.
The scope and enforcement of these laws is uncertain and subject to rapid change. The shifting compliance environment and the need to build and maintain robust and expandable systems to comply with different compliance and/or reporting requirements in multiple jurisdictions increase the possibility that we may run afoul of one or more of the requirements or that federal or state regulatory authorities might challenge our current or future activities under these laws. Additionally, we cannot predict the impact of any changes in these laws, whether or not retroactive.
53
Our failure to adequately protect personal information in compliance with evolving legal requirements could harm our business.
In the ordinary course of our business, we collect and store sensitive data, including legally protected personally identifiable information. We collect this kind of information during the course of clinical trials and for post-marketing safety vigilance, helping enable surgeons and their patients to pursue claims for reimbursement for procedures using iFuse and servicing potential warranty claims.
There are a number of state, federal, and international laws protecting the privacy and security of health information and personal data. These data protection and privacy-related laws and regulations are evolving and may result in ever-increasing regulatory and public scrutiny of companies’ data practices and escalating levels of enforcement and sanctions. As part of the American Recovery and Reinvestment Act 2009, or ARRA, Congress amended the privacy and security provisions of the Health Insurance Portability and Accountability Act, or HIPAA. HIPAA imposes certain requirements regarding the privacy, security, use, and disclosure of an individual’s protected health information, or PHI, by certain health care providers, health care clearinghouses, and health insurance plans, collectively referred to as “covered entities,” and their “business associates,” or subcontractors who provide services to covered entities that involve the creation, use, maintenance, or disclosure of PHI. ARRA included significant increases in the penalties for improper use or disclosure of an individual’s PHI under HIPAA and extended enforcement authority to state attorneys general. The amendments also created notification requirements applicable to covered entities and business associates in certain cases when PHI in their control has been inappropriately accessed or disclosed. In the case of a breach of unsecured PHI, covered entities may be required to provide notification to individuals affected by the breach, federal regulators, and, in some cases, local and national media. In addition to HIPAA, most states have laws requiring notification of affected individuals and state regulators in the event of a breach of “personal information,” which is a broader class of information than the PHI protected by HIPAA. Certain states also have data privacy requirements applicable to individually identifiable health information. Privacy laws in different states may contain different requirements, and such laws may not be pre-empted by HIPAA, which could complicate our efforts to comply.
In addition, even when HIPAA does not apply, according to the FTC, failing to take appropriate steps to keep consumers’ personal information secure constitutes unfair acts or practices in or affecting commerce in violation of Section 5(a) of the FTCA, 15 U.S.C § 45(a). The FTC expects a company’s data security measures to be reasonable and appropriate in light of the sensitivity and volume of consumer information it holds, the size and complexity of its business, and the cost of available tools to improve security and reduce vulnerabilities. Medical data is considered sensitive data that merits stronger safeguards. The FTC’s guidance for appropriately securing consumers’ personal information is similar to what is required by the HIPAA Security Rule.
Many foreign countries and governmental bodies, including the EU, Australia, and other relevant jurisdictions, have laws and regulations concerning the collection and use of personal or sensitive data obtained from their residents or by businesses operating within their jurisdiction. For example, the European Commission recently adopted the General Data Protection Regulation, or the GDPR, effective on May 25, 2018, that superseded current EU data protection legislation, imposed more stringent EU data protection requirements and provides for greater penalties for noncompliance. The GDPR applies to any company established in the EU as well as to those outside the EU if they collect and use “personal data,” or any information relating to an identified or identifiable natural person, in connection with the offering goods or services to individuals in the EU or the monitoring of their behavior. The GDPR enhances data protection obligations for processors and controllers of personal data, including, for example, expanded disclosures about how personal information is to be used, limitations on retention of information, mandatory data breach notification requirements, and substantial new obligations on services providers. Non-compliance with the GDPR can trigger steep fines of up to €20 million or 4% of total worldwide annual revenues, whichever is higher. Given the breadth and depth of changes in data protection obligations, achieving and maintaining GDPR compliance will require considerable time and resources.
We are at risk of enforcement actions taken by certain EU data protection authorities until such point in time that we may be able to ensure that all transfers of personal data to us from the European Economic Area are conducted in compliance with all applicable regulatory obligations, the guidance of data protection authorities and evolving best practices. We may find it necessary to establish systems to maintain personal data originating from the EU in the European Economic Area, which may involve substantial expense and may cause us to need to divert resources from other aspects of our business, all of which may adversely affect our business.
Our failure to comply with applicable laws and regulations, or to protect such data, could result in enforcement actions against us, including fines, imprisonment of company officials and public censure, claims for damages by end-customers, and other affected individuals, and the imposition of integrity obligations and agency oversight, damage to our reputation, and loss of goodwill, any of which could harm on our operations, financial performance, and business. Evolving and changing definitions of personal data and personal information, within the European Union, the United States, and elsewhere, may limit or inhibit our ability to operate or expand our business, including limiting strategic partnerships that may involve the sharing of data. Moreover, if the relevant laws and regulations change, or are interpreted and applied in a manner that is inconsistent with our data practices or the operation of our products, or if we expand into new regions and are required to comply with new requirements, we may need to expend resources in order to change our business operations, data practices, or the manner in which our products operate. Even the perception of privacy concerns, whether or not valid, may harm our reputation and inhibit adoption of our products.
54
We are subject to risks associated with our non-U.S. operations.
The FCPA prohibits companies and their intermediaries from making improper payments to foreign officials for the purpose of obtaining or retaining business. Other anti-corruption or anti-bribery laws, such as the UKBA, prohibit companies and their intermediaries from making improper payments for the purpose of obtaining or retaining business in foreign countries. The FCPA also imposes accounting standards and requirements on publicly traded U.S. corporations and their foreign affiliates, which are intended to prevent the diversion of corporate funds to the payment of bribes and other improper payments, and to prevent the establishment of slush funds from which such improper payments can be made. Because of the predominance of government-sponsored healthcare systems around the world, many of our customer relationships outside of the United States are with governmental entities and are therefore subject to such anti-bribery laws. Our internal control policies and procedures may not always protect us from reckless or criminal acts committed by our employees or agents. Violations of these laws, or allegations of such violations, could disrupt our operations, involve significant management distraction, and result in a material adverse effect on our business, results of operations, and financial condition. We also could suffer severe penalties, including criminal and civil penalties, disgorgement, and other remedial measures, including further changes or enhancements to our procedures, policies, and controls, as well as potential personnel changes and disciplinary actions.
Furthermore, we are subject to anti-boycott laws, anti-money laundering laws, and the export controls and economic embargo rules and regulations of the United States, including, but not limited to, the Export Administration Regulations and trade sanctions against embargoed countries, which are administered by the Office of Foreign Assets Control within the Department of the Treasury, as well as the laws and regulations administered by the Department of Commerce. These regulations limit our ability to market, sell, distribute, or otherwise transfer our products or technology to prohibited countries or persons. A determination that we have failed to comply, whether knowingly or inadvertently, may result in substantial penalties, including fines and enforcement actions and civil and/or criminal sanctions, the disgorgement of profits, and the imposition of a court-appointed monitor, as well as the denial of export privileges, and may have an adverse effect on our reputation.
Even if our products are approved by regulatory authorities or CE marked, if we, our contractors, or our suppliers fail to comply with ongoing FDA or other foreign regulatory requirements, or if we experience unanticipated problems with our products, these products could be subject to restrictions or withdrawal from the market.
Any product for which we obtain regulatory clearance or approval, or a CE Certificate of Conformity, and the manufacturing processes, reporting requirements, post-approval clinical data, and promotional activities for such product, will be subject to continued regulatory review, oversight and periodic inspections by the FDA, our Notified Body and other domestic and foreign regulatory bodies. In particular, we and our suppliers are required to comply with FDA’s Quality System Regulations, or QSR, and International Standards Organization, regulations for the manufacture of our products and other regulations which cover the methods and documentation of the design, testing, production, control, quality assurance, labeling, packaging, storage, and shipping of any product for which we obtain regulatory clearance or approval, or a CE Certificate of Conformity.
The failure by us or one of our suppliers to comply with applicable statutes and regulations, or the failure to timely and adequately respond to any adverse inspectional observations or product safety issues, could result in, among other things, any of the following enforcement actions:
|
•
|
untitled letters, warning letters, fines, injunctions, consent, and civil penalties;
|
|
•
|
unanticipated expenditures to address or defend such actions;
|
|
•
|
customer notifications for repair, replacement, refunds;
|
|
•
|
recall, detention, or seizure of our products;
|
|
•
|
operating restrictions or partial suspension or total shutdown of production;
|
|
•
|
refusing or delaying our requests for 510(k) clearance or premarket approval and conformity assessments of new products or modified products;
|
|
•
|
limitations on the intended uses for which the product may be marketed;
|
|
•
|
operating restrictions;
|
|
•
|
withdrawing 510(k) clearances or PMA approvals that have already been granted;
|
|
•
|
suspension or withdrawal of CE Certificates of Conformity;
|
|
•
|
refusal to grant export approval for our products; and
|
|
•
|
criminal prosecution.
|
55
In addition, we may be required to conduct costly post-market testing and surveillance to monitor the safety or effectiveness of our products, and we must comply with medical device reporting requirements, including the reporting of adverse events and malfunctions related to our products. Later discovery of previously unknown problems with our products, including unanticipated adverse events or adverse events of unanticipated severity or frequency, manufacturing problems, or failure to comply with regulatory requirements such as QSR, may result in changes to labeling, restrictions on such products or manufacturing processes, withdrawal of the products from the market, voluntary or mandatory recalls, a requirement to repair, replace, or refund the cost of any medical device we manufacture or distribute, fines, suspension, variation, or withdrawal of regulatory approvals or CE Certificates of Conformity, product seizures, injunctions, or the imposition of civil, administrative, or criminal penalties which would adversely affect our business, operating results, and prospects.
If the FDA determines that our promotional materials, labeling, training or other marketing or educational activities constitute promotion of an unapproved use, it could request that we cease or modify our training or promotional materials or subject us to regulatory enforcement actions. It is also possible that other federal, state or foreign enforcement authorities might take action if they consider our training or other promotional materials to constitute promotion of an unapproved use, which could result in significant fines or penalties under other statutory authorities, such as laws prohibiting false or fraudulent claims for payment of government funds.
If any of these actions were to occur it would harm our reputation and cause our product sales and profitability to suffer and may prevent us from generating revenue. Furthermore, our key component suppliers may not currently be or may not continue to be in compliance with all applicable regulatory requirements, which could result in our failure to produce our products on a timely basis and in the required quantities, if at all.
The FDA inspected our facilities in May 2014. As a result, we received a Notice of Inspectional Observations, or Form 483, with three observations that have since been addressed with a corrective and preventative action, or CAPA, plan. We responded to the Agency in writing and the matter was closed as of October 2014 through the issuance of an Establishment Inspection Report. To date, the FDA has not taken any further action with respect to the May 2014 inspection or its findings. The FDA inspected our facilities again in December 2016 and no findings were noted.
Our employees, independent contractors, consultants, manufacturers, and third-party distributors may engage in misconduct or other improper activities, relating to regulatory standards and requirements.
We are exposed to the risk that our employees, independent contractors, consultants, manufacturers, and third-party distributors may engage in fraudulent conduct or other illegal activity. Misconduct by these parties could include intentional, reckless and/or negligent conduct or disclosure of unauthorized activities to us that violates FDA regulations, including those laws requiring the reporting of true, complete and accurate information to the FDA, manufacturing standards, federal and state healthcare laws and regulations, and laws that require the true, complete and accurate reporting of financial information or data. These laws and regulations may restrict or prohibit a wide range of pricing, discounting, marketing and promotion, sales commission, customer incentive programs, and other business arrangements. Misconduct by these parties could also involve the improper use of individually identifiable information, including, without limitation, information obtained in the course of clinical trials, which could result in regulatory sanctions and serious harm to our reputation. We have a compliance program, code of conduct and associated policies and procedures, but it is not always possible to identify and deter misconduct, and the precautions we take to detect and prevent this activity may not be effective in controlling unknown or unmanaged risks or losses or in protecting us from governmental investigations or other actions or lawsuits stemming from a failure to be in compliance with such laws or regulations. If any such actions are instituted against us, and we are not successful in defending ourselves or asserting our rights, those actions could have a significant impact on our business, including the imposition of significant civil, criminal, and administrative penalties, including, without limitation, damages, fines, disgorgement of profits, imprisonment, exclusion from participation in government healthcare programs, such as Medicare and Medicaid, and the curtailment or restructuring of our operations.
56
We may be subject to enforcement action, including fines, penalties or injunctions, if we are determined to be engaging in the off-label promotion of our products.
Our promotional materials and training methods must comply with FDA and other applicable laws and regulations, including the prohibition of the promotion of off-label use. Physicians may use our products off-label, as the FDA does not restrict or regulate a physician’s choice of treatment within the practice of medicine. In the United States, the full indication for the iFuse Implant System is: “The iFuse Implant System is intended for sacroiliac joint fusion for conditions including sacroiliac joint dysfunction that is a direct result of sacroiliac joint disruption and degenerative sacroiliitis. This includes conditions whose symptoms began during pregnancy or in the peripartum period and have persisted postpartum for more than six months. Clinical studies have demonstrated that treatment with the iFuse Implant System improved pain, patient function, and quality of life.” Moreover, iFuse is one of the few devices regulated through the class II pathway that has claims for clinical improvements. iFuse-3D, which was FDA-cleared in 2017, has a very similar indication statement but does not have the statement regarding improvement in pain, function and quality of life. In the United States, our marketing strategies must adhere to the above statements. In all other countries, the indication statement for the iFuse Implant System (including iFuse-3D) more broadly indicates that the device is indicated for sacroiliac joint fusion. The above-described potential limitation in indication statements in the U.S. does not apply in other geographies.
We believe that the specific surgical procedures for which our products are marketed fall within the scope of the surgical applications that have been cleared by the FDA. However, if the FDA determines that our promotional materials or training constitutes promotion of an off-label use, it could request that we modify our training or promotional materials, require us to stop promoting our products for those specific procedures until we obtain FDA clearance or approval for them, or subject us to regulatory or enforcement actions, including the issuance of an untitled letter, a warning letter, injunction, seizure, civil fines, and criminal penalties. It is also possible that other federal, state or foreign enforcement authorities might take action if they consider our promotional or training materials to constitute promotion of an unapproved use, which could result in significant fines or penalties under other statutory authorities, such as laws prohibiting false or fraudulent claims for payment of government fund. In that event, our reputation could be damaged and adoption of the products would be impaired. Although our policy is to refrain from statements that could be considered off-label promotion of our products, the FDA or another regulatory agency could disagree and conclude that we have engaged in off-label promotion. In addition, the off-label use of our products may increase the risk of injury to patients, and, in turn, the risk of product liability claims. Product liability claims are expensive to defend and could divert our management’s attention, result in substantial damage awards against us and harm our reputation.
We are required to report certain malfunctions, deaths, and serious injuries associated with our products, which can result in voluntary corrective actions or agency enforcement actions.
Further, under the FDA’s medical device reporting, regulations, we are required to report to the FDA any information that our product may have caused or contributed to a death or serious injury or in which our product malfunctioned and, if the malfunction were to recur, would likely cause or contribute to death or serious injury. If we fail to report these events to the FDA within the required timeframes, or at all, FDA could take enforcement action against us. Any such adverse event involving our products or repeated product malfunctions may result in a voluntary or involuntary corrective actions, such as recalls or customer notifications, or agency action, such as inspection or enforcement action. Any corrective action, whether voluntary or involuntary, as well as defending ourselves in a lawsuit could divert managerial and financial resources, impair our ability to manufacture our products in a cost-effective and timely manner, and have an adverse effect on our reputation, results of operations, and financial condition.
In the EEA, we must comply with the EU Medical Device Vigilance System. Under this system, incidents must be reported to the relevant authorities of the Member States of the EEA, and manufacturers are required to take Field Safety Corrective Actions, or FSCAs, to reduce a risk of death or serious deterioration in the state of health associated with the use of a medical device that is already placed on the market. An incident is defined as any malfunction or deterioration in the characteristics and/or performance of a device, as well as any inadequacy in the labeling or the instructions for use which, directly or indirectly, might lead to or might have led to the death of a patient or user or of other persons or to a serious deterioration in their state of health. An FSCA may include the recall, modification, exchange, destruction or retrofitting of the device FSCAs must be communicated by the manufacturer or its legal representative to its customers and/or to the end users of the device through Field Safety Notices.
Any adverse event involving our products, whether in the United States or abroad could result in future voluntary corrective actions, such as recalls, including corrections, or customer notifications, or agency action, such as inspection or enforcement actions. If malfunctions do occur, we may be unable to correct the malfunctions adequately or prevent further malfunctions, in which case we may need to cease manufacture and distribution of the affected products, initiate voluntary recalls, and redesign the products. Regulatory authorities may also take actions against us, such as ordering recalls, imposing fines, or seizing the affected products. Any corrective action, whether voluntary or involuntary, will require the dedication of our time and capital, distract management from operating our business, and may harm our reputation and financial results.
57
A recall of our products, either voluntarily or at the direction of the FDA or another governmental authority, including foreign governmental authorities, or the discovery of serious safety issues or malfunctions with our products, can result in voluntary corrective actions or agency enforcement actions, which could have a significant adverse impact on us.
The FDA and similar foreign governmental authorities have the authority to require the recall of commercialized products in the event of material deficiencies or defects in design or manufacture or in the event that a product poses an unacceptable risk to health. Manufacturers may, under their own initiative, recall a product if any material deficiency in a device is found.
In the case of the FDA, the authority to require a recall must be based on an FDA finding that there is an unreasonable risk of substantial public harm. In addition, foreign governmental bodies have the authority to require the recall of our products in the event of material deficiencies or defects in design or manufacture. A government-mandated or voluntary recall by us or one of our third-party distributors could occur as a result of an unacceptable risk to health, component failures, manufacturing errors, design or labeling defects, or other deficiencies and issues. Recalls of any of our products would divert managerial and financial resources and have an adverse effect on our reputation, results of operations, and financial condition, which could impair our ability to produce our products in a cost-effective and timely manner in order to meet our customers’ demands. We may also be required to bear other costs or take other actions that may have a negative impact on our future sales and our ability to generate profits.
The FDA requires that certain classifications of recalls be reported to FDA within 10 working days after the recall is initiated. Companies are required to maintain certain records of recalls, even if they are not reportable to the FDA. We may initiate voluntary recalls involving our products in the future that we determine do not require notification of the FDA. If the FDA disagrees with our determinations, they could require us to report those actions as recalls. A future recall announcement could harm our reputation with customers and negatively affect our sales. In addition, the FDA could take enforcement action for failing to report the recalls when they were conducted.
Modifications to our products may require new 510(k) clearances or premarket approvals and new conformity assessment by our Notified Body, or may require us to cease marketing or recall the modified products until clearances, approvals, or CE Certificates of Conformity are obtained.
Any modification to a 510(k)-cleared device that could significantly affect its safety or effectiveness, or that would constitute a major change in its intended use, design, or manufacture, requires a new 510(k) clearance or, possibly, a PMA. The FDA requires every manufacturer make and document this determination in the first instance. A manufacturer may determine that a modification could not significantly affect safety or effectiveness and does not represent a major change in its intended use, so that no new 510(k) clearance is necessary. FDA may review any manufacturer’s decision and may not agree with our decisions regarding whether new clearances or approvals are necessary. The FDA may also on its own initiative determine that a new clearance or approval is required. We have made modifications to our products in the past and may make additional modifications in the future that we believe do not or will not require additional clearances or approvals. If the FDA disagrees and requires new clearances or approvals for the modifications, we may be required to recall and to stop marketing our products as modified until clearance or approvals can be obtained, which could require us to redesign our products and harm our operating results. In these circumstances, we may be subject to significant enforcement actions.
We have modified some of our 510(k) cleared products, and have determined based on our review of the applicable FDA guidance that in certain instances new 510(k) clearances or PMAs are not required. If the FDA disagrees with our determination and requires us to submit new 510(k) clearances or PMAs for modifications to our previously cleared products for which we have concluded that new clearances or approvals are unnecessary, we may be required to cease marketing or to recall the modified product until we obtain clearance or approval, and we may be subject to significant enforcement action, regulatory fines, or penalties.
If a manufacturer determines that a modification to an FDA-cleared device could significantly affect its safety or effectiveness, or would constitute a major change in its intended use, then the manufacturer must file for a new 510(k) clearance or possibly a premarket approval application. Where we determine that modifications to our products require a new 510(k) clearance or premarket approval application, we may not be able to obtain those additional clearances or approvals for the modifications or additional indications in a timely manner, or at all. FDA’s ongoing review of the 510(k) program may make it more difficult for us to make modifications to our previously cleared products, either by imposing more strict requirements on when a new 510(k) for a modification to a previously cleared product must be submitted, or applying more onerous review criteria to such submissions.
In the EEA, we must inform the Notified Body that carried out the conformity assessment of the medical devices we market or sell in the EEA of any planned substantial changes to our quality system or changes to our devices which could affect compliance with the essential requirements or the devices’ intended use. The Notified Body will then assess the changes and verify whether they affect the products’ conformity. There can be no assurances that the assessment will be favorable and that the Notified Body will attest our compliance with the essential requirements, which will prevent us from selling our products in the EEA.
58
Obtaining regulatory clearances or approvals and CE Certificates of Conformity can be a time-consuming process, and delays in obtaining required future regulatory clearances or approvals, and CE Certificates of Conformity would adversely affect our ability to introduce new or enhanced products in a timely manner, which in turn would harm our future growth.
There is no guarantee that the FDA will grant 510(k) clearance or premarket approval of our future products or that our Notified Body will issue the required CE Certificate of Conformity, and failure to obtain necessary clearances or approvals for our future products would adversely affect our ability to grow our business.
We are in the process of developing our regulatory strategies for obtaining clearance or approval for future products. Some of them may require 510(k) clearance by the FDA or a new CE Certificate of Conformity. Other future products may require premarket approval. In addition, some of our new products may require clinical trials to support regulatory approval and we may not successfully complete these clinical trials. The FDA may not approve or clear these products or our Notified Body may not issue CE Certificate of Conformity for the indications that are necessary or desirable for successful commercialization. Indeed, the FDA may refuse our requests for 510(k) clearance or premarket approval of new products, new intended uses, or modifications to existing products. Failure to receive clearance or approval for our new products would have an adverse effect on our ability to expand our business.
We may fail to obtain or maintain foreign regulatory approvals to market our products in other countries.
We currently market our products internationally and intend to expand our international marketing. International jurisdictions require separate regulatory approvals and compliance with numerous and varying regulatory requirements. For example, we intend to continue to seek domestic and international regulatory clearance to market our primary products Asia, Latin America, and the Middle East and other key markets. The approval procedures vary among countries and may involve requirements for substantial additional testing, and the time required to obtain approval may differ from country to country and from that required to obtain FDA clearance or approval or to obtain CE Certificates of Conformity.
Clearance or approval by the FDA or obtaining a CE Certificate of Conformity does not ensure approval or certification by regulatory authorities in other countries or jurisdictions, and approval or certification by one foreign regulatory authority does not ensure approval or certification by regulatory authorities in other foreign countries or by the FDA, and the CE marking of our products in the EEA. The foreign regulatory approval or certification process may include all of the risks associated with obtaining FDA clearance or approval, or a CE Certificate of Conformity for a medical device in the EEA in addition to other risks. In addition, the time required to obtain foreign approval may differ from that required to obtain FDA clearance or approval, or a CE Certificate of Conformity in the EEA and we may not obtain foreign regulatory approvals on a timely basis, if at all. We may not be able to file for regulatory approvals or certifications and may not receive necessary approvals to commercialize our products in any market. If we fail to receive necessary approvals or certifications to commercialize our products in foreign jurisdictions on a timely basis, or at all, our business, results of operations, and financial condition could be adversely affected.
Clinical trials necessary to support a 510(k) or PMA application or a conformity assessment procedure will be expensive and may require the enrollment of large numbers of patients, and suitable patients may be difficult to identify and recruit. Delays or failures in our clinical trials will prevent us from commercializing any modified or new products and will adversely affect our business, operating results and prospects.
Initiating and completing clinical trials necessary to support a PMA application for our future products and additional safety and effectiveness data beyond that typically required for a 510(k) clearance for iFuse, as well as other possible future product candidates, and to support a conformity assessment procedure would be time consuming and expensive and the outcome uncertain. Moreover, the results of early clinical trials are not necessarily predictive of future results, and any product we advance into clinical trials may not have favorable results in later clinical trials.
Conducting successful clinical studies may require the enrollment of large numbers of patients, and suitable patients may be difficult to identify and recruit. Patient enrollment in clinical trials and completion of patient participation and follow-up depends on many factors, including the size of the patient population, the nature of the trial protocol, the attractiveness of, or the discomforts and risks associated with, the treatments received by enrolled subjects, the availability of appropriate clinical trial investigators, support staff, and proximity of patients to clinical sites and able to comply with the inclusion and exclusion criteria for participation in the clinical trial and patient compliance. Development of sufficient and appropriate clinical protocols to demonstrate safety and effectiveness are required and we may not adequately develop such protocols to support clearance and approval. Further, the FDA or our Notified Body may require us to submit data on a greater number of patients than we originally anticipated and/or for a longer follow-up period or change the data collection requirements or data analysis applicable to our clinical trials. Delays in patient enrollment or failure of patients to continue to participate in a clinical trial may cause an increase in costs and delays in the approval and attempted commercialization of our products or result in the failure of the clinical trial. In addition, despite considerable time and expense invested in our clinical trials, the FDA or our Notified Body may not consider our data adequate to demonstrate safety and effectiveness. Such increased costs and delays or failures could adversely affect our business, operating results and prospects.
59
Our facility and our clinical investigational sites operate under procedures that govern the conduct and management of FDA-regulated clinical studies under 21 CFR Parts 50 and 812, and Good Clinical Practices. The FDA may conduct Bioresearch Monitoring inspections of us and/or our clinical sites to assess compliance with 21 CFR Parts 50 and 812, our procedures, and the clinical protocol. If the FDA were to find that we or our clinical investigators are not operating in compliance with applicable regulations, we could be subject to the above FDA enforcement action, as well as refusal to accept all or part of our data in support of our 510(k) or PMA, or we may need to conduct additional studies.
The results of our clinical trials may not support our product candidate claims or may result in the discovery of adverse side effects.
Even if our clinical trials are completed as planned, we cannot be certain that their results will support our product candidate claims or that the FDA, foreign authorities, or our Notified Body will agree with our conclusions regarding them. Success in pre-clinical studies and early clinical trials does not ensure that later clinical trials will be successful, and we cannot be sure that the later trials will replicate the results of prior trials and pre-clinical studies. The clinical trial process may fail to demonstrate that our product candidates are safe and effective for the proposed indicated uses, which could cause us to abandon a product candidate and may delay development of others. Any delay or termination of our clinical trials will delay the filing of our product submissions and, ultimately, our ability to commercialize our product candidates and generate revenue. It is also possible that patients enrolled in clinical trials will experience adverse side effects that are not currently part of the product candidate’s profile.
U.S. legislative or FDA or foreign regulatory reforms may make it more difficult and costly for us to obtain regulatory clearances or approvals, or CE Certificates of Conformity for our product candidates and to manufacture, market, and distribute our products after approval is obtained.
From time to time, Congress introduces legislation that could significantly change the statutory provisions governing the regulatory approval, manufacture, and marketing of regulated products or the reimbursement thereof. In addition, FDA regulations and guidance are often revised or reinterpreted by the FDA in ways that may significantly affect our business and our products. Any new regulations or revisions or reinterpretations of existing regulations may impose additional costs or lengthen review times of future products. In addition, FDA regulations and guidance are often revised or reinterpreted by the agency in ways that may significantly affect our business and our products. It is impossible to predict whether legislative changes will be enacted or FDA regulations, guidance, or interpretations changed, and what the impact of such changes, if any, may be.
In December 2016, the 21st Century Cures Act was enacted, with a number of provisions impacting medical device regulation. The FDA has implemented, and continues to implement, these reforms, which could impose additional regulatory requirements upon us and delay our ability to obtain new 510(k) clearances, increase the costs of compliance or restrict our ability to maintain our current clearances. Any change in the laws or regulations that govern the clearance and approval processes relating to our current and future products could make it more difficult and costly to obtain clearance or approval for new products, or to produce, market, and distribute existing products. Significant delays in receiving clearance or approval, or the failure to receive clearance or approval for our new products would have an adverse effect on our ability to expand our business.
Moreover, the policies of the Trump Administration and their impact on the regulation of our products in the United States remain uncertain. The outcome of the 2016 election and the forthcoming 2018 mid-term elections could result in significant legislative and regulatory reforms impacting the FDA’s regulation of our products. Any change in the laws or regulations that govern the clearance and approval processes relating to our current and future products could make it more difficult and costly to obtain clearance or approval for new products, or to produce, market and distribute existing products. Significant delays in receiving clearance or approval, or the failure to receive clearance or approval for our new products would have an adverse effect on our ability to expand our business.
Another example can be found in the EEA. On September 26, 2012, the European Commission adopted a package of legislative proposals designed to replace the existing regulatory framework for medical devices in the EEA. These proposals are intended to strengthen the medical devices rules in the EEA. On April 5, 2017, the final text of the Medical Devices Regulation (MDR) and In Vitro Diagnostic Medical Devices Regulation (IVDR) were adopted by the Parliament and the Council. These regulations, which will substantially impact medical devices manufacturers, will be applicable from May 2020 for the MDR and May 2022 for the IVDR. Examples of the changes which will be introduced by these regulations include the following:
|
•
|
additional scrutiny during the conformity assessment procedure for high risk medical devices;
|
|
•
|
strengthening of the clinical data requirements related to medical devices;
|
|
•
|
strengthening of the designation and monitoring processes governing notified bodies;
|
|
•
|
the obligation for manufacturers and authorized representative to have a person responsible for regulatory compliance continuously at their disposal;
|
|
•
|
authorized representatives would be held legally responsible and liable for defective products placed on the EU market;
|
60
|
•
|
increased traceability of medical devices following the introduction of a Unique Device Identification, or UDI, system;
|
|
•
|
new rules governing the reprocessing of medical devices; and
|
|
•
|
increased transparency with the establishment of EUDAMED III as information from several databases concerning economic operators, CE Certificates of Conformity, conformity assessment, clinical investigations, the UDI system, adverse event reporting and market surveillance would be available to the public.
|
The sales of our products depend in part on the availability of coverage and reimbursement from third-party payors such as government health administration authorities, private health insurers, health maintenance organizations, and other healthcare-related organizations. Recent political, economic, and regulatory influences are subjecting the healthcare industry to fundamental changes that can impact coverage and reimbursement from third-party payors. For example, Patient Protection and Affordable Care Act, as amended by the Health Care and Education Reconciliation Act of 2011, among other things, reduced and/or limited Medicare reimbursement to certain providers. Legislative changes to the Patient Protection and Affordable Care Act remain possible in the 115th United States Congress and under the Trump Administration. We expect that the Patient Protection and Affordable Care Act, as currently enacted or as it may be amended in the future, and other healthcare reform measures that may be adopted in the future, could have a material adverse effect on our industry generally and on our ability to maintain or increase sales of our existing products. Other federal laws further reduce Medicare’s payments to providers by two percent through 2024. These reductions reduce reimbursement for our products, which could potentially negatively impact our revenue, and may reduce providers’ revenues or profits, which could affect their ability to purchase new technologies. Both the federal and state governments in the United States and foreign governments continue to propose and pass new legislation and regulations designed to contain or reduce the cost of healthcare. Such legislation and regulations may result in decreased reimbursement for medical devices, which may further exacerbate industry-wide pressure to reduce the prices charged for medical devices. This could harm our ability to market our products and generate sales.
Our financial performance may be adversely affected by medical device tax provisions in the healthcare reform laws.
The Patient Protection and Affordable Care Act, as amended by the Health Care and Education Reconciliation Act of 2011, imposes, among other things, an annual excise tax on any entity that manufactures or imports medical devices offered for sale in the United States. Under these provisions, the Congressional Research Service predicts that the total cost to the medical device industry may be up to $20.0 billion over the next decade. A two-year moratorium currently applies to this tax through December 2019. After that time, the tax may be repealed or modified, or the moratorium may be lifted, in which case sales of our iFuse would be subject to this excise tax.
We may incur product liability losses, and insurance coverage may be inadequate or unavailable to cover these losses.
Our business exposes us to potential product liability claims that are inherent in the testing, design, manufacture, and sale of medical devices for sacroiliac joint surgery procedures. Sacroiliac joint surgery involves significant risk of serious complications, including bleeding, nerve injury, paralysis, and even death. In addition, if longer-term patient results and experience indicates that our products or any component of a product cause tissue damage, motor impairment, or other adverse effects, we could be subject to significant liability. Surgeons may misuse or ineffectively use our products, which may result in unsatisfactory patient outcomes or patient injury. We could become the subject of product liability lawsuits alleging that component failures, manufacturing flaws, design defects, or inadequate disclosure of product-related risks or product-related information resulted in an unsafe condition or injury to patients. Product liability lawsuits and claims, safety alerts, or product recalls, regardless of their ultimate outcome, could have a material adverse effect on our business and reputation, our ability to attract and retain customers and our results of operations or financial condition.
Although we maintain third-party product liability insurance coverage, it is possible that claims against us may exceed the coverage limits of our insurance policies or cause us to record a self-insured loss. Even if any product liability loss is covered by an insurance policy, these policies typically have substantial retentions or deductibles that we are responsible for. Product liability claims in excess of applicable insurance coverage could have a material adverse effect on our business, results of operations, and financial condition.
In addition, any product liability claim brought against us, with or without merit, could result in an increase of our product liability insurance rates. Insurance coverage varies in cost and can be difficult to obtain, and we cannot guarantee that we will be able to obtain insurance coverage in the future on terms acceptable to us or at all.
61
We are subject to environmental laws and regulations that can impose significant costs and expose us to potential financial liabilities.
The manufacture of certain of our products, including our implants and products, and the handling of materials used in the product testing process, including in our cadaveric laboratory, involve the use of biological, hazardous and/or radioactive materials and wastes. Our business and facilities and those of our suppliers are subject to foreign, federal, state, and local laws and regulations relating to the protection of human health and the environment, including those governing the use, manufacture, storage, handling, and disposal of, and exposure to, such materials and wastes. In addition, under some environmental laws and regulations, we could be held responsible for costs relating to any contamination at our past or present facilities and at third-party waste disposal sites even if such contamination was not caused by us. A failure to comply with current or future environmental laws and regulations could result in severe fines or penalties. Any such expenses or liability could have a significant negative impact on our business, results of operations, and financial condition.
The comprehensive tax reform bill adopted in 2017 could adversely affect our business and financial condition.
On December 22, 2017, President Trump signed into law new legislation that significantly revised the Internal Revenue Code of 1986, as amended, or the Code. The newly enacted federal income tax law, among other things, contains significant changes to corporate taxation, including reduction of the corporate tax rate from a top marginal rate of 35% to a flat rate of 21%, limitation of the tax deduction for interest expense to 30% of adjusted earnings (except for certain small businesses), limitation of the deduction for net operating losses arising after 2017 to 80% of current year taxable income and elimination of carrybacks of such net operating losses, one time taxation of offshore earnings at reduced rates regardless of whether they are repatriated, elimination of U.S. tax on foreign earnings (subject to certain important exceptions), immediate deductions for certain new investments instead of deductions for depreciation expense over time, and modification or repeal of many business deductions and credits. Notwithstanding the reduction in the corporate income tax rate, the overall impact of the new federal tax law is uncertain and our business and financial condition could be adversely affected. In addition, it is uncertain if and to what extent various states will conform to the newly enacted federal tax law. The impact of this tax reform on holders of our common stock is also uncertain and could be adverse. We urge our stockholders to consult with their legal and tax advisors with respect to this legislation and the potential tax consequences of investing in or holding our common stock.
Risks Related to Our Intellectual Property
We rely primarily on patent, copyright, trademark and trade secret laws, as well as confidentiality and non- disclosure agreements and other methods, to protect our proprietary technologies and know-how. As of
December 31, 2018
, we owned 35 issued U.S. patents and had 14 pending U.S. patent applications, and we owned nine issued foreign patents and had five pending foreign patent applications. As of
December 31, 2018
, we have 12 registered trademarks in the United States and have filed for two more. We have sought protection for at least two of these trademarks in 60 countries including the 28 European member countries of the Madrid Protocol.
We have applied for patent protection relating to certain existing and proposed products and processes. While we generally apply for patents in those countries where we intend to make, have made, use, or sell patented products, we may not accurately predict all of the countries where patent protection will ultimately be desirable. If we fail to timely file a patent application in any such country, we may be precluded from doing so at a later date. Furthermore, we cannot assure investors that any of our patent applications will be approved. The rights granted to us under our patents, including prospective rights sought in our pending patent applications, may not be meaningful or provide us with any commercial advantage. In addition, those rights could be opposed, contested, or circumvented by our competitors or be declared invalid or unenforceable in judicial or administrative proceedings. The failure of our patents to adequately protect our technology might make it easier for our competitors to offer the same or similar products or technologies. Competitors may be able to design around our patents or develop products that provide outcomes that are comparable to ours without infringing on our intellectual property rights. Due to differences between foreign and U.S. patent laws, our patented intellectual property rights may not receive the same degree of protection in foreign countries as they would in the United States. Even if patents are granted outside the United States, effective enforcement in those countries may not be available. Since most of our issued patents are for the United States only, we lack a corresponding scope of patent protection in other countries. In countries where we do not have significant patent protection, we may not be able to stop a competitor from marketing products in such countries that are the same as or similar to our products.
We rely on our trademarks, trade names and brand names to distinguish our products from the products of our competitors and have registered or applied to register many of these trademarks. We cannot assure investors that our trademark applications will be approved. Third parties may also oppose our trademark applications, or otherwise challenge our use of the trademarks. In the event that our trademarks are successfully challenged, we could be forced to rebrand our products, which could result in loss of brand recognition, and could require us to devote resources to advertising and marketing new brands. Further, we cannot assure investors that competitors will not infringe upon our trademarks, or that we will have adequate resources to enforce our trademarks.
62
We also rely on trade secrets, know-how, and technology, which are not protected by patents, to maintain our competitive position. We try to protect this information by entering into confidentiality and intellectual property assignment agreements with parties that develop intellectual property for us and/or have access to it, such as our officers, employees, consultants, and advisors. However, in the event of unauthorized use or disclosure or other breaches of such agreements, we may not be provided with meaningful protection for our trade secrets or other proprietary information. In addition, our trade secrets may otherwise become known or be independently discovered by competitors. To the extent that our commercial partners, collaborators, employees, and consultants use intellectual property owned by others in their work for us, disputes may arise as to the rights in related or resulting know- how and inventions. If any of our trade secrets, know-how or other technologies not protected by a patent were to be disclosed to or independently developed by a competitor, our business, financial condition, and results of operations could be materially adversely affected.
In the future, we may enter into licensing agreements to maintain our competitive position. If we enter into in-bound intellectual property license agreements, we may not be able to fully protect the licensed intellectual property rights or maintain those licenses. Future licensors could retain the right to prosecute and defend the intellectual property rights licensed to us, in which case we would depend on the ability of our licensors to obtain, maintain and enforce intellectual property protection for the licensed intellectual property. These licensors may determine not to pursue litigation against other companies or may pursue such litigation less aggressively than we would. Further, entering into such license agreements could impose various diligence, commercialization, royalty, or other obligations on us. Future licensors may allege that we have breached our license agreement with them, and accordingly seek damages or to terminate our license, which could adversely affect our competitive business position and harm our business prospects.
If a competitor infringes upon one of our patents, trademarks, or other intellectual property rights, enforcing those patents, trademarks, and other rights may be difficult and time consuming. Even if successful, litigation to defend our patents and trademarks against challenges or to enforce our intellectual property rights could be expensive and time consuming and could divert management’s attention from managing our business. Moreover, we may not have sufficient resources to defend our patents or trademarks against challenges or to enforce our intellectual property rights. In addition, if third parties infringe any intellectual property that is not material to the products that we make, have made, use, or sell, it may be impractical for us to enforce this intellectual property against those third parties.
We may be subject to damages resulting from claims that we, our employees, or our third-party distributors have wrongfully used or disclosed alleged trade secrets of our competitors or are in breach of non-competition or non-solicitation agreements with our competitors.
Many of our employees were previously employed at other medical device companies, including our competitors or potential competitors, in some cases until recently. Some of our third-party distributors sell, or in the past have sold, products of our competitors. We may be subject to claims that we, our employees, or our third-party distributors have inadvertently or otherwise used or disclosed trade secrets or other proprietary information of these former employers or competitors. In addition, we have been and may in the future be subject to claims that we caused an employee to breach the terms of his or her non-competition or non-solicitation agreement. Even if we are successful in defending against these claims, litigation could result in substantial costs, divert the attention of management from our core business and harm our reputation. If our defense to those claims fails, in addition to paying monetary damages, we may lose valuable intellectual property rights or personnel. There can be no assurance that this type of litigation will not continue, and any future litigation or the threat thereof may adversely affect our ability to hire additional direct sales representatives. A loss of key personnel or their work product could hamper or prevent our ability to commercialize product candidates, which could have an adverse effect on our business, results of operations, and financial condition.
63
The medical device industry is characterized by patent litigation and we could become subject to litigation that could be costly, result in the diversion of management’s time and efforts, require us to pay damages, and/or prevent us from developing or marketing our existing or future products.
Our commercial success will depend in part on not infringing the patents or violating the other proprietary rights of third parties. Significant litigation regarding patent rights exists in our industry. Our competitors in both the United States and abroad, many of which have substantially greater resources and have made substantial investments in competing technologies, may have applied for or obtained or may in the future apply for and obtain, patents that will prevent, limit, or otherwise interfere with our ability to make and sell our products. We have conducted a limited review of patents issued to third parties. The large number of patents, the rapid rate of new patent issuances, the complexities of the technology involved, and the uncertainty of litigation increase the risk of business assets and management’s attention being diverted to patent litigation. Any litigation or claim against us, even those without merit, may cause us to incur substantial costs, and could place a significant strain on our financial resources, divert the attention of management from our core business, and harm our reputation. Further, as the number of participants in the medical device industry grows, the possibility of intellectual property infringement claims against us increases. If we are found to infringe the intellectual property rights of third parties, we could be required to pay substantial damages, including treble, or triple, damages if an infringement is found to be willful, and/or royalties and could be prevented from selling our products unless we obtain a license or are able to redesign our products to avoid infringement. Any such license may not be available on reasonable terms, if at all, and there can be no assurance that we would be able to redesign our products in a way that would not infringe the intellectual property rights of others. If we fail to obtain any required licenses or make any necessary changes to our products or technologies, we may have to withdraw existing products from the market or may be unable to commercialize one or more of our products, all of which could have a material adverse effect on our business, results of operations, and financial condition. If passed into law, patent reform legislation currently pending in the U.S. Congress could significantly change the risks associated with bringing or defending a patent infringement lawsuit. For example, fee shifting legislation could require a non-prevailing party to pay the attorney fees of the prevailing party in some circumstances.
In addition, we generally indemnify our customers and third-party distributors with respect to infringement by our products of the proprietary rights of third parties. Third parties may assert infringement claims against our customers or third-party distributors. These claims may require us to initiate or defend protracted and costly litigation on behalf of our customers or third-party distributors, regardless of the merits of these claims. If any of these claims succeed, we may be forced to pay damages on behalf of our customers or third-party distributors or may be required to obtain licenses to intellectual property owned by such third parties. If we cannot obtain all necessary licenses on commercially reasonable terms, our customers and third-party distributors may be forced to stop using or selling our products.
Risks Related to Ownership of Our Common Stock
The price of our common stock may be volatile, and the value of an investment in our common stock could decline.
Prior to October 17, 2018, there was no public market for our common stock. Medical device stocks have historically experienced volatility, and the trading price of our common stock may fluctuate substantially. These fluctuations could cause our stockholders to lose all or part of their investment in our common stock. Factors that could cause fluctuations in the trading price of our common stock include the following:
|
•
|
actual or anticipated changes or fluctuations in our results of operations;
|
|
•
|
results of our clinical trials and that of our competitors’ products;
|
|
•
|
regulatory actions with respect to our products or our competitor’s products;
|
|
•
|
announcements of new offerings, products, services or technologies, commercial relationships, acquisitions, or other events by us or our competitors;
|
|
•
|
price and volume fluctuations in the overall stock market from time to time;
|
|
•
|
significant volatility in the market price and trading volume of healthcare companies, in general, and of companies in the medical device industry in particular;
|
|
•
|
fluctuations in the trading volume of our shares or the size of our public float;
|
|
•
|
negative publicity;
|
|
•
|
whether our results of operations meet the expectations of securities analysts or investors or those expectations change;
|
|
•
|
litigation involving us, our industry, or both;
|
|
•
|
regulatory developments in the United States, foreign countries, or both;
|
|
•
|
lock-up releases and sales of large blocks of our common stock;
|
|
•
|
additions or departures of key employees or scientific personnel; and
|
64
|
•
|
general economic conditions and trends.
|
In addition, if the market for healthcare stocks or the stock market, in general, experience a loss of investor confidence, the trading price of our common stock could decline for reasons unrelated to our business, results of operations, or financial condition. The trading price of our common stock might also decline in reaction to events that affect other companies in our industry even if these events do not directly affect us. In the past, following periods of volatility in the market price of a company’s securities, securities class action litigation has often been brought against that company. If our stock price is volatile, we may become the target of securities litigation. Securities litigation could result in substantial costs and divert our management’s attention and resources from our business. This could have a material adverse effect on our business, results of operations, and financial condition.
Sales of substantial amounts of our common stock in the public markets, including when the “lock-up” or “market standoff” period from our IPO ends, or the perception that sales might occur, could reduce the price of our common stock and may dilute our stockholders' voting power and ownership interest in us.
Sales of a substantial number of shares of our common stock in the public market, or the perception that these sales could occur, could adversely affect the market price of our common stock, and may make it more difficult for our stockholders to sell our common stock at a time and price that they deem appropriate. All of the shares of common stock sold in our IPO are freely tradable without restrictions or further registration under the Securities Act of 1933, as amended, or the Securities Act, except for any shares held by our “affiliates” as defined in Rule 144 under the Securities Act. However, subject to certain exceptions, we, our directors and officers and the holders of substantially all of our capital stock, warrants and stock options prior to the IPO have agreed not to offer, sell or agree to sell, directly or indirectly, any shares of common stock without the permission of Morgan Stanley & Co. LLC and Merrill Lynch, Pierce, Fenner & Smith Incorporated until April 14, 2019. When the lock-up period expires, our security holders will be able to sell shares in the public market subject to any restrictions under the securities laws. In addition, Morgan Stanley and Merrill Lynch may, in their discretion, release all or some portion of the shares subject to lock-up agreements prior to the expiration of the lock-up period. Sales of a substantial number of such shares upon expiration or early release of the lock-up, or the perception that such sales may occur, could cause our share price to fall, or make it more difficult for our stockholders to sell our common stock at a time and price that they deem appropriate.
The holders of approximately 12 million shares, or approximately 55.4%, of our common stock, have rights, subject to some conditions, to require us to file registration statements covering the sale of their shares or to include their shares in registration statements that we may file for ourselves or other stockholders. We have also registered the offer and sale of all shares of common stock that we may issue under our equity compensation plans.
We may issue our shares of common stock or securities convertible into our common stock from time to time in connection with a financing, acquisition, investments or otherwise. Any such issuance could result in substantial dilution to our existing stockholders and cause the trading price of our common stock to decline.
Insiders have substantial control over us, which could limit our other stockholders' ability to influence the outcome of key transactions, including a change of control.
Our directors, executive officers, and each of our stockholders that own greater than 5% of our outstanding common stock, in the aggregate, beneficially own approximately 52.0% of the outstanding shares of our common stock. As a result, these stockholders will be able to influence or control matters requiring approval by our stockholders, including the election of directors and the approval of mergers, acquisitions or other extraordinary transactions. They may also have interests that differ from our other stockholders' interests and may vote in a manner that is adverse to our other stockholders' interests. This concentration of ownership may have the effect of deterring, delaying, or preventing a change of control of our company, could deprive our stockholders of an opportunity to receive a premium for their common stock as part of a sale of our company and might ultimately affect the market price of our common stock.
65
We may be unable to utilize our federal net operating loss carryforwards to reduce our income taxes.
As of
December 31, 2018
, we had net operating loss, or NOL, carryforwards of
$135.5 million
and
$109.9 million
available to reduce future taxable income, if any, for U.S. federal income tax and state income tax purposes, respectively. If not utilized, our federal and state NOL carryforwards begin to expire in
2029
and
2019
, respectively. These NOL carryforwards could expire unused and be unavailable to offset future income tax liabilities. In addition, under Section 382 of the Code, and corresponding provisions of state law, if a corporation undergoes an “ownership change,” which generally occurs if the percentage of the corporation’s stock owned by 5% stockholders increases by more than 50% over a three-year period, the corporation’s ability to use its pre-change NOL carryforwards and other pre-change tax attributes to offset its post-change income may be limited. We have determined that we have experienced Section 382 ownership changes in 2010 and $1.4 million of our NOL and tax credit carryforwards are subject to limitation. In addition, we are still analyzing the effect that our IPO may have had on our NOLs, and we may experience ownership changes in the future as a result of subsequent shifts in our stock ownership, some of which may be outside of our control. As a result of our IPO, or if a future ownership change occurs, our ability to use our NOL tax credit carryforwards may be materially limited, which would harm our future operating results by effectively increasing our future tax obligations.
The requirements of being a public company may strain our resources, divert our management’s attention, and affect our ability to attract and retain qualified board members.
As a public company, we are subject to the reporting requirements of the Securities Exchange Act of 1934, as amended, or the Exchange Act, and are required to comply with the applicable requirements of the Sarbanes-Oxley Act of 2002, or the Sarbanes-Oxley Act, and the Dodd-Frank Wall Street Reform and Consumer Protection Act of 2010, the listing requirements of the Nasdaq Global Market and other applicable securities rules and regulations. Compliance with these rules and regulations will increase our legal and financial compliance costs, make some activities more difficult, time consuming, or costly and increase demand on our systems and resources. Among other things, the Exchange Act requires that we file annual, quarterly, and current reports with respect to our business and results of operations and maintain effective disclosure controls and procedures and internal controls over financial reporting. In order to maintain and, if required, improve our disclosure controls and procedures and internal controls over financial reporting to meet this standard, significant resources and management oversight may be required. As a result, management’s attention may be diverted from other business concerns, which could harm our business and results of operations. Although we have already hired additional employees to comply with these requirements, we may need to hire even more employees in the future, which will increase our costs and expenses.
As a public company, these new rules and regulations have made it more expensive for us to obtain director and officer liability insurance. In the future, we may be required to accept reduced coverage. These factors could make it more difficult for us to attract and retain qualified members of our board of directors, particularly to serve on our audit committee and compensation committee, and qualified executive officers.
Failure to establish and maintain an effective system of internal controls could result in material misstatements of our financial statements or cause us to fail to meet our reporting obligations or fail to prevent fraud in which case, our stockholders could lose confidence in our financial reporting, which would harm our business and could negatively impact the price of our stock.
We are subject to the reporting requirements of the Exchange Act, the Sarbanes-Oxley Act and the rules and regulations of Nasdaq Global Market. The Sarbanes-Oxley Act requires, among other things, that we maintain effective disclosure controls and procedures and internal controls over financial reporting. Commencing with the year ending December 31, 2019, we must perform system and process evaluation and testing of our internal controls over financial reporting to allow management to report on the effectiveness of our internal controls over financial reporting in our Annual Report on Form 10-K for that year, as required by Section 404 of the Sarbanes-Oxley Act, or Section 404. This will require that we incur substantial additional professional fees and internal costs to expand our accounting and finance functions and that we expend significant management efforts. As a result, we may experience difficulty in producing accurate financial statements in a timely manner.
We may discover weaknesses in our system of internal financial and accounting controls and procedures that could result in a material misstatement of our financial statements. In addition, our internal control over financial reporting will not prevent or detect all errors and all fraud. A control system, no matter how well designed and operated, can provide only reasonable, not absolute, assurance that the control system’s objectives will be met. Because of the inherent limitations in all control systems, no evaluation of controls can provide absolute assurance that misstatements due to error or fraud will not occur or that all control issues and instances of fraud will be detected.
66
The rules governing the standards that must be met for our management to assess our internal control over financial reporting are complex and require significant documentation, testing, and possible remediation. If we are not able to comply with the requirements of Section 404 of the Sarbanes-Oxley Act in a timely manner, or if we are unable to maintain proper and effective internal controls, we may not be able to produce timely and accurate financial statements. In addition, in connection with the future attestation process by our independent registered public accounting firm, we may encounter problems or delays in completing the implementation of any requested improvements and receiving a favorable attestation. If we cannot favorably assess the effectiveness of our internal control over financial reporting, or if our independent registered public accounting firm is unable to provide an unqualified attestation report on our internal controls, our stockholders could lose confidence in our reporting, and the market price of our stock could decline. In addition, we could be subject to sanctions or investigations by the Nasdaq Global Market, the Securities and Exchange Commission, or SEC, or other regulatory authorities.
We are an “emerging growth company,” and we cannot be certain if the reduced disclosure requirements applicable to emerging growth companies will make our common stock less attractive to investors.
We are an “emerging growth company” as defined in the JOBS Act and we intend to take advantage of some of the exemptions from reporting requirements that are applicable to other public companies that are not emerging growth companies, including:
|
•
|
an exception from compliance with the auditor attestation requirements of Section 404 of the Sarbanes-Oxley Act of 2002;
|
|
•
|
reduced disclosure about our executive compensation arrangements in our periodic reports, proxy statements, and registration statements;
|
|
•
|
exemptions from the requirements of holding non-binding advisory votes on executive compensation or golden parachute arrangements; and
|
|
•
|
exemption from complying with new or revised financial accounting standards until such time as such standards are applicable to private companies.
|
If some investors find our common stock less attractive because we will rely on these exemptions, there may be a less active trading market for our common stock and our stock price may be more volatile. We may take advantage of these reporting exemptions until we are no longer an emerging growth company. We will remain an emerging growth company until the earlier of (1) the last day of the fiscal year (a) in 2023, (b) in which we have total annual gross revenue of at least $1.07 billion, or (c) in which we are deemed to be a large accelerated filer, which means the market value of our common stock that is held by non- affiliates exceeds $700 million as of the prior June 30, and (2) the date on which we have issued more than $1.0 billion in non-convertible debt during the prior three-year period.
If securities or industry analysts do not publish research or reports about our business, or publish unfavorable research reports about our business, our share price and trading volume could decline.
The trading market for our common stock depends, to some extent, on the research and reports that securities or industry analysts publish about us or our business. We do not have any control over these analysts. If one or more of the analysts who cover us publishes unfavorable commentary about us or changes their opinion of our business prospects, our share price would likely decline. If one or more of these analysts ceases coverage of or fails to regularly publish reports on us, we could lose visibility in the financial markets, which could cause our share price or trading volume to decline.
We do not intend to pay dividends for the foreseeable future and, consequently, our stockholders' ability to achieve a return on investment in our common stock will depend on appreciation in the price of our common stock.
We have never declared or paid any dividends on our common stock. We intend to retain any earnings to finance the operation and expansion of our business, and we do not anticipate paying any cash dividends in the future. As a result, our stockholders may only receive a return on an investment in our common stock if the market price of our common stock increases. In addition, our loan and security agreements contain restrictions on our ability to pay dividends.
Our credit facility contains covenants that may restrict our business and financing activities.
Borrowings under our credit facility are secured by substantially all of our assets. Our credit facility also restricts our ability to, among other things:
|
•
|
dispose of or sell assets;
|
|
•
|
make material changes in our business or management;
|
|
•
|
consolidate or merge with or acquire other entities;
|
|
•
|
incur additional indebtedness;
|
67
|
•
|
incur liens on our assets;
|
|
•
|
pay dividends or make distributions on our capital stock;
|
|
•
|
make certain investments;
|
|
•
|
enter into transactions with our affiliates;
|
|
•
|
make any payment in respect of any subordinated indebtedness; and
|
|
•
|
waive or amend any of our current intellectual property agreements or material contracts.
|
These restrictions are subject to certain exceptions. In addition, our loan and security agreement requires us to maintain a minimum cash balance and revenue targets. Beginning with the three months ended March 31, 2019, we are required to meet either revenue or earnings targets
The covenants in our credit facility, as well as any future financing agreements that we may enter into, may restrict our ability to finance our operations, engage in, expand, or otherwise pursue our business activities and strategies. Our ability to comply with these covenants may be affected by events beyond our control, and future breaches of any of these covenants could result in a default under our credit facility agreements. If not waived, future defaults could cause all of the outstanding indebtedness under our credit facility agreement to become immediately due and payable and terminate all commitments to extend further credit.
If we do not have or are unable to generate sufficient cash available to repay our debt obligations when they become due and payable, either upon maturity or in the event of a default, we may not be able to obtain additional debt or equity financing on favorable terms, if at all, which may negatively impact our ability to operate our business.
Our charter documents and Delaware law could discourage takeover attempts and lead to management entrenchment.
Our amended and restated certificate of incorporation and amended and restated bylaws contain provisions that could delay or prevent a change in control of our company. These provisions could also make it difficult for stockholders to elect directors that are not nominated by the current members of our board of directors or take other corporate actions, including effecting changes in our management. These provisions include:
|
•
|
a classified board of directors with three-year staggered terms, which could delay the ability of stockholders to change the membership of a majority of our board of directors;
|
|
•
|
the ability of our board of directors to issue shares of preferred stock and to determine the price and other terms of those shares, including preferences and voting rights, without stockholder approval, which could be used to significantly dilute the ownership of a hostile acquiror;
|
|
•
|
the exclusive right of our board of directors to elect a director to fill a vacancy created by the expansion of our board of directors or the resignation, death or removal of a director, which prevents stockholders from being able to fill vacancies on our board of directors;
|
|
•
|
a prohibition on stockholder action by written consent, which forces stockholder action to be taken at an annual or special meeting of our stockholders;
|
|
•
|
the requirement that a special meeting of stockholders may be called only by a majority vote of our entire board of directors, the chairman of our board of directors, or our chief executive officer, which could delay the ability of our stockholders to force consideration of a proposal or to take action, including the removal of directors;
|
|
•
|
the requirement for the affirmative vote of holders of at least 66 2/3% of the voting power of all of the then-outstanding shares of the voting stock, voting together as a single class, to amend the provisions of our amended and restated certificate of incorporation relating to the management of our business or our amended and restated bylaws, which may inhibit the ability of an acquiror to effect such amendments to facilitate an unsolicited takeover attempt; and
|
|
•
|
advance notice procedures with which stockholders must comply to nominate candidates to our board of directors or to propose matters to be acted upon at a stockholders’ meeting, which may discourage or deter a potential acquiror from conducting a solicitation of proxies to elect the acquiror’s own slate of directors or otherwise attempting to obtain control of us.
|
In addition, as a Delaware corporation, we are subject to Section 203 of the Delaware General Corporation Law. These provisions may prohibit large stockholders, in particular those owning 15% or more of our outstanding voting stock, from merging or combining with us for a certain period of time.
68
A Delaware corporation may opt out of this provision by express provision in its original certificate of incorporation or by amendment to its certificate of incorporation or bylaws approved by its stockholders. However, we have not opted out of, and do not currently intend to opt out of, this provision.
These and other provisions in our amended and restated certificate of incorporation, amended and restated bylaws and Delaware law could make it more difficult for stockholders or potential acquirers to obtain control of our board of directors or initiate actions that are opposed by our then-current board of directors, including delay or impede a merger, tender offer, or proxy contest involving our company. The existence of these provisions could negatively affect the price of our common stock and limit opportunities for our stockholders to realize value in a corporate transaction.
Our amended and restated certificate of incorporation provides that the Court of Chancery of the State of Delaware and the federal district courts of the United States of America are the exclusive forums for substantially all disputes between us and our stockholders, which restricts our stockholders’ ability to bring a lawsuit against us or our directors, officers, or employees in jurisdictions other than Delaware and federal district courts.
Our amended and restated certificate of incorporation provides that the Court of Chancery of the State of Delaware is the exclusive forum for any derivative action or proceeding brought on our behalf; any action asserting a breach of a fiduciary duty; any action asserting a claim against us arising pursuant to the Delaware General Corporation Law, our amended and restated certificate of incorporation, or our amended and restated bylaws; or any action asserting a claim against us that is governed by the internal affairs doctrine. The provision would not apply to suits brought to enforce a duty or liability created by the Exchange Act. Our amended and restated certificate of incorporation further provides that the federal district courts of the United States of America are the exclusive forum for resolving any complaint asserting a cause of action arising under the Securities Act. These choice of forum provisions may limit a stockholder’s ability to bring a claim in a judicial forum that it finds favorable for disputes with us or our directors, officers, or other employees. Some companies that adopted a similar federal district court forum selection provision are currently subject to a suit in the Chancery Court of Delaware by stockholders who assert that the provision is not enforceable. If a court were to find either choice of forum provisions contained in our amended and restated certificate of incorporation to be inapplicable or unenforceable in an action, we may incur additional costs associated with resolving such action in other jurisdictions, which could harm our business.
69
Item 1B Unresolved Staff Comments.
None.
Item 2. Properties.
Our leased headquarters in Santa Clara, California, comprises approximately 21,848 square feet. Our headquarters houses our research, product development, marketing, finance, education, and administration functions. We believe our facilities are adequate and suitable for our current needs but in the future we may need additional space.
We also lease office spaces in Gallarate, Italy, Mannheim, Germany and Knaresborough, United Kingdom to accommodate mainly our European sales and marketing team.
Item 3. Legal Proceedings
We are, and from time to time may be, party to litigation and subject to claims incident to the ordinary course of business. As our growth continues, we may become party to an increasing number of litigation matters and claims. The outcome of litigation and claims cannot be predicted with certainty, and the resolution of these matters could materially affect our future results of operations, cash flow or financial position. We are not presently party to any legal proceedings that in the opinion of management would, individually or taken together, likely have a material adverse effect on our business, operating results, financial condition, or cash flow.
Item 4. Mine Safety Disclosures
Not Applicable.
70
71
PART II
Item 5. Market for Registrant’s Common Equity, Related Stockholder Matters and Issuer Purchases of Equity Securities.
Market Price of Common Stock
Our common stock has been listed on the Nasdaq Global Market under the symbol “SIBN” since October 17, 2018. Prior to that date, there was no public trading market for our common stock.
Holders of Record
As of
March 13, 2019
, we had
441
holders of record of our common stock. The actual number of stockholders is greater than this number of record holders, and includes stockholders who are beneficial owners, but whose shares are held in street name by brokers and other nominees. This number of holders of record also does not include stockholders whose shares may be held in trust by other entities.
Dividend Policy
We have never declared or paid any cash dividends on our capital stock, and we do not currently intend to pay any cash dividends on our capital stock in the foreseeable future. In addition, our credit facility with Biopharma Credit Investments IV Sub LP, or Pharmakon, restricts our ability to pay dividends on our capital stock. We currently intend to retain all available funds and any future earnings to support operations and to finance the growth and development of our business. Any future determination to pay dividends will be made at the discretion of our board of directors subject to applicable laws, and will depend upon, among other factors, our results of operations, financial condition, contractual restrictions, and capital requirements. Our future ability to pay cash dividends on our capital stock may also be limited by the terms of any future debt or preferred securities or future credit facility.
Recent Sales of Unregistered Securities
None.
Use of Proceeds from our Public Offering of Common Stock
On October 16, 2018, our registration statement on Form S-1 (File No. 333-227445) relating to our IPO of common stock became effective. The IPO closed on October 16, 2018 at which time we issued 8,280,000 shares of our common stock at an initial offering price of $15.00 per share for gross proceeds of $124.2 million. We received net proceeds from the IPO of approximately $113.6 million, after deducting the underwriting discount of $8.7 million and other estimated offering-related expenses paid or payable by us of approximately $1.9 million. None of the expenses associated with the IPO or private placement were paid to directors, officers, persons owning 10% or more of any class of equity securities, or to their associates, or to our affiliates. Morgan Stanley & Co. LLC, Merrill Lynch, Pierce, Fenner & Smith Incorporated, Canaccord Genuity Inc. and JMP Securities LLC acted as underwriters for the offering.
Shares of our common stock began trading on the Nasdaq Global Market on October 17, 2018. The shares were registered under the Securities Act on registration statement on Form S-1 (Registration No. 333-227445).
There has been no material change in the planned use of proceeds from the IPO from that described in the prospectus filed with the SEC pursuant to Rule 424(b)(4) under the Securities Act on October 16, 2018.
Repurchases of Shares or of Company Equity Securities
None.
Item 6. Selected Financial Data.
Not applicable to a smaller reporting company.
72
Item 7. Management’s Discussion and Analysis of Financial Condition and Results of Operations
The following discussion and analysis of our financial condition and results of operations should be read in conjunction with our financial statements and the related notes to those statements included elsewhere in this Annual Report on Form 10-K. Some of the information contained in this discussion and analysis or set forth elsewhere in this Annual Report on Form 10-K, including information with respect to our plans and strategy for our business, includes forward-looking statements that involve risks and uncertainties. As a result of many important factors, including those set forth in the "Risk Factors" section of this Annual Report on Form 10-K, our actual results could differ materially from the results described in, or implied, by these forward-looking statements.
Overview
We are a medical device company that has pioneered a proprietary minimally invasive surgical implant system, which we call iFuse, to fuse the sacroiliac joint to treat sacroiliac joint dysfunction that often causes severe lower back pain. Since we introduced iFuse in 2009, more than 37,000 procedures have been performed by over 1,800 surgeons, in the United States and 33 other countries. Published clinical studies have shown that 15% to 30% of all chronic lower back pain is associated with the sacroiliac joint. We believe iFuse is currently used in the majority of minimally invasive surgical fusions of the sacroiliac joint in the United States.
The two sacroiliac joints are the largest joints in the body and connect the sacrum, near the base of the spine, to the iliac bones, the two major bones of the pelvis. The iFuse system includes a series of patented triangular implants, the instruments we have developed to enable the procedure, as well as the diagnostic and surgical techniques we have developed to enable physicians to perform the procedure. We introduced our second generation implant, the iFuse-3D, in 2017. We market our products with a direct sales force and a number of distributors in the United States, and with a combination of a direct sales force and distributors in other countries.
We have incurred net losses since our inception in 2008. We had net losses of
$17.5 million
and
$23.0 million
for the years ended
December 31, 2018
and
2017
, respectively. As of
December 31, 2018
, we had an accumulated deficit of
$157.2 million
. To date, we have financed our operations primarily through private placements of equity securities, certain debt-related financing arrangements, and sales of our products. We have devoted substantially all of our resources to research and development of our products, reimbursement-related initiatives, sales and marketing activities, and clinical, quality assurance, and regulatory matters for our products.
In October 2018, we completed our IPO by issuing 8.28 million shares of common stock, at an offering price of $15.00 per share, for net proceeds of $113.6 million after deducting underwriting discounts and commissions and offering expenses payable by us.
Factors Affecting Results of Operations
Coverage and Reimbursement
Prior to our launch of iFuse in 2009, Medicare and most private insurance companies reimbursed surgeons routinely for sacroiliac joint fusions, which were primarily invasive. However, effective July 1, 2013, the AMA’s Editorial Panel effectively restricted reimbursement for minimally invasive sacroiliac joint fusion because they considered the published clinical evidence at the time to be inadequate.
Subsequently, as a result of the growing number of published clinical studies demonstrating the effectiveness and safety of iFuse, along with the support of several professional medical specialty societies and leading academic surgeons, the AMA Editorial Panel established a new reimbursement code for minimally invasive sacroiliac joint fusion surgery, effective January 1, 2015. However, the new code did not immediately lead to positive coverage decisions by payors—in many cases, the payors wanted additional published evidence before deciding to cover the procedure. As a result, positive reimbursement decisions covering the procedure have occurred over the last few years, and some payors are still in the process of making decisions based on the most recent evidence.
Coverage decisions for this code are made independently by each private insurance company and each of the seven regional Medicare Administrative Contractors that help manage Medicare. The process of obtaining coverage is laborious. As of June 30, 2016, because of the iFuse clinical evidence, all Medicare Administrative Contractors were covering the procedure. At the time, very few private payors were covering. By December 31, 2017, U.S. payors covering 162 million lives regularly reimbursed for the iFuse procedure, and as of December 31, 2018, U.S. payors covering 256.5 million lives regularly reimbursed for the iFuse procedures, 121.7 million of which are covered by private payors. Forty-five of the largest 65 private payors that we track had positive coverage policies for the procedure, were consistently covering the procedure, or had announced coming future coverage. Of these 45 private payors, 26 of them have issued positive coverage policies exclusive to iFuse for sacroiliac joint fusion because of the clinical evidence. Twenty of these exclusive coverage policies have published since January 1, 2018, which we believe has contributed to our accelerating sales growth in our fiscal year 2018.
73
There are a number of large and small private payors, including Aetna, Cigna, Humana, and Anthem that are not yet reimbursing for the procedure. Some of these non-covering payors are reevaluating coverage given the latest data, but there can be no assurance they will reach positive coverage decisions.
Our Sales Force
We market and sell iFuse primarily through a direct sales force and a small number of third-party distributors. Our target customer base includes approximately 7,500 surgeons who perform spine and/or pelvic surgery, including orthopedic spine surgeons, neurosurgeons, general orthopedic surgeons, and orthopedic trauma surgeons.
Our direct sales organization in the United States was comprised of seven sales regions as of December 31, 2018. Each region is comprised of a number of territory sales managers who act as the primary customer contact. Our territory sales managers have extensive training and experience selling medical devices for spine problems and pain management, generally focusing on emerging technologies and markets. For large and/or high volume territories, we also employ territory associate representatives who cover cases. As of December 31, 2018, our territory sales managers were led by seven regional sales directors who reported to our Vice President of U.S. Sales. The Vice President of U.S. Sales reports to our Chief Commercial Officer. As of December 31, 2018, our U.S. sales force consisted of 45 sales representatives directly employed by us, and 30 third-party distributors.
In addition to general sales and marketing training, we provide our sales organization with comprehensive, hands-on cadaveric and dry-lab training sessions focusing on the clinical benefits of our products and how to use them. We believe our robust training and professional development programs have been an important component of our success to date and will help support our anticipated future growth. We expect to continue to increase the size of our sales organization in order to increase sales and market penetration and to provide the significant, ongoing level of customer support required by our sales and marketing strategy.
As of December 31, 2018, we had 28 employees working in our European operations, and have established operations in Italy (2010), Germany (2014), and the United Kingdom (2015). As of December 31, 2018, our international sales force consisted of 14 sales representatives directly employed by us and 23 exclusive third-party distributors, which together had sales in 33 countries through December 31, 2018. We anticipate continuing to build our operations in the major European countries while establishing distributor arrangements in smaller ones. We intend to follow a similar model in Europe to the one established in the United States, working with internationally recognized healthcare professional experts as we expand our training and reimbursement activities. As of December 31, 2018, beyond Europe and the United States, surgeons had performed the first iFuse procedures in Australia, Cayman Islands, Hong Kong, Israel, Japan, Kuwait, New Zealand, Saudi Arabia, Taiwan and Turkey.
We have in the past and expect in the future to enter into different compensation arrangements with our sales professionals, which may include minimum guaranteed commissions. This has impacted our compensation expenses in the past and we expect it will in the future.
Components of Results of Operations
Revenue
We derive substantially all our revenue from sales of iFuse. Revenue from sales of iFuse fluctuate based on volume of cases (procedures performed), discounts, mix of international and U.S. sales, and the number of implants used for a particular patient. Similar to other orthopedic companies, our revenue can also fluctuate from quarter to quarter due to a variety of factors, including reimbursement, sales force changes, physician activities, and seasonality. Our revenue from international sales may also be significantly impacted by fluctuations in foreign currency exchange rates between the U.S. dollar (our reporting currency) and the local currency.
Cost of Goods Sold, Gross Profit, and Gross Margin
We utilize third-party manufacturers for production of the iFuse implants and instrument sets.
Cost of goods sold consists primarily of costs of the components of iFuse implants and instruments, scrap and inventory obsolescence, and distribution-related expenses such as logistics and shipping costs. We anticipate that our cost of goods sold will increase in absolute dollars as case levels increase.
Our gross profit has been and will continue to be affected by a variety of factors, including the cost to have our products manufactured, pricing pressure from increasing competition, and the factors described above impacting our revenue.
Our gross margins are typically higher on products we sell directly as compared to products we sell through third-party distributors. As a result, changes in the mix of direct versus distributor sales can directly influence our gross margins.
74
In accordance with the Patient Protection and Affordable Care Act, effective January 1, 2013, we began to incur an excise tax on sales of medical devices in the United States. Effective December 2015, the Act was amended to include a provision to suspend the tax on medical devices through 2017. In January 2018, the suspension on the tax on medical devices was further extended through 2019.
Operating Expenses
Our operating expenses consist of sales and marketing, research and development, and general and administrative expenses. Personnel costs are the most significant component of operating expenses and consist of salaries, sales commissions and other cash and stock-based compensation related expenses. We expect operating expenses to increase in absolute dollars as we continue to invest and grow our business, but we anticipate that it will decrease as a percentage of revenue over time. In September 2017, we implemented cost-saving measures, which reduced our operational expenses though headcount reductions, reduced project spending, and more targeted marketing and surgeon training activities.
Sales and Marketing Expenses
Sales and marketing expenses primarily consist of salaries, stock-based compensation expense, and other compensation related costs, for personnel employed in sales, marketing, medical affairs, and professional education departments. In addition, our sales and marketing expenses include commissions and bonuses, generally based on a percentage of sales, to our sales managers and directors, direct sales representatives and third-party distributors. We expect our sales and marketing expenses to increase in absolute dollars with the continued commercialization of our current and future products and continued investment in our global sales organization, including broadening our relationships with third-party distributors, expanding exclusivity commitments among them and increasing the number of our direct sales representatives, especially with increased reimbursement and adoption in the United States. Our sales and marketing expenses may fluctuate from period to period due to the seasonality of our business and as we continue to add direct sales representatives in new territories.
Research and Development Expenses
Our research and development expenses primarily consist of engineering, product development, clinical and regulatory expenses (including clinical study expenses), and consulting services, outside prototyping services, outside research activities, materials, depreciation, and other costs associated with development of our products. Research and development expenses also include related personnel and consultants’ compensation and stock-based compensation expense. We expense research and development costs as they are incurred. We expect research and development expense to increase in absolute dollars as we develop new products, add research and development personnel, and undergo clinical activities, including more clinical studies to gain additional regulatory clearances and wider surgeon adoption.
General and Administrative Expenses
General and administrative expenses primarily consist of compensation, stock-based compensation expense, and other costs for finance, accounting, legal, compliance, reimbursement, and administrative matters. We expect our general and administrative expenses to increase in absolute dollars to support the growth of our business. We also expect to incur additional general and administrative expenses as a result of operating as a public company, including but not limited to: expenses related to compliance with the rules and regulations of the Securities and Exchange Commission and those of the Nasdaq Global Market on which our securities are traded; additional insurance expenses; investor relations activities; and other administrative and professional services. While we expect the general and administrative expenses to increase in absolute dollars, we anticipate that it will decrease as a percentage of revenue over time.
Interest Expense
Interest expense is related to borrowings and includes the amortization of debt discounts derived from the issuance of warrants.
Other Income (Expense), Net
Other income (expense), net consists primarily of the changes in fair value of our preferred stock warrant liability and net gain (loss) on foreign currency transactions. In connection with our initial public offering, or IPO, our preferred stock warrant liability was reclassed to equity as a result of the preferred stock warrants being converted to common stock warrants.
75
Results of Operations
The following table sets forth our results of operations for the period presented (in thousands):
|
Year ended December 31,
|
|||||||
|
2018
|
2017
|
||||||
|
Consolidated Statements of Operations Data:
|
|||||||
|
Revenue
|
$
|
55,380
|
|
$
|
47,983
|
|
|
|
Cost of goods sold
|
4,833
|
|
5,112
|
|
|||
|
Gross profit
|
50,547
|
|
42,871
|
|
|||
|
Operating expenses:
|
|||||||
|
Sales and marketing
|
44,497
|
|
41,646
|
|
|||
|
Research and development
|
5,376
|
|
5,513
|
|
|||
|
General and administrative
|
12,639
|
|
13,062
|
|
|||
|
Total operating expenses
|
62,512
|
|
60,221
|
|
|||
|
Loss from operations
|
(11,965
|
)
|
(17,350
|
)
|
|||
|
Interest and other income (expense), net:
|
|||||||
|
Interest income
|
769
|
|
175
|
|
|||
|
Interest expense
|
(5,108
|
)
|
(6,204
|
)
|
|||
|
Other income (expense), net
|
(1,149
|
)
|
340
|
|
|||
|
Net loss
|
$
|
(17,453
|
)
|
$
|
(23,039
|
)
|
|
The following table sets forth our results of operations as a percentage of revenue:
|
Year ended December 31,
|
|||||
|
2018
|
2017
|
||||
|
Consolidated Statements of Operations Data:
|
|||||
|
Revenue
|
100
|
%
|
100
|
%
|
|
|
Cost of goods sold
|
9
|
%
|
11
|
%
|
|
|
Gross profit
|
91
|
%
|
89
|
%
|
|
|
Operating expenses:
|
|||||
|
Sales and marketing
|
80
|
%
|
87
|
%
|
|
|
Research and development
|
10
|
%
|
11
|
%
|
|
|
General and administrative
|
23
|
%
|
27
|
%
|
|
|
Total operating expenses
|
113
|
%
|
125
|
%
|
|
|
Loss from operations
|
(22
|
)%
|
(36
|
)%
|
|
|
Interest and other income (expense), net:
|
|||||
|
Interest income
|
2
|
%
|
—
|
%
|
|
|
Interest expense
|
(9
|
)%
|
(13
|
)%
|
|
|
Other income (expense), net
|
(2
|
)%
|
1
|
%
|
|
|
Net loss
|
(31
|
)%
|
(48
|
)%
|
|
76
The following table sets forth our United States and international revenue (in thousands):
|
Year ended December 31,
|
|||||||
|
2018
|
2017
|
||||||
|
United States
|
50,137
|
|
43,351
|
|
|||
|
International
|
5,243
|
|
4,632
|
|
|||
|
$
|
55,380
|
|
$
|
47,983
|
|
||
The following table sets forth our United States and international revenue as a percentage of our total revenue:
|
Year ended December 31,
|
|||||
|
2018
|
2017
|
||||
|
United States
|
91
|
%
|
90
|
%
|
|
|
International
|
9
|
%
|
10
|
%
|
|
|
100
|
%
|
100
|
%
|
||
Comparison of the years ended
December 31, 2018
and
2017
Revenue, Cost of Goods Sold, Gross Profit, and Gross Margin
|
Year ended December 31,
|
||||||||||||||
|
2018
|
2017
|
$ Change
|
% Change
|
|||||||||||
|
(in thousands except for percentages)
|
||||||||||||||
|
Revenue
|
$
|
55,380
|
|
$
|
47,983
|
|
$
|
7,397
|
|
15
|
%
|
|||
|
Cost of goods sold
|
4,833
|
|
5,112
|
|
(279
|
)
|
(5
|
)%
|
||||||
|
Gross profit
|
$
|
50,547
|
|
$
|
42,871
|
|
$
|
7,676
|
|
18
|
%
|
|||
|
Gross margin
|
91
|
%
|
89
|
%
|
||||||||||
Revenue.
Revenue increased
$7.4 million
, or
15%
, for the
year ended
December 31, 2018
compared to the
year ended
December 31, 2017
. This is primarily due to an increase of
$6.8 million
from growth of domestic revenue from higher sales force productivity and more active surgeons from improved U.S. reimbursement coverage. In addition, revenue increased
$0.6 million
from growth of international revenue from increased case volume in the United Kingdom, increased sales force productivity in Germany, and new business in Australia and Taiwan.
Cost of Goods Sold, Gross Profit, and Gross Margin.
Total cost of goods sold
decreased
$0.3 million
, or
5%
, for the
year ended
December 31, 2018
compared to the
year ended
December 31, 2017
. This is primarily due to a decrease of $0.3 million in depreciation expense for fully depreciated instrument sets, employee related costs of $0.1 million due to lower headcount, and $0.1 million in lower consulting and other professional fees. These decreases were partially offset by increases in direct product costs from higher case volumes. Gross profit
increased
$7.7 million
, or
18%
, to
$50.5 million
for the
year ended
December 31, 2018
compared to the
year ended
December 31, 2017
due to higher revenue and lower cost of goods sold, resulting in an increase in gross margin to
91%
compared to
89%
for the respective periods.
Operating Expenses
|
Year ended December 31,
|
||||||||||||||
|
2018
|
2017
|
$ Change
|
% Change
|
|||||||||||
|
(in thousands except for percentages)
|
||||||||||||||
|
Sales and marketing
|
$
|
44,497
|
|
$
|
41,646
|
|
$
|
2,851
|
|
7
|
%
|
|||
|
Research and development
|
5,376
|
|
5,513
|
|
(137
|
)
|
(2
|
)%
|
||||||
|
General and administrative
|
12,639
|
|
13,062
|
|
(423
|
)
|
(3
|
)%
|
||||||
|
Total operating expenses
|
$
|
62,512
|
|
$
|
60,221
|
|
$
|
2,291
|
|
|||||
77
Sales and Marketing Expenses.
Sales and marketing expenses
increased
$2.9 million
, or
7%
, for the
year ended
December 31, 2018
compared to the
year ended
December 31, 2017
. The increase was primarily due to an increase of $1.2 million in salaries and other employee incentive expense and related costs as a result of improved company performance during the period, $0.7 million in additional general operational costs, $0.5 million in travel expense as a result of an increase in field sales personnel, $0.6 million in increased commissions (net of lower minimum guaranteed commissions), and $0.2 million in distributor commissions due to higher revenues. These increases were partially offset by a decrease of $0.4 million in general marketing expenses.
Research and Development Expenses.
Research and development expenses
decreased
$0.1 million
, or
2%
, for the
year ended
December 31, 2018
compared to the
year ended
December 31, 2017
. The decrease was primarily due to a reduction of $0.3 million in salaries and related expenditures from lower headcount and $0.2 million in clinical trial expense as the INSITE and SIFI studies mature. These reductions were partially offset by an increase in prototype materials and supplies for new product development of $0.4 million.
General and Administrative Expenses
. General and administrative expenses
decreased
$0.4 million
, or
3%
, for the
year ended
December 31, 2018
compared to the
year ended
December 31, 2017
. The decrease was primarily due to $1.3 million of offering costs written off in September 2017 from delays in the public offering process and a decrease of $0.5 million from the forgiveness of a loan to the Chief Executive Officer in 2017. These decreases were partially offset by an increase in compensation expense and stock-based compensation of $0.8 million, an increase in insurance costs of $0.3 million and an increase in consulting and professional services of $0.3 million, all in conjunction of becoming a publicly traded company.
Interest and Other Income (Expense), Net
|
Year ended December 31,
|
$ Change
|
% Change
|
||||||||||||
|
2018
|
2017
|
|||||||||||||
|
(in thousands except for percentages)
|
||||||||||||||
|
Interest income
|
$
|
769
|
|
$
|
175
|
|
$
|
594
|
|
339
|
%
|
|||
|
Interest expense
|
(5,108
|
)
|
(6,204
|
)
|
1,096
|
|
(18
|
)%
|
||||||
|
Other income (expense), net
|
(1,149
|
)
|
340
|
|
(1,489
|
)
|
(438
|
)%
|
||||||
Interest Income.
Interest income
increased
$0.6 million
, or
339%
, for the
year ended
December 31, 2018
compared to the
year ended
December 31, 2017
, due to an increase of investments of excess cash in money market funds and marketable securities.
Interest Expense
. Interest expense decreased
$1.1 million
, or
18%
, for the
year ended
December 31, 2018
compared to the
year ended
December 31, 2017
, primarily due to the extinguishment of a credit facility with Silicon Valley Bank, or SVB, and Oxford Finance LLC, or Oxford, in October 2017. In conjunction with the extinguishment, we entered into a new term loan with Pharmakon, or the New Term Loan, with an increased principal balance from $30.6 million to $40 million. The extinguishment resulted in $1.5 million in early termination fees and we expensed an additional $0.7 million of unamortized debt discounts during 2017. The decrease was partially offset by $1.1 million of additional interest expense in 2018 on the increase in borrowings.
Other Income (Expense), Net.
Other income (expense), net, decreased
$1.5 million
or
438%
, for the
year ended
December 31, 2018
compared to the
year ended
December 31, 2017
, due to losses from the change in the fair value of outstanding preferred stock warrants, which are accounted for as a liability and revalued at each reporting period. In connection with our initial public offering, or IPO, our preferred stock warrant liability was reclassed to equity as a result of the preferred stock warrants being converted to common stock warrants.
Liquidity and Capital Resources
As of
December 31, 2018
, we had cash and cash equivalents of
$25.1 million
and short-term investments of
$97.1 million
. Since inception, we have financed our operations through our initial public offering, private placements of preferred stock, debt financing arrangements, and the sale of our products. As of
December 31, 2018
, we had
$39.0 million
principal amount of outstanding debt, net of debt discounts.
As of
December 31, 2018
, we had an accumulated deficit of
$157.2 million
. During the years ended
December 31, 2018
and 2017, we incurred a net loss of
$17.5 million
and
$23.0 million
, respectively, and expect to incur additional losses in the future. We have not achieved positive cash flow from operations to date. The debt covenants associated with our current debt agreement required us to maintain a minimum cash balance of $5.0 million and achieve certain revenue targets, which we were in compliance with as of December 31, 2018. Beginning with the three months ended March 31, 2019, we are required to meet either revenue or earnings targets. If we do not comply with these covenants, the debt will immediately become due.
78
Based upon our current operating plan, we believe that our existing cash, cash equivalents and short-term investments will enable us to fund our operating expenses and capital expenditure requirements through at least the next 12 months. We continue to face challenges and uncertainties and, as a result, our available capital resources may be consumed more rapidly than currently expected due to: (a) decreases in sales of our products and the uncertainty of future revenues from new products; (b) changes we may make to the business that affect ongoing operating expenses; (c) changes we may make in our business strategy; (d) regulatory developments affecting our existing products; (e) changes we may make in our research and development spending plans; and (f) other items affecting our forecasted level of expenditures and use of cash resources.
If we need to raise additional capital to fund our operations, funding may not be available to us on acceptable terms, or at all. If we are unable to obtain adequate financing when needed, we may have to delay, reduce the scope of or suspend one or more of our sales and marketing efforts, research and development activities, or other operations. We may seek to raise any necessary additional capital through a combination of public or private equity offerings, debt financings, and collaborations or licensing arrangements. If we do raise additional capital through public or private equity offerings, the ownership interest of our existing stockholders will be diluted, and the terms of these securities may include liquidation or other preferences that adversely affect our stockholders’ rights. If we raise additional capital through debt financing, we may be subject to covenants limiting or restricting our ability to take specific actions, such as incurring additional debt, making capital expenditures, or declaring dividends. If we are unable to raise capital, we will need to delay, reduce, or terminate planned activities to reduce costs. Doing so will likely harm our ability to execute our business plans.
Borrowings
In October 2017, we extinguished a term loan and revolving line of credit facility with Silicon Valley Bank and Oxford Finance, LLC and concurrently, entered into the New Term Loan with Pharmakon Advisors for $40.0 million. The New Term Loan includes an interest-only period for 35 months through September 2020 and is then repaid for 25 months of equal principal payments plus interest through December 2022. The New Term Loan carries a fixed interest rate of 11.5% and a closing fee of 1.5% of the funded amount, or $0.6 million. The New Term Loan includes a pre-payment fee of the remaining interest payable for the first 30 months of the agreement if it is prepaid within the first 30 months, a 2% prepayment penalty for months 31-48, and a 1% penalty for months 49-60. The New Term Loan required us to maintain a minimum cash balance of $5.0 million and achieve certain minimum net sales, which we were in compliance with through December 31, 2018.
Beginning with the three months ended March 31, 2019, we are required to meet either minimum net sales or trailing 12-month consolidated EBITDA targets. We need to meet one or the other, but not both. If we do not meet either the minimum net sales or trailing 12-month consolidated EBITDA targets, the debt will immediately become due. The minimum net sales and trailing 12-month consolidated EBITDA targets are as follows (in thousands):
|
Twelve Months Ending
|
Minimum Net Sales
|
Trailing 12-Month Consolidated EBITDA
|
||||||
|
March 31, 2019
|
$
|
52,000
|
|
or
|
$
|
(5,000
|
)
|
|
|
June 30, 2019
|
$
|
53,500
|
|
or
|
$
|
(3,500
|
)
|
|
|
September 30, 2019
|
$
|
54,500
|
|
or
|
$
|
(2,000
|
)
|
|
|
December 31, 2019
|
$
|
56,000
|
|
or
|
$
|
—
|
|
|
|
March 31, 2020
|
$
|
57,500
|
|
or
|
$
|
1,000
|
|
|
|
June 30, 2020
|
$
|
58,500
|
|
or
|
$
|
2,000
|
|
|
|
thereafter, as applicable
|
$
|
60,000
|
|
or
|
$
|
3,000
|
|
|
The New Term Loan is collateralized by all of our assets, including intellectual property.
Through
December 31, 2018
, we were in compliance with all of our debt obligations and covenants.
79
Contractual Obligations
The following table summarizes our contractual obligations as of
December 31, 2018
(in thousands):
|
Payments Due By Period
|
|||||||||||||||
|
Total
|
Less than 1 year
|
1-3 years
|
4-5 years
|
More than 5 years
|
|||||||||||
|
Principal obligations on the debt arrangements
|
$
|
40,000
|
|
$
|
—
|
|
$
|
22,222
|
|
$
|
17,778
|
|
$
|
—
|
|
|
Interest obligations on the debt arrangements
|
13,995
|
|
4,664
|
|
9,331
|
|
—
|
|
—
|
|
|||||
|
Operating leases
|
5,852
|
|
1,035
|
|
1,947
|
|
1,686
|
|
1,184
|
|
|||||
|
Purchase obligations
|
246
|
|
246
|
|
—
|
|
—
|
|
—
|
|
|||||
|
Total
|
$
|
60,093
|
|
$
|
5,945
|
|
$
|
33,500
|
|
$
|
19,464
|
|
$
|
1,184
|
|
In February 2018, we entered into a new seven-year lease for our Santa Clara, California facility. The total commitment is $5.1 million.
Cash Flows
The following table sets forth the primary sources and uses of cash for each of the periods presented below:
|
Year ended
December 31, |
||||||||||||||
|
2018
|
2017
|
$ Change
|
% Change
|
|||||||||||
|
(in thousands, except for percentages)
|
||||||||||||||
|
Net cash (used in) provided by:
|
||||||||||||||
|
Operating activities
|
$
|
(14,519
|
)
|
$
|
(17,530
|
)
|
$
|
3,011
|
|
(17
|
)%
|
|||
|
Investing activities
|
(97,825
|
)
|
(478
|
)
|
(97,347
|
)
|
20365
|
%
|
||||||
|
Financing activities
|
115,150
|
|
12,862
|
|
102,288
|
|
795
|
%
|
||||||
|
Effects of exchange rate changes on cash and cash equivalents
|
(94
|
)
|
(346
|
)
|
252
|
|
(73
|
)%
|
||||||
|
Net decrease in cash and cash equivalents
|
$
|
2,712
|
|
$
|
(5,492
|
)
|
$
|
8,204
|
|
|||||
Cash Used in Operating Activities
Net cash used in operating activities decreased
$3.0 million
, or
17%
, from the
year ended
December 31, 2017
to the
year ended
December 31, 2018
. The decrease in the net cash used in operating activities was primarily due to a decrease of
$5.6 million
in our net loss from higher sales, lower cost of good sold, and modest increases in operating expenses, partially offset by a decrease of
$1.2 million
in non-cash charges and decrease in changes in operating assets and liabilities of $1.4 million. The decrease in non-cash charges were mainly due charges related to write-off of public offering costs of $1.3 million, write-off of debt discount of $0.7 million and forgiveness of notes receivable of $0.4 million recognized during the year ended December 31, 2017. These charges were partially offset by higher stock-based compensation of $0.9 million and change in fair value of redeemable convertible preferred stock warrants of $1.0 million in the year ended December 31, 2018 compared to the year ended December 31, 2017. The decrease in changes in operating assets and liabilities was mainly due to higher inventory and accounts receivable as of December 31, 2018 compared to December 31, 2017.
Cash Used in Investing Activities
Net cash used in investing activities increased
$97.3 million
from the
year ended
December 31, 2017
to the
year ended
December 31, 2018
. Cash used in investing activities for the
year ended
December 31, 2018
primarily consisted of purchase of short-term investments of $96.9 million as a result of the investments of the net proceeds from our IPO, and leasehold improvements related to the new building lease entered into in February 2018 of $0.6 million. Cash used in investing activities for the
year ended
December 31, 2017
primarily consisted of instrument set purchases of $0.5 million. The instrument sets are carried by our sales representatives and used during iFuse procedures.
80
Cash Provided by Financing Activities
Cash provided by financing activities increased
$102.3 million
from the
year ended
December 31, 2017
to the
year ended
December 31, 2018
. Cash provided by financing activities for the
year ended
December 31, 2018
consisted of net proceeds from issuance of common stock with our IPO of $113.6 million and exercises of common stock options of
$1.6 million
. Cash provided by financing activities for the
year ended
December 31, 2017
consisted primarily of proceeds of $40 million from debt financing, proceeds of $5.4 million from the issuance of Series 7 preferred stock from February through March 2017 and
$0.4 million
in proceeds from exercises of common stock options, partially offset by $29.1 million in extinguishment of debt financing, $1.1 million in repayment of debt financing, payments of debt issuance costs of $1.5 million, and payments for public offering costs of
$1.3 million
.
Critical Accounting Policies, Significant Judgments, and Use of Estimates
This discussion and analysis of our financial condition and results of operations is based on our consolidated financial statements, which have been prepared in accordance with U.S. GAAP. The preparation of these consolidated financial statements requires us to make estimates and assumptions that affect the reported amounts of assets and liabilities and the disclosure of contingent assets and liabilities at the date of the consolidated financial statements, as well as the reported revenue generated, and expenses incurred during the reporting periods. We base our estimates on our historical experience and on various other factors that we believe are reasonable under the circumstances, the results of which form the basis for making judgments about the carrying value of assets and liabilities that are not readily apparent from other sources. Actual results may differ from these estimates. We believe that the accounting policies discussed below are critical to understanding our historical and future performance, as these policies relate to the more significant areas involving management’s judgments and estimates. For more detail on our critical accounting policies, see Note 2 to our consolidated financial statements appearing elsewhere in this report.
Revenue Recognition
We derive our revenue from the sale of our products to medical groups and hospitals through our direct sales force and distributors throughout the United States and Europe.
In accordance with ASC Topic 605, Revenue Recognition, we recognize revenue when persuasive evidence of an arrangement exists, title and risk of loss has transferred to the customer, the sales price is fixed or determinable, and collectability is reasonably assured. For the majority of product sales where our sales representative delivers the product at the point of implantation at hospitals or other medical facilities, we recognize revenue related to product sales upon completion of the procedure and authorization by the customer. Revenue is recognized upon receipt of a purchase agreement or agreement on pricing terms with the customer and when all other revenue recognition criteria are met. For the remaining sales, which include distributor and hospital sales where the product is ordered in advance of a procedure and a valid purchase order has been received, we recognize revenue based on shipping or delivery, which represents the point in time when the customer has taken ownership and assumed risk of loss and the required revenue recognition criteria are met. Such customers are obligated to pay within specified terms regardless of when or if they ever sell or use the products, and we have no post-delivery obligations.
Stock-Based Compensation
We measure our stock-based awards made to employees based on the estimated fair value of the awards as of the grant date using the Black-Scholes option-pricing model. We recognize stock-based compensation cost over the requisite service period using the straight-line method and base stock-based compensation cost on the value of the portion of stock-based payment awards ultimately expected to vest.
We record equity instruments issued to nonemployees at their fair value on the measurement date and are subject to periodic adjustment as the underling equity instruments vest. We believe that the estimated fair value of the stock options is more readily measurable than the fair value of the services received. We recognize stock-based compensation related to stock options granted to nonemployees as the stock options are earned.
Determining Fair Value of Stock Options
We recognize compensation costs related to stock-based awards granted to employees and directors, including stock options, based on the estimated fair value of the awards on the date of grant. We estimate the grant date fair value, and the resulting stock-based compensation, using the Black-Scholes option-pricing model. We generally recognize the grant date fair value of the stock-based awards on a straight-line basis over the requisite service period, which is generally the vesting period of the respective awards.
The Black-Scholes option-pricing model requires the use of subjective assumptions to determine the fair value of stock-based awards. These assumptions include:
81
|
|
|
Expected Term
-The expected term represents the period that we expect stock-based awards to be outstanding. We determine the expected term for option grants using the simplified method. The simplified method deems the expected term to be the midpoint between the vesting date and the contractual life of the stock-based awards.
|
|
|
|
|
Expected Volatility
-Since we have been privately held until October 2018 and prior to that time did not have any trading history for our common stock, we estimated the expected volatility prior to our IPO based on the average volatility for comparable publicly traded companies over a period equal to the expected term of the stock option grants. We chose the comparable companies based on their similar size, stage in the life cycle, or area of specialty.
|
|
|
|
|
Risk-Free Interest Rate
-The risk-free interest rate is based on the U.S. Treasury zero coupon issues in effect at the time of grant for periods corresponding with the expected term of option.
|
|
|
|
|
Expected Dividend
-We have never paid dividends on our common stock and have no plans to pay dividends on our common stock. Therefore, we used an expected dividend yield of zero.
|
|
Our board of directors intends all options granted to be exercisable at a price per share not less than the per share fair value of our common stock underlying those options on the date of grant. Prior to our IPO, the estimated fair value of our common stock was determined at each valuation date in accordance with the guidelines outlined in the
American Institute of Certified Public Accountants Practice Aid, Valuation of Privately-Held-Company Equity Securities Issued as Compensation
. Our board of directors, with the assistance of management, developed these valuations using significant judgment and taking into account numerous factors, including developments at our company, market conditions, and contemporaneous independent third-party valuations. In valuing our common stock, the fair value of our business, or enterprise value, was determined using both the income approach and market approach. The income approach estimates value based on the expectation of future cash flows that a company will generate. These future cash flows are discounted to their present values using a discount rate based on the capital rates of return for venture-backed early stage companies and is adjusted to reflect the risks inherent in our cash flows. The market approach estimates value based on a comparison of the subject company to comparable public companies in a similar line of business. From the comparable companies, a representative market value multiple is determined and then applied to the subject company’s financial results to estimate the value of the subject company.
We then allocated the enterprise values derived from the approaches discussed above to each of our classes of stock using a hybrid methodology, which included both the Option Pricing Method, or OPM, and the Probability Weighted Expected Return Method, or PWERM. The allocation of these enterprise values to each part of our capital structure, including our common stock, was done based on the OPM. OPM treats the rights of the holders of preferred and common shares as equivalent to call options on any value of the enterprise above certain breakpoints of value based upon the liquidation preferences of the holders of preferred shares, as well as their rights to participation and conversion. Thus, the estimated value of the common stock can be determined by estimating the value of its portion of each of these call option rights. The OPM is appropriate to use when the range of possible future outcomes is difficult to predict and thus creates highly speculative forecasts. The OPM backsolve method derives the implied enterprise value of a company from a recent transaction involving our own securities issued on an arms-length basis. Under the PWERM the value is estimated based upon analysis of future values for the enterprise under varying scenarios, probabilities are ascribed to these scenarios based on expected future outcomes. PWERM involves a forward-looking analysis of the possible future outcomes of the enterprise. This method is particularly useful when discrete future outcomes can be predicted at a relatively high confidence level with a probability distribution. Discrete future outcomes considered under the PWERM include an initial public offering scenarios.
After the equity value is determined and allocated to the various classes of shares, a discount for lack of marketability, or DLOM, is applied to arrive at the fair value of common stock. A DLOM is applied based on the theory that as an owner of a private company stock, the stockholder has limited opportunities to sell this stock and any such sale would involve significant transaction costs, thereby reducing overall fair market value.
Following our IPO, the fair value of our common stock has been determined based on the closing price of our common stock on the Nasdaq Global Market.
Preferred Stock Warrant Liability
We issued freestanding warrants to purchase shares of common and preferred stock in connection with our prior debt facilities. We accounted for these warrants as a liability in our consolidated financial statements because the underlying instrument into which the warrants were exercisable contained deemed liquidation provisions that were outside our control.
82
The warrants were recorded at fair value using the Black-Scholes option pricing model. The warrants were re-measured at each financial reporting period with any changes in fair value being recognized as a component of other income (expense), net in the consolidated statements of operations. We adjusted the liability for changes in fair value until the the closing of our initial public offering, at which time certain preferred stock warrants were converted into warrants to purchase common stock and the liability was reclassified to additional paid-in capital.
Common Stock Warrants
We account for warrants for shares of common stock as equity in accordance with the accounting guidance for derivatives. The accounting guidance provides a scope exception from classifying and measuring as a financial liability a contract that would otherwise meet the definition of a derivative if the contract is both (i) indexed to the entity’s own stock and (ii) classified in the stockholders’ deficit section of the consolidated balance sheet. We determined that the warrants for shares of common stock issued in connection with our prior debt facilities. We estimate the fair value of our warrants for shares of common stock by using the Black-Scholes option pricing model. Warrants classified as equity are recorded as additional paid-in-capital on the consolidated balance sheet and no further adjustments to their valuation are made after the issuance of the warrants.
Income Taxes
We account for income taxes under the liability method, whereby deferred tax assets and liabilities are determined based on the difference between the financial statement and tax bases of assets and liabilities using the enacted tax rates in effect for the year in which the differences are expected to affect taxable income. We assess the likelihood that the resulting deferred tax assets will be realized. A valuation allowance is provided when it is more likely than not that some portion or all of a deferred tax asset will not be realized.
As of
December 31, 2018
, we had net operating loss carryforwards of
$135.5 million
and
$109.9 million
available to reduce future taxable income, if any, for federal and state income tax purposes, respectively. If not utilized, our federal and state net operating loss carryforwards begin to expire in
2029
and
2019
, respectively, and valuation allowances have been established, where necessary. We also have research credit carryforwards of approximately
$1.7 million
and
$1.9 million
available to reduce future taxable income, if any, for both federal and California state income tax purposes, respectively. The federal credits begin to expire in
2030
, and the California credits have no expiration date. Realization of these net operating loss and research credit carryforwards could expire unused and be unavailable to reduce future income tax liabilities, which could materially and adversely affect our results of operations.
We did not record a provision or benefit for income taxes during the years ended
December 31, 2018
or
2017
. We continue to maintain a full valuation allowance against our net deferred tax assets.
We assess all material positions taken in any income tax return, including all significant uncertain positions, in all tax years that are still subject to assessment or challenge by relevant taxing authorities. Assessing an uncertain tax position begins with the initial determination of the positions sustainability and is measured at the largest amount of benefit that is greater than fifty percent likely of being realized upon ultimate settlement. As of each balance sheet date, unresolved uncertain tax positions must be reassessed, and we will determine whether (i) the factors underlying the sustainability assertion have changed and (ii) the amount of the recognized tax benefit is still appropriate. The recognition and measurement of tax benefits requires significant judgment. Judgments concerning the recognition and measurement of a tax benefit may change as new information becomes available.
The Tax Reform Act of 1986 limits the use of net operating loss and tax credit carryforwards in certain situations where changes occur in the stock ownership of a company. In general, if we experience a greater than 50 percentage point aggregate change in ownership over a three-year period (a Section 382 ownership change), utilization of our pre-change NOL carryforwards are subject to an annual limitation under Section 382 of the Internal Revenue Code (California has similar laws). The annual limitation generally is determined by multiplying the value of our stock at the time of such ownership change (subject to certain adjustments) by the applicable long-term tax-exempt rate. Such limitations may result in expiration of a portion of the NOL carryforwards before utilization. We have not utilized any NOL carryovers through December 31, 2018. In addition, our deferred tax assets are subject to full valuation allowance, and thus no benefit for deferred tax assets have been recorded. The Company has determined that it experienced Section 382 ownership changes in 2010 and
$1.4 million
of its NOLs are limited. The Company is currently performing an analysis to determine whether any additional NOL carryforwards are limited due to a change in ownership as a result of its recent IPO.
On December 22, 2017, the United States enacted a law commonly known as the Tax Cuts and Jobs Act (“TCJA”) which makes widespread changes to the Internal Revenue Code, including a reduction in the federal corporate tax rate to 21%, effective January 1, 2018.
83
The Company is subject to the provisions of the Financial Accounting Standards Board (“FASB”) ASC 740-10, Income Taxes, which requires that the effect on deferred tax assets and liabilities of a change in tax rates be recognized in the period the tax rate change was enacted. The carrying value of U.S. deferred taxes is determined by the enacted U.S. corporate income tax rate. Consequently, the reduction in the U.S. corporate income tax rate impacts the carrying value of deferred tax assets. Under the new corporate income tax rate of 21%, the U.S. net deferred tax asset position decreased by approximately $15.8 million. Uncertainty regarding the impact of tax reform remains, as a result of factors including future regulatory and rulemaking processes, the prospects of additional corrective or supplemental legislation, potential trade or other litigation, and other factors.
In December 2017, the SEC staff issued Staff Accounting Bulletin No. 118 (“SAB 118”), which provides guidance for the tax effect of the 2017 Tax Act. SAB 118 provides a measurement period that should not extend beyond one year from the 2017 Tax Act’s enactment date for companies to complete the accounting under Accounting Standards Codification Topic 740, Income Taxes (“ASC 740”). In accordance with SAB 118, we must reflect the income tax effects of those aspects of the 2017 Tax Act for which the accounting under ASC 740 is complete. To the extent that its accounting for certain income tax effects of the 2017 Tax Act is incomplete, but we are able to determine a reasonable estimate, we must record a provisional estimate in its consolidated financial statements. If we cannot determine a provisional estimate to be included in its consolidated financial statements, we should continue to apply ASC 740 on the basis of the provisions of the tax laws that were in effect immediately before the enactment of the 2017 Tax Act. It is expected that the U.S. Treasury will issue regulations and other guidance on the application of certain provisions of the 2017 Tax Act. We analyzed the guidance and other necessary information related to the tax effects of the 2017 Tax Act and consider the accounting of our net deferred tax assets complete in accordance with SAB 118.
Off-Balance Sheet Arrangements
Through
December 31, 2018
, we did not have any relationships with unconsolidated organizations or financial partnerships, such as structured finance or special purpose entities that would have been established for the purpose of facilitating off-balance sheet arrangements or other contractually narrow or limited purposes.
Seasonality
Our business is affected by seasonal variations. For instance, we have historically experienced lower sales in the summer months and higher sales in the last quarter of the fiscal year. However, taken as a whole, seasonality does not have a material impact on our financial results.
JOBS Act Accounting Election
In April 2012, the JOBS Act was enacted. Section 107(b) of the JOBS Act provides that an “emerging growth company” can take advantage of the extended transition period provided in Section 7(a)(2)(B) of the Securities Act for complying with new or revised accounting standards. Thus, an emerging growth company can delay the adoption of certain accounting standards until those standards would otherwise apply to private companies. We have elected to avail ourselves of this exemption and, therefore, we will not be subject to the same new or revised accounting standards as other public companies that are not emerging growth companies.
84
Recent Accounting Pronouncements
Recently Adopted Accounting Standards
In July 2015, the FASB issued ASU 2015-11, Inventory (Topic 330): Simplifying the Measurement of Inventory. ASU 2015-11 simplifies the guidance on the subsequent measurement of inventory, excluding inventory measured using last-in, first out or the retail inventory method. Under the new standard, in scope inventory should be measured at the lower of cost and net realizable value. The new standard will become effective for fiscal years, including interim periods within those fiscal years, beginning after December 15, 2016, for public companies. For all other entities, the new standard is effective for fiscal years beginning after December 15, 2016, and interim periods within fiscal years beginning after December 15, 2017, with early adoption permitted. We adopted this standard for the fiscal year ended
December 31, 2017
, which did not have a material impact on our consolidated financial statements.
In November 2015, the FASB issued ASU 2015-17, Balance Sheet Classification of Deferred Taxes. ASU 2015-17 specifies that deferred tax assets and liabilities shall be classified as non-current, or long-term, in a classified statement of financial position. The new standard is effective for public entities for fiscal years beginning after December 15, 2016, and interim periods within those fiscal years. For private entities, the new standard is effective for fiscal years beginning after December 15, 2017, and interim periods within fiscal years beginning after December 15, 2018. Earlier application is permitted for all entities as of the beginning of an interim or an annual reporting period. We early adopted this standard for the fiscal year ended
December 31, 2017
, which did not have a material impact on our consolidated financial statements.
In March 2016, the FASB issued ASU 2016-09, which simplified several aspects of accounting for stock-based compensation transactions. The areas for simplification in this update involve several aspects of the accounting for share-based payment transactions, including the income tax consequences, classification of awards as either equity or liabilities, and classification on the statement of cash flows. The new guidance is effective for public entities for fiscal years beginning after December 15, 2016 and interim periods within those years. Other entities must apply the new guidance in fiscal years beginning after December 15, 2017 and in interim periods within fiscal years beginning after December 15, 2018, with early adoption permitted. We early adopted this standard in the first quarter of 2017 by recording the cumulative impact of applying this guidance to retained earnings, which was not material. We elected to continue to estimate the number of awards that are expected to vest.
In January 2016, the FASB issued ASU 2016-01. Recognition and Measurement of Financial Assets and Financial Liabilities, which amends Accounting Standards Codification, or ASC, Subtopic 825-10, Financial Instruments - Overall, and includes updates on certain aspects of recognition, measurement, presentation and disclosure of financial instruments and applies to all entities that hold financial assets or owe financial liabilities. The new standard is effective for our annual period beginning after December 15, 2018, with early adoption permitted
beginning after December 15, 2017. We have adopted this standard for the fiscal year ending December 31, 2018, which did not have any impact on our consolidated financial statements.
In May 2017, the FASB issued ASU 2017-09, Compensation—Stock Compensation (Topic 718): Scope of Modification Accounting, which clarifies when to account for a change to the terms or conditions of a share-based payment award as a modification. Under the new guidance, modification accounting is required only if the fair value, the vesting conditions, or the classification of the award (as equity or liability) changes as a result of the change in terms or conditions. The standard is effective for all entities for fiscal years, including interim periods within those fiscal years, beginning after December 15, 2017. Early adoption is permitted. We adopted this standard for the fiscal year ending December 31, 2018, which did not have any impact on our consolidated financial statements.
Recently Issued Accounting Standards Not Yet Effective
In May 2014, the Financial Accounting Standards Board (“FASB”) issued Accounting Standards Update (“ASU”) 2014-09, Revenue from Contracts with Customers, which required an entity to recognize the amount of revenue to which it expects to be entitled for the transfer of promised goods or services to customers. ASU 2014-09 will replace most existing revenue recognition guidance in U.S. GAAP when it becomes effective. The new standard is effective for fiscal years beginning after December 15, 2017 for public companies, and for fiscal years beginning after December 15, 2018, and interim periods beginning after December 15, 2019, for private companies. Early application is permitted. The standard permits the use of either the retrospective or cumulative effect transition method. In March 2016, the FASB issued ASU 2016-08, Revenue from Contracts with Customers (Topic 606): Principal versus Agent Considerations (Reporting Revenue Gross versus Net), which clarifies the implementation guidance on principal versus agent considerations in ASU 2014-09. In April 2016, the FASB issued ASU 2016-10, Revenue from Contracts with Customers (Topic 606): Identifying Performance Obligations and Licensing, which clarifies certain aspects of identifying performance obligations and licensing implementation guidance. In May 2016, the FASB issued ASU 2016-12, Revenue from Contracts with Customers (Topic 606): Narrow-Scope Improvements and Practical Expedients, which relates to disclosures of remaining performance obligations, as well as other amendments to guidance on collectability, non-cash consideration and the presentation of sales and other similar taxes collected from customers. These standards have the same effective date and transition date as ASU 2014-09.
85
We continue to evaluate the impacts of adoption of the new standard on its accounting policies, processes, and system requirements and have assigned internal resources, in addition to the engagement of third party service providers, to assist in the evaluation. At this time, as it relates to product sales where our sales representative delivers the product at the point of implantation at hospital or other medical facilities, we expect revenue to continue to be recognized upon completion of the procedure and authorization by the customer. Additionally, the new standard requires the capitalization of costs to obtain a contract, primarily sales commissions, and amortization of these costs over the contract period or estimated customer life. We expect to continue expensing all sales commissions as incurred. Management will adopt the standard using the modified retrospective method for the fiscal year ending December 31, 2019.
In February 2016, the FASB issued its new lease accounting guidance. Under the new guidance, ASU 2016-02, Leases (Topic 842), lessor accounting is largely unchanged. The new lease guidance simplifies the accounting for sale and leaseback transactions primarily because lessees must recognize lease assets and lease liabilities. Under the new guidance, lessees will be required to recognize a lease liability, which is a lessee’s obligation to make lease payments arising from a lease, measured on a discounted basis; and a right-of-use asset, which is an asset that represents the lessee’s right to use, or control use of, a specified asset for the lease term for all leases (with the exception of short-term leases) at the adoption date. The new guidance is effective for fiscal years, and for interim periods within those fiscal years, beginning after December 15, 2018 for public companies and beginning after December 15, 2019 for private companies. Early adoption is permitted for any interim or annual financial statements net yet issued. Lessees (for capital and operating leases) and lessors (for sales-type, direct financing and operating leases) must apply a modified retrospective approach for all leases existing at, or entered into after, the beginning of the earliest comparative period presented in the financial statements. We are currently evaluating the impact of this standard on our consolidated financial statements, and anticipates adopting the standard for the fiscal year ending December 31, 2020.
In August 2016, the FASB issued ASU 2016-15 “Statement of Cash Flows (Topic 230), Classification of Certain Cash Receipts and Cash Payments”. ASU 2016-15 provides guidance on the following eight specific cash flow classification issues: (1) debt prepayment or debt extinguishment costs; (2) settlement of zero-coupon debt instruments or other debt instruments with coupon interest rates that are insignificant in relation to the effective interest rate of the borrowing; (3) contingent consideration payments made after a business combination; (4) proceeds from the settlement of insurance claims; (5) proceeds from the settlement of corporate-owned life insurance policies, including bank-owned life insurance policies; (6) distributions received from equity method investees; (7) beneficial interests in securitization transactions; and (8) separately identifiable cash flows and application of the predominance principle. Current GAAP does not include specific guidance on these eight cash flow classification issues. The amendments of this ASU are effective for reporting periods beginning after December 15, 2017 for public companies, and fiscal years beginning after December 15, 2018 and interim periods within fiscal years beginning after December 15, 2019 for private companies, with early adoption permitted. We are currently evaluating the impact of adopting ASU 2016-15 on our consolidated financial statements, and anticipates adopting the standard for the fiscal year ending December 31, 2019.
In July 2017, the FASB issued ASU 2017-11, Earnings Per Share (Topic 260), Distinguishing Liabilities from Equity (Topic 480), Derivatives and Hedging (Topic 815) I. Accounting for Certain Financial Instruments with Down Round Features II. Replacement of the Indefinite Deferral for Mandatorily Redeemable Financial Instruments of Certain Nonpublic Entities and Certain Mandatorily Redeemable Noncontrolling Interests with a Scope Exception. Part I applies to entities that issue financial instruments such as warrants, convertible debt or convertible preferred stock that contain down-round features. Part II replaces the indefinite deferral for certain mandatorily redeemable noncontrolling interests and mandatorily redeemable financial instruments of nonpublic entities contained within ASC Topic 480 with a scope exception and does not impact the accounting for these mandatorily redeemable instruments. For public business entities, the amendments in Part I of this update are effective for fiscal years, and interim periods within those fiscal years, beginning after December 15, 2018. For all other entities, the amendments in Part I of this Update are effective for fiscal years beginning after December 15, 2019, and interim periods within fiscal years beginning after December 15, 2020. Early adoption is permitted for all entities, including adoption in an interim period. We are currently evaluating the impact that the adoption of this standard will have on our consolidated financial statements, and anticipates adopting the standard for the fiscal year ending December 31, 2020.
In February 2018, the FASB issued ASU 2018-02, Income Statement—Reporting Comprehensive Income (Topic 220). This update provides companies with the option to reclassify stranded tax effects caused by the 2017 Tax Cuts and Jobs Act (the 2017 Tax Act) from accumulated other comprehensive income to retained earnings. This standard is effective for all entities for fiscal years, and interim periods within those fiscal years, beginning after December 15, 2018. Early adoption is permitted. We are currently evaluating the impact that the adoption of this standard will have on our consolidated financial statements, and anticipates adopting the standard for the fiscal year ending December 31, 2019.
In June 2018, the FASB issued ASU 2018-07, Improvements to Nonemployee Share-Based Payment Accounting. ASU 2018-07 expands the scope of Topic 718, Compensation—Stock Compensation, to include share-based payments issued to nonemployees for goods or services. Consequently, the accounting for share-based payments to nonemployees and employees will be substantially aligned. ASU 2018-07 supersedes Subtopic 505-50, Equity—Equity-Based Payments to Non-Employees. For public business entities, the amendments are effective for fiscal years beginning after December 15, 2018, including interim periods within that fiscal year. For all other entities, the amendments are effective for fiscal years beginning after December 15, 2019, and interim periods within fiscal years
86
beginning after December 15, 2020. Early adoption is permitted, but no earlier than a company’s adoption date of ASC 606. We are currently evaluating the impact that the adoption of this standard will have on the consolidated financial statements, and anticipates adopting the standard for the fiscal year ending December 31, 2020.
Item 7A. Quantitative and Qualitative Disclosures about Market Risk
Not applicable to a smaller reporting company.
87
Item 8. Financial Statements and Supplementary Data
SI-BONE, INC.
INDEX TO CONSOLIDATED FINANCIAL STATEMENTS
|
Report of Independent Registered Public Accounting Firm
|
|
|
Consolidated Balance Sheets
|
|
|
Consolidated Statements of Operations and Comprehensive Loss
|
|
|
Consolidated Statements of Changes in Redeemable Convertible Preferred Stock and Stockholders' Equity (Deficit)
|
|
|
Consolidated Statements of Cash Flows
|
|
|
Notes to Consolidated Financial Statements
|
|
88
Report of Independent Registered Public Accounting Firm
To the Board of Directors and Stockholders of SI-BONE, Inc.
Opinion on the Financial Statements
We have audited the accompanying consolidated balance sheets of SI-BONE, Inc. and its subsidiaries (the “Company”) as of December 31, 2018 and 2017, and the related consolidated statements of operations and comprehensive loss, of changes in redeemable convertible preferred stock and stockholders' equity (deficit) and of cash flows for each of the years then ended including the related notes (collectively referred to as the “consolidated financial statements”). In our opinion, the consolidated financial statements present fairly, in all material respects, the financial position of the Company as of December 31, 2018 and 2017, and the results of its operations and its cash flows for each of the years then ended in conformity with accounting principles generally accepted in the United States of America.
Basis for Opinion
These consolidated financial statements are the responsibility of the Company’s management. Our responsibility is to express an opinion on the Company’s consolidated financial statements based on our audits. We are a public accounting firm registered with the Public Company Accounting Oversight Board (United States) (PCAOB) and are required to be independent with respect to the Company in accordance with the U.S. federal securities laws and the applicable rules and regulations of the Securities and Exchange Commission and the PCAOB.
We conducted our audits of these consolidated financial statements in accordance with the standards of the PCAOB. Those standards require that we plan and perform the audit to obtain reasonable assurance about whether the consolidated financial statements are free of material misstatement, whether due to error or fraud.
Our audits included performing procedures to assess the risks of material misstatement of the consolidated financial statements, whether due to error or fraud, and performing procedures that respond to those risks. Such procedures included
examining, on a test basis, evidence regarding the amounts and disclosures in the consolidated financial statements. Our audits also included evaluating the accounting principles used and significant estimates made by management, as well as evaluating the overall presentation of the consolidated financial statements. We believe that our audits provide a reasonable basis for our opinion.
/s/PricewaterhouseCoopers LLP
San Jose, California
March 14, 2019
We have served as the Company's auditor since 2013.
89
SI-BONE, INC.
CONSOLIDATED BALANCE SHEETS
(In thousands, except share and per share amounts)
|
December 31,
|
December 31,
|
||||||
|
2018
|
2017
|
||||||
|
ASSETS
|
|||||||
|
CURRENT ASSETS
|
|||||||
|
Cash and cash equivalents
|
$
|
25,120
|
|
$
|
22,408
|
|
|
|
Short-term investments
|
97,103
|
|
—
|
|
|||
|
Accounts receivable, net of allowance for doubtful accounts of $263 and $268 at December 31, 2018 and 2017, respectively
|
8,486
|
|
7,416
|
|
|||
|
Inventory
|
3,343
|
|
2,553
|
|
|||
|
Prepaid expenses and other current assets
|
1,990
|
|
1,252
|
|
|||
|
Total current assets
|
136,042
|
|
33,629
|
|
|||
|
Property and equipment, net
|
2,154
|
|
1,896
|
|
|||
|
Other non-current assets
|
325
|
|
309
|
|
|||
|
TOTAL ASSETS
|
$
|
138,521
|
|
$
|
35,834
|
|
|
|
LIABILITIES, REDEEMABLE CONVERTIBLE PREFERRED STOCK AND STOCKHOLDERS’ EQUITY (DEFICIT)
|
|||||||
|
CURRENT LIABILITIES
|
|||||||
|
Accounts payable
|
$
|
2,146
|
|
$
|
1,814
|
|
|
|
Accrued liabilities and other
|
6,860
|
|
5,724
|
|
|||
|
Total current liabilities
|
9,006
|
|
7,538
|
|
|||
|
Redeemable convertible preferred stock warrants
|
—
|
|
422
|
|
|||
|
Long-term borrowings
|
38,963
|
|
38,704
|
|
|||
|
Other long-term liabilities
|
360
|
|
—
|
|
|||
|
TOTAL LIABILITIES
|
48,329
|
|
46,664
|
|
|||
|
Commitments and contingencies (Note 6)
|
|
|
|||||
|
Redeemable convertible preferred stock, $0.0001 par value;
|
|||||||
|
Authorized: 0 and 12,104,749 shares at December 30, 2018 and December 31, 2017; issued and outstanding: 0 and 11,871,578 shares at December 30, 2018 and December 31, 2017; (Liquidation preference of $0 and $119,194 at December 30, 2018 and December 31, 2017).
|
—
|
|
118,548
|
|
|||
|
STOCKHOLDERS’ EQUITY (DEFICIT)
|
|||||||
|
Preferred stock, $0.0001 par value; Authorized: 5,000,000 and 0 shares at December 31, 2018 and 2017, respectively; no shares issued and outstanding as of December 31, 2018 and 2017.
|
—
|
|
—
|
|
|||
|
Common stock, $0.0001 par value; Authorized: 100,000,000 and 19,333,333 shares at December 31, 2018 and 2017, respectively; issued and outstanding: 24,450,757 and 3,603,140 shares, at December 31, 2018 and 2017, respectively.
|
3
|
|
1
|
|
|||
|
Additional paid-in capital
|
246,927
|
|
9,943
|
|
|||
|
Accumulated other comprehensive income
|
439
|
|
402
|
|
|||
|
Accumulated deficit
|
(157,177
|
)
|
(139,724
|
)
|
|||
|
TOTAL STOCKHOLDERS’ EQUITY (DEFICIT)
|
90,192
|
|
(129,378
|
)
|
|||
|
TOTAL LIABILITIES, REDEEMABLE CONVERTIBLE PREFERRED STOCK AND STOCKHOLDERS’ EQUITY (DEFICIT)
|
$
|
138,521
|
|
$
|
35,834
|
|
|
The accompanying notes are an integral part of these consolidated financial statements.
90
SI-BONE, INC.
CONSOLIDATED STATEMENTS OF OPERATIONS AND COMPREHENSIVE LOSS
(In thousands, except share and per share amounts)
|
Year ended
December 31, |
||||||||
|
2018
|
2017
|
|||||||
|
Revenue
|
$
|
55,380
|
|
$
|
47,983
|
|
||
|
Cost of goods sold
|
4,833
|
|
5,112
|
|
||||
|
Gross profit
|
50,547
|
|
42,871
|
|
||||
|
Operating expenses:
|
||||||||
|
Sales and marketing
|
44,497
|
|
41,646
|
|
||||
|
Research and development
|
5,376
|
|
5,513
|
|
||||
|
General and administrative
|
12,639
|
|
13,062
|
|
||||
|
Total operating expenses
|
62,512
|
|
60,221
|
|
||||
|
Loss from operations
|
(11,965
|
)
|
(17,350
|
)
|
||||
|
Interest and other income (expense), net:
|
||||||||
|
Interest income
|
769
|
|
175
|
|
||||
|
Interest expense
|
(5,108
|
)
|
(6,204
|
)
|
||||
|
Other income (expense), net
|
(1,149
|
)
|
340
|
|
||||
|
Net loss
|
(17,453
|
)
|
(23,039
|
)
|
||||
|
Other comprehensive income:
|
||||||||
|
Unrealized gain of marketable securities
|
10
|
|
—
|
|
||||
|
Changes in foreign currency translation
|
27
|
|
(70
|
)
|
||||
|
Comprehensive loss
|
$
|
(17,416
|
)
|
$
|
(23,109
|
)
|
||
|
Net loss per share, basic and diluted
|
$
|
(2.20
|
)
|
$
|
(6.65
|
)
|
||
|
Weighted-average number of common shares used to compute basic and diluted net loss per share
|
7,950,284
|
|
3,467,096
|
|
||||
The accompanying notes are an integral part of these consolidated financial statements.
91
SI-BONE, INC.
CONSOLIDATED STATEMENTS OF CHANGES IN REDEEMABLE CONVERTIBLE PREFERRED STOCK AND STOCKHOLDERS' EQUITY (DEFICIT)
(In thousands, except share amounts)
|
Redeemable
Convertible Preferred Stock |
Common Stock
|
Additional
Paid-in Capital |
Stockholders’
Notes Receivable |
Accumulated
Other Comprehensive Income (Loss) |
Accumulated
Deficit |
Total
Stockholders’ Equity (Deficit) |
||||||||||||||||||||
|
Shares
|
Amount
|
Shares
|
Amount
|
|||||||||||||||||||||||
|
December 31, 2016
|
11,330,704
|
|
113,121
|
|
3,446,137
|
|
1
|
|
8,000
|
|
(521
|
)
|
472
|
|
(116,685
|
)
|
(108,733
|
)
|
||||||||
|
Issuance of common stock upon exercise of stock options
|
—
|
|
—
|
|
152,691
|
|
—
|
|
383
|
|
—
|
|
—
|
|
—
|
|
383
|
|
||||||||
|
Issuance of common stock upon exercise of unvested stock options
|
—
|
|
—
|
|
4,312
|
|
—
|
|
—
|
|
—
|
|
—
|
|
—
|
|
—
|
|
||||||||
|
Stock-based compensation
|
—
|
|
—
|
|
—
|
|
—
|
|
1,438
|
|
—
|
|
—
|
|
—
|
|
1,438
|
|
||||||||
|
Issuance of redeemable convertible preferred stock, net of issuance costs
|
540,874
|
|
5,427
|
|
—
|
|
—
|
|
—
|
|
—
|
|
—
|
|
—
|
|
—
|
|
||||||||
|
Repayment of stockholders’ notes receivable
|
—
|
|
—
|
|
—
|
|
—
|
|
—
|
|
84
|
|
—
|
|
—
|
|
84
|
|
||||||||
|
Forgiveness of stockholders’ note receivable
|
—
|
|
—
|
|
—
|
|
—
|
|
—
|
|
437
|
|
—
|
|
—
|
|
437
|
|
||||||||
|
Vesting of early exercised stock options
|
—
|
|
—
|
|
—
|
|
—
|
|
122
|
|
—
|
|
—
|
|
—
|
|
122
|
|
||||||||
|
Foreign currency translation
|
—
|
|
—
|
|
—
|
|
—
|
|
—
|
|
—
|
|
(70
|
)
|
—
|
|
(70
|
)
|
||||||||
|
Net loss
|
—
|
|
—
|
|
—
|
|
—
|
|
—
|
|
—
|
|
—
|
|
(23,039
|
)
|
(23,039
|
)
|
||||||||
|
December 31, 2017
|
11,871,578
|
|
118,548
|
|
3,603,140
|
|
1
|
|
9,943
|
|
—
|
|
402
|
|
(139,724
|
)
|
(129,378
|
)
|
||||||||
|
Issuance of common stock upon exercise of stock options
|
—
|
|
—
|
|
289,077
|
|
—
|
|
1,136
|
|
—
|
|
—
|
|
—
|
|
1,136
|
|
||||||||
|
Issuance of common stock upon exercise of unvested stock options
|
—
|
|
—
|
|
106,028
|
|
—
|
|
—
|
|
—
|
|
—
|
|
—
|
|
—
|
|
||||||||
|
Conversion from preferred stock to common stock
|
(11,871,578
|
)
|
(118,548
|
)
|
12,066,654
|
|
1
|
|
118,547
|
|
—
|
|
—
|
|
—
|
|
118,548
|
|
||||||||
|
Conversion from preferred stock warrants to common stock warrants
|
1,248
|
|
1,248
|
|
||||||||||||||||||||||
92
|
Issuance of common stock from warrants exercise
|
—
|
|
—
|
|
121,486
|
|
—
|
|
—
|
|
—
|
|
—
|
|
—
|
|
—
|
|
||||||||
|
Issuance of common stock from IPO Proceeds, net
|
—
|
|
—
|
|
8,280,000
|
|
1
|
|
113,602
|
|
—
|
|
—
|
|
—
|
|
113,603
|
|
||||||||
|
Repurchase of unvested early exercised stock options
|
—
|
|
—
|
|
(15,628
|
)
|
—
|
|
—
|
|
—
|
|
—
|
|
—
|
|
—
|
|
||||||||
|
Stock-based compensation
|
—
|
|
—
|
|
—
|
|
—
|
|
2,312
|
|
—
|
|
—
|
|
—
|
|
2,312
|
|
||||||||
|
Vesting of early exercised stock options
|
—
|
|
—
|
|
—
|
|
—
|
|
139
|
|
—
|
|
—
|
|
—
|
|
139
|
|
||||||||
|
Foreign currency translation
|
—
|
|
—
|
|
—
|
|
—
|
|
—
|
|
—
|
|
27
|
|
—
|
|
27
|
|
||||||||
|
Unrealized gain of marketable securities
|
10
|
|
10
|
|
||||||||||||||||||||||
|
Net loss
|
—
|
|
—
|
|
—
|
|
—
|
|
—
|
|
—
|
|
—
|
|
(17,453
|
)
|
(17,453
|
)
|
||||||||
|
December 31, 2018
|
—
|
|
—
|
|
24,450,757
|
|
3
|
|
246,927
|
|
—
|
|
439
|
|
(157,177
|
)
|
90,192
|
|
||||||||
The accompanying notes are an integral part of these consolidated financial statements.
93
SI-BONE, INC.
CONSOLIDATED STATEMENTS OF CASH FLOWS
(In thousands)
|
Year ended
December 31, |
|||||||
|
2018
|
2017
|
||||||
|
Cash flows from operating activities
|
|||||||
|
Net loss
|
$
|
(17,453
|
)
|
$
|
(23,039
|
)
|
|
|
Adjustments to reconcile net loss to net cash used in operating activities
|
|||||||
|
Depreciation and amortization
|
722
|
|
1,013
|
|
|||
|
Change in allowance for doubtful accounts
|
(5
|
)
|
(36
|
)
|
|||
|
Stock-based compensation
|
2,312
|
|
1,438
|
|
|||
|
Change in fair value of redeemable convertible preferred stock warrants
|
826
|
|
(166
|
)
|
|||
|
Loss on write-off of property and equipment
|
52
|
|
214
|
|
|||
|
Write-off of debt discount
|
—
|
|
650
|
|
|||
|
Amortization of debt discount
|
259
|
|
285
|
|
|||
|
Write-off of public offering costs
|
—
|
|
1,292
|
|
|||
|
Forgiveness of notes receivable
|
—
|
|
437
|
|
|||
|
Short-term investments accretion
|
(209
|
)
|
—
|
|
|||
|
Changes in operating assets and liabilities
|
|||||||
|
Accounts receivable
|
(1,023
|
)
|
(1,313
|
)
|
|||
|
Inventory
|
(759
|
)
|
(980
|
)
|
|||
|
Prepaid expenses and other assets
|
(752
|
)
|
72
|
|
|||
|
Accounts payable
|
251
|
|
811
|
|
|||
|
Accrued liabilities and other
|
1,260
|
|
1,792
|
|
|||
|
Net cash used in operating activities
|
(14,519
|
)
|
(17,530
|
)
|
|||
|
Cash flows from investing activities
|
|||||||
|
Purchase of property and equipment
|
(942
|
)
|
(478
|
)
|
|||
|
Purchase of short-term investments
|
(96,883
|
)
|
—
|
|
|||
|
Net cash used in investing activities
|
(97,825
|
)
|
(478
|
)
|
|||
|
Cash flows from financing activities
|
|||||||
|
Proceeds from initial public offering, net of underwriting discounts and commissions
|
115,506
|
|
—
|
|
|||
|
Proceeds from the exercise of common stock options, net
|
1,614
|
|
383
|
|
|||
|
Repurchase of common stock
|
(73
|
)
|
—
|
|
|||
|
Repayment of stockholders’ notes receivable
|
—
|
|
84
|
|
|||
|
Repayment of debt financing
|
—
|
|
(1,119
|
)
|
|||
|
Extinguishment of debt financing
|
—
|
|
(29,081
|
)
|
|||
|
Proceeds from debt financing
|
—
|
|
40,000
|
|
|||
|
Payment of debt issuance costs
|
—
|
|
(1,540
|
)
|
|||
|
Proceeds from the issuance of redeemable convertible preferred stock, net
|
—
|
|
5,427
|
|
|||
|
Payments of public offering costs
|
(1,897
|
)
|
(1,292
|
)
|
|||
|
Net cash provided by financing activities
|
115,150
|
|
12,862
|
|
|||
|
Effect of exchange rate changes on cash and cash equivalents
|
(94
|
)
|
(346
|
)
|
|||
|
Net decrease in cash and cash equivalents
|
$
|
2,712
|
|
$
|
(5,492
|
)
|
|
|
Cash and cash equivalents at
|
|||||||
|
Beginning of period
|
22,408
|
|
27,900
|
|
|||
|
End of period
|
$
|
25,120
|
|
$
|
22,408
|
|
|
|
Supplemental disclosure of cash flow information
|
|||||||
|
Cash paid for interest
|
$
|
5,500
|
|
$
|
4,514
|
|
|
|
Supplemental disclosure of non-cash information
|
|||||||
|
Conversion of redeemable convertible preferred stock to common stock
|
$
|
118,547
|
|
$
|
—
|
|
|
94
|
Year ended
December 31, |
|||||||
|
Conversion of preferred stock warrants to common stock warrants
|
$
|
1,248
|
|
$
|
—
|
|
|
|
Vesting of early exercised stock options
|
$
|
139
|
|
$
|
122
|
|
|
|
Purchases of property and equipment included in accounts payable and accrued liabilities
|
$
|
82
|
|
$
|
97
|
|
|
|
Public offering costs included in accounts payable and accrued liabilities
|
$
|
7
|
|
$
|
—
|
|
|
The accompanying notes are an integral part of these consolidated financial statements.
95
SI-BONE, INC.
NOTES TO CONSOLIDATED FINANCIAL STATEMENTS
SI-BONE, INC.
NOTES TO CONSOLIDATED FINANCIAL STATEMENTS
1. The Company and Nature of Business
SI-BONE, Inc. (the “Company”) was incorporated in the state of Delaware on March 18, 2008 and is headquartered in Santa Clara, California. The Company is a medical device company that has pioneered a proprietary minimally invasive surgical implant system to fuse the sacroiliac joint for treatment of the most common types of sacroiliac joint disorders that cause lower back pain. The Company introduced its iFuse Implant System, or iFuse, in 2009 in the United States, in 2010 in certain countries in the European Union, and in 2015 in certain countries in the rest of the world.
Reverse Stock Split
In October 2018, the Company's board of directors and stockholders approved a 1-for-18 reverse stock split of the Company's common stock and redeemable convertible preferred stock, which was effected on October 4, 2018. The par value of the common stock and redeemable convertible preferred stock was not adjusted as a result of the reverse split. All issued and outstanding share and per share amounts of common stock, redeemable convertible preferred stock, stock options, and warrants included in the accompanying consolidated financial statements have been adjusted to reflect this reverse stock split for all periods presented.
Initial Public Offering
On October 16, 2018, the Company’s Registration Statement on Form S-1 (File No. 333-227445) relating to the initial public offering (IPO) of its common stock was declared effective by the Securities and Exchange Commission (SEC). Pursuant to such Registration Statement, the Company sold
8,280,000
shares at an initial public offering price of
$15.00
per share for net proceeds of
$113.6 million
to the Company, net of underwriting discounts and commissions and offering costs.
In connection with the IPO, the Company's outstanding shares of redeemable convertible preferred stock were automatically converted into an aggregate of
12,066,654
shares of common stock, and the Company's outstanding warrants to purchase
156,550
shares of redeemable convertible preferred stock were automatically converted into warrants to purchase an aggregate of
160,657
shares of common stock, resulting in reclassification of the related redeemable convertible preferred stock warrant liability of
$1.2 million
in additional paid-in-capital.
2. Summary of Significant Accounting Policies
Basis of Presentation and Principles of Consolidation
The accompanying consolidated financial statements have been prepared in accordance with generally accepted accounting principles in the United States of America (“U.S. GAAP”). The consolidated financial statements include the Company's accounts, as well as those of the Company's wholly-owned international subsidiaries. All inter-company accounts and transactions have been eliminated.
Use of Estimates
The preparation of financial statements in conformity with accounting principles generally accepted in the United States of America requires management to make estimates and assumptions that affect the reported amounts of assets and liabilities and disclosure of contingent assets and liabilities as of the date of the financial statements and the reported amounts of revenue and expenses during the reporting period. Significant accounting estimates and management judgments reflected in the consolidated financial statements include: fair value of assets and liabilities; analysis of the allowance for doubtful accounts; inventory valuation; valuation of deferred tax assets, including related valuation allowances; fair value of common stock and redeemable convertible preferred stock warrants; stock-based compensation; and useful lives of long-lived assets. Estimates are based on historical experience, where applicable and other assumptions believed to be reasonable by the management. Actual results could differ from those estimates.
96
SI-BONE, INC.
NOTES TO CONSOLIDATED FINANCIAL STATEMENTS
JOBS Act Accounting Election
As an emerging growth company under the Jumpstart Our Business Startups Act of 2012, or the JOBS Act, the Company is eligible to take advantage of certain exemptions from various reporting requirements that are applicable to other public companies that are not emerging growth companies. The Company has elected to take advantage of the extended transition period for adopting new or revised accounting standards that have different effective dates for public and private companies until such time as those standards apply to private companies.
Segments
The chief operating decision makers for the Company are the Chief Executive Officer and Chief Financial Officer. The Chief Executive Officer and the Chief Financial Officer review financial information presented on a consolidated basis, accompanied by information about revenue by geographic region, for purposes of evaluating financial performance. The Company has one business activity and there are no segment managers who are held accountable for operations, operating results or plans for levels or components below the consolidated unit level. Accordingly, the Company has determined that it has a single reportable and operating segment structure.
The Company derives substantially all of its revenue from sales to customers in the United States. Revenue by geography is based on billing address of the customer. No single country outside the United States accounts for more than 10% of the total revenue during the periods presented. Long-lived assets held outside the United States are immaterial. Following table summarizes the Company's revenue by geography (in thousands):
|
Year ended December 31,
|
|||||||
|
2018
|
2017
|
||||||
|
Domestic
|
$
|
50,137
|
|
$
|
43,351
|
|
|
|
International
|
5,243
|
|
4,632
|
|
|||
|
$
|
55,380
|
|
$
|
47,983
|
|
||
Foreign Currency
The Company’s foreign subsidiaries use local currency as their functional currency. Assets and liabilities are translated at exchange rates prevailing at the balance sheet dates. Revenue, costs and expenses are translated into U.S. dollars using average exchange rates for the period. Gains and losses resulting from the translation of the Company’s consolidated balance sheets are recorded as a component of accumulated other comprehensive income. Gains and losses from foreign currency transactions are recognized as a component of other income (expense), net.
Concentration of Credit Risk
Financial instruments that potentially subject the Company to a concentration of credit risk consist of cash and cash equivalents. The Company’s cash and cash equivalents are deposited with financial institutions in the United States and in Europe; the majority of the Company’s cash and cash equivalents are deposited with a single financial institution in the United States. Deposits in this institution exceed the amount of insurance provided on such deposits. The Company has not experienced any losses on its deposits of cash and cash equivalents.
The Company’s revenue and accounts receivable are spread across a large number of customers, primarily in the United States, and no one customer accounts for more than 10% of total revenue or gross accounts receivable in any period presented.
Other Risks and Uncertainties
The Company is subject to risks common to medical device companies including, but not limited to, new technological innovations, dependence on key personnel, protection of proprietary technology, compliance with government regulations, product liability, the ability to obtain adequate coverage and reimbursement from third-party payors, uncertainty of market acceptance of products, and the need to obtain additional financing.
The Company is dependent on third-party manufacturers and suppliers, in some cases single source suppliers. The Company currently has limited long term contracts with its key suppliers and is subject to risks such as manufacturing failures, non-compliance with regulatory requirements, price fluctuations, inability to properly meet demand and third-party supplier discontinuation of operations.
97
SI-BONE, INC.
NOTES TO CONSOLIDATED FINANCIAL STATEMENTS
Liquidity
As of and for the year ended December 31, 2018, the Company had an accumulated deficit of
$157.2 million
and used
$14.5 million
of cash in operations. The Company has not achieved positive cash flow from operations to date. As of
December 31, 2018
, we had cash and cash equivalents of
$25.1 million
and short-term investments of
$97.1 million
. The Company held cash and cash equivalents of
$22.4 million
as of December 31, 2017.
The Company’s primary cash needs are for the ongoing commercialization of its iFuse products. The Company also has certain debt covenants associated with its current debt agreement. These covenants include a
$5.0 million
minimum cash balance and revenue targets, which if not met would result in the debt becoming immediately due. The revenue target is assessed quarterly based on the rolling twelve months of revenue, and increases by approximately
2%
-
4%
each quarter. Beginning with the three months ended March 31, 2019, the Company is required to meet either revenue or earnings targets. The Company has met the minimum liquidity and revenue targets as of December 31, 2018; however there can be no assurances that the Company will continue to meet these targets in the future.
Based upon the Company's current operating plan, the Company believes that its existing cash, cash equivalents and short-term investments will enable the Company to fund its operating expenses and capital expenditure requirements through at least the next 12 months. The Company continues to face challenges and uncertainties and, as a result, its available capital resources may be consumed more rapidly than currently expected due to: (a) decreases in sales of our products and the uncertainty of future revenues from new products; (b) changes that the Company may make to the business that affect ongoing operating expenses; (c) changes that the Company may make in its business strategy; (d) regulatory developments affecting the Company's existing products; (e) changes that the Company may make in its research and development spending plans; and (f) other items affecting the Company's forecasted level of expenditures and use of cash resources.
Fair Value of Financial Instruments
Carrying amounts of certain of the Company’s financial instruments, including cash equivalents, short-term investments, accounts receivable, accounts payable, and accrued liabilities, approximate fair value due to their relatively short maturities and market interest rates, if applicable. The carrying value of the Company’s long-term debt also approximates fair value based on management’s estimation that a current interest rate would not differ materially from the stated rate. The carrying amount of the redeemable convertible preferred stock warrants has been marked to fair value such that the carrying amount represents its estimated fair value.
The Company discloses and recognizes the fair value of its assets and liabilities using a hierarchy that prioritizes the inputs to valuation techniques used to measure fair value. Fair value is an exit price, representing the amount that would be received to sell an asset or paid to transfer a liability in an orderly transaction between market participants. As such, fair value is a market-based measurement that should be determined based on assumptions that market participants would use in pricing an asset or liability. As a basis for considering such assumptions, a three-tier value hierarchy has been established, which prioritizes the inputs used in measuring fair value as follows:
Level 1: Quoted prices (unadjusted) in active market that are accessible at measurement date for assets or liabilities. The fair value hierarchy gives the highest priority to Level 1 inputs.
Level 2: Observable prices that are based on inputs not quoted on active markets, but corroborated by market data.
Level 3: Unobservable inputs are used when little or no market data is available. The fair value hierarchy gives the lowest priority to Level 3 inputs.
Assets and liabilities measured at fair value are classified in their entirety based on the lowest level of input that is significant to the fair value measurement. The Company’s assessment of the significance of a particular input to the fair value measurement in its entirety requires management to make judgments and considers factors specific to the asset or liability.
The Company’s cash equivalents consist of money market funds as of
December 31, 2018
and
December 31, 2017
. The money market funds are classified as Level 1 of the fair value hierarchy. The Company's marketable securities are classified as Level 1 or Level 2 of the fair value hierarchy. The Company’s redeemable convertible preferred stock warrants are classified within Level 3 of the fair value hierarchy. The redeemable convertible preferred stock warrants have been valued using a Black-Scholes valuation model and are subsequently marked to fair value at each reporting period.
Cash and Cash Equivalents
The Company considers all highly liquid investments with remaining maturities at the date of purchase of three months or less to be cash equivalents.
98
SI-BONE, INC.
NOTES TO CONSOLIDATED FINANCIAL STATEMENTS
Marketable Securities
The Company's marketable securities primarily consist of investments in U.S. treasury securities, corporate bonds, and commercial paper. We classify our marketable securities as available-for-sale at the time of purchase and reevaluate such classification as of each balance sheet date. Based upon maturity dates, all marketable securities as available for use in current operations, and therefore we classify these securities as current assets in the accompanying consolidated balance sheets. All marketable securities are recorded at their estimated fair value. Unrealized gains and losses on available-for-sale securities are recorded in Accumulated other comprehensive income (loss) ("OCI"). We evaluate our investments to assess whether those in unrealized loss positions are other-than-temporarily impaired. The Company considers impairments to be other-than-temporary if they are related to deterioration in credit risk or if it is likely we will sell the securities before the recovery of their cost basis. Realized gains and losses and declines in value judged to be other-than-temporary are determined based on the specific identification method and are reported in Other income (expense), net on the consolidated statements of operations.
If quoted prices for identical instruments are available in an active market, marketable securities are classified within Level 1 of the fair value hierarchy. If quoted prices for identical instruments in active markets are not available, fair values are estimated using quoted prices of similar instruments and are classified within Level 2 of the fair value hierarchy. To date, all of the Company's marketable securities can be valued using one of these two methodologies.
Accounts Receivable and Allowance for Doubtful Accounts
Accounts receivable are recorded at the invoiced amount and do not bear interest. The Company generally does not require collateral or other security in support of accounts receivable. Allowances are provided for individual accounts receivable when the Company becomes aware of a customer’s inability to meet its financial obligations, such as in the case of bankruptcy, deterioration in the customer’s operating results or change in financial position. If circumstances related to customers change, estimates of the recoverability of receivables would be further adjusted. The Company also considers broad factors in evaluating the sufficiency of its allowance for doubtful accounts, including the length of time receivables are past due, significant one-time events, creditworthiness of customers and historical experience. Account balances are charged off against the allowance after all means of collection have been exhausted and the potential for recovery is considered remote.
Inventory
Inventory is stated at lower of cost or net realizable value. The Company establishes the inventory basis by determining the cost based on standard costs approximating the purchase costs on a first-in, first-out basis. The excess and obsolete inventory is estimated based on future demand and market conditions. Inventory write-downs are charged to cost of goods sold. As of
December 31, 2018
and
December 31, 2017
, inventory consisted entirely of finished goods.
Property and Equipment
Property and equipment are stated at cost less accumulated depreciation and amortization. All property and equipment is depreciated on a straight-line basis over the estimated useful lives of the assets, which are as follows:
|
Computer and office equipment
|
3 – 5 years
|
|
Machinery and equipment
|
3 – 5 years
|
|
Furniture and fixtures
|
7 years
|
Leasehold improvements are amortized over the lesser of their useful lives or the life of the lease. Upon sale or retirement of the assets, the cost and related accumulated depreciation are removed from the consolidated balance sheet and the resulting gain or loss is recognized in the consolidated statement of operations. Maintenance and repairs are charged to operations as incurred.
Impairment of Long-Lived Assets
The Company reviews long-lived assets for impairment whenever events or changes in circumstances indicate that the carrying amount of an asset might not be recoverable. When such an event occurs, management determines whether there has been an impairment by comparing the anticipated undiscounted future net cash flows to the related asset’s carrying value. If an asset is considered impaired, the asset is written down to fair value, which is determined based either on discounted cash flows or appraised value, depending on the nature of the asset. Through
December 31, 2018
and
December 31, 2017
, the Company has not experienced impairment losses on its long-lived assets.
99
SI-BONE, INC.
NOTES TO CONSOLIDATED FINANCIAL STATEMENTS
Public Offering Costs
Specific incremental costs (i.e. consisting of legal, accounting and other fees and costs) directly attributable to a proposed or actual offering of securities may properly be deferred and charged against the gross proceeds of the offering. In the event a planned IPO does not occur or is significantly delayed, all of the costs will be expensed. There were
no
capitalized offering costs as of
December 31, 2018
and
2017
included in other non-current assets on the consolidated balance sheets. Costs incurred and capitalized during the year ended
December 31, 2018
amounting to
$1.9 million
were transferred to additional paid-in capital upon completion of the IPO on October 16, 2018. Offering costs of
$1.3 million
were also incurred and expensed in the
December 31, 2017
, as a result of delays in the IPO process during the period.
Common Stock Warrants
The Company accounts for warrants for shares of common stock as equity in accordance with the accounting guidance for derivatives. The accounting guidance provides a scope exception from classifying and measuring as a financial liability a contract that would otherwise meet the definition of a derivative if the contract is both (i) indexed to the entity’s own stock and (ii) classified in the stockholders’ deficit section of the consolidated balance sheet. The Company determined that the warrants for shares of common stock issued in connection with its prior debt arrangements are required to be classified in equity. Warrants classified as equity are recorded as additional paid-in capital on the consolidated balance sheet and no further adjustments to their valuation are made.
Redeemable Convertible Preferred Stock Warrants
Warrants and other similar instruments related to shares that are contingently redeemable are classified as liabilities on the consolidated balance sheet at their estimated fair value because the shares underlying the warrants may obligate the Company to transfer assets to the holders at a future date under certain circumstances such as a deemed liquidation event. The warrants are exercisable into the Company’s redeemable convertible preferred stock and are classified as liabilities on the consolidated balance sheet. The warrants, measured at fair value, are subject to re-measurement at each balance sheet date and the change in fair value, if any, is recognized as other income (expense), net. The Company adjusted the liability for changes in fair value until the the closing of our initial public offering, at which time certain preferred stock warrants were converted into warrants to purchase common stock and the liability was reclassified to additional paid-in capital.
The Company estimated the fair value of these liabilities using option pricing models and assumptions that were based on the individual characteristics of the warrants on the valuation date, as well as assumptions for future financings, expected volatility, expected life, yield, and risk-free interest rate.
Revenue Recognition
The Company’s revenue is derived from the sale of its products to medical groups and hospitals through its direct sales force and distributors throughout the United States and Europe.
In accordance with ASC Topic 605, Revenue Recognition (“ASC 605”), the Company recognizes revenue when persuasive evidence of an arrangement exists, title and risk of loss has transferred to the customer, the sales price is fixed or determinable, and collectability is reasonably assured. For the majority of product sales where the Company’s sales representative delivers the product at the point of implantation at hospitals or other medical facilities, the Company recognizes revenue related to product sales upon completion of the procedure and authorization by the customer. Revenue is recognized upon receipt of a purchase agreement or agreement on pricing terms with the customer and when all other revenue recognition criteria are met. For the remaining sales, which include distributor and hospital sales where the product is ordered in advance of a procedure and a valid purchase order has been received, the Company recognizes revenue based upon shipping or delivery terms, which represents the point in time when the customer has taken ownership and assumed risk of loss and the required revenue recognition criteria are met. Such customers are obligated to pay within specified terms regardless of when or if they ever sell or use the products, and the Company has no post-delivery obligations.
Warranty Program
In January 2017, the Company implemented a warranty program which provides a purchaser a one-time replacement of any iFuse implant at no additional cost for a revision procedure within a
one
-year period following the original procedure and is accounted for as a warranty accrual. The Company also provides a purchaser with a one-time credit equal to the purchase price paid for use on future purchases for any revision procedure within the
one
-year period following an original procedure where an implant is not required. These one-time credits are accounted for as sales reserves. Sales and warranty reserves from the warranty program were immaterial as of both
December 31, 2018
and
2017
.
100
SI-BONE, INC.
NOTES TO CONSOLIDATED FINANCIAL STATEMENTS
Medical Device Excise Tax
In accordance with the Patient Protection and Affordable Care Act, effective January 1, 2013, the Company began to incur an excise tax on sales of medical devices in the United States. The medical device excise tax is included in cost of goods sold in the consolidated statements of operations and comprehensive loss for all the periods presented. Effective December 2015, the Act was amended to include a provision to suspend the tax on medical devices through 2017. In January 2018, the suspension on the tax on medical devices was further extended through 2019.
Shipping and Handling Costs
Shipping and handling costs are expensed as incurred and are included in cost of goods sold.
Research and Development
Research and development costs are charged to operations as incurred and consist of costs incurred by the Company for the development of the Company’s product which include (1) employee-related expenses, including salaries, benefits, travel and non-cash stock-based compensation expense (2) external research and development expenses (3) other expenses, which include direct and allocated expenses for facilities and other costs.
Advertising Expenditures
The cost of advertising is included in Sales and Marketing expense in the consolidated financial statements and expensed as incurred. Advertising costs totaled
$0.7
million and
$0.8
million for the
year ended
December 31, 2018
and
2017
, respectively.
Stock-Based Compensation
The Company measures its stock-based awards made to employees based on the estimated fair values of the awards as of the grant date using the Black-Scholes option-pricing model. The model requires management to make a number of assumptions including expected volatility, expected life, risk-free interest rate and expected dividends. Stock-based compensation expense is recognized over the requisite service period using the straight-line method and is based on the value of the portion of stock-based payment awards that is ultimately expected to vest. As such, the Company’s stock-based compensation is reduced for the estimated forfeitures at the date of grant and revised, if necessary, in subsequent periods if actual forfeitures differ from those estimates.
Equity instruments issued to nonemployees are recorded at their fair value on the measurement date and are subject to periodic adjustments as the underlying equity instruments vest. The Company believes that the estimated fair value of the stock options is more readily measurable than the fair value of the services received. Stock-based compensation related to stock options granted to nonemployees is recognized as the stock options are earned.
In the event the underlying terms of stock options are modified on which stock-based compensation was granted, additional expense is recognized for any modification that increases the total fair value of the share-based payment arrangement at the modification date.
Income Taxes
The Company accounts for income taxes under the asset and liability method, whereby deferred tax assets and liabilities are determined based on the difference between the financial statement and tax bases of assets and liabilities using the enacted tax rates in effect for the year in which the differences are expected to affect taxable income. A valuation allowance is established when necessary to reduce deferred tax assets to the amounts expected to be realized.
The Company adopted the accounting guidance for uncertainties in income taxes, which prescribes a recognition threshold and measurement process for recording uncertain tax positions taken, or expected to be taken, in a tax return in the financial statements. The guidance also prescribes treatment for derecognition, classification, accounting in interim periods and disclosure requirements for uncertain tax positions. The Company accrues for the estimated amount of taxes for uncertain tax positions if it is more likely than not that the Company would be required to pay such additional taxes. An uncertain tax position will not be recognized if it has a less than 50% likelihood of being sustained.
101
SI-BONE, INC.
NOTES TO CONSOLIDATED FINANCIAL STATEMENTS
Net Loss per Share of Common Stock
The Company calculates basic and diluted net loss per common share attributable to shareholders in conformity with the two-class method required for companies with participating securities. The Company considers all series of redeemable convertible preferred stock and early exercised stock options to be participating securities as the holders are entitled to receive dividends on a pari passu basis in the event that a dividend is paid on common stock. Under the two-class method, the net loss attributable to common stock is not allocated to the redeemable convertible preferred stock and early exercised stock options as the holders of redeemable convertible preferred stock and early exercised stock options do not have a contractual obligation to share in losses.
Basic net loss per common share is calculated by dividing the net loss by the weighted-average number of common shares outstanding during the period, without consideration for potentially dilutive securities. Diluted net loss per share is computed by dividing the net loss by the weighted-average number of common shares and potentially dilutive securities outstanding for the period. For purposes of the diluted net loss per share calculation, redeemable convertible preferred stock and common stock options and warrants are considered to be potentially dilutive securities. Because the Company has reported a net loss in all periods presented, redeemable convertible preferred stock and common stock options and warrants are anti-dilutive and therefore diluted net loss per common share is the same as basic net loss per common share for those periods.
Comprehensive Loss
Comprehensive loss represents all changes in the stockholders’ equity (deficit) except those resulting from distributions to stockholders. The Company’s unrealized foreign currency translation income (losses) and unrealized gain (losses) of marketable securities represent the two components of other comprehensive income that are excluded from the reported net loss for each of the reporting periods and has been presented in the consolidated statements of operations and comprehensive loss.
Recent Accounting Pronouncements
Recently Adopted Accounting Standards
In July 2015, the FASB issued ASU 2015-11, Inventory (Topic 330): Simplifying the Measurement of Inventory. ASU 2015-11 simplifies the guidance on the subsequent measurement of inventory, excluding inventory measured using last-in, first out or the retail inventory method. Under the new standard, in scope inventory should be measured at the lower of cost and net realizable value. The new standard will become effective for fiscal years, including interim periods within those fiscal years, beginning after December 15, 2016, for public companies. For all other entities, the new standard is effective for fiscal years beginning after December 15, 2016, and interim periods within fiscal years beginning after December 15, 2017, with early adoption permitted. The Company has adopted this standard for the fiscal year ended
December 31, 2017
, which did not have a material impact on the Company’s consolidated financial statements.
In November 2015, the FASB issued ASU 2015-17, Balance Sheet Classification of Deferred Taxes. ASU 2015-17 specifies that deferred tax assets and liabilities shall be classified as non-current, or long-term, in a classified statement of financial position. The new standard is effective for public entities for fiscal years beginning after December 15, 2016, and interim periods within those fiscal years. For private entities, the new standard is effective for fiscal years beginning after December 15, 2017, and interim periods within fiscal years beginning after December 15, 2018. Earlier application is permitted for all entities as of the beginning of an interim or an annual reporting period. The Company has early adopted this standard for the fiscal year ended
December 31, 2017
, which did not have a material impact on the Company’s consolidated financial statements.
In March 2016, the FASB issued ASU 2016-09, which simplified several aspects of accounting for stock-based compensation transactions. The areas for simplification in this update involve several aspects of the accounting for share-based payment transactions, including the income tax consequences, classification of awards as either equity or liabilities, and classification on the statement of cash flows. The new guidance is effective for public entities for fiscal years beginning after December 15, 2016 and interim periods within those years. Other entities must apply the new guidance in fiscal years beginning after December 15, 2017 and in interim periods within fiscal years beginning after December 15, 2018, with early adoption permitted. The Company early adopted this standard in the first quarter of 2017 by recording the cumulative impact of applying this guidance to retained earnings, which was not material. The Company elected to continue to estimate the number of awards that are expected to vest.
In January 2016, the FASB issued ASU 2016-01. Recognition and Measurement of Financial Assets and Financial Liabilities, which amends Accounting Standards Codification, or ASC, Subtopic 825-10, Financial Instruments - Overall, and includes updates on certain aspects of recognition, measurement, presentation and disclosure of financial instruments and applies to all entities that hold financial assets or owe financial liabilities. The new standard is effective for the Company’s annual period beginning after December 15, 2018, with early adoption permitted beginning after December 15, 2017. The Company has adopted this standard for the fiscal year ending December 31, 2018, which did not have any impact on the Company’s consolidated financial statements.
102
SI-BONE, INC.
NOTES TO CONSOLIDATED FINANCIAL STATEMENTS
In May 2017, the FASB issued ASU 2017-09, Compensation—Stock Compensation (Topic 718): Scope of Modification Accounting, which clarifies when to account for a change to the terms or conditions of a share-based payment award as a modification. Under the new guidance, modification accounting is required only if the fair value, the vesting conditions, or the classification of the award (as equity or liability) changes as a result of the change in terms or conditions. The standard is effective for all entities for fiscal years, including interim periods within those fiscal years, beginning after December 15, 2017. Early adoption is permitted. The Company has adopted this standard for the fiscal year ending December 31, 2018, which did not have any impact on the Company’s consolidated financial statements.
Recently Issued Accounting Standards Not Yet Effective
In May 2014, the Financial Accounting Standards Board (“FASB”) issued Accounting Standards Update (“ASU”) 2014-09, Revenue from Contracts with Customers, which required an entity to recognize the amount of revenue to which it expects to be entitled for the transfer of promised goods or services to customers. ASU 2014-09 will replace most existing revenue recognition guidance in U.S. GAAP when it becomes effective. The new standard is effective for fiscal years beginning after December 15, 2017 for public companies, and for fiscal years beginning after December 15, 2018, and interim periods beginning after December 15, 2019, for private companies. Early application is permitted. The standard permits the use of either the retrospective or cumulative effect transition method. In March 2016, the FASB issued ASU 2016-08, Revenue from Contracts with Customers (Topic 606): Principal versus Agent Considerations (Reporting Revenue Gross versus Net), which clarifies the implementation guidance on principal versus agent considerations in ASU 2014-09. In April 2016, the FASB issued ASU 2016-10, Revenue from Contracts with Customers (Topic 606): Identifying Performance Obligations and Licensing, which clarifies certain aspects of identifying performance obligations and licensing implementation guidance. In May 2016, the FASB issued ASU 2016-12, Revenue from Contracts with Customers (Topic 606): Narrow-Scope Improvements and Practical Expedients, which relates to disclosures of remaining performance obligations, as well as other amendments to guidance on collectability, non-cash consideration and the presentation of sales and other similar taxes collected from customers. These standards have the same effective date and transition date as ASU 2014-09.
The Company continues to evaluate the impacts of adoption of the new standard on its accounting policies, processes, and system requirements and has assigned internal resources, in addition to the engagement of third party service providers, to assist in the evaluation. At this time, as it relates to product sales where the Company's sales representative delivers the product at the point of implantation at hospital or other medical facilities, the Company expects revenue to continue to be recognized upon completion of the procedure and authorization by the customer. Additionally, the new standard requires the capitalization of costs to obtain a contract, primarily sales commissions, and amortization of these costs over the contract period or estimated customer life. The Company expects to continue expensing all sales commissions as incurred. Management will adopt the standard using the modified retrospective method for the fiscal year ending December 31, 2019.
In February 2016, the FASB issued its new lease accounting guidance. Under the new guidance, ASU 2016-02, Leases (Topic 842), lessor accounting is largely unchanged. The new lease guidance simplifies the accounting for sale and leaseback transactions primarily because lessees must recognize lease assets and lease liabilities. Under the new guidance, lessees will be required to recognize a lease liability, which is a lessee’s obligation to make lease payments arising from a lease, measured on a discounted basis; and a right-of-use asset, which is an asset that represents the lessee’s right to use, or control use of, a specified asset for the lease term for all leases (with the exception of short-term leases) at the adoption date. The new guidance is effective for fiscal years, and for interim periods within those fiscal years, beginning after December 15, 2018 for public companies and beginning after December 15, 2019 for private companies. Early adoption is permitted for any interim or annual financial statements net yet issued. Lessees (for capital and operating leases) and lessors (for sales-type, direct financing and operating leases) must apply a modified retrospective approach for all leases existing at, or entered into after, the beginning of the earliest comparative period presented in the financial statements. The Company is currently evaluating the impact of this standard on its consolidated financial statements, and anticipates adopting the standard for the fiscal year ending December 31, 2020.
In August 2016, the FASB issued ASU 2016-15 “Statement of Cash Flows (Topic 230), Classification of Certain Cash Receipts and Cash Payments”. ASU 2016-15 provides guidance on the following eight specific cash flow classification issues: (1) debt prepayment or debt extinguishment costs; (2) settlement of zero-coupon debt instruments or other debt instruments with coupon interest rates that are insignificant in relation to the effective interest rate of the borrowing; (3) contingent consideration payments made after a business combination; (4) proceeds from the settlement of insurance claims; (5) proceeds from the settlement of corporate-owned life insurance policies, including bank-owned life insurance policies; (6) distributions received from equity method investees; (7) beneficial interests in securitization transactions; and (8) separately identifiable cash flows and application of the predominance principle. Current GAAP does not include specific guidance on these eight cash flow classification issues. The amendments of this ASU are effective for reporting periods beginning after December 15, 2017 for public companies, and fiscal years beginning after December 15, 2018 and interim periods within fiscal years beginning after December 15, 2019 for private companies, with early adoption permitted. The Company is currently evaluating the impact of adopting ASU 2016-15 on its consolidated financial statements, and anticipates adopting the standard for the fiscal year ending December 31, 2019.
103
SI-BONE, INC.
NOTES TO CONSOLIDATED FINANCIAL STATEMENTS
In July 2017, the FASB issued ASU 2017-11, Earnings Per Share (Topic 260), Distinguishing Liabilities from Equity (Topic 480), Derivatives and Hedging (Topic 815) I. Accounting for Certain Financial Instruments with Down Round Features II. Replacement of the Indefinite Deferral for Mandatorily Redeemable Financial Instruments of Certain Nonpublic Entities and Certain Mandatorily Redeemable Noncontrolling Interests with a Scope Exception. Part I applies to entities that issue financial instruments such as warrants, convertible debt or convertible preferred stock that contain down-round features. Part II replaces the indefinite deferral for certain mandatorily redeemable noncontrolling interests and mandatorily redeemable financial instruments of nonpublic entities contained within ASC Topic 480 with a scope exception and does not impact the accounting for these mandatorily redeemable instruments. For public business entities, the amendments in Part I of this update are effective for fiscal years, and interim periods within those fiscal years, beginning after December 15, 2018. For all other entities, the amendments in Part I of this Update are effective for fiscal years beginning after December 15, 2019, and interim periods within fiscal years beginning after December 15, 2020. Early adoption is permitted for all entities, including adoption in an interim period. The Company is currently evaluating the impact that the adoption of this standard will have on its consolidated financial statements, and anticipates adopting the standard for the fiscal year ending December 31, 2020.
In February 2018, the FASB issued ASU 2018-02, Income Statement—Reporting Comprehensive Income (Topic 220). This update provides companies with the option to reclassify stranded tax effects caused by the 2017 Tax Cuts and Jobs Act (the 2017 Tax Act) from accumulated other comprehensive income to retained earnings. This standard is effective for all entities for fiscal years, and interim periods within those fiscal years, beginning after December 15, 2018. Early adoption is permitted. The Company is currently evaluating the impact that the adoption of this standard will have on its consolidated financial statements, and anticipates adopting the standard for the fiscal year ending December 31, 2019.
In June 2018, the FASB issued ASU 2018-07, Improvements to Nonemployee Share-Based Payment Accounting. ASU 2018-07 expands the scope of Topic 718, Compensation—Stock Compensation, to include share-based payments issued to nonemployees for goods or services. Consequently, the accounting for share-based payments to nonemployees and employees will be substantially aligned. ASU 2018-07 supersedes Subtopic 505-50, Equity—Equity-Based Payments to Non-Employees. For public business entities, the amendments are effective for fiscal years beginning after December 15, 2018, including interim periods within that fiscal year. For all other entities, the amendments are effective for fiscal years beginning after December 15, 2019, and interim periods within fiscal years beginning after December 15, 2020. Early adoption is permitted, but no earlier than a company’s adoption date of ASC 606. The Company is currently evaluating the impact that the adoption of this standard will have on the consolidated financial statements, and anticipates adopting the standard for the fiscal year ending December 31, 2020.
3. Marketable Securities
At
December 31, 2018
, marketable securities consisted of the following (in thousands):
|
Amortized Cost
|
Unrealized Gains
|
Unrealized Losses
|
Aggregate Fair Value
|
||||||||||||
|
U.S. treasury securities
|
$
|
65,491
|
|
$
|
2
|
|
$
|
(4
|
)
|
$
|
65,489
|
|
|||
|
Corporate bonds
|
19,708
|
|
15
|
|
(3
|
)
|
19,720
|
|
|||||||
|
Commercial paper
|
11,894
|
|
—
|
|
—
|
|
11,894
|
|
|||||||
|
Short-term investments
|
$
|
97,093
|
|
$
|
17
|
|
$
|
(7
|
)
|
$
|
97,103
|
|
|||
|
U.S. treasury securities
|
$
|
1,000
|
|
$
|
—
|
|
$
|
—
|
|
$
|
1,000
|
|
|||
|
Commercial paper
|
6,635
|
|
—
|
|
—
|
|
6,635
|
|
|||||||
|
Money market funds
|
15,223
|
|
15,223
|
|
|||||||||||
|
Cash equivalents
|
$
|
22,858
|
|
$
|
—
|
|
$
|
—
|
|
$
|
22,858
|
|
|||
|
Total marketable securities
|
$
|
119,951
|
|
$
|
17
|
|
$
|
(7
|
)
|
$
|
119,961
|
|
|||
All marketable securities of at December 31, 2017 of
$22.1 million
consisted of money market funds which were classified as cash equivalents.
104
SI-BONE, INC.
NOTES TO CONSOLIDATED FINANCIAL STATEMENTS
4. Fair Value Measurement
The following table sets forth the fair value of the Company’s financial assets and liabilities measured at fair value on a recurring basis based on the three-tier fair value hierarchy (in thousands):
|
December 31, 2018
|
|||||||||||||||
|
Level 1
|
Level 2
|
Level 3
|
Total
|
||||||||||||
|
Assets
|
|||||||||||||||
|
Money market funds
[1]
|
$
|
15,223
|
|
$
|
—
|
|
$
|
—
|
|
$
|
15,223
|
|
|||
|
U.S. treasury securities
|
66,489
|
|
—
|
|
—
|
|
66,489
|
|
|||||||
|
Corporate bonds
|
—
|
|
19,720
|
|
—
|
|
19,720
|
|
|||||||
|
Commercial paper
|
—
|
|
18,529
|
|
—
|
|
18,529
|
|
|||||||
|
Liabilities
|
|||||||||||||||
|
Redeemable convertible preferred stock warrants
|
$
|
—
|
|
$
|
—
|
|
$
|
—
|
|
$
|
—
|
|
|||
|
December 31, 2017
|
|||||||||||||||
|
Level 1
|
Level 2
|
Level 3
|
Total
|
||||||||||||
|
Assets
|
|||||||||||||||
|
Money market funds
[1]
|
$
|
22,115
|
|
$
|
—
|
|
$
|
—
|
|
$
|
22,115
|
|
|||
|
Liabilities
|
|||||||||||||||
|
Redeemable convertible preferred stock warrants
|
$
|
—
|
|
$
|
—
|
|
$
|
422
|
|
$
|
422
|
|
|||
|
[1]
|
Included in cash and cash equivalents on the consolidated balance sheet
|
The following table sets forth a summary of the changes in the fair value of the redeemable convertible preferred stock warrants, the Company’s Level 3 financial liability, which is measured on a recurring basis (in thousands):
|
Balances at December 31, 2017
|
$
|
422
|
|
|
Change in fair value recorded in other (income) expense, net
|
826
|
|
|
|
Conversion of preferred stock warrants to common stock warrants
|
(1,248
|
)
|
|
|
Balances at December 31, 2018
|
$
|
—
|
|
105
SI-BONE, INC.
NOTES TO CONSOLIDATED FINANCIAL STATEMENTS
5. Balance Sheet Components
Property and Equipment, net
(in thousands):
|
December 31,
|
December 31,
|
||||||
|
2018
|
2017
|
||||||
|
Machinery and equipment
|
$
|
3,785
|
|
$
|
3,428
|
|
|
|
Construction in progress
|
730
|
|
879
|
|
|||
|
Computer and office equipment
|
407
|
|
310
|
|
|||
|
Leasehold improvements
|
448
|
|
272
|
|
|||
|
Furniture and fixtures
|
148
|
|
29
|
|
|||
|
5,518
|
|
4,918
|
|
||||
|
Less: Accumulated depreciation and amortization
|
(3,364
|
)
|
(3,022
|
)
|
|||
|
$
|
2,154
|
|
$
|
1,896
|
|
||
Depreciation expense was
$0.7 million
and
$1.0 million
for the years ended
December 31, 2018
and
2017
, respectively.
Accrued Liabilities and Other
(in thousands):
|
December 31,
|
December 31,
|
||||||
|
2018
|
2017
|
||||||
|
Accrued compensation and related expenses
|
$
|
5,425
|
|
$
|
3,732
|
|
|
|
Accrued interest
|
—
|
|
831
|
|
|||
|
Accrued professional services
|
583
|
|
341
|
|
|||
|
Sales tax payable
|
388
|
|
466
|
|
|||
|
Liability for early exercise of unvested stock options
|
331
|
|
65
|
|
|||
|
Sales and warranty reserves
|
35
|
|
149
|
|
|||
|
Other
|
98
|
|
140
|
|
|||
|
$
|
6,860
|
|
$
|
5,724
|
|
||
106
SI-BONE, INC.
NOTES TO CONSOLIDATED FINANCIAL STATEMENTS
6. Commitments and Contingencies
Operating Leases
In August 2012, the Company entered into a new
four
-year non-cancelable operating lease for its existing office building space in San Jose, California which commenced in January 2013. In February 2014, the Company expanded the existing lease space and extended the lease terms through June 2017. In May 2016, the Company entered into another extension of the lease with its lessor for additional 12 months beginning in July 2017. Effective May 2018, the Company entered into an early termination agreement on an operating lease for its San Jose office.
No
early termination fees were incurred and all previously agreed-to rent payments were released, with no further obligations. In February 2018, the Company entered into a new
seven
-year non-cancelable operating lease for an office building space in Santa Clara, California which commenced in April 2018.
The Company also entered into non-cancelable operating leases for its office building space in Gallarate, Italy and Mannheim, Germany which both expire in November 2024. Further, the Company also leases vehicles under operating lease arrangements for certain of its sales personnel in Europe which expire various times in 2019 to 2021.
Rent expense is recorded over the lease terms on a straight-line basis. Rent expense charged to operations under operating leases totaled approximately
$1.2 million
and
$1.0 million
for the years ended
December 31, 2018
and
2017
, respectively.
The aggregate future minimum lease payments under all leases as of
December 31, 2018
are as follows (in thousands):
|
Year Ending December 31,
|
|||
|
2019
|
$
|
1,035
|
|
|
2020
|
1,033
|
|
|
|
2021
|
914
|
|
|
|
2022
|
842
|
|
|
|
2023
|
844
|
|
|
|
Thereafter
|
1,184
|
|
|
|
$
|
5,852
|
|
|
Contingencies
From time to time, the Company may have certain contingent liabilities that arise in the ordinary course of business activities. The Company accrues a liability for such matters when it is probable that future expenditures will be made and such expenditures can be reasonably estimated.
Purchase Commitments and Obligations
The Company has certain purchase commitments related to inventory used in normal course of business. These commitments totaled
$0.2 million
and
$0.1 million
at
December 31, 2018
and
December 31, 2017
, respectively. The amounts paid under these arrangements may be less in the event that the arrangement is renegotiated or canceled.
Legal Proceedings
On February 6, 2019, a putative class action captioned Eric B. Fromer Chiropractic, Inc. v. SI-BONE, Inc. (Civil Action No. 5:19-cv-633-SVK), was filed in the United States District Court, Northern District of California. The complaint alleges violations of the Telephone Consumer Protection Act (the “TCPA”) on behalf of an individual and putative classes of persons alleged to be similarly situated. The complaint alleges that the Company sent invitations to an educational dinner event to health care providers by way of facsimile transmission. The TCPA prohibits using a fax machine to send unsolicited advertisements not including proper opt-out instructions or to send unsolicited advertisements to persons with whom the sender did not have an established business relationship. The Company believes that it has meritorious defenses and intends to vigorously defend itself in the action. It is too early in this matter to reasonably predict the probability of the outcomes or to estimate the range of possible loss, if any.
107
SI-BONE, INC.
NOTES TO CONSOLIDATED FINANCIAL STATEMENTS
Indemnification
The Company enters into standard indemnification arrangements in the ordinary course of business. Pursuant to these arrangements, the Company indemnifies, holds harmless, and agrees to reimburse the indemnified parties for losses suffered or incurred by the indemnified party, in connection with any trade secret, copyright, patent or other intellectual property infringement claim by any third-party with respect to the Company’s technology. The term of these indemnification agreements is generally perpetual. The maximum potential amount of future payments the Company could be required to make under these agreements is not determinable because it involves claims that may be made against the Company in the future, but have not yet been made.
The Company has entered into indemnification agreements with its directors and officers that may require the Company to indemnify its directors and officers against liabilities that may arise by reason of their status or service as directors or officers, other than liabilities arising from willful misconduct of the individual.
The Company has
not
incurred costs to defend lawsuits or settle claims related to these indemnification agreements.
No
liability associated with such indemnifications has been recorded to date.
7. Borrowings
The Company had
$39.0 million
and
$38.7 million
of outstanding debt, net of debt discounts, as of
December 31, 2018
and
December 31, 2017
, respectively.
Term Loan
In August 2016, the Company entered into a Term Loan facility and a revolving line of credit with Silicon Valley Bank, or SVB and Oxford Finance LLC, or Oxford for
$35.2 million
. The Term Loan had interest only periods for
six months
up to October 1, 2017 and was then to be repaid over
25 months
of equal principal payments plus interest. The maturity date of the term loan was December 1, 2019, and it carried an interest rate equal to the greater of
11%
or the WSJ Prime rate plus
7.75%
. The Term Loan borrowings were senior unsecured obligations of the Company, ranking equally and ratably among themselves and with the Company’s existing and future unsecured and unsubordinated debt.
In conjunction with the above Term Loan agreement, the Company issued redeemable convertible preferred stock warrants (refer to Note 9 for details).
In October 2017, the Company extinguished the Term Loan with SVB and Oxford. Concurrently, the Company entered into a New Term Loan with Pharmakon Advisors, or Pharmakon. As a result of the extinguished debt, the Company paid
$29.1 million
in principal payments to SVB and Oxford. The Company also paid
$1.5 million
in early termination fees and recorded
$0.7 million
of unamortized debt discounts. This loss on extinguishment of
$2.2 million
is reflected as interest expense in the consolidated statement of operations.
The Company entered into the New Term Loan with Pharmakon for
$40.0 million
in October 2017. Debt issuance costs of
$1.3 million
were recorded as a direct deduction from the carrying amount of the New Term Loan on the consolidated balance sheet, and are being amortized over the period of the New Term Loan using the effective interest method to interest expense in the consolidated statement of operations. The New Term Loan includes an interest-only period for
35
months through September 2020 and is then repaid in equal quarterly principal payments plus interest through December 2022, and is classified as long-term borrowings on the consolidated balance sheet. The New Term Loan carries a fixed interest rate of
11.5%
and a closing fee of
1.5%
of the funded amount, or
$0.6 million
. The New Term Loan includes a pre-payment fee equal to the interest due for the first 30 months of the agreement if it is prepaid within the first 30 months, a
2%
prepayment penalty for months 31-48, and a
1%
penalty for months 49-60. The New Term Loan required the Company to maintain a minimum cash balance of
$5.0 million
and to achieve certain revenue targets through December 31, 2018. Beginning with the three months ended March 31, 2019, the Company is required to meet either revenue or earnings targets. Under the New Term Loan, the Company also has a second tranche of
$10.0 million
available through January 2019, contingent upon the achievement of certain revenue milestones. The Company did not draw upon the second tranche. The New Term Loan is a senior obligation secured with a blanket first lien on the assets of the Company. As of
December 31, 2018
and
December 31, 2017
, the total loan balance, net of debt discount, was
$39.0 million
and
$38.7 million
, respectively, with an effective interest rate of
12.3%
and
12.0%
, respectively, and the Company was in compliance with all debt covenants.
108
SI-BONE, INC.
NOTES TO CONSOLIDATED FINANCIAL STATEMENTS
Approximate annual future minimum principal payments under the loan agreements as of
December 31, 2018
are as follows (in thousands):
|
Year Ending at, December 31,
|
|||
|
2019
|
$
|
—
|
|
|
2020
|
4,444
|
|
|
|
2021
|
17,778
|
|
|
|
2022
|
17,778
|
|
|
|
Total future minimum payments
|
40,000
|
|
|
|
Less:
|
|||
|
Amount representing debt discount
|
(1,037
|
)
|
|
|
Total minimum payments
|
$
|
38,963
|
|
The New Term Loan required the Company to maintain a minimum cash balance of
$5.0 million
and to achieve certain revenue targets, which we were in compliance with through December 31, 2018.
Beginning with the three months ended March 31, 2019, the Company is required to meet either minimum net sales or trailing 12-month consolidated EBITDA targets. The Company needs to meet one or the other, but not both. If the Company does not meet either the minimum net sales or trailing 12-month consolidated EBITDA targets, the debt will immediately become due. The minimum net sales and trailing 12-month consolidated EBITDA targets are as follows (in thousands):
|
Twelve Months Ending
|
Minimum Net Sales
|
Trailing 12-Month Consolidated EBITDA
|
||||||
|
March 31, 2019
|
$
|
52,000
|
|
or
|
$
|
(5,000
|
)
|
|
|
June 30, 2019
|
$
|
53,500
|
|
or
|
$
|
(3,500
|
)
|
|
|
September 30, 2019
|
$
|
54,500
|
|
or
|
$
|
(2,000
|
)
|
|
|
December 31, 2019
|
$
|
56,000
|
|
or
|
$
|
—
|
|
|
|
March 31, 2020
|
$
|
57,500
|
|
or
|
$
|
1,000
|
|
|
|
June 30, 2020
|
$
|
58,500
|
|
or
|
$
|
2,000
|
|
|
|
thereafter, as applicable
|
$
|
60,000
|
|
or
|
$
|
3,000
|
|
|
The New Term Loan is collateralized by all of the Company's assets, including intellectual property.
Through
December 31, 2018
, the Company was in compliance with all of its debt obligations and covenants.
Line of Credit
In October 2015, the Company entered into an agreement with its existing lender SVB and Oxford. The amount of the revolving line of credit was
$4.0 million
(or
80%
of the amount of certain customer accounts receivable). It carried an interest rate equal to the WSJ Prime rate plus
3%
with a maturity of December 1, 2019. In October 2017, this line of credit was cancelled in conjunction with the SVB and Oxford debt extinguishment discussed above. No draws were made on this facility through its cancellation.
109
SI-BONE, INC.
NOTES TO CONSOLIDATED FINANCIAL STATEMENTS
8. Redeemable Convertible Preferred Stock
In connection with the IPO, the Company's outstanding shares of redeemable convertible preferred stock were automatically converted into an aggregate of
12,066,654
shares of common stock. There was
no
preferred stock balance outstanding at
December 31, 2018
.
Preferred stock at
December 31, 2017
consisted of the following:
|
Shares
|
|||||||||||||
|
Series
|
Authorized
|
Issued and
Outstanding |
Carrying Value
|
Liquidation Value
|
|||||||||
|
(in thousands)
|
|||||||||||||
|
Series 1
|
245,096
|
|
245,096
|
|
$
|
154
|
|
$
|
154
|
|
|||
|
Series 2
|
709,617
|
|
709,608
|
|
1,489
|
|
1,520
|
|
|||||
|
Series 3
|
498,958
|
|
498,938
|
|
2,862
|
|
2,874
|
|
|||||
|
Series 4
|
2,509,047
|
|
2,509,032
|
|
15,656
|
|
15,807
|
|
|||||
|
Series 5
|
2,086,138
|
|
2,009,226
|
|
18,127
|
|
18,275
|
|
|||||
|
Series 6
|
3,389,227
|
|
3,319,274
|
|
54,508
|
|
54,674
|
|
|||||
|
Series 7
|
2,666,666
|
|
2,580,404
|
|
25,752
|
|
25,890
|
|
|||||
|
Total
|
12,104,749
|
|
11,871,578
|
|
$
|
118,548
|
|
$
|
119,194
|
|
|||
Prior to the conversion of redeemable preferred stock to common stock during the IPO, the holders of preferred stock had various rights and preferences as follows:
Voting Rights
The holders of Series 1, Series 2, Series 3, Series 4, Series 5, Series 6, and Series 7 preferred stock shares were entitled to vote on all matters on which the common stockholders were entitled to vote. The holders of Series 1, Series 2, Series 3 had the right to
0.352941
votes for each share of Series 2 common stock into which such preferred stock would had converted and the holders of Series 4, Series 5, Series 6 and Series 7 had the right to
one
vote for each share of Series 2 common stock into which such preferred stock would had converted. As long as there were any shares of Series 4, Series 5, Series 6, and Series 7 shares that were outstanding, the holders of such Series 4, Series 5, Series 6 and Series 7, at each respective series, were entitled to elect
one
member of the Board of Directors each; the holders of Series 2 common stock were entitled to elect
two
members of the Board of Directors; and the holders of the preferred stock and Series 2 common stock, voting together as a single class were entitled to elect the remaining members of the Board of Directors, as determined at each annual meeting of the Board of Directors.
As long as at least
277,778
preferred stock shares remained outstanding, the Company must obtain approval from a majority of the holders of the then outstanding shares of preferred stockholders and a majority of the voting power of all outstanding shares of Series 5 preferred stock in order to (i) consummate or agree to consummate a Liquidation Event (as defined in the Company’s certificate of incorporation); (ii) amend, alter, restate or repeal any provision of the Company’s certificate of incorporation or bylaws so as to adversely alter, affect or change the powers, preferences, rights or privileges of the shares of preferred stock; (iii) increase or decrease (other than by redemption or conversion) the total number of authorized shares of common stock or preferred stock or designated shares of any series of preferred stock; (iv) authorize or issue, or obligate itself to issue, any equity security (including any other security convertible into or exercisable for any such equity security) having a preference over, or being on a parity with, any series of preferred stock with respect to dividends, liquidation or redemption, other than the issuance of any authorized but unissued shares of Series 6 preferred stock designated in the Company’s certificate of incorporation (including any security convertible into or exercisable for such shares of preferred stock); (v) redeem, purchase or otherwise acquire (or pay into or set aside for a sinking fund for such purpose) any share or shares of preferred stock or common stock; provided, however, that this restriction shall not apply to the repurchase of shares of common stock from employees, officers, directors, consultants or other persons performing services for the Company or any subsidiary pursuant to agreements under which the Company has the option to repurchase such shares upon the occurrence of certain events, such as the termination of employment or service, or pursuant to an agreement providing for a right of first refusal in favor of the Company, in each case, provided that such agreement has been approved by the Company’s board of directors; or (vi) pay or declare any dividend on any shares of capital stock of the Company.
110
SI-BONE, INC.
NOTES TO CONSOLIDATED FINANCIAL STATEMENTS
Dividends
The holders of preferred stock were entitled to receive noncumulative dividends, when and if declared by the Board of Directors, out of any assets legally available, prior to and in preference to any declaration or payment of dividends on the common stock of the Company. Dividend rates, on a per annum basis, for Series 1, Series 2, Series 3, Series 4, Series 5, Series 6, and Series 7 preferred stock are
$0.050112
,
$0.171360
,
$0.4608
,
$0.504
,
$0.72774
,
$1.317744
, and
$0.802656
, respectively, (adjusted to reflect subsequent stock dividends, stock splits or recapitalization).
No
dividends on preferred stock or common stock have been declared as of December 31, 2018 and 2017.
Liquidation
In the event of any liquidation, dissolution or winding-up of the Company or Liquidating Event, the holders of the preferred stock were entitled to receive prior to and in preference to any distribution to holders of the common stock, an amount equal to their respective original issuance price per share (original issuance price per share for Series 1, Series 2, Series 3, Series 4, Series 5, Series 6, and Series 7 preferred stock are
$0.6264
,
$2.142
,
$5.76
,
$6.30
,
$9.0954
,
$16.4718
, and
$10.0332
, respectively), plus any declared but unpaid dividends on such shares. Should the Company’s legally available assets be insufficient to satisfy the full liquidation preference, the funds will be distributed ratably among the holders of the preferred stock in proportion to the preferential amount each holder is otherwise entitled to receive.
Upon the closing of the distribution as above, the remaining proceeds shall be distributed among the holders of Series 4, Series 5, Series 6, Series 7 preferred stock and common stock pro rata based on the number of shares of common stock held by each until the holders of the preferred stock have received the “participation cap.” Thereafter, if proceeds remain, the holders of Series 7 preferred stock and common stock of this corporation shall receive all of the remaining proceeds pro rata based on the number of shares of common stock held by each (assuming full conversion of all such Series 7 preferred stock). The Company has a per share “Participation Cap” of
$32.9436
for the Series 6 preferred stock,
$18.1908
for the Series 5 preferred stock, and
$12.60
for the Series 4 preferred stock (each as adjusted for any stock splits, stock dividends, combinations, subdivisions, recapitalizations or the like with respect to such series of preferred stock).
Conversion
Each share of Series 1, Series 2, Series 3, Series 4, Series 5, Series 6, and Series 7 preferred stock was convertible at the option of the holder, into the number of shares of Series 2 common stock into which such shares are at the then effective conversion ratio or
one
to one ratio. The conversion price per share for Series 1, Series 2, Series 3 and Series 4, Series 5, Series 6, and Series 7 preferred stock shall be the respective issuance price per share, respectively. The initial conversion price was subject to adjustment from time to time. In March 2017, the conversion price per share for the Series 6 preferred stock was amended from
$15.714
per share to
$15.5574
per share which resulted in the conversion ratio increasing from
1.05
to
1.06
per share.
Each share of preferred stock shall be converted into common stock shares upon the earlier of (i) immediately before the closing of a firm commitment underwritten public offering in which the aggregate gross proceeds of not less than
$50.0 million
and a per share public offering of not less than
$30.0996
, or (ii) the Company’s receipt of a written request for such conversion from the holders of at least the voting majority of all outstanding preferred stock (voting as a single class and on an as-converted basis).
Other Matters
Prior to the conversion of redeemable convertible preferred stock to common stock during the IPO, the Company has classified the preferred stock as temporary equity on the consolidated balance sheets as the shares can be redeemed upon the occurrence of certain change in control events that are outside the Company’s control, including deemed liquidation, sale or transfer of the Company. The Company has not adjusted the carrying values of the preferred stock to the liquidation preferences of such shares because it was uncertain whether or when an event would occur that would obligate the Company to pay the liquidation preferences to holders of shares of preferred stock.
111
SI-BONE, INC.
NOTES TO CONSOLIDATED FINANCIAL STATEMENTS
9. Warrants
In connection with the IPO, the Company's outstanding warrants to purchase
156,550
shares of redeemable convertible preferred stock were automatically converted into warrants to purchase an aggregate of
160,657
shares of common stock, resulting in reclassification of the related redeemable convertible preferred stock warrant liability of
$1.2 million
in additional paid-in-capital. In addition, warrants to purchase Series 6 Preferred Stock were converted to warrants to purchase common stock at a conversion ratio of 1:1.06.
Warrants issued and outstanding at
December 31, 2018
are as follows(in thousands, except share and per share data):
|
Date
|
Number of
Shares Underlying Warrants |
Price per
Share |
Fair Value
|
||||||||||||
|
Warrants to purchase
|
Issuance
|
Expiration
|
|||||||||||||
|
Common stock
|
3/1/2017
|
3/1/2027
|
[a]
|
1,388
|
|
5.94
|
|
$
|
5
|
|
[b]
|
||||
|
Common stock
|
7/19/2013
|
7/22/2023
|
[a]
|
32,983
|
|
9.10
|
|
$
|
122
|
|
[b]
|
||||
|
Common stock
|
11/26/2014
|
11/26/2024
|
[a]
|
6,680
|
|
16.47
|
|
$
|
49
|
|
[b]
|
||||
|
Common stock
|
10/20/2015
|
10/20/2025
|
[a]
|
41,650
|
|
16.47
|
|
$
|
396
|
|
[c]
|
||||
|
Common stock
|
11/9/2015
|
11/9/2025
|
[a]
|
25,709
|
|
16.47
|
|
$
|
244
|
|
[c]
|
||||
|
Common stock
|
12/22/2016
|
12/22/2026
|
[a]
|
9,712
|
|
10.03
|
|
$
|
45
|
|
[c]
|
||||
|
Total outstanding common stock warrants
|
118,122
|
||||||||||||||
|
[a]
|
Common stock warrants will remain outstanding until exercised by the holder.
|
|
[b]
|
Fair value at the date of issuance.
|
|
[c]
|
Fair value at the date of conversion from redeemable convertible preferred stock to common stock warrants in conjunction with the IPO on October 16, 2018.
|
Warrants issued and outstanding at
December 31, 2017
are as follows (in thousands, except share and per share data):
|
Series
|
Date
|
Number of
Shares Underlying Warrants |
Price per
Share |
Fair Value
|
|||||||||||||
|
Warrants to purchase
|
Issuance
|
Expiration
|
|||||||||||||||
|
Common stock
|
7/19/2013
|
7/22/2023
|
[a]
|
101,010
|
$
|
3.96
|
|
$
|
244
|
|
[b]
|
||||||
|
Common stock
|
11/26/2014
|
11/26/2024
|
[a]
|
21,928
|
$
|
3.42
|
|
$
|
47
|
|
[b]
|
||||||
|
Common stock
|
3/1/2017
|
3/1/2027
|
[a]
|
1,388
|
$
|
5.94
|
|
$
|
5
|
|
[b]
|
||||||
|
Total common stock warrants
|
124,326
|
||||||||||||||||
|
Redeemable convertible preferred stock
|
Series 5
|
7/1/2012
|
7/25/2019
|
[d]
|
54,917
|
$
|
9.10
|
|
$
|
255
|
|
[c]
|
|||||
|
Redeemable convertible preferred stock
|
Series 5
|
7/19/2013
|
7/22/2023
|
[e]
|
21,989
|
$
|
9.10
|
|
$
|
122
|
|
[c]
|
|||||
|
Redeemable convertible preferred stock
|
Series 6
|
11/26/2014
|
11/26/2024
|
[e]
|
6,310
|
$
|
16.47
|
|
$
|
49
|
|
[c]
|
|||||
|
Redeemable convertible preferred stock
|
Series 6
|
10/20/2015
|
10/20/2025
|
[e]
|
39,339
|
$
|
16.47
|
|
$
|
396
|
|
[c]
|
|||||
|
Redeemable convertible preferred stock
|
Series 6
|
11/9/2015
|
11/9/2025
|
[e]
|
24,283
|
$
|
16.47
|
|
$
|
244
|
|
[c]
|
|||||
|
Redeemable convertible preferred stock
|
Series 7
|
12/22/2016
|
12/22/2026
|
[e]
|
9,712
|
$
|
10.03
|
|
$
|
45
|
|
[c]
|
|||||
|
Total redeemable convertible preferred stock warrants
|
156,550
|
||||||||||||||||
|
Total outstanding common and redeemable convertible preferred stock warrants
|
280,876
|
||||||||||||||||
|
[a]
|
Common stock warrants will remain outstanding until exercised by the holder.
|
|
[b]
|
Fair value at the date of issuance.
|
|
[c]
|
Fair value as of December 31, 2017.
|
|
[d]
|
These warrants will be net exercised immediately upon the closing of the Company’s IPO, or upon a corporate transaction as defined in the Note and Warrant Purchase Agreement dated July 25, 2012.
|
|
[e]
|
Convertible preferred stock warrants will remain outstanding until exercised by the holder and will convert to common stock warrants upon an IPO. The warrants will be exercisable for
10 years
from the date of issuance.
|
112
SI-BONE, INC.
NOTES TO CONSOLIDATED FINANCIAL STATEMENTS
In connection with previously issued debt, the Company issued
101,010
warrants to purchase common shares of the Company at an exercise price of
$3.96
per share in July 2013. Additionally, the Company issued warrants to purchase an additional
21,928
shares of common stock at an exercise price of
$3.42
per share in November 2014. The Company determined that its warrants to purchase shares of common stock meet the requirements for equity classification.
In conjunction with debt issued in July 2012, the Company issued warrants which became exercisable for an aggregate of
54,917
shares of Series 5 preferred stock of the Company at an exercise price of
$9.10
per share.
In conjunction with debt issued in 2013 and 2014, the Company issued
32,983
warrants to purchase Series 5 redeemable convertible preferred stock of the Company at an exercise price of
$9.10
per share. Subsequently, the Company issued additional warrants to purchase
6,310
shares of Series 6 redeemable convertible preferred stock at an exercise price of
$16.47
per share.
In conjunction with the debt agreement with SVB and Oxford, or Term Loan agreement (refer to Note 7), the Company issued warrants to purchase
39,339
shares of Series 6 redeemable convertible preferred stock at an exercise price of
$16.47
per share in October 2015 and additional
24,283
shares of Series 6 redeemable convertible preferred stock at an exercise price of
$16.47
per share in November 2015.
In conjunction with the Term Loan agreement and its modification (refer to Note 7), the Company issued additional warrants for the purchase of
9,712
shares of Series 7 redeemable convertible preferred stock at an exercise price of
$10.03
per share in December 2016.
In March 2017, the Company issued a warrant to purchase
1,388
shares of common stock at an exercise price of
$5.94
to a consultant. The Company determined that such warrant meets the requirements for equity classification.
In October 2017, the Company extinguished its debt with SVB and Oxford. All related debt discounts were written off upon repayment of the loan.
The Company estimates the fair value of warrants using the Black-Scholes option valuation model. The fair value is estimated using certain assumptions. Refer to Note 11. Stock-Based Incentive Compensation Plans, for further discussions on how the Company determines these input assumptions. Each of these inputs is subjective and its determination generally requires significant judgment. The fair value of warrants to purchase preferred stock were recorded at the date of issuance as a discount to debt and amortized to interest expense over the term of the note. The changes in the fair value of the redeemable convertible preferred stock warrants are recorded in other income and expense. Weighted-average assumptions used in computation of the fair value of the redeemable convertible preferred stock warrants are summarized in the table below:
|
Year Ended December 31,
|
||||||
|
2018
|
2017
|
|||||
|
Remaining contractual term (in years)
|
4.9
|
|
5.3
|
|
||
|
Expected volatility
|
53.89
|
%
|
59.06
|
%
|
||
|
Risk-free interest rate
|
2.62
|
%
|
2.16
|
%
|
||
|
Dividend yield
|
—
|
%
|
—
|
%
|
||
113
SI-BONE, INC.
NOTES TO CONSOLIDATED FINANCIAL STATEMENTS
10. Common Stock
In March 2017, the Board of Directors approved an increase of
555,555
Series 2 common stock. As a result, the Company’s restated certificate of incorporation, as amended, authorizes the Company to issue
19,333,333
shares of
$0.0001
par value common stock, of which
6,000,000
has been designated as Series 1 common stock and
13,333,333
has been designated as Series 2 common stock. The holders of Series 1 common stock shall have no voting rights; the holders of Series 2 common stock shall have the right to one vote for each such share.
In October 2018, the Company amended and restated its certification of incorporation, which authorizes the Company to issue
100,000,000
shares of common stock and
5,000,000
shares of preferred stock, each having a par value of
$0.0001
. At December 31, 2018, there was
no
preferred stock issued and outstanding.
The holders of common stock are entitled to receive dividends whenever funds are legally available, as, when, and if declared by the Board of Directors. There have been
no
dividends declared to date.
The Company has reserved shares of common stock, on an issued and as-converted basis, for future issuance as follows:
|
December 31, 2018
|
December 31, 2017
|
||||||||
|
Issued and
Outstanding |
Issued and
Outstanding |
Common Stock
Equivalent Shares |
|||||||
|
Common stock
|
24,450,757
|
|
—
|
|
—
|
|
|||
|
Series 1 common stock
|
—
|
|
3,112,955
|
|
3,112,955
|
|
|||
|
Series 2 common stock
|
—
|
|
490,185
|
|
490,185
|
|
|||
|
Redeemable convertible preferred stock
|
—
|
|
11,871,578
|
|
12,066,654
|
|
|||
|
Restricted stock units outstanding
|
53,436
|
|
—
|
|
—
|
|
|||
|
Stock options outstanding
|
2,641,198
|
|
3,001,929
|
|
3,001,929
|
|
|||
|
Shares available for grant
|
2,497,082
|
|
29,654
|
|
29,654
|
|
|||
|
Common stock warrants
|
118,122
|
|
124,326
|
|
124,326
|
|
|||
|
Redeemable convertible preferred stock warrants
|
—
|
|
156,550
|
|
160,657
|
|
|||
|
Total
|
29,760,595
|
|
18,787,177
|
|
18,986,360
|
|
|||
114
SI-BONE, INC.
NOTES TO CONSOLIDATED FINANCIAL STATEMENTS
11. Stock-Based Incentive Compensation Plans
In April 2008, the Company adopted the 2008 Stock Option Plan, as amended, under which the Board of Directors may issue incentive and nonqualified stock options to employees, directors and consultants. In October 2018, the Company adopted the 2018 Equity Incentive Plan, which serves as the successor to the 2008 Stock Option Plan, under which the Board of Directors may issue incentive and nonqualified stock options and restricted stock units (RSUs) to employees, directors and consultants. No new options have been granted under the 2008 Stock Option Plan since August 2018. Outstanding options under the 2008 Stock Option Plan continue to be subject to the terms and conditions of that plan.
The Board of Directors has the authority to determine to whom options will be granted, the number of shares, the term and the exercise price. If an individual owns stock representing more than
10%
of the outstanding shares, the price of each share shall be at least
110%
of the fair market value, as determined by the Board of Directors. The exercise price of an incentive stock option and a nonqualified stock option shall not be less than
100%
and
85%
, respectively, of the fair market value on the date of grant. As of
December 31, 2017
, a total of
5,350,080
shares of common stock had been reserved for issuance under the 2008 Stock Option Plan. As of December 31, 2018, a total of
2,576,538
shares of common stock had been reserved for issuance under the 2018 Equity Incentive Plan.
Options granted have a term of
10
years, except, options granted to individuals holding more than
10%
of the outstanding shares have a term of
five
years. Options generally vest over a
four
-year period. Certain shares issued under the Plan are exercisable immediately, but subject to a right of repurchase by the Company of any unvested shares. RSUs granted under the 2018 Equity Incentive Plan generally vest over
two
to
four
years based upon continued services and are settled at vesting in shares of the Company's common stock.
The following table summarizes stock option activity for the year ended
December 31, 2018
for all stock plans:
|
Options Outstanding
|
||||||||||||
|
Number of Shares
|
Weighted-Average Exercise Price
|
Weighted-Average Contractual Remaining Life
|
Aggregate Intrinsic Value
|
|||||||||
|
(Years)
|
(in thousands)
|
|||||||||||
|
Balances at December 31, 2017
|
3,001,929
|
|
$
|
4.15
|
|
$
|
3,585
|
|
||||
|
Options granted
|
100,080
|
|
$
|
8.88
|
|
|||||||
|
Options exercised
|
(395,117
|
)
|
$
|
4.08
|
|
|||||||
|
Options canceled
|
(65,694
|
)
|
$
|
4.81
|
|
|||||||
|
Balances at December 31, 2018
|
2,641,198
|
|
$
|
4.27
|
|
6.6
|
$
|
43,905
|
|
|||
|
Options vested and exercisable - December 31, 2018
|
1,762,687
|
|
$
|
3.73
|
|
5.9
|
$
|
41,882
|
|
|||
|
Options vested and expected to vest - December 31, 2018
|
2,366,723
|
|
$
|
4.14
|
|
6.5
|
$
|
40,154
|
|
|||
The weighted-average grant date fair value of all options granted were
$3.98
and
$1.80
for years ended
December 31, 2018
and
2017
, respectively. The aggregate intrinsic values of options outstanding, options vested and exercisable, and options vested and expected to vest were calculated as the difference between the exercise price of the options and the close price of the Company’s common stock on the last trading day of the year, as of
December 31, 2018
and
2017
, respectively.
Employee Stock Purchase Plan
The Company allows eligible employees to purchase shares of the Company's common stock through payroll deductions at the price equal to
85%
of the lesser of the fair market value of the stock as of the first date or the ending date of each
six
month offering period.
115
SI-BONE, INC.
NOTES TO CONSOLIDATED FINANCIAL STATEMENTS
Early Exercise of Unvested Stock Options
Early exercises of stock options are subject to a right of repurchase by the Company of any unvested shares. The repurchase rights lapse over the original vesting period of the options. The Company accounts for the cash received in consideration for the early exercised options as a liability included in accrued liabilities, which is then reclassified to stockholders’ equity (deficit) as the options vest. At
December 31, 2018
and
December 31, 2017
, the Company had a total of
74,019
and
16,117
shares of common stock, respectively, subject to repurchase under the Plan and
$0.3 million
and
$0.1 million
, respectively, of associated liabilities for the repurchase.
Stock-Based Compensation
The following table sets forth stock-based compensation expense recognized for the periods presented (in thousands):
|
Year ended
December 31, |
|||||||||
|
2018
|
2017
|
||||||||
|
Cost of goods sold
|
$
|
34
|
|
$
|
23
|
|
|||
|
Research and development
|
156
|
|
143
|
|
|||||
|
Sales and marketing
|
651
|
|
438
|
|
|||||
|
General and administrative
|
1,471
|
|
1,271
|
|
|||||
|
$
|
2,312
|
|
$
|
1,875
|
|
||||
Amounts above do not include
$0.4 million
of stock-based compensation expense related to forgiveness of notes receivable for the year ended
December 31, 2017
.
No
amounts of stock-based compensation expense related to forgiveness of notes receivable were recognized for the year ended
December 31, 2018
. Refer to Note 13 for details.
The Company estimates the fair value of stock options using the Black-Scholes option valuation model. The fair value of employee stock options is being amortized on a straight-line basis over the requisite service period of the awards. The fair value of employee stock options was estimated using the assumptions below. Each of these inputs is subjective and its determination generally requires significant judgment.
Fair Value of Common Stock
The fair value of the shares of the Company’s common stock underlying the stock options has historically been determined by the Company’s Board of Directors. Because there had been no public market for the Company’s common stock prior to its IPO, its Board of Directors has determined the fair value of the Company’s common stock at the time of grant of the option by considering a number of objective and subjective factors, including independent third-party valuations, the Company’s stage of development, sales of the Company’s redeemable convertible preferred stock, the Company’s operating and financial performance, equity market conditions affecting comparable public companies, the lack of liquidity of the Company’s capital stock, and the general and industry-specific economic outlooks.
Subsequent to its IPO, the Company uses the market closing price for its common stock as reported on the NASDAQ Global Market on the date of grant.
Expected Term
The expected term represents the period that the share-based awards are expected to be outstanding. The Company used the simplified method to determine the expected term, which is calculated as the average of the time to vesting and the contractual life of the options.
Expected Volatility
As the Company’s common stock has never been publicly traded, the expected volatility is derived from the average historical volatilities of publicly traded companies within its industry that the Company considers to be comparable to its business over a period approximately equal to the expected term for its stock options.
Risk-Free Interest Rate
The risk-free interest rate is based on the U.S. Treasury zero coupon issues in effect at the time of grant for periods corresponding with the expected term of the option.
116
SI-BONE, INC.
NOTES TO CONSOLIDATED FINANCIAL STATEMENTS
Dividend Yield
The Company has never paid dividends on its common stock and has no plans to pay dividends on its common stock. Therefore, the Company used an expected dividend yield of zero.
Expected Forfeiture Rate
The Company is required to estimate forfeitures at the time of grant and revise those estimates in subsequent periods if actual forfeitures differ from those estimates. The Company uses historical data to estimate pre-vesting option forfeitures and record stock-based compensation expense only for those awards that are expected to vest. To the extent actual forfeitures differ from the estimates, the difference will be recorded as a cumulative adjustment in the period that the estimates are revised.
The grant date fair value of the stock option awards granted to employees was estimated at the date of grant using a Black-Scholes option-pricing model with the following assumptions:
|
Year ended
|
|||
|
December 31,
|
|||
|
2018
|
2017
|
||
|
Expected term
|
6.17
|
5.71
|
|
|
Expected volatility
|
42%-47%
|
42%-55%
|
|
|
Risk-free interest rate
|
2.35%-2.96%
|
1.73%-2.31%
|
|
|
Dividend yield
|
—%
|
—%
|
|
Performance Stock Options
In March 2017, the Company granted
564,098
performance stock options at an exercise price of
$5.94
, of which
408,544
performance options will vest monthly over
four
years and
155,554
performance options will vest monthly over
three
years. The vesting period will begin on the date of the closing of an IPO, the performance condition, subject to the optionee’s continuous service. Stock-based compensation expense for performance stock options is based on the probability of achieving certain performance criteria, as defined in the individual option grant agreement. Periodically, the Company estimates the number of performance options ultimately expected to vest and recognizes stock-based compensation expense for those options when it becomes probable that the performance criteria will be met. In October 2018, the Company completed its IPO and recognized
$0.6 million
expense related to the performance stock options for the year ended
December 31, 2018
.
In December 2017, the Company modified the terms of
394,652
unvested stock option awards granted in March 2017, by reducing their exercise price from
$5.94
to
$4.68
per share. In addition, the vesting performance conditions for these options were removed and the vesting commencement date changed from the IPO date to September 2017. There were no other changes in any of the other terms of the option awards. Due to these options previously subject to performance conditions that were not deemed probable of occurring, the Company had not recognized any expense related to these grants. The modification resulted in total expense of
$0.8 million
that is recognized over the amended vesting period of forty-eight months
Restricted Stock Units
The following table summarizes restricted stock units activity for the year ended
December 31, 2018
:
|
Number of
Shares |
Weighted-
Average Grant Date Fair Value |
||||||
|
Unvested as of December 31, 2017
|
—
|
|
$
|
—
|
|
||
|
Granted
|
54,036
|
|
$
|
11.79
|
|
||
|
Forfeited
|
(600
|
)
|
20.60
|
|
|||
|
Vested
|
—
|
|
$
|
—
|
|
||
|
Unvested as of December 31, 2018
|
53,436
|
|
$
|
11.69
|
|
||
117
SI-BONE, INC.
NOTES TO CONSOLIDATED FINANCIAL STATEMENTS
As of
December 31, 2018
, there was a total unrecognized compensation cost of
$4.5 million
. These costs are expected to be recognized over a period of approximately
2.29 years
.
Employee Stock Purchase Plan
In October 2018, the Company adopted the 2018 Employee Stock Purchase Plan (the "ESPP").
515,307
shares of common stock are reserved for issuance under the ESPP. The Company recognized
$0.1 million
compensation expense for the ESPP. As of
December 31, 2018
, the unrecognized compensation cost for the ESPP was approximately
$0.3 million
.
The assumptions used to determine the grant date fair value of employee stock options and ESPP purchase rights for the periods presented are as follows:
|
Year ended
|
||
|
December 31,
|
||
|
2018
|
||
|
Expected term
|
0.5
|
|
|
Expected volatility
|
43.96%
|
|
|
Risk-free interest rate
|
2.49%
|
|
|
Dividend yield
|
—%
|
|
12. Employee Benefit Plan
The Company sponsors a 401(k) plan covering all employees. Contributions made by the Company are discretionary and are determined annually by the Board of Directors. The Company has made no contributions to the 401(k) plan since its inception.
13. Related Party Transactions
In March 2013, the Company granted a loan to its then current Chief Financial Officer to assist with the exercise of his stock option grants in the form of a full recourse promissory note with an aggregate principal amount of
$0.2 million
. The note is collateralized by the common stock issued upon the exercise of the stock options, as well as personal assets of the borrower. Interest under this note will accrue at the rate of
1.09%
per annum. In November 2016, the loan amount was partially repaid in the amount of
$0.1 million
(including principal and interest). The remainder of the principal balance of this note, together with all accrued and unpaid interest to date, was fully paid in December 2017.
In February 2014, the Company granted a loan to its Chief Executive Officer to assist with the exercise of his stock option grants in the form of a full recourse promissory note with an aggregate principal amount of
$0.4 million
. The note is collateralized by the common stock issued upon the exercise of the stock options, as well as personal assets of the borrower. At the time of issuance, the Company accounted for the note as a full recourse promissory note based on historical pattern of collecting payment on notes in full and no other notes had been forgiven, nor had any recourse notes been substantively converted to nonrecourse. Interest under this note will accrue at the rate of
1.97%
per annum. The principal balance of this note, together with all accrued and unpaid interest to date, was due in February 2019. In March 2017, the Company forgave
$0.2 million
of principal and interest due on this promissory note from its Chief Executive Officer. In addition, the Board of Directors approved the forgiveness of the remaining
50%
of the principal balance of the note in January 2018. At the time of the forgiveness, all of the related stock options were fully vested. As a result, the Company expensed the principal note balance of
$0.4 million
to stock-based compensation expense and accrued interest of
$0.1 million
to general and administrative expenses in the consolidated statement of operations in the year ended December 31, 2017.
118
SI-BONE, INC.
NOTES TO CONSOLIDATED FINANCIAL STATEMENTS
14. Net Loss Per Share of Common Stock
Basic and Diluted Net Loss per Share
The following table summarizes the computation of basic and diluted net loss per share (in thousands, except share and per share data):
|
Year ended
December 31, |
|||||||
|
2018
|
2017
|
||||||
|
Net loss
|
$
|
(17,453
|
)
|
$
|
(23,039
|
)
|
|
|
Weighted-average shares used to compute basic and diluted net loss per share*
|
7,950,284
|
|
3,467,096
|
|
|||
|
Net loss per share, basic and diluted*
|
$
|
(2.20
|
)
|
$
|
(6.65
|
)
|
|
_________________________________________
* Calculated based on the 1-for-18 reverse stock split effected October 4, 2018.
Unvested shares for the years ended
December 31, 2018
and
December 31, 2017
were excluded from the weighted-average shares used to compute basic and diluted net loss per share.
The following common stock equivalents were excluded from the computation of diluted net loss per share for the periods presented because including them would have been antidilutive:
|
December 31,
|
|||||
|
2018
|
2017
|
||||
|
Stock options
|
2,641,198
|
3,001,929
|
|||
|
Shares subject to repurchase
|
74,019
|
16,117
|
|||
|
Unvested restricted stock units
|
53,436
|
|
—
|
|
|
|
Estimated ESPP shares
|
89,606
|
—
|
|
||
|
Redeemable convertible preferred stock
|
—
|
|
12,066,654
|
||
|
Redeemable convertible preferred stock warrants
|
—
|
|
160,657
|
||
|
Common stock warrants
|
118,122
|
124,326
|
|||
119
SI-BONE, INC.
NOTES TO CONSOLIDATED FINANCIAL STATEMENTS
15. Income Taxes
The components of the Company’s loss before income taxes are as follows (in thousands):
|
Year Ended December 31,
|
|||||
|
2018
|
2017
|
||||
|
Domestic
|
(16,835
|
)
|
(22,717
|
)
|
|
|
Foreign
|
(618
|
)
|
(322
|
)
|
|
|
Loss before income taxes
|
(17,453
|
)
|
(23,039
|
)
|
|
The components of income tax expense are as follows (in thousands):
|
Year Ended December 31,
|
|||||||
|
2018
|
2017
|
||||||
|
Current tax expense:
|
|||||||
|
Federal
|
$
|
—
|
|
$
|
—
|
|
|
|
State
|
—
|
|
—
|
|
|||
|
Foreign
|
—
|
|
—
|
|
|||
|
Total current tax expense
|
—
|
|
—
|
|
|||
|
Deferred tax expense:
|
|||||||
|
Federal
|
3,555
|
|
(9,574
|
)
|
|||
|
State
|
822
|
|
2,061
|
|
|||
|
Foreign
|
200
|
|
—
|
|
|||
|
Total deferred tax expense
|
4,577
|
|
(7,513
|
)
|
|||
|
Change in deferred tax valuation allowance
|
(4,577
|
)
|
7,513
|
|
|||
|
Net deferred tax expense
|
—
|
|
—
|
|
|||
|
Provision for income taxes
|
$
|
—
|
|
$
|
—
|
|
|
Income tax expense differs from the amount computed by applying the statutory federal income tax rate due to the following:
|
Year Ended December 31,
|
|||||
|
2018
|
2017
|
||||
|
Tax at statutory federal rate
|
(21.0
|
)%
|
(34.0
|
)%
|
|
|
State tax, net of federal benefit
|
(5.3
|
)%
|
(4.3
|
)%
|
|
|
Measurement of deferred taxes as a result of tax reform
|
—
|
%
|
68.7
|
%
|
|
|
Tax credits
|
(0.7
|
)%
|
(0.3
|
)%
|
|
|
Change in deferred tax valuation allowance
|
26.2
|
%
|
(32.6
|
)%
|
|
|
Other
|
0.8
|
%
|
2.5
|
%
|
|
|
Total income tax expense
|
—
|
%
|
—
|
%
|
|
120
SI-BONE, INC.
NOTES TO CONSOLIDATED FINANCIAL STATEMENTS
The tax effects of temporary differences and carryforwards that give rise to significant portions of the deferred tax assets are presented below (in thousands):
|
December 31,
|
|||||||
|
2018
|
2017
|
||||||
|
Net operating loss carryforwards
|
$
|
35,067
|
|
$
|
32,210
|
|
|
|
Research and development credits
|
2,255
|
|
2,070
|
|
|||
|
Depreciation and amortization
|
132
|
|
179
|
|
|||
|
Accruals and reserves
|
2,958
|
|
1,376
|
|
|||
|
40,412
|
|
35,835
|
|
||||
|
Less: Valuation allowance
|
(40,412
|
)
|
(35,835
|
)
|
|||
|
Total deferred tax asset
|
$
|
—
|
|
$
|
—
|
|
|
The Company has established a full valuation allowance against its deferred tax assets due to the uncertainty surrounding realization of such assets. The following table summarizes changes in the valuation allowance for the year ended December 31, 2018 and 2017 (in thousands):
|
December 31,
|
|||||||
|
2018
|
2017
|
||||||
|
Beginning balance
|
$
|
35,835
|
|
$
|
43,348
|
|
|
|
Additions during the period
|
4,577
|
|
—
|
|
|||
|
Deductions during the period
|
—
|
|
(7,513
|
)
|
|||
|
Ending balance
|
$
|
40,412
|
|
$
|
35,835
|
|
|
As of December 31, 2018, the Company had net operating loss (“NOL”) carryforwards of approximately
$135.5 million
and
$109.9 million
available to reduce future taxable income, if any, for federal and state income tax purposes, respectively. If not utilized, the Company’s federal net operating loss carryforward begins to expire in
2029
, and the state net operating loss carryforward begins to expire in
2019
.
As of December 31, 2018, the Company had credit carryforwards of approximately
$1.7 million
and
$1.9 million
available to reduce future taxable income, if any, for both federal and state income tax purposes, respectively. The federal credits begin to expire in
2030
, and the state credits have no expiration date.
The Tax Reform Act of 1986 limits the use of net operating loss and tax credit carryforwards in certain situations where changes occur in the stock ownership of a company. In general, if the Company experiences a greater than 50 percentage point aggregate change in ownership over a three-year period (a Section 382 ownership change), utilization of its pre-change NOL carryforwards are subject to an annual limitation under Section 382 of the Internal Revenue Code (California has similar laws). The annual limitation generally is determined by multiplying the value of the Company’s stock at the time of such ownership change (subject to certain adjustments) by the applicable long-term tax-exempt rate. Such limitations may result in expiration of a portion of the NOL carryforwards before utilization. The Company has not utilized any NOL carryovers through December 31, 2018. In addition, the Company’s deferred tax assets are subject to full valuation allowance, and thus no benefit for deferred tax assets have been recorded. The Company has determined that it experienced Section 382 ownership changes in 2010 and
$1.4 million
of its NOLs are limited. The Company is currently performing an analysis to determine whether any additional NOL carryforwards are limited due to a change in ownership as a result of its recent IPO.
The Company accounts for the uncertainty in income taxes by utilizing a comprehensive model for the recognition, measurement, presentation and disclosure in financial statements of any uncertain tax positions that have been taken or are expected to be taken on an income tax return. The changes in the Company’s uncertain income tax positions for the years ended December 31, 2018 and 2017 consisted of the following (in thousands):
121
SI-BONE, INC.
NOTES TO CONSOLIDATED FINANCIAL STATEMENTS
|
Beginning balance as of January 1, 2017
|
$
|
950
|
|
|
Increases in balances related to tax positions taken during 2017
|
43
|
|
|
|
Ending balance as of December 31, 2017
|
993
|
|
|
|
Increases in balances related to tax positions taken during 2018
|
91
|
|
|
|
Ending balance as of December 31, 2018
|
$
|
1,084
|
|
The Company has elected to recognize interest and penalties related to uncertain tax positions as a component of income tax expense. The Company has accrued
zero
at December 31, 2018 and 2017 for payment of interest related to unrecognized tax benefits. None of the Company’s unrecognized tax benefits that, if recognized, would affect its effective tax rate at December 31, 2018.
The Company currently has no federal or state tax examinations in progress nor has it had any federal or state examinations since inception. As a result of the Company’s net operating loss carry forwards, all of its tax years are subject to federal and state tax examinations.
On December 22, 2017, the United States enacted a law commonly known as the Tax Cuts and Jobs Act (“TCJA”) which makes widespread changes to the Internal Revenue Code, including a reduction in the federal corporate tax rate to 21%, effective January 1, 2018.
The Company is subject to the provisions of the Financial Accounting Standards Board (“FASB”) ASC 740-10, Income Taxes, which requires that the effect on deferred tax assets and liabilities of a change in tax rates be recognized in the period the tax rate change was enacted. The carrying value of U.S. deferred taxes is determined by the enacted U.S. corporate income tax rate. Consequently, the reduction in the U.S. corporate income tax rate impacts the carrying value of deferred tax assets. Under the new corporate income tax rate of 21%, the U.S. net deferred tax asset position decreased by approximately
$15.8 million
. Uncertainty regarding the impact of tax reform remains, as a result of factors including future regulatory and rulemaking processes, the prospects of additional corrective or supplemental legislation, potential trade or other litigation, and other factors.
In December 2017, the SEC staff issued Staff Accounting Bulletin No. 118 (“SAB 118”), which provides guidance for the tax effect of the 2017 Tax Act. SAB 118 provides a measurement period that should not extend beyond one year from the 2017 Tax Act’s enactment date for companies to complete the accounting under Accounting Standards Codification Topic 740, Income Taxes (“ASC 740”). In accordance with SAB 118, the Company must reflect the income tax effects of those aspects of the 2017 Tax Act for which the accounting under ASC 740 is complete. To the extent that its accounting for certain income tax effects of the 2017 Tax Act is incomplete, but the Company is able to determine a reasonable estimate, the Company must record a provisional estimate in its consolidated financial statements. If the Company cannot determine a provisional estimate to be included in its consolidated financial statements, the Company should continue to apply ASC 740 on the basis of the provisions of the tax laws that were in effect immediately before the enactment of the 2017 Tax Act. It is expected that the U.S. Treasury will issue regulations and other guidance on the application of certain provisions of the 2017 Tax Act. The Company has analyzed the guidance and other necessary information related to the tax effects of the 2017 Tax Act and considers the accounting of its net deferred tax assets complete in accordance with SAB 118.
122
Item 9. Changes in and Disagreements with Accountants on Accounting and Financial Disclosure.
None.
Item 9A. Controls and Procedures.
Evaluation of disclosure controls and procedures.
We maintain disclosure controls and procedures that are designed to ensure that information required to be disclosed in the reports that we file or submit under the Securities and Exchange Act of 1934 is (i) recorded, processed, summarized and reported within the time periods specified in the SEC’s rules and forms and (ii) accumulated and communicated to our management, including our principal executive officer and principal financial officer, to allow timely decisions regarding required disclosure.
The effectiveness of any system of internal control over financial reporting, including ours, is subject to inherent limitations, including the exercise of judgment in designing, implementing, operating, and evaluating the controls and procedures, and the inability to eliminate misconduct completely. Accordingly, any system of internal control over financial reporting, including ours, no matter how well designed and operated, can only provide reasonable, not absolute assurances. In addition, projections of any evaluation of effectiveness to future periods are subject to the risk that controls may become inadequate because of changes in conditions, or that the degree of compliance with the policies or procedures may deteriorate. We intend to continue to monitor and upgrade our internal controls as necessary or appropriate for our business, but cannot assure you that such improvements will be sufficient to provide us with effective internal control over financial reporting.
As of December 31, 201, our management, with the participation of our Chief Executive Officer and our Chief Financial Officer, have evaluated our disclosure controls and procedures (as defined in Rules 13a‑15(e) and 15d‑15(e) under the Securities Exchange Act of 1934, as amended). Based on that evaluation, our Chief Executive Officer and our Chief Financial Officer have concluded that, as of December 31, 2018, our disclosure controls and procedures were effective at the reasonable assurance level. Additionally, our management has concluded that the financial statements included elsewhere in this report present fairly, in all material respects, our financial position, results of operations and cash flows in conformity with GAAP.
Exemption from management’s report on internal control over financial reporting for the fiscal year ended December 31, 2018.
This Annual Report on Form 10‑K does not include a report of management’s assessment regarding internal control over financial reporting or an attestation report of our independent registered public accounting firm due to a transition period established by the rules of the SEC for newly public companies.
Changes in internal control over financial reporting.
There were no changes in our internal control over financial reporting during the fourth quarter of the year ended December 31, 2018, that have materially affected, or are reasonably likely to materially affect, our internal control over financial reporting.
Item 9B. Other Information
None.
123
PART III
Item 10. Directors, Executive Officers and Corporate Governance.
Information required by this item will be contained in our definitive proxy statement to be filed with the Securities and Exchange Commission on Schedule 14A in connection with our 2019 Annual Meeting of Stockholders, or the Proxy Statement, which will be filed not later than 120 days after the end of our fiscal year ended December 31, 2018, under the headings “Management,” “Proposal 1 - Election of Directors,” “Board Committees and Meetings,” and “Section 16(a) Beneficial Ownership Reporting Compliance,” and is incorporated herein by reference.
We have adopted a Code of Business Conduct and Ethics that applies to our officers, directors and employees which is available on our website at www.si-bone.com. The Code of Business Conduct and Ethics is intended to qualify as a “code of ethics” within the meaning of Section 406 of the Sarbanes-Oxley Act of 2002 and Item 406 of Regulation S-K. In addition, we intend to promptly disclose (1) the nature of any substantive amendment to our Code of Business Conduct and Ethics that applies to our principal executive officer, principal financial officer, principal accounting officer or controller or persons performing similar functions and (2) the nature of any waiver, including an implicit waiver, from a provision of our code of ethics that is granted to one of these specified officers, the name of such person who is granted the waiver and the date of the waiver, on our website in the future.
Item 11. Executive Compensation.
The information required by this item regarding executive compensation will be incorporated by reference to the information set forth in the sections titled “Executive Compensation” and “Compensation of Non-Employee Board Members” in our Proxy Statement.
Item 12. Security Ownership of Certain Beneficial Owners and Management and Related Stockholder Matters.
The information required by this item regarding security ownership of certain beneficial owners and management will be incorporated by reference to the information set forth in the sections titled “Security Ownership of Certain Beneficial Owners and Management” and “Securities Authorized for Issuance Under Equity Compensation Plans” in our Proxy Statement.
Item 13. Certain Relationships and Related Transactions, and Director Independence.
The information required by this item regarding certain relationships and related transactions and director independence will be incorporated by reference to the information set forth in the sections titled “Certain Relationships and Related Party Transactions” and “Proposal 1 - Election of Directors”, respectively, in our Proxy Statement.
Item 14. Principal Accounting Fees and Services.
The information required by this item regarding principal accountant fees and services will be incorporated by reference to the information set forth in the section titled “Principal Accountant Fees and Services” in our Proxy Statement.
124
Item 15. Exhibits, Financial Statement Schedules.
(a) The following documents are filed as part of this report:
1. Financial Statements
Information in response to this Item is included in Part II, Item 8 of this Annual Report on Form 10‑K.
2. Financial Statement Schedules
All schedules are omitted because they are not applicable or the required information is shown in the financial statements or notes thereto.
3. Exhibits
EXHIBIT INDEX
|
Incorporation By Reference
|
||||||||||
|
Exhibit
Number |
Description
|
Form
|
SEC File No.
|
Exhibit
|
Filing Date
|
|||||
|
3.1
|
8-K
|
001-38701
|
3.1
|
10/19/2018
|
||||||
|
3.2
|
S-1/A
|
333-227445
|
3.4
|
10/5/2018
|
||||||
|
4.1
|
S-1/A
|
333-227445
|
4.1
|
10/5/2018
|
||||||
|
4.2
|
333-227445
|
|||||||||
|
10.1+
|
S-1
|
333-227445
|
10.1
|
9/20/2018
|
||||||
|
10.2+
|
S-1/A
|
333-227445
|
10.2
|
10/5/2018
|
||||||
|
10.3+
|
S-1/A
|
333-227445
|
10.3
|
10/5/2018
|
||||||
|
10.4+
|
S-1/A
|
333-227445
|
10.4
|
10/5/2018
|
||||||
|
10.5+
|
S-1/A
|
333-227445
|
10.5
|
10/5/2018
|
||||||
|
10.6+
|
S-1/A
|
333-227445
|
10.6
|
10/5/2018
|
||||||
|
10.7#
|
S-1
|
333-227445
|
10.5
|
9/20/2018
|
||||||
125
|
10.8#
|
S-1
|
333-227445
|
10.6
|
9/20/2018
|
||||||
|
10.9+
|
S-1
|
333-227445
|
10.7
|
9/20/2018
|
||||||
|
10.10+
|
S-1
|
333-227445
|
10.8
|
9/20/2018
|
||||||
|
10.11+
|
S-1
|
333-227445
|
10.9
|
9/20/2018
|
||||||
|
10.12+
|
S-1
|
333-227445
|
10.10
|
9/20/2018
|
||||||
|
10.13+
|
S-1
|
333-227445
|
10.11
|
9/20/2018
|
||||||
|
10.14+
|
S-1
|
333-227445
|
10.12
|
9/20/2018
|
||||||
|
10.15+
|
S-1
|
333-227445
|
10.13
|
9/20/2018
|
||||||
|
10.16+
|
S-1
|
333-227445
|
10.14
|
9/20/2018
|
||||||
|
10.17+
|
S-1
|
333-227445
|
10.15
|
9/20/2018
|
||||||
|
10.18+
|
S-1
|
333-227445
|
10.16
|
9/20/2018
|
||||||
|
10.19+
|
S-1
|
333-227445
|
10.17
|
9/20/2018
|
||||||
|
10.20+
|
S-1
|
333-227445
|
10.18
|
9/20/2018
|
||||||
|
10.21
|
S-1/A
|
333-227445
|
10.21
|
10/5/2018
|
||||||
|
10.22
|
S-1
|
333-227445
|
10.20
|
9/20/2018
|
||||||
|
10.23
|
S-1
|
333-227445
|
10.21
|
9/20/2018
|
||||||
|
10.24
|
S-1
|
333-227445
|
10.22
|
9/20/2018
|
||||||
|
10.25
|
S-1
|
333-227445
|
10.23
|
9/20/2018
|
||||||
126
|
10.26
|
S-1
|
333-227445
|
10.24
|
9/20/2018
|
||||||
|
10.27
|
S-1
|
333-227445
|
10.25
|
9/20/2018
|
||||||
|
10.28
|
S-1
|
333-227445
|
10.26
|
9/20/2018
|
||||||
|
10.29
|
S-1
|
333-227445
|
10.27
|
9/20/2018
|
||||||
|
10.30
|
S-1
|
333-227445
|
10.28
|
9/20/2018
|
||||||
|
10.31
|
S-1
|
333-227445
|
10.29
|
9/20/2018
|
||||||
|
10.32
|
S-1
|
333-227445
|
10.30
|
9/20/2018
|
||||||
|
21.1*
|
||||||||||
|
23.1*
|
||||||||||
|
24.1*
|
||||||||||
|
31.1*
|
||||||||||
|
31.2*
|
||||||||||
|
32.1**
|
||||||||||
|
101.INS
|
XBRL Instance Document
|
|||||||||
|
101.SCH
|
XBRL Taxonomy Extension Schema Document
|
|||||||||
|
101.CAL
|
XBRL Taxonomy Extension Calculation Linkbase Document
|
|||||||||
|
101.DEF
|
XBRL Taxonomy Extension Definition Linkbase Document
|
|||||||||
|
101.LAB
|
XBRL Taxonomy Extension Label Linkbase Document
|
|||||||||
127
|
101.PRE
|
XBRL Taxonomy Extension Presentation Linkbase Document
|
|||||||||
|
*
|
Filed herewith.
|
|
**
|
Furnished herewith. Exhibit 32.1 is being furnished and shall not be deemed to be “filed” for purposes of Section 18 of the Securities Exchange Act of 1934, as amended (the “Exchange Act”), or otherwise subject to the liability of that section, nor shall such exhibit be deemed to be incorporated by reference in any registration statement or other document filed under the Securities Act of 1933, as amended, or the Exchange Act, except as otherwise specifically stated in such filing.
|
|
+
|
Indicates a management contract or compensatory plan.
|
|
#
|
Confidential treatment has been granted with respect to certain portions of this exhibit. Omitted portions have been filed separately with the Securities and Exchange Commission.
|
(b) We have filed, or incorporated into this Annual Report on Form 10‑K by reference, the exhibits listed on the Exhibit Index immediately above.
(c) See Item 15(a)2 above.
Item 16. Form 10-K Summary
None.
128
SIGNATURES
Pursuant to the requirements of Section 13 or 15(d) of the Securities Exchange Act of 1934, as amended, the Registrant has duly caused this Report to be signed on its behalf by the undersigned, thereunto duly authorized, in Santa Clara, California, on this 14th day of March, 2019.
|
SI-BONE, Inc.
|
||
|
By:
|
/s/ Jeffrey W. Dunn
|
|
|
Jeffrey W. Dunn
|
||
|
President and Chief Executive Officer
|
||
|
(Duly Authorized Officer and Principal Executive Officer
)
|
||
|
SI-BONE, Inc.
|
||
|
By:
|
/s/ Laura A. Francis
|
|
|
Laura A. Francis
|
||
|
Chief Financial Officer
|
||
|
(Principal Financial and Accounting Officer)
|
||
KNOW ALL PERSONS BY THESE PRESENTS, that each person whose signature appears below constitutes and appoints Laura A. Francis, and Michael A. Pisetsky, and each of them, as his or her true and lawful attorneys-in-fact and agents, each with the full power of substitution, for him or her and in his or her name, place or stead, in any and all capacities, to sign any and all amendments to this Annual Report on Form 10‑K, and to file the same, with all exhibits thereto and other documents in connection therewith, with the Securities and Exchange Commission, granting unto said attorneys-in-fact and agents, and each of them, full power and authority to do and perform each and every act and thing requisite and necessary to be done in and about the premises, as fully to all intents and purposes as he might or could do in person, hereby ratifying and confirming all that said attorneys-in-fact and agents, or their or his substitute or substitutes, may lawfully do or cause to be done by virtue hereof.
Pursuant to the requirements of the Securities Exchange Act of 1934, as amended, this Report has been signed below by the following persons on behalf of the Registrant in the capacities and on the dates indicated.
|
Signature
|
|
Title
|
|
Date
|
|
/s/ Jeffrey W. Dunn
|
President and Chief Executive Officer
|
March 14, 2019
|
||
|
Jeffrey W. Dunn
|
(Principal Executive Officer) and Director
|
|||
|
/s/ Laura A. Francis
|
Chief Financial Officer
|
March 14, 2019
|
||
|
Laura A. Francis
|
(Principal Financial and Accounting Officer)
|
|||
|
/s/ David P. Bonita, M.D.
|
Director
|
March 14, 2019
|
||
|
David P. Bonita, M.D.
|
||||
|
/s/ Timothy E. Davis, Jr.
|
Director
|
March 14, 2019
|
||
|
Timothy E. Davis, Jr.
|
||||
|
/s/John G. Freund, M.D.
|
Director
|
March 14, 2019
|
||
|
John G. Freund, M.D.
|
||||
|
/s/ Gregory K. Hinckley
|
Director
|
March 14, 2019
|
||
|
Gregory K. Hinckley
|
||||
|
/s/ Karen A. Licitra
|
Director
|
March 14, 2019
|
||
|
Karen A. Licitra
|
||||
|
/s/ Mark A. Reiley, M.D.
|
Director
|
March 14, 2019
|
||
|
Mark A. Reiley, M.D.
|
||||
|
/sTimothy B. Petersen.
|
Director
|
March 14, 2019
|
||
|
Timothy B. Petersen
|
||||
|
/s/ Keith C. Valentine
|
Director
|
March 14, 2019
|
||
|
Keith C. Valentine
|
||||
TABLE OF CONTENTS
Part IItem 1. BusinessItem 1A. Risk FactorsItem 1B Unresolved Staff CommentsItem 2. PropertiesItem 3. Legal ProceedingsItem 4. Mine Safety DisclosuresPart IIItem 5. Market For Registrant S Common Equity, Related Stockholder Matters and Issuer Purchases Of Equity SecuritiesItem 6. Selected Financial DataItem 7. Management S Discussion and Analysis Of Financial Condition and Results Of OperationsItem 7A. Quantitative and Qualitative Disclosures About Market RiskItem 8. Financial Statements and Supplementary DataItem 9. Changes in and Disagreements with Accountants on Accounting and Financial DisclosureItem 9A. Controls and ProceduresItem 9B. Other InformationPart IIIItem 10. Directors, Executive Officers and Corporate GovernanceItem 11. Executive CompensationItem 12. Security Ownership Of Certain Beneficial Owners and Management and Related Stockholder MattersItem 13. Certain Relationships and Related Transactions, and Director IndependenceItem 14. Principal Accounting Fees and ServicesItem 15. Exhibits, Financial Statement SchedulesItem 16. Form 10-k Summary