SILVER ELEPHANT MINING CORP.
UNITED STATES
SECURITIES
AND EXCHANGE COMMISSION
Washington, D.C.
20549
FORM 20-F
☐
REGISTRATION
STATEMENT PURSUANT TO SECTION 12(b) OR (g) OF THE SECURITIES
EXCHANGE ACT OF 1934.
OR
☒
ANNUAL REPORT PURSUANT TO SECTION 13 OR 15(d) OF THE
SECURITIES EXCHANGE ACT OF 1934
For the
fiscal year ended
December 31,
2020
OR
☐
TRANSITION REPORT
PURSUANT TO SECTION 13 OR 15(d) OF THE SECURITIES EXCHANGE ACT OF
1934
For the
transition period from _____________to _____________
OR
☐
SHELL COMPANY
REPORT PURSUANT TO SECTION 13 OR 15(d) OF THE SECURITIES EXCHANGE
ACT OF 1934
Commission
file number:
000-55985
SILVER ELEPHANT MINING CORP.
(Exact
name of Registrant as specified in its charter)
British Columbia, Canada
(Jurisdiction
of incorporation or organization)
Suite
1610 - 409 Granville Street
Vancouver, British Columbia, Canada V6C 1T2
(Address
of principal executive offices)
John
Lee
Suite
1610 - 409 Granville Street
Vancouver,
British Columbia, Canada V6C 1T2
Telephone: 604-569-3661, Facsimile: 604-569-3617 Email:
info@silverelef.com
(Name,
Telephone, E-Mail and/or Facsimile number and Address of Company
Contact Person)
Copy of
communications to:
James
Guttman Dorsey & Whitney LLP
Brookfield
Place 161 Bay Street, Suite 4310
Toronto,
Ontario, Canada M5J 2S1
Telephone:
(416) 367-7376 Facsimile:
(416) 367-7371
Securities
registered or to be registered pursuant to Section 12 (b) of the
Act:
None
Securities
registered or to be registered pursuant to Section 12 (g) of the
Act.
Common Shares without par value
(Title
of Class)
Securities
for which there is a reporting obligation pursuant to Section 15(d)
of the Act:
None
Indicate
the number of outstanding shares of each of the issuer’s
classes of capital or common stock as of the close of the period
covered by the annual report:
180,518,828 Common Shares as at December 31,
2020
Indicate
by check mark if the registrant is a well-known seasoned issuer, as
defined in Rule 405 of the Securities Act. Yes
☐
No
☒
If this
report is an annual or transition report, indicate by check mark if
the registrant is not required to file reports pursuant to Section
13 or 15(d) of the Securities Exchange Act of 1934
Yes
☐
No
☒
Indicate
by check mark whether the registrant (1) has filed all reports
required to be filed by Section 13 or 15(d) of the Securities
Exchange Act of 1934 during the preceding 12 months (or such
shorter period that the registrant was required to file such
reports), and (2) has been subject to such filing requirements for
the past 90 days.
Yes
☒
No
☐
Indicate
by check mark whether the registrant has submitted electronically
every Interactive Data File required to be submitted and posted
pursuant to Rule 405 of Regulation S-T (§232.405 of this
chapter) during the preceding 12 months (or for such shorter period
that the registrant was required to submit and post such
files).
Yes
☒
No
☐
|
Large
accelerated filer
☐
|
Accelerated
filer
☐
|
Non-accelerated
filer
☒
Emerging growth
company
☒
|
If an
emerging growth company that prepares its financial statements in
accordance with U.S. GAAP, indicate by check mark if the registrant
has elected not to use the extended transition period for complying
with any new or revised financial accounting standards provided
pursuant to Section 13(a) of the Exchange Act.
☐
Indicate
by check mark whether the registrant has filed a report on and
attestation to its management’s assessment of the
effectiveness of its internal control over financial reporting
under Section 404(b) of the Sarbanes-Oxley Act (15 U.S.C. 7262(b))
by the registered public accounting firm that prepared or issued
its audit report.
☐
Indicate
by check mark which basis of accounting the registrant has used to
prepare the financial statements included in this
filing:
U.S.
GAAP
☐
International Financial
Reporting Standards as issued By the International Accounting
Standards Board
☒
Other
☐
If
“Other” has been checked in response to previous
question, indicate by check mark which financial statement item the
registrant has elected to follow.
Item 17
☐
Item 18
☐
If this
is an annual report, indicate by check mark whether the registrant
is a shell company (as defined in Rule 12b-2 of the Exchange
Act).
Yes
☐
No
☒
TABLE OF CONTENTS
|
|
|
Page
|
|
|
PART
I
|
|
10
|
|
|
|
|
|
|
|
ITEM
1.
|
IDENTITY
OF DIRECTORS, SENIOR MANAGEMENT AND ADVISERS
|
10
|
|
|
|
|
|
|
|
ITEM
2
|
OFFER
STATISTICS AND EXPECTED TIMETABLE
|
10
|
|
|
|
|
|
|
|
ITEM
3.
|
KEY
INFORMATION
|
10
|
|
|
|
|
|
|
|
|
A. Selected
Financial Data
|
10
|
|
|
|
B. Capitalization
and Indebtedness
|
10
|
|
|
|
C. Reasons
for the Offer and Use of Proceeds
|
10
|
|
|
|
D. Risk
Factors
|
10
|
|
|
|
|
|
|
|
ITEM
4.
|
INFORMATION
ON THE COMPANY
|
22
|
|
|
|
|
|
|
|
|
A. History
and Development of the Company
|
22
|
|
|
|
B. Business
Overview
|
31
|
|
|
|
C. Organizational
Structure
|
33
|
|
|
|
D. Property,
Plants and Equipment
|
34
|
|
|
|
|
|
|
|
|
ITEM
4A. UNRESOLVED STAFF COMMENTS
|
91
|
|
|
|
|
|
|
|
ITEM
5.
|
OPERATING
AND FINANCIAL REVIEW AND PROSPECTS
|
91
|
|
|
|
|
|
|
|
|
A. Operating
Results
|
91
|
|
|
|
B. Liquidity
and Capital Resources
|
93
|
|
|
|
C. Research
and Development, Patents and Licenses, etc.
|
97
|
|
|
|
D. Trend
Information
|
97
|
|
|
|
E. Off-Balance
Sheet Arrangements
|
97
|
|
|
|
F. Tabular
Disclosure of Contractual Obligations
|
97
|
|
|
|
G. Safe
Harbor
|
98
|
|
|
|
|
|
|
|
ITEM
6.
|
DIRECTORS,
SENIOR MANAGEMENT AND EMPLOYEES
|
98
|
|
|
|
|
|
|
|
|
A. Directors
and Senior Management
|
98
|
|
|
|
B. Compensation
|
102
|
|
|
|
C. Board
Practices
|
105
|
|
|
|
D. Employees
|
105
|
|
|
|
E. Share
Ownership
|
108
|
|
|
|
|
|
|
|
ITEM
7.
|
MAJOR
SHAREHOLDERS AND RELATED PARTY TRANSACTIONS
|
109
|
|
|
|
|
|
|
|
|
A. Major
Shareholders
|
109
|
|
|
|
B. Related
Party Transactions
|
110
|
|
|
|
C. Interests
of Experts and Counsel
|
110
|
|
|
|
|
|
|
|
ITEM
8.
|
FINANCIAL
INFORMATION
|
110
|
|
|
|
|
|
|
|
|
A. Consolidated
Statements and Other Financial Information
|
110
|
|
|
|
B. Significant
Changes
|
111
|
|
|
|
|
|
|
|
ITEM
9.
|
THE
OFFER AND LISTING
|
112
|
|
|
|
|
|
|
|
|
A. Offer
and Listing Details
|
112
|
|
|
|
B. Plan
of Distribution
|
112
|
|
|
|
C. Markets
|
112
|
|
|
|
D. Selling
Shareholders
|
112
|
|
|
|
E. Dilution
|
112
|
|
|
|
F.
Expenses of the
Issuer
|
112
|
|
3
|
|
|
|
|
ITEM
10.
|
ADDITIONAL
INFORMATION
|
112
|
|
|
|
|
|
|
A. Share
Capital
|
112
|
|
|
B. Memorandum
and Articles of Association
|
112
|
|
|
C. Material
Contracts
|
115
|
|
|
D. Exchange
Controls
|
115
|
|
|
E. Taxation
|
115
|
|
|
F.
Scope of this Summary
|
116
|
|
|
G.
Dividends and Paying Agents
|
121
|
|
|
H. Statement
by Experts
|
121
|
|
|
I. Documents
on Display
|
121
|
|
|
J. Subsidiary
Information
|
122
|
|
|
|
|
|
ITEM
11.
|
QUANTITATIVE
AND QUALITATIVE DISCLOSURES ABOUT MARKET RISK
|
122
|
|
|
|
|
|
ITEM
12.
|
DESCRIPTION
OF SECURITIES OTHER THAN EQUITY SECURITIES
|
122
|
|
|
|
|
|
|
A. -
C.
|
122
|
|
|
D. American
Depository Receipts
|
122
|
|
PART
II
|
|
|
|
|
|
|
|
ITEM
13.
|
DEFAULTS,
DIVIDEND ARREARAGES AND DELINQUENCIES
|
123
|
|
|
|
|
|
ITEM
14.
|
MATERIAL
MODIFICATIONS TO THE RIGHTS OF SECURITY HOLDERS AND USE OF
PROCEEDS
|
123
|
|
|
|
|
|
ITEM
15.
|
CONTROLS
AND PROCEDURES
|
123
|
|
|
|
|
|
|
A. Disclosure
Controls and Procedures
|
123
|
|
|
B. Management's
Annual Report on Internal Control Over Financial
Reporting
|
123
|
|
|
C. Attestation
Report of the Registered Public Accounting Firm
|
123
|
|
|
D. Changes
in Internal Control Over Financial Reporting
|
123
|
|
|
|
|
|
ITEM
16.
|
[RESERVED]
|
123
|
|
|
|
|
|
|
ITEM
16A. AUDIT
COMMITTEE FINANCIAL EXPERT
|
124
|
|
|
ITEM
16B. CODE
OF ETHICS
|
124
|
|
|
ITEM
16C. PRINCIPAL
ACCOUNTANT FEES AND SERVICES
|
124
|
|
|
ITEM
16D. EXEMPTIONS
FROM THE LISTING STANDARDS FOR AUDIT COMMITTEES
|
124
|
|
|
ITEM
16E. PURCHASES
OF EQUITY SECURITIES BY THE ISSUER AND AFFILIATED
PURCHASERS
|
124
|
|
|
ITEM
16F. CHANGE
IN REGISTRANT’S CERTIFYING ACCOUNTANT
|
124
|
|
|
ITEM
16G. CORPORATE
GOVERNANCE
|
124
|
|
|
ITEM
16H. MINE
SAFETY DISCLOSURE
|
124
|
|
|
|
|
|
PART
III
|
|
|
|
|
|
|
|
ITEM
17.
|
FINANCIAL
STATEMENTS
|
125
|
|
|
|
|
|
ITEM
18.
|
FINANCIAL
STATEMENTS
|
125
|
|
|
|
|
|
ITEM
19.
|
EXHIBITS
|
125
|
4
INTRODUCTORY NOTES
GENERAL INFORMATION
In this
annual report on Form 20-F (the “Annual Report”), the
terms “we”, “our”, “us”, the
“Company” refer, unless the context requires otherwise,
to Silver Elephant Mining Corp. and its subsidiaries.
References
herein to "Common Shares" are references to the Common Shares
without par value of the Company.
PRESENTATION OF FINANCIAL AND OTHER DATA
We
prepare our audited consolidated financial statements in accordance
with International Financial Reporting Standards, or
“IFRS”, as issued by the International Accounting
Standards Board, or the “IASB”. The financial
information and related discussion and analysis contained in this
annual report on Form 20-F are presented in Canadian dollars,
unless stated otherwise.
The financial
information analysis in this annual report on Form 20-F is based on
our consolidated financial statements as of December 31, 2020, 2019
and 2018, included elsewhere in this document. Percentages and some
amounts in this annual report on Form 20-F have been rounded for
ease of presentation. Any discrepancies between totals and the sums
of the amounts listed are due to rounding.
CURRENCY
Unless
otherwise indicated, all references to “dollars” or
“$” are to Canadian dollars and all references to
“US dollars,” “USD”, "US$" or "USD$" are to
United States of America dollars.
SHARE CONSOLIDATIONS AND FORWARD SPLIT
2016 Share Consolidation
On June
7, 2016, we completed a consolidation of our issued and outstanding
Common Shares on the basis of one post consolidation Common Share,
option and warrant, for 100 pre- consolidation Common Shares,
options and warrants, as applicable (we refer to this as the "2016
Consolidation").
Forward Split
On
August 8, 2018, we completed a split of our issued and outstanding
Common Shares on the basis of ten post-split Common Shares, options
and warrants for 1 pre-split Common Share, option and warrant, as
applicable (the "Forward Split").
2020 Share Consolidation
On
March 16, 2020, the shareholders approved a consolidation of our
issued and outstanding Common Shares on the basis of one (1) new
Common Share for every five (5) to ten (10) issued and outstanding
Common Shares (we refer to this as the "2020 Consolidation"). The
2020 Consolidation has not yet been effected.
All
Common Share and "per share" information in this Annual Report have
been retroactively adjusted to reflect the Forward Split and the
cumulative effect of the 2016 Consolidation and Forward Split, as
applicable, for all periods presented, unless otherwise
indicated.
CAUTIONARY NOTE REGARDING FORWARD-LOOKING STATEMENTS
Certain
statements contained in this Annual Report constitute
“forward-looking statements” within the meaning of the
Private Securities Litigation Reform Act of 1995 and
“forward-looking information” within the meaning of
Canadian securities laws and are intended to be covered by the safe
harbors provided by such regulations (collectively referred to
herein as “forward-looking statements”).
Forward-looking statements in this Annual Report are frequently,
but not always, identified by words such as “expects”,
“anticipates”, “intends”,
“believes”, “estimates”,
“potentially” or similar expressions, or statements
that events, conditions or results “will”,
“may”, “would”, “could”,
“should” occur or are “to be” achieved, and
statements related to matters which are not historical facts.
Information concerning management’s expectations regarding
our future growth, results of operations, performance, business
prospects and opportunities may also be deemed to be
forward-looking statements, as such information constitutes
predictions based on certain factors, estimates and assumptions
subject to significant business, economic, competitive and other
uncertainties and contingencies, and involve known and unknown
risks which may cause the actual results, performance, or
achievements to be different from future results, performance, or
achievements contained in our forward- looking
statements.
Such
forward-looking statements include, but are not limited to,
statements regarding the following:
●
the Company’s
planned and future exploration and/or development of the Pulacayo
Paca silver-lead-zinc property located in the Potosí
Department, Antonnio Quijarro province, Bolivia and the Gibellini
vanadium project located in the State of Nevada, USA;
●
the volatility of
the novel coronavirus (“COVID-19”) outbreak as a global
pandemic;
●
political
instability and social unrest in Bolivia and other jurisdictions
where the Company operates;
●
the use of proceeds
from the 2020 Prospectus Offering and the February 2021 Private
Placement;
●
the Company’s
goals regarding exploration, and development of, and production
from its projects, and regarding raising capital and conducting
further exploration and developments of its
properties;
●
the Company’s
future business plans;
5
●
the Company’s
future financial and operating performance;
●
the future price of
silver, lead, zinc, vanadium and other metals;
●
expectations
regarding any environmental issues that may affect planned or
future exploration and development programs and the potential
impact of complying with existing and proposed environmental laws
and regulations;
●
the ability to
obtain or maintain any required permits, licenses or other
necessary approvals for the exploration or development of the
Company’s projects;
●
government
regulation of mineral exploration and development operations in
Bolivia and other relevant jurisdictions;
●
the Company’s
reliance on key management personnel, advisors and
consultants;
●
the volatility of
global financial markets;
●
the timing and
amount of estimated future operating and exploration
expenditures;
●
the costs and
timing of the development of new deposits;
●
the continuation of
the Company as a going concern;
●
the likelihood of
securing project financing;
●
the impacts of
changes in the legal and regulatory environment in which the
Company operates;
●
the timing and
possible outcome of any pending litigation and regulatory matters;
and
●
other information
concerning possible or assumed future results of the
Company’s operations.
The
forward-looking statements in this Annual Report are based upon our
current business and operating plans, and are subject to certain
risks, uncertainties and assumptions. Many factors could cause our
actual results, performance or achievements to be materially
different from any future results, performance or achievements that
may be expressed or implied by our forward-looking statements,
including, among others:
●
the Company is an
exploration stage company;
●
the cost, timing
and amount of estimated future capital, operating exploration,
acquisition, development and reclamation activities;
●
the volatility of
the market price of the Common Shares;
●
judgment of
management when exercising discretion in the use of proceeds from
offerings of securities;
●
sales of a
significant number of Common Shares in the public markets, or the
perception of such sales, could depress the market price of the
Common Shares;
●
potential dilution
with the issuance of additional Common Shares;
●
none of the
properties in which the Company has a material interest have
mineral reserves;
●
estimates of
mineral resources are based on interpretation and assumptions and
are inherently imprecise;
●
the Company has not
received any material revenue or net profit to date;
●
exploration,
development and production risks;
●
no history of
profitable mineral production;
●
actual capital
costs, operating costs, production and economic returns may differ
significantly from those the Company has anticipated;
●
foreign operations
and political condition risks and uncertainties;
●
legal and political
risk, including as a result of the new Biden administration in the
United States;
●
amendments to local
laws;
●
the ability to
obtain, maintain or renew underlying licenses and
permits;
●
title to mineral
properties; environmental risks;
●
competitive
conditions in the mineral exploration and mining
business;
●
availability of
adequate infrastructure;
●
the ability of the
Company to retain its key management and employees and the impact
of shortages of skilled personnel and contractors;
●
limits of insurance
coverage and uninsurable risk;
●
reliance on third
party contractors;
●
the availability of
additional financing on reasonable terms or at all;
●
foreign exchange
risk;
●
impact of
anti-corruption legislation;
●
recent global
financial conditions;
●
changes to the
Company’s dividend policy;
●
conflicts of
interest;
●
cyber security
risks;
●
litigation and
regulatory proceedings;
●
the obligations
which the Company must satisfy in order to maintain its interests
in its properties;
●
the influence of
third-party stakeholders;
●
the Company’s
relationships with the communities in which it
operates;
●
human
error;
●
the speculative
nature of mineral exploration and development in general, including
the risk of diminishing quantities or grades of
mineralization;
6
●
proposed
legislation in Nevada that could increase the costs or taxation of
our operations; and
●
other risks and the
factors discussed under the heading “
Risk Factors
” in this Annual
Report.
This
foregoing list is not exhaustive of the factors that may affect any
of our forward-looking statements. Some of the important risks and
uncertainties that could affect forward- looking statements are
described further under the heading “
Risk Factors
” in this Annual
Report. Should one or more of these risks or uncertainties
materialize, or should underlying assumptions prove incorrect,
actual results may vary materially from those described herein. For
the reasons set forth above and elsewhere in this Annual Report, we
caution you not to place undue reliance on forward-looking
statements in this Annual Report.
The
forward-looking statements in this Annual Report speak only as to
the date of this Annual Report and are based on our beliefs,
opinions and expectations at the time they are made. Except as
required by law, we undertake no obligation to update or review any
forward-looking statements whether as a result of new information,
future developments or otherwise.
CAUTIONARY NOTE TO U.S. INVESTORS CONCERNING RESERVE AND RESOURCE
ESTIMATES
The
terms “mineral reserve”, “proven mineral
reserve” and “probable mineral reserve” are
Canadian mining terms as defined in accordance with
Canadian National Instrument 43- 101 –
Standards of Disclosure for Mineral Projects
(“NI
43-101”) and the Canadian Institute of Mining, Metallurgy and
Petroleum (the “CIM”) - CIM Definition Standards on
Mineral Resources and Mineral Reserves, adopted by the CIM Council,
as amended. These definitions differ from the definitions in the
United States Securities and Exchange Commission Industry Guide 7
(“SEC Industry Guide 7”) under the
United States Securities Exchange Act of
1934
, as amended (the “Exchange
Act”).
Under
SEC Industry Guide 7 standards, mineralization may not be
classified as a “reserve” unless the determination has
been made that the mineralization could be economically and legally
produced or extracted at the time the reserve determination is
made. Pursuant to SEC Industry Guide 7, a mineral reserve may not
be designated as such unless: (i) competent professional engineers
conduct a detailed engineering and economic study, and the
“bankable” or “final” feasibility study
demonstrates that a mineral deposit can be mined profitably at a
commercial rate; (ii) a historic three-year average commodity price
is used in any reserve or cash flow analysis used to designate
reserves; and (iii) the company has demonstrated that the mineral
property will receive its governmental permits, and the primary
environmental document has been filed with the appropriate
governmental authorities.
The
terms “mineral resource”, “measured mineral
resource”, “indicated mineral resource” and
“inferred mineral resource” are defined in and required
to be disclosed by NI 43-101; however, these terms are not defined
terms under SEC Industry Guide 7 and have historically not been
permitted to be used in reports and annual reports filed with the
SEC. Investors are cautioned not to assume that any part or all of
mineral deposits in these categories will ever be converted into
reserves. An “Inferred mineral resource” has a lower
level of confidence than an “indicated mineral
resource” and must not be converted to a mineral
“reserve”. The quantity and grade of reported
“Inferred Resources” in this estimation are uncertain
in nature and there has been insufficient exploration to define
these “Inferred Resources” as an “Indicated or
Measured” Mineral Resource and it is uncertain if further
exploration will result in upgrading them to an “Indicated or
Measured” Mineral Resource category. Under Canadian rules,
estimates of inferred mineral resources may not form the basis of
feasibility or pre-feasibility studies, except in rare
cases.
Disclosure
of “contained ounces” in a resource is permitted
disclosure under Canadian regulations; however, under SEC Industry
Guide 7 the United States Securities and Exchange Commission (the
“SEC”) historically only permitted issuers to report
mineralization that does not constitute “reserves” by
SEC Industry Guide 7 standards as in place tonnage and grade
without reference to unit measures.
The
term “mineralized material” as used in this Annual
Report, although permissible under SEC Industry Guide 7, does not
indicate “reserves” by SEC Industry Guide 7 standards.
We cannot be certain that any part of the mineralized material will
ever be confirmed or converted into SEC Industry Guide 7 compliant
“reserves”. Investors are cautioned not to assume that
all or any part of the mineralized material will ever be confirmed
or converted into reserves or that mineralized material can be
economically or legally extracted.
Accordingly,
information contained in this Annual Report may contain
descriptions of our mineral deposits that may not be comparable to
similar information made public by U.S. companies pursuant to SEC
Industry Guide 7.
On
October 31, 2018, the SEC adopted the Modernization of Property
Disclosures for Mining Registrants (the “New Rule”),
introducing significant changes to the existing mining disclosure
framework to better align it with international industry and
regulatory practice, including NI 43-101. The New Rule became
effective as of February 25, 2019 and following a transition period
the Company may be required to comply with the New Rule as of its
annual report for its first fiscal year beginning on or after
January 1, 2021, and earlier in certain circumstances. While early
voluntary compliance with the New Rule is permitted, the Company
has not elected to comply with the New Rule at this time and the
Company does not anticipate needing to comply with the New Rule
until March 2022. Under the SEC Modernization Rules, the
definitions of “Proven Mineral Reserves” and
“Probable Mineral Reserves” have been amended to be
substantially similar to the corresponding CIM Definition Standards
and the SEC has added definitions to recognize “Measured
Mineral Resources”, “Indicated Mineral Resources”
and “Inferred Mineral Resources” which are also
substantially similar to the corresponding CIM Definition
Standards; however, there are differences in the definitions under
the SEC Modernization Rules and the CIM Definition Standards and
therefore once the Company begins reporting under the SEC
Modernization Rules there is no assurance that the Company’s
Mineral Reserve and Mineral Resource estimates will be the same as
those reported under CIM Definition Standards as contained in this
Annual Report.
7
METRIC CONVERSION TABLE
|
To Convert Imperial Measurement Units
|
To Metric Measurement Units
|
Multiply by
|
|
Acres
|
Hectares
|
0.4047
|
|
Feet
|
Meters
|
0.3048
|
|
Miles
|
Kilometers
|
1.6093
|
|
Tons
(short)
|
Tonnes
|
0.9072
|
|
Gallons
|
Liters
|
3.785
|
|
Ounces
(troy)
|
Grams
|
31.103
|
|
Ounces
(troy) per ton (short)
|
Grams
per tonne
|
34.286
|
|
|
|
|
TECHNICAL INFORMATION
This
Annual Report contains information of a technical or scientific
nature respecting the Company’s mineral properties (the
"Technical Information"). Technical Information is primarily
derived from the documents referenced herein. All Technical
Information which appears in this Annual Report has been reviewed
and approved by Danniel Oosterman, Vice President Exploration of
the Company who is a "Qualified Person" as defined by the
guidelines in NI 43-101. The Company operates quality assurance and
quality control of sampling and analytical procedures.
GLOSSARY OF TERMS
|
Ag
|
silver
|
|
Au
|
gold
|
|
CIM
Standards, 2014
|
Canadian
Institute of Mining, Metallurgy and Petroleum Standards for Mineral
Resources and Reserves: Definitions and Guidelines, as amended in
2014
|
|
deposit
|
means a
mineral deposit which is a mineralized mass that may be
economically valuable, but whose characteristics may require more
detailed information. Mineral resources are calculated from
geological data collected from deposits, however, deposits do not
necessarily reflect the presence of mineral resources.
|
|
Fe
|
iron
|
|
ft
|
feet
|
|
g/t
|
Grams
per tonne
|
|
lb.
|
pound
(2,000 lbs. to 1 ton, 2,204.6 lbs. to 1 tonne)
|
|
Indicated
Coal Resource
|
That
part of a Coal Resource for which quantity or quality, densities,
shape, and physical characteristics can be estimated with a level
of confidence sufficient to allow the appropriate application of
technical and economic parameters to support mine planning and
evaluation of the economic viability of the deposit. The estimate
is based on detailed and reliable exploration and testing
information gathered through appropriate techniques from locations
such as outcrops, trenches, pits, workings and drill holes that are
spaced closely enough for geological and quality continuity to be
reasonably assumed.
|
|
Indicated
Mineral Resources
|
That
part of a Mineral Resource for which tonnage, densities, shape,
physical characteristics, grade and mineral content can be
estimated with a reasonable level of confidence. It is based on
exploration, sampling and testing information gathered through
appropriate techniques from locations such as outcrops, trenches,
pits, workings and drill holes. The locations are too widely or
inappropriately spaced to confirm geological and/or grade
continuity but are spaced closely enough for continuity to be
assumed.
|
|
Inferred
Coal Resource
|
That
part of a Coal Resource for which quantity and quality can be
estimated on the basis of geological evidence and limited sampling
and reasonably assumed, but not verified, geological and quality
continuity. The estimate is based on limited information and
sampling, gathered through appropriate techniques from locations
such as outcrops, trenches, pits, workings, and drill
holes.
|
|
Inferred
Mineral Resource
|
Inferred
Mineral Resource is the part of a mineral resource for which
tonnage, grade and mineral content can be estimated with a low
level of confidence. It is inferred from geological evidence and
assumed but not verified geological or grade
continuity.
|
|
m
|
meters
|
8
|
Measured
Mineral Resource
|
That
part of a Mineral Resource for which tonnage, densities, shape,
physical characteristics, grade and mineral content can be
estimated with a high level of confidence. It is based on detailed
and reliable exploration, sampling and testing information gathered
through appropriate techniques from locations such as outcrops,
trenches, pits, workings and drill holes. The locations are spaced
closely enough to confirm geological and grade
continuity.
|
|
mineral
resource
|
means a
concentration or occurrence of natural, solid, inorganic, or
fossilized organic material in or on the Earth’s crust in
such form and quantity and of such a grade or quality that it has
reasonable prospects for economic extraction. The location,
quantity, grade, geological characteristics, and continuity of a
mineral resource are known, estimated, or interpreted from specific
geological evidence and knowledge. Mineral resources are
sub-divided, in order of increasing geological confidence, into
Inferred, Indicated, and
Measured
categories. Note that the confidence level in
Inferred Mineral Resources is insufficient to allow the application
of technical and economic parameters or to enable an evaluation of
economic viability worthy of public disclosure. Regardless of
category, a mineral resource is estimated through application of
the guidelines of the Canadian Institute of Mining, Metallurgy and
Petroleum Standards for Mineral Resources and Reserves: Definitions
and Guidelines, as amended in 2014. A “historic”
mineral resource estimate refers to a mineral resource estimate of
the quantity, grade, or metal or mineral content of a deposit that
the Company has not verified as current, and which was prepared
before the Company acquired or entered into an agreement to
acquire, an interest in the property that contains the
deposit.
|
|
NI
43-101
|
Canadian
National Instrument 43-101 Standards of Disclosure for Mineral
Projects.
|
|
oz.
|
troy
ounce (12 oz. to 1 pound)
|
|
Preliminary
Economic Assessment (PEA)
|
A
preliminary assessment study which includes an economic analysis of
the potential viability of a material resource prior to the
completion of a prefeasibility study. Based on the Society for
Mining, Metallurgy and Exploration (SME) study types a PEA (also
known as a conceptual or scoping study used to support a NI 43-101
Technical Report is within +/-35% degree of accuracy.
|
|
Preliminary
Feasibility Study (PFS)
|
A
comprehensive study of the viability of a project that has advanced
to a stage where the mining method and pit configuration has been
established and an effective method of coal processing has been
determined, and includes a financial analysis based on reasonable
assumptions of technical, engineering, legal, operating, economic,
social, and environmental factors, and the evaluation of other
relevant factors which are sufficient for a Qualified Person (QP),
acting reasonably, to determine if all or part of a Resource can be
classified as a Reserve (CIM Standards, 2014). Based on the SME
study types a PFS used to support a NI 43-101 Technical Report is
within +/-25% degree of accuracy.
|
|
Qualified
Person Or QP
|
An
individual who is an engineer or geoscientist with at least five
years of experience in mineral exploration, mine development or
operation, or mineral project assessment, or any combination of
these; has experience relevant to the subject matter of the mineral
project and the technical report; and is a member or licensee in
good standing of a professional association recognized under Nl
43-101 (CIM Standards, 2014).
|
|
Ti
|
Titanium
|
|
V
|
Vanadium
|
9
ITEM
1.
IDENTITY
OF DIRECTORS, SENIOR MANAGEMENT AND ADVISERS
Not
applicable.
Not
applicable.
ITEM
3.
KEY
INFORMATION
A.
Selected
Financial Data
The
following selected financial and other data summarize our
historical financial information. We derived the selected balance
sheet information as of December 31, 2020, 2019 and 2018, and the
selected statement of operations information for the years ended
December 31, 2020, 2019 and 2018, from our audited financial
statements as of those dates. The consolidated financial statements
were prepared in accordance with International Financial Reporting
Standards (“IFRS”) issued by the International
Accounting Standards Board, which differ in certain respects from
the principles we would have followed had our consolidated
financial statements been prepared in accordance with generally
accepted accounting principles in the United States (“U.S.
GAAP”).
The
information in the following tables should be read in conjunction
with the information appearing under the heading
“
Item 5. Operating and
Financial Review and Prospects
” and our audited annual
financial statements under the heading “
Item 18. Financial
Statements
”.
|
Statement
of Operations
|
2020
|
2019
|
2018
|
2017
|
2016
|
|
Revenue$
|
$
—
|
$
—
|
—
|
—
|
—
|
|
Net income
(loss)
|
(4,626,887
)
|
17,513,854
|
(18,184,468
)
|
(18,592,981
)
|
(2,007,305
)
|
|
Comprehensive
income (loss)
|
(4,626,887
)
|
17,513,854
|
(18,196,628
)
|
(18,580,821
)
|
(2,007,305
)
|
|
Basic net (loss)
income per share
|
(0.03
)
|
0.17
|
(0.23
)
|
(0.33
)
|
(0.05
)
|
|
Diluted net (loss)
income per share
|
(0.03
)
|
0.17
|
(0.23
)
|
(0.33
)
|
(0.05
)
|
|
Balance
Sheet Data
|
2020
|
2019
|
2018
|
2017
|
2016
|
|
Total
Asset
|
$
39,833,010
|
$
27,448,088
|
$
9,264,205
|
18,368,843
|
27,828,109
|
|
Share
Capital
|
$
197,612,182
|
$
181,129,012
|
$
173,819,546
|
165,862,805
|
156,529,025
|
|
Number of Common
Shares (as adjusted to reflect changes in capital)
|
180,518,828
|
121,299,508
|
95,316,127
|
74,721,790
|
48,076,530
|
|
Total
liabilities
|
$
2,474,953
|
$
2,740,000
|
$
10,023,943
|
9,681,322
|
11,032,616
|
|
Total
shareholders’ equity
|
$
37,358,057
|
$
24,708,088
|
$
(759,738
)
|
8,687,521
|
16,795,493
|
B.
Capitalization
and Indebtedness
Not
applicable.
C.
Reasons
for the Offer and Use of Proceeds
Not
applicable.
D.
Risk
Factors
This
section describes some of the risks and uncertainties faced by us.
An investment in the Company involves a high degree of risk. You
should carefully consider the risks described below and the risks
described elsewhere in this Annual Report when making an investment
decision related to the Company. We believe the risk factors
summarized below are most relevant to our business. These are
factors that, individually or in the aggregate, could cause our
actual results to differ significantly from anticipated or
historical results. The occurrence of any of the risks could harm
our business and cause you to lose all or part of your investment.
However, you should understand that it is not possible to predict
or identify all such factors. The risks and uncertainties described
and discussed below and elsewhere in this Annual Report are not the
only risks and uncertainties that we face. Additional risks and
uncertainties not presently known to us or that we currently deem
immaterial may also impair our business operations. If any of these
risks actually occurs, our business, financial condition and
results of operations would suffer. The risks discussed below also
include forward-looking statements, and our actual results may
differ substantially from those discussed in these forward-looking
statements. See the discussion under the heading
“
Cautionary Note Regarding
Forward-Looking Statements
” at the beginning of this
Annual Report for more detail.
Except
as required by law, we undertake no obligation to publicly update
forward-looking statements, whether as a result of new information,
future events, or otherwise.
10
We have a history of net losses and do not anticipate having
positive cash flow in the foreseeable future.
We have
not received any material revenue or net profit to date.
Exploration and development of mineral properties requires large
amounts of capital and usually results in accounting losses for
many years before profitability is achieved, if ever. We have
incurred losses and negative operating cash flow during our most
recently completed financial year and for the current financial
year to date. We believe that commercial mining activity is
warranted on our Gibellini Project (as defined herein) and Pulacayo
Project (as defined herein). Even if we undertake future
development activity on any of our properties, there is no
certainty that we will produce revenue, operate profitably or
provide a return on investment in the future. The exploration of
our properties depends on our ability to obtain additional required
financing. There is no assurance that we will be successful in
obtaining the required financing, which could cause us to postpone
our exploration plans or result in the loss or substantial dilution
of our interest in our properties.
We will need a significant amount of capital to carry out our
proposed business plan. Unless we are able to raise sufficient
funds, we may be forced to discontinue our operations.
We are
in the exploration stage and will likely operate at a loss until
our business becomes established. We will require additional
financing in order to fund future operations. Our ability to secure
any required financing in order to commence and sustain our
operations will depend in part upon prevailing capital market
conditions as well as our business success. There can be no
assurance that we will be successful in our efforts to secure any
additional financing on terms satisfactory to our management. If
additional financing is raised by issuing Common Shares, control
may change, and shareholders may suffer additional dilution. If
adequate funds are not available or they are unavailable on
acceptable terms, we may be required to scale back our business
plan or cease operating.
Our mineral exploration efforts are highly speculative in nature
and may be unsuccessful
.
The
exploration for and development of minerals involve significant
risks, which even a combination of careful evaluation, experience
and knowledge may not eliminate. Few properties which are explored
are ultimately developed into producing mines. There can be no
guarantee that the estimates of quantities and qualities of
minerals disclosed will be economically recoverable. With all
mining operations there is uncertainty and, therefore, risk
associated with operating parameters and costs resulting from the
scaling up of extraction methods tested in pilot conditions.
Mineral exploration is speculative in nature and there can be no
assurance that any minerals discovered will result in an increase
in our resource base.
Our
operations are subject to all of the hazards and risks normally
encountered in the exploration, development and production of
minerals. These include unusual and unexpected geological
formations, rock falls, seismic activity, flooding and other
conditions involved in the extraction of material, any of which
could result in damage to, or destruction of, mines and other
producing facilities, damage to life or property, environmental
damage and possible legal liability. Although precautions to
minimize risk will be taken, operations are subject to hazards that
may result in environmental pollution and consequent liability that
could have a material adverse impact on our business, operations
and financial performance.
Substantial
expenditures are required to establish ore reserves through
drilling, to develop metallurgical processes to extract the metal
from the ore and, in the case of new properties, to develop the
mining and processing facilities and infrastructure at any site
chosen for mining. Although substantial benefits may be derived
from the discovery of a major mineralized deposit, no assurance can
be given that minerals will be discovered in sufficient quantities
to justify commercial operations or that funds required for
development can be obtained on a timely basis. The economics of
developing vanadium, silver, coal and other mineral properties is
affected by many factors including the cost of operations,
variations in the grade of ore mined, fluctuations in metal
markets, costs of processing equipment and such other factors such
as government regulations, including regulations relating to
royalties, allowable production, importing and exporting of
minerals and environmental protection. The remoteness and
restrictions on access of properties in which we have an interest
will have an adverse effect on profitability as a result of higher
infrastructure costs. There are also physical risks to the
exploration personnel working in the terrain in which our
properties are located, often in poor climate
conditions.
Our
long-term commercial success depends on our ability to find,
acquire, develop and commercially produce vanadium, silver, coal
and other minerals. No assurance can be given that we will be able
to locate satisfactory properties for acquisition or participation.
Moreover, if such acquisitions or participations are identified, we
may determine that current markets, terms of acquisition and
participation or pricing conditions make such acquisitions or
participations uneconomic.
We have no history of profitably commercially producing vanadium,
silver, coal or other metals from our mineral exploration
properties and there can be no assurance that we will successfully
establish mining operations or profitably produce vanadium, silver,
coal or other base or precious metals.
None of
our properties are currently under development. The future
development of any property found to be economically feasible will
require the construction and operation of mines, processing plants
and related infrastructure. As a result, we are subject to all of
the risks associated with establishing new mining operations and
business enterprises, including:
●
the timing and cost
of the construction of mining and processing
facilities;
●
the availability
and costs of skilled labor and mining equipment;
●
the availability
and cost of appropriate smelting and/or refining
arrangements;
11
●
the need to obtain
necessary environmental and other governmental approvals and
permits and the timing of those approvals and permits;
and
●
the availability of
funds to finance construction and development
activities.
The
costs, timing and complexities of mine construction and development
are increased by the remote location of our mining properties. It
is common in new mining operations to experience unexpected
problems and delays during development, construction and mine
start-up. In addition, delays in the commencement of mineral
production often occur. Accordingly, there are no assurances that
our activities will successfully establish mining operations,
result in profitable operations or that vanadium, silver, coal or
other metals will be produced at any of our
properties.
All of the properties in which we hold an interest are considered
to be in the exploration stage only and do not contain a known body
of commercial minerals. The figures for our resources are estimates
based on interpretation and assumptions and may yield less mineral
production under actual operating conditions than is currently
estimated.
All of
the properties in which we hold an interest are considered to be in
the exploration stage only and do not contain a known body of
commercial minerals. The figures for our resources are estimates
based on interpretation and assumptions and may yield less mineral
production under actual operating conditions than is currently
estimated. Unless otherwise indicated, mineralization figures
presented in this Annual Report and in our other filings with
securities regulatory authorities, news releases and other public
statements that may be made from time to time are based upon
estimates made by our personnel and independent geologists. These
estimates may be imprecise because they are based upon geological
and engineering interpretation and statistical inferences drawn
from drilling and sample analysis, stated operating conditions, and
mineral processing tests, which may prove to be unreliable. There
can be no assurance that:
●
these estimates
will be accurate;
●
resource or other
mineralization figures will be accurate; or
●
the resource or
mineralization could be mined or processed profitably.
Because
we have not commenced production at any of our properties, other
than Ulaan Ovoo, and have not defined or delineated any proven or
probable reserves on any of our properties, the mineralization
estimates for our properties may require adjustments including
possible downward revisions based upon further exploration or
development work, actual production experience, or current costs
and sales prices. In addition, the quality of coal or grade of ore
ultimately mined, if any, may differ from that indicated by
drilling and beneficiation testing results. There can be no
assurance that the type and amount of minerals recovered in
laboratory analyses and small-scale beneficiation tests will be
duplicated in large-scale tests under on-site conditions or in
production scale.
The
resource estimates contained in this Annual Report have been
estimated based on assumed future prices, cut-off grades and
operating costs that may prove to be inaccurate. Extended declines
in market prices for vanadium, silver, coal or other metals may
render portions of our mineralization uneconomic and result in
reduced reported mineralization. Any material reductions in
estimates of mineralization, or of our ability to extract this
mineralization, could have a material adverse effect on our results
of operations or financial condition.
Actual capital costs, operating costs, production and economic
returns may differ significantly from those we have anticipated and
there are no assurances that any future development activities will
result in profitable mining operations.
Actual
capital costs, operating costs, production and economic returns may
differ significantly from those we have anticipated, and we cannot
assure you that any future development activities will result in
profitable mining operations. The capital costs required to take
our projects into production may be significantly higher than
anticipated. None of our mineral properties has a sufficient
operating history upon which we can base estimates of future
operating costs. Any potential decisions about the possible
development of these and other mineral properties would ultimately
be based upon feasibility studies which may or may not be
undertaken. Feasibility studies derive estimates of cash operating
costs based upon, among other things:
●
anticipated
tonnage, grades and metallurgical characteristics of the ore or
quality of the vanadium, silver, coal or other minerals to be mined
and/or processed;
●
anticipated
recovery rates of metals from the ore;
●
cash operating
costs of comparable facilities and equipment; and
●
anticipated
climatic conditions.
Cash
operating costs, production and economic returns, and other
estimates contained in studies or estimates prepared by or for us
may differ significantly from those anticipated by our current
studies and estimates, and there can be no assurance that our
actual operating costs will not be higher than currently
anticipated.
12
COVID-19 - The outbreak of contagious diseases, including the
spread of the coronavirus, could impact our business operations,
results of operations and/or financial condition.
An
emerging risk is a risk not well understood at the current time and
for which the impacts on strategy and financial results are
difficult to assess or are in the process of being assessed. Since
December 31, 2019, the outbreak of the novel strain of coronavirus,
specifically identified as “COVID-19”, has resulted in
governments worldwide enacting emergency measures to combat the
spread of the virus. These measures, which include the
implementation of travel bans, self-imposed quarantine periods and
social distancing, have caused material disruption to businesses
globally, resulting in an economic slowdown. Global equity markets
have experienced significant volatility and weakness. Governments
and central banks have reacted with significant monetary and fiscal
interventions designed to stabilize economic conditions. The
duration and impact of the COVID-19 outbreak is unknown at this
time, as is the efficacy of the government and central bank
interventions. It is not possible to reliably estimate the length
and severity of these developments and the impact on the financial
results and condition of the Company and its operating subsidiaries
in future periods.
Our
business operations could be significantly adversely affected by
the effects of a widespread global outbreak of contagious disease,
including the recent outbreak of respiratory illness caused by
COVID-19. We cannot accurately predict the impact COVID-19 will
have on third parties, including our employees or contractors,
ability to fulfil their obligations to the Company, including due
to uncertainties relating to the ultimate geographic spread of the
virus, its severity, the duration of the outbreak, and the
restrictions imposed by governments of affected countries to combat
COVID-19. In addition, a significant outbreak of contagious
diseases in the human population could result in a widespread
health crisis that could adversely affect the economies and
financial markets of many countries (including those countries in
which our properties are located and other countries we rely on to
conduct our business operations), resulting in an economic downturn
that could negatively impact our operating results and financial
condition. There can be no assurance that any policies or
procedures that have been or that may be put in place by the
Company will mitigate the risks associated with, or that they will
not cause us to experience, less favourable health, safety and
economic outcomes, including the ability to obtain financing for
business operations as needed or on terms acceptable to the
Company.
We are subject to substantial government regulation in the United
States and Canada. Changes to regulation or more stringent
implementation could have a material adverse effect on our results
of operations and financial condition.
Mining
and exploration activities at our properties in North America are
subject to various laws and regulations relating to the protection
of the environment, such as the U.S. federal Clean Water Act and
the Nevada Water Pollution Control Law. Although we intend to
comply with all existing environmental and mining laws and
regulations, no assurance can be given that we will be in
compliance with all applicable regulations or that new rules and
regulations will not be enacted, including by the new Biden
administration in the United States, or that existing rules and
regulations will not be applied in a manner that could limit or
curtail development of our properties.
All
claims held by us in the United States are unpatented lode mining
claims and all claims held by us in Ontario are patented claims.
Our Manitoba claims are Crown Land mineral claims and mineral
leases administered by the Manitoba Provincial government. At
present, there is no royalty payable to the United States on
production from unpatented mining claims, but exploration and
development on these claims is subject to regulation and requires
permits from the U.S. Department of Interior and various state
agencies. There is a tax imposed on profits from the extraction of
mineral substances raised and sold by operators of Ontario mines.
There have been legislative attempts to impose a royalty on
production from unpatented mining claims in the United States in
recent years. Amendments to current laws and regulations governing
exploration, development and mining or more stringent
implementation thereof could have a material adverse effect on our
business and cause increases in exploration expenses or capital
expenditures or require delays or abandonment in the development of
our properties.
Our
operations are also subject to laws and regulations governing the
protection of endangered and other specified species. In May 2015,
the U.S. Department of the Interior released a plan to protect the
greater sage grouse, a species whose natural habitat is found
across much of the western United States, including Nevada. The
U.S. Department of the Interior’s plan is intended to guide
conservation efforts on approximately 70 million acres of national
public lands. No assurances can be made that restrictions relating
to conservation will not have an adverse impact on our operations
in impacted areas.
We are
also required to expend significant resources to comply with
numerous corporate governance and disclosure regulations and
requirements adopted by Canadian federal and provincial
governments, as well as the Toronto Stock Exchange (the
“TSX”). These additional compliance costs and related
diversion of the attention of management and key personnel could
have a material adverse effect on our business.
Reform of the General Mining Law could adversely impact our results
of operations.
All of
our unpatented mining claims are on U.S. federal lands. Legislation
has been introduced regularly in the U.S. Congress over the last
decade to change the General Mining Law of 1872, as amended (the
“General Mining Law”), under which we hold these
unpatented mining claims. It is possible that the General Mining
Law may be amended or replaced by less favorable legislation in the
future. Previously proposed legislation contained a production
royalty obligation, new environmental standards and conditions,
additional reclamation requirements and extensive new procedural
steps which would likely result in delays in permitting. The
ultimate content of future proposed legislation, if enacted, is
uncertain. If a royalty on unpatented mining claims were imposed,
the profitability of our U.S. operations could be materially
adversely affected.
13
Any
such reform of the General Mining Law could increase the costs of
our U.S. mining activities or could materially impair our ability
to develop or continue our U.S. operations, and as a result, could
have an adverse effect on us and our results of
operations.
We are required to obtain government approvals and permits in order
to conduct operations.
Government
approvals and permits are currently required in connection with all
of our operations, and further approvals and permits may be
required in the future. We must obtain and maintain a variety of
licenses and permits, which include or cover, without limitation,
air quality, water quality, water rights, dam safety, fire safety,
emergency preparedness, hazardous materials, mercury control, waste
rock management, solid waste disposal, storm water runoff, water
pollution control, water treatment, rights of way and tailings
operations. Such licenses and permits are subject to change in
regulations and in various operating circumstances. The duration
and success of our efforts to obtain permits are contingent upon
many variables outside of our control. Obtaining governmental
approvals and permits may increase costs and cause delays depending
on the nature of the activity to be permitted and the applicable
requirements implemented by the permitting authority.
There
can be no assurance that all necessary approvals and permits will
be obtained or timely obtained. In addition, there can be no
assurance that, if obtained, the costs of the approvals and permits
will not exceed our estimates or that we will be able to maintain
such approvals and permits. To the extent such approvals or permits
are required and not obtained or maintained, our operations may be
curtailed, or we may be prohibited from proceeding with planned
exploration, development or operation of our mineral
properties.
Certain of our current exploration properties are located in
Bolivia and Mongolia, and their operations may be exposed to
various levels of political, economic, and other risks and
uncertainties.
Certain
of our current exploration properties are located in Bolivia and
Mongolia. In these countries, their operations may be exposed to
various levels of political, economic, and other risks and
uncertainties. These risks and uncertainties include, but are not
limited to, political and bureaucratic corruption and uncertainty,
terrorism, hostage taking, military repression, fluctuations in
currency exchange rates, high rates of inflation, labor unrest,
civil unrest, expropriation and nationalization, renegotiation or
nullification of existing concessions, licenses, permits and
contracts, illegal mining, changes in taxation policies,
restrictions on foreign exchange and repatriation, changing
political conditions, currency controls, and governmental
regulations that favor or require the awarding of contracts to
local contractors or require foreign contractors to employ citizens
of, or purchase supplies from, a particular
jurisdiction.
Future
political and economic conditions may result in a government
adopting different policies with respect to foreign development and
ownership of mineral resources. Any changes in policy may result in
changes in laws affecting ownership of assets, foreign investment,
taxation, rates of exchange, resource sales, environmental
protection, labour relations or practices, price controls,
repatriation of income, and return of capital which may affect both
our ability to undertake exploration and development activities in
respect of future properties in the manner currently contemplated,
as well as our ability to continue to explore, develop, and operate
those properties to which we have rights relating to exploration,
development, and operations.
Changes in regulations or shifts in political attitudes in Bolivia
and Mongolia, as well as in neighboring countries, are beyond our
control and may adversely affect our business and financial
condition.
Any
changes in regulations or shifts in political attitudes in Bolivia
and Mongolia are beyond our control and may adversely affect our
business, financial condition and prospects.
The
Bolivian government adopted a new constitution (which we refer to
as the “NCPE”) in early 2009 which increased state
control over key economic sectors, including mining. The NCPE
provides that all minerals, among all natural resources, belong to
the Bolivian people who are represented by the government. Such
entity is the only one capable of managing all minerals throughout
the production chain. Consequently, only the Bolivian central
government possesses the authority to grant mining rights. Bolivian
President Evo Morales signed a new law, the Law of Mining Rights,
increasing the State’s expropriation powers over the mining
sector. It was specifically drafted to target mines deemed by the
state as unproductive, inactive or idle. The Bolivian government
has assigned responsibility for determining whether a concession is
idle to the Vice Ministry of Regulation, Auditing and Mining
Policy. Mining areas occupied by cooperatives or local groups will
not be regarded as idle. There have been recent actions by the
government of Bolivia to ease concerns of foreign exploration and
mining investors. As reported in the
Mining Journal
, at a UK-Bolivia trade
and investment forum in London in June of 2016, Félix
César Navarro, Minister of Mining and Metallurgy
(“Minister Navarro”), talked of new safeguards for
foreign investors looking to put cash into the country, stating,
that new contracts governing exploration, mining and processing
were currently going through Bolivia’s congress that would
give foreign investors the legal security they need to invest in
the country (
report by Mining
Journal June 10, 2016
). Certain Company officials also met
with Minister Navarro in March, October and November of 2016.
During the meeting in March at the 2016 PDAC convention, Minister
Navarro expressed his full support for the start-up and development
of the Pulacayo mine. During the October meeting, Minister Navarro
stated that the aim of the recent mining regulation is to support
the investors and ensure the inclusion of cooperative labor in
their projects. At the November meeting, Minister Navarro stated
that both public and private mining sectors will try to attract
foreign investment disclosing and sharing their experience with
investors from several parts of the world. We consider our
investment in the Pulacayo Project to be safe. However, we cannot
provide any assurance that our operations at the Pulacayo Project
will not be affected by changes in the political environment of
Bolivia or the political attitudes of the Bolivian government.
Further, there can be no assurance that neighboring
countries’ political and economic policies in relation to
Bolivia will also not have adverse economic effects on our
business, including our ability to transport and sell our product
and access construction labor, supplies and materials.
14
The
Mongolian legal system shares several of the qualitative
characteristics typically found in a developing country and many of
its laws, particularly with respect to matters of environment and
taxation, are still evolving. A transaction or business structure
that would likely be regarded under a more established legal system
as appropriate and relatively straightforward might be regarded in
Mongolia as outside the scope of existing Mongolian law,
regulation, or legal precedent. As the legal framework in Mongolia
is in many instances based on recent political reforms or newly
enacted legislation which may not be consistent with long-standing
conventions and customs, certain business arrangements or
structures and certain tax planning mechanisms may carry
significant risks. In particular, when business objectives and
practicalities dictate the use of arrangements and structures that,
while not necessarily contrary to settled Mongolian law, are
sufficiently novel within a Mongolian legal context, it is possible
that such arrangements may be invalidated.
The
legal system in Mongolia has inherent uncertainties that could
limit the legal protections available to us. These uncertainties
include, without limitation: (i) inconsistencies between laws; (ii)
limited judicial and administrative guidance on interpreting
Mongolian legislation; (iii) substantial gaps in the regulatory
structure due to delay or absence of implementing regulations; (iv)
the lack of established interpretations of new principles of
Mongolian legislation, particularly those relating to business,
corporate and securities laws; (v) a lack of judicial independence
from political, social and commercial forces; and (vi) bankruptcy
procedures that are not well developed and are subject to abuse.
The Mongolian judicial system has relative little experience in
enforcing the laws and regulations that currently exist, leading to
a degree of uncertainty as to the outcome of any litigation, it may
be difficult to obtain swift and equitable enforcement, or to
obtain enforcement of a judgment by a court of another
jurisdiction.
In
addition, while legislation has been enacted to protect private
property against expropriation and nationalization, due to the lack
of experience in enforcing these provisions and political factors,
these protections may not be enforced in the event of an attempted
expropriation or nationalization. Whether legitimate or not,
expropriation or nationalization of any of our assets, or portions
thereof, potentially without adequate or any compensation, could
materially and adversely affect our business and results of
operations. Further, there can be no assurance that neighboring
countries’ political and economic policies in relation to
Mongolia will not have adverse economic effects on our business,
including our ability to transport and sell our product and access
construction labor, supplies and materials.
In Bolivia, recent and anticipated changes to mining laws and
policies and mining taxes and expected changes in governmental
regulation or governmental actions may adversely affect
us.
In
Bolivia, recent and anticipated changes to mining laws and policies
and mining taxes and expected changes in governmental regulation or
governmental actions may adversely affect us. On May 28, 2014, Law
535 of Mining and Metallurgy (which we refer to as the “May
Mining Law”) was adopted and placed into effect. Pursuant to
the May Mining Law, we must develop our mining activities to comply
with the economic and social function, which means observing the
sustainability of the mining activities, work creation, respecting
the rights of our mining workers, and ensuring the payment of
mining patents and the continuity of existing
activities.
The
Framework Law on Mother Earth and Integral Development for Living
Well (together with the May Mining Law, the “New Mining
Laws”), in effect since October 15, 2012, prioritizes the
importance of nature to the Bolivian people and could have
significant consequences to the country’s mining industry.
This law established 11 new rights for “mother earth”
including, the right to life and to exist; the right to continue
vital cycle and processes free from human alteration; the right to
pure water and clean air; the right to balance; the right not to be
polluted; and the right to not have cellular structure modified or
genetically altered. At present, it is unclear how the New Mining
Laws will affect exploration companies with projects in the area or
how the law will be enforced.
In the
past, the Government of Bolivia has nationalized the assets of
certain companies in various industries. Nationalization or other
expropriation of our assets, without adequate compensation, could
have a material adverse effect on our business and/or result in the
total loss of our investment in Bolivia.
Our mineral rights may be terminated or not renewed by governmental
authorities and we may be negatively impacted by changes to mining
laws and regulations.
Our
activities are subject to government approvals, various laws
governing prospecting, development, land resumptions, production
taxes, labor standards and occupational health, mine safety, toxic
substances and other matters, including issues affecting local
native populations. Although we believe that our activities are
currently carried out in accordance with all applicable rules and
regulations, no assurance can be given that new rules and
regulations will not be enacted or that existing rules and
regulations will not be applied in a manner which could limit or
curtail production or development. Amendments to current laws and
regulations governing operations, including by the new Biden
administration in the United States and proposed changes to tax
laws in Nevada, and activities of exploration and mining, or more
stringent implementation thereof, could have a material adverse
impact on our business, operations and financial performance.
Further, the mining licenses and permits issued in respect of our
projects may be subject to conditions which, if not satisfied, may
lead to the revocation of such licenses. In the event of
revocation, the value of our investments in such projects may
decline.
In the
United States, the tenures are in the form of claims where
exploration and development rights are retained so long as annual
maintenance fees are paid and certain forms filed. The maintenance
fees may be substantial with a large number of claims and the fees
are adjusted periodically. Diligent periodic assessment of the
resource and development value of claims by the claimant is
required.
15
Title to our mineral properties may be disputed by third
parties.
Title
to mineral properties, as well as the location of boundaries on the
grounds may be disputed. Moreover, additional amounts may be
required to be paid to surface right owners in connection with any
mining development. At all of such properties where there are
current or planned exploration activities, we believe that we have
either contractual, statutory, or common law rights to make such
use of the surface as is reasonably necessary in connection with
those activities. Although we believe we have taken reasonable
measures to ensure proper title to our properties, there is no
guarantee that title to our properties will not be challenged or
impaired. Successful challenges to the title of our properties
could impair the development of operations on those
properties.
Environmental regulations worldwide have become increasingly
stringent over the last decade which will require us to dedicate
more time and money to compliance and remediation
activities.
All
phases of the mining business present environmental risks and
hazards and are subject to environmental regulation pursuant to a
variety of international conventions, and federal, state and
municipal laws and regulations. Environmental legislation provides
for, among other things, restrictions and prohibitions on spills
and releases or emissions of various substances produced in
association with mining operations. The legislation also requires
that wells and facility sites be operated, maintained, abandoned
and reclaimed to the satisfaction of applicable regulatory
authorities. Compliance with such legislation can require
significant expenditures and a breach may result in the imposition
of fines and penalties, some of which may be material.
Environmental legislation is evolving in a manner expected to
result in stricter standards and enforcement, larger fines and
liability and potentially increased capital expenditures and
operating costs. Environmental assessments of proposed projects
carry a heightened degree of responsibility for companies and their
directors, officers and employees. The cost of compliance with
changes in governmental regulations has a potential to reduce the
profitability of operations.
Failure
to comply with applicable laws, regulations, and permitting
requirements may result in enforcement actions under, including
orders issued by regulatory or judicial authorities causing
operations to cease or be curtailed, and may include corrective
measures requiring capital expenditures, installation of additional
equipment, or remedial actions. Entities engaged in mining
operations may be required to compensate those suffering loss or
damage by reason of the mining activities and may have civil or
criminal fines or penalties imposed for violations of applicable
laws or regulations and, in particular, environmental
laws.
Amendments
to current laws, regulations and permits governing operations and
activities of mining companies, or more stringent implementation
thereof, could have a material adverse impact on our business and
cause increases in capital expenditures, production costs or
reduction in levels of production at producing properties, or
require abandonment or delays in the development of new mining
properties.
Certain of our properties are located on land that is or may become
subject to traditional territory, title claims and/or claims of
cultural significance by certain Native American tribes or
Aboriginal communities and stakeholders, and such claims and the
attendant obligations of the provincial and federal governments to
those tribal or Aboriginal communities and stakeholders may affect
our current and future operations.
Native
American and Aboriginal interests and rights as well as related
consultation issues may impact our ability to pursue exploration
and development at our U.S. and Canadian properties. There is no
assurance that claims or other assertion of rights by tribal or
Aboriginal communities and stakeholders or consultation issues will
not arise on or with respect to our properties or activities. These
could result in significant costs and delays or materially restrict
our activities. Opposition by Native American tribes or Aboriginal
communities and stakeholders to our presence, operations or
development on land subject to their traditional territory or title
claims or in areas of cultural significance could negatively impact
us in terms of public perception, costly legal proceedings,
potential blockades or other interference by third parties in our
operations, or court-ordered relief impacting our operations. In
addition, we may be required to, or may voluntarily, enter into
certain agreements with such Native American tribes or Aboriginal
communities and stakeholders in order to facilitate development of
our properties, which could reduce the expected earnings or income
from any future production.
Litigation and Regulatory Proceedings
The
Company may be subject to civil claims (including class action
claims) based on allegations of negligence, breach of statutory
duty, public nuisance or private nuisance or otherwise in
connection with the Company’s operations, or investigations
relating thereto. While the Company is presently unable to quantify
any potential liability under any of the above heads of damage,
such liability may be material and may materially adversely affect
the Company’s ability to continue operations. In addition,
the Company may be subject to actions or related investigations by
governmental or regulatory authorities in connection with its
business activities, including, but not limited to, current and
historic activities at the Company’s properties. Such actions
may include prosecution for breach of relevant legislation or
failure to comply with the terms of the Company’s licenses
and permits and may result in liability for pollution, other fines
or penalties, revocations of consents, permits, approvals or
licenses or similar actions, which could be material and may impact
the results of the Company’s operations. The Company’s
current insurance coverage may not be adequate to cover any or all
the potential losses, liabilities and damages that could result
from the civil and/or regulatory actions referred to
above.
16
The mining industry in general is intensely competitive.
Furthermore, there is no assurance that, even if commercial
quantities are discovered, a ready market will exist for sale of
the same mineral ore.
The
mining industry in general is intensely competitive and there is no
assurance that, even if commercial quantities of ore are
discovered, a ready market will exist for the sale of same.
Marketability of natural resources which we may discover will be
affected by numerous factors beyond our control, such as market
fluctuations, the proximity and capacity of natural resource
markets and processing equipment, government regulations including
regulations relating to prices, royalties, land tenure, land use,
importing and exporting of minerals and environmental protection.
The exact effect of such factors cannot be predicted but they may
result in us not receiving an adequate return on our
investment.
The mining business is subject to inherent risks, some of which are
not insurable.
Our
business is subject to a number of risks and hazards, including
adverse environmental conditions, industrial accidents, labor
disputes, unusual or unexpected geological conditions, ground or
slope failures, cave-ins, changes in the regulatory environment and
natural phenomena such as inclement weather conditions, floods and
earthquakes. Such occurrences could result in damage to mineral
properties or production facilities, personal injury or death,
environmental damage to our properties or the properties of others,
delays in development or mining, monetary losses and possible legal
liability.
Although
we maintain insurance to protect against certain risks in amounts
that we consider reasonable, our insurance will not cover all the
potential risks associated with our operations. We may also be
unable to maintain insurance to cover these risks at economically
feasible premiums. Insurance coverage may not continue to be
available or may not be adequate to cover any resulting liability.
Moreover, insurance against risks such as environmental pollution
or other hazards as a result of exploration and production is not
generally available to us or to other companies in the mining
industry on acceptable terms. We may also become subject to
liability for pollution or other hazards which may not be insured
against or which we may elect not to insure against because of
premium costs or other reasons. Losses from these events may cause
us to incur significant costs that could have a material adverse
effect upon our financial performance, results of operations and
business outlook.
We depend on a number of key personnel, including our directors and
executive officers, the loss of any one of whom could have an
adverse effect on our operations.
We
depend on a number of key personnel, including our directors and
executive officers, the loss of any one of whom could have an
adverse effect on our operations. We have employment and consulting
contracts with several key personnel, and we do not have key man
life insurance.
Our
ability to manage growth effectively will require us to continue to
implement and improve management systems and to recruit and train
new employees. We cannot assure you that we will be successful in
attracting and retaining skilled and experienced
personnel.
Our business is highly dependent on the international market prices
of the metals we plan to produce, which are both cyclical and
volatile.
Our
revenues, if any, are expected to be in large part derived from the
mining and sale of vanadium, silver, nickel, coal and other
minerals. The prices of those commodities have fluctuated widely,
particularly in recent years, and are affected by numerous factors
beyond our control including international economic and political
trends, expectations of inflation, currency exchange fluctuations,
interest rates, global or regional consumption patterns,
speculative activities and increased production due to new mine
developments and improved mining and production
methods.
The
price of vanadium, silver and coal may have a significant influence
on the market price of our securities and the value of our mineral
properties. Mineral prices fluctuate widely and are affected by
numerous factors beyond our control. The level of interest rates,
the rate of inflation, the world supply of mineral commodities and
the stability of exchange rates can all cause significant
fluctuations in prices. Such external economic factors are in turn
influenced by changes in international investment patterns,
monetary systems and political developments. The price of mineral
commodities has fluctuated widely in recent years, and future price
declines could cause commercial production to be impracticable,
thereby having a material adverse effect on our business, financial
condition and result of operations.
We may be subject to misconduct by third-party
contractors.
We will
be heavily reliant upon our contractors during the development of
large scale projects. Companies are often measured and evaluated by
the behavior and performance of their representatives, including in
large part their contractors. We work hard to build in controls and
mechanisms to choose and retain employees and contractors with
similar values to our own; however, these controls may not always
be effective. Sound judgment, safe work practices, and ethical
behavior is expected from our contractors both on and off-site. Any
work disruptions, labor disputes, regulatory breach or
irresponsible behavior of our contractors could reflect on us
poorly and could lead to loss of social license, delays in
production and schedule, unsafe work practices and accidents and
reputational harm.
17
Our business requires substantial capital expenditures and is
subject to financing risks.
We
estimate that our current financial resources are insufficient to
undertake presently planned exploration and development programs.
Further exploration and development of our mineral properties may
require additional capital. One source of future funds presently
available to us is through the sale of equity capital. There is no
assurance that this source will continue to be available as
required or at all. If it is available, future equity financings
may result in substantial dilution to shareholders. Another
alternative for the financing of further exploration and/or
development would be the offering of an interest in our mineral
properties to be earned by another party or parties carrying out
further exploration or development thereof. There can be no
assurance that we will be able to conclude any such agreements on
favorable terms or at all.
Any
failure to obtain the required financing on acceptable terms could
have a material adverse effect on our financial condition, results
of operations and liquidity and may require us to cancel or
postpone planned capital investments.
Foreign Operations, Including Emerging and Developing Market
Risk
Changes
in mining, investment or other applicable policies or shifts in
political attitude in Bolivia may adversely affect the
Company’s operations or profitability and may affect the
Company’s ability to fund its ongoing expenditures.
Regardless of the economic viability of the Company’s
properties, such political changes, which are beyond the
Company’s control, could have a substantive impact and
prevent or restrict (or adversely impact the financial results of)
mining of some or all of any deposits on the Pulacayo
Project.
Bolivia
is a mining-friendly jurisdiction with a long history of mining and
an experienced labour force. The majority of the Company’s
operating costs in relation to Pulacayo Project are denominated in
Bolivian boliviano. The Company has not hedged its exposure to any
exchange rate fluctuations applicable to its business, and is
therefore exposed to currency fluctuation risks. The
Company’s operations are also subject to Bolivian regulations
pertaining to environmental protection, the use and development of
mineral properties and the acquisition or use of rural properties
by foreign investors or Bolivian companies under foreign control
and various other Bolivian regulatory frameworks, as described
below.
The
market for securities issued by companies with significant
operations in Bolivia is influenced by economic and market
conditions in Bolivia and, to varying degrees, market conditions in
Canada, the United States and developing countries, especially
other Latin American countries. Although economic conditions vary
by country, the reaction of investors to developments in one
country may cause fluctuations in the capital markets in other
countries. Developments or adverse economic conditions in other
countries, including developing countries, have at times
significantly affected the availability of credit in the Bolivian
economy and resulted in considerable outflows of funds and reduced
foreign investment in Bolivia, as well as limited access to
international capital markets, all of which may materially
adversely affect The Company’s ability to borrow at
acceptable interest rates or to raise equity capital when it needs
to do so. In addition, a significant decline in the economic growth
or demand for imports of any of Bolivia’s major trading
partners could have a material adverse impact on Bolivia’s
exports and balance of trade and adversely affect Bolivia’s
economic growth.
In
addition, because international investors’ reactions to the
events occurring in one emerging market country sometimes produce a
“contagion” effect, in which an entire region or class
of investment is disfavored by international investors, Bolivia
could be adversely affected by negative economic or financial
developments in other countries.
The
Company’s financial condition and results of any future
operations may also be materially adversely affected by any of the
following factors, as well as by the Bolivian government’s
actions in response to them:
●
currency
depreciations and other exchange rate movements;
●
monetary
policies;
●
inflation rate
fluctuations;
●
economic and social
instability;
●
energy shortages or
other changes in energy prices;
●
interest
rates;
●
disasters at third
party mineral projects;
●
exchange rate
controls and restrictions on remittances abroad;
●
liquidity of the
domestic capital and lending markets;
●
tax policy,
including international tax treaties; and
●
other political,
diplomatic, social and economic policies or developments in or
affecting Bolivia.
Uncertainty
over whether the Bolivian federal government will implement changes
in policy or regulation affecting these or other factors in the
future may contribute to economic uncertainty in Bolivia and to
heightened volatility in the market value of securities issued by
Bolivian companies or companies with Bolivian assets. These and
other future developments in the Bolivian economy and governmental
policies may adversely affect the Company.
18
Political and Economic Risks in Bolivia
The
Pulacayo Project and certain other projects of the Company are
located in Bolivia. Regardless of recent progress in restructuring
its political institutions and revitalizing its economy,
Bolivia’s history since the mid-1960s has been one of
political and economic instability under a variety of governments.
Since 2006, the government has intervened in the national economy
and social structure, including periodically imposing various
controls, the effects of which have been to restrict the ability of
both domestic and foreign companies to freely operate. Although the
Company believes that the current conditions in Bolivia are
relatively stable and conducive to conducting business, the
Company’s current and future mineral exploration and mining
activities in Bolivia are exposed to various levels of political,
economic, and other risks and uncertainties. These risks and
uncertainties include, but are not limited to, hostage taking,
military repression, extreme fluctuations in currency exchange
rates, high rates of inflation, political and labour unrest, civil
unrest, expropriation and nationalization, renegotiation or
nullification of existing concessions, licences, permits and
contracts, illegal mining, changes in taxation policies,
restrictions on foreign exchange and repatriation, changing
political conditions, currency controls, and governmental
regulations that favour or require the awarding of contracts to
local contractors or require foreign contractors to employ citizens
or purchase supplies from a particular jurisdiction.
There
has been a significant level of social unrest in Bolivia in recent
years resulting from a number of factors, including a high rate of
unemployment. Protestors have previously targeted foreign firms in
the mining sector, and as a result there is no assurance that
future social unrest will not have an adverse impact on the
Company’s operations. The Company’s exploration and
development activities may be affected by changes in government,
political instability, and the nature of various government
regulations relating to the mining industry. Bolivia’s fiscal
regime has historically been favourable to the mining industry, but
there is a risk that this could change. In addition, labour in
Bolivia is customarily unionized and there are risks that labour
unrest or wage agreements may impact operations. The Company cannot
predict the government’s positions on foreign investment,
mining concessions, land tenure, environmental regulation, or
taxation. A change in government positions on these issues could
adversely affect the Company’s business and/or its holdings,
assets, and operations in Bolivia. Any changes in regulations or
shifts in political conditions are beyond the control of the
Company. The Company’s operations in Bolivia entail
significant governmental, economic, social, medical, and other risk
factors common to all developing countries. The status of Bolivia
as a developing country may also make it more difficult for the
Company to obtain any required financing because of the investment
risks associated with it. The level of social unrest in Bolivia has
increased significantly following the failed general elections held
on October 20, 2019.
The
Company’s operations in Bolivia may be adversely affected by
economic uncertainty characteristic of developing countries.
Operations may be affected in varying degrees by government
regulations with respect to restrictions on production, price
controls, export controls, currency remittance, income taxes,
expropriation of property, foreign investment, maintenance of
claims, environmental legislation, land use, land claims of local
people, water use, and safety factors. Any such changes could have
a material adverse effect on the Company’s
operations.
Currency fluctuation may affect our operations and financial
stability.
We
transact business in a number of currencies including Canadian,
U.S., Bolivian and Mongolian currencies. Fluctuations in exchange
rates may have a significant effect on our cash flows. Future
changes in exchange rates could materially affect our results in
either a positive or negative direction. We do not currently engage
in foreign currency hedging activities.
We are subject to anti-corruption, anti-bribery and anti-money
laundering laws and regulations in Canada and the United States,
among other countries. Any violations of any such laws or
regulations could have a material adverse impact on our reputation
and results of operations and financial condition.
We are
subject to anti-corruption legislation including the
Corruption of Foreign Public Officials
Act
(Canada) and other similar acts (which we refer to
collectively as “Anti- Corruption Legislation”), which
prohibit us or any of our officers, directors, employees or agents
or any of our stockholders acting on our behalf from paying,
offering to pay or authorizing the payment of anything of value to
any foreign government official, government staff member, political
party or political candidate in an attempt to obtain or retain
business or to otherwise influence a person working in an office
capacity. Anti-Corruption Legislation also requires public
companies to make and keep books and records that accurately and
fairly reflect their transactions and to devise and maintain an
adequate system of internal accounting controls. Our international
activities create the risk of unauthorized payments or offers of
payments by our employees, consultants or agents, even though they
may not always be subject to our control. We have policies and
procedures in place that strictly prohibit these practices by our
employees and agents. However, our existing safeguards and any
future improvements may prove to be less than effective, and our
employees, consultants and agents may engage in conduct for which
we may be held responsible. Any failure by us to adopt appropriate
compliance procedures and to ensure that our employees and agents
comply with Anti- Corruption Legislation and other applicable laws
and regulations in foreign jurisdictions could result in
substantial penalties or restrictions on our ability to conduct our
business, which may have a material adverse impact on us or our
share price.
19
Our results and financial condition are affected by global and
local market conditions that we do not control and cannot
predict.
Access
to financing has been negatively impacted by many factors as a
result of the global financial crisis. This may impact our ability
to obtain debt or equity financing in the future on terms favorable
to us and our ability to attain strategic partnerships or enter
into joint venture arrangements which may further negatively impact
the timeline for commencement of commercial production.
Additionally, global economic conditions may cause decreases in
asset values that are deemed to be other than temporary, which may
result in impairment losses. If such volatility and market turmoil
continue, our business and financial condition could be adversely
impacted.
Our insurance will not cover all the potential risks associated
with a mining company’s operations.
Our
insurance will not cover all the potential risks associated with a
mining company’s operations. We may also be unable to
maintain insurance to cover these risks at economically feasible
premiums. Insurance coverage may not continue to be available or
may not be adequate to cover any resulting liability. Moreover,
insurance against risks such as environmental pollution or other
hazards as a result of exploration and production is not generally
available to us or to other companies in the mining industry on
acceptable terms. We may also become subject to liability for
pollution or other hazards which may not be insured against or
which we may elect not to insure against because of premium costs
or other reasons. Losses from these events may cause the Company to
incur significant costs that could have a material adverse effect
upon its financial condition and results of
operations.
We have never paid any dividends and we are unlikely to do so in
the foreseeable future.
To
date, we have never paid any dividends on our outstanding Common
Shares and we are unlikely to do so in the foreseeable future. Any
decision to pay dividends on our Common Shares will be made by our
Corporate Governance and Compensation Committee on the basis of our
earnings, financial requirements and other conditions.
We engage in extensive related party transactions, which may result
in conflicts of interest involving our management.
We have
engaged in the past, and continue to engage, in extensive related
party transactions involving certain of our management. See the
discussion under the heading “
Item 7.B. Related Party
Transactions
” for further detail. Such related party
transactions could cause us to become materially dependent on the
related parties in the ongoing conduct of our business, and related
parties may be motivated by personal interests to pursue courses of
action that are not necessarily in the best interests of the
Company and our stockholders. Related party transactions often
present conflicts of interest could result in disadvantages to the
Company, and may impair investor confidence, all of which could
materially and adversely affect us.
We rely on information technology systems and networks in our
operations which are provided and maintained by third-party
contractors.
We rely
on information technology (“IT”) systems and networks
in our operations which are provided and maintained by third-party
contractors. The availability, capacity, reliability and security
of these IT systems could be subject to network disruptions caused
by a variety of malicious sources, including computer viruses,
security breaches, cyber-attacks and theft, as well as network
and/or hardware disruptions resulting from unexpected failures such
as human error, software or hardware defects, natural disasters,
fire, flood or power loss. Our operations also depend on the timely
maintenance, upgrade and replacement of networks, equipment, IT
systems and software, as well as pre-emptive expenses to mitigate
the risks of failures.
The
ability of the IT function to support our business in the event of
any such failure and the ability to recover key systems from
unexpected interruptions cannot be fully tested. There is a risk
that if such an event were to occur, our response may not be
adequate to immediately address all of the potential repercussions
of the incident. In the event of a disaster affecting our head
office, key systems may be unavailable for a number of days,
leading to inability to perform some business processes in a timely
manner. The failure of our IT systems or a component thereof could,
depending on the nature, materially impact our financial condition,
results of operations, reputation and share price.
Unauthorized
access to our IT systems as a result of cyber-attacks could lead to
exposure, corruption or loss of confidential information, and
disruption to our communications, operations, business activities
or our competitive position. Further, disruption of critical IT
services, or breaches of information security, could expose us to
financial losses and regulatory or legal action. Our risk and
exposure to these matters cannot be fully mitigated because of,
among other things, the evolving nature of these threats. As a
result, cyber- security and the continued development and
enhancement of controls, processes and practices designed to
protect systems, computers, software, data and networks from
attack, damage or unauthorized access remain a
priority.
We
apply technical and process controls in line with industry-accepted
standards to protect information, assets and systems. Although
these measures are robust, they cannot possibly prevent all types
of cyber-threat. There is no assurance that we will not suffer
losses associated with cyber-security breaches in the future, and
we may be required to expend significant additional resources to
investigate, mitigate and remediate any potential vulnerabilities.
As cyber-threats continue to evolve, we may be required to expend
additional resources to continue to modify or enhance protective
measures or to investigate and remediate any security
vulnerabilities.
20
As a foreign private issuer, we are permitted to file less
information with the SEC than a company that is not a foreign
private issuer or that files as a domestic issuer.
As a
“foreign private issuer,” we are exempt from certain
rules under the Exchange Act that impose disclosure requirements as
well as procedural requirements for proxy solicitations under
Section 14 of the Exchange Act. In addition, our officers,
directors and principal shareholders are exempt from the reporting
and “short-swing” profit recovery provisions of Section
16 of the Exchange Act. Moreover, we are not required to file
periodic reports and financial statements with the SEC as
frequently or as promptly as a company that files as a domestic
issuer whose securities are registered under the Exchange Act, nor
are we generally required to comply with the SEC’s Regulation
FD, which restricts the selective disclosure of material non-public
information. For as long as we are a foreign private issuer we
intend to file our annual financial statements on Form 20-F and
furnish our quarterly financial statements on Form 6-K to the SEC
for so long as we are subject to the reporting requirements of
Section 13(g) or 15(d) of the Exchange Act. However, the
information we file or furnish will not be the same as the
information that is required in annual and quarterly reports on
Form 10-K or Form 10-Q for U.S. domestic issuers. Accordingly,
there may be less information publicly available concerning us than
there is for a company that files as a domestic
issuer.
We may lose our foreign private issuer status, which would then
require us to comply with the Exchange Act’s domestic
reporting regime and cause us to incur additional legal, accounting
and other expenses.
We are
required to determine our status as a foreign private issuer on an
annual basis at the end of our second fiscal quarter. We will lose
our current status as a foreign private issuer if (1) a majority of
our Common Shares are directly or indirectly held of record by
residents of the United States; and (2) either (a) a majority of
our executive officers or directors are U.S. citizens or residents,
or (b) more than 50 percent of our assets are located in the United
States, or (c) our business is administered principally in the
United States. If we lose this status, we would be required to
comply with the Exchange Act reporting and other requirements
applicable to U.S. domestic issuers, which are more detailed and
extensive than the requirements for foreign private issuers. We may
also be required to make changes in our corporate governance
practices in accordance with various SEC rules. Further, we would
be required to comply with United States generally accepted
accounting principles, as opposed to IFRS, in the preparation and
issuance of our financial statements for historical and current
periods. The regulatory and compliance costs to us under U.S.
securities laws if we are required to comply with the reporting
requirements applicable to a U.S. domestic issuer may be higher
than the cost we would incur as a foreign private issuer. As a
result, we expect that a loss of foreign private issuer status
would increase our legal and financial compliance
costs.
As a Canadian incorporated and domiciled company, our financial
statements are prepared using IFRS accounting principles which are
different than the accounting principles under U.S. Generally
Accepted Accounting Principles.
Our
financial statements have been prepared in accordance with IFRS.
IFRS is an internationally recognized body of accounting principles
that are used by many companies outside of the United States to
prepare their financial statements. IFRS accounting principles are
different from those of U.S. GAAP. Investors who are not familiar
with IFRS may misunderstand certain information presented in our
financial statements. Accordingly, we suggest that readers of our
financial statements familiarize themselves with the provisions of
IFRS accounting principles in order to better understand the
differences between these two sets of principles.
Because we are a Canadian company and the majority of our directors
and officers are resident in Canada or countries other than the
United States, it may be difficult for investors in the United
States to enforce civil liabilities against us based solely upon
the federal securities laws of the United States.
We are
governed by the corporate legislation of British Columbia, where we
amalgamated, and our principal place of business is in Canada. Our
auditors and a majority of our directors and officers are residents
of Canada or countries other than the United States. All or a
substantial portion of our assets and those of such persons are
located outside the United States. Consequently, it may be
difficult for U.S. investors to effect service of process within
the United States upon us or our directors, officers and auditors
who are not residents of the United States or to realize in the
United States upon judgments of U.S. courts predicated upon civil
liabilities under the Securities Act (as defined below). Investors
should not assume that Canadian or other foreign courts: (1) would
enforce judgments of U.S. courts obtained in actions against us or
such persons predicated upon the civil liability provisions of the
U.S. federal securities laws or the securities or “blue
sky” laws of any state within the United States or (2) would
enforce, in original actions, liabilities against us or such
persons predicated upon the U.S. federal securities laws or any
such state securities or blue-sky laws.
We are an emerging growth company and we cannot be certain if the
reduced disclosure requirements applicable to emerging growth
companies may make our securities less attractive to investors and,
as a result, adversely affect the price of our securities and
result in a less active trading market for our
securities.
We are
an emerging growth company as defined in Rule 12b-2 under the
Exchange Act, and we may take advantage of certain exemptions from
various reporting requirements that are applicable to other public
companies that are not emerging growth companies. For example, we
have elected to rely on an exemption from the auditor attestation
requirements of Section 404 of the Sarbanes-Oxley Act relating to
internal control over financial reporting, and we will not provide
such an attestation from our auditors.
We may
avail ourselves of these disclosure exemptions until we are no
longer an emerging growth company. We cannot predict whether
investors will find our securities less attractive because of our
reliance on some or all of these exemptions. If investors find our
securities less attractive, it may adversely impact the price of
our securities and there may be a less active trading market for
our securities.
21
We will
cease to be an emerging growth company upon the earliest
of:
●
the last day of the
fiscal year during which we have total annual gross revenues of
$1,070,000,000 or more;
●
the last day of our
fiscal year following the fifth anniversary of the completion of
our first sale of common equity securities pursuant to an effective
registration statement under the U.S. Securities Act of 1933 (the
“Securities Act”);
●
the date on which
we have, during the previous three-year period, issued more than
$1,000,000,000 in non-convertible debt; or
●
the date on which
we are deemed to be a “large accelerated filer”, as
defined in Rule 12b–2 of the Exchange Act, which would occur
if the market value of our Common Shares that are held by
non-affiliates exceeds $700,000,000 as of the last day of our most
recently-completed second fiscal quarter.
The Company’s Passive Foreign Investment Company status has
possible adverse tax consequences for U.S. investors.
Because
the Company is an exploration stage company and its only material
revenues consist of passive investment income on its cash
investments, U.S. holders of Common Shares should be aware that the
Company believes it was classified as a passive foreign investment
company ("PFIC") during the tax year ended December 31, 2020, and
based on current business plans and financial expectations, the
Company anticipates that it should be a PFIC for the current tax
year and may be a PFIC in future tax years. If the Company is a
PFIC for any year during a U.S. shareholder’s holding period
of the Common Shares, then such U.S. shareholder generally will be
required to treat any gain realized upon a disposition of Common
Shares, or any "excess distribution" received on its Common Shares,
as ordinary income, and to pay an interest charge on a portion of
such gain or distribution, unless the shareholder makes a timely
and effective "qualified electing fund" election ("QEF Election")
or a "mark-to-market" election with respect to the Common
Shares.
A U.S.
shareholder who makes a QEF Election generally must report on a
current basis its share of the Company’s net capital gain and
ordinary earnings for any year in which the Company is a PFIC,
whether or not the Company distributes any amounts to its
shareholders. However, U.S. shareholders should be aware that there
can be no assurance that the Company will satisfy the record
keeping requirements that apply to a qualified electing fund, or
that the Company will supply U.S. shareholders with information
that such U.S. shareholders require to report under the QEF
Election rules, in the event that the Company is a PFIC and a U.S.
shareholder wishes to make a QEF Election. Thus, U.S. shareholders
may not be able to make a QEF Election with respect to their Common
Shares. A U.S. shareholder who makes a mark-to-market election
generally must include as ordinary income each year the excess of
the fair market value of the Common Shares over the
taxpayer’s adjusted tax basis therein. This paragraph is
qualified in its entirety by the discussion below under the heading
"Certain United States Federal Income Tax Considerations." Each
U.S. shareholder should consult its own tax advisors regarding the
PFIC rules and the U.S. federal income tax consequences of the
acquisition, ownership, and disposition of Common
Shares.
ITEM
4.
INFORMATION
ON THE COMPANY
A.
History
and Development of the Company
The
Company is an exploration stage company with projects in the United
States, Canada, Bolivia and Mongolia. The Company, in its current
form, is primarily the product of an April 16, 2010 business
combination between Red Hill Energy Inc. and Prophecy Resource
Corp. We are currently governed under the Business Corporations Act
(British Columbia) ("BCBCA"). Our head and registered offices are
located at Suite 1610 – 409 Granville Street, Vancouver,
British Columbia, V6C 1T2, Telephone: 604-569-3661.
Red
Hill Energy Inc. was incorporated on November 6, 1978 under the
Corporations Act (British Columbia) under the name "Banbury Gold
Mines Ltd." Banbury changed its name to "Enerwaste Minerals Corp."
on July 3, 1992 and to "Universal Gun-Loc Industries Ltd." on
December 17, 1993. On April 24, 2002, Universal Gun-Loc changed its
name to "UGL Enterprises Ltd." and then to "Red Hill Energy Inc."
on May 29, 2006.
On
April 16, 2010, Red Hill Energy Inc. changed its name to "Prophecy
Resource Corp." in conjunction with the merger of Red Hill Energy
Inc. and Prophecy Resource Corp.
On June
13, 2011, the Prophecy Resource Corp. changed its name to "Prophecy
Coal Corp." in connection with its amalgamation with Northern
Platinum Ltd. and Prophecy Holdings Inc. and an asset spin-off to
capitalize the Company’s then-controlled affiliate, Wellgreen
Platinum Ltd.
On
January 2, 2015, we completed, by way of a share purchase
agreement, the acquisition of 100% of Apogee Silver Ltd.’s
("Apogee") interest in and to ASC Holdings Limited and ASC Bolivia
LDC (which together, indirectly held through ASC Bolivia LDC
Sucursal Bolivia, Apogee’s joint venture interest in the
Pulacayo Project and Apogee Minerals Bolivia S.A. by paying to
Apogee $250,000 in cash and issuing to Apogee 60 million Common
Shares.
On
January 5, 2015, Prophecy Coal Corp. changed its name to "Prophecy
Development Corp." in connection with an acquisition of assets
located in Bolivia and to better reflect its various interests in
its mining and energy projects at the time in the United States,
Canada, Bolivia and Mongolia.
22
On
March 12, 2015, we entered into a credit facility (which, as
amended, we refer to as the "Credit Facility") with Linx Partners
Ltd. (which we refer to as "Linx"), a private company wholly-owned
and controlled by John Lee, our Chief Executive Officer and
Executive Chairman, and a member of our board of directors (which
we refer to as the "Board"), in order to meet interim working
capital requirements to fund our business operations and financial
commitments. The Credit Facility was amended on May 5, 2015 and
February 24, 2016. The Credit Facility was revolving and had a
maximum principal amount available for advance of $2.5 million. The
Credit Facility had a two-year term with an option to extend for
any number of subsequent one-year terms subject to approval by the
TSX and had a simple interest rate of 18% per annum. We closed out
and terminated the Credit Facility on November 28,
2017.
On May
5, 2015, the Company, through our wholly-owned subsidiary, Red
Hill, entered into a purchase agreement with Khishig Arvin
Industrial LLC, an arm’s-length party in Mongolia, to sell
substantially all of our mining and transportation equipment at our
Ulaan Ovoo Property for total proceeds of approximately $2.34
million. The sale, together with the sale of additional equipment
to other arm’s-length parties, was completed in June 2015 and
we received approximately $2.9 million in cash. In consideration
for our receiving consent to the sales of the equipment from Linx,
which held a general security interest over all of our property
(including property indirectly held through our subsidiaries such
as Red Hill), we issued the equivalent of 1,200,000 common share
purchase warrants of the Company to Mr. Lee, the beneficial owner
of Linx, exercisable at the equivalent of $0.50 per share for a
period of five years expiring on May 22, 2020.
On
September 1, 2015, we announced a non-brokered private placement
involving the issuance of up to the equivalent of 4,000,000 units
at a price of the equivalent of $0.50 per unit. Each unit consisted
of one Common Share and one common share purchase warrant entitling
the holder thereof to acquire an additional Common Share at a price
of the equivalent of $0.70 per share for a period of five years
from the date of issuance. On September 30, 2015, we closed on a
first cash tranche of the aforementioned private placement for
gross cash proceeds of $556,000 through the issuance of the
equivalent of 1,112,000 units. The remainder of this private
placement was cancelled on November 4, 2015.
On
November 12, 2015, we announced a non-brokered private placement
involving the issuance of up to the equivalent of 2,500,000 units
at a price of the equivalent of $0.40 per unit. Each unit consisted
of one Common Share and one common share purchase warrant entitling
the holder thereof to acquire an additional Common Share at a price
of the equivalent of $0.70 per share for a period of five years
from the date of issuance. On November 13, 2015 we closed on a
first tranche of the aforementioned private placement for gross
cash proceeds of $250,000 through the issuance of the equivalent of
625,000 units. On December 18, 2015, we announced the closure of
the aforementioned private placement with no further
subscriptions.
On
January 25, 2016, we completed a non-brokered private placement
involving the issuance of the equivalent of 800,000 units at a
price of the equivalent of $0.25 per unit, with each unit
consisting of one Common Share and one common share purchase
warrant at a price of the equivalent of $0.40 per share for a
period of five years from the date of issuance.
On
January 29, 2016, we voluntarily delisted our Common Shares from
the OTCQX.
On
March 30, 2016, we entered into a debt settlement agreement with
Linx and Mr. Lee, the beneficial owner of Linx, pursuant to which,
we agreed to issue the equivalent of 7,500,000 units to Mr. Lee, in
satisfaction of $1,500,000 of indebtedness owed by us to Linx under
the Credit Facility. Each unit consists of one Common Share and one
common share purchase warrant at a price of the equivalent of $0.40
per share for a period of five years from the date of issuance. We
issued the aforementioned equivalent of 7,500,000 units on June 6,
2016.
On June
7, 2016, we completed the 2016 Consolidation.
On
August 29, 2016, we completed a non-brokered private placement
involving the issuance of the equivalent of 2,027,350 units at a
price of the equivalent of $0.38 per unit for gross proceeds of
$770,393. Each unit consisted of one Common Share and one-half of
one common share purchase warrant, with each full purchase warrant
entitling the holder thereof to purchase one Common Share at a
price equivalent of $0.44 per share for a period of five years from
the date of issuance.
On
September 22, 2016, we sold our 60% interest in the Okeover,
copper-molybdenum project located in British Columbia, Canada to
Lorraine Copper Corp. (which we refer to as "Lorraine"). Under the
terms of the agreement, Lorraine issued 2,200,000 Common Shares of
Lorraine (valued at $0.08 per share) to us and assumed our $19,079
payment obligation to Eastfield Resources Ltd. under such
parties’ existing joint venture agreement. We are
additionally entitled to receive 30% of any payments or proceeds
resulting from third party agreements related to the project
entered into within five years of the date of the sale, up to a
maximum amount of $1,000,000.
On
January 13, 2017, we closed a non-brokered private placement
involving the issuance of the equivalent of 499,990 units at a
price of the equivalent of $0.30 per unit, with each unit
consisting of one Common Share and one warrant to purchase one
Common Share at a price of the equivalent of $0.40 per Common Share
for a period of five years from the date of issuance.
On
January 13, 2017, we entered into another debt settlement agreement
with Linx and Mr. Lee, the beneficial owner of Linx, to settle most
of the outstanding balance we owed to Linx under the Credit
Facility. We agreed to issue the equivalent of 3,000,000 Common
Shares of the Company to Mr. Lee, in satisfaction of $900,000 of
indebtedness owed by us to Linx under the Credit Facility. Linx
agreed to accrue and postpone the repayment of any principal,
interest and fees due under the Credit Facility until the earlier
of October 1, 2017, or such time as the Company is in a reasonable
financial position to repay all or a portion of the amounts
owing.
23
On
February 10, 2017, we acquired the remaining 20% title interest
held by Randsburg International Gold Corp. in the patented claims
that comprise the Titan Project, and issued the equivalent of
200,000 Common Shares of the Company in consideration
therefor.
On
April 12, 2017, we closed a non-brokered private placement
involving the issuance of the equivalent of 1,032,500 units at a
price of the equivalent of $0.40 per unit, with each unit
consisting of one Common Share and one warrant to purchase one
Common Share at a price of the equivalent of $0.50 per Common Share
for a period of five years from the date of issuance.
On June
22, 2017, we acquired through lease, the Gibellini Project, by
paying USD$35,000 in cash to Janelle Dietrich, (whom we refer to as
the “Gibellini Lessor”) with the intent to carry-out
mining operations there. Under the mineral lease agreement, we
agreed to lease the Gibellini mining claims by paying to the
Gibellini Lessor, annual advance royalty payments which will be
tied, based on an agreed formula (not to exceed USD$120,000 per
year), to the average vanadium pentoxide price of the preceding
year. Upon commencement of production, we intend to maintain our
acquisition through lease of the Gibellini mining claims by paying
to the Gibellini Lessor, a 2.5% net smelter return (which we refer
to as “NSR”) until a total of USD$3 million is paid.
Thereafter, the NSR will be reduced to 2% over the remaining life
of the mine. All advance royalty payments made, will be deducted as
credits against future production royalty payments. The lease is
for a term of 10 years, which can be extended for an additional 10
years at our option. On April 23, 2018, we amended the mineral
lease agreement to provide us with an option at any time during the
term of the mineral lease agreement, to require the Gibellini
Lessor to transfer her title over all of the leased Gibellini
mining claims (excluding four claims which will be retained by the
Gibellini Lessor and which contain minimal resources) to us in
exchange for USD$1,000,000, to be paid as an advance royalty
payment (we refer to this as the “Transfer Payment”).
We received a credit of USD$99,027 towards the Transfer Payment
upon signing of the amendment, with the remaining USD$900,973
portion of the Transfer Payment due and payable by us to the
Gibellini Lessor upon completion of the transfer of the
aforementioned claims from the Gibellini Lessor to us. The advance
royalty obligation and production royalty will not be affected,
reduced or relieved by the transfer of title.
On July
10, 2017, we acquired through lease, the Louie Hill group of claims
in Nevada, USA, by paying USD$10,000 in cash to Richard A. McKay,
Nancy M. Minoletti and Pamela S. Scutt (whom we refer to
collectively as the “Louie Hill Lessors”) with the
intent to carry out mining operations there. Under the mineral
lease agreement, we will lease the Louie Hill group of claims by
paying, to the Louie Hill Lessors, annual advance royalty payments
which will be tied, based on an agreed formula (not to exceed
USD$28,000 per year), to the average vanadium pentoxide price for
the preceding year. Upon commencement of production, we intend to
maintain our acquisition through lease of the Louie Hill group of
claims by paying to the Louie Hill Lessors, a 2.5% NSR of which,
1.5% of the NSR may be purchased by us at any time for USD$1
million, leaving the total NSR to be reduced to 1% over the
remaining life of the mine. All advance royalty payments made, will
be deducted as credits against future production royalty payments.
The lease is for a term of 10 years, which can be extended for an
additional 10 years at our option.
On
September 20 and October 16, 2017, we closed on the first and
second tranches, respectively, of a non-brokered private placement,
pursuant to which we issued a total of the equivalents of 7,845,460
units and 11,397,110 special warrants each, at a price of the
equivalent of $0.35 per unit or special warrant. Each unit
consisted of one Common Share and one-half of one share purchase
warrant. Each whole warrant entitles the holder thereof to acquire
one Common Share at a price equivalent of $0.40 and is exercisable
for a period of three years from the date of issuance. Each Special
Warrant was to be exercisable for one unit at no additional cost to
the holder provided TSX and shareholder approval for the issuance
was obtained within a specified time. On December 18, 2017, all the
special warrants were converted into units.
On
December 5, 2017, we announced we had significantly expanded the
land position at our Gibellini Project by staking 198 new claims
immediately adjacent to the Gibellini Project covering 4091 acres
sufficient to enable future vanadium mining, processing and
extraction.
THREE YEAR HISTORY
Year Ended December 31, 2018
On
February 15, 2018, we acquired an additional 105 unpatented lode
mining claims located adjacent to our existing Gibellini Project,
through the acquisition of 1104002 B.C. Ltd. and its Nevada
subsidiary, by paying a total of $335,661 in cash, settling $14,338
in debt and issuing the equivalent of 500,000 common share purchase
warrants to arm’s-length, private parties.
On
February 27, 2018, we re-listed our Common Shares on the OTCQX,
which began trading again under the symbol "PRPCF".
On
April 23, 2018, we announced an amendment to the Gibellini mineral
lease agreement dated June 22, 2017, whereby we were granted the
option to cause the Gibellini Lessor to transfer title to
substantially all of the applicable Gibellini mining claims to us
in exchange for US$1,000,000, to be paid as an advance royalty
payment.
On
August 14, 2018, we closed the Company’s non-brokered private
placement for gross proceeds of $1,137,197 through the issuance of
4,061,417 units of the Company. Each unit is comprised of one
Common Share and one common share purchase warrant. Each warrant
entitles the holder to purchase one additional Common Share at an
exercise price of $0.40 for a period of three years from the
closing of the first tranche of the placement.
On
August 8, 2018, we completed the Forward Split.
On
August 20, 2018, the Company secured water supply for the Gibellini
Project’s construction and operation. The Company signed a
10-year water lease agreement (the "Gibellini Agreement") with the
owner of a private ranch, located approximately 14.5 km from the
Gibellini Project. The Gibellini Agreement can be extended for any
number of additional 7-year terms, not to exceed (with the primary
term) a total of 99 years. Per the terms of the Gibellini
Agreement, the lessor has granted to the Company the rights to 805
acre-feet (approximately 262.4 million gallons) of water per year
for the Gibellini Project, at a minimum flow rate of 500 gallons
per minute from its year-round springs surface water
stream.
24
On
October 2, 2018, the Company signed a Memorandum of Agreement for
voluntary cost recovery with the U.S. Department of the Interior
Bureau of Land Management (the "BLM"), Battle Mountain District
office to expedite Gibellini Project permitting efforts. The
Company and the BLM agreed in principal to a fixed cost structure
that will have the Company reimburse the BLM for the cost of all
anticipated work for the BLM to complete its review of the
Company’s submission of mine plan of operations and any
updates to existing baseline studies.
On
November 22, 2018, we closed a bought deal financing previously
announced on November 1, 2018, which raised gross proceeds of
$5,520,000. The Company entered into an agreement for BMO Nesbitt
Burns Inc. to buy, on a bought deal basis, 12,000,000 Common
Shares, at a price of $0.46 per share. The Common Shares were
offered by way of a short form prospectus in each of the provinces
and territories of Canada, except Québec. The Company incurred
$560,576 in Common Share issuance costs.
On
December 18, 2018, the Company announced that it selected M3
Engineering & Technology Corporation to provide engineering,
procurement, construction and management services for its Gibellini
Project in response to its Request for Proposal issued on August
15, 2018.
Year Ended December 31, 2019
On
February 14, 2019, the Company announced that it had retained Amec
Foster Wheeler E&C Services Inc. (Wood) to undertake updating
of the mineral resource and mining section for the Company’s
upcoming feasibility study to be completed to the standards of NI
43-101 of its Gibellini Project.
On
March 18, 2019, the Company announced that the Ulaan Ovoo Property
had started up. The Company also reported that it had executed a
lease agreement with an arms-length private Mongolian company (the
"Mongolian Lessee") whereby the Mongolian Lessee performs mining
operations at the Company’s Ulaan Ovoo Property and will pay
the Company $2 for every tonne of coal shipped from the Ulaan Ovoo
site premises. The Mongolian Lessee is responsible for all capital
and operating expenses, government taxes and royalties related to
Ulaan Ovoo operation.
On
March 26, 2019, the Company announced its vanadium assay results
from its fall 2018 exploration reconnaissance program on the
Gibellini Project. There were 155 assays taken from three
prospective exploration areas which all were within 5 km to the
existing Gibellini Project vanadium NI 43-101 compliant resource
pit.
On May
1, 2019, the Company announced that it had received guidance
regarding expected permitting timelines following the Company
meeting with regulators in late April 2019. The Company estimated
Q1 2020 as the target date for publication of the Notice of Intent
("NOI") to prepare an Environment Impact Statement ("EIS") in the
Federal Register. Upon publication of the NOI the review process is
mandated to be completed within a 12-month period under the US
Department of the Interior’s Secretarial Order No. 3355.
Based on this guidance, an EIS Record of Decision ("ROD") was
expected no later than Q1 2021. Upon receipt of a positive ROD and
issuance of Nevada State permits, the Company plans to start mine
construction in 2021 and begin vanadium production by Q4
2022.
On May
27, 2019, the Company announced that its Annual General Meeting
("AGM") had been scheduled for September 12, 2019. Due to some
recent changes in the Company’s Management, the AGM was
delayed from being held within six months of its year end. TSX
approval had been obtained to delay the Company’s AGM to
September 12, 2019.
On June
19, 2019, the Company announced the appointment of a third party
National Environmental Policy Act ("NEPA") contractor and SWCA
Environmental Consultants ("SWCA") to work under the direction of
the BLM per the provisions of a Memorandum of Understanding between
SWCA, BLM and the Company, to prepare the EIS for the and assist
the BLM in the maintenance of the administrative record. The EIS
was prepared pursuant to Secretarial Order 3355 in the Federal
Register to BLM.
On July
8, 2019, the Company announced that it had submitted its updated
Plan of Operations (the "POO") through the Company’s U.S.
subsidiary for the Gibellini Project to the BLM and the Reclamation
Permit Application to the Nevada Division of Environmental
Protection, Bureau of Mining Regulation and Reclamation (the
"BMRR"). The POO was submitted on schedule and prepared under
budget. The POO submission is the last major step before the
publication of the NOI which will initiate the EIS process under
the Secretary of Interior Order No. 3355 (Streamlining National
Environmental Policy Reviews and Implementation of Executive Order
13807; see Company’s news release dated March 28, 2018 filed
on SEDAR). The streamlined EIS process from NOI to the ROD is one
year.
The
Company further announced that a positive resolution was issued
from the Mongolia city tax tribunal regarding the Company’s
VAT dispute with the Mongolia tax office. The resolution, which is
binding and final, affirmed the Company’s outstanding VAT
credit of 1.169 billion MNT (USD$439,470 based on rate of 2,660 MNT
to 1 USD$) which resulted from past mining equipment purchases. The
VAT credit can be used to offset the Company’s taxes and
royalty payments; or be refunded in cash by Mongolia’s
Ministry of Finance within 12 to 24 months processing time. In
addition, the Company also reported that it had successfully
converted its Chandgana Khavtgai coal exploration license to a
mining license in central Mongolia.
On July
19, 2019, the Company announced its objectives for the second half
of 2019 for its Gibellini Project. The Company submitted the key
Nevada state permit applications required for project construction
by the end of the third quarter of 2019. It is anticipated that all
approvals will be received by the third quarter of
2021.
25
On July
29, 2019, the Company the Company granted an aggregate of 1,685,000
incentive stock options to its directors, officer and employees of
the Company. The options are exercisable at a price of $0.20 per
share for a term of five years expiring on November 1, 2024 and
vest at 12.5% per quarter for the first two years following the
date of grant.
On
August 19, 2019, the Company announced the formation of two wholly
owned Canadian BC subsidiaries: Silver Elephant Mining Corp. (which
subsequently changed its name to "Illumina Silver Mining Corp.")
and Asia Mining Inc. in order to facilitate potential future
spinoffs of the Company’s wholly owned Bolivian silver
operation and Mongolian coal operation.
On
August 26, 2019, the Company announced that it was undertaking a
non-brokered private placement involving the issuance of 13 million
Common Shares at a price of $0.20 per share to raise aggregate
gross proceeds of $2,600,000 (the "August 2019 Placement"). The
Company’s management and directors subscribed to 2 million
Common Shares in the August 2019 Placement. These Common Shares
were subject, under applicable Canadian securities laws, to a
minimum hold period of four months plus one day from the date of
issue.
On
September 6, 2019, the Company closed the August 2019 Placement.
The Placement raised gross cash proceeds of $2,600,000 through the
issuance of 13,000,000 Common Shares at a price of $0.20 per share.
The Company paid $10,000 in cash and issued 525,000 Common Shares
as finder’s fees. Proceeds of the August 2019 Placement were
used to develop the Company’s mineral projects and for
general working capital purposes.
On
September 24, 2019, the Company announced the successful completion
of its internal reorganization. The Company further announced,
subject to approval by the TSX, that it would issue 175,000 Common
Shares, with a four-month hold period under applicable Canadian
securities laws, to Mr. Bryan Slusarchuk in exchange for consulting
services to the Company.
On
September 30, 2019, the Company announced a 5,000-meter diamond
drilling at its Pulacayo Project had started with first set of
assay results expected in early November, 2019.
On
October 3, 2019, the Pulacayo Mining Production Contract ("Pulacayo
MPC") was executed between the Company and the Corporación
Minera de Bolivia ("COMIBOL"), a branch of the Bolivian Ministry of
Mining and Metallurgy. Notification of the final government
resolution approving the Pulacayo MPC was received on September 27,
2019. The Pulacayo MPC granted the Company the 100% exclusive right
to develop and mine at the Pulacayo and Paca concessions for up to
30 years, which is comparable to a mining license in Canada or the
United States. The Company’s Bolivian subsidiaries had spent
$25 million on Pulacayo and Paca as of October 3, 2019 with over
80,000 meters of drilling, with a completed historic independent
feasibility study, and an approved detailed environment impact
assessment.
On
October 7, 2019, the Company announced that it was undertaking a
non-brokered private placement involving the issuance of 10 million
Common Shares at a price of $0.40 per share (the "October 2019
Placement") to raise aggregate gross proceeds of
$4,000,000.
On
October 9, 2019, the Company issued 104,951 Common Shares at a
value of $43,060 to its directors to settle outstanding director
fees.
On
October 21, 2019, the Company announced that it had closed the
October 2019 Placement. The October 2019 Placement raised gross
cash proceeds of $3,900,000 for Company through the issuance of
9,750,000 Common Shares at a price of $0.40 per share. Mr. Eric
Sprott, through 2176423 Ontario Ltd., a corporation that is
beneficially owned by him, acquired 5,000,000 Common Shares under
the October 2019 Placement for a total consideration of $2,000,000.
Following the completion of the private placement, Mr.
Sprott’s holdings represented 9% of the issued and
outstanding Common Shares at the time of the October 2019
Placement. Mr. Sprott beneficially owned 5,900,000 Common Shares in
the Company prior to this investment. The Company’s
management and directors purchased 0.4 million Common Shares for
proceeds of $160,000. The Company issued 654,500 Common Shares as
finder’s fees to Mackie Research Capital Corp. All Common
Shares issued in the October 2019 Placement were subject to a four
month and one day hold period under applicable Canadian securities
laws. Proceeds were used for the Company’s mineral project
exploration and for general working capital purposes.
On
October 28, 2019, the Company announced the diamond drilling
results from the Company’s 100% controlled Paca silver
project in the Potosi department of Bolivia.
On
November 1, 2019, the Company granted an aggregate of 1,680,000
incentive stock options to its directors, officer and employees of
the Company. The options are exercisable at a price of $0.44 per
share for a term of five years expiring on November 1, 2024 and
vest at 12.5% per quarter for the first two years following the
date of grant.
On
November 7, 2019, the Company announced that it had submitted,
through its wholly owned US subsidiary Nevada Vanadium, LLC
("Nevada Vanadium"), the applications and Engineering Design
Reports for the primary mining permits that govern project
construction, operations and closure for its Gibellini Project
located in Eureka County, Nevada, U.S., to BLM and the Gibellini
Project EIS contractor, SWCA. The permit applications were
submitted on October 31, 2019 for the Water Pollution Control
Permit and the Class II Air Quality Permit. These Nevada state
permits have been developed to provide construction level
engineering that supports the mine plan previously submitted to the
BLM in the POO. Comments received from both the BLM and SWCA were
used as guidance in the engineering design to ensure the State and
Federal Permits are aligned and reflect the most current guidance
provided by the Company, NDEP and BLM.
26
On
December 4, 2019, the Company announced that it had received on
November 18, 2019, the 18-page Resolution No. 195/2018 issued by
the Supreme Court of Bolivia (the "2019 Resolution"), signed by all
of its nine judges. It declared that the contentious tax claim of
US$6,556,787 (US$816,769.54 income tax on alleged 2003 profits and
US$5,740,017.81 in interests and penalties) brought by
Bolivia’s General Revenue Authority against the
Company’s Bolivian subsidiary was not proven. The 2019
Resolution is final and binding. Hence neither the Company nor the
Company’s Bolivian subsidiaries owe any outstanding back
taxes to the Bolivian General Revenue Authority.
On
December 18, 2019, the Company announced that the phase two
drilling had commenced at the Pulacayo Project. It is a 5,000-meter
program that will consist mainly of wide step-out drilling up to
1.5km west of the current 43-101 Pulacayo resource. That current
Pulacayo resource covers 1.4 km in strike and represents only a
small portion of the Tajo vein system (the "TVS") which is over 3
km in strike and open to least 1,000 meters at depth, according to
historical records of underground mining.
During
the year ended December 31, 2019, the Company experienced various
changes in Directors, Officers and Management of the Company as
follows:
●
Gerald Panneton
ceased to be the President, Chief Executive Officer and a Director
on February 15, 2019;
●
John Lee ceased to
act as Head of International Affairs on February 15,
2019;
●
Tony Wong ceased to
act as Corporate Secretary on February 22, 2019;
●
Louis Dionne ceased
to be a Director on February 28, 2019;
●
Rocio Echegaray was
appointed Corporate Secretary on March 8, 2019;
●
Michael Doolin was
appointed Chief Operating Officer and Interim Chief Executive
Officer on April 1, 2019;
●
John Lee ceased to
act as Interim President and Chief Executive Officer on April 1,
2019;
●
Bekzod Kasimov
ceased to act as Vice-President Business Development on July 1,
2019;
●
Marc Leduc was
appointed as a Director on July 22, 2019;
●
Joaquin
Merino-Marquez was appointed as Vice-President, South American
Operation on November 1, 2019;
●
Ronald Clayton was
appointed as a Director on November 4, 2019;
●
Michael Drozd
ceased to act as Vice-President, Operations on November 7,
2019;
●
Rocio Echegaray
ceased to act as Corporate Secretary on November 15, 2019;
and
●
Brigitte McArthur
was appointed Corporate Secretary on November 15,
2019.
Year Ended December 31, 2020
On
January 8, 2020, the Company announced the following:
●
a special meeting
of the shareholders to be held on March 16, 2020, to seek
shareholder approval the following:
●
changing the name
of the Company from "Prophecy Development Corp." to "Silver
Elephant Mining Corp." (the "Name Change");
●
a consolidation of
the issued and outstanding Common Shares at a ratio between one (1)
new Common Share for every five (5) to ten (10) issued and
outstanding Common Shares; and
●
ratification of
1,275,000 stock options previously granted to certain directors,
officers, employees and consultants of the Company on July 29, 2019
pursuant to the terms of the Company’s 20% fixed share-based
compensation plan, as amended (the "Share-Based Compensation
Plan").
●
the engagement of
Ken Cotiamco to provide investor relations and shareholder
communications services effective January 6, 2020. The Company
further announced that Ken Cotiamco entered into a consulting
agreement whereby Ken Cotiamco would receive from the Company
remuneration of $4,000 per month for a term of three months, which
could be extended and also pursuant to the consulting agreement the
Company granted 100,000 incentive stock options at a price of $0.41
per share for a term of five years expiring on January 6,
2025;
●
pursuant to the
Share-Based Compensation Plan, the issuance of an aggregate of
1,601,000 Common Shares (subject to a minimum hold period of four
months plus one date from the date of issuance, under applicable
Canadian securities laws) as 2019 bonus payments to certain
directors, officers, employees and consultants of the
Company;
●
that further to the
Company’s news release dated December 18, 2019, the Company
had completed the first of 3 holes of the planned 17 drill holes at
the Pulacayo Project; and
●
the Company had
mobilized a second drilling rig to the Pulacayo Project and expects
to complete the proposed 5,000 meter drill program in February
2020, with full assay results by March 2020.
On
January 21, 2020, the Company provided its first step-out diamond
drilling results from its 100%-controlled Pulacayo
Project.
On
March 6, 2020, the Company provided its 2,598-meter, 16-hole
Pulacayo step out drill program from its 100%-controlled Pulacayo
Project.
On
March 9, 2020, the Company commenced its district exploration
program at its Pulacayo Project.
On
March 16, 2020, the Company held the special meeting of the
shareholders where it received shareholder approval of the Name
Change and the 2020 Consolidation and ratification of the 1,275,000
stock options granted under the Share-Based Compensation
Plan.
27
On
March 16, 2020, the Company amended its articles of incorporation
and changed its name to "Silver Elephant Mining Corp."
On
March 19, 2020, the Company changed its symbol on the TSX from PCY
to "ELEF".
On
March 23, 2020, the Company changed its symbol on the OTCQX from
PRPCF to "SILEF".
In
March 2020, the World Health Organization declared coronavirus
COVID-19 a global pandemic. This contagious disease outbreak, which
has continued to spread, and any related adverse public health
developments, has adversely affected workforces, economies, and
financial markets globally, potentially leading to an economic
downturn. It is not possible for the Company to predict the
duration or magnitude of the adverse results of the outbreak and
its effects on the Company’s business or results of
operations at this time.
The
Company has implemented preventative measures across its offices
and operations in order to safeguard the health of its employees,
while continuing to operate safely and responsibly maintain
employment and economic activity. All of the Company’s
corporate offices have been closed and remote work implemented for
all employees able to do so. Other measures being put into place at
the Company’s operations include:
●
Reducing or
eliminating in person meetings and other large
gatherings;
●
Enhanced cleaning
and disinfecting protocols, including frequent disinfecting of
employee work areas;
●
Promoting personal
preventative measures, such as frequent handwashing;
●
Screening all
contractors and external visitors to site for risk factors and
symptoms;
●
Increasing social
distancing practices at site, such as cancelling large group
meetings and changing meetings from in-person to
virtual;
●
Requiring employees
who show symptoms or are in close contact with someone with
symptoms to stay home from work;
●
Requiring employees
returning from travel outside of Canada to self-isolate;
and
●
Reducing the number
of on-site staff as much as possible and implementing work from
home where feasible.
On
April 15, 2020, the Company announced a non-brokered private
placement (the "April 2020 Placement") involving the issuance of up
to 14 million units (each a "Unit") at a price of $0.13 per Unit.
Each Unit consisted of one Common Share and one common share
purchase warrant, each entitling the holder to acquire an
additional Common Share at a price of $0.16 per share for a period
of three years from the date of issuance.
On May
1, 2020, the Company closed the first tranche of the April 2020
Placement. The first tranche raised gross proceeds of $1,330,940
through the issuance of 10,238,000 Units.
On May
4, 2020, the Company granted an aggregate of 3,000,000 incentive
stock options to certain directors, officers, employees and
consultants of the Company. These options are exercisable at a
price of $0.22 per share for a term of five years expiring on May
4, 2025, and vest at 12.5% per quarter for the first two years
following the date of grant.
On May
20, 2020, the Company closed the second and final tranche of the
April 2020 Placement for $1,976,000 through the issuance of
15,200,000 Units. The Company paid $3,250 in cash and issued
156,900 Units as finder’s fee.
On July
7, 2020, the Company reported that all proposed resolutions put
forth to the shareholders were approved at the Company’s
Annual General and Special Meeting held on July 7, 2020. The
Company had previously received conditional approval from the TSX
to amend the exercise price of an aggregate of 24,318,927
previously issued common share purchase warrants with an exercise
price from between $0.40 to $0.70 (the "Original Warrants") of the
Company to an exercise price of $0.26 per share (the "Amendment")
pending shareholder approval of the Amendment. Pursuant to the
passing of the ordinary resolution approving the Amendment, the
Original Warrants were cancelled and replaced with amended common
share purchase warrants with an exercise price of $0.26 per share
(the "Amended Warrants"), with the Amendment becoming effective as
of July 17, 2020. All other terms of the Amended Warrants were
unchanged from the Original Warrants.
On July
13, 2020, the Company announced that it had entered into a binding
sales and purchase agreement (the "Triunfo SPA") with a private
party to acquire the El Triunfo Gold-Silver-Lead-Zinc Project in La
Paz District, Bolivia (the "Triunfo Project"). Subject to the
provisions of the Triunfo SPA, the vendor agreed to sell, assign,
and transfer to the Company, and the Company agreed to purchase
from the vendor, the mining rights of the Triunfo Project upon the
Company paying the vendor the sum of US$1,100,000, consisting of
US$100,000 paid on execution of the Triunfo SPA, and US$1,000,000
to be paid on or before June 15, 2025.
On July
16, 2020, the Company announced that the NOI to prepare an the EIS
for the Gibellini Project was published on July 14, 2020, in the
Federal Register. The NOI formally commenced the 12-month timeline
to complete the NEPA review and the EIS preparation by the
BLM.
On July
20, 2020, the Company announced it had engaged Mercator Geological
Services Limited ("Mercator") to prepare an updated NI 43-101
compliant technical report for the Pulacayo Project. The Company
further announced the departure of Michael Doolin, the
Company’s Chief Executive Officer and Chief Operating
Officer. John Lee was subsequently appointed as Chief Executive
Officer of the Company.
On
August 3, 2020, the Company announced the appointment of David H.
Smith as an Independent Director and the resignation of Ronald
Clayton from the Company’s board of directors.
28
On
August 11, 2020, the Company announced diamond infill drilling
results from the Pulacayo Project which demonstrated broad
continuity of mineralization and grade starting from near-surface,
consistent with historic Hochschild mining records, which indicated
high grade mineralization with increasing depth to more than 1,000
meters from surface.
On
August 18, 2020, the Company granted an aggregate of 720,000
incentive stock options to a director, employee and consultant of
the Company. The options are exercisable at a price of $0.50 per
share for a term of five years expiring on August 17, 2025, and
vest at 12.5% per quarter for the first two years following the
date of grant.
On
August 24, 2020, the Company announced that its wholly owned
subsidiary, Nevada Vanadium, entered into a binding definitive
Asset Purchase Agreement (the "Bisoni APA") with CellCube Energy
Storage Systems Inc. ("CellCube") to acquire the Bisoni vanadium
project (the "Bisoni Project") situated immediately southwest of
the Gibellini Project.
On
August 19, 2020, the Company announced that it had received its
first chip sampling results on the Triunfo Project. A total of 103
chip samples were collected from outcrops at surface and from
underground adits and tunnels accessing the main east-west
mineralized trend. The width of the samples varies from 1.0 to
5.3m, exhibiting an average width of 2.5m. 37 Triunfo samples
assayed up to 8.3 g/t AuEg. These results confirmed the Triunfo
Project exhibits near-surface Au-Ag-Pb-Zn
mineralization.
On
September 8, 2020, the Company announced that it had entered into a
binding sales and purchase agreement (the "Sunawayo SPA") with a
private party to acquire the Sunawayo silver-lead mining project
(the "Sunawayo Project") located immediately adjacent to the Malku
Khota silver project in Bolivia. Subject to the provisions of the
Sunawayo SPA, the vendor of the Sunawayo Project agreed to
irrevocably transfer the mining rights of the Sunawayo Project to
the Company for consideration of US$6,500,000, which payment
consists of US$300,000 paid on execution of the Sunawayo SPA, with
the remaining US$6,200,000 to be paid in cash over a one-year
period in twelve equal monthly installments, starting March 1,
2021.
On
September 18, 2020, the Company’s wholly owned subsidiary,
Nevada Vanadium completed the acquisition of the Bisoni Project
pursuant to the Bisoni APA. The Bisoni Project is comprised of 201
lode mining claims, along a 13.8 kilometer strike that covers an
area of 16.5 square kilometers (1,656 hectares), easily accessed by
a graded gravel road extending south from US Highway 50, and is
about 25 miles south of the town of Eureka, Nevada. As
consideration for the acquisition of the Bisoni Project under the
Bisoni APA, the Company issued 4 million Common Shares (the "Bisoni
APA Shares") and paid $200,000 cash to CellCube. The Bisoni APA
Shares were subject to a Canadian statutory four month hold period
that expired on January 19, 2021. Additionally, subject to TSX
approval, if, on or before December 31, 2023, the price of European
vanadium pentoxide on the Metal Bulletin (or an equivalent
publication) exceeds US$12 a pound for 30 consecutive days, the
Company will issue to CellCube additional Common Shares with a
value of $500,000, calculated based upon the 5 day volume weighted
average price of the Common Shares immediately following the
satisfaction of the vanadium pentoxide pricing
condition.
On
September 28, 2020, the Company announced that all of the initial
forty-eight chip and grab samples collected from surface outcrops
and adits at the Sunawayo Project returned anomalous Ag-Pb assayed
values. Ten of the assayed samples contain either over 100g/t
silver or 10% lead or both. The results exceeded the
Company’s expectations and are an early indication of the
potential for mineral discoveries at the Sunawayo Project. The
Company is mobilizing to start geological and structural mapping to
ascertain the primary controls and trends for mineralization at the
Sunawayo Project. This work will lay the foundation for defining
drill targets by year’s end.
On
October 13, 2020, the Company announced the results of an NI 43-101
compliant mineral resource estimate for the Pulacayo Project
prepared by Mercator. This mineral resource estimate has an
effective date of October 13, 2020, and includes an indicated
mineral resource of 106.7 million oz of silver, 1,384.7 million
pounds of zinc, and 693.9 million pounds of lead, and an inferred
mineral resource of 13.1 million oz of silver, 122.8 million pounds
of zinc and 61.9 million pounds of lead.
On
October 21, 2020, the Company announced that it had entered into an
agreement with Mackie Research Capital Corporation, as lead
underwriter and sole bookrunner (the "Lead Underwriter"), on behalf
of a syndicate of underwriters, including Canaccord Genuity Corp.
and Sprott Capital Partners LP (collectively with the Lead
Underwriter, the "Underwriters"), pursuant to which the
Underwriters agreed to purchase, on a bought‐deal basis,
15,000,000 Common Shares at a price of $0.40 per share for
aggregate gross proceeds of $6,000,000 (the "2020 Prospectus
Offering"). The Company also granted the Underwriters an option
(the "Over-Allotment Option") to increase the size of the 2020
Prospectus Offering by up to 15%, at any time up to 30 days
following the closing of the Offering. The Common Shares were
offered by way of a short form prospectus filed in each province of
Canada, other than Québec pursuant to National Instrument
44-101 –
Short Form
Prospectus Distributions
.
On
October 21, 2020, the Company announced that it had entered into an
amended agreement with the Lead Underwriter to increase the size of
the 2020 Prospectus Offering to 20,000,000 Common Shares at a price
of $0.40 per share for aggregate gross proceeds of $8,000,000. All
other terms of the 2020 Prospectus Offering remained
unchanged.
On
November 17, 2020, the Company filed an NI 43-101 compliant
technical report titled "
Mineral
Resource Estimate Technical Report for the Pulacayo Project,
Potosí Department, Antonnio Quijarro Province,
Bolivia
", prepared by Matthew Harrington, P. Geo, Michael
Cullen, P. Geo, and Osvaldo Arcé, P. Geo, of Mercator, with an
amended report date of November 12, 2020, and an effective date of
October 13, 2020 (the "Pulacayo Technical Report"), with Canadian
securities regulatory authorities. The Pulacayo Technical Report is
available under the Company’s SEDAR profile at www.sedar.com.
On November 17, 2020, the Company also filed its final short form
prospectus with the securities commissions in each of the provinces
of Canada, other than Québec, in connection with the 2020
Prospectus Offering and on
November 24, 2020, the
Company announced the
closing of the 2020 Prospectus
Offering, pursuant to which the Company issued 23,000,000 Common
Shares at a price of $0.40 per share, for aggregate gross proceeds
of $9,200,000, including the full exercise of the Over-Allotment
Option.
29
On November 25, 2020, the Company
announced
that it had received the complete assay results from the
Company’s first diamond drill program at the Triunfo Project.
Borehole TR007 intercepted 48.9 meters of mineralization grading
0.42 g/t gold, 35.5 g/t silver, 1.17% zinc, and 0.83% lead (1.45
g/t AuEq) within 98.9 meters of mineralization grading 1.04 g/t
AgEq starting 13.0 meters downhole.
On
November 30, 2020, the Company announced that it had received the
complete assay results from the Company’s diamond drill
program at the Paca silver-lead-zinc deposit ("Paca") in Bolivia.
Reported widths are intercepted core lengths and not true widths,
as relationships with intercepted structures and contacts vary.
Based on core-angle measurements, true widths range from 77% to 86%
of the reported core length. PND 114, 115, 118 drilled tested
oblique structures parallel to the main east-west trend and
discovered new mineralized zones. PND 114 intersected 16.5 meters
of mineralization grading 55g/t silver equivalent that is to the
north of the Paca north zone. PND 115 intercepted 66 meters of
mineralization grading 75g/t silver equivalent between Paca main
zone and Paca north zone, which are 250 meters apart. PND 118 was
drilled at the eastern edge of the Paca main zone and intersected
112 meters of mineralization grading 50 g/t silver
equivalent.
During
the year ended December 31, 2020, the Company experienced the
following changes in Directors, Officers and
Management:
●
Michael Doolin
ceased to act as Chief Executive Officer on July 17,
2020;
●
John Lee was
appointed Chief Executive Officer effective July 17,
2020;
●
Ronald Clayton
resigned as a Director on July 31, 2020; and
●
David H. Smith was
appointed as a Director on August 3, 2020.
Subsequent Events to December 31, 2020
On
January 21, 2021, the Company announced that a 2,300 meter drilling
program had commenced at its Sunawayo Project. Since that time the
Company has collected over 900 samples along an 8 km strike length.
Over 86% of those samples returned silver assay results grading
from 1 g/t to 458 g/t. A total of 15 drillholes have been planned
over a span of 3km to test potential mineralized structures at the
Caballo Uma and Pujiuni targets at the Sunawayo Project. The
Company completed the drill first hole while continuing its mapping
and sampling program at the Sunawayo Project, which spans 17km
totaling an area of 59.5 km2.
On
January 21, 2021, the Company announced that it had completed a 940
meter diamond drilling program at the Pero target within the
Pulacayo Project.
On January 22, 2021, the Company announced that it had entered into
a binding definitive Asset Purchase Agreement (the "Minago
APA") with Victory Nickel Inc. ("Victory Nickel")
to acquire
the Minago Nickel Project located in the Thompson nickel belt
("TNB") in Manitoba, Canada (the "Minago Project"). The summary of
the proposed transaction is as follows:
●
Subject to the terms of the Minago APA, the Company acquired the
Minago Project from Victory Nickel for aggregate consideration of
US$11,675,000, which consisted of a US$6,675,000 ("Property
Payment") credit against certain secured debt owed by Victory
Nickel to the Company at closing and US$5,000,000 in Common Shares
("Consideration Shares") to be issued over a one-year
period.
●
Additionally, the Company agreed to issue to Victory Nickel
$2,000,000 in Common Shares, upon the price of nickel exceeding
US$10 per pound for 30 consecutive business days, occurring before
December 31, 2023.
●
At
closing, pursuant to the Minago APA, the Company further subscribed
for 40,000,000 Common Shares of Victory Nickel (each, a "VN Share")
at a price per VN Share of $0.025 for consideration of
$1,000,000.
The US$6,675,000 Property Payment was made at closing in the form
of a credit in the favour of Victory Nickel of US$6,675,000 against
an aggregate of approximately US$
12,056,307
owed by Victory Nickel
pursuant to a Secured Debt Facility ("SDF"). The current SDF
creditor and the Company entered into arm-length definitive Debt
Purchase and Assignment Agreement ("DPAA"), whereby the SDF
creditor sold and assigned the SDF to the Company for US$6,675,000.
Under the Minago APA, the Company agreed to
further credit the remaining balance under the SDF
to Victory Nickel’s benefit, upon the completion of an
independent economic study proving positive net present value being
prepared in respect of the Minago Project
in the future after
closing
. The Company also
granted Victory Nickel a right of first refusal until December 31,
2023 to exploit the sandstone (non-nickel bearing sulphides)
resources for frac sand extraction at the Minago Project. The
Consideration Shares will be issued in three tranches as follows:
US$2,000,000 worth of Consideration Shares at Closing; a further
US$2,000,000 worth of Consideration Shares on or before August 31,
2021, and a further US$1,000,000 worth of Consideration Shares on
or before December 31, 2021.
Closing was subject to
customary closing conditions, including the final approval of the
TSX and the Canada Stock Exchange ("CSE").
On
January 27, 2021, the Company announced the initial drill results
from the Pero discovery within the Pulacayo Project.
On
January 28, 2021, the Company announced that it had been named to
the 2021 OTCQX® Best 50, a ranking of top performing companies
traded on the OTCQX Best Market in 2020.
On
February 1, 2021, the Company announced a non-brokered private
placement (the "February 2021 Placement") involving the issuance of
up to 10 million Common Shares at a price of $0.375 per share to
raise aggregate gross proceeds of up to $3,750,000.
30
On
February 5, 2021, the Company announced that it had closed the 2021
February Placement. The 2021 February Placement raised gross cash
proceeds of $3,750,000 through the issuance of 10,000,001 Common
Shares at a price of $0.375 per share. The Company paid $73,875 in
cash as finder’s fees. The Common Shares are subject to a
four month and one day hold period. Proceeds of the 2021 February
Placement are expected to be used for exploration, working capital
and general corporate purposes which may include project
evaluations and acquisitions.
On
February 10, 2021, the Company announced
that further to its
press release dated January 22, 2021, it
had
completed the acquisition of the Minago Project.
Under the
terms of
the Minago APA the Company acquired the Minago Project for
aggregate consideration of US$11,675,000, which consisted of a
Property Payment of US$6,675,000 pursuant to the SDF and
US$5,000,000 worth of the Consideration Shares to be issued to
Victory Nickel over a 1-year period. An initial tranche of
5,363,630 Consideration Shares were issued on February 9,
2021,
a further US$2,000,000
worth of Consideration Shares will be issued on or before August
31, 2021, and a further US$1,000,000 worth of Consideration Shares
on or before December 31, 2021, at such time as may be determined
at the sole option of the Company
. All Consideration
Shares are subject to 4-month plus 1-day statutory hold period. The
Property Payment was a credit in favour of Victory Nickel against
an aggregate of approximately US$
12,056,307
owed by Victory Nickel
pursuant to the SDF.
Immediately prior to acquiring the Minago Project, the Company
acquired the SDF for US$6,675,000 in cash and 3 million common
share purchase warrants of the Company, each exercisable until
February 8, 2023
at an exercise price of $0.4764
from an
arms-length party pursuant to the DPAA. The SDF has been
restructured to bear zero percent interest and to expire on
February 8, 2026, which will automatically be extended in 5-year
increments. The Company
will
credit the remaining balance under the SDF to Victory
Nickel’s benefit, upon completion of an independent economic
study proving positive net present value in respect of the Minago
Project
during the term of the
SDF
. The Company also agreed to
reimburse up to $200,000 of financial advisory services rendered by
Red Cloud Securities Inc. as disclosed in a news release dated
October 30, 2020 issued by Victory Nickel.
The Company further subscribed to 40,000,000 VN Shares at a price
of $0.025 per VN Share, for cash consideration of $1,000,000, which
resulted in the Company owning approximately 29% of Victory Nickel
post-investment on a non-diluted basis. Each VN Share is subject to
4-month plus 1-day statutory hold period.
Additionally, the
Company agreed to issue to Victory Nickel $2,000,000 of the Common
Shares, upon the price of nickel exceeding US$10 per pound for 30
consecutive business days, at any time before December 31, 2023.
The Company also
granted
Victory Nickel the right of first refusal exercisable until
December 31, 2023 with respect to the exploration of the sandstone
(non-nickel bearing sulphides) resources for frac sand extraction
at the Minago Project.
On
January 27, 2021, the Company announced that the first ever drill
hole at the Sunawayo Project has intercepted 137 meters of
mineralization grading 36 g/t silver, starting from 0
meters-depth.
The
Company has not made any capital divestitures during the past three
fiscal years.
Currently,
we do not have operating revenues, and we do not anticipate
generating operating revenues during the fiscal year 2021. Our
primary source of funds since inception has been through the
issuance of equity securities. At December 31, 2020, the Company
had cash flow of $7.6 million (2019 - $3 million; 2018 - $5.3
million) representing an increase of $4.6 million from $3 million
held at December 31, 2019. The Company’s working capital at
December 31, 2020 was a surplus of $6 million (2019 - $0.95
million; 2018 - $3.8 million). We will continue to seek capital
through the issuance of equity, strategic alliances or joint
ventures, and debt, of which the Company currently has
none.
The SEC
maintains an Internet site that contains reports, proxy and
information statements, and other information regarding issuers
that file electronically with the SEC at:
http://www.sec.gov
.
B.
Business
Overview
The
Company is a mineral exploration stage company. The Company’s
principal projects are the Pulacayo Project located in Bolivia and
the Gibellini vanadium project, which is comprised of the Gibellini
and Louie Hill vanadium deposits and associated claims located in
the State of Nevada, USA (the "Gibellini Project").
The
Pulacayo Project comprises seven mining areas covering an area of
approximately 3,560 hectares of contiguous areas centered on the
historical Pulacayo mine and town site. The Pulacayo Project is
located 18 km east of the town of Uyuni in the Department of
Potosí, in southwestern Bolivia. It is located 460 km
south-southeast of the national capital of La Paz and 150 km
southwest of the City of Potosí, which is the administrative
capital of the department. The Pulacayo Project is fully permitted
with secured social licenses for mining.
The
Pulacayo Project mining rights are recognized by two legally
independent contractual arrangements, one covering all, except
Apuradita from the Pulacayo MPC between the Company and COMIBOL, a
Bolivian state mining company, and the original holder of the
rights, executed on October 3, 2019. The Pulacayo MPC grants the
Company the 100% exclusive right to develop and mine at the
Pulacayo and Paca concessions for up to 30 years against certain
royalty payments. It is comparable to a mining license in Canada or
the United States. In connection with Apuradita, its rights are
covered by a second contractual arrangement, with the Bolivian
Jurisdictional Mining Authority, acting for the State, which is in
process of formalization, as a mean of recognition of the acquired
rights to what was originally the mining concession. Until such
time as the contract is formalized, all mining rights, as
recognized in the Bolivian Mining Law 535, can be exercised by the
holder of the ex-concession.
31
The
Company also currently holds, through leasehold assignments, a 100%
interest in the claims comprising the Gibellini Project, which the
Company aims to make the first operating primary vanadium mine in
North America, as well as a 100% interest in the Titan
vanadium-titanium-iron property located in Ontario, Canada; a 100%
interest in the Ulaan Ovoo coal property located in Selenge
province, Mongolia; and a 100% interest in each of the Chandgana
Tal coal property and the Khavtgai Uul coal property located in
Khentii province, Mongolia. The Company also holds the land use
right and construction license for the Chandgana 600MW Coal-Fired
Mine Mouth Power Plant project located in Khentii province,
Mongolia.
Principal Products, Markets and Marketing
At the
moment, we are not in production and we do not produce any products
or minerals. Based on the projects that we are developing, our
possible future products may include, but will not be limited to,
raw thermal coal, zinc-silver concentrate, lead-silver concentrate,
nickel concentrate and vanadium pentoxide product.
We are
working to bring the Gibellini Project into production as soon as
possible in order to address the supply-demand gap for vanadium
projected to 2023. The projected demand is largely driven by
environmental-related actions by the Chinese government which is
intensified by increasing demand for vanadium redox flow storage
batteries. The supply-demand gap will affect all uses of vanadium
including steel manufacture, high tech applications and large
capacity vanadium redox flow batteries.
Our
marketing efforts have mostly been in assessing the reasons and
sources of demand, but we have also conducted concept-level
negotiations for supplying vanadium from the Gibellini Project to
traders and battery manufacturers. As the Gibellini Project
develops and more reliable information concerning timing, volume
and quality become available, we will increase our marketing
efforts. We will be primarily competing with other mining projects
that produce raw thermal coal, zinc-silver concentrate, lead-silver
concentrate and vanadium pentoxide. Our possible principle markets
for vanadium pentoxide product may be Europe and/or China. Below
are the 3-year historical industry pricing charts, USD$ per lb.,
for the vanadium pentoxide flake, minimum 98% vanadium pentoxide
content, delivered in China and Europe.
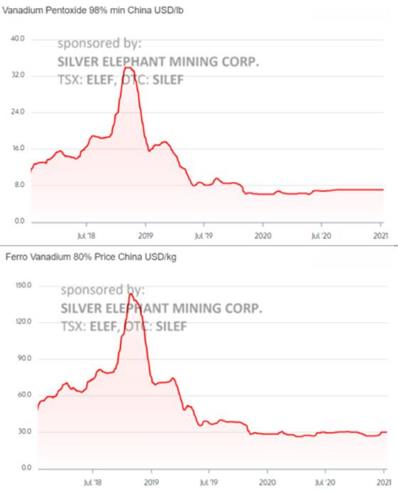
International
mineral commodity pricing is generally established in US dollars
and the competitive positioning between producers can be
significantly affected by fluctuations in exchange rates. The
competitiveness of mineral producers is significantly determined by
the grade or quality of the deposit, production costs and
transportation costs relative to other producers. Such costs are
largely influenced by the location and nature of mineral deposits,
mining and processing costs, transportation and port costs,
currency exchange rates, operating and management skills, and
differing taxation systems between countries.
Seasonality
The
mining business is subject to mineral commodities price cycles. If
the global economy stalls and commodity prices decline, as a
consequence, a continuing period of lower prices could
significantly affect the economic potential of our properties and
result in us determining to cease work on or drop our interest in,
some or all of our properties.
Sources and Availability of Raw Materials
All of
the raw materials we require to carry on our business are available
through normal supply or business contracting
channels.
32
Economic Dependence
Our
business is not substantially dependent on any one contract such as
a property option agreement or a contract to sell the major part of
our output.
Government Regulations
Our
exploration and future development activities are subject to
various national, state, provincial and local laws and regulations
in the Unites States, Bolivia, Canada and Mongolia, which govern
prospecting, development, mining, production, exports, taxes, labor
standards, occupational health, waste disposal, protection of the
environment, mine safety, hazardous substances and other
matters.
Mining
and exploration activities at our properties in North America are
subject to various laws and regulations relating to the protection
of the environment, such as the General Mining Law, U.S. federal
Clean Water Act and the Nevada Water Pollution Control Law, both of
which we discuss under the heading “Risk Factors” in
this Annual Report. Although, we intend to comply with all existing
environmental and mining laws and regulations, no assurance can be
given that we will be in compliance with all applicable regulations
or that new rules and regulations will not be enacted or that
existing rules and regulations will not be applied in a manner that
could limit or curtail development of our properties. Amendments to
current laws and regulations governing exploration and development
or more stringent implementation thereof could have a material
adverse effect on our business and cause increases in exploration
expenses or require delays or abandonment in the development of
mining properties. In addition, we are required to expend
significant resources to comply with numerous corporate governance
and disclosure regulations and requirements adopted by U.S. federal
and Canadian federal and provincial governments. These additional
compliance costs and related diversion of the attention of
management and key personnel could have a material adverse effect
on our business.
Except
as described in this Annual Report, we believe that we are in
compliance in all material respects with applicable mining, health,
safety and environmental statutes and regulations.
For a
more detailed discussion of the various government laws and
regulations in the United States applicable to our operations and
the potential negative effects of such laws and regulations, see
the section “
Item 3.D. Risk
Factors
.”
C.
Organizational
Structure
The
chart below illustrates the inter-corporate relationships among us
and our subsidiaries, the percentage of voting securities of such
subsidiaries owned by us, and each subsidiary’s jurisdiction
of incorporation as of the date of this Annual Report.
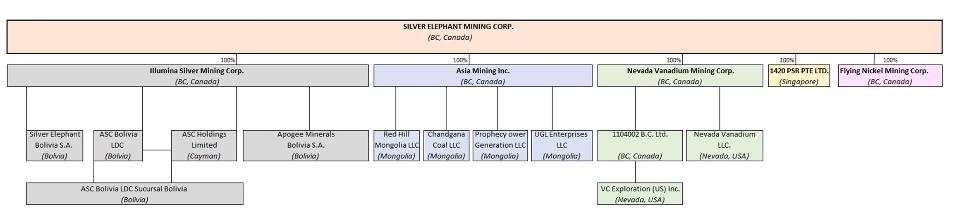
33
We hold
mining and energy properties and projects through the Company and
the following subsidiaries:
|
Subsidiary
|
Mining Properties and Projects
|
|
Nevada
Vanadium LLC
|
Holds
the Gibellini Project, which is comprised of Gibellini and Louie
Hill deposits by 209 Nevada Vanadium claims and 40 "Deitrich"
claims under the Deitrich Lease Agreement as amended on April 19,
2018 as well as the historic Bisoni deposit (201 lode claims).
Nevada Vanadium owns 450 Gibellini claims and 100% interest of the
Bisoni deposit claims in Nevada, USA.
|
|
VC
Exploration (US) Inc.
|
Holds a
100% interest in 105 unpatented lode mining claims that comprise a
portion of the Gibellini Project in Nevada, USA.
|
|
Silver
Elephant Mining Corp.
|
Holds a
100% interest in the Titan vanadium-titanium-iron property located
in the Province of Ontario, Canada.
|
|
Silver
Elephant Mining Corp.
|
Holds a
100% interest in 94 mineral claims and 2 mining leases covering 197
square kilometers located in the Province of Manitoba,
Canada.
|
|
Red
Hill Mongolia LLC
|
Holds a
100% interest in the Ulaan Ovoo Property located in Selenge
Province, Mongolia.
|
|
Chandgana
Coal LLC
|
Holds a
100% interest in the Chandgana Tal coal property and Khavtgai Uul
Property located in Khentii province, Mongolia. We refer to the
Chandgana Tal coal property and the Khavtgai Uul Property
collectively as the "Chandgana Project."
|
|
Prophecy
Power Generation LLC
|
Holds
the land use right and construction license for the Chandgana
Project planned in Khentii province, Mongolia.
|
|
ASC
Bolivia LDC Sucursal Bolivia
|
Holds a
100% exclusive right to develop and mine at the Pulacayo and Paca
concessions for up to 30 years against certain royalty payments.
Rights include "Temeridad" and "Real De Monte" concessions at Paca
and are administered by COMIBOL and thus are part of the Pulacayo
MPC.
|
|
Illumina
Silver Mining Corp.
|
Holds
the Triunfo SPA to acquire the El Triunfo Gold-Silver-Lead-Zinc
Project in La Paz District, Bolivia. Subject to the provisions of
the Triunfo SPA, the vendor irrevocably agreed to sell, assign, and
transfer to the Company, and the Company agreed to purchase from
the vendor, the mining rights of the Triunfo Project upon the
Company paying the vendor the sum of USD$1,100,000, consisting of
USD$100,000 on Triunfo SPA signing (paid), and USD$1,000,000 on or
before June 15, 2025.
|
|
Illumina
Silver Mining Corp.
|
Holds
the Sunawayo SPA to acquire the Sunawayo Project. The Sunawayo
Project is patented land which the Company has acquired through the
Sunawayo SPA, whereas the adjacent Malku Khota silver project
in Bolivia is unpatented land administered by COMIBOL. In
January 2020, the Company applied for a mining production contract
with COMIBOL that would give it the rights to mine and explore
Malku Khota. The application was received by COMIBOL and is under
review.
|
D.
Property,
Plants and Equipment
General
Currently,
we consider only the Gibellini Project and the Pulacayo to be
material. We do not currently consider the interests the Company
holds in its other projects to be material.
Portions
of the following excerpts are based on the assumptions,
qualifications and procedures set forth in the respective technical
reports which, while not fully described herein, have been filed on
SEDAR (available at
www.sedar.ca
)
and EDGAR (
www.sec.gov
).
Please
refer to the discussion under the heading “Cautionary Note
Regarding Forward-Looking Statements” at the beginning of
this Annual Report for important information concerning certain
mining terms and descriptions of our mineral deposits used or
contained in this section.
34
PULACAYO PROJECT, BOLIVIA
The
scientific and technical information in this section of this Annual
Report that specifically relates to the current Pulacayo Project
mineral resource estimates for the Pulacayo and Paca deposits has
been extracted or summarized from the Pulacayo Technical Report.
The Pulacayo Technical Report was prepared by Matthew Harrington,
P.Geo., of Mercator Geological Services Limited, Michael Cullen,
P.Geo. of Mercator Geological Services Limited and Osvaldo Arce,
Ph.D., P. Geo., Independent Consultant. Additional information
presented below that pertains to the Pulacayo Project but does not
specifically appear in the Pulacayo Technical Report has been
provided by the Company. The Pulacayo Technical Report has been
filed under the Company’s SEDAR profile at
www.SEDAR.com
.
The
discussion below includes the Pulacayo and Paca silver-lead-zinc
deposits and related concessions located in Bolivia (the "Pulacayo
Project").
The
Pulacayo Project comprises seven mining areas covering an area of
approximately 3,560 hectares of contiguous areas centered on the
historical Pulacayo mine and town site. The Pulacayo Project is
located 18 km east of the town of Uyuni in the Department of
Potosí, in southwestern Bolivia. It is located 460 km
south-southeast of the national capital of La Paz and 150 km
southwest of the City of Potosí, which is the administrative
capital of the department. The Pulacayo Project is fully permitted
with secured social licenses for mining.
On
January 2, 2015, pursuant to the terms of the acquisition agreement
entered into between the Company and Apogee Silver Ltd. the Company
acquired the Pulacayo Project through the acquisition of the issued
and outstanding shares of ASC Holdings Limited and ASC Bolivia LDC,
which together, hold the issued and outstanding shares of ASC
Bolivia LDC Sucursal Bolivia. ASC Bolivia LDC Sucursal Bolivia
controls the mining rights to the concessions through a separate
joint venture agreement with the Pulacayo Ltda. Mining Cooperative
(the "Pulacayo Mining Cooperative") who hold the mining rights
through a lease agreement with state owned Mining Corporation of
Bolivia, COMIBOL.
The
Pulacayo Project mining rights are recognized by two legally
independent contractual arrangements, one covering all, except
Apuradita from the Pulacayo MPC between the Company and COMIBOL, a
Bolivian state mining company, and the original holder of the
rights, executed on October 3, 2019. The Pulacayo MPC grants the
Company the 100% exclusive right to develop and mine at the
Pulacayo and Paca concessions for up to 30 years against certain
royalty payments. It is comparable to a mining license in Canada or
the United States. In connection with Apuradita, its rights are
covered by a second contractual arrangement, with the Bolivian
Jurisdictional Mining Authority, acting for the State, which is in
process of formalization, as a mean of recognition of the acquired
rights to what was originally the mining concession. Until such
time as the contract is formalized, all mining rights, as
recognized in the Bolivian Mining Law 535, can be exercised by the
holder of the ex-concession.
Project Location
Bolivia
is a landlocked country located in central South America and
includes diverse geographic and climatic conditions that range from
snow-capped peaks and high-altitude plateaus to vast, low-lying
grasslands and rainforests. The country is normally accessible by
international air travel from Miami (American Airlines), Mexico
City, Brazil, Chile (LAN), Argentina and Peru (Taca Airlines). In
addition, local Bolivian airlines fly regular internal flights
between major cities, with several flights a week to a newly paved
runway at Uyuni city, located 18 km south of the Pulacayo Project.
While these routes and access methods are normally available, at
the time of report preparation airline travel to and from Bolivia,
as well as internally within the country, plus land travel within
the country, had been materially reduced due to the effects of the
internationally extensive Novel Coronavirus (Covid19) pandemic. It
is not clear how long this will continue.
The
principal highways are generally paved, and heavy trucks and buses
dominate road traffic outside of the major cities. For the most
part, road freight service functions adequately even to small
remote villages. The Pulacayo Project is accessed from La Paz by
means of a paved road, which runs to the area of Huari, passing
through Oruro. It can also be accessed by the road between Oruro
and Potosí and from Potosí to Uyuni by a good quality
paved road. Paving of the road from Potosí to Uyuni began in
2007 and has now been completed to Potosi. Secondary roads can be
best described as "tracks" and winding, single lane roads are often
precariously carved out of steep slopes.
There
is also a reasonably well-developed rail system with connections
south to Argentina, east to Brazil and west to Chile and the port
of Antofagasta. Rail service from Uyuni connects with Oruro,
Atocha, Tupiza, and Villazon (on the border with Argentina). Uyuni
is also connected by railway to Chile through Estación Abaroa.
Disused rail lines exist between Uyuni-Potosí and Oruro-La
Paz. The figure below presents major highway and rail routes of
Bolivia relative to the Pulacayo Project’s
location.
35
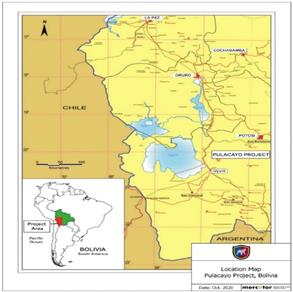
Accessibility, Climate, Local Resources, Infrastructure and
Physiography
Accessibility
Bolivia
is a landlocked country located in central South America and
includes diverse geographic and climatic conditions that range from
snow-capped peaks and high-altitude plateaus to vast, low-lying
grasslands and rainforests. The country is normally accessible by
international air travel from Miami (American Airlines), Mexico
City, Brazil, Chile (LAN), Argentina and Peru (Taca Airlines). In
addition, local Bolivian airlines fly regular internal flights
between major cities, with several flights a week to a newly paved
runway at Uyuni city, located 18 km south of the Pulacayo property.
While these routes and access methods are normally available, at
the time of report preparation airline travel to and from Bolivia,
as well as internally within the country, plus land travel within
the country, had been materially reduced due to the affects of the
internationally extensive Novel Coronavirus (Covid19) pandemic. It
is not clear how long this will continue.
The
principal highways are generally paved, and heavy trucks and buses
dominate road traffic outside of the major cities. For the most
part, road freight service functions adequately even to small
remote villages. The Pulacayo project is accessed from La Paz by
means of a paved road, which runs to the area of Huari, passing
through Oruro. It can also be accessed by the road between Oruro
and Potosí and from Potosí to Uyuni by a good quality
paved road. Paving of the road from Potosí to Uyuni began in
2007 and has now been completed to Potosi. Secondary roads can be
best described as “tracks” and winding, single lane
roads are often precariously carved out of steep
slopes.
There
is also a reasonably well-developed rail system with connections
south to Argentina, east to Brazil and west to Chile and the port
of Antofagasta. Rail service from Uyuni connects with Oruro,
Atocha, Tupiza, and Villazon (on the border with Argentina). Uyuni
is also connected by railway to Chile through Estación Abaroa.
Disused rail lines exist between Uyuni-Potosí and Oruro-La
Paz. The figure below presents major highway and rail routes of
Bolivia relative to the Pulacayo project’s
location.
36
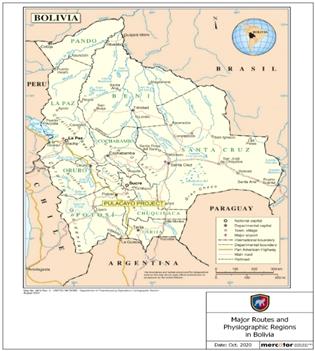
Major Routes and Physiographic Regions in Bolivia
Climate and Physiography
Two
Andean mountain chains run through western Bolivia, with many peaks
rising to elevations greater than 6,000 m above sea level. The
western Cordillera Occidental Real forms Bolivia’s western
boundary with Peru and Chile, extending southeast from Lake
Titicaca and then south across central Bolivia to join with the
Cordillera Central along the country’s southern border with
Argentina. Between these two mountain chains is the Altiplano, a
high flat plain system at elevations between 3,500 m and 4,000 m
above sea level. East of the Cordillera Central a lower altitude
region of rolling hills and fertile basins having a tropical
climate occurs between elevations of 300 m and 400 m above sea
level. To the north, the Andes adjoin tropical lowlands of
Brazil’s Amazon Basin.
Climate
within Bolivia is altitude related. The rainy period lasts from
November to March and corresponds with the southern
hemisphere’s summer season. Of the major cities, only
Potosí receives regular snowfalls, with these typically
occurring between February and April at the end of the rainy
season. La Paz and Oruro occasionally receive light snow. On the
Altiplano and in higher altitude areas, sub-zero temperatures are
frequent at night throughout the year. Snow-capped peaks are
present year-round at elevations greater than approximately 5,200
m.
The
Pulacayo Project area is located immediately southwest of the
Cosuño Caldera and local topographic relief is gentle to
moderate, with elevations ranging between 4,000 m and 4,500 m above
sea level. The Paca and Pulacayo volcanic domes are volcanic
structures that exist as prominent topographic highs in this area.
The area has a semi-arid climate, with annual rainfall of
approximately 100 mm and a mean summer temperature of 12° C
between October and March. During winter, minimum temperatures
reach the -20 to -25° C range and summer maximums in the 18 to
20° C range occur in June and July. Yearly mean temperature is
5.5° C. Vegetation is sparse to non-existent and consists of
only local low bushes.
Local resources and Infrastructure
Bolivia
has a long history as a significant primary producer of silver and
tin, with associated secondary production of gold, copper,
antimony, bismuth, tungsten, sulphur and iron. The country also
contains sizeable reserves of natural gas that have not been fully
developed to date due to export issues and limited access to
required infrastructure.
The
country has an abundance of hydroelectric power and transmission
lines which parallel the road system provide service to most major
settlements. Remote villages generally have diesel generators which
run infrequently during evening hours. Transmission lines from the
hydroelectric plants of Landara, Punutuma, and Yura that were
reconditioned by a joint venture between COMIBOL and the Valle
Hermoso Electrical Company pass within a few kilometers of
Pulacayo.
37
Telephone
service and internet access are available in most areas and
cellular telephone service is widespread. However, coverage is not
complete and international connectivity is not ensured. Local
communication services in the area are good and consist of an
ENTEL-based long-distance telephone service, a GSM signal for cell
phones and two antennae for reception and transmission of signals
from national television stations. Apogee installed a satellite
receiver to provide internet access for its operation and this
service is shared with the Pulacayo Mining Cooperative. An adequate
supply of potable water for the town is supplied by pipeline from a
dam and reservoir (Yana Pollera) facility located 28 km from
Pulacayo in the Cerro Cosuño.
Coeur
d’Alene Mines Corporation (San Bartolome), Pan American
Silver Ltd. (San Vicente), Glencore International plc (Sinchi
Wayra) and Sumitomo Corporation (San Cristóbal) are
significant international companies with producing mines in this
region in recent years. Basic exploration services are available in
Bolivia and include several small diamond core drilling
contractors, the ALS Group, which operates an analytical services
sample preparation facility in Oruro, the SGS Group, which has
analytical services and preparation facilities in La Paz, and
several locally owned assay facilities. The Bolivian National
School of Engineering operates a technical college in Oruro
(Universidad Técnica de Oruro) that includes a mineral
processing department and laboratory facilities that provide
commercial services to the mining industry. In general, an adequate
supply of junior to intermediate level geologists, metallurgists,
mining engineers and chemists is currently considered to be present
in the country.
Since
down-sizing of site operations at Pulacayo by Apogee in 2013-2014,
the population of the community has dropped to approximately 300 to
400 permanent residents, many of whom are associated with the
Pulacayo Mining Cooperative. The village has a state-run school and
medical services are provided by the state’s Caja Nacional de
Seguros (National Insurance Fund). A hospital and clinic function
independently. Numerous dwellings and mining related buildings in
Pulacayo are owned by COMIBOL and some of these have been donated
to the Pulacayo Mining Cooperative. Under terms of the Shared Risk
Contract, COMIBOL makes some mining infrastructure available for
use by the Company.
Property
controlled
100% of the Pulacayo Project through an agreement with Golden
Minerals Company ("GMC"), the successor of Apex Silver Company
before its acquisition by us. GMC’s former Bolivian
subsidiary, ASC Bolivia LDC Sucursal Bolivia ("ASC"), holds the
mining rights to the concessions through a joint venture with the
Pulacayo Mining Cooperative, which in turn has a lease agreement
with COMIBOL, the state mining corporation of Bolivia. On January
21, 2011, Apogee entered into a definitive agreement with GMC to
acquire all of the issued share capital of ASC, which holds a 100%
interest in the Pulacayo Project. Pursuant to the applicable
agreement, Apogee acquired all of the issued and outstanding shares
of the subsidiary from GMC in consideration for Common Shares of
Apogee upon closing of the transaction, and an additional block of
Common Shares and a cash fee eighteen (18) months following closing
of the transaction. In January 2015, Prophecy Coal Corp.
(predecessor to the Company) completed purchase of Apogee Minerals
Bolivia S.A., ASC Holdings Limited and ASC Bolivia LDC (which hold
ASC, the holder of Apogee’s mining joint venture interest in
the Pulacayo Project) (collectively, the "Apogee Subsidiaries") and
thus Apogee’s interest in the mining joint venture. The term
of the joint venture agreement is 23 years starting July 30th,
2002. ASC Bolivia LDC is committed to pay to COMIBOL USD$1,000
during the exploration period. During the mining period ASC Bolivia
LDC will pay to COMIBOL the equivalent of 2.5% of the Net Smelter
Return (NSR) and 1.5% of the NSR to the Pulacayo Mining
Cooperative. On September 1, 2016 the Bolivian government issued
Supreme Decree N° 2891 which was confirmed by Law N° 845
dated October 24, 2016. Both regulations revert to the domain of
the State, areas over which joint venture agreements, lease or
sub-lease agreements have been executed between mining cooperatives
and private local or foreign companies, in order to convert such
agreements into mining production contracts between the private
parties party to such agreements and the government. This affects
our Pulacayo Joint Venture Agreement. We submitted the required
application on December 22, 2016. In October 2
nd
2019 a new Mining
Production Contract (replacing the Joint Venture Agreement) was
executed between Apogee Minerals Bolivia S.A. (a subsidiary of the
Company) and the state owned Bolivian Mining Corporation (COMIBOL).
The term is 15 years and subject to renewal for another 15 years
(total 30 years). COMIBOL is entitled to receive 7% of the Gross
Sales Value. No monthly fee payable to COMIBOL has been
agreed.
The
current holdings that comprise the Pulacayo Project cover 3,560 ha
of surface area and are listed in the table below. All titles,
associated agreement and permits are in good standing.
38
Pulacayo Project Exploration Holdings
|
*STA
|
Titleholder
|
Size (ha)
|
Patents Payment
|
Registration Number
|
Location
|
|
Pulacayo
|
COMIBOL
|
1,031
|
Payment
is not required*
|
512-01015
|
Pulacayo
|
|
Porvenir
|
COMIBOL
|
1,199
|
Payment
is not required*
|
512-01165
|
Pulacayo
|
|
Huanchaca
|
COMIBOL
|
470
|
Payment
is not required*
|
512-03903
|
Pulacayo
|
|
Galería
General
|
COMIBOL
|
76
|
Payment
is not required*
|
512-01160
|
Pulacayo
|
|
Subtotal
|
|
2,776
|
|
|
|
|
Temeridad
|
COMIBOL
|
10
|
Payment
is not required*
|
512-00992
|
Paca
|
|
Real
del Monte
|
COMIBOL
|
24
|
Payment
is not required*
|
512-00994
|
Paca
|
|
Apuradita
|
ASC
Bolivia LDC
|
750
|
2017
|
512-03652
|
Paca
|
|
Subtotal
|
|
784
|
|
|
|
|
Grand Total
|
|
3,560
|
|
|
|
|
* Special Transitory Authorization – formerly mining
concession
|
|||||
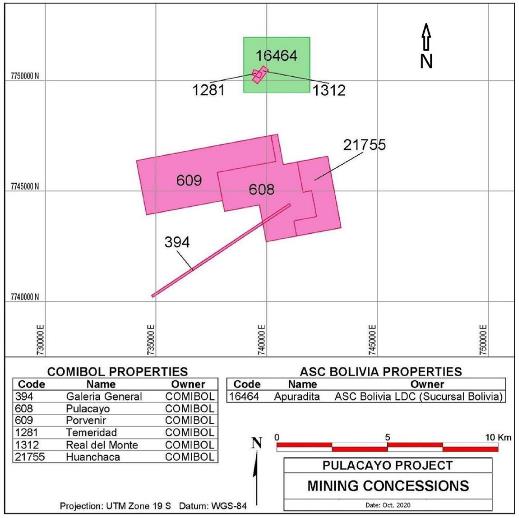
History of Production
The
Pulacayo area has a very long history of exploration and mining,
with this dominated by the Pulacayo deposit itself, where most work
has been concentrated on mineralized systems that comprise the TVS
and related systems. In contrast, the history of Paca deposit
exploration forms a relatively small part of the long-term
exploration and mining history of the area. Exploration and related
studies carried out since 2001 by Apogee and related firms form the
bulk of modern era work completed in the Pulacayo Project area and
include over 91,900 m of core drilling, completion of a feasibility
study in 2012 and several mineral resource estimates prepared in
accordance with NI 43-101.
Mining
of silver deposits at the Pulacayo Project area began in the
Spanish Colonial Period (c.1545) but early production details do
not exist. The first work formally recorded on the property was
carried out in 1833 when Mariano Ramírez rediscovered the
Pulacayo deposit. In 1857 Aniceto Arce founded the Huanchaca Mining
Company of Bolivia and subsequently pursued development and
production at Pulacayo. Revenue from the mine funded the first
railway line in Bolivia, which in 1888 connected Pulacayo to the
port of Antofagasta, Chile. In 1891, reported annual silver
production reached 5.7 million ounces and mining operations at
Pulacayo at that time were the second largest in Bolivia. Pulacayo
production was predominantly from the Veta TVS which had been
defined along a strike length of 2.5 km and to a depth of more than
1000 m. In 1923, mining operation ceased due to flooding of the
main working levels.
39
In
1927, Mauricio Hochschild bought the property and re-started mine
development. The Veta Cuatro vein was the focus of this work and
was intersected at a mine elevation of approximately -266 m. It was
proven to continue down-dip to the -776 m elevation where it showed
a strike length of 750 m. Several short adits were also established
during the Hochschild period at Paca to test a mineralized volcanic
conglomeratic unit that outcrops in the deposit area. Work by
Hochschild in the district continued until 1952 when the Bolivian
government nationalized the mines and administration of the
Pulacayo deposit and management was assumed by COMIBOL. Operations
continued under COMIBOL until closure in 1959 due to exhaustion of
reserves and rising costs. The total production from the Pulacayo
mine is estimated by the National Geological and Mineral Service of
Bolivia to be 678 million ounces of silver, 200,000 tons of zinc
and 200,000 tons of lead (National Geological and Mineral Service
of Bolivia Bulletin No. 30, 2002, after Mignon 1989).
In
1956, COMIBOL established the Esmeralda adit that was driven south
into the Paca deposit to assess breccia hosted high grade
mineralization localized along the andesite-host sequence contact.
A total of approximately 250 m of drifting and cross cutting was
carried out within the main mineralized zone, distributed between
the main adit level and short sub-levels above and below the main
level. Workings were established for exploration purposes only and
commercial production was not undertaken by COMIBOL.
In
1962, the Pulacayo Mining Cooperative was founded and this local
group leased access to the Pulacayo mine from COMIBOL. The Pulacayo
Mining Cooperative has carried out small scale mining in the
district since that time and continues to do so at present. Efforts
are directed toward exploitation of narrow, very high-grade silver
mineralization in upper levels of the old mining workings,
typically above the San Leon tunnel level.
Modern
exploration of the Pulacayo and Paca areas began to a limited
degree in the 1980’s when various mining and exploration
companies targeted epithermal silver and gold mineralization within
the volcanic-intrusive system present in the area. In 2001, ASC
initiated an exploration program in the district, signed agreements
with the Pulacayo Mining Cooperative and COMIBOL and completed
programs of regional and detailed geological mapping, topographic
surveying and sampling of historical workings. In part, these work
programs included the Paca deposit, where 3,130 m of core drilling
and 896 m of reverse circulation (RC) drilling were completed, and
a mineral resource estimate was prepared. ASC also completed core
drilling campaigns at Pulacayo.
In 2005
Apogee signed a joint venture agreement with ASC and subsequently
commenced exploration in the region in early 2006. Extensive
exploration, economic evaluation, metallurgical studies, mine and
mill permitting environmental studies and underground test mining
programs were subsequently carried out by Apogee between 2006 and
2015 when the Pulacayo Project was purchased by the Company’s
precursor, Prophecy Development Corp. (Prophecy). Work was carried
out on both the Pulacayo and Paca deposits during this period, with
emphasis placed on Pulacayo. Combined results of the ASC and Apogee
diamond drilling programs carried out between 2002 and 2012
contributed to the several mineral resource estimates prepared in
accordance with NI 43-101 and the CIM Standards in place at the
time, and also supported a 2013 Feasibility Study focused on
underground mining. Since 2001, ASC and Apogee completed 88,596 m
of drilling from surface and underground on the Pulacayo Project,
with Apogee programs accounting for 79,129 m of this
total.
GEOLOGICAL SETTING
Geology
The
Pulacayo Project that includes both the Pulacayo and Paca deposits
is located on the western flank of a regional anticline that
affects sedimentary and igneous rocks of Silurian, Tertiary and
Quaternary ages on the western side of the Cordillera Oriental,
near the Cordillera-Altiplano boundary. The Uyuni-Khenayani Fault
is a reverse fault that crosses the project area and is believed to
have controlled localization of volcanic center complexes at Cuzco,
Cosuño, Pulacayo and San Cristóbal and related
mineralized areas at Pulacayo, Cosuño, El Asiento,
Carguaycollu and San Cristóbal. This fault brings Tertiary
sediments in contact with Paleozoic formations at surface and is
located about 4 km west of Pulacayo. The Pulacayo Project
mineralized zones at Pulacayo, Pacamayo and Paca all occur on the
west flank of a north-south striking anticline and local
topographic highs define Lower Miocene dacitic-andesitic domes and
stocks associated with caldera resurgence that intrude the folded
section. A younger Miocene-Pliocene phase of volcanism is also
superimposed on the anticlinal trend and is marked by pyroclastic
deposits and flows of andesitic and rhyolitic composition.
Ignimbrites associated with the Cosuño Caldera are the
youngest volcanic deposits in the area. A dacitic to andesitic dome
complex at the Pulacayo Property intruded the folded sedimentary
section and forms the main topographic highs that occur on the
property.
Exploration
The
Company has completed various geological mapping and surface
sampling programs over several areas of mineralization on the
Pulacayo Project during the 2015 through 2017 period. Recent
exploration activities completed by the Company include a
geological mapping and chip sample program completed in February
2020 for the Paca area and a San Leon Tunnel geological mapping and
chip sample program completed in February-March of 2020. The
Company also carried out a 3,277.4 m core drilling program in late
2019 and early 2020. A 545 meter drilling program at the Paca
deposit was completed in October, 2020. A 940 meter drilling
program was commenced at the eastern side of the Pulacayo deposit
in an area known as “Pero” in December 2020, and
completed in January 2021.
40
Drilling
Apogee
commissioned a topographic survey of the Pulacayo and Paca areas in
2006 to provide a topographic base map for use in establishing road
access, geological mapping and surface sampling, and locating drill
collars and geophysical lines. A surface mapping and sampling
program was done during 2005 and initially utilized the ASC
preliminary geological maps. The company completed detailed surface
mapping that covered all the exploration licenses. The sampling
consisted mostly of rock chip samples taken from outcrops and
accessible underground mine workings for a total of 549 samples.
During 2006 Apogee also commissioned a detailed, three-dimensional
digital model of the historic underground mine workings. The model
was subsequently modified by Apogee to conform to the current datum
and adjusted to align with the +1% incline grade of the San Leon
tunnel. An induced polarization (IP) geophysical survey was carried
out by Apogee between November and December 2007. A total of 29
line km of IP surveying was completed on the Pulacayo Project
including seven lines at Pulacayo oriented north-south
perpendicular to the east-west strike of the TVS and five similarly
oriented survey lines at Paca.
Following
the acquisition of the Pulacayo Project, Apogee initiated a diamond
core exploration drill program that consisted of 19 holes. During
2007-2008 Apogee focused on the Paca deposit and completed 68 drill
holes in two programs with 14 completed during November 2007 and 54
holes completed during 2008. Subsequent drilling occurred during
June 2009, between November 2010 and December 2011, and between
August 2011 and June 2012. Overall core recovery reported by Apogee
exceeds 90% in most cases though proximity to old mine workings
reduces the recovery potential due to associated bedrock
instability. Particular attention was paid to the planning and
documentation of drill holes. Planning is based on the logging and
interpretation of geological cross sections generated by Apogee
staff geologists. Drill hole coordinates are established from
digital maps and surface drill hole collars are located on the
ground by field geologists using a hand-held GPS receiver. The
completed drill hole is later surveyed by company surveyors. Drill
hole azimuth and inclination are established using a compass and
clinometer. Collar coordinates for underground drilling are
established by company surveyors and hole azimuth and inclination
are set by transit. Downhole deviation is determined for both
surface and underground holes at approximately 50 m intervals using
down hole survey tools.
Work
during 2015 included mapping, sampling, assays and metallurgical
tests under Phase 2 of the exploration plan, planning for Phase 2
(geophysics, drilling and assays), and preparation and submittal of
the permit application for Phase 2. The exploration centered on
assessing the historical tailings piles and potential mineralized
areas suggested by historical exploration. On February 2, 2015, the
Company announced the assay results received January 22, 2015 from
ALS Minerals Ltda., for samples obtained during the reconnaissance
sampling program of tailings piles materials. The tailings piles
are the remaining materials from processing ore, extracted from the
Pulacayo mining district between approximately 1850 and 1950. The
ore was processed by a mill on site which has since been
dismantled.
A total
of 12 tailings piles were identified at the start of the mapping
and sampling program and a total of 299 samples from the 12
tailings piles were obtained. Samples were obtained at random
locations on the top surface of those piles from small holes
excavated with an excavator and systematically at 2 meter spacings
in the walls (slopes) of the piles from hand dug or excavated
trenches, all at depths of 1.2 to 1.5 meters. The samples were then
preserved, stored, secured, and transported following industry
standard methods. The assay program was performed by ALS Minerals
Ltda. of Lima, Perú and included standard Quality Assurance
and Quality Control (QA/QC) samples to enforce the validity of the
results. The results indicate silver grades up to 1200 g/t, gold
grades up to 7 g/t and indium grades up to 154.5 g/t. On September
10, 2015, the Company reported results from preliminary
metallurgical test work conducted on samples collected from various
tailing piles at the Pulacayo Project showing up to 64.39% silver
recovery.
Surface
mapping and sampling was completed during June to August 2015 on
four potential mineralized areas (El Abra, Pero, Paca, and
Pacamayo). The sampling included close spaced grab and chip samples
obtained systematically where the trend of the mineralization is
apparent or in historic mine adits and random spot sampling where
the trend is not apparent. The samples were obtained through the
aid of trenching to allow sampling of fresher material, where
possible. The samples were then preserved, stored, secured, and
transported following industry standard methods. The assay program
was performed by ALS Minerals Ltda. and included standard QA/QC
samples to enforce the validity of the results. On August 27, 2015
and September 9, 2015, the Company announced assay results of the
first and second group of samples from the potential mineralized
areas at the district exploration program. On September 18, 2015,
the Company announced the assay results of the three Pacamayo
samples where the silver grade was reported as more than 1,500 g/t.
These samples have undergone reanalysis using the fire assay and
gravimetric finish method which has a greater upper detection
limit.
An
exploration permit application was submitted during early 2015. The
exploration permit would allow geophysical work to complete Phase 1
then after review of the Phase 1 information and previous
exploration information and planning, completion of Phase
2.
Planning
and budgeting for exploration to prove the planned stopes in the
internally developed mining plans was completed. This exploration
plan included in-mine drilling and mining new drivages to explore
new areas, mapping of existing exposures and new drivages, sampling
of existing exposures, new drivages, and drill core for laboratory
analysis and metallurgical testing.
41
Summary of Modern Era Drilling
The
Company initiated a 7-hole surface diamond drill program at the
Paca deposit in September of 2019 and completed the program in
October of 2019. Seven holes were completed for a total of 860 m.
The Company also initiated surface drilling at the Pulacayo deposit
in December of 2019 and concluded in February of 2020. A total of
3,277.4 meters of drilling was completed in 18 drillholes. Results
of the 2019-2020 were included in the current mineral resource
estimation program and contribute to 91,873 m of drilling combined
for both deposits, the balance of which was completed by ASC and
Apogee during the 2002 to 2012 period.
Mineralization
Mineralization
comprising the current Pulacayo deposit mineral resource estimate
is defined by the extent of modern-era diamond core drilling along
the TVS in the vicinity of historic underground workings. The
workings extend over a strike length of approximately 2.7 km and to
a vertical depth from surface of about 1 km. Modern drilling
coverage is present for approximately 1.5 km of the known deposit
strike length and extends to a vertical depth of approximately 550
m below surface.
The
extent of mineralization comprising the current Paca deposit
mineral resource estimate is defined by the extent of modern era
diamond core drilling along a strike length of approximately 750 m
and north-south extent of approximately 700 m. Limited underground
exploratory workings accessible from the Esmeralda adit are present
along approximately 100 m of the deposit’s strike length in
its central area.
Mineralization
of economic interest at the Pulacayo deposit occurs within the
Tertiary age Pulacayo volcanic dome complex that consists of older
sedimentary rocks of the Silurian Quenhua Formation plus intruding
andesitic volcanic rocks of the Rotchild and Megacristal units.
Mineralization hosted by volcanic rocks can occur over tens of
meters in thickness and typically consists of discrete veins plus
stockworks of narrow veins and veinlets that occur within argillic
alteration host rock envelopes. At deeper levels, high grade veins
that are typically less than a few meters in width are hosted by
sedimentary lithologies. Veins are commonly banded in texture and
can contain semi-massive to massive sulphides. Primary minerals of
economic importance at Pulacayo are tetrahedrite, galena and
sphalerite, with additional silver sulfosalts and native silver
also contributing to deposit silver grades. Mineralization is
controlled by an east-west oriented normal fault system that links
two northeast trending, steeply dipping, regional strike slip
faults.
Mineralization
of economic interest at the Paca deposit occurs in association with
the same Tertiary age volcanic dome complex that produced the
Pulacayo deposit and takes the form of thin veinlets, fracture
fillings and disseminations hosted by altered volcaniclastic
sedimentary lithologies and altered intermediate to felsic igneous
lithologies. These occur in direct association with mineralized
igneous or hydrothermal breccia zones. The intensity of argillic
alteration is greatest in areas of highest concentrations of
metallic mineral phases such as sphalerite, galena, argentite and
tetrahedrite. Stratabound disseminated mineralization and breccia
hosted mineralization predominate within the deposit, but discrete
mineralized veins are also present locally. The deposit occurs at
the contact between an andesitic intrusive complex and
volcaniclastic sedimentary host lithologies. Bedded and
cross-cutting breccia deposits that are important hosts to
higher-grade mineralization commonly show close spatial association
with the contact zone of the andesitic intrusion.
Deposit Type
The
Pulacayo and Paca deposits are interpreted to be low to
transitional sulphidation epithermal deposits that contain both
precious and base metal mineralization.
Sampling
The
core is initially examined by core technicians and all measurements
are confirmed. Core is aligned and repositioned in the core box
where possible and individual depth marks are recorded at 1 m
intervals on the core box walls. Core technicians photograph all
core, measure core recovery between core depth blocks, complete
magnetic susceptibility readings and specific gravity measurements,
and record the information on hard copy data record sheets. This
information is initially entered into Excel digital spreadsheets
and then incorporated into the project digital database. Drill site
geologists then complete a written quick log of rock types along
with a graphical strip log that illustrates the rock types. They
subsequently complete a detailed written description of rock types,
alteration styles and intensities, structural features, and
mineralization features. The drill hole logs are drawn on paper
cross sections when logging is completed and lithologies are
graphically correlated from drill hole to drill hole. Mineralized
intervals are marked for sampling by the logging geologist using
colored grease pencils and the depths of the intervals and
associated sample numbers are recorded on a hardcopy sample record
sheet. All paper copy information for each hole, including quick
logs, detailed logs, graphical logs, sample record sheets and assay
certificates are secured together in a drill hole file folder to
provide a complete archival record for each drill hole. Subsequent
to logging and processing, down hole litho-coded intervals, sample
intervals and drill hole collar and survey information are entered
into digital spreadsheets and then incorporated into the project
digital database. The sample intervals marked by the logging
geologist are cut in half by the core technicians using a diamond
saw. Friable core is cut in half with a knife. Each half core
sample is assigned a unique sample tag and number and placed in a
correspondingly numbered 6 mil plastic sample bag. A duplicate tag
showing the same number is secured to the core box at the indicated
sample interval. All sample intervals and corresponding numbers are
recorded on a hardcopy sample data sheet and are subsequently
entered into a digital spreadsheet for later incorporation in the
project database. The secured 6 mil plastic sample bags are grouped
in batches of 6 to 10 samples and secured in a larger plastic mesh
bag in preparation for shipment to the laboratory.
42
Drill
site procedures pertinent to the ASC drilling were confirmed by
Apogee staff familiar with the ASC program to be generally similar
to those employed by Apogee with respect to core logging and
sampling. All ASC drill core samples were processed at the Oruro,
Bolivia laboratory of ALS Chemex (formerly Bondar-Clegg), with
those from the first phase of drilling being analyzed at ALS Chemex
facilities in Vancouver, BC, Canada. In both instances, standard
core preparation methods were used prior to elemental
analysis.
Security of Samples
Apogee
staff was responsible for transport of core boxes by pick-up truck
from drill sites to the company’s locked and secure core
storage and logging facility located in the town of Pulacayo. The
secured 6 mil plastic sample bags are grouped in batches of 6 to 10
samples and secured in a larger plastic mesh bag in preparation for
shipment to the ALS Chemex preparation laboratory located in Oruro,
Bolivia. All bagged samples remained in a locked storage facility
until shipment to the laboratory. Samples are transported from the
core storage area to the ALS Chemex facility by either Apogee
personnel or a reputable commercial carrier. Sample shipment forms
are used to list all samples in each shipment and laboratory
personnel crosscheck samples received against this list and report
any irregularities by fax or email to Apogee. Apogee has not
encountered any substantial issues with respect to sample
processing, delivery or security for the Pulacayo drilling
programs. The transport and security of samples pertinent to the
ASC drilling were confirmed by Apogee staff familiar with the ASC
program to be generally similar to those employed by Apogee. The
security of Paca exploration samples followed the same
procedures.
Sample Preparation, Analysis and Quality Assurance/Quality
Control
All
drill core samples from the ASC 2002 and 2003 drilling programs
were processed at the Oruro, Bolivia laboratory of ALS Chemex, with
those from the first phase of drilling being analyzed at ALS Chemex
facilities in Vancouver, BC, Canada. In both instances, standard
core preparation methods were used prior to elemental analysis.
During the 2006 to 2012 Apogee drilling programs Apogee staff
carried out immersion method specific gravity determinations but
did not carry out any form of direct sample preparation or
analytical work on project samples. Analytical work was completed
by ALS Minerals Ltda. at its analytical facility in Lima, Peru
after completion of sample preparation procedures at the ALS
facility located in Oruro, Bolivia. ALS was at the time and remains
an internationally accredited laboratory with National Association
of Testing Authorities certification and also complies with
standards of International Organization for Standardization (ISO)
9001:2000 and ISO 17025:1999. The laboratory utilizes industry
standard analytical methodology and utilizes rigorous internal
QA/QC procedures for self-testing. Samples from the ASC drilling
programs carried out in 2002 and 2003 were also prepared and
analyzed by ALS. However, after preparation at the facility in
Oruro, Bolivia under the same protocols as for Apogee, analytical
work was carried out at the company’s laboratory in
Vancouver, BC, Canada. This facility was fully accredited at the
time and analytical protocols were the same as those described
above for Apogee.
Apogee
developed an internal QA/QC program that includes blind insertion
of reference standards, blanks and duplicates in each analytical
shipment that was used for the 2006 to 2012 drilling programs. A
blank is inserted at the beginning of each sample batch, standards
are inserted at random intervals throughout each batch of 50
samples and duplicates are analyzed at the end of each batch. All
data gathered for QA/QC purposes is captured, sorted and retained
in the QA/QC database. The QA/QC samples include commercial
reference standards, an in-house standard, and commercial prepared
blank materials. Coarse field blanks were also prepared by Apogee.
Analysis of duplicate samples of quarter core is accommodated
through their blind inclusion in the sample stream and analysis of
duplicate prepared pulp splits are also requested for each batch.
Apogee’s protocol also includes a check sampling program
based on analysis of sample splits at a second accredited
laboratory. Bulk density measurements (specific gravity) were
systematically collected by Apogee staff using standard water
immersion methods and unsealed core samples. Characteristics of
lithology and alteration were also recorded as part of the density
program and all information was assembled in digital
spreadsheets.
QA/QC
procedures pertinent to the ASC 2002-2003 drilling programs were
not documented. However, the first drilling program carried out by
Apogee in 2006 was intended to confirm earlier ASC analytical data.
Full QA/QC protocols instituted by Apogee were applied to this
program and results of the Apogee re-drill program correlate well
with those of ASC suggesting that acceptable standards were being
met by ASC. Though preparation, analysis, and QA/QC procedures were
not documented for the early ASC drilling on Paca, the results of
the 2006 re-drill program and check sampling by Mercator during
2015 were comparable and suggests acceptable procedures were
followed for the Paca deposit samples. Sampling from later drilling
at Paca followed Apogee’s QA/QC procedures described above.
Bulk density measurements were also obtained.
The
authors of the Pulacayo Technical Report visited the Pulacayo
Project site on three occasions to support preparation of previous
mineral resource estimates and one other visit was conducted in
September of 2020 in support of the current mineral resource
estimates and associated technical reporting. Results of data
verification activities carried out by the authors of the Pulacayo
Technical Report and site visits show that Pulacayo Project
datasets are of industry standard quality and suitable to support
mineral resource estimation programs.
43
Data Verification
Core
sample records, lithologic logs, laboratory reports and associated
drill hole information for all drill programs completed by Apogee
and ASC were digitally compiled by Apogee staff. Information
pertaining to the exploration history in the property area was also
compiled by Apogee and was reviewed to assess consistency and
validity of Apogee results. The digital drill hole records compiled
by Apogee were checked in detail against the parameters (collar
data, down hole survey values, hole depths, lithocodes) of the
original hard copy source documents to assess consistency and
accuracy. This was followed by review and validation of
approximately 10% of the compiled core sample dataset against
original source documents. Review of logging and sample records
showed consistently good agreement between original records and
digital database values. The drilling and sampling database records
were further assessed through digital error identification methods
available through the Gemcom-Surpac Version 6.2.1® software
for such errors as sample record duplications, end of hole errors,
survey and collar file inconsistencies and some potential lithocode
file errors. The digital review and import of the manually checked
datasets through Surpac provided a validated Microsoft Access®
database that is considered to be acceptable for resource
estimation.
Apogee
hosted two site visits by experts for review of procedures and
verification of conditions and work programs. The first during
August 2011 included review of drilling program components, core
check sampling, verification of drill hole locations, and
discussion with Apogee staff and consultants. The experts
determined that, to the extent reviewed during the visit, evidence
of work programs carried out to date on the property is consistent
with descriptions reported by the company and that procedures
employed by Apogee staff are consistent with current industry
standards and of good quality. The second site visit occurred
during April 2012 and included additional review of on-going
drilling and resource estimation program work pertaining to oxide
zone mineralization. The experts determined their drill hole
coordinates compared well with Apogee’s coordinates and
reasonable correlation exists between the original sample analyses
and the check sample analyses.
The
data verification performed for the Paca deposit was similar to
that for the Pulacayo deposit described previously. Micon
International Limited of Toronto, Canada, considered the field
standard used by Apogee in its QA/QC program to be unacceptable and
suggested use of a commercial standard or an in-house standard
supported by industry best practices.
The
authors of the Pulacayo Technical Report visited the Pulacayo
Project site on three occasions to support preparation of previous
mineral resource estimates and one other visit was conducted in
September of 2020 in support of the current mineral resource
estimates and associated technical reporting. Results of data
verification activities carried out by the authors of the Pulacayo
Technical Report and site visits show that Pulacayo Project
datasets are of industry standard quality and suitable to support
mineral resource estimation programs.
Mineral Processing and Metallurgical Testing
To
date, four metallurgical test programs were completed by outside
experts. These programs include: Resource Development Inc., Denver,
USA in 2003, UTO (Universidad Técnica de Oruro), Oruro, La
Paz, Bolivia in 2009, ED&ED Ingeniería y Servicios S.A.C.
(which we refer to as “ED&ED”), Lima, Peru in 2011,
and UTO and Maelgwyn Mineral Services Laboratory in South Africa
during 2012. A fifth program was managed by Apogee where bulk
samples from trial mining were sent to local
concentrators.
During
2003, Resource Development Inc. tested 120 kg of core sample from
two drill holes. Preliminary metallurgical test work was performed
to evaluate the silver and sulfide base metals recovery potential
including in-place densities, feed characterization, mineralogy,
leaching, gravity concentration, and bench-scale open circuit and
locked cycle tests (LCT’s). Silver minerals were found not to
be amenable to leaching by NaCN or gravity concentration. Grinding
test data determined the time required to achieve a P80 of 150 #
(104 lm) was 20 minutes. Bench scale open circuit flotation tests
(OCT’s) were performed using the flotation reagent suite
developed for the San Cristobal Project. The overall silver
recovery in the lead rougher concentrates was 97.1%. The lead
cleaner concentrate recovered 2.8% of the weight, 84.6% of lead,
3.1% of zinc and 46.9% of silver. The lead concentrate assayed
60.8% Pb, 4.22% Zn and 8,440 g/t Ag. The zinc cleaner concentrate
recovered 7.8% of weight, 1.3% of lead, 84.7% of zinc and 38.8% Ag.
The concentrate assayed 0.324% Pb, 41.2% Zn and 2,463 g/t Ag. Large
scale two cycle locked cycle flotation tests were performed using
the process flowsheet similar to that developed for San Cristobal
deposit. The lead concentrate assaying 62.2% Pb, 4.46% Zn and
10,891 g/t Ag, recovered 3.1% weight, 88.8% of lead, 3.9% of zinc
and 63.4% of silver. The zinc concentrate assayed 61.5% Zn, 0.9% Pb
and 3,303 g/t Ag, recovered 5% weight, 87.6% of zinc, 2.1% of lead
and 31.3% of silver. The tailings were very difficult to settle due
to high proportions of clay in the ore, which will impact the
process flow sheet and overall plant design. The lead and zinc
third cleaner concentrates were analyzed for impurities and found
that penalties may be incurred on the concentrates for several
impurities.
44
UTO
conducted a metallurgical test program during 2009 on three samples
comprising comminution (only Bond Ball Work Index), OCT’s,
LCT’s, OCT tailings (non-float) size by size analyses, and
OCT tailings (non-float) sedimentation tests. Clay mineralogy
studies were not carried out to determine the presence of clays
that may produce very fine slimes though during the test work,
slimes were produced affecting the flotation performance, settling
of tailings, and flotation pulp rheology. The samples were drill
cores composited to represent a higher grade, a medium grade, and a
lower grade. Comminution was evaluated using the Bond Ball Mill
Work Index test and categorized the samples as medium to hard.
Abrasion index, crushing work index, and rod work index tests were
not performed. Specific gravity tests were performed. Flotation
test work focused on lead and silver recovery using both batch open
circuit and closed circuit flotation tests. Locked cycle tests of
the high-grade sample indicated that conventional selective
lead-silver and zinc-silver flotation techniques recovered 56% of
the silver in the lead concentrate and 27% of the silver in the
zinc concentrate with lead recovery of 79% and zinc recovery of
81%. Silver grades were 6,620 g/t in the lead concentrate and 2,010
g/t in the zinc concentrate. LCT test results of the medium grade
sample indicated that it is possible to recover almost 34% of the
silver in the lead concentrate and 50% of the silver in the zinc
concentrate, with lead and zinc grades at 51% and 58%, lead and
zinc recoveries at 74% and 83%, and silver grades at 6,220 g/t and
2,990 g/t. LCT test results of the low-grade sample indicated that
it is possible to recover almost 30% of the silver in the lead
concentrate and 21% of the silver in the zinc concentrate, with
lead and zinc grades at 51% and 58%, lead and zinc recoveries at
74% and 83%, and silver grades at 6,220 g/t and 2,990 g/t,
respectively. The results seem to be reasonable and in accordance
with expectations from the mineralogy of the ore. These results
constitute the design basis for the flow sheet. Full OCT’s of
sulphide minerals flotation were conducted initially on each sample
as a proof of concept of the overall circuit and to establish a
workable set of flotation conditions and reagents. These tests
demonstrated that sulphide flotation to saleable lead and zinc
concentrates at acceptable (for batch tests) recoveries was
possible.
During
2011, the laboratory facility of ED&ED, performed a series of
flotation tests and contracted mineralogical analyses on a high
grade and low-grade sample. The initial ED&ED flotation test
work was not successful then after pre-conditioning the samples
with activated carbon and subsequent differential flotation, was
moderately successful. The minerals present included sphalerite,
galena, pyrite and quartzite gangue with galena-sphalerite
assemblages (intertwined specimens) present to some extent. Twelve
(12) OCT’s were conducted on each of the samples to confirm
the previous flotation results by UTO and to evaluate the effect of
flotation response at finer grind sizes as seen in the flowcharts.
The flotation tests carried out on the high-grade samples indicated
that it is possible to obtain commercial lead and zinc concentrates
with grades of lead and zinc of 42.1% and 43%, respectively. The
concentration of silver in the lead and zinc concentrates were
reported as 7,010 g/t and 198.2 g/t, respectively. The
straightforward conventional selective lead-silver and zinc-silver
flotation techniques after carbon pre-treatment are able to recover
85.7% of silver in the lead concentrate (with a mass pull of 3.1%)
and 2.93% of silver in the zinc concentrate (with a mass pull of
3.75%). The lead and zinc recoveries are estimated as 80% and
77.8%, respectively. The flotation tests, carried out on the
low-grade samples indicated that it is possible to obtain
commercial lead and zinc concentrates with grades of lead and zinc
of 41% and 43.1%, respectively. The concentration of silver in the
lead and zinc concentrates were reported as 6,734 g/t and 207 g/t,
respectively. The straightforward conventional selective
lead-silver and zinc-silver flotation techniques after carbon
pre-treatment are able to recover 74% of silver in the lead
concentrate (with a mass pull of 1.95%) and 3.27% of silver in the
zinc concentrate (with a mass pull of 2.8%). The lead and zinc
recoveries are estimated as 77.6% and 71.9%, respectively. In
overall, better flotation (open circuit tests) performances are
obtained at a grind size of P80 of 74 lm. Locked cycle tests at
this grind size will be necessary to confirm these results. A set
of paste thickening tests were run on dry samples of the flotation
test (tailings) to investigate the performance of the FLSmidth Deep
Cone Paste thickening technology. Screening flocculent tests were
carried out. Anionic flocculent (Floenger PHP 50 Plus) was selected
to improve sedimentation performance based on settling rates and
observed visual supernatant clarity. Experience has shown that it
is difficult to scale paste flow characteristics from small-scale
tests to full-scale pipeline conditions, pilot-scale pumping tests
are usually necessary. The lab flotation concentrates (open circuit
tests) were assayed to determine the deleterious elements in the
concentrate and for use in the NSR calculations and included
mineralogical analyses. The results showed that the lead
concentrate assayed 47.2% Pb and 6,273 g/t Ag with 1.3% Cu, 1.45%
As and 1.23% Sb. The zinc concentrate assayed 53.8% Zn with
negligible copper, arsenic or antimony. The lead, silver and zinc
concentrate grades are in agreement with the LCT carried out
before. Concentrations of deleterious elements appear below typical
smelter penalty thresholds, with arsenic appearing as the principal
penalty element.
During
2012, UTO conducted further metallurgical test work including a
single collective flotation test, a series of open circuit
differential flotation tests (with a de-sliming step), a single
locked cycle flotation test (with de-sliming step), and PORCO flow
sheet testing. This test work was designed to explore the flotation
response of the ore to conventional differential flotation and to
establish the operating conditions, reagent scheme, and
consumptions. The sample was prepared and provided by Apogee (ASL)
and consisted of a bulk composite sample from drill cores with
grain sizes up to 76.2 mm (3 inches). The first exploratory test
indicated that silver recovery to bulk concentrate is about 72%,
while the lead and zinc recoveries are approximately 66% and 78%
respectively. The floating fraction accounted for about 13%, the
slimes fraction 18%, and the rest is lost as final tailings. Lead
and silver losses are up to 23% and 13%, respectively. The open
batch flotation tests indicated that lead recovery is between 48%
and 54%, while zinc recovery is in the range from 50.1% to 72%.
Total silver recovery to both lead and zinc concentrates is between
30% and 68%. Lead concentrate grades range from 33.5% to 59%, zinc
concentrate grades range from 49% and 55%. Similarly, silver grades
in both concentrates range from 9,875 g/t to 15,333 g/t. A single
LCT, a repetitive batch used to simulate a continuous circuit where
all the intermediate material added to the appropriate location in
the flowsheet, was conducted to produce a metallurgical projection
of the sample tested and to assess if the flowsheet and reagent
suite is stable. A good locked cycle test typically achieves steady
state over the last three cycles. Steady state implies both
stability and mass conservation. Stability implies constancy. It
was not indicated whether the test reached stability or whether
mass conservation was achieved. Assuming that steady state was
reached, the results indicated that lead and zinc recoveries were
60.1% and 76.5%, respectively. Lead concentrate assayed 11,114 g/t
Ag, 49.1% Pb and 4.81% Zn. Additionally, the metal values in the
zinc concentrate were 2,220 g/t Ag, 2.29% Pb and 48.6% Zn.
Concentrates account for about 2.9% w/w of the feed (0.81% lead and
2.1% zinc). Silver metal loss in the slimes is as high as in the
tailings. Lead and silver losses in the final tails are 23.1% and
9.12% respectively. The PORCO flowsheet is basically a bulk
flotation followed by lead and zinc flotation, this processing
route should be carried out at high pH (12.2) intended to depress
pyrite at the outset. However, the Pulacayo ore did not respond
well mainly because of lead and silver selectivity issues and high
consumption of acid (H2SO4) to drop the pH to a level suitable for
lead flotation after the bulk stage.
45
Maelgwyn
Mineral Services Africa carried out laboratory flotation
optimization test work on ore samples from the Pulacayo Project
during 2012. The objectives of the work were to: (i) test the
flotation conditions supplied by Apogee on the core samples to
determine the metal recoveries and grades achievable by
differential flotation of the Pb and Zn minerals; (ii) to optimize
the flotation conditions for effective differential of the Pb and
Zn minerals and to achieve saleable grades of Pb and Zn
concentrates; and (iii) to perform locked cycle testing of the
optimized flotation conditions using selected variability core
samples. Laboratory rod milling curves were produced for all the
samples and found that the milling times required for the samples
indicated a high degree of variability in hardness between the
sample types. Flotation tests included 65 OCT’s (exploratory
test work) and four locked cycle flotation tests. In summary, the
locked cycle tests yielded Pb concentrates of 55-69% Pb at
recoveries between 88% and 93% and Zn concentrates of 37% to 56% Zn
at recoveries of 79% to 90% with a large variation in head grade
from 1.5% Pb to 4.3% Pb. The silver recoveries ranged between 68%
and 94% with a variation in head grade of between 136 g/t Ag and
375 g/t Ag.
The
test mining between November 2011 and May 2013 produced 12,550 tons
of ore that were used in a toll milling program to evaluate ore
processing. The ore was hauled by truck to four concentrators
– Tatasi, Fedecomin, La Estrella, and Zabaleta. The Zabaleta
concentrator attained the best recoveries for which the results are
presented in the table below.
Pulacayo Deposit Zabaleta Toll Milling Results
|
Material
|
Concentrate
Grade
|
Recoveries
|
||||
|
Pb
(%)
|
Zn
(%)
|
Ag
(g/t)
|
Pb
(%)
|
Zn
(%)
|
Ag
(%)
|
|
|
Lead
Concentrate
|
47.95
|
12.85
|
6,295
|
64.62
|
16.26
|
72.13
|
|
Zinc
Concentrate
|
8.47
|
39.45
|
941
|
9.97
|
43.57
|
8.41
|
|
Tailings
|
0.58
|
0.97
|
49
|
25.41
|
40.16
|
18.45
|
|
Total Ag recovery: 81.55%
|
||||||
Only
one series of metallurgical tests were performed on samples from
the Paca deposit. The tests were completed on three samples
composited from drill cores and included feed characterization,
leaching, flotation and gravity tests, in-place bulk density
determination, and mineralogy. Study of the three composite samples
found the silver grade varied from 44.5 g/t Ag to 228.6 g/t Ag,
lead minerals 0.56% Pb to 0.8% Pb), and zinc minerals 0.05% Zn to
0.41% Zn). The other sulfide minerals identified were sulphosalts
and chalcocite. Coarse native silver was detected in one of the
samples. The silver minerals were amenable to cyanide leaching for
most of the composite samples (i.e. 28% to 82% Ag extraction)
however, extraction of silver was size dependent and improved with
fineness-of-size. The lime consumption in leach varied from 0.8 to
2.4 kg/t. The NaCN consumption was dependent on both ore type and
particle size, increasing with fineness of a particular size and in
general, averaged ± 1.5 kg/t. Due to the presence of coarse
native silver, the silver leaching was not completed in 120 hours,
hence, the data was extrapolated to 240 hours leach time to project
anticipated silver recovery and indicated that over 90% of silver
could potentially be recovered at fine particle size for two of the
three composites. Assay of the final pregnant solution from
selected tests found measurable quantities of gold, hence, it is
reasonable to conclude that gold is present in those samples. Some
of the copper minerals present in the samples are also readily
soluble in cyanide. Differential lead/zinc flotation process
recovered over 90% of silver in the combined lead and zinc
concentrate for the composite assaying 228.6 g/t Ag. The flotation
process shows promise of recovering silver. However, the flotation
process did not recover acceptable silver values from the other
composites. The gravity concentration process did not concentrate
silver in the gravity concentrate, hence, it cannot be used alone
as a process for recovering silver minerals. The average density
was ± 2.2 gm/cc for the samples tested, but the in-place bulk
densities were extremely variable for one composite (i.e., 1.79 and
2.58 gm/cc). In summary, the preliminary results were encouraging
to warrant additional drilling and metallurgical
testing.
Mining
Mineralization
is found from the surface to at least 1,000 m depth at the Pulacayo
deposit thus both surface and underground mining methods are
likely. It is envisioned that surface mining will recover the
oxidized ore and some sulphide ore to an elevation below which a
crown pillar will be left and below which underground mining
methods would start. Mineralization at the Paca deposit is found
from the surface to approximately 60 m depth for the mantos-style
mineralization and from approximately 10 m to 240m depth for the
stockwork and vein style mineralization. Thus, it is anticipated
mining will be mostly by surface methods.
Trial
mining was conducted between November 2011 and May 2013 at the
Pulacayo deposit. The trial mining was done to obtain geotechnical
information, better understand mining dilution, obtain a large
sample for process testing, and train the workforce. The mining
methods included jack leg drill and blast with tracked haulage for
development and drill and blast with trackless haulage for
production by the shrinkage and reusing stoping methods. The
haulage way was advanced and three stopes were mined. The trial
mining produced 12,550 tons of ore.
46
Mineral Resource Estimates and Reserves
The
current Pulacayo Project mineral resource estimates for the
Pulacayo and Paca deposits has been extracted or summarized from
the Pulacayo Technical Report.
The
Pulacayo Technical Report documents new mineral resource estimates
for the Pulacayo and Paca deposits that differ from the directly
preceding estimates by their inclusion of open pit optimization
methods for reporting of mineral resources. The current mineral
resource estimates and this supporting technical report were
prepared in accordance with NI 43-101 and the CIM Standards,
2014.
Geovia
Surpac ® Version 2020 was used to create the Pulacayo Project
block models, associated geological and grade solids, and to
interpolate silver-zinc-lead grade. The current mineral resource
estimate is based on combined results of 92,900 m of drilling,
44,469 core or chip analytical results, 355 trench samples, and 71
underground chip or channel samples for the two deposits. Geovia
Whittle pit optimization software and the PseudoFlow algorithm were
applied for pit shell optimization purposes.
A
tabulation of the mineral resources for the Pulacayo Project is
presented in the table below. Pit Constrained mineral resources
were defined for each deposit within optimized pit shells. Sulphide
zone pit optimization parameters include mining at US$2.00 per
tonne, combined processing and G&A at US$12.50 per tonne
processed, and haulage at US$0.50 per tonne processed for Pulacayo
and US$2.00 per tonne for Paca. Oxide zone pit optimization
parameters include mining at US$2.00 per tonne, combined processing
and G&A at US$23.50 per tonne processed, and haulage at US$0.50
per tonne processed for Pulacayo and US$2.00 per tonne for Paca.
Metal prices of US$17/oz Ag, US$0.95/lb Pb, and US$1.16/lb Zn were
used and metal recoveries of 89.2% Ag, 91.9% Pb, and 82.9% Zn were
used for sulphide zone mineral resources and 80% Ag for oxide zone
mineral resources.
Pit
Constrained sulphide mineral resources are reported at a cut-off
value of 30 g/t silver equivalent (Ag Eq.) within optimized pit
shells and Pit Constrained oxide mineral resources are reported at
a cut-off value of 50 g/t Ag within optimized pits shells. Cut-off
grades reflect total operating costs and are considered to reflect
reasonable prospects for eventual economic extraction using open
conventional open pit mining methods. Out of Pit mineral resources
are reported external to the optimized pit shells and are reported
at a cut-off grade of 100 g/t Ag Eg. They are considered to have
reasonable prospects for eventual economic extraction using
conventional underground mining methods such as long hole stoping
based on a mining cost of US$35 per tonne and processing and
G&A cost of $20.00 per tonne processed.
Mineral Resource Category Parameters
Definitions
of mineral resources and associated mineral resource categories
used in this report are those recognized under NI 43-101 and set
out in the CIM Standards, 2014. Only Inferred and Indicated
categories have been assigned to the Pulacayo deposit.
Several
factors were considered in defining resource categories, including
drill hole spacing, geological interpretations and number of
informing assay composites and average distance of assay composites
to block centroids. Specific definition parameters for each
resource category applied in the current estimate are set out
below.
Measured Resource
: No interpolated resource blocks were
assigned to this category.
Indicated Resource
: Indicated mineral resources are defined
as all blocks with interpolated silver grades from the first or
second interpolation passes that meet the specified Pit Constrained
or Out of Pit cut-off grades.
Inferred Resources
: Inferred mineral resources are defined
as all blocks with interpolated silver grades from the first,
second, and third interpolation passes that were not previously
assigned to the Indicated category and meet the specified Pit
Constrained or Out of Pit cut-off grades.
Application
of the selected mineral resource categorization parameters
specified above defined distribution of Indicated and Inferred
mineral resource estimate blocks within the block model. To
eliminate isolated and irregular category assignment artifacts, the
peripheral limits of blocks in close proximity to each other that
share the same category designation and demonstrate reasonable
continuity were wireframed and developed into discrete solid
models. All blocks within these “category” solid models
were re-classified to match that model’s designation. This
process resulted in more continuous zones of each mineral resource
estimate category and limited occurrences of orphaned blocks of one
category as imbedded patches in other category
domains.
Mineral Resource Estimate Tabulation
PULACAYO DEPOSIT
Mineral Resource Estimate
Block
grade, block density and block volume parameters for the Pulacayo
deposit were estimated using methods described in preceding
sections of this report. Subsequent application of mineral resource
category parameters resulted in the Pulacayo deposit mineral
resource estimate presented below in table below. Results are
presented in accordance with NI-43-101 and the CIM.
47
Pulacayo Deposit Mineral Resource Estimate – Effective Date:
October 13, 2020**
|
Pit Constrained Mineral Resources
|
|||||||
|
Cut -off
|
Zone
|
Category
|
Rounded Tonnes
|
Ag g/t
|
Pb %
|
Zn %
|
*Ag Eq. g/t
|
|
50 Ag
g/t
|
Oxide
|
Indicated
|
1,090,000
|
125
|
|
|
|
|
Inferred
|
25,000
|
60
|
|
|
|
||
|
30 *Ag
Eq. g/t
|
Sulfide
|
Indicated
|
24,600,000
|
76
|
0.70
|
1.63
|
156
|
|
Inferred
|
745,000
|
82
|
0.61
|
1.79
|
164
|
||
|
Out of Pit Mineral Resources
|
|||||||
|
100 *Ag
Eq. g/t
|
Sulfide
|
Indicated
|
660,000
|
268
|
0.44
|
1.35
|
307
|
|
Inferred
|
900,000
|
179
|
0.42
|
2.14
|
257
|
||
|
50 Ag
g/t
|
Oxide
|
Indicated
|
1,090,000
|
125
|
|
|
|
|
Inferred
|
25,000
|
60
|
|
|
|
||
|
30/100
*Ag Eq. g/t
|
Sulfide
|
Indicated
|
25,260,000
|
81
|
0.69
|
1.62
|
160
|
|
Inferred
|
1,645,000
|
135
|
0.51
|
1.98
|
215
|
||
**Notes:
1.
Mineral resources
were prepared in accordance with NI 43-101, the CIM Definition
Standards (2014) and CIM MRMR Best Practice Guidelines
(2019).
2.
*Ag Eq. = Silver
Equivalent (Recovered) = (Ag g/t*89.2%)+((Pb%*(US$0.95/lb.
Pb/14.583 Troy oz./lb./US$17 per Troy oz.
Ag)*(10,000*91.9%))+((Zn%*(US$1.16/lb. Zn/14.583 Troy oz./lb./US$17
per Troy oz. Ag)*(10,000*82.9%)). Sulphide zone metal recoveries of
89.2% for Ag, 91.9% for Pb, and 82.9% for Zn were used in the
Silver Equivalent (Recovered) equation and reflect metallurgical
testing results disclosed previously for the Pulacayo deposit. A
metal recovery of 80% Ag was used for oxide zone mineral
resources.
3.
Metal prices of
US$17/oz Ag, US$0.95/lb. Pb, and US$1.16 Zn apply. A currency
exchange rate of $1.00 to US$0.75 applies.
4.
Pit Constrained
mineral resources are defined within an optimized pit shell with
average pit slope angles of 45⁰. The Pulacayo deposit mineral
resource estimate was optimized at a 12.3:1 strip
ratio.
5.
Base-case sulfide
zone pit optimization parameters include mining at US$2.00 per
tonne; combined processing and G&A at US$12.50 per tonne
processed; and haulage at US$0.50 per tonne.
6.
Base-case oxide
zone pit optimization parameters include mining at US$2.00 per
tonne; combined processing and G&A at US$23.50 per tonne
processed; and haulage at US$0.50 per tonne.
7.
Pit Constrained
sulphide zone mineral resources are reported at a cut-off grade of
30 g/t Ag Eq. within the optimized pit shell and Pit Constrained
oxide zone mineral resources are reported at a cut-off grade of 50
g/t Ag within the optimized pit shell. Cut-off grades reflect total
operating costs used in pit optimization and are considered to
define reasonable prospects for eventual economic extraction by
open pit mining methods.
8.
Out of Pit mineral
resources are external to the optimized pit shell and are reported
at a cut-off grade of 100 g/t Ag Eq. They are considered to have
reasonable prospects for eventual economic extraction using
conventional underground methods such as long hole stoping based on
a mining cost of $35 per tonne and processing and G&A cost of
$20 per tonne processed.
9.
Combined Pit
Constrained and Out of Pit mineral resources is the
tonnage-weighted average summation of Pit Constrained and Out of
Pit Pulacayo mineral resources.
10.
Mineral resources
were estimated using Ordinary Kriging methods applied to 1 m
downhole assay composites capped at 2,300 g/t Ag, 13% Pb and 15%
Zn.
12.
Bulk density was
interpolated using Inverse Distance methods.
13.
Mineral resources
may be materially affected by environmental, permitting, legal,
title, taxation, sociopolitical, marketing, or other relevant
issues.
14.
Mineral resource
tonnages have been rounded to the nearest 5,000; totals may vary
due to rounding.
Pit
Constrained sulphide mineral resources are reported at a cut-off
value of 30 g/t Ag Eq. within the optimized pit shell and Pit
Constrained oxide mineral resources are reported at a cut-off value
of 50 g/t Ag within the optimized pit shell. Cut-off grades reflect
total operating costs and are considered to reflect reasonable
prospects for eventual economic extraction using conventional open
pit mining methods. Sulphide zone pit optimization parameters
include mining at US$2.00 per tonne, combined processing and
G&A at US$12.50 per tonne processed, and haulage at US$0.50 per
tonne processed. Oxide zone pit optimization parameters include
mining at US$2.00 per tonne, combined processing and G&A at
US$23.50 per tonne processed, and haulage at US$0.50 per tonne
processed. Metal prices of US$17/oz silver, US$0.95/lb lead, and
US$1.16/lb zinc were used and metal recoveries of 89.2% silver,
91.9% lead, and 82.9% zinc were used for sulphide zone mineral
resources and 80% silver for oxide zone mineral resources.
Optimization was constrained to an elevation of 4000 asl (maximum
depth of approximately 400 m below surface). The optimized pit
supports a 12.3:1 strip ratio with average pit slopes of
45°.
48
Out of
Pit mineral resources are reported external to the optimized pit
shell at a cut-off grade of 100 g/t Ag Eg. They are considered to
have reasonable prospects for eventual economic extraction using
conventional underground mining methods such as long hole stoping
based on a mining cost of US$35 per tonne and processing and
G&A cost of $20.00 per tonne processed.
Validation of Mineral Resource Models
Results
of block modeling were reviewed in three dimensions and compared on
a section by section basis with associated drill hole data. Block
grade distribution was shown to have acceptable correlation with
the grade distribution of the underlying drill hole data. Silver,
lead, and zinc grade descriptive statistics, presented in the table
below, were calculated for all interpolated blocks at a zero
cut-off value and were compared to the values of the combined assay
composite population (100 g/t Ag domain and 45 g/t Ag Eq. domain).
Average grades compare favorably between the composite and block
populations. As expected, the large block grade population is
characterized by lower coefficient of variation, standard deviation
and variance values than those of the assay composite
population.
Comparison of Pulacayo Deposit Block and Composite
Values
|
|
Capped Composite Values
|
Block Values
|
||||
|
Parameter
|
Ag g/t
|
Pb %
|
Zn %
|
Ag g/t
|
Pb %
|
Zn %
|
|
Mean
Grade
|
75.63
|
0.65
|
1.45
|
89.71
|
0.68
|
1.5
|
|
Maximum
Grade
|
2,300
|
13
|
15
|
1,559
|
7.03
|
12.46
|
|
Minimum
Grade
|
0
|
0
|
0
|
0
|
0
|
0
|
|
Variance
|
41,141
|
1.432
|
3.25
|
15,408
|
0.6
|
1.66
|
|
Standard
Deviation
|
203
|
1.2
|
1.8
|
124
|
0.77
|
1.29
|
|
Coefficient
of Variation
|
2.68
|
1.84
|
1.25
|
1.38
|
1.14
|
0.86
|
|
Number
of Samples
|
10,168
|
10,168
|
10,168
|
4,196,877
|
4,196,877
|
4,196,877
|
Block
volume estimates for each mineral resource solid were compared with
corresponding solid model volume reports generated in Surpac and
results show good correlation, indicating consistency in volume
capture and block volume reporting. Mercator created swath plots in
the easting and vertical directions comparing average composite
grades and global mass weighted block grades.
Tonnage and Grade Sensitivity
Tonnages
and average grades at various Ag Eq. cut-off grades are presented
in the tables below for Pit Constrained and Out of Pit sulphide
mineral resources and tonnages and average grades at various Ag
cut-off grades for Pit Constrained oxide mineral resources.
Approximately 95% of the Pit Constrained sulphide mineral resource
is retained at a cut-off grade of 60 g/t Ag Eq., double the mineral
resource cut-off grade of 30 g/t Ag Eq. Similarly, approximately
90% of the Out of Pit sulphide mineral resource is retained at a
cut-off grade of 150 g/t Ag Eq. when compared to the mineral
resource cut-off grade of 100 g/t Ag Eq. Significant tonnages are
present at higher cut-off grades for Pit Constrained sulphide
mineral resources and, when combined with Out of Pit sulphide
mineral resources, demonstrate potential for higher grade bulk
tonnage underground mining scenarios. Pit Constrained oxide mineral
resources demonstrate a high sensitivity to Ag cut-off
grade.
Pulacayo Deposit Pit Constrained Sulphide Zone Sensitivity
Analysis
|
Cut-off Grade (Ag Eg. g/t)
|
Category
|
Rounded Tonnes
|
Ag g/t
|
Pb %
|
Zn %
|
Ag Eq. g/t
|
|
15
|
Indicated
|
24,710,000
|
76
|
0.70
|
1.62
|
155
|
|
Inferred
|
755,000
|
81
|
0.60
|
1.77
|
162
|
|
|
*30
|
Indicated
|
24,600,000
|
76
|
0.70
|
1.63
|
156
|
|
Inferred
|
745,000
|
82
|
0.61
|
1.79
|
164
|
|
|
60
|
Indicated
|
20,660,000
|
88
|
0.79
|
1.80
|
176
|
|
Inferred
|
665,000
|
88
|
0.66
|
1.95
|
178
|
|
|
90
|
Indicated
|
13,700,000
|
121
|
0.99
|
2.17
|
227
|
|
Inferred
|
290,000
|
154
|
0.97
|
3.62
|
312
|
|
|
150
|
Indicated
|
7,295,000
|
201
|
1.35
|
2.59
|
327
|
|
Inferred
|
205,000
|
205
|
1.15
|
4.33
|
391
|
49
|
Cut-off Grade (Ag Eg. g/t)
|
Category
|
Rounded Tonnes
|
Ag g/t
|
Pb %
|
Zn %
|
Ag Eq. g/t
|
|
200
|
Indicated
|
5,385,000
|
249
|
1.54
|
2.75
|
383
|
|
Inferred
|
180,000
|
230
|
1.22
|
4.57
|
426
|
|
|
300
|
Indicated
|
3,255,000
|
315
|
1.88
|
3.18
|
471
|
|
Inferred
|
130,000
|
286
|
1.37
|
4.82
|
491
|
|
|
400
|
Indicated
|
1,860,000
|
387
|
2.25
|
3.62
|
565
|
|
Inferred
|
105,000
|
297
|
1.46
|
5.29
|
521
|
|
|
*Mineral
resource Estimate cut-off grade highlighted
|
||||||
Pulacayo Deposit Out of Pit Sulphide Zone Sensitivity
Analysis
|
Cut-off Grade (Ag Eg. g/t)
|
Category
|
Rounded Tonnes
|
Ag g/t
|
Pb %
|
Zn %
|
Ag Eq. g/t
|
|
75
|
Indicated
|
880,000
|
211
|
0.38
|
1.34
|
253
|
|
Inferred
|
1,250,000
|
137
|
0.36
|
1.92
|
209
|
|
|
*100
|
Indicated
|
660,000
|
268
|
0.44
|
1.35
|
307
|
|
Inferred
|
900,000
|
179
|
0.42
|
2.14
|
257
|
|
|
150
|
Indicated
|
530,000
|
321
|
0.49
|
1.3
|
354
|
|
Inferred
|
680,000
|
220
|
0.46
|
2.25
|
300
|
|
|
200
|
Indicated
|
435,000
|
359
|
0.53
|
1.41
|
394
|
|
Inferred
|
505,000
|
260
|
0.54
|
2.37
|
343
|
|
|
300
|
Indicated
|
290,000
|
429
|
0.64
|
1.63
|
468
|
|
Inferred
|
310,000
|
327
|
0.72
|
2.23
|
403
|
|
|
400
|
Indicated
|
180,000
|
490
|
0.74
|
1.93
|
538
|
|
Inferred
|
165,000
|
384
|
0.99
|
2.01
|
455
|
|
|
*Mineral
resource Estimate cut-off grade highlighted
|
||||||
Pulacayo Deposit Pit Constrained Oxide Zone Sensitivity
Analysis
|
Cut-off Grade (Ag g/t)
|
Category
|
Rounded Tonnes
|
Ag g/t
|
Pb %
|
Zn %
|
|
30
|
Indicated
|
1,760,000
|
92
|
|
|
|
Inferred
|
35,000
|
55
|
|
|
|
|
*50
|
Indicated
|
1,090,000
|
125
|
|
|
|
Inferred
|
25,000
|
60
|
|
|
|
|
90
|
Indicated
|
615,000
|
171
|
|
|
|
Inferred
|
|
|
|
|
|
|
200
|
Indicated
|
185,000
|
250
|
|
|
|
Inferred
|
|
|
|
|
|
|
*Mineral
resource Estimate cut-off of grade highlighted
|
|||||
Previous Mineral Resource Estimate
The
current mineral resource estimate is the 7th mineral resource
estimate prepared for the Pulacayo deposit under National
Instrument 43-101 and in accordance with CIM Standards applicable
at the respective effective dates. The first 4 estimates pre-date
the Company’s acquisition of the Pulacayo Project and are
noted in report section 6. The last two estimates were prepared on
behalf of Prophecy, the Company’s precursor, and are noted in
report section 9. The most recent previous mineral resource
estimate for the Pulacayo deposit was prepared by Mercator and is
described in a NI 43-101 technical report prepared for Prophecy
that is titled "Prophecy Development Corp., Updated Mineral
Resource Estimate and Technical Report, Pulacayo Project,
Potosí District, Antonnio Quijarro Province, Bolivia,
Effective Date: October 20th, 2017". This report is referenced
herein as Cullen and Webster (2017) and is filed on SEDAR. Results
of the mineral resource estimate supported by the 2017 technical
report are briefly discussed below relative to results of the
current mineral resource estimate.
50
The
Cullen and Webster (2017) mineral resource estimation program
applied methodologies specifically aimed at defining high grade
silver mineralization and minimizing potential dilution of metal
grade by adjacent lower grade tonnes. For these reasons, results of
the resulting mineral resource estimates differ substantially from
current 2020 results by having higher metal grades, thinner
mineralized zone solids and significantly lower tonnages defined at
higher cut-off values. In contract, the emphasis of the current
mineral resource estimation program was definition of mineral
resources having potential for economic extraction in the
foreseeable future using primarily open pit mining methods.
However, the sensitivity analysis of the current mineral resource
estimate shows comparable mineral resources defined at the 400 g/t
Ag Eq. cut-off value to those defined at that same cut-off value in
the 2017 mineral resource estimates. The slight decrease in average
grades and tonnes at that cut-off value is associated with several
factors, including but not necessarily restricted to, a difference
in interpolation methods, grade domain cut-off values, and
evolution of the underground workings model. The value (pricing) of
silver is comparable between the current mineral resource and the
2017 assessments. The 2017 mineral resource estimate for the
Pulacayo deposit has been superseded by the current mineral
resource estimate for the deposit.
PACA DEPOSIT
The
Pulacayo and Paca deposits are related to the same mineralizing
event that is associated with development of the associated Paca
and Pulacayo volcanic centers. The Paca deposit is spatially
related to the contact zone of the Paca volcanic dome which is
comprised of porphyritic andesite and dacite units and related
volcanic breccias. These are hosted by fine grained to
conglomeratic volcaniclastic lithologies of the Quehua Formation.
Silver-zinc-lead mineralization at Paca occurs primarily within an
argillic to advanced argillic alteration envelope that affects both
Paca dome igneous lithologies and surrounding host sequences.
Silicification and alunite development are also well developed in
association with some portions of the deposit. The Paca deposit
presents a core zone of mineralization that correlates closely with
an irregularly shaped body of altered and brecciated andesite and
country rocks that closely follows the contact zone between the
Paca dome andesite and the shallowly north-dipping host
volcaniclastic sequence. Adjacent to this, stratabound replacement
style (“mantos”) mineralization is present within the
shallowly north-dipping host volcaniclastic sequence at several
elevations. Mantos mineralization merges with that seen in the
central breccia zone but is typically lower in all metal grades. A
polylithic conglomerate unit that outcrops in the deposit area is
also mineralized and shows a strong imprint of silicification
represented by micro-crystalline replacement style silica in
various forms.
Mineralization
associated with discrete veins of significant width and lateral
extent is not pervasively present at Paca. Mineralization more
typically occurs in irregularly spaced discrete fracture systems as
well as in matrix replacement sites. The mantos style
mineralization is primarily represented as finely disseminated,
fine grains and aggregates of silver, lead and zinc sulphide and
sulphosalt phases, accompanied by others such as manganese oxide
and barite. Argillic to advanced argillic alteration phases are
pervasively present in areas of significant metallic
mineralization. Mineral phases commonly recognized at Paca in
association with metal grades of economic interest include
sphalerite, galena, silver sulphosalts, tennatite, smithsonite,
barite, manganese oxide, gypsum, jarosite, specularite, cerussite,
dolomite aragonite and calcite. The style and occurrence of this
mineralization is consistent with a low-to-intermediate epithermal
style genetic model.
The
Paca deposit resource is reported in the Mineral Resource Estimate
Technical Report for the Pulacayo Project that describes mineral
resources estimated following the CIM Standards, 2014. The Mineral
Resource Estimate has an effective date of October 13,
2020.
The
Mineral Resource Estimate was prepared by Mercator under the
supervision of Matthew Harrington, P. Geo., who is an independent
Qualified Person as defined under NI 43-101. A contained metal
summary based on the Mineral Resource Estimate for the Paca deposit
is reported below:
Paca Deposit Pit-Constrained Mineral Resource Estimate
Effective
Date October 13, 2020**
|
Cut -off Grade
|
Zone
|
Category
|
Rounded Tonnes
|
Ag g/t
|
Zn %
|
Pb %
|
Ag Moz
|
Zn Mlbs
|
Pb Mlbs
|
*AgEq Moz
|
*AgEq g/t
|
|
50 Ag
g/t
|
Oxide
In-Pit
|
Indicated
|
1,095,000
|
185
|
|
|
6.5
|
|
|
|
|
|
Inferred
|
345,000
|
131
|
|
|
1.5
|
|
|
|
|
||
|
30
*AgEq g/t
|
Sulfide
In-Pit
|
Indicated
|
20,595,000
|
46
|
1.07
|
0.67
|
30.5
|
485.8
|
304.2
|
70.2
|
106
|
|
Inferred
|
3,050,000
|
46
|
0.76
|
0.65
|
4.5
|
51.1
|
43.7
|
9.2
|
94
|
||
|
Total:
|
Indicated
|
21,690,000
|
|
|
|
37
|
485.8
|
304.2
|
70.2
|
|
|
|
Inferred
|
3,395,000
|
|
|
|
6
|
51.1
|
43.7
|
9.2
|
|
||
**See detailed notes on the Mineral Resource Estimate parameters
under preceding Table titled “Pulacayo Deposit Mineral
Resource Estimate - Effective Date October 13,
2020”
Sensitivity
analysis shown in the following two tables illustrates various
pit-constrained grade-tonnage scenarios at the Paca deposit based
on a range of cut-off grades:
51
Paca Deposit Pit-Constrained Cut-Off Grade Sensitivity Report for
Oxide Zone
|
Cut -off Grade
|
Category
|
Rounded Tonnes
|
Ag g/t
|
Zn %
|
Pb %
|
Ag Moz
|
Zn Mlbs
|
Pb Mlbs
|
*AgEq Moz
|
AgEq g/t
|
|
30 Ag
g/t
|
Indicated
|
1,805,000
|
128
|
|
|
7.4
|
|
|
|
|
|
Inferred
|
500,000
|
102
|
|
|
1.6
|
|
|
|
|
|
|
45 Ag
g/t
|
Indicated
|
1,225,000
|
170
|
|
|
6.7
|
|
|
|
|
|
Inferred
|
375,000
|
124
|
|
|
1.5
|
|
|
|
|
|
|
90 Ag
g/t
|
Indicated
|
800,000
|
231
|
|
|
5.9
|
|
|
|
|
|
Inferred
|
235,000
|
159
|
|
|
1.2
|
|
|
|
|
|
|
200 Ag
g/t
|
Indicated
|
420,000
|
311
|
|
|
4.2
|
|
|
|
|
|
Inferred
|
55,000
|
285
|
|
|
0.5
|
|
|
|
|
|
|
400 Ag
g/t
|
Indicated
|
80,000
|
493
|
|
|
1.3
|
|
|
|
|
|
Inferred
|
5,000
|
459
|
|
|
0.1
|
|
|
|
|
Note: Cut-off grade for pit-constrained oxide mineral resources is
50 g/t Ag.
Paca Deposit Pit-Constrained Cut-Off Grade Sensitivity Report for
Sulfide Zone
|
Cut -off Grade
|
Category
|
Rounded Tonnes
|
Ag g/t
|
Zn %
|
Pb %
|
Ag Moz
|
Zn Mlbs
|
Pb Mlbs
|
*AgEq Moz
|
AgEq g/t
|
|
30 AgEq g/t
|
Indicated
|
20,595,000
|
46
|
1.07
|
0.67
|
30.5
|
485.8
|
304.2
|
70.2
|
106
|
|
Inferred
|
3,050,000
|
46
|
0.76
|
0.65
|
4.5
|
51.1
|
43.7
|
9.2
|
94
|
|
|
45 AgEq
g/t
|
Indicated
|
19,315,000
|
48
|
1.11
|
0.69
|
29.8
|
472.7
|
293.8
|
68.3
|
110
|
|
Inferred
|
2,650,000
|
51
|
0.81
|
0.7
|
4.4
|
47.3
|
40.9
|
8.7
|
102
|
|
|
90 AgEq
g/t
|
Indicated
|
8,600,000
|
87
|
1.38
|
0.95
|
24.1
|
261.6
|
180.1
|
45.4
|
164
|
|
Inferred
|
950,000
|
114
|
0.94
|
0.95
|
3.5
|
19.7
|
19.9
|
5.2
|
171
|
Note: Mineral resource estimate cut-off grade
bolded
.
|
Cut -off Grade
|
Category
|
Rounded Tonnes
|
Ag g/t
|
Zn %
|
Pb %
|
Ag Moz
|
Zn Mlbs
|
Pb Mlbs
|
*AgEq Moz
|
AgEq g/t
|
|
200
AgEq g/t
|
Indicated
|
1,810,000
|
256
|
1.22
|
1.22
|
14.9
|
48.7
|
48.7
|
18.5
|
318
|
|
Inferred
|
190,000
|
338
|
0.61
|
0.98
|
2.1
|
2.6
|
4.1
|
2.2
|
360
|
|
|
400
AgEq g/t
|
Indicated
|
300,000
|
490
|
1.38
|
1.47
|
4.7
|
9.1
|
9.7
|
5.2
|
542
|
|
Inferred
|
50,000
|
545
|
0.39
|
0.82
|
0.9
|
0.4
|
0.9
|
0.9
|
530
|
|
|
Note: Mineral resource estimate cut-off grade
bolded
.
|
||||||||||
Mineral Reserve Estimates
No
mineral reserves have been defined to date by the Company for the
Pulacayo and Paca deposits.
Environmental
The
Company, through acquisition of ASC and later transfer of the
environmental license, has a valid and in force environmental
license issued by the Bolivian Ministry of Environment and Water
that is valid to 2023 for the Pulacayo licenses. The license allows
for construction of a mine and concentrator with capacities up to
560 tons per day. Granting of the environmental license includes
approval of the Environmental Impact Evaluation Study and
Environmental Base Line Audit. Bolivian environmental law absolves
the Company of environmental liability created by its
predecessors.
The
Pulacayo Project’s current environmental operating
requirements are set out in compliance with the Environment Law
(Law Nº 1333) and the Environmental Regulation for Mining
Activities. A certificate of exemption was obtained for the
exploration phase and an audit of the Environmental Base Line
(ALBA) was carried out between December 2007 and July 2008 by
Mining Consulting & Engineering “MINCO S.R.L.”, a
Bolivian based professional consulting firm with broad exposure to
the mining industry. Its audit report summarized the work carried
out during the Environmental Assessment by Apogee and includes 1) a
compilation of information on the local vegetation, animals, soil,
water, air, etc., including collection of more than 500 samples in
the area of interest to support the conclusions and recommendations
of the report; 2) an evaluation of the social impact of the
project; 3) an evaluation of the area contaminated during previous
mining activities, including tailings, abandoned facilities, acid
waters, scrap, etc.; and 4) an evaluation of other environmental
liabilities.
52
The
very long production history of the Pulacayo site, which in part is
not fully documented, has potentially resulted in mining or milling
associated site contamination issues related to waste rock or
tailings deposit distributions that are not fully defined at this
time. These may be additional to the areas of such concern
identified in environmental permitting activities completed to
date. Future issues associated with these should be considered
project risks that may require management as the project
progresses. Additional issues with site contamination associated
with historical and recent site operations carried out by, or on
behalf of, COMIBOL that are related to that firm’s
infrastructure at the site may also pose future project risk that
should monitored. Potential impacts of poorly or undocumented site
operations by the local mining cooperative may also require
management as the project progresses.
On May
25, 2011 Apogee was awarded an environmental licence by the
Bolivian authorities sanctioning mining operations at its Pulacayo
project. The permit (Certificado de Dispensación Categoria 3
Para Exploración y Actividades Mineras Menores/EMAP) allows
for the extraction of up to 200 tonnes per day from underground for
stockpiling and transporting for off-site processing. This permit
is still in effect at the effective date of this
report.
On
September 25, 2013 Apogee was awarded by the Bolivian Ministry of
Water and Environment the Environment Impact Declaration
certificate which shows that the Bolivian environmental authorities
approved the Environmental Impact Assessment (“EIA”)
which permits establishment of mining, milling and tailings
facilities on the Pulacayo site of sufficient size to support
milling operations of up to 560 tonnes per day. The application to
obtain this permit was applied by Apogee on December 17, 2012. The
submission was the result of over 30 months of technical studies
and consultations, including a comprehensive water management plan,
the feasibility study, archeological studies, flora and fauna
studies, mine closure planning, social baseline studies, and
results from two years of public consultations with local
communities. All permits previously granted to Apogee currently
remain in effect for the Company.
On May
25, 2011 Apogee was awarded an environmental licence by the
Bolivian authorities sanctioning mining operations at its Pulacayo
project. The permit (Certificado de Dispensación Categoria 3
Para Exploración y Actividades Mineras Menores/EMAP) allows
for the extraction of up to 200 tonnes per day from underground for
stockpiling and transporting for off-site processing. This permit
is still in effect at the effective date of this
report.
On
November 12, 2018 ASC Bolivia LDC Sucursal Bolivia was awarded an
updated environmental licence by the Bolivian authorities
sanctioning mining operations at its Paca project. The permit
(Certificado de Dispensación Categoria 3 Para Exploración
y Actividades Mineras Menores/EMAP) which allows exploration
activities. This permit is still in effect.
Agreements
and permits currently in place for the Pulacayo project provide
authority to carry out the Pulacayo and Paca deposit area
exploration work programs recommended in this report. They also
provide access for development of certain mining, milling and
tailings infrastructure for the Pulacayo deposit, subject to site
environmental directives.
Project Risks and Mitigation
The
major risks to developing the Pulacayo Project include the
inability to obtain financing, decreases in metal prices, and
adverse political and social changes. The inability to obtain
financing will be mitigated through pursuit of equity investors and
cash flow from sale of available material. The risk from decrease
in metal prices will be mitigated by the timing of the project in
that the start of the project is at the time of lowest metal prices
in several years and concentrate sales will start when metal prices
are projected to be much higher. Adverse political and social
changes are also mitigated by the timing of the project. The
national government has started to become much more supportive of
mining and recently the local government and population have shown
strong support for re-starting the mine.
Legacy Financial Obligations
As part
of the transaction with Apogee, we agreed to assume, within certain
limitations, all liabilities associated with the Apogee
Subsidiaries and the Pulacayo Project. During 2014, Apogee received
notice from the national tax authority in Bolivia alleging that its
wholly owned subsidiary ASC owes approximately Bs42,000,000
(equaling in an amount originally assessed at approximately
$7,600,000 in 2004) of taxes, interest and penalties relating to a
historical tax liability. The Company continued to dispute the
assessment and hired local legal counsel to pursue an appeal of the
tax authority’s assessment on both substantive and procedural
grounds. On May 26, 2015, the Company received a positive
“resolution” issued by the Bolivian Constitutional
Court that declared null and void the previous resolution of the
Bolivian Supreme Court issued in 2011 and sent the matter back to
the Supreme Court to consider and issue a new
resolution.
On
December 4, 2019, the Company received the 2019 Resolution issued
by the Supreme Court of Bolivia which declares that the contentious
tax claim of US$ 6,556,787 brought by Bolivia’s General
Revenue Authority against the Company’s Bolivian subsidiary
is not proven.
53
THREE YEAR RECENT ACTIVITIES & UPDATES
2018
During
the year ended December 31, 2018, the Company determined there were
several indicators of potential impairment of the carrying value of
the Pulacayo Paca property including change in the Company primary
focus to Gibellini Project. While management believes that Pulacayo
Project is a property of merit and warrants continued development,
a write down in accordance with
IFRS 6 Exploration for and Evaluation of
Mineral Resources and IAS 36, Impairment of Assets
of
$13,708,200 of previously capitalized deferred exploration costs to
$nil and an impairment charge of $335,181 on the Pulacayo mining
equipment has been recognized. This non-cash accounting charge does
not impact the Company’s financial liquidity, or any future
operations and management believes the adjustment to the book value
of this long-lived asset more accurately reflects the
Company’s current market capitalization.
2019
In
September of 2019 the Company initiated its first drilling program
at the Paca deposit area. The program was completed in October of
2019, and consisted of 7 drill holes. The complete detailed
composited drill intersections of mineralization are tabulated in
the following table:
|
Hole
|
From (m)
|
To (m)
|
Length (m)
|
Ag (g/t)
|
Zn %
|
Pb %
|
AgEq
|
|
PND107
|
|||||||
|
Interval:
|
55
|
109
|
54
|
151
|
1.01
|
1.17
|
238
|
|
including …
|
70
|
77
|
7
|
178
|
0.97
|
1.37
|
271
|
|
and …
|
70
|
109
|
39
|
180
|
1.2
|
1.34
|
283
|
|
and …
|
87
|
109
|
22
|
240
|
1.23
|
1.65
|
355
|
54
|
Hole
|
From (m)
|
To (m)
|
Length (m)
|
Ag (g/t)
|
Zn %
|
Pb %
|
AgEq
|
|
PND108
|
|||||||
|
|
15
|
65
|
50
|
135
|
0.4
|
1.42
|
208
|
|
including …
|
33
|
57
|
24
|
200
|
0.6
|
2.12
|
307
|
|
and …
|
33
|
43
|
10
|
257
|
0.41
|
1.49
|
333
|
|
Interval:
|
94
|
96
|
2
|
160
|
0.94
|
0.52
|
220
|
|
PND109
|
|||||||
|
Interval:
|
15
|
43
|
28
|
242
|
0.27
|
0.69
|
281
|
|
including …
|
20
|
29
|
9
|
391
|
0.26
|
1.1
|
445
|
|
and …
|
24
|
26
|
2
|
1223
|
0.42
|
3.2
|
1365
|
|
and …
|
37
|
43
|
6
|
282
|
0.31
|
0.52
|
315
|
|
|
75
|
173
|
98
|
15
|
2.47
|
1.28
|
168
|
|
including …
|
93
|
94
|
1
|
167
|
3.64
|
1.24
|
367
|
|
PND110
|
|||||||
|
Interval:
|
9
|
182
|
173
|
95
|
1.63
|
1.4
|
273
|
|
including…
|
9
|
98
|
89
|
279
|
1.28
|
1.17
|
378
|
|
and…
|
9
|
28
|
19
|
718
|
0.05
|
0.74
|
749
|
|
and…
|
9
|
12
|
3
|
145
|
0.07
|
0.9
|
183
|
|
and…
|
16
|
28
|
12
|
1085
|
0.04
|
0.71
|
1115
|
|
and…
|
44
|
180
|
138
|
87
|
1.59
|
2.01
|
233
|
|
and…
|
44
|
46.5
|
2.5
|
111
|
0.61
|
1.09
|
179
|
|
and…
|
44
|
98
|
54
|
98
|
2.03
|
1.52
|
343
|
|
and…
|
52
|
54
|
2
|
115
|
1.61
|
1.33
|
234
|
|
and…
|
60
|
82
|
22
|
328
|
1.98
|
1.43
|
466
|
|
and…
|
61
|
65
|
4
|
1248
|
1.93
|
2.88
|
1441
|
|
and…
|
86
|
94
|
8
|
270
|
2.83
|
2.74
|
495
|
|
and…
|
97
|
98
|
1
|
155
|
3.26
|
3.03
|
409
|
|
PND111
|
|||||||
|
Interval:
|
0
|
2.4
|
2.4
|
110
|
0.16
|
0.58
|
139
|
|
PND112
|
|||||||
|
Interval:
|
12
|
28
|
16
|
154
|
0.08
|
0.39
|
173
|
|
including…
|
21
|
22
|
1
|
890
|
0.05
|
0.31
|
904
|
|
Interval:
|
33
|
36
|
3
|
120
|
0.07
|
2.4
|
216
|
|
Interval:
|
43
|
44.6
|
1.6
|
100
|
0.23
|
1.58
|
171
|
|
PND113
|
|||||||
|
Interval:
|
3
|
28
|
25
|
196
|
0.04
|
0.29
|
209
|
|
including…
|
3
|
17
|
14
|
185
|
0.04
|
0.38
|
202
|
|
and…
|
21
|
28
|
7
|
310
|
0.04
|
0.19
|
320
|
Reported
widths are intercepted core lengths and not true widths, as
relationships with intercepted structures and contacts vary. Based
on core-angle measurements, true widths are estimated at
approximately 77% of reported core lengths. Silver equivalents
reported are calculated above do not assume metallurgical
recoveries and were calculated using AgEg. (g/t) = Ag (g/t) % +
(Pb% *(US$0.94/lb. Pb /14.583 Troy oz./lb./US$16.50 per Troy oz.
Ag)*10,000) + (Zn% *(US$1.00/lb. Zn/14.583 Troy oz./lb./US$16.50
per Troy oz. Ag)*10,000). Metal prices used in this silver
equivalent calculation are US$16.50/Troy oz. Ag, US$0.94/lb. Pb and
US$1.00/lb. Zn.
55
The
Company adopts industry recognized best practices in its
implementation of QA/QC methods. A geochemical standard control
sample and one blank sample is inserted into the sample stream
every 20th sample. Duplicates are taken at every 40th sample.
Standards and duplicates including lab duplicates and standards and
are analyzed using Thompson-Howarth plots. Samples are shipped to
ALS Global Laboratories in Ururo, Bolivia for preparation, and then
shipped to ALS Global laboratories for analysis in Lima, Peru.
Samples were analyzed using intermediate level four acid digestion.
Silver overlimits are analyzed using fire assay with a gravimetric
finish. ALS Laboratories sample management system meets all
requirements of International Standards ISO/IEC 17025:2017 and ISO
9001:2015. All ALS geochemical hub laboratories are accredited to
ISO/IEC 17025:2017 for specific analytical procedures.
All
samples are taken from HQ-diameter core which split in half by a
diamond-blade masonry saw. One-half of the core is submitted for
laboratory analysis and the other half is preserved on the
Company’s secured core facility for reference. All core is
geotechnically analyzed, photographed and then logged by geologists
prior to sampling.
During
the year ended December 31, 2019, the Company assessed whether
there was any indication that the previously recognized impairment
loss in connection with the Pulacayo Project may no longer exist or
may have decreased. The Company noted the following indications
that the impairment may no longer exist:
●
The Company signed
a mining production contract granting the Company the 100%
exclusive right to develop and mine at the Pulacayo
Project;
●
The Company renewed
its exploration focus to develop the Pulacayo Project in
2020;
●
The Company
re-initiated active exploration and drilling program on the
property;
●
Completed a
positive final settlement of Bolivian tax dispute.
As the
Company identified indications that the impairment may no longer
exist, the Company completed an assessment to determine the
recoverable amount of the Pulacayo Project.
In
order to estimate the fair-value of the property the Company
engaged a third-party valuation consultant and also utilized level
3 inputs on the fair value hierarchy to estimate the recoverable
amount based on the property’s fair value less costs of
disposal determined with reference to dollars per unit of metal
in-situ.
With
reference to metal in-situ, the Company applied US$0.79 per ounce
of silver resource to its 36.8 million ounces of silver resources
and US$0.0136 per pound of zinc or lead in resource to its 303
million pounds of zinc and lead.
The
Company also considered data derived from properties similar to the
Pulacayo Paca Property. The data consisted of property transactions
and market valuations of companies holding comparable properties,
adjusted to reflect the possible impact of factors such as
location, political jurisdiction, commodity, geology,
mineralization, stage of exploration, resources, infrastructure and
property size.
As the
recoverable amount estimated with respect to the above was $31.4
million an impairment recovery of $13,708,200 was recorded during
the year ended December 31, 2019.
2020
Diamond Drilling
Drilling
that began at the Pulacayo deposit in December of 2019 was
completed in February of 2020. The Company announced its first set
of results on January 21, 2020, from borehole PUD 267 which
intercepted 10 meters of mineralization grading 147 g/t silver,
9.8% zinc, and 2.0% lead (539 g/t AgEq) within 35.5 meter
mineralization grading 230 g/t AgEq starting 31.5 meters
downhole.
56
On
March 6, 2020, the Company released additional results from its
first 2,598 meters of drilling, which focused on the western
portion of the Pulacayo Project and on August 11, 2020, the Company
announced further diamond infill drilling results from the Pulacayo
Project. Complete results of all first phase 2020 drilling are
tabulated below:
|
Hole ID
|
From (m)
|
To (m)
|
Interval (m)
|
Ag (g/t)
|
Zn (%)
|
Pb (%)
|
AgEq
|
|
PUD267*
|
31.5
|
67
|
35.5
|
54.3
|
4.31
|
0.92
|
229.6
|
|
including…
|
117
|
123
|
6
|
47.8
|
1.11
|
0.25
|
89.7
|
|
PUD268
|
21
|
23
|
2
|
20
|
1.34
|
0.77
|
92.6
|
|
PUD274
|
75
|
77
|
2
|
93.5
|
|
0.42
|
98.8
|
|
PUD274
|
82
|
83
|
1
|
83
|
|
0.09
|
77.4
|
|
PUD283
|
248
|
350
|
102
|
145
|
2.56
|
1.05
|
255
|
|
including..
|
248
|
282
|
34
|
9
|
1.05
|
0.22
|
52
|
|
and…
|
282
|
297
|
15
|
35
|
2.99
|
0.4
|
148
|
|
and…
|
297
|
310
|
13
|
157
|
5.15
|
1.47
|
370
|
|
and…
|
310
|
317
|
7
|
225
|
3.74
|
1.15
|
371
|
|
and…
|
317
|
322
|
5
|
1565
|
3.85
|
8.25
|
1825
|
|
and…
|
322
|
329
|
7
|
134
|
1.73
|
1.18
|
222
|
|
and…
|
329
|
350
|
21
|
76
|
2.65
|
0.82
|
188
|
|
PUD284
|
30.5
|
204.2
|
173.7
|
15
|
0.67
|
0.28
|
46
|
|
including…
|
30.5
|
55
|
24.5
|
3
|
2.45
|
0.1
|
20
|
|
and…
|
55
|
65
|
10
|
113
|
2.11
|
1.93
|
243
|
|
and…
|
65
|
79
|
14
|
13
|
1.2
|
0.44
|
69
|
|
and…
|
79
|
101
|
22
|
4
|
0.36
|
0.11
|
20
|
|
and…
|
101
|
204.2
|
103.2
|
10
|
0.59
|
0.18
|
36
|
|
PUD284
|
206.3
|
273
|
66.7
|
112
|
1.94
|
0.46
|
182
|
|
Interval:
|
206.3
|
240
|
33.7
|
46
|
2.12
|
0.41
|
129
|
|
Interval:
|
240
|
256
|
16
|
79
|
2.7
|
0.72
|
189
|
|
Interval:
|
256
|
273
|
17
|
274
|
1.13
|
0.33
|
295
|
|
PUD284
|
282
|
318
|
36
|
26
|
1.01
|
20
|
70
|
|
including…
|
282
|
288
|
6
|
13
|
0.94
|
0.27
|
54
|
|
and…
|
288
|
300
|
12
|
60
|
1.48
|
0.61
|
127
|
|
and…
|
300
|
318
|
18
|
7
|
0.72
|
0.18
|
38
|
Reported
widths are intercepted core lengths and not true widths, as
relationships with intercepted structures and contacts vary. Based
on core-angle measurements, true widths are estimated at
approximately 61% of reported core lengths. Silver equivalent is
calculated as follows: Ag Eq. (g/t) = Ag (g/t)*89.2% + (Pb%
*(US$0.94/ lb. Pb /14.583 Troy oz/lb./US$16.50 per Troy oz.
Ag)*10,000*91.9%) + (Zn% *(US$1.00/lb. Zn/14.583 Troy
oz/lb./US$16.50 per Troy oz. Ag)*10,000*82.9). This calculation
incorporates metallurgical recoveries from test work completed for
Pulacayo in 2013 by Universidad Tecnica de Oruro (UTO), in Oruro
and La Paz, Bolivia as well as at Maelgwyn Mineral Services Africa
(MMSA) in Roodeporrt, South Africa.
Drilling
was commenced and completed in October 2020 at the Paca deposit. A
545 meter program focused on potential reinterpretation of the
geology in the area. Geological mapping identified additional
structures in the Paca area that may run oblique to the main
east-west trending structure. In this program, 5 holes were drilled
diagonally to test possible oblique structures for
‘blind’ mineralization that might have previously gone
undetected. Significant results are shown below:
|
Hole ID
|
From
|
To
|
Length (m)
|
Ag (g/t)
|
Zn %
|
Pb %
|
AgEq*
|
|
PND114
|
1.5
|
18.0
|
16.5
|
43
|
0.11
|
0.36
|
55
|
|
PND115
|
3.0
|
69.0
|
66.0
|
48
|
0.10
|
0.80
|
75
|
|
PND116
|
7.0
|
37.0
|
30.0
|
23
|
0.15
|
0.42
|
41
|
|
PND117
|
51.0
|
82.0
|
31.0
|
3
|
0.45
|
0.31
|
31
|
|
PND118
|
18.0
|
38.0
|
20.0
|
25
|
0.09
|
0.09
|
29
|
|
PND118
|
67.0
|
179.0
|
112.0
|
15
|
0.50
|
0.48
|
50
|
|
including…
|
133.0
|
143.0
|
10.0
|
61
|
0.65
|
0.37
|
93
|
57
(*)
Silver equivalent (“AgEq”) calculation is based on
NI43-101 compliant 2020 resource report completed for the Paca
deposit by Mercator Geological Services (see Company’s press
release dated October 13th, 2020). Silver equivalent is calculated
as follows: Ag Eq. = Silver Equivalent (Recovered) = (Ag
g/t*89.2%)+((Pb%*(US$0.95/lb. Pb/14.583 Troy oz./lb./US$17 per Troy
oz. Ag)*(10,000*91.9%))+((Zn%*(US$1.16/lb. Zn/14.583 Troy
oz./lb./US$17 per Troy oz. Ag)*(10,000*82.9%)) and assumed
metallurgical recoveries. Metal prices of US$17/oz Ag, US$0.95/lb
Pb, and US$1.16/lb Zn apply.
Reported
widths are intercepted core lengths and not true widths, as
relationships with intercepted structures and contacts vary. Based
on core-angle measurements, true widths range from 77% to 86% of
the reported core length.
PND
114, 115, 118 drilled tested oblique structures parallel to the
main east-west trend and discovered new mineralized
zones.
PND 114
intersected 16.5 meters of mineralization grading 55g/t silver
equivalent that is to the north of the Paca north
zone.
PND 115
intercepted 66 meters of mineralization grading 75g/t silver
equivalent between Paca main zone and Paca north zone, which are
250 meters apart.
PND 118
was drilled at the eastern edge of the Paca main zone and
intersected 112 meters of mineralization grading 50 g/t silver
equivalent.
The
Company adopts industry recognized best practices in its
implementation of QA/QC methods. A geochemical standard control
sample and one blank sample is inserted into the sample stream
every 20th sample. Duplicates are taken at every 40th sample.
Standards and duplicates including lab duplicates and standards and
are analyzed using Thompson-Howarth plots. Samples are shipped to
ALS Global Laboratories in Ururo, Bolivia for preparation, and then
shipped to ALS Global laboratories for analysis in Lima, Peru.
Samples were analyzed using intermediate level four acid digestion.
Silver overlimits are analyzed using fire assay with a gravimetric
finish. ALS Laboratories sample management system meets all
requirements of International Standards ISO/IEC 17025:2017 and ISO
9001:2015. All ALS geochemical hub laboratories are accredited to
ISO/IEC 17025:2017 for specific analytical procedures.
All
samples are taken from HQ-diameter core which split in half by a
diamond-blade masonry saw. One-half of the core is submitted for
laboratory analysis and the other half is preserved on the
Company’s secured core facility for reference. All core is
geotechnically analyzed, photographed and then logged by geologists
prior to sampling.
District Exploration
In
March 2020 the Company further announced that it had commenced
district exploration program at its Pulacayo Project. The Company
would be conducting geological mapping, with relevant sampling and
possible trenching on the property. Induced polarization geophysics
would also be conducted in tandem with the field program, with 106
line-kilometers of survey having been outlined.
In July
2020, the Company announced results of rock chip samples taken from
the San Leon underground tunnel. This geological sampling and
mapping program are part of an ongoing district exploration program
announced on March 9, 2020, at the Company’s Pulacayo Silver
Project in Bolivia. A total of 113 chip samples were collected at
intervals of from 0.85 to 3.0 meters to better characterize the
geology and alteration of the San Leon tunnel, which continues for
3km to the south of the mapping area, passing through the
Company’s existing NI43-101 Pulacayo resource and connects to
the town of Pulacayo. The tunnel also extends to the north for 1 km
where historically the Pulacayo mine’s ore was carted for
smelting during the 1800’s. Sample results are tabulated
below:
|
Sample
ID
|
TYPE
|
Azimuth
|
WIDTH
(m)
|
Ag
ppm
|
Pb
%
|
Zn
%
|
Ag
Eq. ppm
|
Structure
|
DIP_DIR
|
DIP
|
|
3879
|
Chip
|
350
|
1.5
|
400
|
0.876
|
0.929
|
420
|
Breccia
|
20
|
80
|
|
3883
|
Chip
|
350
|
0.9
|
77
|
0.342
|
0.287
|
91
|
Fault
|
0
|
72
|
|
3881
|
Chip
|
7
|
1.8
|
25
|
0.137
|
0.127
|
32
|
Contact
|
345
|
78
|
|
3878
|
Chip
|
13
|
0.9
|
5
|
0.306
|
0.399
|
29
|
Veinlets
|
0
|
85
|
|
3882
|
Chip
|
338
|
1.8
|
17
|
0.18
|
0.074
|
24
|
Veinlets
|
350
|
65
|
|
3880
|
Chip
|
5
|
1.9
|
6
|
0.132
|
0.102
|
14
|
Veinlets
|
345
|
65
|
Mapping
identified a vein system trending in a roughly east-west direction
at the Pacamayo zone ("Veta Pacamayo"). The vein system measures
approximately 175 meters in width south to north in the tunnel and
is situated 1.3 kilometers north of the Pulacayo resource and 5km
south of Paca resource. Highlights of the tunnel chip samples taken
in Veta Pacamayo include 420g/t AgEq* over 1.5 meters and 91g/t
AgEq over 0.9 meters.
The
Pulacayo TVS (Veta Pulacayo) that hosts the Company’s
indicated silver resource of 30.4 million oz @ 455g/t and inferred
resource of 6.3 million oz at 406 g/t likewise trends roughly
east-west, indicating that the Veta Pacamayo represents a parallel
system that has seen very little exploration to date.
Geological
mapping also identified a transition in the intensity of alteration
(argillic-style) along the San Leon tunnel. Highest intensity
alteration occurs in the Veta Pulacayo, and Veta Pacamayo areas and
coincides with the highest observed chip sample silver
values.
58
(*)
Silver equivalent is calculated as follows: Ag Eq.(g/t) = Ag
(g/t)*89.2%+(Pb% *(US$0.94/ lb. Pb /14.583 Troy oz/lb./US$16.50 per
Troy oz. Ag)*10,000*91.9%) + (Zn% *(US$1.00/lb. Zn/14.583 Troy
oz/lb./US$16.50 per Troy oz. Ag)*10,000*82.9). This calculation
incorporates metallurgical recoveries from test work completed for
the Pulacayo Project in 2013.
In
September 2020 geological mapping was conducted in the Pero area of
the Pulacayo Project. Pero is located to the southeast of the TVS
that hosts the Pulacayo deposit. Geological mapping and surface
sampling identified an area of silver bearing surface
mineralization of up to 200 g/t silver several hundreds of meters
south of the projected east-west TVS trend, suggesting that the TVS
was offset southward in this portion of the system where strong
alteration can be observed at surface covering 250 meters by 100
meters wide. This reinterpreted surface projection of the TVS
coincides with some historic Spanish workings in that area of
property that date back to the 16th Century. Highlights of assay
results from recent surface samples at Pero are tabulated
below:
|
Sample ID
|
Type
|
Azimuth
|
Width (m)
|
Ag (g/t)
|
Zn%
|
Pb%
|
|
1313
|
Chip
|
210
|
3
|
200
|
0.1
|
0.1
|
|
1314
|
Chip
|
195
|
1.2
|
200
|
0.1
|
0.01
|
|
1295
|
Chip
|
340
|
3
|
164
|
0.0164
|
0.0164
|
|
1297
|
Chip
|
320
|
1.4
|
132
|
0.0132
|
0.0132
|
|
1315
|
Chip
|
200
|
2.9
|
100
|
0.01
|
0.01
|
|
1301
|
Chip
|
240
|
4
|
72
|
0.0072
|
0.0072
|
|
1303
|
Chip
|
200
|
6.4
|
67
|
0.0067
|
0.0067
|
|
1323
|
Chip
|
20
|
4
|
50
|
0.005
|
0.005
|
|
1304
|
Chip
|
150
|
3.7
|
46
|
0.0046
|
0.0046
|
2021
Diamond Drilling
In
December 2020 the Company commenced a 940 meter diamond drilling
program at the Pero target within its Pulacayo Project in Bolivia.
Pero is located at the easternmost portion of the Pulacayo deposit
and is the least understood area geologically. Field work in 2020
identified potential structural remobilization in this area that
might explain the erratic nature of mineralization within the TVS
as it occurs in this area of the property. A summary of results
from this drilling is tabulated below:
|
BHID
|
From (m)
|
To (m)
|
Length (m)
|
Ag (g/t)
|
Pb %
|
Zn %
|
AgEq* (g/t)
|
|
PUD285
|
30.6
|
44.6
|
14.0
|
43
|
0.19
|
0.02
|
46
|
|
PUD
285
|
143.0
|
191.0
|
48.0
|
10
|
0.11
|
0.17
|
23
|
|
PUD
286
|
99.0
|
124.0
|
25.0
|
18
|
0.33
|
0.09
|
32
|
|
PUD
286
|
148.0
|
152.0
|
4.0
|
393
|
3.79
|
0.88
|
518
|
|
PUD
286
|
174.0
|
183.0
|
9.0
|
20
|
0.13
|
0.05
|
25
|
|
PUD
287
|
56.0
|
78.0
|
22.0
|
43
|
0.23
|
0.02
|
48
|
|
PUD
287
|
127.0
|
139.0
|
12.0
|
15
|
0.01
|
0.01
|
15
|
*Ag Eq.
= Silver Equivalent (Recovered) = (Ag g/t*89.2%)+((Pb%*(US$0.95/lb.
Pb/14.583 Troy oz./lb./US$17 per Troy oz.
Ag)*(10,000*91.9%))+((Zn%*(US$1.16/lb. Zn/14.583 Troy oz./lb./US$17
per Troy oz. Ag)*(10,000*82.9%)). Sulphide zone metal recoveries of
89.2% for Ag, 91.9% for Pb, and 82.9% for Zn were used in the
Silver Equivalent (Recovered) equation and reflect metallurgical
testing results disclosed previously for the Pulacayo Deposit.
Reported widths are intercepted core lengths and not true widths,
as relationships with intercepted structures and contacts vary.
Based on core-angle measurements, true widths range from 75% to 85%
of the reported core length.
During
the year ended December 31, 2020, the Company incurred total costs
of $2,357,534 (2019 - $1,474,026; 2018 - $898,650) for the Pulacayo
Project including for $1,767,089 (2019 - $964,716; 2018 - $51,112)
for geological and engineering services, $584,712 (2019 - $503,071;
2018 - $847,538) for personnel, legal, general and administrative
expenses and $5,733 (2019 - $6,239, 2018 - $Nil) for fees and
permits.
59
Planning Activities
The
Company’s objectives in 2021 are to drill and expand the
Pulacayo silver resource base which open to the west and at depth,
as well as drill district-scale targets (Paca, Al Abra, Pero,
Pacamayo) and to increase investor awareness.
The
Company’s 2021 Pulacayo objectives are:
(1)
Complete district
geological mapping over entire property;
(2)
Complete induced
polarization (geophysics) survey over the entire
property;
(3)
Evaluate field data
to generate drilling targets over property; and
(4)
Commence diamond
drilling program testing priority targets on property.
GIBELLINI PROJECT, NEVADA, U.S.A.
The
Company’s U.S.-based asset is its interest in the Gibellini
Project. The Company holds a 100% interest in the Gibellini Project
by way of a lease agreement and staked claims. Claims are in the
name of the Company’s indirect, wholly-owned Nevada
subsidiaries, VC Exploration (US), Inc. (“VC
Exploration”) and Nevada Vanadium, LLC (“Nevada
Vanadium”).
Project Location
The
Gibellini Project consists of a total of 555 unpatented lode mining
claims that includes: the Gibellini group of 40 claims, the VC
Exploration group of 105 claims, the Bisoni group of 201 claims and
the Company group of 209 claims. The Gibellini Project is located
in Eureka County, Nevada, as well as 28 of the Bisoni group of
claims, with the remaining 173 claims extending southwest into Nye
County, Nevada. They are located approximately 25 miles south of
the town of Eureka and are easily accessed from US Highway 50 to a
paved road that becomes a graded, gravel road.
The
Gibellini Project is situated on the south east flank of the Fish
Creek Range in the Fish Creek Mining District, about 25 miles south
of Eureka, Nevada and is accessed by dirt road extending westward
from State Route 379.
History
The
Gibellini group of claims were acquired on June 22, 2017, through
leasehold assignments from the claimant and then-holder of the
Gibellini mineral claims (the “Gibellini Lessor”) and
includes an area of approximately 771 acres. Under the Gibellini
mineral lease agreement (the “Gibellini MLA”), the
Company leased this core group of claims, which originally
constituted the entire Gibellini Project, by, among other things,
agreeing to pay to the Gibellini Lessor annual advance royalty
payments. These payments are tied, based on an agreed formula not
to exceed US$120,000 per year, to the average vanadium pentoxide
price of the prior year (each an “Advance Royalty
Payment”). Upon commencement of production, the obligation to
make Advance Royalty Payments will cease and the Company will
instead maintain its acquisition through lease of the Gibellini
group of claims by paying to the Gibellini Lessor, a 2.5% net
smelter return royalty (the “Gibellini NSR Payments”)
until a total of US$3 million is paid. Thereafter, the Gibellini
NSR will be reduced to 2% over the remaining life of the mine (and
referred to thereafter, as “Production Royalty
Payments”). Upon commencement of production, any Advance
Royalty Payments that have been made will be deducted as credits
against the Gibellini NSR Payments or Production Royalty Payments,
as applicable. The lease is for a term of 10 years, expiring on
June 22, 2027, which can be extended for an additional 10 years, at
the Company’s option.
On
April 19, 2018, the Gibellini MLA was amended to grant the Company
the option, at any time during the term of the Gibellini MLA, which
ends on June 22, 2027, to require the Gibellini Lessor to transfer
its title over all of the leased mining claims (excluding four
claims which will be retained by the Gibellini Lessor and which
contain minimal resource) to the Company in exchange for
USD1,000,000, which will be deemed an Advance Royalty
Payment.
The
Company also entered into a lease agreement to acquire 10
unpatented lode claims totaling approximately 207 gross acres (the
“Former Louie Hill Claims”) from their holders (the
“Former Louie Hill Lessors”) on July 10, 2017 (the
“Louie Hill MLA”). The Former Louie Hill Claims were
located approximately 1600 feet south of the Gibellini group of
claims. The Former Louie Hill Claims were subsequently abandoned by
the Former Louie Hill Lessors, and on March 11 and 12, 2018, the
Company staked the area within and under 17 new claims totaling
approximately 340 gross acres, which now collectively comprise the
expanded Louie Hill group of claims (the “Current Louie Hill
Claims”).
60
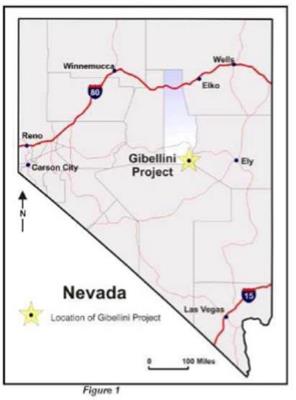
|
On
October 22, 2018, the Company entered into a royalty agreement (the
“Royalty Agreement”) with the Former Louie Hill Lessors
that replaced, on substantially similar terms, the Louie Hill MLA.
The Royalty Agreement provides for payment by the Company to the
Former Louie Hill Lessors of both advance royalty payments and net
smelter return royalty payments. As with the Gibellini MLA, the
advance royalty payments are calculated based on an agreed formula
relative to the average vanadium pentoxide price for the prior
year, for a total amount not to exceed US$28,000 per year (the
“Louie Hill Advance Royalty Payments”). Upon
commencement of production, the obligation to make Louie Hill
Advance Royalty Payments will be replaced by a 2.5% net smelter
return royalty (the “Louie Hill NSR”) payable on
vanadium pentoxide produced from the area of the Former Louie Hill
Claims contained within the Current Louie Hill Claims.
The
Company may purchase three-fifths of the Louie Hill NSR at any time
for US$1 million, leaving the total Louie Hill NSR payable by the
Company at 1.0% for the remaining life of the mine. Any Louie Hill
Advance Royalty Payments that have been made at the time of the
commencement of production will be deducted as credits against
future payments under the Louie Hill NSR. The payments under the
Royalty Agreement will continue for an indefinite period and will
be payable as long as the Company, its subsidiaries, or any of
their permitted successors or assigns holds a valid and enforceable
mining concession over the area.
|
On
December 5, 2017, the Company announced that it had significantly
expanded the land position at the Gibellini Project, by staking a
total of 198 new claims immediately adjacent to the Gibellini claim
group covering 4091 acres that are sufficient to enable future
vanadium mining, processing and extraction.
On
November 20, 2017, the Company filed an independent technical
report titled “
Gibellini
Project Nevada, USA NI 43-101 Technical Report
” with
an effective date of November 10, 2017 (the “2017 Gibellini
Report”) prepared by the Wood Group. The 2017 Gibellini
Report was filed with Canadian securities regulatory authorities
and is available under the Company’s SEDAR profile at
www.sedar.com
.
On
February 15, 2018, the Company indirectly acquired an additional
105 unpatented lode mining claims located adjacent to its existing
Gibellini Project in Nevada, USA through the indirect acquisition
of VC Exploration, by paying a total of $335,661 in cash and
issuing the equivalent of 500,000 common share purchase warrants to
arm’s-length, private parties.
On June
25, 2018, the Company filed a technical report titled
“
Gibellini Project Eureka
County, Nevada, NI 43-101 Technical Report on Preliminary Economic
Assessment
” prepared by Mr. Kirk Hanson, P.E.,
Technical Director, Open Pit Mining; Mr. Edward J.C. Orbock III, RM
SME, Principal Geologist and US Manager of Consulting; Mr. Edwin
Peralta, P.E., Senior Mining Engineer; and Mr. Lynton Gormely,
P.Eng., Consultant Metallurgist of Wood Group (the “2018
Gibellini PEA”). The 2018 Gibellini PEA has an effective date
of May 29, 2018 and is available under the Company’s SEDAR
profile at
www.sedar.com
.
Each of the authors of the 2018 Gibellini PEA are
“independent” Qualified Persons within the meaning of
NI 43-101.
On
August 24, 2020, the Company announced it had commenced the
acquisition of the Bisoni Project from CellCube. As consideration
for the acquisition of the Bisoni Project under the Bisoni APA, the
Company issued the Bisoni APA Shares and paid $200,000 cash to
CellCube. The Bisoni APA Shares were subject to a Canadian
statutory four month hold period that expired on January 19, 2021.
Additionally, subject to TSX approval, if, on or before December
31, 2023, the price of European vanadium pentoxide on the Metal
Bulletin (or an equivalent publication) exceeds US$12 a pound for
30 consecutive days, the Company will issue to CellCube additional
Common Shares with a value of $500,000, calculated based upon the 5
day volume weighted average price of the Common Shares immediately
following the satisfaction of the vanadium pentoxide pricing
condition. The acquisition of the Bisoni Project was completed on
September 18th, 2020. The expanded Bisoni group of claims is
located within the same formation and lithologic units as the
Gibellini group of claims. The general geology in this area is
considered to be similar to the Gibellini group of
claims.
In the
three months ended September 30, 2020, the Company expanded the
land position at the Gibellini Project, by staking a total 32 new
claims adjacent to the project.
61
The
Gibellini Project is situated entirely on public lands that are
administered by the BLM. No easements or rights of way are required
for access over public lands. Rights-of-way would need to be
acquired for future infrastructure requirements, such as pipelines
and powerlines.
Resources
On June
25, 2018, the Company filed the 2018 Gibellini PEA, which provides
an updated mineral resource estimate for the Gibellini
Project.
The
2018 Gibellini PEA replaces the 2017 Gibellini Report. The 2018
Gibellini PEA is preliminary in nature and includes inferred
mineral resources that are too speculative geologically to have
economic considerations applied to them that would enable them to
be categorized as mineral reserves. There is no certainty that the
2018 Gibellini PEA results will be realized. Mineral resources are
not mineral reserves and do not have demonstrated economic
viability.
The
2018 Gibellini PEA disclosed an estimated 7.94 million tons at a
weighted average grade of 0.314% vanadium pentoxide
(“V
2
O
5
”) in the
measured category and 15.02 million tons at a weighted average
grade of 0.271% V
2
O
5
in the Indicated
category leading to a total combined measured and indicated mineral
resource of 22.95 million tons at a weighted average grade of
0.286% V
2
O
5
. Total contained
metal content of the measured and indicated mineral resources is
131.34 million pounds V
2
O
5
. The inferred
mineral resource estimate is 14.97 million tons at a weighted
average grade of 0.175% V
2
O
5
. The total
contained metal content of the inferred mineral resource estimate
is 52.30 million pounds V
2
O
5
. The table below
contains a summary of the Gibellini deposit mineral resource
estimate (the “Gibellini Deposit Mineral Resource
Estimate”), which is derived from the 2018 Gibellini
PEA:
Gibellini Deposit Mineral Resource Estimate***
|
Confidence Category
|
Domain
|
Cut-off V
2
O
5
(%)
|
Tons (Mt)
|
Grade V
2
O
5
(%)
|
Contained V
2
O
5
(Mlb)
|
|
Measured
|
Oxide
|
0.101
|
3.96
|
0.251
|
19.87
|
|
Transition
|
0.086
|
3.98
|
0.377
|
29.98
|
|
|
Indicated
|
Oxide
|
0.101
|
7.83
|
0.222
|
34.76
|
|
Transition
|
0.086
|
7.19
|
0.325
|
46.73
|
|
|
Total Measured and Indicated
|
|
|
22.95
|
0.286
|
131.34
|
|
Inferred
|
Oxide
|
0.101
|
0.16
|
0.170
|
0.55
|
|
Transition
|
0.086
|
0.01
|
0.180
|
0.03
|
|
|
Reduced
|
0.116
|
14.80
|
0.175
|
51.72
|
|
|
Total Inferred
|
|
|
14.97
|
0.175
|
52.30
|
***Notes:
1.
The Qualified Person for the Gibellini Deposit Mineral Resource
Estimate is Mr. E.J.C. Orbock III, RM SME, an employee of the Wood
Group of companies. The Gibellini Deposit Mineral Resource Estimate
has an effective date of May 29, 2018.
2.
Mineral resources that are not mineral reserves do not have
demonstrated economic viability.
3.
Mineral resources are reported at various cut-off grades for oxide,
transition, and reduced material.
4.
Mineral resources are reported within a conceptual pit shell that
uses the following assumptions: mineral resource V
2
O
5
price:
$14.64/lb.; mining cost: $2.21/ton mined; process cost: $13.62/ton;
G&A cost: $0.99/ton processed; metallurgical recovery
assumptions of 60% for oxide material, 70% for transition material
and 52% for reduced material; tonnage factors of 16.86 ft3/ton for
oxide material, 16.35 ft3/ton for transition material and 14.18
ft3/ton for reduced material; royalty: 2.5% net smelter return
(NSR); shipping and conversion costs: $0.37/lb. An overall 40º
pit slope angle assumption was used.
5.
Rounding as required by reporting guidelines may result in apparent
summation differences between tons, grade and contained metal
content. Tonnage and grade measurements are in US units. Grades are
reported in percentages.
Louie Hill Deposit
The
Louie Hill deposit lies approximately 1,600 ft south of the
Gibellini deposit.
The
2018 Gibellini PEA provides an inferred mineral resource of 7.52
million tons at a weighted average grade of 0.276% dium pentoxide
(V
2
O
5
). The oxidation
domains were not modeled. The total contained metal content of the
estimate is 41.49 million pounds V
2
O
5
. The table below
summarizes the Louie Hill deposit mineral resource estimate (the
“Louie Hill Deposit Mineral Resource
Estimate”):
62
Louie Hill Deposit Mineral Resource Estimate***
|
Confidence Category
|
Cut-off V
2
O
5
(%)
|
Tons (Mt)
|
Grade V
2
O
5
(%)
|
Contained V
2
O
5
(Mlb)
|
|
Inferred
|
0.101
|
7.52
|
0.276
|
41.49
|
***Notes:
1.
The Qualified Person for the Louie Hill Deposit Mineral Resource
Estimate is Mr. E.J.C. Orbock III, RM SME, an employee of the a
Wood Group of companies . The Louie Hill Deposit Mineral Resource
Estimate has an effective date of May 29, 2018. The resource model
was prepared by Mr. Mark Hertel, RM SME.
2.
Mineral resources that are not mineral reserves do not have
demonstrated economic viability.
3.
Oxidation state was not modeled.
4.
Mineral resources are reported within a conceptual pit shell that
uses the following assumptions: mineral resource V
2
O
5
price: $14.64/lb;
mining cost: $2.21/ton mined; process cost: $13.62/ton; G&A
cost: $0.99/ton processed; metallurgical recovery assumptions of
60% for mineralized material; tonnage factors of 16.86 ft3/ton for
mineralized material, royalty: 2.5% net smelter return (NSR);
shipping and conversion costs: $0.37/lb. For the purposes of the
Louie Hill Deposit Mineral Resource Estimate, an overall 40º
slope angle assumption was used.
5.
Rounding as required by reporting guidelines may result in apparent
summation differences between tons, grade and contained metal
content. Tonnage and grade measurements are in US units. Grades are
reported in percentages.
A total
of 280 drill holes (about 51,265 ft) have been completed on the
Gibellini Project since 1946, comprising 16 core holes (4,046 ft),
169 rotary drill holes (25,077 ft; note not all drill holes have
footages recorded) and 95 reverse circulation holes (22,142
ft).
The
vanadium-hosted argillite unit ranges from 175 to over 300 ft thick
and overlies gray mudstone and black shales. The argillite has been
oxidized to various hues of yellow and orange to a depth of 100 ft
and is believed to have been part an overall homogenous black shale
unit. Alteration (oxidation) of the rocks is classified as one of
three oxide codes: oxidized, transitional, and
reduced.
Regional Geology
The
Gibellini Project occurs on the east flank of the southern part of
the Fish Creek Range. The southern part of the Fish Creek Range
consists primarily of Paleozoic sedimentary rocks of Ordovician to
Mississippian Age of the eastern carbonate, western siliceous, and
overlap assemblages. Tertiary volcanic rocks crop out along the
eastern edge of the range and Tertiary to Quaternary sedimentary
rocks and alluvium bound the range to the west and east in the
Antelope and Little Smoky valleys, respectively. North to
northeast-trending faults dominate in the region, particularly
along the eastern range front.
The
Gibellini Project lies within the Fish Creek Mining District. The
limestone hosted Gibellini Manganese-Nickel mine and the Gibellini
and Louie Hill black-shale hosted vanadium deposits are the most
significant deposits in the district, and all occur within the
Gibellini Project boundary. The Bisoni-McKay black-shale hosted
vanadium deposit occurs several miles south of the Gibellini
Project. A fluorite–beryl prospect and
silver–lead–zinc vein mines with minor production are
also reported to occur in the district. No significant work has
been conducted on the Gibellini Project since 2015, with some minor
prospecting completed in October of 2018. The Company has not
completed trenching or drilling activities since its acquisition of
the Gibellini Project.
Project Geology
The
Gibellini Project deposit occurs within an allocthonous fault wedge
of organic-rich siliceous mudstone, siltstone, and chert, which
forms a northwest trending prominent ridge. These rocks are mapped
as the Gibellini facies of the Woodruff Formation of Devonian Age
(Desborough et al., 1984). These rocks are described by Noranda as
thin-bedded shales, very fissile and highly folded, distorted and
fractured (Condon, 1975). In general, the beds strike
north-northwest and dip from 15 to 50° to the west. Outcrops
of the shale are scarce except for along road cuts and trenches.
The black shale unit which hosts the vanadium resource is from 175
ft to over 300 ft thick and overlies gray mudstone. The shale has
been oxidized to various hues of yellow and orange up to a depth of
100 ft.
The
Woodruff Formation is interpreted to have been deposited as
eugeosynclinal rocks (western assemblage) in western Nevada that
have been thrust eastward over miogeosynclinal rocks (eastern
assemblage) during the Antler Orogeny in late Devonian
time.
The
Gibellini facies is structurally underlain by the Bisoni facies of
the Woodruff Formation. The Bisoni unit consists of dolomitic or
argillaceous siltstone, siliceous mudstone, chert, and lesser
limestone and sandstone (Desborough and others, 1984).
Structurally
underlying the Woodruff Formation are the coarse clastic rocks of
the Antelope Range Formation. These rocks are interpreted to have
been deposited during the Antler Orogeny and are attributed to the
overlap assemblage.
63
The
Louie Hill deposit is located in the same formation and lithologic
units as the Gibellini deposit. The general geology in this area is
thought to be similar to the Gibellini deposit area.
The
ridge on which the Gibellini Manganese-Nickel mine (Niganz mine)
lies is underlain by yellowish-gray, fine-grained limestone. This
limestone is well bedded with beds averaging 2 ft thick. A
fossiliferous horizon containing abundant Bryozoa crops out on the
ridge about 100 ft higher than the mine. The lithologic and faunal
evidence suggest that this unit is part of the Upper Devonian
Nevada Limestone. Beds strike at N18E to N32W and dip at 18 degrees
to 22 degrees west. The manganese–nickel mineralization
occurs within this unit. Alluvium up to 10 ft thick overlies part
of the area and is composed mostly of limy detritus from the high
ridge north of the mine. Minor faulting has taken place in the
limestone.
Deposit Descriptions
Gibellini Deposit
The
Gibellini deposit occurs within organic-rich siliceous mudstone,
siltstone, and chert of the Gibellini facies of the Devonian Age
Woodruff Formation.
In
general, the beds strike north-northwest and dip from 15º to
50º to the west. The black shale unit which hosts the vanadium
Mineral Resource is from 175 ft to over 300 ft thick and overlies
gray mudstone of the Bisoni facies. The shale has been oxidized to
various hues of yellow and orange up to a depth of 100
ft.
Alteration
(oxidation) of the rocks is classified as one of three oxide codes:
oxidized, transitional, and reduced. Vanadium grade changes across
these boundaries. The transitional zone reports the highest average
grades and RMP geologists interpreted this zone to have been
upgraded by supergene processes.
Louie Hill
The
Louie Hill deposit lies approximately 500 m south of the Gibellini
deposit, being separated from the latter by a prominent drainage.
Mineralization at Louie Hill is hosted by organic-rich siliceous
mudstone, siltstone, and chert of the Gibellini facies of the
Devonian Woodruff Formation and probably represents a dissected
piece of the same allochthonous fault wedge containing the
Gibellini deposit.
Mineralized
beds cropping out on Louie Hill are often contorted and shattered
but in general strike in a north–south direction, and dip to
the west 0 to 40º.
Rocks
underlying the Louie Hill Deposit consist of mudstone, siltstone
and fine-grained sandstone probably of Mississippian age (Webb
and/or Chainman Formations). Oxidation of the mineralized rocks has
produced light-colored material with local red and yellow bands of
concentrated vanadium minerals.
Bisoni-McKay
The
overall geologic interpretation is largely based on the Hose, 1983
interpretation of the Bisoni McKay area. The Woodruff and
underlying Devils Gate Limestone contact relationship on the
project is mapped as a fault, perhaps part of which may be a slide
block plane. In any case, at first glance both formations appear to
be folded in sequence. Prior to Tertiary faulting the Devils Gate
Limestone, the overlying Woodruff Formation and perhaps the
Mississippian strata above, tentatively identified as the basal
unit of the Webb Fm, appear to have been folded as a unit as
exemplified by the north-trending fold and an accompanying fault
that extends along the west side of the drill grid in Area A North.
The fold may be due to drag along the north-south west fault
trend.
In the
project area the late Devonian Gibellini facies and the greater
Woodruff Formation are typically preserved and exposed in
down-dropped fault blocks.. In the vicinity of the historic
Bisoni-Mckay deposit the Woodruff Formation is juxtaposed with the
older, massive outcrops of Devonian Devils Gate Limestone. The
north to northwest concealed fault has juxtaposed the Devils Gate
limestone against the Mississippian Webb Fm that has resulted
placing the Woodruff rocks in fault contact with the younger Webb
Fm, which is younger than the Woodruff Formation.
Activities and Developments
2018
On
February 15, 2018, the Company indirectly acquired an additional
105 unpatented lode mining claims located adjacent to its existing
Gibellini claims through the indirect acquisition of VC Exploration
by paying a total of $335,661 in cash and issuing the equivalent of
500,000 common share purchase warrants to arm’s-length,
private parties.
On
April 19, 2018, the Gibellini MLA was amended to grant the Company
the option, at any time during the term of the agreement, to
require the Gibellini Lessor to transfer their title over all of
the leased mining claims (excluding four claims which will be
retained by the Gibellini Lessor and which contain minimal
resource) to the Company in exchange for USD$1,000,000, to be paid
as an advance royalty payment.
On May
9, 2018, the Company submitted its Management’s POO to the
BLM and the Reclamation Permit Application to the
BMRR.
64
On May
29, 2018, the Company received results of the 2018 Gibellini PEA
for the Gibellini Project. The 2018 Gibellini PEA reported an
after-tax cumulative cash flow of $601.5 million, an internal rate
of return of 50.8%, a net present value of $338.3 million at a 7%
discount rate and a 1.72 years payback on investment from start-up
assuming an average vanadium pentoxide price of $12.73 per pound.
As of May 29, 2018, the price of vanadium pentoxide was $14.20 per
pound according to
www.asianmetal.com
.
The 2018 Gibellini PEA was prepared by Amec Foster Wheeler E&C
Services Inc, part of the Wood Group, and is based on the NI 43-101
compliant resource calculations reported above.
Highlights of the 2018 Gibellini PEA (after tax)
|
Internal
rate of return
|
50.8%
|
|
Net
present value (“NPV”)
|
US$338.3
million at 7% discount rate
|
|
Payback
period
|
1.72
years
|
|
Average
annual production
|
9.65
million lbs V
2
O
5
|
|
Average
V
2
O
5
selling
price
|
US$12.73
per lb
|
|
Operating
cash cost
|
US$4.77
per lb V
2
O
5
|
|
All-in
sustaining costs*
|
US$6.28
per lb V
2
O
5
|
|
Breakeven
price**
|
US$7.76
per lb V
2
O
5
|
|
Initial
capital cost including 25% contingency
|
US$116.76
million
|
|
Average
grade
|
0.26%
V
2
O
5
|
|
Strip
ratio
|
0.17
waste to leach material
|
|
Mining
operating rate
|
3.4
million tons (leach material and waste) per year
|
|
Average
V
2
O
5
recovery through
Direct Heap Leaching
|
62%
|
|
Life of
mine
|
13.5
years
|
|
* includes selling costs, royalties, operating cash cost,
reclamation, exploration and sustaining capital costs.
|
|
|
**includes selling costs, royalties, operating cash costs, taxes
(local, state, and federal), working capital, and sustaining and
capital costs.
|
|
The
2018 Gibellini PEA is preliminary in nature and includes inferred
mineral resources that are considered too speculative geologically
to have the economic considerations applied to them that would
enable them to be categorized as mineral reserves, and there is no
certainty that the 2018 Gibellini PEA will be realized. Mineral
resources are not mineral reserves and do not have demonstrated
economic viability.
Sensitivity Analysis
The
tables below show the sensitivity analysis to the vanadium
pentoxide price, grade, and to the 2018 Gibellini PEA capital cost
and operating costs. This sensitivity analysis indicates strong
project economics even in very challenging conditions, and that the
project is well positioned to benefit from the current rising
vanadium price environment.. A 20% increase in the vanadium price
relative to the base case translates to a US$491.3 million
after-tax NPV at a 7% discount rate.
65
Sensitivity Analysis
|
V
2
O
5
price
change
|
V
2
O
5
price
US$/lb
|
After-taxIRR
|
After-tax
NPVUS$M @ 7%
|
After-taxcashflowUS$M
|
|
30%
|
16.55
|
69%
|
568.0
|
996.0
|
|
20%
|
15.28
|
63%
|
491.3
|
864.4
|
|
10%
|
14.00
|
57%
|
415.2
|
733.2
|
|
Base
price
|
12.73
|
51%
|
338.3
|
600.4
|
|
-10%
|
11.46
|
44%
|
261.0
|
467.2
|
|
-20%
|
10.18
|
36%
|
183.1
|
333.2
|
|
-30%
|
8.91
|
26%
|
103.9
|
196.9
|
|
V
2
O
5
gradechange
|
V
2
O
5
grade
|
After-taxIRR
|
After-tax
NPVUS$M @ 7%
|
After-taxcashflowUS$M
|
|
30%
|
0.34%
|
68%
|
554.4
|
972.8
|
|
20%
|
0.31%
|
63%
|
482.4
|
849.0
|
|
10%
|
0.28%
|
57%
|
410.7
|
725.4
|
|
Base
grade
|
0.26%
|
51%
|
338.3
|
600.4
|
|
-10%
|
0.23%
|
44%
|
265.6
|
475.0
|
|
-20%
|
0.21%
|
37%
|
192.2
|
348.9
|
|
-30%
|
0.18%
|
28%
|
118.3
|
221.6
|
|
Capexchange
|
CapexUS$M
|
After-taxIRR
|
After-tax
NPVUS$M @ 7%
|
After-taxcashflowUS$M
|
|
30%
|
151.8
|
40%
|
307.2
|
564.3
|
|
20%
|
140.1
|
43%
|
317.6
|
576.3
|
|
10%
|
128.4
|
47%
|
328.0
|
588.4
|
|
Base
Capex
|
116.8
|
51%
|
338.3
|
600.4
|
|
-10%
|
105.1
|
55%
|
348.6
|
612.5
|
|
-20%
|
93.4
|
61%
|
358.9
|
624.6
|
|
-30%
|
81.7
|
67%
|
369.3
|
636.8
|
|
Opexchange
|
OpexUS$M
|
After-taxIRR
|
After-tax
NPVUS$M @ 7%
|
After-taxcashflowUS$M
|
|
30%
|
6.20
|
45%
|
257.9
|
450.2
|
|
20%
|
5.72
|
47%
|
284.8
|
500.3
|
|
10%
|
5.25
|
49%
|
311.6
|
550.4
|
|
Base
Capex
|
4.77
|
51%
|
338.3
|
600.4
|
|
-10%
|
4.29
|
53%
|
364.8
|
650.0
|
|
-20%
|
3.82
|
55%
|
390.7
|
698.4
|
|
-30%
|
3.34
|
56%
|
416.0
|
745.4
|
66
Mining & Processing
Mining
at the Gibellini and Louie Hill deposits is planned to be a
conventional open pit mine utilizing a truck and shovel fleet
comprised of 100-ton trucks and front-end loaders. Average mine
production during the 13.5 year mine life is 3.4 million tons of
leach material (3 million tons) and waste (0.4 million tonnes) per
year at a strip ratio of 0.17. Mining is to be completed either
in-house or through contract, with the Company’s mining staff
overseeing the contracted mining operation and performing the mine
engineering and survey work if contract mining is
selected.
|
|
Oxide‘000
tons
|
Transition‘000
tons
|
Reduced‘000
tons
|
Grade%
V
2
O
5
|
Metal
containedV
2
O
5
(Mlb)
|
Metal
ProducedV
2
O
5
(Mlb)
|
|
YR
1
|
2,600
|
400
|
—
|
0.291
|
17.440
|
10.633
|
|
YR
2
|
2,400
|
600
|
—
|
0.278
|
16.690
|
10.480
|
|
YR
3
|
1,760
|
1,240
|
—
|
0.310
|
18.580
|
12.067
|
|
YR
4
|
650
|
2,350
|
—
|
0.372
|
22.320
|
15.217
|
|
YR
5
|
310
|
2,680
|
10
|
0.366
|
21.950
|
15.185
|
|
YR
6
|
2,240
|
750
|
10
|
0.315
|
18.920
|
11.928
|
|
YR
7
|
3,000
|
—
|
—
|
0.316
|
18.980
|
11.394
|
|
YR
8
|
1,910
|
700
|
380
|
0.189
|
11.310
|
7.085
|
|
YR
9
|
690
|
1,220
|
1,090
|
0.216
|
12.940
|
8.023
|
|
YR
10
|
110
|
370
|
2,520
|
0.208
|
12.480
|
6.898
|
|
YR
11
|
450
|
360
|
2,180
|
0.182
|
10.910
|
6.103
|
|
YR
12
|
50
|
140
|
2,820
|
0.166
|
9.980
|
5.349
|
|
YR
13
|
390
|
10
|
2,600
|
0.183
|
10.970
|
5.839
|
|
YR
14
|
1,710
|
—
|
—
|
0.195
|
6.670
|
4.096
|
|
Totals:
|
18,290
|
10,830
|
11,590
|
0.258
|
210.15
|
130.297
|
The
processing method envisioned for the Gibellini Project will be to
feed leach material from the mine via loader to a hopper that feeds
the crushing plant. The leach material will then be fed to an
agglomerator where sulfuric acid, flocculent and water will be
added to achieve adequate agglomeration. The agglomerated leach
material will be transported to a stacker on the leach pad, which
will stack the material to a height of 15 feet. Once the material
is stacked, solution will be added to the leach heap at a rate of
0.0025 gallons per minute per square foot. The solution will be
collected in a pond and this pregnant leach solution will be sent
to the process building for metal recovery where it will go through
solvent extraction and stripping processes to produce the vanadium
pentoxide and a secondary yellowcake uranium.
Vanadium Recoveries and Metallurgical Testing
Approximately
130.3 million pounds of V
2
O
5
and 336,000
pounds of uranium is expected to be produced from the Gibellini
Project heap leaching operations at an average vanadium recovery of
62% (oxide: 60%, transition: 70% and reduced: 52%). The heap
leaching is performed at ambient temperature and atmospheric
pressure without pre-roasting or other beneficiation process. The
pregnant leach solution is continuously collected with leach
material undergoing, on average, a 150-day heap-leaching cycle. The
table below summarizes the projected metallurgical recoveries used
in the 2018 Gibellini PEA for the three defined oxidation-type
domains.
|
Mill
Feed Material Type
|
Direct Leaching Recovery
|
|
Oxide
|
60%
|
|
Transition
|
70%
|
|
Reduced
|
52%
|
67
The
direct heap leach vanadium recovery estimates used in the 2018
Gibellini PEA were based on extensive metallurgical testing work
performed by SGS Lakefield Research Laboratories, Dawson Minerals
Laboratories, and McClelland Laboratories (“
McClelland
”). Samples were
selected from a range of depths within the deposit, representative
of the various types and styles of mineralization. Samples were
obtained to ensure that tests were performed on a sufficient sample
mass. The end results demonstrated low acid consumption (less than
100 lb acid consumption per ton leached) and high recovery through
direct leaching. Notable test results included the
following:
Acid Heap Leach Testing of a Gibellini Bulk Sample, McClelland,
September 4, 2013
A
series of trenches were excavated and approximately 18 tons of
material were sent to McClelland for pilot testing.
Solvent Extraction (SX) Test Work
Solvent
extraction (“
SX
”) processing test work was
conducted in 2013 to recover vanadium from sulfuric acid pregnant
leach solution (“
PLS
”) generated during pilot
column testing on bulk leach samples from the Gibellini Project.
Laboratory scale testing was conducted on select solutions
generated during the pilot SX processing, to optimize the SX
processing conditions. Additional laboratory scale testing was
conducted on the loaded strip solution generated during the pilot
SX testing, to evaluate methods for upgrading and purifying it to
levels that may be required for sale of a final vanadium bearing
product.
The
design parameters from this test work were:
1)
SX Extraction pH
Range 1.8 to 2.0
2)
Di-2-Ethyl Hexyl
Phosphoric Acid Concentration 0.45 M (~17.3% by weight)
Cytec
3)
923 Concentration
0.13 M (~5.4% by weight)
4)
The Organic Diluent
is Orform SX-12 (high purity kerosene)
5)
SO2 addition of 1.0
to 1.5 g/l
6)
Strip Solution
Sulfuric Acid Concentration 225 to 250 g/l SX
7)
Extraction
Efficiency ~97%
8)
SX Strip Efficiency
~98%
In
August of 2018, the Company received metallurgical results from its
technology partner, Northwest Non-Ferrous Metals Mining and Geology
Group Co., Ltd, (‘
NWME
”) from samples collected
during a site visit in March of 2018. Tests were performed at its
laboratory testing facilities located in Xi’an, China. NWME
utilized a SX processing method to recover vanadium from sulfuric
acid PLS generated by bottle roll and column test acid leaching on
Gibellini Project samples. The solution was reduced and then
precipitated using ammonia to make AMV. The AMV was calcined and
heated then cooled and pulverized. A vanadium pentoxide with 98.56
% purity content was produced. The assay for this work is shown
below:
|
V
2
O
5
%
|
SI %
|
Fe %
|
P %
|
S %
|
As %
|
Na2O %
|
K2O %
|
Al %
|
U %
|
|
98.56
|
0.0078
|
0.88
|
0.058
|
0.47
|
0.0026
|
0.43
|
0.052
|
0.22
|
0.0001
|
Uranium
content is less than 0.0001% which does not affect the
marketability of the product.
The PLS
was produced with very low deleterious elements which enabled using
an efficient SX process. The PLS V2O5 concentration was 1.15 gram
per liter and the Pregnant Strip Solution V
2
O
5
concentration was
39.61 grams per liter.
Overall Vanadium Recovery of Over 60% and Low Acid
Consumption
PLS was
produced from both bottle roll and column tests. Sulfuric acid was
added to the feed material with the bottle rolling for 1 hour, then
the open bottle was allowed to cure for 24 hours and water was
added to the bottle to attain the desired density (40%). Initial
samples were taken at 6 hours, 12 hours, 24 hours, 36 hours, 48
hours and then once a day until the bottle roll was
completed.
In
column tests, sulfuric acid was added to the feed material and the
material was allowed to cure for 24 hours before initiating the
leaching. Leaching was conducted by applying 108 grams per liter
acid solution over the material. PLS was collected every 24 hours
and samples were taken for vanadium analysis. All the tests were
performed at room temperature and at atmospheric pressure. The
results of the tests are given below:
|
Test
|
Leach Time
|
Vanadium Recovery %
|
Sulfuric Acid Consumed kg/t
|
|
Column
Test
|
21
days
|
70.74
|
100
|
|
Bottle
Roll Test - investigate the effect of the curing method and
increase of sulfuric acid addition on the vanadium
recovery
|
50
hours
|
62.8
|
150
|
|
Bottle
Roll Test - investigate addition of NWME prepared leaching agent on
the vanadium recovery
|
144
hours
|
66.5
|
100
|
|
Bottle
Roll Test - investigate the leaching of coarse feed (2mm) on the
vanadium recovery
|
216
hours
|
63.7
|
100
|
68
The
results of the bottle roll and column leach tests performed by NWME
largely validate the results of previous tests performed by
McClelland on the Gibellini Project bulk sample in 2013 (18 tons of
material).
The
NWME test samples were not agglomerated and were on short leach
time of 21 days for column tests and 5 days for bottle roll tests.
The Company studied both the NWME test and McClelland test in
detail and believe the results were consistent, whereby 70%
recovery can be achieved with longer leach cycle (over 100 days
McClelland vs 21 days NWME) and less acid consumption (50 kg of
acid per tonne of material McClelland vs 100 kg of acid per tonne
of material NWME).
A
summary of acid heap leach tests of a Gibellini Project bulk
sample, completed at McClelland, September 4, 2013 is tabulated
below:
|
Size
|
Test Type
|
Time (Days)
|
Vanadium Recovery %
|
Head Grade % V
2
O
5
|
Sulfuric Acid Consumed kg/t
|
|
50 mm
(2”)
|
Column,
open circuit
|
123
|
76.6
|
0.53
|
39.9
|
|
12.5
mm (1/2”)
|
Column,
open circuit
|
123
|
80.2
|
0.56
|
32.7
|
|
12.5
mm (1/2”)
|
Column,
closed circuit
|
230
|
68.3
|
0.51
|
38.1
|
|
12.5
mm (1/2”)
|
Column,
closed circuit
|
198
|
74.0
|
0.56
|
43.5
|
|
12.5
mm (1/2”)
|
Bottle
Roll
|
4
|
67.1
|
0.51
|
33.6
|
|
1.7 mm
(-10m)
|
Bottle
Roll
|
4
|
66.3
|
0.51
|
29.9
|
|
-75µ
|
Bottle
Roll
|
4
|
67.6
|
0.50
|
28.1
|
|
-75µ
|
Bottle
Roll
|
30
|
74.2
|
0.53
|
24.5
|
Representative Feed Grade with Benign Test Conditions that Can be
Replicated in Commercial Setting
The
leaching bottle roll and column tests were performed at room
temperature and at atmospheric pressure based on the Gibellini
Project’s representative grade from grab sampling method
across the width of the mineralization at various locations of the
Project. These samples are characterized in table
below:
|
Sample Number
|
Sample ID
|
Weight kg
|
Head Grade V
2
O
5
(%)
|
|
1
|
18-L6-28
|
17.0
|
0.665
|
|
2
|
18-L6-29
|
17.0
|
0.885
|
|
3
|
18-L6-30
|
12.5
|
0.370
|
|
4
|
18-L6-31
|
18.0
|
0.210
|
|
5
|
18-L6-32
|
13.5
|
0.420
|
|
6
|
18-L6-33
|
22.5
|
0.280
|
|
7
|
18-L6-34
|
19.0
|
0.315
|
|
8
|
18-L6-35
|
20.0
|
0.185
|
|
9
|
18-L6-36
|
18.0
|
0.165
|
|
10
|
18-L6-37
|
20.0
|
0.195
|
|
Total
|
|
177.5
|
|
For the
purpose of metallurgical testing, the samples were mixed to produce
a composite material with the average grade of 0.30% V
2
O
5
which is
representative of Gibellini Project resource grade. The composite
material was ground to -75 lm feed. The Company believes the test
conditions can easily be replicated in a commercial heap leach
setting with low technical and implementation risk.
Vanadium Mineralogy in Achieves Recovery at Room Temperature and
Atmospheric Pressure
NWME
performed detailed mineralogical analysis which included microscope
identification using a Carl Zeiss Axioskop, XRD analysis on Bruker
D8-A25 XRD, multi-element analysis, electron probe X-ray
microanalysis on JEOL JXA 8230, scanning electron microscopy/energy
dispersive X-ray spectroscopy analysis on Mineral Liberation
Analizer 650 and V element phase analysis. This mineralogical
analysis confirmed that the Gibellini Project resource has a high
percentage of independent vanadium minerals ("IVM") such as
kazakhstanite, shubnelite, sherwoodite, bokite, which can be
leached easily at room temperature and atmospheric pressure within
a short time frame.
NWME
noted the unique nature of the Gibellini Project samples with over
45% IVM versus numerous other typical black shale deposits which
they have encountered containing less than 10% IVM.
All of
the test work carried out on the material from the Gibellini
Project indicate that there is a two-stage leaching phenomenon in
Gibellini Project ore - approximately 50% of the vanadium leaches
in the first 96 hours (independent vanadium minerals), and the
remaining leaching approximately 15 to 20% occurs over a longer
time horizon.
69
Heap
leaching is the lowest-cost recovery method compared to roasting,
and pressured container VAC leaching; whereby capital costs can
compound to multiple times greater for the same throughput. The
Gibellini Project’s high IVM content is a key competitive
differentiator which places the deposit in the top tier of black
shale deposits in terms of pre-production capital cost required
based on NWME’s research. The mineralogical results of the
Gibellini Project ore as characterized by NWME’s test work is
shown in table below:
|
Mineral composition
|
Mineral content %
|
V content in minerals %
|
V distribution %
|
|
|
Independent
vanadium minerals
45.2%
of vanadium content
|
Kazakhstanite
|
0.15
|
40.91
|
19.77
|
|
Shubnelite
|
0.13
|
27.86
|
11.67
|
|
|
Sherwoodite
|
0.08
|
34.54
|
8.90
|
|
|
Bokite
|
0.03
|
36.51
|
3.53
|
|
|
Melanovanadite
|
0.01
|
41.27
|
1.33
|
|
|
Vanadium-bearing
layered aluminosilicate minerals
20.8%
of vanadium content
|
Sericite
|
8.59
|
0.57
|
14.63
|
|
Illite
|
5.58
|
0.28
|
5.03
|
|
|
Chlorite
|
0.81
|
0.44
|
1.14
|
|
|
Nacrite-palygorskite
|
0.70
|
-
|
-
|
|
|
Vanadium-bearing
layered iron oxide, sulfate 34% of vanadium content
|
Limonite
|
1.76
|
5.48
|
31.07
|
|
Strengite
|
0.64
|
0.49
|
1.01
|
|
|
Jarosite
|
0.48
|
1.24
|
1.92
|
|
|
Gangue
|
Quartz
|
75.88
|
-
|
-
|
|
Apatite
|
2.83
|
-
|
-
|
|
|
Potassium
feldspar
|
0.73
|
-
|
-
|
|
|
Dolomite
|
0.66
|
-
|
-
|
|
|
Carbonaceous
|
0.45
|
-
|
-
|
|
|
Rutile
|
0.25
|
-
|
-
|
|
|
Barite
|
0.04
|
-
|
-
|
|
|
Pyrite
|
0.20
|
-
|
-
|
|
|
Total
|
100.00
|
|
100.00
|
|
Low Carbonate Content Results in Low Acid Consumption.
NWME
detailed mineralogical analysis which included microscope
identification using a Carl Zeiss Axioskop, XRD analysis on Bruker
D8-A25 XRD, multi-element analysis, electron probe X-ray
microanalysis on JEOL JXA 8230, scanning electron microscopy/energy
dispersive X-ray spectroscopy analysis on Mineral Liberation
Analyzer 650 and V element phase analysis, confirmed the extremely
low carbonaceous content of the Gibellini Project's oxide and
transition samples. This explains the low acid consumption (less
than 50 kg per tonne) compared to other average black shale
deposits of 200 kg to 300 kg per tonne based on extensive NWME data
compilation. Given acid cost accounts for approximately 50% of the
Project’s operating expenses, the Gibellini Project's low
carbon content is a key competitive differentiator which places it
in the top tier of black shale deposits in terms of processing cost
based on NWME’s findings.
The
following table is a generalized comparison of the Gibellini
Project's deposit to a composite of typical black shale vanadium
deposits:
|
|
Gibellini Vanadium Deposit
|
Black Shale Series Vanadium Deposits
|
|
Host
Rock
|
Silica
State
|
Carbon
Siliceous Rocks with Mudstone
|
|
The
Mineral Composition
|
High
Silica, Low Aluminum and Low Carbonaceous. SiO2-78.40%; Al2O3 -
4.13%; T(C) - 0.47%
|
High
Silica, High Aluminum and High Carbonaceous. SiO2-62-93%; Al2O3
> 7%; T(C) > 10%
|
Capital and Operating Costs
The
projected capital costs for the Gibellini Project over a one and a
half year construction period and mine life average operating costs
are summarized in the two tables below. The capital cost includes
25% contingency or USD23.4 million.
70
Pre-Production Capital Cost
|
Cost
Description
|
Total
(US$000s)
|
|
Open Pit Mine
|
|
|
Open
pit mine development
|
1,412
|
|
Gibellini
incremental WRSF
|
212
|
|
Mobile
equipment
|
111
|
|
Infrastructure-On Site
|
|
|
Site
prep
|
2,431
|
|
Roads
|
1,391
|
|
Water
supply
|
2,007
|
|
Sanitary
system
|
61
|
|
Electrical –
on site
|
2,052
|
|
Communications
|
165
|
|
Contact
water ponds
|
174
|
|
Non-process
facilities – buildings
|
7,583
|
|
Process Facilities
|
|
|
Mill
feed handling
|
15,380
|
|
Heap
leach system
|
20,037
|
|
Process
plant
|
14,441
|
|
Off-Site Infrastructure
|
|
|
Water
system
|
4,495
|
|
Electrical supply
system
|
3,227
|
|
First
fills
|
860
|
|
Subtotal Total Direct Cost
|
76,039
|
|
Construction
indirect costs
|
4,254
|
|
Sales
tax / OH&P
|
4,236
|
|
EPCM
|
8,879
|
|
Total
Before Contingency
|
93,409
|
|
Contingency
(25%)
|
23,352
|
|
Total
Project Cost
|
116,761
|
Operating Costs
|
Total
Cash Operating Cost
|
US$
per Ton Leached
|
US$
per lb of V
2
O
5
Produced
|
|
G&A
|
0.99
|
0.31
|
|
Mining
Cost
|
2.72
|
0.85
|
|
Total
Processing Cost
|
11.54
|
3.61
|
|
Total
|
15.26
|
4.77
|
71
The
cash operating costs in the first half of the project covering
years 1-7 is US$3.59 per lb of V
2
O
5
produced and for
the years 8-14 is US$7.12 per lb of V
2
O
5
produced,
resulting in the weighted average cash cost of US$4.77 per lb of
V
2
O
5
produced. The
cash operating cost is lower in the first half of the project due
to processing higher grade material.
Engineering Procurement Construction Management
On
August 15, 2018, the Company issued a request for proposal (the
“RFP”) for engineering, procurement, construction and
management services (“EPCM”) from qualified bidders. In
December of 2018, the Company selected M3 Engineering &
Technology Corporation (“M3”) of Tucson, Arizona to
provide EPCM for the Gibellini Project in response to the RFP. M3
was selected for its specific experience in heap leach engineering,
and construction expertise in arid environments such as Nevada and
Arizona.
The
EPCM consists of three phases. Phase 1 includes updating and
simplifying previous basic engineering as well as mine design,
waste dump design, road design, borrow pit design, buildings and
infrastructure designs will not be substantially changed. Phase 2
will consist of procurement of the required equipment, services and
developing the detailed engineering design required to build the
project facilities. Phase 3 will outline construction management
services to build the facilities to accomplish the actual
work.
The
Company expects Phase 1 of the EPCM to be completed in 2020; Phase
2 to be completed in 2021; Phase 3, to be completed in 2022; and
the Gibellini Project wet commissioning is expected to be in
2023.
To try
to minimize technical and implementation risk, the Company is
working closely with its chosen technology partner, NWME, to fine
tune metallurgy, process design and engineering, and ensure maximum
vanadium recovery and high-grade vanadium pentoxide commercial
product on site. NWME owns and is currently operating the
world’s largest black-shale vanadium mine in China with an
environmentally friendly, hydrometallurgical leach processing
technology without the need of a pre-roasting step (see the
Company’s news release dated March 12, 2018, for more
details).
Big Sky Prospect (300m by 50m)
On
March 26, 2019, the Company announced via news release available on
SEDAR vanadium assay results from its Fall 2018 exploration
reconnaissance program on the Gibellini Project. The 155 assays are
taken from three prospective exploration areas all within 5
kilometers to existing Gibellini Project vanadium NI 43-101
compliant resource pit outline. Surface grab samples assay as high
as 2% vanadium pentoxide (V
2
O
5
) and 75 samples
(48% of total 155) have V
2
O
5
grades greater
than the Gibellini Project deposit’s cut-off grade of 0.101%
V
2
O
5
at $12.5/lb
V
2
O
5
.
The
high vanadium assay results along the 5-kilometer
northeast-southwest trend which line-up the Northeast Prospect,
through Gibellini Hill, Louie Hill, Middle Earth prospect, and Big
Sky prospect providing an indication of potential and possibly
significant future expansion of vanadium mineralization along this
corridor.
The Big
Sky prospect occurs 3.1 kilometers southwest of the Gibellini Hill
measured and indicated resource and 1.8 kilometers southwest of the
Louie Hill inferred resource. A total of 62 samples were taken, of
which 40% (n=25) returned assays greater than Gibellini Project
cut-off grade. Sixteen (16) samples returned assays >0.200
V
2
O
5
. The distribution
of samples occurs along a 300-meter exposure of the Woodruff
Formation. Assays showing >0.200 V
2
O
5
are shown in
table below.
V
2
O
5
% grab sample
assay results at Big Sky prospect for samples with
>0.200%
|
SAMPLE ID
|
Prospect
|
V
2
O
5
%
|
|
301910
|
Big
Sky
|
0.261
|
|
301913
|
Big
Sky
|
0.223
|
|
301915
|
Big
Sky
|
0.346
|
|
301916
|
Big
Sky
|
0.400
|
|
301918
|
Big
Sky
|
0.712
|
|
301920
|
Big
Sky
|
0.264
|
|
301926
|
Big
Sky
|
0.580
|
|
301927
|
Big
Sky
|
2.008
|
|
301928
|
Big
Sky
|
0.848
|
|
301944
|
Big
Sky
|
0.264
|
|
301946
|
Big
Sky
|
0.280
|
|
301947
|
Big
Sky
|
0.218
|
|
301950
|
Big
Sky
|
0.261
|
|
302050
|
Big
Sky
|
0.214
|
|
302054
|
Big
Sky
|
0.787
|
|
302055
|
Big
Sky
|
1.982
|
72
Middle Earth Prospect (200m by 70m)
The
Middle Earth prospect occurs 1.7 kilometers southeast of the
Gibellini Hill deposit and 300 meters south of the Louie Hill
deposit. A total of 50 samples were collected of which 68% (n=34)
returned assays >0.101% V
2
O
5
or the Gibellini
Project cut-off grade. Twenty-seven (27) samples returned assays
>0.200 V
2
O
5
. The samples are
distributed over 3 road cuts of exposed Woodruff Formation making
up a 200 meter by 70-meter areal footprint. Assays showing
>0.200 V
2
O
5
are shown in the
following table.
V
2
O
5
% grab sample
assay results at Middle Earth prospect for samples with
>0.200%
|
SAMPLE ID
|
Prospect
|
V
2
O
5
%
|
|
301951
|
Middle
Earth
|
0.350
|
|
301952
|
Middle
Earth
|
0.482
|
|
301968
|
Middle
Earth
|
0.628
|
|
301969
|
Middle
Earth
|
0.605
|
|
301970
|
Middle
Earth
|
0.634
|
|
301972
|
Middle
Earth
|
0.252
|
|
301973
|
Middle
Earth
|
0.687
|
|
301974
|
Middle
Earth
|
0.470
|
|
301975
|
Middle
Earth
|
0.612
|
|
301976
|
Middle
Earth
|
0.637
|
|
301978
|
Middle
Earth
|
0.559
|
|
301979
|
Middle
Earth
|
0.557
|
|
301980
|
Middle
Earth
|
0.259
|
|
301981
|
Middle
Earth
|
0.405
|
|
301983
|
Middle
Earth
|
0.255
|
|
301984
|
Middle
Earth
|
0.303
|
|
301985
|
Middle
Earth
|
0.434
|
|
301987
|
Middle
Earth
|
0.291
|
|
301988
|
Middle
Earth
|
1.294
|
|
301989
|
Middle
Earth
|
0.261
|
|
301991
|
Middle
Earth
|
0.314
|
|
301992
|
Middle
Earth
|
0.457
|
|
301993
|
Middle
Earth
|
0.380
|
|
301995
|
Middle
Earth
|
0.302
|
|
301998
|
Middle
Earth
|
0.539
|
|
301999
|
Middle
Earth
|
0.618
|
|
302000
|
Middle
Earth
|
0.532
|
Northeast Trench Prospect (500m by 300m)
The
Northeast Trench prospect occurs 1.2 kilometers northeast of the
Gibellini Hill deposit and 2.5 kilometers northeast of the Louie
Hill deposit. A total of 43 samples were collected of which 37%
(n=16) returned assays >0.101% V
2
O
5
or the Gibellini
Project cut-off grade. Three (3) samples returned assays >0.200
V
2
O
5
. The samples are
distributed through road cuts (“trenches”) and dry
gulches of exposed Woodruff Formation making up a 500 meter by
350-meter areal footprint. The exposure at the Northeast Trench is
greatly obscured by colluvium material however the extent where it
is exposed might indicate a large volume of Woodruff Formation yet
to be explored. Assays showing >0.200 V
2
O
5
are shown in the
following table.
V
2
O
5
% grab sample
assay results at Northeast Trench prospect for samples with
>0.200%
|
SAMPLE ID
|
Prospect
|
V
2
O
5
%
|
|
302004
|
NE
Trench
|
0.239
|
|
302005
|
NE
Trench
|
0.380
|
|
302016
|
NE
Trench
|
0.303
|
Water and Power supply
On
August 20, 2018, the Company secured water supply for the Gibellini
Project construction and operation. The Company signed a 10-year
agreement (the “Water Supply Agreement”) with the owner
of a private ranch, located approximately 14.5 kilometers from the
Gibellini Project. The Water Supply Agreement can be extended for
any number of additional 7-year terms, not to exceed (with the
primary term) a total of 99 years.
73
Under
the terms of the Water Supply Agreement, the lessor granted to the
Company the rights to 805 acre-feet (approximately 262.4 million
gallons) of water per year for the Gibellini Project, at a minimum
flow rate of 500 gallons per minute (“gpm”) from its
year-round springs surface water stream. The water flow rate was
measured at the ranch springs in 1965, in 1981, from December 2011
to September 2013, and most recently, in 2017. The water flow rate
ranges from 1,000 to 3,900 gpm with an average flow rate of 2,690
gpm, which exceeds the project’s maximum water operational
requirement of 420 gpm based on the process engineering design
prepared by Scotia International of Nevada, Inc. as a part of
engineering, procurement, construction and management work done in
2014.license.
The
Gibellini Project completed water-related baseline studies
including the drilling of water-test wells, water source data
collection, characterization, flow rate testing and modeling. Due
to the fact that the Water Supply Agreement provides a source of
water from surface springs located on a private ranch and baseline
studies related to it have been completed, the Company expects to
significantly expedite the permitting process by eliminating the
need to appropriate water rights from the Nevada Division of Water
Resources.
The
power supply for the Gibellini Project site is assumed to be at
24.9 kV and supplied from a planned substation to be located near
Fish Creek Ranch. This substation would tap and step-down the 69kV
supply carried by the line to the nearby Pan Mine to 24.9kV and
place it on a line to the Gibellini Project. Negotiations with the
power utility, Mt. Wheeler Power, will need to be undertaken to
secure any future power supply contract and transmission line to
the site.
2019
Permitting
In
conformance with BLM permitting requirements and Secretarial Order
3355, the Company submitted a package of enhanced baseline reports
(the “Enhanced Baseline Reports”) on March 22, 2019.
Following the BLM review of the baseline reports, the Company
submitted the Gibellini Mine Plan of Operations (the
“Gibellini MPO”) to the Battle Mountain District office
of the BLM and the Reclamation Permit application to the State of
Nevada Division of Environmental Protection Bureau of Mining
Regulation and Reclamation on June 28, 2019.
The
Enhanced Baseline Reports were completed using data primarily
collected by the previous operator between 2010 and 2012, and
included studies of biological resources, air resources, cultural
resources, surface water resources, ground water resources, noise,
wild horses, paleontological resources, geological resources,
socioeconomic and environmental justice, soil resources, visual
resources, wetlands and riparian resources, and geochemical
characterization for ore and overburden. The baseline data was
updated with data collection completed in 2019 that validated the
previous data. The reports included a review of potential
environmental impacts and proposed environmental protection
measures to avoid or minimize these impacts. The Gibellini MPO was
then prepared by integrating the information developed in the
baseline reports to guide the Gibellini Project design to avoid or
minimize potential environmental impacts.
The
Gibellini MPO includes over 1,100 pages of detailed development
plans for the Gibellini Project exploration activities, open pit
mining operations and processing facilities to extract and recover
vanadium from the Gibellini deposit with stated average mine
production during the seven-year mine life of 15.7 million tons of
ore material containing 120.5 million pounds of vanadium. The
primary facilities include the: pit, waste rock disposal facility,
mine office, auxiliary facilities such as water and power, crushing
facilities and stockpile, heap leach pad, process facility, water
ponds, borrow areas, and mine and access roads.
In
addition, the Gibellini MPO includes the following management plans
and engineering studies:
●
quality assurance
plan;
●
storm water
management plan;
●
adaptive waste rock
management plan;
●
monitoring
plan;
●
noxious weed
management plan;
●
spill contingency
plan;
●
feasibility study
level pit slope design;
●
heap leach and
waste rock dump facility stability report;
●
closure
plan;
●
water management
plan;
●
interim closure
plan;
●
transportation
plan;
●
radiation
protection plan;
●
climate data and
surface water hydrology;
●
seismic hazard
analyses; and
●
engineering design
criteria.
In
August 2018, NewFields completed the Gibellini Project heap leach
pad and waste dump designs as part of an overall basic engineering
design led by M3 Engineering and Technology Corp
74
On
October 31, 2019, the water pollution control permit and air permit
applications were submitted to the Nevada Division of Environmental
Protection (“NDEP “) incorporating the Newfields and M3
Engineering design packages. The draft air permit was posted for
public comment on July 13, 2020.
NDEP Water Pollution Control Permit
Mining
in Nevada is regulated under the authority of the Nevada Revised
Statutes (NRS) 445A.300-NRS 445A.730 and the Nevada Administrative
Code (NAC) 445A.350-NAC 445A.447. Water Pollution Control Permits
(“WPCP”) are issued to an operator prior to the
construction of any mining, milling, or other beneficiation process
activity. Facilities utilizing chemicals for processing ores are
required to meet a zero-discharge performance standard such that
waters of the State will not be degraded.
The
engineering design for heap leaching, the processing facility, and
the mine design (M3 Engineering and Newfields Companies, LLC) was
integrated into to the site closure plan that was also submitted as
part of the WPCP application. This design will facilitate
concurrent closure of the heap as each heap cell is finished
leaching. This will allow the closure plan to be initiated during
operations. At the end of active mining, the site can be closed at
minimal technical risk. This reduces the closure duration and
liability and the commensurate reclamation bond.
Air Quality Class II Permit
The
Nevada Bureau of Air Pollution Control issues air quality operating
permits to stationary and temporary mobile sources that emit
regulated pollutants to ensure that these emissions do not harm
public health or cause significant deterioration in areas that
presently have clean air. This is achieved by stipulating specific
permit conditions designed to limit the amount of pollutants that
sources may emit into the air as a regular part of their business
processes.
Any
process/activity that is an emission source requires an air quality
permit. Nevada Revised Statute (NRS) 445B.155 defines an emission
source as “any property, real or personal, which directly
emits or may emit any air contaminant.”
The
Class II Permit for the Gibellini Project is for facilities that
emit less than 100 tons per year for any one regulated pollutant.
Since the vanadium processing will utilize a heap leach, the
emissions will be under the threshold for more complex air permits.
The engineering design incorporates stringent emission control
technology to minimize emissions. The modeled emissions from the
entire Gibellini Project are well below the National Ambient Air
Quality Standards ("NAAQS").
The
Enhanced Baseline Reports (“EBR’s”) were
extensively used in the Project engineering design to ensure that
potential environmental impacts identified in the EBR’s would
be avoided or minimized by facility design. These engineering
controls help ensure that avoidance of potential environmental
impacts is “built into” the project from the start of
the design process. Doing so will allow environmental protection
measures to be taken to minimize the risk of impacts that cannot be
completely avoided in the design and ensure up-front project
planning that is sensitive to all environmental
resources.
On
October 31, 2019, the Company submitted permit applications for the
Water Pollution Control Permit and the Class II Air Quality Permit.
These Nevada state permits have been developed to provide
construction level engineering that supports the mine plan
previously submitted to the BLM in the Plan of Operations. Comments
received from the BLM were used as guidance in the engineering
design to ensure the State and Federal Permits are aligned and
reflect the most current guidance provided by both the NDEP and
BLM.
2020
Bisoni-McKay Claims and Historical Deposit
On
August 24, 2020 the Company announced that its wholly owned
subsidiary Nevada Vanadium had entered into the Bisoni APA with
CellCube to acquire the Bisoni Vanadium Project (Bisoni Project)
situated immediately southwest to Nevada Vanadium’s Gibellini
Project. Subject to the terms and conditions in the Bisoni APA,
Nevada Vanadium would acquire the Bisoni Project by the Company
issuing 4 million Common Shares and paying $200,000 cash to
CellCube at closing. Additionally, the Company would make a
one-time payment to CellCube of $500,000 in Common Shares, upon the
price of European vanadium pentoxide price exceeding US$12 a pound
for 30 consecutive business days, occurring on or before December
31, 2023, subject to TSX approval. The 4 million Common Shares
would be subject to a statutory four month and one day hold period
expiring on January 19, 2021.
On
September 18, 2020 the Company’s subsidiary, Nevada Vanadium
announced that it had completed the acquisition of the Bisoni
Project from CellCube. Under the terms of the Bisoni APA, the
Company issued 4 million Common Shares ("Compensation Shares") and
paid $200,000 cash to CellCube. The Compensation Shares were
subject to a Canadian statutory four month and one day hold period
which expired on January 19, 2021.
The
Bisoni group of claims is host to a historic resource known as the
Bisoni-McKay deposit. The resource was calculated in 2016 by Edwin
Ulmer and Edwin H. Bentzen III. A summary of the historic resource
is tabulated below:
|
Bisoni-McKay Deposit Historic Category
|
V
2
O
5
Mt
|
V
2
O
5
Grade
%
|
Mlbs Contained V
2
O
5
|
|
Indicated
|
11.88
|
0.397
|
94.41
|
|
Inferred
|
7.05
|
0.427
|
60.12
|
75
The
historic resource calculation adopted a 0.2% V
2
O
5
cutoff grade. A
Qualified Person has not done sufficient work to classify the
historical estimate as current mineral resources or mineral
reserves. The Company is not treating the historical estimate as
current mineral resources or mineral reserves.
The
Bisoni Project was drilled in the 1970s by Hecla, and more recently
by Stina Resources (now CellCube) in 2004, 2005, and 2007. Historic
2005 drill result highlights include:
(1)
BMK 05-01 –
98.5 meters grading 0.46% V
2
O
5
from surface,
including 36.0 meters grading 0.76% V
2
O
5
(2)
BMK 05-02 –
98.1 meters grading 0.53% V
2
O
5
from near
surface, including 40.2 meters grading 0.88% V
2
O
5
(3)
BMK 05-03 –
105.2 meters of 0.49% V
2
O
5
.
Compiled
historic results are tabulated below:
|
From (m)
|
To (m)
|
Downhole Interval
|
Approx. true width
|
V (ppm)
|
V
2
O
5
(ppm)
|
V
2
O
5
(%)
|
|
Hole
No. DDH BMK 05-01
|
Total
depth 98.5m
|
|||||
|
0.0
|
22.9
|
22.9
|
79.2
|
1,395
|
2,491
|
0.25
|
|
22.9
|
62.5
|
39.6
|
1,693
|
3,023
|
0.3
|
|
|
62.5
|
98.5
|
36.0
|
4,623
|
7,610
|
0.76
|
|
|
0.0
|
98.5
|
98.5
|
2,563
|
4,575
|
0.46
|
|
|
Hole
No. DDH BMK 05-02
|
Total
depth: 105.0m
|
|||||
|
7.0
|
36.3
|
29.3
|
n/a
|
1,630
|
2,909
|
0.29
|
|
36.3
|
64.9
|
28.7
|
1,635
|
2,919
|
0.29
|
|
|
64.9
|
105.2
|
40.2
|
4,944
|
8,825
|
0.88
|
|
|
7.0
|
105.2
|
98.1
|
2990
|
5337
|
0.53
|
|
|
Hole
No. DDH BMK 05-03
|
Total
depth: 105.2m
|
|||||
|
4.0
|
25.3
|
21.3
|
n/a
|
1,501
|
2,680
|
0.27
|
|
25.3
|
69.2
|
43.9
|
2,771
|
4,952
|
0.5
|
|
|
69.2
|
130.5
|
62.3
|
2,761
|
4,929
|
0.49
|
|
|
25.3
|
130.5
|
105.2
|
2,766
|
4,938
|
0.49
|
|
These
drill results are “historic” as defined by NI 43-101
and have not been independently verified. Truth widths are unknown
except where indicated.
The
host rocks carrying vanadium mineralization at both the Gibellini
Project and Bisoni Project belong to the same Gibellini facies of
the Woodruff Shale Formation.
There
exist several highly prospective exploration targets in between and
around the Gibellini and Bisoni McKay deposits (the two are 14
kilometers apart) along the northeast – southwest corridor
such as the Big Sky prospect, the Middle Earth prospect and the
North East prospect (from Gibellini Project) and BMK and BR zones
(from the Bisoni Project) all with outcropping surface vanadium
mineralization that could potentially ultimately lead to additional
vanadium mineral discoveries.
Offtake and Project Financing
The
Company has received unsolicited expressions of interest from
various potential investment sources and is currently engaged in
discussions with potential cornerstone investors, vanadium product
off-takers on potential equity, debt and prepaid off-take financing
possibilities. The Company expects to report material progress in
due course.
Permitting
Integration with BLM 12-month 3355 Environmental Impact Statement
Process
The
Nevada state permit applications were brought forward in the
permitting process to identify any issues resulting from NDEP
review that could affect the project design in the plan of
operations early. By resolving the State permitting issues prior to
the start of the EIS, it will help ensure that the 12-month
schedule mandated by the BLM Secretarial Order 3355 (S.O. 3355) can
be met and interruptions to the schedule can be
avoided.
On July
14, 2020, the NOI to prepare the EIS was published in the Federal
Register. The NOI formally commences the 12-month timeline to
complete the National Environmental Policy Act review and EIS
preparation by the BLM. The NEPA process is designed to help public
officials complete permitting decisions that are protective of the
environment and includes a public engagement process.
76
A news
release dated July 16, 2020 from the BLM Mount Lewis Office stated
the following: “
If approved,
this project would provide hundreds of jobs and will contribute to
the nation’s domestic source of critical minerals,”
said Doug Furtado, Battle Mountain District Manager. “The
Gibellini mine would also be the first vanadium mine in the U.S.
and, in accordance with Secretarial Order 3355, we anticipate
having a record of decision in 12 months
.
As
there is currently no primary domestic production of vanadium, the
United States is dependent on foreign sources of vanadium; this
creates a strategic vulnerability for both the economy and military
to adverse government action or other events that can disrupt the
supply of this key mineral.”
During
the year ended December 31, 2020, the Company incurred total costs
of $2,435,857 (2019 -$4,956,939; 2018 - $2,727,759) for the
Gibellini Project including for $897,085 (2019 - $3,200,773; 2018 -
$1,509,587) for geological and engineering services, $1,190,607
(2019 - $1,470,007; 2018 - $831,023) for personnel, legal, general
and administrative expenses and $348,165 (2019 -$286,158; 2018 -
$387,149) for royalties, fees and taxes. Also, during the year
ended December 31, 2020, the Company incurred total costs of
$2,237,077 (2019 -$Nil; 2018 - $Nil) for the Bisoni claims and
16,489 (2019 - $Nil, 2018 - $Nil) for the Gibellini
claims.
Mineral Reserve Estimates
There
are no mineral reserves established at this time.
Planning Activities
The
Company intends to spend the available funds based on annual
budgets approved by the Board of Directors consistent with
established internal control guidelines, and programs recommended
in the 2018 Gibellini PEA. However, there may be circumstances
where, for sound business reasons, a reallocation of the net
proceeds may be necessary. The actual amount that the Company
spends in connection with each of the intended uses of proceeds may
vary significantly and will depend on a number of factors,
including those referred to under “Risk
Factors”.
The
Company’s 2021 objectives are:
●
To continue with
the permitting process in order to obtain necessary permits and
authorizations prior to conducting Project-related activities to
ensure compliance with all applicable regulatory requirements.
Anticipated permits are presented in the following
Table:
Required Permits and Regulatory Authorizations for Gibellini
Project
|
Permits and Authorizations
|
Regulatory Agency
|
|
Plan of
Operations/Record of Decision
|
Bureau
of Land Management
|
|
Explosives
Permit
|
U.S.
Department of the Treasury, Bureau of Alcohol, Tobacco, and
Firearms
|
|
Surface
Disturbance Permit and Class II Air Quality Operating
Permit
|
Nevada
Department of Conservation and Natural Resources, Division of
Environmental Protection, Bureau of Air Quality
|
|
Water
Pollution Control Permit
|
Nevada
Department of Conservation and Natural Resources, Division of
Environmental Protection, Bureau of Mining Regulation and
Reclamation
|
|
Mining
Reclamation Permit
|
Nevada
Department of Conservation and Natural Resources, Division of
Environmental Protection, Bureau of Mining Regulation and
Reclamation
|
|
Industrial
Artificial Pond Permit
|
Nevada
Department of Conservation and Natural Resources, Nevada Department
of Wildlife (NDOW)
|
|
Class
III Waiver Landfill Permit
|
Nevada
Department of Conservation and Natural Resources, Division of
Environmental Protection, Bureau of Solid Waste
|
|
General
Discharge Permit (Stormwater)
|
Nevada
Department of Conservation and Natural Resources, Division of
Environmental Protection, Bureau of Water Pollution
Control
|
|
Hazardous
Materials Storage Permit
|
State
of Nevada, Fire Marshall Division
|
|
Hazardous
Waste Identification Number
|
United
States Environmental Protection Agency
|
|
Septic
Treatment PermitSewage Disposal System Permit
|
Nevada
Department of Conservation and Natural Resources, Division of
Environmental Protection, Bureau of Water Pollution
Control
|
|
Potable
Water System Permit
|
Nevada
Department of Conservation and Natural Resources, Division of
Environmental Protection, Bureau of Safe Drinking
Water
|
|
Radioactive
Materials License
|
Nevada
Department of Health and Human Services, Nevada State Health
Division, Radiological Health Section
|
|
Dam
Safety Permit
|
State
of Nevada Division of Water Resources
|
|
Local Permits
|
|
|
County
Road Use and Maintenance Permit/Agreement
|
Eureka
County Building Planning Department
|
a)
Continue to seek
potential offtake or strategic investment partners.
b)
Further explore the
Gibellini Project and evaluate prospects from the Bisoni
Project.
77
NON-MATERIAL PROPERTIES
SUNAWAYO PROJECT, BOLIVIA
Project Location
Located
in central Bolivia, the Company’s Sunawayo Project is
contiguous with the Malku Khota project ("MK"). The Malku Khota
deposit with a 350million-oz historic silver resource sits 200
meters south of the Sunawayo-MK border ("MK Border"). The Sunawayo
Project features a 17km property extent which covers 59.5 square km
of prospective area and includes an active 100 ton-per-day open-pit
mining operation located 10km north of the MK Border.
In the
Company’s first-pass reconnaissance, undertaken while
possessing only limited site data, the Company’s geologists
identified at least four high priority areas along the 11km
lithological trend that hosts the Malku Khota deposit. These areas
are called Caballo Uma, Pujiuni, Mine Area and MK
Border.
The
Sunawayo Project is patented land which the Company acquired
through the Sunawayo SPA, whereas Malku Khota is unpatented land
administered by COMIBOL. In January of 2020, the Company applied
for a mining production contract with COMIBOL that would give it
the rights to mine and explore Malku Khota. The application was
received by COMIBOL and is currently under review. While the
Company is engaging with COMIBOL to advance this process, the
Company has not been provided with any timelines for any eventual
approval.
The
purchase of the Sunawayo Project included a fully permitted 100
ton-per-day open-pit mining operation that produces lead
concentrate. The Sunawayo Project has a strike of 17 kilometers
which covers 59.5 square kilometers of prospective area. The
Sunawayo Project has ready access to water and power and is located
165 kilometers by road from Bolivia’s 5th largest city,
Oruro.
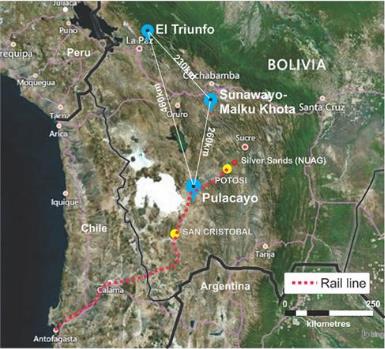
|
History
Artisanal mining in
the Sunawayo area is known been conducted dating back to Spanish
Colonial times, pre-1800, reportedly mining for silver and gold
mining and therefore mining activity has a several hundred year
history in the region, though predominantly focused on the adjacent
concessions to the southeast, known as the Malku Khota property,
which is host to a historical polymetallic silver deposit
reportedly containing up to 350Moz of silver. There are no records
describing the historical exploration or prospecting work.
Currently on the north portion of the property is a 100
tonne-per-day lead mining operation known as the Cerusita Mine
operated by a private interest, that mines Pb-carbonate
(cerrusite). No silver production has been reported from this
operation.
Regional
Geology
The
Sunawayo Project is located in the Andean Cordillera of Bolivia,
which has been characterized as a classic example of a convergent
continental plate margin. The Andean Cordillera consists of three
segments, northern, central, and southern Andes; each of these
segments has some similarities but also have distinctly different
Mesozoic and Cenozoic geologic histories. The Sunawayo Project is
located in southwestern Bolivia, within the central portion of the
Andes and near a major westward oroclinal bend in the cordillera.
The central Andes in Bolivia consist of three distinct and
contiguous provinces: the Cordillera Occidental, Altiplano, and the
Cordillera Oriental, listed in order from west to east. These three
provinces are crosscut by the Central Volcanic Zone which is the
largest of the three active volcanic chains that comprise the
Andean Cordillera. The Sunawayo Project lies within the Cordillera
Oriental.
|
78
Project Geology
In the
Sunawayo Project area, the Paleozoic rocks are unconformably
overlain by the Jurassic Ravelo Formation, which consist of white,
yellow and red, medium to coarse-grained sandstones that exhibit
distinct Aeolian crossbedding structures and are locally
intercalated with siltstones and conglomerate lenses. The Ravelo
Formation is unconformably overlain by the middle Cretaceous
Aroifilla and Chaunaca Formations which consist of sandstones,
siltstones, mudstones, marls, and evaporates with a distinctly
reddish color due to abundant iron oxides. The Aroifilla Formation
unconformably overlies the Ravelo Formation, and consists of
intercalated "red bed" siltstones, mudstones, and sandstones.
Fractures are coated with iron oxides, and small rounded iron oxide
and siderite nodules are common in the stratigraphic section
immediately above the contact with the Ravelo Formation. The El
Molino Formation unconformably overlies the Aroifilla Formation and
is interpreted to be the core of a synclinal fold sequence on the
property and is characterized by white beds of calcareous
siltstones and limestones.
Deposit Descriptions
Sunawayo, Malku Khota, and Sedex Deposits
While
there currently is no deposit that has been discovered on the
Sunawayo Project it’s southeast boundary lies only 200m from
a historic polymetallic silver deposit known as Malku Khota
(containing a historic resource of 350-million-oz silver based on
42,704 meters of drilling between 2007 and 2010). Mapping and
sampling completed by the company has confirmed that the district
is situated within one very large hydrothermal system and is
remarkably under-explored. Mapping has also confirmed that the
geology of the Malku Khota lithological trend and host-sandstone
units extend for another 8 km northwest into the Sunawayo Project
without having received a single exploration drill
hole.
The
deposit model that has been invoked for Malku Khota is known as a
sedimentary exhalative ("Sedex") style deposit. Sedex-style
silver-lead-zinc deposits account for 50% of the world’s lead
and zinc reserves and 30% of the world’s silver resources
(2019 USGS Data). Large, regional scale Sedex systems can span
hundreds of kilometers, forming large tonnage deposits. Examples
are Glencore’s Mount Isa mine and Teck’s Red Dog
mine.
Exploration
There
are no records describing the historical exploration or prospecting
work. The property is a grassroots project with no historical
mapping or drilling. The Company commenced a geological mapping
program in late-2020 focusing on lithological similarities and
continuities with the Malku Khota deposit-hosting rocks to the
southeast and how they relate to lithologies observed on the
Sunawayo Project. The Company has confirmed that the
host-stratigraphy for the Malku Khota deposit does extend for at
least 8km northwest onto the Sunawayo Project.
Activities and Developments
No
exploration has been conducted on the property prior to the
Company’s acquiring rights to explore the Sunawayo Project in
2020.
2020
On
September 28, 2020, the Company announced that all of the initial
forty-eight chip and grab samples collected from surface outcrops
and adits at the Sunawayo Project returned anomalous Ag-Pb assayed
values. Ten of the assayed samples contain either over 100g/t
silver or 10% lead or both. The results vastly exceeded the
Company’s expectations and are an early indication of the
potential for multiple mineral discoveries at the Sunawayo
Project.
In the
Company’s first-pass reconnaissance, undertaken while
possessing only limited site data, the Company’s geologists
identified at least four high priority areas along the 11km
lithological trend that hosts the Malku Khota deposit. These areas
are called Caballo Uma, Pujiuni, Mine Area and MK
Border.
On
January 21, 2021 the Company announced that a 2,300 meter drilling
program had commenced at its Sunawayo Project. Since that time the
Company has collected over 900 samples along an 8 km strike length.
Over 86% of those samples returned silver assay results grading
from 1 g/t to 458 g/t. A total of 15 drillholes have been planned
over a span of 3km to test potential mineralized structures at the
Caballo Uma and Pujiuni targets at the Sunawayo Project. The
Company completed the drill first hole while continuing its mapping
and sampling program at the Sunawayo Project, which spans 17km
totaling an area of 59.5 km2.
79
Caballo Uma (28 samples; 1.6km by 1.0 km)
Caballo
Uma is located approximately 7km south of Mine Area and 5 km
northwest of MK Border. There are numerous adits at Caballo Uma,
with samples returning high grade silver values over a span of 1.6
km in a southeast-northwest trend. Company geologists observed
mineralization associated with extensive, multiple east-west
trending vein systems, stockworks, and hydrothermal breccias.
Results from Caballo Uma are tabulated below:
|
Sample ID
|
Area
|
Type
|
Ag (g/t)
|
Pb %
|
Zn %
|
AgEq (g/t)
|
|
93323
|
Caballo
Uma
|
CHIP
|
397
|
2.63
|
0.67
|
475
|
|
93329
|
Caballo
Uma
|
CHIP
|
293
|
4.26
|
2.04
|
448
|
|
93327
|
Caballo
Uma
|
GRAB
|
289
|
1.92
|
0.44
|
344
|
|
93324
|
Caballo
Uma
|
GRAB
|
288
|
0.27
|
0.01
|
294
|
|
93303
|
Caballo
Uma
|
CHIP
|
169
|
12.55
|
0.26
|
452
|
|
93321
|
Caballo
Uma
|
GRAB
|
158
|
20.00
|
0.01
|
597
|
|
93322
|
Caballo
Uma
|
GRAB
|
79
|
1.14
|
0.18
|
110
|
|
93328
|
Caballo
Uma
|
GRAB
|
77
|
0.61
|
0.24
|
97
|
|
93302
|
Caballo
Uma
|
CHIP
|
59
|
3.02
|
0.03
|
126
|
|
93325
|
Caballo
Uma
|
GRAB
|
48
|
0.07
|
0.44
|
63
|
|
93330
|
Caballo
Uma
|
GRAB
|
48
|
10.05
|
2.35
|
339
|
|
93305
|
Caballo
Uma
|
CHIP
|
28
|
4.08
|
0.02
|
118
|
|
93319
|
Caballo
Uma
|
CHIP
|
23
|
1.73
|
0.03
|
62
|
|
93320
|
Caballo
Uma
|
GRAB
|
22
|
1.40
|
0.02
|
53
|
|
93301
|
Caballo
Uma
|
CHIP
|
14
|
3.94
|
0.01
|
101
|
|
93306
|
Caballo
Uma
|
CHIP
|
12
|
1.43
|
0.01
|
44
|
|
93316
|
Caballo
Uma
|
GRAB
|
9
|
2.81
|
0.61
|
89
|
|
93326
|
Caballo
Uma
|
CHIP
|
9
|
0.02
|
0.03
|
10
|
|
93314
|
Caballo
Uma
|
CHIP
|
8
|
2.79
|
0.45
|
83
|
|
93317
|
Caballo
Uma
|
CHIP
|
7
|
0.59
|
0.01
|
20
|
|
93313
|
Caballo
Uma
|
CHIP
|
6
|
1.62
|
0.41
|
54
|
|
93307
|
Caballo
Uma
|
GRAB
|
5
|
3.43
|
0.01
|
81
|
|
93304
|
Caballo
Uma
|
GRAB
|
5
|
0.33
|
0.00
|
12
|
|
93315
|
Caballo
Uma
|
CHIP
|
3
|
0.50
|
0.03
|
15
|
|
93318
|
Caballo
Uma
|
CHIP
|
3
|
0.36
|
0.10
|
14
|
|
93308
|
Caballo
Uma
|
GRAB
|
2
|
0.87
|
0.08
|
23
|
|
93311
|
Caballo
Uma
|
GRAB
|
0
|
5.36
|
2.70
|
199
|
|
93312
|
Caballo
Uma
|
GRAB
|
0
|
0.20
|
2.24
|
72
|
Pujiuni (11 samples; 1.0 km by 0.5 km)
Pujiuni
is 3.5 km south of Mine Area and 8.5km northwest of MK Border. It
has several artisanal workings; some possibly dating back to
Spanish-era 1800’s. The Pujiuni area is known locally to
carry high grade silver minerals. One hydrothermal breccia returned
the highest silver assay at 477 g/t silver, and over 20% lead.
Mineralization is disseminated in sandstones or as stockwork veins
in hydrothermal breccias. These features have also been observed in
the Malku Khota deposit. Pujiuni results are tabulated
below:
|
Sample ID
|
Area
|
Type
|
Ag (g/t)
|
Pb %
|
Zn %
|
AgEq (g/t)
|
|
93337
|
Pijiuni
|
CHIP
|
477
|
>20
|
0.02
|
916
|
|
93334
|
Pijiuni
|
CHIP
|
37
|
4.28
|
0.03
|
132
|
|
93336
|
Pijiuni
|
CHIP
|
35
|
0.59
|
0.13
|
52
|
|
93338
|
Pijiuni
|
CHIP
|
22
|
0.63
|
0.16
|
41
|
|
93335
|
Pijiuni
|
GRAB
|
20
|
0.37
|
0.01
|
28
|
|
93339
|
Pijiuni
|
GRAB
|
15
|
0.32
|
0.25
|
29
|
|
93332
|
Pijiuni
|
CHIP
|
13
|
1.88
|
0.07
|
56
|
|
93342
|
Pijiuni
|
CHIP
|
12
|
0.96
|
0.02
|
34
|
|
93341
|
Pijiuni
|
CHIP
|
11
|
0.40
|
0.02
|
20
|
|
93331
|
Pijiuni
|
CHIP
|
9
|
1.11
|
0.11
|
37
|
|
93333
|
Pijiuni
|
CHIP
|
8
|
0.26
|
0.04
|
15
|
80
Mine Area (7 samples; 2.0km by 0.5km)
The
current 100 tonne-per-day mining operation is known as Mine Area
and is located 10km from the MK Border. The area features a 180m by
70m small pit at 30 meters depth, and several surrounding quarries.
The mined materials are fed first to a crusher, and then to a
gravimetric concentrator. The lead concentrate is produced and
exported. A single mine-feed sample taken from the crusher assayed
223 g/t silver and over 20% lead. Below the pit there are
underground workings for silver mineral extraction. The Company
plans to maintain the status quo for the mining operation but
possibly expand it in latter part of 2021 after evaluation. The
priority for the Company is to explore the property-wide mineral
potential of the Sunawayo Project. Samples from Mine Area are shown
below:
|
Sample ID
|
Area
|
Type
|
Ag (g/t)
|
Pb %
|
Zn %
|
AgEq (g/t)
|
|
93344
|
Mine
Area
|
GRAB
|
6
|
1.56
|
0.61
|
58
|
|
93343
|
Mine
Area
|
GRAB
|
4
|
0.24
|
0.02
|
10
|
|
93347
|
Mine
Area
|
GRAB
|
3
|
>20
|
0.01
|
442
|
|
93345
|
Mine
Area
|
GRAB
|
2
|
1.84
|
0.03
|
43
|
|
93346
|
Mine
Area
|
GRAB
|
1
|
14.20
|
0.25
|
320
|
|
93349
|
Mine
Area
|
CHIP
|
1
|
2.85
|
0.01
|
64
|
|
93348
|
Mine
Area
|
GRAB
|
0
|
1.83
|
0.66
|
60
|
MK Border (2 samples, border length 3km)
Just
two samples were taken from sandstones at road cuts at the 3km-long
MK Border. Both samples showed the presence of silver as shown
below:
|
Sample ID
|
Area
|
Type
|
Ag (g/t)
|
Pb %
|
Zn %
|
AgEq (g/t)
|
|
93310
|
MK
Border
|
GRAB
|
8
|
0.05
|
0.17
|
14
|
|
93309
|
MK
Border
|
GRAB
|
8
|
0.01
|
0.10
|
11
|
48 chip
and grab samples, range in length from 1 to 4 meters (2.4-meter
average).
Silver
equivalent calculation uses a silver price of $25.00/oz, a zinc
price of $1.10/lb., a lead price of $0.80/lb. (all USD), and
assumes a 100% metallurgical recovery. Silver equivalent values can
be calculated using the following formula: AgEq = Ag g/t + (Zn % x
30.1644 ) + (Pb % x 21.9377). Samples indicating >20% Pb are
calculated using 20% Pb.
The
Company further announced that due to the daily COVID-19 infection
count below 500 in Bolivia, the Company commenced mobilizing to
start geological and structural mapping to ascertain the primary
controls and trends for mineralization at the Sunawayo Project.
This work will lay the foundation for defining drill targets by
year’s end.
2021
The
Company commenced the maiden drilling program for the Sunawayo
Project in January 2021. The first 2 drillhole results were
received in February 2021, and announced on February 24, 2021. The
first drill hole intercepted 137 meters of mineralization grading
36 g/t silver, starting from 0 meters-depth. The second drill hole
intercepted 31 meters of mineralization grading 44 g/t silver,
0.39% lead, and 0.48% zinc from 1 meter-depth. Both SWD001 and
SWD002 (240 meters to the southeast of the former) feature
near-uniform silver assays throughout the reported intervals.
Composited results for SWD001 and SWD002 are tabulated
below:
|
Hole
ID
|
From
|
To
|
Length
(m)
|
Ag
(g/t)
|
Pb
%
|
Zn
%
|
AgEq*
(g/t)
|
|
SWD001
|
0.0
|
137.0
|
137.0
|
36
|
0.12
|
0.02
|
39
|
|
SWD002
|
1.0
|
32.0
|
31.0
|
44
|
0.39
|
0.48
|
67
|
|
incl…
|
21.0
|
30.0
|
9.0
|
48
|
0.73
|
1.57
|
112
|
Reported
widths are intercepted core lengths and not true widths, as
relationships with intercepted structures and contacts vary. Based
on core-angle measurements, true widths range from 80% to 85% of
reported core length. (*)Silver equivalent calculation uses a
silver price of $25.00/oz, a zinc price of $1.10/lb., and a lead
price of $0.80/lb. (all USD) and assumes a 100% metallurgical
recovery. Silver equivalent values can be calculated using the
following formula: AgEq = Ag g/t + (Zn % x 30.1644 ) + (Pb % x
21.9377).
These 2
holes were the first results from 15 planned
drillholes.
During
the year ended December 31, 2020, the Company incurred total costs
of $513,088 (2019 -$Nil; 2018 - $Nil) for the Sunawayo Project
including for $116,152 (2019 - $Nil; 2018 - $Nil) for geological
and engineering services and $396,936 of acquisition
cost.
81
The
Company’s 2021 objectives with respect to the Sunawayo
Project are:
●
Commence maiden
drilling program on property;
●
Complete due
diligence evaluation by March 2021;
●
Complete induced
polarization (geophysics) south portion of property;
●
Continue geological
and structural mapping;
●
Evaluate field data
for additional target generation; and
●
Commence 2nd drill
campaign on property testing targets generated from field
work.
TRIUNFO PROJECT, BOLIVIA
Project Location
The
Triunfo Project area covers approximately 256 hectares located in
the La Paz Department. The Triunfo Project is located about 35
kilometers east of the Bolivian capital of La Paz at an elevation
of approximately 4,500 meters. Access is gained by a
well-maintained gravel road from La Paz. We have completed
construction of a 2.5-kilometer road to the property. The project
hosts a large mineralized area extending for at least 800 meters in
length and up to 200 meters in width. Mineralization occurs as a
stockwork zone of veining within a sequence of Paleozoic shales,
siltstones and quartzites. Within the mineralized zone, surface
sampling has returned elevated values of gold, silver, lead and
zinc.
History
In
mid-2007 Solitario Resources completed three core holes totaling
679 meters. All three holes intersected significant widths of
low-grade polymetallic mineralization. Drill hole T-1 intersected
94.2 meters grading 0.65% lead, 0.39% zinc, 21.8 gpt silver and
0.39 gpt gold. The results of these three holes were highly
encouraging, but Solitario Resources were monitoring the political
situation in Bolivia before committing to a second round of
drilling. Artisanal mining by locals has been ongoing in the area
for decades however no historical records are available on the
property.
Summary of Geological Setting and Mineralization Regional
Geology
The
regional geological setting is characterized by a prevalence of
late-Ordovician to mid-Devonian rocks, with mid-Devonian
supracrustal rocks overlaying metamorphic Ordovician basement rocks
that have undergone northeast-southwest regional transpressional
stress leading to isoclinal folding throughout the region. The
project lies within the Bolivian altiplano of the Central Andes, in
the Pre- Andean Cordillera, in the Sud Yungas Province, Department
of La Paz.
Project Geology
The
Triunfo Project is comprised of predominantly Silurian rocks of the
Llallagua and Uncia Formations, which consist predominantly of
fine-grained metasedimentary rocks, principally as black shales
interbedded with quartzites. The property is characterized by tight
isoclinal folds manifest as anticlinal sequences whose axes trend
roughly west-northwest. This folding appears to have resulted in
providing controlling structures for observed mineralization on the
property.
Deposit Descriptions
Mineralization
The
mineralization is characterized by pyrite, arsenopyrite, galena,
and sphalerite and carries gold, silver, and zinc and lead in
various proportions.
Mineralization
outcrops at the surface and continues for at least 750 meters in
three discrete blocks, known as A, B, and C. The mineralized blocks
have widths varying from 20m to 150m and are locally displaced for
several meters by north-east trending faults.
In the
past decade, some artisanal mining has been developed where gold
mineralization has been identified. Those areas have been
principally mined for gold. They demonstrate a continuity of
mineralization along the strike and to modest depths.
The
Triunfo Project mineralization can be described polymetallic
vein-style mineralization hosted in metasediments or possibly
Saddle Reef-style mineralization occurring through the Silurian and
Devonian periods. The metasediments were intruded by nearby
plutonic batholiths which are likely related to the mineralizing
event. This style of mineralization is well documented in Bolivia.
Examples include Cerro Rico and Porco, located in and around
Potosi.
The
mineralization is characterized by multiple veins (up to 1.0m wide)
and veinlets. They are emplaced along fractures and faults that
have developed on the flanks of an east-west trending
anticlinal-synclinal sequence. Mineralization is also noted to
occur in the sedimentary planes between slate layers. The slate
layers can manifest as stockwork-style mineralization which tends
to be elongated parallel to the anticlinal axis.
(*)
Gold equivalent calculation uses a gold price of $1,795, a zinc
price of $0.93, a lead price of $0.80, and a silver price of
$18.30, and assumes a 100% metallurgical recovery. Gold equivalent
values can be calculated using the following formula: AuEq = Au g/t
+ (Ag g/t x 0.2243) + (Zn % x 1.385) + (Pb % x
0.3055).
82
Historic Exploration
Exploration
was conducted in 2005–07 by Solitario Resources, which made 3
drill holes, all of which intercepted mineralization. Historical
hole TR-001 returned 94.2 meters grading 0.39 g/t Au, 21.8 g/t Ag,
0.65%Pb, 0.39%Zn, , (0.95 g/t AuEq*), according to Solitario
Resources SEC Form 10-K filings. Only 20% of the property was
explored by Solitario. Highlights from this historic drill campaign
are tabulated below:
|
Hole ID
|
From
|
To
|
Length (m)
|
Au (g/t)
|
Ag (g/t)
|
Zn %
|
Pb %
|
AuEq* (g/t)
|
|
TR001
|
53.8
|
148.0
|
94.3
|
0.40
|
21.80
|
0.39
|
0.65
|
0.96
|
|
TR002
|
10.7
|
91.8
|
81.1
|
0.28
|
24.57
|
0.58
|
0.70
|
0.95
|
|
TR003
|
89.6
|
147.1
|
57.5
|
0.25
|
24.88
|
0.53
|
0.77
|
0.93
|
Activities and Developments
2020
Mineral
rights for the Triunfo Project were acquired by the Company in 2020
and marks the first year since 2007 that any exploration has been
conducted on the property. Two work programs were completed during
the year. The first program consisted of a reconnaissance sampling
program that was conducted as part of the initial evaluation of the
property. The second program was 5-hole diamond drilling campaign
that was completed in the Fall of 2020. The nature and results of
this work is described below in order of timing of
completion.
Reconnaissance Sampling
On
August 19, 2020, the Company announced that it had received its
first chip sampling results. A total of 103 chip samples were
collected from outcrops at surface and from underground adits and
tunnels accessing the main east-west mineralized trend. The width
of the samples varies from 1.0 to 5.3m, exhibiting an average width
of 2.5m. These results confirm that the Triunfo Project exhibits
near-surface Au-Ag-Pb-Zn mineralization where gold and silver
account for a majority of the value.
Sampling
was conducted on two priority areas, known as Block A and Block B.
These 2 contiguous blocks, located at the western portion of the
property, span a total strike length of 750m at various widths from
20 to 100 m. Artisanal mining has been developed along
predominantly east-west mineralized trends in the area (please
refer to Company’s news release dated July 13th, 2020). The
sampling returned significant results from both Blocks. The table
below shows the assay results, equal to and over 1.0 g/t Au
Equivalent which represent over 36% of the samples (37 /
103).
|
ID
|
BLOCK
|
TYPE
|
WIDTH (m)
|
Au (g/t)
|
Ag (g/t)
|
Pb (%)
|
Zn (%)
|
Au Equiv (g/t)
|
Ag Equiv (g/t)
|
|
46506
|
A
|
chip
channel
|
3.90
|
2.22
|
113.00
|
3.46
|
0.12
|
8.30
|
813.94
|
|
46505
|
A
|
chip
channel
|
2.00
|
3.70
|
29.30
|
1.34
|
0.06
|
8.22
|
805.86
|
|
46504
|
A
|
chip
channel
|
2.10
|
0.89
|
68.70
|
2.52
|
1.82
|
5.58
|
547.21
|
|
46503
|
A
|
chip
channel
|
2.20
|
1.27
|
64.00
|
1.93
|
0.13
|
4.74
|
465.03
|
|
46502
|
A
|
chip
channel
|
3.80
|
0.62
|
55.20
|
2.34
|
1.08
|
4.23
|
414.86
|
|
46501
|
A
|
chip
channel
|
2.30
|
0.21
|
75.10
|
2.61
|
1.29
|
4.14
|
406.07
|
|
46299
|
A
|
chip
channel
|
2.80
|
1.86
|
24.60
|
0.00
|
0.02
|
3.93
|
385.39
|
|
46298
|
A
|
chip
channel
|
2.30
|
0.59
|
35.40
|
1.42
|
1.76
|
3.73
|
365.50
|
|
46297
|
A
|
chip
channel
|
2.00
|
1.56
|
39.50
|
0.00
|
0.01
|
3.65
|
357.77
|
|
46296
|
A
|
chip
channel
|
2.40
|
0.69
|
95.80
|
0.00
|
0.01
|
3.10
|
303.82
|
|
46295
|
A
|
chip
channel
|
2.10
|
1.55
|
5.50
|
0.00
|
0.00
|
2.98
|
292.64
|
|
46294
|
A
|
chip
channel
|
3.00
|
0.19
|
45.70
|
2.88
|
0.14
|
2.94
|
288.56
|
|
46293
|
A
|
chip
channel
|
1.30
|
1.29
|
15.10
|
0.34
|
0.03
|
2.89
|
283.91
|
|
46292
|
A
|
chip
channel
|
2.60
|
0.70
|
75.40
|
0.00
|
0.04
|
2.75
|
269.70
|
83
|
ID
|
BLOCK
|
TYPE
|
WIDTH (m)
|
Au (g/t)
|
Ag (g/t)
|
Pb (%)
|
Zn (%)
|
Au Equiv (g/t)
|
Ag Equiv (g/t)
|
|
46291
|
A
|
chip
channel
|
2.00
|
0.29
|
42.00
|
1.88
|
0.45
|
2.70
|
264.59
|
|
46290
|
A
|
chip
channel
|
2.00
|
0.33
|
46.60
|
1.76
|
0.10
|
2.56
|
250.73
|
|
46289
|
A
|
chip
channel
|
1.00
|
0.82
|
30.80
|
0.54
|
0.02
|
2.42
|
237.84
|
|
46288
|
A
|
chip
channel
|
1.70
|
0.04
|
20.00
|
0.53
|
2.23
|
2.22
|
217.89
|
|
46287
|
A
|
chip
channel
|
1.00
|
0.70
|
30.00
|
0.35
|
0.11
|
2.14
|
209.93
|
|
46286
|
A
|
chip
channel
|
3.40
|
1.00
|
14.20
|
0.00
|
0.00
|
2.13
|
208.64
|
|
46285
|
A
|
chip
channel
|
3.00
|
1.08
|
5.40
|
0.00
|
0.00
|
2.11
|
206.82
|
|
46284
|
A
|
chip
channel
|
2.00
|
0.43
|
25.20
|
1.02
|
0.37
|
2.10
|
205.63
|
|
46283
|
A
|
chip
channel
|
2.20
|
0.92
|
5.90
|
0.00
|
0.00
|
1.82
|
178.46
|
|
46282
|
A
|
chip
channel
|
1.30
|
0.94
|
1.90
|
0.00
|
0.00
|
1.78
|
174.77
|
|
46281
|
A
|
chip
channel
|
1.50
|
0.49
|
42.10
|
0.00
|
0.01
|
1.71
|
167.73
|
|
46279
|
A
|
chip
channel
|
2.40
|
0.76
|
13.70
|
0.00
|
0.00
|
1.67
|
164.16
|
|
46278
|
B
|
chip
channel
|
2.00
|
0.33
|
17.00
|
0.59
|
0.41
|
1.54
|
151.10
|
|
46277
|
B
|
chip
channel
|
2.10
|
0.55
|
26.40
|
0.00
|
0.00
|
1.52
|
149.28
|
|
46276
|
B
|
chip
channel
|
2.00
|
0.29
|
15.50
|
0.54
|
0.23
|
1.29
|
126.13
|
|
46275
|
B
|
chip
channel
|
2.00
|
0.47
|
6.20
|
0.25
|
0.23
|
1.28
|
125.73
|
|
46274
|
B
|
chip
channel
|
4.00
|
0.63
|
1.50
|
0.00
|
0.00
|
1.20
|
117.52
|
|
46273
|
B
|
chip
channel
|
2.30
|
0.59
|
3.70
|
0.00
|
0.00
|
1.17
|
114.48
|
|
46272
|
B
|
chip
channel
|
2.90
|
0.55
|
4.10
|
0.00
|
0.01
|
1.11
|
108.53
|
|
46271
|
B
|
chip
channel
|
2.00
|
0.23
|
10.70
|
0.30
|
0.36
|
1.04
|
101.91
|
|
46270
|
B
|
chip
channel
|
2.40
|
0.43
|
9.00
|
0.02
|
0.02
|
0.99
|
96.87
|
|
46269
|
B
|
chip
channel
|
2.50
|
0.05
|
22.70
|
0.25
|
0.46
|
0.97
|
94.82
|
Denser
sets of veins and veinlets hosted by shales and quartzites appear
to correlate with higher grades. The strike lengths of these
mineralized trends have been recognized as continuing along several
hundreds of meters at surface.
(*)
Gold equivalent calculation uses a gold price of $1,795, a zinc
price of $0.93, a lead price of $0.80, and a silver price of $18.30
(all USD), and assumes a 100% metallurgical recovery. Gold
equivalent values can be calculated using the following formula:
AuEq = Au g/t + (Ag g/t x 0.0102) + (Zn % x 0.3551) + (Pb % x
0.3055).
84
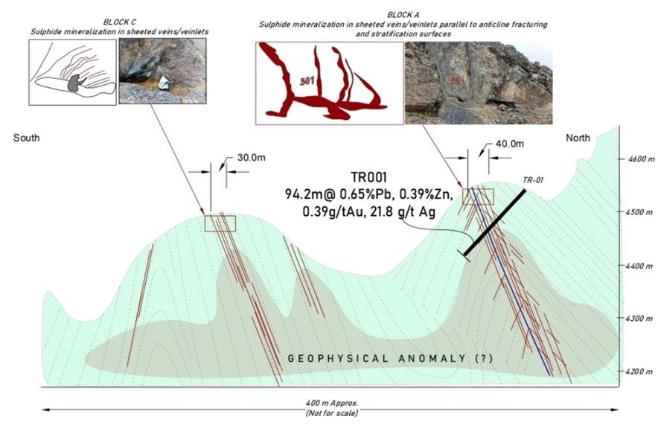
The
mineralization is characterized by multiple veins (up to 1.0m wide)
and veinlets. They are emplaced along fractures and faults that
have developed on the flanks of an east-west trending
anticlinal-synclinal sequence. Mineralization is also noted to
occur in the sedimentary planes between slate layers. The slate
layers can manifest as stockwork-style mineralization which tends
to be elongated parallel to the anticlinal axis.
Diamond Drilling
A
5-hole diamond drilling program at the Triunfo Project was
commenced in late-August of 2020. A total of 1,017 meters was
drilled and the Company reported results for this program on
November 25th, 2020. Highlights from this drilling
includes:
|
Hole ID
|
From
|
To
|
Length (m)
|
Au (g/t)
|
Ag (g/t)
|
Zn %
|
Pb %
|
AuEq* (g/t)
|
|
TR006
|
40.0
|
76.0
|
36.0
|
0.49
|
15.46
|
0.54
|
0.44
|
0.97
|
|
including…
|
58.0
|
72.0
|
14.0
|
0.48
|
20.23
|
0.76
|
0.66
|
1.16
|
|
TR007
|
13.0
|
111.9
|
98.9
|
0.37
|
22.71
|
0.74
|
0.58
|
1.04
|
|
including…
|
63.0
|
111.9
|
48.9
|
0.42
|
35.49
|
1.17
|
0.83
|
1.45
|
|
TR008
|
6.8
|
84.0
|
77.3
|
0.31
|
17.65
|
0.57
|
0.53
|
0.85
|
|
including…
|
45.0
|
51.4
|
6.4
|
1.60
|
56.49
|
1.66
|
0.94
|
3.05
|
Reported
widths are intercepted core lengths and not true widths, as
relationships with intercepted structures and contacts vary. Based
on core-angle measurements, true widths range between 54-65% of
reported core length.
(*)
Gold equivalent calculation uses a gold price of $1,795, a zinc
price of $0.93, a lead price of $0.80, and a silver price of $18.30
(all USD), and assumes a 100% metallurgical recovery. Gold
equivalent values can be calculated using the following formula:
AuEq = Au g/t + (Ag g/t x 0.0102) + (Zn % x 0.3551) + (Pb % x
0.3055).
Mineralization
is hosted in altered black shales exhibiting hydrothermal sheeted
quartz-carbonate vein sets that are concentrated along the axes of
regional anticlinal fold structures.
85
Detailed
Assay results are detailed in the table below:
|
Hole ID
|
From
|
To
|
Length (m)
|
Au (g/t)
|
Ag (g/t)
|
Zn %
|
Pb %
|
AuEq* (g/t)
|
|
TR004
|
14.0
|
15.0
|
1.0
|
0.24
|
18.85
|
0.21
|
0.65
|
0.70
|
|
17.0
|
18.0
|
1.0
|
0.74
|
2.21
|
0.03
|
0.04
|
0.78
|
|
|
71.0
|
74.0
|
3.0
|
1.11
|
5.01
|
0.00
|
0.00
|
1.16
|
|
|
TR005
|
61.0
|
62.0
|
1.0
|
0.59
|
8.00
|
0.00
|
0.01
|
0.67
|
|
122.0
|
124.0
|
2.0
|
0.50
|
2.29
|
0.01
|
0.02
|
0.53
|
|
|
TR006
|
5.0
|
6.0
|
1.0
|
0.73
|
3.19
|
0.10
|
0.13
|
0.84
|
|
20.0
|
21.0
|
1.0
|
0.15
|
11.10
|
0.35
|
0.29
|
0.48
|
|
|
40.0
|
76.0
|
36.0
|
0.49
|
15.46
|
0.54
|
0.44
|
0.97
|
|
|
including…
|
58.0
|
72.0
|
14.0
|
0.48
|
20.23
|
0.76
|
0.66
|
1.16
|
|
TR006
|
94.5
|
101.5
|
7.0
|
0.56
|
23.21
|
0.82
|
0.56
|
1.26
|
|
106.5
|
107.4
|
0.8
|
0.32
|
12.70
|
0.25
|
0.01
|
0.54
|
|
|
120.0
|
121.0
|
1.0
|
0.07
|
15.90
|
0.50
|
0.67
|
0.62
|
|
|
142.8
|
143.3
|
0.5
|
0.60
|
0.43
|
0.00
|
0.00
|
0.61
|
|
|
190.0
|
191.3
|
1.3
|
0.72
|
89.58
|
2.07
|
0.16
|
2.42
|
|
|
TR007
|
13.0
|
111.9
|
98.9
|
0.37
|
22.71
|
0.74
|
0.58
|
1.04
|
|
including…
|
63.0
|
111.9
|
48.9
|
0.42
|
35.49
|
1.17
|
0.83
|
1.45
|
|
TR007
|
118.5
|
119.5
|
1.0
|
0.03
|
4.55
|
0.17
|
0.53
|
0.30
|
|
121.5
|
122.5
|
1.0
|
0.30
|
3.69
|
0.07
|
0.46
|
0.50
|
|
|
125.5
|
126.3
|
0.8
|
0.56
|
3.18
|
0.09
|
0.03
|
0.63
|
|
|
179.0
|
181.0
|
2.0
|
1.05
|
1.38
|
0.01
|
0.01
|
1.07
|
|
|
185.6
|
186.2
|
0.6
|
0.44
|
5.69
|
0.02
|
0.01
|
0.51
|
|
|
196.0
|
197.0
|
1.0
|
0.74
|
1.46
|
0.00
|
0.00
|
0.76
|
|
|
TR008
|
6.8
|
84.0
|
77.3
|
0.31
|
17.65
|
0.57
|
0.53
|
0.85
|
|
including…
|
45.0
|
51.4
|
6.4
|
1.60
|
56.49
|
1.66
|
0.94
|
3.05
|
|
TR008
|
138.1
|
139.1
|
1.0
|
0.71
|
0.90
|
0.01
|
0.00
|
0.72
|
|
149.0
|
151.0
|
2.0
|
0.10
|
22.73
|
0.78
|
0.03
|
0.61
|
|
|
156.0
|
157.0
|
1.0
|
0.74
|
1.33
|
0.02
|
0.01
|
0.76
|
|
|
183.0
|
183.6
|
0.6
|
1.65
|
2.62
|
0.02
|
0.01
|
1.69
|
|
|
231.6
|
232.6
|
1.0
|
0.41
|
4.50
|
0.00
|
0.00
|
0.46
|
|
|
247.5
|
250.0
|
2.5
|
1.64
|
35.99
|
0.00
|
0.00
|
2.01
|
|
|
257.0
|
258.0
|
1.0
|
0.78
|
2.15
|
0.00
|
0.00
|
0.80
|
Reported
widths are intercepted core lengths and not true widths, as
relationships with intercepted structures and contacts vary. Based
on core-angle measurements, true widths range between 54-65% of
reported core length.
The
Company plans district geological mapping and geophysics such as
induced polarization (IP) in the following year.
During
the year ended December 31, 2020, the Company incurred total costs
of $463,665 (2019 -$Nil; 2018 - $Nil) for the Triunfo Project
including for $327,989 (2019 - $Nil; 2018 - $Nil) for geological
and engineering services, and $135,676 (2019 -$Nil; 2018 - $Nil) of
acquisition cost.
The
Company’s 2021 Triunfo objectives are:
●
Conduct geological
and structural mapping over the property;
●
Complete induced
polarization (geophysics) survey over the property;
●
Generate drilling
targets from ground work; and
●
Test targets with
diamond drilling program.
MINAGO PROJECT, MANITOBA, CANADA
Project Location
The
Minago Project spans over 197 km
2
and is in the
province of Manitoba, Canada, situated approximately 480km north of
Winnipeg and 225km southwest of Thompson. The Minago Project site
is close to existing infrastructure, including Manitoba Provincial
Highway 6, a 230 kV high voltage transmission line that runs
directly beside Highway 6, both of which transect the property. The
Property may be served by the Hudson Bay Railway Company (HBR),
with rail lines accessible from Ponton, Manitoba, approximately 65
km north of the Minago Project.
86
The
Minago Project resides in the southern part of the TNB. It is
recognized as the fifth largest nickel-bearing geological belt in
the world with
over 5 billion pounds
of nickel production since 1958.
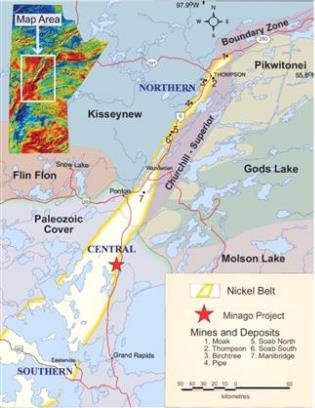
|
History
Geophysical
Reservation 34 (GR 34), covering an area of 19.2 by 38.4 km, was
granted to Amax Potash Ltd. (Amax) on November 1, 1966 for a period
of two years, extended to April 30, 1969 in 1968. In March of 1969,
Amax converted the most favourable prospective area of GR 34 to 844
contiguous claims and in April of 1969 an additional 18 claims were
staked.
In
1973, the claims covering ground deemed to have the most potential
for economically viable nickel mineralization were taken to lease
status as Explored Area Lease 3 (North Block) and Explored Area
Lease 4 (South Block). A subsequent agreement, dated December 12,
1973, granted Granges Exploration Aktiebolag (Granges) an option on
the Explored Area Leases.
●
On May 18, 1989,
Black Hawk Mining Inc. (Black Hawk) purchased the Amax interest in
the Explored Area Leases and on August 2, 1989 purchased the
Granges interest and Net Smelter Return (NSR) royalty in the
Explored Area Leases.
●
On April 1, 1992,
Explored Area Lease 3 and Explored Area Lease 4 were converted to
Mineral Lease 002 and Mineral Lease 003 respectively.
●
On March 18, 1994,
a portion of Mineral Lease 002 was converted to mineral claims KON
1, KON 2, and KON 3.
●
On March 18, 1994,
a portion of Mineral Lease 003 was converted to mineral claim KON
4.
●
On November 3,
1999, Nuinsco Resources Limited (Nuinsco) purchased the Black Hawk
interest, subject to a graduated NSR royalty based on nickel
prices.
|
●
On February 1,
2007, Victory Nickel was formed through an arrangement with Nuinsco
and was assigned the Minago Property along with several
others.
●
In October 2008,
Victory Nickel acquired Independent Nickel Inc. which owned a
royalty on the Minago Property.
●
In February 2021,
the Company successfully completed a transaction for the
acquisition for 100% interest in the Minago Property.
Historic
exploration on the property includes:
●
AMAX EXPLORATION
WORK – 1966 TO 1972: Amax conducted a regional scale
exploration program on the southern extension of the Thompson
Nickel Belt.
●
GRANGES EXPLORATION
WORK – 1973 TO 1976 Granges focused their efforts on the
Minago nickel deposit conducting resource estimates, mining,
metallurgical, and milling studies. The work concluded that the
Minago nickel deposit was sufficiently confirmed and that further
delineation and exploration should be conducted from underground
workings.
●
BLACK HAWK
EXPLORATION WORK – 1989 TO 1991 Black Hawk conducted a deep
penetrating ground electromagnetic survey, resource estimates,
mining, metallurgical, and milling studies. A helicopter borne
electromagnetic and magnetic survey covering the Property was
obtained from Falconbridge Limited and interpreted.
●
NUINSCO WORK
– JUNE 2006 In June 2006 Nuinsco, requested an independent
review of the geology, exploration history, historical resource
estimates, resource estimates, and the potential for discovery of
additional nickel mineralization. A report summarized the results
of exploration conducted during the period from 1966 to 1991 and
the work conducted by Nuinsco from 2004 to October 31,
2006.
87
●
VICTORY NICKEL
– 2007 TO 2020 Nuinsco spun out its subsidiary, Victory
Nickel as a dedicated platform for the Minago Project. Victory
Nickel completed a Feasibility Study in 2009 and an Environmental
Impact Study in 2010 and secured permits in April of 2011 from the
Manitoba Provincial Government for a 10,000 tpd open-pit mining
operation. In 2011 and 2012, Victory Nickel completed over 6,000
meters of drilling on a mineralized extension to the north of the
Nose deposit called the North Limb. In January of 2020, Victory
Nickel completed two diamond drillholes on the property. No results
are reported as work is incomplete due to restrictions caused by
lockdowns in the COVID-19 pandemic.
Regional Geology
The
regional geology comprises the eastern edge of the Phanerozoic
sediments of the Western Canada Sedimentary Basin. The basin
unconformably overlies Precambrian crystalline basement rocks,
including the Thompson Nickel Belt. The basin tapers from a maximum
thickness of about 6,000 m in Alberta to zero at the north and
east, where it is bound by the Canadian Shield. The Property is
located near the northeast corner of the basin, where it comprises
approximately 53 m of Ordovician dolomitic limestone underlain by
approximately 7.5 m of Ordovician sandstone.
The
Precambrian basement rocks of the Thompson Nickel Belt form a
northeast southwest trending 10 to 35 km wide belt of variably
reworked Archean age basement gneisses and Early Proterozoic age
cover rocks along the northwest margin of the Superior Province.
Lithotectonically, the Thompson Nickel Belt is part of the
Churchill Superior boundary zone.
The
Archean age rocks to the southeast of the Thompson Nickel Belt
include low to medium grade metamorphosed granite greenstone, and
gneiss terranes and the high grade metamorphosed Pikwitonei
Granulite Belt. The Pikwitonei Granulite Belt is interpreted to
represent exposed portions of deeper level equivalents of the low
to medium grade metamorphosed granite greenstone and gneiss
terranes. The Superior Province Archean age rocks are cut by mafic
to ultramafic dikes of the Molson swarm dated at 1883 mega annum
(Ma). Dikes of the Molson swarm occur in the Thompson Nickel Belt,
but not to the northwest in the Kisseynew domain. The early
Proterozoic rocks to the northwest of the Thompson Nickel Belt
comprise the Kisseynew domain that is interpreted to represent the
metamorphosed remnants of a back arc or inter arc
basin.
The
variably reworked Archean age basement gneisses constitute the
dominant portion (volumetrically) of the Thompson Nickel Belt. The
Early Proterozoic rocks that occur along the western margin of the
Thompson Nickel Belt are a geologically distinguishable
stratigraphic sequence of rocks known as the Opswagan
Group.
Local Geology
There
is no outcrop on the Property. Bedrock geology is interpreted from
geophysical data, diamond drill hole core, and regional structural
and isopach trends. The surface cover typically comprises 1.0 to
2.1 m of muskeg and peat that is underlain by 1.5 to 10.7 m of
impermeable compacted glacial lacustrine clays. The clays are dark
brown to grey and carbonate rich.
Underlying
the surficial cover are flat lying Ordovician dolomite and
sandstone. The dolomite is fine grained, massive to stratified and
varies in colour from creamy white to tan brown to bluish grey.
Dolomite thicknesses range from 42 to 62 m with the thickness
increasing southward. The upper 24 m of the formation is stratified
with horizontal clay/organic beds 1 to 5 mm in thickness, spaced at
intervals ranging from millimeters to one meter. A stratified zone
of dolomite breccia and microfracturing characterized by dolomite
clasts in a carbonate clay matrix and varying in thickness from 0.3
to 3.0 m is located 15 m to 21 m below the surface of the
formation. Scattered throughout the dolomite are occasional soft
clay seams ranging from 1 to 2 centimeters (cm) in thickness. The
seams may contain dolomite fragments and sand grains and vary in
orientation from semi-horizontal to semi-vertical.
The
Ordovician sandstone of the Winnipeg Formation occurs
stratigraphically below the dolomite approximately 46 to 73 m below
surface. The sandstone ranges in thickness from 5.1 to 15.9 m.
Cohesiveness varies from consolidated and carbonate cemented to
semi-consolidated, friable and clay/silt rich to unconsolidated
sand. Clay/silt rich zones are brown grey in colour while white
zones are carbonate cemented.
The
Precambrian basement comprises a variety of lithologies briefly
described and listed below, in decreasing order of
abundance.
1.
Granitic rocks
include granite, granitic gneiss (foliated granite) and pegmatite
sills and dikes. Typically grey to pink, the granitic rocks range
from almost white to almost red in colour. Grain size ranges from
fine to coarse with medium to coarse grain size predominating.
Textures vary from massive to strongly foliated. The granitic rocks
are mostly potassium (K) feldspar rich, may contain up to 15%
biotite and appear to intrude all other rock types.
2.
The fine to coarse
grained ultramafic rocks that host the nickel deposit include
serpentinized dunite, peridotite (harzburgite, lherzolite,
wehrlite) and pyroxenite (orthopyroxenite, websterite,
clinopyroxenite). The ultramafic rocks dip vertical to near
vertical with individual bodies having strike lengths up to 1,525 m
and widths up to 457.2 m. Serpentinization varies from intense to
weak and appears to decrease with depth, most markedly a change is
observed at approximately 400 m below surface. Zoned contact
alteration on a centimeter to meter scale occurs adjacent to
granite and some fractures. From most intense (adjacent to granite
or fracture) to least intense (furthest from granite or fracture)
the alteration typically comprises
biotite/phlogopite-chlorite-tremolite.
3.
Metavolcanic rocks,
interpreted to be Bah Lake Formation, include chloritebiotite
schist and amphibolite. Amphibolite is dark green to black, fine to
medium grained, foliated and lineated.
88
4.
Metasedimentary
rocks, interpreted to be Pipe Formation, comprise sillimanite
paragneiss, siliceous sediments, skarn, iron formation, graphitic
sediments, semi pelite and calc silicate. Distinctive minerals
include graphite, sillimanite, garnet, diopside, carbonate,
muscovite and very fine grain quartz. Sulphide facies iron
formation comprises semi-massive to massive pyrite and pyrrhotite,
sometimes nodular, and associated with detrital metasediments often
containing siliceous fragments and includes sulphide breccia in
zones of cataclastic deformation.
5.
Molson dikes and
sills that are olivene rich. The Precambrian lithologies have
undergone complex multiphase ductile and brittle deformation.
Interpretations of magnetic data suggest that the ultramafic rocks
containing the Minago deposit have undergone dextral strike slip
fault movement which resulted in a large Z shaped drag fold and
that the deposit flanks the axial plane of an eastern limb.
Vertical longitudinals of the mineralized zones indicate that the
folded limb plunges steeply towards the southeast.
The
Ospawagan Group hosts the nickel deposits of the Thompson Nickel
Belt. Within the Ospawagan Group almost all of the nickel deposits
of the Thompson Nickel Belt are found within lower Pipe
Formation.
Deposit Description
The
Minago Property is part of the southern extension of the TNB, which
constitutes part of the larger Circum- Superior Boundary Zone
(CSBZ), where the TNB component of the CSBZ extends from
approximately 50 km northeast of Thompson to approximately 125 km
southwest of Thompson, from where it is covered by Paleozoic
carbonate platform rocks. Beneath the Paleozoic platform, the
geophysical expression of the TNB continues approximately 275 km
southward towards the Saskatchewan border, where the
Circum-Superior Boundary Zone is interpreted to continue into North
Dakota to a depth of 500 to 2000 m beneath Paleozoic and Mesozoic
rocks. The Minago deposit occurs under the Paleozoic cover rocks
and is expressed in magnetometer surveys that have been completed
in the area. The formation of the TNB-style mineralization has been
attributed to pre-existing komatitte-associated nickel deposits
that have undergone later deformation resulting in remobilization
of nickel sulphide into structural traps within fold structures.
Komatiite-associated Ni sulphide deposits, such as those in the
TNB, are part of a continuum of lithotectonic associations in the
family of magmatic Ni-Cu-(PGE) deposits.
Activities and Developments
As the
Company completed the acquisition of the Minago property in
February 2021, there has been no activities or developments on the
property by Silver Elephant mining at time of writing.
COAL PROJECTS
Ulaan Ovoo Coal Property, Mongolia
The
Company acquired a 100 % interest in the Ulaan Ovoo Property
located in the territory of Tushig soum of Selenge aimag (province)
in Northern Mongolia in 2010 from a private Mongolian company. On
November 9, 2010, the Company received the final permit to commence
mining operations at the Ulaan Ovoo Property. The focus of the
Ulaan Ovoo PFS was for the development of low ash coal reserves in
the form of a starter pit. During 2014, the Company faced
challenges, such as significant dewatering of the resource, lack of
demand, depressed coal sales prices, and higher than expected
operating/transportation costs, resulting in limited production
throughout the period. Pit dewatering has become a significant
impediment to achieving consistent production, especially following
mine standby during the periods of low market demand. The mine was
placed on standby in Spring 2014 but continued coal loading and
sales from the existing stockpiles. Due to the lack of sustained
production, management has not sufficiently tested the mine plant
and equipment to conclude that the mine has reached the commercial
production stage. During the beginning of 2015, due to minimal
increase in coal prices and decreased demand because of a mild
winter, the Company decided to maintain the operations on standby
though coal loading and sales from existing stockpiles continued to
customers. The Company decided to sell the mining equipment to
generate cash so that operations may continue.
In
April 2015, the Company, through its wholly-owned subsidiary, Red
Hill, entered into a purchase agreement with an arm’s-length
party in Mongolia to sell substantially all of its mining and
transportation equipment at the Ulaan Ovoo Property for total
proceeds of approximately $2.34 million. The sale of equipment was
completed in June 2015. Total proceeds (including the sale of
equipment to other arm’s-length parties) amounted to $2.9
million in cash. The Ulaan Ovoo Property ceased pre-commercial
operations in June 2015, The Company continued to maintain the
Ulaan Ovoo Property operations on standby, incurring minimal
general and administrative costs.
On
October 16, 2018, the Company executed a lease agreement (the
"Lease") with the Mongolian Lessee whereby the Mongolian Lessee
plans to perform mining operations at Ulaan Ovoo Property and will
pay the Company US$2.00 for every tonne of coal shipped from the
Ulaan Ovoo Property’s site premises (the "Production
Royalty"). The Mongolian Lessee paid the Company US$100,000 in
cash, as a non-refundable advance royalty payment and is preparing,
at its own and sole expense, to restart and operate the Ulaan Ovoo
Property with its own equipment, supplies, housing and crew. The
Mongolian Lessee will pay all government taxes and royalties
related to its proposed mining operation. The Lease is valid for 3
years with an annual advance royalty payment ("ARP") for the first
year of US$100,000 which was due and paid upon signing, and
US$150,000 and US$200,000 due on the 1st and 2nd anniversary of the
Lease, respectively. The ARP can be credited towards the Production
Royalty payments to be made to the Company as the Mongolian Lessee
starts to sell Ulaan Ovoo coal. The 3-year Lease can be extended
upon mutual agreement. The first and second anniversary payments
due have not been collected and the Company has recorded a full
provision in the amount of $470,278 (US$350,000) due to uncertainty
of their collection.
89
Since
the signing of the Lease, the Mongolian Lessee has spent
approximately US$700,000 on supplies, housing and crew and
restarted Ulaan Ovoo Property with its own equipment in March 2018
reporting approximately 21,000 tonnes of coal production and sales.
In June 2019 the Ulaan Ovoo Property achieved record monthly coal
production of 37,800 tonnes, however the operation was stopped in
April and May due to the late approval of 2019 environmental plan.
The approval was issued in June 2019.
During
2020 with the nationwide COVID-19 restriction the Mongolian Lessee
mined approximately 82,000 tonnes of coal production and sales. The
Mongolian Lessee continues to mine with its own equipment and
exported its first wagon of coal to China in 2020.
In
accordance with relevant laws and regulations, mining feasibility
study and detailed environmental impact assessment had to be
updated for the Ulaan Ovoo Property. With the COVID-19 restriction,
the approval was delayed but the update of the Ulaan Ovoo
feasibility study was approved by the Minerals Resource Council on
April 22, 2020, and by the Minerals Resource and Petroleum
Authority on November 2, 2020. The Company is working to get
approval for the update to the detailed environmental impact
assessment for the Ulaan Ovoo Property.
Chandgana Project, Mongolia
The
Chandgana Project consist of the Chandgana Tal property and the
Khavtgai Uul property (formerly named Chandgana Khavtgai) which are
within nine kilometers of each other in the Nyalga Coal Basin in
east central Mongolia and approximately 280 kilometers east of
Ulaanbaatar. On November 22, 2006 the Company (then Red Hill Energy
Inc.) entered into a letter agreement with a private Mongolian
company that set out the terms to acquire a 100% interest in the
Chandgana Tal property. On August 7, 2007, the Company (then Red
Hill Energy Inc.) entered into a letter agreement with another
private Mongolian company that set out the terms to acquire a 100%
interest in the Khavtgai Uul property. Under the terms of the
Chandgana Khavtgai agreement, the Company paid a total of
US$570,000. On February 8, 2011, the Company received a full mining
license from the Mineral Resources Authority of Mongolia for the
Chandgana Tal property. The license can be updated to allow mining
of 3.5 million tonnes per year to meet the demand of the Chandgana
Power Plant within 90 days.
During
2007, the Company performed geologic mapping, drilling and
geophysical surveys of the Chandgana Tal and Khavtgai Uul
properties. During June, 2010, The Company completed a 13 drill
hole, 2,373 meter resource expansion drilling program on the
Khavtgai Uul property, including 1,070 meters of core drilling, and
five lines of seismic geophysical survey for a total of 7.4 line
kilometers. The Company completed a 15 drill hole program during
June-July 2011 to better define the coal resource of the Chandgana
Tal licenses.
The
Chandgana Tal property has been mined previously and occasionally
during the Company’s tenure to meet local demand. The Company
decided not to mine during the 2017- 2018 heating season because of
insufficient demand. A dry lake was determined by the Ministry of
Environment to overlap onto one of the Chandgana Tal licenses as
determined under the Mongolian Law to Prohibit Mineral Exploration
and Mining Operations at Headwaters of Rivers, Protected Zones of
Water Reservoirs and Forested Areas (the “Long Named
Law”) but was resolved without loss to the Company. The
Khavtgai Uul property has never been mined. The Ministry of
Environment determined that a dry lake overlapped the Khavtgai Uul
license as defined under the Long Named Law. This was resolved by
removing the lake area from the license while not affecting the
coal resource and mineability. The Company will continue to monitor
the developments and ensure that it follows the necessary steps in
the Amended Law on Implementation to secure its operations and
licenses and is fully compliant with Mongolian law.
During
2017, preparatory work to convert the Khavtgai Uul exploration
license to a mining license was completed. The Company engaged a
contractor to prepare the required documents to convert the license
to a mining license under which the right to explore is permanent.
In 2017, as preparatory work to convert the Khavtgai Uul
exploration license to a mining license necessary laboratory
analysis work was done such as coal chemical, mineral and element
analysis of duplicates of coal samples taken as a result of
drilling work in past years as well as radiation analysis of coal
ash. A report describing the results of geological and exploration
work completed during 2017 was delivered to Geological division of
Mineral Resources and Petroleum Authority of Mongolia (the former
Mineral Resources Authority of Mongolia (MRAM)). Based on previous
years of work a report of the reserves of the licensed area was
prepared, and an official letter requesting an expert be appointed
were submitted to the Mineral Resources Professional Council in
January 2018.During 2018, the Company completed converting the
Khavtgai Uul exploration license to a mining license.
During
2017 activities for the Chandgana Tal project included payment of
license fees and environmental sampling and reporting. No
exploration was completed on the Chandgana Tal licenses. The
Company assessed the local market for coal and found there was not
sufficient demand to warrant mining during the 2017-2018 heating
seasons. Thus, the annual mining and environmental plans were not
filed.
During
2020, the Company successfully received the approval of the
feasibility study for the Khavtgai Uul project and intends to
get approval for its detailed
environmental impact assessment with the relevant ministries and
complete the requirements to maintain the
licenses.
For the
Chandgana Tal project, the Company intends to update the mining
feasibility study and
report to
certify land quality and characterization
with the relevant
ministries and complete the requirements to maintain the
licenses.
90
ITEM
4A
UNRESOLVED
STAFF COMMENTS
Not
applicable.
ITEM
5.
OPERATING
AND FINANCIAL REVIEW AND PROSPECTS
The
following discussion of the financial condition, changes in
financial condition and results of operations of the Company should
be read in conjunction with our consolidated financial statements
and related notes [which have been prepared in accordance with IFRS
as issued by the IASB] included in this Annual Report. The
discussion contains forward-looking statements (as previously
defined) which are subject to numerous risks and uncertainties, as
more fully described elsewhere in this Annual Report under the
heading “
Cautionary Note
Regarding Forward-Looking Statements
.”
A.
Operating
Results
Year Ended December 31, 2018 compared with Year Ended December 31,
2017
We
reported a net loss of $18.2 million ($0.23 loss per share) for the
year ended December 31, 2018, which represents a decreased loss of
$0.4 million when compared to the same period in 2017 ($0.33 loss
per share). The decrease in net loss was primarily due to lesser
impairment charges of 14.5 million (2017 -$15.1 million) mostly
attributable to our non-core Bolivian property.
Our
annual operating expenses increased to $3.3 million in the fiscal
year 2018 compared to $2.4 million in the fiscal year
2017.
The
increase by $0.9 million in operating expenses during the fiscal
year 2018 compared to the fiscal year 2017 was a result of the
overall increased activity levels of the Company related to the
acquisition of vanadium properties in Nevada and equity financings.
Notably our advertising and promotion expenses increased by
$369,718 due to increased promotion efforts in the US and Europe to
raise market awareness and to raise equity financing. The Company
incurred higher marketing costs because the Company is working with
the financial community to make its projects known. Investor
relations remains a priority due to the ongoing need to attract
investment capital.
Our
consulting and management fees decreased by $496,002 in the year
2018 compared to the year 2017. The Company significantly reduced
external consulting services used during the fiscal year 2017
related to acquiring the Gibellini Project and hiring Skanderbeg
Capital Advisors Inc. to explore and evaluate strategic
alternatives. The amount of this decrease was partially offset by a
higher amount of internal consulting expenses due to hiring a new
Vice-President, Exploration and restored the Company interim CEO
previously reduced fees.
Our
general and administrative costs comprising head office costs
including salaries, directors’ fees, insurance and costs
related to maintaining the Company’s exchange listings and
complying with securities regulations. General and administrative
expenses increased by $721,988 in the fiscal year 2018 compared to
the fiscal year 2017. The increase was the result of increased
salaries due to hiring a new President and CEO and restoring
salaries for officers of the Company, increased stock exchange and
shareholders’ services due to increased financing
activities.
Our
professional fees increased by $233,972. The increase was mainly
due to increased legal, accounting and audit services related to
the Gibellini Project activities and the recently completed bought
deal financing.
Our
travel and accommodation expenses increased by $133,029. The
Company incurred additional travel expenses as it actively pursued
the Gibellini Project moving toward production. Additionally,
non-cash share-based expenses decreased in the fiscal year 2018 by
$45,687 compared to the fiscal year 2017 due to the decrease in the
number of options earned during the fiscal year 2018. The Company
uses the fair value method of accounting for stock options granted
to directors, officers, employees and consultants whereby the fair
value of all stock options granted is recorded as a charge to
operations over the period from the grant date to the vesting date
of the option. The fair value of stock options granted is estimated
on the date of grant using the Black-Scholes option pricing
model.
For the
year ended December 31, 2018, we incurred other expenses classified
as “Other Items” amounting to $14,886,085 compared to
$16,211,616 for the fiscal year 2017. The decrease by $1,325,531 in
the fiscal year 2018 is the net result of changes to a number of
the following items: costs in excess of recovered coal for Ulaan
Ovoo decreased by $14,852 due to changes at Ulaan Ovoo Property in
Mongolia related to a lease agreement with an arms-length private
Mongolian company which plans to perform mining operations at Ulaan
Ovoo Property in the first fiscal quarter 2019 with its own
equipment and resources; foreign exchange loss increased by
$224,199 due to fluctuations in the value of the Canadian dollar
compared to the United States dollar, Bolivian Boliviano and
Mongolian Tugrik; we recorded a total of $13,994,970 impairment
charges on our non-core Pulacayo Property and Chandgana Coal
property incurred expenses, an impairment charge of $425,925 on
Bolivian mining equipment, and impairment charges of $26,234 and
$21,004 on prepaid expenses and receivables respectively; we sold
2.7 million shares of a public company for a realized gain of
$91,890;we earned $50,000 from a debt settlement with Nickel Creek
Platinum Corp.
The
total assets decreased by $9.1 million from $18.4 million in the
year 2017 to $9.3 million in the year 2018. The decrease was mainly
due to a write-off the non-core Pulacayo Property and its mining
equipment. Current assets increased by $1 million from $4.5 million
in the year 2017 to $5.5 million in the year 2018. The increase was
mainly due to the $5.2 million net proceeds received from the
bought deal financing in Q4 2018.
91
Year Ended December 31, 2019 compared with Year Ended December 31,
2018.
We
reported a net gain of $17.5 million ($0.17 gain per share) for the
year ended December 31, 2019, which represents a decreased loss of
$35.7 million when compared to the year 2018 ($0.23 loss per
share). The decrease in net loss was primarily due to an impairment
reversal of 13.7 million for the Pulacayo Project and a write-off
the Bolivian tax liability of $8 million in 2019 compared to
impairment charges of $18.2 million in 2018.
For the
year ended December 31, 2019, we incurred operating expenses of
$3,505,562 (2018 - $3,298,383).
The
$207,179 increase in operating expenses when compared to the year
2018 was due to a few factors. Advertising and promotion expenses
increased by $322,952 due to increased promotion efforts in the
U.S. and Europe to raise market awareness and to raise equity
financing. We incurred higher marketing costs because the Company
is working with the financial community to make its projects known.
Investor relations remains a priority due to the ongoing need to
attract investment capital. Consulting and management fees
decreased by $4,058. General and administrative costs comprising
head office costs including salaries, directors’ fees,
insurance and costs related to maintaining the Company’s
exchange listings and complying with securities regulations.
General and administrative expenses decreased by $71,107 in the
year 2019 compared to the year 2018. Professional fees decreased by
$200,290, which was mainly due to reduced legal fees. Share-based
payments costs are non-cash charges which reflect the estimated
value of stock options granted. We use the fair value method of
accounting for stock options granted to directors, officers,
employees and consultants whereby the fair value of all stock
options granted is recorded as a charge to operations over the
period from the grant date to the vesting date of the option. The
fair value of stock options granted is estimated on the date of
grant using the Black-Scholes option pricing model. The increase in
share-based payments in 2019 by $154,372 compared to 2018 was
primarily related to the decrease in the number of options earned
during the year 2019 compared to the year 2018. Travel and
accommodation expenses slightly increased by $5,310. The Company
incurred additional travel expenses as it actively pursues the
Pulacayo Project and Gibellini Project moving toward production and
seeks financing.
For the
year ended December 31, 2019, we incurred other expenses classified
as “Other Items” amounting to a gain of $21,019,416
compared to a loss of $14,866,085 for the year 2018.
The
decrease in loss of Other Items by $35,905,501 in the year 2019
compared to the year 2018 is the net result of changes to a number
of the following items:
●
in the year 2019
costs in excess of recovered coal for Ulaan Ovoo increased by
$26,019 compared to the year 2018 due to increased activities at
Ulaan Ovoo coal mine in Mongolia;
●
foreign exchange
loss increased by $30,540 due to fluctuations in the value of the
Canadian dollar compared to the United States dollar, Bolivian
boliviano and Mongolian tugrik;
●
in the year 2019,
the Company recorded an impairment recovery of $13,708,200 on its
Pulacayo and impairment charges of $51,828 and $16,304 on prepaid
expenses and receivables respectively;
●
in the year 2018,
the Company recorded a total of $13,994,970 impairment charges on
its Pulacayo Project and Chandgana Coal property incurred expenses,
an impairment charge of $425,925 on Bolivian mining equipment, and
impairment charges of $26,234 and $21,004 on prepaid expenses and
receivables respectively;
●
in the year 2018,
the Company sold 2.7 million shares of a public company for a
realized loss of $91,890. In the year 2017, the Company sold of 2.2
million Lorraine Copper Corp. shares for a realized loss of
$22,810; and
●
in the year 2019,
the Company recorded a write off Bolivian tax liabilities of
$7,952,700 due to the decision of the Supreme Court of Bolivia to
discharge the Company of the contentious tax claim.
Year Ended December 31, 2020 compared with Year Ended December 31,
2019.
We
reported a net loss of $4.6 million ($0.03 per share) for the year
ended December 31, 2020, which represents an increased loss of $22
million when compared to the year 2019 ($0.17 gain per share). The
increase in net loss was primarily due to an impairment reversal of
13.7 million for Pulacayo Project and a write-off the Bolivian tax
liability of $8 million in 2019 compared to impairment charges
total of $0.59 million in 2020.
For the
year ended December 31, 2020, we incurred operating expenses of
$3,394,116 (2019 - $3,505,562). In late January 2020, in response
to the reported spread of COVID-19 the Company implemented
measures, including travel restrictions, remote work, and
supplemental health care, for the Company’s Canadian head
office staff, as well as our Bolivian, Mongolian, and US-based
staff. These measures had no material impact on the Company’s
costs, nor did COVID-19 cause any significant disruptions to the
Company’s operations.
92
The
$111,446 decrease in operating expenses when compared to the year
2019 was due to a few factors:
●
advertising and
promotion expenses decreased by $253,153 from $794,182 in the year
2019, to $541,029 in the year 2020, due to decreased promotional
activities and restricted travels during the COVID-19
pandemic;
●
consulting and
management fees increased by $318,804 from $251,552 in the year
2019, to $570,356 in the year 2020, due to the issuance of a bonus
in the amount of $324,000 to management/consultants of the Company,
which was paid by the issuance of Common Shares at a value of $0.40
per share;
●
general and
administrative fees consisted of general office expenses and
administrative services related to maintaining the Company’s
exchange listings and complying with securities regulations and
also included insurance, salaries and directors’ fees.
General and administrative expenses decreased by $189,181 from
$1,286,617 in the year 2019, to $1,097,436 in the year 2020. The
decrease is a result of cost cutting initiatives across the
Company;
●
professional fees
increased by $92,761, from $228,594 in the year 2019, to $321,355
in the year 2020, due to increased legal fees associated with the
Offering and properties acquisitions;
●
share-based
payments costs are non-cash charges which reflect the estimated
value of stock options granted. The Company uses the fair value
method of accounting for stock options granted to directors,
officers, employees, and consultants whereby the fair value of all
stock options granted is recorded as a charge to operations over
the period from the grant date to the vesting date of the options.
The fair value of options granted is estimated on the date of grant
using the Black-Scholes option pricing model. Share-based payments
increased in the year 2020, by $62,815 compared to the year 2019.
The increase was primarily related to the increase in the number of
options earned during the year, 2020, compared to the year 2019;
and
●
travel and
accommodation expenses decreased by $143,492 from $236,815 in the
year 2019, to $93,323 in the year 2020, due to decreased property
site visits and restricted travels during the COVID-19
pandemic.
For the
year ended December 31, 2020, we incurred other expenses classified
as “Other Items” amounting to $1,232,771 compared to a
gain of $21,019,416 for the year 2019.The increase in loss of Other
Items by $22,252,187 in the year 2020 compared to the year 2019 was
the net result of changes to a number of the following
items:
●
in the year 2020
costs in excess of recovered coal increased by $469,850 compared to
the year 2019. This increase was mainly due to the change in
estimate reclamation provision for Ulaan Ovoo coal mine in
Mongolia;
●
foreign exchange
loss decreased by $378,362 due to fluctuations in the value of the
Canadian dollar compared to the United States dollar, Bolivian
boliviano and Mongolian tugrik;
●
in the year 2020,
the Company recorded an impairment of prepaid expenses of $121,125
compared to $51,828 in the year 2019;
●
in the year 2020,
the Company recorded an impairment of receivables of $470,278
compared to $16,304 in the year 2019;
●
in the year 2020,
the Company recorded a gain on sale of equipment of 13,677 compared
to a loss of 9,795 in the year 2019; and
●
also, in the year
2019, the Company recorded an impairment recovery of $13,708,200 on
its Pulacayo property and wrote off Bolivian tax liabilities of
$7,952,700 due to the decision of the Supreme Court of Bolivia to
discharge the Company of the tax claim.
B.
Liquidity
and Capital Resources
The
Company utilizes existing cash received from prior issuances of
equity instruments to provide liquidity to the Company and finance
exploration projects. The Company is of the opinion that its
working capital is sufficient for its present requirements. The
business of mineral exploration involves a high degree of risk and
there can be no assurance that the Company’s current
operations, including exploration programs, will result in
profitable mining operations. The recoverability of the carrying
value of mineral properties, and property and equipment interests
and the Company’s continued on going existence is dependent
upon the preservation of its interest in the underlying properties,
the discovery of economically recoverable reserves, the achievement
of profitable operations, the ability of the Company to raise
additional sources of funding, and/or, alternatively, upon the
Company’s ability to dispose of some or all of its interests
on an advantageous basis. Additionally, the current capital markets
and general economic conditions are significant obstacles to
raising the required funds. These conditions may cast significant
doubt upon the Company’s ability to continue as a going
concern.
Given
that COVID-19 may result in a widespread health crisis that could
adversely affect the economies and financial markets of many
countries, there is the possibility of an economic downturn which
may affect our ability to access or raise capital through the
issuance of our equity securities as and when needed for business
operations.
Year Ended December 31, 2018 compared with Year Ended December 31,
2017
At
December 31, 2018, we had cash flow of $5.3 million representing an
increase of $1.2 million from $4.1 million held at December 31,
2017. The Company’s working capital at December 31, 2018, was
a surplus of $3.8 million compared to working capital of $2.6
million at December 31, 2017.
During
the year ended December 31, 2018, cash used in operating activities
was $2,626,687 compared to $707,231 cash used in the prior year.
The increased outflows in 2018 primarily related to increased
activities of the Company to develop the Gibellini Project. The
year over year increase in cash used by operating activities is due
to increased funds required for working capital
changes.
93
During
the year ended December 31, 2018, we used $3,628,762 in investing
activities (2017 – $1,988,566). The Company received net
proceeds of $101,550 from selling its marketable securities, used
$120,416 (2017 – $515,609) on purchase of property and
equipment, $425,605 (2017 – $58,790) on the acquisition of
the Gibellini Project, and $3,184,294 (2017 – $1,339,417) on
mineral properties expenditures.
During
the year ended December 31, 2018, a total of $7,458,938 was
provided by financing activities including net proceeds of
$6,096,621 – from the Common Share issuances, $24,150 from
exercise of stock options, and $1,338,167 from the exercise of
common share purchase warrants.
Year Ended December 31, 2019 compared with Year Ended December 31,
2018
At
December 31, 2019, we had cash flow of $3 million representing a
decrease of $2.3 million from $5.3 million held at December 31,
2018. The Company’s working capital at December 31, 2019, was
$0.95 million compared to working capital of $3.8 million at
December 31, 2018.
During
the year ended December 31, 2019, cash used in operating activities
was $2,675,513compared to $2,626,687 cash used during the prior
year. The increased outflows in 2019 primarily related to increased
activities of the Company to develop the Pulacayo Project and the
Gibellini Project.
The
year over year increase in cash used by operating activities is due
to increased funds required for working capital changes. The
Company has increased its efforts in managing operating costs in
advance of cash flows from operations but will require financing in
the near term to fund operations.
During
the year ended December 31, 2019, we used $6,236,965 in investing
activities (2018 – $3,628,762). We used $113,564 (2018 -
$120,416) on purchase of property and equipment, $6,123, 401 (2018
- $1,398,207) on mineral property expenditures.
During
the year ended December 31, 2019, a total of $6,626,085 was
provided by financing activities including net proceeds from the
Company’s common share issuances of $6,237,791, an additional
$174,250 from exercise of stock options, and $250,572 from the
exercise of warrants to purchase Common Shares of the Company. We
spent $36,528 for lease payments.
Year Ended December 31, 2020 compared with Year Ended December 31,
2019
At
December 31, 2020, we had cash flow of $7.6 million representing an
increase of $4.6 million from $3 million held at December 31, 2019.
The Company’s working capital at December 31, 2020, was $6
million compared to working capital of $0.95 million at December
31, 2019.
During
the year ended December 31, 2020,
cash used in operating activities
was $2,549,042 compared to $2,675,513 during the year ended
December 31, 2019 (2018 - $2,626,687). The decreased outflows in
2020 year related to decreased activities of the Company due to the
COVID-19 pandemic.
During
the year ended December 31, 2020, the Company used $6,397,063 in
investing activities (2019 - $6,236,965. 2018 - $3,628,762). During
the year ended December 31, 2020, the Company spent $6,336,166
(2019 - $6,126,401, 2018 - $3,609,896) on its mineral projects
exploration activities, $111,592 (year 2019 - $113,564, 2018 -
$120,416) on purchase of equipment, and received $50,695 on sale of
equipment 2019 - $Nil, 2018 - $Nil).
During
the year ended December 31, 2020, a total of $13,536,550 was
provided by financing activities (2019 – $6,626,085, 2018 -
$7,458,938) including net proceeds from private placements of
$10,201,705 (2019 - $6,237,791, 2018 - $6,096,621), $299,812 from
exercise of stock options (2019 - $174,250, 2018 - $24,150),
$3,072,194 from exercise of warrants (2019 - $250,572, 2018 -
$1,338,167). The Company also spent $37,162 (2019 - $36,528) for
corporate office lease payments.
As an
exploration company, the Company has no regular cash in-flow from
operations, and the level of operations is principally a function
of availability of capital resources. The Company’s capital
resources are largely determined by the strength of the junior
resource markets and by the status of the Company’s projects
in relation to these markets, and its ability to compete for
investor support of its projects. See the disclosure under the
heading “
Key
Information
-
Risk
Factors
” in the 2020 Annual Report. To date, the
principal sources of funding have been equity and debt financing.
Many factors influence the Company’s ability to raise funds,
and there is no assurance that the Company will be successful in
obtaining adequate financing with favourable terms, or at all, for
these or other purposes including general working capital
purposes.
For the
foreseeable future, as existing properties are explored, evaluated
and developed, the Company will continue to seek capital through
the issuance of equity, strategic alliances or joint ventures, and
debt, of which the Company currently has none.
94
The
Company expects to continue requiring cash for operations and
exploration and evaluation activities as expenditures are incurred
while no revenues are generated. Therefore, its continuance as a
going concern is dependent upon its ability to obtain adequate
financing to fund future operations based on annual budgets
approved by the Company's board of directors, consistent with
established internal control guidelines, and programs recommended
in the Pulacayo Technical Report. The Company has managed its
working capital by controlling its spending on its properties and
operations. Due to the ongoing planned advancement of Pulacayo
Project milestones, the Company will continue to incur costs
associated with exploration, evaluation and development activities,
while no revenues are being generated. In response to the COVID-19
pandemic, exploration in Bolivia may be impacted by government
restrictions on the Company’s operations. Potential stoppages
on exploration activities could result in additional costs, project
delays, cost overruns, and operational restart costs. The total
amount of funds that the Company needs to carry out its proposed
operations may increase from these and other consequences of the
COVID-19 pandemic. The actual amount that the Company spends in
connection with each of the intended uses of proceeds may vary
significantly and will depend on a number of factors, including
those referred to under "
Risk
Factors
".
Our
consolidated financial statements have been prepared on a going
concern basis which assumes that we will be able to realize our
assets and discharge our liabilities in the normal course of
business for the foreseeable future. Our ability to continue as a
going concern is dependent upon the continued support from our
shareholders, the discovery of economically recoverable reserves,
and our ability to obtain the financing necessary to complete
development and achieve profitable operations in the future. The
outcome of these matters cannot be predicted at this
time.
Financial Instruments
All
financial assets are initially recorded at fair value and
designated upon inception into one of the following four
categories: held‐to‐maturity, marketable securities,
loans and receivables or at fair value though profit and loss
(“FVTPL”). FVTPL comprises derivatives and financial
assets acquired principally for the purpose of selling or
repurchasing in the near term. They are carried at fair value with
changes in fair value recognized in profit or loss. The
Company’s cash is classified as FVTPL.
Marketable
securities instruments are measured at fair value with changes in
fair value recognized in other comprehensive income. Where a
decline in the fair value of marketable securities constitutes
objective evidence of impairment, the amount of the loss is removed
from accumulated other comprehensive income and recognized in
profit or loss. The Company’s investments are classified as
marketable securities. Marketable securities consist of investment
in Common Shares of public companies and therefore have no fixed
maturity date or coupon rate. The fair value of the listed
marketable securities has been determined directly by reference to
published price quotation in an active market.
All
financial assets except those measured at fair value through profit
or loss are subject to review for impairment at least at each
reporting date. Financial assets are impaired when there is
objective evidence of impairment as a result of one or more events
that have occurred after initial recognition of the asset and that
event has an impact on the estimated future cash flows of the
financial asset or the group of financial assets.
Transactions
costs associated with FVTPL financial assets are expensed as
incurred, while transaction costs associated with all other
financial assets are included in the initial carrying amount of the
asset.
The
Company assesses at each reporting date whether there is objective
evidence that a financial asset or a group of financial assets is
impaired. An evaluation is made as to whether a decline in fair
value is significant or prolonged based on an analysis of
indicators such as market price of the investment and significant
adverse changes in the technological, market, economic or legal
environment in which the investee operates.
If a
financial asset is impaired, an amount equal to the difference
between its carrying value and its current fair value is
transferred from Accumulated Other Comprehensive Income (Loss) and
recognized in the consolidated statement of operations. Reversals
of impairment charges in respect of equity instruments classified
as available-for-sale are not recognized in the consolidated
statement of operations.
The
Company considers that the carrying amount of all its financial
assets and financial liabilities measure at amortized cost
approximates their fair value due to their short term nature.
Restricted cash equivalents approximate fair value due to the
nature of the instrument. The Company does not offset financial
assets with financial liabilities.
2018
At
December 31, 2018, our financial assets and financial liabilities
were categorized as follows: FVTPL – cash of $5,304,097,
amortized cost – receivables of $36,399, restricted cash
equivalents of $34,500, accounts payable and accrued liabilities of
$1,636,786.
2019
At
December 31, 2019, our financial assets and financial liabilities
were categorized as follows: FVTPL – cash of $3,017,704,
amortized cost – receivables of $246,671, restricted cash
equivalents of $34,500, and accounts payable of
$2,420,392.
2020
At
December 31, 2020, our financial assets and financial liabilities
were categorized as follows: FVTPL – cash of $7,608,149,
amortized cost – receivables of $75,765, restricted cash
equivalents of $34,500, and accounts payable of
$1,717,977.
95
Commitments
Our
subsidiary, ASC, controls the mining rights to the Pulacayo Project
through a joint venture agreement entered into between itself and
the Pulacayo Mining Cooperative on July 30, 2002 (the "ASC Joint
Venture"). The ASC Joint Venture has a term of 23 years which
commenced the day the ASC Joint Venture was entered into. Pursuant
to the ASC Joint Venture, ASC is committed to pay monthly rent of
US$1,000 to the state-owned Mining Corporation of Bolivia, COMIBOL
and US$1,500 monthly rent to the Pulacayo Mining Cooperative until
the Pulacayo Project starts commercial production.
Under
the terms of the lease agreement through which we acquired the
Gibellini Project, we are required to make annually, on each
anniversary of the execution date of the agreement, advance royalty
payments which will be tied, based on an agreed formula (not to
exceed US$120,000 per year), to the average vanadium pentoxide
price of the prior year. Further, upon commencement of production,
we will maintain our acquisition by paying to the Lessors, a 2.5%
NSR until a total of US$3 million is paid. Thereafter, the NSR will
be reduced to the Production Royalty Payments. Under the terms of
the lease agreement, all advance royalty payments made, will be
deducted as credits against future Production Royalty Payments. The
Gibellini Project lease is for a term of 10 years but can be
extended for an additional 10 years at our option.
Under
the terms of the lease agreement through which we acquired the
Louie Hill Project in Nevada, we are required to pay, annually, on
each anniversary of the execution date of the agreement, advance
royalty payments which will be tied, based on an agreed formula
(not to exceed USD$28,000 per year), to the average vanadium
pentoxide price for the prior year. Further, upon commencement of
production, we will maintain our acquisition by paying to the Louie
Hill Lessor, a 2.5% NSR of which, 1.5% of the NSR may be purchased
at any time by us for US$1 million leaving the total NSR to be
reduced to 1% over the remaining life of the mine. Under the terms
of the lease agreement, all advance royalty payments made, will be
deducted as credits against future such production royalty
payments. The Louie Hill Project lease is for a term of 10 years
but can be extended for an additional 10 years at our
option.
As part
of the transaction with Apogee, we agreed to assume within certain
limitations all liabilities associated with the Apogee Subsidiaries
and the Pulacayo Project.
Contingencies
During
Apogee’s financial year ended June 30, 2014, it received
notice from the Servicio de Impuestos Nacionales, the national tax
authority in Bolivia, that ASC Bolivia LDC Sucursal Bolivia, now
the Company’s wholly-owned subsidiary, owed approximately
Bs42,000,000 in taxes, interest and penalties relating to a
historical tax liability in an amount originally assessed at
approximately $7,600,000 in 2004, prior to Apogee acquiring the
subsidiary in 2011.
Apogee
disputed the assessment and disclosed to the Company that it
believed the notice was improperly issued. The Company continued to
dispute the assessment and hired local legal counsel to pursue an
appeal of the tax authority’s assessment on both substantive
and procedural grounds. The Company received a positive Resolution
issued by the Bolivian Constitutional Court that among other
things, declared null and void the previous Resolution of the
Bolivian Supreme Court issued in 2011 (that imposed the tax
liability on ASC Bolivia LDC Sucursal Bolivia) and sent the matter
back to the Supreme court to consider and issue a new
resolution.
On
November 18, 2019 the Company received Resolution No. 195/2018
issued by the Supreme Court of Bolivia which declared the tax claim
brought by Bolivia’s General Revenue Authority against the
Company’s Bolivian subsidiary as not proven.
The
Resolution is final and binding. Hence neither the Company nor the
Company’s Bolivian subsidiaries owe any outstanding back
taxes to the Bolivian General Revenue Authority.
During
the year ended December 31, 2019, the Company and legal counsel
reassessed the status of tax rulings and determined that the
probability of a re-issuance of a tax claim against the Company in
connection with the above was remote. As a result, the Company has
written off the tax liability and recorded a debt settlement gain
in the amount of $7,952,700 on its consolidated statements of
operations and comprehensive loss.
During
the year ended December 31, 2014, the Company’s wholly-owned
subsidiary, Red Hill Mongolia LLC (“Red Hill”) was
issued a letter from the Sukhbaatar District Tax Division notifying
it of the results of the Sukhbaatar District Tax Division’s
VAT inspection of Red Hill’s 2009-2013 tax imposition and
payments that resulted in validating VAT credits of only
MNT235,718,533 from Red Hill’s claimed VAT credit of
MNT2,654,175,507. Red Hill disagreed with the Sukhbaatar District
Tax Division’s findings as the tax assessment appeared to the
Company to be unfounded. The Company disputed the Sukhbaatar
District Tax Division’s assessment and submitted a complaint
to the Capital City Tax Tribunal. On March 24, 2015, the Capital
City Tax Tribunal resolved to refer the matter back to the
Sukhbaatar District Tax Division for revision and separation of the
action between confirmation of Red Hill’s VAT credit, and the
imposition of the penalty/deduction for the tax
assessment.
Due to
the uncertainty of realizing the VAT balance, the Company recorded
an impairment charge for the full VAT balance in the year ended
December 31, 2015.
In June
2019, the Company received a positive resolution issued from the
Capital City Tax Tribunal, which is binding and final, affirmed Red
Hill’s outstanding VAT credit of 1.169 billion MNT resulted
from past mining equipment purchases. The VAT credit can be used to
offset taxes and royalty payments; or be refunded in cash by
Mongolia’s Ministry of Finance within 12 to 24 months
processing time. Due to the credit risk associated with the VAT
credit, the Company has provided a full valuation provision against
the balance.
96
C.
Research
and Development, Patents and Licenses, etc.
None.
D.
Trend
Information
While
the Company is an exploration company that does not have any
producing mines, it is directly affected by trends in the metal
industry. At the present time global metal prices are extremely
volatile. Base metal prices, driven by rising global demand,
climbed dramatically and approached near historic highs several
years ago. Prices have declined significantly since those highs,
other than in the case of vanadium, which has risen
significantly.
Overall
market prices for securities in the mineral resource sector and
factors affecting such prices, including base metal prices,
political trends in the countries in which such companies operate,
and general economic conditions, may have an effect on the terms on
which financing is available to the Company, if available at
all.
Additionally,
any outbreaks of contagious diseases and other adverse public
health developments in countries where we operate could have a
material and adverse effect on our business, financial condition
and results of operations. For example, the recent outbreak of
COVID-19 first identified in Wuhan, Hubei Province, China, has
resulted in significant restrictive measures being implemented by
governments of affected countries to control the spread of
COVID-19. Such COVID-19 related restrictions and disruptions,
including for employees, manufacturers, suppliers and customers
across different industries, may negatively impact our business
operations and therefore our operational results and financial
condition. In addition, COVID-19 may result in a widespread health
crisis that could adversely affect the economies and financial
markets of many countries, resulting in an economic downturn that
could affect our ability to access or raise capital through
issuances of our securities as and when needed for business
operations.
Except
as disclosed, the Company does not know of any trends, demand,
commitments, events or uncertainties that will result in, or that
are reasonably likely to result in, its liquidity either materially
increasing or decreasing at present or in the foreseeable future.
Material increases or decreases in liquidity are substantially
determined by the success or failure of the Company’s
exploration programs.
The
Company’s financial assets and liabilities generally consist
of cash, receivables, deposits, accounts payable and accrued
liabilities, some of which are denominated in foreign currencies
including Canadian dollars, United States dollars, Mongolian
Tugriks and Bolivian Bolivianos. The Company is at risk to
financial gain or loss as a result of foreign exchange movements
against the Canadian dollar. The Company does not currently have
major commitments to acquire assets in foreign currencies, but
historically it has incurred the majority of its exploration costs
in foreign currencies. The Company currently does not and also does
not expect to engage in currency hedging to offset any risk of
currency fluctuations.
E.
Off-Balance
Sheet Arrangements
None.
F.
Tabular
Disclosure of Contractual Obligations
The
Company’s commitments related to mineral properties are
disclosed in Note 14 to the Annual Financial Statements. The
Company has no commitments for capital expenditures.
The
Company has the following financial obligations in the ordinary
course of business:
|
|
Payments due by period
|
||||
|
Contractual Obligations
|
Total
|
Less than 1 year
|
1-3 years
|
3-5 years
|
More than 5 years
|
|
Long-term
debt
|
$Nil
|
$Nil
|
$Nil
|
$Nil
|
$Nil
|
|
Capital
(finance) lease obligations
|
$Nil
|
$Nil
|
$Nil
|
$Nil
|
$Nil
|
|
Operating
lease obligations
|
$20,533
|
$20,533
|
$Nil
|
$Nil
|
$Nil
|
|
Purchase
obligations
|
$Nil
|
$Nil
|
$Nil
|
$Nil
|
$Nil
|
|
Other
long-term liabilities
|
$Nil
|
$Nil
|
$Nil
|
$Nil
|
$Nil
|
|
Loan
|
$Nil
|
$Nil
|
$Nil
|
$Nil
|
$Nil
|
|
Total
|
$20,533
|
$20,533
|
$Nil
|
$Nil
|
$Nil
|
97
G.
Safe
Harbor
The
Company seeks safe harbor for our forward-looking statements
contained in Items 5.E and F. See the heading “Cautionary
Note Regarding Forward-Looking Statements”
above.
ITEM
6.
DIRECTORS,
SENIOR MANAGEMENT AND EMPLOYEES
A.
Directors
and Senior Management
The
following are the names and ages of our directors and senior
management of the Company as of December 31, 2020 and March 12,
2021, with their positions and offices with the Company and
corresponding start dates, and their principal occupations during
the last five years. There are no family relationships between any
of the persons named below. There are no arrangements or
understandings with any major shareholders, customers, suppliers or
other parties pursuant to which any person named below was selected
as a director or executive officer. Mr. Lee, the Company’s
Chief Executive Officer and Executive Chairman and Director was not
selected as a Director of the Company in connection with the
consulting agreement dated February 28, 2019 entered between the
Company and Linx (a wholly-owned subsidiary of Mr. Lee).
An
independent director is as a director that is not an officer or
employee of the Company. Therefore Mr. Lee is considered a
Non-Independent director as he currently holds the position of
Chief Executive Officer and Executive Chairman of the
Company.
|
Name and Age
|
Current Office Held
with the Company
|
Current director and/or
Executive Office Since
|
Principal Occupation During Last Five Years (3)
|

John
Lee
Age:47
|
Chief
Executive Officer (4)
Executive
Chairman
Non-Independent
Director
|
July
17, 2020
January
1, 2013
October
21, 2009
|
Present
:
President of Mau Capital Management
LLC (private investor relations firm) from July 2004 to present;
Executive Chairman and a Director of the Company from January 2013
to present; and Chief Executive Officer from July 17, 2020 to
present.
Former:
Interim President from June 2011
to October 2018; Interim CEO of the Company from November 2012 to
October 2018; Head of Internal Affairs of the Company from October
2018 to February 2019; and Interim President and Interim Chief
Executive Officer of the Company from February 2019 to April
2019.
|

Greg
Hall (1)(2)(5)
Age:
63
|
Independent
Director
|
October
21, 2009
|
Present:
Co-Founder
and Director of the Company from October 21, 2009 to present;
President and Director of Water Street
Assets; Director of CanX CBD Processing and a Member of the
Institute of Corporate Directors.
Former:
Founding Partner & Director of PI Financial;
Partner and Director of Haywood Securities; VP of Canaccord
Genuity; Sr. VP of Leede Jones Gable; Director and Audit Chairman
of Silvercorp Metals (NYSE); and Co-Founding Shareholder and
Director of Numinus Wellness.
|

Marc
Leduc (1)(2)
Age:
59
|
Independent
Director
|
July
22, 2019
|
Present:
Independent
Director of the Company from July 22, 2019 to present; Chief
Operating Officer of KORE Mining Ltd. from October 29, 2019 to
present; Director of South Star Mining Corp. from March 25, 2019 to
present, and Director of South Atlantic Gold from April 8, 2020 to
present.
Former:
President, Chief Executive and a
Director of Luna Gold Corp. from January 30, 2015 to August 14,
2016; COO and Interim President and CEO of NewCastle Gold from
October 1, 2016 to December 31,2017, EVP of US Operations for
Equinox Gold January 1, 2018 to March 31, 2019 and Director of
Rupert Resources Ltd. from April 10, 2013 to December 7,
2016.
|
98
|
Name and Age
|
Current Office Held
with the Company
|
Current director and/or
Executive Office Since
|
Principal Occupation During Last Five Years (3)
|

Masa
Igata (1)(2)
Age:
60
|
Independent
Director
|
April
23, 2014
|
Present:
Director of the Company from
April 23, 2014 to present; Founder and Chief Executive Officer of
Frontier LLC (Mongolia from March 2007 to present and Founder and
Chief Executive Officer of Frontier Japan from January 2015 to
present.
|

David
H. Smith (6)
Age:
73
|
Independent
Director
|
August
3, 2020
|
Present:
Director of
the Company from August 2020 to present; Senior Analyst for The
Morgan Report.com; regular contributor to Money Metals Exchange;
regular Contributor by Invitation to The Prospector News; and a
ghostwriter.
|

Ronald
Espell
Age:
60
|
Vice-President,
Environment
and Sustainability
|
October
29, 2018
|
Present:
Vice-President, Environment and Sustainability of the Company from
November 2018 to present.
Former:
VP Environment of American
Vanadium Corp. from April 2012 to April, 2015; Principal Consultant
of SRK Consulting from April, 2015 to April, 2016; Corporate
Environmental Director of McEwen Mining Inc. from April, 2016 to
November, 2017.
|

Danniel
Oosterman
Age:
48
|
Vice-President,
Exploration
|
February
20, 2018
|
Present:
Vice-President, Exploration of the Company from February 2018 to
present.
Former:
President & CEO of Canstar
Resources Inc. from March 2013 to December 2017.
|

Joaquin
Merino-Marquez
Age:
53
|
Vice-President, South
American Operation
|
November 1, 2019
|
Present:
Vice-President, South American
Operations of the Company from November 1, 2019 to present;
President and a Director of Emerita Resources Corp. (
Formerly “Emerita Gold
Corp.”)
from January 11, 2013 to present.
|
99
|
Name and Age
|
Current Office Held
with the Company
|
Current director and/or
Executive Office Since
|
Principal Occupation During Last Five Years (3)
|

Irina
Plavutska
Age:
63
|
Chief
Financial Officer
|
September
11, 2013
|
Present:
Chief Financial Officer of the
Company from September 13, 2013 to present.
|

Brigitte
McArthur
Age:
57
|
Corporate
Secretary
|
November
15, 2019
|
Present
:
Corporate Secretary of the Company
from November 15, 2019 to present.
President and Director
of RJL Consultant Ltd. from November 2006 to
present.
Former:
Corporate Secretary of
Nevsun Resources Ltd. from March 2018 to January 2019; and Admin,
Officer I Corp. Secretary Dept. of HSBC Bank Canada from August
2015 to March 2018.
|
Notes:
(1)
Member of the Audit
Committee.
(2)
Member of the
Corporate Governance and Compensation Committee.
(3)
The information as
to principal occupation, business or employment is not within the
knowledge of our management and has been furnished by the
respective individuals. Each director or officer has held the same
or similar principal occupation with the organization indicated or
a predecessor thereof for the last five years.
(4)
Mr. Lee was
appointed Chief Executive Officer upon the departure of Michael
Doolin effective July 17, 2020.
(5)
Mr. Hall is the
Chair of the Audit Committee and Chair of the Corporate Governance
and Compensation Committee.
(6)
Mr. Smith was
appointed a Director of the Company on August 3, 2020.
During
the year ended December 31, 2020, the Company experienced the
following changes in Directors, Officers and
Management:
●
Michael Doolin
ceased to act as Chief Executive Officer on July 17,
2020;
●
John Lee was
appointed Chief Executive Officer effective July 17,
2020;
●
Ronald Clayton
resigned as a Director on July 31, 2020; and
●
David H. Smith was
appointed as a Director on August 3, 2020.
Biographical Information of Directors and Senior
Management
The
following are brief biographies of our directors and senior
management as of December 31, 2020:
John Lee
is the Chief Executive Officer, Executive Chairman
and has been a Director of the Company since October 2009. Mr. Lee
has been an accredited investor in the resource industry since
2001. Under John’s leadership, the Company raised over $110
million and grew from having minimal assets to owning substantial
assets in USA, Bolivia and Mongolia. Mr. Lee is a CFA charter
holder and has degrees in economics and engineering from Rice
University. Since joining the Company Mr. Lee has led the Company
in making several timely project acquisitions and has also
identified, negotiated and financed Pulacayo Project acquisition in
2015 and the Gibellini Project acquisition in 2017.
Greg Hall
is a Co-Founder of the Company and has been an
Independent Director since October 2009.
As corporate director of several public companies
since 2003, Mr. Hall has been involved in strategic planning,
mergers and acquisitions, and investment decisions. Currently Mr.
Hall is President and Director of Water Street Assets, Director of
CanX CBD Processing and a Member of the Institute of Corporate
Directors.
Mr. Hall is a graduate of the Rotman School of
Management, University of Toronto, SME Enterprise Board Program,
and a Member of the Institute of Corporate Directors.
100
Masa Igata
has been an Independent Director of the Company
since April 2014. Mr. Masa Igata, Founder & CEO of Frontier LLC
and Frontier Japan, has more than 30 years of professional
experience in Asian financial markets. Prior to establishing
Frontier Securities(Later renamed as Frontier LLC) in 2007, he had
been a Managing Director at Salomon Brother/Citigroup/Nikko
Citigroup in Tokyo leading the company to be the most profitable
foreign investment bank in Japan for more than the decade. After
leaving the firm in 2004, Mr. Igata became interested in
Mongolia’s fast-growing economy, and began to develop close
relationships with many Mongolian businesses since then. Mr. Igata
has since invested in Mining, Finance and real estate sector in
Japan, Mongolia, Canada and China through his own companies in each
region. In addition, with proven expertise on cross-border capital
raising, Mr. Igata has been actively promoting Mongolian investment
opportunities to foreign investors and advocating capital
market’s best practices in Mongolia to ensure and enhance its
access to foreign investors through a full range of financial
services, corporate access and research. In addition, he has
extensively advised the Government of Mongolia, several government
agencies and major corporate in Mongolia on fund raising, corporate
governance and value enhancement. In Japan, Mr. Igata has been
advising to major mining companies on corporate governance,
investor relations and the outlook on the global mining sector.
Hosting Invest Mongolia Tokyo is one of the service to facilitate
himself and Japanese investors to access to the Government and the
Business in Mongolia. In addition, Mr. Igata has been actively
advising to Japanese Government and Government related agencies on
the various issues on the global mining industry. Mr. Igata is a
certified member of the Securities Analyst Association of Japan and
an Advisory Member of the Board at Business Council of Mongolia
(BCM). Mr. Igata was conferred a decoration of Nairamdal
(Friendship) from President of Mongolia Tsakhiagiin Elbegdorj on
June 2017.
Marc Leduc
has been an Independent Director of the Company
since July 2019. Mr. Leduc is a mining engineer and geologist with
more than 30 years’ experience involving all aspects of the
development, operations, planning and evaluation of mining
projects. Mr. Leduc holds a B.Sc. (Hons) degree in Mining
Engineering from Queen’s University Kingston, and B.Sc.
degree in Geology from the University of Ottawa, and he is a
registered professional engineer in both Ontario and BC. Mr. Leduc
has led technical teams in the design and construction of large
mines, heap leach and tailings facilities. Mr. Leduc has held top
management positions with several mining companies including most
recently Chief Operating Officer and Interim CEO of NewCastle Gold
Ltd before it was acquired in 2017 via merger with Trek Mining Inc.
and Anfield Gold Corp. (now named Equinox Gold Corp.). Mr. Leduc,
following the merger, remained with Equinox Gold for all of 2018
and into 2019 holding the position of Senior Vice President of US
Operations. Mr. Leduc currently holds the position of COO with Kore
Mining and is an independent director of South Star Mining and
South Atlantic Gold. Mr. Leduc spent several years working in Peru
as the President and COO for Bear Creek Mining Corp, a silver
exploration and development company.
David H. Smith
has been an Independent Director of the
Company since August 2020. He is a Senior Analyst for The Morgan
Report.com, a regular contributor to Money Metals Exchange and a
regular Contributor by Invitation to The Prospector News, and a
ghostwriter.
Irina Plavutska
has been with the Company since 2010 and was
appointed Chief Financial Officer in April 2011. Ms. Plavutska is a
professional accountant with over 20 years of international
experience in financial reporting, auditing, and accounting. Ms.
Plavutska is a member of Chartered Professional Accountants
Canada.
Ronald Espell
was appointed Vice President, Environment and
Sustainability in October 2018. Mr. Espell is a highly regarded
specialist in U.S. federal and Nevada state mine permitting, with
over 30 years of experience in corporate environmental management,
permitting in conformance with applicable regulatory and
performance standards, mine waste management, reclamation, and
closure planning. Prior to joining the Company, Mr. Espell was the
corporate environmental director of McEwen Mining Inc. Within 18
months from the time he joined McEwen Mining, Mr. Espell led his
team to successfully obtain the Gold Bar project’s
environmental impact statement (EIS) approval from the BLM in
November 2017. Prior to his time with McEwen Mining, Mr. Espell was
a principal consultant at SRK Consulting and Vice-President of
Environment for the Gibellini Project’s prior operator, where
he led efforts in the preparation of the Gibellini Project’s
baseline studies and plan of operation. Mr. Espell’s wealth
of experience includes being an environmental management specialist
at the Nevada Division of Environmental Protection, as well as
working for 17 years in positions of increasing responsibility at
Barrick Gold Corp., from being Environmental Superintendent,
Environmental Manager of Barrick Goldstrike, Regional Environmental
Director — Australia Pacific, and Corporate Environmental
Director.
Danniel Oosterman
was appointed Vice-President, Exploration
in February 2018. Mr. Oosterman worked for 20 years in the mining
and exploration business specializing in exploration and
development of projects from grass roots, brown field, to
feasibility stage. Mr. Oosterman’s background includes
occupying both technical and executive roles, with an early career
joining exploration efforts for mining companies such as
Falconbridge Ltd. and Inco Limited before transitioning to the
junior mining sector to manage many technical projects across
Canada before advancing to President and CEO of Canstar Resources
Inc., a TSX Venture Exchange-listed company. He holds a B.Sc.
(Hons) degree in Geology from Laurentian University and is a member
of the Association of Professional Geoscientists of Ontario. Mr.
Oosterman is closely involved in the development of the
Company’s Gibellini Project and exploration of the Pulacayo
Project. Mr. Oosterman is a “qualified person” within
the meaning of NI 43–101.
101
Joaquin Merino-Marquez
was appointed Vice-President, South
American Operations in November 2019. Based in Bolivia, Mr.
Merino-Marquez is a professional geologist with 27 years of
experience in the mining industry. Mr. Merino-Marquez is currently
the President and a Director of Emerita Resources Corp. (Formerly
“Emerita Gold Corp.”) since January 11, 2013. Prior
industry affiliations include roles as vice-president of
exploration for Primero Mining Corp. and vice-president of
exploration for Apogee Minerals Ltd. Prior to Apogee, Mr.
Merino-Marquez was the exploration manager for Placer Dome at the
Porgera mine and a mine geologist at Hecla Mining’s La
Camorra mine. Mr. Merino-Marquez is a native Spanish speaker and
fluent in English. He holds a Master of Science from Queens
University and a Bachelor of Science in geology from University of
Seville (Spain). He is a member of the Association of Professional
Geoscientists of Ontario. From 2006 to 2010, Mr. Merino-Marquez
lived in Bolivia and led Apogee’s 85,000-meter drill campaign
at Pulacayo and Paca silver projects. The drill campaign was a
success and defined over 90 million ounces of silver resources
according to independent, third party estimates (which are now
considered historic in nature and should not be relied up on as
they are no longer National Instrument 43-101
compliant).
Brigitte McArthur
was appointed Corporate Secretary in
November 2019. Ms. McArthur brings over 30 years’ experience
working with private and publicly trading companies. Ms. McArthur
is the President and Director of RJL Consultant Ltd., a private
company that provides corporate secretarial and governance
services. Previous to joining the Company, Ms. McArthur served as
Corporate Secretary of Nevsun Resources Ltd. until being acquired
by Zijin Mining Group Company Limited. Throughout her extensive
experience, Ms. McArthur has been responsible for all aspects of
corporate governance and regulatory matters.
B.
Compensation
Executive Officers
For the
purposes of this Annual Report, “executive officer” of
the Company means an individual who at any time during the year was
the Chief Executive Officer (“CEO”), President or Chief
Financial Officer (“CFO”) of the Company; any
Vice-President in charge of a principal business unit, division or
function; and any individual who performed a policy-making function
in respect of the Company.
Set out
below are particulars of compensation paid to the following persons
(the “Named Executive Officers” or “NEOs”)
for the fiscal year ended December 31, 2020:
1.
the
CEO;
2.
the
CFO;
3.
each of the three
most highly compensated executive officers, or the three most
highly compensated individuals acting in a similar capacity, other
than the CEO and CFO, at the end of the most recently completed
financial year whose total compensation was, individually, more
than $150,000 for that financial year; and
4.
any individual who
would be a NEO under paragraph (3) but for the fact that the
individual was neither an executive officer of the Company, nor
acting in a similar capacity, at the end of that financial
year.
102
The
Company has no pension, defined contribution, or deferred
compensation plans for its directors, executive officers or
employees.
|
|
|
|
|
|
Non-equity incentive
plan compensation
($)
|
|
|
|
|
|
Name and Position
|
Year
|
Salary
($)
|
Share based awards
($)
|
Option-based awards
(1)
($)
|
Annual
incentive
plans
|
Long-term
incentive
plans
|
Pension
value
($)
|
All other
compensation
($)
(4)
|
Total
compensation
($)
|
|
John Lee
(2)(10)
Executive
Chairman, Chief Executive Officer & Director
|
2020
2019
2018
|
Nil
Nil
Nil
|
Nil
320,000
(11)
Nil
|
174,476
21,908
(3)
(6)
80,064
|
Nil
Nil
Nil
|
Nil
Nil
Nil
|
Nil
Nil
Nil
|
426,792
(5)
377,370
(5)
406,468
(5)
|
601,268
719,278
486,532
|
|
Irina Plavutska
CFO
|
2020
2019
2018
|
145,200
143,152
118,500
|
Nil
40,000
(11)
Nil
|
43,619
7,303
(3)
17,617
|
Nil
Nil
Nil
|
Nil
Nil
Nil
|
Nil
Nil
Nil
|
6,792
6,370
5,424
|
195,611
196,825
141,541
|
|
Danniel Oosterman
(6)
Vice-President
Exploration
|
2020
2019
2018
|
151,800
138,000
108,015
|
Nil
40,000
(11)
Nil
|
43,619
12,342
(3)
42,192
|
Nil
Nil
Nil
|
Nil
Nil
Nil
|
Nil
Nil
Nil
|
Nil
Nil
Nil
|
195,419
190,342
150,207
|
|
Ronald Espell
(7)
VP,
Environment and Sustainability
|
2020
2019
2018
|
335,317
331,674
Nil
|
Nil
60,000
(11)
Nil
|
95,213
7,303
(3)
Nil
|
Nil
Nil
Nil
|
Nil
Nil
Nil
|
Nil
Nil
Nil
|
19,603
29,548
Nil
|
450,134
428.525
Nil
|
|
Joaquin Merino-Marquez
(8)
VP,
South American Operation
|
2020
2019
2018
|
Nil
Nil
Nil
|
Nil
Nil
Nil
|
96,124
Nil
Nil
|
Nil
Nil
Nil
|
Nil
Nil
Nil
|
Nil
Nil
Nil
|
208,728
Nil
Nil
|
304,852
Nil
Nil
|
|
Michael Doolin
(2) (9)
Former CEO & COO
|
2020
2019
2018
|
259,021
298,469
Nil
|
Nil
265,000
(11)
Nil
|
75,676
74,387
Nil
|
Nil
Nil
Nil
|
Nil
Nil
Nil
|
Nil
Nil
Nil
|
6,526
10,672
Nil
|
341,224
648,528
Nil
|
Notes:
1)
Amounts shown in
this column represent Options granted as part of the annual
compensation package of each NEO. Fair value at the time of grant
calculated using the Black-Scholes option pricing model using the
assumption Value calculated based on the difference between the
closing price of the Common Shares on December 31, 2020 - $0.49
(2019 - $0.39; 2018 - $0.27) and the option exercise
price.
2)
John Lee and
Michael Doolin did not receive compensation for acting as a
Director of the Company.
3)
Stock options
granted on July 29, 2019 were not valued at December 31, 2019 due
to the following: further to the voluntary forfeiture of stock
options with expire dates on April 7, 2020, June 22, 2020, and
November 14, 2023, at exercise prices ranging from $0.50 to $0.65,
the Company granted 794, 000 new stock options with an expire date
of July 29, 2024 at an exercise price of $0.20 per share. As of
December 31, 2019, the re-issuing of these options had been
approved by the TSX, but they had not been approved by the
shareholders; consequently, these options were not valued.
Subsequently the stock options were ratified and approved by the
shareholders at the Company’s special meeting of shareholders
held March 16, 2020.
4)
All Other
Compensation for NEOs is comprised of payments for health Benefits
amongst other things which are made on behalf of all corporate
employees of the Company.
103
5)
All other
Compensation for Mr. Lee consisted of the following: Linx Partners
Ltd., a private company controlled by John Lee, our Chief Executive
Officer, Executive Chairman and a director of the Company, has
provided management and consulting services to the Company since
April 7, 2015 (prior to that, from June 13, 2011, Mr. Lee’s
management and consulting services were provided to the Company
though Mau Capital Management LLC, another private company
controlled by Mr. Lee). During the year ended December 31, 2020, we
paid $420,000 (2019 - $371,000; 2018 - $401,044) for management and
consulting services rendered to the Company by Linx Partners Ltd.
and $6,792 (2019 - $6,370; 2018 - $5,424) for health
benefits
6)
Danniel Oosterman
was appointed Vice President Exploration on February 2,
2018.
7)
Ronald Espell was
appointed VP, Environment and Sustainability on October 29,
2018.
8)
Joaquin
Merino-Marquez was appointed VP, South American Operations on
November 1, 2019.
9)
Michael Doolin was
appointed Chief Executive Officer and Chief Operating Officer on
April 1, 2019 and ceased to act as Chief Executive Officer and
Chief Operating Officer on July 17, 2020. Mr. Lee assumed the role
of Chief Executive Officer effective July 17, 2020.
10)
Mr. Lee was
appointed the role of Chief Executive Officer effective July 17,
2020.
11)
On January 6, 2020,
the Company issued bonus Common Shares with a fair value of $0.40
per share to executive officers under the Share- Based Compensation
Plan. The bonus Common Shares were based on the year ended December
31, 2019.
D
uring
the years ended December 31, 2020, 2019 and 2018, the stock option
values were calculated using the following weighted average
assumptions:
|
|
|
|
|
Year ended December 31,
|
||
|
|
|
|
|
2020
|
2019
|
2018
|
|
Risk-free
interest rate
|
|
|
|
1.46%
|
1.54%
|
1.77%
|
|
Expected
life of options in years
|
|
|
4.06
|
4.45
|
4.40
|
|
|
Expected
volatility
|
|
|
|
132.47%
|
132.75%
|
135.71%
|
|
Expected
dividend yield
|
|
|
|
Nil
|
Nil
|
Nil
|
|
Expected
forfeiture rate
|
|
|
|
12%
|
12%
|
12%
|
|
Weighted
average fair value of options granted during the
period
|
$0.30
|
$0.31
|
$0.32
|
|||
The
expected volatility used in the Black-Scholes option pricing model
is based on the historical volatility of the Common Shares. The
expected forfeiture rate is based on the historical forfeitures of
options issued.
Directors
Independent
directors are paid varying amounts depending on the degree to which
they are active on behalf of the Company. See the table below for
amounts paid or accrued in fiscal year 2020.
The
compensation provided to directors who were not an executive
officer for the Company’s most recently completed financial
year of December 31, 2020, are as follows:
|
Name
|
Fees Earned ($)
|
Share-Based
Awards
($)
|
Option-Based
Awards
($)
(4)
|
Non-equity Incentive
Plan Compensation
|
Pension
Value
|
All other
Compensation ($)
|
Total ($)
|
|
Greg
Hall
|
26,800
|
Nil
|
21,810
|
Nil
|
Nil
|
Nil
|
48,610
|
|
Masa
Igata
|
20,100
|
Nil
|
21,810
|
Nil
|
Nil
|
Nil
|
41,910
|
|
Marc
Leduc
|
19,100
|
Nil
|
21,810
|
Nil
|
Nil
|
Nil
|
40,910
|
|
Ronald
Clayton
(1)
|
11,100
|
Nil
|
45,406
|
Nil
|
Nil
|
Nil
|
56,506
|
|
David
H. Smith
(2)
|
7,500
|
Nil
|
20,638
|
Nil
|
Nil
|
Nil
|
28,138
|
Notes:
1.
Ronald Clayton
resigned as a Director on July 31, 2020 2020.
2.
David H. Smith was
appointed as a Director on August 3, 2020.
Description of Compensation Plan
We have
adopted the Share-Based Compensation Plan. The purpose of the
Share-Based Compensation Plan is to allow us to grant options,
bonus Common Shares and stock appreciation rights (the "Awards") to
directors, officers, employees and consultants, as additional
compensation, and as an opportunity to participate in our success.
The granting of Awards is intended to align the interests of such
persons with that of our shareholders.
104
Options
are exercisable for up to 10 years from the date of grant or as
determined by the corporate governance and compensation committee
of our Board (the "CGCC") and are required to have exercise prices
equal to or greater than the market price (as defined by the stock
exchange on which our Common Shares are principally listed for
trading and based on the volume weighted average trading price of
our Common Shares as reported on such exchange for the five trading
days immediately preceding the day that the options are granted).
Options granted under the Share-Based Compensation Plan vest at
12.5% per quarter over a two-year period unless determined
otherwise by the CGCC. In addition, the CGCC may accelerate the
vesting date, permit the conditional exercise of options, amend or
modify the terms of the options, or terminate options pursuant to
the Share-Based Compensation Plan, the CGCC may from time to time
authorize the issuance of Awards to directors, officers, employees
and consultants of the Company or employees of companies providing
management or consulting services to the Company. The maximum
number of Common Shares which may be reserved for issuance under
the Share-Based Compensation Plan is 14,374,419, which was approved
at the Company’s AGM held September 12, 2019.
C.
Board
Practices Overview
Our
Board has a formal mandate as outlined in our Corporate Governance
Policies and Procedures Manual, as amended (the "Manual"). The
Manual mandates the Board to: (i) oversee management of the
Company, (ii) exercise business judgment, (iii) understand the
Company and its business, (iv) establish effective systems, (v)
protect confidentiality and proprietary information, and (vi)
prepare for and attend Board, committee and shareholder meetings.
The Manual also includes written charters for each committee and it
contains a Code of Ethics, policies dealing with issuance of news
releases and disclosure documents, as well as Common Share trading
black-out periods. Further, in the Manual, the Board encourages but
does not require continuing education for all the Company’s
directors.
Term of Office
Unless
the director’s office is vacated earlier in accordance with
the provisions of the BCBCA, each of our current directors will
hold office until the conclusion of the next annual meeting of the
Company’s shareholders or if no director is then elected,
until a successor is elected.
John
Lee, our Chief Executive Officer and Executive Chairman, will hold
his office for an indefinite period until the termination of our
consulting agreement dated February 20, 2018 with his wholly-owned
company, Linx. Our consulting agreement with Linx may be terminated
without cause by either party upon 90 days’ written notice,
or immediately by us for cause.
Irina
Plavutska, our Chief Financial Officer, will hold her office for an
indefinite period until the termination of our employment agreement
dated February 1, 2018. Our employment agreement with Ms. Plavutska
may be terminated by us without cause upon the amount of written
notice required by the British Columbia Employment Standards Act
based on each employee’s respective length of service, or
immediately for cause. Ms. Plavutska may terminate her employment
with us upon two weeks’ written notice.
Ronald
Espell, our Vice-President, Environment and Sustainability, will
hold his office for an indefinite period until the termination of
our subsidiary Nevada Vanadium’s employment agreement with
him dated October 23, 2018. Nevada Vanadium’s employment
agreement with Mr. Espell may be terminated by Nevada Vanadium
without cause upon 30 days’ written notice and payment of a
severance amount equal to 6 months’ salary during the first
three years that Mr. Espell is employed, or one month’s
salary for each full year that Mr. Espell is employed after three
years, by Nevada Vanadium, or immediately for cause. Mr. Espell may
terminate his employment with Nevada Vanadium upon 30 days’
written notice.
Danniel
Oosterman, our Vice-President, Exploration, will hold his office
for an indefinite period on a month-to-month basis until the
termination of our consulting agreement dated February 12, 2018.
Our consulting agreement with Mr. Oosterman may be terminated by us
or by Mr. Oosterman upon thirty days’ written
notice.
Joaquin
Merino-Marquez, our Vice-President, South American Operation, will
hold his office for an indefinite period on a month-to-month basis
until the termination of our consulting agreement dated November 1,
2019. Our consulting agreement with Mr. Merino-Marquez may be
terminated by us or by Mr. Merino-Marquez upon sixty days’
written notice.
Brigitte
McArthur, our Corporate Secretary, will hold her office for an
indefinite period until the termination of our employment agreement
dated November 15, 2019. Our employment agreement with Ms. McArthur
may be terminated by us without cause upon the amount of written
notice required by the British Columbia Employment Standards Act
based on each employee’s respective length of service, or
immediately for cause. Ms. McArthur may terminate her employment
with us upon two weeks’ written notice.
The
period during which each of our directors and executive officers
has held their respective office is specified in the table set
forth in “
Item 6.A.
Directors, Senior Management and Employees - Directors and Senior
Management
.”
Termination and Change of Control Benefits
Other
than as set out below, there are no contracts, agreements, plans or
arrangements that provide for payments to a NEO following or in
connection with any termination (whether voluntary, involuntary or
constructive), resignation, retirement, change of control of the
Company or change in responsibilities of the NEO.
105
John Lee, Chief Executive officer & Executive
Chairman
On
January 1, 2010, the Company entered into a consulting agreement
with a holding company solely owned by Mr. Lee, at an annual fee of
$16,000 (as amended). On November 6, 2012 this agreement was
terminated and on November 7, 2012 a new consulting agreement was
entered into (which we refer to as the “Mau
Agreement”). On April 7, 2015, the Mau Agreement was
terminated, and the Company entered into an agreement with Linx
that subsequently, on October 9, 2018, was replaced with another
agreement with Linx Partners Ltd. (“Linx”) (which we
refer to as the “New Linx Agreement”) for an indefinite
term. The New Linx Agreement provides for: (1) consulting fees of
$336,000 per year, with up to $33,600 per year annual increases
during fiscal years 2020 to 2022, at the discretion of the Board of
Directors; (2) bonus, based on pre-determined criteria; (3) up to
3,000,000 Common Shares upon meeting certain milestone targets
described in the New Linx Agreement; (4) stock options; (5) health
and dental benefits; and (6) vacation pay.
The New
Linx Agreement may be terminated by the Company at any time for any
reason other than for cause upon a 90 days’ written notice.
If the Company terminates the New Linx Agreement for any reason
other than cause, the Company shall pay a termination payment of
either $1,600,000, which shall include all applicable taxes,
provided the Company has successfully raised total gross aggregate
proceeds of no less than $25,000,000 through one or more equity
financing(s) undertaken after October 9, 2018, or the lesser amount
of $1,000,000, which shall include all applicable taxes, in the
event the Company has not successfully raised total gross aggregate
proceeds of no less than $25,000,000 through one or more equity
financing(s) undertaken after October 9, 2018. Linx may terminate
the Linx Agreement by providing the Company with a 90 days’
written notice.
The
Company entered into a Change of Control Agreement with Linx (the
"Linx Change of Control Agreement") dated October 9, 2018. The Linx
Change of Control Agreement provides that in the event the New Linx
Agreement is terminated as a result of, or within six months
following, a significant change in the affairs of the Company such
as a take-over bid, change of control of the Board, the sale,
exchange or other disposition of a majority of the outstanding
Common Shares, the merger or amalgamation or other corporate
restructuring of the Company in a transaction or series of
transactions in which the Company’s shareholders receive more
than 50% of the outstanding Common Shares of the new or continuing
company, and upon an involuntary termination, Mr. Lee shall receive
from the Company within 30 days: i) a payment of $1,600,000; ii)
reimbursement for all reasonable business related promotion,
entertainment and/or travel expenses incurred by Linx during the
course of the Linx Agreement with the Company, subject to the
expense reimbursement provisions set out in the Linx Agreement;
iii) Mr. Lee’s entitlement to participate in the
Company’s annual bonus plan in respect of the calendar year
in which the involuntary termination has occurred, and the prior
year if such payment has not yet been made; iv) provide Mr. Lee and
his eligible dependents with coverage under the Company’s
Benefit Plans for a period of 30 days after termination of the Linx
Agreement; and v) all of Mr. Lee’s rights to any stock
options he holds shall be governed by the provisions of his stock
option agreements with the Company.
Irina Plavutska, Chief Financial Officer
Ms.
Plavutska entered into her latest employment agreement with the
Company effective February 1, 2018, as amended January 31, 2019.
The employment agreement is for an indefinite term and provides
for: (1) salary; (2) bonus, at the discretion of the Company; (3)
stock options; (4) employee benefits; and (5) vacation pay. Her
employment agreement with the Company also provides that in the
event her employment is terminated as a result of, or within six
months following, a Change in Control, Ms. Plavutska shall receive
from the Company within 30 days, a payment equal to two years of
her regular annual salary (currently $145,200). In the event Ms.
Plavutska’s employment agreement is terminated as a result of
a Change in Control, all of her rights to any stock options she
holds shall be governed by the provisions of her stock option
agreements with the Company including, without limitation,
acceleration of vesting and the time period remaining to exercise
any vested options.
Brigitte McArthur, Corporate Secretary
Ms.
McArthur entered into her employment agreement with the Company on
November 15, 2019. The employment agreement is for an indefinite
term and provides for: (1) salary; (2) bonus, at the discretion of
the Company; (3) stock options; (4) employee benefits; and (5)
vacation pay. Her employment agreement with the Company also
provides that in the event her employment is terminated as a result
of, or within six months following, a Change in Control, Ms.
McArthur shall receive from the Company within 30 days, a payment
equal to one year of her regular annual salary (currently $90,000).
In the event Ms. McArthur’s employment agreement is
terminated as a result of a Change in Control, all of her rights to
any stock options she holds shall be governed by the provisions of
her stock option agreements with the Company including, without
limitation, acceleration of vesting and the time period remaining
to exercise any vested options.
The
criteria used to determine the amounts payable to the NEOs is based
on industry standards and the Company’s financial
circumstances. The agreements with the NEOs and subsequent changes
were accepted by the Board based on recommendations of the
CGCC.
106
Board Committees
Applicable
regulatory governance policies require that: (i) committees of the
our board of directors be composed of at least a majority of
independent directors; (ii) our Board expressly assume
responsibility, or assign to a committee of the Board,
responsibility for the development of the Company’s approach
to governance issues; (iii) the audit committee of the Board (the
“Audit Committee”) be composed only of independent
directors, and the role of the Audit Committee be specifically
defined and include the responsibility for overseeing
management’s system of internal controls; (iv) the Audit
Committee have direct access to the Company’s external
auditor; and (v) the Board appoint a committee, composed of a
majority of independent directors, with the responsibility for
proposing new nominees to the Board and for assessing directors on
an on-going basis.
Audit Committee
We have
an Audit Committee comprised of directors Greg Hall (Chair), Masa
Igata and Marc Leduc. All members of the Audit Committee are
financially literate within the meaning of
National Instrument 52-110 Audit
Committees
. Messrs. Hall, Igata and Leduc are independent
under the criteria established by SEC Rule 10A-3. The relevant
education and experience of each member of the Audit Committee is
described under “Item 6.A. Directors, Senior Management and
Employees - Directors and Senior Management” above. The terms
of reference of the Audit Committee are given in the charter of the
Audit Committee, attached hereto as Exhibit 2.2.
Corporate Governance and Compensation Committee
The
Board has a CGCC (as previously defined) whose functions include
reviewing, on an annual basis, the compensation paid to the
Company’s executive officers and directors, reviewing the
performance of the Company’s executive officers, and making
recommendations on compensation to the Board. The CGCC periodically
considers the grant of incentive Awards under the Share-Based
Compensation Plan. The CGCC currently consists of Greg Hall
(Chairman), Masa Igata and Marc Leduc. All members have direct
experience relevant to their responsibilities on the CGCC. The
Board has not made a determination on whether Messrs. Hall, Igata
and Leduc meet the independence requirements for members of the
compensation committee established under NYSE American Company
Guide Section 805(c)(1).
D.
Employees
As of
December 31, 2018, we had four employees in Canada, seven employees
in Mongolia, and four non-independent consultants working in
Bolivia, Canada and the United States.
As of
December 31, 2019, we had three employees in Canada, ten employees
in Mongolia, and four non-independent consultants working in
Bolivia, Canada and the United States.
As of
December 31, 2020, we had three employees in Canada, 10 employees
in Mongolia, 1 employee working in the United States and 5
non-independent consultants working in Bolivia, Canada and the
United States.
We rely
on and engage consultants on a contract basis to assist us to carry
on our administrative and exploration activities
107
E.
Share
Ownership
The
following table sets forth certain information as of March 12, 2021
regarding the beneficial ownership of our Common Shares by the
executive officers, officers and directors named herein. The
percentage of Common Shares beneficially owned is computed on the
basis of 200,542,449 Common Shares outstanding as of March 12,
2021.
|
Name and Title
|
Common
Shares
Held
|
Percentage of Common Shares as at March 12, 2021 (%)
|
Stock Options Granted
|
Exercise Price of Stock Options ($)
|
Date of Expiration (Stock Options)
|
|
John
Lee,
Chief
Executive Officer and Executive Chairman
|
9,610,211
(1)
|
4.8
|
500,000
|
0.20
|
2-Jun-21
|
|
|
|
|
300,000
|
0.49
|
12-Jan-22
|
|
|
|
|
550,000
|
0.33
|
12-Jun-22
|
|
|
|
|
680,000
|
0.35
|
1-Sep-22
|
|
|
|
|
400,000
|
0.28
|
6-Apr-23
|
|
|
|
|
350,000
|
0.33
|
17-Oct-23
|
|
|
|
|
700,000
|
0.20
|
29-Jul-24
|
|
|
|
|
300,000
|
0.44
|
1-Nov-24
|
|
|
|
|
800,000
|
0.22
|
4-May-25
|
|
Greg
Hall, Director
|
183,092
|
*
|
120,000
|
0.20
|
2-Jun-21
|
|
|
|
|
50,000
|
0.49
|
12-Jan-22
|
|
|
|
|
50,000
|
0.33
|
12-Jun-22
|
|
|
|
|
50,000
|
0.35
|
1-Sep-22
|
|
|
|
|
40,000
|
0.28
|
6-Apr-23
|
|
|
|
|
50,000
|
0.33
|
17-Oct-23
|
|
|
|
|
120,000
|
0.20
|
29-Jul-24
|
|
|
|
|
80,000
|
0.44
|
1-Nov-24
|
|
|
|
|
100,000
|
0.22
|
4-May-25
|
|
Marc
Leduc, Director
|
23,585
|
*
|
150,000
|
0.20
|
29-Jul-24
|
|
|
|
|
80,000
|
0.44
|
1-Nov-24
|
|
|
|
|
100,000
|
0.22
|
4-May-25
|
|
Masa
Igata, Director
|
826,348
(2)
|
*
|
120,000
|
0.20
|
2-Jun-21
|
|
|
|
|
70,000
|
0.49
|
12-Jan-22
|
|
|
|
|
50,000
|
0.33
|
12-Jun-22
|
|
|
|
|
50,000
|
0.35
|
1-Sep-22
|
|
|
|
|
40,000
|
0.28
|
6-Apr-23
|
|
|
|
|
50,000
|
0.33
|
17-Oct-23
|
|
|
|
|
100,000
|
0.20
|
29-Jul-24
|
|
|
|
|
80,000
|
0.44
|
1-Nov-24
|
|
|
|
|
100,000
|
0.22
|
4-May-25
|
|
David
H. Smith, Director
|
0
|
*
|
50,000
|
0.20
|
2-Jun-21
|
|
|
|
|
120,000
|
0.50
|
17-Aug-25
|
|
Ronald
Espell, Vice-President,
Environment
and Sustainability
|
150,000
|
*
|
200,000
|
0.20
|
29-Jul-24
|
|
|
|
|
100,000
|
0.44
|
1-Nov-24
|
|
|
|
|
200,000
|
0.22
|
4-May-25
|
|
|
|
|
300,000
|
0.50
|
17-Aug-25
|
108
|
Name and Title
|
Common
Shares
Held
|
Percentage of Common Shares as at March 12, 2021 (%)
|
Stock Options Granted
|
Exercise Price of Stock Options ($)
|
Date of Expiration (Stock Options)
|
|
Danniel
Oosterman, Vice-President, Exploration
|
101,531
|
*
|
200,000
|
0.31
|
20-Feb-23
|
|
|
|
|
20,000
|
0.28
|
6-Apr-23
|
|
|
|
|
50,000
|
0.33
|
17-Oct-23
|
|
|
|
|
100,000
|
0.20
|
29-Jul-24
|
|
|
|
|
100,000
|
0.44
|
1-Nov-24
|
|
|
|
|
200,000
|
0.22
|
4-May-25
|
|
Joaquin Merino-Marquez, Vice-Président,
South American Operations
|
10,000
|
*
|
200,000
|
0.44
|
1-Nov-24
|
|
|
|
|
250,000
|
0.22
|
4-May-25
|
|
|
|
|
300,000
|
0.50
|
17-Aug-25
|
|
Irina
Plavutska, Chief Financial Officer
|
0
|
*
|
70,000
|
0.49
|
12-Jan-22
|
|
|
|
|
37,500
|
0.28
|
6-Apr-23
|
|
|
|
|
50,000
|
0.33
|
17-Oct-23
|
|
|
|
|
50,000
|
0.20
|
29-Jul-24
|
|
|
|
|
100,000
|
0.44
|
1-Nov-24
|
|
|
|
|
200,000
|
0.22
|
4-May-25
|
|
Brigitte
McArthur, Corporate Secretary
|
6,000
|
*
|
100,000
|
0.33
|
15-Nov-24
|
|
TOTAL
|
10,084,419
|
5.04%
|
9.227.500
|
|
|
Notes:
(*)
Indicates less than
1%.
1.
The equivalent of
9,325,901 are held directly by Mr. Lee and a total of 284,310
Common Shares are held by Merit Holdings Ltd., a private company
wholly owned and controlled by Mr. Lee.
2.
The Common Shares
and Stock Options are held by Sophir Asia Limited, a private
company wholly owned and controlled by Mr. Igata.
See
“
Description of Compensation
Plan
” for more details.
ITEM
7.
MAJOR
SHAREHOLDERS AND RELATED PARTY TRANSACTIONS
A.
Major
Shareholders
There
are no entities who, to our knowledge, own beneficially, directly
or indirectly, more than 5% of any class of our voting securities
(other than as set forth in the directors’ and
officers’ table).
Voting Rights
The
Company’s major shareholders do not have different voting
rights from our other shareholders.
Record Holders
As at
March 12, 2021, there were 275 holders of record of our Common
Shares, of which 81 were U.S. residents owning 2,234,897 Common
Shares (1.12%) of our outstanding Common Shares outstanding at that
time.
Control
The
Company is a publicly owned Canadian corporation, the shares of
which are owned by Canadian residents, U.S. residents, and
residents of other countries.
Change in Control
To the
best of the Company’s knowledge, there are no arrangements
the operation of which may result in a change in control of the
Company.
109
B.
Related
Party Transactions
The
related party transactions of the Company since January 1, 2020 are
presented below.
●
Linx Partners Ltd.,
a private company controlled by John Lee, our Chief Executive
Officer, Executive Chairman and a director of the Company, has
provided management and consulting services to the Company since
April 7, 2015 (prior to that, from June 13, 2011, Mr. Lee’s
management and consulting services were provided to the Company
though Mau Capital Management LLC, another private company
controlled by Mr. Lee).. During the year ended December 31, 2020,
we paid $420,000 and issued bonus Common Shares with a value of
$320,000 (2019 - $371,000; 2018 - $401,044) for management and
consulting services rendered to the Company by Linx Partners
Ltd.
●
MaKevCo Consulting
Inc., a private company 50% owned by Greg Hall, a director of the
Company, provides consulting services to the Company. During the
year ended December 31, 2020, we paid $26,800 and issued bonus
Common Shares with a value of $6,000 (2019 - $21,400; 2018 -
$21,200) for consulting services rendered to the Company by MaKevCo
Consulting Inc.
●
Sophir Asia Ltd., a
private company controlled by Masa Igata, a director of the
Company, provides consulting services to the Company. During the
year ended December 31, 2020, we paid $20,100 and issued bonus
Common Shares a value of $6,000 (2019 - $19,600; 2018 - $19,100)
for consulting services rendered to the Company by Sophir Asia Ltd.
A summary of related party transactions
by related party
and a summary of the
transactions
by nature
among the related parties is as follows:
|
|
Year
Ended
December
31,
2020
|
Year
Ended
December
31,
2019
|
Year
Ended
December
31,
2018
|
|
Directors and
officers
|
$
1,536,167
|
$
1,685,242
|
$
1,265,152
|
|
Linx Partners
Ltd.
|
740,000
|
371,000
|
401,044
|
|
MaKevCo Consulting
Inc.
|
32,800
|
21,400
|
21,200
|
|
Sophir Asia
Ltd.
|
26,100
|
19,600
|
19,100
|
|
TOTAL
|
$
2,335,067
|
$
2,097,242
|
$
1,706,496
|
|
|
Year
Ended
December
31,
2020
|
Year
Ended
December
31,
2019
|
Year
Ended
December
31,
2018
|
|
Consulting and
management fees
|
$
370,000
|
$
218,500
|
$
268,456
|
|
Directors’
fees
|
108,600
|
103,805
|
70,378
|
|
Mineral
properties
|
1,387,067
|
1,171,585
|
631,610
|
|
Salaries
|
469,400
|
603,352
|
736,052
|
|
TOTAL
|
$
2,335,067
|
$
2,097,242
|
$
1,706,496
|
As at
December 31, 2020, there are no related party loans and amounts due
to related parties were $1,800 (2019 - $30,533; 2018 -
$4,634).
C.
Interests
of Experts and Counsel
Not
applicable.
ITEM
8.
FINANCIAL
INFORMATION
A.
Consolidated
Statements and Other Financial Information
Consolidated Financial Statements
The
consolidated financial statements of the Company and the report of
the independent registered public accounting firm, Davidson &
Company LLP, are filed as part of this Annual Report under Item
18.
Legal or Arbitration Proceedings
Other
than as disclosed below, the Company has not been involved in any
legal or arbitration proceedings or regulatory actions which may
have, or have had in the recent past, significant effects on the
company’s financial position or profitability. The Company
accrues for liabilities when it is probable and the amount can be
reasonably estimated.
110
ASC Tax Claim
On
January 2, 2015, the Company acquired ASC Holdings Limited and ASC
Bolivia LDC (which together, hold ASC Bolivia LDC Sucursal Bolivia,
which in turn, held Apogee Silver Ltd.’s
(“Apogee”) joint venture interest in the Pulacayo
Project) and Apogee Minerals Bolivia S.A. by paying to Apogee
$250,000 in cash and issuing to Apogee 60 million Common Shares.
The Company agreed to assume all liabilities of these former Apogee
subsidiaries, including legal and tax liabilities associated with
the Pulacayo Project. During Apogee’s financial year ended
June 30, 2014, it received notice from the Servicio de Impuestos
Nacionales, the national tax authority in Bolivia, that ASC Bolivia
LDC Sucursal Bolivia, now the Company’s wholly-owned
subsidiary, owed approximately Bs42,000,000 in taxes, interest and
penalties relating to a historical tax liability in an amount
originally assessed at approximately $7,600,000 in 2004, prior to
Apogee acquiring the subsidiary in 2011.
Apogee
disputed the assessment and disclosed to the Company that it
believed the notice was improperly issued. The Company continued to
dispute the assessment and hired local legal counsel to pursue an
appeal of the tax authority’s assessment on both substantive
and procedural grounds. The Company received a positive Resolution
issued by the Bolivian Constitutional Court that among other
things, declared null and void the previous Resolution of the
Bolivian Supreme Court issued in 2011 (that imposed the tax
liability on ASC Bolivia LDC Sucursal Bolivia) and sent the matter
back to the Supreme court to consider and issue a new
resolution.
On
November 18, 2019 the Company received Resolution No. 195/2018
issued by the Supreme Court of Bolivia which declared the tax claim
brought by Bolivia’s General Revenue Authority against the
Company’s Bolivian subsidiary as not proven.
The
Resolution is final and binding. Hence neither the Company nor the
Company’s Bolivian subsidiaries owe any outstanding back
taxes to the Bolivian General Revenue Authority.
During
the year ended December 31, 2019, the Company and legal counsel
reassessed the status of tax rulings and determined that the
probability of a re-issuance of a tax claim against the Company in
connection with the above was remote. As a result, the Company has
written off the tax liability and recorded a debt settlement gain
in the amount of $7,952,700 on its consolidated statements of
operations and comprehensive loss.
Red Hill Tax Claim
During
the year ended December 31, 2014, the Company’s wholly-owned
subsidiary, Red Hill was issued a letter from the Sukhbaatar
District Tax Division notifying it of the results of the Sukhbaatar
District Tax Division’s VAT inspection of Red Hill’s
2009-2013 tax imposition and payments that resulted in validating
VAT credits of only MNT235,718,533 from Red Hill’s claimed
VAT credit of MNT2,654,175,507. Red Hill disagreed with the
Sukhbaatar District Tax Division’s findings as the tax
assessment appeared to the Company to be unfounded. The Company
disputed the Sukhbaatar District Tax Division’s assessment
and submitted a complaint to the Capital City Tax Tribunal. On
March 24, 2015, the Capital City Tax Tribunal resolved to refer the
matter back to the Sukhbaatar District Tax Division for revision
and separation of the action between confirmation of Red
Hill’s VAT credit, and the imposition of the
penalty/deduction for the tax assessment.
Due to
the uncertainty of realizing the VAT balance, the Company has
recorded an impairment charge for the full VAT balance in the year
ended December 31, 2015.
In June
2019, the Company received a positive resolution issued from the
Capital City Tax Tribunal, which is binding and final, affirmed Red
Hill’s outstanding VAT credit of 1.169 billion MNT resulted
from past mining equipment purchases. The VAT credit can be used to
offset taxes and royalty payments; or be refunded in cash by
Mongolia’s Ministry of Finance within 12 to 24 months
processing time. Due to the credit risk associated with the VAT
credit, the Company has provided a full valuation provision against
the balance.
Dividend Policy
To
date, we have not paid any dividends on our outstanding Common
Shares and it is not contemplated that we will pay any dividends in
the immediate or foreseeable future. It is our intention to use all
available cash flow to finance further operations and exploration
of our resource properties. Holders of our Common Shares will be
entitled to receive dividends, if, as and when declared by the
Board out of profits, capital or otherwise.
There
are no restrictions that could prevent us from paying dividends on
our Common Shares except that we may not pay dividends if that
payment would render us insolvent.
B.
Significant
Changes
Not
applicable.
None.
111
ITEM
9.
THE
OFFER AND LISTING
A.
Offer
and Listing Details
The
Company’s Common Shares trades on the TSX under the symbol
“ELEF”, the OTCQX under the symbol “SILEF”
and the Frankfurt Stock Exchange under the symbol
“1P2N”.
B.
Plan
of Distribution
Not
applicable.
C.
Markets
Our
Common Shares are listed for trading on the TSX, the OTCQX, and the
Frankfurt Stock Exchange. Our Common Shares were voluntarily
delisted from the OTCQX on January 29, 2016 and began trading again
on the OTCQX on February 27, 2018. The following tables set forth
the reported high and low prices on the TSX for the five most
recent fiscal years.
|
YEAR
|
TSX
($) HIGH
|
TSX
($) LOW
|
|
December
31, 2020
|
0.55
|
0.10
|
|
December
31, 2019
|
0.49
|
0.15
|
|
December
31, 2018
|
4.35
|
0.105
|
|
December
31, 2017
|
6.19
|
2.78
|
|
December
31, 2016
|
4.61
|
0.015
|
D.
Selling
Shareholders
Not
applicable.
E.
Dilution
Not
applicable.
F.
Expenses
of the Issue
Not
applicable.
ITEM
10.
ADDITIONAL
INFORMATION
A.
Share
Capital
Not
Applicable.
B.
Memorandum
and Articles of Association
Incorporation
We are
amalgamated under the British Columbia Business Corporations Act
(BCBCA). Our British Columbia incorporation number is
BC0912924.
Objects and Purposes of Our Company
Our
articles do not contain a description of our objects and
purposes.
Voting on Proposals. Arrangements, Contracts or Compensation by
Directors
Other
than as disclosed below, our articles do not restrict
directors’ power to (a) vote on a proposal, arrangement or
contract in which the directors are materially interested or (b) to
vote compensation to themselves or any other members of their body
in the absence of an independent quorum.
112
The
BCBCA does, however, contain restrictions in this regard. The BCBCA
provides that a director who holds a disclosable interest in a
contract or transaction into which we have entered or proposes to
enter is not entitled to vote on any directors’ resolution to
approve that contract or transaction, unless all the directors have
a disclosable interest in that contract or transaction, in which
case any or all of those directors may vote on such resolution. A
director who holds a disclosable interest in a contract or
transaction into which we have entered or proposes to enter and who
is present at the meeting of directors at which the contract or
transaction is considered for approval may be counted in the quorum
at the meeting whether or not the director votes on any or all of
the resolutions considered at the meeting. A director or senior
officer generally holds a disclosable interest in a contract or
transaction if (a) the contract or transaction is material to our
company; (b) we have entered, or proposed to enter, into the
contract or transaction, and (c) either (i) the director or senior
officer has a material interest in the contract or transaction or
(ii) the director or senior officer is a director or senior officer
of, or has a material interest in, a person who has a material
interest in the contract or transaction. A director or senior
officer does not hold a disclosable interest in a contract or
transaction merely because the contract or transaction relates to
the remuneration of the director or senior officer in that
person’s capacity as director, officer, employee or agent of
our company or of an affiliate of our company.
Borrowing Powers of Directors
Our
articles provide that we, if authorized by our directors,
may:
●
borrow money in the
manner and amount, on the security, from the sources and on the
terms and conditions that they consider appropriate;
●
issue bonds,
debentures and other debt obligations either outright or as
security for any liability or obligation of our company or any
other person and at such discounts or premiums and on such other
terms as they consider appropriate;
●
guarantee the
repayment of money by any other person or the performance of any
obligation of any other person; and
●
mortgage, charge,
whether by way of specific or floating charge, grant a security
interest in, or give other security on, the whole or any part of
the present and future assets and undertaking of our
company.
Qualifications of Directors
Under
our articles, a director is not required to hold a share in the
capital of the Company as qualification for his or her office but
must be qualified as required by the BCBCA to become, act or
continue to act as a director. Our articles contain no provisions
regarding retirement or non-retirement of directors under an age
limit requirement.
Share Rights
The
holders of our Common Shares are entitled to vote at all meetings
of shareholders of the Company, to receive dividends if, as and
when declared by the Board and to participate ratably in any
distribution of property or assets upon the liquidation, winding-up
or other dissolution of the Company. Our Common Shares carry no
pre-emptive rights, conversion or exchange rights, redemption,
retraction, repurchase, sinking fund or purchase fund provisions.
There are no provisions requiring the holders of our Common Shares
to contribute additional capital and there are no restrictions on
the issuance of additional securities by the Company. There are no
restrictions on the repurchase or redemption of the Common Shares
by the Company except to the extent that any such repurchase or
redemption would render the Company insolvent pursuant to the
BCBCA.
Procedures to Change the Rights of Shareholders
Our
articles state that subject to Article 9.2 of the BCBCA, the
Company may by ordinary resolution of its shareholders: (a) create
one or more classes or series of shares or, if none of the shares
of a class or series of shares are allotted or issued, eliminate
that class or series of shares; (b) increase, reduce or eliminate
the maximum number of shares that the Company is authorized to
issue out of any class or series of shares or establish a maximum
number of shares that the Company is authorized to issue out of any
class or series of shares for which no maximum is established; (c)
subdivide or consolidate all or any of its unissued, or fully paid
issued shares; (d) if the Company is authorized to issue shares of
a class of shares with par value: (i) decrease the par value of
those shares, or (ii) if none of the shares of that class of shares
are allotted or issued, increase the par value of those shares);
(e) change all or any of its unissued or fully paid issued shares
with par value into shares without par value or all or any of its
unissued shares without par value into shares with par value; (f)
alter the identifying name of any of its shares; or (g) otherwise
alter its shares or authorized share structure when required or
permitted to do so by the BCBCA.
Meetings
Each
director holds office until our next annual general meeting or
until his office is earlier vacated in accordance with our articles
or with the provisions of the BCBCA. A director appointed or
elected to fill a vacancy on our board also holds office until our
next annual general meeting.
Our
articles and the BCBCA provide that our annual meetings of
shareholders must be held at least once in each calendar year and
not more than 15 months after the last annual general meeting at
such time and place as our Board may determine. Our directors may,
at any time, call a meeting of our shareholders.
Under
the BCBCA, the holders of not less than five percent of our issued
Common Shares that carry the right to vote at a meeting may
requisition our directors to call a meeting of shareholders for the
purposes of transacting any business that may be transacted at a
general meeting.
113
Under
our articles, the quorum for the transaction of business at a
meeting of our shareholders is two persons who are, present in
person or represent by proxy, shareholders holding, in the
aggregate, at least five percent of the issued Common Shares
entitled to be voted at the meeting.
Our
articles state that in addition to those persons who are entitled
to vote at a meeting of our shareholders, the only other persons
entitled to be present at the meeting are the directors, the
president (if any), the secretary (if any), the assistant secretary
(if any), the auditor for our company, and any other persons
invited by our directors but if any of those persons does attend a
meeting of shareholders, that person is not to be counted in the
quorum and is not entitled to vote at the meeting unless that
person is a shareholder or proxy
Limitations on Ownership of Securities
Neither
Canadian law nor our articles limit the right of a non-resident to
hold or vote Common Shares, other than as provided in the
Investment Canada Act (as amended by the World Trade Organization
Agreement Implementation Act, the "Investment Act"). The Investment
Act generally prohibits implementation of a direct reviewable
investment by an individual, government or agency thereof,
corporation, partnership, trust or joint venture that is not a
"Canadian", as defined in the Investment Act (a "non-Canadian"),
unless, after review, the minister responsible for the Investment
Act is satisfied that the investment is likely to be of net benefit
to Canada. An investment in the Common Shares by a non-Canadian
(other than a "WTO Investor," as defined below) would be reviewable
under the Investment Act if it were an investment to acquire direct
control of the company, and the value of the assets of the company
were $5.0 million or more (provided that immediately prior to the
implementation of the investment the Company was not controlled by
WTO Investors). An investment in Common Shares by a WTO Investor
(or by a non-Canadian other than a WTO Investor if, immediately
prior to the implementation of the investment the Company was
controlled by WTO Investors) would be reviewable under the
Investment Act if it were an investment to acquire direct control
of the company and the value of the assets of the Company equaled
or exceeded an amount determined by the Minister of Finance
(Canada) on an annual basis. The current threshold for review for
WTO Investors or vendors (other than Canadians) is $1 billion. A
non-Canadian, whether a WTO Investor or otherwise, would be deemed
to acquire control of a company for purposes of the Investment Act
if he or she acquired a majority of the Common Shares of the
company.
The
acquisition of less than a majority, but at least one-third of the
Common Shares, would be presumed to be an acquisition of control of
the company, unless it could be established that the company is not
controlled in fact by the acquirer through the ownership of the
Common Shares. In general, an individual is a WTO Investor if he or
she is a "national" of a country (other than Canada) that is a
member of the World Trade Organization ("WTO Member") or has a
right of permanent residence in a WTO Member. A corporation or
other entity will be a "WTO Investor" if it is a "WTO
Investor-controlled entity", pursuant to detailed rules set out in
the Investment Act. The U.S. is a WTO Member. Certain transactions
involving our Common Shares would be exempt from the Investment
Act, including:
●
an acquisition of
the Common Shares if the acquisition were made in the ordinary
course of that person’s business as a trader or dealer in
securities;
●
an acquisition of
control of the Company in connection with the realization of a
security interest granted for a loan or other financial assistance
and not for any purpose related to the provisions of the Investment
Act; and
●
an acquisition of
control of the Company by reason of an amalgamation, merger,
consolidation or corporate reorganization, following which the
ultimate direct or indirect control in fact of the Company, through
the ownership of voting interests, remains unchanged.
Change in Control
There
are no provisions in our articles or in the BCBCA that would have
the effect of delaying, deferring or preventing a change in control
of our company, and that would operate only with respect to a
merger, acquisition or corporate restructuring involving our
Company or our subsidiaries.
Ownership Threshold
Our
articles or the BCBCA do not contain any provisions governing the
ownership threshold above which shareholder ownership must be
disclosed. Securities legislation in Canada, however, requires that
we disclose in our information circular for our annual general
meeting, holders who beneficially own more than 10% of our issued
and outstanding Common Shares. Most state corporation statutes do
not contain provisions governing the threshold above which
shareholder ownership must be disclosed. We expect that the United
States federal securities laws will require us to disclose holders
who own 5% or more of our issued and outstanding Common Shares of
the Company. As of the date of this Annual Report there are no
persons who, or corporations which, beneficially own, or control or
direct, directly or indirectly, shares carrying 5% or more of the
issued and outstanding Common Shares of the Company.
114
C.
Material
Contracts
1)
the Amendment to
the Mineral Lease Agreement dated April 19, 2018 between the
Company and Janelle Dietrich, concerning the lease by the Company
of those mining claims which constitute the Gibellini Project.
Refer to Gibellini Project,
History disclosure for full details.
2)
the Pulacayo Mining
Production Contract dated September 30, 2019, between the Company
and the Corporación Minera de Bolivia, a branch of the
Bolivian Mining Ministry.
Refer to
Pulacayo Project, Property disclosure for full
details.
3)
The Triunfo APA
between the Company’s subsidiary Illumina Silver Mining Corp.
and a private party to acquire the Triunfo Project.
Refer to the Triunfo Project, Bolivia
disclosure for full details.
D.
Exchange
Controls
There
are no governmental laws, decrees, regulations or other
legislation, including foreign exchange controls, in Canada which
may affect the export or import of capital or that may affect the
remittance of dividends, interest or other payments to non-resident
holders of the Company’s securities. Any remittances of
dividends to United States residents, however, are subject to a
withholding tax pursuant to the Income Tax Act (Canada) and the
Canada-U.S. Income Tax Convention (1980) (each as amended and
together the "Convention"). Remittances of interest to U.S.
residents entitled to the benefits of the Convention are generally
not subject to withholding taxes except in limited circumstances
involving participating interest payments. Certain other types of
remittances, such as royalties paid to U.S. residents, may be
subject to a withholding tax depending on all of the
circumstances.
E.
Taxation
115
CERTAIN UNITED STATES FEDERAL INCOME TAX
CONSIDERATIONS
The
following is a general summary of certain material U.S. federal
income tax considerations applicable to a U.S. Holder (as defined
below) arising from and relating to the acquisition, ownership, and
disposition of Common Shares.
This
summary is for general information purposes only and does not
purport to be a complete analysis or listing of all potential U.S.
federal income tax considerations that may apply to a U.S. Holder
arising from and relating to the acquisition, ownership, and
disposition of Common Shares. In addition, this summary does not
take into account the individual facts and circumstances of any
particular U.S. Holder that may affect the U.S. federal income tax
consequences to such U.S. Holder, including, without limitation,
specific tax consequences to a U.S. Holder under an applicable
income tax treaty. Accordingly, this summary is not intended to be,
and should not be construed as, legal or U.S. federal income tax
advice with respect to any U.S. Holder. This summary does not
address the U.S. federal net investment income, U.S. federal
alternative minimum, U.S. federal estate and gift, U.S. state and
local, and non-U.S. tax consequences to U.S. Holders of the
acquisition, ownership, and disposition of Common Shares. In
addition, except as specifically set forth below, this summary does
not discuss applicable tax reporting requirements. Each prospective
U.S. Holder should consult its own tax advisors regarding the U.S.
federal, U.S. federal net investment income, U.S. federal
alternative minimum, U.S. federal estate and gift, U.S. state and
local, and non-U.S. tax consequences relating to the acquisition,
ownership and disposition of Common Shares.
No
legal opinion from U.S. legal counsel or ruling from the Internal
Revenue Service (the "IRS") has been requested, or will be
obtained, regarding the U.S. federal income tax consequences of the
acquisition, ownership, and disposition of Common Shares. This
summary is not binding on the IRS, and the IRS is not precluded
from taking a position that is different from, and contrary to, the
positions taken in this summary. In addition, because the
authorities on which this summary is based are subject to various
interpretations, the IRS and the U.S. courts could disagree with
one or more of the conclusions described in this
summary.
F.
Scope
of this Summary
Authorities
This
summary is based on the Internal Revenue Code of 1986, as amended
(the "Code"), Treasury Regulations (whether final, temporary, or
proposed), published rulings of the IRS, published administrative
positions of the IRS, the Convention Between Canada and the United
States of America with Respect to Taxes on Income and on Capital,
signed September 26, 1980, as amended (the "Canada-U.S. Tax
Convention"), and U.S. court decisions that are applicable, and, in
each case, as in effect and available, as of the date of this
document. Any of the authorities on which this summary is based
could be changed in a material and adverse manner at any time, and
any such change could be applied retroactively. This summary does
not discuss the potential effects, whether adverse or beneficial,
of any proposed legislation.
U.S. Holders
For
purposes of this summary, the term "U.S. Holder" means a beneficial
owner of Common Shares that is for U.S. federal income tax
purposes:
●
an individual who
is a citizen or resident of the United States;
●
a corporation (or
other entity treated as a corporation for U.S. federal income tax
purposes) organized under the laws of the United States, any state
thereof or the District of Columbia;
●
an estate whose
income is subject to U.S. federal income taxation regardless of its
source; or
●
a trust that (1) is
subject to the primary supervision of a court within the U.S. and
the control of one or more U.S. persons for all substantial
decisions or (2) has a valid election in effect under applicable
Treasury Regulations to be treated as a U.S. person.
U.S. Holders Subject to Special U.S. Federal Income Tax Rules Not
Addressed
This
summary does not address the U.S. federal income tax considerations
applicable to U.S. Holders that are subject to special provisions
under the Code, including, but not limited to, U.S. Holders that:
(a) are tax-exempt organizations, qualified retirement plans,
individual retirement accounts, or other tax-deferred accounts; (b)
are financial institutions, underwriters, insurance companies, real
estate investment trusts, or regulated investment companies; (c)
are broker-dealers, dealers, or traders in securities or currencies
that elect to apply a mark-to-market accounting method; (d) have a
"functional currency" other than the U.S. dollar; (e) own Common
Shares as part of a straddle, hedging transaction, conversion
transaction, constructive sale, or other arrangement involving more
than one position; (f) acquire Common Shares in connection with the
exercise of employee stock options or otherwise as compensation for
services; (g) hold Common Shares other than as a capital asset
within the meaning of Section 1221 of the Code (generally, property
held for investment purposes); (h) are subject to special tax
accounting rules with respect to Common Shares; (i) own, have owned
or will own (directly, indirectly, or by attribution) 10% or more
of the total combined voting power or value of the outstanding
Common Shares; (j) are partnerships or other pass-through entities;
(k) U.S. expatriates or former long-term residents of the U.S.; or
(l) are persons that are subject to tax in a non-U.S. jurisdiction
with respect to their Common Shares U.S. Holders that are subject
to special provisions under the Code, including, but not limited
to, U.S. Holders described immediately above, should consult their
own tax advisors regarding the U.S. federal, U.S. federal net
investment income, U.S. federal alternative minimum, U.S. federal
estate and gift, U.S. state and local, and non-U.S. tax
consequences relating to the acquisition, ownership and disposition
of Common Shares.
116
If an
entity or arrangement that is classified as a partnership (or other
"pass-through" entity) for U.S. federal income tax purposes holds
Common Shares, the U.S. federal income tax consequences to such
entity or arrangement and the partners (or other owners or
participants) of such entity or arrangement generally will depend
on the activities of the entity or arrangement and the status of
such partners (or owners or participants). This summary does not
address the tax consequences to any such partner (or owner or
participants). Partners (or other owners or participants) of
entities or arrangements that are classified as partnerships or as
"pass-through" entities for U.S. federal income tax purposes should
consult their own tax advisors regarding the U.S. federal income
tax consequences arising from and relating to the acquisition,
ownership, and disposition of Common Shares.
Passive Foreign Investment Company Rules
PFIC Status of the Company
If the
Company were to constitute a “passive foreign investment
company” under the meaning of Section 1297 of the Code (a
“PFIC”, as defined below) for any year during a U.S.
Holder’s holding period, then certain potentially adverse
rules may affect the U.S. federal income tax consequences to a U.S.
Holder as a result of the acquisition, ownership and disposition of
Common Shares. The Company believes that it was classified as a
PFIC during the tax year ended December 31, 2020, and based on
current business plans and financial expectations, the Company
expects that it should be a PFIC for the current tax year and may
be a PFIC in future tax years. No opinion of legal counsel or
ruling from the IRS concerning the status of the Company as a PFIC
has been obtained or is currently planned to be requested. The
determination of whether any corporation was, or will be, a PFIC
for a tax year depends, in part, on the application of complex U.S.
federal income tax rules, which are subject to differing
interpretations. In addition, whether any corporation will be a
PFIC for any tax year depends on the assets and income of such
corporation over the course of each such tax year and, as a result,
cannot be predicted with certainty as of the date of this document.
Accordingly, there can be no assurance that the IRS will not
challenge any determination made by the Company (or any subsidiary
of the Company) concerning its PFIC status. Each U.S. Holder should
consult its own tax advisors regarding the PFIC status of the
Company and each subsidiary of the Company. In any year in which
the Company is classified as a PFIC, a U.S. Holder will be required
to file an annual report with the IRS containing such information
as Treasury Regulations and/or other IRS guidance may require. In
addition to penalties, a failure to satisfy such reporting
requirements may result in an extension of the time period during
which the IRS can assess a tax. U.S. Holders should consult their
own tax advisors regarding the requirements of filing such
information returns under these rules, including the requirement to
file an IRS Form 8621 annually.
The
Company generally will be a PFIC if, for a tax year, (a) 75% or
more of the gross income of the Company is passive income (the
“PFIC income test”) or (b) 50% or more of the value of
the Company’s assets either produce passive income or are
held for the production of passive income, based on the quarterly
average of the fair market value of such assets (the “PFIC
asset test”). “Gross income” generally includes
all sales revenues less the cost of goods sold, plus income from
investments and from incidental or outside operations or sources,
and “passive income” generally includes, for example,
dividends, interest, certain rents and royalties, certain gains
from the sale of stock and securities, and certain gains from
commodities transactions.
Active
business gains arising from the sale of commodities generally are
excluded from passive income if substantially all of a foreign
corporation’s commodities are stock in trade or inventory,
depreciable property used in a trade or business, or supplies
regularly used or consumed in the ordinary course of its trade or
business, and certain other requirements are
satisfied.
For
purposes of the PFIC income test and PFIC asset test described
above, if the Company owns, directly or indirectly, 25% or more of
the total value of the outstanding shares of another corporation,
the Company will be treated as if it (a) held a proportionate share
of the assets of such other corporation and (b) received directly a
proportionate share of the income of such other corporation. In
addition, for purposes of the PFIC income test and PFIC asset test
described above, and assuming certain other requirements are met,
“passive income” does not include certain interest,
dividends, rents, or royalties that are received or accrued by the
Company from certain “related persons” (as defined in
Section 954(d)(3) of the Code) also organized in Canada, to the
extent such items are properly allocable to the income of such
related person that is not passive income.
Under
certain attribution rules, if the Company is a PFIC, U.S. Holders
will generally be deemed to own their proportionate Common
Share’s direct or indirect equity interest in any company
that is also a PFIC (a ‘‘Subsidiary
PFIC’’), and will generally be subject to U.S. federal
income tax on their proportionate share of (a) any "excess
distributions," as described below, on the stock of a Subsidiary
PFIC and (b) a disposition or deemed disposition of the stock of a
Subsidiary PFIC by the Company or another Subsidiary PFIC, both as
if such U.S. Holders directly held the shares of such Subsidiary
PFIC. In addition, U.S. Holders may be subject to U.S. federal
income tax on any indirect gain realized on the stock of a
Subsidiary PFIC on the sale or disposition of Common Shares.
Accordingly, U.S. Holders should be aware that they could be
subject to tax under the PFIC rules even if no distributions are
received and no redemptions or other dispositions of Common Shares
are made.
Default PFIC Rules Under Section 1291 of the Code
If the
Company is a PFIC for any tax year during which a U.S. Holder owns
Common Shares, the U.S. federal income tax consequences to such
U.S. Holder of the acquisition, ownership, and disposition of
Common Shares will depend on whether and when such U.S. Holder
makes an election to treat the Company and each Subsidiary PFIC, if
any, as a "qualified electing fund" or "QEF" under Section 1295 of
the Code (a "QEF Election") or makes a mark-to-market election
under Section 1296 of the Code (a "Mark-to-Market Election"). A
U.S. Holder that does not make either a QEF Election or a
Mark-to-Market Election will be referred to in this summary as a
"Non-Electing U.S. Holder."
117
A
Non-Electing U.S. Holder will be subject to the rules of Section
1291 of the Code (described below) with respect to (a) any gain
recognized on the sale or other taxable disposition of Common
Shares and (b) any "excess distribution" received on the Common
Shares. A distribution generally will be an "excess distribution"
to the extent that such distribution (together with all other
distributions received in the current tax year) exceeds 125% of the
average distributions received during the three preceding tax years
(or during a U.S. Holder’s holding period for the Common
Shares, if shorter).
Under
Section 1291 of the Code, any gain recognized on the sale or other
taxable disposition of Common Shares (including an indirect
disposition of the stock of any Subsidiary PFIC), and any "excess
distribution" received on Common Shares or with respect to the
stock of a Subsidiary PFIC, must be ratably allocated to each day
in a Non-Electing U.S. Holder’s holding period for the
respective Common Shares. The amount of any such gain or excess
distribution allocated to the tax year of disposition or
distribution of the excess distribution and to years before the
entity became a PFIC, if any, would be taxed as ordinary income
(and not eligible for certain preferred rates). The amounts
allocated to any other tax year would be subject to U.S. federal
income tax at the highest tax rate applicable to ordinary income in
each such year, and an interest charge would be imposed on the tax
liability for each such year, calculated as if such tax liability
had been due in each such year. A Non-Electing U.S. Holder that is
not a corporation must treat any such interest paid as "personal
interest," which is not deductible.
If the
Company is a PFIC for any tax year during which a Non-Electing U.S.
Holder holds Common Shares, the Company will continue to be treated
as a PFIC with respect to such Non-Electing U.S. Holder, regardless
of whether the Company ceases to be a PFIC in one or more
subsequent tax years. A Non-Electing U.S. Holder may terminate this
deemed PFIC status by electing to recognize gain (which will be
taxed under the rules of Section 1291 of the Code discussed above),
but not loss, as if such Common Shares were sold on the last day of
the last tax year for which the Company was a PFIC.
QEF Election
A U.S.
Holder that makes a timely and effective QEF Election for the first
tax year in which the holding period of its Common Shares begins
generally will not be subject to the rules of Section 1291 of the
Code discussed above with respect to its Common Shares. A U.S.
Holder that makes a timely and effective QEF Election will be
subject to U.S. federal income tax on such U.S. Holder’s pro
rata share of (a) the net capital gain of the Company, which will
be taxed as long-term capital gain to such U.S. Holder, and (b) the
ordinary earnings of the Company, which will be taxed as ordinary
income to such U.S. Holder. Generally, "net capital gain" is the
excess of (a) net long-term capital gain over (b) net short- term
capital loss, and "ordinary earnings" are the excess of (a)
"earnings and profits" over (b) net capital gain. A U.S. Holder
that makes a QEF Election will be subject to U.S. federal income
tax on such amounts for each tax year in which the Company is a
PFIC, regardless of whether such amounts are actually distributed
to such U.S. Holder by the Company. However, for any tax year in
which the Company is a PFIC and has no net income or gain, U.S.
Holders that have made a QEF Election would not have any income
inclusions as a result of the QEF Election. If a U.S. Holder that
made a QEF Election has an income inclusion, such a U.S. Holder
may, subject to certain limitations, elect to defer payment of
current U.S. federal income tax on such amounts, subject to an
interest charge. If such U.S. Holder is not a corporation, any such
interest paid will be treated as "personal interest," which is not
deductible.
A U.S.
Holder that makes a timely and effective QEF Election with respect
to the Company generally (a) may receive a tax-free distribution
from the Company to the extent that such distribution represents
"earnings and profits" of the Company that were previously included
in income by the U.S. Holder because of such QEF Election and (b)
will adjust such U.S. Holder’s tax basis in the Common Shares
to reflect the amount included in income or allowed as a tax-free
distribution because of such QEF Election. In addition, a U.S.
Holder that makes a QEF Election generally will recognize capital
gain or loss on the sale or other taxable disposition of Common
Shares.
The
procedure for making a QEF Election, and the U.S. federal income
tax consequences of making a QEF Election, will depend on whether
such QEF Election is timely. A QEF Election will be treated as
"timely" if such QEF Election is made for the first year in the
U.S. Holder’s holding period for the Common Shares in which
the Company was a PFIC. A U.S. Holder may make a timely QEF
Election by filing the appropriate QEF Election documents at the
time such U.S. Holder files a U.S. federal income tax return for
such year. If a U.S. Holder does not make a timely and effective
QEF Election for the first year in the U.S. Holder’s holding
period for the Common Shares, the U.S. Holder may still be able to
make a timely and effective QEF Election in a subsequent year if
such U.S. Holder meets certain requirements and makes a "purging"
election to recognize gain (which will be taxed under the rules of
Section 1291 of the Code discussed above) as if such Common Shares
were sold for their fair market value on the day the QEF Election
is effective. If a U.S. Holder makes a QEF Election but does not
make a "purging" election to recognize gain as discussed in the
preceding sentence, then such U.S. Holder shall be subject to the
QEF Election rules and shall continue to be subject to tax under
the rules of Section 1291 discussed above with respect to its
Common Shares. If a U.S. Holder owns PFIC stock indirectly through
another PFIC, separate QEF Elections must be made for the PFIC in
which the U.S. Holder is a direct shareholder and the Subsidiary
PFIC for the QEF rules to apply to both PFICs.
118
A QEF
Election will apply to the tax year for which such QEF Election is
timely made and to all subsequent tax years, unless such QEF
Election is invalidated or terminated or the IRS consents to
revocation of such QEF Election. If a U.S. Holder makes a QEF
Election and, in a subsequent tax year, the Company ceases to be a
PFIC, the QEF Election will remain in effect (although it will not
be applicable) during those tax years in which the Company is not a
PFIC. Accordingly, if the Company becomes a PFIC in another
subsequent tax year, the QEF Election will be effective and the
U.S. Holder will be subject to the QEF rules described above during
any subsequent tax year in which the Company qualifies as a
PFIC.
U.S.
Holders should be aware that there can be no assurances that the
Company will satisfy the record keeping requirements that apply to
a QEF, or that the Company will supply U.S. Holders with
information that such U.S. Holders are required to report under the
QEF rules, in the event that the Company is a PFIC. Thus, U.S.
Holders may not be able to make a QEF Election with respect to
their Common Shares. Each U.S. Holder should consult its own tax
advisors regarding the availability of, and procedure for making, a
QEF Election.
A U.S.
Holder makes a QEF Election by attaching a completed IRS Form 8621,
including a PFIC Annual Information Statement, to a timely filed
United States federal income tax return. However, if the Company
does not provide the required information with regard to the
Company or any of its Subsidiary PFICs, U.S. Holders will not be
able to make a QEF Election for such entity and will continue to be
subject to the rules of Section 1291 of the Code discussed above
that apply to Non-Electing U.S. Holders with respect to the
taxation of gains and excess distributions.
Mark-to-Market Election
A U.S.
Holder may make a Mark-to-Market Election only if the Common Shares
are marketable stock. The Common Shares generally will be
"marketable stock" if the Common Shares are regularly traded on (a)
a national securities exchange that is registered with the
Securities and Exchange Commission, (b) the national market system
established pursuant to section 11A of the Securities and Exchange
Act of 1934, or (c) a foreign securities exchange that is regulated
or supervised by a governmental authority of the country in which
the market is located, provided that (i) such foreign exchange has
trading volume, listing, financial disclosure, and surveillance
requirements, and meets other requirements and the laws of the
country in which such foreign exchange is located, together with
the rules of such foreign exchange, ensure that such requirements
are actually enforced and (ii) the rules of such foreign exchange
effectively promote active trading of listed stocks. If such stock
is traded on such a qualified exchange or other market, such stock
generally will be "regularly traded" for any calendar year during
which such stock is traded, other than in de minimis quantities, on
at least 15 days during each calendar quarter.
A U.S.
Holder that makes a Mark-to-Market Election with respect to its
Common Shares generally will not be subject to the rules of Section
1291 of the Code discussed above with respect to such Common
Shares. However, if a U.S. Holder does not make a Mark-to-Market
Election beginning in the first tax year of such U.S.
Holder’s holding period for the Common Shares for which the
Company is a PFIC and such U.S. Holder has not made a timely QEF
Election, the rules of Section 1291 of the Code discussed above
will apply to certain dispositions of, and distributions on, the
Common Shares.
A U.S.
Holder that makes a Mark-to-Market Election will include in
ordinary income, for each tax year in which the Company is a PFIC,
an amount equal to the excess, if any, of (a) the fair market value
of the Common Shares, as of the close of such tax year over (b)
such U.S. Holder’s adjusted tax basis in such Common Shares.
A U.S. Holder that makes a Mark- to-Market Election will be allowed
a deduction in an amount equal to the excess, if any, of (a) such
U.S. Holder’s adjusted tax basis in the Common Shares, over
(b) the fair market value of such Common Shares (but only to the
extent of the net amount of previously included income as a result
of the Mark-to-Market Election for prior tax years).
A U.S.
Holder that makes a Mark-to-Market Election generally also will
adjust such U.S. Holder’s tax basis in the Common Shares to
reflect the amount included in gross income or allowed as a
deduction because of such Mark-to-Market Election. In addition,
upon a sale or other taxable disposition of Common Shares, a U.S.
Holder that makes a Mark-to- Market Election will recognize
ordinary income or ordinary loss (not to exceed the excess, if any,
of (a) the amount included in ordinary income because of such
Mark-to-Market Election for prior tax years over (b) the amount
allowed as a deduction because of such Mark-to-Market Election for
prior tax years). Losses that exceed this limitation are subject to
the rules generally applicable to losses provided in the Code and
Treasury Regulations.
A U.S.
Holder makes a Mark-to-Market Election by attaching a completed IRS
Form 8621 to a timely filed United States federal income tax
return. A Mark-to-Market Election applies to the tax year in which
such Mark-to-Market Election is made and to each subsequent tax
year, unless the Common Shares cease to be "marketable stock" or
the IRS consents to revocation of such election. Each U.S. Holder
should consult its own tax advisors regarding the availability of,
and procedure for making, a Mark-to-Market Election.
Although
a U.S. Holder may be eligible to make a Mark-to-Market Election
with respect to the Common Shares, no such election may be made
with respect to the stock of any Subsidiary PFIC that a U.S. Holder
is treated as owning, because such stock is not marketable. Hence,
the Mark-to- Market Election will not be effective to avoid the
application of the default rules of Section 1291 of the Code
described above with respect to deemed dispositions of Subsidiary
PFIC stock or excess distributions from a Subsidiary PFIC to its
shareholder.
119
Other PFIC Rules
Under
Section 1291(f) of the Code, the IRS has issued proposed Treasury
Regulations that, subject to certain exceptions, would cause a U.S.
Holder that had not made a timely QEF Election to recognize gain
(but not loss) upon certain transfers of Common Shares that would
otherwise be tax- deferred (e.g., gifts and exchanges pursuant to
corporate reorganizations). However, the specific U.S. federal
income tax consequences to a U.S. Holder may vary based on the
manner in which Common Shares are transferred.
Certain
additional adverse rules may apply with respect to a U.S. Holder if
the Company is a PFIC, regardless of whether such U.S. Holder makes
a QEF Election. For example, under Section 1298(b)(6) of the Code,
a U.S. Holder that uses Common Shares as security for a loan will,
except as may be provided in Treasury Regulations, be treated as
having made a taxable disposition of such Common
Shares.
Special
rules also apply to the amount of foreign tax credit that a U.S.
Holder may claim on a distribution from a PFIC. Subject to such
special rules, foreign taxes paid with respect to any distribution
in respect of stock in a PFIC are generally eligible for the
foreign tax credit. The rules relating to distributions by a PFIC
and their eligibility for the foreign tax credit are complicated,
and a U.S. Holder should consult with its own tax advisors
regarding the availability of the foreign tax credit with respect
to distributions by a PFIC.
The
PFIC rules are complex, and each U.S. Holder should consult its own
tax advisors regarding the PFIC rules and how the PFIC rules may
affect the U.S. federal income tax consequences of the acquisition,
ownership, and disposition of Common Shares.
General Rules Applicable to the Ownership and Disposition of Common
Shares
The
following discussion describes the general rules applicable to the
ownership and disposition of the Common Shares but is subject in
its entirety to the special rules described above under the heading
"Passive Foreign Investment Company Rules."
Distributions on Common Shares
A U.S.
Holder that receives a distribution, including a constructive
distribution, with respect to a Common Share will be required to
include the amount of such distribution in gross income as a
dividend (without reduction for any Canadian income tax withheld
from such distribution) to the extent of the current and
accumulated "earnings and profits" of the Company, as computed for
U.S. federal income tax purposes. A dividend generally will be
taxed to a U.S. Holder at ordinary income tax rates if the Company
is a PFIC for the tax year of such distribution or the preceding
tax year. To the extent that a distribution exceeds the current and
accumulated "earnings and profits" of the Company, such
distribution will be treated first as a tax-free return of capital
to the extent of a U.S. Holder’s tax basis in the Common
Shares and thereafter as gain from the sale or exchange of such
Common Shares. (See "Sale or Other Taxable Disposition of Common
Shares" below). However, the Company may not maintain the
calculations of its earnings and profits in accordance with U.S.
federal income tax principles, and each U.S. Holder may have to
assume that any distribution by the Company with respect to the
Common Shares will constitute ordinary dividend income. Dividends
received on Common Shares by corporate U.S. Holders generally will
not be eligible for the "dividends received deduction." Subject to
applicable limitations and provided the Company is eligible for the
benefits of the Canada-U.S. Tax Convention or the Common Shares are
readily tradable on a United States securities market, dividends
paid by the Company to non-corporate U.S. Holders, including
individuals, generally will be eligible for the preferential tax
rates applicable to long-term capital gains for dividends, provided
certain holding period and other conditions are satisfied,
including that the Company not be classified as a PFIC in the tax
year of distribution or in the preceding tax year. The dividend
rules are complex, and each U.S. Holder should consult its own tax
advisors regarding the application of such rules.
Sale or Other Taxable Disposition of Common Shares
Upon
the sale or other taxable disposition of Common Shares, a U.S.
Holder generally will recognize capital gain or loss in an amount
equal to the difference between the U.S. dollar value of cash
received plus the fair market value of any property received and
such U.S. Holder’s tax basis in such Common Shares sold or
otherwise disposed of. A U.S. Holder’s tax basis in Common
Shares generally will be such holder’s U.S. dollar cost for
such Common Shares. Gain or loss recognized on such sale or other
disposition generally will be long- term capital gain or loss if,
at the time of the sale or other disposition, the Common Shares
have been held for more than one year.
Preferential
tax rates currently apply to long-term capital gain of a U.S.
Holder that is an individual, estate, or trust. There are currently
no preferential tax rates for long-term capital gain of a U.S.
Holder that is a corporation. Deductions for capital losses are
subject to significant limitations under the Code.
Additional Considerations
Foreign Currency
The
amount of any distribution paid to a U.S. Holder in foreign
currency, or on the sale, exchange or other taxable disposition of
Common Shares, generally will be equal to the U.S. dollar value of
such foreign currency based on the exchange rate applicable on the
date of receipt (regardless of whether such foreign currency is
converted into U.S. dollars at that time). A U.S. Holder will have
a basis in the foreign currency equal to its U.S. dollar value on
the date of receipt. Any U.S. Holder who converts or otherwise
disposes of the foreign currency after the date of receipt may have
a foreign currency exchange gain or loss that would be treated as
ordinary income or loss, and generally will be U.S. source income
or loss for foreign tax credit purposes. Different rules apply to
U.S. Holders who use the accrual method of tax accounting. Each
U.S. Holder should consult its own U.S. tax advisors regarding the
U.S. federal income tax consequences of receiving, owning, and
disposing of foreign currency.
120
Foreign Tax Credit
Subject
to the PFIC rules discussed above, a U.S. Holder that pays (whether
directly or through withholding) Canadian income tax with respect
to dividends paid on the Common Shares generally will be entitled,
at the election of such U.S. Holder, to receive either a deduction
or a credit for such Canadian income tax. Generally, a credit will
reduce a U.S. Holder’s U.S. federal income tax liability on a
dollar-for-dollar basis, whereas a deduction will reduce a U.S.
Holder’s income that is subject to U.S. federal income tax.
This election is made on a year-by-year basis and applies to all
foreign taxes paid (whether directly or through withholding) by a
U.S. Holder during a year. The foreign tax credit rules are complex
and involve the application of rules that depend on a U.S.
Holder’s particular circumstances. Each U.S. Holder should
consult its own U.S. tax advisor regarding the foreign tax credit
rules.
Backup Withholding and Information Reporting
Under
U.S. federal income tax law, certain categories of U.S. Holders
must file information returns with respect to their investment in,
or involvement in, a foreign corporation. For example, U.S. return
disclosure obligations (and related penalties) are imposed on
individuals who are U.S. Holders that hold certain specified
foreign financial assets in excess of certain thresholds. The
definition of specified foreign financial assets includes not only
financial accounts maintained in foreign financial institutions,
but also, unless held in accounts maintained by a financial
institution, any stock or security issued by a non-U.S. person, any
financial instrument or contract held for investment that has an
issuer or counterparty other than a U.S. person and any interest in
a foreign entity. U.S. Holders may be subject to these reporting
requirements unless their Common Shares are held in an account at
certain financial institutions. Penalties for failure to file
certain of these information returns are substantial. U.S. Holders
should consult with their own tax advisors regarding the
requirements of filing information returns, including the
requirement to file an IRS Form 8938.
Payments
made within the U.S., or by a U.S. payor or U.S. middleman, of
dividends on, and proceeds arising from the sale or other taxable
disposition of, Common Shares will generally be subject to
information reporting and backup withholding tax, at the rate of
24%, if a U.S. Holder (a) fails to furnish such U.S. Holder’s
correct U.S. taxpayer identification number (generally on Form
W-9), (b) furnishes an incorrect U.S. taxpayer identification
number, (c) is notified by the IRS that such U.S. Holder has
previously failed to properly report items subject to backup
withholding tax, or (d) fails to certify, under penalty of perjury,
that such U.S. Holder has furnished its correct U.S. taxpayer
identification number and that the IRS has not notified such U.S.
Holder that it is subject to backup withholding tax. However,
certain exempt persons generally are excluded from these
information reporting and backup withholding rules. Backup
withholding is not an additional tax. Any amounts withheld under
the U.S. backup withholding tax rules will be allowed as a credit
against a U.S. Holder’s U.S. federal income tax liability, if
any, or will be refunded, if such U.S. Holder furnishes required
information to the IRS in a timely manner.
The
discussion of reporting requirements set forth above is not
intended to constitute a complete description of all reporting
requirements that may apply to a U.S. Holder. A failure to satisfy
certain reporting requirements may result in an extension of the
time period during which the IRS can assess a tax and, under
certain circumstances, such an extension may apply to assessments
of amounts unrelated to any unsatisfied reporting requirement. Each
U.S. Holder should consult its own tax advisors regarding the
information reporting and backup withholding rules.
THE ABOVE SUMMARY IS NOT INTENDED TO CONSTITUTE A COMPLETE ANALYSIS
OF ALL TAX CONSIDERATIONS APPLICABLE TO U.S. HOLDERS WITH RESPECT
TO THE ACQUISITION, OWNERSHIP, AND DISPOSITION OF COMMON SHARES.
U.S. HOLDERS SHOULD CONSULT THEIR OWN TAX ADVISORS AS TO THE TAX
CONSIDERATIONS APPLICABLE TO THEM IN THEIR OWN PARTICULAR
CIRCUMSTANCES.
G.
Dividends
and Paying Agents
Not
Applicable.
H.
Statement
by Experts
Not
Applicable.
I.
Documents
on Display
We are
subject to the informational requirements of the Exchange Act and
file reports and other information with the SEC. You may read and
copy any of our reports and other information we file with the SEC
and obtain copies upon payment of any prescribed fees from the
Public Reference Room maintained by the SEC at 100 F Street, N.E.,
Washington, D.C. 20549. In addition, the SEC maintains a website
that contains reports and other information regarding registrants
that file electronically with the SEC at http://www.sec.gov. The
public may obtain information on the operation of the Public
Reference Room by calling the SEC at 1-800-SEC-0330.
The
documents concerning us referred to in this Annual Report may be
viewed during normal business hours at our executive offices at
Suite 1610 – 409 Granville Street, Vancouver, British
Columbia, V6C 1T2.
We are
required to file reports and other information with the securities
commissions in Canada. You are invited to read and copy any
reports, statements or other information, other than confidential
filings, that we file with the provincial securities commissions.
These filings are also electronically available from SEDAR at
www.sedar.com, the Canadian equivalent of the SEC’s
electronic document gathering and retrieval system.
121
J.
Subsidiary
Information
Not
applicable.
ITEM
11.
QUANTITATIVE
AND QUALITATIVE DISCLOSURES ABOUT MARKET RISK
(a)
Quantitative
Information about market risk
Market Risk
The
significant market risks to which the Company is exposed are
interest rate risk, foreign currency risk, and commodity and equity
price risk. Despite some signs of improvement, market challenges
for commodities and mining sector equities continued during the
first part of the year. These economic conditions create
uncertainty particularly over the price of vanadium, silver and
coal, the exchange rate between Canadian and US dollars and the
timing of any further recovery remains uncertain.
Interest Rate Risk
Interest
rate risk is the risk that the fair value or future cash flows of a
financial instrument will fluctuate due to changes in market
interest rates. The Company’s cash primarily include highly
liquid investments that earn interest at market rates that are
fixed to maturity. Due to the short-term nature of these financial
instruments, fluctuations in market rates do not have significant
impact on the fair values of the financial instruments as of
December 31, 2020. The Company manages interest rate risk by
maintaining an investment policy that focuses primarily on
preservation of capital and liquidity.
Foreign Currency Risk
The
Company is exposed to foreign currency risk to the extent that
monetary assets and liabilities held by the Company are not
denominated in Canadian dollars. The Company has exploration
projects in the United States, Bolivia and Mongolia and undertakes
transactions in various foreign currencies. The Company is
therefore exposed to foreign currency risk arising from
transactions denominated in a foreign currency and the translation
of financial instruments denominated in US dollar, Bolivian
boliviano and Mongolian tugrik into its reporting currency, the
Canadian dollar. Based on the above, net exposures as at December
31, 2020, with other variables unchanged, a 10% (December 31, 2019
– 10%, December 31, 2018 – 10%) strengthening
(weakening) of the Canadian dollar against the Mongolian tugrik
would impact net loss with other variables unchanged by $100,000. A
10% strengthening (weakening) of the Canadian dollar against the
Bolivian boliviano would impact net loss with other variables
unchanged by $73,000. A 10% strengthening (weakening) of the US
dollar against the Canadian dollar would impact net loss with other
variables unchanged by $28,000. The Company currently does not use
any foreign exchange contracts to hedge this currency
risk.
Commodity and Equity Price Risk
Commodity
price risk is defined as the potential adverse impact on earnings
and economic value due to commodity price movements and
volatilities. Commodity prices fluctuate on a daily basis and are
affected by numerous factors beyond the Company’s control.
The supply and demand for these commodities, the level of interest
rates, the rate of inflation, investment decisions by large holders
of commodities including governmental reserves and stability of
exchange rates can all cause significant fluctuations in prices.
Such external economic factors are in turn influenced by changes in
international investment patterns and monetary systems and
political developments.
The
Company is also exposed to price risk with regards to equity
prices. Equity price risk is defined as the potential adverse
impact on the Company’s earnings due to movements in
individual equity prices or general movements in the level of the
stock market.
The
Company closely monitors commodity prices, individual equity
movements and the stock market to determine the appropriate course
of action to be taken by the Company. Fluctuations in value may be
significant.
Credit Risk
Credit
risk is the risk that one party to a financial instrument will fail
to discharge an obligation and cause the other party to incur a
financial loss. The Company is exposed to credit risk primarily
associated to cash and receivables. The carrying amount of assets
included on the statements of financial position represents the
maximum credit exposure.
ITEM
12.
DESCRIPTION
OF SECURITIES OTHER THAN EQUITY SECURITIES
A.
A.-C.
Not
applicable.
D.
American
Depository Receipts
The
Company does not have securities registered as American Depository
Receipts.
122
ITEM
13.
DEFAULTS,
DIVIDEND ARREARAGES AND DELINQUENCIES
Not
applicable.
ITEM
14.
MATERIAL
MODIFICATIONS TO THE RIGHTS OF SECURITY HOLDERS AND USE OF
PROCEEDS
Not
applicable.
ITEM
15.
CONTROLS
AND PROCEDURES
A.
Disclosure
Controls and Procedures
An
evaluation was performed under the supervision and with the
participation of the Company’s Audit Committee and
management, including the Company’s CEO and the
Company’s CFO, of the effectiveness of the design and
operation of the Company’s disclosure controls and procedures
pursuant to Rules 13a-15(b) and 15d-15(b) of the U.S. Exchange Act
as of December 31, 2020. Based on their evaluation, the
Company’s CEO and CFO have concluded that the disclosure
controls and procedures were effective to give reasonable assurance
that the information required to be disclosed by the Company in
reports that it files or submits under the U.S. Exchange Act is,
(a) recorded, processed, summarized and reported, within the time
periods specified in the SEC’s rules and forms, and (b)
accumulated and communicated to management, including its principal
executive and principal financial officers, or persons performing
similar functions, as appropriate to allow timely decisions
regarding required disclosure.
B.
Management’s
Annual Report on Internal Control Over Financial
Reporting
The
Company’s management, including the Company’s CEO and
CFO, is responsible for establishing and maintaining adequate
internal control over the Company’s internal control over
financial reporting, as such term is defined in Rule 13a-15(f)
under the U.S. Exchange Act. The Company’s internal control
over financial reporting is a process designed to provide
reasonable assurance regarding the reliability of financial
reporting and the preparation of consolidated financial statements
for external purposes in accordance with IFRS. The Company’s
internal control over financial reporting includes policies and
procedures that: pertain to the maintenance of records that, in
reasonable detail accurately and fairly reflect the transactions
and disposition of assets; provide reasonable assurance that
transactions are recorded as necessary to permit preparation of the
consolidated financial statements in accordance with IFRS and that
receipts and expenditures are being made only in accordance with
authorization of management and directors of the Company; and
provide reasonable assurance regarding prevention or timely
detection of unauthorized acquisition, use or disposition of assets
that could have a material effect on the consolidated financial
statements.
Because
of their inherent limitations, internal control over financial
reporting can provide only reasonable assurance and may not prevent
or detect misstatements. Furthermore, projections of any evaluation
of effectiveness to future periods are subject to the risk that
controls may become inadequate because of changes in conditions, or
that the degree of compliance with the policies or procedures may
deteriorate.
The
Company’s management (with the participation of the CEO and
the CFO) conducted an evaluation of the effectiveness of the
Company’s internal control over financial reporting as of
December 31, 2020. This evaluation was based on the criteria set
forth in the 2013 Internal Control-Integrated Framework issued by
the Committee of Sponsoring Organizations of the Treadway
Commission. Based on its assessment, management has concluded that
the Company’s internal control over financial reporting was
effective during the year ended December 31, 2020, and
management’s assessment did not identify any material
weaknesses.
C.
Attestation
Report of the Registered Public Accounting Firm
This
Annual Report does not include an attestation report of our
registered public accounting firm regarding internal control over
financial reporting. Management’s report was not subject to
attestation by our registered public accounting firm due to: (1)
the Dodd-Frank Wall Street Reform and Consumer Protection Act of
2010, which permits the Company as a “non-accelerated
filer” to provide only management’s report on internal
control over financial reporting in this Annual Report and omit an
attestation report of the issuer’s registered public
accounting firm regarding management’s report on internal
control over financial reporting; and (2) our qualifying as an
“emerging growth company” under section 3(a) of the
Exchange Act (as amended by the JOBS Act, enacted on April 5,
2012), providing us an exemption from the attestation
requirement.
D.
Changes
in Internal Control Over Financial Reporting
Based
upon their evaluation of our controls, our CEO and CFO have
concluded that there were no significant changes in our internal
control over financial reporting or in other factors during our
last fiscal year that have materially affected, or are reasonably
likely to materially affect, our internal control over financial
reporting.
ITEM
16.
[RESERVED]
Not
applicable.
123
ITEM
A
AUDIT
COMMITTEE FINANCIAL EXPERT
The
Company’s Board has determined that Mr. Greg Hall, Chairman
of the Audit Committee possesses the educational and professional
qualifications as well as the experience to qualify as an
“Audit Committee Financial Expert” as defined in Item
407(d)(5) of Regulation S-K under the Exchange Act. Mr. Hall does
not meet the criteria for independence of an audit committee member
established under SEC Rule 10A-3. In addition, the Company believes
that the other members of the Audit Committee are capable of
analyzing and evaluating the financial statements and understanding
internal controls and procedures for financial
reporting.
ITEM
B
CODE
OF ETHICS
The
Company has adopted a Code of Ethics that applies to all directors,
senior officers and employees of the Company including the CEO and
CFO.
Shareholders
may request a copy of the Code of Ethics by written request
directed to Silver Elephant Mining Corp., Suite 1610, 409 Granville
Street, Vancouver, British Columbia, Canada V6C 1T2.
There
have been no waivers or amendments to the Code of Ethics during the
year ended December 31, 2020.
ITEM
C
PRINCIPAL
ACCOUNTANT FEES AND SERVICES
The
following table shows the aggregate amounts billed to the Company
by its principal auditors, Davidson & Company LLP Chartered
Accountants, and its affiliates, for the three fiscal years ended
December 31, 2020, for audit fees, audit related fees, tax fees and
all other fees:
|
|
Year
Ended
December
31,
2020
(4)
|
Year
Ended
December
31,
2019
|
Year
Ended
December
31,
2018
|
|
Audit Fees
(1)
|
$
86,037
|
$
100,000
|
$
100,000
|
|
Audit-Related Fees
(2)
|
21,000
|
Nil
|
52,340
|
|
Tax Fees
(3)
|
15,950
|
20,000
|
13,000
|
|
All Other
Fees
|
20,000
|
Nil
|
Nil
|
|
TOTAL
|
$
146,787
|
$
120,000
|
$
165,340
|
Notes:
1.
“Audit
Fees” represent fees for the audit of the annual consolidated
financial statements, and review in connection with the statutory
and regulatory filings.
2.
“Audit
Related Fees” represent fees for assurance and related
services that are related to the performance of the
audit.
3.
“Tax
Fees” represent fees for tax compliance, tax advice and
planning.
4.
Fees for the year
ended December 31, 2020, are based, in part, upon estimates
received by the Company as final invoices are yet to be rendered as
of the date of this Annual Report.
ITEM
D
EXEMPTIONS
FROM THE LISTING STANDARDS FOR AUDIT COMMITTEES
Not
applicable.
ITEM
E
PURCHASES
OF EQUITY SECURITIES BY THE ISSUER AND AFFILIATED
PURCHASERS
Not
applicable.
ITEM
F
CHANGE
IN REGISTRANT’S CERTIFYING ACCOUNTANT
Not
applicable.
ITEM
G
CORPORATE
GOVERNANCE
Not
applicable.
ITEM
H
MINE
SAFETY DISCLOSURE
Pursuant
to Section 1503(a) of the Dodd-Frank Wall Street Reform and
Consumer Protection Act of 2010, issuers that are operators, or
that have a subsidiary that is an operator, of a coal or other mine
in the United States are required to disclose in their periodic
reports filed with the SEC information regarding specified health
and safety violations, orders and citations, related assessments
and legal actions, and mining-related fatalities with respect to
mining operations and properties in the United States that are
subject to regulation by the Federal Mine Safety and Health
Administration (the “MSHA”) under the Federal Mine
Safety and Health Act of 1977 (the “Mine Act”). During
the year ended December 31, 2020, the Company had no operating
mines in the United States that were subject to regulation by the
MSHA under the Mine Act.
124
ITEM
17.
FINANCIAL
STATEMENTS
Not
applicable.
ITEM
18.
FINANCIAL
STATEMENTS
Page 126
Audited
Financial Statements of the Company for the years ended December
31, 2020, 2019 and 2018.
ITEM
19.
EXHIBITS
Exhibit Number
Description
1.1
*
Articles of
Incorporation (incorporated by reference from our Registration
Statement on Form 20-F filed with the SEC on June 27,
2018).
1.2
*
Amendment to
Articles of Incorporation dated March 16, 2020 (incorporated by
reference filed with the SEC on March 17, 2020.)
Description of
Registered Securities (incorporated by reference from our Form 20-F
filed with the SEC on March 31, 2020).
Audit Committee
Charter dated October 21, 2020.
4.1
*
Debt Settlement
Agreement dated January 13, 2017 among Silver Elephant Mining
Corp., Linx and John Lee (incorporated by reference from our
Registration Statement on Form 20- F filed with the SEC on June 27,
2018).
4.2
*
Mineral Lease
Agreement dated June 22, 2017 between Silver Elephant Mining Corp.
and Janelle Dietrich (incorporated by reference from our
Registration Statement on Form 20-F filed with the SEC on June 27,
2018).
4.3
*
Mineral Lease
Agreement dated July 10, 2017 among Silver Elephant Mining Corp.,
Richard A. McKay, Nancy M. Minoletti and Pamela S. Scutt
(incorporated by reference from our Registration Statement on Form
20-F filed with the SEC on June 27, 2018).
4.4
*
Share Purchase
Agreement dated February 7, 2018 among Silver Elephant Mining
Corp., Medalist Capital Ltd. and 631208 B.C. Ltd. (incorporated by
reference from our Registration Statement on Form 20-F filed with
the SEC on June 27, 2018.
4.5
*
Amendment to the
Mineral Lease Agreement dated April 19, 2018 between Silver
Elephant Mining Corp. and Janelle Dietrich (incorporated by
reference from our Annual Report on Form 20-F filed with the SEC on
March 31, 2019).
4.6
*
Share-Based
Compensation Plan (incorporated by reference from the
Company’s Management information Circular filed with the SEC
on June 1, 2020).
4.7
*
English Summary of
Pulacayo Joint Venture Agreement (incorporated by reference from
our Annual Report on Form 20-F filed with the SEC on March 31,
2019).
4.8
*
Underwriting
Agreement between Silver Elephant Mining Corp., and Mackie Research
Capital Corporation, Canaccord Genuity Corp. and Sprott Capital
Partners LP. dated October 26, 2020 (incorporated by reference from
our Form 6-K filed with the SEC on October 29, 2020).
4.9
*
Amendment to
Underwriting Agreement between Silver Elephant Mining Corp., and
Mackie Research Capital Corporation, Canaccord Genuity Corp. and
Sprott Capital Partners LP. dated November 17, 2020 (incorporated
by reference from our Form 6-K filed with the SEC on November 18,
2020.)
4.10
*
The El Triunfo
Sales and Purchase Agreement dated July 13, 2020 between the
Company’s subsidiary Illumina Silver Mining Corp. and a
private party to acquire the El Triunfo Gold-Silver-Lead-Zinc
Project (incorporated by reference filed with the SEC on February
9, 2021).
4.11
*
Minago Project
Asset Purchase Agreement dated January 21, 2021 (incorporated by
reference and filed with the SEC on February 10, 2021)
4.12
*
Voting Trust
Agreement dated February 9, 2021 between Victory Nickel Inc. and
the Company dated February 9, 2021 (incorporated by reference and
filed with the SEC on February 10, 2021).
4.13
*
Voting Trust
Agreement in respect to the Company’s Common Shares dated
February 9, 2021 (incorporated by reference and filed with the SEC
on February 10, 2021).
4.14
*
Debt Purchase
Agreement between City Hall Capital LLC and Silver Elephant Mining
Corp (redacted) . dated January 15, 2021 (incorporated by reference
and filed with the SEC on February 10, 2021).
List of
Subsidiaries
Certification of
Chief Executive Officer Pursuant to Section 302 of the
Sarbanes-Oxley Act of 2002
Certification of
Chief Financial Officer Pursuant to Section 302 of the
Sarbanes-Oxley Act of 2002
Certification of
Chief Executive Officer Pursuant to Section 906 of the
Sarbanes-Oxley Act of 2002
Certification of
Chief Financial Officer Pursuant to Section 906 of the
Sarbanes-Oxley Act of 2002
15.1
*
43-101 Pulacayo
2020 Technical Report, effective Oct 13 2020 dated October 23, 2020
(incorporated by reference from our Form 6-K filed with the SEC on
November 18, 2020)
101.
INS
XBRL
Instance
Document
101.
SCH
XBRL
Taxonomy Extension
Schema Document
101.
CAL
XBRL
Taxonomy Extension
Calculation Linkbase Document
101.
DEF
XBRL
Taxonomy Extension
Definition Linkbase Document
101.
LAB
XBRL
Taxonomy Extension
Label Linkbase Document
101.
PRE
XBRL
Taxonomy Extension
Presentation Linkbase Document
*
Incorporated by reference from the Company’s SEC
filings.
125
SIGNATURES
The
registrant hereby certifies that it meets all of the requirements
for filing on Form 20-F and that it has duly caused and authorized
the undersigned to sign this Annual Report on its
behalf.
|
|
|
SILVER ELEPHANT MINING CORP.
|
|
Date:
March 12, 2021
|
By:
|
/s/
John Lee
|
|
|
|
John
Lee
|
|
|
|
Chief
Executive Officer
|
126

Annual Consolidated Financial Statements
For the years ended December 31, 2020, 2019 and 2018
(Expressed
in Canadian Dollars)
TABLE OF CONTENTS
|
MANAGEMENT’S RESPONSIBILITY FOR FINANCIAL
REPORTING
|
3
|
|
|
Report of Independent Registered Public Accounting
Firm
|
4
|
|
|
Consolidated Statements of Financial Position
|
6
|
|
|
Consolidated Statements of Operations and Comprehensive Gain
(Loss)
|
7
|
|
|
Consolidated Statements of Changes in Equity
|
8
|
|
|
Consolidated Statements of Cash Flows
|
9
|
|
|
|
|
|
|
1
|
DESCRIPTION OF BUSINESS AND NATURE OF OPERATIONS
|
10
|
|
2
|
BASIS OF PRESENTATION
|
10
|
|
3
|
BASIS OF CONSOLIDATION
|
11
|
|
4
|
CHANGES IN ACCOUNTING POLICIES
|
11
|
|
5
|
SIGNIFICANT JUDGMENTS, ESTIMATES AND ASSUMPTIONS
|
12
|
|
6
|
SUMMARY OF SIGNIFICANT ACCOUNTING POLICIES
|
16
|
|
7
|
SEGMENTED INFORMATION
|
21
|
|
8
|
CASH AND CASH EQUIVALENTS
|
21
|
|
9
|
RECEIVABLES
|
22
|
|
10
|
PREPAID EXPENSES
|
22
|
|
11
|
MARKETABLE SECURITIES
|
22
|
|
12
|
RIGHT-OF-USE ASSET
|
22
|
|
13
|
EQUIPMENT
|
23
|
|
14
|
MINERAL PROPERTIES
|
25
|
|
15
|
ACCOUNTS PAYABLE AND ACCRUED LIABILITIES
|
30
|
|
16
|
LEASE LIABILITY
|
31
|
|
17
|
PROVISION FOR CLOSURE AND RECLAMATION
|
31
|
|
18
|
TAX PROVISION
|
32
|
|
19
|
SHARE CAPITAL
|
33
|
|
20
|
CAPITAL RISK MANAGEMENT
|
38
|
|
21
|
FAIR VALUE MEASUREMENTS AND FINANCIAL INSTRUMENTS
|
38
|
|
22
|
FINANCIAL RISK MANAGEMENT DISCLOSURES
|
39
|
|
23
|
RELATED PARTY DISCLOSURES
|
40
|
|
24
|
KEY MANAGEMENT PERSONNEL COMPENSATION
|
41
|
|
25
|
SUPPLEMENTAL CASH FLOW INFORMATION
|
42
|
|
26
|
CONTINGENCIES
|
42
|
|
27
|
EVENTS AFTER THE REPORTING DATE
|
43
|
2

The annual audited consolidated financial statements (the
“
Annual Financial
Statements
”), the notes
thereto, and other financial information contained in the
accompanying Management’s Discussion and Analysis
(“
MD&A
”) have been prepared in accordance with
International Financial Reporting Standards as issued by the
International Accounting Standards Board and are the responsibility
of the management of Silver Elephant Mining Corp. The financial
information presented elsewhere in the MD&A is consistent with
the data that is contained in the Annual Financial Statements. The
Annual Financial Statements, where necessary, include amounts which
are based on the best estimates and judgment of
management.
In order to discharge management’s responsibility for the
integrity of the Annual Financial Statements, the Company maintains
a system of internal accounting controls. These controls are
designed to provide reasonable assurance that the Company’s
assets are safeguarded, transactions are executed and recorded in
accordance with management’s authorization, proper records
are maintained, and relevant and reliable financial information is
produced. These controls include maintaining quality standards in
hiring and training of employees, policies and procedures manuals,
a corporate code of conduct and ethics and ensuring that there is
proper accountability for performance within appropriate and
well-defined areas of responsibility. The system of internal
controls is further supported by a compliance function, which is
designed to ensure that we and our employees comply with securities
legislation and conflict of interest rules.
The Board of Directors is responsible for overseeing
management’s performance of its responsibilities for
financial reporting and internal control. The Audit Committee,
which is composed of non-executive directors, meets with management
as well as the external auditors to ensure that management is
properly fulfilling its financial reporting responsibilities to the
Board who approve the Annual Financial Statements. The external
auditors have full and unrestricted access to the Audit Committee
to discuss the scope of their audits and the adequacy of the system
of internal controls
,
and to review financial reporting
issues
.
The
external auditors, Davidson & Company LLP, have been appointed
by the Company’s shareholders to render their opinion on the
Annual Financial Statements and their report is included
herein.
|
“John Lee”
|
“
Irina
Plavutska
”
|
|
----------------------------------------------------
|
---------------------------------------------------
|
|
John
Lee, Chief Executive Officer
|
Irina
Plavutska, Chief Financial Officer
|
Vancouver,
British Columbia
March
12, 2021
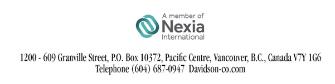
3
REPORT OF INDEPENDENT REGISTERED PUBLIC ACCOUNTING
FIRM
To the
Shareholders and Directors of
Silver
Elephant Mining Corp.
Opinion on the Consolidated Financial Statements
We have audited the accompanying consolidated statements of
financial position of Silver Elephant Mining Corp.
(the “Company”), as of December 31, 2020, 2019 and
2018, and the related consolidated statements of operations and
comprehensive gain (loss), changes in equity (deficiency), and cash
flows for the years ended December 31, 2020, 2019 and 2018, and the
related notes (collectively referred to as the “financial
statements”). In our opinion, the consolidated financial
statements present fairly, in all material respects, the financial
position of Silver Elephant Mining Corp. as of December 31, 2020,
2019 and 2018, and the results of its operations and its cash flows
for the years ended December 31, 2020, 2019 and 2018 in accordance
with those requirements of International Financial Reporting
Standards (IFRS) as issued by the International Accounting
Standards Board.
Going Concern
The
accompanying consolidated financial statements have been prepared
assuming that the Company will continue as a going concern. As
discussed in Note 1 to the consolidated financial statements, the
Company has suffered recurring losses from operations that raise
substantial doubt about its ability to continue as a going concern.
Management's plans in regard to these matters are also described in
Note 1. The consolidated financial statements do not include any
adjustments that might result from the outcome of this
uncertainty.
Basis for Opinion
These
consolidated financial statements are the responsibility of the
Company’s management. Our responsibility is to express an
opinion on the Company’s consolidated financial statements
based on our audits. We are a public accounting firm registered
with the Public Company Accounting Oversight Board (United States)
(“PCAOB”) and are required to be independent with
respect to the Company in accordance with the U.S. federal
securities laws and the applicable rules and regulations of the
Securities and Exchange Commission and the PCAOB.
We
conducted our audits in accordance with the standards of the PCAOB.
Those standards require that we plan and perform the audit to
obtain reasonable assurance about whether the consolidated
financial statements are free of material misstatement, whether due
to error or fraud. The Company is not required to have, nor were we
engaged to perform, an audit of its internal control over financial
reporting. As part of our audits we are required to obtain an
understanding of internal control over financial reporting but not
for the purpose of expressing an opinion on the effectiveness of
the Company’s internal control over financial reporting.
Accordingly, we express no such opinion.
4
Our
audits included performing procedures to assess the risks of
material misstatements of the financial statements, whether due to
error or fraud, and performing procedures that respond to those
risks. Such procedures included examining, on a test basis,
evidence regarding the amounts and disclosures in the consolidated
financial statements. Our audits also included evaluating the
accounting principles used and significant estimates made by
management, as well as evaluating the overall presentation of the
consolidated financial statements. We believe that our audits
provide a reasonable basis for our opinion.
We have
served as the Company’s auditor since 2013.
|
|

|
|
Vancouver,
Canada
|
Chartered
Professional Accountants
|
March
12, 2021
5
SILVER ELEPHANT MINING CORP.
(Expressed
in Canadian Dollars)
|
As at
|
|
December
31,
|
December
31,
|
December
31,
|
|
|
Notes
|
2020
|
2019
|
2018
|
|
Assets
|
|
|
|
|
|
Current
assets
|
|
|
|
|
|
Cash
|
8
|
$
7,608,149
|
$
3,017,704
|
$
5,304,097
|
|
Receivables
|
9
|
75,765
|
246,671
|
36,399
|
|
Prepaid
expenses
|
10
|
114,717
|
135,767
|
123,272
|
|
|
|
7,798,631
|
3,400,142
|
5,463,768
|
|
Non-current
assets
|
|
|
|
|
|
Restricted cash
equivalents
|
8
|
34,500
|
34,500
|
34,500
|
|
Reclamation
deposits
|
|
21,055
|
21,055
|
21,055
|
|
Right-of-use
asset
|
12
|
18,430
|
50,023
|
-
|
|
Equipment
|
13
|
153,800
|
159,484
|
101,162
|
|
Mineral
properties
|
14
|
31,806,594
|
23,782,884
|
3,643,720
|
|
|
|
$
39,833,010
|
$
27,448,088
|
$
9,264,205
|
|
Liabilities
and Equity (Deficiency)
|
|
|
|
|
|
Current
liabilities
|
|
|
|
|
|
Accounts payable
and accrued liabilities
|
15
|
$
1,759,163
|
$
2,420,392
|
$
1,636,786
|
|
Lease
liability
|
16
|
20,533
|
32,285
|
-
|
|
|
|
1,779,696
|
2,452,677
|
1,636,786
|
|
Non-current
liabilities
|
|
|
|
|
|
Lease
liability
|
16
|
-
|
20,533
|
-
|
|
Provision for
closure and reclamation
|
17
|
695,257
|
266,790
|
265,239
|
|
Tax
provision
|
18
|
-
|
-
|
8,121,918
|
|
|
|
2,474,953
|
2,740,000
|
10,023,943
|
|
Equity
(Deficiency)
|
|
|
|
|
|
Share
capital
|
19
|
197,612,182
|
181,129,012
|
173,819,546
|
|
Reserves
|
19
|
24,852,022
|
24,058,336
|
23,413,830
|
|
Deficit
|
|
(185,106,147
)
|
(180,479,260
)
|
(197,993,114
)
|
|
|
|
37,358,057
|
24,708,088
|
(759,738
)
|
|
|
|
$
39,833,010
|
$
27,448,088
|
$
9,264,205
|
|
Approved
on behalf of the Board:
|
|||||
|
"John Lee"
|
|
|
|
|
"Greg Hall"
|
|
John
Lee, Director
|
|
|
|
|
Greg
Hall, Director
|
Contingencies
(Note 26)
Events
after the reporting date (Note 27)
The
accompanying notes form an integral part of these consolidated
financial statements.
6
SILVER ELEPHANT MINING CORP.
(Expressed
in Canadian Dollars)
|
|
|
Years
Ended December 31,
|
||
|
|
Notes
|
2020
|
2019
|
2018
|
|
General
and Administrative Expenses
|
|
|
|
|
|
Advertising and
promotion
|
|
$
541,029
|
$
794,182
|
$
471,230
|
|
Consulting and
management fees
|
22
|
570,356
|
251,552
|
255,610
|
|
Depreciation and
accretion
|
|
41,116
|
65,157
|
28,024
|
|
Director
fees
|
22
|
108,600
|
103,805
|
70,378
|
|
Insurance
|
|
100,948
|
93,661
|
55,546
|
|
Office and
administration
|
|
136,274
|
123,904
|
137,289
|
|
Professional
fees
|
|
321,355
|
228,594
|
428,884
|
|
Salaries and
benefits
|
23
|
530,065
|
760,182
|
827,168
|
|
Share-based
payments
|
19
|
770,617
|
707,802
|
553,430
|
|
Stock exchange and
shareholder services
|
|
180,433
|
139,908
|
239,319
|
|
Travel and
accommodation
|
|
93,323
|
236,815
|
231,505
|
|
|
|
(3,394,116
)
|
(3,505,562
)
|
(3,298,383
)
|
|
Other
Items
|
|
|
|
|
|
Costs in excess of
recovered coal
|
13
|
(590,204
)
|
(120,354
)
|
(94,335
)
|
|
Foreign exchange
loss
|
|
(64,841
)
|
(443,203
)
|
(412,663
)
|
|
(Impairment)/recovery
of mineral property
|
14
|
-
|
13,708,200
|
(13,994,970
)
|
|
Impairment of
prepaid expenses
|
10
|
(121,125
)
|
(51,828
)
|
(26,234
)
|
|
Impairment of
equipment
|
13
|
-
|
-
|
(425,925
)
|
|
Impairment of
receivables
|
9
|
(470,278
)
|
(16,304
)
|
(21,004
)
|
|
Loss on sale of
marketable securities
|
|
-
|
-
|
(91,890
)
|
|
(Loss)/gain on sale
of equipment
|
|
13,677
|
(9,795
)
|
-
|
|
Gain on debt
settlement
|
23, 26
|
-
|
7,952,700
|
50,000
|
|
Other
income
|
|
-
|
-
|
130,936.00
|
|
|
|
(1,232,771
)
|
21,019,416
|
(14,886,085
)
|
|
Gain/(Loss)
for Year
|
|
(4,626,887
)
|
17,513,854
|
(18,184,468
)
|
|
Fair value loss on
marketable securities
|
|
-
|
-
|
(81,000
)
|
|
Reclassification
adjustment for realized loss
|
|
|
|
|
|
marketable
securities
|
|
-
|
-
|
68,840
|
|
Comprehensive
Gain/(Loss) for Year
|
|
$
(4,626,887
)
|
$
17,513,854
|
$
(18,196,628
)
|
|
Gain/(Loss)
Per Common Share,
|
|
|
|
|
|
basic
|
|
$
(0.03
)
|
$
0.17
|
$
(0.23
)
|
|
diluted
|
|
$
(0.03
)
|
$
0.17
|
$
(0.23
)
|
|
Weighted
Average Number of Common Shares Outstanding,
|
|
|
|
|
|
basic
|
|
137,901,802
|
102,208,111
|
78,445,396
|
|
diluted
|
|
137,901,802
|
102,398,145
|
78,443,396
|
The
accompanying notes form an integral part of these consolidated
financial statements.
7
SILVER ELEPHANT MINING CORP.
Consolidated Statements of Changes in Equity
(Deficiency)
(Expressed
in Canadian Dollars)
|
|
Number of
Shares
|
Share
Capital
|
Reserves
|
Accumulated Other
Comprehensive Income (loss)
|
Deficit
|
Total Equity
(Deficiency)
|
|
Balance,
December 31, 2017
|
74,721,790
|
$
165,862,805
|
$
22,621,202
|
$
12,160
|
$
(179,808,646
)
|
$
8,687,521
|
|
Private placements,
net of share issue costs
|
16,061,417
|
6,096,621
|
-
|
-
|
-
|
6,096,621
|
|
Warrants issued for
mineral property
|
-
|
-
|
181,944
|
-
|
-
|
181,944
|
|
Exercise of stock
options
|
87,500
|
39,500
|
(15,350
)
|
-
|
-
|
24,150
|
|
Exercise of
warrants
|
3,445,420
|
1,470,620
|
(132,453
)
|
-
|
-
|
1,338,167
|
|
Bonus
shares
|
1,000,000
|
350,000
|
-
|
-
|
-
|
350,000
|
|
Share-based
payments
|
-
|
-
|
758,487
|
-
|
-
|
758,487
|
|
Loss for the
year
|
-
|
-
|
-
|
-
|
(18,184,468
)
|
(18,184,468
)
|
|
Unrealized loss on
marketable securities
|
-
|
-
|
-
|
(12,160
)
|
-
|
(12,160
)
|
|
Balance,
December 31, 2018
|
95,316,127
|
$
173,819,546
|
$
23,413,830
|
-
|
$
(197,993,114
)
|
$
(759,738
)
|
|
Private placements,
net of share issue costs
|
22,750,000
|
6,117,991
|
-
|
-
|
-
|
6,117,991
|
|
Finders
shares
|
1,179,500
|
366,800
|
-
|
-
|
-
|
366,800
|
|
Debt
Settlements
|
104,951
|
43,030
|
-
|
-
|
|
43,030
|
|
Exercise of stock
options
|
622,500
|
328,095
|
(153,845
)
|
-
|
-
|
174,250
|
|
Exercise of
warrants
|
651,430
|
279,050
|
(28,478
)
|
-
|
-
|
250,572
|
|
Bonus
shares
|
500,000
|
115,000
|
-
|
-
|
-
|
115,000
|
|
Share compensation
for services
|
175,000
|
59,500
|
-
|
-
|
-
|
59,500
|
|
Share-based
payments
|
-
|
-
|
826,829
|
-
|
-
|
826,829
|
|
Gain for the
year
|
-
|
-
|
-
|
-
|
17,513,854
|
17,513,854
|
|
Balance,
December 31, 2019
|
121,299,508
|
$
181,129,012
|
$
24,058,336
|
-
|
$
(180,479,260
)
|
$
24,708,088
|
|
Private placements,
net of share issue costs
|
38,200,000
|
10,247,206
|
-
|
-
|
-
|
10,247,206
|
|
Finders
units
|
156,900
|
(24,000
)
|
24,000
|
-
|
-
|
-
|
|
Broker
warrants
|
-
|
(226,917
)
|
226,917
|
-
|
-
|
-
|
|
Shares issued for
property acquisition
|
4,000,000
|
2,000,000
|
-
|
-
|
-
|
2,000,000
|
|
Exercise of stock
options
|
1,233,750
|
572,659
|
(272,847
)
|
-
|
-
|
299,812
|
|
Exercise of
warrants
|
14,027,670
|
3,273,822
|
(166,628
)
|
-
|
-
|
3,107,194
|
|
Bonus
shares
|
1,601,000
|
640,400
|
-
|
-
|
-
|
640,400
|
|
Share-based
payments
|
-
|
-
|
982,244
|
-
|
-
|
982,244
|
|
Loss for the
year
|
-
|
-
|
-
|
-
|
(4,626,887
)
|
(4,626,887
)
|
|
Balance,
December 31, 2020
|
180,518,828
|
$
197,612,182
|
$
24,852,022
|
-
|
$
(185,106,147
)
|
$
37,358,057
|
The
accompanying notes form an integral part of these consolidated
financial statements.
8
SILVER ELEPHANT MINING CORP.
(Expressed
in Canadian Dollars)
|
|
Years
Ended December 31,
|
||
|
|
2020
|
2019
|
2018
|
|
|
|
|
|
|
Operating
Activities
|
|
|
|
|
Net gain/(loss) for
year
|
$
(4,626,887
)
|
$
17,513,854
|
$
(18,184,468
)
|
|
Adjustments to
reconcile net loss to net cash flows:
|
|
|
|
|
Depreciation and
accretion
|
64,387
|
65,157
|
28,024
|
|
Share-based
payments
|
770,617
|
707,802
|
553,430
|
|
Unrealized foreign
exchange (gain)/loss
|
-
|
(169,218
)
|
580,902
|
|
Share compensation
for services
|
720,900
|
356,003
|
350,000
|
|
(Impairment)/recovery
of mineral property
|
-
|
(13,708,200
)
|
13,994,970
|
|
Impairment of
prepaid expenses
|
121,125
|
51,828
|
26,234
|
|
Impairment of
equipment
|
-
|
-
|
425,925
|
|
Impairment of
receivables
|
470,278
|
16,304
|
21,004
|
|
Loss on sale of
marketable securities
|
-
|
-
|
91,890
|
|
(Loss)/gain on sale
of equipment
|
13,677
|
9,795
|
-
|
|
Change in estimate
reclamation provision
|
405,196
|
-
|
-
|
|
Gain on debt
settlement
|
-
|
(7,952,700
)
|
-
|
|
|
(2,060,707
)
|
(3,109,375
)
|
(2,112,089
)
|
|
Changes to working
capital items
|
|
|
|
|
Receivables
|
(299,372
)
|
(196,079
)
|
(22,750
)
|
|
Prepaid expenses
and reclamation deposits
|
(100,075
)
|
(29,323
)
|
(8,896
)
|
|
Accounts payable
and accrued liabilities
|
(88,888
)
|
659,264
|
(482,952
)
|
|
|
(488,335
)
|
433,862
|
(514,598
)
|
|
Cash
Used in Operating Activities
|
(2,549,042
)
|
(2,675,513
)
|
(2,626,687
)
|
|
|
|
|
|
|
Investing
Activities
|
|
|
|
|
Net
(purchases)/proceeds from marketable securities
|
-
|
-
|
101,550
|
|
Proceeds
on sale of equipment
|
50,695
|
-
|
-
|
|
Purchase of
equipment
|
(111,592
)
|
(113,564
)
|
(120,416
)
|
|
Mineral property
expenditures
|
(6,336,166
)
|
(6,123,401
)
|
(3,609,896
)
|
|
Cash
Used in Investing Activities
|
(6,397,063
)
|
(6,236,965
)
|
(3,628,762
)
|
|
|
|
|
|
|
Financing
Activities
|
|
|
|
|
Proceeds from share
issuance, net of share issue costs
|
10,201,706
|
6,237,791
|
6,096,621
|
|
Proceeds from
exercise of stock options
|
299,812
|
174,250
|
24,150
|
|
Proceeds from
exercise of warrants
|
3,072,194
|
250,572
|
1,338,167
|
|
Lease
payments
|
(37,162
)
|
(36,528
)
|
-
|
|
Cash
Provided by Financing Activities
|
13,536,550
|
6,626,085
|
7,458,938
|
|
Net Decrease in
Cash
|
4,590,445
|
(2,286,393
)
|
1,203,489
|
|
Cash - beginning of
year
|
3,017,704
|
5,304,097
|
4,100,608
|
|
Cash - end of
year
|
$
7,608,149
|
$
3,017,704
|
$
5,304,097
|
Supplemental
cash flow information (Note 25)
The
accompanying notes form an integral part of these consolidated
financial statements.
9
SILVER ELEPHANT MINING CORP.
Notes
to Annual Consolidated Financial Statements
For the
years ended December 31, 2020, 2019 and 2018
(Expressed in
Canadian Dollars)
1.
DESCRIPTION
OF BUSINESS AND NATURE OF OPERATIONS
Silver
Elephant Mining Corp. (the “
Company
”) is incorporated under
the laws of the province of British Columbia, Canada. The
common shares
without par value
in the capital of the Company (the
“
Common
Shares
”) are listed for
trading on the Toronto Stock Exchange (the
“
TSX
”) under the symbol “ELEF” and
on
the Frankfurt Stock Exchange under the symbol
“1P2N” and are quoted on
the OTCQX® Best Market under the
symbol “SILEF”
.
The
Company is an exploration stage company. The Company
holds an interest in the Pulacayo
Paca silver-zinc-lead property located in Bolivia and
an
100% interest in two vanadium projects in North America, being the
Gibellini vanadium project, which is comprised of the
Gibellini
,
Louie
Hill and Bisoni vanadium deposits and associated claims located in
the State of Nevada, USA, and the Titan vanadium-titanium-iron
property located in the Province of Ontario, Canada. In 2020, the
Company acquired the Sunawayo silver-zinc-lead and El Triunfo
gold-silver-zinc properties in Bolivia.
The Company also has a 100% interest
in the Ulaan Ovoo coal property located in Selenge province,
Mongolia and a 100% interest in the Chandgana Tal coal property and
Khavtgai Uul coal property located in Khentii province,
Mongolia.
The
Company maintains its registered and records office at Suite 1610
– 409 Granville Street, Vancouver, British Columbia, Canada,
V6C 1T2.
These consolidated audited annual
financial statements have been prepared under the assumption that
the Company is a going concern
, which contemplates the
realization of assets and the payment of liabilities in the
ordinary course of business. As at December 31, 2020, Company has a
deficit of $185.1 million.
The
business of mineral exploration involves a high degree of risk and
there can be no assurance that the Company’s current
operations, including exploration programs, will result in
profitable mining operations. The recoverability of the carrying
value of mineral properties, and property and equipment interests
and the Company’s continued existence is dependent upon the
preservation of its interest in the underlying properties, the
discovery of economically recoverable reserves, the achievement of
profitable operations, the ability of the Company to raise
additional sources of funding, and/or, alternatively, upon the
Company’s ability to dispose of some or all of its interests
on an advantageous basis. These conditions may cast significant
doubt upon the Company’s ability to continue as a going
concern.
In
assessing whether the going concern assumption is appropriate,
management takes into account all available information about the
future, which is at least, but not limited to, twelve months from
the end of the reporting period. Management is aware, in making its
assessment, of uncertainties related to events or conditions that
may cast significant doubt upon the entity’s ability to
continue as a going concern that these uncertainties are material
and, therefore, that it may be unable to realize its assets and
discharge its liabilities in the normal course of business.
Accordingly, they do not give effect to adjustments that would be
necessary should the Company be unable to continue as a going
concern and therefore to realize its assets and discharge its
liabilities and commitments in other than the normal course of
business and at amounts different from those in the accompanying
financial statements. These adjustments could be
material.
2.
BASIS
OF PRESENTATION
These
Annual Financial Statements have been prepared in accordance with
International Financial Reporting Standards, (“
IFRS
”) as issued by the
International Accounting Standards Board (“
IASB
”).
The
preparation of financial statements in compliance with IFRS
requires the use of certain critical accounting estimates. It also
requires the Company’s management to exercise judgment in
applying the Company’s accounting policies. The areas where
significant judgments and estimates have been made in preparing
these Annual Financial Statements and their effect are disclosed in
Note 5.
These
Annual Financial Statements have been prepared on a historical cost
basis, except for financial instruments classified as fair value
through profit or loss (“
FVTPL
”), which are stated at their
fair values. These Annual Financial Statements have been prepared
using the accrual basis of accounting except for
10
SILVER ELEPHANT MINING CORP.
Notes
to Annual Consolidated Financial Statements
For the
years ended December 31, 2020, 2019 and 2018
(Expressed in
Canadian Dollars)
2.
BASIS OF PRESENTATION
(cont’d…)
cash
flow information. These Annual Financial Statements are presented
in Canadian Dollars, except where otherwise noted.
The
accounting policies set out in Note 6 have been applied
consistently by the Company and its subsidiaries to all periods
presented.
The
Annual Consolidated Financial Statements were reviewed by the Audit
Committee and approved and authorized for issue by the Board of
Directors on March 8, 2021
.
3.
BASIS
OF CONSOLIDATION
The Annual Financial Statements comprise the financial statements
of the Company and its wholly owned and partially owned
subsidiaries as at December 31, 2020. Subsidiaries are consolidated
from the date of acquisition, being the date on which the Company
obtains control, and continue to be consolidated until the date
when such control ceases. Effects of transactions between
subsidiaries are eliminated on consolidation. The financial
statements of the subsidiaries are prepared for the same reporting
period as the parent company
.
Accounting policies of the
subsidiaries have been changed where necessary to ensure
consistency with the policies adopted by the
Company.
The
Company’s significant subsidiaries at December 31, 2020 are
presented in the following table:
4.
CHANGES
IN ACCOUNTING POLICIES
Amendment to IFRS 16, COVID
‐
19
‐
Related Rent
Concessions
In May
2020, the International Accounting Standards Board
(“IASB”) issued an amendment to permit lessees, as a
practical expedient, not to assess whether particular rent
concessions that reduce lease payments occurring as a direct
consequence of the COVID
‐
19 pandemic are lease
modifications and instead to account for those rent concessions as
if they are not lease modifications. The amendment is
effective for annual reporting periods beginning on or after June
1, 2020, with earlier application permitted. The adoption of this
amendment is not expected to have an impact on the financial
statements.
Amendments to IAS 1 and IAS 8: Definition of
Material
In
October 2018, the IASB issued amendments to IAS 1, Presentation of
Financial Statements, and IAS 8, Accounting Policies, Changes in
Accounting Estimates and Errors, to align the definition of
“material” across the standards and to clarify certain
aspects of the definition. The new definition states that,
“Information is material if omitting, misstating or obscuring
it could reasonably be expected to influence decisions that the
primary users of general purpose financial statements make on the
basis of those financial statements, which provide financial
information about a specific reporting entity.”
These amendments are effective for annual periods beginning on or
after January 1, 2020. The amendments to the definition of material
did not have a significant impact on the Annual Financial
Statements.
11
SILVER ELEPHANT MINING CORP.
Notes
to Annual Consolidated Financial Statements
For the
years ended December 31, 2020, 2019 and 2018
(Expressed in
Canadian Dollars)
4.
CHANGES IN ACCOUNTING POLICIES
(cont’d…)
Future Accounting Pronouncements
The
Company has not early adopted any standard, interpretation or
amendment that has been issued but is not yet
effective.
Amendments to IAS 16: Property, Plant and Equipment: Proceeds
before Intended Use.
In May 2020, the IASB issued amendments
to IAS 16,
Property, Plant
and Equipment
(IAS 16). The amendments prohibit
a company from
deducting from the cost of property, plant and equipment amounts
received from selling items produced
while the company is
preparing the asset for its intended use. Instead, a company will
recognize such sales proceeds and related costs in profit (loss).
An entity is required to apply these amendments for annual
reporting periods beginning on or after January 1, 2022. The
amendments are applied retrospectively only to items of property,
plant and equipment that are available for use after the beginning
of the earliest period presented in the financial statements in
which the entity first applies the amendments. We are currently
assessing the effect of this amendment on our financial
statements.
Amendments
to IAS 1: Classification of Liabilities as Current or
Non
‐
Current
and Deferral of Effective Date
.
In January 2020, the IASB
issued amendments to IAS 1, Presentation of Financial Statements,
to provide a more general approach to the presentation of
liabilities as current or non
‐
current based on
contractual arrangements in place at the reporting
date.
These
amendments:
−
specify that the rights and conditions existing at the end of the
reporting period are relevant in determining whether the Company
has a right to defer settlement of a liability by at least twelve
months;
−
provide that management’s expectations are not a relevant
consideration as to whether the Company will exercise its rights to
defer settlement of a liability; and
−
clarify when a liability is considered settled.
On July
15, 2020, the IASB issued a deferral of the effective date for the
new guidance by one year to annual reporting periods beginning on
or after January 1, 2023 and is to be applied retrospectively. The
Company has not yet determined the impact of these amendments on
its financial statements
.
5.
SIGNIFICANT
JUDGMENTS, ESTIMATES AND ASSUMPTIONS
The
preparation of a company’s financial statements in conformity
with IFRS requires management to make judgments, estimates and
assumptions that affect the reported amounts of assets and
liabilities and disclosures of contingent assets and liabilities at
the date of the financial statements and the reported amounts of
revenues and expenses during the reporting period. Estimates and
assumptions are continually evaluated and are based on
management’s experience and other factors, including
expectations of future events that are believed to be reasonable
under the circumstances. Actual results could differ from these
estimates.
5.1.
Significant
Judgments
The
significant judgments that the Company’s management has made
in the process of applying the Company’s accounting policies,
apart from those involving estimation uncertainties (Annual
financial statements 5.2), that have the most significant effect on
the amounts recognized in the Annual Financial Statements include,
but are not limited to:
(a)
Functional currency
determination
The
functional currency for each of the Company’s subsidiaries is
the currency of the primary economic environment and the Company
reconsiders the functional currency of its entities if there is a
change in events and conditions which determined the primary
economic environment. Management has determined the functional
currency of all entities to be the Canadian dollar.
12
SILVER ELEPHANT MINING CORP.
Notes
to Annual Consolidated Financial Statements
For the
years ended December 31, 2020, 2019 and 2018
(Expressed in
Canadian Dollars)
5.
SIGNIFICANT JUDGMENTS, ESTIMATES AND
ASSUMPTIONS
(cont’d…)
5.1 Significant Judgments
(cont’d…)
(b)
Economic
recoverability and probability of future economic benefits of
exploration, evaluation and development costs
Management
has determined that exploratory drilling, evaluation, development
and related costs incurred which have been capitalized are
economically recoverable. Management uses several criteria in its
assessments of economic recoverability and probability of future
economic benefit including geologic and metallurgic information,
history of conversion of mineral deposits to proven and probable
reserves, scoping, prefeasibility and feasibility studies,
assessable facilities, existing permits and life of mine
plans.
Management
has determined that during the year ended December 31, 2020, none
of the Company’s silver and vanadium projects have reached
technical feasibility and commercial viability and therefore remain
within Mineral Properties on the Statement of Financial
Position
.
(c)
Impairment (recovery) assessment of deferred exploration
interests
The
Company considers both external and internal sources of information
in assessing whether there are any indications that mineral
property interests are impaired. External sources of information
the Company considers include changes in the market, economic and
legal environment in which the Company operates that are not within
its control and affect the recoverable amount of mineral property
interest. Internal sources of information the Company considers
include the manner in which mineral properties and plant and
equipment are being used or are expected to be used and indications
of economic performance of the assets.
During
the year ended December 31, 2018, the Company wrote-off $13,994,970
of capitalized mineral property costs. During the year ended
December 31, 2019, the Company reversed $13,708,200 of impairment
(Note 14).
(d)
Deferred Tax Assets
and Liabilities
The
measurement of the deferred tax provision is subject to uncertainty
associated with the timing of future events and changes in
legislation, tax rates and interpretations by tax authorities. The
estimation of deferred taxes includes evaluating the recoverability
of deferred tax assets based on an assessment of the
Company’s ability to utilize the underlying future tax
deductions against future taxable income prior to expiry of those
deductions. For deferred tax calculation purposes, Management
assesses whether it is probable that some or all of the deferred
income tax assets will not be realized. The ultimate realization of
deferred tax assets is dependent upon the generation of future
taxable income, which in turn is dependent upon the successful
discovery, extraction, development and commercialization of mineral
reserves. To the extent that management’s assessment of the
Company’s ability to utilize future tax deductions changes,
the Company would be required to recognize more or fewer deferred
tax assets, and future tax provisions or recoveries could be
affected
.
5.2 Estimates and Assumptions
The
Company bases its estimates and assumptions on current and various
other factors that it believes to be reasonable under the
circumstances. Management believes the estimates are reasonable;
however, actual results could differ from those estimates and could
impact future results of operations and cash flows. The areas which
require management to make significant estimates and assumptions in
determining carrying values include, but are not limited
to:
(a)
Mineral
reserves
The recoverability of the carrying value of the mineral properties
is dependent on successful development and commercial exploitation,
or alternatively, sale of the respective areas of
interest
.
13
SILVER ELEPHANT MINING CORP.
Notes
to Annual Consolidated Financial Statements
For the
years ended December 31, 2020, 2019 and 2018
(Expressed in
Canadian Dollars)
5.
SIGNIFICANT JUDGMENTS, ESTIMATES AND
ASSUMPTIONS
(cont’d…)
5.2 Estimates and Assumptions
(cont’d…)
(b)
Depreciation
Significant
judgment is involved in the determination of useful life and
residual values for the computation of depreciation, depletion and
amortization and no assurance can be given that actual useful lives
and residual values will not differ significantly from current
assumptions.
(c)
Impairment
The carrying value of long-lived assets are reviewed each reporting
period to determine whether there is any indication of impairment.
If the carrying amount of an asset exceeds its recoverable amount,
the asset is impaired, and an impairment loss is recognized in the
consolidated statement of operations. The assessment of fair
values, including those of the cash generating units (the smallest
identifiable group of assets that generates cash inflows that are
largely independent of the cash inflow from other assets or groups
of assets) (“
CGUs
”) for purposes of testing impairment,
require the use of estimates and assumptions for recoverable
production, long-term commodity prices, discount rates, foreign
exchange rates, future capital requirements and operating
performance. Changes in any of the assumptions or estimates used in
determining the fair value of long-lived assets could impact the
impairment analysis.
(d)
Allowance for
doubtful accounts, and the recoverability of receivables and
prepaid expense amounts.
Significant
estimates are involved in the determination of recoverability of
receivables and no assurance can be given that actual proceeds will
not differ significantly from current estimations. Similarly,
significant estimates are involved in the determination of the
recoverability of services and/or goods related to the prepaid
expense amounts, and actual results could differ significantly from
current estimations.
Management
has made significant assumptions about the recoverability of
receivables and prepaid expense amounts. During the year ended
December 31, 2020 the Company wrote-off $470,278 (2019 -
$16,304;2018
-
$21,004) of trade receivables which are no longer expected to be
recovered and $121,125 (2019 - $51,828;2018 - $26,234) of prepaid
expenses for which not future benefit is expected to be
received.
(e)
Provision for
closure and reclamation
The
Company assesses its mineral properties’ rehabilitation
provision at each reporting date or when new material information
becomes available. Exploration, development and mining activities
are subject to various laws and regulations governing the
protection of the environment. In general, these laws and
regulations are continually changing, and the Company has made, and
intends to make in the future, expenditures to comply with such
laws and regulations. Accounting for reclamation obligations
requires management to make estimates of the future costs that the
Company will incur to complete the reclamation work required to
comply with existing laws and regulations at each location. Actual
costs incurred may differ from those amounts
estimated.
Also,
future changes to environmental laws and regulations could increase
the extent of reclamation and remediation work required to be
performed by the Company. Increases in future costs could
materially impact the
amounts
charged to operations for reclamation and remediation. The
provision represents management’s best estimate of the
present value of the future reclamation and remediation obligation.
The actual future expenditures may differ from the amounts
currently provided.
(f)
Share-based
payments
Management
uses valuation techniques in measuring the fair value of share
purchase options granted. The fair value is determined using the
Black Scholes option pricing model which requires management to
make certain estimates, judgement, and assumptions in relation to
the expected life of the share purchase options and share purchase
warrants, expected volatility, expected risk-free rate, and
expected forfeiture rate. Changes to these assumptions could have a
material impact on the Annual Financial Statements.
14
SILVER ELEPHANT MINING CORP.
Notes
to Annual Consolidated Financial Statements
For the
years ended December 31, 2020, 2019 and 2018
(Expressed in
Canadian Dollars)
5.
SIGNIFICANT JUDGMENTS, ESTIMATES AND
ASSUMPTIONS
(cont’d…)
5.2 Estimates and Assumptions
(cont’d…)
(g)
Contingencies
The
assessment of contingencies involves the exercise of significant
judgment and estimates of the outcome of future events. In
assessing loss contingencies related to legal proceedings that are
pending against the Company and that may result in regulatory or
government actions that may negatively impact the Company’s
business or operations, the Company and its legal counsel evaluate
the perceived merits of the legal proceeding or unasserted claim or
action as well as the perceived merits of the nature and amount of
relief sought or expected to be sought, when determining the
amount, if any, to recognize as a contingent liability or when
assessing the impact on the carrying value of the Company’s
assets. Contingent assets are not recognized in the Annual
Financial Statements.
(h)
Fair value measurement
The
Company measures financial instruments at fair value at each
reporting date. The fair values of financial instruments measured
at amortized cost are disclosed in Note 21
.
Also, from time to time,
the fair values of non-financial assets and liabilities are
required to be determined, e.g., when the entity acquires a
business, completes
an
asset acquisition or where an entity measures the recoverable
amount of an asset or cash-generating unit at fair value less costs
of disposal. Fair value is the price that would be received to sell
an asset or paid to transfer a liability in an orderly transaction
between market participants at the measurement date.
The
fair value of an asset or a liability is measured using the
assumptions that market participants would use when pricing the
asset or liability, assuming that market participants act in their
economic best interest. A fair value measurement of a non-financial
asset takes into account a market participant’s ability to
generate economic benefits by using the asset in its highest and
best use or by selling it to another market participant that would
use the asset in its highest and best use. The Company uses
valuation techniques that are appropriate in the circumstances and
for which sufficient data are available to measure fair value,
maximising the use of relevant observable inputs and minimising the
use of unobservable inputs. Changes in estimates and assumptions
about these inputs could affect the reported fair
value.
COVID-19
An
emerging risk is a risk not well understood at the current time and
for which the impacts on strategy and financial results are
difficult to assess or are in the process of being assessed. Since
December 31, 2019, the outbreak of COVID-19 has resulted in
governments worldwide enacting emergency measures to combat the
spread of the virus. These measures, which include the
implementation of travel bans, self-imposed quarantine periods and
social distancing, have caused material disruption to businesses
globally, resulting in an economic slowdown. Global equity markets
have experienced significant volatility and weakness. Governments
and central banks have reacted with significant monetary and fiscal
interventions designed to stabilize economic conditions. The
duration and impact of the COVID-19 outbreak is unknown at this
time, as is the efficacy of the government and central bank
interventions. It is not possible to reliably estimate the length
and severity of these developments and the impact on the financial
results and condition of the Company and its operating subsidiaries
in future periods.
COVID-19
may impact Company operations, and consequently, the nature and
amounts and disclosures in the financial statements. Some of the
specific areas impacted by COVID-19 include, but are not limited
to:
●
Going concern
assessments;
●
Evaluation of
subsequent events;
●
Impairment and
recovery of mineral properties;
●
Fair value
measurements;
●
Lease
modifications;
●
Employee
termination benefits; and
●
Financial statement
and Management Discussion & Analysis disclosures.
As at
December 31, 2020, the COVID-19 pandemic has not affected the
Company’s critical accounting policies.
15
SILVER ELEPHANT MINING CORP.
Notes
to Annual Consolidated Financial Statements
For the
years ended December 31, 2020, 2019 and 2018
(Expressed in
Canadian Dollars)
6.
SUMMARY
OF SIGNIFICANT ACCOUNTING POLICIES
(a)
Restricted
cash equivalents
Restricted
cash equivalents consist of highly liquid investments pledged as
collateral for the Company’s credit card and are readily
convertible to known amounts of cash.
(b)
Mineral
properties
Mineral
property assets consist of exploration and evaluation costs. Costs
directly related to the exploration and evaluation of resource
properties are capitalized to mineral properties once the legal
rights to explore the resource properties are acquired or obtained.
These costs include acquisition of rights to explore, license and
application fees, topographical, geological, geochemical and
geophysical studies, exploratory drilling, trenching,
sampling, and activities in relation to evaluating the technical
feasibility and commercial viability of extracting a mineral
resource.
If it
is determined that capitalized acquisition, exploration and
evaluation costs are not recoverable, or the property is abandoned
or management has determined an impairment in value, the property
is written down to its recoverable amount. Mineral properties are
reviewed at least annually for indicators of impairment and are
tested for impairment when facts and circumstances suggest that the
carrying amount may exceed its recoverable amount.
From
time to time, the Company acquires or disposes of properties
pursuant to the terms of option agreements. Options are exercisable
entirely at the discretion of the optionee and, accordingly, are
recorded as mineral property costs or recoveries when the payments
are made or received. After costs are recovered, the balances of
the payments received are recorded as a gain on option or
disposition of mineral property.
(i)
Title to mineral
properties
Although the
Company has taken steps to verify title to the properties on which
it is conducting exploration and in which it has an interest, in
accordance with industry standards for the current stage of
exploration of such properties, these procedures do not guarantee
the Company’s title, nor has the Company insured title.
Property title may be subject to unregistered prior agreements and
non-compliance with regulatory requirements
.
(ii)
Realization of
mineral property assets
The
investment in and expenditures on mineral property interests
comprise a significant portion of the Company’s assets.
Realization of the Company’s investment in these assets is
dependent upon the establishment of legal ownership, and the
attainment of successful production from properties or from the
proceeds of their disposal. Resource exploration and development is
highly speculative and involves inherent risks. While the rewards
if an ore body is discovered can be substantial, few properties
that are explored are ultimately developed into profitable
producing mines. There can be no assurance that current exploration
programs will result in the discovery of economically viable
quantities of ore.
The
amounts shown for acquisition costs and deferred exploration
expenditures represent costs incurred to date and do not
necessarily reflect present or future values.
(iii)
Environmental
The
Company is subject to the laws and regulations relating to
environmental matters in all jurisdictions in which it operates,
including provisions relating to property reclamation, discharge of
hazardous material and other matters. The Company may also be held
liable should environmental problems be discovered that were caused
by former owners and operators of its properties and properties in
which it has previously had an interest.
The
Company conducts its mineral exploration activities in compliance
with applicable environmental protection legislation. Other than as
disclosed in Note 17, the Company is not aware of any existing
environmental issues related to any of its current or former
properties that may result in material liability to the Company.
Environmental legislation is becoming increasingly stringent and
costs and expenses of regulatory compliance are increasing. The
impact of new and future environmental legislation on the
Company’s operations may cause additional
expenses
16
SILVER ELEPHANT MINING CORP.
Notes
to Annual Consolidated Financial Statements
For the
years ended December 31, 2020, 2019 and 2018
(Expressed in
Canadian Dollars)
6.
SUMMARY OF SIGNIFICANT ACCOUNTING
POLICIES
(cont’d…)
(b)
Mineral properties
(cont’d…)
(iii)
Environmental
(cont’d…)
and
restrictions. If the restrictions adversely affect the scope of
exploration and development on the mineral properties, the
potential for production on the property may be diminished or
negated.
(c)
Equipment
Equipment
is stated at cost less accumulated depreciation and accumulated
impairment losses, if any. The cost of an item of property and
equipment consists of the purchase price, any costs directly
attributable to bringing the asset to the location and condition
necessary for its intended use, and an initial estimate of the
costs of dismantling and removing the item and restoring the site
on which it is located.
Depreciation
of equipment is recorded on a declining-balance basis at the
following annual rates:
|
Computer
equipment
|
45%
|
|
Furniture
and equipment
|
20%
|
|
Leasehold
improvement
|
Straight
line / 5 years
|
|
Mining
equipment
|
20%
|
|
Vehicles
|
30%
|
|
Right-of-use
asset
|
Straight
line / term of lease
|
When
parts of major components of equipment have different useful lives,
they are accounted for as a separate item of
equipment.
The
cost of major overhauls of parts of equipment is recognized in the
carrying amount of the item if is probable that the future economic
benefits embodied within the part will flow to the Company, and its
cost can be measured reliably. The carrying amount of the replaced
part is derecognized. The costs of the day-to-day servicing of
equipment are recognized in profit or loss as
incurred.
(d)
Impairment of
non-current assets and Cash Generating Units (“
CGU
”)
At the
end of each reporting period, the Company reviews the carrying
amounts of its tangible and intangible assets to determine whether
there is an indication that those assets have suffered an
impairment loss. If any such indication exists, the recoverable
amount of the asset is estimated in order to determine the extent
of the impairment loss (if any).
Where
it is not possible to estimate the recoverable amount of an
individual asset, the Company estimates the recoverable amount of
the CGU, where the recoverable amount of the CGU is the greater of
the CGU’s fair value less costs to sell and its value in use
to which the assets belong. In assessing value in use, estimated
future cash flows are discounted to their present value using a
pre-tax discount rate that reflects current market assessments of
the time value of money and the risks specific to the
asset.
If the
recoverable amount of an asset (or CGU) is estimated to be less
than its carrying amount, the carrying amount of the asset (or CGU)
is reduced to its recoverable amount. An impairment loss is
recognized immediately in the statement of comprehensive loss,
unless the relevant asset is carried at a revalued amount, in which
case the impairment loss is treated as a revaluation decrease. Each
project or group of claims or licenses is treated as a CGU.
Discounted cash flow techniques often require management to make
estimates and assumptions concerning reserves and expected future
production revenues and expenses, which can vary from actual. Where
an impairment loss subsequently reverses, the carrying amount of
the asset (or CGU) is increased to the revised estimate of its
recoverable amount, such that the increased carrying amount does
not exceed the carrying amount that would have been determined had
no impairment loss been recognized for the asset (or CGU) in prior
years.
17
SILVER ELEPHANT MINING CORP.
Notes
to Annual Consolidated Financial Statements
For the
years ended December 31, 2020, 2019 and 2018
(Expressed in
Canadian Dollars)
6.
SUMMARY OF SIGNIFICANT ACCOUNTING
POLICIES
(cont’d…)
(e)
Foreign currency
translation
Transactions
in currencies other than the functional currency are recorded at
the prevailing exchange rates on the dates of the transactions. At
each financial position reporting date, monetary assets and
liabilities denominated in foreign currencies are translated at the
prevailing exchange rates at the date of the consolidated statement
of financial position. Non-monetary items measured in terms of
historical cost in a foreign currency are not retranslated. Gains
and losses arising from this translation are included in the
determination of net gain or loss for the year.
(f)
Costs in
excess of recovered coal
Exploration
expenditures are re-classified from Exploration and evaluation
assets to deferred development costs within the property and
equipment category once the work completed to date supports the
future development of the property and such development receives
appropriate approvals.
After
reclassification, all subsequent expenditure on the construction,
installation or completion of infrastructure facilities is
capitalized within deferred development cost. Development
expenditure is net of proceeds from the sale of coal extracted
during the development phase to the extent that it is considered
integral to the development of the mine. Any costs incurred in
testing the assets to determine if they are functioning as
intended, are capitalized, net of any proceeds received from
selling any product produced while testing. Where these proceeds
exceed the cost of testing, any excess is recognized in the
statement of profit or loss and other comprehensive
income.
As the
Company’s Ulaan Ovoo mine has been impaired to a value of
$nil (2019 - $nil, 2018 - $nil), all property costs incurred are
presented net of incidental income earned from the property in all
years presented.
(g)
Unit
offerings
Proceeds
received on the issuance of units, consisting of common shares and
warrants, are allocated first to common shares based on the market
trading price of the common shares at the time the units are
priced, and any excess is allocated to warrants.
(h)
Share-based
payments
The
Company has a share purchase option plan that is described in Note
19. The Company accounts for share-based payments using a fair
value-based method with respect to all share-based payments to
directors, officers, employees, and service providers. Share-based
payments to employees are measured at the fair value of the
instruments issued and amortized over the vesting periods.
Share-based payments to non-employees are
measured at the fair value of the
goods or services received or if such fair value is not reliably
measurable, at the fair value of the equity instruments issued. The
fair value is recognized as an expense or capitalized to mineral
properties or property and equipment with a corresponding increase
in option reserve. This includes a forfeiture estimate, which is
revised for actual forfeitures in subsequent periods.
Where
the terms and conditions of options are modified before they vest,
the increase in the fair value of the options, measured immediately
before and after the modification, is also charged to the
consolidated statement of operations over the remaining vesting
period.
Upon
the exercise of the share purchase option, the consideration
received, and the related amount transferred from option reserve
are recorded as share capital.
(i)
Loss per
share
Basic
loss per share is calculated using the weighted average number of
common shares outstanding during the period. The Company uses the
treasury stock method to compute the dilutive effect of options and
warrants. Under this method the dilutive effect on earnings per
share is calculated presuming the exercise of outstanding
options
18
SILVER ELEPHANT MINING CORP.
Notes
to Annual Consolidated Financial Statements
For the
years ended December 31, 2020, 2019 and 2018
(Expressed in
Canadian Dollars)
6.
SUMMARY OF SIGNIFICANT ACCOUNTING
POLICIES
(cont’d…)
(i)
Loss per
share
and
warrants. It assumes that the proceeds of such exercise would be
used to repurchase common shares at the average market price during
the period. However, the calculation of diluted loss per share
excludes the effects of various conversions and exercise of options
and warrants that would be anti-dilutive.
(j)
Income
taxes
Income
tax expense comprises current and deferred tax. Current tax is the
expected tax payable or receivable on the taxable income or loss
for the year using tax rates enacted or substantively enacted at
the reporting date.
Deferred
tax is recognized in respect of temporary differences between the
carrying amounts of assets and liabilities for financial reporting
purposes and the amounts used for taxation purposes. Deferred tax
is measured at the tax rates that are expected to be applied to
temporary differences when they reverse, based on the tax laws that
have been enacted or substantively enacted by the reporting date.
Deferred tax assets and liabilities are offset if there is a
legally enforceable right to offset current tax liabilities and
assets, and they relate to income taxes levied by the same tax
authority on the same taxable entity.
A
deferred tax asset is recognized for unused tax losses, tax credits
and deductible temporary differences, to the extent that it is
probable that future taxable profits will be available against
which they can be utilized. Deferred tax assets are reviewed at
each reporting date and are reduced to the extent that it is no
longer probable that the related tax benefit will be
realized.
(k)
Provision for
closure and reclamation
The
Company assesses its equipment and mineral property rehabilitation
provision at each reporting date. Changes to estimated future costs
are recognized in the statement of financial position by either
increasing or decreasing the rehabilitation liability and asset to
which it relates if the initial estimate was originally recognized
as part of an asset measured in accordance with IAS 16
Property, Plant and
Equipment
.
The
Company records the present value of estimated costs of legal and
constructive obligations required to restore operations in the
period in which the obligation is incurred. The nature of these
restoration activities includes dismantling and removing
structures; rehabilitating mineral properties; dismantling
operating facilities; closure of plant and waste sites; and
restoration, reclamation and vegetation of affected areas. Present
value is used where the effect of the time value of money is
material. The related liability is adjusted each period for the
unwinding of the discount rate and for changes in estimates,
changes to the current market-based discount rate, and the amount
or timing of the underlying cash flows needed to settle the
obligation.
(l)
Financial
instruments
Classification
Financial assets
are classified at initial recognition as either: measured at
amortized cost, FVTPL or fair value through other comprehensive
income ("FVOCI"). The classification depends on the Company’s
business model for managing the financial assets and the
contractual cash flow characteristics. For assets measured at fair
value, gains and losses will either be recorded in profit or loss
or OCI. Derivatives embedded in contracts where the host is a
financial asset in the scope of the standard are never separated.
Instead, the hybrid financial instrument as a whole is assessed for
classification. Financial liabilities are measured at amortized
cost, unless they are required to be measured at FVTPL or the
Company has opted to measure at FVTPL.
Measurement
Financial assets
and liabilities at FVTPL are initially recognized at fair value and
transaction costs are expensed in the consolidated statement of
loss and comprehensive loss. Realized and unrealized gains and
losses arising from changes in the fair value of the financial
assets or liabilities held at FVTPL are included in the
consolidated
19
SILVER ELEPHANT MINING CORP.
Notes
to Annual Consolidated Financial Statements
For the
years ended December 31, 2020, 2019 and 2018
(Expressed in
Canadian Dollars)
6.
SUMMARY OF SIGNIFICANT ACCOUNTING
POLICIES
(cont’d…)
(l)
Financial
instruments (cont’d…)
Measurement
(cont’d…)
statement of
operations and comprehensive loss in the period in which they
arise. Where the Company has opted to designate a financial
liability at FVTPL, any changes associated with the Company's
credit risk will be recognized
in OCI.
Financial assets and liabilities at amortized cost are initially
recognized at fair value, and subsequently carried at amortized
cost less any impairment.
Impairment
The
Company assesses on a forward-looking basis the expected credit
loss (“ECL”) associated with financial assets measured
at amortized cost, contract assets and debt instruments carried at
FVOCI. The impairment methodology applied depends on whether there
has been a significant increase in credit risk. Please refer to
Note 21 for relevant fair value measurement
disclosures.
(m)
Leases
At
inception of a contract, we assess whether a contract is, or
contains, a lease. A contract is, or contains, a lease if the
contract conveys the right to control the use of an identified
asset for a period of time in exchange for consideration. We assess
whether the contract involves the use of an identified asset,
whether we have the right to obtain substantially all of the
economic benefits from use of the asset during the term of the
arrangement and if we have the right to direct the use of the
asset. At inception or on assessment of a contract that contains a
lease component, we allocate the consideration in the contract to
each lease component on the basis of their relative stand-alone
prices.
As a
lessee, we recognize a right-of-use asset, which is included in
property, plant and equipment, and a lease liability at the
commencement date of a lease. The right-of-use asset is initially
measured at cost, which is comprised of the initial amount of the
lease liability adjusted for any lease payments made at or before
the commencement date, plus any decommissioning and restoration
costs, less any lease incentives received.
The
right-of-use asset is subsequently depreciated from the
commencement date to the earlier of the end of the lease term, or
the end of the useful life of the asset. In addition, the
right-of-use asset may be reduced due to impairment losses, if any,
and adjusted for certain remeasurements of the lease
liability.
A lease
liability is initially measured at the present value of the lease
payments that are not paid at the commencement date, discounted by
the interest rate implicit in the lease, or if that rate cannot be
readily determined, our incremental borrowing rate. Lease payments
included in the measurement of the lease liability are comprised
of:
●
fixed payments,
including in-substance fixed payments, less any lease incentives
receivable;
●
variable lease
payments that depend on an index or a rate, initially measured
using the index or rate as at the commencement date;
●
amounts expected to
be payable under a residual value guarantee;
●
exercise prices of
purchase options if we are reasonably certain to exercise that
option; and
●
payments of
penalties for terminating the lease, if the lease term reflects the
lessee exercising an option to terminate the lease.
The
lease liability is measured at amortized cost using the effective
interest method. It is remeasured when there is a change in future
lease payments arising from a change in an index or rate, or if
there is a change in our estimate or assessment of the expected
amount payable under a residual value guarantee, purchase, and
extension or termination option. Variable lease payments not
included in the initial measurement of the lease liability are
charged directly to profit (loss).
20
SILVER ELEPHANT MINING CORP.
Notes
to Annual Consolidated Financial Statements
For the
years ended December 31, 2020, 2019 and 2018
(Expressed in
Canadian Dollars)
6.
SUMMARY OF SIGNIFICANT ACCOUNTING
POLICIES
(cont’d…)
(m)
Leases
(cont’d…)
We have
elected not to recognize right-of-use assets and lease liabilities
for short-term leases that have a lease term of 12 months or less
and leases of low-value assets. The lease payments associated with
these leases are charged directly to profit (loss) on a
straight-line basis over the lease term.
7.
SEGMENTED
INFORMATION
The
Company operates in one operating segment, being the acquisition,
exploration and development of mineral properties. Geographic
segmentation of the Company’s non-current assets is as
follows:
|
|
December
31, 2020
|
||||
|
|
Canada
|
USA
|
Mongolia
|
Bolivia
|
Total
|
|
Reclamation
deposits
|
$
-
|
$
-
|
$
21,055
|
$
-
|
$
21,055
|
|
Equipment
|
9,729
|
80,401
|
2,790
|
60,880
|
153,800
|
|
Mineral
properties
|
-
|
13,290,081
|
-
|
18,516,513
|
31,806,594
|
|
|
$
9,729
|
$
13,370,482
|
$
23,845
|
$
18,577,393
|
$
31,981,449
|
|
|
December
31, 2019
|
||||
|
|
Canada
|
USA
|
Mongolia
|
Bolivia
|
Total
|
|
Reclamation
deposits
|
$
-
|
$
-
|
$
21,055
|
$
-
|
$
21,055
|
|
Equipment
|
12,005
|
89,826
|
35,721
|
21,932
|
159,484
|
|
Mineral
properties
|
-
|
8,600,658
|
-
|
15,182,226
|
23,782,884
|
|
|
$
12,005
|
$
8,690,484
|
$
56,776
|
$
15,204,158
|
$
23,963,423
|
|
|
December
31, 2018
|
||||
|
|
Canada
|
USA
|
Mongolia
|
Bolivia
|
Total
|
|
Reclamation
deposits
|
$
-
|
$
-
|
$
21,055
|
$
-
|
$
21,055
|
|
Equipment
|
14,839
|
22,713
|
33,440
|
30,170
|
101,162
|
|
Mineral
properties
|
-
|
3,643,720
|
-
|
-
|
3,643,720
|
|
|
$
14,839
|
$
3,666,433
|
$
54,495
|
$
30,170
|
$
3,765,937
|
8.
CASH
AND RESTRICTED CASH EQUIVALENTS
Cash
and restricted cash equivalents of the Company are comprised of
bank balances and a guaranteed investment certificate which can be
readily converted into cash without significant restrictions,
changes in value or penalties.
|
|
December
31, 2020
|
December
31, 2019
|
December
31, 2018
|
|
Cash
|
$
7,608,149
|
$
3,017,704
|
$
5,304,097
|
|
Restricted
cash equivalents
|
34,500
|
34,500
|
34,500
|
|
|
$
7,642,649
|
$
3,052,204
|
$
5,338,597
|
Restricted Cash Equivalents
As at
December 31, 2020, a guaranteed investment certificate of $34,500
(2019 - $34,500, 2018 – $34,500) has been pledged as
collateral for the Company’s credit card.
21
SILVER ELEPHANT MINING CORP.
Notes
to Annual Consolidated Financial Statements
For the
years ended December 31, 2020, 2019 and 2018
(Expressed in
Canadian Dollars)
9.
RECEIVABLES
Trade
receivables are non-interest-bearing and are generally on terms of
30 to 90 days.
|
|
December
31, 2020
|
December
31, 2019
|
December
31, 2018
|
|
Input
tax recoverable
|
$
73,804
|
$
20,741
|
$
36,399
|
|
Trade
receivable
|
1,961
|
195,433
|
-
|
|
Subscriptions
receivable
|
-
|
30,497
|
-
|
|
|
$
75,765
|
$
246,671
|
$
36,399
|
During
the year ended December 31, 2020, the Company wrote-off $470,278
(2019 - $16,304, 2018 - $21,004) of receivables which are no longer
expected to be recovered.
10.
PREPAID
EXPENSES
|
|
December
31, 2020
|
December
31, 2019
|
December
31, 2018
|
|
General
|
$
26,759
|
$
44,613
|
$
47,215
|
|
Insurance
|
69,096
|
59,815
|
57,883
|
|
Environmental
and taxes
|
6,850
|
6,850
|
8,789
|
|
Rent
|
12,012
|
24,489
|
9,385
|
|
|
$
114,717
|
$
135,767
|
$
123,272
|
During
the year ended December 31, 2020, the Company wrote-off $121,125
(2019 - $51,828, 2018 - $26,234) of prepaid expenses for which no
future benefit is expected to be received.
11.
MARKETABLE
SECURITIES
As at
and during the year ended December 31, 2020 and year ended December
31, 2019, the Company did not have marketable securities. During
the year ended December 31, 2018, the Company sold all its
marketable securities for proceeds of $162,490 and a realized loss
of $91,890. Following the disposal of the shares, the Company
reclassified the cumulative loss previously recognized in other
comprehensive income of $68,840 to profit and loss on the sale of
marketable securities.
The
following table summarized information regarding the
Company’s marketable securities as at December 31, 2020,
2019, and 2018:
|
Marketable
securities
|
2020
|
2019
|
2018
|
|
Balance,
beginning of year
|
$
-
|
$
-
|
205600
|
|
Additions
|
-
|
-
|
60940
|
|
Disposals
|
-
|
-
|
(162,490
)
|
|
Realized
loss on disposal
|
-
|
-
|
(91,890
)
|
|
Unrealized
gain/(loss) on market-to-market
|
-
|
-
|
(12,160
)
|
|
Balance,
end of year
|
$
-
|
$
-
|
$
-
|
12.
RIGHT-OF-USE
ASSET
During
the first-time application of IFRS 16 to the Company’s office
lease, the recognition of a right of use asset was required and the
leased asset was measured at the amount of the lease liability
using the Company’s current incremental borrowing rate of
10%. The lease contains no extension or termination options. The
following table presents the right-of-use-asset as at January 1,
2019, December 31, 2019 and December 31, 2020:
|
Initial
recognition, January 1, 2019
|
$
81,617
|
|
Additions
|
-
|
|
Depreciation
|
(31,594
)
|
|
Balance
at December 31, 2019
|
$
50,023
|
|
Depreciation
|
(31,593
)
|
|
Balance
at December 31, 2020
|
$
18,430
|
22
SILVER ELEPHANT MINING CORP.
Notes
to Annual Consolidated Financial Statements
For the
years ended December 31, 2020, 2019 and 2018
(Expressed in
Canadian Dollars)
13.
EQUIPMENT
During
the year ended December 31, 2018, the Company wrote-off $425,925 of
mining equipment in Bolivia that was no longer in use.
On October 1
0
,
2018, the Company signed a lease agreement (the
“
Lease
”)
with an arms-length private Mongolian company (the
“
Lessee
”)
whereby the Lessee plans to perform mining operations at the
Company’s Ulaan Ovoo coal mine and will pay the Company
US$2.00 (the “
Production
Royalty
”) for every tonne of coal
shipped from the Ulaan Ovoo site premises.
The Lessee paid the Company
US$100,000 in cash (recorded as other income on the consolidated
statement of operations) as a non-refundable advance royalty
payment and is preparing, at its own and sole expense, to restart
and operate the Ulaan Ovoo mine with its own equipment, supplies,
housing and crew.
The
Lease is valid for 3 years with an annual advance royalty payment
(“
ARP
”) for the
first year of US$100,000 which was due and paid upon signing, and
US$150,000 and US$200,000 due on the 1st and 2nd anniversary of the
Lease, respectively. The ARP can be credited towards the US$2.00
per tonne Production Royalty payments to be made to the Company as
the Lessee starts to sell Ulaan Ovoo coal.
The 3-year Lease can
be extended upon mutual agreement. The first and second anniversary
payments due have not been collected and the Company has recorded a
full provision in the amount of $470,278 (US$350,000) due to
uncertainty of their collection.
The
impaired value of $Nil for deferred development costs at Ulaan Ovoo
property at December 31, 2020 (2019, 2018 - $Nil) remains
unchanged.
The
following table summarized information regarding the
Company’s equipment as at December 31, 2020, 2019, and
2018:
23
SILVER ELEPHANT MINING CORP.
Notes
to Annual Consolidated Financial Statements
For the
years ended December 31, 2020, 2019 and 2018
(Expressed in
Canadian Dollars)
13.
EQUIPMENT
|
|
Computer
|
Furniture
&
|
|
Mining
|
|
|
|
Equipment
|
Equipment
|
Vehicles
|
Equipment
|
Total
|
|
Cost
|
|
|
|
|
|
|
Balance,
December 31, 2017
|
$
100,074
|
$
276,830
|
$
172,692
|
$
1,314,829
|
$
1,864,425
|
|
Additions/(Disposals)
|
3,180
|
2,015
|
-
|
24,476
|
29,671
|
|
Impairment
charge
|
-
|
-
|
-
|
(1,314,829
)
|
(1,314,829
)
|
|
Balance,
December 31, 2018
|
$
103,254
|
$
278,845
|
$
172,692
|
$
24,476
|
$
579,267
|
|
Accumulated depreciation
|
|
|
|
|
|
|
Balance,
December 31, 2017
|
$
96,695
|
$
217,073
|
$
129,842
|
$
888,904
|
$
1,332,514
|
|
Depreciation
for year
|
1,316
|
16,351
|
13,337
|
3,491
|
34,495
|
|
Impairment
charge
|
-
|
-
|
-
|
(888,904
)
|
(888,904
)
|
|
Balance,
December 31, 2018
|
$
98,011
|
$
233,424
|
$
143,179
|
$
3,491
|
$
478,105
|
|
Carrying amount at December 31, 2018
|
$
5,243
|
$
45,421
|
$
29,513
|
$
20,985
|
$
101,162
|
|
Cost
|
|
|
|
|
|
|
Balance,
December 31, 2018
|
$
103,254
|
$
278,845
|
$
172,692
|
$
24,476
|
$
579,267
|
|
Additions/(Disposals)
|
-
|
-
|
46,914
|
-
|
46,914
|
|
Balance,
December 31, 2019
|
$
103,254
|
$
278,845
|
$
219,606
|
$
24,476
|
$
626,181
|
|
Accumulated depreciation
|
|
|
|
|
|
|
Balance,
December 31, 2018
|
$
98,011
|
$
233,424
|
$
143,179
|
$
3,491
|
$
478,105
|
|
Disposals
|
-
|
-
|
(39,178
)
|
-
|
(39,178
)
|
|
Depreciation
for year
|
792
|
12,445
|
10,641
|
3,892
|
27,770
|
|
Balance,
December 31, 2019
|
$
98,803
|
$
245,869
|
$
114,642
|
$
7,383
|
$
466,697
|
|
Carrying amount at December 31, 2019
|
$
4,451
|
$
32,976
|
$
104,964
|
$
17,093
|
$
159,484
|
|
Cost
|
|
|
|
|
|
|
Balance,
December 31, 2019
|
$
103,254
|
$
278,845
|
$
219,606
|
$
24,476
|
$
626,181
|
|
Additions
|
-
|
-
|
111,592
|
-
|
111,592
|
|
Disposals
|
(1,326
)
|
-
|
(76,803
)
|
-
|
(78,129
)
|
|
Balance,
December 31, 2020
|
$
101,928
|
$
278,845
|
$
254,395
|
$
24,476
|
$
659,644
|
|
Accumulated depreciation
|
|
|
|
|
|
|
Balance,
December 31, 2019
|
$
98,803
|
$
245,869
|
$
114,642
|
$
7,383
|
$
466,697
|
|
Disposals
|
-
|
-
|
(12,431
)
|
-
|
(12,431
)
|
|
Depreciation
for year
|
2,003
|
6,243
|
40,161
|
3,171
|
51,578
|
|
Balance,
December 31, 2020
|
$
100,806
|
$
252,112
|
$
142,372
|
$
10,554
|
$
505,844
|
|
Carrying amount at December 31, 2020
|
$
1,122
|
$
26,733
|
$
112,023
|
$
13,922
|
$
153,800
|
24
SILVER ELEPHANT MINING CORP.
Notes
to Annual Consolidated Financial Statements
For the
years ended December 31, 2020, 2019 and 2018
(Expressed in
Canadian Dollars)
14. MINERAL PROPERTIES
|
|
Pulacayo
|
Gibellini
|
Sunawayo
|
Triunfo
|
Chandgana
Tal
|
Khavtgai
Uul
|
Total
|
|
Balance, December 31, 2017
|
$
12,809,550
|
$
490,356
|
$
-
|
$
-
|
$
-
|
$
-
|
$
13,299,906
|
|
Additions:
|
|
|
|
|
|
|
|
|
Acquisition
cost
|
$
-
|
$
425,605
|
$
-
|
$
-
|
$
-
|
$
-
|
$
425,605
|
|
Deferred
exploration costs:
|
|
|
|
|
|
|
|
|
Licenses,
tax, and permits
|
-
|
387,149
|
-
|
-
|
1,271
|
261,168
|
649,588
|
|
Geological
and consulting
|
51,112
|
1,509,587
|
-
|
-
|
-
|
-
|
1,560,699
|
|
Personnel,
camp and general
|
847,538
|
831,023
|
-
|
-
|
20,590
|
3,741
|
1,702,892
|
|
|
898,650
|
2,727,759
|
-
|
-
|
21,861
|
264,909
|
3,913,179
|
|
Impairment
|
(13,708,200
)
|
-
|
-
|
-
|
(21,861
)
|
(264,909
)
|
(13,994,970
)
|
|
Balance, December 31, 2018
|
$
-
|
$
3,643,720
|
$
-
|
$
-
|
$
-
|
$
-
|
$
3,643,720
|
|
Additions:
|
|
|
|
|
|
|
|
|
Acquisition
cost
|
$
-
|
$
-
|
$
-
|
$
-
|
$
-
|
$
-
|
$
-
|
|
Deferred
exploration costs:
|
|
|
|
|
|
|
|
|
Licenses,
tax, and permits
|
6,239
|
286,158
|
-
|
-
|
-
|
-
|
292,397
|
|
Geological
and consulting
|
964,716
|
3,200,773
|
-
|
-
|
-
|
-
|
4,165,489
|
|
Personnel,
camp and general
|
503,071
|
1,470,007
|
-
|
-
|
-
|
-
|
1,973,078
|
|
|
1,474,026
|
4,956,939
|
-
|
-
|
-
|
-
|
6,430,965
|
|
Impairment
Recovery
|
13,708,200
|
-
|
-
|
-
|
-
|
-
|
13,708,200
|
|
Balance, December 31, 2019
|
$
15,182,226
|
$
8,600,658
|
$
-
|
$
-
|
$
-
|
$
-
|
$
23,782,885
|
|
Additions:
|
|
|
|
|
|
|
|
|
Acquisition
cost
|
$
-
|
$
2,253,566
|
$
396,936
|
$
135,676
|
$
-
|
$
-
|
$
2,786,178
|
|
Deferred
exploration costs:
|
|
|
|
|
|
|
|
|
Licenses,
tax, and permits
|
5,733
|
348,165
|
-
|
-
|
-
|
-
|
353,898
|
|
Geological
and consulting
|
1,767,089
|
897,085
|
116,152
|
327,989
|
-
|
-
|
3,108,315
|
|
Personnel,
camp and general
|
584,712
|
1,190,607
|
-
|
-
|
-
|
-
|
1,775,319
|
|
|
2,357,534
|
2,435,857
|
116,152
|
327,989
|
-
|
-
|
5,237,531
|
|
Balance, December 31, 2020
|
$
17,539,760
|
$
13,290,081
|
$
513,088
|
$
463,665
|
$
-
|
$
-
|
$
31,806,594
|
25
SILVER ELEPHANT MINING CORP.
Notes
to Annual Consolidated Financial Statements
For the
years ended December 31, 2020, 2019 and 2018
(Expressed in
Canadian Dollars)
14.
MINERAL PROPERTIES
(cont’d...)
Gibellini Project, Nevada, United States
Gibellini Project
The Gibellini Project consists of a total of 555 unpatented lode
mining claims that includes: the Gibellini group of 40
claims
,
the VC Exploration group of
105 claims, the Bisoni group of 201 claims and the Company group of
209 claims. All the claims are
located in Eureka County, Nevada,
USA.
Gibellini Group
The
Gibellini group of claims were acquired on June 22, 2017, through
leasehold assignments from the claimant and then-holder of the
Gibellini mineral claims (the “
Gibellini Lessor
”). Under the
Gibellini mineral lease agreement (the “
Gibellini MLA
”), the Company
leased this core group of claims, which originally constituted the
entire Gibellini Project, by, among other things, agreeing to pay
to the Gibellini Lessor annual advance royalty payments. These
payments are tied, based on an agreed formula not to exceed
US$120,000 per year, to the average vanadium pentoxide price of the
prior year (each an "
Advance
Royalty Payment
"). Upon commencement of production, the
obligation to make Advance Royalty Payments will cease and the
Company will instead maintain its acquisition through lease of the
Gibellini group of claims by paying to the Gibellini Lessor, a 2.5%
net smelter return royalty (the “
Gibellini
NSR Payments
”) until a total of
US$3 million is paid. Thereafter, the Gibellini NSR will be reduced
to 2% over the remaining life of the mine (and referred to
thereafter, as “
Production
Royalty Payments
”). Upon commencement of production,
any Advance Royalty Payments that have been made will be deducted
as credits against the Gibellini NSR Payments or Production Royalty
Payments, as applicable. The lease is for a term of 10 years,
expiring on June 22, 2027, which can be extended for an additional
10 years, at the Company’s option.
On April 19, 2018, the Gibellini MLA was amended to grant the
Company the option, at any time during the term of the Gibellini
MLA, which ends on June 22, 2027, to require the Gibellini Lessor
to transfer their title over all of the leased mining claims
(excluding four claims which will be retained by the Gibellini
Lessor) (the "
Transferred
Claims
") to the
Company in exchange for US$1,000,000, which will be deemed an
Advance Royalty Payment
(the
“
Transfer
Payment
”). A credit of
US$99,027 in favour of the Company towards the Transfer Payment was
paid upon the execution of the amendment, with a remaining balance
of US$900,973 on the Transfer Payment due and payable by the
Company to the Gibellini Lessor upon completion of transfer of the
Transferred Claims from the Gibellini Lessor to the Company. The
Advance Royalty Payment obligation and Production Royalty Payments
will not be affected, reduced or relieved by the transfer of
title.
On June
22, 2020, the Company paid US$50,000 (2019 – US$120,000, 2018
– US$101,943) of the Advance Royalty Payment to the Gibellini
Lessor.
During year 2020, the Company
expanded the land position at
the Gibellini Project, by staking a total of 32 new claims
immediately adjacent to the Gibellini Project.
The Bisoni Group
On September 18, 2020, the Company
completed the acquisition of the Bisoni
vanadium property situated immediately southwest of the Gibellini
Project pursuant to an asset purchase agreement
(the “
Bisoni
APA
”) dated
August 18, 2020, with Cellcube Energy Storage Systems Inc.
(“
Cellcube
”).
The Bisoni
property comprised of 201 lode mining claims.
As consideration for the acquisition of
the Bisoni property under the Bisoni APA, the Company issued
4 million Common Shares (the “
Bisoni APA Shares
”) and paid
$200,000 cash to Cellcube. Additionally, subject to TSX approval,
if, on or before December 31, 2023, the price of European vanadium
pentoxide on the Metal Bulletin (or an equivalent publication)
exceeds US$12 a pound for 30 consecutive days, the Company will
issue to Cellcube additional Common Shares with a value of $500,000
calculated based upon the 5-day volume weighted average price of
the Common Shares immediately following the satisfaction of the
vanadium pentoxide pricing condition.
26
SILVER ELEPHANT MINING CORP.
Notes
to Annual Consolidated Financial Statements
For the
years ended December 31, 2020, 2019 and 2018
(Expressed in
Canadian Dollars)
14.
MINERAL PROPERTIES
(cont’d...)
Gibellini Project, Nevada, United States
(cont’d…)
VC Exploration Group
The Company entered into a lease agreement to acquire 10 unpatented
lode claims totaling approximately 207 gross acres (the
“
Former
Louie
Hill
Claims
”)
from their holders (
the “
Former
Louie Hill Lessors
”) on July 10,
2017 (the “
Louie
Hill
MLA
”).
The
Former Louie Hill Claims were
located
approximately 1600
feet south of the Gibellini group of claims. The Former Louie Hill
Claims were subsequently abandoned by the Former Louie Hill
Lessors, and on March 11 and 12, 2018, the Company staked the area
within and under 17 new claims totaling approximately 340 gross
acres,
which now
collectively comprise the expanded Louie Hill group of claims (the
“
Current
Louie
Hill
Claims
”)
.
On October 22, 2018, the Company entered into a royalty agreement
(the “
Royalty
Agreement
”)
with the Former Louie Hill Lessors that replaced, on substantially
similar terms, the Louie Hill MLA. The Royalty Agreement
provides for the Company to pay the following royalties to the
Former Louie Hill
Lessors
as an advance royalty: (i)
US$75,000 upon the Company achieving Commercial Production (as
defined in the Royalty Agreement) at the Gibellini Project; (ii)
US$50,000 upon the Company selling, conveying, transferring or
assigning all or any portion of certain claims defined in the
Royalty Agreement to any third party and (iii) annually upon the
anniversary date of July 10, 2018
,
and the anniversary date of
each year thereafter during the term of the Royalty Agreement: (a)
if the average vanadium pentoxide price per pound as quoted on
www.metalbulletin.com
(the “
Metal Bulletin
”) or another
reliable and reputable industry source as agreed by the parties,
remains below US$7.00/lb during the preceding 12 months, US$12,500;
or (b) if the average vanadium pentoxide price per pound as quoted
on Metal Bulletin or another reliable and reputable industry source
as agreed by the parties, remains equal to or above US$7.00/lb
during the preceding 12 months, US$2,000 x average vanadium
pentoxide price per pound up to a maximum annual advance royalty
payment of US$28,000.
Further, the Company will pay to the
Former Louie Hill
Lessors
a
2.5% net smelter return royalty (the “
Louie
Hill
NSR
”) payable on vanadium
pentoxide produced from the area of the Former Louie Hill Claims
contained within the Current Louie Hill Claims
.
The Company may purchase
three-fifths of the Louie Hill NSR at any time for US$1,000,000,
leaving the total Louie Hill NSR payable by the Company at 1.0% for
the remaining life of the mine. Any Louie Hill Advance Royalty
Payments that have been made at the time of Commercial Production
will be deducted as credits against future payments under the Louie
Hill NSR. The payments under the Royalty Agreement will continue
for an indefinite period and
will be payable as long as the
Company, its subsidiaries, or any of their permitted successors or
assigns holds a valid and enforceable mining concession over the
area
.
On July
7, 2020, the Company paid US$12,500 (2019 – US$28,000, 2018 -
US$21,491), comprising the Louie Hill Advance Royalty Payment to
the Former Louie Hill Lessors
.
On
February 15, 2018, the
Company acquired
an additional 105 unpatented lode mining claims
located adjacent to its existing Gibellini Project
in Nevada, USA through the
acquisition of VC Exploration (US) Inc, ("
VC
Exploration
") by
paying
a total of $335,661
in cash and issuing 500,000 Common
Share purchase warrants (
valued at $89,944)
to arm’s-length, private
parties.
Each warrant entitles the holder upon exercise, to
acquire one Common Share at a price of $0.50 per Common Share until
February 15, 2021. The acquisition of the VC Exploration has been
accounted for as an asset acquisition as their activities at the
time of the acquisition consisted of mineral claims
only.
The Company Group
During 2017 and 2018, the Company expanded the land position at the
Gibellini Project, by staking a total of 209 new claims immediately
adjacent to the Gibellini Project covering 4091 acres.
27
SILVER ELEPHANT MINING CORP.
Notes
to Annual Consolidated Financial Statements
For the
years ended December 31, 2020, 2019 and 2018
(Expressed in
Canadian Dollars)
14.
MINERAL PROPERTIES
(cont’d...)
Pulacayo Project, Bolivia
The
Company holds an interest in the Pulacayo Paca silver-lead-zinc
project in Bolivia (the "
Pulacayo
Project
").
The
Pulacayo Project mining rights are recognized by two legally
independent contractual arrangements, one covering all, except the
Apuradita deposit, from a mining production contract (the
"
Pulacayo MPC
") between the
Company and the Corporación Minera de Bolivia ("
COMIBOL
"), a Bolivian state mining
company, and the original holder of the rights, executed on October
3, 2019. The Pulacayo MPC grants the Company the 100% exclusive
right to develop and mine at the Pulacayo and Paca concessions for
up to 30 years against certain royalty payments. In connection with
the Apuradita deposit, its rights are covered by a second
contractual arrangement, with the Bolivian Jurisdictional Mining
Authority, acting for the Government of Bolivia, which is in
process of formalization, as a mean of recognition of the acquired
rights to what was originally the mining concession. Until such
time as the contract is formalized, all mining rights, as
recognized in the Bolivian Mining Law 535, can be exercised by the
holder of the ex-concession.
Pursuant
to the Pulacayo MPC,
ASC
Bolivia LDC Sucursal Bolivia (“
ASC
”),
a subsidiary of the Company, ha
s committed to pay monthly
rent of US$1,000 to COMIBOL and US$1,500 monthly rent to the
Pulacayo Ltda. Mining Cooperative until the Pulacayo Project starts
commercial production.
During
the year ended December 31, 2018, the Company determined there were
several indicators of potential impairment of the carrying value of
the Pulacayo Paca property. The indicators of potential impairment
were as follows:
●
change in the
Company’s primary focus to the Gibellini
Project;
●
management’s
decision to suspend further exploration activities;
and
●
no positive
decision from the Bolivian Government to grant mining production
contract to develop the project.
As
result, in accordance with
IFRS 6,
Exploration for and Evaluation of Mineral
Resources
and
IAS 36, Impairment of Assets
, at
December 31, 2018, the Company assessed the recoverable amount of
the Pulacayo Paca property exploration costs and determined that
its value in use is $nil. As at December 31, 2018, the recoverable
amount of $nil resulted in an impairment charge of $13,708,200
against the value of the deferred exploration costs, which was
reflected on the consolidated statement of operations.
During
the year ended December 31, 2019, the Company assessed whether
there was any indication that the previously recognized impairment
loss in connection with the Pulacayo Paca property
may no longer exist or may have decreased. The
Company noted the following indications that the impairment may no
longer exist:
●
the Company signed
a mining production contract granting the Company the 100%
exclusive right to develop and mine at the Pulacayo Paca
property;
●
the
Company renewed its exploration focus to develop the Pulacayo Paca
property in the current year;
●
the Company re-initiated active exploration and
drilling program on the property
;
●
the Company
completed a positive final settlement of Bolivian tax dispute (Note
26).
As the
Company identified indications that the impairment may no longer
exist, the Company completed an assessment to determine the
recoverable amount of the Pulacayo Paca property. In order to
estimate the fair-value of the property the Company engaged a
third-party valuation consultant and also utilized level 3 inputs
on the fair value hierarchy to estimate the recoverable amount
based on the property’s fair value less costs of disposal
determined with reference to dollars per unit of metal in-situ.
With reference to metal in-situ, the Company applied US$0.79 per
ounce of silver resource to its 36.8 million ounces of silver
resources and US$0.0136 per pound of zinc or lead in resource to
its 303 million pounds of zinc and lead.
The
Company also considered data derived from properties similar to the
Pulacayo Paca Property. The data consisted of property transactions
and market valuations of companies holding comparable properties,
adjusted to reflect the possible impact of factors such as
location, political jurisdiction, commodity, geology,
mineralization, stage of exploration, resources, infrastructure and
property size.
28
SILVER ELEPHANT MINING CORP.
Notes
to Annual Consolidated Financial Statements
For the
years ended December 31, 2020, 2019 and 2018
(Expressed in
Canadian Dollars)
14.
MINERAL PROPERTIES
(cont’d...)
Pulacayo Project, Bolivia
(cont’d...)
As the
recoverable amount estimated with respect to the above was $31.4
million an impairment recovery of $13,708,200 was recorded during
the year ended December 31, 2019.
Triunfo Project, Bolivia
On July
13, 2020, the Company announced that it had entered into an
agreement (the “
Triunfo
Agreement
”) with a private party (the
“Triunfo Vendor”
) for the
right to conduct mining exploration activities (the
“
Exploration
Right
”) within the El
Triunfo gold-silver-lead-zinc project in La Paz District, Bolivia
(the “
Triunfo
Project
”) and the right, at the Company’s
election, to purchase the Triunfo Project for US$1,000,000 (the
“
Purchase
Right
”) and together with the
Exploration Right, the “
Triunfo
Rights
”). The Purchase Right
can be exercised at any time after the Triunfo Vendor completes the
required Bolivian administrative procedures for the Triunfo Project
until July 13, 2025 or such further period as the parties may
agree. To secure the Triunfo Rights, the Company paid the
Triunfo Vendor US$100,000 upon execution of the Triunfo
Agreement. Until the Company exercises its Purchase Right,
beginning in 2021 the Company must pay the Triunfo Vendor US$50,000
on June 15 of each year to maintain the Triunfo Rights. The
Company may elect to terminate the Triunfo Agreement at any
time. If the Company exercises the Purchase Right, the
Triunfo Vendor will maintain up to a 5% interest of the profits,
net of taxes and royalties, derived from the sale of concentrate
produced from the Triunfo Project (the “
Residual
Interest
”).
If the Company exercises the Purchase Right, the
Company may reduce some or all of the Residual Interest at any time
by making a lump sum
payment to the Triunfo Vendor at any
time to reduce some or all of the Residual Interest as
follows:
●
the Residual
Interest may be extinguished for US$300,000;
●
the Residual
Interest may be reduced to 4% for US$250,000;
●
the Residual
Interest may be reduced to 3% for US$200,000;
●
the Residual
Interest may be reduced to 2% for US$150,000; or
●
the Residual
Interest may be reduced to 1% for US$100,000.
Sunawayo Project, Bolivia
On September 7, 2020, the Company announced that it had entered
into a binding sales and purchase agreement (the
“
Sunawayo
SPA
”)
with a private party (the “
Sunawayo
Vendor
”) to
acquire the Sunawayo silver-lead mining project (the
“
Sunawayo
Project
”)
.
Subject
to the provisions of the Sunawayo SPA, the Sunawayo Vendor agreed
to irrevocably transfer the mining rights of the Sunawayo Project
to the Company for consideration of US$6,500,000, which payment
consists of US$300,000 paid on execution of the Sunawayo SPA, with
the remaining US$6,200,000 to be paid in cash over a one-year
period in twelve equal monthly installments, starting March 1,
2021
.
Previously Impaired Properties
Chandgana Properties, Mongolia
In
March 2006, the Company acquired a 100% interest in the Chandgana
Tal property, a coal exploration property consisting of two
exploration licenses located in the northeast part of the Nyalga
coal basin, approximately 290 kilometers east of Ulaanbaatar,
Mongolia
.
In
March 2011, the Company obtained a mine permit from Ministry of
Mineral Resources and Energy for the Chandgana Tal coal
project.
In
2007, the Company acquired a 100% interest in the Chandgana
Khavtgai property, a coal exploration property consisting of one
license located in the northeast part of the Nyalga coal
basin
.
During
the year ended December 31, 2017, the Company determined there were
several indicators of potential impairment of the carrying value of
the Chandgana Tal and Khavtgai Uul properties. As result, in
accordance with
IFRS 6,
Exploration for and Evaluation of Mineral
Resources
and
IAS 36, Impairment of Assets
, at
December 31, 2017, the Company assessed the recoverable amount of
the Chandgana Properties deferred exploration costs and determined
that its value in use is $nil. As at December 31, 2017, the
recoverable amount of $nil resulted in an
29
SILVER ELEPHANT MINING CORP.
Notes
to Annual Consolidated Financial Statements
For the
years ended December 31, 2020, 2019 and 2018
(Expressed in
Canadian Dollars)
14.
MINERAL PROPERTIES
(cont’d...)
Previously Impaired Properties
(cont’d...)
Chandgana Properties, Mongolia
(cont’d...)
impairment
charge of $14,733,067 against the value of the deferred exploration
costs, which was reflected on the consolidated statement of
operations. As at and for the year ended December 31, 2020 and as
for years ended December 31, 2019 and 2018, there were no changes
to the impairment assessment and accordingly all costs remain
impaired.
Titan Property, Ontario, Canada
The
Company has a 100% interest in the Titan property, a
vanadium-titanium-iron project located in Ontario, Canada. In
January 2010, the Company entered into an option agreement (the
"
Titan Agreement
") with
Randsburg International Gold Corp. (“
Randsburg
”) whereby the Company
had the right to acquire an 80% interest in the Titan property by
paying Randsburg an aggregate of $500,000 (paid), and by incurring
exploration expenditures of $200,000 by December 31, 2010. Pursuant
to the Titan Agreement, Randsburg has the option to sell the
remaining 20% interest in the Titan property to the Company for
$150,000 cash or 400,000 Common Shares.
At
December 31, 2014, due to market conditions, the Company impaired
the value of the property to $nil. On February 10, 2017, the
Company negotiated with Randsburg to acquire the remaining 20%
title interest of Randsburg in the Titan project
by issuing to Randsburg 20,000 Common
Shares at a value of $4.81 per Common Share.
Therefore, the Company recorded an impairment loss of $96,200 on
the acquisition of the remaining title interest in the Titan
property which was reflected on the consolidated statement of
operations and comprehensive loss during the year ended December
31, 2017. As there were no benchmark or market changes from January
1, 2015
,
to December 31, 2020, the
impaired value of $nil for Titan property remains
unchanged.
15.
ACCOUNTS
PAYABLE AND ACCRUED LIABILITIES
Accounts
payable and accrued liabilities of the Company consist of amounts
outstanding for trade and other purchases relating to development
and exploration, along with administrative activities. The usual
credit period taken for trade purchases is between 30 to 90
days.
|
|
Year
Ended December 31,
|
||
|
|
2020
|
2019
|
2018
|
|
Trade
accounts payable
|
$
1,717,977
|
$
2,420,392
|
$
1,636,786
|
|
Accrued
liabilities
|
41,186
|
-
|
-
|
|
|
$
1,759,163
|
$
2,420,392
|
$
1,636,786
|
30
SILVER ELEPHANT MINING CORP.
Notes
to Annual Consolidated Financial Statements
For the
years ended December 31, 2020, 2019 and 2018
(Expressed in
Canadian Dollars)
16.
LEASE
LIABILITY
As at
December 31, 2020, the Company recorded $20,533 of lease liability.
The incremental borrowing rate for lease liability initially
recognized as of January 1, 2019 was 10%.
|
Lease
liability
|
|
|
Initial
recognition, January 1, 2019
|
$
81,617
|
|
Cash
flows:
|
|
|
Lease
payments for year
|
(36,528
)
|
|
Non-cash
changes:
|
|
|
Accretion
expenses for year
|
7,729
|
|
Balance
at December 31, 2019
|
$
52,818
|
|
|
|
|
Cash
flows:
|
|
|
Lease
payments for year
|
(37,162
)
|
|
Non-cash
changes:
|
|
|
Accretion
expenses for year
|
4,877
|
|
Balance
at December 31, 2020
|
20,533
|
The
Company does not face a significant liquidity risk with regard to
its lease liability. Lease liability is monitored within the
Company treasury function. The lease liability matures in
2021.
There
were no significant payments made for short-term or low value
leases in the year ended December 31, 2020 (2019 -
$nil).
17.
PROVISION
FOR CLOSURE AND RECLAMATION
The Company’s closure and reclamation costs consists of costs
accrued based on the current best estimate of mine closure and
reclamation activities that will be required at the Ulaan Ovoo site
upon completion of mining activity. These activities include costs
for earthworks, including land re-contouring and re-vegetation,
water treatment and demolition. The Company’s provision for
future site closure and reclamation costs is based on the level of
known disturbance at the reporting date, known legal requirements
and estimates prepared by a third-party specialist.
It is not currently possible to estimate the impact on operating
results, if any, of future legislative or regulatory
developments.
Management used a risk-free interest rate of 1.14% (2019 –
1.72%, 2018 – 1.98%) and a risk premium of 8.66% (2019
– 7%, 2018– 7%) in preparing the Company’s
provision for closure and reclamation. Although the ultimate amount
of reclamation costs to be incurred cannot be predicted with
certainty, the total undiscounted amount of estimated cash flows
required to settle the Company’s estimated obligations is
$4,951,000 over the next 21 years. The cash expenditures are
expected to occur over a period of time extending several years
after the projected mine closure of the mineral
properties.
|
|
December 31,
2020
|
December 31,
2019
|
December 31,
2018
|
|
Balance, beginning
of year
|
$
266,790
|
$
265,239
|
$
244,323
|
|
Change in
estimate
|
405,196
|
-
|
-
|
|
Accretion
|
23,271
|
1,551
|
20,916
|
|
Balance, end of
year
|
$
695,257
|
$
266,790
|
$
265,239
|
31
SILVER ELEPHANT MINING CORP.
Notes
to Annual Consolidated Financial Statements
For the
years ended December 31, 2020, 2019 and 2018
(Expressed in
Canadian Dollars)
18.
TAX PROVISION
The Company’s operations are, in part, subject to foreign tax
laws where interpretations, regulations and legislation are complex
and continually changing. As a result, there are usually some tax
matters in question that may, upon resolution in the future, result
in adjustments to the amount of deferred income tax assets and
liabilities, and those adjustments may be material to the
Company’s financial position and results of
operations.
A reconciliation of income taxes at statutory rates with the
reported taxes is as follows:
|
|
2020
|
2019
|
2018
|
|
|
|
|
|
|
Income (loss) for
the year
|
$
(4,626,887
)
|
$
17,513,854
|
$
(18,184,469
)
|
|
|
|
|
|
|
Expected income tax
(recovery)
|
$
(1,249,000
)
|
$
4,729,000
|
$
(4,910,000
)
|
|
Change in
statutory, foreign tax, foreign exchange rates and
other
|
117,000
|
(529,000
)
|
389,000
|
|
Permanent
differences
|
269,000
|
(4,861,000
)
|
3,833,000
|
|
Share issue
cost
|
(250,000
)
|
(103,000
)
|
(151,000
)
|
|
Adjustment to prior
years provision versus statutory tax returns and expiry of
non-capital losses
|
404,000
|
1,205,000
|
12,000
|
|
Change in
unrecognized deductible temporary differences
|
709,000
|
(441,000
)
|
827,000
|
|
Total
income tax expense (recovery)
|
$
-
|
$
-
|
$
-
|
In September 2017, the British Columbia (BC) Government proposed
changes to the general corporate income tax rate to increase the
rate from 11% to 12% effective January 1, 2018 and onwards. This
change in tax rate was substantively enacted on October 26, 2017.
The relevant deferred tax balances have been remeasured to
reflect the increase in the Company's combined Federal and
Provincial (BC) general corporate income tax rate from 26% to
27%.
The significant components of the Company’s temporary
differences, unused tax credits and unused tax losses that have not
been included on the consolidated statement of financial position
are as follows:
|
|
2020
|
Expiry
Date Range
|
2019
|
Expiry
Date Range
|
2018
|
Expiry
Date Range
|
|
Temporary
Differences
|
|
|
|
|
|
|
|
Exploration and
evaluation assets
|
$
6,284,000
|
No expiry
date
|
$
6,135,000
|
No expiry
date
|
$
19,625,000
|
No expiry
date
|
|
Investment tax
credit
|
23,000
|
2029
|
23,000
|
2029
|
23,000
|
2029
|
|
Property
and equipment
|
1,547,000
|
No expiry
date
|
1,242,000
|
No expiry
date
|
1,138,000
|
No expiry
date
|
|
Share issue
costs
|
1,212,000
|
2041 to
2044
|
747,000
|
2040 to
2043
|
644,000
|
2039 to
2042
|
|
Asset retirement
obligation
|
695,000
|
No expiry
date
|
267,000
|
No expiry
date
|
265,000
|
No expiry
date
|
|
Allowable capital
losses
|
4,150,000
|
No expiry
date
|
5,864,000
|
No expiry
date
|
6,607,000
|
No expiry
date
|
|
Non-capital
losses available for future periods
|
30,569,000
|
2023 to
2040
|
27,024,000
|
2023 to
2039
|
24,109,000
|
2030 to
2038
|
|
Canada
|
30,015,000
|
2029 to
2040
|
26,980,000
|
2029 to
2039
|
21,402,000
|
2029 to
2038
|
|
Mongolia
|
554,000
|
2023 to
2028
|
44,000
|
2023 to
2027
|
-
|
2023 to
2026
|
32
SILVER ELEPHANT MINING CORP.
Notes
to Annual Consolidated Financial Statements
For the
years ended December 31, 2020, 2019 and 2018
(Expressed in
Canadian Dollars)
19.
SHARE
CAPITAL
(a)
Authorized
The
authorized share capital of the Company consists of an unlimited
number of Common Shares. At December 31, 2020, the Company had
180,518,828 (December 31, 2019 – 121,299,508; December 31,
2018 – 95,316,127) Common Shares issued and
outstanding.
On
August 8, 2018, the Company
completed a common share split on the basis of ten (10) new Common
Shares, options and warrants for every one (1) old Share, option
and warrant outstanding (the “
Split
”).
All information with
respect to the number of Common Shares and issuance prices for the
time periods prior to the Split was restated to reflect the Common
Share Consolidation and the Split.
(b)
Equity
issuances
During the year ended December 31, 2020
On May
1, 2020 and on May 20, 2020, the Company closed two tranches of a
non-brokered private placement (the "
May 2020
Private Placement
") for aggregate gross
proceeds of $1,930,500 and share compensation for services of
$45,500 through the issuance of 15,200,000 units of the Company
(each, a "
Unit
") at a price
of $0.13 per Unit.
Each
Unit is comprised of one Common Share and one Common Share purchase
warrant (each, a “
Warrant
”).
Each Warrant entitles the holder to purchase one Common Share at an
exercise price of $0.16 for a period of three years from the date
of issuance. The Company paid $3,250 in cash and issued 156,900
Units as finder’s fees in connection with the May 2020
Private Placement.
The Units issued as a finder's fee have
been valued at $24,000
based
on the offering price of the Units under the May 2020 Private
Placement. The Company has recorded the fair value of the
finder’s units as share issuance costs.
The
Company issued 1,601,000 Common Shares with a value of $640,400 as
a bonus payment to certain directors, officers, employees, and
consultants of the Company.
On
September 18, 2020, the Company issued 4,000,000 Common Shares at a
value of $0.50 per Common Share in relation with purchase of Bisoni
Project in Nevada, USA.
On
November 24, 2020, the Company closed its bought deal short form
prospectus offering pursuant to which the Company has issued
23,000,000 Common Shares at a price of $0.40 per Common Share for
aggregate gross proceeds of $9,200,000 (
the
“Offering”
).
Pursuant to the terms and conditions of the Underwriting Agreement,
the Company paid a cash commission to the Underwriters of $534,000,
additional fees of $391,544 and issued
1,335,000 Share purchase warrants as a
finder’s fee in relation with the Offering.
The fair
value of $226,917 of the issued warrants determined using the
Black-Scholes option pricing model using the following assumptions:
(1) a risk-free interest
rate of 0.2%; (2) warrant expected life of one year; (3) expected
volatility of 107%, and (4) dividend yield of
nil.
The
Company has recorded the fair value of the finder’s units as
share issuance costs.
During
the year ended December 31, 2020, the Company issued 1,233,750
Common Shares on the exercise of stock options for total proceeds
of $299,812.
During
the year ended December 31, 2020, the Company issued 14,027,670
Common Shares on the exercise of warrants for aggregate gross
proceeds of $3,072,194 and share compensation for services of
$35,000.
During the year ended December 31, 2019
On September 6, 2019, the Company closed its non-brokered private
placement for $2,600,000 through the issuance of 13,000,000 Common
Shares at a price of $0.20 per Common Share. The Company paid
$15,209 and issued 525,000 Common Shares as a finder’s fee
valued at $105,000.
$175,000 of the private placement was
for prepaid consulting fees for the Company’s executive
chairman, of which $35,000 is included in prepaid expenses as at
December 31, 2019 and $41,503 for services. Included in accounts
receivable as at December 31, 2019 is $30,497 of subscriptions
receivable.
33
SILVER ELEPHANT MINING CORP.
Notes
to Annual Consolidated Financial Statements
For the
years ended December 31, 2020, 2019 and 2018
(Expressed in
Canadian Dollars)
19. SHARE CAPITAL
(cont’d…)
(b)
Equity issuances
(cont’d…)
During the year ended December 31, 2019
(cont’d…)
On October 18, 2019, the Company closed
its non-brokered
private placement for gross proceeds of $3,900,000 through the
issuance of 9,750,000 Common Shares at a price of $0.40 per Share.
Also, the Company issued 654,500 Common Shares as a finder’s
fee valued at $261,800.
On
October 9, 2019, the Company issued 104,951 Common Shares with a
value of $43,030, to its directors to settle director fees debts
owing to them.
The
Company issued 622,500 and 651,430 Common Shares on the exercise of
stock options and warrants respectively for total proceeds of
$424,822
.
The
Company
issued 500,000 sign-on bonus
Common
Shares with a fair
value of $0.23 per Share to an officer valued at
$115,000.
On
September 26, 2019, the Company issued 175,000 Common Shares valued
at $59,500 for consulting services.
During the year ended December 31, 2018
On August 14, 2018, the Company closed its non-brokered private
placement for gross proceeds of $1,137,197 through the issuance of
4,061,417 units of the Company. Each unit is comprised of
one
Common
Share and one
Common
Share purchase warrant. Each
warrant entitles the holder to purchase one additional
Common
Share of the Company at an
exercise price of $0.40 for a period of three years from the
closing of the first tranche of the placement.
On November 22, 2018, the Company closed its bought deal financing
for gross proceeds of $5,520,000. The Company entered into an
agreement with BMO Nesbitt Burns Inc. (“
BMO
”), under which BMO agreed to buy on a
bought deal basis 12,000,000
Common
Shares, at a price of $0.46 per Common Share. The
shares were offered by way of a short form prospectus in each of
the provinces and territories of Canada, except Québec. The
Company incurred $560,576 in cash share issuance
costs.
The
Company issued 87,500 and 3,445,420 Shares on the exercise of stock
options and warrants respectively for total proceeds of
$1,362,317
.
On
October 10, 2018,
the
Company issued 1,000,
000
Common
Shares with a fair value of
$0.35 per Share as a bonus to its new CEO included in Salaries and
benefits.
(c)
Share-based
compensation plan
The
Company has a 20% fixed equity-based compensation plan in place, as
approved by the Company’s shareholders on June 2, 2016 (the
“
2016 Plan
”),
amended on June 13, 2017 and subsequently amended at the
Company’s annual general meeting of shareholders held on
September 12, 2019 (the “
Amended 2016 Plan
”). Under the
Amended 2016 Plan the Company may grant stock options, bonus shares
or stock appreciation rights to acquire the equivalent of a maximum
of 14,372,419 of the Company’s Common Shares. All stock
options and other share-based awards granted by the Company, or to
be granted by the Company, since the implementation of the Amended
2016 Plan will be issued under, and governed by, the terms and
conditions of the Amended 2016 Plan. The stock option vesting
terms are determined by the Board of Directors on the date of grant
with a maximum term of 10 years.
During the year ended December 31, 2020, the Company granted
3,820,000 incentive stock options to its directors, officers,
employees and consultants.
The options are exercisable at an
exercise prices ranging from $0.22 to $0.50 per Common Share and
expiry dates ranging from January 6, 2025 to August 17, 2025 and
vest at 12.5% per quarter for the first two years following the
date of grant.
34
SILVER ELEPHANT MINING CORP.
Notes
to Annual Consolidated Financial Statements
For the
years ended December 31, 2020, 2019 and 2018
(Expressed in
Canadian Dollars)
19.
SHARE CAPITAL
(cont’d…)
(c)
Share-based
compensation plan (cont’d…)
During the year ended December 31, 2019, the Company granted
3,965,000 incentive stock options to its directors, officers,
employees and consultants.
The options are exercisable at an
exercise prices ranging from $0.20 to $0.44 per Common Share and
expiry dates ranging from April 1, 2024 to November 15, 2024 and
vest at 12.5% per quarter for the first two years following the
date of grant.
During the year ended December 31, 2018, the Company granted
4,040,000 incentive stock options to its directors, officers,
employees and consultants.
The options are exercisable at an
exercise prices ranging from $0.22 to $0.65 per Common Share and
expiry dates ranging from February 20, 2023 to November 14, 2023
and vest at 12.5% per quarter for the first two years following the
date of grant.
The
following is a summary of the changes in the Company’s stock
options from December 31, 2017 to December 31, 2020:
|
|
Number
of Options
|
Weighted
Average Exercise Price
|
|
Outstanding,
December 31, 2018
|
9,591,000
|
$
0.34
|
|
Granted
|
3,965,000
|
$
0.31
|
|
Expired
|
(315,000
)
|
$
0.65
|
|
Cancelled
|
(2,247,000
)
|
$
0.32
|
|
Forfeited
|
(794,000
)
|
$
0.54
|
|
Exercised
|
(622,500
)
|
$
0.28
|
|
Outstanding,
December 31, 2019
|
9,577,500
|
$
0.31
|
|
Granted
|
3,820,000
|
$
0.28
|
|
Expired
|
(90,000
)
|
$
0.50
|
|
Cancelled
|
(1,801,250
)
|
$
0.30
|
|
Exercised
|
(1,233,750
)
|
$
0.24
|
|
Outstanding,
December 31, 2020
|
10,272,500
|
$
0.31
|
As of
December 31, 2020, the following the Company stock options were
outstanding:
|
Exercise
|
Expiry
|
Options
Outstanding
|
Exercisable
|
Unvested
|
|
Price
|
Date
|
December
31, 2020
|
||
|
$
0.50
|
August
17, 2025
|
720,000
|
90,000
|
630,000
|
|
$
0.22
|
May
4, 2025
|
2,200,000
|
825,000
|
1,375,000
|
|
$
0.33
|
November
15, 2024
|
100,000
|
62,500
|
37,500
|
|
$
0.50
|
November
1, 2024
|
1,100,000
|
687,500
|
412,500
|
|
$
0.20
|
July
29, 2024
|
1,475,000
|
1,106,250
|
368,750
|
|
$
0.33
|
October
17, 2023
|
620,000
|
620,000
|
-
|
|
$
0.28
|
April
6, 2023
|
612,500
|
612,500
|
-
|
|
$
0.31
|
February
20, 2023
|
200,000
|
200,000
|
-
|
|
$
0.35
|
September
1, 2022
|
880,000
|
880,000
|
-
|
|
$
0.33
|
June
12, 2022
|
805,000
|
805,000
|
-
|
|
$
0.49
|
January
12, 2022
|
620,000
|
620,000
|
-
|
|
$
0.20
|
June
2, 2021
|
940,000
|
940,000
|
-
|
|
|
10,272,500
|
7,448,750
|
2,823,750
|
|
35
SILVER ELEPHANT MINING CORP.
Notes
to Annual Consolidated Financial Statements
For the
years ended December 31, 2020, 2019 and 2018
(Expressed in
Canadian Dollars)
19.
SHARE CAPITAL
(cont’d…)
(c)
Share-based
compensation plan (cont’d…)
Share-based
payment expenses resulting from stock options are amortized over
the corresponding vesting periods. During the years ended December
31, 2020, 2019 and 2018, the share-based payment expenses were
calculated using the following weighted average
assumptions:
|
|
Year
ended December 31,
|
||
|
|
2020
|
2019
|
2018
|
|
Risk-free
interest rate
|
1.46
%
|
1.54
%
|
1.77
%
|
|
Expected
life of options in years
|
4.06
|
4.45
|
4.4
|
|
Expected
volatility
|
132.47
%
|
132.75
%
|
135.71
%
|
|
Expected
dividend yield
|
Nil
|
Nil
|
Nil
|
|
Expected
forfeiture rate
|
12
%
|
|
12
%
|
|
Weighted
average fair value of options granted during the year
|
$
0.30
|
$
0.31
|
$
0.32
|
The
expected volatility used in the Black-Scholes option pricing model
is based on the historical volatility of the Company’s
shares
.
The
expected forfeiture rate is based on the historical forfeitures of
options issued.
Share-based
payments charged to operations and assets were allocated between
deferred mineral properties, and general and administrative
expenses. Share-based payments are allocated between being either
capitalized to deferred exploration costs where related to mineral
properties or expensed as general and administrative expenses where
otherwise related to the general operations of the
Company.
For the
year ended December 31, 2020, 2019, and 2018, share-based payments
were recorded as follows:
|
|
Year
Ended December 31,
|
||
|
|
2020
|
2019
|
2018
|
|
Consolidated
Statement of Operations
|
|
|
|
|
Share
based payments
|
770,617
|
707,802
|
553,430
|
|
|
$
770,617
|
$
707,802
|
$
553,430
|
|
Consolidated
Statement of Financial Position
|
|
|
|
|
Gibellini
exploration
|
124,855
|
79,888
|
87,186
|
|
Pulacayo
exploration
|
86,772
|
39,139
|
117,871
|
|
|
211,627
|
119,027
|
205,057
|
|
Total
share-based payments
|
$
982,244
|
$
826,829
|
$
758,487
|
On July
29, 2019, further to the voluntary forfeiture of share options held
by certain directors, officers, and employees with expiry dates on
April 7, 2020, June 22, 2020, and November 14, 2023, at exercise
prices ranging
from
$0.50 to $0.65, the Company granted 1,275,000 new stock options to
such individuals with an expiry date of July 29, 2024 at an
exercise price of $0.20 per Common Share subject to a two-year
vesting schedule whereby 12.5% vest per quarter following the date
of grant. During the year ended December 31, 2020, the re-issuing
of these options was approved by the TSX and by the shareholders.
There was no increase to the incremental fair value of the share
options as a result of these modifications. The impact of these
modifications was calculated using the following weighted average
assumptions: (
1) a
risk-free interest rate of 1.46%; (2) expected life of five years;
(3) expected volatility of 133.89%, (4) forfeiture rate of 12%, and
(5) dividend yield of nil.
36
SILVER ELEPHANT MINING CORP.
Notes
to Annual Consolidated Financial Statements
For the
years ended December 31, 2020, 2019 and 2018
(Expressed in
Canadian Dollars)
19.
SHARE CAPITAL
(cont’d...)
(d)
Share purchase
warrants
The
following is a summary of the changes in The Company’s share
purchase warrants from December 31, 2017 to
December 31
,
2020:
|
|
Number
of Warrants
|
Weighted
Average Exercise Price
|
|
Outstanding,
December 31, 2018
|
27,318,027
|
$
0.15
|
|
Exercised
|
(651,430
)
|
$
0.38
|
|
Outstanding,
December 31, 2019
|
26,666,597
|
$
0.15
|
|
Issued
|
16,691,900
|
$
0.18
|
|
Expired
|
(2,759,760
)
|
$
0.48
|
|
Exercised
|
(14,027,670
)
|
$
0.21
|
|
Outstanding,
December 31, 2020
|
26,571,067
|
$
0.21
|
On February 15, 2018, the Company issued 500,000 Share purchase
warrants as a part of consideration for mining claims acquisition
(Note 14)
. The fair value of $89,944 of the issued warrants
determined using the Black-Scholes option pricing model using the
following assumptions:
(1) a risk-free interest rate of
1.9%; (2) warrant expected life of three years; (3) expected
volatility of 116%, and (4) dividend yield of
nil.
On April 23
,
2018, the Company issued 500,000 Share
purchase warrants as a part of consideration for services related
to the Gibellini Project.
The fair value of $92,000 of the
issued warrants determined using the Black-Scholes option pricing
model using the following assumptions:
(1) a risk-free interest rate of 2%;
(2) warrant expected life of three years; (3) expected volatility
of 97.4%, and (4) dividend yield of nil.
As of
December 31
,
2020, the following share purchase warrants were
outstanding:
|
Exercise
Price
|
Expiry
Date
|
Number
of warrants at December 31, 2020
|
|
$
0.40
|
November
24, 2021
|
1,335,000
|
|
$
0.16
|
May
20, 2023
|
4,962,000
|
|
$
0.16
|
May
1, 2023
|
4,994,900
|
|
$
0.26
|
June
13, 2022
|
521,590
|
|
$
0.26
|
April
12, 2022
|
1,032,500
|
|
$
0.26
|
January
13, 2022
|
499,990
|
|
$
0.26
|
August
29, 2021
|
1,013,670
|
|
$
0.26
|
August
13, 2021
|
198,237
|
|
$
0.26
|
July
6, 2021
|
3,863,180
|
|
$
0.26
|
June
2, 2021
|
7,500,000
|
|
$
0.26
|
January
25, 2021
|
650,000
|
|
|
26,571,067
|
|
37
SILVER ELEPHANT MINING CORP.
Notes
to Annual Consolidated Financial Statements
For the
years ended December 31, 2020, 2019 and 2018
(Expressed in
Canadian Dollars)
20.
CAPITAL
RISK MANAGEMENT
Management
considers its capital structure to consist of share capital, share
purchase options and warrants. The Company manages its capital
structure and makes adjustments to it, based on the funds available
to, and required by the Company in order to support the
acquisition, exploration and development of mineral properties. The
Board of Directors does not establish quantitative returns on
capital criteria for management. In order to facilitate the
management of its capital requirement, the Company prepares annual
expenditure budgets that are updated as necessary depending on
various factors. The annual and updated budgets are approved by the
Board of Directors.
The
properties, to which the Company currently has an interest in, are
in the exploration stage; as such, the Company is dependent on
external financing to fund its activities. In order to carry out
the planned exploration and development and pay for administrative
costs, the Company will spend its existing working capital and
raise additional amounts as needed. There were no changes in
managements approach to capital management during the year ended
December 31, 2020. Neither the Company nor its subsidiaries are
subject to externally imposed capital requirements.
21.
FAIR
VALUE MEASUREMENTS AND FINANCIAL INSTRUMENTS
Fair Value Measurements
Fair value hierarchy
Fair
value is the price that would be received to sell an asset or paid
to transfer a liability in an orderly transaction between market
participants at the measurement date. The fair value hierarchy
establishes three levels to classify the inputs to valuation
techniques used to measure fair value. The Company utilizes a fair
value hierarchy that prioritizes the inputs to valuation techniques
used to measure fair value as follows:
Level 1
– quoted prices (unadjusted) in active markets for identical
assets or liabilities;
Level 2
– inputs are quoted prices in markets that are not active,
quoted prices for similar assets or liabilities in active markets,
inputs other than quoted prices that are observable for the asset
or liability (for example, interest rate and yield curves
observable at commonly quoted intervals, forward pricing curves
used to value currency and commodity contracts and volatility
measurements used to value option contracts), or inputs that are
derived principally from or corroborated by observable market data
or other means;and
Level 3
– inputs for the asset or liability that are not based on
observable market data (unobservable inputs).
The
fair value hierarchy gives the highest priority to Level 1 inputs
and the lowest priority to Level 3 inputs. The following table sets
forth the Company’s financial assets measured at fair value
by level within the fair value hierarchy
.
|
|
Level 1
|
Level 2
|
Level 3
|
Total
|
|
Financial
assets
|
|
|
|
|
|
Cash,
December 31, 2020
|
$
7,608,149
|
$
-
|
$
-
|
$
7,608,149
|
|
Cash,
December 31, 2019
|
$
3,017,704
|
$
-
|
$
-
|
$
3,017,704
|
|
Cash,
December 31, 2018
|
$
5,304,097
|
$
-
|
$
-
|
$
5,304,097
|
Categories of financial instruments
The
Company considers that the carrying amount of all its financial
assets and financial liabilities measured at amortized cost
approximates their fair value due to their short term nature.
Restricted cash equivalents approximate fair value due to the
nature of the instrument. The Company does not offset financial
assets with financial liabilities. There were no transfers between
Level 1, 2 and 3 for the year ended December 31, 2020.
38
SILVER ELEPHANT MINING CORP.
Notes
to Annual Consolidated Financial Statements
For the
years ended December 31, 2020, 2019 and 2018
(Expressed in
Canadian Dollars)
21.
FAIR VALUE MEASUREMENTS AND FINANCIAL
INSTRUMENTS
(cont’d...)
Fair Value Measurements
(cont’d...)
Categories of financial instruments
(cont’d...)
The
Company’s financial assets and financial liabilities are
categorized as follows:
|
|
December
31, 2020
|
December
31, 2019
|
December
31, 2018
|
|
Fair
value through profit or loss
|
|
|
|
|
Cash
|
$
7,608,149
|
$
3,017,704
|
$
5,304,097
|
|
Amortized
cost
|
|
|
|
|
Receivables
|
$
75,765
|
$
246,671
|
$
36,399
|
|
Restricted
cash equivalents
|
$
34,500
|
$
34,500
|
$
34,500
|
|
|
$
7,718,414
|
$
3,298,875
|
$
5,374,996
|
|
Amortized
cost
|
|
|
|
|
Accounts
payable
|
$
1,717,977
|
$
2,420,392
|
$
1,636,786
|
22.
FINANCIAL
RISK MANAGEMENT DISCLOSURES
(a)
Liquidity
risk
Liquidity
risk is the risk that an entity will be unable to meet its
financial obligations as they fall due. The Company manages
liquidity risk by preparing cash flow forecasts of upcoming cash
requirements. As at December 31, 2020,
the
Company had a cash balance of $7,608,149 (December 31,
2019
–
$3,017,704, December 31, 2018
– $5,304,097). As
at December 31, 2020 the Company had accounts payable and accrued
liabilities of $1,759,163
(December
31, 2019 - $2,420,392 December 31, 2018
- $1,636,786), which
have contractual maturities of 90 days or less.
The
Company has a planning and budgeting process in place by which it
anticipates and determines the funds required to support normal
operation requirements as well as the growth and development of its
mineral property interests. The Company coordinates this planning
and budgeting process with its financing activities through the
capital management process in normal circumstances.
The
following table details the Company’s current and expected
remaining contractual maturities for its financial liabilities with
agreed repayment periods. The table is based on the undiscounted
cash flows of financial liabilities.
|
|
0 to 6
months
|
6 to 12
months
|
Total
|
|
Accounts
payable and accrued liabilities
|
|
|
|
|
As
at December 31, 2020
|
$
1,759,163
|
$
-
|
$
1,759,163
|
|
As
at December 31, 2019
|
$
2,420,392
|
$
-
|
$
2,420,392
|
|
As
at December 31, 2018
|
$
1,636,786
|
$
-
|
$
1,636,786
|
(b)
Credit
risk
Credit
risk is the risk that one party to a financial instrument will fail
to discharge an obligation and cause the other party to incur a
financial loss. The Company is exposed to credit risk primarily
associated to cash and cash equivalents, restricted cash
equivalents and receivables, net of allowances. The carrying amount
of financial assets included on the statements of financial
position represents the maximum credit exposure.
39
SILVER ELEPHANT MINING CORP.
Notes
to Annual Consolidated Financial Statements
For the
years ended December 31, 2020, 2019 and 2018
(Expressed in
Canadian Dollars)
22.
FINANCIAL RISK MANAGEMENT DISCLOSURES
(cont’d...)
(c)
Market
risk
(i)
Interest rate
risk
Interest rate risk
is the risk that the fair value or future cash flows of a financial
instrument will fluctuate due to changes in market interest rates.
The Company’s cash and restricted cash equivalents primarily
include highly liquid investments that earn interest at market
rates that are fixed to maturity. Due to the short
‐
term nature of these
financial instruments, fluctuations in market rates do not have
significant impact on the fair values of the financial instruments
as of December 31, 2020. The Company manages interest rate risk by
maintaining an investment policy that focuses primarily on
preservation of capital and liquidity.
(ii)
Foreign
currency risk
The
Company is exposed to foreign currency risk to the extent that
monetary assets and liabilities held by the Company are not
denominated in Canadian dollars.
The
Company has exploration and development projects in Mongolia and
Bolivia and undertakes transactions in various foreign currencies.
The Company is therefore exposed to foreign currency risk arising
from transactions denominated in a foreign currency and the
translation of financial instruments denominated in US
dollars
,
Mongolian tugrik, and Bolivian boliviano into its functional and
reporting currency, the Canadian dollar.
Based
on the above, net exposures as at December 31, 2020, with other
variables unchanged, a 10% (December 31, 2019 – 10%, December
31, 2018 – 10%) strengthening (weakening) of the Canadian
dollar against the Mongolian tugrik would impact net loss with
other variables unchanged by $1
00,000.
A 10% strengthening
(weakening) of the Canadian dollar against the Bolivian boliviano
would impact net loss with other variables unchanged by $73,000. A
10% strengthening (weakening) of the US dollar against the Canadian
dollar would impact net loss with other variables unchanged by
$28,000
.
The
Company currently does not use any foreign exchange contracts to
hedge this currency risk.
(iii)
Commodity and
equity price risk
Commodity price risk is defined as
the potential adverse impact on earnings and economic value due to
commodity price movements and volatilities.
Commodity prices
fluctuate on a daily basis and are affected by numerous factors
beyond the Company’s control. The supply and demand for these
commodities, the level of interest rates, the rate of inflation,
investment decisions by large holders of commodities including
governmental reserves and stability of exchange rates can all cause
significant fluctuations in prices. Such external economic factors
are in turn influenced by changes in international investment
patterns and monetary systems and political developments.
The Company is also
exposed to price risk with regards to equity prices. Equity price
risk is defined as the potential adverse impact on the
Company’s earnings due to movements in individual equity
prices or general movements in the level of the stock
market.
The
Company closely monitors commodity prices, individual equity
movements and the stock market to determine the appropriate course
of action to be taken by the Company. Fluctuations in value may be
significant.
23.
RELATED
PARTY DISCLOSURES
During
the year ended December 31, 2020, the Company had related party
transactions with the following companies, related by way of
directors and key management personnel:
●
Linx Partners Ltd.,
a private company controlled by John Lee, Director, CEO and
Executive Chairman of Prophecy, provides management and consulting
services to the Company.
●
MaKevCo Consulting
Inc., a private company 50% owned by Greg Hall, Director of The
Company, provides consulting services to the Company.
40
SILVER ELEPHANT MINING CORP.
Notes
to Annual Consolidated Financial Statements
For the
years ended December 31, 2020, 2019 and 2018
(Expressed in
Canadian Dollars)
23.
RELATED PARTY DISCLOSURES
(cont’d...)
●
Sophir Asia Ltd., a
private company controlled by Masa Igata, Director of The Company,
provides consulting services to the Company
.
A
summary of related party transactions by related party is as
follows:
|
|
Year
Ended December 31,
|
||
|
Related
parties
|
2020
|
2019
|
2018
|
|
Directors
and officers
|
$
1,536,167
|
$
1,685,242
|
$
1,265,152
|
|
Linx
Partners Ltd.
|
740,000
|
371,000
|
401,044
|
|
MaKevCo
Consulting Inc.
|
32,800
|
21,400
|
21,200
|
|
Sophir
Asia Ltd.
|
26,100
|
19,600
|
19,100
|
|
|
$
2,335,067
|
$
2,097,242
|
$
1,706,496
|
A
summary of the transactions by nature among the related parties is
as follows:
|
|
Year
Ended December 31,
|
||
|
Related
parties
|
2020
|
2019
|
2018
|
|
Consulting
and management fees
|
$
370,000
|
$
218,500
|
$
268,456
|
|
Directors'
fees
|
108,600
|
103,805
|
70,378
|
|
Mineral
properties
|
1,387,067
|
1,171,585
|
631,610
|
|
Salaries
|
469,400
|
603,352
|
736,052
|
|
|
$
2,335,067
|
$
2,097,242
|
$
1,706,496
|
As at
December 31, 2020, amounts due to related parties were $1,800
(December 31, 2019 - $30,533;December 31, 2018 - $4,634) and
included in accounts payable and accrued liabilities.
24.
KEY
MANAGEMENT PERSONNEL COMPENSATION
Key
management personnel are those persons having authority and
responsibility for planning, directing and controlling the
activities of the Company, including directors of the
Company.
|
|
Year
Ended December 31,
|
||
|
Key
Management Personnel
|
2020
|
2019
|
2018
|
|
Salaries
and short term benefits
|
$
522,359
|
$
696,751
|
$
775,064
|
|
Directors'
fees
|
108,600
|
103,805
|
70,378
|
|
Share-based
payments
|
1,054,812
|
431,037
|
621,339
|
|
|
$
1,685,771
|
$
1,231,593
|
$
1,466,781
|
41
SILVER ELEPHANT MINING CORP.
Notes
to Annual Consolidated Financial Statements
For the
years ended December 31, 2020, 2019 and 2018
(Expressed in
Canadian Dollars)
25.
SUPPLEMENTAL
CASH FLOW INFORMATION
|
|
Year
Ended December 31,
|
||
|
|
2020
|
2019
|
2018
|
|
Supplementary
information
|
|
|
|
|
Non-Cash Financing
and Investing Activities
|
|
|
|
|
Shares
issued on acquisition of mineral property
|
$
2,000,000
|
$
-
|
$
-
|
|
Bonus
shares
|
$
640,400
|
$
115,000
|
$
-
|
|
Shares
for services
|
$
80,500
|
$
241,003
|
$
-
|
|
Shares
issued to settle debt
|
$
-
|
$
43,030
|
$
-
|
|
Share
issued recorded as prepaid expenses
|
$
-
|
$
35,000
|
$
-
|
|
Subscription
receivable
|
$
-
|
$
30,497
|
$
-
|
|
Warrants
issued for mineral property
|
$
-
|
$
-
|
$
181,944
|
|
Finders
units
|
$
24,000
|
$
-
|
$
-
|
|
Broker
warrants
|
$
226,917
|
$
-
|
$
-
|
|
Depreciation
included in mineral property
|
$
46,932
|
$
3,487
|
$
27,387
|
|
Equipment
expenditures included in accounts payable
|
$
-
|
$
472,213
|
$
489,890
|
|
Fair value
loss/gain on marketable securities
|
$
-
|
$
-
|
$
12,160
|
|
Mineral property
expenditures included in accounts payable
|
$
681,781
|
$
1,252,796
|
$
1,067,747
|
|
Share-based
payments capitalized in mineral properties
|
$
211,627
|
$
119,028
|
$
205,057
|
|
Reclassification of
contributed surplus on exercise of options
|
$
272,848
|
$
153,845
|
$
15,350
|
|
Reclassification of
contributed surplus on exercise of warrants
|
$
166,628
|
$
28,478
|
$
10,650
|
26.
CONTINGENCIES
ASC tax claim
On
January 2, 2015, the Company acquired ASC Holdings Limited and ASC
Bolivia LDC (which together, hold ASC Bolivia LDC Sucursal Bolivia,
which in turn, held Apogee Silver Ltd.’s (“
Apogee
”) joint venture interest in
the Pulacayo Project) and Apogee Minerals Bolivia S.A. Pursuant to
the terms of the Agreement, the Company agreed to assume all
liabilities of these former Apogee subsidiaries, including legal
and tax liabilities associated with the Pulacayo Project.
During Apogee’s financial year ended June 30, 2014, it
received notice from the Servicio de Impuestos Nacionales, the
national tax authority in Bolivia, that ASC Bolivia LDC Sucursal
Bolivia, now the Company’s wholly-owned subsidiary, owed
approximately Bs42,000,000 in taxes, interest and penalties
relating to a historical tax liability in an amount originally
assessed at approximately $760,000 in 2004, prior to Apogee
acquiring the subsidiary in 2011.
Apogee
disputed the assessment and disclosed to the Company that it
believed the notice was improperly issued. The Company
continued to dispute the assessment and hired local legal counsel
to pursue an appeal of the tax authority’s assessment on both
substantive and procedural grounds. The Company received a positive
Resolution issued by the Bolivian Constitutional Court that
among other things, declared null and void the
previous
Resolution
of the Bolivian Supreme Court issued in 2011 (that imposed the tax
liability on ASC Bolivia LDC Sucursal Bolivia) and sent the matter
back to the Supreme court to consider and issue a new
resolution.
On November 18, 2019 the Company received Resolution No. 195/2018
issued by the Supreme Court of Bolivia which declared the tax claim
brought by Bolivia’s General Revenue Authority against the
Company’s Bolivian subsidiary as not
proven.
The Resolution is final and binding. Hence neither the Company nor
the Company’s Bolivian subsidiaries owe any outstanding back
taxes to the Bolivian General Revenue Authority.
During
the year ended December 31, 2019, the Company and legal counsel
reassessed the status of tax rulings and determined that the
probability of a re-issuance of a tax claim against the Company in
connection with the above was remote. As a result, the Company has
written off the tax liability and recorded a debt settlement gain
in the amount of $7,952,700 on its consolidated statements of
operations and comprehensive loss.
42
SILVER ELEPHANT MINING CORP.
Notes
to Annual Consolidated Financial Statements
For the
years ended December 31, 2020, 2019 and 2018
(Expressed in
Canadian Dollars)
26.
CONTINGENCIES
(cont’d...)
Red Hill tax claim
During
the year ended December 31, 2014, the Company’s wholly-owned
subsidiary, Red Hill Mongolia LLC (“
Red Hill
”) was issued a letter
from the Sukhbaatar District Tax Division notifying it of the
results of the Sukhbaatar District Tax Division’s VAT
inspection of Red Hill’s 2009-2013 tax imposition and
payments that resulted in validating VAT credits of only
MNT235,718,533 from Red Hill’s claimed VAT credit of
MNT2,654,175,507. Red Hill disagreed with the Sukhbaatar District
Tax Division’s findings as the tax assessment appeared to the
Company to be unfounded.
The Company disputed
the Sukhbaatar District Tax Division’s assessment and
submitted a complaint to the Capital City Tax Tribunal
.
On March 24,
2015, the Capital City Tax Tribunal resolved to refer the matter
back to the Sukhbaatar District Tax Division for revision and
separation of the action between confirmation of Red Hill’s
VAT credit, and the imposition of the penalty/deduction for the tax
assessment. Due to the uncertainty of realizing the VAT balance,
the Company has recorded an impairment charge for the full VAT
balance in the year ended December 31, 2015.
In
June 2019, the Company
received a positive resolution issued from the City tax tribunal
regarding the Company’s VAT dispute with the Mongolia tax
office. The resolution, which is binding and final, affirmed Red
Hill’s outstanding VAT credit of 1.169 billion MNT resulted
from past mining equipment purchases.
The VAT credit can be used to offset Red Hill’s taxes and
royalty payments; or be refunded in cash by Mongolia’s
Ministry of Finance within 12 to 24 months processing time.
Due to the credit risk
associated with the VAT credit, the Company has provided a full
valuation provision against the balance.
27.
EVENTS
AFTER THE REPORTING DATE
The following events occurred subsequent to December 31,
2020:
●
On February 5,
2021, the Company closed its non-brokered private placement (the
“
February 2021
Placement
”) through
the issuance of 10,000,001 Common Shares at a price of $0.375 per
Common Share. The February 2021 Placement raised gross cash
proceeds of $3,750,000. The Company paid $73,875 in cash as
finder’s fees.
●
On February 10,
2021, the
Company
acquired
the
Minago Nickel Project located in Manitoba, Canada (the
“Minago Project”) (the “Minago Acquisition) by
way of
Asset Purchase
Agreement (the
“APA”
)
with Victory Nickel Inc. (“Victory
Nickel”)
.
Under the
terms of
the APA
,
the Company
acquired the Minago Project for aggregate consideration of
US$11,675,000, which consisted of a US$6,675,000
(“
Property
Payment
”) credit against
certain secured debt owed by Victory Nickel to the Company at
closing and US$5,000,000 in the Company common shares
(“
Consideration
Shares”)
to be issued over a
one-year period.
In satisfaction of the
Consideration Share to be issued, an initial tranche of 5,363,630
Consideration Shares was issued on February
9,
2021,
a further US$2,000,000
worth of Consideration Shares will be issued on or before August
31, 2021, and a further US$1,000,000 worth of Consideration Shares
on or before December 31, 2021
. All Consideration
Shares are subject to 4-month plus 1-day statutory hold period. The
Property Payment was a credit in favour of Victory Nickel against
an aggregate of approximately US$
12,056,307
owed by Victory Nickel
pursuant a Secured Debt Facility (the “
SDF
”)
.
Immediately prior to
acquiring the Minago Project, the Company acquired the SDF for
US$6,675,000 in cash and 3 million of the Company’s common
share purchase warrants (the “
Warrants
”),
each exercisable until February 8, 2023
at an exercise price
of $0.4764
from an arms-length
party pursuant to a Debt Purchase and Assignment Agreement (the
“
DPAA
”)
executed on January 15, 2021. The SDF has been restructured to bear
zero percent interest and to expire on February 8, 2026, which will
automatically be extended in 5-year increments. The Company
will credit the remaining balance
under the SDF to Victory Nickel’s benefit, upon completion of
an independent economic study proving positive net present value in
respect of the Minago Project
during the term of the
SDF
. The Company agreed to
reimburse up to $200,000 of financial advisory services rendered by
Red Cloud Securities Inc
.
43
SILVER ELEPHANT MINING CORP.
Notes
to Annual Consolidated Financial Statements
For the
years ended December 31, 2020, 2019 and 2018
(Expressed in
Canadian Dollars)
27.
EVENTS AFTER THE REPORTING DATE
(cont’d...)
The Company subscribed to 40,000,000 common shares
of Victory Nickel (“VN share”) at a price per VN share
of $0.025 for cash consideration of $1,000,000, which resulted in
the Company owning approximately 29% of Victory Nickel
post-investment on a non-diluted basis. Each VN share is subject to
4-month plus 1-day statutory hold period.
Additionally, the
Company agreed to issue to Victory Nickel $2,000,000 in Common
Shares, upon the price of nickel exceeding US$10 per pound for 30
consecutive business days, at any time before December 31, 2023.
The Company
granted Victory
Nickel the right of first refusal exercisable until December 31,
2023 with respect to the exploration of the sandstone (non-nickel
bearing sulphides) resources for frac sand extraction at the Minago
Project.
●
4,554,990
Common Share purchase warrants were exercised for total proceeds of
$1,164,297 and 105,000 stock options were exercised for total
proceeds of $28,825.
44

Management’s Discussion and Analysis of Financial Condition
and Results of Operations
For the year ended December 31, 2020
(Currency
expressed in Canadian Dollars, except where indicated)
SILVER ELEPHANT MINING CORP.
Management’s Discussion and Analysis of Financial Condition
and Results of Operations
For the year ended December 31, 2020
(Expressed
in Canadian Dollars, except where indicated)
CONTENTS
|
1
|
INTRODUCTION
|
3
|
|
2
|
CAUTIONARY NOTE REGARDING FORWARD-LOOKING STATEMENTS
|
5
|
|
3
|
YEAR 2018 HIGHLIGHTS AND SIGNIFICANT EVENTS
|
6
|
|
4
|
PROPERTY SUMMARY
|
11
|
|
5
|
SELECTED ANNUAL FINANCIAL INFORMATION
|
54
|
|
6
|
SUMMARY OF QUARTERLY RESULTS
|
55
|
|
7
|
RESULTS OF OPERATIONS FOR THE YEAR ENDED DECEMBER 31,
2018
|
55
|
|
8
|
RESULTS OF OPERATIONS FOR THE FOURTH QUARTER 2018
|
57
|
|
9
|
PROPOSED TRANSACTIONS
|
58
|
|
10
|
LIQUIDITY AND CAPITAL RESOURCES
|
59
|
|
11
|
CONTINGENCIES
|
62
|
|
12
|
ENVIRONMENTAL REGULATIONS
|
63
|
|
13
|
RELATED PARTY DISCLOSURES
|
63
|
|
14
|
CRITICAL ACCOUNTING ESTIMATES AND JUDGMENTS
|
64
|
|
15
|
ACCOUNTING CHANGES AND RECENT ACCOUNTING
PRONOUNCEMENTS
|
68
|
|
16
|
FINANCIAL INSTRUMENTS AND RELATED RISKS
|
69
|
|
17
|
RISKS AND UNCERTAINTIES
|
71
|
|
18
|
DISCLOSURE CONTROLS AND PROCEDURES
|
72
|
|
19
|
CHANGES IN INTERNAL CONTROL OVER FINANCIAL REPORTING
|
73
|
|
20
|
DISCLOSURE OF OUTSTANDING SHARE DATA
|
73
|
|
21
|
OFF-BALANCE SHEET ARRANGEMENTS
|
73
|
2
SILVER ELEPHANT MINING CORP.
Management’s Discussion and Analysis of Financial Condition
and Results of Operations
For the year ended December 31, 2020
(Expressed
in Canadian Dollars, except where indicated)
1.
INTRODUCTION
This
Management’s Discussion and Analysis (“
MD&A
”) of Silver Elephant
Mining Corp.
and its
subsidiaries (the “
Company
”) provides analysis of the
Company’s financial results for the year ended December 31,
2020. The following discussion of performance, financial condition
and future prospects should be read in conjunction with the
accompanying December 31, 2020 audited consolidated financial
statements and the notes to those financial statements
(the “
Annual Financial
Statements
”)
,
prepared in accordance with International Financial Reporting
Standards (“
IFRS
”), as issued by the
International Accounting Standards Board, and the Company’s
SEC Form 20-F Annual Report for the year ended December 31, 2020
(the “
2020 Annual
Report
”), all of which are available
under the Company’s SEDAR profile at
www.SEDAR.com
. This MD&A is
current as of March 12, 2021, was reviewed, approved, and
authorized for issue by the Company’s Board of
Directors.
The
information provided herein supplements but does not form part of
the financial statements. Financial information is expressed in
Canadian dollars, unless stated otherwise. All references to "$" or
"dollars" in this MD&A refer to Canadian dollars. References to
"US$" or "USD" in this MD&A refer to United States dollars.
Readers are cautioned that this MD&A contains
“forward-looking statements” and that actual events may
vary from management’s expectations. Readers are encouraged
to read the cautionary note contained herein regarding such
forward-looking statements.
Information on risks associated with investing in
the Company’s securities, as well as information about
mineral resources under National Instrument 43-101 –
Standards of
Disclosure for Mineral Projects
(“
NI 43-101
”)
are contained in the 2019 Annual Report which is
available
under the Company’s SEDAR profile at
www.sedar.com.
Description of Business
The
Company amalgamated under the laws of the Province of British
Columbia, Canada. The Company’s Common Shares (the
"
Common Shares
”, and
each, a “
Common
Share
”) are listed for trading on the Toronto Stock
Exchange (the “
TSX
”) under the symbol
“ELEF” and on the Frankfurt Stock Exchange under the
symbol “1P2N” and are quoted on the OTCQX under the
symbol “SILEF”.
The
Company is a mineral exploration stage company. The Company's
principal projects are the Pulacayo Paca silver-lead-zinc project
in Bolivia (the "
Pulacayo
Project
") and the Gibellini vanadium project (the
“Gibellini Project”) located in the State of Nevada,
USA.
The
Pulacayo Project comprises seven mining areas covering an area of
approximately 3,560 hectares of contiguous areas centered on the
historical Pulacayo mine and town site. The Pulacayo Project is
located 18 kilometers east of the town of Uyuni in the Department
of Potosí, in southwestern Bolivia. It is located 460
kilometers south-southeast of the national capital of La Paz and
150 kilometers southwest of the City of Potosí, which is the
administrative capital of the department. The Pulacayo Project is
fully permitted with secured social licenses for
mining.
The
Pulacayo Project mining rights are recognized by two legally
independent contractual arrangements, one covering all, except the
Apuradita deposit, from a mining production contract (the
"
Pulacayo MPC
") between the
Company and the Corporación Minera de Bolivia ("
COMIBOL
"), a Bolivian state mining
company, and the original holder of the rights, executed on October
3, 2019. The Pulacayo MPC grants the Company the 100% exclusive
right to develop and mine at the Pulacayo and Paca concessions for
up to 30 years against certain royalty payments. It is comparable
to a mining license in Canada or the United States. In connection
with the Apuradita deposit, its rights are covered by a second
contractual arrangement, with the Bolivian Jurisdictional Mining
Authority, acting for the Government of Bolivia, which is in
process of formalization, as a mean of recognition of the acquired
rights to what was originally the mining concession. Until such
time as the contract is formalized, all mining rights, as
recognized in the Bolivian Mining Law 535, can be exercised by the
holder of the ex-concession.
The
Company also currently holds, through leasehold assignments, a 100%
interest in the claims comprising the Gibellini Project, which the
Company aims to make the first operating primary vanadium mine in
North America, as well as a 100% interest in the Titan
vanadium-titanium-iron property located in Ontario, Canada; a 100%
interest in the Ulaan Ovoo coal property located in Selenge
province, Mongolia; and a 100% interest in each of the Chandgana
Tal coal property and the Khavtgai Uul coal property located in
Khentii province, Mongolia. The Company also holds the land use
right and construction license for the Chandgana 600MW Coal-Fired
Mine Mouth Power Plant project located in Khentil province,
Mongolia.
3
SILVER ELEPHANT MINING CORP.
Management’s Discussion and Analysis of Financial Condition
and Results of Operations
For the year ended December 31, 2020
(Expressed
in Canadian Dollars, except where indicated)
General Corporate Information:
|
At
December 31, 2020 and March 12
,
2021,
the Company had: (i) 180,518,828 and 200,542,449 Common Shares
issued and outstanding, respectively; (ii) 10,272,500 and
10,167,500 stock options, each exercisable for the purchase of one
Common Share, outstanding, respectively; (iii) 26,571,067 and
25,016,077 Common Share purchase warrants, each exercisable for the
purchase of one Common Share, outstanding,
respectively.
|
Transfer
Agent and Registrar
Computershare
Investor Services Inc.
3
rd
Floor, 510 Burrard
Street,
Vancouver, BC,
Canada, V6C 3B9
Tel: +1
(604) 661-9400
|
|
|
|
|
Investor and Contact Information
All
financial reports, news releases and corporate information can be
accessed by visiting the Company’s website at:
www.silverelef.com.
Investor
& Media requests and queries:
Email:
ir@silverelef.com
|
Head
Office and Registered Office
Suite
1610 - 409 Granville Street,
Vancouver, BC,
Canada, V6C 1T2
Tel: +1
(604) 569-3661
|
Directors and Officers
As at
the date of this MD&A, The Company’s directors and
officers were as follows:
|
Directors
|
Officers
|
|
John
Lee (Chief Executive Officer and Executive Chairman)
|
Ronald
Espell, Vice-President, Environment and Sustainability
Danniel
Oosterman, Vice-President, Exploration
|
|
Greg
Hall
|
Joaquin
Merino-Marquez, Vice-President, South American
Operations
|
|
Masa
Igata
|
Irina
Plavutska, Chief Financial Officer
|
|
Marc
Leduc
David
H. Smith
|
Brigitte
McArthur, Corporate Secretary
|
|
|
|
|
Audit Committee
|
Corporate Governance and Compensation Committee
|
|
Greg
Hall (Chair)
|
Greg
Hall (Chair)
|
|
Masa
Igata
|
Masa
Igata
|
|
Marc
Leduc
|
Marc
Leduc
|
Qualified Persons
Danniel
Oosterman, B.Sc.(Hons), P.Geo., is a “qualified person”
within the meaning of NI 43-101 (a "
Qualified Person
"). Mr. Oosterman serves
as the Company’s Vice-President, Exploration and Qualified
Person. He is not considered independent of the Company given the
large extent that his professional time is dedicated solely to the
Company. Mr. Oosterman has reviewed and approved the technical and
scientific disclosure regarding the mineral properties of the
Company contained in this MD&A.
4
SILVER ELEPHANT MINING CORP.
Management’s Discussion and Analysis of Financial Condition
and Results of Operations
For the year ended December 31, 2020
(Expressed
in Canadian Dollars, except where indicated)
2.
CAUTIONARY NOTE REGARDING FORWARD-LOOKING STATEMENTS
Certain statements contained in this MD&A constitute
"forward-looking statements" within the meaning of United States
securities laws and "forward-looking information" within the
meaning of Canadian securities laws and are intended to be covered
by the safe harbors provided by such regulations (such
forward-looking statements and forward-looking information are
collectively referred to herein as "
forward-looking statements
"). These
forward looking statements concerns matters anticipated
developments in the Company’s continuing and future
operations in the United States, Canada, Bolivia and Mongolia, and
the adequacy of the Company’s financial resources and
financial projections.
Forward-looking statements in this MD&A are frequently, but not
always, identified by words such as "expects", "anticipates",
"intends", "believes", "estimates", "potentially" or similar
expressions, or statements that events, conditions or results
"will", "may", "would", "could" or "should" occur or are "to be"
achieved, and statements related to matters which are not
historical facts. Information concerning management's expectations
regarding the Company's future growth, results of operations,
performance, business prospects and opportunities may also be
deemed to be forward-looking statements, as such information
constitutes predictions based on certain factors, estimates and
assumptions subject to significant business, economic, competitive
and other uncertainties and contingencies, and involve known and
unknown risks which may cause the actual results, performance, or
achievements to be different from future results, performance, or
achievements contained in the forward- looking statements. Such
forward-looking statements include but are not limited to
statements regarding the Company's planned and future exploration
and/or development of the Pulacayo Project, the Gibellini Project
and the Titan Project; permitting and feasibility of the Gibellini
Project;the volatility of the novel coronavirus ("
COVID-19
") outbreak as a global
pandemic;political instability and social unrest in Bolivia and
other jurisdictions where the Company operates;
the Revised Pulacayo Technical Report
(as defined herein), including the anticipated filing thereof; the
Company's goals regarding exploration, and development of, and
production from its projects, and regarding raising capital and
conducting further exploration and developments of its properties;
the Company's future business plans;the Company's future financial
and operating performance; the future price of silver, lead, zinc,
vanadium and other metals; expectations regarding any environmental
issues that may affect planned or future exploration and
development programs and the potential impact of complying with
existing and proposed environmental laws and regulations; the
ability to obtain or maintain any required permits, licenses or
other necessary approvals for the exploration or development of the
Company's projects; government regulation of mineral exploration
and development operations in Bolivia and other relevant
jurisdictions;the Company's reliance on key management personnel,
advisors and consultants; the volatility of global financial
markets;the timing and amount of estimated future operating and
exploration expenditures;the costs and timing of the development of
new deposits;the continuation of the Company as a going concern;the
likelihood of securing project financing;the impacts of changes in
the legal and regulatory environment in which the Company
operates;the timing and possible outcome of any pending litigation
and regulatory matters;and other information concerning possible or
assumed future results of the Company's operations, including
development and production of electricity from the Company’s
Chandgana power plant, including finalizing of any power purchase
agreement; estimated future coal production at the Chandgana Tal,
Ulaan Ovoo and Khavtgai Uul coal properties, and other information
concerning possible or assumed future results of operations of the
Company. Refer to Section 4 – Property Summary.
Statements relating to mineral resources are deemed to be
forward-looking statements, as they involve the implied assessment,
based on certain estimates and assumptions, that the mineral
resources described exist in the quantities predicted or estimated
and may be profitably produced in the future. Estimated values of
future net revenue do not represent fair market value. There is no
certainty that it will be commercially viable to produce any
portion of the mineral resources.
Forward-looking statements are not guarantees of future performance
and are based upon a number of estimates and assumptions of
management at the date the statements are made including, among
other things, the following: timely receipt of regulatory and
governmental approvals (including licenses and permits) for the
development, construction and production of the Company's
properties and projects; there being no significant disruptions
affecting operations, whether due to labour disruptions, COVID 19
or other causes; currency exchange rates being approximately
consistent with current levels; certain price assumptions for
silver, lead, zinc, vanadium and other metals; prices for and
availability of fuel and electricity; parts and equipment and other
key supplies remaining
5
SILVER ELEPHANT MINING CORP.
Management’s Discussion and Analysis of Financial Condition
and Results of Operations
For the year ended December 31, 2020
(Expressed
in Canadian Dollars, except where indicated)
consistent with current levels and prices; production forecasts
meeting expectations; the accuracy of the Company's current mineral
resource estimates and of any metallurgical testing completed to
date; labour and materials costs increasing on a basis consistent
with the Company's current expectations; any additional required
financing being available on reasonable terms; market developments
and trends in global supply and demand for silver, lead, zinc,
vanadium and other metals meeting expectations; favourable
operating conditions; political stability; access to necessary
financing; stability of labour markets and in market conditions in
general; and estimates of costs and expenditures to complete the
Company's programs. The Company has no assurance that any of these
assumptions will prove to be correct.
Many of these assumptions are inherently subject to significant
business, social, economic, political, regulatory, competitive and
other risks and uncertainties, contingencies, and other factors
that are not within the control of the Company and could thus cause
actual performance, achievements, actions, events, results or
conditions to be materially different from those projected in the
forward-looking statements. Furthermore, such forward-looking
statements involve known and unknown risks, uncertainties and other
factors which may cause the actual results, performance or
achievements of the Company to be materially different from those
reflected in the forward-looking statements, whether expressed or
implied. Such factors include, among others, the following: the
Company is an exploration stage company; the cost, timing and
amount of estimated future capital, operating exploration,
acquisition, development and reclamation activities; the volatility
of the market price of the Common Shares; judgment of management
when exercising discretion in the use of proceeds from offerings of
securities; sales of a significant number of Common Shares in the
public markets, or the perception of such sales, could depress the
market price of the Common Shares; potential dilution with the
issuance of additional Common Shares; none of the properties in
which the Company has a material interest have mineral reserves;
estimates of mineral resources are based on interpretation and
assumptions and are inherently imprecise; the Company has not
received any material revenue or net profit to date; exploration,
development and production risks; no history of profitable mineral
production; actual capital costs, operating costs, production and
economic returns may differ significantly from those the Company
has anticipated; foreign operations and political condition risks
and uncertainties; legal and political risk; amendments to local
laws; the ability to obtain, maintain or renew underlying licenses
and permits; title to mineral properties; environmental risks;
competitive conditions in the mineral exploration and mining
business; availability of adequate infrastructure; the ability of
the Company to retain its key management and employees and the
impact of shortages of skilled personnel and contractors; limits of
insurance coverage and uninsurable risk; reliance on third party
contractors; the availability of additional financing on reasonable
terms or at all; foreign exchange risk; impact of anti-corruption
legislation; recent global financial conditions; changes to the
Company's dividend policy; conflicts of interest; cyber security
risks; litigation and regulatory proceedings; the obligations which
the Company must satisfy in order to maintain its interests in its
properties; the influence of third-party stakeholders; the
Company's relationships with the communities in which it operates;
human error; the speculative nature of mineral exploration and
development in general, including the risk of diminishing
quantities or grades of mineralization; and other risks and the
factors discussed under the heading "Key Information - Risk
Factors" in the 2019 Annual Report and in analogous disclosure in
other disclosure documents of the Company
The foregoing list is not exhaustive and additional factors may
affect any of the Company's forward-looking statements. Although
the Company has attempted to identify important factors that could
cause actual performance, achievements, actions, events, results or
conditions to differ materially from those described in
forward-looking statements, there may be other factors that cause
performance, achievements, actions, events, results or conditions
to differ from those anticipated, estimated or
intended.
The forward-looking statements contained herein are made as of the
date of this MD&A and the Company disclaims any obligation to
update or revise any forward-looking statements, whether as a
result of new information, future events or results or otherwise,
except as required by applicable law. There can be no assurance
that forward-looking statements will prove to be accurate, as
actual results and future events could differ materially from those
anticipated in such statements. Accordingly, readers should not
place undue reliance on forward-looking statements. All
forward-looking statements attributable to the Company are
expressly qualified by these cautionary statements.
3.
YEAR 2020 HIGHLIGHTS AND SIGNIFICANT EVENTS
For
further information please view the Company’s 2020 news
releases
under the Company’s
SEDAR profile at
www.SEDAR.com
.
6
SILVER ELEPHANT MINING CORP.
Management’s Discussion and Analysis of Financial Condition
and Results of Operations
For the year ended December 31, 2020
(Expressed
in Canadian Dollars, except where indicated)
Pulacayo Project
●
In January 2020 the
Company had completed the first of 3 holes of the planned 17 drill
holes at the Pulacayo Project and has mobilized a second drilling
rig to the Pulacayo Project.
●
On January 21,
2020, the Company
announced the first
step-out diamond drilling results from the Pulacayo property.
Borehole PUD 267 intercepted 10 meters of mineralization grading
147 g/t silver, 9.8% zinc, and 2.0% lead (539 g/t AgEq) within 35.5
meter mineralization grading 230 g/t AgEq starting 31.5 meters
downhole;
●
On March 6, 2020,
the Company released
the results of
its first 2,598 meters of drilling which focused on the western
portion of the Pulacayo Project;
●
On
March 9, 2020, the Company announced a commencement district
exploration program at the Pulacayo Project. The exploration team
will be conducting geological mapping, with relevant sampling and
possible trenching on the property. Induced polarization geophysics
will be conducted in tandem with the field program, with 106
line-kilometers of survey having been outlined. The program is
expected to be completed by June 2020, when the results will have
been evaluated. The intention is to then generate drilling targets
in the district.
●
On July 20, 2020, the Company announced it had
engaged Mercator Geological Services Limited (
“Mercator”
)
to prepare an updated NI 43-101 compliant technical report for
the Pulacayo Project.
●
On August 11, 2020,
the Company announced diamond infill drilling results from the
Pulacayo Project which demonstrated broad continuity of
mineralization and grade starting from near-surface, consistent
with historic Hochschild mining records, which indicated high grade
mineralization with increasing depth to more than 1,000 meters from
surface.
●
On October 13, 2020,
the Company announced
the
results of an NI 43-101 compliant mineral resource estimate
for the Pulacayo Project prepared by Mercator. This mineral
resource estimate has an effective date of October 13, 2020 and
includes an indicated mineral resource of 106.7 million oz of
silver, 1,384.7 million pounds of zinc, and 693.9 million pounds of
lead, and an inferred mineral resource of 13.1 million oz of
silver, 122.8 million pounds of zinc and 61.9 million pounds of
lead.
On October 26, 2020, the Company filed an NI 43-101
compliant technical report titled "
Mineral Resource Estimate Technical Report for
the Pulacayo Project, Potosí Department, Antonnio Quijarro
Province, Bolivia
" prepared by Matthew Harrington, P. Geo,
Michael Cullen, P. Geo, and Osvaldo Arce, P. Geo, of Mercator, with
an effective date of October 13, 2020 and a report date of October
23, 2020 (the "
Pulacayo Technical
Report
") with Canadian securities regulatory authorities.
The Pulacayo Technical Report is available under the
Company’s SEDAR profile at www.sedar.com and is discussed in
more detail below, under the heading "
Property Summary – Pulacayo Project,
Bolivia
". The Company is in the process of finalizing a
revised version of the Pulacayo Technical Report (the "
Revised Pulacayo Technical Report
"), due
to subsequent revisions to a number of sections of the Pulacayo
Technical Report by the authors thereof; however, the Revised
Pulacayo Technical Report will not contain any changes to the
mineral resource estimates, the interpretation and conclusions, or
the recommendations from those set out in the Pulacayo Technical
Report. The Revised Pulacayo Technical Report will be filed by the
Company with Canadian securities regulatory authorities in
connection with the filing of the final short form prospectus of
the Company in relation to the Offering (as defined
herein).
●
On November 17,
2020 the Company announced that it had filed its independent
amended technical report with a report date of November 12, 2020
and an effective date of October 13, 2020, titled "Mineral Resource
Estimate Technical Report for the Pulacayo Project" (the "Report").
The Report was prepared by Mercator Geological Services Limited on
the Company’s Pulacayo project and has been filed under the
Company’s profile on the System for Electronic Document
Analysis and Retrieval at
www.sedar.com
.
●
On November 30, 2020 the Company announced that it had received the
complete assay results from the Company’s diamond drill
program at the Paca silver-lead-zinc deposit (“Paca”)
in Bolivia. Reported widths are intercepted core lengths and not
true widths, as relationships with intercepted structures and
contacts
7
SILVER ELEPHANT MINING CORP.
Management’s Discussion and Analysis of Financial Condition
and Results of Operations
For the year ended December 31, 2020
(Expressed
in Canadian Dollars, except where indicated)
vary. Based on core-angle measurements, true widths range from 77%
to 86% of the reported core length. PND 114, 115, 118 drilled
tested oblique structures parallel to the main east-west trend and
discovered new mineralized zones. PND 114 intersected 16.5 meters
of mineralization grading 55g/t silver equivalent that is to the
north of the Paca north zone. PND 115 intercepted 66 meters of
mineralization grading 75g/t silver equivalent between Paca main
zone and Paca north zone, which are 250 meters apart. PND 118 was
drilled at the eastern edge of the Paca main zone and intersected
112 meters of mineralization grading 50 g/t silver
equivalent.
Gibellini Project
●
On July 16, 2020, the Company announced that the
Notice of Intent (the “
NOI
”) to prepare an Environmental Impact
Statement (the “
EIS
”) for the Gibellini Project was published
on July 14, 2020, in the Federal Register. The NOI formally
commenced the 12-month timeline to complete the National
Environmental Policy Act (“
NEPA
”) review and the EIS preparation by the
U.S. Department of the Interior Bureau of Land Management (the
“
BLM
”).
Acquisitions
●
On July 13, 2020,
the Company announced that it had entered into an agreement (the
“
Triunfo
Agreement
”) with a private party (the
“Triunfo Vendor”
) for the
right to conduct mining exploration activities (the
“
Exploration
Right
”) within the El
Triunfo gold-silver-lead-zinc project in La Paz District, Bolivia
(the “
Triunfo
Project
”) and the right, at the Company’s
election, to purchase the Triunfo Project for US$1,000,000 (the
“
Purchase
Right
”, and together with the
Exploration Right, the “
Triunfo
Rights
”). The Purchase Right can
be exercised at any time after the Triunfo Vendor completes the
required Bolivian administrative procedures for the Triunfo
Project, expected to occur no later than March 2021, until July 13,
2025 or such further period as the parties may agree. To secure the
Triunfo Rights, the Company paid the Triunfo Vendor US$100,000 upon
execution of the Triunfo Agreement. Until the Company exercises its
Purchase Right, beginning in 2021 the Company must pay the Triunfo
Vendor US$50,000 on June 15 of each year to maintain the Triunfo
Rights. The Company may elect to terminate the Triunfo Agreement at
any time. If the Company exercises the Purchase Right, the Triunfo
Vendor will maintain up to a 5% interest of the profits, net of
taxes and royalties, derived from the sale of concentrate produced
from the Triunfo Project (the “
Residual
Interest
”).
If the Company exercises the Purchase Right, the
Company may reduce some or all of the Residual Interest at any time
by making a lump sum payment of up to
US$300,000.
On November 25, 2020
the Company
announced
that it had received the complete assay results from the
Company’s first diamond drill program at the Triunfo Project.
Borehole TR007 intercepted 48.9 meters of mineralization grading
0.42 g/t gold, 35.5 g/t silver, 1.17% zinc, and 0.83% lead (1.45
g/t AuEq) within 98.9 meters of mineralization grading 1.04 g/t
AgEq starting 13.0 meters downhole.
●
On August 19, 2020, the Company announced that it
had received its first chip sampling results on the Triunfo
Project.
A total of 103 chip
samples were collected from outcrops at surface and from
underground adits and tunnels accessing the main east-west
mineralized trend. The width of the samples varies from 1.0 to
5.3m, exhibiting an
average width of 2.5m.
37 Triunfo samples assayed up to 8.3 g/t AuEg.
These results confirmed the Triunfo Project
exhibits near-surface Au-Ag-Pb-Zn
mineralization.
●
On September 8, 2020, the Company
announced that it had entered into a binding sales and purchase
agreement (the “
Sunawayo
SPA
”)
with a private party (the “
Sunawayo
Vendor
”) to
acquire the Sunawayo silver-lead mining project (the
“
Sunawayo
Project
”)
located immediately adjacent to the Malku Khota silver project in
Bolivia.
Subject to the provisions of the Sunawayo SPA, the
Sunawayo Vendor agreed to irrevocably transfer the mining rights of
the Sunawayo Project to the Company for consideration of
US$6,500,000, which payment consists of US$300,000 paid on
execution of the Sunawayo SPA, with the remaining US$6,200,000 to
be paid in cash over a one-year period in twelve equal monthly
installments, starting March 1, 2021.
8
SILVER ELEPHANT MINING CORP.
Management’s Discussion and Analysis of Financial Condition
and Results of Operations
For the year ended December 31, 2020
(Expressed
in Canadian Dollars, except where indicated)
●
On September 28, 2020, the Company
announced
that all of the initial
forty-eight chip and grab samples collected from surface outcrops
and adits at the Sunawayo Project returned anomalous Ag-Pb assayed
values. Ten of the assayed samples contain either over 100g/t
silver or 10% lead or both. The results exceeded the
Company’s expectations and are an early indication of the
potential for mineral discoveries at Sunawayo. The Company is
mobilizing to start geological and structural mapping to ascertain
the primary controls and trends for mineralization at Sunawayo.
This work will lay the foundation for defining drill targets by
year’s end.
●
On September 18, 2020, the Company’s
wholly owned subsidiary
Nevada Vanadium LLC
(“
Nevada
Vanadium
”)
completed the acquisition of the Bisoni vanadium project (the
"
Bisoni
Project
") situated
immediately southwest of the Gibellini Project pursuant to an Asset
Purchase Agreement (the “
Bisoni
APA
”) dated
August 18, 2020, with Cellcube Energy Storage Systems Inc.
(“
Cellcube
”).
The Bisoni
Project is comprised of 201 lode mining claims, along a
13.8-kilometer strike that covers an area of 16.5 square kilometers
(1,656 hectares),
easily
accessed by a graded gravel road extending south from US Highway 50
and is about 25 miles south of the town of Eureka,
Nevada.
●
As consideration
for the acquisition of the Bisoni Project under the Bisoni APA, the
Company issued 4 million Common Shares (the "
Bisoni APA Shares
") and paid $200,000
cash to CellCube. The Bisoni APA Shares were subject to a Canadian
statutory four month hold period that expired on January 19, 2021.
Additionally, subject to TSX approval, if, on or before December
31, 2023, the price of European vanadium pentoxide on the Metal
Bulletin (or an equivalent publication) exceeds US$12 a pound for
30 consecutive days, the Company will issue to CellCube additional
Common Shares with a value of $500,000, calculated based upon the 5
day volume weighted average price of the Common Shares immediately
following the satisfaction of the vanadium pentoxide pricing
condition.
Corporate
●
During the year
ended December 31, 2020 the Company experienced the following
changes in Directors, Officers and Management as
follows:
o
Michael Doolin
ceased to act as Chief Executive Officer on July 17,
2020;
o
John Lee was
appointed Interim Chief Executive Officer effective July 17,
2020;
o
Ronald Clayton
resigned as a Director on July 31, 2020; and
o
David Smith was
appointed as a Director on August 3, 2020.
●
On January 6, 2020,
pursuant to the Company’s Share-Based Compensation Plan, the
issuance of an aggregate of 1,601,000 Common Shares as 2019 bonus
payments to certain directors, officers, employees and consultants
of the Company;
●
On May 4, 2020, the
Company
has
granted in aggregate, 3,000,000 incentive stock options to certain
directors, officers, employees and consultants of the Company.
These options are exercisable at a price of $0.22 per Common Share
for a term of five years expiring on May 4, 2025 and vest at 12.5%
per quarter for the first two years following the date of
grant.
●
On July 7, 2020, the Company reported
that all
proposed resolutions were approved at the Company’s Annual
General and Special Meeting of shareholders held on July 7, 2020.
The Company had previously received conditional approval from the
TSX to amend the exercise price of an aggregate of 24,318,927
previously issued Common Share purchase warrants
(the
“Original
Warrants”
) of the Company to an
exercise price of $0.26 per Common Share
(the
“Amendment”
)
pending shareholder approval of the Amendment. Pursuant to the
passing of the ordinary resolution approving the Amendment, the
Original Warrants were cancelled and replaced with amended Common
Share purchase warrants with an exercise price of $0.26 per Common
Share (the
“Amended
Warrants”
), which the Amendment
becoming effective as of July 17, 2020. All other terms of the
Amended Warrants were unchanged from the Original
Warrants.
●
On August 17, 2020,
the Company has granted in aggregate, 720,000 incentive stock
options to certain directors, employees, and consultants of the
Company.
These options are
exercisable at a price of $0.50 per Common Share for a term of five
years expiring on August 17, 2025 and vest at 12.5% per quarter for
the first two years following the date of
grant.
9
SILVER ELEPHANT MINING CORP.
Management’s Discussion and Analysis of Financial Condition
and Results of Operations
For the year ended December 31, 2020
(Expressed
in Canadian Dollars, except where indicated)
●
During the year
ended December 31, 2020, 14,027,670 Common Share purchase warrants
and 1,233,750 stock options were exercised for total proceeds of
$3,407,006.
Financings
:
●
On May 1, 2020 and
on May 20, 2020, the Company closed two tranches of a non-brokered
private placement (the "
May
2020
Private
Placement
") for aggregate gross proceeds of $1,930,500 and
share compensation for services of $45,500, through the issuance of
15,200,000 units of the Company (each, a "
Unit
") at a price of $0.13 per Unit.
Each Unit is comprised of one Common Share and one Common Share
purchase warrant (each, a “
Warrant
”). Each Warrant entitles
the holder to purchase one Common Share at an exercise price of
$0.16 for a period of three years from the date of issuance. The
Company paid $3,250 in cash and issued 156,900 Units as
finder’s fees in connection with the May 2020 Private
Placement.
The May
2020 Private Placement proceeds were expected to be used for the
Company’s mineral project development and for general working
capital purposes.
●
On October 20, 2020,
the Company announced
that it had entered into an agreement
with Mackie Research Capital Corporation as lead underwriter and
sole bookrunner (the
“Lead
Underwriter”
), on behalf
of a syndicate of underwriters, including Canaccord Genuity Corp.
and Sprott Capital Partners LP (collectively with the Lead
Underwriter, the
“Underwriters”
),
pursuant to which the Underwriters agreed to purchase, on a
bought
‐
deal
basis, 15,000,000 Common Shares of the Company at a price of $0.40
per Common Share for aggregate gross proceeds of $6,000,000
(the
“Offering”
).
The
Company also granted the Underwriters an option to increase the
size of the Offering by up to an additional number of Common Shares
that in aggregate would be equal to 15% of the total number of
Common Shares to be issued under the Offering, at any time up to 30
days following the closing of the Offering.
●
On
October 21, 2020, the Company announced that it had entered into an
amended agreement with the Lead Underwriter to increase the size of
the Offering to 20,000,000 Common Share at a price of $0.40 per
Common Share for aggregate gross proceeds of $8,000,000. The other
details of the Offering remained unchanged.
●
On
November 24, 2020, the
Company announced the
closing of the Offering to which the
Company issued 23,000,000 Common Shares at a price of C$0.40 per
Common Share, for aggregate gross proceeds of C$9,200,000,
including the full exercise of the over-allotment option.
The net proceeds from the Offering
will be used for the exploration, development and/or improvement of
the Company’s mineral properties and for working capital
purposes.
Subsequent
Events to December 31, 2020
●
On January 21,
2020, the Company announced completion of a 940 meter diamond
drilling program at the Pero target within the Pulacayo Project and
commencement of a 2,300 meter drilling program at the Sunawayo
Project.
●
On January 22,
2020, the Company announced entering into a binding definitive
Asset Purchase Agreement (“
APA
”) with Victory Nickel Inc.
(“
Victory
Nickel
”) to acquire the Minago Nickel Project
(“
Minago
Project
”), located in Manitoba, Canada.
●
On January 27,
2020, the Company announced the initial drill results from the Pero
discovery within the Pulacayo Project. The Company plans to begin a
geophysical survey over Pero in Q1 2021 to define potential
anomalies in-and-around these newly discovered mineralized zones to
help formulate the next set of drill targets on the
project.
●
On February 5, 2021
the Company closed its non-brokered private placement (the
“
February 2021
Placement
”) through
the issuance of 10,000,001 Common Shares at a price of $0.375 per
Common Share. The February 2021 Placement raised gross cash
proceeds of $3,750,000
.
The Company paid $73,875 in
cash as finder’s fees. The Common Shares are subject to a
four month and one day hold period. Proceeds of the February 2021
Placement are expected to be used for exploration, working capital
and general corporate purposes which may include project
evaluations and acquisitions.
10
SILVER ELEPHANT MINING CORP.
Management’s Discussion and Analysis of Financial Condition
and Results of Operations
For the year ended December 31, 2020
(Expressed
in Canadian Dollars, except where indicated)
●
On February 10,
2021, the
Company
has
acquired
the
Minago Project (the “Minago Acquisition) by way of
Asset
Purchase Agreement (the
“APA”
)
with Victory Nickel Inc. (“
Victory
Nickel
”)
.
Under
the
terms
of the APA the Company acquired the Minago Project for aggregate
consideration of US$11,675,000, which consisted of a US$6,675,000
(“
Property
Payment
”) credit against
certain secured debt owed by Victory Nickel to the Company at
closing and US$5,000,000 in the Company common shares
(“
Consideration
Shares”)
to be issued over a
one-year period.
In satisfaction of the
Consideration Share to be issued, an initial tranche of 5,363,630
Consideration Shares was issued on February
9,
2021,
a further US$2,000,000
worth of Consideration Shares will be issued on or before August
31, 2021, and a further US$1,000,000 worth of Consideration Shares
on or before December 31, 2021
. All Consideration
Shares are subject to 4-month plus 1-day statutory hold period. The
Property Payment was a credit in favour of Victory Nickel against
an aggregate of approximately US$
12,056,307
owed by Victory Nickel
pursuant a Secured Debt Facility (the “
SDF
”).
Immediately prior to
acquiring the Minago Project, the Company acquired the SDF for
US$6,675,000 in cash and 3 million of the Company’s common
share purchase warrants (the “
Warrants
”),
each exercisable until February 8, 2023
at an exercise price
of $0.4764
from an arms-length
party pursuant to a Debt Purchase and Assignment Agreement (the
“
DPAA
”)
executed on January 15, 2021. The SDF has been restructured to bear
zero percent interest and to expire on February 8, 2026, which will
automatically be extended in 5-year increments. The Company
will credit the remaining balance
under the SDF to Victory Nickel’s benefit, upon completion of
an independent economic study proving positive net present value in
respect of the Minago Project
during the term of the
SDF
. The Company agreed to
reimburse up to $200,000 of financial advisory services rendered by
Red Cloud Securities Inc.
●
On February 24, 2021,
the Company announced that the first drill hole at the Sunawayo
Project has intercepted 137 meters of mineralization grading 36 g/t
silver, starting from zero meters-depts.
The
second drill hole intercepted 31 meters of mineralization grading
44 g/t silver, 0.39% lead, and 0.48% zinc from 1 meter-depth. Both
drill holes (240 meters to the southeast of the former) feature
near-uniform silver assays throughout the reported intervals,
indicating that silver mineralization is highly likely to continue
deeper.
4.
PROPERTY SUMMARY
DEFINITIONS AND INTERPRETATIONS
This
MD&A contains a number of technical terms relating to
exploration and resource development that may be unfamiliar to a
general reader. The following definitions are provided for
reference and clarification, and reflect their common use and
understanding in the mining industry:
“
deposit
”
means a mineral deposit which is a mineralized mass that may be
economically valuable, but whose characteristics may require more
detailed information. Mineral resources are calculated from
geological data collected from deposits, however, deposits do not
necessarily reflect the presence of mineral resources.
“
mineral
resource
” means a
concentration or occurrence of natural, solid, inorganic, or
fossilized organic material in or on the Earth’s crust in
such form and quantity and of such a grade or quality that it has
reasonable prospects for economic extraction. The location,
quantity, grade, geological characteristics, and continuity of a
mineral resource are known, estimated, or interpreted from specific
geological evidence and knowledge. Mineral resources are
sub-divided, in order of increasing geological confidence, into
Inferred
,
Indicated
, and
Measured
categories. Note that the
confidence level in Inferred Mineral Resources is insufficient
to allow the application of technical and economic parameters or to
enable an evaluation of economic viability worthy of public
disclosure. Regardless of category, a mineral resource is estimated
through application of the guidelines of the Canadian Institute of
Mining, Metallurgy and Petroleum Standards for Mineral Resources
and Reserves: Definitions and Guidelines, as amended in 2014. A
“historic” mineral resource estimate refers to a
mineral resource estimate of the quantity, grade, or metal or
mineral content of a deposit that the Company has not verified as
current, and which was prepared before the Company acquired or
entered into an agreement to acquire, an interest in the property
that contains the deposit.
11
SILVER ELEPHANT MINING CORP.
Management’s Discussion and Analysis of Financial Condition
and Results of Operations
For the year ended December 31, 2020
(Expressed
in Canadian Dollars, except where indicated)
“
project
”,
as used in the context of the Pulacayo Project, the
Gibellini
Project, the
Triunfo Project, the Sunawayo Project and the Titan Project defined
in this MD&A, refers to a mineral project which, pursuant to NI
43-101, means any exploration, development or production activity,
including a royalty or similar interest in these activities with
respect to base metals, precious metals or industrial metals as it
applies to the Company.
“
property
”
refers to land concessions for which the Company holds mineral
rights to conduct its activities.
“
Qualified
Person
” means,
pursuant to NI 43-101, an individual who is an engineer or
geoscientist with at least five years experience in mineral
exploration, mine development or operation, or mineral project
assessment. This individual is a member or licensee in good
standing of a professional association and has to have relevant
experience of the subject matter of the mineral project and the
technical report.
PULACAYO PROJECT, BOLIVIA
The
scientific and technical information in this section of this
MD&A that specifically relates to the current Pulacayo Project
mineral resource estimates for the Pulacayo and Paca deposits has
been extracted or summarized from the Pulacayo Technical Report.
Additional information presented below that pertains to the
Pulacayo Project but does not specifically appear in the Pulacayo
Technical Report has been provided by the Company. The Pulacayo
Technical Report is available under the Company’s SEDAR
profile at www.sedar.com.
The
Company filed the Pulacayo Technical Report on October 26, 2020.
The Company is in the process of finalizing the Revised Pulacayo
Technical Report due to subsequent revisions to a number of
sections of the Pulacayo Technical Report by the authors thereof;
however, the Revised Pulacayo Technical Report will not contain any
changes to the mineral resource estimates, the interpretation and
conclusions, or the recommendations from those set out in the
Pulacayo Technical Report. The Revised Pulacayo Technical Report
will be filed by the Company with Canadian securities regulatory
authorities in connection with the filing of the final short form
prospectus of the Company in relation to the Offering.
The
Pulacayo Project consists of many licenses within which are located
the Pulacayo and Paca mineral deposits, several areas of potential
mineralization and historic tailings piles.
The
Pulacayo Project mining rights are recognized by two legally
independent contractual arrangements, one covering all, except the
Apuradita mining concession, from the Pulacayo MPC between the
Company and COMIBOL, a Bolivian state mining company, and the
original holder of the rights, executed on October 3, 2019. The
Pulacayo MPC grants the Company the 100% exclusive right to develop
and mine at the Pulacayo and Paca mineral deposits for up to 30
years against certain royalty payments. It is comparable to a
mining license in Canada or the United States. In connection with
the Apuradita mining concession, its rights are covered by a second
contractual arrangement, with the Bolivian Jurisdictional Mining
Authority, acting for the State, which is in process of
formalization, as a mean of recognition of the acquired rights to
what was originally the mining concession. Until such time as the
contract is formalized, all mining rights, as recognized in the
Bolivian Mining Law 535, can be exercised by the holder of the
ex-concession.
The
Pulacayo Project comprises seven mining areas covering an area of
approximately 3,560 hectares of contiguous areas centered on the
historical Pulacayo mine and town site. The Pulacayo Project is
located 18 kilometers east of the town of Uyuni in the Department
of Potosí, in southwestern Bolivia. It is located 460
kilometers south-southeast of the national capital of La Paz and
150 kilometers southwest of the City of Potosí, which is the
administrative capital of the department. The Pulacayo Project is
fully permitted with secured social licenses for
mining.
Mineral Resources and Reserves
The
Pulacayo Technical Report describes mineral resources estimated
following the guidelines of the Canadian Institute of Mining,
Metallurgy and Petroleum Standards for Mineral Resources and
Reserves: Definitions and Guidelines, as amended in 2014 (the
“
CIM
Standards
,
2014
”). Two mineral resource
estimates were disclosed according to the requirements of
NI 43-101 for the Pulacayo Project, one for the Pulacayo
deposit and one for the Paca deposit (the “
Pulacayo
MRE
” and “
Paca
MRE
”, respectively, and
collectively referred to herein as the “
Mineral
Resource
Estimate
”).
12
SILVER ELEPHANT MINING CORP.
Management’s Discussion and Analysis of Financial Condition
and Results of Operations
For the year ended December 31, 2020
(Expressed
in Canadian Dollars, except where indicated)
The
Mineral Resource Estimate has an effective date of October 13, 2020
and includes an indicated mineral resource of 106.7 million oz of
silver, 1,384.7 million pounds of zinc, and 693.9 million pounds of
lead, and an inferred mineral resource of 13.1 million oz of
silver, 122.8 million pounds of zinc and 61.9 million pounds of
lead. Apogee Mineral Bolivia S.A., the Company’s wholly owned
Bolivian subsidiary, has invested over US$30 million at the
Pulacayo Project since 2006.
The
Mineral Resource Estimate was prepared by Mercator under the
supervision of Matthew Harrington, P. Geo., who is an independent
Qualified Person as defined under NI 43-101. A contained metal
summary based on the Mineral Resource Estimate for the Pulacayo
Project is reported below:
Pulacayo Project Mineral Resource Estimate Summary of Total
Contained Metal -
Effective October 13, 2020**
|
Zone
|
Category
|
Rounded Tonnes
|
Ag Moz
|
Zn Mlbs
|
Pb Mlbs
|
*AgEq Moz
|
|
Open
Pit Constrained
|
Indicated
|
47,380,000
|
101.0
|
1,365.0
|
687.5
|
202.0
|
|
Inferred
|
4,165,000
|
8.0
|
80.3
|
53.5
|
14.3
|
|
|
Out-of-Pit
|
Indicated
|
660,000
|
5.7
|
19.6
|
6.4
|
6.5
|
|
Inferred
|
900,000
|
5.2
|
42.4
|
8.3
|
7.4
|
|
|
Total:
|
Indicated
|
48,040,000
|
106.7
|
1,384.7
|
693.9
|
208.5
|
|
Inferred
|
5,065,000
|
13.1
|
122.8
|
61.9
|
21.7
|
**Notes
:
1.
The Mineral Resource Estimate was prepared in accordance with
NI 43-101, the CIM Definition Standards (2014) and CIM MRMR
Best Practice Guidelines (2019).
2.
*Ag Eq. = silver equivalent (recovered) = (Ag
g/t*89.2%)+((Pb%*(US$0.95/lb. Pb/14.583 Troy oz./lb./US$17 per Troy
oz. Ag)*(10,000*91.9%))+((Zn%*(US$1.16/lb. Zn/14.583 Troy
oz./lb./US$17 per Troy oz. Ag)*(10,000*82.9%)). Sulphide zone metal
recoveries of 89.2% for Ag, 91.9% for Pb, and 82.9% for Zn were
used in the silver equivalent (recovered) equation and reflect
metallurgical testing results disclosed previously for the Pulacayo
deposit. A metal recovery of 80% Ag was used for oxide zone mineral
resources.
3.
Metal prices of US$17/oz Ag, US$0.95/lb Pb, and US$1.16 Zn apply. A
currency exchange rate of CDN$1.00 to US$0.75 applies.
4.
Pit-constrained mineral resources are defined for each deposit
within optimized pit shells with average pit slope angles of
45⁰. The Pulacayo MRE was optimized at a 12.3:1 strip ratio
and the Paca MRE was optimized with at a 4.3: strip
ratio.
5.
Base-case sulfide zone pit optimization parameters include: mining
at US$2.00 per tonne; combined processing and general and
administrative (“
G&A
”) at US$12.50 per tonne
processed; haulage at US$0.50 per tonne processed for the Pulacayo
deposit and US$2.00 per tonne processed for the Paca
deposit.
6.
Base-case oxide zone pit optimization parameters include: mining at
US$2.00 per tonne; combined processing and G&A at US$23.50 per
tonne processed; haulage at US$0.50 per tonne processed for the
Pulacayo deposit and US$2.00 per tonne processed for the Paca
deposit.
7.
Pit-constrained sulphide zone mineral resources are reported at a
cut-off grade of 30 g/t ag eq. within the optimized pit shells and
pit-constrained oxide zone mineral resources are reported at a
cut-off grade of 50 g/t Ag within the optimized pit shells. Cut-off
grades reflect total operating costs used in pit optimization and
are considered to define reasonable prospects for eventual economic
extraction by open pit mining methods.
8.
Out of pit mineral resources are external to the optimized pit
shells and are reported at a cut-off grade of 100 g/t Ag Eq. They
are considered to have reasonable prospects for eventual economic
extraction using conventional underground methods such as long hole
stoping based on a mining cost of $35 per tonne and processing and
G&A cost of $20 per tonne processed.
9.
“Total” mineral resources for the Pulacayo MRE is the
tonnage-weighted average summation of pit-constrained and
out-of-pit Pulacayo deposit mineral resources.
10.
“Total” mineral resources for the Mineral Resource
Estimate is the tonnage-weighted average summation of the total
Pulacayo MRE and Paca MRE.
13
SILVER ELEPHANT MINING CORP.
Management’s Discussion and Analysis of Financial Condition
and Results of Operations
For the year ended December 31, 2020
(Expressed
in Canadian Dollars, except where indicated)
11.
Mineral resources were estimated using ordinary Kriging methods
applied to 1 m downhole assay composites capped at 2,300 g/t Ag,
13% Pb and 15% Zn.
12.
Bulk density was interpolated using ordinary Kriging methods for
Pulacayo MRE. An average bulk density of 2.32 g/cm3 or 2.24 g/cm3
was applied to Paca MRE, based on grade domain solid
models.
13.
Mineral resources may be materially affected by environmental,
permitting, legal, title, taxation, sociopolitical, marketing, or
other relevant issues.
14.
Mineral resource tonnages have been rounded to the nearest 5,000;
totals may vary due to rounding.
The
Mineral Resource Estimate is based on estimates of pit-constrained
and out of pit mineral resources, details of which are presented in
the following two tables for the Pulacayo and Paca deposits,
respectively. The Pulacayo MRE incorporate 73,016 metres of diamond
drilling (244 surface and 42 underground drill holes). The Paca MRE
incorporates results of 104 diamond drill holes and 6 reverse
circulation drill holes totaling 19,916 meters completed between
2002 and 2020. Geovia Surpac ® Version 2020 was used to create
the Pulacayo Project block models, associated geological and grade
solids, and to interpolate silver-zinc-lead grade. Geovia Whittle
pit optimization software and the PseudoFlow algorithm were applied
for pit shell optimization purposes.
Pulacayo Deposit Combined Pit-Constrained and Out-of-Pit Mineral
Resource Estimate – Effective Date October 13,
2020**
|
Cut -off Grade
|
Zone
|
Category
|
Rounded Tonnes
|
Ag g/t
|
Zn %
|
Pb %
|
Ag Moz
|
Zn Mlbs
|
Pb Mlbs
|
*AgEq
Moz
|
*AgEq g/t
|
|
50 Ag
g/t
|
Oxide
In-Pit
|
Indicated
|
1,090,000
|
125
|
|
|
4.4
|
|
|
|
|
|
Inferred
|
25,000
|
60
|
|
|
0.0
|
|
|
|
|
||
|
30
*AgEq g/t
|
Sulfide
In-Pit
|
Indicated
|
24,600,000
|
76
|
1.63
|
0.70
|
60.1
|
884.0
|
379.6
|
123.4
|
156
|
|
Inferred
|
745,000
|
82
|
1.79
|
0.61
|
2.0
|
29.4
|
10.0
|
3.9
|
164
|
||
|
100
*AgEq g/t
|
Sulfide
Out-of-Pit
|
Indicated
|
660,000
|
268
|
1.35
|
0.44
|
5.7
|
19.6
|
6.4
|
6.5
|
307
|
|
Inferred
|
900,000
|
179
|
2.14
|
0.42
|
5.2
|
42.4
|
8.3
|
7.4
|
257
|
||
|
Total:
|
Indicated
|
26,350,000
|
|
|
|
70.2
|
903.7
|
386.0
|
133.4
|
|
|
|
Inferred
|
1,670,000
|
|
|
|
7.2
|
71.8
|
18.4
|
11.4
|
|
||
Paca Deposit Pit-Constrained Mineral Resource Estimate –
Effective Date October 13, 2020**
|
Cut -off Grade
|
Zone
|
Category
|
Rounded Tonnes
|
Ag g/t
|
Zn %
|
Pb %
|
Ag Moz
|
Zn Mlbs
|
Pb Mlbs
|
*AgEq Moz
|
*AgEq g/t
|
|
50 Ag
g/t
|
Oxide
In-Pit
|
Indicated
|
1,095,000
|
185
|
|
|
6.5
|
|
|
|
|
|
Inferred
|
345,000
|
131
|
|
|
1.5
|
|
|
|
|
||
|
30
*AgEq g/t
|
Sulfide
In-Pit
|
Indicated
|
20,595,000
|
46
|
1.07
|
0.67
|
30.5
|
485.8
|
304.2
|
70.2
|
106
|
|
Inferred
|
3,050,000
|
46
|
0.76
|
0.65
|
4.5
|
51.1
|
43.7
|
9.2
|
94
|
||
|
Total:
|
Indicated
|
21,690,000
|
|
|
|
37
|
485.8
|
304.2
|
70.2
|
|
|
|
Inferred
|
3,395,000
|
|
|
|
6
|
51.1
|
43.7
|
9.2
|
|
||
**See detailed notes on the Mineral Resource Estimate parameters
under preceding Table titled “Pulacayo Project Mineral
Resource Estimate Summary of Total Contained Metal - Effective Date
October 13, 2020”
Pulacayo Deposit Sensitivity Analysis from October 13
th
, 2020 Mineral
Resource Estimate
The
sensitivity analysis is shown in the following tables showing
various pit-constrained grade-tonnage scenarios for the Pulacayo
deposit based on a range of cut-off grades for the sulphide and
oxide zones.
14
SILVER ELEPHANT MINING CORP.
Management’s Discussion and Analysis of Financial Condition
and Results of Operations
For the year ended December 31, 2020
(Expressed
in Canadian Dollars, except where indicated)
Pulacayo Deposit Pit-Constrained Cut-Off Grade Sensitivity Report
for Oxide Zone
|
Cut -off Grade
|
Category
|
Rounded Tonnes
|
Ag g/t
|
Zn %
|
Pb %
|
Ag Moz
|
Zn Mlbs
|
Pb Mlbs
|
*AgEq Moz
|
AgEq g/t
|
|
30 Ag
g/t
|
Indicated
|
1,760,000
|
92
|
|
|
5.2
|
|
|
|
|
|
Inferred
|
35,000
|
55
|
|
|
0.1
|
|
|
|
|
|
|
45 Ag
g/t
|
Indicated
|
1,220,000
|
116
|
|
|
4.6
|
|
|
|
|
|
Inferred
|
30,000
|
58
|
|
|
0.1
|
|
|
|
|
|
|
90 Ag
g/t
|
Indicated
|
615,000
|
171
|
|
|
3.4
|
|
|
|
|
|
Inferred
|
|
|
|
|
0
|
|
|
|
|
|
|
200 Ag
g/t
|
Indicated
|
185,000
|
250
|
|
|
1.5
|
|
|
|
|
|
Inferred
|
|
|
|
|
0
|
|
|
|
|
Note: Cut-off grade for pit-constrained oxide mineral resources is
50 g/t Ag.
Pulacayo Deposit Pit-Constrained Cut-Off Grade Sensitivity Report
for Sulfide Zone
|
Cut -off Grade
|
Category
|
Rounded Tonnes
|
Ag g/t
|
Zn %
|
Pb %
|
Ag Moz
|
|
Pb Mlbs
|
*AgEq Moz
|
AgEq g/t
|
|
30 AgEq g/t
|
Indicated
|
24,600,000
|
76
|
1.63
|
0.7
|
60.1
|
|
379.6
|
123.4
|
156
|
|
Inferred
|
745,000
|
82
|
1.79
|
0.61
|
2
|
29.4
|
10
|
3.9
|
164
|
|
|
45 AgEq
g/t
|
Indicated
|
23,715,000
|
78
|
1.67
|
0.72
|
59.5
|
|
376.4
|
122
|
160
|
|
Inferred
|
735,000
|
83
|
1.81
|
0.61
|
2
|
29.3
|
9.9
|
3.9
|
166
|
|
|
90 AgEq
g/t
|
Indicated
|
13,700,000
|
121
|
2.17
|
0.99
|
53.3
|
|
299
|
100
|
227
|
|
Inferred
|
290,000
|
154
|
3.62
|
0.97
|
1.4
|
23.1
|
6.2
|
2.9
|
312
|
|
|
200
AgEq g/t
|
Indicated
|
5,385,000
|
249
|
2.75
|
1.54
|
43.1
|
|
182.8
|
66.3
|
383
|
|
Inferred
|
180,000
|
230
|
4.57
|
1.22
|
1.3
|
18.1
|
4.8
|
2.5
|
426
|
|
|
400
AgEq g/t
|
Indicated
|
1,860,000
|
387
|
3.62
|
2.25
|
23.1
|
|
92.3
|
33.8
|
565
|
|
Inferred
|
105,000
|
297
|
5.29
|
1.46
|
1
|
12.2
|
3.4
|
1.8
|
521
|
Note: Mineral resource estimate cut-off grade
bolded
.
15
SILVER ELEPHANT MINING CORP.
Management’s Discussion and Analysis of Financial Condition
and Results of Operations
For the year ended December 31, 2020
(Expressed
in Canadian Dollars, except where indicated)
The
following table shows sensitivity analysis for the Pulacayo deposit
for out-of-pit grade tonnage scenarios:
Pulacayo Deposit Out-of-Pit Cut-Off Grade Sensitivity Report for
Sulfide Zone
|
Cut -off Grade
|
Category
|
Rounded Tonnes
|
Ag g/t
|
Zn %
|
Pb %
|
Ag Moz
|
Zn Mlbs
|
Pb Mlbs
|
*AgEq Moz
|
AgEq g/t
|
|
100 AgEq g/t
|
Indicated
|
660,000
|
268
|
1.35
|
0.44
|
5.7
|
19.6
|
6.4
|
6.5
|
307
|
|
Inferred
|
900,000
|
179
|
2.14
|
0.42
|
5.2
|
42.4
|
8.3
|
7.4
|
257
|
|
|
150
AgEq g/t
|
Indicated
|
530,000
|
321
|
1.3
|
0.49
|
5.5
|
15.2
|
5.7
|
6
|
354
|
|
Inferred
|
680,000
|
220
|
2.25
|
0.46
|
4.8
|
33.7
|
6.9
|
6.6
|
300
|
|
|
200
AgEq g/t
|
Indicated
|
435,000
|
359
|
1.41
|
0.53
|
5
|
13.5
|
5.1
|
5.5
|
394
|
|
Inferred
|
505,000
|
260
|
2.37
|
0.54
|
4.2
|
26.4
|
6
|
5.6
|
343
|
|
|
250
AgEq g/t
|
Indicated
|
350,000
|
397
|
1.53
|
0.59
|
4.5
|
11.8
|
4.6
|
4.9
|
435
|
|
Inferred
|
375,000
|
309
|
2.14
|
0.64
|
3.7
|
17.7
|
5.3
|
4.6
|
381
|
|
|
300 Ag
Eq g/t
|
Indicated
|
290,000
|
429
|
1.63
|
0.64
|
4
|
10.4
|
4.1
|
4.4
|
468
|
|
Inferred
|
310,000
|
327
|
2.23
|
0.72
|
3.3
|
15.2
|
4.9
|
4
|
403
|
|
|
350 Ag
Eq g/t
|
Indicated
|
230,000
|
462
|
1.74
|
0.7
|
3.4
|
8.8
|
3.5
|
3.7
|
504
|
|
Inferred
|
225,000
|
358
|
2.18
|
0.85
|
2.6
|
10.8
|
4.2
|
3.1
|
434
|
|
|
400 Ag
Eq g/t
|
Indicated
|
180,000
|
490
|
1.93
|
0.74
|
2.8
|
7.7
|
2.9
|
3.1
|
538
|
|
Inferred
|
165,000
|
384
|
2.01
|
0.99
|
2
|
7.3
|
3.6
|
2.4
|
455
|
Note: Mineral resource estimate cut-off grade
bolded.
Paca Deposit Sensitivity Analysis from October 13
th
, 2020
MRE
The
Paca deposit is located 7 kilometers north of the Pulacayo deposit.
Sensitivity analysis shown in the following two tables illustrates
various pit-constrained grade-tonnage scenarios at the Paca deposit
based on a range of cut-off grades.
Paca Deposit Pit-Constrained Cut-Off Grade Sensitivity Report for
Oxide Zone
|
Cut -off Grade
|
Category
|
Rounded Tonnes
|
Ag g/t
|
Zn %
|
Pb %
|
Ag Moz
|
Zn Mlbs
|
Pb Mlbs
|
*AgEq Moz
|
AgEq g/t
|
|
30 Ag
g/t
|
Indicated
|
1,805,000
|
128
|
|
|
7.4
|
|
|
|
|
|
Inferred
|
500,000
|
102
|
|
|
1.6
|
|
|
|
|
|
|
45 Ag
g/t
|
Indicated
|
1,225,000
|
170
|
|
|
6.7
|
|
|
|
|
|
Inferred
|
375,000
|
124
|
|
|
1.5
|
|
|
|
|
|
|
90 Ag
g/t
|
Indicated
|
800,000
|
231
|
|
|
5.9
|
|
|
|
|
|
Inferred
|
235,000
|
159
|
|
|
1.2
|
|
|
|
|
|
|
200 Ag
g/t
|
Indicated
|
420,000
|
311
|
|
|
4.2
|
|
|
|
|
|
Inferred
|
55,000
|
285
|
|
|
0.5
|
|
|
|
|
|
|
400 Ag
g/t
|
Indicated
|
80,000
|
493
|
|
|
1.3
|
|
|
|
|
|
Inferred
|
5,000
|
459
|
|
|
0.1
|
|
|
|
|
Note: Cut-off grade for pit-constrained oxide mineral resources is
50 g/t Ag.
16
SILVER ELEPHANT MINING CORP.
Management’s Discussion and Analysis of Financial Condition
and Results of Operations
For the year ended December 31, 2020
(Expressed
in Canadian Dollars, except where indicated)
Paca Deposit Pit-Constrained Cut-Off Grade Sensitivity Report for
Sulfide Zone
|
Cut -off Grade
|
Category
|
Rounded Tonnes
|
Ag g/t
|
Zn %
|
Pb %
|
Ag Moz
|
Zn Mlbs
|
Pb Mlbs
|
*AgEq Moz
|
AgEq g/t
|
|
30 AgEq g/t
|
Indicated
|
20,595,000
|
46
|
1.07
|
0.67
|
30.5
|
485.8
|
304.2
|
70.2
|
106
|
|
Inferred
|
3,050,000
|
46
|
0.76
|
0.65
|
4.5
|
51.1
|
43.7
|
9.2
|
94
|
|
|
45 AgEq
g/t
|
Indicated
|
19,315,000
|
48
|
1.11
|
0.69
|
29.8
|
472.7
|
293.8
|
68.3
|
110
|
|
Inferred
|
2,650,000
|
51
|
0.81
|
0.7
|
4.4
|
47.3
|
40.9
|
8.7
|
102
|
|
|
90 AgEq
g/t
|
Indicated
|
8,600,000
|
87
|
1.38
|
0.95
|
24.1
|
261.6
|
180.1
|
45.4
|
164
|
|
Inferred
|
950,000
|
114
|
0.94
|
0.95
|
3.5
|
19.7
|
19.9
|
5.2
|
171
|
|
|
200
AgEq g/t
|
Indicated
|
1,810,000
|
256
|
1.22
|
1.22
|
14.9
|
48.7
|
48.7
|
18.5
|
318
|
|
Inferred
|
190,000
|
338
|
0.61
|
0.98
|
2.1
|
2.6
|
4.1
|
2.2
|
360
|
|
|
400
AgEq g/t
|
Indicated
|
300,000
|
490
|
1.38
|
1.47
|
4.7
|
9.1
|
9.7
|
5.2
|
542
|
|
Inferred
|
50,000
|
545
|
0.39
|
0.82
|
0.9
|
0.4
|
0.9
|
0.9
|
530
|
Note: Mineral resource estimate cut-off grade
bolded
.
Recent Activities & Updates
2017
During
the year ended December 31, 2017, the Company updated mining
scenarios and budgets, negotiated to resolve legacy financial
obligations, and engaged in deliberations to obtain permission to
restart operations at the Pulacayo Project. The Company has worked
with government officials to obtain assurances that its investments
in exploration and its work toward a production profile at the
Pulacayo Project are financially safe and legally protected. Such
efforts included a meeting with
Bolivia’s Minister of Mining and Metallurgy,
César Navarro, and other mine operators in
Bolivia.
2018
During
the year ended December 31, 2018, the Company determined there were
several indicators of potential impairment of the carrying value of
the Pulacayo Project, including the shift at the time of the
Company’s primary focus to the Gibellini Project. While
management believed and continues to believe that the Pulacayo
Project is a property of merit and warrants continued development,
a write down in accordance with
IFRS 6 Exploration for and Evaluation of
Mineral Resources
and
IAS
36, Impairment of Assets
of $13,708,200 of previously
capitalized deferred exploration costs to $nil and an impairment
charge of $335,181 on the mining equipment at the Pulacayo Project
has been recognized. This non-cash accounting charge does not
impact the Company’s financial liquidity, or any future
operations and management believes the adjustment to the book value
of this long-lived asset more accurately reflects the
Company’s current market capitalization.
2019
In
September of 2019 the Company initiated its first drilling program
at the Paca deposit area. The program was completed in October of
2019 and consisted of 7 drill holes. The complete detailed
composited drill intersections of mineralization are tabulated in
the following table:
17
SILVER ELEPHANT MINING CORP.
Management’s Discussion and Analysis of Financial Condition
and Results of Operations
For the year ended December 31, 2020
(Expressed
in Canadian Dollars, except where indicated)
|
Hole
|
From(m)
|
To (m)
|
Length
|
Ag (g/t)
|
Zn %
|
Pb %
|
AgEq
|
|
(m)
|
|||||||
|
PND107
|
|||||||
|
Interval:
|
55
|
109
|
54
|
151
|
1.01
|
1.17
|
238
|
|
including …
|
70
|
77
|
7
|
178
|
0.97
|
1.37
|
271
|
|
and …
|
70
|
109
|
39
|
180
|
1.2
|
1.34
|
283
|
|
and …
|
87
|
109
|
22
|
240
|
1.23
|
1.65
|
355
|
|
PND108
|
|||||||
|
|
15
|
65
|
50
|
135
|
0.4
|
1.42
|
208
|
|
including …
|
33
|
57
|
24
|
200
|
0.6
|
2.12
|
307
|
|
and …
|
33
|
43
|
10
|
257
|
0.41
|
1.49
|
333
|
|
Interval:
|
94
|
96
|
2
|
160
|
0.94
|
0.52
|
220
|
|
PND109
|
|||||||
|
Interval:
|
15
|
43
|
28
|
242
|
0.27
|
0.69
|
281
|
|
including …
|
20
|
29
|
9
|
391
|
0.26
|
1.1
|
445
|
|
and …
|
24
|
26
|
2
|
1223
|
0.42
|
3.2
|
1365
|
|
and …
|
37
|
43
|
6
|
282
|
0.31
|
0.52
|
315
|
|
|
75
|
173
|
98
|
15
|
2.47
|
1.28
|
168
|
|
including …
|
93
|
94
|
1
|
167
|
3.64
|
1.24
|
367
|
|
PND110
|
|||||||
|
Interval:
|
9
|
182
|
173
|
95
|
1.63
|
1.4
|
273
|
|
including…
|
9
|
98
|
89
|
279
|
1.28
|
1.17
|
378
|
|
and…
|
9
|
28
|
19
|
718
|
0.05
|
0.74
|
749
|
|
and…
|
9
|
12
|
3
|
145
|
0.07
|
0.9
|
183
|
|
and…
|
16
|
28
|
12
|
1085
|
0.04
|
0.71
|
1115
|
|
and…
|
44
|
180
|
138
|
87
|
1.59
|
2.01
|
233
|
|
and…
|
44
|
46.5
|
2.5
|
111
|
0.61
|
1.09
|
179
|
|
and…
|
44
|
98
|
54
|
98
|
2.03
|
1.52
|
343
|
|
and…
|
52
|
54
|
2
|
115
|
1.61
|
1.33
|
234
|
|
and…
|
60
|
82
|
22
|
328
|
1.98
|
1.43
|
466
|
|
and…
|
61
|
65
|
4
|
1248
|
1.93
|
2.88
|
1441
|
|
and…
|
86
|
94
|
8
|
270
|
2.83
|
2.74
|
495
|
|
and…
|
97
|
98
|
1
|
155
|
3.26
|
3.03
|
409
|
|
PND111
|
|||||||
|
Interval:
|
0
|
2.4
|
2.4
|
110
|
0.16
|
0.58
|
139
|
|
PND112
|
|||||||
|
Interval:
|
12
|
28
|
16
|
154
|
0.08
|
0.39
|
173
|
|
including…
|
21
|
22
|
1
|
890
|
0.05
|
0.31
|
904
|
|
Interval:
|
33
|
36
|
3
|
120
|
0.07
|
2.4
|
216
|
|
Interval:
|
43
|
44.6
|
1.6
|
100
|
0.23
|
1.58
|
171
|
|
PND113
|
|||||||
|
Interval:
|
3
|
28
|
25
|
196
|
0.04
|
0.29
|
209
|
|
including…
|
3
|
17
|
14
|
185
|
0.04
|
0.38
|
202
|
|
and…
|
21
|
28
|
7
|
310
|
0.04
|
0.19
|
320
|
18
SILVER ELEPHANT MINING CORP.
Management’s Discussion and Analysis of Financial Condition
and Results of Operations
For the year ended December 31, 2020
(Expressed
in Canadian Dollars, except where indicated)
Reported
widths are intercepted core lengths and not true widths, as
relationships with intercepted structures and contacts vary. Based
on core-angle measurements, true widths are estimated at
approximately 77% of reported core lengths. Silver equivalents
reported are calculated above do not assume metallurgical
recoveries and were calculated using AgEg. (g/t) = Ag (g/t) % +
(Pb% *(US$0.94/lb. Pb /14.583 Troy oz./lb./US$16.50 per Troy oz.
Ag)*10,000) + (Zn% *(US$1.00/lb. Zn/14.583 Troy oz./lb./US$16.50
per Troy oz. Ag)*10,000). Metal prices used in this silver
equivalent calculation are US$16.50/Troy oz. Ag, US$0.94/lb. Pb and
US$1.00/lb. Zn.
During
the year ended December 31, 2019, the Company assessed whether
there was any indication that the previously recognized impairment
loss in connection with the Pulacayo Project may no longer exist or
may have decreased. The Company noted the following indications
that the impairment may no longer exist:
●
the Company signed
the Pulacayo MPC granting the Company the 100% exclusive right to
develop and mine at the Pulacayo Project;
●
the Company shifted
its exploration focus to develop the Pulacayo Project in the during
the year ended December 31, 2019;
●
the Company
re-initiated active exploration and drilling programs on the
Pulacayo Project; and
●
a tax dispute in
Bolivia was settled in the Company’s favour.
As the
Company identified these indications that the impairment may no
longer exist, the Company completed an assessment to determine the
recoverable amount of the Pulacayo Project. In order to estimate
the fair-value of the property the Company engaged a third-party
valuation consultant and also utilized level 3 inputs on the fair
value hierarchy to estimate the recoverable amount based on the
property’s fair value less costs of disposal determined with
reference to dollars per unit of metal in-situ. With reference to
metal in-situ, the Company applied US$0.79 per ounce of silver
resource to its 36.8 million ounces of silver resources and
US$0.0136 per pound of zinc or lead in resource to its 303 million
pounds of zinc and lead. The Company also considered data derived
from properties similar to the Pulacayo Project. This data
consisted of property transactions and market valuations of
companies holding comparable properties, adjusted to reflect the
possible impact of factors such as location, political
jurisdiction, commodity, geology, mineralization, stage of
exploration, resources, infrastructure and property
size.
As the
recoverable amount estimated with respect to the above was $31.4
million, an impairment recovery of $13,708,200 was recorded during
the year ended December 31, 2019.
2020
Drilling
that began at the Pulacayo deposit in December of 2019 was
completed in February of 2020. The Company announced its first set
of results on January 21, 2020, from borehole PUD 267 which
intercepted 10 meters of mineralization grading 147 g/t silver,
9.8% zinc, and 2.0% lead (539 g/t AgEq) within 35.5 meter
mineralization grading 230 g/t AgEq starting 31.5 meters
downhole.
19
SILVER ELEPHANT MINING CORP.
Management’s Discussion and Analysis of Financial Condition
and Results of Operations
For the year ended December 31, 2020
(Expressed
in Canadian Dollars, except where indicated)
On
March 6, 2020, the Company released additional results from its
first 2,598 meters of drilling, which focused on the western
portion of the Pulacayo Project and on August 11, 2020, the Company
announced further diamond infill drilling results from the Pulacayo
Project. Complete results of all first phase 2020 drilling are
tabulated below:
|
Hole ID
|
From (m)
|
To (m)
|
Interval (m)
|
Ag (g/t)
|
Zn (%)
|
Pb (%)
|
AgEq
|
|
PUD267*
|
31.5
|
67
|
35.5
|
54.3
|
4.31
|
0.92
|
229.6
|
|
including…
|
117
|
123
|
6
|
47.8
|
1.11
|
0.25
|
89.7
|
|
PUD268
|
21
|
23
|
2
|
20
|
1.34
|
0.77
|
92.6
|
|
PUD274
|
75
|
77
|
2
|
93.5
|
|
0.42
|
98.8
|
|
PUD274
|
82
|
83
|
1
|
83
|
|
0.09
|
77.4
|
|
PUD283
|
248
|
350
|
102
|
145
|
2.56
|
1.05
|
255
|
|
including..
|
248
|
282
|
34
|
9
|
1.05
|
0.22
|
52
|
|
and…
|
282
|
297
|
15
|
35
|
2.99
|
0.4
|
148
|
|
and…
|
297
|
310
|
13
|
157
|
5.15
|
1.47
|
370
|
|
and…
|
310
|
317
|
7
|
225
|
3.74
|
1.15
|
371
|
|
and…
|
317
|
322
|
5
|
1565
|
3.85
|
8.25
|
1825
|
|
and…
|
322
|
329
|
7
|
134
|
1.73
|
1.18
|
222
|
|
and…
|
329
|
350
|
21
|
76
|
2.65
|
0.82
|
188
|
|
PUD284
|
30.5
|
204.2
|
173.7
|
15
|
0.67
|
0.28
|
46
|
|
including…
|
30.5
|
55
|
24.5
|
3
|
2.45
|
0.1
|
20
|
|
and…
|
55
|
65
|
10
|
113
|
2.11
|
1.93
|
243
|
|
and…
|
65
|
79
|
14
|
13
|
1.2
|
0.44
|
69
|
|
and…
|
79
|
101
|
22
|
4
|
0.36
|
0.11
|
20
|
|
and…
|
101
|
204.2
|
103.2
|
10
|
0.59
|
0.18
|
36
|
|
PUD284
|
206.3
|
273
|
66.7
|
112
|
1.94
|
0.46
|
182
|
|
Interval:
|
206.3
|
240
|
33.7
|
46
|
2.12
|
0.41
|
129
|
|
Interval:
|
240
|
256
|
16
|
79
|
2.7
|
0.72
|
189
|
|
Interval:
|
256
|
273
|
17
|
274
|
1.13
|
0.33
|
295
|
|
PUD284
|
282
|
318
|
36
|
26
|
1.01
|
0.34
|
70
|
|
including…
|
282
|
288
|
6
|
13
|
0.94
|
0.27
|
54
|
|
and…
|
288
|
300
|
12
|
60
|
1.48
|
0.61
|
127
|
|
and…
|
300
|
318
|
18
|
7
|
0.72
|
0.18
|
38
|
Reported
widths are intercepted core lengths and not true widths, as
relationships with intercepted structures and contacts vary. Based
on core-angle measurements, true widths are estimated at
approximately 61% of reported core lengths. Silver equivalent is
calculated as follows: Ag Eq. (g/t) = Ag (g/t)*89.2% + (Pb%
*(US$0.94/ lb. Pb /14.583 Troy oz/lb./US$16.50 per Troy oz.
Ag)*10,000*91.9%) + (Zn% *(US$1.00/lb. Zn/14.583 Troy
oz/lb./US$16.50 per Troy oz. Ag)*10,000*82.9). This calculation
incorporates metallurgical recoveries from test work completed for
Pulacayo in 2013 by Universidad Tecnica de Oruro (UTO), in Oruro
and La Paz, Bolivia as well as at Maelgwyn Mineral Services Africa
(MMSA) in Roodeporrt, South Africa.
The
Company adopts industry recognized best practices in its
implementation of QA/QC methods. A geochemical standard control
sample and one blank sample is inserted into the sample stream
every 20th sample. Duplicates are taken at every 40th sample.
Standards and duplicates including lab duplicates and standards and
are analyzed using Thompson-Howarth plots. Samples are shipped to
ALS Global Laboratories in Ururo, Bolivia for preparation, and then
shipped to ALS Global laboratories for analysis in Lima, Peru.
Samples were analyzed using intermediate level four acid digestion.
Silver overlimits are analyzed using fire assay with a gravimetric
finish. ALS Laboratories sample management system meets all
requirements of International Standards ISO/IEC 17025:2017 and ISO
9001:2015. All ALS geochemical hub laboratories are accredited to
ISO/IEC 17025:2017 for specific analytical procedures.
20
SILVER ELEPHANT MINING CORP.
Management’s Discussion and Analysis of Financial Condition
and Results of Operations
For the year ended December 31, 2020
(Expressed
in Canadian Dollars, except where indicated)
All
samples are taken from HQ-diameter core which split in half by a
diamond-blade masonry saw. One-half of the core is submitted for
laboratory analysis and the other half is preserved on the
Company’s secured core facility for reference. All core is
geotechnically analyzed, photographed and then logged by geologists
prior to sampling.
On
November 30, 2020, the Company announced that
further to the news
release dated October 14, 2020, it has received the complete assay
results from the Company’s diamond drill program at the Paca
deposit. All 5 drill holes intersected mineralization, with the
results shown in the following table:
|
Hole ID
|
From
|
To
|
Length (m)
|
Ag g/t
|
Zn %
|
Pb %
|
AgEq*
|
|
PND114
|
1.5
|
18.0
|
16.5
|
43
|
0.11
|
0.36
|
55
|
|
PND115
|
3.0
|
69.0
|
66.0
|
48
|
0.10
|
0.80
|
75
|
|
PND116
|
7.0
|
37.0
|
30.0
|
23
|
0.15
|
0.42
|
41
|
|
PND117
|
51.0
|
82.0
|
31.0
|
3
|
0.45
|
0.31
|
31
|
|
PND118
|
18.0
|
38.0
|
20.0
|
25
|
0.09
|
0.09
|
29
|
|
PND118
|
67.0
|
179.0
|
112.0
|
15
|
0.50
|
0.48
|
50
|
|
including…
|
133.0
|
143.0
|
10.0
|
61
|
0.65
|
0.37
|
93
|
(*) Silver equivalent (“AgEq”) calculation is based on
NI43-101 compliant 2020 resource report completed for the Paca
deposit by Mercator Geological Services (see Company’s press
release dated October 13
th
,
2020). Silver equivalent is calculated as follows: Ag Eq. = Silver
Equivalent (Recovered) = (Ag g/t*89.2%)+((Pb%*(US$0.95/lb.
Pb/14.583 Troy oz./lb./US$17 per Troy oz.
Ag)*(10,000*91.9%))+((Zn%*(US$1.16/lb. Zn/14.583 Troy oz./lb./US$17
per Troy oz. Ag)*(10,000*82.9%)) and assumed metallurgical
recoveries. Metal prices of US$17/oz Ag, US$0.95/lb Pb, and
US$1.16/lb Zn apply.
Reported widths are intercepted core lengths and not true widths,
as relationships with intercepted structures and contacts vary.
Based on core-angle measurements, true widths range from 77% to 86%
of the reported core length.
PND 114, 115, 118 drilled tested oblique structures parallel to the
main east-west trend and discovered new mineralized
zones.
PND 114 intersected 16.5 meters of mineralization grading 55g/t
silver equivalent that is to the north of the Paca north
zone.
PND 115 intercepted 66 meters of mineralization grading 75g/t
silver equivalent between Paca main zone and Paca north zone, which
are 250 meters apart.
PND 118 was drilled at the eastern edge of the Paca main zone and
intersected 112 meters of mineralization grading 50 g/t silver
equivalent.
The Company is integrating the drill results to the recently
completed geomodelling.
Commencement of next round of Paca drilling is
tentatively scheduled for the first half of
2021.
In March 2020 the Company further announced that it had commenced
district exploration program at its Pulacayo project. The Company
would be conducting geological mapping, with relevant sampling and
possible trenching on the property. Induced polarization geophysics
would also be conducted in tandem with the field program, with 106
line-kilometers of survey having been outlined.
In July 2020, the Company announced results of rock chip samples
taken from the San Leon underground tunnel. This geological
sampling and mapping program are part of an ongoing district
exploration program announced on March 9, 2020, at the
Company’s Pulacayo Silver Project in Bolivia. A total of 113
chip samples were collected at intervals of from 0.85 to 3.0 meters
to better characterize the geology and alteration of the San Leon
tunnel, which continues for 3km to the south of the mapping area,
passing through the Company’s existing NI43-101 Pulacayo
resource and connects to the town of Pulacayo. The tunnel also
extends to the north for 1 km where historically the Pulacayo
mine’s ore was carted for smelting during the 1800’s.
Sample results are tabulated below:
21
SILVER ELEPHANT MINING CORP.
Management’s Discussion and Analysis of Financial Condition
and Results of Operations
For the year ended December 31, 2020
(Expressed
in Canadian Dollars, except where indicated)
|
Sample ID
|
TYPE
|
Azimuth
|
WIDTH (m)
|
Ag ppm
|
Pb %
|
Zn %
|
Ag Eq. ppm
|
Structure
|
DIP_DIR
|
DIP
|
|
3879
|
Chip
|
350
|
1.5
|
400
|
0.876
|
0.929
|
420
|
Breccia
|
20
|
80
|
|
3883
|
Chip
|
350
|
0.9
|
77
|
0.342
|
0.287
|
91
|
Fault
|
0
|
72
|
|
3881
|
Chip
|
7
|
1.8
|
25
|
0.137
|
0.127
|
32
|
Contact
|
345
|
78
|
|
3878
|
Chip
|
13
|
0.9
|
5
|
0.306
|
0.399
|
29
|
Veinlets
|
0
|
85
|
|
3882
|
Chip
|
338
|
1.8
|
17
|
0.18
|
0.074
|
24
|
Veinlets
|
350
|
65
|
|
3880
|
Chip
|
5
|
1.9
|
6
|
0.132
|
0.102
|
14
|
Veinlets
|
345
|
65
|
Mapping identified a vein system trending in a roughly east-west
direction at the Pacamayo zone (“Veta Pacamayo”). The
vein system measures approximately 175 meters in width south to
north in the tunnel and is situated 1.3 kilometers north of the
Pulacayo resource and 5km south of Paca resource. Highlights of the
tunnel chip samples taken in Veta Pacamayo include 420g/t AgEq*
over 1.5 meters and 91g/t AgEq over 0.9 meters.
The Pulacayo Tajo vein system (Veta Pulacayo) that hosts the
Company’s indicated silver resource of 30.4 million oz @
455g/t and inferred resource of 6.3 million oz at 406 g/t likewise
trends roughly east-west, indicating that the Veta Pacamayo
represents a parallel system that has seen very little exploration
to date.
Geological mapping also identified a transition in the intensity of
alteration (argillic-style) along the San Leon tunnel. Highest
intensity alteration occurs in the Veta Pulacayo, and Veta Pacamayo
areas and coincides with the highest observed chip sample silver
values.
(*) Silver equivalent is calculated as follows: Ag Eq.(g/t) = Ag
(g/t)*89.2%+(Pb% *(US$0.94/ lb. Pb /14.583 Troy oz/lb./US$16.50 per
Troy oz. Ag)*10,000*91.9%) + (Zn% *(US$1.00/lb. Zn/14.583 Troy
oz/lb./US$16.50 per Troy oz. Ag)*10,000*82.9). This calculation
incorporates metallurgical recoveries from test work completed for
the Pulacayo project in 2013.
In September 2020 geological mapping was conducted in the Pero area
of the Pulacayo Project. Pero is located to the southeast of the
Tajo Vein system that hosts the Pulacayo deposit. Geological
mapping and surface sampling identified an area of silver bearing
surface mineralization of up to 200 g/t silver several hundreds of
meters south of the projected east-west Tajo Vein system trend,
suggesting that the Tajo Vein system was offset southward in this
portion of the system where strong alteration can be observed at
surface covering 250 meters by 100 meters wide. This reinterpreted
surface projection of the Tajo Vein system coincides with some
historic Spanish workings in that area of property that date back
to the 16th Century. Highlights of assay results from recent
surface samples at Pero are tabulated below:
|
Sample ID
|
Type
|
Azimuth
|
Width (m)
|
Ag (g/t)
|
Zn%
|
Pb%
|
|
1313
|
Chip
|
210
|
3
|
200
|
0.1
|
0.1
|
|
1314
|
Chip
|
195
|
1.2
|
200
|
0.1
|
0.01
|
|
1295
|
Chip
|
340
|
3
|
164
|
0.0164
|
0.0164
|
|
1297
|
Chip
|
320
|
1.4
|
132
|
0.0132
|
0.0132
|
|
1315
|
Chip
|
200
|
2.9
|
100
|
0.01
|
0.01
|
|
1301
|
Chip
|
240
|
4
|
72
|
0.0072
|
0.0072
|
|
1303
|
Chip
|
200
|
6.4
|
67
|
0.0067
|
0.0067
|
|
1323
|
Chip
|
20
|
4
|
50
|
0.005
|
0.005
|
|
1304
|
Chip
|
150
|
3.7
|
46
|
0.0046
|
0.0046
|
22
SILVER ELEPHANT MINING CORP.
Management’s Discussion and Analysis of Financial Condition
and Results of Operations
For the year ended December 31, 2020
(Expressed
in Canadian Dollars, except where indicated)
In December 2020 the Company commenced a 940 meter diamond drilling
program at the Pero target within its Pulacayo Project in Bolivia.
Pero is located at the easternmost portion of the Pulacayo deposit
and is the least understood area geologically. Field work in 2020
identified potential structural remobilization in this area that
might explain the erratic nature of mineralization within the Tajo
Vein System as it occurs in this area of the property. A summary of
results from this drilling is tabulated below:
|
BHID
|
From
(m)
|
To
(m)
|
Length
(m)
|
Ag
(g/t)
|
Pb
%
|
Zn
%
|
AgEq*
(g/t)
|
|
PUD285
|
30.6
|
44.6
|
14.0
|
43
|
0.19
|
0.02
|
46
|
|
PUD
285
|
143.0
|
191.0
|
48.0
|
10
|
0.11
|
0.17
|
23
|
|
PUD
286
|
99.0
|
124.0
|
25.0
|
18
|
0.33
|
0.09
|
32
|
|
PUD
286
|
148.0
|
152.0
|
4.0
|
393
|
3.79
|
0.88
|
518
|
|
PUD
286
|
174.0
|
183.0
|
9.0
|
20
|
0.13
|
0.05
|
25
|
|
PUD
287
|
56.0
|
78.0
|
22.0
|
43
|
0.23
|
0.02
|
48
|
|
PUD
287
|
127.0
|
139.0
|
12.0
|
15
|
0.01
|
0.01
|
15
|
*Ag Eq. = Silver Equivalent (Recovered) = (Ag
g/t*89.2%)+((Pb%*(US$0.95/lb. Pb/14.583 Troy oz./lb./US$17 per Troy
oz. Ag)*(10,000*91.9%))+((Zn%*(US$1.16/lb. Zn/14.583 Troy
oz./lb./US$17 per Troy oz. Ag)*(10,000*82.9%)). Sulphide zone metal
recoveries of 89.2% for Ag, 91.9% for Pb, and 82.9% for Zn were
used in the Silver Equivalent (Recovered) equation and reflect
metallurgical testing results disclosed previously for the Pulacayo
Deposit. Reported widths are intercepted core lengths and not true
widths, as relationships with intercepted structures and contacts
vary. Based on core-angle measurements, true widths range from 75%
to 85% of the reported core length.
During
the year ended December 31, 2020, the Company incurred total costs
of $2,357,534 (2019 - $1,474,026; 2018 - $898,650) for the Pulacayo
Project including $1,767,089 (2019 - $964,716; 2018 - $51,112) for
geological and engineering services, $584,712 (2019 - $503,071;
2018 - $847,538) for personnel, legal, general and administrative
expenses and $5,733 (2019 - $6,239, 2018 - $Nil) for fees and
permits.
The
Company also reports that the national COVID-19 quarantine in
Bolivia was lifted in late-June of 2020. The Company has resumed
its work schedule and commenced an exploration program at the
Pulacayo Project consisting of geological mapping of the property.
Work will continue as planned; however the Company will follow the
guidance of federal and local authorities in Bolivia with regards
to COVID-19.
2021 Outlook
The
Company’s 2021 Pulacayo objectives are:
●
Complete
district geological mapping over entire property
●
Complete
induced polarization (geophysics) survey over the entire
property
●
Evaluate
field data to generate drilling targets over property
●
Commence
diamond drilling program testing priority targets on
property
23
SILVER ELEPHANT MINING CORP.
Management’s Discussion and Analysis of Financial Condition
and Results of Operations
For the year ended December 31, 2020
(Expressed
in Canadian Dollars, except where indicated)
Sunawayo Project, Bolivia
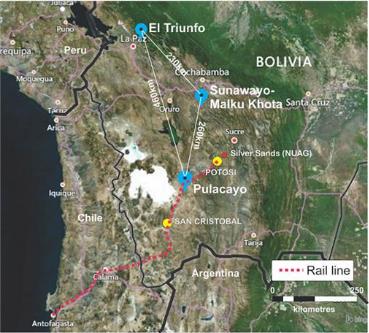
|
On
September 8, 2020, the Company announced that it has entered into
the Sunawayo SPA, a binding sales and purchase agreement with the
Sunawayo Vendor to acquire the Sunawayo Project, a silver-lead
mining project located immediately adjacent to the Malku Khota
silver project in Bolivia.
The
Sunawayo Project is patented land which the Company has secured
rights to explore through the Sunawayo SPA, whereas Malku Khota is
unpatented land administered by COMIBOL. In January of 2020, the
Company applied for a mining production contract with COMIBOL that
would give it the rights to mine and explore Malku Khota. The
application was received by COMIBOL and is currently under review.
While the Company is engaging with COMIBOL to advance this process,
the Company has not been provided with any timelines for any
eventual approval.
|
The
purchase agreement of the Sunawayo Project includes a fully
permitted 100 ton-per-day open-pit mining operation that produces
lead concentrate. The Sunawayo Project has a strike of 17
kilometers which covers 59.5 square kilometers of prospective area.
The Sunawayo Project has ready access to water and power and is
located 165 kilometers by road from Bolivia’s 5th largest
city, Oruro.
Forty-eight
samples, spanning 11 kilometers, were taken at the Sunawayo
Project, where visible mineralization were observed during a recent
site visit conducted in August 2020 by Company geologists who
collected the samples during their visit.
Four
priority targets were identified during this site visit: Caballo
Uma, Pujiuni, Mine Area, and Malku Khota border.
|
Sample
ID
|
Area
|
Type
|
Ag
(g/t)
|
Pb
%
|
Zn
%
|
AgEq
(g/t)
|
|
93323
|
Caballo
Uma
|
CHIP
|
397
|
2.63
|
0.67
|
475
|
|
93329
|
Caballo
Uma
|
CHIP
|
293
|
4.26
|
2.04
|
448
|
|
93327
|
Caballo
Uma
|
GRAB
|
289
|
1.92
|
0.44
|
344
|
|
93324
|
Caballo
Uma
|
GRAB
|
288
|
0.27
|
0.01
|
294
|
|
93303
|
Caballo
Uma
|
CHIP
|
169
|
12.55
|
0.26
|
452
|
|
93321
|
Caballo
Uma
|
GRAB
|
158
|
20
|
0.01
|
597
|
|
93337
|
Pijiuni
|
CHIP
|
477
|
>20
|
0.02
|
916
|
|
93334
|
Pijiuni
|
CHIP
|
37
|
4.28
|
0.03
|
132
|
|
93336
|
Pijiuni
|
CHIP
|
35
|
0.59
|
0.13
|
52
|
|
93347
|
Mine
Area
|
GRAB
|
3
|
>20
|
0.01
|
442
|
|
93346
|
Mine
Area
|
GRAB
|
1
|
14.2
|
0.25
|
320
|
|
93310
|
MK
Border
|
GRAB
|
8
|
0.05
|
0.17
|
14
|
|
93309
|
MK
Border
|
GRAB
|
8
|
0.01
|
0.1
|
11
|
24
SILVER ELEPHANT MINING CORP.
Management’s Discussion and Analysis of Financial Condition
and Results of Operations
For the year ended December 31, 2020
(Expressed
in Canadian Dollars, except where indicated)
Silver
equivalent calculation uses a silver price of $25.00/oz, a zinc
price of $1.10/lb., a lead price of $0.80/lb. (all USD), and
assumes a 100% metallurgical recovery. Silver equivalent values can
be calculated using the following formula: AgEq = Ag g/t + (Zn % x
30.1644 ) + (Pb % x 21.9377). Samples indicating >20% Pb are
calculated using 20% Pb
2021
The
Company commenced the maiden drilling program for the Sunawayo
project in January 2021. The first 2 drillhole results were
received in February 2021, and announced on February 24th, 2021.
The first drill hole intercepted 137 meters of mineralization
grading 36 g/t silver, starting from 0 meters-depth. The second
drill hole intercepted 31 meters of mineralization grading 44 g/t
silver, 0.39% lead, and 0.48% zinc from 1 meter-depth. Both SWD001
and SWD002 (240 meters to the southeast of the former) feature
near-uniform silver assays throughout the reported intervals.
Composited results for SWD001 and SWD002 are tabulated
below:
|
Hole ID
|
From
|
To
|
Length (m)
|
Ag (g/t)
|
Pb %
|
Zn %
|
AgEq* (g/t)
|
|
SWD001
|
0.0
|
137.0
|
137.0
|
36
|
0.12
|
0.02
|
39
|
|
SWD002
|
1.0
|
32.0
|
31.0
|
44
|
0.39
|
0.48
|
67
|
|
incl…
|
21.0
|
30.0
|
9.0
|
48
|
0.73
|
1.57
|
112
|
Reported
widths are intercepted core lengths and not true widths, as
relationships with intercepted structures and contacts vary. Based
on core-angle measurements, true widths range from 80% to 85% of
reported core length. (*)Silver equivalent calculation uses a
silver price of $25.00/oz, a zinc price of $1.10/lb., and a lead
price of $0.80/lb. (all USD) and assumes a 100% metallurgical
recovery. Silver equivalent values can be calculated using the
following formula: AgEq = Ag g/t + (Zn % x 30.1644 ) + (Pb % x
21.9377).
These 2
holes were the first results from 15 planned
drillholes.
Summary of the Acquisition of the Sunawayo Project
Subject
to the provisions of the Sunawayo SPA, the Sunawayo Vendor agreed
to transfer the mining rights of the Sunawayo Project to the
Company upon the Company paying it US$6,500,000. That payment
consists of US$300,000 that was paid to the Sunawayo Vendor upon
execution of the Sunawayo SPA with the remaining US$6,200,000 to be
paid in cash over a one-year period in twelve equal monthly
installments, starting March 1, 2021.
As with
the Pulacayo Project, the Company’s objectives for the
remainder of 2020 and 2021 are to identify exploration targets and
to test those targets that meet the criteria for drilling with an
aim to make new discoveries. More specifically, the Company’s
goal is to explore near the southeast border of the Sunawayo
Project, in and around the existing open pit mine, and along the 8
kilometer Malku Khota lithological trend within sandstone units.
The Company anticipates it will take three to four months to
achieve this goal. The Company will continue to simultaneously
advance a mining production contract application with COMIBOL for
the rights to mine and explore the adjacent Malku Khota project.
This application process is anticipated to last six to twelve
months.
During
the year ended December 31, 2020, the Company incurred total costs
of $513,088 (2019 -$Nil; 2018 - $Nil) for the Sunawayo Project
including for $116,152 (2019 - $Nil; 2018 - $Nil) for geological
and engineering services and $396,936 of acquisition
cost.
The
Company’s 2021 Sunawayo objectives are:
●
Complete maiden
drilling program on property;
●
Complete due
diligence evaluation by March, 2021;
●
Complete induced
polarization (geophysics) south portion of property;
●
Continue geological
and structural mapping;
●
Evaluate field data
for additional target generation;
●
Commence
2
nd
drill
campaign on property testing targets generated from field
work
25
SILVER ELEPHANT MINING CORP.
Management’s Discussion and Analysis of Financial Condition
and Results of Operations
For the year ended December 31, 2020
(Expressed
in Canadian Dollars, except where indicated)
Triunfo Project, Bolivia
On July
13, 2020 the Company executed the Triunfo
Agreement with the Triunfo Vendor.
The Triunfo Agreement provides the Company with the Triunfo Rights
(consisting of the Exploration Right and the Purchase Right) with
respect to the Triunfo Project. The Purchase Right can be exercised
at any time after the Triunfo Vendor completes the required
Bolivian administrative procedures for the Triunfo Project
(expected to occur no later than March 2021) until July 13, 2025,
or such further period as the parties may agree. To secure the
Triunfo Rights, the Company paid the Triunfo Vendor US$100,000 upon
execution of the Triunfo Agreement. Until the Company exercises its
Purchase Right, beginning in 2021 the Company must pay the Triunfo
Vendor US$50,000 on June 15 of each year to maintain the Triunfo
Rights. The Company may elect to terminate the Triunfo Agreement at
any time. If the Company exercises the Purchase Right, the Triunfo
Vendor will maintain the Residual Interest. Upon exercise of the
Purchase Right, the Company may make a lump sum payment to the
Triunfo Vendor at any time to reduce some or all of the Residual
Interest as follows:
●
the Residual
Interest may be extinguished for US$300,000;
●
the Residual
Interest may be reduced to 4% for US$250,000;
●
the Residual
Interest may be reduced to 3% for US$200,000;
●
the Residual
Interest may be reduced to 2% for US$150,000; or
●
the Residual
Interest may be reduced to 1% for US$100,000.
Triunfo Project Summary
The
Triunfo Project area covers approximately 256 hectares located in
the La Paz Department, which is located about 75 kilometers to the
east of the city of La Paz, Bolivia. The Triunfo Project has access
to power and water and is accessible by road year-round. The
Triunfo Vendor maintains a positive relationship with the local
community. Exploration was conducted in 2005 through 2007 by
Solitario Resources, which made 3 drill holes, all of which
intercepted mineralization. Only 20% of the Triunfo Project was
explored by Solitario.
The
mineralization is characterized by pyrite, arsenopyrite, galena,
and sphalerite and carries gold, silver, and zinc and lead in
various proportions. Mineralization outcrops at the surface and
continues for at least 750 meters in three discrete blocks, known
as A, B, and C. The mineralized blocks have widths varying from 20
meters to 150 meters and are locally displaced for several meters
by north-east trending faults.
In the
past decade, some artisanal mining has been developed where gold
mineralization has been identified. Those areas have been
principally mined for gold.
The
Triunfo Project contains polymetallic vein-style mineralization
hosted in metasediments of the Silurian and Devonian periods. The
metasediments were intruded by nearby plutonic batholiths which are
likely related to the mineralizing event. This style of
mineralization is well documented in Bolivia. Examples include
Cerro Rico and Porco, located in and around Potosi.
Several
dozen chip samples were taken from the surface and tunnels at
Triunfo in late-May 2020. The sampling returned significant results
from both blocks.
The
following table shows the assay results, equal to and over 1.0 g/t
Au Equivalent which represent over 36% of the samples (37 /
103).
26
SILVER ELEPHANT MINING CORP.
Management’s Discussion and Analysis of Financial Condition
and Results of Operations
For the year ended December 31, 2020
(Expressed
in Canadian Dollars, except where indicated)
El Triunfo Chip Channel Results Returning 1g/t AuEq* or
greater
|
ID
|
BLOCK
|
Type
|
WIDTH
|
Au
|
Ag
|
Pb
|
Zn
|
AuEq
|
AgEq
|
|
(m)
|
(g/t)
|
(g/t)
|
(%)
|
(%)
|
(g/t)
|
(g/t)
|
|||
|
46506
|
A
|
chip
channel
|
3.9
|
2
|
113
|
3.46
|
0.12
|
8
|
814
|
|
46505
|
A
|
chip
channel
|
2
|
4
|
29
|
1.34
|
0.06
|
8
|
806
|
|
46504
|
A
|
chip
channel
|
2.1
|
1
|
69
|
2.52
|
1.82
|
6
|
547
|
|
46503
|
A
|
chip
channel
|
2.2
|
1
|
64
|
1.93
|
0.13
|
5
|
465
|
|
46502
|
A
|
chip
channel
|
3.8
|
1
|
55
|
2.34
|
1.08
|
4
|
415
|
|
46501
|
A
|
chip
channel
|
2.3
|
0
|
75
|
2.61
|
1.29
|
4
|
406
|
|
46299
|
A
|
chip
channel
|
2.8
|
2
|
25
|
0
|
0.02
|
4
|
385
|
|
46298
|
A
|
chip
channel
|
2.3
|
1
|
35
|
1.42
|
1.76
|
4
|
366
|
|
46297
|
A
|
chip
channel
|
2
|
2
|
40
|
0
|
0.01
|
4
|
358
|
|
46296
|
A
|
chip
channel
|
2.4
|
1
|
96
|
0
|
0.01
|
3
|
304
|
|
46295
|
A
|
chip
channel
|
2.1
|
2
|
6
|
0
|
0
|
3
|
293
|
|
46294
|
A
|
chip
channel
|
3
|
0
|
46
|
2.88
|
0.14
|
3
|
289
|
|
46293
|
A
|
chip
channel
|
1.3
|
1
|
15
|
0.34
|
0.03
|
3
|
284
|
|
46292
|
A
|
chip
channel
|
2.6
|
1
|
75
|
0
|
0.04
|
3
|
270
|
|
46291
|
A
|
chip
channel
|
2
|
0
|
42
|
1.88
|
0.45
|
3
|
265
|
|
46290
|
A
|
chip
channel
|
2
|
0
|
47
|
1.76
|
0.1
|
3
|
251
|
|
46289
|
A
|
chip
channel
|
1
|
1
|
31
|
0.54
|
0.02
|
2
|
238
|
|
46288
|
A
|
chip
channel
|
1.7
|
0
|
20
|
0.53
|
2.23
|
2
|
218
|
|
46287
|
A
|
chip
channel
|
1
|
1
|
30
|
0.35
|
0.11
|
2
|
210
|
|
46286
|
A
|
chip
channel
|
3.4
|
1
|
14
|
0
|
0
|
2
|
209
|
|
46285
|
A
|
chip
channel
|
3
|
1
|
5
|
0
|
0
|
2
|
207
|
|
46284
|
A
|
chip
channel
|
2
|
0
|
25
|
1.02
|
0.37
|
2
|
206
|
|
46283
|
A
|
chip
channel
|
2.2
|
1
|
6
|
0
|
0
|
2
|
178
|
|
46282
|
A
|
chip
channel
|
1.3
|
1
|
2
|
0
|
0
|
2
|
175
|
|
46281
|
A
|
chip
channel
|
1.5
|
0
|
42
|
0
|
0.01
|
2
|
168
|
|
46279
|
A
|
chip
channel
|
2.4
|
1
|
14
|
0
|
0
|
2
|
164
|
|
46278
|
A
|
chip
channel
|
2
|
0
|
17
|
0.59
|
0.41
|
2
|
151
|
|
46277
|
A
|
chip
channel
|
2.1
|
1
|
26
|
0
|
0
|
2
|
149
|
|
46276
|
A
|
chip
channel
|
2
|
0
|
16
|
0.54
|
0.23
|
1
|
126
|
|
46275
|
A
|
chip
channel
|
2
|
0
|
6
|
0.25
|
0.23
|
1
|
126
|
|
46274
|
A
|
chip
channel
|
4
|
1
|
2
|
0
|
0
|
1
|
118
|
|
46273
|
A
|
chip
channel
|
2.3
|
1
|
4
|
0
|
0
|
1
|
114
|
|
46272
|
A
|
chip
channel
|
2.9
|
1
|
4
|
0
|
0.01
|
1
|
109
|
|
46271
|
A
|
chip
channel
|
2
|
0
|
11
|
0.3
|
0.36
|
1
|
102
|
|
46270
|
A
|
chip
channel
|
2.4
|
0
|
9
|
0.02
|
0.02
|
1
|
97
|
|
46269
|
A
|
chip
channel
|
2.5
|
0
|
23
|
0.25
|
0.46
|
1
|
95
|
27
SILVER ELEPHANT MINING CORP.
Management’s Discussion and Analysis of Financial Condition
and Results of Operations
For the year ended December 31, 2020
(Expressed
in Canadian Dollars, except where indicated)
(*)
Gold equivalent calculation uses a gold price of $1,795, a zinc
price of $0.93, a lead price of $0.80, and a silver price of $18.30
(all USD), and assumes a 100% metallurgical recovery. Gold
equivalent values can be calculated using the following formula:
AuEq = Au g/t + (Ag g/t x 0.0102) + (Zn % x 0.3551) + (Pb % x
0.3055). Silver equivalent calculation uses a silver price of
$25.00/oz, a zinc price of $1.10/lb., a lead price of $0.80/lb.
(all USD), and assumes a 100% metallurgical recovery. Silver
equivalent values can be calculated using the following formula:
AgEq = Ag g/t + (Zn % x 30.1644 ) + (Pb % x 21.9377).
Denser
sets of veins and veinlets hosted by shales and quartzites appear
to correlate with higher grades. The strike lengths of these
mineralized trends have been recognized as continuing along several
hundreds of meters at surface.
As with
the Pulacayo Project and Sunawayo Project, the Company’s
objectives for the remainder of 2020 and 2021 is to identify
exploration targets and to test those targets that meet the
criteria for drilling with an aim to make new discoveries. More
specifically, the Company’s initial drill program entails 5
holes for up to 1,000 meters that may be expanded. The drilling
will step out to the east and west of historic drill hole TR001 on
Block B.
District
geological mapping and geophysics is also planned, as the host and
accessory mineral properties associated with the mineralization at
El Triunfo can be detected by geophysical imaging methods such as
induced polarization (IP).
The
mineralization is characterized by multiple veins (up to 1.0m wide)
and veinlets. They are emplaced along fractures and faults that
have developed on the flanks of an east-west trending
anticlinal-synclinal sequence. Mineralization is also noted to
occur in the sedimentary planes between slate layers. The slate
layers can manifest as stockwork-style mineralization which tends
to be elongated parallel to the anticlinal axis.
On November 25, 2020, the Company announced that further to the
news release dated August 19, 2020, it has received the complete
assay results from the Company’s first diamond drill program
at its 100%-controlled El Triunfo Au-Ag-Zn-Pb project in
Bolivia.
28
SILVER ELEPHANT MINING CORP.
Management’s Discussion and Analysis of Financial Condition
and Results of Operations
For the year ended December 31, 2020
(Expressed
in Canadian Dollars, except where indicated)
Borehole TR007 intercepted 48.9 meters of mineralization grading
0.42 g/t gold, 35.5 g/t silver, 1.17% zinc, and 0.83% lead (1.45
g/t AuEq) within 98.9 meters of mineralization grading 1.04 g/t
AgEq starting 13.0 meters downhole.
Notable highlights include
|
Hole ID
|
From
|
To
|
Length (m)
|
Au (g/t)
|
Ag (g/t)
|
Zn %
|
Pb %
|
AuEq* (g/t)
|
|
TR006
|
40.0
|
76.0
|
36.0
|
0.49
|
15.46
|
0.54
|
0.44
|
0.97
|
|
including…
|
58.0
|
72.0
|
14.0
|
0.48
|
20.23
|
0.76
|
0.66
|
1.16
|
|
TR007
|
13.0
|
111.9
|
98.9
|
0.37
|
22.71
|
0.74
|
0.58
|
1.04
|
|
including…
|
63.0
|
111.9
|
48.9
|
0.42
|
35.49
|
1.17
|
0.83
|
1.45
|
|
TR008
|
6.8
|
84.0
|
77.3
|
0.31
|
17.65
|
0.57
|
0.53
|
0.85
|
|
including…
|
45.0
|
51.4
|
6.4
|
1.60
|
56.49
|
1.66
|
0.94
|
3.05
|
(*) Gold equivalent calculation uses a gold price of $1,795, a zinc
price of $0.93, a lead price of $0.80, and a silver price of $18.30
(all USD), and assumes a 100% metallurgical recovery. Gold
equivalent values can be calculated using the following formula:
AuEq = Au g/t + (Ag g/t x 0.0102) + (Zn % x 0.3551) + (Pb % x
0.3055).
Mineralization is hosted in altered black shales exhibiting
hydrothermal sheeted quartz-carbonate vein sets that are
concentrated along the axes of regional anticlinal fold
structures.
Assay results are detailed in the table below:
|
Hole ID
|
From
|
To
|
Length (m)
|
Au (g/t)
|
Ag (g/t)
|
Zn %
|
Pb %
|
AuEq* (g/t)
|
|
TR004
|
14.0
|
15.0
|
1.0
|
0.24
|
18.85
|
0.21
|
0.65
|
0.70
|
|
17.0
|
18.0
|
1.0
|
0.74
|
2.21
|
0.03
|
0.04
|
0.78
|
|
|
71.0
|
74.0
|
3.0
|
1.11
|
5.01
|
0.00
|
0.00
|
1.16
|
|
Hole ID
|
From
|
To
|
Length (m)
|
Au (g/t)
|
Ag (g/t)
|
Zn %
|
Pb %
|
AuEq* (g/t)
|
|
TR005
|
61.0
|
62.0
|
1.0
|
0.59
|
8.00
|
0.00
|
0.01
|
0.67
|
|
122.0
|
124.0
|
2.0
|
0.50
|
2.29
|
0.01
|
0.02
|
0.53
|
|
|
TR006
|
5.0
|
6.0
|
1.0
|
0.73
|
3.19
|
0.10
|
0.13
|
0.84
|
|
20.0
|
21.0
|
1.0
|
0.15
|
11.10
|
0.35
|
0.29
|
0.48
|
|
|
40.0
|
76.0
|
36.0
|
0.49
|
15.46
|
0.54
|
0.44
|
0.97
|
|
|
including…
|
58.0
|
72.0
|
14.0
|
0.48
|
20.23
|
0.76
|
0.66
|
1.16
|
|
TR006
|
94.5
|
101.5
|
7.0
|
0.56
|
23.21
|
0.82
|
0.56
|
1.26
|
|
106.5
|
107.4
|
0.8
|
0.32
|
12.70
|
0.25
|
0.01
|
0.54
|
|
|
120.0
|
121.0
|
1.0
|
0.07
|
15.90
|
0.50
|
0.67
|
0.62
|
|
|
142.8
|
143.3
|
0.5
|
0.60
|
0.43
|
0.00
|
0.00
|
0.61
|
|
|
190.0
|
191.3
|
1.3
|
0.72
|
89.58
|
2.07
|
0.16
|
2.42
|
|
|
TR007
|
13.0
|
111.9
|
98.9
|
0.37
|
22.71
|
0.74
|
0.58
|
1.04
|
|
including…
|
63.0
|
111.9
|
48.9
|
0.42
|
35.49
|
1.17
|
0.83
|
1.45
|
|
TR007
|
118.5
|
119.5
|
1.0
|
0.03
|
4.55
|
0.17
|
0.53
|
0.30
|
|
121.5
|
122.5
|
1.0
|
0.30
|
3.69
|
0.07
|
0.46
|
0.50
|
|
|
125.5
|
126.3
|
0.8
|
0.56
|
3.18
|
0.09
|
0.03
|
0.63
|
|
|
179.0
|
181.0
|
2.0
|
1.05
|
1.38
|
0.01
|
0.01
|
1.07
|
|
|
185.6
|
186.2
|
0.6
|
0.44
|
5.69
|
0.02
|
0.01
|
0.51
|
|
|
196.0
|
197.0
|
1.0
|
0.74
|
1.46
|
0.00
|
0.00
|
0.76
|
|
|
TR008
|
6.8
|
84.0
|
77.3
|
0.31
|
17.65
|
0.57
|
0.53
|
0.85
|
|
including…
|
45.0
|
51.4
|
6.4
|
1.60
|
56.49
|
1.66
|
0.94
|
3.05
|
|
TR008
|
138.1
|
139.1
|
1.0
|
0.71
|
0.90
|
0.01
|
0.00
|
0.72
|
|
149.0
|
151.0
|
2.0
|
0.10
|
22.73
|
0.78
|
0.03
|
0.61
|
|
|
156.0
|
157.0
|
1.0
|
0.74
|
1.33
|
0.02
|
0.01
|
0.76
|
|
|
183.0
|
183.6
|
0.6
|
1.65
|
2.62
|
0.02
|
0.01
|
1.69
|
|
|
231.6
|
232.6
|
1.0
|
0.41
|
4.50
|
0.00
|
0.00
|
0.46
|
|
|
247.5
|
250.0
|
2.5
|
1.64
|
35.99
|
0.00
|
0.00
|
2.01
|
|
|
257.0
|
258.0
|
1.0
|
0.78
|
2.15
|
0.00
|
0.00
|
0.80
|
29
SILVER ELEPHANT MINING CORP.
Management’s Discussion and Analysis of Financial Condition
and Results of Operations
For the year ended December 31, 2020
(Expressed
in Canadian Dollars, except where indicated)
*See Notes on gold equivalent (AuEq) calculations and metals prices
above.
Reported widths in all tables are intercepted core lengths and not
true widths, as relationships with intercepted structures and
contacts vary. Based on core-angle measurements, true widths range
from 54% to 65% of reported core length.
As the next step, the Company will integrate those results with
planned
district geological
mapping and geophysics such as induced polarization (IP).
Commencement of next round of El
Triunfo drilling is tentatively scheduled for first half of
2021.
During
the year ended December 31, 2020, the Company incurred total costs
of $463,665 (2019 -$Nil; 2018 - $Nil) for the Triunfo Project
including $327,989 (2019 - $Nil; 2018 - $Nil) for geological and
engineering services, and $135,676 (2019 -$Nil; 2018 - $Nil) of
acquisition cost.
The
Company’s 2021 Triunfo objectives are:
●
Conduct geological
and structural mapping over the property;
●
Complete induced
polarization (geophysics) survey over the property;
●
Generate drilling
targets from ground work; and
●
Test targets with
diamond drilling program.
Gibellini Project, Nevada, USA
One of
the Company’s principal assets is its interest in the
Gibellini Project. The Company holds a 100% interest in the
properties by way of a lease agreement and staked claims. Claims
are in the name of the Company’s indirect, wholly-owned
Nevada subsidiaries, VC Exploration (US), Inc. (“
VC Exploration
”) and Nevada
Vanadium, LLC (“
Nevada
Vanadium
”).
The
Gibellini Project consists of a total of 555 unpatented lode mining
claims that includes: 40 "Deitrich" claims under the Deitrich Lease
Agreement as amended on April 19, 2018, the Nevada Vanadium group
of 450 Gibellini claims and 100% interest of the Bisoni deposit
claims, and the VC Exploration group of 105 claims. The Gibellini,
VC Exploration and Company group of claims are located in Eureka
County, Nevada, as well as 28 of the Bisoni group of claims, with
the remaining 173 claims extending southwest into Nye County,
Nevada. They are located approximately 25 miles south of the town
of Eureka and are easily accessed from US Highway 50 to a paved
road that becomes a graded, gravel road.
The
Gibellini Project is situated on the south east flank of the Fish
Creek Range in the Fish Creek Mining District, about 25 miles south
of Eureka, Nevada and is accessed by dirt road extending westward
from State Route 379.
30
SILVER ELEPHANT MINING CORP.
Management’s Discussion and Analysis of Financial Condition
and Results of Operations
For the year ended December 31, 2020
(Expressed
in Canadian Dollars, except where indicated)
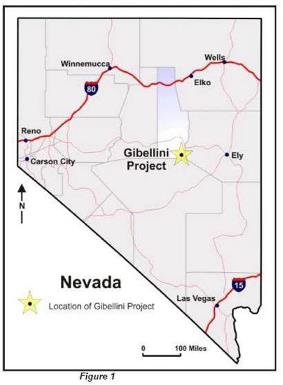
|
The
Gibellini group of claims were acquired on June 22, 2017, through
leasehold assignments from the claimant and then-holder of the
Gibellini mineral claims (the “
Gibellini Lessor
”) and includes an
area of approximately 771 acres. Under the Gibellini mineral lease
agreement (the “
Gibellini
MLA
”), the Company leased this core group of claims,
which originally constituted the entire Gibellini Project, by,
among other things, agreeing to pay to the Gibellini Lessor annual
advance royalty payments. These payments are tied, based on an
agreed formula not to exceed US$120,000 per year, to the average
vanadium pentoxide price of the prior year (each an "
Advance Royalty Payment
"). Upon
commencement of production, the obligation to make Advance Royalty
Payments will cease and the Company will instead maintain its
acquisition through lease of the Gibellini group of claims by
paying to the Gibellini Lessor, a 2.5% net smelter return royalty
(the “
Gibellini
NSR Payments
”) until a
total of US$3 million is paid. Thereafter, the Gibellini NSR will
be reduced to 2% over the remaining life of the mine (and referred
to thereafter, as “
Production
Royalty Payments
”). Upon commencement of production,
any Advance Royalty Payments that have been made will be deducted
as credits against the Gibellini NSR Payments or Production Royalty
Payments, as applicable. The lease is for a term of 10 years,
expiring on June 22, 2027, which can be extended for an additional
10 years, at the Company’s option.
|
On
April 19, 2018, the Gibellini MLA was amended to grant the Company
the option, at any time during the term of the Gibellini MLA, which
ends on June 22, 2027, to require the Gibellini Lessor to transfer
their title over all of the leased mining claims (excluding four
claims which will be retained by the Gibellini Lessor and which
contain minimal resource) to the Company in exchange for
USD1,000,000, which will be deemed an Advance Royalty
Payment.
The
Company also entered into a lease agreement to acquire 10
unpatented lode claims totaling approximately 207 gross acres (the
“
Former
Louie
Hill
Claims
”) from their holders (the
“
Former
Louie Hill Lessors
”) on July 10,
2017 (the “
Louie
Hill
MLA
”). The Former Louie Hill
Claims were located approximately 1600 feet south of the Gibellini
group of claims. The Former Louie Hill Claims were subsequently
abandoned by the Former Louie Hill Lessors, and on March 11 and 12,
2018, the Company staked the area within and under 17 new claims
totaling approximately 340 gross acres, which now collectively
comprise the expanded Louie Hill group of claims (the
“
Current
Louie
Hill
Claims
”).
On
October 22, 2018, the Company entered into a royalty agreement (the
“
Royalty
Agreement
”) with the Former Louie Hill Lessors that
replaced, on substantially similar terms, the Louie Hill MLA. The
Royalty Agreement provides for payment by the Company to the Former
Louie Hill Lessors of both advance royalty payments and net smelter
return royalty payments. As with the Gibellini MLA, the advance
royalty payments are calculated based on an agreed formula relative
to the average vanadium pentoxide price for the prior year, for a
total amount not to exceed US$28,000 per year (the
“
Louie
Hill
Advance
Royalty
Payments
”). Upon commencement of
production, the obligation to make Louie Hill Advance Royalty
Payments will be replaced by a 2.5% net smelter return royalty (the
“
Louie
Hill
NSR
”) payable on vanadium
pentoxide produced from the area of the Former Louie Hill Claims
contained within the Current Louie Hill Claims.
31
SILVER ELEPHANT MINING CORP.
Management’s Discussion and Analysis of Financial Condition
and Results of Operations
For the year ended December 31, 2020
(Expressed
in Canadian Dollars, except where indicated)
The
Company may purchase three-fifths of the Louie Hill NSR at any time
for US$1 million, leaving the total Louie Hill NSR payable by the
Company at 1.0% for the remaining life of the mine. Any Louie Hill
Advance Royalty Payments that have been made at the time of the
commencement of production will be deducted as credits against
future payments under the Louie Hill NSR. The payments under the
Royalty Agreement will continue for an indefinite period and will
be payable as long as the Company, its subsidiaries, or any of
their permitted successors or assigns holds a valid and enforceable
mining concession over the area.
On
December 5, 2017, the Company announced that it had significantly
expanded the land position at the Gibellini Project, by staking a
total of 198 new claims immediately adjacent to the Gibellini claim
group covering 4091 acres that are sufficient to enable future
vanadium mining, processing and extraction.
On
November 20, 2017, the Company filed an independent technical
report titled “
Gibellini
Project Nevada, USA NI 43-101 Technical Report
”
with an effective date of November 10, 2017
(the ”
2017 Gibellini
Report
”) prepared by the Wood Group. The 2017
Gibellini Report was filed with Canadian securities regulatory
authorities and is available under the Company’s SEDAR
profile at www.sedar.com.
On
February 15, 2018, the Company indirectly acquired an additional
105 unpatented lode mining claims located adjacent to its existing
Gibellini Project in Nevada, USA through the indirect acquisition
of VC Exploration (US) Inc, by paying a total of $335,661 in cash
and issuing the equivalent of 500,000 Common Share purchase
warrants to arm’s-length, private parties.
On June
25, 2018, the Company filed a technical report titled
“
Gibellini Project Eureka
County, Nevada, NI 43-101 Technical Report on Preliminary
Economic Assessment
” prepared by Mr. Kirk Hanson,
P.E., Technical Director, Open Pit Mining; Mr. Edward J.C. Orbock
III, RM SME, Principal Geologist and US Manager of Consulting; Mr.
Edwin Peralta, P.E., Senior Mining Engineer; and Mr. Lynton
Gormely, P.Eng., Consultant Metallurgist of Wood Group (the
“
2018 Gibellini
PEA
”). The 2018 Gibellini PEA has an effective date of
May 29, 2018 and is available under the Company’s SEDAR
profile at www.sedar.com. Each of the authors of the 2018 Gibellini
PEA are "independent" Qualified Persons within the meaning of
NI 43-101.
On
August 24, 2020, the Company announced it had commenced the
acquisition of the Bisoni Project from CellCube. As consideration
for the acquisition of the Bisoni Project under the Bisoni APA, the
Company issued 4 million the Bisoni APA Shares and paid $200,000
cash to Cellcube. The Bisoni APA Shares are subject to a statutory
four month hold period expiring on January 19, 2021. Additionally,
subject to TSX approval, if, on or before December 31, 2023, the
price of European vanadium pentoxide on the Metal Bulletin (or an
equivalent publication) exceeds US$12 a pound for 30 consecutive
days, the Company will issue to Cellcube additional Common Shares
with a value of $500,000, calculated based upon the 5 day volume
weighted average price of the Common Shares immediately following
the satisfaction of the vanadium pentoxide pricing condition. The
acquisition of the Bisoni Project was completed on September 18th,
2020. The expanded Bisoni group of claims is located within the
same formation and lithologic units as the Gibellini group of
claims. The general geology in this area is considered to be
similar to the Gibellini group of claims.
In the
three months ended September 30, 2020, the Company expanded the
land position at the Gibellini Project, by staking a total 32 new
claims adjacent to the project.
The
Gibellini Project is situated entirely on public lands that are
administered by the BLM. No easements or rights of way are required
for access over public lands. Rights-of-way would need to be
acquired for future infrastructure requirements, such as pipelines
and powerlines.
Gibellini Deposit Mineral Resource Estimate and 2018 Gibellini
PEA
On June
25, 2018, the Company filed the 2018 Gibellini PEA, which provides
an updated mineral resource estimate for the Gibellini
Project.
32
SILVER ELEPHANT MINING CORP.
Management’s Discussion and Analysis of Financial Condition
and Results of Operations
For the year ended December 31, 2020
(Expressed
in Canadian Dollars, except where indicated)
The
2018 Gibellini PEA replaces the 2017 Gibellini Report. The 2018
Gibellini PEA is preliminary in nature and includes inferred
mineral resources that are too speculative geologically to have
economic considerations applied to them that would enable them to
be categorized as mineral reserves. There is no certainty that the
2018 Gibellini PEA results will be realized. Mineral resources are
not mineral reserves and do not have demonstrated economic
viability.
The
2018 Gibellini PEA disclosed an estimated 7.94 million tons at a
weighted average grade of 0.314% vanadium pentoxide
(“
V
2
O
5
”)
in the measured category and 15.02 million tons at a weighted
average grade of 0.271% V
2
O
5
in the
Indicated category leading to a total combined measured and
indicated mineral resource of 22.95 million tons at a weighted
average grade of 0.286% V
2
O
5
. Total contained
metal content of the measured and indicated mineral resources is
131.34 million pounds V
2
O
5
. The inferred
mineral resource estimate is 14.97 million tons at a weighted
average grade of 0.175% V
2
O
5
. The total
contained metal content of the inferred mineral resource estimate
is 52.30 million pounds V
2
O
5
. The table below
contains a summary of the Gibellini deposit mineral resource
estimate (the "
Gibellini Deposit
Mineral Resource Estimate
"), which is derived from the 2018
Gibellini PEA:
Gibellini Deposit Mineral Resource Estimate***
|
Confidence
Category
|
Domain
|
Cut-offV
2
O
5
(%)
|
Tons(Mt)
|
GradeV
2
O
5
(%)
|
ContainedV
2
O
5
(Mlb)
|
|
Measured
|
Oxide
|
0.101
|
3.96
|
0.251
|
19.87
|
|
Transition
|
0.086
|
3.98
|
0.377
|
29.98
|
|
|
Indicated
|
Oxide
|
0.101
|
7.83
|
0.222
|
34.76
|
|
Transition
|
0.086
|
7.19
|
0.325
|
46.73
|
|
|
Total Measured and Indicated
|
|
|
22.95
|
0.286
|
131.34
|
|
Inferred
|
Oxide
|
0.101
|
0.16
|
0.170
|
0.55
|
|
Transition
|
0.086
|
0.01
|
0.180
|
0.03
|
|
|
Reduced
|
0.116
|
14.80
|
0.175
|
51.72
|
|
|
Total Inferred
|
|
|
14.97
|
0.175
|
52.30
|
***Notes:
1.The Qualified Person for the Gibellini Deposit Mineral Resource
Estimate is Mr. E.J.C. Orbock III, RM SME, an employee of the Wood
Group of companies. The Gibellini Deposit Mineral Resource Estimate
has an effective date of May 29, 2018.
2.Mineral resources that are not mineral reserves do not have
demonstrated economic viability.
3.Mineral resources are reported at various cut-off grades for
oxide, transition, and reduced material.
4.Mineral resources are reported within a conceptual pit shell that
uses the following assumptions: mineral resource V
2
O
5
price:
$14.64/lb.; mining cost: $2.21/ton mined; process cost: $13.62/ton;
G&A cost: $0.99/ton processed; metallurgical recovery
assumptions of 60% for oxide material, 70% for transition material
and 52% for reduced material; tonnage factors of 16.86 ft3/ton for
oxide material, 16.35 ft3/ton for transition material and 14.18
ft3/ton for reduced material; royalty: 2.5% net smelter return
(NSR); shipping and conversion costs: $0.37/lb. An overall 40º
pit slope angle assumption was used.
5.Rounding as required by reporting guidelines may result in
apparent summation differences between tons, grade and contained
metal content. Tonnage and grade measurements are in US units.
Grades are reported in percentages.
33
SILVER ELEPHANT MINING CORP.
Management’s Discussion and Analysis of Financial Condition
and Results of Operations
For the year ended December 31, 2020
(Expressed
in Canadian Dollars, except where indicated)
Louie Hill Deposit
The
Louie Hill deposit lies approximately 1,600 ft south of the
Gibellini deposit.
The
2018 Gibellini PEA provides an inferred mineral resource of 7.52
million tons at a weighted average grade of 0.276% vanadium
pentoxide (V
2
O
5
). The oxidation
domains were not modeled. The total contained metal content of the
estimate is 41.49 million pounds V
2
O
5
. The table below
summarizes the Louie Hill deposit mineral resource estimate (the
"
Louie Hill Deposit Mineral
Resource Estimate
"):
Louie Hill Deposit Mineral Resource Estimate***
|
Confidence
Category
|
Cut-offV
2
O
5
(%)
|
Tons(Mt)
|
GradeV
2
O
5
(%)
|
ContainedV
2
O
5
(Mlb)
|
|
Inferred
|
0.101
|
7.52
|
0.276
|
41.49
|
***Notes:
1.The Qualified Person for the Louie Hill Deposit Mineral Resource
Estimate is Mr. E.J.C. Orbock III, RM SME, an employee of the a
Wood Group of companies . The Louie Hill Deposit Mineral Resource
Estimate has an effective date of May 29, 2018. The resource model
was prepared by Mr. Mark Hertel, RM SME.
2.Mineral resources that are not mineral reserves do not have
demonstrated economic viability.
3.Oxidation state was not modeled.
4.Mineral resources are reported within a conceptual pit shell that
uses the following assumptions: mineral resource V
2
O
5
price: $14.64/lb;
mining cost: $2.21/ton mined; process cost: $13.62/ton; G&A
cost: $0.99/ton processed; metallurgical recovery assumptions of
60% for mineralized material; tonnage factors of 16.86 ft3/ton for
mineralized material, royalty: 2.5% net smelter return (NSR);
shipping and conversion costs: $0.37/lb. For the purposes of the
Louie Hill Deposit Mineral Resource Estimate, an overall 40º
slope angle assumption was used.
5.Rounding as required by reporting guidelines may result in
apparent summation differences between tons, grade and contained
metal content. Tonnage and grade measurements are in US units.
Grades are reported in percentages.
A total
of 280 drill holes (about 51,265 ft) have been completed on the
Gibellini Project since 1946, comprising 16 core holes (4,046 ft),
169 rotary drill holes (25,077 ft; note not all drill holes have
footages recorded) and 95 reverse circulation holes (22,142
ft).
The
vanadium-hosted argillite unit ranges from 175 to over 300 ft thick
and overlies gray mudstone and black shales. The argillite has been
oxidized to various hues of yellow and orange to a depth of 100 ft
and is believed to have been part an overall homogenous black shale
unit. Alteration (oxidation) of the rocks is classified as one of
three oxide codes: oxidized, transitional, and
reduced.
No
significant work has been conducted on the Gibellini Project since
2015, with some minor prospecting completed in October of 2018. The
Company has not completed trenching or drilling activities since
its acquisition of the Gibellini Project.
The
power supply for the Gibellini Project site is assumed to be at
24.9 kV and supplied from a planned substation to be located near
Fish Creek Ranch. This substation would tap and step-down the 69kV
supply carried by the line to the nearby Pan Mine to 24.9kV and
place it on a line to the Gibellini Project. Negotiations with the
power utility, Mt. Wheeler Power, will need to be undertaken to
secure any future power supply contract and transmission line to
the site.
In
conformance with BLM permitting requirements and Secretarial Order
3355, the Company submitted a package of enhanced baseline reports
(the "
Enhanced Baseline
Reports
") on March 22, 2019. Following the BLM review of the
baseline reports, the Company submitted the Gibellini Mine Plan of
Operations (the “
Gibellini
MPO
”) to the Battle Mountain
District office of the BLM and the Reclamation Permit application
to the State of Nevada Division of Environmental Protection
Bureau of Mining Regulation and Reclamation on June 28,
2019.
34
SILVER ELEPHANT MINING CORP.
Management’s Discussion and Analysis of Financial Condition
and Results of Operations
For the year ended December 31, 2020
(Expressed
in Canadian Dollars, except where indicated)
The
Enhanced Baseline Reports were completed using data primarily
collected by the previous operator between 2010 and 2012, and
included studies of biological resources, air resources, cultural
resources, surface water resources, ground water resources, noise,
wild horses, paleontological resources, geological resources,
socioeconomic and environmental justice, soil resources, visual
resources, wetlands and riparian resources, and geochemical
characterization for ore and overburden. The baseline data was
updated with data collection completed in 2019 that validated the
previous data. The reports included a review of potential
environmental impacts and proposed environmental protection
measures to avoid or minimize these impacts. The Gibellini MPO was
then prepared by integrating the information developed in the
baseline reports to guide the Gibellini Project design to avoid or
minimize potential environmental impacts.
The
Gibellini MPO includes over 1,100 pages of detailed development
plans for the Gibellini Project exploration activities, open pit
mining operations and processing facilities to extract and recover
vanadium from the Gibellini deposit with stated average mine
production during the seven-year mine life of 15.7 million tons of
ore material containing 120.5 million pounds of vanadium. The
primary facilities include the: pit, waste rock disposal facility,
mine office, auxiliary facilities such as water and power, crushing
facilities and stockpile, heap leach pad, process facility, water
ponds, borrow areas, and mine and access roads.
In
addition, the Gibellini MPO includes the following management plans
and engineering studies:
1.
quality assurance
plan;
2.
storm water
management plan;
3.
adaptive waste rock
management plan;
4.
monitoring
plan;
5.
noxious weed
management plan;
6.
spill contingency
plan;
7.
feasibility study
level pit slope design;
8.
heap leach and
waste rock dump facility stability report;
9.
closure
plan;
10.
water management
plan;
11.
interim closure
plan;
12.
transportation
plan;
13.
radiation
protection plan;
14.
climate data and
surface water hydrology;
15.
seismic hazard
analyses; and
16.
engineering design
criteria.
In
August 2018, NewFields completed the Gibellini heap leach pad and
waste dump designs as part of an overall basic engineering design
led by M3 Engineering and Technology Corp
On
October 31, 2019, the water pollution control permit and air permit
applications were submitted to the Nevada Division of Environmental
Protection (“NDEP “) incorporating the Newfields and M3
Engineering design packages. The draft air permit was posted for
public comment on July 13, 2020.
2018 Gibellini PEA
On May
29, 2018, the Company received results of the 2018 Gibellini PEA
for the Gibellini Project. The 2018 Gibellini PEA reported an
after-tax cumulative cash flow of $601.5 million, an internal rate
of return of 50.8%, a net present value of $338.3 million at a 7%
discount rate and a 1.72 years payback on investment from start-up
assuming an average vanadium pentoxide price of $12.73 per pound.
As of May 29, 2018, the price of vanadium pentoxide was $14.20 per
pound according to
www.asianmetal.com
. The 2018
Gibellini PEA was prepared by Amec Foster Wheeler E&C Services
Inc, part of the Wood Group, and is based on the NI 43-101
compliant resource calculations reported above.
35
SILVER ELEPHANT MINING CORP.
Management’s Discussion and Analysis of Financial Condition
and Results of Operations
For the year ended December 31, 2020
(Expressed
in Canadian Dollars, except where indicated)
Highlights of the 2018 Gibellini PEA (after tax)
|
Internal rate of
return
|
50.8%
|
|
Net
present value (“
NPV
”)
|
US$338.3 million at
7% discount rate
|
|
Payback
period
|
1.72
years
|
|
Average
annual production
|
9.65
million lbs V
2
O
5
|
|
Average
V
2
O
5
selling
price
|
US$12.73 per
lb
|
|
Operating cash
cost
|
US$4.77
per lb V
2
O
5
|
|
All-in
sustaining costs
*
|
US$6.28
per lb V
2
O
5
|
|
Breakeven
price
**
|
US$7.76
per lb V
2
O
5
|
|
Initial
capital cost including 25% contingency
|
US$116.76
million
|
|
Average
grade
|
0.26%
V
2
O
5
|
|
Strip
ratio
|
0.17
waste to leach material
|
|
Mining
operating rate
|
3.4
million tons (leach material and waste) per year
|
|
Average
V
2
O
5
recovery
through Direct Heap Leaching
|
62%
|
|
Life of
mine
|
13.5
years
|
*
includes
selling costs, royalties, operating cash cost, reclamation,
exploration and sustaining capital costs.
**
includes
selling costs, royalties, operating cash costs, taxes (local,
state, and federal), working capital, and sustaining and capital
costs.
The
2018 Gibellini PEA is preliminary in nature and includes inferred
mineral resources that are considered too speculative geologically
to have the economic considerations applied to them that would
enable them to be categorized as mineral reserves, and there is no
certainty that the 2018 Gibellini PEA will be realized. Mineral
resources are not mineral reserves and do not have demonstrated
economic viability.
Sensitivity Analysis
The
tables below show the sensitivity analysis to the vanadium
pentoxide price, grade, and to the 2018 Gibellini PEA capital cost
and operating costs. This sensitivity analysis indicates strong
project economics even in very challenging conditions, and that the
project is well positioned to benefit from the current rising
vanadium price environment. A 20% increase in the vanadium price
relative to the base case translates to a US$491.3 million
after-tax NPV at a 7% discount rate.
36
SILVER ELEPHANT MINING CORP.
Management’s Discussion and Analysis of Financial Condition
and Results of Operations
For the year ended December 31, 2020
(Expressed
in Canadian Dollars, except where indicated)
Sensitivity Analysis
|
V
2
O
5
price
change
|
V
2
O
5
price
US$/lb
|
After-taxIRR
|
After-tax
NPVUS$M @ 7%
|
After-taxcashflowUS$M
|
|
30%
|
16.55
|
69%
|
568.0
|
996.0
|
|
20%
|
15.28
|
63%
|
491.3
|
864.4
|
|
10%
|
14.00
|
57%
|
415.2
|
733.2
|
|
Base
price
|
12.73
|
51%
|
338.3
|
600.4
|
|
-10%
|
11.46
|
44%
|
261.0
|
467.2
|
|
-20%
|
10.18
|
36%
|
183.1
|
333.2
|
|
-30%
|
8.91
|
26%
|
103.9
|
196.9
|
|
V
2
O
5
gradechange
|
V
2
O
5
grade
|
After-taxIRR
|
After-tax
NPVUS$M @ 7%
|
After-taxcashflowUS$M
|
|
30%
|
0.34%
|
68%
|
554.4
|
972.8
|
|
20%
|
0.31%
|
63%
|
482.4
|
849.0
|
|
10%
|
0.28%
|
57%
|
410.7
|
725.4
|
|
Base
grade
|
0.26%
|
51%
|
338.3
|
600.4
|
|
-10%
|
0.23%
|
44%
|
265.6
|
475.0
|
|
-20%
|
0.21%
|
37%
|
192.2
|
348.9
|
|
-30%
|
0.18%
|
28%
|
118.3
|
221.6
|
|
Capexchange
|
CapexUS$M
|
After-taxIRR
|
After-tax
NPVUS$M @ 7%
|
After-taxcashflowUS$M
|
|
30%
|
151.8
|
40%
|
307.2
|
564.3
|
|
20%
|
140.1
|
43%
|
317.6
|
576.3
|
|
10%
|
128.4
|
47%
|
328.0
|
588.4
|
|
Base
Capex
|
116.8
|
51%
|
338.3
|
600.4
|
|
-10%
|
105.1
|
55%
|
348.6
|
612.5
|
|
-20%
|
93.4
|
61%
|
358.9
|
624.6
|
|
-30%
|
81.7
|
67%
|
369.3
|
636.8
|
37
SILVER ELEPHANT MINING CORP.
Management’s Discussion and Analysis of Financial Condition
and Results of Operations
For the year ended December 31, 2020
(Expressed
in Canadian Dollars, except where indicated)
|
Opexchange
|
OpexUS$M
|
After-taxIRR
|
After-tax
NPVUS$M @ 7%
|
After-taxcashflowUS$M
|
|
30%
|
6.20
|
45%
|
257.9
|
450.2
|
|
20%
|
5.72
|
47%
|
284.8
|
500.3
|
|
10%
|
5.25
|
49%
|
311.6
|
550.4
|
|
Base
Capex
|
4.77
|
51%
|
338.3
|
600.4
|
|
-10%
|
4.29
|
53%
|
364.8
|
650.0
|
|
-20%
|
3.82
|
55%
|
390.7
|
698.4
|
|
-30%
|
3.34
|
56%
|
416.0
|
745.4
|
Mining & Processing
Mining
at the Gibellini and Louie Hill deposits is planned to be a
conventional open pit mine utilizing a truck and shovel fleet
comprised of 100-ton trucks and front-end loaders. Average mine
production during the 13.5 year mine life is 3.4 million tons of
leach material (3 million tons) and waste (0.4 million tonnes) per
year at a strip ratio of 0.17. Mining is to be completed either
in-house or through contract, with the Company’s mining staff
overseeing the contracted mining operation and performing the mine
engineering and survey work if contract mining is
selected.
|
|
Oxide‘000
tons
|
Transition‘000
tons
|
Reduced‘000
tons
|
Grade%
V
2
O
5
|
Metal
containedV
2
O
5
(Mlb)
|
Metal
ProducedV
2
O
5
(Mlb)
|
|
YR
1
|
2,600
|
400
|
—
|
0.291
|
17.440
|
10.633
|
|
YR
2
|
2,400
|
600
|
—
|
0.278
|
16.690
|
10.480
|
|
YR
3
|
1,760
|
1,240
|
—
|
0.310
|
18.580
|
12.067
|
|
YR
4
|
650
|
2,350
|
—
|
0.372
|
22.320
|
15.217
|
|
YR
5
|
310
|
2,680
|
10
|
0.366
|
21.950
|
15.185
|
|
YR
6
|
2,240
|
750
|
10
|
0.315
|
18.920
|
11.928
|
|
YR
7
|
3,000
|
—
|
—
|
0.316
|
18.980
|
11.394
|
|
YR
8
|
1,910
|
700
|
380
|
0.189
|
11.310
|
7.085
|
|
YR
9
|
690
|
1,220
|
1,090
|
0.216
|
12.940
|
8.023
|
|
YR
10
|
110
|
370
|
2,520
|
0.208
|
12.480
|
6.898
|
|
YR
11
|
450
|
360
|
2,180
|
0.182
|
10.910
|
6.103
|
|
YR
12
|
50
|
140
|
2,820
|
0.166
|
9.980
|
5.349
|
|
YR
13
|
390
|
10
|
2,600
|
0.183
|
10.970
|
5.839
|
|
YR
14
|
1,710
|
—
|
—
|
0.195
|
6.670
|
4.096
|
|
Totals:
|
18,290
|
10,830
|
11,590
|
0.258
|
210.15
|
130.297
|
38
SILVER ELEPHANT MINING CORP.
Management’s Discussion and Analysis of Financial Condition
and Results of Operations
For the year ended December 31, 2020
(Expressed
in Canadian Dollars, except where indicated)
The
processing method envisioned for the Gibellini Project will be to
feed leach material from the mine via loader to a hopper that feeds
the crushing plant. The leach material will then be fed to an
agglomerator where sulfuric acid, flocculent and water will be
added to achieve adequate agglomeration. The agglomerated leach
material will be transported to a stacker on the leach pad, which
will stack the material to a height of 15 feet. Once the material
is stacked, solution will be added to the leach heap at a rate of
0.0025 gallons per minute per square foot. The solution will be
collected in a pond and this pregnant leach solution will be sent
to the process building for metal recovery where it will go through
solvent extraction and stripping processes to produce the vanadium
pentoxide and a secondary yellowcake uranium.
Vanadium Recoveries and Metallurgical Testing
Approximately
130.3 million pounds of V
2
O
5
and 336,000
pounds of uranium is expected to be produced from the
Gibellini Project heap leaching operations at an average vanadium
recovery of 62% (oxide: 60%, transition: 70% and reduced: 52%). The
heap leaching is performed at ambient temperature and atmospheric
pressure without pre-roasting or other beneficiation process. The
pregnant leach solution is continuously collected with leach
material undergoing, on average, a 150-day heap-leaching cycle. The
table below summarizes the projected metallurgical recoveries used
in the 2018 Gibellini PEA for the three defined oxidation-type
domains.
|
Mill
Feed Material Type
|
Direct
Leaching Recovery
|
|
Oxide
|
60%
|
|
Transition
|
70%
|
|
Reduced
|
52%
|
The
direct heap leach vanadium recovery estimates used in the 2018
Gibellini PEA were based on extensive metallurgical testing work
performed by SGS Lakefield Research Laboratories, Dawson Minerals
Laboratories, and McClelland Laboratories ("
McClelland
"). Samples were selected from
a range of depths within the deposit, representative of the various
types and styles of mineralization. Samples were obtained to ensure
that tests were performed on a sufficient sample mass. The end
results demonstrated low acid consumption (less than 100 lb acid
consumption per ton leached) and high recovery through direct
leaching. Notable test results included the following:
Acid Heap Leach Testing of a Gibellini Bulk Sample, McClelland,
September 4, 2013
A
series of trenches were excavated and approximately 18 tons of
material were sent to McClelland for pilot testing.
Solvent Extraction (SX) Test Work
The
design parameters from this test work are:
●
SX Extraction pH
Range 1.8 to 2.0
●
Di-2-Ethyl Hexyl
Phosphoric Acid Concentration 0.45 M (~17.3% by weight)
Cytec
●
923 Concentration
0.13 M (~5.4% by weight)
●
The Organic Diluent
is Orform SX-12 (high purity kerosene)
●
SO
2
addition of
1.0 to 1.5 g/l
●
Strip Solution
Sulfuric Acid Concentration 225 to 250 g/l SX
●
Extraction
Efficiency ~97%
●
SX Strip Efficiency
~98%
Pilot Scale Solvent Extraction Testing on Vanadium Bearing
Solutions from Two Gibellini Project Column Leach Tests,
McClelland, September 16, 2013
39
SILVER ELEPHANT MINING CORP.
Management’s Discussion and Analysis of Financial Condition
and Results of Operations
For the year ended December 31, 2020
(Expressed
in Canadian Dollars, except where indicated)
Solvent
extraction (“
SX
”) processing was conducted to
recover vanadium from sulfuric acid pregnant leach solution
(“
PLS
”)
generated during pilot column testing on bulk leach samples from
the Gibellini Project. Laboratory scale testing was conducted on
select solutions generated during the pilot SX processing, to
optimize the SX processing conditions. Additional laboratory scale
testing was conducted on the loaded strip solution generated during
the pilot SX testing, to evaluate methods for upgrading and
purifying it to levels that may be required for sale of a final
vanadium bearing product.
In
August of 2018, the Company received metallurgical results from its
technology partner, Northwest Non-Ferrous Metals Mining and Geology
Group Co., Ltd, (‘
NWME
”) from samples collected
during a site visit in March of 2018. Tests were performed at its
laboratory testing facilities located in Xi’an, China. NWME
utilized a SX processing method to recover vanadium from sulfuric
acid PLS generated by bottle roll and column test acid leaching on
Gibellini samples. The solution was reduced and then precipitated
using ammonia to make AMV. The AMV was calcined and heated then
cooled and pulverized. A vanadium pentoxide with 98.56 % purity
content was produced. The assay for this work is shown
below:
|
V2O5 %
|
SI %
|
Fe %
|
P %
|
S %
|
As %
|
Na2O %
|
K2O %
|
Al %
|
U %
|
|
98.56
|
0.0078
|
0.88
|
0.058
|
0.47
|
0.0026
|
0.43
|
0.052
|
0.22
|
0.0001
|
Uranium
content is less than 0.0001% which does not affect the
marketability of the product.
The PLS
was produced with very low deleterious elements which enabled using
an efficient SX process. The PLS V2O5 concentration was 1.15 gram
per liter and the Pregnant Strip Solution V2O5 concentration was
39.61 grams per liter.
Capital and Operating Costs
The
projected capital costs for the Gibellini Project over a one and a
half year construction period and mine life average operating costs
are summarized in the two tables below. The capital cost includes
25% contingency or USD23.4 million.
40
SILVER ELEPHANT MINING CORP.
Management’s Discussion and Analysis of Financial Condition
and Results of Operations
For the year ended December 31, 2020
(Expressed
in Canadian Dollars, except where indicated)
Pre-Production Capital Cost
|
Cost
Description
|
Total
(US$000s)
|
|
Open Pit Mine
|
|
|
Open
pit mine development
|
1,412
|
|
Gibellini
incremental WRSF
|
212
|
|
Mobile
equipment
|
111
|
|
Infrastructure-On Site
|
|
|
Site
prep
|
2,431
|
|
Roads
|
1,391
|
|
Water
supply
|
2,007
|
|
Sanitary
system
|
61
|
|
Electrical –
on site
|
2,052
|
|
Communications
|
165
|
|
Contact
water ponds
|
174
|
|
Non-process
facilities – buildings
|
7,583
|
|
Process Facilities
|
|
|
Mill
feed handling
|
15,380
|
|
Heap
leach system
|
20,037
|
|
Process
plant
|
14,441
|
|
Off-Site Infrastructure
|
|
|
Water
system
|
4,495
|
|
Electrical supply
system
|
3,227
|
|
First
fills
|
860
|
|
Subtotal Total Direct Cost
|
76,039
|
|
Construction
indirect costs
|
4,254
|
|
Sales
tax / OH&P
|
4,236
|
|
EPCM
|
8,879
|
|
Total
Before Contingency
|
93,409
|
|
Contingency
(25%)
|
23,352
|
|
Total
Project Cost
|
116,761
|
41
SILVER ELEPHANT MINING CORP.
Management’s Discussion and Analysis of Financial Condition
and Results of Operations
For the year ended December 31, 2020
(Expressed
in Canadian Dollars, except where indicated)
Operating Costs
|
Total
Cash Operating Cost
|
US$ per
Ton Leached
|
US$ per
lb of V
2
O
5
Produced
|
|
G&A
|
0.99
|
0.31
|
|
Mining
Cost
|
2.72
|
0.85
|
|
Total
Processing Cost
|
11.54
|
3.61
|
|
Total
|
15.26
|
4.77
|
The
cash operating costs in the first half of the project covering
years 1-7 is US$3.59 per lb of V
2
O
5
produced and
for the years 8-14 is US$7.12 per lb of V
2
O
5
produced,
resulting in the weighted average cash cost of US$4.77 per lb of
V
2
O
5
produced.
The cash operating cost is lower in the first half of the project
due to processing higher grade material.
Engineering Procurement Construction Management:
On
August 15, 2018, the Company issued a request for proposal
(the “
RFP
”)
for engineering, procurement, construction and management services
("
EPCM
") from qualified
bidders. In December of 2018, the Company selected M3 Engineering
& Technology Corporation (“
M3
”) of Tucson, Arizona to provide
EPCM for the Gibellini Project in response to the RFP. M3 was
selected for its specific experience in heap leach engineering, and
construction expertise in arid environments such as Nevada and
Arizona.
The
EPCM consists of three phases. Phase 1 includes updating and
simplifying previous basic engineering as well as mine design,
waste dump design, road design, borrow pit design, buildings and
infrastructure designs will not be substantially changed. Phase 2
will consist of procurement of the required equipment, services and
developing the detailed engineering design required to build the
project facilities. Phase 3 will outline construction management
services to build the facilities to accomplish the actual
work.
The
Company expects Phase 1 of the EPCM to be completed in 2020, and to
date this schedule has not been impacted by the COVID-19 pandemic.
Phase 2 is anticipated to be completed in 2021, Phase 3 to be
completed in 2022 and the Gibellini Project wet commissioning is
expected to occur in 2023. These timelines remain provisional and
will be revised as necessary should they materially
change.
To try
to minimize technical and implementation risk, the Company is
working closely with its chosen technology partner, NWME, to fine
tune metallurgy, process design and engineering, and ensure maximum
vanadium recovery and high-grade vanadium pentoxide commercial
product on site. NWME owns and is currently operating the
world’s largest black-shale vanadium mine in China with an
environmentally friendly, hydrometallurgical leach processing
technology without the need of a pre-roasting step (see the
Company’s news release dated March 12, 2018, for more
details).
NWME
conducted a site visit of the Gibellini Project in March 2018 and
analyzed samples from the Gibellini Project in its laboratories.
The results of this work are discussed in the following
section.
Test Results
Samples
collected by NWME’s technical team during their visit to the
Gibellini Project’s site in February 2018 were analyzed at
NWME’s facility in Xi’an, China. Approximately 250 kg
of material was submitted for analysis. The results are described
below.
98.6% V
2
O
5
Produced on the
1
st
Run
with Simple Conventional Flowsheet
NWME
used SX processing method to recover vanadium from sulfuric acid
PLS generated by bottle roll and column test acid leaching on
Gibellini samples. The solution was reduced and then precipitated
using ammonia to make AMV. The AMV was calcined and heated then
cooled and pulverized. A vanadium pentoxide with 98.56 % purity
content was produced. The assay for this work is shown in table
below:
42
SILVER ELEPHANT MINING CORP.
Management’s Discussion and Analysis of Financial Condition
and Results of Operations
For the year ended December 31, 2020
(Expressed
in Canadian Dollars, except where indicated)
Gibellini Vanadium Pentoxide Assay
|
V2O %
|
SI %
|
Fe %
|
P %
|
S %
|
As %
|
Na2O %
|
K2O %
|
Al %
|
U %
|
|
98.56
|
0.0078
|
0.88
|
0.058
|
0.47
|
0.0026
|
0.43
|
0.052
|
0.22
|
0.0001
|
Uranium
content is less than 0.0001% which does not affect the
marketability of the product.
The PLS
was produced with very low deleterious elements which enabled using
an efficient SX process. The PLS V
2
O
5
concentration was
1.15 gram per liter and the pregnant strip solution V
2
O
5
concentration was
39.61 grams per liter.
Overall Vanadium Recovery of Over 60% and Low Acid
Consumption
PLS was
produced from both bottle roll and column tests. Sulfuric acid was
added to the feed material with the bottle rolling for 1 hour, then
the open bottle was allowed to cure for 24 hours and water was
added to the bottle to attain the desired density (40%). Initial
samples were taken at 6 hours, 12 hours, 24 hours, 36 hours, 48
hours and then once a day until the bottle roll was
completed.
In
column tests, sulfuric acid was added to the feed material and the
material was allowed to cure for 24 hours before initiating the
leaching. Leaching was conducted by applying 108 grams per liter
acid solution over the material. PLS was collected every 24 hours
and samples were taken for vanadium analysis. All the tests were
performed at room temperature and at atmospheric pressure. The
results of the tests are given below:
|
Test
|
Leach Time
|
Vanadium Recovery %
|
Sulfuric Acid Consumed kg/t
|
|
Column
Test
|
21
days
|
70.74
|
100
|
|
Bottle
Roll Test - investigate the effect of the curing method and
increase of sulfuric acid addition on the vanadium
recovery
|
50
hours
|
62.8
|
150
|
|
Bottle
Roll Test - investigate addition of NWME prepared leaching agent on
the vanadium recovery
|
144
hours
|
66.5
|
100
|
|
Bottle
Roll Test - investigate the leaching of coarse feed (2mm) on the
vanadium recovery
|
216
hours
|
63.7
|
100
|
The
results of the bottle roll and column leach tests performed by NWME
largely validate the results of previous tests performed by
McClelland on the Gibellini bulk sample in 2013 (18 tons of
material).
The
NWME test samples were not agglomerated and were on short leach
time of 21 days for column tests and 5 days for bottle roll tests.
The Company studied both the NWME test and McClelland test in
detail and believe the results were consistent, whereby 70%
recovery can be achieved with longer leach cycle (over 100 days
McClelland vs 21 days NWME) and less acid consumption (50 kg of
acid per tonne of material McClelland vs 100 kg of acid per tonne
of material NWME).
43
SILVER ELEPHANT MINING CORP.
Management’s Discussion and Analysis of Financial Condition
and Results of Operations
For the year ended December 31, 2020
(Expressed
in Canadian Dollars, except where indicated)
A
summary of acid heap leach tests of a Gibellini bulk sample,
completed at McClelland, September 4, 2013 is tabulated
below:
|
Size
|
Test Type
|
Time (Days)
|
Vanadium Recovery %
|
Head Grade % V2O5
|
Sulfuric Acid Consumed kg/t
|
|
50 mm (2”)
|
Column, open circuit
|
123
|
76.6
|
0.53
|
39.9
|
|
12.5 mm (1/2”)
|
Column, open circuit
|
123
|
80.2
|
0.56
|
32.7
|
|
12.5 mm (1/2”)
|
Column, closed circuit
|
230
|
68.3
|
0.51
|
38.1
|
|
12.5 mm (1/2”)
|
Column, closed circuit
|
198
|
74
|
0.56
|
43.5
|
|
12.5 mm (1/2”)
|
Bottle Roll
|
4
|
67.1
|
0.51
|
33.6
|
|
1.7 mm (-10m)
|
Bottle Roll
|
4
|
66.3
|
0.51
|
29.9
|
|
-75µ
|
Bottle Roll
|
4
|
67.6
|
0.5
|
28.1
|
|
-75µ
|
Bottle Roll
|
30
|
74.2
|
0.53
|
24.5
|
Representative Feed Grade with Benign Test Conditions that Can be
Replicated in Commercial Setting
The
leaching bottle roll and column tests were performed at room
temperature and at atmospheric pressure based on Gibellini’s
representative grade from grab sampling method across the width of
the mineralization at various locations of the Project. These
samples are characterized in table below:
|
Sample Number
|
Sample ID
|
Weight kg
|
Head Grade V2O5 (%)
|
|
1
|
18-L6-28
|
17.0
|
0.665
|
|
2
|
18-L6-29
|
17.0
|
0.885
|
|
3
|
18-L6-30
|
12.5
|
0.370
|
|
4
|
18-L6-31
|
18.0
|
0.210
|
|
5
|
18-L6-32
|
13.5
|
0.420
|
|
6
|
18-L6-33
|
22.5
|
0.280
|
|
7
|
18-L6-34
|
19.0
|
0.315
|
|
8
|
18-L6-35
|
20.0
|
0.185
|
|
9
|
18-L6-36
|
18.0
|
0.165
|
|
10
|
18-L6-37
|
20.0
|
0.195
|
|
Total
|
|
177.5
|
|
For the
purpose of metallurgical testing, the samples were mixed to produce
a composite material with the average grade of 0.30% V
2
O
5
which is representative of Gibellini
resource grade. The composite material was ground to -75 lm feed.
The Company belie
ves the test conditions can easily be
replicated in a commercial heap leach setting with low technical
and implementation risk.
Vanadium Mineralogy in Achieves Recovery at Room Temperature and
Atmospheric Pressure
NWME
performed detailed mineralogical analysis which included microscope
identification using a Carl Zeiss Axioskop, XRD analysis on Bruker
D8-A25 XRD, multi-element analysis, electron probe X-ray
microanalysis on JEOL JXA 8230, scanning electron microscopy/energy
dispersive X-ray spectroscopy analysis on Mineral Liberation
Analizer 650 and V element phase analysis. This mineralogical
analysis confirmed that the Gibellini resource has a high
percentage of independent vanadium minerals (“
IVM
”) such as kazakhstanite,
shubnelite, sherwoodite, bokite, which can be leached easily at
room temperature and atmospheric pressure within a short time
frame.
44
SILVER ELEPHANT MINING CORP.
Management’s Discussion and Analysis of Financial Condition
and Results of Operations
For the year ended December 31, 2020
(Expressed
in Canadian Dollars, except where indicated)
NWME
noted the unique nature of the Gibellini samples with over 45% IVM
versus numerous other typical black shale deposits which they have
encountered containing less than 10% IVM.
All of
the test work carried out on the material from the Gibellini
Project indicate that there is a two-stage leaching phenomenon in
Gibellini ore - approximately 50% of the vanadium leaches in the
first 96 hours (independent vanadium minerals), and the remaining
leaching approximately 15 to 20% occurs over a longer time
horizon.
Heap
leaching is the lowest-cost recovery method compared to roasting,
and pressured container VAC leaching; whereby capital costs can
compound to multiple times greater for the same throughput.
Gibellini’s high IVM content is a key competitive
differentiator which places the deposit in the top tier of black
shale deposits in terms of pre-production capital cost required
based on NWME’s research. The mineralogical results of the
Gibellini ore as characterized by NWME’s test work is shown
in table below:
|
Mineral composition
|
Mineral content %
|
V content in minerals %
|
V distribution %
|
|
|
Independent
vanadium minerals
45.2%
of vanadium content
|
Kazakhstanite
|
0.15
|
40.91
|
19.77
|
|
Shubnelite
|
0.13
|
27.86
|
11.67
|
|
|
Sherwoodite
|
0.08
|
34.54
|
8.90
|
|
|
Bokite
|
0.03
|
36.51
|
3.53
|
|
|
Melanovanadite
|
0.01
|
41.27
|
1.33
|
|
|
Vanadium-bearing
layered aluminosilicate minerals
20.8%
of vanadium content
|
Sericite
|
8.59
|
0.57
|
14.63
|
|
Illite
|
5.58
|
0.28
|
5.03
|
|
|
Chlorite
|
0.81
|
0.44
|
1.14
|
|
|
Nacrite-palygorskite
|
0.70
|
-
|
-
|
|
|
Vanadium-bearing
layered iron oxide, sulfate 34% of vanadium content
|
Limonite
|
1.76
|
5.48
|
31.07
|
|
Strengite
|
0.64
|
0.49
|
1.01
|
|
|
Jarosite
|
0.48
|
1.24
|
1.92
|
|
|
Gangue
|
Quartz
|
75.88
|
-
|
-
|
|
Apatite
|
2.83
|
-
|
-
|
|
|
Potassium
feldspar
|
0.73
|
-
|
-
|
|
|
Dolomite
|
0.66
|
-
|
-
|
|
|
Carbonaceous
|
0.45
|
-
|
-
|
|
|
Rutile
|
0.25
|
-
|
-
|
|
|
Barite
|
0.04
|
-
|
-
|
|
|
Pyrite
|
0.20
|
-
|
-
|
|
|
Total
|
100.00
|
|
100.00
|
|
Low Carbonate Content Results in Low Acid Consumption.
NWME
detailed mineralogical analysis which included microscope
identification using a Carl Zeiss Axioskop, XRD analysis on Bruker
D8-A25 XRD, multi-element analysis, electron probe X-ray
microanalysis on JEOL JXA 8230, scanning electron microscopy/energy
dispersive X-ray spectroscopy analysis on Mineral Liberation
Analyzer 650 and V element phase analysis, confirmed the extremely
low carbonaceous content of Gibellini’s oxide and transition
samples. This explains the low acid consumption (less than 50 kg
per tonne) compared to other average black shale deposits of 200 kg
to 300 kg per tonne based on extensive NWME data compilation. Given
acid cost accounts for approximately 50% of the Project’s
operating expenses, Gibellini’s low carbon content is a key
competitive differentiator which places it in the top tier of black
shale deposits in terms of processing cost based on NWME’s
findings.
45
SILVER ELEPHANT MINING CORP.
Management’s Discussion and Analysis of Financial Condition
and Results of Operations
For the year ended December 31, 2020
(Expressed
in Canadian Dollars, except where indicated)
The
following table is a generalized comparison of Gibellini’s
deposit to a composite of typical black shale vanadium
deposits:
|
|
Gibellini Vanadium Deposit
|
Black Shale Series Vanadium Deposits
|
|
Host
Rock
|
Silica
State
|
Carbon
Siliceous Rocks with Mudstone
|
|
The
Mineral Composition
|
High
Silica, Low Aluminium and Low Carbonaceous. SiO2-78.40%; Al2O3 -
4.13%;
T(C) -
0.47%
|
High
Silica, High Aluminum and High Carbonaceous. SiO2-62-93%; Al2O3
> 7%;
T(C) >
10%
|
On
March 26, 2019, the Company announced via news release available on
SEDAR vanadium assay results from its Fall 2018 exploration
reconnaissance program on the Gibellini Project. The 155 assays are
taken from three prospective exploration areas all within 5
kilometers to existing Gibellini vanadium NI 43-101 compliant
resource pit outline. Surface grab samples assay as high as 2%
vanadium pentoxide (V2O5) and 75 samples (48% of total 155) have
V2O5 grades greater than the Gibellini deposit’s cut-off
grade of 0.101% V2O5 at $12.5/lb V2O5.
The
high vanadium assay results along the 5-kilometer
northeast-southwest trend which line-up the Northeast Prospect,
through Gibellini Hill, Louie Hill, Middle Earth prospect, and Big
Sky prospect providing an indication of potential and possibly
significant future expansion of vanadium mineralization along this
corridor.
Big Sky Prospect (300m by 50m)
The Big
Sky prospect occurs 3.1 kilometers southwest of the Gibellini Hill
measured and indicated resource and 1.8 kilometers southwest of the
Louie Hill inferred resource. A total of 62 samples were taken, of
which 40% (
n
=25) returned
assays greater than Gibellini cut-off grade. Sixteen (16) samples
returned assays >0.200 V2O5. The distribution of samples occurs
along a 300-meter exposure of the Woodruff Formation. Assays
showing >0.200 V2O5 are shown in table below.
V2O5% grab sample assay results at Big Sky prospect for samples
with >0.200%
|
SAMPLE ID
|
Prospect
|
V2O5 %
|
|
301910
|
Big
Sky
|
0.261
|
|
301913
|
Big
Sky
|
0.223
|
|
301915
|
Big
Sky
|
0.346
|
|
301916
|
Big
Sky
|
0.400
|
|
301918
|
Big
Sky
|
0.712
|
|
301920
|
Big
Sky
|
0.264
|
|
301926
|
Big
Sky
|
0.580
|
|
301927
|
Big
Sky
|
2.008
|
|
301928
|
Big
Sky
|
0.848
|
|
301944
|
Big
Sky
|
0.264
|
|
301946
|
Big
Sky
|
0.280
|
|
301947
|
Big
Sky
|
0.218
|
|
301950
|
Big
Sky
|
0.261
|
|
302050
|
Big
Sky
|
0.214
|
|
302054
|
Big
Sky
|
0.787
|
|
302055
|
Big
Sky
|
1.982
|
46
SILVER ELEPHANT MINING CORP.
Management’s Discussion and Analysis of Financial Condition
and Results of Operations
For the year ended December 31, 2020
(Expressed
in Canadian Dollars, except where indicated)
Middle Earth Prospect (200m by 70m)
The
Middle Earth prospect occurs 1.7 kilometers southeast of the
Gibellini Hill deposit and 300 meters south of the Louie Hill
deposit. A total of 50 samples were collected of which 68%
(
n
=34) returned assays
>0.101% V2O5 or the Gibellini cut-off grade. Twenty-seven (27)
samples returned assays >0.200 V2O5. The samples are distributed
over 3 road cuts of exposed Woodruff Formation making up a 200
meter by 70-meter areal footprint. Assays showing >0.200 V2O5
are shown in the following table.
V2O5% grab sample assay results at Middle Earth prospect for
samples with >0.200%
|
SAMPLE ID
|
Prospect
|
V2O5 %
|
|
301951
|
Middle
Earth
|
0.350
|
|
301952
|
Middle
Earth
|
0.482
|
|
301968
|
Middle
Earth
|
0.628
|
|
301969
|
Middle
Earth
|
0.605
|
|
301970
|
Middle
Earth
|
0.634
|
|
301972
|
Middle
Earth
|
0.252
|
|
301973
|
Middle
Earth
|
0.687
|
|
301974
|
Middle
Earth
|
0.470
|
|
301975
|
Middle
Earth
|
0.612
|
|
301976
|
Middle
Earth
|
0.637
|
|
301978
|
Middle
Earth
|
0.559
|
|
301979
|
Middle
Earth
|
0.557
|
|
301980
|
Middle
Earth
|
0.259
|
|
301981
|
Middle
Earth
|
0.405
|
|
301983
|
Middle
Earth
|
0.255
|
|
301984
|
Middle
Earth
|
0.303
|
|
301985
|
Middle
Earth
|
0.434
|
|
301987
|
Middle
Earth
|
0.291
|
|
301988
|
Middle
Earth
|
1.294
|
|
301989
|
Middle
Earth
|
0.261
|
|
301991
|
Middle
Earth
|
0.314
|
|
301992
|
Middle
Earth
|
0.457
|
|
301993
|
Middle
Earth
|
0.380
|
|
301995
|
Middle
Earth
|
0.302
|
|
301998
|
Middle
Earth
|
0.539
|
|
301999
|
Middle
Earth
|
0.618
|
|
302000
|
Middle
Earth
|
0.532
|
Northeast Trench Prospect (500m by 300m)
The
Northeast Trench prospect occurs 1.2 kilometers northeast of the
Gibellini Hill deposit and 2.5 kilometers northeast of the Louie
Hill deposit. A total of 43 samples were collected of which 37%
(
n
=16) returned assays
>0.101% V2O5 or the Gibellini cut-off grade. Three (3) samples
returned assays >0.200 V2O5. The samples are distributed through
road cuts (“trenches”) and dry gulches of exposed
Woodruff Formation making up a 500 meter by 350-meter areal
footprint. The exposure at the Northeast Trench is greatly obscured
by colluvium material however the extent where it is exposed might
indicate a large volume of Woodruff Formation yet to be explored.
Assays showing >0.200 V2O5 are shown in the following
table.
47
SILVER ELEPHANT MINING CORP.
Management’s Discussion and Analysis of Financial Condition
and Results of Operations
For the year ended December 31, 2020
(Expressed
in Canadian Dollars, except where indicated)
V2O5% grab sample assay results at Northeast Trench prospect for
samples with >0.200%
|
SAMPLE ID
|
Prospect
|
V2O5 %
|
|
302004
|
NE
Trench
|
0.239
|
|
302005
|
NE
Trench
|
0.380
|
|
302016
|
NE
Trench
|
0.303
|
Water supply
On
August 20, 2018, the Company
secured water supply for the
Gibellini Project construction and operation. The Company signed a
10-year agreement (the "
Water
Supply Agreement
") with the owner of a private ranch,
located approximately 14.5 kilometers from the Gibellini Project.
The Water Supply Agreement can be extended for any number of
additional 7-year terms, not to exceed (with the primary term) a
total of 99 years.
Under
the terms of the Water Supply Agreement, the lessor granted to the
Company the rights to 805 acre-feet (approximately 262.4 million
gallons) of water per year for the Gibellini Project, at a minimum
flow rate of 500 gallons per minute (“
gpm
”) from its year-round springs
surface water stream. The water flow rate was measured at the ranch
springs in 1965, in 1981, from December 2011 to September 2013, and
most recently, in 2017. The water flow rate ranges from 1,000 to
3,900 gpm with an average flow rate of 2,690 gpm, which exceeds the
project’s maximum water operational requirement of 420 gpm
based on the process engineering design prepared by Scotia
International of Nevada, Inc. as a part of engineering,
procurement, construction and management work done in
2014.license.
The
Gibellini Project completed water-related baseline studies
including the drilling of water-test wells, water source data
collection, characterization, flow rate testing and modeling. Due
to the fact that the Water Supply Agreement provides a source of
water from surface springs located on a private ranch and baseline
studies related to it have been completed, the Company expects to
significantly expedite the permitting process by eliminating the
need to appropriate water rights from the Nevada Division of Water
Resources.
Bisoni-McKay Claims and Historical Deposit
On
August 24, 2020 the Company announced it had commenced the
acquisition of the Bisoni-McKay Project from CellCube. This
transaction was successfully completed and announced on September
18, 2020. The Bisoni group of claims is host to a historic resource
known as the Bisoni-McKay deposit. The resource was calculated in
2016 by Edwin Ulmer and Edwin H. Bentzen III. A summary of the
historic resource is tabulated below:
|
Bisoni-McKay Deposit Historic Category
|
V2O5 Mt
|
V2O5 Grade %
|
Mlbs Contained V2O5
|
|
|
|||
|
Indicated
|
11.88
|
0.397
|
94.41
|
|
Inferred
|
7.05
|
0.427
|
60.12
|
The
historic resource calculation adopted a 0.2% V2O5 cutoff grade. A
Qualified Person has not done sufficient work to classify the
historical estimate as current mineral resources or mineral
reserves. The Company is not treating the historical estimate as
current mineral resources or mineral reserves.
The
Bisoni Project was drilled in the 1970s by Hecla, and more recently
by Stina Resources (now Cellcube) in 2004, 2005, and 2007. Historic
2005 drill result highlights include:
●
BMK 05-01 –
98.5 meters grading 0.46% V2O5 from surface, including 36.0 meters
grading 0.76% V2O5
●
BMK 05-02 –
98.1 meters grading 0.53% V2O5 from near surface, including 40.2
meters grading 0.88% V2O5
●
BMK 05-03 –
105.2 meters of 0.49% V2O5.
48
SILVER ELEPHANT MINING CORP.
Management’s Discussion and Analysis of Financial Condition
and Results of Operations
For the year ended December 31, 2020
(Expressed
in Canadian Dollars, except where indicated)
Compiled
historic results are tabulated below:
|
From (m)
|
To (m)
|
Downhole Interval
|
Approx. true width
|
V(ppm)
|
V2O5(ppm)
|
V2O5 (%)
|
|
Hole
No. DDH BMK 05-01
|
Total
depth 98.5m
|
|||||
|
0.0
|
22.9
|
22.9
|
79.2
|
1,395
|
2,491
|
0.25
|
|
22.9
|
62.5
|
39.6
|
1,693
|
3,023
|
0.3
|
|
|
62.5
|
98.5
|
36.0
|
4,623
|
7,610
|
0.76
|
|
|
0.0
|
98.5
|
98.5
|
2,563
|
4,575
|
0.46
|
|
|
Hole
No. DDH BMK 05-02
|
Total
depth: 105.0m
|
|||||
|
7.0
|
36.3
|
29.3
|
n/a
|
1,630
|
2,909
|
0.29
|
|
36.3
|
64.9
|
28.7
|
1,635
|
2,919
|
0.29
|
|
|
64.9
|
105.2
|
40.2
|
4,944
|
8,825
|
0.88
|
|
|
7.0
|
105.2
|
98.1
|
2990
|
5337
|
0.53
|
|
|
Hole
No. DDH BMK 05-03
|
Total
depth: 105.2m
|
|||||
|
4.0
|
25.3
|
21.3
|
n/a
|
1,501
|
2,680
|
0.27
|
|
25.3
|
69.2
|
43.9
|
2,771
|
4,952
|
0.5
|
|
|
69.2
|
130.5
|
62.3
|
2,761
|
4,929
|
0.49
|
|
|
25.3
|
130.5
|
105.2
|
2,766
|
4,938
|
0.49
|
|
These
drill results are “historic” as defined by
NI 43-101 and have not been independently verified. Truth
widths are unknown except where indicated.
The
host rocks carrying vanadium mineralization at both the Gibellini
Project and Bisoni Project belong to the same Gibellini facies of
the Woodruff Shale Formation.
There
exist several highly prospective exploration targets in between and
around the Gibellini and Bisoni McKay deposits (the two are 14
kilometers apart) along the northeast – southwest corridor
such as the Big Sky prospect, the Middle Earth prospect and the
North East prospect (from Gibellini Project) and BMK and BR zones
(from the Bisoni Project) all with outcropping surface vanadium
mineralization that could potentially ultimately lead to additional
vanadium mineral discoveries.
Offtake and Project Financing
The
Company has received unsolicited expressions of interest from
various potential investment sources and is currently engaged in
discussions with potential cornerstone investors, vanadium product
off-takers on potential equity, debt and prepaid off-take financing
possibilities. The Company expects to report material progress in
due course.
Permitting
On
October 31, 2019, the Company submitted permit applications for the
Water Pollution Control Permit and the Class II Air Quality Permit.
These Nevada state permits have been developed to provide
construction level engineering that supports the mine plan
previously submitted to the BLM in the Plan of Operations. Comments
received from the BLM were used as guidance in the engineering
design to ensure the State and Federal Permits are aligned and
reflect the most current guidance provided by both the NDEP and
BLM.
49
SILVER ELEPHANT MINING CORP.
Management’s Discussion and Analysis of Financial Condition
and Results of Operations
For the year ended December 31, 2020
(Expressed
in Canadian Dollars, except where indicated)
NDEP Water Pollution Control Permit
Mining
in Nevada is regulated under the authority of the Nevada Revised
Statutes (NRS) 445A.300-NRS 445A.730 and the Nevada Administrative
Code (NAC) 445A.350-NAC 445A.447. Water Pollution Control Permits
("
WPCP
") are issued to an
operator prior to the construction of any mining, milling, or other
beneficiation process activity. Facilities utilizing chemicals for
processing ores are required to meet a zero-discharge performance
standard such that waters of the State will not be
degraded.
The
engineering design for heap leaching, the processing facility, and
the mine design (M3 Engineering and Newfields Companies, LLC) was
integrated into to the site closure plan that was also submitted as
part of the WPCP application. This design will facilitate
concurrent closure of the heap as each heap cell is finished
leaching. This will allow the closure plan to be initiated during
operations. At the end of active mining, the site can be closed at
minimal technical risk. This reduces the closure duration and
liability and the commensurate reclamation bond.
Air Quality Class II Permit
The
Nevada Bureau of Air Pollution Control issues air quality operating
permits to stationary and temporary mobile sources that emit
regulated pollutants to ensure that these emissions do not harm
public health or cause significant deterioration in areas that
presently have clean air. This is achieved by stipulating specific
permit conditions designed to limit the amount of pollutants that
sources may emit into the air as a regular part of their business
processes.
Any
process/activity that is an emission source requires an air quality
permit. Nevada Revised Statute (NRS) 445B.155 defines an emission
source as “any property, real or personal, which directly
emits or may emit any air contaminant.”
The
Class II Permit for Gibellini is for facilities that emit less than
100 tons per year for any one regulated pollutant. Since the
vanadium processing will utilize a heap leach, the emissions will
be under the threshold for more complex air permits. The
engineering design incorporates stringent emission control
technology to minimize emissions. The modeled emissions from the
entire Gibellini Project are well below the National Ambient Air
Quality Standards (“
NAAQS
”).
The
Enhanced Baseline Reports (“
EBR’s
”) were extensively
used in the Project engineering design to ensure that potential
environmental impacts identified in the EBR’s would be
avoided or minimized by facility design. These engineering controls
help ensure that avoidance of potential environmental impacts is
“built into” the project from the start of the design
process. Doing so will allow environmental protection measures to
be taken to minimize the risk of impacts that cannot be completely
avoided in the design and ensure up-front project planning that is
sensitive to all environmental resources.
Integration with BLM 12-month 3355 Environmental Impact Statement
Process
The
Nevada state permit applications were brought forward in the
permitting process to identify any issues resulting from NDEP
review that could affect the project design in the plan of
operations early. By resolving the State permitting issues prior to
the start of the EIS, it will help ensure that the 12-month
schedule mandated by the BLM Secretarial Order 3355 (S.O. 3355) can
be met and interruptions to the schedule can be
avoided.
On July
14, 2020, the NOI to prepare the EIS was published in the Federal
Register. The NOI formally commences the 12-month timeline to
complete the National Environmental Policy Act review and EIS
preparation by the BLM. The NEPA process is designed to help public
officials complete permitting decisions that are protective of the
environment and includes a public engagement process.
A news
release dated July 16, 2020 from the BLM Mount Lewis Office stated
the following:
“If approved,
this project would provide hundreds of jobs and will contribute to
the nation’s domestic source of critical minerals,”
said Doug Furtado, Battle Mountain District Manager. “The
Gibellini mine would also be the first vanadium mine in the U.S.
and, in accordance with Secretarial Order 3355, we anticipate
having a record of decision in 12 months.
50
SILVER ELEPHANT MINING CORP.
Management’s Discussion and Analysis of Financial Condition
and Results of Operations
For the year ended December 31, 2020
(Expressed
in Canadian Dollars, except where indicated)
As
there is currently no primary domestic production of vanadium, the
United States is dependent on foreign sources of vanadium; this
creates a strategic vulnerability for both the economy and military
to adverse government action or other events that can disrupt the
supply of this key mineral.”
The
Company continues with its EPCM work and expects Phase 1 of the
EPCM, updating basic engineering design, to be completed by 2020;
Phase 2, equipment procurement and detailed engineering design, to
be completed in 2021; Phase 3, facilities construction, to start in
2022 and be completed in 2023 with the Gibellini Project wet
commissioning expected to be in 2023.
During
the year ended December 31, 2020, the Company incurred total costs
of $2,435,857 (2019 -$4,956,939; 2018 - $2,727,759) for the
Gibellini Project including $897,085 (2019 - $3,200,773; 2018 -
$1,509,587) for geological and engineering services, $1,190,607
(2019 - $1,470,007; 2018 - $831,023) for personnel, legal, general
and administrative expenses and $348,165 (2019 -$286,158; 2018 -
$387,149) for royalties, fees and taxes. Also, during the year
ended December 31, 2020, the Company incurred total costs of
$2,237,077 (2019 -$Nil; 2018 - $Nil) for the Bisoni claims and
16,489 (2019 - $Nil, 2018 - $Nil) for the Gibellini
claims.
2021 Outlook
The
Company intends to continue with the permitting process in order to
obtain necessary permits and authorizations prior to conducting
Project-related activities to ensure compliance with all applicable
regulatory requirements. The permits the Company expects to receive
are presented in the following table:
Required Permits and Regulatory Authorizations for Gibellini
Project
|
Permits and Authorizations
|
Regulatory Agency
|
|
Plan of
Operations/Record of Decision
|
Bureau
of Land Management
|
|
Explosives
Permit
|
U.S.
Department of the Treasury, Bureau of Alcohol, Tobacco, and
Firearms
|
|
Surface
Disturbance Permit and Class II Air Quality Operating
Permit
|
Nevada
Department of Conservation and Natural Resources, Division of
Environmental Protection, Bureau of Air Quality
|
|
Water
Pollution Control Permit
|
Nevada
Department of Conservation and Natural Resources, Division of
Environmental Protection, Bureau of Mining Regulation and
Reclamation
|
|
Mining
Reclamation Permit
|
Nevada
Department of Conservation and Natural Resources, Division of
Environmental Protection, Bureau of Mining Regulation and
Reclamation
|
|
Industrial
Artificial Pond Permit
|
Nevada
Department of Conservation and Natural Resources, Nevada Department
of Wildlife (NDOW)
|
|
Class
III Waiver Landfill Permit
|
Nevada
Department of Conservation and Natural Resources, Division of
Environmental Protection, Bureau of Solid Waste
|
|
General
Discharge Permit (Stormwater)
|
Nevada
Department of Conservation and Natural Resources, Division of
Environmental Protection, Bureau of Water Pollution
Control
|
|
Hazardous
Materials Storage Permit
|
State
of Nevada, Fire Marshall Division
|
|
Hazardous
Waste Identification Number
|
United
States Environmental Protection Agency
|
|
Septic
Treatment Permit
Sewage
Disposal System Permit
|
Nevada
Department of Conservation and Natural Resources, Division of
Environmental Protection, Bureau of Water Pollution
Control
|
|
Potable
Water System Permit
|
Nevada
Department of Conservation and Natural Resources, Division of
Environmental Protection, Bureau of Safe Drinking
Water
|
|
Radioactive
Materials License
|
Nevada
Department of Health and Human Services, Nevada State Health
Division, Radiological Health Section
|
|
Dam
Safety Permit
|
State
of Nevada Division of Water Resources
|
|
Local Permits
|
|
|
County
Road Use and Maintenance Permit/Agreement
|
Eureka
County Building Planning Department
|
51
SILVER ELEPHANT MINING CORP.
Management’s Discussion and Analysis of Financial Condition
and Results of Operations
For the year ended December 31, 2020
(Expressed
in Canadian Dollars, except where indicated)
Expected
costs associated with this process fall under General and
Administrative costs for the Company. The Company does not
anticipate that there will be any deficiencies or other factors
that will delay or prevent receipt of these permits.
Ulaan Ovoo Coal Property, Mongolia
The
Company acquired a 100% interest in the Ulaan Ovoo Property located
in the territory of Tushig soum of Selenge aimag province in
Northern Mongolia in 2010 from a private Mongolian company. On
November 9, 2010, the Company received the final permit to commence
mining operations at the Ulaan Ovoo Property. The focus of the
Ulaan Ovoo PFS was for the development of low ash coal reserves in
the form of a starter pit. During 2014, the Company faced
challenges, such as significant dewatering of the resource, lack of
demand, depressed coal sales prices, and higher than expected
operating/transportation costs, resulting in limited production
throughout the period. Pit dewatering has become a significant
impediment to achieving consistent production, especially following
mine standby during the periods of low market demand. The mine was
placed on standby in Spring 2014 but continued coal loading and
sales from the existing stockpiles. Due to the lack of sustained
production, management has not sufficiently tested the mine plant
and equipment to conclude that the mine has reached the commercial
production stage. During the beginning of 2015, due to minimal
increase in coal prices and decreased demand because of a mild
winter, the Company decided to maintain the operations on standby
though coal loading and sales from existing stockpiles continued to
customers. The Company decided to sell the mining equipment to
generate cash so that operations may continue.
In
April 2015, the Company, through its wholly-owned subsidiary, Red
Hill, entered into a purchase agreement with an arm’s-length
party in Mongolia to sell substantially all of its mining and
transportation equipment at the Ulaan Ovoo Property for total
proceeds of approximately $2.34 million. The sale of equipment was
completed in June 2015. Total proceeds (including the sale of
equipment to other arm’s-length parties) amounted to $2.9
million in cash. The Ulaan Ovoo Property ceased pre-commercial
operations in June 2015, The Company continued to maintain the
Ulaan Ovoo Property operations on standby, incurring minimal
general and administrative costs.
On
October 10, 2018, the Company executed a lease agreement (the
“Lease”) with an arms-length private Mongolian company
(the “Lessee”) whereby the Lessee plans to perform
mining operations at Ulaan Ovoo Property and will pay the Company
USD$2.00 (the “Production Royalty”) for every tonne of
coal shipped from the Ulaan Ovoo Property’s site premises.
The Lessee paid the Company USD$100,000 in cash, as a
non-refundable advance royalty payment and is preparing, at its own
and sole expense, to restart and operate the Ulaan Ovoo Property
with its own equipment, supplies, housing and crew. The Lessee will
pay all government taxes and royalties related to its proposed
mining operation. The Lease is valid for 3 years with an annual
advance royalty payment (“
ARP
”) for the first year of
USD$100,000 which was due and paid upon signing, and USD$150,000
and USD$200,000 due on the 1st and 2nd anniversary of the Lease,
respectively. The ARP can be credited towards the USD$2.00 per
tonne Production Royalty payments to be made to the Company as the
Lessee starts to sell Ulaan Ovoo coal. The 3-year Lease can be
extended upon mutual agreement.
The
first and second anniversary payments due have not been collected
and the Company has recorded a full provision in the amount of
$470,278 (US$350,000) due to uncertainty of their
collection.
Since
the signing of the Lease, the Lessee has spent approximately
USD$700,000 on supplies, housing and crew and restarted Ulaan Ovoo
Property with its own equipment in March 2018 reporting
approximately 21,000 tonnes of coal production and sales. In June
2019 the Ulaan Ovoo Property achieved record monthly coal
production of 37,800 tonnes, however the operation was stopped in
April and May due to the late approval of 2019 environmental plan.
The approval was issued in June 2019.
During
2020, even with the nationwide COVID-19 restriction the Lessee
mined approximately 82,000 tonnes of coal production and sales. The
Lessee continues to mine with its own equipment and has exported
its first wagon of coal to China in 2020.
In
accordance with relevant laws and regulations, mining feasibility
study and detailed environmental impact assessment had to be
updated for the Ulaan Ovoo Property. With the COVID-19 restriction,
the approval was delayed but the update of the Ulaan Ovoo
feasibility study was approved by the Minerals Resource Council on
April 22, 2020, and by the Minerals Resource and Petroleum
Authority on November 2, 2020. The Company is working to get
approval for the update to the detailed environmental impact
assessment for the Ulaan Ovoo Property.
52
SILVER ELEPHANT MINING CORP.
Management’s Discussion and Analysis of Financial Condition
and Results of Operations
For the year ended December 31, 2020
(Expressed
in Canadian Dollars, except where indicated)
Chandgana Coal Properties, Mongolia
The
Chandgana Project consist of the Chandgana Tal property and the
Khavtgai Uul which are within nine kilometres of each other in the
Nyalga Coal Basin in east central Mongolia and approximately 280
kilometres east of Ulaanbaatar. On November 22, 2006 the Company
entered into a letter agreement with a private Mongolian company
that set out the terms to acquire a 100% interest in the Chandgana
Tal property. On August 7, 2007, the Company entered into a letter
agreement with another private Mongolian company that set out the
terms to acquire a 100% interest in the Khavtgai Uul property.
Under the terms of the Chandgana Khavtgai agreement, the Company
paid a total of USD$570,000. On February 8, 2011, the Company
received a full mining license from the Mineral Resources Authority
of Mongolia for the Chandgana Tal property. The license can be
updated to allow mining of 3.5 million tonnes per year to meet the
demand of the Chandgana Power Plant within 90 days.
During
2007, the Company performed geologic mapping, drilling and
geophysical surveys of the Chandgana Tal and Khavtgai Uul
properties. During June, 2010, The Company completed a 13 drill
hole, 2,373 metre resource expansion drilling program on the
Khavtgai Uul property, including 1,070 metres of core drilling, and
five lines of seismic geophysical survey for a total of 7.4 line
kilometres. The Company completed a 15 drill hole program during
June-July 2011 to better define the coal resource of the Chandgana
Tal licenses.
The
Chandgana Tal property has been mined previously and occasionally
during the Company’s tenure to meet local demand. The Company
decided not to mine during the 2017- 2018 heating season because of
insufficient demand. A dry lake was determined by the Ministry of
Environment to overlap onto one of the Chandgana Tal licenses as
determined under the Mongolian Law to Prohibit Mineral Exploration
and Mining Operations at Headwaters of Rivers, Protected Zones of
Water Reservoirs and Forested Areas (the “Long Named
Law”) but was resolved without loss to the Company. The
Khavtgai Uul property has never been mined. The Ministry of
Environment determined that a dry lake overlapped the Khavtgai Uul
license as defined under the Long Named Law. This was resolved by
removing the lake area from the license while not affecting the
coal resource and mineability. The Company will continue to monitor
the developments and ensure that it follows the necessary steps in
the Amended Law on Implementation to secure its operations and
licenses and is fully compliant with Mongolian law.
During
2017, preparatory work to convert the Khavtgai Uul exploration
license to a mining license was completed. The Company engaged a
contractor to prepare the required documents to convert the license
to a mining license under which the right to explore is permanent.
In 2017, as preparatory work to convert the Khavtgai Uul
exploration license to a mining license necessary laboratory
analysis work was done such as coal chemical, mineral and element
analysis of duplicates of coal samples taken as a result of
drilling work in past years as well as radiation analysis of coal
ash. A report describing the results of geological and exploration
work completed during 2017 was delivered to Geological division of
Mineral Resources and Petroleum Authority of Mongolia (the former
Mineral Resources Authority of Mongolia (MRAM)). Based on previous
years of work a report of the reserves of the licensed area was
prepared, and an official letter requesting an expert be appointed
were submitted to the Mineral Resources Professional Council in
January 2018. During 2018, the Company completed converting the
Khavtgai Uul exploration license to a mining license.
During
2017 activities for the Chandgana Tal project included payment of
license fees and environmental sampling and reporting. No
exploration was completed on the Chandgana Tal licenses. The
Company assessed the local market for coal and found there was not
sufficient demand to warrant mining during the 2017-2018 heating
seasons. Thus, the annual mining and environmental plans were not
filed.
During
2020, the Company successfully got the approval of the feasibility
study for the Khavtgai Uul project and intends to
get approval for its detailed environmental impact
assessment with the relevant ministries and complete the
requirements to maintain the licenses.
For the
Chandgana Tal project, the Company intends to update the mining
feasibility study and
report to
certify land quality and characterization
with the relevant
ministries and complete the requirements to maintain the
licenses.
53
SILVER ELEPHANT MINING CORP.
Management’s Discussion and Analysis of Financial Condition
and Results of Operations
For the year ended December 31, 2020
(Expressed
in Canadian Dollars, except where indicated)
5.
SELECTED ANNUAL FINANCIAL INFORMATION
The
table below contains selected financial data from the audited
consolidated financial statements of the Company for the three most
recently completed financial years and was prepared in accordance
with IFRS.
Selected Annual Financial Data
|
|
|
Years ended December 31,
|
|
|
|
2020
|
2019
|
2018
|
|
|
|
|
|
|
Operating
expense
|
$
(3,394,116
)
|
$
(3,505,562
)
|
$
(3,298,383
)
|
|
Other
items
|
(1,232,771
)
|
21,019,416
|
(14,886,085
)
|
|
Net
gain/(loss)
|
(4,626,887
)
|
17,513,854
|
(18,184,468
)
|
|
Comprehensive
gain/(loss)
|
(4,626,887
)
|
17,513,854
|
(18,196,628
)
|
|
|
|
|
|
|
Share
Information:
|
|
|
|
|
Gain/(loss)
per share, basic
|
$
(0.03
)
|
$
0.17
|
$
(0.23
)
|
|
Gain/(loss)
per share, diluted
|
$
(0.03
)
|
$
0.17
|
$
(0.23
)
|
|
Weighted
average number of common shares outstanding, basic
|
137,901,802
|
102,208,111
|
78,445,396
|
|
diluted
|
137,901,802
|
102,398,145
|
78,443,396
|
|
Financial
Position:
|
|
|
|
|
Current
assets
|
7,798,631
|
3,400,142
|
5,463,768
|
|
Equipment
|
153,800
|
159,484
|
101,162
|
|
Mineral
properties
|
31,806,594
|
23,782,884
|
3,643,720
|
|
Total
assets
|
39,833,010
|
27,448,088
|
9,264,205
|
|
Total
liabilities
|
2,474,953
|
2,740,000
|
10,023,943
|
|
Dividends
|
$
-
|
$
-
|
$
-
|
Year 2020 compared to year 2019
The
Company’s annual operating expenses for the years 2020, 2019,
and 2018 remain close.
The
Company reported a net loss of $4.6 million ($0.03 per Common
Share) for the year ended December 31, 2020, which represents an
increased loss of $22 million when compared to the year ended
December 31, 2019 (a net gain of $17.5 million, $0.17 gain per
Common Share). The increase of net loss was primarily due to an
impairment reversal of 13.7 million for Pulacayo property and a
write-off the Bolivian tax liability of $8 million in the year 2019
compared to $Nil similar costs in the year 2020.
The
total assets increased by $12.4 million from $27.5 million in the
year 2019 to $39.8 million in the year 2020. The increase was
mainly due to an increase in mineral property exploration and
properties acquisitions. Current assets increased by $4.4 million
from $3.4 million in the year 2019 to $7.8 million in the year
2020. The increase was mainly due to an increase in cash of $4.6
million.
The
Company’s total liabilities decreased by $0.2 million from
$2.7 million in the year 2019 to $2.5 million in the year
2020.
Year 2019 compared to year 2018
The
Company reported a net gain of $17.5 million ($0.17 gain per Common
Share) for the year 2019, which represents a decreased loss of
$35.7 million when compared to the year 2018 ($0.23 loss per Common
Share). The decrease in net loss was primarily due to an impairment
reversal of 13.7 million for Pulacayo property and a write-off the
Bolivian tax liability of $8 million in the year 2019 compared to
impairment charges of $18.2 million in the year 2018.
54
SILVER ELEPHANT MINING CORP.
Management’s Discussion and Analysis of Financial Condition
and Results of Operations
For the year ended December 31, 2020
(Expressed
in Canadian Dollars, except where indicated)
The
total assets increased by $18.2 million from $9.3 million in the
year 2018 to $27.5 million in the l year 2019. The increase was
mainly due to an impairment reversal for Pulacayo property and an
increase in mineral property exploration in the year 2019. Current
assets decreased by $2.3 million from $5.5 million in the year 2018
to $3.2 million in the year 2019. The decrease was mainly due to a
decrease in cash of $2.3 million.
The
Company’s total liabilities decreased by $7.3 million since
December 31, 2018. The decrease in total liabilities was mainly due
to a write-off the Bolivian tax liability.
6.
SUMMARY OF QUARTERLY RESULTS
To
date, COVID-19 has not significantly impacted the Company’s
operations.
Silver Elephant has
implemented extensive preventative measures across its offices and
operations in order to safeguard the health of its employees, while
continuing to operate safely and responsibly maintain employment
and economic activity.
The
following table summarizes selected consolidated financial
information prepared in accordance with IFRS for the eight most
recently completed quarters:
|
|
2020
|
2020
|
2020
|
2020
|
|
|
Q4
|
Q3
|
Q2
|
Q1
|
|
|
|
|
|
|
|
Operating
expense
|
$
(809,912
)
|
$
(853,332
)
|
$
(592,874
)
|
$
(1,137,998
)
|
|
Net
gain/(loss)
|
(2,259,661
)
|
(1,037,332
)
|
(389,770
)
|
(940,124
)
|
|
Net
loss per share, basic and diluted
|
$
(0.01
)
|
$
(0.01
)
|
$
(0.01
)
|
$
(0.01
)
|
|
Comprehensive
gain/(loss )
|
(2,259,661
)
|
(1,037,332
)
|
(389,770
)
|
(940,124
)
|
|
Comprehensive
gain/(loss)per share, basic and diluted
|
$
(0.01
)
|
$
(0.01
)
|
$
(0.01
)
|
$
(0.01
)
|
|
|
2019
|
2019
|
2019
|
2019
|
|
|
Q4
|
Q3
|
Q2
|
Q1
|
|
|
|
|
|
|
|
Operating
expense
|
$
(1,175,096
)
|
$
(715,475
)
|
$
(820,893
)
|
$
(794,098
)
|
|
Net
loss
|
12,475,952
|
(1,019,268
)
|
6,966,029
|
(908,859
)
|
|
Net
loss per share, basic and diluted
|
$
0.11
|
$
(0.01
)
|
$
0.07
|
$
(0.01
)
|
|
Comprehensive
loss
|
12,475,952
|
(1,019,268
)
|
6,966,029
|
(908,859
)
|
|
Comprehensive
loss per share, basic and diluted
|
$
0.11
|
$
(0.01
)
|
$
0.07
|
$
(0.01
)
|
The
fluctuation on quarterly net loss is primarily due to Common
Share-based compensation expenses recognized as stock options
granted to directors, officers, employees and consultants of the
Company are earned, advertising and promotion expenses, the
impairment losses recognized on resource properties, and debt
settlements.
7.
RESULTS OF OPERATIONS FOR THE YEAR ENDED DECEMBER 31,
2020
All of
the information described below is accounted for in accordance with
IFRS. The reader is encouraged to refer to Note 6 of the
Company’s Annual Financial Statements for the year ended
December 31, 2020 for the Company’s IFRS accounting
policies.
55
SILVER ELEPHANT MINING CORP.
Management’s Discussion and Analysis of Financial Condition
and Results of Operations
For the year ended December 31, 2020
(Expressed
in Canadian Dollars, except where indicated)
|
Operating Expenses
|
Years Ended December 31,
|
||
|
|
2020
|
2019
|
2018
|
|
Advertising
and promotion
|
$
541,029
|
$
794,182
|
$
471,230
|
|
Consulting
and management fees
|
570,356
|
251,552
|
255,610
|
|
General
and administrative expenses
|
1,097,436
|
1,286,617
|
1,357,724
|
|
Professional
fees
|
321,355
|
228,594
|
428,884
|
|
Share-based
payments
|
770,617
|
707,802
|
553,430
|
|
Travel
and accommodation
|
93,323
|
236,815
|
231,505
|
|
|
$
3,394,116
|
$
3,505,562
|
$
3,298,383
|
The
Company had an operating loss of $3,394,116 for the year ended
December 31, 2020, compared with an operating loss of $3,505,562
for the year ended December 31, 2019.
In late
January 2020, in response to the reported spread of COVID-19 the
Company implemented measures, including travel restrictions, remote
work, and supplemental health care, for the Company’s
Canadian head office staff, as well as our Bolivian, Mongolian, and
US-based staff. These measures had no material impact on the
Company’s costs, nor did COVID-19 cause any significant
disruptions to the Company’s operations.
Of note
for the year ended December 31, 2020, are the following
items:
●
advertising and
promotion expenses decreased by $253,153 from $794,182 in the year
2019, to $541,029 in the year 2020, due to decreased promotional
activities and restricted travels during the COVID-19
pandemic;
●
consulting and
management fees increased by $318,804 from $251,552 in the year
2019, to $570,356 in the year 2020, due to the issuance of a bonus
in the amount of $324,000 to management/consultants of the Company,
which was paid by the issuance of Common Shares at a value of $0.40
per share;
●
general and
administrative fees consisted of general office expenses and
administrative services related to maintaining the Company’s
exchange listings and complying with securities regulations and
also included insurance, salaries and directors’ fees.
General and administrative expenses decreased by $189,180 from
$1,286,617 in the year 2019, to $1,097,436 in the year 2020. The
decrease is a result of cost cutting initiatives across the
Company;
●
professional fees
increased by $92,761, from $228,594 in the year 2019, to $321,355
in the year 2020, due to increased legal fees associated with the
Offering and properties acquisitions;
●
share-based
payments costs are non-cash charges which reflect the estimated
value of stock options granted. The Company uses the fair value
method of accounting for stock options granted to directors,
officers, employees and consultants whereby the fair value of all
stock options granted is recorded as a charge to operations over
the period from the grant date to the vesting date of the options.
The fair value of options granted is estimated on the date of grant
using the Black-Scholes option pricing model. Share-based payments
increased in the year 2020, by $62,815 compared to the year 2019.
The increase was primarily related to the increase in the number of
options earned during the year 2020, compared to the year 2019;
and
●
travel and
accommodation expenses decreased by $143,492 from $236,815 in the
year 2019, to $93,323 in the year 2020, due to decreased property
site visits and restricted travels during the COVID-19
pandemic.
56
SILVER ELEPHANT MINING CORP.
Management’s Discussion and Analysis of Financial Condition
and Results of Operations
For the year ended December 31, 2020
(Expressed
in Canadian Dollars, except where indicated)
For the
year ended December 31, 2020, the Company’s “Other
Items” amounted to a loss of $1,232,771 compared to a gain of
$21,019,416 in the year ended December 31, 2019.
|
|
Years Ended December 31,
|
||
|
Other Items
|
2,020
|
2,019
|
2,018
|
|
Costs
in excess of recovered coal
|
$
590,204
|
$
120,354
|
$
94,335
|
|
Foreign
exchange loss
|
64,841
|
443,203
|
412,663
|
|
Impairment/(recovery)
of mineral property
|
-
|
(13,708,200
)
|
13,994,970
|
|
Impairment
of prepaid expenses
|
121,125
|
51,828
|
26,234
|
|
Impairment
of equipment
|
-
|
-
|
425,925
|
|
Impairment
of receivables
|
470,278
|
16,304
|
21,004
|
|
Loss
on sale of marketable securities
|
-
|
-
|
91,890
|
|
Loss/(gain)
on sale of equipment
|
(13,677
)
|
9,795
|
-
|
|
Gain
on debt settlement
|
-
|
(7,952,700
)
|
(50,000
)
|
|
Other
income
|
-
|
-
|
(130,936
)
|
|
|
$
1,232,771
|
$
(21,019,416
)
|
$
14,886,085
|
The
increase in loss of Other Items by $22,252,187 in the year 2020
compared to the year 2019 was the net result of changes to a number
of the following items:
●
in the year 2020
costs in excess of recovered coal increased by $469,850 compared to
the year 2019
.
This increase was mainly due
to the change in estimate reclamation provision for Ulaan Ovoo coal
mine in Mongolia;
●
foreign exchange
loss decreased by $378,362 due to fluctuations in the value of the
Canadian dollar compared to the United States dollar, Bolivian
boliviano and Mongolian tugrik;
●
in the year 2020,
the Company recorded an impairment of prepaid expenses of $121,125
compared to $51,828 in the year 2019;
●
in the year 2020,
the Company recorded an impairment of receivables of $470,278
compared to $16,304 in the year 2019;
●
in the year 2020,
the Company recorded a gain on sale of equipment of $13,677
compared to a loss of 9,795 in the year 2019;
●
also, in the year
2019, the Company recorded an impairment recovery of $13,708,200 on
its Pulacayo property and wrote off Bolivian tax liabilities of
$7,952,700 due to the decision of the Supreme Court of Bolivia to
discharge the Company of the tax claim.
8.
RESULTS OF OPERATIONS FOR THE FOURTH QUARTER 2020
A
summary of the Company’s consolidated operating expenses
results for the three months ended December 31, 2020, 2019 and 2018
provided below:
|
Operating Expenses
|
Three Months Ended December31,
|
||
|
|
2020
|
2019
|
2018
|
|
Advertising
and promotion
|
$
184,175
|
$
237,556
|
$
107,296
|
|
Consulting
and management fees
|
77,856
|
85,500
|
63,455
|
|
General
and administrative expenses
|
258,092
|
256,452
|
726,257
|
|
Professional
fees
|
103,008
|
46,443
|
204,162
|
|
Share-based
payments
|
176,224
|
475,200
|
135,848
|
|
Travel
and accommodation
|
10,557
|
73,945
|
81,457
|
|
|
$
809,912
|
$
1,175,096
|
$
1,318,475
|
57
SILVER ELEPHANT MINING CORP.
Management’s Discussion and Analysis of Financial Condition
and Results of Operations
For the year ended December 31, 2020
(Expressed
in Canadian Dollars, except where indicated)
The
Company had an operating loss of $809,912 for the three months
ended December 31, 2020, compared to an operating loss of
$1,175,096 for the three months ended December 31,
2019.
Of note
are the following items:
●
advertising and
promotion expenses decreased by $53,381 from $237,556 in the three
months ended December 31, 2020, to $184,175 in the three months
ended December 31, 2020, due to decreased promotion activities due
to COVID-19;
●
consulting and
management fees in the three months ended December 31, 2020, remain
close to fees incurred in the three months ended December 31,
2019;
●
general and
administrative fees consisted of general office expenses and
administrative services related to maintaining the Company’s
exchange listings and complying with securities regulations and
also included insurance, salaries and directors’ fees.
General and administrative expenses in the three months ended
December 31, 2020 remain close to fees incurred in the three months
ended December 31, 2019;
●
professional fees
increased by $56,565, from $46,443 in the three months ended
December 31, 2019, to $103,008 in the three months ended December
31, 2020 due to legal fees related to the Offering;
●
share-based
payments decreased in the three months ended December 31, 2020, by
$298,976 compared to the three months ended December 31, 2019. The
decrease was related to the decrease in the number of options
earned during the three months ended December 31, 2020, compared to
the three months ended December 31, 2019;
●
travel and
accommodation expenses decreased by $63,388 from $73,945in the
three months ended December 31, 2019, to $10,557 in the three
months ended December 31, 2020, due to decreased property site
visits and restricted travels during the COVID-19
pandemic;
For the three months ended December 31, 2020, the Company’s
“Other Items” amounted to a loss of $1,449,749 compared
to a gain of $13,651,048 in the three months ended December
31,
2019
.
|
Other Items
|
Years Ended December 31,
|
||
|
|
2020
|
2019
|
2018
|
|
Costs
in excess of recovered coal
|
$
590,204
|
$
120,354
|
$
94,335
|
|
Foreign
exchange loss
|
64,841
|
443,203
|
412,663
|
|
Impairment/(recovery)
of mineral property
|
-
|
(13,708,200
)
|
13,994,970
|
|
Impairment
of prepaid expenses
|
121,125
|
51,828
|
26,234
|
|
Impairment
of equipment
|
-
|
-
|
425,925
|
|
Impairment
of receivables
|
470,278
|
16,304
|
21,004
|
|
Loss
on sale of marketable securities
|
-
|
-
|
91,890
|
|
Loss/(gain)
on sale of equipment
|
(13,677
)
|
9,795
|
-
|
|
Gain
on debt settlement
|
-
|
(7,952,700
)
|
(50,000
)
|
|
Other
income
|
-
|
-
|
(130,936
)
|
|
|
$
1,232,771
|
$
(21,019,416
)
|
$
14,886,085
|
9.
PROPOSED TRANSACTIONS
As at
the date of this MD&A, there are no proposed transactions where
the Board or senior management believes that confirmation of the
decision by the Board is probable or with which the Board and
senior management have decided to proceed.
58
SILVER ELEPHANT MINING CORP.
Management’s Discussion and Analysis of Financial Condition
and Results of Operations
For the year ended December 31, 2020
(Expressed
in Canadian Dollars, except where indicated)
10.
LIQUIDITY AND CAPITAL RESOURCES
Working Capital
The
Company utilizes existing cash received from prior issuances of
equity instruments to provide liquidity to the Company and finance
exploration projects.
At
December 31, 2020, the Company had cash flow of $7,608,149,
representing an increase of $4,590,445 from $3,017,704 as at
December 31, 2019. The Company’s working capital at December
31, 2020, was $6,018,935 compared to working capital of $947,465 at
December 31, 2019.
On May
1, 2020 and on May 20, 2020, the Company closed the May 2020
Private Placement for aggregate gross proceeds of $1,930,500 and
share compensation for services of $45,500, through the issuance of
15,200,000 units of the Company at a price of $0.13 per Unit. Each
Unit is comprised of one Common Share and one Warrant. Each Warrant
entitles the holder to purchase one Common Share at an exercise
price of $0.16 for a period of three years from the date of
issuance. The Company paid $3,250 in cash and issued 156,900 Units
as finder’s fees in connection with the May 2020 Private
Placement.
The net
proceeds of the May 2020 Private Placement were expected to be used
for the Company’s mineral project development and for general
working capital purposes. The following table compares the
estimated use of net proceeds from the May 2020 Private Placement
and the actual use of proceeds as of December 31,
2020.
|
Description of expenditure
|
Originally proposed
use of proceeds
|
Actual use of proceeds
as of December 31, 2020
|
|
Development
of mineral properties
|
$
1,676,838
|
$
1,629,546
|
|
General
and administrative expenses
|
$
250,412
|
$
297,704
|
|
|
$
1,927,250
|
$
1,927,250
|
As of
December 31, 2020, the net proceeds from the May 2020 Private
Placement were fully applied.
On
November 24, 2020, the Company closed its bought deal short form
prospectus offering pursuant to which the Company has issued
23,000,000 Common Shares at a price of $0.40 per Common Share for
aggregate gross proceeds of $9,200,000.
Pursuant to the terms and conditions of the
Underwriting Agreement, the Company paid a cash commission to the
Underwriters of $534,000, additional fees of $391,545 and issued
1,335,000 Share purchase warrants as a finder’s fee in
relation with the Offering.
The net proceeds from
the Offering will be used for the exploration, development and/or
improvement of the Company’s mineral properties and for
working capital purposes.
The
following table compares the estimated use of net proceeds from the
November 2020 Offering and the actual use of proceeds as of
December 31, 2020.
|
Description of expenditure
|
Originally proposed
use of proceeds
|
Actual use of proceeds
as of December 31, 2020
|
|
Expoloration
- Phase 1 of Pulacayo Project
|
$
3,240,000
|
$
663,100
|
|
Expoloration
- Triunfo Project
|
$
980,000
|
$
48,741
|
|
Expoloration
- Sunawayo Project
|
$
1,700,000
|
$
51,604
|
|
Working
capital and general corporate purposes
|
$
1,300,000
|
$
190,568
|
|
Total
|
$
7,220,000
|
$
954,013
|
During the
year ended December 31, 2020,
14,027,670 Common Share purchase warrants and
1,233,750 stock options were exercised for aggregate proceeds of
$3,407,006. Subsequent to the year end, and as at the date of this
MD&A, 4,554,990 Common Share purchase warrants were exercised
for aggregate proceeds of $1,164,297.
59
SILVER ELEPHANT MINING CORP.
Management’s Discussion and Analysis of Financial Condition
and Results of Operations
For the year ended December 31, 2020
(Expressed
in Canadian Dollars, except where indicated)
Subsequent
to the year ended December 31, 2020, the Company closed the
February 2021 Placement through the issuance of 10,000,001 Common
Shares at a price of $0.375 per Common Share. The February 2021
Placement raised gross cash proceeds of $3,750,000
.
The Company paid $73,875 in
cash as finder’s fees
.
Proceeds of the February
2021 Placement are expected to be used for exploration, working
capital and general corporate purposes which may include project
evaluations and acquisitions.
As at
the date of this MD&A, the Company has cash flow of $1 million
and the Company’s working capital is $0.7
million.
The
Company’s cash flow highlights for the year ended December
31, 2020, are presented in the table below.
Sources and Use of
Cash
|
|
Years Ended December 31,
|
||
|
|
2020
|
2019
|
2018
|
|
Cash
Used in Operating Activities
|
$
(2,549,042
)
|
$
(2,675,513
)
|
$
(2,626,687
)
|
|
Cash
Used in Investing Activities
|
(6,397,063
)
|
(6,236,965
)
|
(3,628,762
)
|
|
Cash
Provided by Financing Activities
|
13,536,550
|
6,626,085
|
7,458,938
|
|
Net
Decrease in Cash
|
4,590,445
|
(2,286,393
)
|
1,203,489
|
|
Cash
- beginning of year
|
3,017,704
|
5,304,097
|
4,100,608
|
|
Cash
- end of year
|
$
7,608,149
|
$
3,017,704
|
$
5,304,097
|
2020
Operating activities:
During the year ended December 31,
2020,
cash used in
operating activities was $2,549,042 compared to $2,675,513 during
the year ended December 31, 2019 (2018 - $2,626,687). The decreased
outflows in 2020 year related to decreased activities of the
Company due to the COVID-19 pandemic.
Investing activities
:
During the year ended December 31, 2020, the Company used
$6,397,063 in investing activities (2019 - $6,236,965. 2018 -
$3,628,762). During the year ended December 31, 2020, the Company
spent $6,336,166 (2019 - $6,126,401, 2018 - $3,609,896) on its
mineral projects exploration activities and $111,592 (year 2019 -
$113,564, 2018 - $120,416) on purchase of equipment and received
$50,695 on sale of equipment 2019 - $Nil, 2018 -
$Nil).
Financing activities
:
During the year ended December 31, 2020, a total of $13,536,550 was
provided by financing activities (2019 – $6,626,085, 2018 -
$7,458,938) including net proceeds from private placements of
$10,201,706 (2019 - $6,237,791, 2018 - $6,096,621), $299,812 from
exercise of stock options (2019 - $174,250, 2018 - $24,150),
$3,072,194 from exercise of warrants (2019 - $250,572, 2018 -
$1,338,167). The Company also spent $37,162 (2019 - $36,528) for
corporate office lease payments.
2019
During
the year ended December 31, 2019, cash used in operating activities
was $2,675,513 compared to $2,626,687 cash used during the prior
year. The increased outflows in 2019 primarily related to increased
activities of the Company to develop the Pulacayo Project and the
Gibellini Project.
During
the year ended December 31, 2019, the Company used $6,236,965 in
investing activities (2018 – $3,628,762). The Company used
$113,564 (2018 - $120,416) on purchase of property and equipment,
$6,123,401 (2018 - $3,609,896) on mineral property
expenditures.
During
the year ended December 31, 2019, a total of $6,626,085 was
provided by financing activities including net proceeds from the
Company’s share issuance of $6,237,791, an additional
$174,250 from exercise of stock options, and $250,572 from the
exercise of warrants to purchase the common shares of the Company.
The Company spent $36,528 for lease payments.
60
SILVER ELEPHANT MINING CORP.
Management’s Discussion and Analysis of Financial Condition
and Results of Operations
For the year ended December 31, 2020
(Expressed
in Canadian Dollars, except where indicated)
2018
During
the year ended December 31, 2018, cash used in operating activities
was $2,626,687 compared to $707,231 cash used during the prior
year. The increased outflows in 2018 primarily related to increased
activities of the Company to develop the Gibellini Project. The
year over year increase in cash used by operating activities is due
to increased funds required for working capital
changes.
During
the year ended December 31, 2018, the Company used $3,628,762 in
investing activities (2017 – $1,988,566). The Company
received net proceeds of $101,550 from selling its marketable
securities, used $120,416 (2017 - $515,609) on purchase of property
and equipment, $425,605 (2017 - $58,790) on the acquisition of the
Gibellini claims, and $3,184,294 (2017 - $1,339,417) on mineral
properties expenditures.
During
the year ended December 31, 2018, a total of $7,458,938 was
provided by financing activities including net proceeds from The
Company’s share issuance of $6,096, 621, $24,150 from
exercise of stock options, and $1,338,167 from the exercise of
warrants to purchase the common shares of the Company.
Capital Resources
As an
exploration company, the Company has no regular cash in-flow from
operations, and the level of operations is principally a function
of availability of capital resources. The Company’s capital
resources are largely determined by the strength of the junior
resource markets and by the status of the Company’s projects
in relation to these markets, and its ability to compete for
investor support of its projects. See the disclosure under the
heading “
Key
Information
-
Risk
Factors
” in the 2020 Annual Report. To date, the
principal sources of funding have been equity and debt financing.
Many factors influence the Company’s ability to raise funds,
and there is no assurance that the Company will be successful in
obtaining adequate financing with favourable terms, or at all, for
these or other purposes including general working capital
purposes.
For the
foreseeable future, as existing properties are explored, evaluated
and developed, the Company will continue to seek capital through
the issuance of equity, strategic alliances or joint ventures, and
debt, of which the Company currently has none.
The
Company expects to continue requiring cash for operations and
exploration and evaluation activities as expenditures are incurred
while no revenues are generated. Therefore, its continuance as a
going concern is dependent upon its ability to obtain adequate
financing to fund future operations based on annual budgets
approved by the Company's board of directors, consistent with
established internal control guidelines, and programs recommended
in the Pulacayo Technical Report. The Company has managed its
working capital by controlling its spending on its properties and
operations. Due to the ongoing planned advancement of Pulacayo
Project milestones, the Company will continue to incur costs
associated with exploration, evaluation and development activities,
while no revenues are being generated. In response to the COVID-19
pandemic, exploration in Bolivia may be impacted by government
restrictions on the Company’s operations. Potential stoppages
on exploration activities could result in additional costs, project
delays, cost overruns, and operational restart costs. The total
amount of funds that the Company needs to carry out its proposed
operations may increase from these and other consequences of the
COVID-19 pandemic. The actual amount that the Company spends in
connection with each of the intended uses of proceeds may vary
significantly and will depend on a number of factors, including
those referred to under "
Risk
Factors
".
Our
Annual Financial Statements have been prepared on a going concern
basis which assumes that we will be able to realize our assets and
discharge our liabilities in the normal course of business for the
foreseeable future. Our ability to continue as a going concern is
dependent upon the continued support from our shareholders, the
discovery of economically recoverable reserves, and our ability to
obtain the financing necessary to complete development and achieve
profitable operations in the future. The outcome of these matters
cannot be predicted at this time.
Contractual Commitments
The
Company’s commitments related to mineral properties are
disclosed in Note 14 to the Annual Financial Statements. The
Company has no commitments for capital expenditures.
61
SILVER ELEPHANT MINING CORP.
Management’s Discussion and Analysis of Financial Condition
and Results of Operations
For the year ended December 31, 2020
(Expressed
in Canadian Dollars, except where indicated)
Capital Risk Management
The
Company considers its capital structure to consist of Common
Shares, stock options and Common Share purchase warrants. The
Company manages its capital structure and makes adjustments to it,
based on the funds available to the Company, in order to support
the exploration and development of its projects and to pursue and
support growth opportunities. The Board does not establish
quantitative returns on capital criteria for management. The
Company is not subject to externally imposed capital requirements.
There has been no change in the Company’s approach to capital
management during the year ended December 31, 2020.
Management
is aware that market conditions, driven primarily by vanadium,
silver, other metal and coal prices, may limit the Company’s
ability to raise additional funds. These factors, and others, are
considered when shaping the Company’s capital management
strategy.
The
Company’s business could be adversely impacted by the effects
of the COVID-19 coronavirus. The extent to which COVID-19 may
impact the Company’s business, including its operations and
the market for its securities, will depend on future developments
which cannot be predicted, and include the duration, severity and
scope of the outbreak and the actions taken to contain or treat the
outbreak.
11.
CONTINGENCIES
The
Company accrues for liabilities when they are probable and the
amount payable can be reasonably estimated.
ASC Tax
Claim
On
January 2, 2015, the Company acquired ASC Holdings Limited and ASC
Bolivia LDC (which together, hold ASC Bolivia LDC Sucursal Bolivia,
which in turn, held Apogee Silver Ltd.’s (“
Apogee
”) then joint venture
interest in the Pulacayo Project) and Apogee Minerals Bolivia S.A.
Pursuant to the terms of the Definitive Agreement dated November 3,
2014 between the Company and Apogee, the Company agreed to assume
all liabilities of these former Apogee subsidiaries, including
legal and tax liabilities associated with the Pulacayo Project.
During Apogee’s financial year ended June 30, 2014, it
received notice from the Servicio de Impuestos Nacionales, the
national tax authority in Bolivia, that ASC Bolivia LDC Sucursal
Bolivia, now the Company’s wholly-owned subsidiary, owed
approximately 42,000,000 Bolivian boliviano in taxes, interest and
penalties relating to a historical tax liability in an amount
originally assessed at approximately $760,000 in 2004, prior to
Apogee acquiring the subsidiary in 2011.
Apogee
disputed the assessment and disclosed to the Company that it
believed the notice was improperly issued. The Company continued to
dispute the assessment and hired local legal counsel to pursue an
appeal of the tax authority’s assessment on both substantive
and procedural grounds. The Company received a positive Resolution
issued by the Bolivian Constitutional Court that, among other
things, declared the previous Resolution of the Bolivian Supreme
Court issued in 2011, that imposed the tax liability on ASC Bolivia
LDC Sucursal Bolivia, null and void and sent the matter back to the
Supreme Court of Bolivia to consider and issue a new
Resolution.
On November 18, 2019, the Company received Resolution No. 195/2018
issued by the Supreme Court of Bolivia which declared the tax claim
brought by the
national tax authority in Bolivia
against the Company’s Bolivian
subsidiary as not proven. This Resolution is final and
binding, hence neither the Company nor the Company’s Bolivian
subsidiaries owe any outstanding back taxes to the
national
tax authority in Bolivia
.
During
the year ended December 31, 2019, the Company and legal counsel
reassessed the status of tax rulings and determined that the
probability of a re-issuance of a tax claim against the Company in
connection with the above was remote. As a result, the Company has
written off the tax liability and recorded a debt settlement gain
in the amount of $7,952,700 on its consolidated statements of
operations and comprehensive loss.
62
SILVER ELEPHANT MINING CORP.
Management’s Discussion and Analysis of Financial Condition
and Results of Operations
For the year ended December 31, 2020
(Expressed
in Canadian Dollars, except where indicated)
Red Hill tax claim
During
the year ended December 31, 2014, the Company’s wholly-owned
subsidiary, Red Hill Mongolia LLC (“
Red Hill
”) was issued a letter
from the Sukhbaatar District Tax Division in Mongolia, notifying it
of the results of the Sukhbaatar District Tax Division’s
value added tax ("
VAT
")
inspection of Red Hill’s 2009-2013 tax imposition and
payments that resulted in validating VAT credits of only
235,718,533 Mongolian tugrik
from Red Hill’s
claimed VAT credit of 2,654,175,507 Mongolian tugrik. Red Hill
disagreed with the Sukhbaatar District Tax Division’s
findings as the tax assessment appeared to the Company to be
unfounded. The Company disputed the Sukhbaatar District Tax
Division’s assessment and submitted a complaint to the
Capital City Tax Tribunal. On March 24, 2015, the Capital City Tax
Tribunal resolved to refer the matter back to the Sukhbaatar
District Tax Division for revision and separation of the action
between confirmation of Red Hill’s VAT credit, and the
imposition of the penalty/deduction for the tax assessment. Due to
the uncertainty of realizing the VAT balance, the Company has
recorded an impairment charge for the full VAT balance in the year
ended December 31, 2015.
In
June 2019, the Company received a
positive resolution issued from the
Capital City Tax
Tribunal
regarding the Company’s
VAT dispute with the Mongolia tax office. The resolution, which is
binding and final, affirmed Red Hill’s outstanding VAT credit
of 1.169
billion Mongolian tugrik resulted from past
mining equipment
purchases.
The VAT credit can be used to offset Red Hill’s taxes and
royalty payments; or be refunded in cash by Mongolia’s
Ministry of Finance within 12 to 24 months.
Due to the
credit risk associated with the VAT credit, the Company has
provided a full valuation provision against the
balance.
12.
ENVIRONMENTAL REGULATIONS
The
Company’s exploration activities are subject to various
government regulation in the United States, Canada, Mongolia and
Bolivia. These laws and regulations are continually changing and
are generally becoming more restrictive. The Company conducts its
operations so as to protect public health and the environment, and
believes its operations are materially in compliance with all
applicable laws and regulations. The Company has made, and expects
to continue to make in the future, filings and expenditures to
comply with such laws and regulations.
13.
RELATED PARTY DISCLOSURES
The
Company had related party transactions with the following
companies, related by way of directors and key management
personnel:
●
Linx Partners Ltd.,
a private company controlled by John Lee, Director, Chief Executive
Officer and Executive Chairman of the Company, provides management
and consulting services to the Company.
●
MaKevCo Consulting
Inc., a private company 50% owned by Greg Hall, a director of the
Company, provides consulting services to the Company.
●
Sophir Asia Ltd., a
private company controlled by Masa Igata, a director of the
Company, provides consulting services to the Company.
A
summary of amounts paid or accrued to related parties is as
follows:
|
|
Year
Ended December 31,
|
||
|
Related
parties
|
2020
|
2019
|
2018
|
|
Directors
and officers
|
$
1,536,167
|
$
1,685,242
|
$
1,265,152
|
|
Linx
Partners Ltd.
|
740,000
|
371,000
|
401,044
|
|
MaKevCo
Consulting Inc.
|
32,800
|
21,400
|
21,200
|
|
Sophir
Asia Ltd.
|
26,100
|
19,600
|
19,100
|
|
|
$
2,335,067
|
$
2,097,242
|
$
1,706,496
|
63
SILVER ELEPHANT MINING CORP.
Management’s Discussion and Analysis of Financial Condition
and Results of Operations
For the year ended December 31, 2020
(Expressed
in Canadian Dollars, except where indicated)
A
summary of the transactions by nature among the related parties is
as follows:
|
|
Year
Ended December 31,
|
||
|
Related
parties
|
2020
|
2019
|
2018
|
|
Consulting
and management fees
|
$
370,000
|
$
218,500
|
$
268,456
|
|
Directors'
fees
|
108,600
|
103,805
|
70,378
|
|
Mineral
properties
|
1,387,067
|
1,171,585
|
631,610
|
|
Salaries
|
469,400
|
603,352
|
736,052
|
|
|
$
2,335,067
|
$
2,097,242
|
$
1,706,496
|
As at
December 31, 2020, amounts due to related parties totaled $1,800
(as at December 31, 2019 – $30,533, as at December 31, 2018 -
$4,634).
On
October 10, 2018, the Company announced the appointment of Gerald
Panneton as the Company’s President and new Chief Executive
Officer, replacing John Lee, who remains as Chairman of the Board.
Pursuant to
the terms of Mr. Panneton’s employment agreement with the
Company, the Company has granted to Mr. Panneton 1,000,000 with a
fair value of $0.35 per Share of bonus shares and 500,000 incentive
stock options exercisable at a price of $0.26 per Common share for
a term of five years expiring on October 10, 2023 and which vest at
12.5% per quarter for the first two years following the date of
grant.
Key
management personnel are those persons having authority and
responsibility for planning, directing and controlling the
activities of the Company, including directors of the Company. The
amounts due to related parties is as follows:
|
|
Year
Ended December 31,
|
||
|
Key
Management Personnel
|
2020
|
2019
|
2018
|
|
Salaries
and short term benefits
|
$
522,359
|
$
696,751
|
$
775,064
|
|
Directors'
fees
|
108,600
|
103,805
|
70,378
|
|
Share-based
payments
|
1,054,812
|
431,037
|
621,339
|
|
|
$
1,685,771
|
$
1,231,593
|
$
1,466,781
|
14.
CRITICAL ACCOUNTING ESTIMATES AND JUDGMENTS
Critical
accounting estimates used in the preparation of the Annual
Financial Statements include determining the carrying value of
mineral properties exploration and evaluation projects and property
and equipment, assessing the impairment of long-lived assets,
determination of environmental obligation provision for closure and
reclamation, determining deferred income taxes, and the valuation
of Share-based payments. These estimates involve considerable
judgment and are, or could be, affected by significant factors that
are out of the Company’s control.
Readers
are encouraged to read the significant accounting policies and
estimates as described in the Company’s Annual Financial
Statements for the year ended December 31, 2020 (Refer to Notes 4,
5, and 6 to the Annual Financial Statements). The Company’s
Annual Financial Statements have been prepared using the going
concern assumption.
Significant Accounting Judgments and Estimates
The
Company bases its estimates and assumptions on current and various
other factors that it believes to be reasonable under the
circumstances. Management believes the estimates are reasonable;
however, actual results could differ from those estimates and could
impact future results of operations and cash flows. The areas which
require management to make significant judgements, estimates and
assumptions in determining carrying values include, but are not
limited to:
64
SILVER ELEPHANT MINING CORP.
Management’s Discussion and Analysis of Financial Condition
and Results of Operations
For the year ended December 31, 2020
(Expressed
in Canadian Dollars, except where indicated)
The
significant judgments that the Company’s management has made
in the process of applying the Company’s accounting policies,
apart from those involving estimation uncertainties (Note 5 to the
Annual Financial Statements), that have the most significant effect
on the amounts recognized in the Annual Financial Statements
include, but are not limited to:
(a)
Functional currency
determination
The
functional currency for each of the Company’s subsidiaries is
the currency of the primary economic environment and the Company
reconsiders the functional currency of its entities if there is a
change in events and conditions which determined the primary
economic environment. Management has determined the functional
currency of all entities to be the Canadian dollar.
(b)
Economic
recoverability and probability of future economic benefits of
exploration, evaluation and development costs
Management
has determined that exploratory drilling, evaluation, development
and related costs incurred which have been capitalized are
economically recoverable. Management uses several criteria in its
assessments of economic recoverability and probability of future
economic benefit including geologic and metallurgic information,
history of conversion of mineral deposits to proven and probable
reserves, scoping, prefeasibility and feasibility studies,
assessable facilities, existing permits and life of mine
plans.
Management
has determined that during the year ended December 31, 2020, none
of the Company’s silver and vanadium projects have reached
technical feasibility and commercial viability and therefore remain
within Mineral Properties on the Statement of Financial
Position.
(c)
Impairment
(recovery) assessment of deferred exploration
interests
The
Company considers both external and internal sources of information
in assessing whether there are any indications that mineral
property interests are impaired. External sources of information
the Company considers include changes in the market, economic and
legal environment in which the Company operates that are not within
its control and affect the recoverable amount of mineral property
interest. Internal sources of information the Company considers
include the manner in which mineral properties and plant and
equipment are being used or are expected to be used and indications
of economic performance of the assets.
(d)
Deferred tax assets
and liabilities
The
measurement of the deferred tax provision is subject to uncertainty
associated with the timing of future events and changes in
legislation, tax rates and interpretations by tax authorities. The
estimation of deferred taxes includes evaluating the recoverability
of deferred tax assets based on an assessment of the
Company’s ability to utilize the underlying future tax
deductions against future taxable income prior to expiry of those
deductions For deferred tax calculation purposes, Management
assesses whether it is probable that some or all of the deferred
income tax assets will not be realized. The ultimate realization of
deferred tax assets is dependent upon the generation of future
taxable income, which in turn is dependent upon the successful
discovery, extraction, development and commercialization of mineral
reserves. To the extent that management’s assessment of the
Company’s ability to utilize future tax deductions changes,
the Company would be required to recognize more or fewer deferred
tax assets, and future tax provisions or recoveries could be
affected.
(e)
Mineral
reserves
The recoverability of the carrying value of the mineral properties
is dependent on successful development and commercial exploitation,
or alternatively, sale of the respective areas of
interest.
65
SILVER ELEPHANT MINING CORP.
Management’s Discussion and Analysis of Financial Condition
and Results of Operations
For the year ended December 31, 2020
(Expressed
in Canadian Dollars, except where indicated)
(f)
Depreciation
Significant
judgment is involved in the determination of useful life and
residual values for the computation of depreciation, depletion and
amortization and no assurance can be given that actual useful lives
and residual values will not differ significantly from current
assumptions.
(g)
Impairment
The
carrying value of long-lived assets are reviewed each reporting
period to determine whether there is any indication of impairment.
If the carrying amount of an asset exceeds its recoverable amount,
the asset is impaired, and an impairment loss is recognized in the
consolidated statement of operations. The assessment of fair
values, including those of the cash generating units (the smallest
identifiable group of assets that generates cash inflows that are
largely independent of the cash inflow from other assets or groups
of assets) (“
CGUs
”) for purposes of testing
impairment, require the use of estimates and assumptions for
recoverable production, long-term commodity prices, discount rates,
foreign exchange rates, future capital requirements and operating
performance. Changes in any of the assumptions or estimates used in
determining the fair value of long-lived assets could impact the
impairment analysis.
(h)
Allowance for
doubtful accounts, and the recoverability of receivables and
prepaid expense amounts
Significant
estimates are involved in the determination of recoverability of
receivables and no assurance can be given that actual proceeds will
not differ significantly from current estimations. Similarly,
significant estimates are involved in the determination of the
recoverability of services and/or goods related to the prepaid
expense amounts, and actual results could differ significantly from
current estimations.
(i)
Provision for
closure and reclamation
The
Company assesses its mineral properties’ rehabilitation
provision at each reporting date or when new material information
becomes available. Exploration, development and mining activities
are subject to various laws and regulations governing the
protection of the environment. In general, these laws and
regulations are continually changing, and the Company has made, and
intends to make in the future, expenditures to comply with such
laws and regulations. Accounting for reclamation obligations
requires management to make estimates of the future costs that the
Company will incur to complete the reclamation work required to
comply with existing laws and regulations at each location. Actual
costs incurred may differ from those amounts
estimated.
Also,
future changes to environmental laws and regulations could increase
the extent of reclamation and remediation work required to be
performed by the Company. Increases in future costs could
materially impact the amounts charged to operations for reclamation
and remediation. The provision represents management’s best
estimate of the present value of the future reclamation and
remediation obligation. The actual future expenditures may differ
from the amounts currently provided.
(j)
Share-based
payments
Management
uses valuation techniques in measuring the fair value of share
purchase options granted. The fair value is determined using the
Black Scholes option pricing model which requires management to
make certain estimates, judgement, and assumptions in relation to
the expected life of the share purchase options and Common Share
purchase warrants, expected volatility, expected risk-free rate,
and expected forfeiture rate. Changes to these assumptions could
have a material impact on the Annual Financial
Statements.
(k)
Contingencies
The
assessment of contingencies involves the exercise of significant
judgment and estimates of the outcome of future events. In
assessing loss contingencies related to legal proceedings that are
pending against the Company and that may result in regulatory or
government actions that may negatively impact the Company’s
business or operations, the Company and its legal counsel evaluate
the perceived merits of the legal proceeding or unasserted claim or
action as well as the perceived merits of the nature and amount of
relief sought or expected to be sought, when determining the
amount, if any, to recognize as a contingent liability or when
assessing the impact on the carrying value of the Company’s
assets. Contingent assets are not recognized in the Annual
Financial Statements.
66
SILVER ELEPHANT MINING CORP.
Management’s Discussion and Analysis of Financial Condition
and Results of Operations
For the year ended December 31, 2020
(Expressed
in Canadian Dollars, except where indicated)
(l)
Fair value
measurement
The
Company measures financial instruments at fair value at each
reporting date. The fair values of financial instruments measured
at amortized cost are disclosed in Note 21 to the Annual Financial
Statements
.
Also, from time
to time, the fair values of non-financial assets and liabilities
are required to be determined, for example when the entity acquires
a business, completes an asset acquisition or where an entity
measures the recoverable amount of an asset or cash-generating unit
at fair value less costs of disposal. Fair value is the price that
would be received to sell an asset or paid to transfer a liability
in an orderly transaction between market participants at the
measurement date.
The
fair value of an asset or a liability is measured using the
assumptions that market participants would use when pricing the
asset or liability, assuming that market participants act in their
economic best interest. A fair value measurement of a non-financial
asset takes into account a market participant’s ability to
generate economic benefits by using the asset in its highest and
best use or by selling it to another market participant that would
use the asset in its highest and best use. The Company uses
valuation techniques that are appropriate in the circumstances and
for which sufficient data are available to measure fair value,
maximising the use of relevant observable inputs and minimising the
use of unobservable inputs. Changes in estimates and assumptions
about these inputs could affect the reported fair
value.
COVID-19
An
emerging risk is a risk not well understood at the current time and
for which the impacts on strategy and financial results are
difficult to assess or are in the process of being assessed. Since
December 31, 2019, the outbreak of COVID-19 has resulted in
governments worldwide enacting emergency measures to combat the
spread of the virus. These measures, which include the
implementation of travel bans, self-imposed quarantine periods and
social distancing, have caused material disruption to businesses
globally, resulting in an economic slowdown. Global equity markets
have experienced significant volatility and weakness. Governments
and central banks have reacted with significant monetary and fiscal
interventions designed to stabilize economic conditions. The
duration and impact of the COVID-19 outbreak is unknown at this
time, as is the efficacy of the government and central bank
interventions. It is not possible to reliably estimate the length
and severity of these developments and the impact on the financial
results and condition of the Company and its operating subsidiaries
in future periods.
COVID-19
may impact Company operations, and consequently, the nature and
amounts and disclosures in the financial statements. Some of the
specific areas impacted by COVID-19 include, but are not limited
to:
●
Going concern
assessments;
●
Evaluation of
subsequent events;
●
Impairment and
recovery of mineral assets;
●
Fair value
measurements;
●
Lease
modifications;
●
Employee
termination benefits; and
●
Financial statement
and Management Discussion & Analysis disclosures.
As at
the date of this MD&A the COVID-19 pandemic has not affected
the Company’s critical accounting policies.
Same accounting policies as annual audited consolidated financial
statements
The
Company followed the same accounting policies and methods of
computation in the Annual Financial Statements for the year ended
December 31, 2020 as followed in the consolidated financial
statements for the year ended December 31, 2019. The Company
describes its significant accounting policies as well and changes
in accounting policies in Notes 4 and 6 of Annual Financial
Statements. No significant changes in accounting policies have
occurred other that the implantation of a new IFS as issued by the
IASB.
67
SILVER ELEPHANT MINING CORP.
Management’s Discussion and Analysis of Financial Condition
and Results of Operations
For the year ended December 31, 2020
(Expressed
in Canadian Dollars, except where indicated)
Basis of consolidation
The
Annual Financial Statements include the accounts of the Company and
its controlled subsidiaries. All material intercompany balances and
transactions have been eliminated. The Company’s the
significant subsidiaries at the date of these MD&A are
presented in the table below:
|
Subsidy
|
Location
|
Ownership interest
|
Projects Owned
|
|
Nevada Vandium LLC
|
USA
|
100%
|
Gibellini project
|
|
VC Exploration (US) Inc.
|
USA
|
100%
|
Gibellini project
|
|
Apogee Minerals Bolivia S.A.
|
Bolivia
|
98%
|
Pulacayo project
|
|
ASC Holdings Limited
|
Bolivia
|
100%
|
Pulacayo project
|
|
Red Hill Mongolia LLC
|
Mongolia
|
100%
|
Ulaan Ovoo mine
|
|
Chandgana Coal LLC
|
Mongolia
|
100%
|
Chandgana project
|
15.
ACCOUNTING CHANGES AND RECENT ACCOUNTING
PRONOUNCEMENTS
Amendment to IFRS 16, COVID
‐
19
‐
Related Rent
Concessions
In May
2020, the International Accounting Standards Board
(“IASB”) issued an amendment to permit lessees, as a
practical expedient, not to assess whether particular rent
concessions that reduce lease payments occurring as a direct
consequence of the COVID
‐
19 pandemic are lease
modifications and instead to account for those rent concessions as
if they are not lease modifications. The amendment is
effective for annual reporting periods beginning on or after June
1, 2020, with earlier application permitted. The adoption of this
amendment is not expected to have an impact on the financial
statements.
Amendments to IAS 1 and IAS 8: Definition of
Material
In
October 2018, the IASB issued amendments to IAS 1, Presentation of
Financial Statements, and IAS 8, Accounting Policies, Changes in
Accounting Estimates and Errors, to align the definition of
“material” across the standards and to clarify certain
aspects of the definition. The new definition states that,
“Information is material if omitting, misstating or obscuring
it could reasonably be expected to influence decisions that the
primary users of general purpose financial statements make on the
basis of those financial statements, which provide financial
information about a specific reporting entity.”
These amendments are effective for annual periods beginning on or
after January 1, 2020. The amendments to the definition of material
did not have a significant impact on the Annual Financial
Statements.
Future Accounting Pronouncements
The
Company has not early adopted any standard, interpretation or
amendment that has been issued but is not yet
effective.
Amendments
to IAS 16: Property, Plant and Equipment: Proceeds before Intended
Use. In May 2020, the IASB issued amendments to IAS 16,
Property, Plant and
Equipment
(IAS 16). The amendments prohibit a company from
deducting from the cost of property, plant and equipment amounts
received from selling items produced while the company is preparing
the asset for its intended use. Instead, a company will recognize
such sales proceeds and related costs in profit (loss). An entity
is required to apply these amendments for annual reporting periods
beginning on or after January 1, 2022. The amendments are applied
retrospectively only to items of property, plant and equipment that
are available for use after the beginning of the earliest period
presented in the financial statements in which the entity first
applies the amendments. We are currently assessing the effect of
this amendment on our financial statements.
68
SILVER ELEPHANT MINING CORP.
Management’s Discussion and Analysis of Financial Condition
and Results of Operations
For the year ended December 31, 2020
(Expressed
in Canadian Dollars, except where indicated)
Amendments
to IAS 1: Classification of Liabilities as Current or
Non
‐
Current
and Deferral of Effective Date. In January 2020, the IASB issued
amendments to IAS 1, Presentation of Financial Statements, to
provide a more general approach to the presentation of liabilities
as current or non
‐
current based on
contractual arrangements in place at the reporting
date.
These
amendments:
−
specify that the rights and conditions existing at the end of the
reporting period are relevant in determining whether the Company
has a right to defer settlement of a liability by at least twelve
months;
−
provide that management’s expectations are not a relevant
consideration as to whether the Company will exercise its rights to
defer settlement of a liability; and
−
clarify when a liability is considered settled.
On July
15, 2020, the IASB issued a deferral of the effective date for the
new guidance by one year to annual reporting periods beginning on
or after January 1, 2023 and is to be applied retrospectively. The
Company has not yet determined the impact of these amendments on
its financial statements.
16.
FINANCIAL INSTRUMENTS AND RELATED RISKS
The
Board, through its Audit Committee, is responsible for identifying
the principal risks of the Company and ensuring that risk
management systems are implemented. The Company manages its
exposure to financial risks, including liquidity risk, foreign
exchange rate risk, interest rate risk, and credit risk in
accordance with its risk management framework. The Company’s
board of directors’ reviews the Company’s policies on
an ongoing basis.
Financial Instruments
(Note 21 to the
Annual Financial Statements)
The
following table sets forth the Company’s financial assets
that are measured at fair value on a recurring basis by level
within the fair value hierarchy. The fair value hierarchy gives the
highest priority to Level 1 inputs and the lowest priority to Level
3 inputs. Table below sets forth The Company’s financial
assets measured at fair value by level within the fair value
hierarchy.
|
|
Level 1
|
Level 2
|
Level 3
|
Total
|
|
Financial
assets
|
|
|
|
|
|
Cash,
December 31, 2020
|
$
7,608,149
|
$
-
|
$
-
|
$
7,608,149
|
|
Cash,
December 31, 2019
|
$
3,017,704
|
$
-
|
$
-
|
$
3,017,704
|
|
Cash,
December 31, 2018
|
$
5,304,097
|
$
-
|
$
-
|
$
5,304,097
|
Categories of financial instruments
The
Company considers that the carrying amount of all its financial
assets and financial liabilities measure at amortized cost
approximates their fair value due to their short term nature.
Restricted cash equivalents approximate fair value due to the
nature of the instrument. The Company does not offset financial
assets with financial liabilities. There were no transfers between
Level 1, 2 and 3 for the year ended December 31, 2020.
The
Company’s financial assets and financial liabilities are
categorized as follows:
|
|
December
31, 2020
|
December
31, 2019
|
December
31, 2018
|
|
Fair
value through profit or loss
|
|
|
|
|
Cash
|
$
7,608,149
|
$
3,017,704
|
$
5,304,097
|
|
Amortized
cost
|
|
|
|
|
Receivables
|
$
75,765
|
$
246,671
|
$
36,399
|
|
Restricted
cash equivalents
|
$
34,500
|
$
34,500
|
$
34,500
|
|
|
$
7,718,414
|
$
3,298,875
|
$
5,374,996
|
|
Amortized
cost
|
|
|
|
|
Accounts
payable
|
$
1,717,977
|
$
2,420,392
|
$
1,636,786
|
69
SILVER ELEPHANT MINING CORP.
Management’s Discussion and Analysis of Financial Condition
and Results of Operations
For the year ended December 31, 2020
(Expressed
in Canadian Dollars, except where indicated)
Related Risks
(a)
Liquidity
risk
Liquidity
risk is the risk that an entity will be unable to meet its
financial obligations as they fall due. The Company manages
liquidity risk by preparing cash flow forecasts of upcoming cash
requirements. As at December 31, 2020, the Company had a cash
balance of $7,608,149 (as at December 31, 2019 –
$3,017,704, as at December 31, 2018 - $5,304,097). As at December
31, 2020, the Company had accounts payable and accrued liabilities
of $1,759,163 (as at December 31, 2019 - $2,420,392, as at
December 31, 2018 - $1,636,786), which have contractual maturities
of 90 days or less.
(b)
Credit
risk
Credit
risk is the risk that one party to a financial instrument will fail
to discharge an obligation and cause the other party to incur a
financial loss. The Company is exposed to credit risk primarily
associated to cash and restricted cash equivalents and receivables,
net of allowances. Management believes that the credit risk
concentration with respect to these financial instruments is remote
as the balances primarily consist of amounts on deposit with a
major financial institution and amounts receivable from the
Government of Canada. The carrying amount of assets included on the
statements of financial position represents the maximum credit
exposure.
(c)
Market
risk
The
significant market risks to which the Company is exposed are
interest rate risk, foreign currency risk, and commodity and equity
price risk. The objective of market risk management is to manage
and control market risk exposures within acceptable limits, while
maximizing returns.
(d)
Interest rate
risk
Interest
rate risk is the risk that the fair value or future cash flows of a
financial instrument will fluctuate due to changes in market
interest rates. The Company’s cash and restricted cash
equivalents primarily include highly liquid investments that earn
interest at market rates that are fixed to maturity. Due to
the short
‐
term nature of these financial instruments, fluctuations in market
rates do not have significant impact on the fair values of the
financial instruments as of December 31, 2020
(e)
Foreign currency
risk
The
Company has exploration and development projects in the United
States, Mongolia and Bolivia and undertakes transactions in various
foreign currencies. The Company is therefore exposed to foreign
currency risk arising from transactions denominated in a foreign
currency and the translation of financial instruments denominated
in United States dollars, Mongolian tugrik, and Bolivian boliviano
into its functional and reporting currency, the Canadian dollar.
Based on the above, net exposures as at December 31, 2020, with
other variables unchanged, a 10% (as at December 31, 2019 –
10%, as at December 31, 2018 – 10%) strengthening (weakening)
of the Canadian dollar against the Mongolian tugrik would impact
net loss with other variables unchanged by $100,000. A 10%
strengthening (weakening) of the Canadian dollar against the
Bolivian boliviano would impact net loss with other variables
unchanged by $73,000. A 10% strengthening (weakening) of the US
dollar against the Canadian dollar would impact net loss with other
variables unchanged by $28,000. The Company currently does not use
any foreign exchange contracts to hedge this currency
risk.
(f)
Commodity and
equity price risk
Commodity
price risk is defined as the potential adverse impact on earnings
and economic value due to commodity price movements and
volatilities. Commodity prices fluctuate on a daily basis and are
affected by numerous factors beyond the Company’s control.
The supply and demand for these commodities, the level of interest
rates, the rate of inflation, investment decisions by large holders
of commodities including governmental reserves and stability of
exchange rates can all cause significant fluctuations in prices.
Such external economic factors are in turn influenced by changes in
international investment patterns and monetary systems and
political developments.
70
SILVER ELEPHANT MINING CORP.
Management’s Discussion and Analysis of Financial Condition
and Results of Operations
For the year ended December 31, 2020
(Expressed
in Canadian Dollars, except where indicated)
The
Company is also exposed to price risk with regards to equity
prices. Equity price risk is defined as the potential adverse
impact on the Company’s earning due to movements in
individual equity prices or general movements in the level of the
stock market.
The
Company closely monitors commodity prices, individual equity
movements and the stock market to determine the appropriate course
of action to be taken by the Company. Fluctuations in value may be
significant.
17.
RISKS AND UNCERTAINTIES
The
Company’s business is the exploration, evaluation and
development of mining properties. Thus, the Company’s
operations are speculative due to the high-risk nature of its
business. The following list details existing and future material
risks to the Company. The risks listed below are not arranged in
any particular order and are not exhaustive. Additional risks and
uncertainties not currently known to the Company, or those that it
currently deems to be immaterial, may become material and adversely
affect the Company. The realization of any of these risks may
materially and adversely impact the Company’s business,
financial condition or results of operations and/or the market
price of the Company’s securities. Each of these risk factors
is discussed in more detail under the heading “
Key Information - Risk Factors
”
in the 2020 Annual Report, which is available under the
Company’s SEDAR profile at www.sedar.com.
●
The COVID-19 global
pandemic and the risk of other similar outbreaks and
pandemics;
●
The Company's
history of net losses;
●
Capital costs,
operating costs, production and economic returns;
●
Exploration and
development risks;
●
The Company has no
history of profitable mineral production;
●
The risks inherent
to the estimation of mineral reserves and mineral
resources;
●
Environmental
risks;
●
Foreign operations
risks;
●
The reform of the
mining laws, including the General Mining Act of 1872 in the
U.S;
●
Government
approvals and permits;
●
Risks associated
with the Company's property and mining interests;
●
Risks associated
with the Company's mineral claims, mining leases, licenses and
permits;
●
Title
risks;
●
Risks associated
with claims from First Nations and other Aboriginal or community
groups;
●
Risks associated
with competition;
●
Inherent
risks;
●
The Company's
reliance on key personnel;
●
The volatility of
mineral prices,
●
Currency
fluctuations;
●
Global, national
and local financial conditions;
●
Risks associated
with third-party contractors;
●
Anti-bribery
legislation;
●
Uninsured
risks;
●
The Company has no
history of making dividend payments;
●
Related party
transactions;
●
Litigation and
regulatory proceedings;
●
Cyber security
risks;
●
Risks associated
with being a foreign private issuer;
●
Risks associated
with non-Canadian investors;
●
Risks associated
with the Company's operations in emerging markets; and
●
Emerging risks, as
described below.
71
SILVER ELEPHANT MINING CORP.
Management’s Discussion and Analysis of Financial Condition
and Results of Operations
For the year ended December 31, 2020
(Expressed
in Canadian Dollars, except where indicated)
An
emerging risk is a risk not well understood at the current time and
for which the impacts on strategy and financial results are
difficult to assess or are in the process of being assessed. Since
December 31, 2019, the COVID-19 global pandemic, has resulted in
governments worldwide enacting emergency measures to combat the
spread of the virus. These measures, which include the
implementation of travel bans, self-imposed quarantine periods and
social distancing, have caused material disruption to businesses
globally, resulting in an economic slowdown. Global equity markets
have experienced significant volatility and weakness. Governments
and central banks have reacted with significant monetary and fiscal
interventions designed to stabilize economic conditions. The
duration and impact of the COVID-19 outbreak is unknown at this
time, as is the efficacy of the government and central bank
interventions. It is not possible to reliably estimate the length
and severity of these developments and the impact on the financial
results and condition of the Company and its operating subsidiaries
in future periods.
18.
DISCLOSURE CONTROLS AND PROCEDURES
Disclosure
controls and procedures are designed to provide reasonable
assurance that information required to be disclosed by The Company
in its annual filings, interim filings or other reports filed or
submitted by it under securities legislation is recorded,
processed, summarized and reported within the time periods
specified in the securities legislation and include controls and
procedures designed to ensure that information required to be
disclosed by the Company in its annual filings, interim filings or
other reports filed or submitted under securities legislation is
accumulated and communicated to the Company’s management,
including its Chief Executive Officer and Chief Financial Officer,
as appropriate to allow timely decisions regarding required
disclosure.
The
Company’s disclosure committee is comprised of the Chief
Executive Officer and senior members of management. The disclosure
committee’s responsibilities include determining whether
information is material and ensuring the timely disclosure of
material information in accordance with securities laws. The Board
of Directors is responsible for reviewing the Company’s
disclosure policy, procedures and controls to ensure that it
addresses the Company’s principal business risks, and changes
in operations or structure, and facilitates compliance with
applicable legislative and regulatory reporting
requirements.
The Chief Executive Officer and Chief Financial Officer, after
participating with the Company’s management in evaluating the
effectiveness of the Company’s disclosure controls and
procedures have concluded that the Company’s disclosure
controls and procedures were effective during the year ended
December 31, 2020.
Design of Internal Controls over Financial Reporting
The Company’s management, with the participation of the Chief
Executive Officer and Chief Financial Officer, is responsible for
establishing and maintaining adequate internal control over
financial reporting. The Company’s internal control over
financial reporting is a process designed to provide reasonable
assurance regarding the reliability of financial reporting and the
preparation of financial statements for external purposes in
accordance with IFRS. The Company’s internal control over
financial reporting includes those policies and procedures
that:
●
pertain to the
maintenance of records that, in reasonable detail accurately and
fairly reflect the transactions, acquisition and disposition of
assets and liabilities;
●
provide reasonable
assurance that transactions are recorded as necessary to permit
preparation of the financial statements in accordance with IFRS and
that receipts and expenditures are being made only in accordance
with the authorization of management and directors of The Company;
and
●
provide reasonable
assurance regarding prevention or timely detection of unauthorized
acquisition, use or disposition of assets, and incurrence of
liabilities, that could have a material effect on the financial
statements.
The Company’s management, with the participation of the Chief
Executive Officer and Chief Financial Officer, assessed the
effectiveness of the Company’s internal control over
financial reporting using the criteria set forth in the
Internal Control
– Integrated Framework
(2013) issued by the Committee of Sponsoring
Organizations of the Treadway Commission. Based on this assessment,
management concluded that the Company’s internal control over
financial reporting was effective during the year ended December
31, 2020.
72
SILVER ELEPHANT MINING CORP.
Management’s Discussion and Analysis of Financial Condition
and Results of Operations
For the year ended December 31, 2020
(Expressed
in Canadian Dollars, except where indicated)
19.
CHANGES IN INTERNAL CONTROL OVER FINANCIAL REPORTING
During the year ended December 31, 2020, the Company’s
employees began working remotely due to the COVID-19 pandemic. This
has required certain processes and controls that were previously
done or documented manually to be completed and retained in
electronic form. Despite this, there were no changes to the
Company’s internal control over financial reporting during
the year ended December 31, 2020, that have materially affected, or
are reasonably likely to materially affect, the Company’s
internal control over financial reporting.
Limitations of controls and procedures
The
Company’s management, including the Chief Executive Officer
and the Chief Financial Officer, believe that any disclosure
controls and procedures or internal controls over financial
reporting, no matter how well conceived and operated, can provide
only reasonable, not absolute, assurance that the objectives of the
control system are met. Further, the design of a control system
must reflect the fact that there are resource constraints, and the
benefits of controls must be considered relative to their costs.
Because of the inherent limitations in all control systems, they
cannot provide absolute assurance that all control issues and
instances of fraud, if any, within the Company have been prevented
or detected. These inherent limitations include the realities that
judgements in decision-making can be faulty, and that breakdowns
can occur because of simple error or mistake. Additionally,
controls can be circumvented by the individual acts of some
persons, by collusion of two or more people, or by unauthorized
override of the control. The design of any systems of controls also
is based in part upon certain assumptions about the likelihood of
future events, and there can be no assurance that any design will
succeed in achieving its stated goals under all potential future
conditions. Accordingly, because of the inherent limitations in a
cost-effective control system, misstatements due to error or fraud
may occur and not be detected.
20.
DISCLOSURE OF OUTSTANDING SHARE DATA
As at
the date of this MD&A, the Company had a total of:
●
200,542,449 Common
Shares outstanding with recorded value of
$205,001,744;
●
10,167,500 stock
options outstanding with a weighted average exercise price of
$0.31. Each option is exercisable to purchase one Common Share at
prices ranging from $0.20 to $0.49 per share and expire between
June 2021 and August 2025; and
●
25,016,077
Common
Share purchase warrants outstanding with a weighted average
exercise price of $0.25. Each Common Share purchase warrant is
exercisable to purchase one Common Share at prices ranging from
$0.16 to $0.48 and expire between June 2021 and May
2023.
21.
OFF-BALANCE SHEET ARRANGEMENTS
During
the year ended December 31, 2020, The Company was not a party to
any off-balance-sheet arrangements that have, or are reasonably
likely to have, a current or future effect on the results of
operations, financial condition, revenues or expenses, liquidity,
capital expenditures or capital resources of The
Company.
73
TABLE OF CONTENTS
Part IItem 1. Identity Of Directors, Senior Management and AdvisersItem 2. Offer Statistics and Expected TimetableItem 3. Key InformationItem 5. Operating and Financial Review and ProspectsItem 18. Financial StatementsItem 7. B. Related Party TransactionsItem 4. Information on The CompanyItem 3. D. Risk FactorsItem 4A Unresolved Staff CommentsItem 6. Directors, Senior Management and EmployeesItem 6. A. Directors, Senior Management and Employees - Directors and Senior ManagementItem 7. Major Shareholders and Related Party TransactionsItem 8. Financial InformationItem 9. The Offer and ListingItem 10. Additional InformationItem 11. Quantitative and Qualitative Disclosures About Market RiskItem 12. Description Of Securities Other Than Equity SecuritiesPart IIItem 13. Defaults, Dividend Arrearages and DelinquenciesItem 14. Material Modifications To The Rights Of Security Holders and Use Of ProceedsItem 15. Controls and ProceduresItem 16. [reserved]Item A Audit Committee Financial ExpertItem B Code Of EthicsItem C Principal Accountant Fees and ServicesItem D Exemptions From The Listing Standards For Audit CommitteesItem E Purchases Of Equity Securities By The Issuer and Affiliated PurchasersItem F Change in Registrant S Certifying AccountantItem G Corporate GovernanceItem H Mine Safety DisclosurePart IIIItem 17. Financial StatementsItem 19. Exhibits