SIRIUS XM HOLDINGS INC.
10-Ks and 10-Qs
|
|
|
|
|
|
|
|
|
|
|
|
|
|
|
|
|
|
|
|
|
|
|
|
|
|
|
|
|
|
|
|
|
|
|
|
|
|
|
|
|
|
|
|
|
|
|
|
|
|
|
|
|
|
|
|
|
|
|
UNITED STATES
SECURITIES AND EXCHANGE COMMISSION
WASHINGTON, D.C. 20549
FORM 10-K
|
þ
|
|
ANNUAL REPORT PURSUANT TO SECTION 13 OR 15(d) OF THE SECURITIES EXCHANGE ACT OF 1934
|
|
FOR THE FISCAL YEAR ENDED DECEMBER 31, 2012
|
||
OR
|
o
|
|
TRANSITION REPORT PURSUANT TO SECTION 13 OR 15(d) OF THE SECURITIES EXCHANGE ACT OF 1934
|
|
FOR THE TRANSITION PERIOD FROM __________ TO ________
|
||
COMMISSION FILE NUMBER 001-34295
SIRIUS XM RADIO INC.
(Exact name of registrant as specified in its charter)
|
Delaware
|
|
52-1700207
|
|
(State or other jurisdiction of
incorporation or organization)
|
|
(I.R.S. Employer Identification Number)
|
|
|
|
|
|
1221 Avenue of the Americas, 36th Floor
|
|
|
|
New York, New York
|
|
10020
|
|
(Address of principal executive offices)
|
|
(Zip Code)
|
Securities registered pursuant to Section 12(b) of the Act:
|
Title of Each Class:
|
Name of Each Exchange on Which Registered:
|
|
|
Common Stock, par value $0.001 per share
|
The Nasdaq Global Select Market
|
|
Securities registered pursuant to Section 12(g) of the Act:
None
(Title of class)
Indicate by check mark if the registrant is a well-known seasoned issuer, as defined in Rule 405 of the Securities Act. Yes
þ
No
o
Indicate by check mark if the registrant is not required to file reports pursuant to Section 13 or 15(d) of the Act. Yes
o
No
þ
Indicate by check mark whether the registrant (1) has filed all reports required to be filed by Section 13 or 15(d) of the Securities Exchange Act of 1934 during the preceding 12 months (or for such shorter period that the registrant was required to file such reports) and (2) has been subject to such filing requirements for the past 90 days. Yes
þ
No
o
Indicate by check mark whether the registrant has submitted electronically and posted on its corporate Web site, if any, every Interactive Data File required to be submitted and posted pursuant to Rule 405 of Regulation S-T during the preceding 12 months (or for such shorter period that the registrant was required to submit and post such files). Yes
þ
No
o
Indicate by check mark if disclosure of delinquent filers pursuant to Item 405 of Regulation S-K is not contained herein, and will not be contained, to the best of the registrant's knowledge, in definitive proxy or information statements incorporated by reference in Part III of this Form 10-K or any amendment to this Form 10-K.
o
Indicate by check mark whether the registrant is a large accelerated filer, an accelerated filer, a non-accelerated filer, or a smaller reporting company. See the definitions of “large accelerated filer,” “accelerated filer” and “smaller reporting company” in Rule 12b-2 of the Exchange Act. (Check one):
|
Large accelerated filer
þ
|
|
Accelerated filer
o
|
|
Non-accelerated filer
o
|
|
Smaller reporting company
o
|
|
(Do not check if a smaller reporting company)
|
||||||
Indicate by check mark whether the registrant is a shell company (as defined in Rule 12b-2 of the Act). Yes
o
No
þ
The aggregate market value of the registrant's common stock held by non-affiliates of the registrant as of June 30, 2012 was
$6,943,176,756
. All executive officers and directors of the registrant have been deemed, solely for the purpose of the foregoing calculation, to be “affiliates” of the registrant.
The number of shares of the registrant's common stock outstanding as of
February 1, 2013
was
6,558,986,663
.
DOCUMENTS INCORPORATED BY REFERENCE
Information included in our definitive proxy statement for our 2013 annual meeting of stockholders scheduled to be held on Tuesday, May 21 2013 is incorporated by reference in Items 10, 11, 12, 13 and 14 of Part III of this report.
SIRIUS XM RADIO INC. AND SUBSIDIARIES
2012 FORM 10-K ANNUAL REPORT
TABLE OF CONTENTS
|
Item No.
|
Description
|
|
|
|
|
|||
|
|
|
||
|
|
|
|
|
|
Item 1B
.
|
|||
|
|
|||
|
|
|||
ITEM 1.
BUSINESS
We broadcast our music, sports, entertainment, comedy, talk, news, traffic and weather channels, as well as infotainment services, in the United States on a subscription fee basis through our two proprietary satellite radio systems. Subscribers can also receive music and other channels, plus new features such as SiriusXM On Demand, over the Internet, including through applications for mobile devices.
As of December 31, 2012, we had
23,900,336
subscribers. Our subscribers include:
|
•
|
subscribers under our regular and discounted pricing plans;
|
|
•
|
subscribers that have prepaid, including payments made or due from automakers for subscriptions included in the sale or lease price of a vehicle;
|
|
•
|
certain radios activated for daily rental fleet programs;
|
|
•
|
subscribers to our Internet services who do not also have satellite radio subscriptions; and
|
|
•
|
certain subscribers to our weather, traffic, data and Backseat TV services.
|
Our primary source of revenue is subscription fees, with most of our customers subscribing on an annual, semi-annual, quarterly or monthly basis. We offer discounts for prepaid and long-term subscription plans as well as discounts for multiple subscriptions on each platform. We also derive revenue from activation and other fees, the sale of advertising on select non-music channels, the direct sale of satellite radios and accessories, and other ancillary services, such as our weather, traffic, data and Backseat TV services.
Our satellite radios are primarily distributed through automakers; retail locations nationwide; and through our website. We have agreements with every major automaker to offer satellite radios in their vehicles. Satellite radio services are also offered to customers of certain rental car companies.
As of January 17, 2013, Liberty Media Corporation beneficially owned, directly and indirectly, over 50% of the outstanding shares of our common stock. Liberty Media owns interests in a broad range of media, communications and entertainment businesses, including its subsidiaries Atlanta National League Baseball Club, Inc. and TruePosition, Inc., its interests in Live Nation Entertainment, Barnes & Noble, and minority equity investments in Time Warner Inc. and Viacom.
Certain other important dates in our corporate history are listed below:
|
•
|
Satellite CD Radio, Inc. was incorporated in the State of Delaware on May 17, 1990.
|
|
•
|
On December 7, 1992, Satellite CD Radio, Inc. changed its name to CD Radio Inc., and Satellite CD Radio, Inc. was formed as a wholly owned subsidiary.
|
|
•
|
On November 18, 1999, CD Radio Inc. changed its name to Sirius Satellite Radio Inc.
|
|
•
|
In July 2008, our wholly owned subsidiary, Vernon Merger Corporation, merged (the “Merger”) with and into XM Satellite Radio Holdings Inc.
|
|
•
|
On August 5, 2008, we changed our name from Sirius Satellite Radio Inc. to Sirius XM Radio Inc.
|
|
•
|
In April 2010, XM Satellite Radio Holdings Inc. merged with and into XM Satellite Radio Inc.; and in January 2011, XM Satellite Radio Inc., our wholly-owned subsidiary, merged with and into Sirius XM Radio Inc.
|
Programming
We offer a dynamic programming lineup of commercial-free music plus sports, entertainment, talk, news, traffic and weather. The channel line-ups for our services vary in certain respects and are available at siriusxm.com.
Our subscription packages allow most listeners to enhance our standard programming lineup. Our “XM Premier” package offers subscribers the Howard Stern channels, SiriusXM NFL Radio, SiriusXM NASCAR Radio, Playboy Radio, Sex Radio and play-by-play NFL games and college sports programming. Our “Sirius Premier” package offers subscribers Oprah Radio, Opie and Anthony, SiriusXM Public Radio, MLB Network Radio, SiriusXM NHL Network Radio, SiriusXM PGA TOUR Radio, SiriusXM Fantasy Sports Radio and select play-by-play of NBA and NHL games and college sports programming. Subscribers with a la carte-capable radios may customize the programming they receive through our a la carte subscription packages. We also offer family friendly, “mostly music” and “mostly sports, news and talk” packages.
1
We also offer an expanded channel lineup, including music, sports and comedy channels as well as SiriusXM Latino, a suite of Latin channels, online and over certain new radios. These channels were the first phase of SiriusXM 2.0, an upgrade and evolution of our satellite and Internet delivered service that spans hardware, software, audio, and data services.
We make changes to our programming lineup from time to time as we strive to attract new subscribers and offer content which appeals to a broad range of audiences and to our existing subscribers.
Music Programming
We offer an extensive selection of music genres, ranging from rock, pop and hip-hop to country, dance, jazz, Latin and classical. Within each genre we offer a range of formats, styles and recordings.
All of our original music channels are broadcast commercial free. Certain of our music channels are programmed by third parties and air commercials. Our channels are produced, programmed and hosted by a team of experts in their fields, and each channel is operated as an individual radio station, with a distinct format and branding. We also provide special features, such as our Artist Confidential series which provides interviews and performances from some of the biggest names in music, a Town Hall series that includes a live audience and that has been expanded to include talk and sports, and an array of “pop up” channels featuring the music of particular artists.
Sports Programming
Live play-by-play sports is an important part of our programming strategy. We are the Official Satellite Radio Partner of the National Football League (“NFL”), Major League Baseball (“MLB”), NASCAR, National Basketball Association (“NBA”), National Hockey League (“NHL”) and PGA TOUR, and broadcast most major college sports, including NCAA Division I football and basketball games. Soccer coverage includes matches from the Barclays Premier League. We also air FIS Alpine Skiing, FIFA World Cup events and horse racing.
We offer many exclusive talk channels and programs such as MLB Network Radio, SiriusXM NASCAR Radio, SiriusXM NFL Radio and Chris “Mad Dog” Russo's
Mad Dog Unleashed
on Mad Dog Radio, as well as two ESPN channels, ESPN Radio and ESPN Xtra. Simulcasts of select ESPN television shows, including
SportsCenter
, can be found on ESPN Xtra.
Talk and Entertainment Programming
We offer a multitude of talk and entertainment channels for a variety of audiences. Our diverse spectrum of talk programming is a significant differentiator from terrestrial radio and other audio entertainment providers.
Our talk radio offerings feature dozens of popular talk personalities, many creating radio shows that air exclusively on our services, including Howard Stern, Oprah Winfrey, Dr. Laura Schlessinger, Opie and Anthony, Bob Edwards, Senator Bill Bradley and doctors from the NYU Langone Medical Center.
Our comedy channels present a range of humor such as Jamie Foxx's The Foxxhole, Laugh USA, Blue Collar Comedy and Raw Dog Comedy. Other talk and entertainment channels include SiriusXM Book Radio, Kids Place Live and Radio Disney, as well as Cosmo Radio, OutQ, Road Dog Trucking and Playboy Radio.
Our religious programming includes The Catholic Channel, which is programmed with the Archdiocese of New York, EWTN, a Global Catholic Radio Network, and Family Talk.
News and Information Programming
We offer a wide range of national, international and financial news, including news from BBC World Service News, Bloomberg Radio, CNBC, CNN, FOX News, HLN, MSNBC, NPR and World Radio Network. We also air a range of political call-in talk shows on a variety of channels including our exclusive channel, POTUS.
We offer continuous, local traffic reports for 22 metropolitan markets throughout the United States.
Internet Radio
We stream music channels and select non-music channels over the Internet. Our Internet service also includes channels and features that are not available on our satellite service. Access to our Internet services is offered to subscribers for a fee. We have available products that provide access to our Internet services without the need for a personal computer. We also offer applications to allow consumers to access our Internet services on certain smartphones and tablet computers.
2
In 2012, we launched SiriusXM On Demand. SiriusXM On Demand offers our Internet subscribers listening on our online media player and on smartphones the ability to choose their favorite episodes from a catalog of more than 300 shows and over 3,000 hours of content to listen to whenever they want. SiriusXM On Demand is offered to our Internet subscribers at no extra charge and offers selections from recent shows; selections from our vault of programming; updated content on a daily basis; regularly updated feature content; and easy navigation through the content. SiriusXM On Demand gives subscribers access to shows from sports, comedy, exclusive talk and entertainment, and commercial-free music from many genres such as:
|
The Howard Stern Show
|
Bob Dylan's Theme Time Radio Hour
|
|
|
Tom Petty's Buried Treasure
|
Jimmy Buffett concerts
|
|
|
The Opie & Anthony Show
|
The Jamie Foxx Show
|
|
|
Coach K
|
Dr. Laura
|
|
|
The Bob Edwards Show
|
Mad Dog Unleashed featuring Christopher "Mad Dog" Russo
|
|
|
Ripken Baseball
|
Rotten Tomatoes Radio
|
|
Subscribers also have access to curated selections from our archives, including our exclusive Artist Confidential series and Town Hall specials with Bruce Springsteen, Roger Waters, One Direction, Quentin Tarantino, Aerosmith, Tom Petty, Taylor Swift, Usher, John Travolta & Olivia Newton-John, Ringo Starr, Coldplay, Nirvana, Cardinal Timothy Dolan, Billy Crystal and Coach K. In addition, subscribers get access to exclusive subscriber events, music specials and interviews from across our sports and talk channels.
Distribution of Radios
Automakers
Our primary means of distributing satellite radios is through the sale and lease of new vehicles. We have agreements with every major automaker to offer satellite radios in their vehicles and satellite radios are available as a factory or dealer-installed option in substantially all vehicle makes sold in the United States.
Many automakers include a subscription to our radio service in the sale or lease price of their vehicles. In many cases, we receive subscription payments from automakers in advance of the activation of our service. We share with certain automakers a portion of the revenues we derive from subscribers using vehicles equipped to receive our service. We also reimburse various automakers for certain costs associated with the satellite radios installed in their vehicles, including in certain cases hardware costs, tooling expenses and promotional and advertising expenses.
Previously Owned Vehicles
We acquire an increasing number of subscribers through the sale and lease of previously owned vehicles with factory-installed satellite radios. We have entered into agreements with many automakers to market subscriptions to purchasers and lessees of vehicles which include satellite radios sold through their certified pre-owned programs. In addition, we work directly with franchise and independent dealers on similar programs for non-certified vehicles.
We have developed systems and methods to identify purchasers and lessees of previously owned vehicles which include satellite radios and have established marketing plans to promote our services to these potential subscribers.
Retail
We sell satellite and Internet radios directly to consumers through our website. Satellite and Internet radios are also marketed and distributed through major national and regional retailers. We develop in-store merchandising materials and provide sales force training for several retailers.
Our Satellite Radio Systems
Our satellite radio systems are designed to provide clear reception in most areas despite variations in terrain, buildings and other obstructions. Subscribers can receive our transmissions in all outdoor locations in the continental U.S. where the satellite radio has an unobstructed line-of-sight with one of our satellites or is within range of one of our terrestrial repeaters. We continually monitor our infrastructure and regularly evaluate improvements in technology.
The Federal Communications Commission (the “FCC”) has allocated the portion of the S-band located between 2320 MHz and 2345 MHz exclusively for satellite radio. Each of our services uses 12.5 MHz of this bandwidth to transmit its respective signals. Uplink transmissions (from the ground to our satellites) use 12.5 MHz of bandwidth in the 7060-7072.5 MHz band.
3
Our satellite radio systems have three principal components:
|
•
|
satellites, terrestrial repeaters and other satellite facilities;
|
|
•
|
studios; and
|
|
•
|
radios.
|
Satellites, Terrestrial Repeaters and Other Satellite Facilities
Satellites.
We currently own a fleet of nine orbiting satellites. We have invested in more technologically advanced satellites and satellite deployment to provide for improved coverage, increased redundancy and more efficient use of our spectrum.
Space Systems/Loral has constructed another satellite, FM-6, for use in our system. We expect to launch this satellite in mid-2013.
We use four of our orbiting satellites in the Sirius system. These satellites, FM-1, FM-2, FM-3 and FM-5, are of the Loral FS-1300 model series. Our FM-1, FM-2 and FM-3 satellites travel in a geosynchronous orbit. Our FM-5 satellite is deployed in a geostationary orbit. In 2012, we donated our FM-4, an obsolete spare ground satellite, to the Smithsonian Institution where it will be on display with the Space Shuttle.
We own five orbiting satellites for use in the XM system. All of these satellites operate in a geostationary orbit. Four of these satellites were manufactured by Boeing Satellite Systems International and one was manufactured by Space Systems/Loral.
Satellite Insurance.
We hold in-orbit insurance for our FM-5 and XM-5 satellites which will expire in 2014 and 2015, respectively. These policies provide coverage for a total, constructive total or partial loss of the satellites that occurs during the first five in-orbit years. We also have negotiated launch and in-orbit insurance for our FM-6 satellite. This insurance provides coverage for a total, constructive total or partial loss of FM-6 that occurs from launch through the end of the first annual in-orbit period. The insurance does not cover the full cost of constructing, launching and insuring new satellites, nor will it protect us from the adverse effect on business operations due to the loss of a satellite. The policies contain standard commercial satellite insurance provisions, including coverage exclusions. We use launch and in-orbit insurance to mitigate the potential financial impact of satellite launch and in-orbit failures unless the premium costs are considered to be uneconomical relative to the risk of satellite failure.
Terrestrial Repeaters.
In some areas with high concentrations of tall buildings, such as urban centers, signals from our satellites may be blocked and reception of satellite signals can be adversely affected. In many of these areas, we have deployed terrestrial repeaters to supplement satellite coverage. We operate approximately 700 terrestrial repeaters as part of our systems.
Other Satellite Facilities.
We control and communicate with our satellites from facilities in North America and maintain earth stations in Panama and Ecuador to control and communicate with several of our Sirius satellites. Our satellites are monitored, tracked and controlled by a third party satellite operator.
Studios
Our programming originates principally from studios in New York City and Washington D.C., and, to a lesser extent, from smaller studio facilities in Cleveland, Los Angeles, Memphis, Nashville and Austin. Our New York City offices house our corporate headquarters. Both our New York City and Washington D.C. offices house facilities for programming origination, programming personnel and facilities to transmit programming.
Radios
We design, establish specifications for, source or specify parts and components for, and manage various aspects of the logistics and production of satellite and Internet radios. We do not manufacture radios. We have authorized manufacturers and distributors to produce and distribute radios, and have licensed our technology to various electronics manufacturers to develop, manufacture and distribute radios under certain brands. We purchase radios from independent manufacturers that are distributed through our website. To facilitate the sale of radios, we may subsidize a portion of the radio manufacturing costs to reduce the hardware price to consumers.
Radios are manufactured in four principal configurations - as in-dash radios, Dock & Play radios, home or commercial units and portable radios. We have introduced Edge, a Dock & Play radio capable of receiving our SiriusXM 2.0 expanded channel lineup, including SiriusXM Latino, and Lynx, a portable radio with SiriusXM 2.0 satellite and Internet radio capability
4
and features. We have introduced an interoperable radio, MiRGE, which has a unified control interface allowing for easy switching between our two satellite radio networks. We also offer the XM SkyDock, which connects to an Apple iPhone and iPod touch and provides live XM satellite radio using the control capability of the iPhone or iPod touch.
Telematics
We have announced an agreement with Nissan North America to become the exclusive provider of a comprehensive suite of premium telematics services for Nissan branded vehicles. We are also exploring other opportunities in the telematics industry, including agreements with additional automakers to install our telematics service and the acquisition of businesses or technology that will complement or enhance our telematics service.
Our telematics service will integrate information and communications technology in vehicles and will include, among other services, 24/7 emergency support for accidents, stolen vehicle tracking and roadside assistance. We anticipate that subscribers will enjoy the simplicity of a consolidated bill for their audio entertainment and a central site to manage subscriptions.
Canada
We have an equity interest in the satellite radio services offered in Canada through Sirius XM Canada. We own approximately 38% of the equity of Sirius XM Canada.
Other Services
Commercial Accounts.
Our programming is available for commercial establishments. Commercial subscription accounts are available through providers of in-store entertainment solutions and directly from us. Certain commercial subscribers are included in our subscriber count.
Satellite Television Service.
Certain of our music channels are offered as part of certain programming packages on the DISH Network satellite television service. Subscribers to the DISH Network satellite television service are not included in our subscriber count.
Subscribers to the following services are not included in our subscriber count, unless the applicable service is purchased by the subscriber separately and not as part of a radio subscription to our services:
Backseat TV.
We offer Backseat TV, a service offering television content designed primarily for children in the backseat of vehicles.
Travel Link.
We offer Travel Link, a suite of data services that includes graphical weather, fuel prices, sports schedules and scores and movie listings.
Real-Time Traffic Services.
We offer services that provide graphic information as to road closings, traffic flow and incident data to consumers with compatible in-vehicle navigation systems.
Real-Time Weather Services.
We offer several real-time weather services designed for improving situational awareness in vehicle, marine and/or aviation use.
FCC Conditions
In order to demonstrate to the FCC that the Merger was in the public interest, we agreed to implement a number of voluntary commitments. These commitments include certain voluntary assurances regarding our programming and programming packages; the creation of public interest channels; and equipment manufacturing, all of which we have complied with.
5
Competition
We face significant competition for both listeners and advertisers. In addition to pre-recorded entertainment purchased or playing in cars, homes and using portable players, we compete with numerous other providers of radio or other audio services. Some of our digital competitors are making in-roads into automobiles, where we are currently the prominent alternative to traditional AM/FM radio. Our existing and emerging competition includes:
Traditional AM/FM Radio
Our services compete with traditional AM/FM radio. Many traditional radio companies are substantial entities owning large numbers of radio stations or other media properties. The radio broadcasting industry is highly competitive.
Traditional AM/FM radio has a well-established demand for its services and offers free broadcasts paid for by commercial advertising rather than by a subscription fee like satellite radio. Many radio stations offer information programming of a local nature, such as local news and sports. Traditional free AM/FM radio reduces the likelihood that customers would be willing to pay for our subscription services and, by offering free broadcasts, it may impose limits on what we can charge for our services. Some AM/FM radio stations have reduced the number of commercials per hour, expanded the range of music played on the air and experimented with new formats in order to lure customers away from satellite radio.
HD Radio
Many radio stations broadcast digital signals, which have clarity similar to our signals. These stations do not charge a subscription fee for their digital signals but do generally carry advertising. To the extent that traditional AM/FM radio stations adopt digital transmission technology and listeners adopt digital receivers, any competitive advantage that we enjoy over traditional radio because of our clearer digital signal is lessened. Traditional AM/FM broadcasters are also complementing their HD Radio efforts by aggressively pursuing Internet radio, wireless Internet-based distribution arrangements and data services. Several automakers install or plan to install HD Radio equipment as factory standard equipment in select models, including Cadillac, Mazda, Lexus, Ford, Volkswagen, BMW, Mercedes-Benz, Scion, Kia and Hyundai.
Internet Radio and Internet-Enabled Smartphones
Internet radio broadcasts often have no geographic limitations and provide listeners with radio programming from across the country and around the world. Major media companies and online-only providers, including Clear Channel, CBS and Pandora, make high fidelity digital streams available through the Internet for free or, in some cases, for a fraction of the cost of a satellite radio subscription. These services compete directly with our services, at home, in the automobile, and wherever audio entertainment is consumed.
Internet-enabled smartphones, most of which have the capability of interfacing with vehicles, can play recorded or cached content and access Internet radio via dedicated applications or browsers. These applications are often free to the user and offer music and talk content as long as the user is subscribed to a sufficiently large mobile data plan. Leading audio smartphone radio applications include Pandora, last.FM, Slacker, iheartradio and Stitcher. Certain of these applications also include advanced functionality, such as personalization, and allow the user to access large libraries of content and podcasts on demand.
Spotify has launched a music streaming service in the United States, which allows its users unlimited, on-demand access to a large library of song tracks, allowing the sharing of playlists with other listeners through the Facebook platform. Other similar services have launched Facebook integration, including MOG and Rdio. These services, which usually require a monthly subscription fee, are currently available on smartphones but may become integrated into connected cars in the future.
Third and fourth generation mobile networks have enabled a steady increase in the audio quality and reliability of mobile Internet radio streaming, and this is expected to further increase as fourth generation networks become the standard. We expect that improvements from higher bandwidths, wider programming selection, and advancements in functionality are likely to continue making Internet radio and smartphone applications an increasingly significant competitor, particularly in vehicles.
6
Advanced In-Dash Infotainment Systems
Nearly all automakers have deployed or are planning to deploy integrated multimedia systems in dash boards, such as Ford's SYNC, Toyota's Entune, and BMW/Mini's Connected. These systems can combine control of audio entertainment from a variety of sources, including AM/FM/HD radio broadcasts, satellite radio, Internet radio, smartphone applications and stored audio, with navigation and other advanced applications such as restaurant bookings, movie show times and financial information. Internet radio and other data are typically connected to the system via a bluetooth link to an Internet-enabled smartphone, and the entire system may be controlled by touchscreen or voice recognition. These systems enhance the attractiveness of our Internet-based competition by making such applications more prominent, easier to access, and safer to use in the car. Similar systems are also available in the aftermarket and sold through retailers.
Direct Broadcast Satellite and Cable Audio
A number of providers offer specialized audio services through either direct broadcast satellite or cable audio systems. These services are targeted to fixed locations, mostly in-home. The radio service offered by direct broadcast satellite and cable audio is often included as part of a package of digital services with video service, and video customers generally do not pay an additional monthly charge for the audio service.
Other Digital Media Services
The audio entertainment marketplace continues to evolve rapidly, with a steady emergence of new media platforms and portable devices that compete with our services now or that could compete with those services in the future.
Traffic News Services
A number of providers also compete with our traffic news services. Clear Channel and Tele Atlas partner to deliver nationwide traffic information for the top 50 markets to in-vehicle navigation systems using RDS/TMC, the radio broadcast standard technology for delivering traffic and travel information to drivers. The in-dash navigation market is also being threatened by increasingly capable smartphones that provide advanced navigation functionality, including live traffic. Android, Blackberry, and Apple iOS-based smartphones all include GPS mapping and navigation functionality, often with turn-by-turn navigation.
Government Regulation
As operators of a privately owned satellite system, we are regulated by the FCC under the Communications Act of 1934, principally with respect to:
|
•
|
the licensing of our satellite systems;
|
|
•
|
preventing interference with or to other users of radio frequencies; and
|
|
•
|
compliance with FCC rules established specifically for U.S. satellites and satellite radio services.
|
Any assignment or transfer of control of our FCC licenses must be approved by the FCC. The FCC's order approving the Merger requires us to comply with certain voluntary commitments we made as part of the FCC merger proceeding. We believe we comply with those commitments.
In 1997, we were the winning bidders for FCC licenses to operate a satellite digital audio radio service and provide other ancillary services. Our FCC licenses for our Sirius satellites expire in 2017. Our FCC licenses for our XM satellites expire in 2013, 2014 and 2018. We anticipate that, absent significant misconduct on our part, the FCC will renew our licenses to permit operation of our satellites for their useful lives, and grant a license for any replacement satellites.
In some areas with high concentrations of tall buildings, such as urban centers, signals from our satellites may be blocked and reception can be adversely affected. In many of these areas, we have installed terrestrial repeaters to supplement our satellite signal coverage. The FCC has established rules governing terrestrial repeaters and has granted us a license to operate our repeater network.
We design, establish specifications for, source or specify parts and components for, manage various aspects of the logistics and production of, and, in most cases, obtain FCC certifications for, satellite radios, including satellite radios that include FM modulators. We believe our radios that are in production comply with all applicable FCC rules.
We are required to obtain export licenses from the United States government to export certain ground control equipment, satellite communications/control services and technical data related to our satellites and their operations. The delivery of such equipment, services and technical data to destinations outside the United States and to foreign persons is subject to strict export
7
control and prior approval requirements from the United States government (including prohibitions on the sharing of certain satellite-related goods and services with China).
Changes in law or regulations relating to communications policy or to matters affecting our services could adversely affect our ability to retain our FCC licenses or the manner in which we operate.
Copyrights to Programming
In connection with our music programming, we must negotiate and enter into royalty arrangements with two sets of rights holders: Holders of copyrights in musical works (that is, the music and lyrics) and holders of copyrights in sound recordings (that is, the actual recording of a work).
Musical works rights holders, generally songwriters and music publishers, are represented by performing rights organizations such as the American Society of Composers, Authors and Publishers (“ASCAP”), Broadcast Music, Inc. (“BMI”), and SESAC, Inc. (“SESAC”). These organizations negotiate fees with copyright users, collect royalties and distribute them to the rights holders. We have arrangements with all of these organizations.
Sound recording rights holders, typically large record companies, are primarily represented by SoundExchange, an organization which negotiates licenses, and collects and distributes royalties on behalf of record companies and performing artists. Under the Digital Performance Right in Sound Recordings Act of 1995 and the Digital Millennium Copyright Act of 1998, we may negotiate royalty arrangements with the sound recording copyright owners, or if negotiation is unsuccessful, the royalty rate is established by the Copyright Royalty Board (the “CRB”) of the Library of Congress.
In December 2012, the CRB issued its determination regarding the royalty rate payable by us under the statutory license covering the performance of sound recordings over our satellite digital audio radio service, and the making of ephemeral (server) copies in support of such performances, for the five-year period starting January 1, 2013 and ending on December 31, 2017. Under the terms of the CRB's decision, we will pay a royalty based on gross revenues, subject to certain exclusions, of 9.0% for 2013, 9.5% for 2014, 10.0% for 2015, 10.5% for 2016, and 11% for 2017. The rate for 2012 was 8.0%.
The revenue subject to royalty includes subscription revenue from our U.S. satellite digital audio radio subscribers and advertising revenue from channels other than those channels that make only incidental performances of sound recordings. Exclusions from revenue subject to the statutory license fee include, among other things, revenue from channels, programming and products or other services offered for a separate charge where such channels make only incidental performances of sound recordings; revenue from equipment sales; revenue from current and future data services (including video services) offered for a separate charge; intellectual property royalties received by us; credit card, invoice and fulfillment service fees; and bad debt expense. The regulations also allow us to further reduce our monthly royalty fee in proportion to the percentage of our performances that feature pre-1972 recordings (which are not subject to federal copyright protection) as well as those that are licensed directly from the copyright holder, rather than through the statutory license.
Trademarks
We have registered, and intend to maintain, the trademark “Sirius”, “XM”, “SiriusXM” and the “Dog design” logo with the United States Patent and Trademark Office in connection with the services we offer. We are not aware of any material claims of infringement or other challenges to our right to use the “Sirius”, “XM” or “SiriusXM” trademark or the “Dog design” logo in the United States. We also have registered, and intend to maintain, trademarks for the names of certain of our channels. We have also registered the trademarks “Sirius”, “XM”, and the “Dog design” logo in Canada. We have granted a license to use certain of our trademarks in Canada to Sirius XM Canada.
Personnel
As of December 31, 2012, we had 1,596 full-time employees. In addition, we rely upon a number of part-time employees, consultants, other advisors and outsourced relationships. None of our employees are represented by a labor union, and we believe that our employee relations are good.
Corporate Information
Our executive offices are located at 1221 Avenue of the Americas, 36th floor, New York, New York 10020 and our telephone number is (212) 584-5100. Our internet address is www.siriusxm.com. Our annual, quarterly and current reports, and any amendments to those reports, filed or furnished pursuant to Section 13(a) or 15(d) of the Securities Exchange Act of 1934 may be accessed free of charge through our website after we have electronically filed or furnished such material with the SEC. Siriusxm.com (including any other reference to such address in this Annual Report) is an inactive textual reference only,
8
meaning that the information contained on or accessible from the website is not part of this Annual Report on Form 10-K and is not incorporated in this report by reference.
Executive Officers of the Registrant
Certain information regarding our executive officers is provided below:
|
Name
|
Age
|
Position
|
|
James E. Meyer
|
58
|
Chief Executive Officer
|
|
Scott A. Greenstein
|
53
|
President and Chief Content Officer
|
|
Dara F. Altman
|
54
|
Executive Vice President and Chief Administrative Officer
|
|
Stephen Cook
|
57
|
Executive Vice President, Sales and Automotive
|
|
Patrick L. Donnelly
|
51
|
Executive Vice President, General Counsel and Secretary
|
|
David J. Frear
|
56
|
Executive Vice President and Chief Financial Officer
|
|
Enrique Rodriguez
|
50
|
Executive Vice President, Operations and Products
|
James E. Meyer
was appointed as our Chief Executive Officer in December 2012. From May 2004 to December 2012, Mr. Meyer was our President, Operations and Sales. Prior to May 2004, Mr. Meyer was President of Aegis Ventures Incorporated, a consulting firm that provides general management services. From December 2001 until 2002, Mr. Meyer served as special advisor to the Chairman of Thomson S.A., a leading consumer electronics company. From January 1997 until December 2001, Mr. Meyer served as the Senior Executive Vice President for Thomson as well as a member of the executive committee. From 1992 until 1996, Mr. Meyer served as Thomson's Senior Vice President of Product Management. Mr. Meyer is a director of ROVI Corporation.
Scott A. Greenstein
has served as our President and Chief Content Officer since May 2004. Prior to May 2004, Mr. Greenstein was Chief Executive Officer of The Greenstein Group, a media and entertainment consulting firm. From 1999 until 2002, he was Chairman of USA Films, a motion picture production, marketing and distribution company. From 1997 until 1999, Mr. Greenstein was Co-President of October Films, a motion picture production, marketing and distribution company. Prior to joining October Films, Mr. Greenstein was Senior Vice President of Motion Pictures, Music, New Media and Publishing at Miramax Films, and held senior positions at Viacom Inc.
Dara F. Altman
has served as our Executive Vice President and Chief Administrative Officer since September 2008. From January 2006 until September 2008, Ms. Altman served as Executive Vice President, Business and Legal Affairs, of XM. Ms. Altman was Executive Vice President of Business Affairs for Discovery Communications from 1997 to 2005. From 1993 to 1997, Ms. Altman served as Senior Vice President and General Counsel of Reiss Media Enterprises, which owned Request TV, a national pay-per-view service. Before Request TV, Ms. Altman served as counsel for Home Box Office. Ms. Altman started her career as an attorney at the law firm of Willkie Farr & Gallagher LLP.
Stephen Cook
was appointed as our Executive Vice President, Sales and Automotive, in January 2013. Mr. Cook served as our Group Vice President and General Manager, Automotive Division, from July 2008 until January 2013. Mr. Cook served as Executive Vice President, Automotive, of XM from July 2006 to July 2008. He also served as XM's Executive Vice President, Sales and Marketing, from January 2002 until July 2006, and as XM's Senior Vice President, Sales and Marketing, from February 1999 until January 2002. Prior to joining XM, Mr. Cook was Chief Operating Officer for Conxus Communications. From 1990 to 1997, Mr. Cook held management positions with GTE's cellular operations. Prior to that time, Mr. Cook worked in brand management for Procter & Gamble.
Patrick L. Donnelly
has served as our Executive Vice President, General Counsel and Secretary since May 1998. From June 1997 to May 1998, he was Vice President and Deputy General Counsel of ITT Corporation, a hotel, gaming and entertainment company that was acquired by Starwood Hotels & Resorts Worldwide, Inc. in February 1998. From October 1995 to June 1997, he was assistant general counsel of ITT Corporation. Prior to October 1995, Mr. Donnelly was an attorney at the law firm of Simpson Thacher & Bartlett LLP.
David J. Frear
has served as our Executive Vice President and Chief Financial Officer since June 2003. From 1999 to 2003, Mr. Frear was Executive Vice President and Chief Financial Officer of Savvis Communications Corporation, a global managed service provider, delivering internet protocol applications for business customers. Mr. Frear also served as a director of Savvis. From 1993 to 1998, Mr. Frear was Senior Vice President and Chief Financial Officer of Orion Network Systems Inc., an international satellite communications company that was acquired by Loral Space & Communications Ltd. in 1998. From
9
1990 to 1993, Mr. Frear was Chief Financial Officer of Millicom Incorporated, a cellular, paging and cable television company. Prior to joining Millicom, he was an investment banker at Bear, Stearns & Co., Inc. and Credit Suisse.
Enrique Rodriguez
was appointed as our Executive Vice President, Operations and Products, in January 2013. He served as our Group Vice President from October 2012 until January 2013. Mr. Rodriguez was the Senior Vice President and General Manager of Cisco System Inc.'s Service Provider Video Technology Group from May 2010 until December 2011. Mr. Rodriguez served as Corporate Vice President for the TV Division of Microsoft Corp. from June 2006 until April 2010. Prior to heading Microsoft's TV Division, Mr. Rodriguez served as Vice President of Xbox Partnerships for Microsoft. Before joining Microsoft in 2003, Rodriguez spent over 20 years at Thomson/RCA in a variety of engineering and executive roles.
Our former Chief Executive Officer, Mel Karmazin, terminated his employment with us in December 2012.
|
ITEM 1A.
|
RISK FACTORS
|
In addition to the other information in this Annual Report on Form 10-K, including the information under the caption Item 1. Business “Competition,” the following risk factors should be considered carefully in evaluating us and our business. This Annual Report on Form 10-K contains forward-looking statements within the meaning of the Private Securities Litigation Reform Act of 1995. Actual results and the timing of events could differ materially from those projected in forward-looking statements due to a number of factors, including those set forth below and elsewhere in this Annual Report on Form 10-K. See “Special Note Regarding Forward-Looking Statements” following this Item 1A. Risk Factors.
We face substantial competition and that competition is likely to increase over time.
We face substantial competition from other providers of radio and other audio services. Our ability to retain and attract subscribers depends on our success in creating and providing popular or unique music, entertainment, news and sports programming. Our subscribers can obtain certain similar content for free through terrestrial radio stations or Internet radio services. Audio content delivered via the Internet, including through mobile devices, is increasingly competitive with our services. In addition, automakers and aftermarket manufacturers have introduced factory-installed radios capable of seamlessly accessing Internet-delivered audio entertainment and easily connecting to Internet-delivered content on smartphones. A summary of various services that compete with us is contained in the section entitled “Item 1. Business - Competition.”
Competition could result in lower subscription, advertising or other revenue or increase our marketing, promotion or other expenses and, consequently, lower our earnings and free cash flow. We cannot assure you we will be able to compete successfully with our existing or future competitors or that competition will not have a material adverse effect on our business, financial condition or results of operations.
Our business depends in large part upon automakers.
A substantial portion of our new subscription growth has come from purchasers and lessees of new and previously owned automobiles. The sale and lease of vehicles with satellite radios is an important source of subscribers for our satellite radio service. We have agreements with every major automaker to include satellite radios in new vehicles, although these agreements do not require automakers to install specific or minimum quantities of radios in any given period.
Automotive production and sales are dependent on many factors, including the availability of consumer credit, general economic conditions, consumer confidence and fuel costs. To the extent vehicle sales by automakers decline, or the penetration of factory-installed satellite radios in those vehicles is reduced, subscriber growth for our satellite radio services may be adversely impacted.
General economic conditions can affect our business.
The purchase of a satellite radio subscription is discretionary, and our business and our financial condition can be negatively affected by general economic conditions. Poor general economic conditions can adversely affect subscriber churn, conversion rates and vehicle sales, as evidenced by the dramatic slowdown in auto sales that negatively impacted our subscriber growth in 2008 and 2009.
10
Failure of our satellites would significantly damage our business.
The lives of our satellites will vary and depend on a number of factors, including:
|
•
|
degradation and durability of solar panels;
|
|
•
|
quality of construction;
|
|
•
|
random failure of satellite components, which could result in significant damage to or loss of a satellite;
|
|
•
|
amount of fuel the satellite consumes; and
|
|
•
|
damage or destruction by electrostatic storms, collisions with other objects in space or other events, such as nuclear detonations, occurring in space.
|
In the ordinary course of operation, satellites experience failures of component parts and operational and performance anomalies. Components on our in-orbit satellites have failed; and from time to time we have experienced anomalies in the operation and performance of these satellites. These failures and anomalies are expected to continue in the ordinary course, and we cannot predict if any of these possible future events will have a material adverse effect on our operations or the life of our existing in-orbit satellites.
Three of the Sirius in-orbit satellites have experienced degradation on their solar arrays. The degradation these satellites have experienced does not affect current operations. Additional degradation on the three Sirius satellites could reduce the estimated lives of those satellites.
Space Systems/Loral has constructed a new satellite for the Sirius system that is expected to be launched during mid-2013. Satellite launches have significant risks, including launch failure, damage or destruction of the satellite during launch and failure to achieve a proper orbit or operate as planned. Our agreement with Space Systems/Loral does not protect us against the risks inherent in a satellite launch or in-orbit operations.
Our XM-1 and XM-2 satellites have experienced progressive degradation problems common to early Boeing 702 class satellites and now serve as in-orbit spares. Our XM-3, XM-4 and XM-5 in-orbit satellites have experienced circuit failures on their solar arrays which do not affect current operations. Additional circuit failures on the satellites could reduce the estimated lives of those satellites. We estimate that our XM-3, XM-4 and XM-5 satellites will meet their 15-year predicted depreciable lives, and that the XM-1 and XM-2 satellites' depreciable lives will end in 2013.
Our XM-5 satellite serves as an in-orbit spare for both of our services. In the event of a failure of XM-3, XM-4 or any of the Sirius satellites, service would be maintained through XM-5.
In addition, our Sirius network of terrestrial repeaters communicates with a single third-party satellite. Our XM network of terrestrial repeaters communicates with a single XM satellite. If the satellites communicating with the applicable repeater network fail unexpectedly, the services would be disrupted for several hours or longer.
We maintain in-orbit insurance policies covering only our XM-5 and FM-5 satellites. These policies will expire in 2014 and 2015, respectively, and we may not renew these in-orbit insurance policies when they expire. Any insurance proceeds will not fully cover our losses in the event of a satellite failure or significant degradation in the service provided by such satellites. For example, the policies covering the insured satellites do not cover the full cost of constructing, launching and insuring new satellites, nor will they cover, and we do not have protection against, business interruption, loss of business or similar losses. Our insurance contains customary exclusions, material change and other conditions that could limit recovery under those policies. Further, any insurance proceeds may not be received on a timely basis in order to launch a spare satellite or construct and launch a replacement satellite or take other remedial measures. In addition, the policies are subject to limitations involving uninsured losses, large satellite performance deductibles and policy limits.
11
Our ability to attract and retain subscribers at a profitable level in the future is uncertain.
We spend substantial amounts on advertising and marketing and in transactions with automakers, retailers and others to obtain and attract subscribers. During 2012, we added approximately two million net subscribers to our services. Our ability to retain our subscribers, or increase the number of subscribers to our service, in any given period is subject to many factors, including:
|
•
|
the price of our service;
|
|
•
|
the health of the economy;
|
|
•
|
the production and sale of new vehicles in the United States;
|
|
•
|
our ability to convince owners and lessees of new and previously owned vehicles that include satellite radios to purchase subscriptions to our service;
|
|
•
|
the effectiveness of our marketing programs;
|
|
•
|
the entertainment value of our programming; and
|
|
•
|
actions by our competitors, such as terrestrial radio and other audio entertainment and information providers.
|
As part of our business, we experience, and expect to experience in the future, subscriber turnover (i.e., churn). If we are unable to retain current subscribers at expected rates, or the costs of retaining subscribers are higher than expected, our financial performance and operating results could be adversely affected. We cannot predict how successful we will be at retaining customers who purchase or lease vehicles that include a prepaid promotional subscription to our satellite radio service. During 2012, we converted
45%
of the customers who received a promotional subscription as part of the purchase or lease of a new vehicle to a self-paying subscription. Over the same period, we have experienced churn of our self-pay subscribers of
1.9%
per month.
Average monthly revenue per subscriber, which we refer to as ARPU, is another key metric we use to analyze our business. Over the past several years, we have focused substantial attention and efforts on balancing ARPU and subscriber additions. Our ability to increase or maintain ARPU over time is uncertain and depends upon various factors, including:
|
•
|
the value consumers perceive in our service;
|
|
•
|
our ability to add and retain compelling programming;
|
|
•
|
the increasing competition we experience from terrestrial and Internet radio and other entertainment providers; and
|
|
•
|
pricing and other offers we may make to attract new subscribers and retain existing subscribers.
|
If we are unable to consistently attract new subscribers, and retain our current subscribers, at a sufficient level of revenue to be profitable, the value of our common stock could decline, and without sufficient cash flow we may not be able to make the required payments on our indebtedness and could ultimately default on our commitments.
Royalties for music rights have increased and may continue to do so in the future.
We must maintain music programming royalty arrangements with, and pay license fees to, BMI, ASCAP and SESAC. These organizations negotiate with copyright users, collect royalties and distribute them to songwriters and music publishers. We have agreements with ASCAP, BMI and SESAC through 2016. There can be no assurance that the royalties we pay to ASCAP, SESAC and BMI will not increase upon expiration of these arrangements.
Under the Digital Performance Right in Sound Recordings Act of 1995 and the Digital Millennium Copyright Act of 1998, we pay royalties to copyright owners of sound recordings. Those royalty rates may be established through negotiation or, if negotiation is unsuccessful, by the CRB. Owners of copyrights in sound recordings have created SoundExchange, a collective organization, to collect and distribute royalties. SoundExchange is exempt by statute from certain U.S. antitrust laws and exercises significant market power in the licensing of sound recordings.
New royalty rates for our use of sound recordings during the five-year period beginning in January 2013 were announced by the CRB in December 2012. Under the terms of the CRB's decision, we will pay a royalty based on gross revenues, subject to certain exclusions, of 9.0% for 2013, 9.5% for 2014, 10.0% for 2015, 10.5% for 2016, and 11% for 2017. The rate for 2012 was 8.0%.
12
Our business could be adversely affected if we fail to attract and retain qualified executive officers.
Our former Chief Executive Officer terminated his employment with us in December 2012. A committee of our board of directors is currently conducting a search for a permanent successor to our former Chief Executive Officer. In addition, the employment agreement with our current Chief Executive Officer, who is serving on an interim basis, expires at the end of October 2013, and he has negotiated a right to retire prior to the expiration of his employment agreement. We face intense competition for executive talent from a variety of sources, including from competing entertainment providers, and we might not be able to find a replacement on a timely basis or with the same level of skill and experience. Our continued success is dependent, in part, upon our ability to attract and retain superior executive officers. Similarly, our business and the value of our common stock could be adversely affected if we are unable to attract and retain qualified executive personnel, including a permanent Chief Executive Officer.
The unfavorable outcome of pending or future litigation could have a material adverse effect.
We are parties to several legal proceedings arising out of various aspects of our business, including class action lawsuits alleging violations of state consumer protection statutes. We are defending all claims against us. The outcome of these proceedings may not be favorable, and an unfavorable outcome may have a material adverse effect on our business or financial results.
Rapid technological and industry changes could adversely impact our services.
The audio entertainment industry is characterized by rapid technological change, frequent product innovations, changes in customer requirements and expectations, and evolving standards. If we are unable to keep pace with these changes, our business may not succeed. Products using new technologies, or emerging industry standards, could make our technologies less competitive in the marketplace.
Failure of third parties to perform could adversely affect our business.
Our business depends, in part, on various third parties, including:
|
•
|
manufacturers that build and distribute satellite radios;
|
|
•
|
companies that manufacture and sell integrated circuits for satellite radios;
|
|
•
|
programming providers and on-air talent;
|
|
•
|
retailers that market and sell satellite radios and promote subscriptions to our services; and
|
|
•
|
vendors that have designed or built and vendors that support or operate important elements of our systems.
|
If one or more of these third parties do not perform in a satisfactory or timely manner, our business could be adversely affected. In addition, a number of third parties on which we depend have experienced, and may in the future experience, financial difficulties or file for bankruptcy protection. Such third parties may not be able to perform their obligations to us in a timely manner, if at all, as a result of their financial condition or may be relieved of their obligations to us as part of seeking bankruptcy protection.
We design, establish specifications, source or specify parts and components, and manage various aspects of the logistics and production of radios. As a result of these activities, we may be exposed to liabilities associated with the design, manufacture and distribution of radios that the providers of an entertainment service would not customarily be subject to, such as liabilities for design defects, patent infringement and compliance with applicable laws, as well as the costs of returned product.
Changes in consumer protection laws and their enforcement could damage our business.
We engage in extensive marketing efforts to attract and retain subscribers to our services. We employ a wide variety of communications tools as part of our marketing campaigns, including telemarketing efforts; print, television, radio and online advertising; and email solicitations.
Consumer protection laws, rules and regulations are extensive and have developed rapidly, particularly at the state level. Consumer protection laws in certain jurisdictions cover nearly all aspects of our marketing efforts, including the content of our advertising, the terms of consumer offers and the manner in which we communicate with subscribers and prospective subscribers. We are engaged in considerable efforts to ensure that all our activities comply with federal and state laws, rules and regulations relating to consumer protection, including laws relating to privacy. Modifications to federal and state laws, rules and regulations concerning consumer protection, including decisions by federal and state courts and agencies interpreting these
13
laws, could have an adverse impact on our ability to attract and retain subscribers to our services. While we monitor the changes in and interpretations of these laws in consumer-related settlements and decisions, and while we believe that we are in material compliance with applicable laws, there can be no assurances that new laws or regulations will not be enacted or adopted, preexisting laws or regulations will not be more strictly enforced or that our varied operations will continue to comply with all applicable laws, which might adversely affect our operations.
A Multistate Working Group of 31 State Attorneys General, led by the Attorney General of the State of Ohio, is investigating certain of our consumer practices. The investigation focuses on practices relating to the cancellation of subscriptions; automatic renewal of subscriptions; charging, billing, collecting, and refunding or crediting of payments from consumers; and soliciting customers. Separate investigations into our consumer practices are being conducted by the Attorneys General of the State of Florida and New York.
Failure to comply with FCC requirements could damage our business.
We hold FCC licenses and authorizations to operate commercial satellite radio services in the United States, including authorizations for satellites and terrestrial repeaters, and related authorizations. The FCC generally grants licenses and authorizations for a fixed term. Although we expect our licenses and authorizations to be renewed in the ordinary course upon their expiration, there can be no assurance that this will be the case. Any assignment or transfer of control of any of our FCC licenses or authorizations must be approved in advance by the FCC.
The operation of our satellite radio systems is subject to significant regulation by the FCC under authority granted through the Communications Act and related federal law. We are required, among other things, to operate only within specified frequencies; to meet certain conditions regarding the interoperability of our satellite radios with those of other licensed satellite radio systems; to coordinate our satellite radio services with radio systems operating in the same range of frequencies in neighboring countries; and to coordinate our communications links to our satellites with other systems that operate in the same frequency band. Non-compliance by us with these requirements or other conditions or with other applicable FCC rules and regulations could result in fines, additional license conditions, license revocation or other detrimental FCC actions. There is no guarantee that Congress will not modify the statutory framework governing our services, or that the FCC will not modify its rules and regulations in a manner that would have a material impact on our operations.
The terms of our licenses, the order of the FCC approving the Merger, and the consent decrees we entered into with the FCC require us to meet certain conditions. Non-compliance with these conditions could result in fines, additional license conditions, license revocation or other detrimental FCC actions.
Other existing or future government laws and regulations could harm our business.
We are subject to many other federal, state and local laws. These laws and regulations cover issues such as user privacy, behavioral advertising, automatic renewal of agreements, pricing, fraud, electronic waste, mobile and electronic device communications, quality of products and services, taxation, advertising, intellectual property rights and information security. The expansion of these laws, both in terms of their number and their applicability, could harm our business. Similarly, new disclosure and reporting requirements, established under existing or new state or federal laws, such as regulatory rules regarding requirements to disclose efforts to identify the origin and existence of certain “conflict minerals” or abusive labor practices in portions of our supply chain, could increase the cost of doing business, adversely affecting our results of operations.
Interruption or failure of our information technology and communications systems could negatively impact our results and our brand.
We operate a complex and growing business. We offer a wide variety of subscription packages at different price points. Our business is dependent on the operation and availability of our information technology and communication systems and those of certain third party service providers. Any degradation in the quality, or any failure, of our systems could reduce our revenues, cause us to lose customers and damage our brand. Although we have implemented practices designed to maintain the availability of our information technology systems and mitigate the harm of any unplanned interruptions, we do not have complete redundancy for all of our information technology systems, and our disaster recovery planning cannot anticipate all eventualities. We occasionally experience unplanned outages or technical difficulties. We could also experience loss of data or processing capabilities, which could cause us to lose customers and could materially harm our reputation and our operating results.
We are involved in continuing efforts to upgrade and maintain our information technology systems. These maintenance and upgrade activities are costly, and problems with the design or implementation of system enhancements could harm our business and our results of operations.
14
Our data centers and our information technology and communications systems are vulnerable to damage or interruption from natural disasters, malicious attacks, fire, power loss, telecommunications failures, computer viruses or other attempts to harm our systems.
If hackers were able to circumvent our security measures, we could lose proprietary information or personal information or experience significant disruptions. If our systems become unavailable or suffer a security breach, we may be required to expend significant resources to address these problems, including notification under various federal and state data privacy regulations, and our reputation and operating results could suffer.
We rely on internal systems and external systems maintained by manufacturers, distributors and service providers to take, fulfill and handle customer service requests and host certain online activities. Any interruption or failure of our internal or external systems could prevent us from servicing customers or cause data to be unintentionally disclosed.
If we fail to protect the security of personal information about our customers, we could be subject to costly government enforcement actions or private litigation and our reputation could suffer.
The nature of our business involves the receipt and storage of personal information about our subscribers. If we experience a data security breach, we could be exposed to government enforcement actions and private litigation. In addition, our subscribers and potential customers could lose confidence in our ability to protect their personal information, which could cause them to discontinue usage of our services. Such events could lead to lost future sales and adversely affect our results of operations.
We may from time to time modify our business plan, and these changes could adversely affect us and our financial condition.
We regularly evaluate our plans and strategy. These evaluations often result in changes to our plans and strategy, some of which may be material. These changes in our plans or strategy may include: the acquisition or termination of unique or compelling programming; the introduction of new features or services; significant new or enhanced distribution arrangements; investments in infrastructure, such as satellites, equipment or radio spectrum; and acquisitions of other businesses, including acquisitions that are not directly related to our satellite radio business.
Our indebtedness could adversely affect our operations and could limit our ability to react to changes in the economy or our industry.
As of December 31, 2012, we had an aggregate principal amount of approximately $2.5 billion of indebtedness. We also have entered into a senior secured revolving credit facility with a syndicate of financial institutions for $1.25 billion, which had not been drawn upon as of December 31, 2012. Our indebtedness has important consequences. For example, it:
|
•
|
increases our vulnerability to general adverse economic and industry conditions;
|
|
•
|
requires us to dedicate a portion of our cash flow from operations to payments on indebtedness, reducing the availability of cash flow to fund capital expenditures, marketing and other general corporate activities;
|
|
•
|
limits our ability to borrow additional funds or make capital expenditures;
|
|
•
|
limits our flexibility in planning for, or reacting to, changes in our business and the audio entertainment industry; and
|
|
•
|
may place us at a competitive disadvantage compared to other competitors.
|
The instruments governing our indebtedness contain covenants that, among other things, place certain limitations on our ability to incur more debt, exceed a specified leverage ratio, pay dividends, make distributions, make investments, repurchase stock, create liens, enter into transactions with affiliates, enter into sale lease-back transactions, merge or consolidate, and transfer or sell assets. Failure to comply with the covenants associated with our indebtedness could result in an event of default, which, if not cured or waived, could cause us to seek the protection of the bankruptcy laws, discontinue operations or seek a purchaser for our business or assets.
Our broadcast studios, terrestrial repeater networks, satellite uplink facilities or other ground facilities could be damaged by natural catastrophes or terrorist activities.
An earthquake, tornado, flood, terrorist attack or other catastrophic event could damage our broadcast studios, terrestrial repeater networks or satellite uplink facilities, interrupt our service and harm our business.
Any damage to the satellites that transmit to our terrestrial repeater networks would likely result in degradation of the affected service for some subscribers and could result in complete loss of service in certain or all areas. Damage to our satellite
15
uplink facilities could result in a complete loss of either of our services until we could transfer operations to suitable back-up facilities.
Our principal stockholder has significant influence over our management and over actions requiring stockholder approval and its interests may differ from the interests of other holders of common stock.
As of January 17, 2013, Liberty Media Corporation beneficially owned approximately 50.21% of our common stock. Five current Liberty Media executives are members of our board of directors, and Liberty Media has designated an additional three members of our board of directors.
As a result, Liberty Media has the ability to control our affairs, policies and operations, such as the appointment of management, future issuances of our common stock or other securities, the payment of dividends, if any, on our common stock, the incurrence of debt by us, amendments to our certificate of incorporation and bylaws and the entering into of extraordinary transactions, and their interests may not in all cases be aligned with the interests of other stockholders. In addition, Liberty Media will be able to determine the outcome of all matters requiring stockholder approval and will be able to cause or prevent a change of control of our company or a change in the composition of our board of directors and could preclude any unsolicited acquisition of our company. The concentration of ownership could deprive our stockholder's of an opportunity to receive a premium for their common stock as part of a sale of our company and might ultimately affect the market price of our common stock.
We are a "controlled company" within the meaning of the NASDAQ listing rules and, as a result, qualify for, and rely on, exemptions from certain corporate governance requirements.
We are considered a "controlled company" for the purposes of the NASDAQ Stock Market listing rules. As such, we have elected not to comply with certain NASDAQ corporate governance requirements that a majority of the board of directors consist of independent directors and that we have independent director oversight over director nominations. As a result, we do not have a majority of independent directors, and our compensation committee and nominating and corporate governance committee may not consist entirely of independent directors.
Our business may be impaired by third-party intellectual property rights.
Development of our systems has depended upon the intellectual property that we have developed, as well as intellectual property licensed from third parties. If the intellectual property that we have developed or use is not adequately protected, others will be permitted to and may duplicate portions of our systems or services without liability. In addition, others may challenge, invalidate, render unenforceable or circumvent our intellectual property rights, patents or existing licenses or we may face significant legal costs in connection with defending and enforcing those intellectual property rights. Some of the know-how and technology we have developed, and plan to develop, is not now, nor will it be, covered by U.S. patents or trade secret protections. Trade secret protection and contractual agreements may not provide adequate protection if there is any unauthorized use or disclosure. The loss of necessary technologies could require us to substitute technologies of lower quality performance standards, at greater cost or on a delayed basis, which could harm us.
Other parties may have patents or pending patent applications, which will later mature into patents or inventions that may block our ability to operate our system or license technologies. We may have to resort to litigation to enforce our rights under license agreements or to determine the scope and validity of other parties' proprietary rights in the subject matter of those licenses. This may be expensive and we may not succeed in any such litigation.
Third parties may assert claims or bring suit against us for patent, trademark or copyright infringement, or for other infringement or misappropriation of intellectual property rights. Any such litigation could result in substantial cost, and diversion of effort and adverse findings in any proceeding could subject us to significant liabilities to third parties; require us to seek licenses from third parties; block our ability to operate our systems or license our technology; or otherwise adversely affect our ability to successfully develop and market our satellite radio systems.
16
Special Note About Forward-Looking Statements
We have made various statements in this Annual Report on Form 10-K that may constitute “forward-looking statements” within the meaning of the Private Securities Litigation Reform Act of 1995. Forward-looking statements may also be made in our other reports filed with or furnished to the SEC, in our press releases and in other documents. In addition, from time to time, we, through our management, may make oral forward-looking statements. Forward-looking statements are subject to risks and uncertainties, including those identified above, which could cause actual results to differ materially from such statements. The words “will likely result,” “are expected to,” “will continue,” “is anticipated,” “estimated,” “believe,” “intend,” “plan,” “may,” “should,” “could,” “would,” “likely,” “projection,” “outlook” and similar expressions are intended to identify forward-looking statements. We caution you that the risk factors described above are not exclusive. There may also be other risks that we are unable to predict at this time that may cause actual results to differ materially from those in forward-looking statements. New factors emerge from time to time, and it is not possible for us to predict which will arise or to assess with any precision the impact of each factor on our business or the extent to which any factor, or combination of factors, may cause actual results to differ materially from those contained in any forward-looking statements. Readers are cautioned not to place undue reliance on these forward-looking statements, which speak only as of the date on which they are made. We undertake no obligation to update publicly or revise any forward-looking statements.
ITEM 1B.
UNRESOLVED STAFF COMMENTS
None.
ITEM 2.
PROPERTIES
Below is a list of the principal properties that we own or lease:
|
Location
|
Purpose
|
Own/Lease
|
|
New York, NY
|
Corporate headquarters and studio/production facilities
|
Lease
|
|
New York, NY
|
Office facilities
|
Lease
|
|
Washington, DC
|
Office and studio/production facilities
|
Own
|
|
Washington, DC
|
Office facilities and data center
|
Own
|
|
Lawrenceville, NJ
|
Office and technical/engineering facilities
|
Lease
|
|
Deerfield Beach, FL
|
Office and technical/engineering facilities
|
Lease
|
|
Farmington Hills, MI
|
Office and technical/engineering facilities
|
Lease
|
|
Nashville, TN
|
Studio/production facilities
|
Lease
|
|
Vernon, NJ
|
Technical/engineering facilities
|
Own
|
|
Ellenwood, GA
|
Technical/engineering facilities
|
Lease
|
|
Los Angeles, CA
|
Studio/production facilities
|
Lease
|
We also own or lease other small facilities that we use as offices for our advertising sales personnel, studios and warehouse and maintenance space. These facilities are not material to our business or operations. We also lease properties in Panama and Ecuador that we use as earth stations to command and control satellites.
In addition, we lease or license space at approximately 650 locations for use in connection with the terrestrial repeater networks that support our satellite radio services. In general, these leases and licenses are for space on building rooftops and communications towers. None of these individual arrangements are material to our business or operations.
ITEM 3.
LEGAL PROCEEDINGS
In the ordinary course of business, we are a defendant or party to various claims and lawsuits, including those discussed below. These claims are at various stages of arbitration or adjudication.
State Consumer Investigations
. A Multistate Working Group of
31
State Attorneys General, led by the Attorney General of the State of Ohio, is investigating certain of our consumer practices. The investigation focuses on practices relating to the cancellation of subscriptions; automatic renewal of subscriptions; charging, billing, collecting, and refunding or crediting of payments from consumers; and soliciting customers.
17
A separate investigation into our consumer practices is being conducted by the Attorneys General of the State of Florida and the State of New York. We are cooperating with these investigations and believe our consumer practices comply with all applicable federal and state laws and regulations.
One Twelve, Inc. and Don Buchwald v. Sirius XM Radio Inc.
In March 2011, One Twelve, Inc., Howard Stern's production company, and Don Buchwald, Stern's agent, commenced an action against us in the Supreme Court of the State of New York, County of New York. The action alleged that, upon the Merger, we failed to honor our obligations under the performance-based compensation provisions of our prior agreement dated October 2004 with One Twelve and Buchwald, as agent; One Twelve and Buchwald each assert a claim of breach of contract. In April 2012, the Court granted our motion for summary judgment and dismissed with prejudice the suit. The Court found the agreement unambiguous. One Twelve and Buchwald have appealed this decision.
Other Matters
. In the ordinary course of business, we are a defendant in various other lawsuits and arbitration proceedings, including derivative actions; actions filed by subscribers, both on behalf of themselves and on a class action basis; former employees; parties to contracts or leases; and owners of patents, trademarks, copyrights or other intellectual property. None of these other actions are, in our opinion, likely to have a material adverse effect on our business, financial condition or results of operations.
ITEM 4.
MINE SAFETY DISCLOSURES
Not applicable.
ITEM 5.
MARKET FOR REGISTRANT'S COMMON EQUITY, RELATED STOCKHOLDER MATTERS AND ISSUER PURCHASES OF EQUITY SECURITIES
Price Range of Common Stock
Our common stock is traded on the NASDAQ Global Select Market under the symbol “SIRI.” The following table sets forth the high and low sales price for our common stock, as reported by NASDAQ, for the periods indicated below:
|
High
|
Low
|
|||
|
Year Ended December 31, 2011
|
||||
|
First Quarter
|
$1.88
|
$1.49
|
||
|
Second Quarter
|
$2.44
|
$1.62
|
||
|
Third Quarter
|
$2.35
|
$1.44
|
||
|
Fourth Quarter
|
$1.92
|
$1.27
|
||
|
Year Ended December 31, 2012
|
||||
|
First Quarter
|
$2.36
|
$1.80
|
||
|
Second Quarter
|
$2.41
|
$1.78
|
||
|
Third Quarter
|
$2.64
|
$1.84
|
||
|
Fourth Quarter
|
$3.01
|
$2.55
|
||
Holders of Common Stock
On
February 1, 2013
, the closing sales price of our common stock on the NASDAQ Global Select Market was $3.23 per share. On
February 1, 2013
, there were approximately 11,290 record holders of our common stock.
18
2012 Dividend
On December 28, 2012, we paid a special cash dividend of $0.05 per share of common stock. This was the first cash dividend paid to our stockholders. Our Series B-1 Preferred Stock held by Liberty Radio, LLC, a wholly-owned subsidiary of Liberty Media Corporation, participated in this cash dividend on an as-converted basis in accordance with its terms. The total amount of this dividend was approximately $327 million.
The dividend reflects the board's desire to return value to stockholders and its confidence in the long-term growth prospects of our business. We currently do not intend to declare recurring dividends on our common stock. Our board of directors has not made any determination whether similar special cash dividends will be paid in the future.
Our ability to pay dividends on our common stock is currently limited by covenants under our debt agreements. We retain sufficient capital capacity to continue making long-term investments in our programming, research and development initiatives and overall operations as well as pursue strategic opportunities which may arise. See Note 12 to our consolidated financial statements included in this Annual Report on Form 10-K.
Stock Repurchase Program
In December 2012, we announced that our board of directors had approved a $2 billion common stock repurchase program, which we will begin utilizing in 2013. Shares of common stock may be purchased from time to time on the open market or in privately negotiated transactions.
19
COMPARISON OF CUMULATIVE TOTAL RETURNS
Set forth below is a graph comparing the cumulative performance of our common stock with the Standard & Poor's Composite-500 Stock Index, or the S&P 500, and the NASDAQ Telecommunications Index from December 31, 2007 to
December 31, 2012
. The graph assumes that $100 was invested on December 31, 2007 in each of our common stock, the S&P 500 and the NASDAQ Telecommunications Index. Dividends were declared in 2012 only.
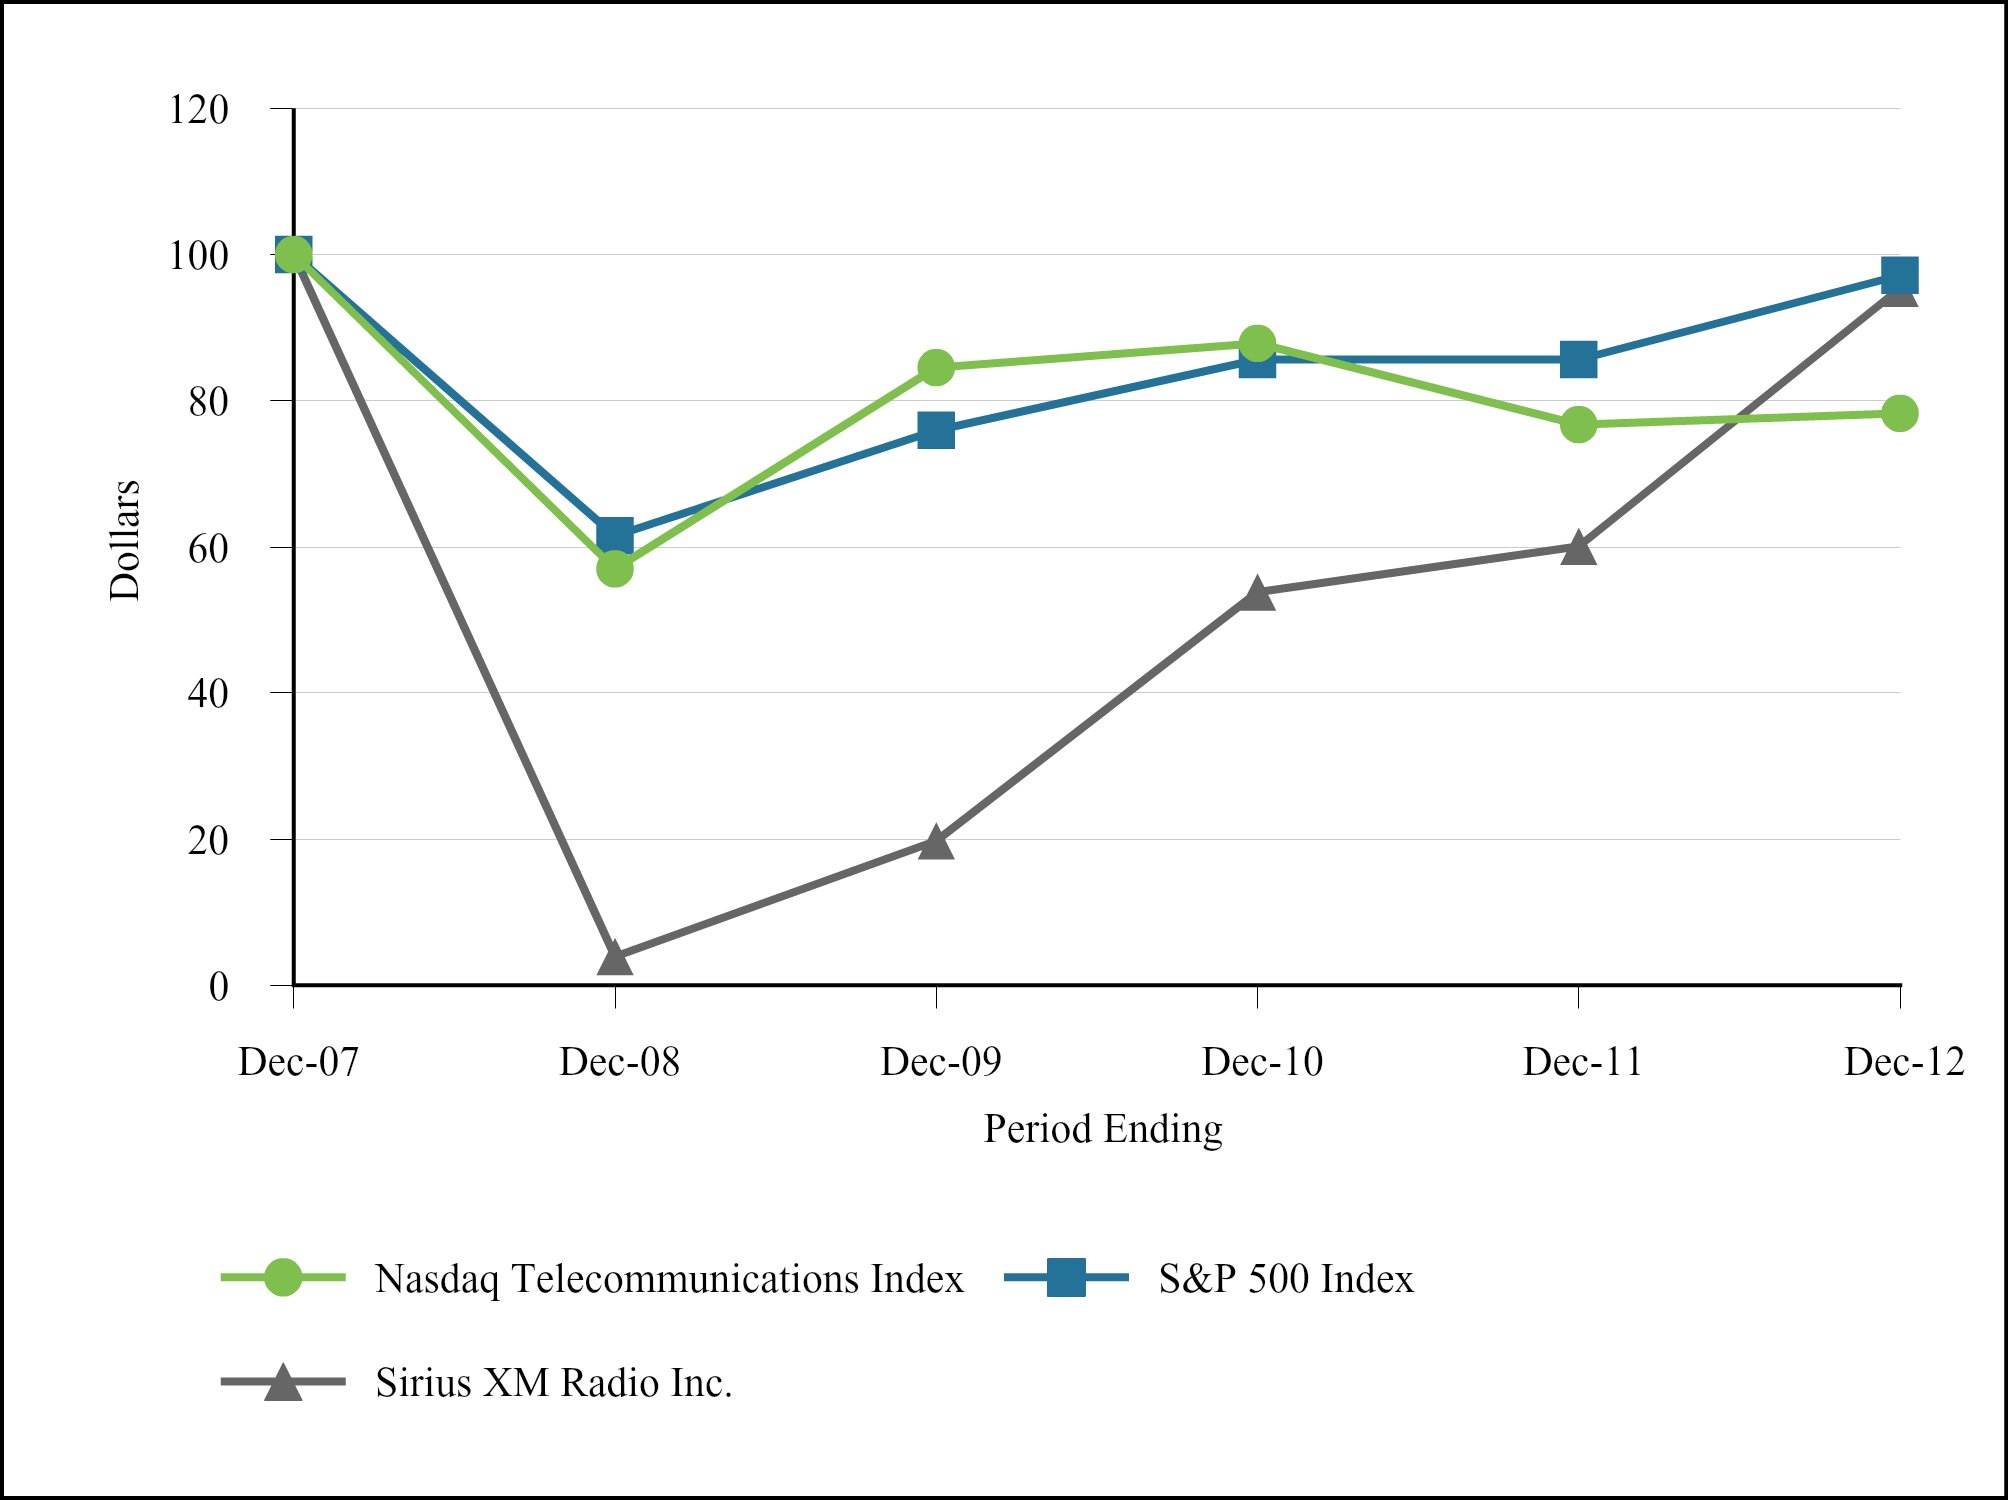
Stockholder Return Performance Table
|
NASDAQ Telecommunications Index
|
S&P 500 Index
|
Sirius XM Radio Inc.
|
||||
|
December 31, 2007
|
$100.00
|
$100.00
|
$100.00
|
|||
|
December 31, 2008
|
$57.02
|
$61.51
|
$3.96
|
|||
|
December 31, 2009
|
$84.52
|
$75.94
|
$19.80
|
|||
|
December 31, 2010
|
$87.84
|
$85.65
|
$53.80
|
|||
|
December 31, 2011
|
$76.75
|
$85.65
|
$60.07
|
|||
|
December 31, 2012
|
$78.29
|
$97.13
|
$95.38
|
|||
20
Equity Compensation Plan Information
|
(shares in thousands)
|
Column (a) Number of Securities to be Issued upon Exercise of Outstanding Options, Warrants and Rights
|
Column (b) Weighted-Average Exercise Price of Outstanding Options, Warrants and Rights
|
Column (c) Number of Securities Remaining Available for Future Issuance under Equity Compensation Plans (excluding Securities Reflected in Column (a))
|
|||||||
|
Plan Category
|
||||||||||
|
Equity compensation plans approved by security holders
|
292,967
|
|
$
|
1.96
|
|
143,243
|
|
|||
|
Equity compensation plans not approved by security holders
|
—
|
|
—
|
|
—
|
|
||||
|
Total
|
292,967
|
|
$
|
1.96
|
|
143,243
|
|
|||
ITEM 6.
SELECTED FINANCIAL DATA
Our selected financial data set forth below with respect to the consolidated statements of comprehensive income for the years ended
December 31, 2012
,
2011
and
2010
, and with respect to the consolidated balance sheets at
December 31, 2012
and
2011
, are derived from our audited consolidated financial statements included in Item 8 of this Annual Report on Form 10-K. Our selected financial data set forth below with respect to the consolidated statements of comprehensive income for the years ended December 31, 2009 and 2008, and with respect to the consolidated balance sheets at
December 31, 2010
, 2009 and 2008 are derived from our audited consolidated financial statements, which are not included in this Annual Report on Form 10-K. This selected financial data should be read in conjunction with the Consolidated Financial Statements and related notes thereto included in Item 8 of this Annual Report on Form 10-K and “Management's Discussion and Analysis of Financial Condition and Results of Operations” included in Item 7 of this Annual Report on Form 10-K.
|
As of and for the Years Ended December 31,
|
|||||||||||||||||||
|
2012
|
2011
|
2010
|
2009 (1)
|
2008 (1) (2)
|
|||||||||||||||
|
(in thousands, except per share data)
|
|
|
|
|
|
||||||||||||||
|
Statements of Comprehensive Income Data:
|
|
|
|
|
|
||||||||||||||
|
Total revenue
|
$
|
3,402,040
|
|
$
|
3,014,524
|
|
$
|
2,816,992
|
|
$
|
2,472,638
|
|
$
|
1,663,992
|
|
||||
|
Net income (loss)
|
$
|
3,472,702
|
|
$
|
426,961
|
|
$
|
43,055
|
|
$
|
(538,226
|
)
|
$
|
(5,316,910
|
)
|
||||
|
Net income (loss) per share – basic
(3)
|
$
|
0.55
|
|
$
|
0.07
|
|
$
|
0.01
|
|
$
|
(0.15
|
)
|
$
|
(2.45
|
)
|
||||
|
Net income (loss) per share – diluted
|
$
|
0.51
|
|
$
|
0.07
|
|
$
|
0.01
|
|
$
|
(0.15
|
)
|
$
|
(2.45
|
)
|
||||
|
Weighted average common shares outstanding – basic
|
4,209,073
|
|
3,744,606
|
|
3,693,259
|
|
3,585,864
|
|
2,169,489
|
|
|||||||||
|
Weighted average common shares outstanding – diluted
|
6,873,786
|
|
6,500,822
|
|
6,391,071
|
|
3,585,864
|
|
2,169,489
|
|
|||||||||
|
Cash dividends per share
(4)
|
$
|
0.05
|
|
$
|
—
|
|
$
|
—
|
|
$
|
—
|
|
$
|
—
|
|
||||
|
Balance Sheet Data:
|
|||||||||||||||||||
|
Cash and cash equivalents
|
$
|
520,945
|
|
$
|
773,990
|
|
$
|
586,691
|
|
$
|
383,489
|
|
$
|
380,446
|
|
||||
|
Restricted investments
|
$
|
3,999
|
|
$
|
3,973
|
|
$
|
3,396
|
|
$
|
3,400
|
|
$
|
141,250
|
|
||||
|
Total assets
|
$
|
9,054,843
|
|
$
|
7,495,996
|
|
$
|
7,383,086
|
|
$
|
7,322,206
|
|
$
|
7,527,075
|
|
||||
|
Long-term debt, net of current portion
|
$
|
2,430,986
|
|
$
|
3,012,351
|
|
$
|
3,021,763
|
|
$
|
3,063,281
|
|
$
|
2,820,781
|
|
||||
|
Stockholders' equity
|
$
|
4,039,565
|
|
$
|
704,145
|
|
$
|
207,636
|
|
$
|
95,522
|
|
$
|
75,875
|
|
||||
——————
|
(1)
|
The 2009 and 2008 results and balances reflect the adoption of ASU 2009-15,
Accounting for Own-Share Lending Arrangements in Contemplation of Convertible Debt Issuance or Other Financing
.
|
|
(2)
|
The 2008 results and balances reflect the results and balances of XM Satellite Radio Holdings Inc. from the date of the Merger and a $4,766,190 goodwill impairment charge.
|
|
(3)
|
The net income (loss) per share-basic calculations were corrected for an immaterial error for the years ended December 31, 2011 and 2010. See Notes 3 and 17 to our consolidated financial statements included in this Annual Report on Form 10-K.
|
|
(4)
|
A special cash dividend was paid during 2012.
|
21
ITEM 7.
MANAGEMENT’S DISCUSSION AND ANALYSIS OF FINANCIAL CONDITION AND RESULTS OF OPERATIONS
This Annual Report on Form 10-K contains forward-looking statements within the meaning of the Private Securities Litigation Reform Act of 1995. Actual results and the timing of events could differ materially from those projected in forward-looking statements due to a number of factors, including those described under “Item 1A - Risk Factors” and elsewhere in this Annual Report. See “Special Note Regarding Forward-Looking Statements.”
(All dollar amounts referenced in this Item 7 are in thousands, unless otherwise stated)
Executive Summary
We broadcast our music, sports, entertainment, comedy, talk, news, traffic and weather channels, as well as infotainment services in the United States on a subscription fee basis through our two proprietary satellite radio systems. Subscribers can also receive our music and other channels, plus new features such as SiriusXM On Demand, over the Internet, including through applications for mobile devices.
We have agreements with every major automaker (“OEMs”) to offer satellite radios as factory- or dealer-installed equipment in their vehicles from which we acquire the majority of our subscribers. We also acquire subscribers through the sale or lease of previously owned vehicles with factory-installed satellite radios. Additionally, we distribute our satellite radios through retail locations nationwide and through our website. Satellite radio services are also offered to customers of certain daily rental car companies.
As of
December 31, 2012
, we had
23,900,336
subscribers of which
19,570,274
were self-pay subscribers and
4,330,062
were paid promotional subscribers. Our subscriber totals include subscribers under our regular pricing plans; discounted pricing plans; subscribers that have prepaid, including payments either made or due from automakers for subscriptions included in the sale or lease price of a vehicle; certain radios activated for daily rental fleet programs; subscribers to our Internet services who do not also have satellite radio subscriptions; and certain subscribers to our weather, traffic, data and Backseat TV services.
Our primary source of revenue is subscription fees, with most of our customers subscribing on an annual, semi-annual, quarterly or monthly basis. We offer discounts for prepaid and long-term subscription plans, as well as discounts for multiple subscriptions on each platform. We also derive revenue from other subscription-related fees, the sale of advertising on select non-music channels, the direct sale of satellite radios, components and accessories, and other ancillary services, such as our Internet radio, Backseat TV, data, traffic, and weather services.
In certain cases, automakers include a subscription to our radio services in the sale or lease price of new and previously owned vehicles. The length of these prepaid subscriptions varies, but is typically three to twelve months. In many cases, we receive subscription payments from automakers in advance of the activation of our service. We also reimburse various automakers for certain costs associated with satellite radios installed in their vehicles.
As of January 17, 2013, Liberty Media Corporation beneficially owned, directly and indirectly, over 50% of the outstanding shares of our common stock. Liberty Media owns interests in a broad range of media, communications and entertainment businesses, including its subsidiaries Atlanta National League Baseball Club, Inc. and TruePosition, Inc., its interests in Live Nation Entertainment, Barnes & Noble, and minority equity investments in Time Warner Inc. and Viacom.
We also have an equity interest in Sirius XM Canada which offers satellite radio services in Canada. Subscribers to the Sirius XM Canada service are not included in our subscriber count.
22
Results of Operations
Set forth below are our results of operations for the
year ended
December 31, 2012
compared with the
year ended
December 31, 2011
and the
year ended
December 31, 2011
compared with the
year ended
December 31, 2010
.
|
|
For the Years Ended December 31,
|
2012 vs 2011 Change
|
2011 vs 2010 Change
|
||||||||||||||||||||||
|
|
2012
|
|
2011
|
|
2010
|
Amount
|
|
%
|
Amount
|
|
%
|
||||||||||||||
|
Revenue:
|
|
|
|
|
|
|
|||||||||||||||||||
|
Subscriber revenue
|
$
|
2,962,665
|
|
$
|
2,595,414
|
|
$
|
2,414,174
|
|
$
|
367,251
|
|
|
14
|
%
|
$
|
181,240
|
|
|
8
|
%
|
||||
|
Advertising revenue, net of agency fees
|
82,320
|
|
73,672
|
|
64,517
|
|
8,648
|
|
|
12
|
%
|
9,155
|
|
|
14
|
%
|
|||||||||
|
Equipment revenue
|
73,456
|
|
71,051
|
|
71,355
|
|
2,405
|
|
|
3
|
%
|
(304
|
)
|
|
—
|
%
|
|||||||||
|
Other revenue
|
283,599
|
|
274,387
|
|
266,946
|
|
9,212
|
|
|
3
|
%
|
7,441
|
|
|
3
|
%
|
|||||||||
|
Total revenue
|
3,402,040
|
|
3,014,524
|
|
2,816,992
|
|
387,516
|
|
|
13
|
%
|
197,532
|
|
|
7
|
%
|
|||||||||
|
Operating expenses:
|
|
|
|
|
|
|
|
|
|||||||||||||||||
|
Cost of services:
|
|
|
|
|
|
|
|
|
|||||||||||||||||
|
Revenue share and royalties
|
551,012
|
|
471,149
|
|
435,410
|
|
79,863
|
|
|
17
|
%
|
35,739
|
|
|
8
|
%
|
|||||||||
|
Programming and content
|
278,997
|
|
281,234
|
|
305,914
|
|
(2,237
|
)
|
|
(1
|
)%
|
(24,680
|
)
|
|
(8
|
)%
|
|||||||||
|
Customer service and billing
|
294,980
|
|
259,719
|
|
241,680
|
|
35,261
|
|
|
14
|
%
|
18,039
|
|
|
7
|
%
|
|||||||||
|
Satellite and transmission
|
72,615
|
|
75,902
|
|
80,947
|
|
(3,287
|
)
|
|
(4
|
)%
|
(5,045
|
)
|
|
(6
|
)%
|
|||||||||
|
Cost of equipment
|
31,766
|
|
33,095
|
|
35,281
|
|
(1,329
|
)
|
|
(4
|
)%
|
(2,186
|
)
|
|
(6
|
)%
|
|||||||||
|
Subscriber acquisition costs
|
474,697
|
|
434,482
|
|
413,041
|
|
40,215
|
|
|
9
|
%
|
21,441
|
|
|
5
|
%
|
|||||||||
|
Sales and marketing
|
248,905
|
|
222,773
|
|
215,454
|
|
26,132
|
|
|
12
|
%
|
7,319
|
|
|
3
|
%
|
|||||||||
|
Engineering, design and development
|
48,843
|
|
53,435
|
|
45,390
|
|
(4,592
|
)
|
|
(9
|
)%
|
8,045
|
|
|
18
|
%
|
|||||||||
|
General and administrative
|
261,905
|
|
238,738
|
|
240,970
|
|
23,167
|
|
|
10
|
%
|
(2,232
|
)
|
|
(1
|
)%
|
|||||||||
|
Depreciation and amortization
|
266,295
|
|
267,880
|
|
273,691
|
|
(1,585
|
)
|
|
(1
|
)%
|
(5,811
|
)
|
|
(2
|
)%
|
|||||||||
|
Restructuring, impairments and related costs
|
—
|
|
—
|
|
63,800
|
|
—
|
|
|
nm
|
|
(63,800
|
)
|
|
nm
|
|
|||||||||
|
Total operating expenses
|
2,530,015
|
|
2,338,407
|
|
2,351,578
|
|
191,608
|
|
|
8
|
%
|
(13,171
|
)
|
|
(1
|
)%
|
|||||||||
|
Income from operations
|
872,025
|
|
676,117
|
|
465,414
|
|
195,908
|
|
|
29
|
%
|
210,703
|
|
|
45
|
%
|
|||||||||
|
Other income (expense):
|
|
|
|
|
|
|
|
|
|||||||||||||||||
|
Interest expense, net of amounts capitalized
|
(265,321
|
)
|
(304,938
|
)
|
(295,643
|
)
|
39,617
|
|
|
13
|
%
|
(9,295
|
)
|
|
(3
|
)%
|
|||||||||
|
Loss on extinguishment of debt and credit facilities, net
|
(132,726
|
)
|
(7,206
|
)
|
(120,120
|
)
|
(125,520
|
)
|
|
nm
|
|
112,914
|
|
|
94
|
%
|
|||||||||
|
Interest and investment income (loss)
|
716
|
|
73,970
|
|
(5,375
|
)
|
(73,254
|
)
|
|
(99
|
)%
|
79,345
|
|
|
nm
|
|
|||||||||
|
Other (loss) income
|
(226
|
)
|
3,252
|
|
3,399
|
|
(3,478
|
)
|
|
(107
|
)%
|
(147
|
)
|
|
(4
|
)%
|
|||||||||
|
Total other expense
|
(397,557
|
)
|
(234,922
|
)
|
(417,739
|
)
|
(162,635
|
)
|
|
(69
|
)%
|
182,817
|
|
|
44
|
%
|
|||||||||
|
Income before income taxes
|
474,468
|
|
441,195
|
|
47,675
|
|
33,273
|
|
|
8
|
%
|
393,520
|
|
|
825
|
%
|
|||||||||
|
Income tax benefit (expense)
|
2,998,234
|
|
(14,234
|
)
|
(4,620
|
)
|
3,012,468
|
|
|
nm
|
|
(9,614
|
)
|
|
(208
|
)%
|
|||||||||
|
Net income
|
$
|
3,472,702
|
|
$
|
426,961
|
|
$
|
43,055
|
|
$
|
3,045,741
|
|
|
713
|
%
|
$
|
383,906
|
|
|
892
|
%
|
||||
nm - not meaningful
Total Revenue
Subscriber Revenue
includes subscription, activation and other fees.
|
•
|
2012 vs. 2011:
For the
years ended
December 31, 2012
and
2011
, subscriber revenue was
$2,962,665
and
$2,595,414
, respectively, an
increase
of
14%
, or
$367,251
. The
increase
was primarily attributable to a 9% increase in daily weighted average number of subscribers, the increase in certain of our subscription rates beginning in January 2012, and an increase in subscriptions to premium services, including Premier packages, data services and Internet streaming. The increase was partially offset by subscription discounts offered through customer acquisition and retention programs.
|
23
|
•
|
2011 vs. 2010:
For the
years ended
December 31, 2011
and 2010, subscriber revenue was
$2,595,414
and
$2,414,174
, respectively, an
increase
of
8%
, or
$181,240
. The
increase
was primarily attributable to an increase of 8% in daily weighted average number of subscribers and an increase in subscriptions to premium services, including Premier packages, data services and Internet subscriptions, partially offset by the impact of subscription discounts offered through customer acquisition and retention programs.
|
We expect subscriber revenues to grow based on the growth of our subscriber base, promotions, plan mix, subscription prices and identification of additional revenue streams from subscribers.
Advertising Revenue
includes the sale of advertising on certain non-music channels, net of agency fees. Agency fees are based on a contractual percentage of the gross advertising revenue.
|
•
|
2012 vs. 2011:
For the
years ended
December 31, 2012
and
2011
, advertising revenue was
$82,320
and
$73,672
, respectively, an
increase
of
12%
, or
$8,648
. The
increase
was primarily due to a greater number of advertising spots sold and broadcast, as well as increases in rates charged per spot.
|
|
•
|
2011 vs. 2010:
For the
years ended
December 31, 2011
and 2010, advertising revenue was
$73,672
and
$64,517
, respectively, an
increase
of
14%
, or
$9,155
. The
increase
was primarily due to a greater number of advertising spots sold and broadcast, as well as increases in rates charged per spot.
|
We expect our advertising revenue to grow as advertisers are attracted to our platform by the increase in our subscriber base.
Equipment Revenue
includes revenue and royalties from the sale of satellite radios, components and accessories.
|
•
|
2012 vs. 2011:
For the
years ended
December 31, 2012
and
2011
, equipment revenue was
$73,456
and
$71,051
, respectively, an
increase
of
3%
, or
$2,405
. The
increase
was driven by royalties from higher OEM production, offset by lower direct to consumer sales.
|
|
•
|
2011 vs. 2010:
For the
years ended
December 31, 2011
and 2010, equipment revenue was
$71,051
and
$71,355
, respectively, a
decrease
of
$304
. The
decrease
was driven by a reduction in aftermarket hardware subsidies earned, partially offset by increased royalties from higher OEM production.
|
We expect equipment revenue to fluctuate based on OEM production for which we receive royalty payments for our technology and, to a lesser extent, on the volume and mix of equipment sales in our aftermarket and direct to consumer business.
Other Revenue
includes amounts earned from subscribers for the U.S. Music Royalty Fee, revenue from our Canadian affiliate and ancillary revenues.
|
•
|
2012 vs. 2011:
For the
years ended
December 31, 2012
and
2011
, other revenue was
$283,599
and
$274,387
, respectively, an
increase
of
3%
, or
$9,212
. The
increase
was driven by revenues from the U.S. Music Royalty Fee as the number of subscribers increased, and higher royalty revenue from Sirius XM Canada.
|
|
•
|
2011 vs. 2010:
For the
years ended
December 31, 2011
and 2010, other revenue was
$274,387
and
$266,946
, respectively, an
increase
of
3%
, or
$7,441
. The
increase
was primarily due to higher royalty revenue from Sirius XM Canada. While the number of subscribers subject to the U.S. Music Royalty Fee increased, that increase was offset by a reduction in December 2010 in the rate charged on primary subscriptions.
|
Other revenue is dependent upon the U.S. Music Royalty Fee and the royalty from our Canadian affiliate. We expect other revenue to increase as our subscriber base drives higher U.S. Music Royalty Fees and as the performance of our Canadian affiliate improves.
24
Operating Expenses
Revenue Share and Royalties
include distribution and content provider revenue share, advertising revenue share, and broadcast and web streaming royalties. Advertising revenue share is recognized in revenue share and royalties in the period in which the advertising is broadcast.
|
•
|
2012 vs. 2011:
For the
years ended
December 31, 2012
and
2011
, revenue share and royalties were
$551,012
and
$471,149
, respectively, an
increase
of
17%
, or
$79,863
, and
increased
as a percentage of total revenue. The
increase
was primarily attributable to greater revenues subject to royalty and/or revenue sharing arrangements and a 7% increase in the statutory royalty rate for the performance of sound recordings, partially offset by an increase in the benefit to earnings from the amortization of deferred credits on executory contracts initially recognized in purchase price accounting associated with the Merger.
|
|
•
|
2011 vs. 2010:
For the
years ended
December 31, 2011
and 2010, revenue share and royalties were
$471,149
and
$435,410
, respectively, an
increase
of
8%
, or
$35,739
. For the year ended
December 31, 2011
, revenue share and royalties
remained flat
as a percentage of total revenue. The
increase
in revenue share and royalties was primarily attributable to a 14% increase in our revenues subject to royalty and/or revenue sharing arrangements and a 7% increase in the statutory royalty rate for the performance of sound recordings, partially offset by a $18,974 increase in the benefit to earnings from the amortization of deferred credits on executory contracts initially recognized in purchase price accounting associated with the Merger.
|
We expect our revenue share and royalty costs to increase as our revenues grow. Under the terms of the Copyright Royalty Board's decision, we paid royalties of 8.0% and 7.5% of gross revenues, subject to certain exclusions, for the
years ended
December 31, 2012
, and
2011
, respectively, and will pay 9.0% in 2013. The deferred credits on executory contracts initially recognized in purchase price accounting associated with the Merger are expected to provide increasing benefits to revenue share and royalties through the expiration of the acquired executory contracts in 2013.
Programming and Content
includes costs to acquire, create, promote and produce content. We have entered into various agreements with third parties for music and non-music programming that require us to pay license fees, purchase advertising on media properties owned or controlled by the licensor, which is allocated to sales and marketing, and pay other guaranteed amounts.
|
•
|
2012 vs. 2011:
For the
years ended
December 31, 2012
and
2011
, programming and content expenses were
$278,997
and
$281,234
, respectively, a
decrease
of
1%
, or
$2,237
, and
decreased
as a percentage of total revenue. The
decrease
was primarily due to savings in content agreements, partially offset by increases in personnel costs and reductions in the benefit to earnings from purchase price accounting adjustments associated with the Merger attributable to the amortization of the deferred credit on acquired programming executory contracts.
|
|
•
|
2011 vs. 2010:
For the
years ended
December 31, 2011
and 2010, programming and content expenses were
$281,234
and
$305,914
, respectively, a
decrease
of
8%
, or
$24,680
, and
decreased
as a percentage of total revenue. The
decrease
was primarily due to savings in content agreements and production costs, partially offset by increases in personnel costs and an $8,394 reduction in the benefit to earnings from purchase price accounting adjustments associated with the Merger attributable to the amortization of the deferred credit on acquired programming executory contracts.
|
Excluding the impact from purchase accounting adjustments, based on our current programming offerings, we expect our programming and content expenses to decrease as agreements expire and are renewed or replaced on more cost effective terms. The impact of purchase price accounting adjustments associated with the Merger attributable to the amortization of the deferred credit on acquired programming executory contracts will continue to decline, in absolute amount and as a percentage of reported programming and content costs, through 2015. Substantially all of the deferred credits on executory contracts will be amortized by the end of 2013.
Customer Service and Billing
includes costs associated with the operation and management of third party customer service centers, and our subscriber management systems as well as billing and collection costs, transaction fees and bad debt expense.
|
•
|
2012 vs. 2011:
For the
years ended
December 31, 2012
and
2011
, customer service and billing expenses were
$294,980
and
$259,719
, respectively, an
increase
of
14%
, or
$35,261
, but
remained flat
as a percentage of total revenue. The
increase
was primarily due to longer average handle time per call and higher subscriber volume driving increased subscriber contacts and higher technology costs.
|
25
|
•
|
2011 vs. 2010:
For the
years ended
December 31, 2011
and 2010, customer service and billing expenses were
$259,719
and
$241,680
, respectively, an
increase
of
7%
, or
$18,039
, but
remained flat
as a percentage of total revenue. The
increase
was primarily attributable to an 8% increase in daily weighted average number of subscribers which drove higher call volume, billing and collection costs, transaction fees, as well as increased handle time per call and personnel costs. This
increase
was partially offset by lower agent rates, fewer contacts per subscriber and lower general operating costs.
|
We expect our customer service and billing expenses to increase as our subscriber base grows.
Satellite and Transmission
consists of costs associated with the operation and maintenance of our satellites; satellite telemetry, tracking and control systems; terrestrial repeater networks; satellite uplink facilities; broadcast studios; and delivery of our Internet streaming service.
|
•
|
2012 vs. 2011:
For the
years ended
December 31, 2012
and
2011
, satellite and transmission expenses were
$72,615
and
$75,902
, respectively, a
decrease
of
4%
, or
$3,287
, and
decreased
as a percentage of total revenue. The
decrease
was primarily due to a reduction of satellite in-orbit insurance expense as we elected not to renew insurance policies on certain older satellites.
|
|
•
|
2011 vs. 2010:
For the
years ended
December 31, 2011
and 2010, satellite and transmission expenses were
$75,902
and
$80,947
, respectively, a
decrease
of
6%
, or
$5,045
, and
decreased
as a percentage of total revenue. The
decrease
was due to savings in repeater expenses from network optimization along with favorable lease renewals, a reduction of satellite in-orbit insurance expense, and a transition to more cost-effective approaches to satellite and broadcast operations.
|
We expect overall satellite and transmission expenses to increase as we enhance our Internet-based service and add functionality, launch our FM-6 satellite and incur in-orbit insurance costs, and extend our terrestrial repeater network.
Cost of Equipment
includes costs from the sale of satellite radios, components and accessories and provisions for inventory allowance attributable to products purchased for resale in our direct to consumer distribution channels.
|
•
|
2012 vs. 2011:
For the
years ended
December 31, 2012
and
2011
, cost of equipment was
$31,766
and
$33,095
, respectively, a
decrease
of
4%
, or
$1,329
, and
decreased
as a percentage of equipment revenue. The
decrease
was primarily due to lower direct to consumer sales, partially offset by higher inventory reserves.
|
|
•
|
2011 vs. 2010:
For the
years ended
December 31, 2011
and 2010, cost of equipment was
$33,095
and
$35,281
, respectively, a
decrease
of
6%
, or
$2,186
, and
decreased
as a percentage of equipment revenue. The
decrease
was primarily due to lower volume of direct to consumer sales.
|
We expect cost of equipment to vary with changes in sales, supply chain management and inventory valuations.
Subscriber Acquisition Costs
include hardware subsidies paid to radio manufacturers, distributors and automakers, including subsidies paid to automakers who include a satellite radio and subscription to our service in the sale or lease price of a new vehicle; subsidies paid for chip sets and certain other components used in manufacturing radios; device royalties for certain radios and chip sets; commissions paid to automakers as incentives to purchase, install and activate satellite radios; product warranty obligations; freight; and provisions for inventory allowances attributable to inventory consumed in our OEM and retail distribution channels. The majority of subscriber acquisition costs are incurred and expensed in advance of, or concurrent with, acquiring a subscriber. Subscriber acquisition costs do not include advertising, marketing, loyalty payments to distributors and dealers of satellite radios or revenue share payments to automakers and retailers of satellite radios.
|
•
|
2012 vs. 2011:
For the
years ended
December 31, 2012
and
2011
, subscriber acquisition costs were
$474,697
and
$434,482
, respectively, an
increase
of
9%
, or
$40,215
, and
decreased
as a percentage of total revenue. The
increase
was primarily a result of higher subsidies related to increased OEM installations occurring in advance of acquiring the subscriber, partially offset by improved OEM subsidy rates per vehicle and increases in the benefit to earnings from the amortization of the deferred credit for acquired executory contracts recognized in purchase price accounting associated with the Merger.
|
|
•
|
2011 vs. 2010:
For the
years ended
December 31, 2011
and 2010, subscriber acquisition costs were
$434,482
and
$413,041
, respectively, an
increase
of
5%
, or
$21,441
, and
decreased
as a percentage of total revenue. The
increase
was primarily a result of the 12% increase in gross subscriber additions and higher subsidies related to
|
26
increased OEM installations occurring in advance of acquiring the subscriber, partially offset by improved OEM subsidy rates per vehicle and a $6,052 increase in the benefit to earnings from the amortization of the deferred credit for acquired executory contracts recognized in purchase price accounting associated with the Merger.
We expect total subscriber acquisition costs to fluctuate with increases or decreases in OEM installations and changes in our gross subscriber additions. Changes in contractual OEM subsidy rates and the cost of subsidized radio components will also impact total subscriber acquisition costs. The impact of purchase price accounting adjustments associated with the Merger attributable to the amortization of the deferred credit for acquired executory contracts will vary, in absolute amount and as a percentage of reported subscriber acquisition costs, through the expiration of the acquired contracts in 2013. We intend to continue to offer subsidies, commissions and other incentives to acquire subscribers.
Sales and Marketing
includes costs for advertising, media and production, including promotional events and sponsorships; cooperative marketing; customer acquisition and retention, and personnel. Cooperative marketing costs include fixed and variable payments to reimburse retailers and automakers for the cost of advertising and other product awareness activities performed on our behalf. Customer acquisition and retention costs include expenses related to direct mail, outbound telemarketing and email.
|
•
|
2012 vs. 2011:
For the
years ended
December 31, 2012
and
2011
, sales and marketing expenses were
$248,905
and
$222,773
, respectively, an
increase
of
12%
, or
$26,132
, and
remained flat
as a percentage of total revenue. The
increase
was primarily due to additional subscriber communications and retention programs associated with a greater number of subscribers and promotional trials, and higher OEM cooperative marketing.
|
|
•
|
2011 vs. 2010:
For the
years ended
December 31, 2011
and 2010, sales and marketing expenses were
$222,773
and
$215,454
, respectively, an
increase
of
3%
, or
$7,319
, and
decreased
as a percentage of total revenue. The
increase
was primarily due to increased subscriber communications and retention programs associated with a greater number of subscribers and promotional trials, partially offset by reductions in consumer advertising and event marketing.
|
We anticipate that sales and marketing expenses will increase as we launch seasonal advertising and promotional initiatives to attract new subscribers, and launch and expand programs to retain our existing subscribers and win-back former subscribers. The impact of purchase price accounting adjustments associated with the Merger attributable to the amortization of the deferred credit on acquired sales and marketing contracts will continue to decline, in absolute amount and as a percentage of reported sales and marketing costs, through 2013.
Engineering, Design and Development
includes costs to develop chip sets and new products and services, research and development for broadcast information systems and costs associated with the incorporation of our radios into vehicles manufactured by automakers.
|
•
|
2012 vs. 2011:
For the
years ended
December 31, 2012
and
2011
, engineering, design and development expenses were
$48,843
and
$53,435
, respectively, a
decrease
of
9%
, or
$4,592
, and
decreased
as a percentage of total revenue. The
decrease
was driven primarily by a reversal of certain non-recurring engineering charges, partially offset by higher product development costs, costs related to the development of enhanced subscriber features and functionality for our service and higher personnel costs.
|
|
•
|
2011 vs. 2010:
For the
years ended
December 31, 2011
and 2010, engineering, design and development expenses were
$53,435
and
$45,390
, respectively, an
increase
of
18%
, or
$8,045
, and
remained flat
as a percentage of total revenue. The
increase
was primarily due to higher product development costs and costs related to enhanced subscriber features and functionality, partially offset by lower share-based payment expenses.
|
We expect engineering, design and development expenses to increase in future periods as we develop our next generation chip sets and products.
General and Administrative
includes executive management, rent and occupancy, finance, legal, human resources, information technology, and insurance costs.
|
•
|
2012 vs. 2011:
For the
years ended
December 31, 2012
and
2011
, general and administrative expenses were
$261,905
and
$238,738
, respectively, an
increase
of
10%
, or
$23,167
, but
remained flat
as a percentage of total revenue. The
increase
was primarily due to higher personnel costs, including share-based payment expenses, office rent expenses and professional fees, partially offset by lower litigation settlement charges.
|
27
|
•
|
2011 vs. 2010:
For the
years ended
December 31, 2011
and 2010, general and administrative expenses were
$238,738
and
$240,970
, respectively, a
decrease
of
1%
, or
$2,232
, and
decreased
as a percentage of total revenue. The
decrease
was primarily due to lower share-based payment expense, as well as lower general operating expenses, including rent, insurance and information technology costs.
|
We expect our general and administrative expenses to increase in future periods as a result of, among other things, enhanced information technology and personnel costs to support the growth of our business.
Depreciation and Amortization
represents the systematic recognition in earnings of the acquisition cost of assets used in operations, including our satellite constellations, property, equipment and intangible assets, over their estimated service lives.
|
•
|
2012 vs. 2011:
For the
years ended
December 31, 2012
and
2011
, depreciation and amortization expense was
$266,295
and
$267,880
, respectively, a
decrease
of
1%
, or
$1,585
, and
decreased
as a percentage of total revenue. The
decrease
was driven by reductions in the amortization of subscriber relationships and depreciation recognized on assets placed in-service as certain assets reached the end of their estimated service lives.
|
|
•
|
2011 vs. 2010:
For the
years ended
December 31, 2011
and 2010, depreciation and amortization expense was
$267,880
and
$273,691
, respectively, a
decrease
of
2%
, or
$5,811
, and
decreased
as a percentage of total revenue. The
decrease
was primarily due to a reduction in the amortization of subscriber relationships, partially offset by depreciation recognized on additional assets placed in service.
|
We expect depreciation expense to increase in future periods as we launch our FM-6 satellite, which will be partially offset by reduced amortization associated with the stepped-up basis in assets acquired in the Merger (including intangible assets, satellites, property and equipment) through the end of their estimated service lives, principally through 2017.
Restructuring, Impairments and Related Costs
represents charges related to the reorganization of our staff and restructuring of contracts, as well as charges related to the impairment of assets when those costs are deemed to provide no future benefit.
|
•
|
2012 vs. 2011:
In 2012 and 2011, we did not record any restructuring, impairments and related costs.
|
|
•
|
2011 vs. 2010:
For the year ended December 31, 2010, restructuring, impairments and related costs were $63,800 primarily due to the impairment of our FM-4 satellite as a result of the launch of our XM-5 satellite in 2010 and contract terminations.
|
Other Income (Expense)
Interest Expense, Net of Amounts Capitalized,
includes interest on outstanding debt, reduced by interest capitalized in connection with the construction of our satellites and related launch vehicles.
|
•
|
2012 vs. 2011:
For the
years ended
December 31, 2012
and
2011
, interest expense was
$265,321
and
$304,938
, respectively, a
decrease
of
13%
, or
$39,617
. The
decrease
was primarily due to a lower average outstanding debt balance and a mix of outstanding debt with lower interest rates.
|
|
•
|
2011 vs. 2010:
For the
years ended
December 31, 2011
and 2010, interest expense was
$304,938
and
$295,643
, respectively, an
increase
of
3%
, or
$9,295
. The
increase
was primarily due to lower capitalized interest related to the construction of our satellites and related launch vehicles, partially offset by outstanding debt with lower interest rates.
|
We expect interest expense to decrease in future periods due to debt retirements at maturity, redemptions and repurchases in 2012. The decrease will be partially offset by a decrease in capitalized interest following the launch of our FM-6 satellite.
Loss on Extinguishment of Debt and Credit Facilities, Net,
includes losses incurred as a result of the conversion and retirement of certain debt.
|
•
|
2012 vs. 2011:
For the
year ended
December 31, 2012
, loss on extinguishment of debt and credit facilities, net, was
$132,726
. The loss was recorded on the repayment of our 13% Senior Notes due 2013 and our 9.75% Senior Secured Notes due 2015. During the
year ended
December 31, 2011
, a
$7,206
loss was recorded on the repayment of our 11.25% Senior Secured Notes due 2013 and our 3.25% Convertible Notes due 2011.
|
28
|
•
|
2011 vs. 2010:
For the
year ended
December 31, 2011
, loss on extinguishment of debt and credit facilities, net, was
$7,206
. During the year ended December 31, 2010, a
$120,120
loss was recorded on the repayment of our Senior Secured Term Loan due 2012 and 9.625% Senior Notes due 2013 and XM's 10% Senior PIK Secured Notes due 2011 and 9.75% Senior Notes due 2014, as well as the partial repayment of XM's 11.25% Senior Secured Notes due 2013 and our 3.25% Convertible Notes due 2011.
|
Interest and Investment Income (Loss)
includes realized gains and losses, dividends, interest income, our share of Sirius Canada’s and XM Canada’s pre-Merger net losses, and our share of the income (loss) of Sirius XM Canada.
|
•
|
2012 vs. 2011:
For the
year ended
December 31, 2012
, interest and investment income was
$716
compared to
$73,970
in
2011
. The interest and investment income for 2012 was primarily due to interest on our investments and our share of Sirius XM Canada's net income, partially offset by the amortization expense related to our equity method intangible assets. The interest and investment income for 2011 was primarily due to income from our interests in Sirius XM Canada due to the realized net gain from the Canada Merger in the second quarter of 2011.
|
|
•
|
2011 vs. 2010:
For the
years ended
December 31, 2011
and 2010, interest and investment income (loss) was
$73,970
and
$(5,375)
, respectively, an
increase
of
$79,345
. The
increase
was attributable to a net gain realized as a result of the Canada Merger. This transaction resulted in the recognition of a $75,768 gain recorded in interest and investment income. The gain was partially offset by our share of net losses at our Canadian affiliate.
|
Income Taxes
Income Tax Benefit (Expense)
includes the reversal of substantially all of our deferred income tax valuation allowance, the change in our deferred tax liability related to the difference in accounting for our FCC licenses, which are amortized over 15 years for tax purposes but not amortized for book purposes in accordance with GAAP, foreign withholding taxes on royalty income, and the effect of changes in certain state laws related to the utilization of net operating losses ("NOLs").
|
•
|
2012 vs. 2011:
For the
year ended
December 31, 2012
, income tax benefit was
$2,998,234
compared to income tax expense of
$(14,234)
for
2011
. For the
year ended
December 31, 2012
, we released
$3,195,651
of valuation allowance due to the cumulative positive evidence that it is more likely than not that our deferred tax assets will be realized.
|
|
•
|
2011 vs. 2010:
For the
years ended
December 31, 2011
and 2010, income tax expense was
$14,234
and
$4,620
, respectively, an
increase
of
208%
, or
$9,614
, primarily due to an increase in the applicable state effective tax rates, foreign withholding taxes on royalty income and the state tax impact of the suspension of NOL use in California and Illinois.
|
As of
December 31, 2012
, the deferred tax asset valuation allowance of
$9,835
relates to deferred tax assets that are not likely to be realized due to certain state NOL limitations.
29
Subscriber Data
The following table contains subscriber data for the
years ended December 31, 2012, 2011 and 2010
, respectively:
|
Unaudited
|
|||||||||
|
For the Years Ended December 31,
|
|||||||||
|
2012
|
2011
|
2010
|
|||||||
|
Beginning subscribers
|
21,892,824
|
|
20,190,964
|
|
18,772,758
|
|
|||
|
Gross subscriber additions
|
9,617,771
|
|
8,696,020
|
|
7,768,827
|
|
|||
|
Deactivated subscribers
|
(7,610,259
|
)
|
(6,994,160
|
)
|
(6,350,621
|
)
|
|||
|
Net additions
|
2,007,512
|
|
1,701,860
|
|
1,418,206
|
|
|||
|
Ending subscribers
|
23,900,336
|
|
21,892,824
|
|
20,190,964
|
|
|||
|
Self-pay
|
19,570,274
|
|
17,908,742
|
|
16,686,799
|
|
|||
|
Paid promotional
|
4,330,062
|
|
3,984,082
|
|
3,504,165
|
|
|||
|
Ending subscribers
|
23,900,336
|
|
21,892,824
|
|
20,190,964
|
|
|||
|
Self-pay
|
1,661,532
|
|
1,221,943
|
|
982,867
|
|
|||
|
Paid promotional
|
345,980
|
|
479,917
|
|
435,339
|
|
|||
|
Net additions
|
2,007,512
|
|
1,701,860
|
|
1,418,206
|
|
|||
|
Daily weighted average number of subscribers
|
22,794,170
|
|
20,903,908
|
|
19,385,055
|
|
|||
|
Average self-pay monthly churn
|
1.9
|
%
|
1.9
|
%
|
1.9
|
%
|
|||
|
New vehicle consumer conversion rate
|
45
|
%
|
45
|
%
|
46
|
%
|
|||
|
Note: See pages 39 through 45 for glossary.
|
|||||||||
Subscribers.
At
December 31, 2012
, we had
23,900,336
subscribers, an increase of
2,007,512
subscribers, or
9%
, from the
21,892,824
subscribers as of
December 31, 2011
.
|
•
|
2012 vs. 2011:
For the
years ended
December 31, 2012
and
2011
, net additions were
2,007,512
and
1,701,860
, respectively, an increase of
18%
, or
305,652
. The improvement was due to the increase in gross subscriber additions, primarily resulting from higher new vehicle shipments and light vehicle sales, as well as an increase in the number of conversions from unpaid promotional trials and returning subscriber activations, including consumers in previously owned vehicles.
This increase in gross additions was partially offset by an increase in deactivations. The increase in deactivations was primarily due to paid promotional trial deactivations stemming from the growth of paid trials and increased self-pay deactivations from our larger subscriber base.
|
|
•
|
2011 vs. 2010
: For the
years ended
December 31, 2011
and 2010, net additions were
1,701,860
and
1,418,206
, respectively, an increase in net additions of
20%
, or
283,654
. The improvement was due to the 12% increase in gross subscriber additions, primarily resulting from an increase in U.S. light vehicle sales, new vehicle penetration, and returning subscriber activations including previously owned car acquisitions. This increase in gross additions was partially offset by the 10% increase in deactivations, which was primarily due to an increase in paid promotional trial volume along with growth in our subscriber base.
|
Average Self-pay Monthly Churn
for the year is derived from the average of the quarterly average self-pay monthly churn during the year. Average self-pay monthly churn for a quarter is derived by dividing the monthly average of self-pay deactivations for a quarter by the average self-pay subscriber balance for a quarter. (See accompanying glossary on pages
39
through
45
for more details.)
|
•
|
2012 vs. 2011:
For the
years ended
December 31, 2012
and
2011
, our average self-pay monthly churn rate was
1.9%
.
|
|
•
|
2011 vs. 2010:
For the
years ended
December 31, 2011
and 2010, our average self-pay monthly churn rate was
1.9%
.
|
30
New Vehicle Consumer Conversion Rate
is the percentage of owners and lessees of new vehicles that receive our service and convert to become self-paying subscribers after an initial promotional period. The metric excludes rental and fleet vehicles.
(See accompanying glossary on pages
39
through
45
for more details).
|
•
|
2012 vs. 2011:
For the
years ended
December 31, 2012
and
2011
, the new vehicle consumer conversion rate was
45%
.
|
|
•
|
2011 vs. 2010:
For the
years ended
December 31, 2011
and 2010, the new vehicle consumer conversion rate was
45%
and
46%
, respectively. The decrease was primarily due to the changing mix of sales among OEMs and operational issues impacting the timing of the receipt of customer information and prompt marketing communications with buyers and lessees of vehicles.
|
Adjusted Results of Operations
In this section, we present certain financial performance measures that are not calculated and presented in accordance with generally accepted accounting principles in the United States of America (“Non-GAAP”). These Non-GAAP financial measures include: average monthly revenue per subscriber, or ARPU; customer service and billing expenses, per average subscriber; subscriber acquisition cost, or SAC, per gross subscriber addition; free cash flow; and adjusted EBITDA. These measures exclude the impact of certain purchase price accounting adjustments. We use these Non-GAAP financial measures to manage our business, to set operational goals and as a basis for determining performance-based compensation for our employees.
The purchase price accounting adjustments include the elimination of the earnings benefit of deferred revenue associated with our investment in Sirius XM Canada, the recognition of subscriber revenues not recognized in purchase price accounting and the elimination of the earnings benefit of deferred credits on executory contracts, which are primarily attributable to third party arrangements with an OEM and certain programming providers.
Our adjusted EBITDA also reallocates share-based payment expense from functional operating expense line items to a separate line within operating expenses. We believe the exclusion of share-based payment expense from functional operating expenses is useful given the significant variation in expense that can result from changes in the fair value as determined by the Black-Scholes-Merton model, which varies based on assumptions used for the expected life, expected stock price volatility and risk-free interest rates, the effect of which is unrelated to the operational conditions that give rise to variations in the components of our operating costs.
Free cash flow is a metric that our management and board of directors use to evaluate the cash generated by our operations, net of capital expenditures and other investment activity. In a capital intensive business, with significant historical and current investments in satellites, we look at our operating cash flow, net of these investing cash outflows, to determine cash available for future subscriber acquisition and capital expenditures, to repurchase or retire debt, to acquire other companies and to evaluate our ability to return capital to stockholders. We believe free cash flow is an indicator of the long-term financial stability of our business. Free cash flow, which is reconciled to “Net cash provided by operating activities”, is a non-GAAP financial measure. This measure can be calculated by deducting amounts under the captions "Additions to property and equipment" and deducting or adding Restricted and other investment activity from "Net cash provided by operating activities" from the consolidated statements of cash flows. Free cash flow should be used in conjunction with other GAAP financial performance measures and may not be comparable to free cash flow measures presented by other companies. Free cash flow should be viewed as a supplemental measure rather than an alternative measure of cash flows from operating activities, as determined in accordance with GAAP. Free cash flow is limited and does not represent remaining cash flows available for discretionary expenditures due to the fact that the measure does not deduct the payments required for debt maturities. We believe free cash flow provides useful supplemental information to investors regarding our current and projected cash flow, along with other GAAP measures (such as cash flows from operating and investing activities), to determine our financial condition, and to compare our operating performance to other communications, entertainment and media companies.
We believe these Non-GAAP financial measures provide useful information to investors regarding our financial condition and results of operations. We believe investors find these Non-GAAP financial performance measures useful in evaluating our core trends because it provides a direct view of our underlying contractual costs. We believe investors use our current and projected adjusted EBITDA to estimate our current or prospective enterprise value and to make investment decisions. By providing these Non-GAAP financial measures, together with the reconciliations to the most directly comparable GAAP measure, we believe we are enhancing investors' understanding of our business and our results of operations.
31
These Non-GAAP financial measures should be viewed in addition to, and not as an alternative for or superior to, our reported results prepared in accordance with GAAP. Please refer to the glossary (pages
39
through
45
) for a further discussion of such Non-GAAP financial measures and reconciliations to the most directly comparable GAAP measure.
The following table contains our key operating metrics based on our adjusted results of operations for the
years ended
December 31, 2012
,
2011
and 2010, respectively:
|
Unaudited Adjusted
|
|||||||||||
|
For the Years Ended December 31,
|
|||||||||||
|
(in thousands, except for per subscriber amounts)
|
2012
|
2011
|
2010
|
||||||||
|
ARPU
|
$
|
12.00
|
|
$
|
11.58
|
|
$
|
11.73
|
|
||
|
SAC, per gross subscriber addition
|
$
|
54
|
|
$
|
55
|
|
$
|
59
|
|
||
|
Customer service and billing expenses, per average subscriber
|
$
|
1.07
|
|
$
|
1.03
|
|
$
|
1.03
|
|
||
|
Free cash flow
|
$
|
709,446
|
|
$
|
415,742
|
|
$
|
210,481
|
|
||
|
Adjusted EBITDA
|
$
|
920,343
|
|
$
|
731,018
|
|
$
|
626,288
|
|
||
|
Note: See pages 39 through 45 for glossary.
|
ARPU
is derived from total earned subscriber revenue, net advertising revenue and other subscription-related revenue, net of purchase price accounting adjustments, divided by the number of months in the period, divided by the daily weighted average number of subscribers for the period. (See accompanying glossary on pages
39
through
45
for more details.)
|
•
|
2012 vs. 2011
: For the
years ended
December 31, 2012
and
2011
, ARPU was
$12.00
and
$11.58
, respectively. The increase was driven primarily by the increase in certain of our subscription rates beginning in January 2012, and an increase in subscriptions to premium services, partially offset by subscription discounts offered through customer acquisition and retention programs and a decrease in the contribution from the U.S. Music Royalty Fee.
|
|
•
|
2011 vs. 2010
: For the
years ended
December 31, 2011
and 2010, ARPU was
$11.58
and
$11.73
, respectively. The decrease was driven primarily by an increase in subscription discounts offered through customer acquisition and retention programs and a decrease in the contribution from the U.S. Music Royalty Fee, partially offset by an increase in subscriptions to our premium services, including Premier packages, data services and Internet subscriptions.
|
SAC, Per Gross Subscriber Addition,
is derived from subscriber acquisition costs and margins from the sale of radios, components and accessories, excluding share-based payment expense and purchase price accounting adjustments, divided by the number of gross subscriber additions for the period. (See accompanying glossary on pages
39
through
45
for more details.)
|
•
|
2012 vs. 2011
: For the
years ended
December 31, 2012
and
2011
, SAC, per gross subscriber addition, was
$54
and
$55
, respectively. The decrease was primarily due to improved OEM subsidy rates per vehicle, partially offset by higher subsidies related to increased OEM installations occurring in advance of acquiring the subscriber.
|
|
•
|
2011 vs. 2010
: For the
years ended
December 31, 2011
and 2010, SAC, per gross subscriber addition, was
$55
and
$59
, respectively. The decrease was primarily due to lower per radio subsidy rates for certain OEMs and growth in subscriber reactivations and royalties from radio manufacturers.
|
Customer Service and Billing Expenses, Per Average Subscriber,
is derived from total customer service and billing expenses, excluding share-based payment expense and purchase price accounting adjustments, divided by the number of months in the period, divided by the daily weighted average number of subscribers for the period. (See accompanying glossary on pages
39
through
45
for more details.)
|
•
|
2012 vs. 2011
: For the
years ended
December 31, 2012
and
2011
, customer service and billing expenses, per average subscriber, were
$1.07
and
$1.03
, respectively. The increase was primarily due to longer average handle time per call and higher technology costs.
|
32
|
•
|
2011 vs. 2010
: For the
years ended
December 31, 2011
and 2010, customer service and billing expenses, per average subscriber, were
$1.03
.
|
Free Cash Flow
includes the net cash provided by operations, additions to property and equipment, and other investing activity. (See accompanying glossary on pages
39
through
45
for more details.)
|
•
|
2012 vs. 2011
: For the
years ended
December 31, 2012
and
2011
, free cash flow was
$709,446
and
$415,742
, respectively, an increase of
$293,704
. The increase was primarily driven by higher net cash provided by operating activities resulting from improved operating performance and higher collections from subscribers and distributors, as well as a decrease in capital expenditures resulting from lower satellite and related launch vehicle construction costs.
|
|
•
|
2011 vs. 2010
: For the
years ended
December 31, 2011
and 2010, free cash flow was
$415,742
and
$210,481
, respectively, an increase of
$205,261
. The increase was primarily driven by higher net cash provided by operating activities resulting from improved operating performance, cash received from the Canada Merger, higher collections from subscribers and distributors, and the repayment in the first quarter of 2010 of liabilities deferred in 2009, as well as a decrease in capital expenditures for the year ended December 31, 2011 resulting from decreased satellite construction and launch expenditures due to the launch in 2010 of our XM-5 satellite, an increase in restricted and other investment activities driven by the return of capital resulting from the Canada Merger; partially offset by proceeds from the sale of investment securities in the year ended December 31, 2010.
|
Adjusted EBITDA.
EBITDA is defined as net income before interest and investment income (loss); interest expense, net of amounts capitalized; income tax benefit (expense) and depreciation and amortization. Adjusted EBITDA removes the impact of other income and expense, losses on extinguishment of debt as well as certain other charges, such as goodwill impairment; restructuring, impairments and related costs; certain purchase price accounting adjustments and share-based payment expense. (See the accompanying glossary on pages
39
through
45
for more details):
|
•
|
2012 vs. 2011
: For the
years ended
December 31, 2012
and
2011
, adjusted EBITDA was
$920,343
and
$731,018
, respectively, an increase of
26%
, or
$189,325
. The increase was primarily due to increases in adjusted revenues, partially offset by increases in expenses included in adjusted EBITDA. The increase in adjusted revenues was primarily due to the increase in our subscriber base and the increase in certain of our subscription rates. The increase in expenses was primarily driven by higher revenue share and royalties expenses associated with growth in revenues, higher subscriber acquisition costs related to increased gross subscriber additions and subsidies related to increased OEM installations, customer service and billing costs related to longer average handle times and higher subscriber volume, and higher sales and marketing costs related to subscriber communications and cooperative marketing, partially offset by lower programming and content costs.
|
|
•
|
2011 vs. 2010
: For the
years ended
December 31, 2011
and 2010, adjusted EBITDA was
$731,018
and
$626,288
, respectively, an increase of
17%
, or
$104,730
. The increase was primarily due to an increase in adjusted revenues, partially offset by an increase in expenses included in adjusted EBITDA. The increase in adjusted revenues was primarily due to the increase in our subscriber base. The increase in expenses was primarily driven by higher revenue share and royalties expenses associated with growth in revenues, increased customer service and billing expenses associated with subscriber growth and higher subscriber acquisition costs related to the 12% increase in gross additions, partially offset by lower programming and content costs.
|
33
Liquidity and Capital Resources
Cash Flows for the
Year Ended
December 31, 2012
Compared with the
Year Ended
December 31, 2011
and
Year Ended
December 31, 2011
Compared with the
Year Ended
December 31, 2010
As of
December 31, 2012
, 2011 and 2010, we had
$520,945
,
$773,990
and
$586,691
, respectively, of cash and cash equivalents. The following table presents a summary of our cash flow activity for the periods set forth below:
|
|
For the Years Ended December 31,
|
|
|||||||||||||||||
|
|
2012
|
2011
|
2010
|
2012 vs. 2011
|
2011 vs. 2010
|
||||||||||||||
|
Net cash provided by operating activities
|
$
|
806,765
|
|
$
|
543,630
|
|
$
|
512,895
|
|
$
|
263,135
|
|
$
|
30,735
|
|
||||
|
Net cash used in investing activities
|
(97,319
|
)
|
(127,888
|
)
|
(302,414
|
)
|
30,569
|
|
174,526
|
|
|||||||||
|
Net cash used in financing activities
|
(962,491
|
)
|
(228,443
|
)
|
(7,279
|
)
|
(734,048
|
)
|
(221,164
|
)
|
|||||||||
|
Net (decrease) increase in cash and cash equivalents
|
(253,045
|
)
|
187,299
|
|
203,202
|
|
(440,344
|
)
|
(15,903
|
)
|
|||||||||
|
Cash and cash equivalents at beginning of period
|
773,990
|
|
586,691
|
|
383,489
|
|
187,299
|
|
203,202
|
|
|||||||||
|
Cash and cash equivalents at end of period
|
$
|
520,945
|
|
$
|
773,990
|
|
$
|
586,691
|
|
$
|
(253,045
|
)
|
$
|
187,299
|
|
||||
Cash Flows Provided by Operating Activities
Cash provided by operating activities increased by
$263,135
to
$806,765
for the
year ended
December 31, 2012
from
$543,630
for the
year ended
December 31, 2011
. Cash provided by operating activities increased by
$30,735
to
$543,630
for the
year ended
December 31, 2011
from cash provided by operating activities of
$512,895
for the
year ended
December 31, 2010
. The primary driver of our operating cash flow growth has been improvements in profitability.
|
•
|
Our net income was
$3,472,702
,
$426,961
and
$43,055
for the
years ended December 31, 2012, 2011 and 2010
, respectively. Excluding the
$3,001,818
non-cash deferred tax valuation allowance reversal in 2012, our increase in net income was primarily driven by an increase in our subscriber revenues of
$367,251
, or
14%
, and
$181,240
, or
8%
, for the
years ended
December 31, 2012
and
2011
, respectively, attributable to the increase in daily weighted average subscribers, an increase in certain of our subscription rates beginning in January 2012, and an increase in subscriptions to premium services, including Premier packages, data services and streaming. Our growth in revenue was partially offset by an increase in our operating expenses of
$191,608
, or
8%
, for the year ended
December 31, 2012
. Operating expenses for the year ended
December 31, 2011
were flat compared
December 31, 2010
. The increase in operating expenses for the year ended
December 31, 2012
was primarily driven by higher revenue share and royalties expenses associated with growth in revenues, higher subscriber acquisition costs related to an
11%
increase in gross subscriber additions and subsidies related to increased OEM installations, customer service and billing costs related to longer average handle times and higher subscriber volume, and higher sales and marketing costs related to subscriber communications and cooperative marketing.
|
|
•
|
Net non-cash adjustments to net income were
$(2,758,067)
,
$66,975
and
$357,743
for the
years ended December 31, 2012, 2011 and 2010
, respectively. Significant components of non-cash expenses, and their impact on cash flows from operating activities, include the following:
|
|
|
For the Years Ended December 31,
|
||||||||||
|
|
2012
|
2011
|
2010
|
||||||||
|
Depreciation and amortization
|
$
|
266,295
|
|
$
|
267,880
|
|
$
|
273,691
|
|
||
|
Restructuring, impairments and related costs
|
$
|
—
|
|
$
|
—
|
|
$
|
66,731
|
|
||
|
Loss on extinguishment of debt and credit facilities, net
|
$
|
132,726
|
|
$
|
7,206
|
|
$
|
120,120
|
|
||
|
Gain on merger of unconsolidated entities
|
$
|
—
|
|
$
|
(75,768
|
)
|
$
|
—
|
|
||
|
Share-based payment expense
|
$
|
63,822
|
|
$
|
53,190
|
|
$
|
60,437
|
|
||
|
Deferred income taxes
|
$
|
(3,001,818
|
)
|
$
|
8,264
|
|
$
|
2,308
|
|
||
|
Other non-cash purchase price adjustments
|
$
|
(289,050
|
)
|
$
|
(275,338
|
)
|
$
|
(250,727
|
)
|
||
Depreciation and amortization expense is expected to increase in future periods as we recognize depreciation expense upon the launch of our FM-6 satellite.
34
Included in restructuring, impairments and related costs for the
year ended
December 31, 2010
are contract termination costs of $7,361 and a loss on the full impairment of our FM-4 satellite of $56,100.
Loss on extinguishment of debt and credit facilities, net, includes losses incurred as a result of retirement of certain debt instruments. Future charges related to the retirement of debt are dependent upon many factors, including our ability to refinance or retire specific debt instruments.
Gain on merger of unconsolidated entities represents the gain on the Canada Merger which closed in June 2011.
Share-based payment expense is expected to increase in future periods as we grant equity awards to our employees and directors. Compensation expense for share-based awards is recorded in the financial statements based on the fair value of the underlying equity awards.
Deferred income taxes includes a benefit related to a reversal of substantially all of our deferred income tax valuation allowance as the cumulative positive evidence outweighed the historical negative evidence regarding the likelihood that our deferred tax asset will be realized.
Other non-cash purchase price adjustments include liabilities recorded as a result of the Merger related to executory contracts with an OEM and certain programming providers, as well as amortization resulting from changes in the value of deferred revenue as a result of the Merger.
Changes in operating assets and liabilities increased operating cash flows for the
years ended December 31, 2012, 2011 and 2010
by
$92,130
,
$49,694
and
$112,097
, respectively. As we continue to grow our subscriber and revenue base, we expect that deferred revenue and amounts due from customers and distributors will continue to increase. Amounts payable to vendors are also expected to increase as our business grows. The timing of payments to vendors and related parties are based in part on contractual commitments.
Cash Flows Used in Investing Activities
Cash used for investing activities consists primarily of capital expenditures for property and equipment. We will continue to incur significant costs to improve our terrestrial repeater network and broadcast and administrative infrastructure. In addition, we will continue to incur capital expenditures associated with our FM-6 satellite. After the launch of our FM-6 satellite, we anticipate no significant satellite capital expenditures for several years until it becomes necessary to replace satellites in our fleet.
|
•
|
The decrease in cash used for investing activities was primarily due to lower satellite and related launch vehicle construction costs associated with our FM-6 satellite which is expected to launch in mid-2013 and following the launch of our XM-5 satellite in 2010.
|
Cash Flows Used in Financing Activities
Cash flows used in financing activities consists of the issuance and repayment of long-term debt and related party debt, cash proceeds from exercise of stock options and the issuance of a special cash dividend. Proceeds from long-term debt, related party debt and equity issuances have been used to fund our operations, construct and launch new satellites and invest in other infrastructure improvements.
|
•
|
Cash flows used in financing activities in 2012 were primarily due to the repayment of the remaining balance of our 13% Senior Notes due 2013 and our 9.75% Senior Secured Notes due 2015, partially offset by the issuance of our 5.25% Senior Notes due 2022 and the exercise of stock options. The cash flows used in financing activities in 2011 were the result of the repayment of the remaining balance of our 11.25% Senior Secured Notes due 2013 and 3.25% Convertible Notes due 2011. In 2010, we repaid our Senior Secured Term Loan due 2012, 9.625% Senior Notes due 2013, XM's 10% Senior PIK Secured Notes due 2011 and 9.75% Senior Notes due 2014. We also partially repaid XM's 11.25% Senior Secured Notes due 2013 and our 3.25% Convertible Notes due 2011 and paid a special cash dividend of approximately $327,000 during the fourth quarter of 2012 described below under "Special Dividend". We issued the following new debt in 2010: our 8.75% Senior Notes due 2015 and 7.625% Senior Notes due 2018.
|
35
Financings and Capital Requirements
We have historically financed our operations through the sale of debt and equity securities.
Future Liquidity and Capital Resource Requirements
We have entered into various agreements to design, construct and launch our satellites in the normal course of business. As disclosed in Note 15 to our consolidated financial statements in Item 8 of this Annual Report on Form 10-K, as of
December 31, 2012
, we expect to incur satellite and transmission related expenditures of approximately
$67,170
an
d
$27,620
in 2013 and 2014, respectively, and an additional
$42,043
thereafter, the majority of which is attributable to the constru
ction and expected launch of our FM-6 satellite and related launch vehicle in 2013.
Based upon our current business plans, we believe that we have sufficient cash, cash equivalents and marketable securities to cover our estimated short-term and long-term funding needs. In 2012, we entered into a five year Senior Secured Revolving Credit Facility ("Credit Facility") which will be used for working capital and other general corporate purposes, including financing acquisitions, share repurchases and dividends. We expect to fund operating expenses, capital expenditures, working capital requirements, interest payments, taxes and scheduled maturities of our debt with existing cash, cash flow from operations and our Credit Facility, which we believe will be sufficient to meet our cash requirements.
Our ability to meet our debt and other obligations depends on our future operating performance and on economic, financial, competitive and other factors. We continually review our operations for opportunities to adjust the timing of expenditures to ensure that sufficient resources are maintained.
We regularly evaluate our business plans and strategy. These evaluations often result in changes to our business plans and strategy, some of which may be material and significantly change our cash requirements. These changes in our business plans or strategy may include: the acquisition of unique or compelling programming; the introduction of new features or services; significant new or enhanced distribution arrangements; investments in infrastructure, such as satellites, equipment or radio spectrum; and acquisitions, including acquisitions that are not directly related to our satellite radio business.
Special Dividend
On December 28, 2012, we paid a special cash dividend of $0.05 per share of common stock. This was the first cash dividend ever paid to our stockholders. Our Series B-1 Preferred Stock held by Liberty Radio, LLC, a wholly-owned subsidiary of Liberty Media Corporation, participated in this cash dividend on an as-converted basis in accordance with its terms. The total amount of this special dividend was approximately $327,000.
The dividend reflects the board's desire to return value to stockholders and its confidence in the long-term growth prospects of our business. We currently do not intend to declare recurring dividends on our common stock. Our board of directors has not made any determination whether similar special cash dividends will be paid in the future.
Our ability to pay dividends on our common stock is currently limited by covenants under our debt agreements. We retain sufficient capital capacity to continue making long-term investments in our programming, research and development initiatives and overall operations as well as pursue strategic opportunities which may arise. See Note 12 to our consolidated financial statements included in this Annual Report on Form 10-K.
Stock Repurchase Program
In December 2012, we announced that our board of directors approved a
$2,000,000
common stock repurchase program, which we will begin utilizing in 2013. Shares of common stock may be purchased from time to time on the open market or in privately negotiated transactions.
7% Exchangeable Senior Subordinated Notes due 2014
As a result of Liberty Media Corporation's beneficial ownership, a Fundamental Change occurred on January 17, 2013 under the indenture governing the Exchangeable Notes. In accordance with the indenture, on February 1, 2013, we made an offer to each holder of Exchangeable Notes to: (i) have the Company repurchase his or her Exchangeable Notes at a purchase price in cash equal to $1,000 per $1,000 principal amount of the Notes (plus accrued and unpaid interest to, but excluding March 1, 2013); or (ii) exchange his or her Exchangeable Notes for our common stock, at an exchange rate of
581.3112
shares per $1,000 principal amount of Notes, on or prior to March 1, 2013. This exchange rate is a benefit to the holders compared to
36
an exchange rate of
543.1372
shares of common stock in effect prior to occurrence of such Fundamental Change. A holder of the Exchangeable Notes may also elect to retain his or her Notes pursuant to their terms through maturity on December 1, 2014, or otherwise transfer or exchange them in the ordinary course. We believe that we have sufficient resources to fund any required repurchases of the Exchangeable Notes.
The indentures and the credit agreement governing our debt include restrictive covenants. As of
December 31, 2012
, we were in compliance with the indentures and credit agreement governing our debt. For a discussion of our “Debt Covenants”, refer to Note 12 to our consolidated financial statements in Item 8 of this Annual Report on Form 10-K.
Off-Balance Sheet Arrangements
We do not have any significant off-balance sheet arrangements other than those disclosed in Note 15 to our consolidated financial statements in Item 8 of this Annual Report on Form 10-K that are reasonably likely to have a material effect on our financial condition, results of operations, liquidity, capital expenditures or capital resources.
Contractual Cash Commitments
For a discussion of our “Contractual Cash Commitments,” refer to Note 15 to our consolidated financial statements in Item 8 of this Annual Report on Form 10-K.
Related Party Transactions
For a discussion of “Related Party Transactions,” refer to Notes 10 and 18 to our consolidated financial statements in Item 8 of this Annual Report on Form 10-K.
Critical Accounting Policies and Estimates
Our consolidated financial statements are prepared in accordance with U.S. GAAP, which require management to make estimates and assumptions that affect the reported amounts of assets and liabilities at the date of the financial statements and the reported amounts of revenues and expenses during the periods. Accounting estimates require the use of significant management assumptions and judgments as to future events, and the effect of those events cannot be predicted with certainty. The accounting estimates will change as new events occur, more experience is acquired and more information is obtained. We evaluate and update our assumptions and estimates on an ongoing basis and use outside experts to assist in that evaluation when we deem necessary. We have disclosed all significant accounting policies in Note 2 to our consolidated financial statements in Item 8 of this Annual Report on Form 10-K.
Goodwill
. Goodwill represents the excess of the purchase price over the estimated fair value of net tangible and identifiable intangible assets acquired in business combinations. Our annual impairment assessment of our single reporting unit is performed as of the fourth quarter of each year. Assessments are performed at other times if events or circumstances indicate it is more likely than not that the asset is impaired. Step one of the impairment assessment compares the fair value of the entity to its carrying value and if the fair value exceeds its carrying value, goodwill is not impaired. If the carrying value exceeds the fair value, the implied fair value of goodwill is compared to the carrying value of goodwill; an impairment loss will be recorded for the amount the carrying value exceeds the implied fair value. At the date of our annual assessment for 2012, the fair value of our single reporting unit substantially exceeded its carrying value and therefore was not at risk of failing step one of ASC 350-20,
Goodwill
. Subsequent to our annual evaluation of the carrying value of goodwill, there were no events or circumstances that triggered the need for an interim evaluation for impairment. As a result, there were no impairment charges to our goodwill during the years ended December 31, 2012 and 2011.
Long-Lived and Indefinite-Lived Assets
. We carry our long-lived assets at cost less accumulated amortization and depreciation. We review our long-lived assets for impairment whenever events or changes in circumstances indicate that the carrying amount of an asset is not recoverable. At the time an impairment in the value of a long-lived asset is identified, the impairment is measured as the amount by which the carrying amount of a long-lived asset exceeds its fair value.
Our annual impairment assessment of indefinite-lived assets, our FCC licenses and trademark, is performed as of the fourth quarter of each year and an assessment is made at other times if events or changes in circumstances indicate that it is more likely than not that the asset is impaired. ASU 2012-02,
Testing Indefinite-Lived Intangible Assets for Impairment,
establishes an option to first perform a qualitative assessment to determine whether it is more likely than not that an asset is
37
impaired. If the qualitative assessment supports that it is more likely than not that the fair value of the asset exceeds its carrying value, a company would not be required to perform a quantitative impairment test. If the qualitative assessment does not support the fair value of the asset, then a quantitative assessment is performed. During the fourth quarter of 2012, a qualitative impairment analysis was performed and we determined that the fair value of our FCC licenses and trademark substantially exceeded the carrying value and therefore was not at risk of impairment. Our qualitative assessment includes the consideration of our long term financial projections, current and historical weighted average cost of capital and liquidity factors, legal and regulatory issues and industry and market pressures. Subsequent to our annual evaluation of the carrying value of our long-lived assets, there were no events or circumstances that triggered the need for an impairment evaluation.
During the year ended December 31, 2011, we used independent appraisals to assist in determining the fair value of our FCC licenses and trademark. The income approach, which is commonly called the “Jefferson Pilot Method” or the “Greenfield Method”, was used to estimate the fair value of our FCC licenses and the “Relief from Royalty” method valuation approach was utilized to value our trademark.
There were no changes in the carrying value of our indefinite life intangible assets during the years ended December 31, 2012 and 2011.
Useful Life of Broadcast/Transmission System
. Our satellite system includes the costs of our satellite construction, launch vehicles, launch insurance, capitalized interest, spare satellite, terrestrial repeater network and satellite uplink facilities. We monitor our satellites for impairment whenever events or changes in circumstances indicate that the carrying amount of the asset is not recoverable.
We currently expect our first two in-orbit Sirius satellites launched in 2000 to operate effectively through 2013, our FM-3 satellite, which was also launched in 2000, to operate effectively through 2015, and our FM-5 satellite, launched in 2009, to operate effectively through 2024. In December 2010, we recorded an other than temporary charge for our FM-4 satellite, the ground spare held in storage since 2002. We operate five in-orbit XM satellites, three of which function as in-orbit spares. Two of the three in-orbit spare satellites were launched in 2001 and the other in 2010 while the other two satellites were launched in 2005 and 2006. We estimate that our XM-3, XM-4 and XM-5 satellites will meet their 15 year predicted depreciable lives, and that the depreciable lives of XM-1 and XM-2 will end in 2013.
Certain of our in-orbit satellites have experienced circuit failures on their solar arrays. We continue to monitor the operating condition of our in-orbit satellites. If events or circumstances indicate that the depreciable lives of our in-orbit satellites have changed, we will modify the depreciable life accordingly. If we were to revise our estimates, our depreciation expense would change. For example, a 10% decrease in the expected depreciable lives of satellites and spacecraft control facilities during 2012 would have resulted in approximately $20,616 of additional depreciation expense.
Income Taxes
. Deferred income taxes are recognized for the tax consequences related to temporary differences between the carrying amount of assets and liabilities for financial reporting purposes and the amounts used for tax purposes, based on enacted tax laws and statutory tax rates applicable to the periods in which the differences are expected to affect taxable income. In determining the period in which related tax benefits are realized for book purposes, excess share-based compensation deductions included in net operating losses are realized after regular net operating losses are exhausted; excess tax compensation benefits are recorded off balance-sheet as a memo entry until the period the excess tax benefit is realized through a reduction of taxes payable. A valuation allowance is recognized when, based on the weight of all available evidence, it is considered more likely than not that all, or some portion, of the deferred tax assets will not be realized. Income tax expense is the sum of current income tax plus the change in deferred tax assets and liabilities.
As of
December 31, 2012
, we have a valuation allowance of
$9,835
which relates to deferred tax assets that are not likely due to certain state net operating loss limitations.
Recent Accounting Pronouncements
Information regarding accounting pronouncements is included in Note 2 to the consolidated financial statements.
38
Glossary
Adjusted EBITDA
- EBITDA is defined as net income before interest and investment income (loss); interest expense, net of amounts capitalized; income tax expense and depreciation and amortization. We adjust EBITDA to remove the impact of other income and expense, loss on extinguishment of debt as well as certain other charges discussed below. This measure is one of the primary Non-GAAP financial measures on which we (i) evaluate the performance of our businesses, (ii) base our internal budgets and (iii) compensate management. Adjusted EBITDA is a Non-GAAP financial performance measure that excludes (if applicable): (i) certain adjustments as a result of the purchase price accounting for the Merger, (ii) goodwill impairment, (iii) restructuring, impairments, and related costs, (iv) depreciation and amortization and (v) share-based payment expense. The purchase price accounting adjustments include: (i) the elimination of deferred revenue associated with the investment in XM Canada, (ii) recognition of deferred subscriber revenues not recognized in purchase price accounting, and (iii) elimination of the benefit of deferred credits on executory contracts, which are primarily attributable to third party arrangements with an OEM and programming providers. We believe adjusted EBITDA is a useful measure of the underlying trend of our operating performance, which provides useful information about our business apart from the costs associated with our physical plant, capital structure and purchase price accounting. We believe investors find this Non-GAAP financial measure useful when analyzing our results and comparing our operating performance to the performance of other communications, entertainment and media companies. We believe investors use current and projected adjusted EBITDA to estimate our current and prospective enterprise value and to make investment decisions. Because we fund and build-out our satellite radio system through the periodic raising and expenditure of large amounts of capital, our results of operations reflect significant charges for depreciation expense. The exclusion of depreciation and amortization expense is useful given significant variation in depreciation and amortization expense that can result from the potential variations in estimated useful lives, all of which can vary widely across different industries or among companies within the same industry. We believe the exclusion of restructuring, impairments and related costs is useful given the nature of these expenses. We also believe the exclusion of share-based payment expense is useful given the significant variation in expense that can result from changes in the fair value as determined using the Black-Scholes-Merton model which varies based on assumptions used for the expected life, expected stock price volatility and risk-free interest rates.
Adjusted EBITDA has certain limitations in that it does not take into account the impact to our statements of comprehensive income of certain expenses, including share-based payment expense and certain purchase price accounting for the Merger. We endeavor to compensate for the limitations of the Non-GAAP measure presented by also providing the comparable GAAP measure with equal or greater prominence and descriptions of the reconciling items, including quantifying such items, to derive the Non-GAAP measure. Investors that wish to compare and evaluate our operating results after giving effect for these costs, should refer to net income as disclosed in our consolidated statements of comprehensive income. Since adjusted EBITDA is a Non-GAAP financial performance measure, our calculation of adjusted EBITDA may be susceptible to varying calculations; may not be comparable to other similarly titled measures of other companies; and should not be considered in isolation, as a substitute for, or superior to measures of financial performance prepared in accordance with GAAP. The reconciliation of net income to the adjusted EBITDA is calculated as follows (in thousands):
39
|
Unaudited
|
|||||||||||
|
For the Years Ended December 31,
|
|||||||||||
|
2012
|
2011
|
2010
|
|||||||||
|
Net income (GAAP):
|
$
|
3,472,702
|
|
$
|
426,961
|
|
$
|
43,055
|
|
||
|
Add back items excluded from Adjusted EBITDA:
|
|||||||||||
|
Purchase price accounting adjustments:
|
|||||||||||
|
Revenues (see pages 41-43)
|
7,479
|
|
10,910
|
|
21,906
|
|
|||||
|
Operating expenses (see pages 41-43)
|
(289,278
|
)
|
(277,258
|
)
|
(261,832
|
)
|
|||||
|
Share-based payment expense, net of purchase price accounting adjustments
|
63,822
|
|
53,369
|
|
63,309
|
|
|||||
|
Depreciation and amortization (GAAP)
|
266,295
|
|
267,880
|
|
273,691
|
|
|||||
|
Restructuring, impairments and related costs (GAAP)
|
—
|
|
—
|
|
63,800
|
|
|||||
|
Interest expense, net of amounts capitalized (GAAP)
|
265,321
|
|
304,938
|
|
295,643
|
|
|||||
|
Loss on extinguishment of debt and credit facilities, net (GAAP)
|
132,726
|
|
7,206
|
|
120,120
|
|
|||||
|
Interest and investment (income) loss (GAAP)
|
(716
|
)
|
(73,970
|
)
|
5,375
|
|
|||||
|
Other loss (income) (GAAP)
|
226
|
|
(3,252
|
)
|
(3,399
|
)
|
|||||
|
Income tax (benefit) expense (GAAP)
|
(2,998,234
|
)
|
14,234
|
|
4,620
|
|
|||||
|
Adjusted EBITDA
|
$
|
920,343
|
|
$
|
731,018
|
|
$
|
626,288
|
|
||
Adjusted Revenues and Operating Expenses
-
We define this Non-GAAP financial measure as our actual revenues and operating expenses adjusted to exclude the impact of certain purchase price accounting adjustments and share-based payment expense. We use this Non-GAAP financial measure to manage our business, to set operational goals and as a basis for determining performance-based compensation for our employees. The following tables reconcile our actual revenues and operating expenses to our adjusted revenues and operating expenses for the
years ended December 31, 2012, 2011 and 2010
:
40
|
Unaudited For the Year Ended December 31, 2012
|
|||||||||||||||
|
(in thousands)
|
As Reported
|
Purchase Price Accounting Adjustments
|
Allocation of Share-based Payment Expense
|
Adjusted
|
|||||||||||
|
Revenue:
|
|||||||||||||||
|
Subscriber revenue
|
$
|
2,962,665
|
|
$
|
228
|
|
$
|
—
|
|
$
|
2,962,893
|
|
|||
|
Advertising revenue, net of agency fees
|
82,320
|
|
—
|
|
—
|
|
82,320
|
|
|||||||
|
Equipment revenue
|
73,456
|
|
—
|
|
—
|
|
73,456
|
|
|||||||
|
Other revenue
|
283,599
|
|
7,251
|
|
—
|
|
290,850
|
|
|||||||
|
Total revenue
|
$
|
3,402,040
|
|
$
|
7,479
|
|
$
|
—
|
|
$
|
3,409,519
|
|
|||
|
Operating expenses
|
|||||||||||||||
|
Cost of services:
|
|||||||||||||||
|
Revenue share and royalties
|
$
|
551,012
|
|
$
|
146,601
|
|
$
|
—
|
|
$
|
697,613
|
|
|||
|
Programming and content
|
278,997
|
|
37,346
|
|
(6,120
|
)
|
310,223
|
|
|||||||
|
Customer service and billing
|
294,980
|
|
—
|
|
(1,847
|
)
|
293,133
|
|
|||||||
|
Satellite and transmission
|
72,615
|
|
—
|
|
(3,329
|
)
|
69,286
|
|
|||||||
|
Cost of equipment
|
31,766
|
|
—
|
|
—
|
|
31,766
|
|
|||||||
|
Subscriber acquisition costs
|
474,697
|
|
90,503
|
|
—
|
|
565,200
|
|
|||||||
|
Sales and marketing
|
248,905
|
|
14,828
|
|
(10,310
|
)
|
253,423
|
|
|||||||
|
Engineering, design and development
|
48,843
|
|
—
|
|
(6,238
|
)
|
42,605
|
|
|||||||
|
General and administrative
|
261,905
|
|
—
|
|
(35,978
|
)
|
225,927
|
|
|||||||
|
Depreciation and amortization (a)
|
266,295
|
|
—
|
|
—
|
|
266,295
|
|
|||||||
|
Share-based payment expense
|
—
|
|
—
|
|
63,822
|
|
63,822
|
|
|||||||
|
Total operating expenses
|
$
|
2,530,015
|
|
$
|
289,278
|
|
$
|
—
|
|
$
|
2,819,293
|
|
|||
|
(a) Purchase price accounting adjustments included above exclude the incremental depreciation and amortization associated with the $785,000 stepped up basis in property, equipment and intangible assets as a result of the Merger. The increased depreciation and amortization for the year ended December 31, 2012 was $53,000.
|
|||||||||||||||
41
|
Unaudited For the Year Ended December 31, 2011
|
|||||||||||||||
|
(in thousands)
|
As Reported
|
Purchase Price Accounting Adjustments
|
Allocation of Share-based Payment Expense
|
Adjusted
|
|||||||||||
|
Revenue:
|
|||||||||||||||
|
Subscriber revenue
|
$
|
2,595,414
|
|
$
|
3,659
|
|
$
|
—
|
|
$
|
2,599,073
|
|
|||
|
Advertising revenue, net of agency fees
|
73,672
|
|
—
|
|
—
|
|
73,672
|
|
|||||||
|
Equipment revenue
|
71,051
|
|
—
|
|
—
|
|
71,051
|
|
|||||||
|
Other revenue
|
274,387
|
|
7,251
|
|
—
|
|
281,638
|
|
|||||||
|
Total revenue
|
$
|
3,014,524
|
|
$
|
10,910
|
|
$
|
—
|
|
$
|
3,025,434
|
|
|||
|
Operating expenses
|
|||||||||||||||
|
Cost of services:
|
|||||||||||||||
|
Revenue share and royalties
|
$
|
471,149
|
|
$
|
126,941
|
|
$
|
—
|
|
$
|
598,090
|
|
|||
|
Programming and content
|
281,234
|
|
49,172
|
|
(6,212
|
)
|
324,194
|
|
|||||||
|
Customer service and billing
|
259,719
|
|
18
|
|
(1,502
|
)
|
258,235
|
|
|||||||
|
Satellite and transmission
|
75,902
|
|
313
|
|
(2,678
|
)
|
73,537
|
|
|||||||
|
Cost of equipment
|
33,095
|
|
—
|
|
—
|
|
33,095
|
|
|||||||
|
Subscriber acquisition costs
|
434,482
|
|
85,491
|
|
—
|
|
519,973
|
|
|||||||
|
Sales and marketing
|
222,773
|
|
15,233
|
|
(8,193
|
)
|
229,813
|
|
|||||||
|
Engineering, design and development
|
53,435
|
|
31
|
|
(4,851
|
)
|
48,615
|
|
|||||||
|
General and administrative
|
238,738
|
|
59
|
|
(29,933
|
)
|
208,864
|
|
|||||||
|
Depreciation and amortization (a)
|
267,880
|
|
—
|
|
—
|
|
267,880
|
|
|||||||
|
Share-based payment expense (b)
|
—
|
|
—
|
|
53,369
|
|
53,369
|
|
|||||||
|
Total operating expenses
|
$
|
2,338,407
|
|
$
|
277,258
|
|
$
|
—
|
|
$
|
2,615,665
|
|
|||
|
(a) Purchase price accounting adjustments included above exclude the incremental depreciation and amortization associated with the $785,000 stepped up basis in property, equipment and intangible assets as a result of the Merger. The increased depreciation and amortization for the year ended December 31, 2011 was $59,000.
|
|||||||||||||||
|
(b) Amounts related to share-based payment expense included in operating expenses were as follows:
|
|||||||||||||||
|
Programming and content
|
$
|
6,185
|
|
$
|
27
|
|
$
|
—
|
|
$
|
6,212
|
|
|||
|
Customer service and billing
|
1,484
|
|
18
|
|
—
|
|
1,502
|
|
|||||||
|
Satellite and transmission
|
2,659
|
|
19
|
|
—
|
|
2,678
|
|
|||||||
|
Sales and marketing
|
8,166
|
|
27
|
|
—
|
|
8,193
|
|
|||||||
|
Engineering, design and development
|
4,820
|
|
31
|
|
—
|
|
4,851
|
|
|||||||
|
General and administrative
|
29,874
|
|
59
|
|
—
|
|
29,933
|
|
|||||||
|
Total share-based payment expense
|
$
|
53,188
|
|
$
|
181
|
|
$
|
—
|
|
$
|
53,369
|
|
|||
42
|
Unaudited For the Year Ended December 31, 2010
|
|||||||||||||||
|
(in thousands)
|
As Reported
|
Purchase Price Accounting Adjustments
|
Allocation of Share-based Payment Expense
|
Adjusted
|
|||||||||||
|
Revenue:
|
|||||||||||||||
|
Subscriber revenue
|
$
|
2,414,174
|
|
$
|
14,655
|
|
$
|
—
|
|
$
|
2,428,829
|
|
|||
|
Advertising revenue, net of agency fees
|
64,517
|
|
—
|
|
—
|
|
64,517
|
|
|||||||
|
Equipment revenue
|
71,355
|
|
—
|
|
—
|
|
71,355
|
|
|||||||
|
Other revenue
|
266,946
|
|
7,251
|
|
—
|
|
274,197
|
|
|||||||
|
Total revenue
|
$
|
2,816,992
|
|
$
|
21,906
|
|
$
|
—
|
|
$
|
2,838,898
|
|
|||
|
Operating expenses
|
|||||||||||||||
|
Cost of services:
|
|||||||||||||||
|
Revenue share and royalties
|
$
|
435,410
|
|
$
|
107,967
|
|
$
|
—
|
|
$
|
543,377
|
|
|||
|
Programming and content
|
305,914
|
|
57,566
|
|
(10,267
|
)
|
353,213
|
|
|||||||
|
Customer service and billing
|
241,680
|
|
281
|
|
(2,207
|
)
|
239,754
|
|
|||||||
|
Satellite and transmission
|
80,947
|
|
1,170
|
|
(3,397
|
)
|
78,720
|
|
|||||||
|
Cost of equipment
|
35,281
|
|
—
|
|
—
|
|
35,281
|
|
|||||||
|
Subscriber acquisition costs
|
413,041
|
|
79,439
|
|
—
|
|
492,480
|
|
|||||||
|
Sales and marketing
|
215,454
|
|
13,983
|
|
(9,423
|
)
|
220,014
|
|
|||||||
|
Engineering, design and development
|
45,390
|
|
520
|
|
(5,868
|
)
|
40,042
|
|
|||||||
|
General and administrative
|
240,970
|
|
906
|
|
(32,147
|
)
|
209,729
|
|
|||||||
|
Depreciation and amortization (a)
|
273,691
|
|
—
|
|
—
|
|
273,691
|
|
|||||||
|
Restructuring, impairments and related costs
|
63,800
|
|
—
|
|
—
|
|
63,800
|
|
|||||||
|
Share-based payment expense (b)
|
—
|
|
—
|
|
63,309
|
|
63,309
|
|
|||||||
|
Total operating expenses
|
$
|
2,351,578
|
|
$
|
261,832
|
|
$
|
—
|
|
$
|
2,613,410
|
|
|||
|
(a) Purchase price accounting adjustments included above exclude the incremental depreciation and amortization associated with the $785,000 stepped up basis in property, equipment and intangible assets as a result of the Merger. The increased depreciation and amortization for the year ended December 31, 2010 was $68,000.
|
|||||||||||||||
|
(b) Amounts related to share-based payment expense included in operating expenses were as follows:
|
|||||||||||||||
|
Programming and content
|
$
|
9,817
|
|
$
|
450
|
|
$
|
—
|
|
$
|
10,267
|
|
|||
|
Customer service and billing
|
1,926
|
|
281
|
|
—
|
|
2,207
|
|
|||||||
|
Satellite and transmission
|
3,109
|
|
288
|
|
—
|
|
3,397
|
|
|||||||
|
Sales and marketing
|
8,996
|
|
427
|
|
—
|
|
9,423
|
|
|||||||
|
Engineering, design and development
|
5,348
|
|
520
|
|
—
|
|
5,868
|
|
|||||||
|
General and administrative
|
31,241
|
|
906
|
|
—
|
|
32,147
|
|
|||||||
|
Total share-based payment expense
|
$
|
60,437
|
|
$
|
2,872
|
|
$
|
—
|
|
$
|
63,309
|
|
|||
ARPU
- is derived from total earned subscriber revenue, net advertising revenue and other subscription-related revenue, net of purchase price accounting adjustments, divided by the number of months in the period, divided by the daily weighted average number of subscribers for the period. Other subscription-related revenue includes the U.S. Music Royalty Fee. Purchase price accounting adjustments include the recognition of deferred subscriber revenues not recognized in purchase price accounting associated with the Merger. ARPU is calculated as follows (in thousands, except for subscriber and per subscriber amounts):
43
|
Unaudited
|
|||||||||||
|
For the Years Ended December 31,
|
|||||||||||
|
2012
|
2011
|
2010
|
|||||||||
|
Subscriber revenue (GAAP)
|
$
|
2,962,665
|
|
$
|
2,595,414
|
|
$
|
2,414,174
|
|
||
|
Add: net advertising revenue (GAAP)
|
82,320
|
|
73,672
|
|
64,517
|
|
|||||
|
Add: other subscription-related revenue (GAAP)
|
237,868
|
|
231,902
|
|
234,148
|
|
|||||
|
Add: purchase price accounting adjustments
|
228
|
|
3,659
|
|
14,655
|
|
|||||
|
$
|
3,283,081
|
|
$
|
2,904,647
|
|
$
|
2,727,494
|
|
|||
|
Daily weighted average number of subscribers
|
22,794,170
|
|
20,903,908
|
|
19,385,055
|
|
|||||
|
ARPU
|
$
|
12.00
|
|
$
|
11.58
|
|
$
|
11.73
|
|
||
Average self-pay monthly churn
- is defined as the monthly average of self-pay deactivations for the period divided by the average number of self-pay subscribers for the period.
Customer service and billing expenses, per average subscriber
- is derived from total customer service and billing expenses, excluding share-based payment expense and purchase price accounting adjustments associated with the Merger, divided by the number of months in the period, divided by the daily weighted average number of subscribers for the period. We believe the exclusion of share-based payment expense in our calculation of customer service and billing expenses, per average subscriber, is useful given the significant variation in expense that can result from changes in the fair market value of our common stock, the effect of which is unrelated to the operational conditions that give rise to variations in the components of our customer service and billing expenses. Purchase price accounting adjustments associated with the Merger include the elimination of the benefit associated with incremental share-based payment arrangements recognized at the Merger date. Customer service and billing expenses, per average subscriber, is calculated as follows (in thousands, except for subscriber and per subscriber amounts):
|
Unaudited
|
|||||||||||
|
For the Years Ended December 31,
|
|||||||||||
|
2012
|
2011
|
2010
|
|||||||||
|
Customer service and billing expenses (GAAP)
|
$
|
294,980
|
|
$
|
259,719
|
|
$
|
241,680
|
|
||
|
Less: share-based payment expense, net of purchase price accounting adjustments
|
(1,847
|
)
|
(1,502
|
)
|
(2,207
|
)
|
|||||
|
Add: purchase price accounting adjustments
|
—
|
|
18
|
|
281
|
|
|||||
|
293,133
|
|
258,235
|
|
239,754
|
|
||||||
|
Daily weighted average number of subscribers
|
22,794,170
|
|
20,903,908
|
|
19,385,055
|
|
|||||
|
Customer service and billing expenses, per average subscriber
|
$
|
1.07
|
|
$
|
1.03
|
|
$
|
1.03
|
|
||
44
Free cash flow
- is derived from cash flow provided by operating activities, capital expenditures and restricted and other investment activity. Free cash flow is calculated as follows (in thousands):
|
Unaudited
|
|||||||||||
|
For the Years Ended December 31,
|
|||||||||||
|
2012
|
2011
|
2010
|
|||||||||
|
Cash Flow information
|
|||||||||||
|
Net cash provided by operating activities
|
$
|
806,765
|
|
$
|
543,630
|
|
$
|
512,895
|
|
||
|
Net cash used in investing activities
|
$
|
(97,319
|
)
|
$
|
(127,888
|
)
|
$
|
(302,414
|
)
|
||
|
Net cash used in financing activities
|
$
|
(962,491
|
)
|
$
|
(228,443
|
)
|
$
|
(7,279
|
)
|
||
|
Free Cash Flow
|
|||||||||||
|
Net cash provided by operating activities
|
$
|
806,765
|
|
$
|
543,630
|
|
$
|
512,895
|
|
||
|
Additions to property and equipment
|
(97,293
|
)
|
(137,429
|
)
|
(311,868
|
)
|
|||||
|
Restricted and other investment activity
|
(26
|
)
|
9,541
|
|
9,454
|
|
|||||
|
Free cash flow
|
$
|
709,446
|
|
$
|
415,742
|
|
$
|
210,481
|
|
||
New vehicle consumer conversion rate
- is defined as the percentage of owners and lessees of new vehicles that receive our service and convert to become self-paying subscribers after the initial promotion period. At the time satellite radio enabled vehicles are sold or leased, the owners or lessees generally receive trial subscriptions ranging from three to twelve months. Promotional periods generally include the period of trial service plus 30 days to handle the receipt and processing of payments. We measure conversion rate three months after the period in which the trial service ends. The metric excludes rental and fleet vehicles.
Subscriber acquisition cost, per gross subscriber addition
- or SAC, per gross subscriber addition, is derived from subscriber acquisition costs and margins from the sale of radios and accessories, excluding share-based payment expense and purchase price accounting adjustments, divided by the number of gross subscriber additions for the period. Purchase price accounting adjustments associated with the Merger include the elimination of the benefit of amortization of deferred credits on executory contracts recognized at the Merger date attributable to an OEM. SAC, per gross subscriber addition, is calculated as follows (in thousands, except for subscriber and per subscriber amounts):
|
Unaudited
|
|||||||||||
|
For the Years Ended December 31,
|
|||||||||||
|
2012
|
2011
|
2010
|
|||||||||
|
Subscriber acquisition costs (GAAP)
|
$
|
474,697
|
|
$
|
434,482
|
|
$
|
413,041
|
|
||
|
Less: margin from direct sales of radios and accessories (GAAP)
|
(41,690
|
)
|
(37,956
|
)
|
(36,074
|
)
|
|||||
|
Add: purchase price accounting adjustments
|
90,503
|
|
85,491
|
|
79,439
|
|
|||||
|
$
|
523,510
|
|
$
|
482,017
|
|
$
|
456,406
|
|
|||
|
Gross subscriber additions
|
9,617,771
|
|
8,696,020
|
|
7,768,827
|
|
|||||
|
SAC, per gross subscriber addition
|
$
|
54
|
|
$
|
55
|
|
$
|
59
|
|
||
ITEM 7A.
QUANTITATIVE AND QUALITATIVE DISCLOSURE ABOUT MARKET RISKS
We do not hold or issue any free-standing derivatives. We hold investments in marketable securities consisting of money market funds, and certificates of deposit and investments in debt and equity securities of other entities. We classify our investments in marketable securities as available-for-sale. These securities are consistent with the investment objectives contained within our investment policy. The basic objectives of our investment policy are the preservation of capital, maintaining sufficient liquidity to meet operating requirements and maximizing yield.
Our debt includes fixed rate instruments and the fair market value of our debt is sensitive to changes in interest rates. Under our current policies, we do not use interest rate derivative instruments to manage our exposure to interest rate fluctuations.
45
ITEM 8.
FINANCIAL STATEMENTS AND SUPPLEMENTARY DATA
See Index to Consolidated Financial Statements contained in Item 15 herein.
ITEM 9.
CHANGES IN AND DISAGREEMENTS WITH ACCOUNTANTS ON ACCOUNTING AND FINANCIAL DISCLOSURE
None.
ITEM 9A.
CONTROLS AND PROCEDURES
Controls and Procedures
As of
December 31, 2012
, an evaluation was performed under the supervision and with the participation of our management, including James E. Meyer, our Chief Executive Officer, and David J. Frear, our Executive Vice President and Chief Financial Officer, of the effectiveness of the design and operation of our disclosure controls and procedures (as that term is defined in Rule 13a-15(e) and 15d-15(e) under the Securities Exchange Act). Based on that evaluation, our management, including our Chief Executive Officer and our Chief Financial Officer, concluded that our disclosure controls and procedures were effective as of
December 31, 2012
. There has been no change in our internal control over financial reporting (as that term is defined in Rule 13a-15(f) and 15d-15(f) under the Securities Exchange Act) during the
year ended
December 31, 2012
that has materially affected, or is reasonably likely to materially affect, our internal control over financial reporting.
Management's Report on Internal Control over Financial Reporting
Our management is responsible for establishing and maintaining adequate internal control over financial reporting as defined in Rule 13a-15(f) under the Exchange Act. We have performed an evaluation under the supervision and with the participation of our management, including our Chief Executive Officer and our Chief Financial Officer, of the effectiveness of our internal control over financial reporting. Our management used the framework in Internal Control-Integrated Framework issued by the Committee of Sponsoring Organizations to perform this evaluation. Based on that evaluation, our management, including our Chief Executive Officer and Chief Financial Officer, concluded that our internal control over financial reporting was effective as of
December 31, 2012
.
KPMG LLP, an independent registered public accounting firm, which has audited and reported on the consolidated financial statements contained in this Annual Report on Form 10-K, has issued its report on the effectiveness of our internal control over financial reporting which follows this report.
Audit Report of the Independent Registered Public Accounting Firm
The effectiveness of our internal control over financial reporting as of
December 31, 2012
has been audited by KPMG LLP, an independent registered public accounting firm, as stated in their audit report appearing on page F-2 of this Annual Report on Form 10-K.
ITEM 9B.
OTHER INFORMATION
None.
ITEM 10.
DIRECTORS, EXECUTIVE OFFICERS AND CORPORATE GOVERNANCE
The information required by this Item 10 is incorporated in this report by reference to the applicable information in our definitive proxy statement for the 2013 annual meeting of stockholders set forth under the captions
Stock Ownership
,
Governance of the Company, Item 1. Election of Directors
and
Item 2. Ratification of Independent Registered Public Accountants
, which we expect to file with the Securities and Exchange Commission prior to April 30, 2013.
46
Code of Ethics
We have adopted a code of ethics that applies to all employees, including executive officers, and to directors. The Code of Ethics is available on the Corporate Governance page of our website at
www.siriusxm.com.
If we ever were to amend or waive any provision of our Code of Ethics that applies to our principal executive officer, principal financial officer, principal accounting officer or any person performing similar functions, we intend to satisfy our disclosure obligations with respect to any such waiver or amendment by posting such information on our internet website set forth above rather than filing a Form 8-K.
ITEM 11.
EXECUTIVE COMPENSATION
The information required by this Item 11 is incorporated in this report by reference to the applicable information in our definitive proxy statement for the 2013 annual meeting of stockholders set forth under the captions
Item 1. Election of Directors
and
Item 2. Ratification of Independent Registered Public Accountants
, which we expect to file with the Securities and Exchange Commission prior to April 30, 2013.
ITEM 12.
SECURITY OWNERSHIP OF CERTAIN BENEFICIAL OWNERS AND MANAGEMENT AND RELATED STOCKHOLDER MATTERS
Certain information required by this item is set forth under the heading “Equity Compensation Plan Information” in Part II, Item 5, of this report.
The additional information required by this Item 12 is incorporated in this report by reference to the applicable information in our definitive proxy statement for the 2013 annual meeting of stockholders set forth under the caption
Stock Ownership
, which we expect to file with the Securities and Exchange Commission prior to April 30, 2013.
ITEM 13.
CERTAIN RELATIONSHIPS AND RELATED TRANSACTIONS, AND DIRECTOR INDEPENDENCE
The information required by this Item 13 is incorporated in this report by reference to the applicable information in our definitive proxy statement for the 2013 annual meeting of stockholders set forth under the captions
Governance of the Company
and
Item 1. Election of Directors
which we expect to file with the Securities and Exchange Commission prior to April 30, 2013.
ITEM 14.
PRINCIPAL ACCOUNTANT FEES AND SERVICES
The information required by this Item 14 is incorporated in this report by reference to the applicable information in our definitive proxy statement for the 2013 annual meeting of stockholders set forth under the captions
Item 2. Ratification of Independent Registered Public Accountants
-
Principal Accountant Fees and Services
, which we expect to file with the Securities and Exchange Commission prior to April 30, 2013.
ITEM 15.
EXHIBITS AND FINANCIAL STATEMENT SCHEDULES
Documents filed as part of this report:
(1) Financial Statements. See Index to Consolidated Financial Statements appearing on page F-1.
(2) Financial Statement Schedules. See Index to Consolidated Financial Statements appearing on page F-1.
(3) Exhibits. See Exhibit Index following this report, which is incorporated herein by reference.
47
SIGNATURES
Pursuant to the requirements of Section 13 or 15(d) of the Securities Exchange Act of 1934, the registrant has duly caused this report to be signed on its behalf by the undersigned, thereunto duly authorized on this 6th day of February 2013.
|
SIRIUS XM RADIO INC.
|
|
|
By:
|
/s/ D
AVID
J. F
REAR
|
|
David J. Frear
|
|
|
Executive Vice President and
|
|
|
Chief Financial Officer
|
|
|
(Principal Financial Officer)
|
|
48
Pursuant to the requirements of the Securities Exchange Act of 1934, this report has been signed below by the following persons on behalf of the registrant and in the capacities and on the dates indicated.
|
Signature
|
Title
|
Date
|
|
|
/s/ E
DDY
W. H
ARTENSTEIN
|
Chairman of the Board of Directors and Director
|
February 6, 2013
|
|
|
(Eddy W. Hartenstein)
|
|||
|
/s/ J
AMES
E.
M
EYER
|
Chief Executive Officer and Director (Principal Executive Officer)
|
February 6, 2013
|
|
|
(
James E. Meyer)
|
|||
|
/s/ D
AVID
J. F
REAR
|
Executive Vice President and Chief Financial Officer
(Principal Financial Officer)
|
February 6, 2013
|
|
|
(
David J. Frear)
|
|||
|
/s/ T
HOMAS
D. B
ARRY
|
Senior Vice President and Controller
(Principal Accounting Officer)
|
February 6, 2013
|
|
|
(Thomas D. Barry)
|
|||
|
/s/ J
OAN
L. A
MBLE
|
Director
|
February 6, 2013
|
|
|
(Joan L. Amble)
|
|||
|
/s/ M
ARK
D. C
ARLETON
|
Director
|
February 6, 2013
|
|
|
(
Mark D. Carleton)
|
|||
|
/s/ D
AVID
J. A. F
LOWERS
|
Director
|
February 6, 2013
|
|
|
(
David J. A. Flowers)
|
|||
|
/s/ J
AMES
P. H
OLDEN
|
Director
|
February 6, 2013
|
|
|
(James P. Holden)
|
|||
|
/s/ G
REGORY
B. M
AFFEI
|
Director
|
February 6, 2013
|
|
|
(Gregory B. Maffei)
|
|||
|
/s/ J
OHN
C. M
ALONE
|
Director
|
February 6, 2013
|
|
|
(
John C. Malone)
|
|||
|
/s/ J
AMES
F. M
OONEY
|
Director
|
February 6, 2013
|
|
|
(James F. Mooney)
|
|||
|
/s/ R
OBIN
S. P
RINGLE
|
Director
|
February 6, 2013
|
|
|
(Robin S. Pringle)
|
|||
|
/s/ C
HARLES
Y. T
ANABE
|
Director
|
February 6, 2013
|
|
|
(Charles Y. Tanabe)
|
|||
|
/s/ C
ARL
V
OGEL
|
Director
|
February 6, 2013
|
|
|
(Carl Vogel)
|
|||
|
/s/ V
ANESSA
W
ITTMAN
|
Director
|
February 6, 2013
|
|
|
(Vanessa Wittman)
|
|||
49
SIRIUS XM RADIO INC. AND SUBSIDIARIES
INDEX TO CONSOLIDATED FINANCIAL STATEMENTS
F-1
Report of Independent Registered Public Accounting Firm
The Board of Directors and Stockholders
Sirius XM Radio Inc. and subsidiaries:
We have audited the accompanying consolidated balance sheets of Sirius XM Radio Inc. and subsidiaries as of
December 31, 2012
and
2011
, and the related consolidated statements of comprehensive income, stockholders' equity, and cash flows for each of the years in the three-year period ended
December 31, 2012
. In connection with our audits of the consolidated financial statements, we also have audited the financial statement schedule listed in Item 15(2). These consolidated financial statements and financial statement schedule are the responsibility of the Company's management. Our responsibility is to express an opinion on these consolidated financial statements and financial statement schedule based on our audits.
We conducted our audits in accordance with the standards of the Public Company Accounting Oversight Board (United States). Those standards require that we plan and perform the audit to obtain reasonable assurance about whether the financial statements are free of material misstatement. An audit includes examining, on a test basis, evidence supporting the amounts and disclosures in the financial statements. An audit also includes assessing the accounting principles used and significant estimates made by management, as well as evaluating the overall financial statement presentation. We believe that our audits provide a reasonable basis for our opinion.
In our opinion, the consolidated financial statements referred to above present fairly, in all material respects, the financial position of Sirius XM Radio Inc. and subsidiaries as of
December 31, 2012
and
2011
, and the results of their operations and their cash flows for each of the years in the three-year period ended
December 31, 2012
, in conformity with U.S. generally accepted accounting principles. Also in our opinion, the related financial statement schedule, when considered in relation to the basic consolidated financial statements taken as a whole, presents fairly, in all material respects, the information set forth therein.
We also have audited, in accordance with the standards of the Public Company Accounting Oversight Board (United States), Sirius XM Radio Inc. and subsidiaries' internal control over financial reporting as of
December 31, 2012
, based on criteria established in
Internal Control - Integrated Framework
issued by the Committee of Sponsoring Organizations of the Treadway Commission (COSO), and our report dated
February 6, 2013
expressed an unqualified opinion on the effectiveness of the Company's internal control over financial reporting.
|
/s/ KPMG LLP
|
New York, New York
February 6, 2013
F-2
Report of Independent Registered Public Accounting Firm
The Board of Directors and Stockholders
Sirius XM Radio Inc. and subsidiaries:
We have audited Sirius XM Radio Inc. and subsidiaries' internal control over financial reporting as of
December 31, 2012
, based on criteria established in
Internal Control - Integrated Framework
issued by the Committee of Sponsoring Organizations of the Treadway Commission (COSO). Sirius XM Radio Inc.'s management is responsible for maintaining effective internal control over financial reporting and for its assessment of the effectiveness of internal control over financial reporting, included in the accompanying
Management's Report on Internal Control over Financial Reporting
. Our responsibility is to express an opinion on the Company's internal control over financial reporting based on our audit.
We conducted our audit in accordance with the standards of the Public Company Accounting Oversight Board (United States). Those standards require that we plan and perform the audit to obtain reasonable assurance about whether effective internal control over financial reporting was maintained in all material respects. Our audit included obtaining an understanding of internal control over financial reporting, assessing the risk that a material weakness exists, and testing and evaluating the design and operating effectiveness of internal control based on the assessed risk. Our audit also included performing such other procedures as we considered necessary in the circumstances. We believe that our audit provides a reasonable basis for our opinion.
A company's internal control over financial reporting is a process designed to provide reasonable assurance regarding the reliability of financial reporting and the preparation of financial statements for external purposes in accordance with generally accepted accounting principles. A company's internal control over financial reporting includes those policies and procedures that (1) pertain to the maintenance of records that, in reasonable detail, accurately and fairly reflect the transactions and dispositions of the assets of the company; (2) provide reasonable assurance that transactions are recorded as necessary to permit preparation of financial statements in accordance with generally accepted accounting principles, and that receipts and expenditures of the company are being made only in accordance with authorizations of management and directors of the company; and (3) provide reasonable assurance regarding prevention or timely detection of unauthorized acquisition, use, or disposition of the company's assets that could have a material effect on the financial statements.
Because of its inherent limitations, internal control over financial reporting may not prevent or detect misstatements. Also, projections of any evaluation of effectiveness to future periods are subject to the risk that controls may become inadequate because of changes in conditions, or that the degree of compliance with the policies or procedures may deteriorate.
In our opinion, Sirius XM Radio Inc. and subsidiaries maintained, in all material respects, effective internal control over financial reporting as of
December 31, 2012
, based on criteria established in
Internal Control - Integrated Framework
issued by the Committee of Sponsoring Organizations of the Treadway Commission (COSO).
We also have audited, in accordance with the standards of the Public Company Accounting Oversight Board (United States), the consolidated balance sheets of Sirius XM Radio Inc. and subsidiaries as of
December 31, 2012
and
2011
, and the related consolidated statements of comprehensive income, stockholders' equity, and cash flows for each of the years in the three-year period ended
December 31, 2012
, and our report dated
February 6, 2013
expressed an unqualified opinion on those consolidated financial statements.
|
/s/ KPMG LLP
|
New York, New York
February 6, 2013
F-3
SIRIUS XM RADIO INC. AND SUBSIDIARIES
|
For the Years Ended December 31,
|
|||||||||||
|
(in thousands, except per share data)
|
2012
|
2011
|
2010
|
||||||||
|
Revenue:
|
|
|
|||||||||
|
Subscriber revenue
|
$
|
2,962,665
|
|
$
|
2,595,414
|
|
$
|
2,414,174
|
|
||
|
Advertising revenue, net of agency fees
|
82,320
|
|
73,672
|
|
64,517
|
|
|||||
|
Equipment revenue
|
73,456
|
|
71,051
|
|
71,355
|
|
|||||
|
Other revenue
|
283,599
|
|
274,387
|
|
266,946
|
|
|||||
|
Total revenue
|
3,402,040
|
|
3,014,524
|
|
2,816,992
|
|
|||||
|
Operating expenses:
|
|
||||||||||
|
Cost of services:
|
|
||||||||||
|
Revenue share and royalties
|
551,012
|
|
471,149
|
|
435,410
|
|
|||||
|
Programming and content
|
278,997
|
|
281,234
|
|
305,914
|
|
|||||
|
Customer service and billing
|
294,980
|
|
259,719
|
|
241,680
|
|
|||||
|
Satellite and transmission
|
72,615
|
|
75,902
|
|
80,947
|
|
|||||
|
Cost of equipment
|
31,766
|
|
33,095
|
|
35,281
|
|
|||||
|
Subscriber acquisition costs
|
474,697
|
|
434,482
|
|
413,041
|
|
|||||
|
Sales and marketing
|
248,905
|
|
222,773
|
|
215,454
|
|
|||||
|
Engineering, design and development
|
48,843
|
|
53,435
|
|
45,390
|
|
|||||
|
General and administrative
|
261,905
|
|
238,738
|
|
240,970
|
|
|||||
|
Depreciation and amortization
|
266,295
|
|
|
267,880
|
|
273,691
|
|
||||
|
Restructuring, impairments and related costs
|
—
|
|
—
|
|
63,800
|
|
|||||
|
Total operating expenses
|
2,530,015
|
|
2,338,407
|
|
2,351,578
|
|
|||||
|
Income from operations
|
872,025
|
|
676,117
|
|
465,414
|
|
|||||
|
Other income (expense):
|
|
||||||||||
|
Interest expense, net of amounts capitalized
|
(265,321
|
)
|
(304,938
|
)
|
(295,643
|
)
|
|||||
|
Loss on extinguishment of debt and credit facilities, net
|
(132,726
|
)
|
(7,206
|
)
|
(120,120
|
)
|
|||||
|
Interest and investment income (loss)
|
716
|
|
73,970
|
|
(5,375
|
)
|
|||||
|
Other (loss) income
|
(226
|
)
|
3,252
|
|
3,399
|
|
|||||
|
Total other expense
|
(397,557
|
)
|
(234,922
|
)
|
(417,739
|
)
|
|||||
|
Income before income taxes
|
474,468
|
|
441,195
|
|
47,675
|
|
|||||
|
Income tax benefit (expense)
|
2,998,234
|
|
(14,234
|
)
|
(4,620
|
)
|
|||||
|
Net income
|
$
|
3,472,702
|
|
$
|
426,961
|
|
$
|
43,055
|
|
||
|
Unrealized gain on available-for-sale securities
|
—
|
|
—
|
|
469
|
|
|||||
|
Realized loss on XM Canada investment foreign currency adjustment
|
—
|
|
6,072
|
|
—
|
|
|||||
|
Foreign currency translation adjustment, net of tax
|
49
|
|
(140
|
)
|
251
|
|
|||||
|
Total comprehensive income
|
$
|
3,472,751
|
|
$
|
432,893
|
|
$
|
43,775
|
|
||
|
Net income per common share:
|
|||||||||||
|
Basic
|
$
|
0.55
|
|
$
|
0.07
|
|
$
|
0.01
|
|
||
|
Diluted
|
$
|
0.51
|
|
$
|
0.07
|
|
$
|
0.01
|
|
||
|
Weighted average common shares outstanding:
|
|
|
|
|
|
||||||
|
Basic
|
4,209,073
|
|
3,744,606
|
|
3,693,259
|
|
|||||
|
Diluted
|
6,873,786
|
|
6,500,822
|
|
6,391,071
|
|
|||||
See accompanying notes to the consolidated financial statements.
F-4
SIRIUS XM RADIO INC. AND SUBSIDIARIES
|
As of December 31,
|
|||||||
|
2012
|
2011
|
||||||
|
(in thousands, except share and per share data)
|
|
||||||
|
ASSETS
|
|
|
|||||
|
Current assets:
|
|
|
|||||
|
Cash and cash equivalents
|
$
|
520,945
|
|
$
|
773,990
|
|
|
|
Accounts receivable, net
|
106,142
|
|
101,705
|
|
|||
|
Receivables from distributors
|
104,425
|
|
84,817
|
|
|||
|
Inventory, net
|
25,337
|
|
36,711
|
|
|||
|
Prepaid expenses
|
122,157
|
|
125,967
|
|
|||
|
Related party current assets
|
13,167
|
|
14,702
|
|
|||
|
Deferred tax asset
|
923,972
|
|
132,727
|
|
|||
|
Other current assets
|
12,037
|
|
6,335
|
|
|||
|
Total current assets
|
1,828,182
|
|
1,276,954
|
|
|||
|
Property and equipment, net
|
1,571,922
|
|
1,673,919
|
|
|||
|
Long-term restricted investments
|
3,999
|
|
3,973
|
|
|||
|
Deferred financing fees, net
|
38,677
|
|
42,046
|
|
|||
|
Intangible assets, net
|
2,519,610
|
|
2,573,638
|
|
|||
|
Goodwill
|
1,815,365
|
|
1,834,856
|
|
|||
|
Related party long-term assets
|
44,954
|
|
54,953
|
|
|||
|
Long-term deferred tax asset
|
1,219,256
|
|
—
|
|
|||
|
Other long-term assets
|
12,878
|
|
35,657
|
|
|||
|
Total assets
|
$
|
9,054,843
|
|
$
|
7,495,996
|
|
|
|
LIABILITIES AND STOCKHOLDERS’ EQUITY
|
|
|
|||||
|
Current liabilities:
|
|
|
|||||
|
Accounts payable and accrued expenses
|
$
|
587,652
|
|
$
|
543,193
|
|
|
|
Accrued interest
|
33,954
|
|
70,405
|
|
|||
|
Current portion of deferred revenue
|
1,474,138
|
|
1,333,965
|
|
|||
|
Current portion of deferred credit on executory contracts
|
207,854
|
|
284,108
|
|
|||
|
Current maturities of long-term debt
|
4,234
|
|
1,623
|
|
|||
|
Related party current liabilities
|
6,756
|
|
14,302
|
|
|||
|
Total current liabilities
|
2,314,588
|
|
2,247,596
|
|
|||
|
Deferred revenue
|
159,501
|
|
198,135
|
|
|||
|
Deferred credit on executory contracts
|
5,175
|
|
218,199
|
|
|||
|
Long-term debt
|
2,222,080
|
|
2,683,563
|
|
|||
|
Long-term related party debt
|
208,906
|
|
328,788
|
|
|||
|
Deferred tax liability
|
69
|
|
1,011,084
|
|
|||
|
Related party long-term liabilities
|
18,966
|
|
21,741
|
|
|||
|
Other long-term liabilities
|
85,993
|
|
82,745
|
|
|||
|
Total liabilities
|
5,015,278
|
|
6,791,851
|
|
|||
|
Commitments and contingencies (Note 15)
|
|
|
|||||
|
Stockholders’ equity:
|
|
|
|||||
|
Preferred stock, par value $0.001; 50,000,000 authorized at December 31, 2012 and 2011:
|
|||||||
|
Series A convertible preferred stock; no shares issued and outstanding at December 31, 2012 and 2011
|
—
|
|
—
|
|
|||
|
Convertible perpetual preferred stock, series B-1 (liquidation preference of $0.001 per share at December 31, 2012 and 2011); 6,250,100 and 12,500,000 shares issued and outstanding at December 31, 2012 and 2011, respectively
|
6
|
|
13
|
|
|||
|
Common stock, par value $0.001; 9,000,000,000 shares authorized at December 31, 2012 and 2011; 5,262,440,085 and 3,753,201,929 shares issued and outstanding at December 31, 2012 and 2011, respectively
|
5,263
|
|
3,753
|
|
|||
|
Accumulated other comprehensive income, net of tax
|
120
|
|
71
|
|
|||
|
Additional paid-in capital
|
10,345,566
|
|
10,484,400
|
|
|||
|
Accumulated deficit
|
(6,311,390
|
)
|
(9,784,092
|
)
|
|||
|
Total stockholders’ equity
|
4,039,565
|
|
704,145
|
|
|||
|
Total liabilities and stockholders’ equity
|
$
|
9,054,843
|
|
$
|
7,495,996
|
|
|
See accompanying notes to the consolidated financial statements.
F-5
SIRIUS XM RADIO INC. AND SUBSIDIARIES
CONSOLIDATED STATEMENT OF STOCKHOLDERS’ EQUITY
|
|
Series A
Convertible
Preferred Stock
|
Convertible Perpetual
Preferred Stock,
Series B-1
|
Common Stock
|
|||||||||||||||||||||||||||||||||
|
(in thousands, except share data)
|
Shares
|
Amount
|
Shares
|
Amount
|
Shares
|
Amount
|
Accumulated Other Comprehensive Income
|
Additional
Paid-in
Capital
|
Accumulated
Deficit
|
Total
Stockholders’
Equity
|
||||||||||||||||||||||||||
|
Balance at January 1, 2010
|
24,808,959
|
|
$
|
25
|
|
12,500,000
|
|
$
|
13
|
|
3,882,659,087
|
|
$
|
3,882
|
|
$
|
(6,581
|
)
|
$
|
10,352,291
|
|
$
|
(10,254,108
|
)
|
$
|
95,522
|
|
|||||||||
|
Comprehensive income, net of tax
|
—
|
|
$
|
—
|
|
—
|
|
$
|
—
|
|
—
|
|
$
|
—
|
|
$
|
720
|
|
$
|
—
|
|
$
|
43,055
|
|
$
|
43,775
|
|
|||||||||
|
Issuance of common stock to employees and employee benefit plans, net of forfeitures
|
—
|
|
$
|
—
|
|
—
|
|
$
|
—
|
|
6,175,089
|
|
$
|
6
|
|
$
|
—
|
|
$
|
5,265
|
|
$
|
—
|
|
$
|
5,271
|
|
|||||||||
|
Share-based payment expense
|
—
|
|
$
|
—
|
|
—
|
|
$
|
—
|
|
—
|
|
$
|
—
|
|
$
|
—
|
|
$
|
52,229
|
|
$
|
—
|
|
$
|
52,229
|
|
|||||||||
|
Exercise of options and vesting of restricted stock units
|
—
|
|
$
|
—
|
|
—
|
|
$
|
—
|
|
19,551,977
|
|
$
|
20
|
|
$
|
—
|
|
$
|
10,819
|
|
$
|
—
|
|
$
|
10,839
|
|
|||||||||
|
Conversion of preferred stock to common stock
|
(24,808,959
|
)
|
$
|
(25
|
)
|
—
|
|
$
|
—
|
|
24,808,959
|
|
$
|
25
|
|
$
|
—
|
|
$
|
—
|
|
$
|
—
|
|
$
|
—
|
|
|||||||||
|
Balance at December 31, 2010
|
—
|
|
$
|
—
|
|
12,500,000
|
|
$
|
13
|
|
3,933,195,112
|
|
$
|
3,933
|
|
$
|
(5,861
|
)
|
$
|
10,420,604
|
|
$
|
(10,211,053
|
)
|
$
|
207,636
|
|
|||||||||
|
Comprehensive income, net of tax
|
—
|
|
$
|
—
|
|
—
|
|
$
|
—
|
|
—
|
|
$
|
—
|
|
$
|
5,932
|
|
$
|
—
|
|
$
|
426,961
|
|
$
|
432,893
|
|
|||||||||
|
Issuance of common stock to employees and employee benefit plans, net of forfeitures
|
—
|
|
$
|
—
|
|
—
|
|
$
|
—
|
|
1,882,801
|
|
$
|
2
|
|
$
|
—
|
|
$
|
3,480
|
|
$
|
—
|
|
$
|
3,482
|
|
|||||||||
|
Share-based payment expense
|
—
|
|
$
|
—
|
|
—
|
|
$
|
—
|
|
—
|
|
$
|
—
|
|
$
|
—
|
|
$
|
48,581
|
|
$
|
—
|
|
$
|
48,581
|
|
|||||||||
|
Exercise of options and vesting of restricted stock units
|
—
|
|
$
|
—
|
|
—
|
|
$
|
—
|
|
13,401,048
|
|
$
|
13
|
|
$
|
—
|
|
$
|
11,540
|
|
$
|
—
|
|
$
|
11,553
|
|
|||||||||
|
Issuance of common stock upon exercise of warrants
|
—
|
|
$
|
—
|
|
—
|
|
$
|
—
|
|
7,122,951
|
|
$
|
7
|
|
$
|
—
|
|
$
|
(7
|
)
|
$
|
—
|
|
$
|
—
|
|
|||||||||
|
Return of shares under share borrow agreements
|
—
|
|
$
|
—
|
|
—
|
|
$
|
—
|
|
(202,399,983
|
)
|
$
|
(202
|
)
|
$
|
—
|
|
$
|
202
|
|
$
|
—
|
|
$
|
—
|
|
|||||||||
|
Balance at December 31, 2011
|
—
|
|
$
|
—
|
|
12,500,000
|
|
$
|
13
|
|
3,753,201,929
|
|
$
|
3,753
|
|
$
|
71
|
|
$
|
10,484,400
|
|
$
|
(9,784,092
|
)
|
$
|
704,145
|
|
|||||||||
|
Comprehensive income, net of tax
|
—
|
|
$
|
—
|
|
—
|
|
$
|
—
|
|
—
|
|
$
|
—
|
|
$
|
49
|
|
$
|
—
|
|
$
|
3,472,702
|
|
$
|
3,472,751
|
|
|||||||||
|
Issuance of common stock to employees and employee benefit plans, net of forfeitures
|
—
|
|
$
|
—
|
|
—
|
|
$
|
—
|
|
1,571,175
|
|
$
|
2
|
|
$
|
—
|
|
$
|
3,521
|
|
$
|
—
|
|
$
|
3,523
|
|
|||||||||
|
Share-based payment expense
|
—
|
|
$
|
—
|
|
—
|
|
$
|
—
|
|
—
|
|
$
|
—
|
|
$
|
—
|
|
$
|
60,299
|
|
$
|
—
|
|
$
|
60,299
|
|
|||||||||
|
Exercise of stock options
|
—
|
|
$
|
—
|
|
—
|
|
$
|
—
|
|
214,199,297
|
|
$
|
214
|
|
$
|
—
|
|
$
|
125,695
|
|
$
|
—
|
|
$
|
125,909
|
|
|||||||||
|
Cash dividends paid on common stock ($0.05)
|
—
|
|
$
|
—
|
|
—
|
|
$
|
—
|
|
—
|
|
$
|
—
|
|
$
|
—
|
|
$
|
(262,387
|
)
|
$
|
—
|
|
$
|
(262,387
|
)
|
|||||||||
|
Cash dividends paid on preferred stock on as-converted basis
|
—
|
|
$
|
—
|
|
—
|
|
$
|
—
|
|
—
|
|
$
|
—
|
|
$
|
—
|
|
$
|
(64,675
|
)
|
$
|
—
|
|
$
|
(64,675
|
)
|
|||||||||
|
Conversion of preferred stock to common stock
|
—
|
|
$
|
—
|
|
(6,249,900
|
)
|
$
|
(7
|
)
|
1,293,467,684
|
|
$
|
1,294
|
|
$
|
—
|
|
$
|
(1,287
|
)
|
$
|
—
|
|
$
|
—
|
|
|||||||||
|
Balance at December 31, 2012
|
—
|
|
$
|
—
|
|
6,250,100
|
|
$
|
6
|
|
5,262,440,085
|
|
$
|
5,263
|
|
$
|
120
|
|
$
|
10,345,566
|
|
$
|
(6,311,390
|
)
|
$
|
4,039,565
|
|
|||||||||
See accompanying notes to the consolidated financial statements.
F-6
SIRIUS XM RADIO INC. AND SUBSIDIARIES
|
|
For the Years Ended December 31,
|
||||||||||
|
(in thousands)
|
2012
|
2011
|
2010
|
||||||||
|
Cash flows from operating activities:
|
|
|
|||||||||
|
Net income
|
$
|
3,472,702
|
|
$
|
426,961
|
|
$
|
43,055
|
|
||
|
Adjustments to reconcile net income to net cash provided by operating activities:
|
|
|
|
||||||||
|
Depreciation and amortization
|
266,295
|
|
267,880
|
|
273,691
|
|
|||||
|
Non-cash interest expense, net of amortization of premium
|
35,924
|
|
39,515
|
|
42,841
|
|
|||||
|
Provision for doubtful accounts
|
34,548
|
|
33,164
|
|
32,379
|
|
|||||
|
Restructuring, impairments and related costs
|
—
|
|
—
|
|
66,731
|
|
|||||
|
Amortization of deferred income related to equity method investment
|
(2,776
|
)
|
(2,776
|
)
|
(2,776
|
)
|
|||||
|
Loss on extinguishment of debt and credit facilities, net
|
132,726
|
|
7,206
|
|
120,120
|
|
|||||
|
Gain on merger of unconsolidated entities
|
—
|
|
(75,768
|
)
|
—
|
|
|||||
|
Loss on unconsolidated entity investments, net
|
420
|
|
6,520
|
|
11,722
|
|
|||||
|
Dividend received from unconsolidated entity investment
|
1,185
|
|
—
|
|
—
|
|
|||||
|
Loss on disposal of assets
|
657
|
|
269
|
|
1,017
|
|
|||||
|
Share-based payment expense
|
63,822
|
|
53,190
|
|
60,437
|
|
|||||
|
Deferred income taxes
|
(3,001,818
|
)
|
8,264
|
|
2,308
|
|
|||||
|
Other non-cash purchase price adjustments
|
(289,050
|
)
|
(275,338
|
)
|
(250,727
|
)
|
|||||
|
Distribution from investment in unconsolidated entity
|
—
|
|
4,849
|
|
—
|
|
|||||
|
Changes in operating assets and liabilities:
|
|||||||||||
|
Accounts receivable
|
(38,985
|
)
|
(13,211
|
)
|
(39,236
|
)
|
|||||
|
Receivables from distributors
|
(19,608
|
)
|
(17,241
|
)
|
(11,023
|
)
|
|||||
|
Inventory
|
11,374
|
|
(14,793
|
)
|
(5,725
|
)
|
|||||
|
Related party assets
|
9,523
|
|
30,036
|
|
(9,803
|
)
|
|||||
|
Prepaid expenses and other current assets
|
647
|
|
8,525
|
|
75,374
|
|
|||||
|
Other long-term assets
|
22,779
|
|
36,490
|
|
17,671
|
|
|||||
|
Accounts payable and accrued expenses
|
46,043
|
|
(32,010
|
)
|
5,420
|
|
|||||
|
Accrued interest
|
(36,451
|
)
|
(2,048
|
)
|
(884
|
)
|
|||||
|
Deferred revenue
|
101,311
|
|
55,336
|
|
133,444
|
|
|||||
|
Related party liabilities
|
(7,545
|
)
|
(1,542
|
)
|
(53,413
|
)
|
|||||
|
Other long-term liabilities
|
3,042
|
|
152
|
|
272
|
|
|||||
|
Net cash provided by operating activities
|
806,765
|
|
543,630
|
|
512,895
|
|
|||||
|
Cash flows from investing activities:
|
|||||||||||
|
Additions to property and equipment
|
(97,293
|
)
|
(137,429
|
)
|
(311,868
|
)
|
|||||
|
Purchase of restricted investments
|
(26
|
)
|
(826
|
)
|
—
|
|
|||||
|
Sale of restricted and other investments
|
—
|
|
—
|
|
9,454
|
|
|||||
|
Release of restricted investments
|
—
|
|
250
|
|
—
|
|
|||||
|
Return of capital from investment in unconsolidated entity
|
—
|
|
10,117
|
|
—
|
|
|||||
|
Net cash used in investing activities
|
(97,319
|
)
|
(127,888
|
)
|
(302,414
|
)
|
|||||
|
Cash flows from financing activities:
|
|||||||||||
|
Proceeds from exercise of stock options
|
123,369
|
|
11,553
|
|
10,839
|
|
|||||
|
Payment of premiums on redemption of debt
|
(100,615
|
)
|
(5,020
|
)
|
(84,326
|
)
|
|||||
|
Repayment of long-term borrowings
|
(915,824
|
)
|
(234,976
|
)
|
(1,262,396
|
)
|
|||||
|
Repayment of related party long-term borrowings
|
(126,000
|
)
|
—
|
|
(142,221
|
)
|
|||||
|
Long-term borrowings, net of costs
|
383,641
|
|
—
|
|
1,274,707
|
|
|||||
|
Related party long-term borrowings
|
—
|
|
—
|
|
196,118
|
|
|||||
|
Dividends paid
|
(327,062
|
)
|
—
|
|
—
|
|
|||||
|
Net cash used in financing activities
|
(962,491
|
)
|
(228,443
|
)
|
(7,279
|
)
|
|||||
|
Net (decrease) increase in cash and cash equivalents
|
(253,045
|
)
|
187,299
|
|
203,202
|
|
|||||
|
Cash and cash equivalents at beginning of period
|
773,990
|
|
586,691
|
|
383,489
|
|
|||||
|
Cash and cash equivalents at end of period
|
$
|
520,945
|
|
$
|
773,990
|
|
$
|
586,691
|
|
||
F-7
SIRIUS XM RADIO INC. AND SUBSIDIARIES
CONSOLIDATED STATEMENTS OF CASH FLOWS - (Continued)
|
|
For the Years Ended December 31,
|
||||||||||
|
(in thousands)
|
2012
|
2011
|
2010
|
||||||||
|
Supplemental Disclosure of Cash and Non-Cash Flow Information
|
|||||||||||
|
Cash paid during the period for:
|
|||||||||||
|
Interest, net of amounts capitalized
|
$
|
262,039
|
|
$
|
258,676
|
|
$
|
241,160
|
|
||
|
Income taxes paid
|
$
|
4,935
|
|
$
|
—
|
|
$
|
—
|
|
||
|
Non-cash investing and financing activities:
|
|
|
|
||||||||
|
Conversion of Series B preferred stock to common stock
|
$
|
1,294
|
|
$
|
—
|
|
$
|
—
|
|
||
|
Capital lease obligations incurred to acquire assets
|
$
|
12,781
|
|
$
|
—
|
|
$
|
—
|
|
||
|
Common stock issuance upon exercise of warrants
|
$
|
—
|
|
$
|
7
|
|
$
|
—
|
|
||
|
Goodwill reduced for exercise of certain stock options
|
$
|
19,491
|
|
$
|
—
|
|
$
|
—
|
|
||
|
In-orbit satellite performance incentive
|
$
|
—
|
|
$
|
—
|
|
$
|
21,450
|
|
||
|
Sale-leaseback of equipment
|
$
|
—
|
|
$
|
—
|
|
$
|
5,305
|
|
||
|
Conversion of Series A preferred stock to common stock
|
$
|
—
|
|
$
|
—
|
|
$
|
25
|
|
||
See accompanying notes to the consolidated financial statements.
F-8
SIRIUS XM RADIO INC. AND SUBSIDIARIES
NOTES TO CONSOLIDATED FINANCIAL STATEMENTS
(Dollar amounts in thousands, unless otherwise stated)
|
(1)
|
Business & Basis of Presentation
|
Business
We broadcast our music, sports, entertainment, comedy, talk, news, traffic and weather channels, as well as infotainment services in the United States on a subscription fee basis through our
two
proprietary satellite radio systems. Subscribers can also receive music and other channels, plus new features such as SiriusXM On Demand, over the Internet, including through applications for mobile devices. We have agreements with every major automaker (“OEMs”) to offer satellite radios as factory- or dealer-installed equipment in their vehicles from which we acquire the majority of our subscribers. We also acquire subscribers through the sale or lease of previously owned vehicles with factory-installed satellite radios. Additionally, we distribute our satellite radios through retail locations nationwide and through our website. Satellite radio services are also offered to customers of certain daily rental car companies.
Our primary source of revenue is subscription fees, with most of our customers subscribing on an annual, semi-annual, quarterly or monthly basis. We offer discounts for prepaid and long-term subscription plans, as well as discounts for multiple subscriptions. We also derive revenue from other subscription-related fees, the sale of advertising on select non-music channels, the direct sale of satellite radios, components and accessories, and other ancillary services, such as our Internet radio, Backseat TV, data, traffic, and weather services.
In certain cases, automakers include a subscription to our radio services in the sale or lease price of new and previously owned vehicles. The length of these prepaid subscriptions varies, but is typically
three
to
twelve
months. In many cases, we receive subscription payments from automakers in advance of the activation of our service. We also reimburse various automakers for certain costs associated with satellite radios installed in their vehicles.
Basis of Presentation
Our financial statements include the consolidated accounts for Sirius XM Radio Inc. and subsidiaries and have been prepared in accordance with U.S. generally accepted accounting principles (“GAAP”).
The preparation of financial statements in conformity with GAAP requires management to make estimates and assumptions that affect the amounts reported in the financial statements and footnotes. Estimates, by their nature, are based on judgment and available information. Actual results could differ materially from those estimates. Significant estimates inherent in the preparation of the accompanying consolidated financial statements include asset impairment, depreciable lives of our satellites, share-based payment expense, and valuation allowances against deferred tax assets.
|
(2)
|
Summary of Significant Accounting Policies
|
Cash and Cash Equivalents
Cash and cash equivalents consist of cash on hand, money market funds, in-transit credit card receipts and highly liquid investments purchased with an original maturity of three months or less.
Equity Method Investments
We hold an equity method investment in Sirius XM Canada. Investments in which we have the ability to exercise significant influence but not control are accounted for pursuant to the equity method of accounting. We recognize our proportionate share of earnings or losses of our affiliates as they occur as a component of Other income (expense) in our consolidated statements of comprehensive income.
The difference between our investment and our share of the fair value of the underlying net assets of our affiliates is first allocated to either finite-lived intangibles or indefinite-lived intangibles and the balance is attributed to goodwill. We follow ASC 350,
Intangibles - Goodwill and Other
, which requires that equity method finite-lived intangibles be amortized over their estimated useful life while indefinite-lived intangibles and goodwill are not amortized. The amortization of equity method finite-lived intangible assets is recorded in Interest and investment income (loss) in our consolidated statements of comprehensive income. We periodically evaluate our equity method investments to determine if there has been an other than temporary decline below carrying value. Equity method finite-lived intangibles, indefinite-lived intangibles and goodwill are included in the carrying amount of the investment.
F-9
SIRIUS XM RADIO INC. AND SUBSIDIARIES
NOTES TO CONSOLIDATED FINANCIAL STATEMENTS - Continued
(Dollar amounts in thousands, unless otherwise stated)
Property and Equipment
Property and equipment, including satellites, are stated at cost, less accumulated depreciation. Equipment under capital leases is stated at the present value of minimum lease payments. Depreciation are calculated using the straight-line method over the following estimated useful life of the asset:
|
Satellite system
|
2 - 15 years
|
|
Terrestrial repeater network
|
5 - 15 years
|
|
Broadcast studio equipment
|
3 - 15 years
|
|
Capitalized software and hardware
|
3 - 7 years
|
|
Satellite telemetry, tracking and control facilities
|
3 - 15 years
|
|
Furniture, fixtures, equipment and other
|
2 - 7 years
|
|
Building
|
20 or 30 years
|
|
Leasehold improvements
|
Lesser of useful life or remaining lease term
|
We review long-lived assets, such as property and equipment, and purchased intangibles subject to amortization for impairment whenever events or changes in circumstances indicate the carrying amount may not be recoverable. Recoverability of assets to be held and used is measured by a comparison of the carrying amount of an asset to estimated undiscounted future cash flows expected to be generated by the asset. If the carrying amount of an asset exceeds the estimated future cash flows, an impairment charge is recognized for the amount by which the carrying amount exceeds the fair value of the asset. We did not record any impairments in
2012
,
2011
or
2010
.
Goodwill and Other Intangible Assets
Goodwill represents the excess of the purchase price over the estimated fair value of net tangible and identifiable intangible assets acquired in business combinations. Our annual impairment assessment of our single reporting unit is performed during the fourth quarter of each year, and an assessment is performed at other times if an event occurs or circumstances change that would more likely than not reduce the fair value of the asset below its carrying value. Step one of the impairment assessment compares the fair value to its carrying value and if the fair value exceeds its carrying value, goodwill is not impaired. If the carrying value exceeds the fair value, the implied fair value of goodwill is compared to the carrying value of goodwill. If the implied fair value exceeds the carrying value then goodwill is not impaired; otherwise, an impairment loss will be recorded by the amount the carrying value exceeds the implied fair value. We did not record any impairments in
2012
,
2011
or
2010
.
The impairment test for other intangible assets not subject to amortization consists of a comparison of the fair value of the intangible asset with its carrying value. This test is performed during the fourth quarter of each year, and an assessment is performed at other times if events or circumstances indicate it is more likely than not that the asset is impaired. Our indefinite life intangibles include our FCC licenses and trademark. If the carrying value of the intangible asset exceeds its fair value, an impairment loss is recognized in an amount equal to that excess.
ASU 2012-02,
Testing Indefinite-Lived Intangible Assets for Impairment,
established an option to first perform a qualitative assessment to determine whether it is more likely than not that an asset is impaired. If the qualitative assessment supports that it is more likely than not that the fair value of the asset exceeds its carrying value, a quantitative impairment test is not required. If the qualitative assessment does not support the fair value of the asset, then a quantitative assessment is performed. We completed a qualitative assessment during the fourth quarter of 2012 and determined that there was no impairment in
2012
. We used independent appraisals to determine the fair value of our FCC licenses and trademark using the Income and the Relief from Royalty approaches, respectively, in
2011
and
2010
and no impairments were recorded.
Other intangible assets with finite lives consists primarily of customer relationships acquired in business combinations, licensing agreements, and certain information technology related costs. These assets are amortized over their respective estimated useful lives to their estimated residual values, and reviewed for impairment under the provisions of ASC 360-10-35,
Property, Plant and Equipment/Overall/Subsequent Measurement
. We review intangible assets subject to amortization for impairment whenever events or circumstances indicate that the carrying amount of an asset may not be recoverable. If the sum of the expected cash flows, undiscounted and without interest, is less than the carrying amount of the asset, an impairment loss
F-10
SIRIUS XM RADIO INC. AND SUBSIDIARIES
NOTES TO CONSOLIDATED FINANCIAL STATEMENTS - Continued
(Dollar amounts in thousands, unless otherwise stated)
is recognized as the amount by which the carrying amount of the asset exceeds its fair value. We did not record any impairments relating to our intangible assets with finite lives in
2012
,
2011
or
2010
.
Revenue Recognition
We derive revenue primarily from subscribers, advertising and direct sales of merchandise.
Revenue from subscribers consists of subscription fees, daily rental fleet revenue and non-refundable activation and other fees. Revenue is recognized as it is realized or realizable and earned. We recognize subscription fees as our services are provided. At the time of sale, vehicle owners purchasing or leasing a vehicle with a subscription to our service typically receive between a three and twelve month prepaid subscription. Prepaid subscription fees received from certain automakers are recorded as deferred revenue and amortized to revenue ratably over the service period which commences upon retail sale and activation.
We recognize revenue from the sale of advertising as the advertising is broadcast. Agency fees are calculated based on a stated percentage applied to gross billing revenue for our advertising inventory and are reported as a reduction of advertising revenue. We pay certain third parties a percentage of advertising revenue. Advertising revenue is recorded gross of such revenue share payments as we are the primary obligor in the transaction. Advertising revenue share payments are recorded to Revenue share and royalties during the period in which the advertising is broadcast.
Equipment revenue and royalties from the sale of satellite radios, components and accessories are recognized upon shipment, net of discounts and rebates. Shipping and handling costs billed to customers are recorded as revenue. Shipping and handling costs associated with shipping goods to customers are reported as a component of Cost of equipment.
ASC 605,
Revenue Recognition,
provides guidance on how and when to recognize revenues for arrangements that may involve the delivery or performance of multiple products, services and/or rights to use assets. Revenue arrangements with multiple deliverables are required to be divided into separate units of accounting if the deliverables in the arrangement meet certain criteria. Consideration must be allocated at the inception of the arrangement to all deliverables based on their relative selling price, which has been determined using vendor specific objective evidence of selling price of self-pay customers.
Revenue Share
We share a portion of our subscription revenues earned from subscribers with certain automakers. The terms of the revenue share agreements vary with each automaker, but are typically based upon the earned audio revenue as reported or gross billed audio revenue. Revenue share is recorded as an expense in our consolidated statements of comprehensive income and not as a reduction to revenue.
Programming Costs
Programming costs which are for a specified number of events are amortized on an event-by-event basis; programming costs which are for a specified season or period are amortized over the season or period on a straight-line basis. We allocate a portion of certain programming costs which are related to sponsorship and marketing activities to Sales and marketing expense on a straight-line basis over the term of the agreement.
Advertising Costs
Media is expensed when aired and advertising production costs are expensed as incurred. Market development funds consist of fixed and variable payments to reimburse retailers for the cost of advertising and other product awareness activities. Fixed market development funds are expensed over the periods specified in the applicable agreement; variable costs are expensed when the media is aired and production costs are expensed as incurred. During the
years ended
December 31, 2012
,
2011
and
2010
, we recorded advertising costs of
$139,830
,
$116,694
and
$110,050
, respectively. These costs are reflected in Sales and marketing expense in our consolidated statements of comprehensive income.
F-11
SIRIUS XM RADIO INC. AND SUBSIDIARIES
NOTES TO CONSOLIDATED FINANCIAL STATEMENTS - Continued
(Dollar amounts in thousands, unless otherwise stated)
Subscriber Acquisition Costs
Subscriber acquisition costs consist of costs incurred to acquire new subscribers and include hardware subsidies paid to radio manufacturers, distributors and automakers, including subsidies paid to automakers who include a satellite radio and a prepaid subscription to our service in the sale or lease price of a new vehicle; subsidies paid for chip sets and certain other components used in manufacturing radios; device royalties for certain radios; commissions paid to automakers as incentives to purchase, install and activate radios; product warranty obligations; freight; and provisions for inventory allowance. Subscriber acquisition costs do not include advertising, loyalty payments to distributors and dealers of radios and revenue share payments to automakers and retailers of radios.
Subsidies paid to radio manufacturers and automakers are expensed upon installation, shipment, receipt of product or activation and are included in Subscriber acquisition costs because we are responsible for providing the service to the customers. Commissions paid to retailers and automakers are expensed upon either the sale or activation of radios. Chip sets that are shipped to radio manufacturers and held on consignment are recorded as inventory and expensed as Subscriber acquisition costs when placed into production by radio manufacturers. Costs for chip sets not held on consignment are expensed as Subscriber acquisition costs when the automaker confirms receipt.
We record product warranty obligations in accordance with ASC 460,
Guarantees
, which requires a guarantor to recognize, at the inception of a guarantee, a liability for the fair value of the obligation undertaken by issuing the guarantee. We warrant that certain products sold through our retail and direct to consumer distribution channels will perform in all material respects in accordance with specifications in effect at the time of the purchase of the products by the customer. The product warranty period on our products is
90 days
from the purchase date for repair or replacement of components and/or products that contain defects of material or workmanship. We record a liability for costs that we expect to incur under our warranty obligations when the product is shipped from the manufacturer. Factors affecting the warranty liability include the number of units sold, historical experience, and anticipated rates of claims and costs per claim. We periodically assess the adequacy of our warranty liability based on changes in these factors.
Research & Development Costs
Research and development costs are expensed as incurred and primarily include the cost of new product development, chip set design, software development and engineering. During the
years ended
December 31, 2012
,
2011
and
2010
, we recorded research and development costs of
$42,605
,
$48,574
and
$40,043
, respectively. These costs are reported as a component of Engineering, design and development expense in our consolidated statements of comprehensive income.
Share-Based Compensation
We account for equity instruments granted to employees in accordance with ASC 718,
Compensation - Stock Compensation
. ASC 718 requires all share-based compensation payments be recognized in the financial statements based on fair value. ASC 718 requires forfeitures to be estimated at the time of grant and revised in subsequent periods if actual forfeitures differ from initial estimates. We use the Black-Scholes-Merton option-pricing model to value stock option awards and have elected to treat awards with graded vesting as a single award. Share-based compensation expense is recognized ratably over the requisite service period, which is generally the vesting period, net of forfeitures. We measure restricted stock awards using the fair market value of the restricted shares of common stock on the day the award is granted.
Fair value as determined using the Black-Scholes-Merton model varies based on assumptions used for the expected life, expected stock price volatility and risk-free interest rates. In
2012
and
2011
, we estimated the fair value of awards granted using the hybrid approach for volatility, which weights observable historical volatility and implied volatility of qualifying actively traded options on our common stock. In 2010, due to the lack of qualifying actively traded options on our common stock, we utilized a
100%
weighting to observable historical volatility. The expected life assumption represents the weighted-average period stock-based awards are expected to remain outstanding. These expected life assumptions are established through a review of historical exercise behavior of stock-based award grants with similar vesting periods. Where historical patterns do not exist, contractual terms are used. The risk-free interest rate represents the daily treasury yield curve rate at the grant date based on the closing market bid yields on actively traded U.S. treasury securities in the over-the-counter market for the expected term. Our assumptions may change in future periods.
Stock-based awards granted to employees, non-employees and members of our board of directors include warrants, stock options, restricted stock and restricted stock units.
F-12
SIRIUS XM RADIO INC. AND SUBSIDIARIES
NOTES TO CONSOLIDATED FINANCIAL STATEMENTS - Continued
(Dollar amounts in thousands, unless otherwise stated)
Income Taxes
Deferred income taxes are recognized for the tax consequences related to temporary differences between the carrying amount of assets and liabilities for financial reporting purposes and the amounts used for tax purposes at each year-end, based on enacted tax laws and statutory tax rates applicable to the periods in which the differences are expected to affect taxable income. In determining the period in which related tax benefits are realized for book purposes, excess share-based compensation deductions included in net operating losses are realized after regular net operating losses are exhausted; excess tax compensation benefits are recorded off balance-sheet as a memo entry until the period the excess tax benefit is realized through a reduction of taxes payable. A valuation allowance is recognized when, based on the weight of all available evidence, it is considered more likely than not that all, or some portion, of the deferred tax assets will not be realized. Income tax expense is the sum of current income tax plus the change in deferred tax assets and liabilities.
As of
December 31, 2012
, we maintained a valuation allowance of
$9,835
relating to deferred tax assets that are not likely to be realized due to certain state net operating loss limitations. In
2011
, we maintained a full valuation allowance of
$3,360,740
against our deferred tax assets due to our prior history of pre-tax losses and uncertainty about the timing of and ability to generate taxable income in the future and our assessment that the realization of the deferred tax assets did meet the more likely than not criterion under ASC 740,
Income Taxes.
ASC 740 requires a company to first determine whether it is more-likely-than-not that a tax position will be sustained based on its technical merits as of the reporting date, assuming that taxing authorities will examine the position and have full knowledge of all relevant information. A tax position that meets this more-likely-than-not threshold is then measured and recognized at the largest amount of benefit that is greater than fifty percent likely to be realized upon effective settlement with a taxing authority. Changes in recognition or measurement are reflected in the period in which the change in judgment occurs. We record interest and penalties related to uncertain tax positions in Income tax (benefit) expense in our consolidated statements of comprehensive income.
We report revenues net of any tax assessed by a governmental authority that is both imposed on, and concurrent with, a specific revenue-producing transaction between a seller and a customer in our consolidated statements of comprehensive income.
Fair Value of Financial Instruments
The fair value of a financial instrument is the amount at which the instrument could be exchanged in an orderly transaction between market participants. As of
December 31, 2012
and
2011
, the carrying amounts of cash and cash equivalents, accounts and other receivables, and accounts payable approximated fair value due to the short-term nature of these instruments.
ASC 820,
Fair Value Measurements and Disclosures,
establishes a fair value hierarchy for input into valuation techniques as follows: i) Level 1 input - unadjusted quoted prices in active markets for identical instrument; ii) Level 2 input - observable market data for the same or similar instrument but not Level 1; and iii) Level 3 input - unobservable inputs developed using management's assumptions about the inputs used for pricing the asset or liability. We use Level 3 inputs to fair value the
8%
convertible unsecured subordinated debentures issued by Sirius XM Canada.
Investments are periodically reviewed for impairment and a write down is recorded whenever declines in fair value below carrying value are determined to be other than temporary. In making this determination, we consider, among other factors, the severity and duration of the decline as well as the likelihood of a recovery within a reasonable timeframe.
The fair value for publicly traded instruments is determined using quoted market prices while the fair value for non-publicly traded instruments is based upon estimates from a market maker and brokerage firm. As of
December 31, 2012
and
2011
, the carrying value of our debt was
$2,435,220
and
$3,013,974
, respectively; and the fair value approximated
$3,055,076
and
$3,506,546
, respectively.
F-13
SIRIUS XM RADIO INC. AND SUBSIDIARIES
NOTES TO CONSOLIDATED FINANCIAL STATEMENTS - Continued
(Dollar amounts in thousands, unless otherwise stated)
Accumulated Other Comprehensive Income
Accumulated other comprehensive income of
$120
at
December 31, 2012
was primarily comprised of foreign currency translation adjustments related to our interest in Sirius XM Canada. During the
years ended
December 31, 2012
,
2011
and
2010
, we recorded a foreign currency translation adjustment of
$49
,
$(140)
and
$251
, respectively, which is recorded net of taxes of
$48
,
$11
and
$63
, respectively. In addition, during the
year ended
December 31, 2011
, we recorded a loss on our XM Canada investment foreign currency translation adjustment of
$6,072
. During the
year ended
December 31, 2010
, we recorded an unrealized gain on available-for-sale securities of
$469
.
Recent Accounting Pronouncements
In May 2011, the FASB issued ASU 2011-04,
Amendments to Achieve Common Fair Value Measurement and Disclosure Requirements in U.S. GAAP and International Financial Reporting Standards (Topic 820) - Fair Value Measurement
, to provide a consistent definition of fair value and ensure that the fair value measurement and disclosure requirements are similar between U.S. GAAP and International Financial Reporting Standards. ASU 2011-04 changes certain fair value measurement principles and enhances the disclosure requirements particularly for Level 3 fair value measurements. This standard is effective for interim and annual periods beginning after December 15, 2011 and is applied on a prospective basis. We adopted ASU 2011-04 as of January 1, 2012 and the impact was not material to our consolidated financial statements.
In June 2011, the FASB issued ASU 2011-05,
Comprehensive Income (Topic 220), Presentation of Comprehensive Income
, to require an entity to present the total of comprehensive income, the components of net income, and the components of other comprehensive income either in single continuous statement of comprehensive income or in two separate but consecutive statements. ASU 2011-05 eliminates the option to present the components of other comprehensive income as part of the statement of equity. The standard does not change the items which must be reported in other comprehensive income, how such items are measured or when they must be reclassified to net income. This standard is effective for interim and annual periods beginning after December 15, 2011 and is to be applied retrospectively. The FASB has deferred the requirement to present reclassification adjustments for each component of accumulated other comprehensive income in both net income and other comprehensive income. Companies are required to either present amounts reclassified out of other comprehensive income on the face of the financial statements or disclose those amounts in the notes to the financial statements. During the deferral period, there is no requirement to separately present or disclose the reclassification adjustments into net income. The effective date of this deferral was consistent with the effective date of ASU 2011-05. We adopted ASU 2011-05 as of January 1, 2012 and disclosed comprehensive income in our consolidated statements of comprehensive income. ASU 2011-05 affects financial statement presentation and has no impact on our results of consolidated financial statements.
In July 2012, the FASB issued ASU 2012-02,
Testing Indefinite-Lived Intangible Assets for Impairment
. The guidance gives companies the option to first perform a qualitative assessment to determine whether it is more likely than not that an indefinite-lived intangible asset is impaired. If the qualitative assessment supports that it is more likely than not the fair value of the asset exceeds its carrying amount, the company would not be required to perform a quantitative impairment test. If the qualitative assessment does not support the fair value of the asset, then a quantitative assessment is performed. ASU 2012-02 is effective for public entities for annual and interim impairment tests performed for fiscal years beginning after September 15, 2012. We early adopted ASU 2012-02 and performed a qualitative assessment to determine whether our indefinite-lived intangible assets were impaired as of the fourth quarter of 2012.
|
(3)
|
Earnings per Share
|
We utilize the two-class method of calculating basic net income per common share, as our Series B Preferred Stock are considered participating securities. Basic net income per common share is calculated by dividing income available to common stockholders by the weighted average common shares outstanding during each reporting period. Diluted net income per common share
adjusts the weighted average common shares outstanding for the potential dilution that could occur if common stock equivalents (convertible debt and preferred stock, warrants, stock options, restricted stock and restricted stock units) were exercised or converted into common stock, calculated using the treasury stock method. Common stock equivalents of approximately
147,125,000
,
419,752,000
and
689,922,000
for the
years ended
December 31, 2012
,
2011
and
2010
, respectively, were excluded from the calculation of diluted net income per common share as the effect would have been anti-dilutive.
F-14
SIRIUS XM RADIO INC. AND SUBSIDIARIES
NOTES TO CONSOLIDATED FINANCIAL STATEMENTS - Continued
(Dollar amounts in thousands, unless otherwise stated)
|
|
For the Years Ended December 31,
|
||||||||||
|
(in thousands, except per share data)
|
2012
|
|
2011
|
2010
|
|||||||
|
Numerator:
|
|||||||||||
|
Net income
|
$
|
3,472,702
|
|
|
$
|
426,961
|
|
$
|
43,055
|
|
|
|
Less:
|
|||||||||||
|
Allocation of undistributed income to Series B Preferred Stock
|
(1,084,895
|
)
|
(174,449
|
)
|
(17,735
|
)
|
|||||
|
Dividends paid to preferred stockholders
|
(64,675
|
)
|
—
|
|
—
|
|
|||||
|
Net income available to common stockholders for basic net income per common share
|
2,323,132
|
|
252,512
|
|
25,320
|
|
|||||
|
Add back:
|
|
|
|
|
|
|
|||||
|
Allocation of undistributed income to Series B Preferred Stock
|
1,084,895
|
|
174,449
|
|
17,735
|
|
|||||
|
Dividends paid to preferred stockholders
|
64,675
|
|
—
|
|
—
|
|
|||||
|
Effect of interest on assumed conversions of convertible debt
|
38,500
|
|
—
|
|
—
|
|
|||||
|
Net income available to common stockholders for diluted net income per common share
|
$
|
3,511,202
|
|
$
|
426,961
|
|
$
|
43,055
|
|
||
|
Denominator:
|
|||||||||||
|
Weighted average common shares outstanding for basic net income per common share
|
4,209,073
|
|
|
3,744,606
|
|
3,693,259
|
|
||||
|
Weighted average impact of assumed Series B Preferred Stock conversion
|
2,215,900
|
|
2,586,977
|
|
2,586,977
|
|
|||||
|
Weighted average impact of assumed convertible debt
|
298,725
|
|
—
|
|
—
|
|
|||||
|
Weighted average impact of other dilutive equity instruments
|
150,088
|
|
|
169,239
|
|
110,835
|
|
||||
|
Weighted average shares for diluted net income per common share
|
6,873,786
|
|
|
6,500,822
|
|
6,391,071
|
|
||||
|
Net income per common share:
|
|||||||||||
|
Basic
|
$
|
0.55
|
|
|
$
|
0.07
|
|
$
|
0.01
|
|
|
|
Diluted
|
$
|
0.51
|
|
|
$
|
0.07
|
|
$
|
0.01
|
|
|
We identified and corrected an immaterial error affecting the historical presentation of basic earnings per share. The adjustment reflects the Series B Preferred Stock held by an affiliate of Liberty Media as participating securities as the holder of such preferred stock may participate in dividends and distributions ratably with the holders of our common stock on an as-converted basis. Net income per common share-basic for the
year ended
December 31, 2011
was previously reported as
$0.11
and has been adjusted to be
$0.07
. There was no impact on the previously reported net income per common share-basic for the
year ended
December 31, 2010
and there was no impact on the previously reported diluted earnings per share for any period presented. The effects of the error were not material to any previously reported quarterly or annual period. The related corrections are reflected in the applicable prior periods.
In September 2012, Liberty Media converted
6,249,900
shares of the Series B Preferred Stock into
1,293,467,684
shares of common stock. For a discussion of subsequent events refer to Note 18.
|
(4)
|
Accounts Receivable, net
|
Accounts receivable, net, are stated at amounts due from customers net of an allowance for doubtful accounts. Our allowance for doubtful accounts is based upon our assessment of various factors. We consider historical experience, the age of the receivable balances, current economic conditions and other factors that may affect the counterparty’s ability to pay. Bad debt is included in Customer service and billing expense in our consolidated statements of comprehensive income.
F-15
SIRIUS XM RADIO INC. AND SUBSIDIARIES
NOTES TO CONSOLIDATED FINANCIAL STATEMENTS - Continued
(Dollar amounts in thousands, unless otherwise stated)
Accounts receivable, net, consists of the following:
|
|
December 31,
2012 |
|
December 31,
2011 |
||||
|
Gross accounts receivable
|
$
|
117,853
|
|
|
$
|
111,637
|
|
|
Allowance for doubtful accounts
|
(11,711
|
)
|
|
(9,932
|
)
|
||
|
Total accounts receivable, net
|
$
|
106,142
|
|
|
$
|
101,705
|
|
Receivables from distributors include billed and unbilled amounts due from OEMs for radio services included in the sale or lease price of vehicles, as well as billed amounts due from retailers. Receivables from distributors consist of the following:
|
|
December 31,
2012 |
|
December 31,
2011 |
||||
|
Billed
|
$
|
53,057
|
|
|
$
|
44,618
|
|
|
Unbilled
|
51,368
|
|
|
40,199
|
|
||
|
Total
|
$
|
104,425
|
|
|
$
|
84,817
|
|
|
(5)
|
Inventory, net
|
Inventory consists of finished goods, refurbished goods, chip sets and other raw material components used in manufacturing radios. Inventory is stated at the lower of cost, determined on a first-in, first-out basis, or market. We record an estimated allowance for inventory that is considered slow moving, obsolete or whose carrying value is in excess of net realizable value. The provision related to products purchased for resale in our direct to consumer distribution channel and components held for resale by us is reported as a component of Cost of equipment in our consolidated statements of comprehensive income. The provision related to inventory consumed in our OEM and retail distribution channel is reported as a component of Subscriber acquisition costs in our consolidated statements of comprehensive income.
Inventory, net, consists of the following:
|
|
December 31,
2012 |
|
December 31,
2011 |
||||
|
Raw materials
|
$
|
17,717
|
|
|
$
|
24,134
|
|
|
Finished goods
|
23,779
|
|
|
28,007
|
|
||
|
Allowance for obsolescence
|
(16,159
|
)
|
|
(15,430
|
)
|
||
|
Total inventory, net
|
$
|
25,337
|
|
|
$
|
36,711
|
|
|
(6)
|
Goodwill
|
Goodwill represents the excess of the purchase price over the estimated fair value of net tangible and identifiable intangible assets acquired in business combinations. Our annual impairment assessment is performed as of the fourth quarter of each year, and an assessment is performed at other times if an event occurs or circumstances change that would more likely than not reduce the fair value of the asset below its carrying value. At the date of our annual assessment for 2012 and 2011, the fair value of our single reporting unit substantially exceeded its carrying value and therefore was not at risk of failing step one of ASC 350-20,
Goodwill
.
As of
December 31, 2012
, there were no indicators of impairment and no impairment loss was recorded for goodwill during the
years ended
December 31, 2012
,
2011
and
2010
. The cumulative balance of goodwill impairment that has been recorded since the Merger is
$4,766,190
, which was recognized during the year ended
December 31, 2008
.
During the
year ended
December 31, 2012
, with the release of our deferred income tax valuation allowance, we reduced goodwill by
$19,491
related to the subsequent exercise of certain stock options and vesting of certain restricted stock units that were recorded at fair value in connection with the Merger. There were no changes in the carrying value of our goodwill during the
year ended
December 31, 2011
.
F-16
SIRIUS XM RADIO INC. AND SUBSIDIARIES
NOTES TO CONSOLIDATED FINANCIAL STATEMENTS - Continued
(Dollar amounts in thousands, unless otherwise stated)
|
(7)
|
Intangible Assets
|
Intangible assets consist of the following:
|
|
|
December 31, 2012
|
|
December 31, 2011
|
|||||||||||||||||||||
|
|
Weighted Average
Useful Lives
|
|
Gross
Carrying
Value
|
|
Accumulated
Amortization
|
|
Net Carrying
Value
|
|
Gross
Carrying
Value
|
|
Accumulated
Amortization
|
|
Net Carrying
Value
|
||||||||||||
|
Indefinite life intangible assets:
|
|
|
|
|
|
||||||||||||||||||||
|
FCC licenses
|
Indefinite
|
|
$
|
2,083,654
|
|
|
$
|
—
|
|
|
$
|
2,083,654
|
|
|
$
|
2,083,654
|
|
|
$
|
—
|
|
|
$
|
2,083,654
|
|
|
Trademark
|
Indefinite
|
|
250,000
|
|
|
—
|
|
|
250,000
|
|
|
250,000
|
|
|
—
|
|
|
250,000
|
|
||||||
|
Definite life intangible assets:
|
|
|
|
|
|
||||||||||||||||||||
|
Subscriber relationships
|
9 years
|
|
380,000
|
|
|
(233,317
|
)
|
|
146,683
|
|
|
380,000
|
|
|
(191,201
|
)
|
|
188,799
|
|
||||||
|
Licensing agreements
|
9.1 years
|
|
78,489
|
|
|
(44,161
|
)
|
|
34,328
|
|
|
78,897
|
|
|
(34,145
|
)
|
|
44,752
|
|
||||||
|
Proprietary software
|
6 years
|
|
16,552
|
|
|
(12,777
|
)
|
|
3,775
|
|
|
16,552
|
|
|
(11,507
|
)
|
|
5,045
|
|
||||||
|
Developed technology
|
10 years
|
|
2,000
|
|
|
(883
|
)
|
|
1,117
|
|
|
2,000
|
|
|
(683
|
)
|
|
1,317
|
|
||||||
|
Leasehold interests
|
7.4 years
|
|
132
|
|
|
(79
|
)
|
|
53
|
|
|
132
|
|
|
(61
|
)
|
|
71
|
|
||||||
|
Total intangible assets
|
|
$
|
2,810,827
|
|
|
$
|
(291,217
|
)
|
|
$
|
2,519,610
|
|
|
$
|
2,811,235
|
|
|
$
|
(237,597
|
)
|
|
$
|
2,573,638
|
|
|
Indefinite Life Intangible Assets
We have identified our FCC licenses and the XM trademark as indefinite life intangible assets after considering the expected use of the assets, the regulatory and economic environment within which they are used and the effects of obsolescence on their use.
We hold FCC licenses to operate our satellite digital audio radio service and provide ancillary services. The following table outlines the years in which each of our licenses expires:
|
FCC satellite licenses
|
Expiration year
|
|
|
SIRIUS FM-1
|
2017
|
|
|
SIRIUS FM-2
|
2017
|
|
|
SIRIUS FM-3
|
2017
|
|
|
SIRIUS FM-5
|
2017
|
|
|
SIRIUS FM-6 (1)
|
|
|
|
XM-1
|
2014
|
|
|
XM-2
|
2014
|
|
|
XM-3
|
2013
|
|
|
XM-4
|
2014
|
|
|
XM-5
|
2018
|
|
|
(1)
|
We hold an FCC license for our FM-6 satellite, which will expire
eight years
from when this satellite is launched and placed into operation.
|
Prior to expiration, we are required to apply for a renewal of our FCC licenses. The renewal and extension of our licenses is reasonably certain at minimal cost, which is expensed as incurred. Each of the FCC licenses authorizes us to use the broadcast spectrum, which is a renewable, reusable resource that does not deplete or exhaust over time.
In connection with the Merger,
$250,000
of the purchase price was allocated to the XM trademark. As of
December 31, 2012
, there were no legal, regulatory or contractual limitations associated with the XM trademark.
Our annual impairment assessment of our indefinite intangible assets is performed as of the fourth quarter of each year. An assessment is performed at other times if an event occurs or circumstances change that would more likely than not reduce the fair value of the asset below its carrying value. At the date of our annual assessment for 2012, our qualitative impairment assessment of fair value of our indefinite intangible assets indicated that such assets substantially exceeded their carrying value and therefore was not at risk of impairment. In 2011, we utilized independent appraisals to assist in determining the fair value of our indefinite intangible assets.
F-17
SIRIUS XM RADIO INC. AND SUBSIDIARIES
NOTES TO CONSOLIDATED FINANCIAL STATEMENTS - Continued
(Dollar amounts in thousands, unless otherwise stated)
As of
December 31, 2012
, there were no indicators of impairment and no impairment loss was recorded for indefinite intangible assets during the
years ended
December 31, 2012
,
2011
and
2010
.
Definite Life Intangible Assets
Subscriber relationships are amortized on an accelerated basis over
9 years
, which reflects the estimated pattern in which the economic benefits will be consumed. Other definite life intangible assets include certain licensing agreements, which are amortized over a weighted average useful life of
9.1 years
on a straight-line basis.
Amortization expense for all definite life intangible assets was
$53,620
,
$59,050
and
$66,324
for the
years ended
December 31, 2012
,
2011
and
2010
, respectively. Expected amortization expense for each of the fiscal years 2013 through 2017 and for periods thereafter is as follows:
|
Year ending December 31,
|
|
Amount
|
||
|
2013
|
|
$
|
47,330
|
|
|
2014
|
|
38,852
|
|
|
|
2015
|
|
37,526
|
|
|
|
2016
|
|
31,932
|
|
|
|
2017
|
|
18,968
|
|
|
|
Thereafter
|
|
11,348
|
|
|
|
Total definite life intangible assets, net
|
|
$
|
185,956
|
|
|
(8)
|
Interest Costs
|
We capitalized a portion of the interest on funds borrowed as part of the cost of constructing our satellites and related launch vehicle. We are currently capitalizing the interest associated with our FM-6 satellite and will continue to do so until its launch. During the
year ended
December 31, 2010
, we also capitalized costs related to our XM-5 satellite and related launch vehicle. We also incur interest costs on all of our debt instruments and on our satellite incentive agreements. The following is a summary of our interest costs:
|
|
For the Years Ended December 31,
|
||||||||||
|
|
2012
|
2011
|
2010
|
||||||||
|
Interest costs charged to expense
|
$
|
265,321
|
|
$
|
304,938
|
|
$
|
295,643
|
|
||
|
Interest costs capitalized
|
31,982
|
|
33,522
|
|
63,880
|
|
|||||
|
Total interest costs incurred
|
$
|
297,303
|
|
$
|
338,460
|
|
$
|
359,523
|
|
||
Included in interest costs incurred is non-cash interest expense, consisting of amortization related to original issue discounts, premiums and deferred financing fees of
$35,924
,
$39,515
and
$42,841
for the
years ended
December 31, 2012
,
2011
and
2010
, respectively.
F-18
SIRIUS XM RADIO INC. AND SUBSIDIARIES
NOTES TO CONSOLIDATED FINANCIAL STATEMENTS - Continued
(Dollar amounts in thousands, unless otherwise stated)
|
(9)
|
Property and Equipment
|
Property and equipment, net, consists of the following:
|
|
December 31,
2012 |
|
December 31,
2011 |
||||
|
Satellite system
|
$
|
1,943,537
|
|
|
$
|
1,943,537
|
|
|
Terrestrial repeater network
|
112,482
|
|
|
112,440
|
|
||
|
Leasehold improvements
|
44,938
|
|
|
43,455
|
|
||
|
Broadcast studio equipment
|
55,823
|
|
|
53,903
|
|
||
|
Capitalized software and hardware
|
232,753
|
|
|
193,301
|
|
||
|
Satellite telemetry, tracking and control facilities
|
62,734
|
|
|
60,539
|
|
||
|
Furniture, fixtures, equipment and other
|
76,028
|
|
|
60,283
|
|
||
|
Land
|
38,411
|
|
|
38,411
|
|
||
|
Building
|
57,816
|
|
|
57,185
|
|
||
|
Construction in progress
|
417,124
|
|
|
372,508
|
|
||
|
Total property and equipment
|
3,041,646
|
|
|
2,935,562
|
|
||
|
Accumulated depreciation and amortization
|
(1,469,724
|
)
|
|
(1,261,643
|
)
|
||
|
Property and equipment, net
|
$
|
1,571,922
|
|
|
$
|
1,673,919
|
|
Construction in progress consists of the following:
|
|
December 31,
2012 |
|
December 31,
2011 |
||||
|
Satellite system
|
$
|
376,825
|
|
|
$
|
343,932
|
|
|
Terrestrial repeater network
|
17,224
|
|
|
19,194
|
|
||
|
Other
|
23,075
|
|
|
9,382
|
|
||
|
Construction in progress
|
$
|
417,124
|
|
|
$
|
372,508
|
|
Depreciation expense on property and equipment was
$212,675
,
$208,830
and
$207,367
for the
years ended
December 31, 2012
,
2011
and
2010
, respectively. We retired property and equipment of
$5,251
and
$12,158
during the
years ended
December 31, 2012
and
2011
.
Satellites
We currently own a fleet of
nine
orbiting satellites. The chart below provides certain information on these satellites:
|
Satellite Designation
|
Year Delivered
|
Estimated End of
Depreciable Life
|
||
|
FM-1
|
2000
|
|
2013
|
|
|
FM-2
|
2000
|
|
2013
|
|
|
FM-3
|
2000
|
|
2015
|
|
|
FM-5
|
2009
|
|
2024
|
|
|
XM-1
|
2001
|
|
2013
|
|
|
XM-2
|
2001
|
|
2013
|
|
|
XM-3
|
2005
|
|
2020
|
|
|
XM-4
|
2006
|
|
2021
|
|
|
XM-5
|
2010
|
|
2025
|
|
F-19
SIRIUS XM RADIO INC. AND SUBSIDIARIES
NOTES TO CONSOLIDATED FINANCIAL STATEMENTS - Continued
(Dollar amounts in thousands, unless otherwise stated)
We own
four
orbiting satellites for use in the Sirius system. We own
five
orbiting satellites for use in the XM system.
Four
of these satellites were manufactured by Boeing Satellite Systems International and
five
were manufactured by Space Systems/Loral.
During the
years ended
December 31, 2012
and
2011
, we capitalized expenditures, including interest, of
$32,893
and
$81,189
, respectively, related to the construction of our FM-6 satellite and related launch vehicle.
|
(10)
|
Related Party Transactions
|
We had the following related party balances at
December 31, 2012
and
2011
:
|
Related party current assets
|
Related party long-term assets
|
Related party current liabilities
|
Related party long-term liabilities
|
Related party long-term debt
|
|||||||||||||||||||||||||||||||||||
|
|
2012
|
2011
|
2012
|
|
2011
|
|
2012
|
|
2011
|
2012
|
2011
|
2012
|
2011
|
||||||||||||||||||||||||||
|
Liberty Media
|
$
|
—
|
|
|
$
|
—
|
|
|
$
|
757
|
|
|
$
|
1,212
|
|
|
$
|
3,980
|
|
$
|
9,722
|
|
|
$
|
—
|
|
|
$
|
—
|
|
|
$
|
208,906
|
|
|
$
|
328,788
|
|
|
|
Sirius XM Canada
|
13,167
|
|
|
14,702
|
|
|
44,197
|
|
|
53,741
|
|
|
2,776
|
|
4,580
|
|
|
18,966
|
|
|
21,741
|
|
|
—
|
|
|
—
|
|
|||||||||||
|
Total
|
$
|
13,167
|
|
|
$
|
14,702
|
|
|
$
|
44,954
|
|
|
$
|
54,953
|
|
|
$
|
6,756
|
|
$
|
14,302
|
|
|
$
|
18,966
|
|
|
$
|
21,741
|
|
|
$
|
208,906
|
|
|
$
|
328,788
|
|
|
Liberty Media
In February 2009, we entered into an Investment Agreement (the “Investment Agreement”) with an affiliate of Liberty Media Corporation, Liberty Radio, LLC (collectively, “Liberty Media”). Pursuant to the Investment Agreement, in March 2009 we issued to Liberty Radio, LLC
12,500,000
shares of our Convertible Perpetual Preferred Stock, Series B-1 (the “Series B Preferred Stock”), with a liquidation preference of
$0.001
per share in partial consideration for certain loans. Liberty Media has representatives on our board of directors. In September 2012, Liberty Media converted
6,249,900
shares of the Series B Preferred Stock into
1,293,467,684
shares of our common stock. For a discussion of subsequent events refer to Note 18.
Liberty Media has advised us that as of
December 31, 2012
and
2011
, respectively, it also owned the following:
|
|
December 31,
2012 |
|
December 31,
2011 |
||||
|
8.75% Senior Notes due 2015
|
$
|
150,000
|
|
|
$
|
150,000
|
|
|
9.75% Senior Secured Notes due 2015
|
—
|
|
|
50,000
|
|
||
|
13% Senior Notes due 2013
|
—
|
|
|
76,000
|
|
||
|
7% Exchangeable Senior Subordinated Notes due 2014
|
11,000
|
|
|
11,000
|
|
||
|
7.625% Senior Notes due 2018
|
50,000
|
|
|
50,000
|
|
||
|
Total principal debt
|
211,000
|
|
|
337,000
|
|
||
|
Less: discounts
|
2,094
|
|
|
8,212
|
|
||
|
Total carrying value of debt
|
$
|
208,906
|
|
|
$
|
328,788
|
|
During the
year ended
December 31, 2012
, we redeemed
$50,000
of our
9.75%
Senior Secured Notes due 2015 and
$76,000
of our
13%
Senior Notes due 2013 held by Liberty Media as part of the redemption of these Notes in their entirety.
As of
December 31, 2012
and
2011
, we recorded
$3,980
and
$9,722
, respectively, related to accrued interest with Liberty Media to Related party current liabilities. We recognized Interest expense associated with debt held by Liberty Media of
$30,931
,
$35,681
and
$40,169
for the
years ended
December 31, 2012
,
2011
and
2010
, respectively.
F-20
SIRIUS XM RADIO INC. AND SUBSIDIARIES
NOTES TO CONSOLIDATED FINANCIAL STATEMENTS - Continued
(Dollar amounts in thousands, unless otherwise stated)
Sirius XM Canada
In June 2011, Canadian Satellite Radio Holdings Inc. (“CSR”), the parent company of XM Canada, and Sirius Canada completed a transaction to combine their operations (“the Canada Merger”). The combined company operates as Sirius XM Canada. We own approximately
46,700,000
Class A shares on a converted basis of CSR, representing a
37.9%
equity interest and a
25.0%
voting interest.
We had the following related party current asset balances attributable to Sirius XM Canada at
December 31, 2012
and
2011
:
|
|
For the Years Ended December 31,
|
||||||
|
|
2012
|
|
2011
|
||||
|
Deferred programming costs and accrued interest
|
$
|
4,350
|
|
|
$
|
2,500
|
|
|
Dividends receivable
|
6,176
|
|
|
—
|
|
||
|
Chip set and other services reimbursement
|
2,641
|
|
|
7,404
|
|
||
|
Non-interest bearing note, principal
|
—
|
|
|
4,798
|
|
||
|
Total
|
$
|
13,167
|
|
|
$
|
14,702
|
|
In November 2012, Sirius XM Canada declared a special cash dividend of Cdn
$0.0825
per Class A shares of stock and Cdn
$0.0275
per Class B shares of stock for shareholders of record on November 28, 2012 in addition to a quarterly cash dividend of the same amount for shareholders of record on the same date. We received
$1,185
in December 2012 which was recorded as a reduction of our investment balance in Sirius XM Canada. As of
December 31, 2012
, we recorded a receivable for the remaining balance of the dividend which was due to us.
We provide Sirius XM Canada with chip sets and other services and we are reimbursed for these costs.
We had the following related party long-term asset balances attributable to Sirius XM Canada at
December 31, 2012
and
2011
:
|
|
For the Years Ended December 31,
|
||||||
|
|
2012
|
|
2011
|
||||
|
Non-interest bearing note, principal
|
$
|
404
|
|
|
$
|
410
|
|
|
Carrying value of host contract of debenture
|
3,877
|
|
|
3,490
|
|
||
|
Carrying value of embedded derivative of debenture
|
9
|
|
|
—
|
|
||
|
Investment balance
*
|
37,983
|
|
|
45,061
|
|
||
|
Deferred programming costs and accrued interest
|
1,924
|
|
|
4,780
|
|
||
|
Total
|
$
|
44,197
|
|
|
$
|
53,741
|
|
* The investment balance includes equity method goodwill and intangible assets of
$27,615
and
$28,589
for the
years ended
December 31, 2012
and
2011
, respectively.
As a result of the Canada Merger, we hold a non-interest bearing note issued by CSR. We also hold an investment in Cdn
$4,000
face value of
8%
convertible unsecured subordinated debentures issued by CSR, for which the embedded conversion feature is bifurcated from the host contract. The host contract is accounted for at fair value as an available-for-sale security with changes in fair value recorded to Accumulated other comprehensive income, net of tax. The embedded conversion feature is accounted for at fair value as a derivative with changes in fair value recorded in earnings as Interest and investment income (loss).
Our interest in Sirius XM Canada is accounted for under the equity method. The excess of the cost of our ownership interest in the equity of Sirius XM Canada over our share of the net assets is recognized as goodwill and intangible assets and is included in the carrying amount of our investment. Equity method goodwill is not amortized. We periodically evaluate this investment to determine if there has been an other than temporary decline below carrying value. Equity method intangible assets are amortized over their respective useful lives, which is recorded in Interest and investment income (loss).
F-21
SIRIUS XM RADIO INC. AND SUBSIDIARIES
NOTES TO CONSOLIDATED FINANCIAL STATEMENTS - Continued
(Dollar amounts in thousands, unless otherwise stated)
We had the following related party liability balances attributable to Sirius XM Canada at
December 31, 2012
and
2011
:
|
For the Years Ended December 31,
|
|||||||
|
|
2012
|
|
2011
|
||||
|
Carrying value of deferred revenue for NHL games
|
$
|
21,742
|
|
$
|
24,517
|
|
|
|
Amounts due to Sirius XM Canada
|
—
|
|
1,804
|
|
|||
|
Total current and long-term liabilities
|
$
|
21,742
|
|
|
$
|
26,321
|
|
In 2005, XM entered into agreements to provide XM Canada, now Sirius XM Canada after the Canada Merger, with the right to offer XM satellite radio service in Canada. The agreements have an initial
ten
year term and Sirius XM Canada has the unilateral option to extend the agreements for an additional
five
year term. We receive a
15%
royalty for all subscriber fees earned by XM Canada each month for its basic service and an activation fee for each gross activation of an XM Canada subscriber on XM’s system. Sirius XM Canada is obligated to pay us a total of
$70,300
for the rights to broadcast and market National Hockey League (“NHL”) games for a
ten
year term. We recognize these payments on a gross basis as a principal obligor pursuant to the provisions of ASC 605,
Revenue Recognition
. The estimated fair value of deferred revenue from XM Canada as of the Merger date was approximately
$34,000
, which is amortized on a straight-line basis through 2020, the end of the expected term of the agreements.
We recorded the following revenue from Sirius XM Canada as Other revenue in our consolidated statements of comprehensive income:
|
|
For the Years Ended December 31,
|
||||||
|
|
2012
|
2011 *
|
|||||
|
Royalty income
|
$
|
31,368
|
|
$
|
13,735
|
|
|
|
Amortization of Sirius XM Canada deferred income
|
2,776
|
|
1,388
|
|
|||
|
Licensing fee revenue
|
4,500
|
|
3,000
|
|
|||
|
Advertising reimbursements
|
833
|
|
417
|
|
|||
|
Total revenue from Sirius XM Canada
|
$
|
39,477
|
|
$
|
18,540
|
|
|
* Sirius XM Canada commenced operations in June 2011.
Our share of net earnings or losses of Sirius XM Canada are recorded to Interest and investment income (loss) in our consolidated statements of comprehensive income on a one month lag. Our share of Sirius XM Canada’s net income was
$554
and
$1,081
for the
years ended
December 31, 2012
and
2011
, respectively. We recorded amortization expense related to the equity method intangible assets of
$974
and
$1,556
for the
years ended
December 31, 2012
and
2011
, respectively.
Sirius Canada
We had an equity interest of
49%
in Sirius Canada until June 21, 2011 when the Canada Merger closed.
In 2005, we entered into a license and services agreement with Sirius Canada. Pursuant to such agreement, we are reimbursed for certain costs incurred to provide Sirius Canada service, including certain costs incurred for the production and distribution of radios, as well as information technology support costs. In consideration for the rights granted pursuant to this license and services agreement, we had the right to receive a royalty equal to a percentage of Sirius Canada’s gross revenues based on subscriber levels (ranging between
5%
and
15%
) and the number of Canadian-specific channels made available to Sirius Canada.
F-22
SIRIUS XM RADIO INC. AND SUBSIDIARIES
NOTES TO CONSOLIDATED FINANCIAL STATEMENTS - Continued
(Dollar amounts in thousands, unless otherwise stated)
We recorded the following revenue from Sirius Canada. Royalty income is included in Other revenue and dividend income is included in Interest and investment income (loss) in our consolidated statements of comprehensive income:
|
|
For the Years Ended December 31,
|
||||||
|
|
2011 *
|
2010
|
|||||
|
Royalty income
|
$
|
9,945
|
|
$
|
10,684
|
|
|
|
Dividend income
|
460
|
|
926
|
|
|||
|
Total revenue from Sirius Canada
|
$
|
10,405
|
|
$
|
11,610
|
|
|
* Sirius Canada combined with XM Canada in June 2011.
Receivables from royalty and dividend income were utilized to absorb a portion of our share of net losses generated by Sirius Canada. Total costs reimbursed by Sirius Canada were
$5,253
and
$12,185
for the
years ended
December 31, 2011
and
2010
, respectively.
Our share of net earnings or losses of Sirius Canada was recorded to Interest and investment income (loss) in our consolidated statements of comprehensive income on a one month lag. Our share of Sirius Canada’s net loss was
$9,717
and
$10,257
for the
years ended
December 31, 2011
and
2010
, respectively. The payments received from Sirius Canada in excess of carrying value were
$6,748
and
$10,281
for the
years ended
December 31, 2011
and
2010
, respectively.
XM Canada
We had an equity interest of
21.5%
in XM Canada until June 21, 2011 when the Canada Merger closed.
The Cdn
$45,000
standby credit facility we extended to XM Canada was paid and terminated as a result of the Canada Merger. We received
$38,815
in cash upon payment of this facility. As a result of the repayment of the credit facility and completion of the Canada Merger, we released a
$15,649
valuation allowance related to the absorption of our share of the net loss from our investment in XM Canada as of June 21, 2011.
We recorded the following revenue from XM Canada as Other revenue in our consolidated statements of comprehensive income:
|
|
For the Years Ended December 31,
|
||||||
|
|
2011 *
|
2010
|
|||||
|
Amortization of XM Canada deferred income
|
$
|
1,388
|
|
$
|
2,776
|
|
|
|
Subscriber and activation fee royalties
|
5,483
|
|
10,313
|
|
|||
|
Licensing fee revenue
|
3,000
|
|
4,500
|
|
|||
|
Advertising reimbursements
|
833
|
|
1,083
|
|
|||
|
Total revenue from XM Canada
|
$
|
10,704
|
|
$
|
18,672
|
|
|
* XM Canada combined with Sirius Canada in June 2011.
Our share of net earnings or losses of XM Canada was recorded to Interest and investment income (loss) in our consolidated statements of comprehensive income on a one month lag. Our share of XM Canada’s net loss was
$6,045
and
$12,147
for the
years ended
December 31, 2011
and
2010
, respectively.
F-23
SIRIUS XM RADIO INC. AND SUBSIDIARIES
NOTES TO CONSOLIDATED FINANCIAL STATEMENTS - Continued
(Dollar amounts in thousands, unless otherwise stated)
General Motors and American Honda
We have a long-term distribution agreement with General Motors Company ("GM"). GM had a representative on our board of directors and was considered a related party through May 27, 2010. During the term of the agreement, GM has agreed to distribute our service. We subsidize a portion of the cost of satellite radios and make incentive payments to GM when the owners of GM vehicles with factory- or dealer- installed satellite radios become self-paying subscribers. We also share with GM a percentage of the subscriber revenue attributable to GM vehicles with factory- or dealer- installed satellite radios. GM provides certain call-center related services directly to subscribers who are also GM customers for which we reimburse GM.
We make bandwidth available to OnStar LLC for audio and data transmissions to owners of enabled GM vehicles, regardless of whether the owner is a subscriber. OnStar's use of our bandwidth must be in compliance with applicable laws, must not compete or adversely interfere with our business, and must meet our quality standards. We also granted to OnStar a certain amount of time to use our studios on an annual basis and agreed to provide certain audio content for distribution on OnStar's services.
We have a long-term distribution agreement with American Honda. American Honda had a representative on our board of directors and was considered a related party through May 27, 2010. We have an agreement to make a certain amount of our bandwidth available to American Honda. American Honda's use of our bandwidth must be in compliance with applicable laws, must not compete or adversely interfere with our business, and must meet our quality standards. This agreement remains in effect so long as American Honda holds a certain amount of investment in us. We make incentive payments to American Honda for each purchaser or a Honda or Acura vehicle that becomes a self-paying subscriber and we share with American Honda a portion of the subscriber revenue attributable to Honda and Acura vehicles with installed satellite radios.
We recorded the following total related party revenue from GM and American Honda, primarily consisting of subscriber revenue, in connection with the agreements above:
|
|
For the Year Ended December 31,
|
||
|
|
2010 *
|
||
|
GM
|
$
|
12,759
|
|
|
American Honda
|
4,990
|
|
|
|
Total
|
$
|
17,749
|
|
*GM and American Honda were considered related parties through May 2010.
We have incurred the following related party expenses with GM and American Honda:
|
|
For the Year Ended December 31,
|
||||||
|
|
2010 *
|
||||||
|
GM
|
American Honda
|
||||||
|
Sales and marketing
|
$
|
13,374
|
|
$
|
—
|
|
|
|
Revenue share and royalties
|
15,823
|
|
3,167
|
|
|||
|
Subscriber acquisition costs
|
17,514
|
|
1,969
|
|
|||
|
Customer service and billing
|
125
|
|
—
|
|
|||
|
Interest expense, net of amounts capitalized
|
1,421
|
|
—
|
|
|||
|
Total
|
$
|
48,257
|
|
$
|
5,136
|
|
|
*GM and American Honda were considered related parties through May 2010.
F-24
SIRIUS XM RADIO INC. AND SUBSIDIARIES
NOTES TO CONSOLIDATED FINANCIAL STATEMENTS - Continued
(Dollar amounts in thousands, unless otherwise stated)
(11) Investments
Long Term Restricted Investments
Restricted investments relate to reimbursement obligations under letters of credit issued for the benefit of lessors of our office space. As of
December 31, 2012
and
2011
, our Long-term restricted investments were
$3,999
and
$3,973
, respectively. During the
year ended
December 31, 2011
,
$250
of obligations relating to these letters of credit were terminated and a new letter of credit agreement was entered into for
$826
for additional space.
Auction Rate Certificates
Auction rate certificates are long-term securities structured to reset their coupon rates by means of an auction. We accounted for our investment in auction rate certificates as available-for-sale securities. In January 2010, our investment in the auction rate certificates was called by the issuer at par plus accrued interest, or
$9,456
, resulting in a gain of
$425
in the
year ended
December 31, 2010
.
(12) Debt
Our debt consists of the following:
|
Conversion
Price
(per share)
|
December 31,
2012 |
December 31,
2011 |
|||||||||
|
8.75% Senior Notes due 2015
|
N/A
|
|
$
|
800,000
|
|
$
|
800,000
|
|
|||
|
Less: discount
|
(7,056
|
)
|
(9,753
|
)
|
|||||||
|
9.75% Senior Secured Notes due 2015
|
N/A
|
|
—
|
|
257,000
|
|
|||||
|
Less: discount
|
—
|
|
(8,356
|
)
|
|||||||
|
13% Senior Notes due 2013
|
N/A
|
|
—
|
|
778,500
|
|
|||||
|
Less: discount
|
—
|
|
(39,504
|
)
|
|||||||
|
7% Exchangeable Senior Subordinated Notes due 2014
|
$
|
1.841
|
|
550,000
|
|
550,000
|
|
||||
|
Less: discount
|
(4,112
|
)
|
(5,956
|
)
|
|||||||
|
7.625% Senior Notes due 2018
|
N/A
|
|
700,000
|
|
700,000
|
|
|||||
|
Less: discount
|
(9,647
|
)
|
(10,898
|
)
|
|||||||
|
5.25% Senior Notes due 2022
|
N/A
|
|
400,000
|
|
—
|
|
|||||
|
Less: discount
|
(5,826
|
)
|
—
|
|
|||||||
|
Other debt:
|
|||||||||||
|
Capital leases
|
N/A
|
|
11,861
|
|
2,941
|
|
|||||
|
Total debt
|
2,435,220
|
|
3,013,974
|
|
|||||||
|
Less: total current maturities non-related party
|
4,234
|
|
1,623
|
|
|||||||
|
Total long-term
|
2,430,986
|
|
3,012,351
|
|
|||||||
|
Less: related party
|
208,906
|
|
328,788
|
|
|||||||
|
Total long-term, excluding related party
|
$
|
2,222,080
|
|
$
|
2,683,563
|
|
|||||
8.75%
Senior Notes due 2015
In March 2010, we issued
$800,000
aggregate principal amount of
8.75%
Senior Notes due 2015 (the “
8.75%
Notes”). Interest is payable
semi-annually in arrears on April 1 and October 1 of each year
at a rate of
8.75%
per annum. The
8.75%
Notes mature on
April 1, 2015
. The
8.75%
Notes were issued for
$786,000
, resulting in an aggregate original issuance discount of
$14,000
. Substantially all of our domestic wholly-owned subsidiaries guarantee our obligations under the
8.75%
Notes on a senior unsecured basis.
F-25
SIRIUS XM RADIO INC. AND SUBSIDIARIES
NOTES TO CONSOLIDATED FINANCIAL STATEMENTS - Continued
(Dollar amounts in thousands, unless otherwise stated)
|
|
7%
Exchangeable Senior Subordinated Notes due 2014
|
In August 2008, we issued
$550,000
aggregate principal amount of
7%
Exchangeable Senior Subordinated Notes due 2014 (the “Exchangeable Notes”). The Exchangeable Notes are senior subordinated obligations and rank junior in right of payment to our existing and future senior debt and equally in right of payment with our existing and future senior subordinated debt. Substantially all of our domestic wholly-owned subsidiaries have guaranteed the Exchangeable Notes on a senior subordinated basis.
Interest is payable
semi-annually in arrears on June 1 and December 1 of each year
at a rate of
7%
per annum. The Exchangeable Notes mature on
December 1, 2014
. The Exchangeable Notes are exchangeable at any time at the option of the holder into shares of our common stock at an initial exchange rate of
533.3333
shares of common stock per
$1,000
principal amount of Exchangeable Notes, which is equivalent to an approximate exchange price of
$1.875
per share of common stock. If a holder of the Exchangeable Notes elects to exchange the notes in connection with a corporate transaction that constitutes a fundamental change, the exchange rate will be increased by an additional number of shares of common stock determined by the Indenture. Due to the special cash dividend in December 2012, the conversion rate increased to
543.1372
shares per common stock per
$1,000
principal amount. For a discussion of subsequent events refer to Note 18.
During the
year ended
December 31, 2012
, the common stock reserved for exchange in connection with the Exchangeable Notes were considered to be dilutive in our calculation of diluted net income per share.
7.625%
Senior Notes due 2018
In October 2010, we issued
$700,000
aggregate principal amount of
7.625%
Senior Notes due 2018 (the “
7.625%
Notes”). Interest is payable
semi-annually in arrears on May 1 and November 1 of each year
at a rate of
7.625%
per annum. The
7.625%
Notes mature on
November 1, 2018
. Substantially all of our domestic wholly-owned subsidiaries guarantee our obligations under the
7.625%
Notes.
5.25%
Senior Notes due 2022
In August 2012, we issued
$400,000
aggregate principal amount of
5.25%
Senior Notes due 2022 (the “
5.25%
Notes”). Interest is payable
semi-annually in arrears on February 15 and August 15 of each year
at a rate of
5.25%
per annum. The
5.25%
Notes mature on
August 15, 2022
. Substantially all of our domestic wholly-owned subsidiaries guarantee our obligations under the
5.25%
Notes.
Senior Secured Revolving Credit Facility
In December 2012, we entered into a
five
-year Senior Secured Revolving Credit Facility (the "Credit Facility") with a syndicate of financial institutions for
$1,250,000
. The Credit Facility is secured by substantially all our assets and the assets of our subsidiaries. The proceeds of loans under the Credit Facility will be used for working capital and other general corporate purposes, including financing acquisitions, share repurchases and dividends. Interest on borrowings is payable on a quarterly basis and accrues at a rate based on LIBOR plus an applicable rate. We are also required to pay a variable fee on the average daily unused portion of the Credit Facility which is currently
0.30%
per annum and is payable on a quarterly basis. The Credit Facility contains customary covenants, including a maintenance covenant.
As of
December 31, 2012
, we have not drawn on the Credit Facility.
Retired Debt
9.75%
Senior Secured Notes due 2015
In August 2009, we issued
$257,000
aggregate principal amount of
9.75%
Senior Secured Notes due
September 1, 2015
(the “
9.75%
Notes”). The
9.75%
Notes were issued for
$244,292
, resulting in an aggregate original issuance discount of
$12,708
. Substantially all of our domestic wholly-owned subsidiaries guaranteed our obligations under the
9.75%
Notes. The
9.75%
Notes and related guarantees were secured by first-priority liens on substantially all of our assets and the assets of the guarantors.
During the
year ended
December 31, 2012
, we purchased
$257,000
in aggregate principal amount of the
9.75%
Notes for an aggregate purchase price, including interest, of
$281,698
. We recognized an aggregate loss on the extinguishment of the
F-26
SIRIUS XM RADIO INC. AND SUBSIDIARIES
NOTES TO CONSOLIDATED FINANCIAL STATEMENTS - Continued
(Dollar amounts in thousands, unless otherwise stated)
9.75%
Notes of
$22,184
during the
year ended
December 31, 2012
, consisting primarily of unamortized discount, deferred financing fees and repayment premium, to Loss on extinguishment of debt and credit facilities, net.
13%
Senior Notes due 2013
In July 2008, we issued
$778,500
aggregate principal amount of
13%
Senior Notes due 2013 (the “
13%
Notes”). The
13%
Notes would have matured on
August 1, 2013
. Substantially all of our domestic wholly-owned subsidiaries guaranteed our obligations under the
13%
Notes.
During the
year ended
December 31, 2012
, we purchased
$778,500
, in aggregate principal amount of the
13%
Notes for an aggregate purchase price, including interest, of
$879,133
. We recognized an aggregate loss on the extinguishment of the
13%
Notes of
$110,542
during the
year ended
December 31, 2012
, consisting primarily of unamortized discount, deferred financing fees and repayment premium, to Loss on extinguishment of debt and credit facilities, net.
3.25%
Convertible Notes due 2011
In 2011, we purchased
$168,113
of our then outstanding
3.25%
Convertible Notes due 2011 (the "
3.25%
Notes") at prices between
100.75%
and
101%
of the principal amount plus accrued interest. We recognized a loss on extinguishment of debt for the
3.25%
Notes of
$2,291
for the
year ended
December 31, 2011
, which consisted primarily of cash premiums paid, unamortized discount and deferred financing fees. The remainder of the
3.25%
Notes was paid upon maturity in the fourth quarter of 2011.
11.25%
Senior Secured Notes due 2013
In October 2010, we purchased
$489,065
in aggregate principal amount of our
11.25%
Senior Secured Notes due 2013 (the "
11.25%
Notes"). The aggregate purchase price for the
11.25%
Notes was
$567,927
. We recorded an aggregate loss on extinguishment of the
11.25%
Notes of
$85,216
, consisting primarily of unamortized discount, deferred financing fees and repayment premium to Loss on extinguishment of debt and credit facilities, net, in our 2010 consolidated statements of comprehensive income. The remainder of the
11.25%
Notes of
$36,685
was purchased in January 2011 for an aggregate purchase price of
$40,376
. A loss from extinguishment of debt of
$4,915
associated with this purchase was recorded during the year ended
December 31, 2011
.
Covenants and Restrictions
Our debt generally requires compliance with certain covenants that restrict our ability to, among other things, (i) incur additional indebtedness unless our consolidated leverage would be no greater than
5.0
times consolidated operating cash flow after the incurrence of the indebtedness, (ii) incur liens, (iii) pay dividends or make certain other restricted payments, investments or acquisitions, (iv) enter into certain transactions with affiliates, (v) merge or consolidate with another person, (vi) sell, assign, lease or otherwise dispose of all or substantially all of our assets, and (vii) make voluntary prepayments of certain debt, in each case subject to exceptions. We also must comply with a maintenance covenant that we not exceed a total leverage ratio, calculated as total consolidated debt to consolidated operating cash flow, of
5.0
to
1.0
.
Under our debt agreements, the following generally constitute an event of default: (i) a default in the payment of interest; (ii) a default in the payment of principal; (iii) failure to comply with covenants; (iv) failure to pay other indebtedness after final maturity or acceleration of other indebtedness exceeding a specified amount; (v) certain events of bankruptcy; (vi) a judgment for payment of money exceeding a specified aggregate amount; and (vii) voidance of subsidiary guarantees, subject to grace periods where applicable. If an event of default occurs and is continuing, our debt could become immediately due and payable.
At
December 31, 2012
and
2011
, we were in compliance with our debt covenants.
F-27
SIRIUS XM RADIO INC. AND SUBSIDIARIES
NOTES TO CONSOLIDATED FINANCIAL STATEMENTS - Continued
(Dollar amounts in thousands, unless otherwise stated)
|
(13)
|
Stockholders’ Equity
|
Common Stock, par value
$0.001
per share
We were authorized to issue up to
9,000,000,000
shares of common stock as of
December 31, 2012
and
2011
. There were
5,262,440,085
and
3,753,201,929
shares of common stock issued and outstanding as of
December 31, 2012
and
2011
, respectively.
As of
December 31, 2012
, approximately
1,885,629,000
shares of common stock were reserved for issuance in connection with outstanding convertible debt, preferred stock, warrants, incentive stock awards and common stock to be granted to third parties upon satisfaction of performance targets.
Special Dividend Declared,
$0.05
per share
On December 5, 2012, we declared a special cash dividend of
$0.05
per share on our outstanding common stock and preferred stock, on an as-converted basis, to stockholders of record as of the close of business on December 18, 2012. The dividend was paid in cash on December 28, 2012 in the amount of
$327,062
.
Stock Repurchase Program
In December 2012, we announced that our board of directors approved a
$2,000,000
common stock repurchase program. Shares of common stock may be purchased from time to time on the open market or in privately negotiated transactions. As of December 31, 2012, we have not repurchased any shares.
Share Lending Arrangements
To facilitate the offering of the Exchangeable Notes, we entered into share lending agreements with Morgan Stanley Capital Services Inc. (“MS”) and UBS AG London Branch (“UBS”) in July 2008, under which we loaned MS and UBS an aggregate of
262,400,000
shares of our common stock in exchange for a fee of
$0.001
per share. During the third quarter of 2009, MS returned to us
60,000,000
shares of our common stock borrowed. In October 2011, MS and UBS returned the remaining
202,400,000
shares loaned. The returned shares were retired upon receipt and removed from outstanding common stock. The share lending agreements have been terminated. Under GAAP, the borrowed shares were not considered outstanding for the purpose of computing and reporting our net income per common share.
We recorded interest expense related to the amortization of the costs associated with the share lending arrangement and other issuance costs for our Exchangeable Notes of
$12,402
,
$11,189
and
$10,095
for the
years ended
December 31, 2012
,
2011
and
2010
, respectively. As of
December 31, 2012
, the unamortized balance of the debt issuance costs was
$27,652
, with
$27,099
recorded in Deferred financing fees, net, and
$553
recorded in Long-term related party assets. As of
December 31, 2011
, the unamortized balance of the debt issuance costs was
$40,054
, with
$39,253
recorded in Deferred financing fees, net, and
$801
recorded in Long-term related party assets. These costs will continue to be amortized until the debt is terminated.
Other
In January 2004, Sirius Satellite Radio Inc. signed a
seven
-year agreement with a sports programming provider which expired in February 2011. Upon execution of this agreement, Sirius delivered
15,173,070
shares of common stock valued at
$40,967
to that programming provider. These shares of common stock were subject to transfer restrictions which lapsed over time. We recognized share-based payment expense associated with these shares of
$1,568
and
$5,852
in the
years ended
December 31, 2011
and
2010
, respectively. As of
December 31, 2011
, the value of the common stock was fully expensed.
Preferred Stock, par value
$0.001
per share
We were authorized to issue up to
50,000,000
shares of undesignated preferred stock as of
December 31, 2012
and
2011
. There were
no
shares of Series A Convertible Preferred Stock (“Series A Preferred Stock”) issued and outstanding as of
December 31, 2012
and
2011
.
There were
6,250,100
and
12,500,000
shares of Series B Preferred Stock issued and outstanding as of
December 31, 2012
and
2011
, respectively. In September 2012, Liberty Media converted
6,249,900
shares of the Series B Preferred Stock into
1,293,467,684
shares of common stock. The Series B Preferred Stock is convertible into shares of our common stock at the rate of
206.9581409
shares of common stock for each share of Series B Preferred Stock, representing approximately
20%
of our
F-28
SIRIUS XM RADIO INC. AND SUBSIDIARIES
NOTES TO CONSOLIDATED FINANCIAL STATEMENTS - Continued
(Dollar amounts in thousands, unless otherwise stated)
outstanding shares of common stock (after giving effect to such conversion). As the holder of the Series B Preferred Stock, Liberty Radio LLC is entitled to a number of votes equal to the number of shares of our common stock into which such shares of Series B Preferred Stock are convertible. Liberty Radio LLC will also receive dividends and distributions ratably with our common stock, on an as-converted basis. With respect to dividend rights, the Series B Preferred Stock ranks evenly with our common stock and each other class or series of our equity securities not expressly provided as ranking senior to the Series B Preferred Stock. With respect to liquidation rights, the Series B Preferred Stock ranks evenly with each other class or series of our equity securities not expressly provided as ranking senior to the Series B Preferred Stock, and ranks senior to our common stock. For a discussion of subsequent events refer to Note 18.
Warrants
We have issued warrants to purchase shares of common stock in connection with distribution, programming and satellite purchase agreements. As of
December 31, 2012
and
2011
, approximately
18,455,000
and
22,506,000
warrants to acquire an equal number of shares of common stock were outstanding and fully vested. Warrants were excluded from the calculation of diluted net income per common share as the effect would have been anti-dilutive for the year ended
December 31, 2012
. The warrants expire at various times through 2015. At
December 31, 2012
and
2011
, the weighted average exercise price of outstanding warrants was
$2.55
and
$2.63
per share, respectively. We did not incur warrant related expenses during the
years ended
December 31, 2012
,
2011
or
2010
.
|
Number of Warrants Outstanding
|
|||||||||
|
December 31,
|
|||||||||
|
(warrants in thousands)
|
Average Exercise Price
|
Expiration Date
|
2012
|
2011
|
|||||
|
NFL
|
$2.50
|
March 2015
|
16,667
|
|
16,718
|
|
|||
|
Ford
|
$3.00
|
October 2012
|
—
|
|
4,000
|
|
|||
|
Other distributors and programming providers
|
$3.00
|
June 2014
|
1,788
|
|
1,788
|
|
|||
|
Total
|
18,455
|
|
22,506
|
|
|||||
In February 2011, Daimler AG exercised
16,500,000
warrants to purchase shares of common stock on a net settlement basis, resulting in the issuance of
7,122,951
shares of our common stock. In October 2012, the
4,000,000
Ford warrants expired.
Rights Plan
In April 2009, our board of directors adopted a rights plan. The terms of the rights and the rights plan are set forth in a Rights Agreement dated as of April 29, 2009 (the “Rights Plan”). The Rights Plan was intended to act as a deterrent to any person or group acquiring
4.9%
or more of our outstanding common stock (assuming for purposes of this calculation that all of our outstanding convertible preferred stock was converted into common stock) without the approval of our board of directors. The Rights Plan expired on August 1, 2011.
|
(14)
|
Benefit Plans
|
We recognized share-based payment expense of
$63,822
,
$51,622
and
$54,585
for the
years ended
December 31, 2012
,
2011
and
2010
, respectively.
2009 Long-Term Stock Incentive Plan
In May 2009, our stockholders approved the Sirius XM Radio Inc. 2009 Long-Term Stock Incentive Plan (the “2009 Plan”). Employees, consultants and members of our board of directors are eligible to receive awards under the 2009 Plan. The 2009 Plan provides for the grant of stock options, restricted stock, restricted stock units and other stock-based awards that the compensation committee of our board of directors may deem appropriate. Vesting and other terms of stock-based awards are set forth in the agreements with the individuals receiving the awards. Stock-based awards granted under the 2009 Plan are generally subject to a vesting requirement. Stock-based awards generally expire
ten
years from the date of grant. Each restricted stock unit entitles the holder to receive
one
share of common stock upon vesting. As of
December 31, 2012
, approximately
143,243,000
shares of common stock were available for future grants under the 2009 Plan.
F-29
SIRIUS XM RADIO INC. AND SUBSIDIARIES
NOTES TO CONSOLIDATED FINANCIAL STATEMENTS - Continued
(Dollar amounts in thousands, unless otherwise stated)
Other Plans
We maintain
four
other share-based benefit plans — the XM 2007 Stock Incentive Plan, the Amended and Restated Sirius Satellite Radio 2003 Long-Term Stock Incentive Plan, the XM 1998 Shares Award Plan and the XM Talent Option Plan. No further awards may be made under these plans.
The following table summarizes the weighted-average assumptions used to compute the fair value of options granted to employees and members of our board of directors:
|
|
For the Years Ended December 31,
|
||||
|
|
2012
|
2011
|
2010
|
||
|
Risk-free interest rate
|
0.8%
|
1.1%
|
1.7%
|
||
|
Expected life of options — years
|
5.06
|
5.27
|
5.28
|
||
|
Expected stock price volatility
|
49%
|
68%
|
85%
|
||
|
Expected dividend yield
|
0%
|
0%
|
0%
|
||
We do not intend to pay regular dividends on our common stock. Accordingly, the dividend yield percentage used in the Black-Scholes-Merton option value is set to zero for all periods.
There were
no
options granted to third parties, other than non-employee members of our board of directors, during the
years ended
December 31, 2012
,
2011
and
2010
.
The following table summarizes stock option activity under our share-based payment plans for the
years ended
December 31, 2012
,
2011
and
2010
(options in thousands):
|
Options
|
Weighted-
Average
Exercise
Price (1)
|
Weighted-Average
Remaining
Contractual Term
(Years)
|
Aggregate
Intrinsic
Value
|
|||||||||
|
Outstanding as of January 1, 2010
|
364,792
|
|
$
|
1.44
|
|
|||||||
|
Granted
|
71,179
|
|
$
|
0.97
|
|
|||||||
|
Exercised
|
(19,360
|
)
|
$
|
0.56
|
|
|||||||
|
Forfeited, cancelled or expired
|
(14,741
|
)
|
$
|
3.58
|
|
|||||||
|
Outstanding as of December 31, 2010
|
401,870
|
|
$
|
1.32
|
|
|||||||
|
Granted
|
77,450
|
|
$
|
1.80
|
|
|||||||
|
Exercised
|
(13,300
|
)
|
$
|
0.87
|
|
|||||||
|
Forfeited, cancelled or expired
|
(26,440
|
)
|
$
|
4.15
|
|
|||||||
|
Outstanding as of December 31, 2011
|
439,580
|
|
$
|
1.25
|
|
|||||||
|
Granted
|
58,626
|
|
$
|
2.53
|
|
|||||||
|
Exercised
|
(214,199
|
)
|
$
|
0.59
|
|
|||||||
|
Forfeited, cancelled or expired
|
(9,495
|
)
|
$
|
3.09
|
|
|||||||
|
Outstanding as of December 31, 2012
|
274,512
|
|
$
|
1.92
|
|
7.29
|
$
|
320,751
|
|
|||
|
Exercisable as of December 31, 2012
|
93,822
|
|
$
|
2.53
|
|
5.19
|
$
|
89,517
|
|
|||
|
(1)
|
The weighted-average exercise price for options outstanding and exercisable as of December 31, 2012 in the table above have been adjusted to reflect the reduction to the exercise price related to the December 28, 2012 special cash dividend.
|
The weighted average grant date fair value of options granted during the
years ended
December 31, 2012
,
2011
and
2010
was
$1.09
,
$1.04
and
$0.67
, respectively. The total intrinsic value of stock options exercised during the
years ended
December 31, 2012
,
2011
and
2010
was
$399,794
,
$13,408
and
$13,261
, respectively.
On December 5, 2012, we declared a special cash dividend of
$0.05
per share on our outstanding common stock and preferred stock, on an as-converted basis, to stockholders of record as of the close of business on December 18, 2012. The dividend was paid in cash on December 28, 2012. The compensation committee of our board of directors, which administers
F-30
SIRIUS XM RADIO INC. AND SUBSIDIARIES
NOTES TO CONSOLIDATED FINANCIAL STATEMENTS - Continued
(Dollar amounts in thousands, unless otherwise stated)
our stock incentive plans, adjusted the exercise price of stock options issued under the plans by decreasing the exercise price by
$0.05
per share. The stock options outstanding as of December 18, 2012 were adjusted on December 28, 2012. This adjustment did not result in any additional incremental share-based payment expense being recognized.
We recognized share-based payment expense associated with stock options of
$60,299
,
$48,038
and
$44,833
for the
years ended
December 31, 2012
,
2011
and
2010
, respectively.
The following table summarizes the nonvested restricted stock and restricted stock unit activity under our share-based payment plans for the
years ended
December 31, 2012
,
2011
and
2010
(shares in thousands):
|
Shares
|
Grant Date Fair Value
|
|||||
|
Nonvested as of January 1, 2010
|
6,919
|
|
$
|
2.65
|
|
|
|
Granted
|
—
|
|
$
|
—
|
|
|
|
Vested restricted stock awards
|
(4,039
|
)
|
$
|
2.85
|
|
|
|
Vested restricted stock units
|
(192
|
)
|
$
|
2.92
|
|
|
|
Forfeited
|
(291
|
)
|
$
|
2.72
|
|
|
|
Nonvested as of December 31, 2010
|
2,397
|
|
$
|
2.57
|
|
|
|
Granted
|
—
|
|
$
|
—
|
|
|
|
Vested restricted stock awards
|
(1,854
|
)
|
$
|
3.30
|
|
|
|
Vested restricted stock units
|
(101
|
)
|
$
|
3.08
|
|
|
|
Forfeited
|
(21
|
)
|
$
|
3.05
|
|
|
|
Nonvested as of December 31, 2011
|
421
|
|
$
|
1.46
|
|
|
|
Granted
|
8
|
|
$
|
—
|
|
|
|
Vested restricted stock awards
|
—
|
|
$
|
—
|
|
|
|
Vested restricted stock units
|
—
|
|
$
|
—
|
|
|
|
Forfeited
|
—
|
|
$
|
—
|
|
|
|
Nonvested as of December 31, 2012
|
429
|
|
$
|
1.46
|
|
|
The total intrinsic value of restricted stock and restricted stock units that vested during the
years ended
December 31, 2012
,
2011
and
2010
was
$0
,
$3,178
and
$3,927
, respectively.
We recognized share-based payment expense associated with restricted stock units and shares of restricted stock of
$0
,
$543
and
$7,397
for the
years ended
December 31, 2012
,
2011
and
2010
, respectively.
No restricted stock units were granted during 2011 or 2010. In connection with the special cash dividend paid in December 2012, we granted
8,000
incremental restricted stock units to prevent the economic dilution of the holders of our restricted stock units. This grant did not result in any additional incremental share-based payment expense being recognized.
Total unrecognized compensation costs related to unvested share-based payment awards for stock options and restricted stock units and shares granted to employees and members of our board of directors at
December 31, 2012
and
December 31, 2011
, net of estimated forfeitures, was
$129,010
and
$129,983
, respectively. The total unrecognized compensation costs at
December 31, 2012
are expected to be recognized over a weighted-average period of
three
years.
401(k) Savings Plan
We sponsor the Sirius XM Radio 401(k) Savings Plan (the “Sirius XM Plan”) for eligible employees.
The Sirius XM Plan allows eligible employees to voluntarily contribute from
1%
to
50%
of their pre-tax eligible earnings, subject to certain defined limits. We match
50% of an employee’s voluntary contributions, up to 6%
of an employee’s pre-tax salary. For the years ended
December 31, 2012
,
2011
and
2010
, these matching contributions were made in the form of
F-31
SIRIUS XM RADIO INC. AND SUBSIDIARIES
NOTES TO CONSOLIDATED FINANCIAL STATEMENTS - Continued
(Dollar amounts in thousands, unless otherwise stated)
shares of our common stock. Employer matching contributions under the Sirius XM Plan vest at a rate of
33.33%
for each year of employment and are fully vested after
three
years of employment for all current and future contributions. Share-based payment expense resulting from the matching contribution to the Sirius XM Plan was
$3,523
,
$3,041
and
$2,356
for the
years ended
December 31, 2012
,
2011
and
2010
, respectively.
We may also elect to contribute to the profit sharing portion of the Sirius XM Plan based upon the total eligible compensation of eligible participants. These additional contributions are determined by the compensation committee of our board of directors. We did not contribute to the profit sharing portion of the Sirius XM Plan in 2012, 2011 or 2010.
|
(15)
|
Commitments and Contingencies
|
The following table summarizes our expected contractual cash commitments as of
December 31, 2012
:
|
2013
|
2014
|
2015
|
2016
|
2017
|
Thereafter
|
Total
|
|||||||||||||||||||||
|
Long-term debt obligations
|
$
|
4,234
|
|
$
|
553,406
|
|
$
|
803,355
|
|
$
|
866
|
|
$
|
—
|
|
$
|
1,100,000
|
|
$
|
2,461,861
|
|
||||||
|
Cash interest payments
|
186,552
|
|
186,918
|
|
113,285
|
|
78,193
|
|
78,865
|
|
158,375
|
|
802,188
|
|
|||||||||||||
|
Satellite and transmission
|
67,170
|
|
27,620
|
|
13,874
|
|
4,351
|
|
3,484
|
|
20,334
|
|
136,833
|
|
|||||||||||||
|
Programming and content
|
219,450
|
|
187,964
|
|
173,959
|
|
23,613
|
|
11,125
|
|
—
|
|
616,111
|
|
|||||||||||||
|
Marketing and distribution
|
20,825
|
|
12,650
|
|
6,385
|
|
3,878
|
|
568
|
|
381
|
|
44,687
|
|
|||||||||||||
|
Satellite incentive payments
|
9,211
|
|
12,377
|
|
11,478
|
|
12,311
|
|
13,259
|
|
69,066
|
|
127,702
|
|
|||||||||||||
|
Operating lease obligations
|
38,434
|
|
32,190
|
|
34,805
|
|
24,727
|
|
18,568
|
|
206,426
|
|
355,150
|
|
|||||||||||||
|
Other
|
59,848
|
|
21,534
|
|
3,572
|
|
1,071
|
|
278
|
|
23
|
|
86,326
|
|
|||||||||||||
|
Total
(1)
|
$
|
605,724
|
|
$
|
1,034,659
|
|
$
|
1,160,713
|
|
$
|
149,010
|
|
$
|
126,147
|
|
$
|
1,554,605
|
|
$
|
4,630,858
|
|
||||||
|
(1)
|
The table does not include our reserve for uncertain tax positions, which at
December 31, 2012
totaled
$1,432
, as the specific timing of any cash payments cannot be projected with reasonable certainty.
|
Long-term debt obligations.
Long-term debt obligations include principal payments on outstanding debt and capital lease obligations.
Cash interest payments.
Cash interest payments include interest due on outstanding debt and capital lease payments through maturity.
Satellite and transmission.
We have entered into agreements with third parties to operate and maintain the off-site satellite telemetry, tracking and control facilities and certain components of our terrestrial repeater networks. We have also entered into various agreements to design and construct a satellite and related launch vehicle for use in our systems.
Programming and content.
We have entered into various programming agreements. Under the terms of these agreements, our obligations include fixed payments, advertising commitments and revenue sharing arrangements.
Marketing and distribution.
We have entered into various marketing, sponsorship and distribution agreements to promote our brand and are obligated to make payments to sponsors, retailers, automakers and radio manufacturers under these agreements. Certain programming and content agreements also require us to purchase advertising on properties owned or controlled by the licensors. We also reimburse automakers for certain engineering and development costs associated with the incorporation of satellite radios into vehicles they manufacture. In addition, in the event certain new products are not shipped by a distributor to its customers within
90
days of the distributor’s receipt of goods, we have agreed to purchase and take title to
the product.
Satellite incentive payments.
Boeing Satellite Systems International, Inc., the manufacturer of
four
of XM’s in-orbit satellites, may be en
titled to future in-orbit performance payments with respect to
two
of XM’s satellites. As of
December 31, 2012
, we have accrued
$27,832
related to contingent in-orbit performance payments for our XM-3 and XM-4 satellites based on expected operating performance over their
fifteen
-year design life. Boeing may also be entitled to an additional
$10,000
if our XM-4 satellite continues to operate above baseline specifications during the
five
years beyond the satellite’s
fifteen
-year design life.
F-32
SIRIUS XM RADIO INC. AND SUBSIDIARIES
NOTES TO CONSOLIDATED FINANCIAL STATEMENTS - Continued
(Dollar amounts in thousands, unless otherwise stated)
Space Systems/Loral, a manufacturer of our in-orbit satellites, may be entitled to future in-orbit performance payments. As of
December 31, 2012
, we have accrued
$8,663
and
$21,450
related to contingent performance payments for our FM-5 and XM-5 satellites, respectively, based on their expected operating performance over their
fifteen
-year design life.
Operating lease obligations.
We have entered into cancelable and non-cancelable operating leases for office space, equipment and terrestrial repeaters. These leases provide for minimum lease payments, additional operating expense charges, leasehold improvements and rent escalations that have initial terms ranging from
one
to
fifteen
years, and certain leases that have options to renew. The effect of the rent holidays and rent concessions are recognized on a straight-line basis over the lease term, including reasonably assured renewal periods. Total rent recognized in connection with leases for the
years ended
December 31, 2012
,
2011
and
2010
was
$37,474
,
$34,143
and
$36,652
, respectively.
Other.
We have entered into various agreements with third parties for general operating purposes. In addition to the minimum contractual cash commitments described above, we have entered into agreements with other variable cost arrangements. These future costs are dependent upon many factors, including subscriber growth, and are difficult to anticipate; however, these costs may be substantial. We may enter into additional programming, distribution, marketing and other agreements that contain similar variable cost provisions.
We do not have any other significant off-balance sheet financing arrangements that are reasonably likely to have a material effect on our financial condition, results of operations, liquidity, capital expenditures or capital resources.
Legal Proceedings
In the ordinary course of business, we are a defendant or party to various claims and lawsuits, including those discussed below. These claims are at various stages of arbitration or adjudication.
State Consumer Investigations
. A Multistate Working Group of
31
State Attorneys General, led by the Attorney General of the State of Ohio, is investigating certain of our consumer practices. The investigation focuses on practices relating to the cancellation of subscriptions; automatic renewal of subscriptions; charging, billing, collecting, and refunding or crediting of payments from consumers; and soliciting customers.
A separate investigation into our consumer practices is being conducted by the Attorneys General of the State of Florida and the State of New York. We are cooperating with these investigations and believe our consumer practices comply with all applicable federal and state laws and regulations.
One Twelve, Inc. and Don Buchwald v. Sirius XM Radio Inc.
In March 2011, One Twelve, Inc., Howard Stern's production company, and Don Buchwald, Stern's agent, commenced an action against us in the Supreme Court of the State of New York, County of New York. The action alleged that, upon the Merger, we failed to honor our obligations under the performance-based compensation provisions of our prior agreement dated October 2004 with One Twelve and Buchwald, as agent; One Twelve and Buchwald each assert a claim of breach of contract. In April 2012, the Court granted our motion for summary judgment and dismissed with prejudice the suit. The Court found the agreement unambiguous. One Twelve and Buchwald have appealed this decision.
Other Matters
. In the ordinary course of business, we are a defendant in various other lawsuits and arbitration proceedings, including derivative actions; actions filed by subscribers, both on behalf of themselves and on a class action basis; former employees; parties to contracts or leases; and owners of patents, trademarks, copyrights or other intellectual property. None of these other actions are, in our opinion, likely to have a material adverse effect on our business, financial condition or results of operations.
F-33
SIRIUS XM RADIO INC. AND SUBSIDIARIES
NOTES TO CONSOLIDATED FINANCIAL STATEMENTS - Continued
(Dollar amounts in thousands, unless otherwise stated)
(16) Income Taxes
Our income tax expense consisted of the following:
|
For the Years Ended December 31,
|
|||||||||||
|
2012
|
2011
|
2010
|
|||||||||
|
Current taxes:
|
|||||||||||
|
Federal
|
$
|
—
|
|
$
|
—
|
|
$
|
—
|
|
||
|
State
|
1,319
|
|
3,229
|
|
942
|
|
|||||
|
Foreign
|
2,265
|
|
2,741
|
|
1,370
|
|
|||||
|
Total current taxes
|
3,584
|
|
5,970
|
|
2,312
|
|
|||||
|
Deferred taxes:
|
|
|
|||||||||
|
Federal
|
(2,729,823
|
)
|
3,991
|
|
4,163
|
|
|||||
|
State
|
(271,995
|
)
|
4,273
|
|
(1,855
|
)
|
|||||
|
Total deferred taxes
|
(3,001,818
|
)
|
8,264
|
|
2,308
|
|
|||||
|
Total income tax (benefit) expense
|
$
|
(2,998,234
|
)
|
|
$
|
14,234
|
|
|
$
|
4,620
|
|
The following table indicates the significant elements contributing to the difference between the federal tax (benefit) expense at the statutory rate and at our effective rate:
|
For the Years Ended December 31,
|
|||||||||||
|
2012
|
2011
|
2010
|
|||||||||
|
Federal tax expense, at statutory rate
|
$
|
166,064
|
|
$
|
154,418
|
|
$
|
16,678
|
|
||
|
State income tax expense, net of federal benefit
|
16,606
|
|
15,751
|
|
1,620
|
|
|||||
|
State income rate changes
|
2,251
|
|
3,851
|
|
(2,252
|
)
|
|||||
|
Non-deductible expenses
|
477
|
|
457
|
|
4,130
|
|
|||||
|
Change in valuation allowance
|
(3,195,651
|
)
|
(166,452
|
)
|
(21,749
|
)
|
|||||
|
Other, net
|
12,019
|
|
6,209
|
|
6,193
|
|
|||||
|
Income tax (benefit) expense
|
$
|
(2,998,234
|
)
|
$
|
14,234
|
|
$
|
4,620
|
|
||
F-34
SIRIUS XM RADIO INC. AND SUBSIDIARIES
NOTES TO CONSOLIDATED FINANCIAL STATEMENTS - Continued
(Dollar amounts in thousands, unless otherwise stated)
The tax effects of temporary differences that give rise to significant portions of the deferred tax assets and deferred tax liabilities are represented below:
|
For the Years Ended December 31,
|
|||||||
|
2012
|
2011
|
||||||
|
Deferred tax assets:
|
|||||||
|
Net operating loss carryforwards
|
$
|
2,493,239
|
|
$
|
3,025,621
|
|
|
|
GM payments and liabilities
|
80,742
|
|
194,976
|
|
|||
|
Deferred revenue
|
511,700
|
|
410,812
|
|
|||
|
Severance accrual
|
46
|
|
21
|
|
|||
|
Accrued bonus
|
23,798
|
|
17,296
|
|
|||
|
Expensed costs capitalized for tax
|
26,569
|
|
35,227
|
|
|||
|
Loan financing costs
|
428
|
|
1,575
|
|
|||
|
Investments
|
39,915
|
|
40,880
|
|
|||
|
Stock based compensation
|
64,636
|
|
89,862
|
|
|||
|
Other
|
34,705
|
|
42,924
|
|
|||
|
Total deferred tax assets
|
3,275,778
|
|
3,859,194
|
|
|||
|
Deferred tax liabilities:
|
|
|
|||||
|
Depreciation of property and equipment
|
(185,007
|
)
|
(405,892
|
)
|
|||
|
FCC license
|
(772,550
|
)
|
(781,742
|
)
|
|||
|
Other intangible assets
|
(165,227
|
)
|
(188,988
|
)
|
|||
|
Other
|
—
|
|
(189
|
)
|
|||
|
Total deferred tax liabilities
|
(1,122,784
|
)
|
(1,376,811
|
)
|
|||
|
Net deferred tax assets before valuation allowance
|
2,152,994
|
|
2,482,383
|
|
|||
|
Valuation allowance
|
(9,835
|
)
|
(3,360,740
|
)
|
|||
|
Total net deferred tax asset (liability)
|
$
|
2,143,159
|
|
$
|
(878,357
|
)
|
|
The ultimate realization of deferred tax assets is dependent upon the generation of future taxable income during the periods in which those temporary differences can be carried forward under tax law. Management's evaluation of the realizability of deferred tax assets considers both positive and negative evidence, including historical financial performance, scheduled reversal of deferred tax assets and liabilities, projected taxable income and tax planning strategies in making this assessment. The weight given to the potential effects of positive and negative evidence is based on the extent to which it can be objectively verified.
For the year ended
December 31, 2012
, our deferred tax asset valuation allowance decreased by
$3,350,905
in response to cumulative positive evidence in
2012
which outweighed the historical negative evidence from our emergence from cumulative losses in recent years and updated assessments regarding that it was more likely than not that our deferred tax assets will be realized. Realization of the net deferred tax assets is dependent on our generation of sufficient future taxable income to obtain benefit from the reversal of temporary differences, primarily related to gross net operating loss carryforwards of approximately
$6,571,519
. In addition to the gross book net operating loss carryforwards, we have
$599,153
of excess share-based compensation deductions that will not be realized until we utilize
$6,571,519
of net operating losses, resulting in an approximate gross operating loss carryforward on our tax return of
$7,170,672
or
$2,493,239
tax effected. As of
December 31, 2012
, the deferred tax asset valuation allowance of
$9,835
relates to deferred tax assets that are not likely to be realized due to certain state net operating loss limitations. These net operating loss carryforwards expire on various dates beginning in 2017 and ending in 2028.
There is no current U.S. federal income tax provision, as all federal taxable income was offset by utilizing U.S. federal net operating loss carryforwards. The state income tax provision is primarily related to taxable income in certain states that have suspended the ability to use net operating loss carryforwards. The foreign income tax provision is primarily related to foreign withholding taxes related to royalty income between us and our Canadian affiliate.
F-35
SIRIUS XM RADIO INC. AND SUBSIDIARIES
NOTES TO CONSOLIDATED FINANCIAL STATEMENTS - Continued
(Dollar amounts in thousands, unless otherwise stated)
As of
December 31, 2012
and
2011
, the gross liability for income taxes associated with uncertain state tax positions was
$1,432
, respectively. If recognized,
$1,432
of unrecognized tax benefits would affect the effective tax rate. This liability is recorded in Other long-term liabilities. No penalties have been accrued for. We do not currently anticipate that our existing reserves related to uncertain tax positions as of
December 31, 2012
will significantly increase or decrease during the twelve-month period ending December 31, 2013; however, various events could cause our current expectations to change in the future. Should our position with respect to the majority of these uncertain tax positions be upheld, the effect would be recorded in our consolidated statements of comprehensive income as part of the income tax provision. Our policy is to recognize interest and penalties accrued on uncertain tax positions as part of income tax expense. We have recorded interest expense of
$55
and
$92
for the years ended December 31, 2012 and 2011, respectively, related to our unrecognized tax benefits presented below.
Changes in our uncertain income tax positions, from January 1 through December 31 are presented below:
|
2012
|
2011
|
||||||
|
Balance, beginning of year
|
$
|
1,432
|
|
$
|
942
|
|
|
|
Additions for tax positions from prior years
|
—
|
|
490
|
|
|||
|
Balance, end of year
|
$
|
1,432
|
|
$
|
1,432
|
|
|
We have federal and certain state income tax audits pending. We do not expect the ultimate disposition of these audits to have a material adverse affect on our financial position or results of operations.
(17) Quarterly Financial Data--Unaudited
Our quarterly results of operations are summarized below:
|
For the Three Months Ended
|
|||||||||||||||
|
March 31
|
June 30
|
September 30
|
December 31
|
||||||||||||
|
2012
|
|
|
|
|
|||||||||||
|
Total revenue
|
$
|
804,722
|
|
$
|
837,543
|
|
$
|
867,360
|
|
$
|
892,415
|
|
|||
|
Cost of services
|
$
|
(292,309
|
)
|
$
|
(293,975
|
)
|
$
|
(314,204
|
)
|
$
|
(328,882
|
)
|
|||
|
Income from operations
|
$
|
199,238
|
|
$
|
227,942
|
|
$
|
231,749
|
|
$
|
213,096
|
|
|||
|
Net income
|
$
|
107,774
|
|
$
|
3,134,170
|
|
$
|
74,514
|
|
$
|
156,244
|
|
|||
|
Net income per common share--basic
(1) (2)
|
$
|
0.02
|
|
$
|
0.49
|
|
$
|
0.01
|
|
$
|
0.02
|
|
|||
|
Net income per common share--diluted
(1)
|
$
|
0.02
|
|
$
|
0.48
|
|
$
|
0.01
|
|
$
|
0.02
|
|
|||
|
2011
|
|||||||||||||||
|
Total revenue
|
$
|
723,839
|
|
$
|
744,397
|
|
$
|
762,550
|
|
$
|
783,738
|
|
|||
|
Cost of services
|
$
|
(270,689
|
)
|
$
|
(273,331
|
)
|
$
|
(277,360
|
)
|
$
|
(299,719
|
)
|
|||
|
Income from operations
|
$
|
164,172
|
|
$
|
172,982
|
|
$
|
184,488
|
|
$
|
154,475
|
|
|||
|
Net income
|
$
|
78,121
|
|
$
|
173,319
|
|
$
|
104,185
|
|
$
|
71,336
|
|
|||
|
Net income per common share--basic
(1) (2)
|
$
|
0.01
|
|
$
|
0.03
|
|
$
|
0.02
|
|
$
|
0.01
|
|
|||
|
Net income per common share--diluted
(1)
|
$
|
0.01
|
|
$
|
0.03
|
|
$
|
0.02
|
|
$
|
0.01
|
|
|||
|
(1)
|
The sum of quarterly net income per share applicable to common stockholders (basic and diluted) does not necessarily agree to the net income per share for the year due to the timing of our common stock issuances.
|
|
(2)
|
We identified and corrected an immaterial error affecting the historical presentation of basic earnings per share. The adjustment reflects the Series B Preferred Stock held by Liberty Media as participating securities as the holders of such preferred stock may participate in dividends and distributions ratably with holders of our common stock on an as-converted basis as disclosed in Footnote 3. The effects of the error were not material to any previously reported quarterly or annual period. The corrected net income per common share--basic calculations are presented in the quarterly results of operations table. The previously reported net income per common share--basic for the three months ended March 31, 2012 and June 30, 2012 were
$0.03
and
$0.83
, respectively. The previously reported net income per common share--basic for the six months ended June 30, 2012 was
$0.86
and the adjusted net income per
|
F-36
SIRIUS XM RADIO INC. AND SUBSIDIARIES
NOTES TO CONSOLIDATED FINANCIAL STATEMENTS - Continued
(Dollar amounts in thousands, unless otherwise stated)
common share--basic was
$0.51
. The previously reported net income per common share--basic for the three month ended March 31, 2011, June 30, 2011, and December 31, 2011 were
$0.02
,
$0.05
and
$0.02
, respectively. The previously reported net income per common share--basic for the six months ended June 30, 2011 was
$0.07
and the adjusted net income per common share--basic was
$0.04
.
(18) Subsequent Events
On January 3, 2013, the Federal Communications Commission granted Liberty Media approval to acquire de jure control of us. On January 17, 2013, Liberty Media filed a Form 4 with the Securities and Exchange Commission indicating that on January 15, 2013 it, indirectly through its subsidiaries, purchased an additional
50,000,000
shares of our common stock. On January 18, 2013, Liberty Radio, LLC, a wholly-owned subsidiary of Liberty Media and the holder of all of the outstanding shares of our Series B Preferred Stock, converted all of its Series B Preferred Stock into
1,293,509,076
shares of our common stock. As a result of this recent purchase and conversion Liberty Media beneficially owned as of January 17, 2013, directly and indirectly, an aggregate of
3,292,800,311
shares of our common stock, representing approximately
50.21%
of all the outstanding shares of our common stock.
As a result of the foregoing, a Fundamental Change occurred on January 17, 2013 under the indenture governing the Exchangeable Notes. In accordance with the indenture, on February 1, 2013, we made an offer to each holder of Exchangeable Notes to: (i) have the Company repurchase his or her Exchangeable Notes at a purchase price in cash equal to $1,000 per $1,000 principal amount of the Notes (plus accrued and unpaid interest to, but excluding March 1, 2013); or (ii) exchange his or her Exchangeable Notes for our common stock, at an exchange rate of
581.3112
shares per $1,000 principal amount of Notes, on or prior to March 1, 2013. This exchange rate is a benefit to the holders compared to an exchange rate of
543.1372
shares of common stock in effect prior to occurrence of such Fundamental Change. A holder of the Exchangeable Notes may also elect to retain his or her Notes pursuant to their terms through maturity on December 1, 2014, or otherwise transfer or exchange them in the ordinary course.
F-37
SIRIUS XM RADIO INC. AND SUBSIDIARIES
Schedule II--Schedule of Valuation and Qualifying Accounts
|
(in thousands)
|
Balance January 1,
|
Charged to Expenses (Benefit)
|
Write-offs/ Payments/ Other
|
Balance December 31,
|
|||||||||
|
Description
|
|||||||||||||
|
2010
|
|||||||||||||
|
Allowance for doubtful accounts
|
$
|
8,667
|
|
32,379
|
|
(30,824
|
)
|
$
|
10,222
|
|
|||
|
Deferred tax assets—valuation allowance
|
$
|
3,615,332
|
|
(21,749
|
)
|
(42,295
|
)
|
$
|
3,551,288
|
|
|||
|
2011
|
|
|
|
|
|||||||||
|
Allowance for doubtful accounts
|
$
|
10,222
|
|
33,164
|
|
(33,454
|
)
|
$
|
9,932
|
|
|||
|
Deferred tax assets—valuation allowance
|
$
|
3,551,288
|
|
(166,452
|
)
|
(24,096
|
)
|
$
|
3,360,740
|
|
|||
|
2012
|
|
|
|
|
|||||||||
|
Allowance for doubtful accounts
|
$
|
9,932
|
|
34,548
|
|
(32,769
|
)
|
$
|
11,711
|
|
|||
|
Deferred tax assets—valuation allowance
|
$
|
3,360,740
|
|
(3,195,651
|
)
|
(155,254
|
)
|
$
|
9,835
|
|
|||
F-38
EXHIBIT INDEX
|
Exhibit
|
|
Description
|
|||
|
|
|
||||
|
3.1
|
|
Amended and Restated Certificate of Incorporation of the Company, dated March 4, 2003 (incorporated by reference to Exhibit 3.1 to the Company's Annual Report on Form 10-K for the year ended December 31, 2002).
|
|||
|
3.2
|
|
Certificate of Amendment of the Amended and Restated Certificate of Incorporation of the Company, dated July 28, 2008 (incorporated by reference to Exhibit 3.1 to the Company's Current Report on Form 8-K dated August 1, 2008).
|
|||
|
3.3
|
|
Certificate of Amendment of the Amended and Restated Certificate of Incorporation of the Company, dated December 18, 2008 (incorporated by reference to Exhibit 3.3 to the Company's Registration Statement on Form S-3 dated December 30, 2008).
|
|||
|
3.4
|
|
Certificate of Amendment of the Amended and Restated Certificate of Incorporation of the Company, dated May 29, 2009 (incorporated by reference to Exhibit 4.4 to the Company's Registration Statement on Form S-8 dated July 1, 2009).
|
|||
|
3.5
|
|
Amended and Restated By-Laws of the Company (incorporated by reference to Exhibit 3.2 to the Company's Quarterly Report on Form 10-Q for the quarter ended September 30, 2001).
|
|||
|
3.6
|
|
Certificate of Amendment of the Amended and Restated By-Laws of the Company, dated July 28, 2008 (incorporated by reference to Exhibit 3.2 to the Company's Current Report on Form 8-K dated August 1, 2008).
|
|||
|
3.7
|
|
Certificate of Designations of Series B-1 Convertible Perpetual Preferred Stock of the Company, dated March 5, 2009 (incorporated by reference to Exhibit 3.1 to the Company's Current Report on Form 8-K dated March 6, 2009).
|
|||
|
3.8
|
|
Certificate of Ownership and Merger, dated January 12, 2011 (incorporated by reference to Exhibit 3.1 to the Company's Current Report on Form 8-K dated January 12, 2011).
|
|||
|
4.1
|
|
Form of certificate for shares of the Company's common stock (incorporated by reference to Exhibit 4.3 to the Company's Registration Statement on Form S-1 (File No. 33-74782)).
|
|||
|
4.2
|
|
Indenture, dated as of August 1, 2008, among XM Satellite Radio Inc., XM Satellite Radio Holdings Inc., XM Equipment LLC, XM Radio Inc., the Company and The Bank of New York Mellon, as trustee, relating to the 7% Exchangeable Senior Subordinated Notes due 2014 (incorporated by reference to Exhibit 4.80 to the Company's Quarterly Report on Form 10-Q for the quarter ended September 30, 2008).
|
|||
|
4.3
|
|
Registration Rights Agreement, dated August 1, 2008, among XM Satellite Radio Inc., XM Satellite Radio Holdings Inc., XM Equipment Leasing LLC, XM Radio Inc., the Company, J.P. Morgan Securities Inc., Morgan Stanley & Co. Incorporated and UBS Securities LLC, relating to the 7% Exchangeable Senior Subordinated Notes due 2014 (incorporated by reference to Exhibit 4.81 to the Company's Quarterly Report on Form 10-Q for the quarter ended September 30, 2008).
|
|||
|
4.4
|
|
Form of Media-Based Incentive Warrant, dated as of January 27, 2009, issued by the Company to NFL Enterprises LLC (incorporated by reference to Exhibit 4.48 to the Company's Annual Report on Form 10-K for the year ended December 31, 2008).
|
|||
|
4.5
|
|
Investment Agreement, dated as of February 17, 2009, among the Company and Liberty Radio LLC (incorporated by reference to Exhibit 4.55 to the Company's Annual Report on Form 10-K for the year ended December 31, 2008).
|
|||
|
4.6
|
|
Indenture, dated as of March 17, 2010, among the Company, the guarantors thereto and U.S. Bank National Association, as trustee, relating to the 8.75% Senior Notes due 2015 (incorporated by reference to Exhibit 4.1 to the Company's Current Report on Form 8-K dated March 19, 2010).
|
|||
|
4.7
|
|
Supplemental Indenture, dated April 14, 2010, among XM Satellite Radio Inc., certain subsidiaries thereof and The Bank of New York Mellon, as trustee, relating to the 7% Exchangeable Senior Subordinated Notes due 2014 (incorporated by reference to XM Satellite Radio Inc.'s Quarterly Report on Form 10-Q filed on May 7, 2010).
|
|||
|
4.8
|
|
Indenture, dated as of October 27, 2010, among XM Satellite Radio Inc., the guarantors thereto and U.S. Bank National Association, as trustee, relating to the 7.625% Senior Notes due 2018 (incorporated by reference to Exhibit 4.1 to XM Satellite Radio Inc.'s Current Report on Form 8-K filed on October 28, 2010).
|
|||
E-1
|
Exhibit
|
|
Description
|
|||
|
4.9
|
|
Supplemental Indenture, dated January 12, 2011, by and among XM Satellite Radio Inc., the Company, certain subsidiaries thereof and The Bank of New York Mellon, as trustee, relating to the 7% Exchangeable Senior Subordinated Notes due 2014 (incorporated by reference to Exhibit 4.3 to the Company's Current Report on Form 8-K filed on January 12, 2011).
|
|||
|
4.10
|
|
Supplemental Indenture, dated January 12, 2011, by and among XM Satellite Radio Inc., the Company, certain subsidiaries thereof and U.S. Bank National Association, as trustee, relating to the 7.625% Senior Notes due 2018 (incorporated by reference to Exhibit 4.4 to the Company's Current Report on Form 8-K filed on January 12, 2011).
|
|||
|
4.11
|
|
Supplemental Indenture, dated January 12, 2011, by and among the Company, certain subsidiaries thereof and U.S. Bank National Association, as trustee, relating to the 8.75% Senior Notes due 2015 (incorporated by reference to Exhibit 4.24 to the Company's Annual Report on Form 10-K for the year ended December 31, 2010).
|
|||
|
4.12
|
|
Indenture, dated as of August 13, 2012, among the Company, the guarantors thereto and U.S. Bank National Association, as trustee, relating to the Company's 5.25% Senior Notes due 2022 (incorporated by reference to the Company's Current Report on Form 8-K filed on August 14, 2012).
|
|||
|
4.13
|
|
Credit Agreement, dated as of December 5, 2012 among the Company, JPMorgan Chase Bank, N.A. as administrative agent, and the other agents and lenders party thereto (incorporated by reference to the Company's Current Report on Form 8-K filed on December 10, 2012).
|
|||
|
**10.1
|
|
Operational Assistance Agreement, dated as of June 7, 1999, between XM Satellite Radio Inc. and Clear Channel Communications, Inc. (incorporated by reference to Exhibit 10.10 to Amendment No. 1 to XM Satellite Radio Holdings Inc.'s Registration Statement on Form S-1, File No. 333-83619).
|
|||
|
**10.2
|
|
Technology Licensing Agreement among XM Satellite Radio Inc., XM Satellite Radio Holdings Inc., WorldSpace Management Corporation and American Mobile Satellite Corporation, dated as of January 1, 1998, amended by Amendment No. 1 to Technology Licensing Agreement, dated June 7, 1999 (incorporated by reference to Exhibit 10.3 to XM Satellite Radio Holdings Inc.'s Annual Report on Form 10-K for the year ended December 31, 2007).
|
|||
|
***10.3
|
|
Third Amended and Restated Distribution and Credit Agreement, dated as of February 6, 2008, among General Motors Corporation, XM Satellite Radio Holdings Inc. and XM Satellite Radio Inc. (incorporated by reference to Exhibit 10.63 to XM Satellite Radio Holdings Inc.'s Annual Report on Form 10-K for the year ended December 31, 2007).
|
|||
|
**10.4
|
|
Third Amended and Restated Satellite Purchase Contract for In-Orbit Delivery, dated as of May 15, 2001, between XM Satellite Radio Inc. and Boeing Satellite Systems International Inc. (incorporated by reference to Exhibit 10.36 to Amendment No. 1 to XM Satellite Radio Holdings Inc.'s Registration Statement on Form S-3, File No. 333-89132).
|
|||
|
10.5
|
|
Assignment and Novation Agreement, dated as of December 5, 2001, between XM Satellite Radio Holdings Inc., XM Satellite Radio Inc. and Boeing Satellite Systems International Inc. (incorporated by reference to Exhibit 10.3 to XM Satellite Radio Holdings Inc.'s Current Report on Form 8-K filed on December 6, 2001).
|
|||
|
**10.6
|
|
Amendment to the Satellite Purchase Contract for In-Orbit Delivery, dated as of December 5, 2001, between XM Satellite Radio Inc. and Boeing Satellite Systems International Inc. (incorporated by reference to Exhibit 10.4 to XM Satellite Radio Holdings Inc.'s Current Report on Form 8-K filed on December 6, 2001).
|
|||
|
10.7
|
|
Amended and Restated Assignment and Use Agreement, dated as of January 28, 2003, between XM Satellite Radio Inc. and XM Radio Inc. (incorporated by reference to Exhibit 10.7 to XM Satellite Radio Holdings Inc.'s Current Report on Form 8-K filed on January 29, 2003).
|
|||
|
**10.8
|
|
Amended and Restated Amendment to the Satellite Purchase Contract for In-Orbit Delivery, dated May 23, 2003, among XM Satellite Radio Inc. and XM Satellite Radio Holdings Inc. and Boeing Satellite Systems International Inc. (incorporated by reference to Exhibit 10.53 to XM Satellite Radio Holdings Inc.'s Quarterly Report on Form 10-Q for the quarter ended June 30, 2003).
|
|||
|
**10.9
|
|
Amendment to the Satellite Purchase Contract for In-Orbit Delivery, dated July 31, 2003, among XM Satellite Radio Inc. and XM Satellite Radio Holdings Inc. and Boeing Satellite Systems International Inc. (incorporated by reference to Exhibit 10.54 to XM Satellite Radio Holdings Inc.'s Quarterly Report on Form 10-Q for the quarter ended June 30, 2003).
|
|||
E-2
|
Exhibit
|
|
Description
|
|||
|
**10.10
|
|
December 2003 Amendment to the Satellite Purchase Contract for In-Orbit Delivery, dated December 19, 2003, among XM Satellite Radio Inc., XM Satellite Radio Holdings Inc. and Boeing Satellite Systems International Inc. (incorporated by reference to Exhibit 10.57 to XM Satellite Radio Holdings Inc.'s Annual Report on Form 10-K for the year ended December 31, 2003).
|
|||
|
*10.11
|
|
Form of Option Agreement between the Company and each Optionee (incorporated by reference to Exhibit 10.16.2 to the Company's Quarterly Report on Form 10-Q for the quarter ended June 30, 1998).
|
|||
|
*10.12
|
|
Form of Director Non-Qualified Stock Option Agreement (incorporated by reference to Exhibit 10.25 to Amendment No. 5 to XM Satellite Radio Holdings Inc.'s Registration Statement on Form S-1, File No. 333-83619).
|
|||
|
*10.13
|
|
CD Radio Inc. 401(k) Savings Plan (incorporated by reference to Exhibit 4.4 to the Company's Registration Statement on Form S-8 (File No. 333-65473)).
|
|||
|
*10.14
|
|
Employment Agreement, dated as of June 3, 2003, between the Company and David J. Frear (incorporated by reference to Exhibit 10.7 to the Company's Quarterly Report on Form 10-Q for the quarter ended June 30, 2003).
|
|||
|
*10.15
|
|
Amended and Restated Sirius Satellite Radio 2003 Long-Term Stock Incentive Plan (incorporated by reference to Exhibit 10.10 to the Company's Quarterly Report on Form 10-Q for the quarter ended June 30, 2004).
|
|||
|
*10.16
|
|
Restricted Stock Unit Agreement, dated as of August 9, 2005, between the Company and James E. Meyer (incorporated by reference to Exhibit 10.3 to the Company's Current Report on Form 8-K dated August 12, 2005).
|
|||
|
*10.17
|
|
First Amendment, dated as of August 10, 2005, to the Employment Agreement, dated as of June 3, 2003, between the Company and David J. Frear (incorporated by reference to Exhibit 10.2 to the Company's Current Report on Form 8-K dated August 12, 2005).
|
|||
|
*10.18
|
|
Form of Non-Qualified Stock Option Agreement (incorporated by reference to Exhibit 10.2 to XM Satellite Radio Holdings Inc.'s Current Report on Form 8-K filed June 1, 2007).
|
|||
|
*10.19
|
|
Form of Restricted Stock Agreement (incorporated by reference to Exhibit 10.3 to XM Satellite Radio Holdings Inc.'s Current Report on Form 8-K filed June 1, 2007).
|
|||
|
*10.20
|
|
XM Satellite Radio Holdings Inc. 2007 Stock Incentive Plan (incorporated by reference to Exhibit 10.5 to XM Satellite Radio Holdings Inc.'s Quarterly Report on Form 10-Q for the quarter ended June 30, 2007).
|
|||
|
*10.21
|
|
Sirius XM Radio 401(k) Savings Plan, as amended and restated effective January 1, 2009 (incorporated by reference to Exhibit 10.30 to the Company's Annual Report on Form 10-K for the year ended December 31, 2009).
|
|||
|
*10.22
|
|
Second Amendment, dated as of February 12, 2008, to the Employment Agreement, dated as of June 3, 2003, between the Company and David J. Frear (incorporated by reference to Exhibit 10.1 to the Company's Current Report on Form 8-K dated February 13, 2008).
|
|||
|
*10.23
|
|
Employment Agreement, dated as of September 26, 2008, between the Company and Dara F. Altman (incorporated by reference to Exhibit 10.1 to the Company's Current Report on Form 8-K dated October 1, 2008).
|
|||
|
*10.24
|
|
Sirius XM Radio Inc. 2009 Long-Term Stock Incentive Plan (incorporated by reference to Exhibit 4.9 to the Company's Registration Statement on Form S-8 dated July 1, 2009).
|
|||
|
*10.25
|
|
Employment Agreement, dated as of July 28, 2009, between the Company and Scott A. Greenstein (incorporated by reference to Exhibit 10.1 to the Company's Current Report on Form 8-K filed July 29, 2009).
|
|||
|
*10.26
|
|
Employment Agreement, dated as of October 14, 2009, between the Company and James E. Meyer (incorporated by reference to Exhibit 10.1 to the Company's Current Report on Form 8-K filed October 16, 2009).
|
|||
|
*10.27
|
|
Employment Agreement, dated as of January 14, 2010, between the Company and Patrick L. Donnelly (incorporated by reference to Exhibit 10.1 to the Company's Current Report on Form 8-K filed January 15, 2010).
|
|||
|
*10.28
|
|
First Amendment, dated as of February 14, 2011, to the Employment Agreement dated as of October 14, 2009, between the Company and James E. Meyer (incorporated by reference to Exhibit 10.1 to the Company's Current Report on Form 8-K filed February 15, 2011).
|
|||
|
*10.29
|
|
Employment Agreement, dated as of July 21, 2011, between the Company and David J. Frear (incorporated by reference to Exhibit 10.1 to the Company's Current Report on Form 8-K filed on July 22, 2011).
|
|||
E-3
|
Exhibit
|
|
Description
|
|||
|
*10.30
|
|
Employment Agreement, dated as of August 23, 2011, between the Company and Dara F. Altman (incorporated by reference to Exhibit 10.1 to the Company's Current Report on Form 8-K filed on August 24, 2011).
|
|||
|
*10.31
|
|
Second Amendment, dated as of March 5, 2012, to the Employment Agreement, dated as of October 14, 2009, between the Company and James E. Meyer (incorporated by reference to Exhibit 10.1 to the Company's Current Report on Form 8-K filed on March 5, 2012).
|
|||
|
*10.32
|
|
Third Amendment, dated as of December 18, 2012, to the Employment Agreement, dated as of October 14, 2009, between the Company and James E. Meyer (incorporated by reference to Exhibit 10.1 to the Company's Current Report on Form 8-K filed on December 19, 2012).
|
|||
|
*10.33
|
|
Form of Director Non-Qualified Stock Option Agreement (incorporated by reference to the Company's Annual Report on Form 10-K for the year ended December 31, 2012).
|
|||
|
*10.34
|
|
Form of Non-Qualified Stock Option Agreement (incorporated by reference to the Company's Annual Report on Form 10-K for the year ended December 31, 2012).
|
|||
|
21.1
|
|
List of Subsidiaries (filed herewith).
|
|||
|
23.1
|
|
Consent of KPMG LLP (filed herewith).
|
|||
|
31.1
|
|
Certificate of James E. Meyer, Chief Executive Officer, pursuant to Section 302 of the Sarbanes-Oxley Act of 2002 (filed herewith).
|
|||
|
31.2
|
|
Certificate of David J. Frear, Executive Vice President and Chief Financial Officer, pursuant to Section 302 of the Sarbanes-Oxley Act of 2002 (filed herewith).
|
|||
|
32.1
|
|
Certificate of James E. Meyer, Chief Executive Officer, pursuant to 18 U.S.C. Section 1350, as adopted pursuant to Section 906 of the Sarbanes-Oxley Act of 2002 (filed herewith).
|
|||
|
32.2
|
|
Certificate of David J. Frear, Executive Vice President and Chief Financial Officer, pursuant to 18 U.S.C. Section 1350, as adopted pursuant to Section 906 of the Sarbanes-Oxley Act of 2002 (filed herewith).
|
|||
|
101.1
|
|
The following financial information from our Annual Report on Form 10-K for the year ended December 31, 2012 formatted in eXtensible Business Reporting Language (XBRL): (i) Consolidated Statements of Comprehensive Income for the years ended December 31, 2012, 2011 and 2010; (ii) Consolidated Balance Sheets as of December 31, 2012 and 2011; (iii) Consolidated Statements of Stockholders' Equity for the years ended December 31, 2012, 2011 and 2010; (iv) Consolidated Statements of Cash Flows for the years ended December 31, 2012, 2011 and 2010; and (v) Notes to Consolidated Financial Statements.
|
|||
____________________
|
*
|
This document has been identified as a management contract or compensatory plan or arrangement.
|
|
**
|
Pursuant to the Commission's Orders Granting Confidential Treatment under Rule 406 of the Securities Act of 1933 or Rule 24(b)-2 under the Securities Exchange Act of 1934, certain confidential portions of this Exhibit were omitted by means of redacting a portion of the text.
|
|
***
|
Confidential treatment has been requested with respect to portions of this Exhibit that have been omitted by redacting a portion of the text.
|
E-4
TABLE OF CONTENTS
Part IItem 1. BusinessItem 1A. Risk FactorsItem 1B. Unresolved Staff CommentsItem 2. PropertiesItem 3. Legal ProceedingsItem 4. Mine Safety DisclosuresPart IIItem 5. Market For Registrant's Common Equity, Related Stockholder Matters and Issuer Purchases Of Equity SecuritiesItem 6. Selected Financial DataItem 7. Management S Discussion and Analysis Of Financial Condition and Results Of OperationsItem 7A. Quantitative and Qualitative Disclosure About Market RisksItem 8. Financial Statements and Supplementary DataItem 9. Changes in and Disagreements with Accountants on Accounting and Financial DisclosureItem 9A. Controls and ProceduresItem 9B. Other InformationPart IIIItem 10. Directors, Executive Officers and Corporate GovernanceItem 2. Ratification Of Independent Registered Public AccountantsItem 11. Executive CompensationItem 1. Election Of DirectorsItem 12. Security Ownership Of Certain Beneficial Owners and Management and Related Stockholder MattersItem 13. Certain Relationships and Related Transactions, and Director IndependenceItem 14. Principal Accountant Fees and ServicesPart IVItem 15. Exhibits and Financial Statement Schedules