|
|
|
|
|
|
|
|
|
|
|
|
|
|
|
|
|
|
|
|
|
|
|
|
|
|
|
|
|
|
|
|
|
|
|
|
|
|
|
|
|
|
|
|
|
|
|
|
|
|
|
|
|
|
|
|
|
|
|
Table of Contents
UNITED STATES SECURITIES AND EXCHANGE COMMISSION
Washington, DC 20549
FORM 10-K
(Mark One)
| þ | ANNUAL REPORT PURSUANT TO SECTION 13 OR 15(d) OF THE SECURITIES EXCHANGE ACT OF 1934 |
| FOR THE FISCAL YEAR ENDED DECEMBER 31, 2012 |
OR
| ¨ | TRANSITION REPORT PURSUANT TO SECTION 13 OR 15(d) OF THE SECURITIES EXCHANGE ACT OF 1934 |
For the transition period from to
Commission file number 1-11690
DDR Corp.
(Exact Name of Registrant as Specified in Its Charter)
|
Ohio |
34-1723097 |
|
|
(State or Other Jurisdiction of Incorporation or Organization) |
(I.R.S. Employer Identification No.) |
3300 Enterprise Parkway, Beachwood, Ohio 44122
|
|
(Address of Principal Executive Offices — Zip Code)
(216) 755-5500
|
|
(Registrant’s telephone number, including area code)
Securities registered pursuant to Section 12(b) of the Act:
|
Title of Each Class |
Name of Each Exchange on
Which Registered |
|
|
Common Shares, Par Value $0.10 Per Share |
New York Stock Exchange | |
|
Depositary Shares, each representing 1/20 of a share of 7.375%
|
New York Stock Exchange | |
|
Depositary Shares, each representing 1/20 of a share of 6.5%
|
New York Stock Exchange |
Securities registered pursuant to Section 12(g) of the Act:
None
(Title of Class)
Indicate by check mark if the registrant is a well-known seasoned issuer, as defined in Rule 405 of the Securities Act. Yes þ No ¨
Indicate by check mark if the registrant is not required to file reports pursuant to Section 13 or Section 15(d) of the Act. Yes ¨ No þ
Indicate by check mark whether the registrant: (1) has filed all reports required to be filed by Section 13 or 15(d) of the Securities Exchange Act of 1934 during the preceding 12 months (or for such shorter period that the registrant was required to file such reports), and (2) has been subject to such filing requirements for the past 90 days. Yes þ No ¨
Indicate by check mark whether the registrant has submitted electronically and posted on its corporate Web site, if any, every Interactive Data File required to be submitted and posted pursuant to Rule 405 of Regulation S-T (§232.405 of this chapter) during the preceding 12 months (or for such shorter period that the registrant was required to submit and post such files). Yes þ No ¨
Indicate by check mark if disclosure of delinquent filers pursuant to Item 405 of Regulation S-K is not contained herein, and will not be contained, to the best of registrant’s knowledge, in definitive proxy or information statements incorporated by reference in Part III of this Form 10-K or any amendment to this Form 10-K. ¨
Indicate by check mark whether the registrant is a large accelerated filer, an accelerated filer, a non-accelerated filer, or a smaller reporting company. See the definitions of “large accelerated filer,” “accelerated filer,” and “smaller reporting company” in Rule 12b-2 of the Exchange Act. (Check one):
| Large accelerated filer þ | Accelerated filer ¨ | Non-accelerated filer ¨ | Smaller reporting company ¨ | |||
| (Do not check if a smaller reporting company) | ||||||
Indicate by check mark whether the registrant is a shell company (as defined in Rule 12b-2 of the Exchange Act). Yes ¨ No þ
The aggregate market value of the voting stock held by non-affiliates of the registrant at June 30, 2012, was $3.5 billion.
(APPLICABLE ONLY TO CORPORATE REGISTRANTS)
Indicate the number of shares outstanding of each of the registrant’s classes of common stock, as of the latest practicable date.
315,003,994 common shares outstanding as of February 15, 2013
|
|
DOCUMENTS INCORPORATED BY REFERENCE
The registrant incorporates by reference in Part III hereof portions of its definitive Proxy Statement for its 2013 Annual Meeting of Shareholders.
Table of Contents
|
Item No. |
Report
Page |
|||||
| PART I | ||||||
|
1. |
3 | |||||
|
1A. |
6 | |||||
|
1B. |
17 | |||||
|
2. |
17 | |||||
|
3. |
42 | |||||
|
4. |
43 | |||||
| PART II | ||||||
|
5. |
45 | |||||
|
6. |
47 | |||||
|
7. |
Management’s Discussion and Analysis of Financial Condition and Results of Operations |
49 | ||||
|
7A. |
86 | |||||
|
8. |
88 | |||||
|
9. |
Changes in and Disagreements with Accountants on Accounting and Financial Disclosure |
88 | ||||
|
9A. |
88 | |||||
|
9B. |
88 | |||||
| PART III | ||||||
|
10. |
89 | |||||
|
11. |
89 | |||||
|
12. |
Security Ownership of Certain Beneficial Owners and Management and Related Stockholder Matters |
90 | ||||
|
13. |
Certain Relationships and Related Transactions, and Director Independence |
90 | ||||
|
14. |
90 | |||||
| PART IV | ||||||
|
15. |
91 | |||||
2
Table of Contents
| Item 1. | BUSINESS |
General Development of Business
DDR Corp., an Ohio corporation (the “Company” or “DDR”), a self-administered and self-managed real estate investment trust (“REIT”), is in the business of acquiring, owning, developing, redeveloping, expanding, leasing and managing shopping centers. In addition, the Company engages in the origination and acquisition of loans and debt securities, which are generally collateralized directly or indirectly by shopping centers. Unless otherwise provided, references herein to the Company or DDR include DDR Corp., its wholly-owned and majority-owned subsidiaries and its consolidated and unconsolidated joint ventures.
The Company is self-administered and self-managed and, therefore, does not engage or pay a REIT advisor. The Company manages substantially all of the Portfolio Properties as defined herein. At December 31, 2012, the Company owned more than 115 million total square feet of gross leasable area (“GLA”). These amounts do not include 44 assets that the Company has not managed since January 1, 2012, 40 of which the Company does not have an economic interest.
Financial Information About Industry Segments
The Company is in the business of acquiring, owning, developing, redeveloping, expanding, leasing and managing shopping centers. In addition, the Company engages in the origination and acquisition of loans and debt securities, which are generally collateralized directly or indirectly by shopping centers. See the Consolidated Financial Statements and Notes thereto included in Item 8 of this Annual Report on Form 10-K for certain information regarding the Company’s reportable segments, which is incorporated herein by reference to such information.
Narrative Description of Business
The Company’s portfolio as of February 15, 2013, consisted of 450 shopping centers (including 206 centers owned through unconsolidated joint ventures and three centers that are otherwise consolidated by the Company) and more than 1,500 acres of undeveloped land (of which approximately 110 acres are owned through unconsolidated joint ventures). The shopping centers and land are collectively referred to as the “Portfolio Properties.” The shopping center properties consist of shopping centers, and to a lesser extent, enclosed malls and lifestyle centers. From January 1, 2010, to February 15, 2013, the Company acquired 61 shopping centers (seven of which were acquired from unconsolidated joint ventures and 46 of which were acquired by one unconsolidated joint venture) containing an aggregate of 16.0 million square feet of GLA owned by the Company for an aggregate purchase price of $2.4 billion. From January 1, 2010, to February 15, 2013, the Company sold 148 shopping centers (including 52 properties owned through unconsolidated joint ventures) containing an aggregate of 18.0 million square feet of GLA owned by the Company for an aggregate sales price of $1.5 billion.
At December 31, 2012, the Company had 14 assets under development and/or redevelopment (consisting of 11 wholly-owned shopping centers and three joint venture shopping centers).
3
Table of Contents
The following tables present the operating statistics affecting base and percentage rental revenues summarized by the following portfolios: combined shopping center portfolio, wholly-owned shopping center portfolio and joint venture shopping center portfolio.
|
Shopping
Center
Portfolio (1) December 31, |
||||||||
| 2012 | 2011 | |||||||
|
Centers owned |
452 | 432 | ||||||
|
Aggregate occupancy rate |
91.5 | % | 89.1 | % | ||||
|
Average annualized base rent per occupied square foot (1) |
$ | 13.66 | (2) | $ | 13.81 | |||
|
Wholly-Owned
Shopping Centers December 31, |
Joint Venture
Shopping Centers (1) December 31, |
|||||||||||||||
| 2012 | 2011 | 2012 | 2011 | |||||||||||||
|
Centers owned |
243 | 253 | 206 | 177 | ||||||||||||
|
Centers owned through consolidated joint ventures |
N/A | N/A | 3 | 2 | ||||||||||||
|
Aggregate occupancy rate |
91.9 | % | 88.8 | % | 90.9 | % | 89.5 | % | ||||||||
|
Average annualized base rent per occupied square foot |
$ | 12.92 | $ | 12.26 | $ | 14.58 | (2) | $ | 15.93 | |||||||
| (1) |
In 2012, excludes shopping centers owned through the Company’s joint venture with Coventry Real Estate Fund II (“Coventry II Fund”), which are no longer managed by the Company and in which the Company’s investment basis is not material. In 2011, excludes shopping centers owned by unconsolidated joint ventures in which the Company’s investment basis is zero and in which the Company is receiving no allocation of income or loss, which includes certain Coventry II Fund investments. |
| (2) |
Decrease within the joint venture portfolio primarily due to the impact of exchange rate fluctuations with the Brazilian Real, the sale of assets in Brazil and the inclusion of the BRE DDR Retail Holdings, LLC assets in 2012. |
Strategy and Philosophy
The Company’s mission is to enhance shareholder value by exceeding the expectations of its tenants, innovating to create new growth opportunities and fostering the talents of its employees while rewarding their successes. The Company’s vision is to be the most admired provider of retail destinations and the first consideration for tenants, investors, partners and employees.
The Company’s strategic objective is to improve the quality of its prime portfolio (i.e., market-dominant shopping centers with high-quality tenants located in attractive markets with strong demographic profiles, which are referred to as “Prime Portfolio” or “Prime Assets”) while lowering leverage and risk and at the same time preparing the Company for long-term growth and financial strength. The Company’s real estate strategy and philosophy has been to grow its business through a combination of leasing, expansion, acquisition, development and redevelopment. The Company may pursue the disposition of certain real estate assets that are not likely to generate superior growth and recycle the proceeds to repay debt, to reinvest in Prime Assets or for other corporate purposes.
The Company’s key strategies are summarized as follows:
| • |
Increase cash flows and property values through strategic leasing, re-tenanting, renovation and expansion of the Company’s portfolio to be the preeminent landlord to the world’s most successful retailers; |
| • |
Increase per share cash flows through the strategic disposition of non-prime assets and use the proceeds to repay debt and reinvest in other higher growth real estate assets and developments; |
4
Table of Contents
| • |
Address capital requirements by selling assets, including sales to joint ventures, retaining capital, maintaining dividend payments at the amount required to meet minimum REIT requirements, entering into new financings and, to the extent deemed appropriate, minimizing capital expenditures; |
| • |
Access equity capital through the public markets and other viable alternatives; |
| • |
Pursue de-leveraging goals, including extending the duration of the Company’s debt; |
| • |
Control spending within the Company’s development portfolio by phasing construction until sufficient pre-leasing is reached and financing is in place; |
| • |
Increase expected spending on redevelopment in order to best position centers for tenant demand and to generate attractive returns; |
| • |
Selectively pursue new investment opportunities only after sufficient equity and debt financings are identified and underwritten expected returns sufficiently exceed the Company’s cost of capital; |
| • |
Continue leasing strategy of enhancing tenant relationships at a high level through the Company’s national account program and increasing occupancy with high-quality tenants; |
| • |
Renew tenants’ extension options and execute leases in a timely manner; |
| • |
Dedicate Company resources to monitor major tenant vacancies, proactively identify potential space recapture opportunities and focus on marketing and re-tenanting those spaces; |
| • |
Selectively develop or sell the Company’s undeveloped parcels and acquire and develop new sites in areas with attractive demographics and |
| • |
Hold prime properties for long-term investment and place a strong emphasis on regular maintenance, periodic renovation and capital improvements. |
The strategy, philosophy, investment and financing policies of the Company, and its policies with respect to certain other activities including its growth, debt capitalization, dividends, status as a REIT and operating policies, are determined by the Board of Directors. Although the Board of Directors has no present intention to amend or revise its policies, the Board of Directors may do so from time to time without a vote of the Company’s shareholders.
Recent Developments
See “Management’s Discussion and Analysis of Financial Condition and Results of Operations” included in Item 7 and the Consolidated Financial Statements and Notes thereto included in Item 8 of this Annual Report on Form 10-K for the year ended December 31, 2012, for information on certain recent developments of the Company, which is incorporated herein by reference to such information.
Tenants and Competition
As one of the nation’s largest owners and operators of shopping centers (measured by total GLA), the Company has established close relationships with a large number of major national and regional retailers. The Company’s management is associated with and actively participates in many shopping center and REIT industry organizations.
Notwithstanding these relationships, numerous developers and real estate companies, private and public, compete with the Company in leasing space in shopping centers to tenants. The Company competes with other real estate companies and developers in terms of rental rate, property location, availability of other space, management services and maintenance.
5
Table of Contents
As of December 31, 2012, the annualized base rental revenues of the Company’s tenants that are equal to or exceed 1.5% of the Company’s aggregate annualized shopping center base rental revenues, including its proportionate share of joint venture aggregate annualized shopping center base rental revenues, are as follows:
|
Tenant |
% of Annualized Base
Rental Revenues |
|||
|
Walmart/Sam’s Club |
4.0 | % | ||
|
TJX Companies (1) |
2.5 | % | ||
|
Bed Bath & Beyond (2) |
2.5 | % | ||
|
PetSmart |
2.2 | % | ||
|
Kohl’s |
1.9 | % | ||
|
Best Buy |
1.7 | % | ||
|
Michaels |
1.7 | % | ||
|
Dick’s Sporting Goods |
1.5 | % | ||
|
Ross Stores |
1.5 | % | ||
| (1) |
Includes T.J. Maxx, Marshalls and Homegoods. |
| (2) |
Includes Bed Bath & Beyond, World Market and other retail concepts. |
Qualification as a Real Estate Investment Trust
As of December 31, 2012, the Company met the qualification requirements of a REIT under Sections 856-860 of the Internal Revenue Code of 1986, as amended (the “Code”). As a result, the Company, with the exception of its taxable REIT subsidiary (“TRS”), will not be subject to federal income tax to the extent it meets certain requirements of the Code.
Employees
As of January 31, 2013, the Company employed 607 full-time individuals including executive, administrative and field personnel. The Company considers its relations with its personnel to be good.
Corporate Headquarters
The Company is an Ohio corporation and was incorporated in 1992. The Company’s executive offices are located at 3300 Enterprise Parkway, Beachwood, Ohio 44122, and its telephone number is (216) 755-5500. The Company’s website is http://www.ddr.com. The Company uses its Investor Relations website, (http://www.ddr.com), as a channel for routine distribution of important information, including news releases, analyst presentations and financial information. The Company posts filings as soon as reasonably practicable after they are electronically filed with, or furnished to, the SEC, including the Company’s annual, quarterly and current reports on Forms 10-K, 10-Q and 8-K, the Company’s proxy statements and any amendments to those reports or statements. All such postings and filings are available on the Company’s Investor Relations website free of charge. In addition, this website allows investors and other interested persons to sign up to automatically receive e-mail alerts when the Company posts news releases and financial information on its website. The SEC also maintains a website (http://www.sec.gov) that contains reports, proxy and information statements and other information regarding issuers that file electronically with the SEC. The content on, or accessible through, any website referred to in this Annual Report on Form 10-K for the fiscal year ended December 31, 2012, is not incorporated by reference into, and shall not be deemed part of, this Form 10-K unless expressly noted.
| Item 1A. | RISK FACTORS |
The risks described below could materially and adversely affect the Company’s results of operations, financial condition, liquidity and cash flows. These risks are not the only risks that the Company faces. The Company’s business operations could also be affected by additional factors that are not presently known to it or that the Company currently considers to be immaterial to its operations.
6
Table of Contents
The Economic Performance and Value of the Company’s Shopping Centers Depend on Many Factors, Each of Which Could Have an Adverse Impact on the Company’s Cash Flows and Operating Results
The economic performance and value of the Company’s real estate holdings can be affected by many factors, including the following:
| • |
Changes in the national, regional, local and international economic climate; |
| • |
Local conditions, such as an oversupply of space or a reduction in demand for real estate in the area; |
| • |
The attractiveness of the properties to tenants; |
| • |
Competition from other available space; |
| • |
The Company’s ability to provide adequate management services and to maintain its properties; |
| • |
Increased operating costs, if these costs cannot be passed through to tenants and |
| • |
The expense of periodically renovating, repairing and reletting spaces. |
Because the Company’s properties consist primarily of shopping centers, the Company’s performance is linked to general economic conditions in the market for retail space. The market for retail space has been and may continue to be adversely affected by weakness in the national, regional and local economies, the adverse financial condition of some large retailing companies, the ongoing consolidation in the retail sector, the excess amount of retail space in a number of markets and increasing consumer purchases through the Internet. To the extent that any of these conditions occur, they are likely to affect market rents for retail space. In addition, the Company may face challenges in the management and maintenance of its properties or incur increased operating costs, such as real estate taxes, insurance and utilities, which may make its properties unattractive to tenants. The loss of rental revenues from a number of the Company’s tenants and its inability to replace such tenants may adversely affect the Company’s profitability and ability to meet its debt and other financial obligations and make distributions to shareholders.
The Company Relies on Major Tenants, Making It Vulnerable to Changes in the Business and Financial Condition of, or Demand for Its Space by, Such Tenants
As of December 31, 2012, the annualized base rental revenues of the Company’s tenants that are equal to or exceed 1.5% of the Company’s aggregate annualized shopping center base rental revenues, including its proportionate share of joint venture aggregate annualized shopping center base rental revenues, are as follows:
|
Tenant |
% of Annualized Base
Rental Revenues |
|||
|
Walmart/Sam’s Club |
4.0 | % | ||
|
TJX Companies (1) |
2.5 | % | ||
|
Bed Bath & Beyond (2) |
2.5 | % | ||
|
PetSmart |
2.2 | % | ||
|
Kohl’s |
1.9 | % | ||
|
Best Buy |
1.7 | % | ||
|
Michaels |
1.7 | % | ||
|
Dick’s Sporting Goods |
1.5 | % | ||
|
Ross Stores |
1.5 | % | ||
| (1) |
Includes T.J. Maxx, Marshalls and Homegoods. |
| (2) |
Includes Bed Bath & Beyond, World Market and other retail concepts. |
The retail shopping sector has been affected by economic conditions as well as the competitive nature of the retail business and the competition for market share where stronger retailers have out-positioned some of the weaker retailers. These shifts have forced some market share away from weaker retailers and required them, in some cases, to declare bankruptcy and/or close stores.
7
Table of Contents
As information becomes available regarding the status of the Company’s leases with tenants in financial distress or the future plans for their spaces change, the Company may be required to write off and/or accelerate depreciation and amortization expense associated with a significant portion of the tenant-related deferred charges in future periods. The Company’s income and ability to meet its financial obligations could also be adversely affected in the event of the bankruptcy, insolvency or significant downturn in the business of one of these tenants or any of the Company’s other major tenants. In addition, the Company’s results could be adversely affected if any of these tenants do not renew their leases as they expire.
The Company’s Dependence on Rental Income May Adversely Affect Its Ability to Meet Its Debt Obligations and Make Distributions to Shareholders
Substantially all of the Company’s income is derived from rental income from real property. As a result, the Company’s performance depends on its ability to collect rent from tenants. The Company’s income and funds for distribution would be negatively affected if a significant number of its tenants, or any of its major tenants, were to do the following:
| • |
Experience a downturn in their business that significantly weakens their ability to meet their obligations to the Company; |
| • |
Delay lease commencements; |
| • |
Decline to extend or renew leases upon expiration; |
| • |
Fail to make rental payments when due or |
| • |
Close stores or declare bankruptcy. |
Any of these actions could result in the termination of tenants’ leases and the loss of rental income attributable to the terminated leases. Lease terminations by an anchor tenant or a failure by that anchor tenant to occupy the premises could also result in lease terminations or reductions in rent by other tenants in the same shopping centers under the terms of some leases. In addition, the Company cannot be certain that any tenant whose lease expires will renew that lease or that it will be able to re-lease space on economically advantageous terms. The loss of rental revenues from a number of the Company’s major tenants and its inability to replace such tenants may adversely affect the Company’s profitability and its ability to meet debt and other financial obligations and make distributions to shareholders.
The Company Has Variable-Rate Debt and Is Subject to Interest Rate Risk
The Company has indebtedness with interest rates that vary depending upon the market index. In addition, the Company has revolving credit facilities that bear interest at a variable rate on any amounts drawn on the facilities. The Company may incur additional variable-rate debt in the future. Increases in interest rates on variable-rate debt would increase the Company’s interest expense, which would negatively affect net earnings and cash available for payment of its debt obligations and distributions to its shareholders.
The Company’s Ability to Increase Its Debt Could Adversely Affect Its Cash Flow
At December 31, 2012, the Company had outstanding debt of $4.3 billion (excluding its proportionate share of unconsolidated joint venture mortgage debt aggregating $0.7 billion as of December 31, 2012). The Company intends to maintain a conservative ratio of debt to total market capitalization (the sum of the aggregate market value of the Company’s common shares and operating partnership units, the liquidation preference on any preferred shares outstanding and its total consolidated indebtedness). The Company is subject to limitations under its credit facilities and indentures relating to its ability to incur additional debt; however, the Company’s organizational documents do not contain any limitation on the amount or percentage of indebtedness it may incur. If the Company were to become more highly leveraged, its cash needs to fund debt service would increase
8
Table of Contents
accordingly. Under such circumstances, the Company’s risk of decreases in cash flow, due to fluctuations in the real estate market, reliance on its major tenants, acquisition and development costs and the other factors discussed in these risk factors, could subject the Company to an even greater adverse impact on its financial condition and results of operations. In addition, increased leverage could increase the risk of default on the Company’s debt obligations, which could further reduce its cash available for distribution and adversely affect its ability to dispose of its portfolio on favorable terms, which could cause the Company to incur losses and reduce its cash flows.
Disruptions in the Financial Markets Could Affect the Company’s Ability to Obtain Financing on Reasonable Terms and Have Other Adverse Effects on the Company and the Market Price of the Company’s Common Shares
The U.S. and global equity and credit markets have experienced significant price volatility, dislocations and liquidity disruptions over the last few years, which caused market prices of many stocks to fluctuate substantially and the spreads on prospective debt financings to widen considerably. These circumstances materially affected liquidity in the financial markets, making terms for certain financings less attractive and, in certain cases, resulting in the unavailability of certain types of financing. Uncertainty in the equity and credit markets may negatively affect the Company’s ability to access additional financing at reasonable terms or at all, which may negatively affect the Company’s ability to refinance its debt, obtain new financing or make acquisitions. These circumstances may also adversely affect the Company’s tenants, including their ability to enter into new leases, pay their rents when due and renew their leases at rates at least as favorable as their current rates.
A prolonged downturn in the equity or credit markets may cause the Company to seek alternative sources of potentially less attractive financing and may require it to adjust its business plan accordingly. In addition, these factors may make it more difficult for the Company to sell properties or may adversely affect the price it receives for properties that it does sell, as prospective buyers may experience increased costs of financing or difficulties in obtaining financing. These events in the equity and credit markets may make it more difficult or costly for the Company to raise capital through the issuance of its common shares or debt securities. These disruptions in the financial markets also may have a material adverse effect on the market value of the Company’s common shares and other adverse effects on the Company or the economy in general. There can be no assurances that government responses to the disruptions in the financial markets will restore consumer confidence, stabilize the markets or increase liquidity and the availability of equity or credit financing.
Changes in the Company’s Credit Ratings or the Debt Markets, as well as Market Conditions in the Credit Markets, Could Adversely Affect the Company’s Publicly Traded Debt and Revolving Credit Facilities
The market value for the Company’s publicly traded debt depends on many factors, including the following:
| • |
The Company’s credit ratings with major credit rating agencies; |
| • |
The prevailing interest rates being paid by, or the market price for publicly traded debt issued by, other companies similar to the Company; |
| • |
The Company’s financial condition, liquidity, leverage, financial performance and prospects and |
| • |
The overall condition of the financial markets. |
The condition of the financial markets and prevailing interest rates have fluctuated in the past and are likely to fluctuate in the future. The U.S. credit markets and the sub-prime residential mortgage market have experienced severe dislocations and liquidity disruptions in the last few years. Furthermore, uncertain market conditions can be exacerbated by leverage. The occurrence of these circumstances in the credit markets and/or additional fluctuations in the financial markets and prevailing interest rates could have an adverse effect on the Company’s ability to access capital and its cost of capital.
9
Table of Contents
In addition, credit rating agencies continually review their ratings for the companies they follow, including the Company. The credit rating agencies also evaluate the real estate industry as a whole and may change their credit rating for the Company based on their overall view of the industry. Any rating organization that rates the Company’s publicly traded debt may lower the rating or decide not to rate the publicly traded debt in its sole discretion. The ratings of the Company’s publicly traded debt are based primarily on the rating organization’s assessment of the likelihood of timely payment of interest when due and the payment of principal on the maturity date. A negative change in the Company’s rating could have an adverse effect on the Company’s revolving credit facilities and market price of the Company’s publicly traded debt as well as the Company’s ability to access capital and its cost of capital.
The Company’s Cash Flows and Operating Results Could Be Adversely Affected by Required Payments of Debt or Related Interest and Other Risks of Its Debt Financing
The Company is generally subject to the risks associated with debt financing. These risks include the following:
| • |
The Company’s cash flow may not satisfy required payments of principal and interest; |
| • |
The Company may not be able to refinance existing indebtedness on its properties as necessary, or the terms of the refinancing may be less favorable to the Company than the terms of existing debt; |
| • |
Required debt payments are not reduced if the economic performance of any property declines; |
| • |
Debt service obligations could reduce funds available for distribution to the Company’s shareholders and funds available for development, redevelopment and acquisitions; |
| • |
Any default on the Company’s indebtedness could result in acceleration of those obligations, which could result in the acceleration of other debt obligations and possible loss of property to foreclosure and |
| • |
The Company may not be able to finance necessary capital expenditures for purposes such as re-leasing space on favorable terms or at all. |
If a property is mortgaged to secure payment of indebtedness and the Company cannot make the mortgage payments, it may have to surrender the property to the lender with a consequent loss of any prospective income and equity value from such property, which may also adversely affect the Company’s credit ratings. Any of these risks can place strains on the Company’s cash flows, reduce its ability to grow and adversely affect its results of operations.
The Company’s Financial Condition Could Be Adversely Affected by Financial Covenants
The Company’s credit facilities and the indentures under which its senior and subordinated unsecured indebtedness is, or may be, issued contain certain financial and operating covenants, including, among other things, leverage ratios and certain coverage ratios, as well as limitations on the Company’s ability to incur secured and unsecured indebtedness, sell all or substantially all of its assets and engage in mergers and certain acquisitions. These credit facilities and indentures also contain customary default provisions including the failure to pay principal and interest issued thereunder in a timely manner, the failure to comply with the Company’s financial and operating covenants, the occurrence of a material adverse effect on the Company and the failure of the Company or its majority-owned subsidiaries (i.e., entities in which the Company has a greater than 50% interest) to pay when due certain indebtedness in excess of certain thresholds beyond applicable grace and cure periods. These covenants could limit the Company’s ability to obtain additional funds needed to address cash shortfalls or pursue growth opportunities or transactions that would provide substantial return to its shareholders. In addition, a breach of these covenants could cause a default or accelerate some or all of the Company’s indebtedness, which could have a material adverse effect on its financial condition.
10
Table of Contents
Property Ownership Through Partnerships and Joint Ventures Could Limit the Company’s Control of Those Investments and Reduce Its Expected Return
Partnership or joint venture investments may involve risks not otherwise present for investments made solely by the Company, including the possibility that the Company’s partner or co-venturer might become bankrupt, that its partner or co-venturer might at any time have different interests or goals than the Company and that its partner or co-venturer may take action contrary to the Company’s instructions, requests, policies or objectives, including the Company’s policy with respect to maintaining its qualification as a REIT. Other risks of joint venture investments include impasse on decisions, such as a sale, because neither the Company’s partner or co-venturer nor the Company would have full control over the partnership or joint venture. These factors could limit the return that the Company receives from such investments or cause its cash flows to be lower than its estimates. There is no limitation under the Company’s Articles of Incorporation, or its code of regulations, as to the amount of funds that the Company may invest in partnerships or joint ventures. In addition, a partner or co-venturer may not have access to sufficient capital to satisfy its funding obligations to the joint venture. Furthermore, if credit conditions in the capital markets deteriorate, the Company could be required to reduce the carrying value of its equity method investments if a loss in the carrying value of the investment is considered an other than temporary decline. As of December 31, 2012, the Company had $613.0 million of investments in and advances to unconsolidated joint ventures holding 206 operating shopping centers.
The Company’s Real Estate Assets May Be Subject to Impairment Charges
On a periodic basis, the Company assesses whether there are any indicators that the value of its real estate assets and other investments may be impaired. A property’s value is impaired only if the estimate of the aggregate future cash flows (undiscounted and without interest charges) to be generated by the property are less than the carrying value of the property. In the Company’s estimate of cash flows, it considers factors such as expected future operating income, trends and prospects, the effects of demand, competition and other factors. If the Company is evaluating the potential sale of an asset or development alternatives, the undiscounted future cash flow considerations include the most likely course of action at the balance sheet date based on current plans, intended holding periods and available market information. The Company is required to make subjective assessments as to whether there are impairments in the value of its real estate assets and other investments. These assessments have a direct impact on the Company’s earnings because recording an impairment charge results in an immediate negative adjustment to earnings. There can be no assurance that the Company will not take additional charges in the future related to the impairment of its assets. Any future impairment could have a material adverse effect on the Company’s results of operations in the period in which the charge is taken.
The Company’s Acquisition Activities May Not Produce the Cash Flows That It Expects and May Be Limited by Competitive Pressures or Other Factors
The Company intends to acquire existing retail properties only to the extent that suitable acquisitions can be made on advantageous terms. Acquisitions of commercial properties entail risks, such as the following:
| • |
The Company’s estimates on expected occupancy and rental rates may differ from actual conditions; |
| • |
The Company’s estimates of the costs of any redevelopment or repositioning of acquired properties may prove to be inaccurate; |
| • |
The Company may be unable to operate successfully in new markets where acquired properties are located due to a lack of market knowledge or understanding of local economies; |
| • |
The properties may become subject to environmental liabilities that the Company was unaware of at the time the Company acquired the property; |
| • |
The Company may be unable to successfully integrate new properties into its existing operations or |
| • |
The Company may have difficulty obtaining financing on acceptable terms or paying the operating expenses and debt service associated with acquired properties prior to sufficient occupancy. |
11
Table of Contents
In addition, the Company may not be in a position or have the opportunity in the future to make suitable property acquisitions on advantageous terms due to competition for such properties with others engaged in real estate investment that may have greater financial resources than the Company. The Company’s inability to successfully acquire new properties may affect the Company’s ability to achieve its anticipated return on investment, which could have an adverse effect on its results of operations.
Real Estate Property Investments Are Illiquid; Therefore, the Company May Not Be Able to Dispose of Properties When Desired or on Favorable Terms
Real estate investments generally cannot be disposed of quickly. In addition, the federal income tax code imposes restrictions, which are not applicable to other types of real estate companies, on the ability of a REIT to dispose of properties. Therefore, the Company may not be able to diversify its portfolio in response to economic or other conditions promptly or on favorable terms, which could cause the Company to incur losses and reduce its cash flows and adversely affect distributions to shareholders.
The Company’s Development and Construction Activities Could Affect Its Operating Results
The Company intends to continue the selective development and construction of retail properties in accordance with its development underwriting policies as opportunities arise. The Company expects to phase in construction until sufficient pre-leasing is reached and financing is in place. The Company’s development and construction activities include the following risks:
| • |
The Company may abandon development opportunities after expending resources to determine feasibility; |
| • |
Construction costs of a project may exceed the Company’s original estimates; |
| • |
Occupancy rates and rents at a newly completed property may not be sufficient to make the property profitable; |
| • |
Rental rates per square foot could be less than projected; |
| • |
Financing may not be available to the Company on favorable terms for development of a property; |
| • |
The Company may not complete construction and lease-up on schedule, resulting in increased debt service expense and construction costs and |
| • |
The Company may not be able to obtain, or may experience delays in obtaining, necessary zoning, land use, building, occupancy and other required governmental permits and authorizations. |
Additionally, the time frame required for development, construction and lease-up of these properties means that the Company may wait several years for a significant cash return. If any of the above events occur, the development of properties may hinder the Company’s growth and have an adverse effect on its results of operations and cash flows. In addition, new development activities, regardless of whether they are ultimately successful, typically require substantial time and attention from management.
If the Company Fails To Qualify as a REIT in Any Taxable Year, It Will Be Subject to U.S. Federal Income Tax as a Regular Corporation and Could Have Significant Tax Liability
The Company intends to operate in a manner that allows it to qualify as a REIT for U.S. federal income tax purposes. However, REIT qualification requires that the Company satisfy numerous requirements (some on an annual or quarterly basis) established under highly technical and complex provisions of the Code, for which there are a limited number of judicial or administrative interpretations. The Company’s status as a REIT requires an analysis of various factual matters and circumstances that are not entirely within its control. Accordingly, it is not certain that the Company will be able to qualify and remain qualified as a REIT for U.S. federal income tax
12
Table of Contents
purposes. Even a technical or inadvertent violation of the REIT requirements could jeopardize the Company’s REIT qualification. Furthermore, Congress or the Internal Revenue Service (“IRS”) might change the tax laws or regulations and the courts could issue new rulings, in each case potentially having retroactive effect that could make it more difficult or impossible for the Company to continue to qualify as a REIT. If the Company fails to qualify as a REIT in any tax year, the following would result:
| • |
The Company would be taxed as a regular domestic corporation, which, among other things, means that it would be unable to deduct distributions to its shareholders in computing its taxable income and would be subject to U.S. federal income tax on its taxable income at regular corporate rates; |
| • |
Any resulting tax liability could be substantial and would reduce the amount of cash available for distribution to shareholders and could force the Company to liquidate assets or take other actions that could have a detrimental effect on its operating results and |
| • |
Unless the Company were entitled to relief under applicable statutory provisions, it would be disqualified from treatment as a REIT for the four taxable years following the year during which the Company lost its qualification, and its cash available for debt service obligations and distribution to its shareholders, therefore, would be reduced for each of the years in which the Company does not qualify as a REIT. |
Even if the Company remains qualified as a REIT, it may face other tax liabilities that reduce its cash flow. The Company may also be subject to certain federal, state and local taxes on its income and property either directly or at the level of its subsidiaries. Any of these taxes would decrease cash available for debt service obligations and distribution to the Company’s shareholders.
Compliance with REIT Requirements May Negatively Affect the Company’s Operating Decisions
To maintain its status as a REIT for U.S. federal income tax purposes, the Company must meet certain requirements on an ongoing basis, including requirements regarding its sources of income, the nature and diversification of its assets, the amounts the Company distributes to its shareholders and the ownership of its shares. The Company may also be required to make distributions to its shareholders when it does not have funds readily available for distribution or at times when the Company’s funds are otherwise needed to fund capital expenditures or debt service obligations.
As a REIT, the Company must distribute at least 90% of its annual net taxable income (excluding net capital gains) to its shareholders. To the extent that the Company satisfies this distribution requirement, but distributes less than 100% of its net taxable income, the Company will be subject to U.S. federal corporate income tax on its undistributed taxable income. In addition, the Company will be subject to a 4% non-deductible excise tax if the actual amount paid to its shareholders in a calendar year is less than the minimum amount specified under U.S. federal tax laws. From time to time, the Company may generate taxable income greater than its income for financial reporting purposes, or its net taxable income may be greater than its cash flow available for distribution to its shareholders. If the Company does not have other funds available in these situations, it could be required to borrow funds, sell its securities or a portion of its properties at unfavorable prices or find other sources of funds in order to meet the REIT distribution requirements and avoid corporate income tax and the 4% excise tax.
In addition, the REIT provisions of the Code impose a 100% tax on income from “prohibited transactions.” Prohibited transactions generally include sales of assets that constitute inventory or other property held for sale to customers in the ordinary course of business, other than foreclosure property. This 100% tax could affect the Company’s decisions to sell property if it believes such sales could be treated as a prohibited transaction. However, the Company would not be subject to this tax if it were to sell assets through its TRS. The Company will also be subject to a 100% tax on certain amounts if the economic arrangements between the Company and its TRS are not comparable to similar arrangements among unrelated parties.
13
Table of Contents
Dividends Paid by REITs Generally Do Not Qualify for Reduced Tax Rates
In general, the maximum U.S. federal income tax rate for dividends paid to individual U.S. shareholders is 20%. Due to its REIT status, the Company’s distributions to individual shareholders generally are not eligible for the reduced rates.
The Company’s Inability to Realize Anticipated Returns from Its Retail Real Estate Investments Outside the United States Could Adversely Affect Its Results of Operations
The Company may not realize the intended benefits of transactions outside the United States, as the Company may not have any prior experience with the local economies or culture. The assets may not perform as well as the Company anticipated or may not be successfully integrated, or the Company may not realize the improvements in occupancy and operating results that it anticipated. The Company could be subject to local laws governing these properties, with which it has no prior experience, and which may present new challenges for the management of the Company’s operations. In addition, financing may not be available at acceptable rates, and equity requirements may be different from the Company’s strategy in the United States. Each of these factors may adversely affect the Company’s ability to achieve anticipated return on investment, which could have an adverse effect on its results of operations.
The Company’s Investments in Real Estate Assets Outside United States Will Be Subject to Additional Risks
International investments and operations generally are subject to various political and other risks that are different from and in addition to risks inherent in the investment in real estate generally discussed in these risk factors and elsewhere in this Annual Report on Form 10-K for the year ended December 31, 2012. The Company’s investments in consolidated and unconsolidated joint ventures with international real estate assets in Brazil, Russia and Canada will be subject to fluctuations in foreign currency exchange rates and the uncertainty of foreign laws and markets including, but not limited to, unexpected changes in the regulatory requirements such as the enactment of laws prohibiting or restricting the foreign ownership of property, political and economic instability in certain geographic locations, labor disruptions, difficulties in managing international operations, potentially adverse tax consequences, laws restricting the Company’s ability to return profits to the United States, additional accounting and control expenses and the administrative burden associated with complying with a variety of foreign laws. Furthermore, the Company is subject to laws and regulations, such as the Foreign Corrupt Practices Act or similar local anti-bribery laws, that generally prohibit companies and their employees, agents and contractors from making improper payments to governmental officials for the purpose of obtaining or retaining business. Failure to comply with these laws could subject the Company to civil and criminal penalties that could materially adversely affect the Company’s results of operations or the value of the Company’s international investments.
Changes in foreign currency exchange rates may also adversely impact the fair values and earnings streams of the Company’s international holdings and thus the returns on the Company’s non-U.S.-dollar denominated investments. Although the Company may hedge some or all of its foreign currency risk, subject to the REIT income qualification tests, the Company may not be able to do so successfully and may incur losses on these investments as a result of exchange rate fluctuations.
The Company Is Subject to Litigation That Could Adversely Affect Its Results of Operations
The Company is a defendant from time to time in lawsuits and regulatory proceedings relating to its business. Due to the inherent uncertainties of litigation and regulatory proceedings, the Company cannot accurately predict the ultimate outcome of any such litigation or proceedings. An unfavorable outcome could adversely affect the Company’s business, financial condition or results of operations.
14
Table of Contents
Any such litigation could also lead to increased volatility of the trading price of the Company’s common shares. For a further discussion of litigation risks, see “Legal Matters” in Note 9 — Commitments and Contingencies to the Consolidated Financial Statements.
The Company’s Real Estate Investments May Contain Environmental Risks That Could Adversely Affect Its Results of Operations
The acquisition of properties may subject the Company to liabilities, including environmental liabilities. The Company’s operating expenses could be higher than anticipated due to the cost of complying with existing or future environmental laws and regulations. In addition, under various federal, state and local laws, ordinances and regulations, the Company may be considered an owner or operator of real property or to have arranged for the disposal or treatment of hazardous or toxic substances. As a result, the Company may become liable for the costs of removal or remediation of certain hazardous substances released on or in its properties. The Company may also be liable for other potential costs that could relate to hazardous or toxic substances (including governmental fines and injuries to persons and property). The Company may incur such liability whether or not it knew of, or was responsible for, the presence of such hazardous or toxic substances. Such liability could be of substantial magnitude and divert management’s attention from other aspects of the Company’s business and, as a result, could have a material adverse effect on the Company’s operating results and financial condition, as well as its ability to make distributions to shareholders.
An Uninsured Loss on the Company’s Properties or a Loss That Exceeds the Limits of the Company’s Insurance Policies Could Subject the Company to Lost Capital or Revenue on Those Properties
Under the terms and conditions of the leases currently in effect on the Company’s properties, tenants generally are required to indemnify and hold the Company harmless from liabilities resulting from injury to persons, air, water, land or property, on or off the premises, due to activities conducted on the properties, except for claims arising from the negligence or intentional misconduct of the Company or its agents. Additionally, tenants are generally required, at the tenant’s expense, to obtain and keep in full force during the term of the lease liability and full replacement value property damage insurance policies. The Company has obtained comprehensive liability, casualty, flood and rental loss insurance policies on its properties. All of these policies may involve substantial deductibles and certain exclusions. In addition, tenants could fail to properly maintain their insurance policies or be unable to pay the deductibles. Should a loss occur that is uninsured or is in an amount exceeding the combined aggregate limits for the policies noted above, or in the event of a loss that is subject to a substantial deductible under an insurance policy, the Company could lose all or part of its capital invested in, and anticipated revenue from, one or more of the properties, which could have a material adverse effect on the Company’s operating results and financial condition, as well as its ability to make distributions to shareholders.
The Company’s Properties Could Be Subject to Damage from Weather-Related Factors
A number of the Company’s properties are located in areas that are subject to natural disasters. Certain of the Company’s properties are located in California and in other areas with higher risk of earthquakes. In addition, many of the Company’s properties are located in coastal regions, including 15 properties located on the island of Puerto Rico as of February 15, 2013, and would therefore be affected by any future increases in sea levels or in the frequency or severity of hurricanes and tropical storms, whether such increases are caused by global climate changes or other factors.
Compliance with the Americans with Disabilities Act and Fire, Safety and Other Regulations May Require the Company to Make Unplanned Expenditures That Adversely Affect the Company’s Cash Flows
All of the Company’s properties are required to comply with the Americans with Disabilities Act, or ADA. The ADA has separate compliance requirements for “public accommodations” and “commercial facilities,” but
15
Table of Contents
generally requires that buildings be made accessible to people with disabilities. Compliance with the ADA requirements could require removal of access barriers, and non-compliance could result in imposition of fines by the U.S. government or an award of damages to private litigants, or both. While the tenants to whom the Company leases properties are obligated by law to comply with the ADA provisions, and are typically obligated to cover costs of compliance, if required changes involve greater expenditures than anticipated, or if the changes must be made on a more accelerated basis than anticipated, the ability of these tenants to cover costs could be adversely affected. As a result, the Company could be required to expend funds to comply with the provisions of the ADA, which could adversely affect the results of operations and financial condition and the Company’s ability to make distributions to shareholders. In addition, the Company is required to operate the properties in compliance with fire and safety regulations, building codes and other land use regulations, as they may be adopted by governmental agencies and bodies and become applicable to the properties. The Company may be required to make substantial capital expenditures to comply with those requirements, and these expenditures could have a material adverse effect on its ability to meet its financial obligations and make distributions to shareholders.
The Company’s Articles of Incorporation Contain Limitations on Acquisitions and Changes in Control
In order to maintain the Company’s status as a REIT, its Articles of Incorporation prohibit any person, except for certain shareholders as set forth in the Company’s Articles of Incorporation, from owning more than 5% of the Company’s outstanding common shares. This restriction is likely to discourage third parties from acquiring control of the Company without consent of its Board of Directors even if a change in control were in the best interests of shareholders.
The Company Has a Number of Shareholders Who Beneficially Own a Significant Portion of Its Outstanding Common Shares, and Their Interests May Differ from the Interests of Other Shareholders
The Company’s significant shareholders are in a position to influence any matters that are brought to a vote of the holders of the Company’s common shares, including, among others, the election of the Company’s Board of Directors and any amendments to its Articles of Incorporation and code of regulations. Without the support of the Company’s significant shareholders, certain transactions, such as mergers, tender offers, sales of assets and business combinations that could give shareholders the opportunity to realize a premium over the then-prevailing market prices for common shares may be more difficult to consummate. The interests of the Company’s significant shareholders may differ from the interests of other shareholders. If the Company’s significant shareholders sell substantial amounts of the Company’s common shares in the public market, the trading price of the Company’s common shares could decline significantly.
Changes in Market Conditions Could Adversely Affect the Market Price of the Company’s Publicly Traded Securities
As with other publicly traded securities, the market price of the Company’s publicly traded securities depends on various market conditions, which may change from time to time. Among the market conditions that may affect the market price of the Company’s publicly traded securities are the following:
| • |
The extent of institutional investor interest in the Company; |
| • |
The reputation of REITs generally and the reputation of REITs with similar portfolios; |
| • |
The attractiveness of the securities of REITs in comparison to securities issued by other entities (including securities issued by other real estate companies); |
| • |
The Company’s financial condition and performance; |
| • |
The market’s perception of the Company’s growth potential and future cash dividends; |
| • |
An increase in market interest rates, which may lead prospective investors to demand a higher distribution rate in relation to the price paid for the Company’s shares and |
| • |
General economic and financial market conditions. |
16
Table of Contents
The Company May Issue Additional Securities Without Shareholder Approval
The Company can issue preferred shares and common shares without shareholder approval subject to certain limitations in the Company’s Articles of Incorporation. Holders of preferred shares have priority over holders of common shares, and the issuance of additional shares reduces the interest of existing holders in the Company.
| Item 1B. | UNRESOLVED STAFF COMMENTS |
None.
| Item 2. | PROPERTIES |
At December 31, 2012, the Portfolio Properties included 452 shopping centers (including 206 centers owned through unconsolidated joint ventures and three that were otherwise consolidated by the Company). The shopping centers consist of 434 community shopping centers and 18 enclosed malls and lifestyle centers. At December 31, 2012, the Portfolio Properties also included more than 1,500 acres of undeveloped land, primarily development sites and parcels, located adjacent to certain of the shopping centers. At December 31, 2012, the shopping centers aggregated 89.2 million square feet of Company-owned GLA (115.7 million square feet of total GLA) located in 39 states, plus Puerto Rico and Brazil. These centers are principally in the Southeast and Midwest, with significant concentrations in Florida, Georgia, New York, North Carolina and Ohio. The Company also owns land in Canada and Russia.
The Company’s shopping centers are designed to attract local area customers and are typically anchored by two or more national tenant anchors (such as Walmart, Kohl’s or Target). The properties often include a supermarket, drug store, junior department store and/or other major “category-killer” discount retailers as additional anchors or tenants. The tenants of the shopping centers typically offer day-to-day necessities rather than high-priced luxury items. As one of the nation’s largest owners and operators of shopping centers (measured by total GLA), the Company has established close relationships with a large number of major national and regional retailers, many of which occupy space in the shopping centers.
At December 31, 2012, shopping centers made up the largest portion of the Company’s portfolio, constituting 82.1 million square feet (92.1% square feet of Company-owned GLA), while enclosed malls and lifestyle centers accounted for 7.1 million square feet (7.9% of Company-owned GLA). At December 31, 2012, the average annualized base rent per square foot of Company-owned GLA of the Company’s 243 wholly-owned shopping centers was $12.92. For the 206 shopping centers owned through unconsolidated joint ventures and three consolidated joint ventures, annualized base rent per square foot was $14.58 at December 31, 2012.
The Company’s average annualized base rent per square foot does not consider tenant expense reimbursements. The Company generally does not enter into significant tenant concessions on a lease by lease basis.
Information as to the Company’s 10 largest tenants based on total annualized rental revenues and Company-owned GLA at December 31, 2012, is set forth in “Management’s Discussion and Analysis of Financial Condition and Results of Operations” included in Item 7 of this Annual Report on Form 10-K for the year ended December 31, 2012. In addition, as of December 31, 2012, unless otherwise indicated, with respect to the 452 shopping centers:
| • |
135 of these properties are anchored by a Walmart, Kohl’s or Target store; |
| • |
These properties range in size from approximately 9,500 square feet to approximately 1,500,000 square feet of total GLA (with 233 properties exceeding 200,000 square feet of total GLA, of which 87 properties exceed 400,000 square feet of total GLA); |
| • |
72.2% of the aggregate Company-owned GLA of these properties is leased to national tenants, including subsidiaries of national tenants, 11.5% is leased to regional tenants, and 7.8% is leased to local tenants; |
17
Table of Contents
| • |
91.5% of the aggregate Company-owned GLA of these properties was occupied as of December 31, 2012. With respect to the properties owned by the Company, including its unconsolidated joint ventures, as of December 31 of each of the last five years beginning with 2008, between 86.8% and 92.1% of the aggregate Company-owned GLA of these properties was occupied and |
| • |
The Company had 14 assets under development and/or redevelopment (consisting of 11 wholly-owned shopping centers and three joint venture shopping centers). |
Tenant Lease Expirations and Renewals
The following table shows the impact of tenant lease expirations through 2022 at the Company’s 243 wholly-owned shopping centers, assuming that none of the tenants exercise any of their renewal options:
|
Expiration Year |
No. of
Leases Expiring |
Approximate
GLA in Square Feet (Thousands) |
Annualized
Base Rent Under Expiring Leases (Thousands) |
Average
Base Rent per Square Foot Under Expiring Leases |
Percentage of
Total GLA Represented by Expiring Leases |
Percentage of
Total Base Rental Revenues Represented by Expiring Leases |
||||||||||||||||||
|
2013 |
571 | 3,099 | $ | 46,744 | $ | 15.08 | 6.7 | % | 8.7 | % | ||||||||||||||
|
2014 |
604 | 4,756 | 62,735 | 13.19 | 10.2 | % | 11.7 | % | ||||||||||||||||
|
2015 |
580 | 5,191 | 65,773 | 12.67 | 11.2 | % | 12.3 | % | ||||||||||||||||
|
2016 |
588 | 5,378 | 75,695 | 14.08 | 11.6 | % | 14.2 | % | ||||||||||||||||
|
2017 |
512 | 6,472 | 74,418 | 11.50 | 13.9 | % | 13.9 | % | ||||||||||||||||
|
2018 |
277 | 3,505 | 44,390 | 12.66 | 7.5 | % | 8.3 | % | ||||||||||||||||
|
2019 |
145 | 2,811 | 33,991 | 12.09 | 6.1 | % | 6.4 | % | ||||||||||||||||
|
2020 |
117 | 1,355 | 18,466 | 13.63 | 2.9 | % | 3.5 | % | ||||||||||||||||
|
2021 |
167 | 3,084 | 35,476 | 11.51 | 6.6 | % | 6.6 | % | ||||||||||||||||
|
2022 |
187 | 2,829 | 36,127 | 12.77 | 6.1 | % | 6.8 | % | ||||||||||||||||
|
|
|
|
|
|
|
|
|
|
|
|
|
|||||||||||||
|
Total |
3,748 | 38,480 | $ | 493,815 | $ | 12.83 | 82.8 | % | 92.4 | % | ||||||||||||||
|
|
|
|
|
|
|
|
|
|
|
|
|
|||||||||||||
The following table shows the impact of tenant lease expirations at the joint venture level through 2022 at the Company’s 206 shopping centers owned through unconsolidated joint ventures and three consolidated joint ventures, assuming that none of the tenants exercise any of their renewal options:
|
Expiration
|
No. of
Leases Expiring |
Approximate
GLA in Square Feet (Thousands) |
Annualized
Base Rent Under Expiring Leases (Thousands) |
Average
Base Rent per Square Foot Under Expiring Leases |
Percentage of
Total GLA Represented by Expiring Leases |
Percentage of
Total Base Rental Revenues Represented by Expiring Leases |
||||||||||||||||||
|
2013 |
895 | 3,016 | $ | 56,811 | $ | 18.84 | 8.1 | % | 11.8 | % | ||||||||||||||
|
2014 |
849 | 4,697 | 71,920 | 15.31 | 12.6 | % | 14.9 | % | ||||||||||||||||
|
2015 |
698 | 4,272 | 63,001 | 14.75 | 11.5 | % | 13.0 | % | ||||||||||||||||
|
2016 |
679 | 4,528 | 69,131 | 15.27 | 12.2 | % | 14.3 | % | ||||||||||||||||
|
2017 |
788 | 4,505 | 73,704 | 16.36 | 12.1 | % | 15.3 | % | ||||||||||||||||
|
2018 |
179 | 2,643 | 32,941 | 12.46 | 7.1 | % | 6.8 | % | ||||||||||||||||
|
2019 |
94 | 2,060 | 26,253 | 12.74 | 5.5 | % | 5.4 | % | ||||||||||||||||
|
2020 |
77 | 1,632 | 17,443 | 10.69 | 4.4 | % | 3.6 | % | ||||||||||||||||
|
2021 |
104 | 1,701 | 22,800 | 13.40 | 4.6 | % | 4.7 | % | ||||||||||||||||
|
2022 |
109 | 2,149 | 24,904 | 11.59 | 5.8 | % | 5.2 | % | ||||||||||||||||
|
|
|
|
|
|
|
|
|
|
|
|
|
|||||||||||||
|
Total |
4,472 | 31,203 | $ | 458,908 | $ | 14.71 | 83.9 | % | 95.0 | % | ||||||||||||||
|
|
|
|
|
|
|
|
|
|
|
|
|
|||||||||||||
The rental payments under certain of these leases will remain constant until the expiration of their base terms, regardless of inflationary increases. There can be no assurance that any of these leases will be renewed or that any replacement tenants will be obtained if not renewed.
18
Table of Contents
DDR Corp.
Shopping Center Property List at December 31, 2012
|
Location |
Center/Property |
Zip
Code |
Type of
Property (1) |
Ownership
Interest |
Year
Developed/ Redeveloped |
Year
Acquired |
DDR
Ownership Interest |
Company
Owned Gross Leasable Area (SF) |
Total
Annualized Base Rent |
Average
Base Rent (Per SF) (2) |
Anchor Tenants |
|||||||||||||||||||||||||||
| Brazil | ||||||||||||||||||||||||||||||||||||||
| 1 | Campinas |
Parque Dom Pedro Avenue Guilherme Campos, 500 |
01387-001 | MM | Fee | 2001/2010 | 2006 | 29.9 | % | 1,143,950 | $ | 37,867,712 | $ | 34.25 | Barbacoa, Bodytech, Casas Bahia, C&A, Centauro, Colombo, Etna, Fast Shop, Fnac, Le Biscuit, Livraria Leitura, Lojas Americanas, Marisa, Me Move, Multiplex, Pernambucanas, Renner, Riachuelo, Telhanorte, Walmart, Zara | |||||||||||||||||||||||
| 2 | Franca |
Franca Shopping Avenue Rio Negro, 1100 |
14406-901 | MM | Fee | 1993 | 2006 | 25.6 | % | 199,438 | $ | 3,951,402 | $ | 19.99 | C&A, C&C , Casas Bahia, Centauro, Lojas Americanas, Magazine Luiza, Marisa, Moviecom, Renner | |||||||||||||||||||||||
| 3 | Manaus |
Manauara Shopping Avenue Mario Ypiranga,1300 |
69057-002 | MM | Fee (3) | 2009 | 2007 | 33.3 | % | 505,229 | $ | 17,143,109 | $ | 34.34 | Bemol, C&A, Centauro, Cia Athletica, Dinamica, Hitech Imports, Marisa, Pbkids Brinquedos, Playarte, Ramsons, Renner, Riachuelo, Saraiva Mega Store, Siberian/Crawford | |||||||||||||||||||||||
| 4 | Sao Paulo |
Campo Limpo Shopping Estrada Do Campo Limpo 459 |
05777-001 | MM | Fee | 2005/2011 | 2006 | 6.7 | % | 239,735 | $ | 7,215,154 | $ | 30.32 | B-Mart, C&A, Casas Bahia, Cinema Multiplex, Extra, Lojas Marabraz, Marisa, Zelo | |||||||||||||||||||||||
| 5 | Sao Paulo |
Plaza Sul Praca Leonor Kaupa |
04151-100 | MM | Fee | 1994 | 2006 | 20 | % | 251,087 | $ | 13,557,381 | $ | 55.18 | Camicado, C&A, Lojas Americanas, Luigi Bertolli, Monday Academia, Playarte, Renner | |||||||||||||||||||||||
| 6 | Sao Paulo |
Boavista Shopping Rua Borba Gato, 59 |
04747-030 | MM | Fee (3) | 2004 | 2006 | 33.3 | % | 171,554 | $ | 3,742,888 | $ | 24.20 | Americanas Express, C&A, Centauro, Marisa, Moviecom, Sonda | |||||||||||||||||||||||
| 7 | Sao Bernardo Do C |
Shopping Metropole Praca Samuel Sabatine, 200 |
09750-902 | MM | Fee (3) |
1980/1995/
1997/2011 |
2006 | 33.3 | % | 286,596 | $ | 13,203,424 | $ | 46.20 | B-Mart, C&A, Lojas Americanas, Fastshop, Marisa, Outback, Playarte, Playland, Renner, Zelo | |||||||||||||||||||||||
| 8 | Uberlandia - Mg - |
Uberlandia Shopping Avenue Paulo Gracindo, 15 |
38411-145 | MM | Fee (3) | 2012 | 1 | * | 33.3 | % | 487,920 | $ | 7,514,489 | $ | 17.12 | B-Mart, Centauro, Cinemark, Fastshop, Kalunga, Le Biscuit, Le Lis Blanc, Leroy Merlin, Luigi Bertolli, Ponto Frio, Renner, Walmart | ||||||||||||||||||||||
|
|
United States and Puerto Rico |
|||||||||||||||||||||||||||||||||||||
| Alabama | ||||||||||||||||||||||||||||||||||||||
| 9 | Birmingham, AL |
Brook Highland Plaza 5291 Highway 280 South |
35242 | SC | Fee | 1994/2003 | 1994 | 100 | % | 551,898 | $ | 4,315,451 | $ | 9.95 | Big Lots, Books-A-Million, Dick’s Sporting Goods, HomeGoods, Lowe’s, Michaels, OfficeMax, Ross Dress For Less, Stein Mart | |||||||||||||||||||||||
| 10 | Birmingham, AL |
Riverchase Promenade Montgomery Highway |
35244 | SC | Fee (3) | 1989 | 2012 | 5 | % | 120,108 | $ | 1,756,202 | $ | 16.34 | 2nd & Charles (Not Owned), Jo-Ann Fabric and Craft Stores, Toys “R” Us (Not Owned) | |||||||||||||||||||||||
| 11 | Birmingham, AL |
River Ridge U.S. Highway 280 |
35242 | SC | Fee (3) | 2001 | 2007 | 15 | % | 172,262 | $ | 2,289,979 | $ | 17.26 | Best Buy, Staples, Target (Not Owned) | |||||||||||||||||||||||
| 12 | Dothan, AL |
Shops on the Circle 3500 Ross Clark Circle |
36303 | SC | Fee | 2000 | 2007 | 100 | % | 182,991 | $ | 1,891,596 | $ | 10.52 | Big Lots, OfficeMax, Old Navy, T.J. Maxx | |||||||||||||||||||||||
| 13 | Florence, AL |
Cox Creek Shopping Center 374-398 Cox Creek Parkway |
35360 | SC | Fee (3) | 2001 | 2007 | 15 | % | 173,940 | $ | 1,659,248 | $ | 10.82 | Best Buy, Burke’s Outlet, Dick’s Sporting Goods, Sam’s Club (Not Owned), Target (Not Owned) | |||||||||||||||||||||||
| 14 | Huntsville, AL |
Westside Centre 6275 University Drive |
35806 | SC | Fee (3) | 2002 | 2007 | 15 | % | 476,146 | $ | 4,262,700 | $ | 12.45 | Big Lots, Dick’s Sporting Goods, Marshalls, Michaels, Ross Dress For Less, Stein Mart, Target (Not Owned) | |||||||||||||||||||||||
| 15 | Scottsboro, AL |
Scottsboro Marketplace 24833 John P. Reid Parkway |
35766 | SC | Fee | 1999 | 2003 | 100 | % | 40,560 | $ | 303,540 | $ | 8.44 | Burke’s Outlet, Walmart (Not Owned) | |||||||||||||||||||||||
| 16 | Tuscaloosa, AL |
McFarland Plaza 2600 Mcfarland Boulevard East |
35404 | SC | Fee (3) | 1999 | 2007 | 15 | % | 234,146 | $ | 1,566,645 | $ | 8.01 | Michaels, OfficeMax, Ross Dress For Less, Stein Mart, Toys “R” Us | |||||||||||||||||||||||
| Arizona | ||||||||||||||||||||||||||||||||||||||
| 17 | Phoenix, AZ |
Deer Valley Towne Center
2805 West Aqua Fria Freeway |
85027 | SC | Fee | 1996 | 1999 | 100 | % | 197,009 | $ | 3,418,317 | $ | 17.21 | AMC Theatres (Not Owned), Michaels, OfficeMax, PetSmart, Ross Dress For Less, Target (Not Owned) | |||||||||||||||||||||||
| 18 | Phoenix, AZ |
Ahwatukee Foothills Towne
Center 4711 East Ray Road |
85044 | SC | Fee | 1996/1997/1999 | 1998 | 100 | % | 666,979 | $ | 9,465,299 | $ | 15.93 | AMC Theatres, Ashley Furniture, Babies “R” Us, Barnes & Noble, Best Buy, Jo-Ann Fabric and Craft Stores, OfficeMax, Old Navy, Party City, Petco, RoomStore, Ross Dress For Less, Sprouts Farmers Market | |||||||||||||||||||||||
19
Table of Contents
DDR Corp.
Shopping Center Property List at December 31, 2012
|
Location |
Center/Property |
Zip
Code |
Type of
Property (1) |
Ownership
Interest |
Year
Developed/ Redeveloped |
Year
Acquired |
DDR
Ownership Interest |
Company
Owned Gross Leasable Area (SF) |
Total
Annualized Base Rent |
Average
Base Rent (Per SF) (2) |
Anchor Tenants |
|||||||||||||||||||||||||||
| 19 | Phoenix, AZ |
Arrowhead Crossing
7553 West Bell Road |
85382 | SC | Fee | 1995 | 1996 | 100 | % | 346,327 | $ | 4,562,656 | $ | 13.79 | Barnes & Noble, David’s Bridal (Not Owned), DSW, Golfsmith, Hobby Lobby, HomeGoods, Nordstrom Rack, Savers (Not Owned), Staples, T.J. Maxx | |||||||||||||||||||||||
| 20 | Phoenix, AZ |
Paradise Village Gateway
Tatum and Shea Boulevards |
85028 | SC | Fee | 1997/2004 | 2003 | 67 | % | 295,311 | $ | 4,712,693 | $ | 19.51 | Albertsons, Bed Bath & Beyond, PetSmart, Ross Dress For Less, Staples | |||||||||||||||||||||||
| 21 | Tucson, AZ | Tucson Spectrum Shopping Center Southwest Corner I-19 and Irvington Road | 85706 | SC | Fee | 2008 | 2012 | 100 | % | 709,811 | $ | 9,251,735 | $ | 15.77 | Bed Bath & Beyond, Best Buy, Dollar Tree, Food City, Harkins Theatre, JCPenney, LA Fitness, Marshalls, Michaels, OfficeMax, Old Navy, Party City, PetSmart, Ross Dress For Less, Sports Authority, Home Depot (Not Owned), Target (Not Owned) | |||||||||||||||||||||||
| Arkansas | ||||||||||||||||||||||||||||||||||||||
| 22 | Fayetteville, AR |
Steele Crossing
3533-3595 North Shiloh Drive |
72703 | SC | Fee (3) | 2003 | 2012 | 5 | % | 136,898 | $ | 949,225 | $ | 15.37 | Kohl’s, Target (Not Owned) | |||||||||||||||||||||||
| 23 | Fayetteville, AR |
Spring Creek Centre
464 East Joyce Boulevard |
72703 | SC | Fee (3) |
1997/1999/
2000/ 2001 |
2012 | 5 | % | 262,233 | $ | 2,792,497 | $ | 12.27 | Bed Bath & Beyond, Best Buy, Home Depot (Not Owned), Old Navy, T.J. Maxx, Walmart (Not Owned) | |||||||||||||||||||||||
| 24 | North Little Rock, AR |
McCain Plaza
4124 East McCain Boulevard |
72117 | SC | Fee | 1991/2004 | 1994 | 100 | % | 295,013 | $ | 2,000,352 | $ | 7.68 | Bed Bath & Beyond, Burlington Coat Factory, Cinemark, Michaels, Ross Dress For Less, T.J. Maxx | |||||||||||||||||||||||
| 25 | Russellville, AR |
Valley Park Centre
3093 East Main Street |
72801 | SC | Fee | 1992 | 1994 | 100 | % | 280,665 | $ | 2,089,160 | $ | 7.78 | Belk, Hobby Lobby, JCPenney, T.J. Maxx | |||||||||||||||||||||||
| California | ||||||||||||||||||||||||||||||||||||||
| 26 | Long Beach, CA |
The Pike at Rainbow Harbor
95 South Pine Avenue |
90802 | SC | GL | 2005 | 1 | * | 100 | % | 339,978 | $ | 4,187,832 | $ | 20.62 | Cinemark, KDB | ||||||||||||||||||||||
| 27 | Oceanside, CA |
Ocean Place Cinemas
401-409 Mission Avenue |
92054 | SC | Fee | 2000 | 2000 | 100 | % | 79,804 | $ | 1,452,879 | $ | 18.49 | Regal Cinemas | |||||||||||||||||||||||
| 28 | Pasadena, CA |
Paseo Colorado
280 East Colorado Boulevard |
91101 | LC | Fee | 2001 | 2003 | 100 | % | 556,271 | $ | 8,408,816 | $ | 18.58 | Arclight Cinemas, DSW, Equinox, Gelson’s Market | |||||||||||||||||||||||
| 29 | Richmond, CA |
Hilltop Plaza
3401 Blume Drive |
94803 | SC | Fee (3) | 1996/2000 | 2002 | 20 | % | 245,774 | $ | 2,132,739 | $ | 14.38 | 99¢ Only, Century Theatres, Ross Dress For Less | |||||||||||||||||||||||
| 30 | San Francisco, CA |
Van Ness Plaza
1000 Van Ness Avenue |
94109 | SC | Fee | 1998 | 2002 | 100 | % | 122,844 | $ | 3,886,404 | $ | 36.61 | AMC Theatres, The Studio Mix | |||||||||||||||||||||||
| 31 | Valencia, CA |
River Oaks Shopping Center
24235 Magic Mountain Parkway |
91355 | SC | GL | 1986/2010 | 2006 | 100 | % | 76,387 | $ | 1,412,907 | $ | 16.56 | buybuy BABY, Sprouts Farmers Market | |||||||||||||||||||||||
| Colorado | ||||||||||||||||||||||||||||||||||||||
| 32 | Aurora, CO |
Pioneer Hills
5400-5820 South Parker |
80012 | SC | Fee (3) | 2003 | 2012 | 5 | % | 139,499 | $ | 2,163,661 | $ | 17.41 | Bed Bath & Beyond, Home Depot (Not Owned), Walmart (Not Owned) | |||||||||||||||||||||||
| 33 | Broomfield, CO |
Flatiron Marketplace
1 West Flatiron Circle |
80021 | SC | Fee | 2001 | 2003 | 100 | % | 252,249 | $ | 2,510,896 | $ | 18.65 | Best Buy | |||||||||||||||||||||||
| 34 | Centennial, CO |
Centennial Promenade
9555 East County Line Road |
80223 | SC | Fee | 1997/2002 | 1997 | 100 | % | 407,964 | $ | 5,981,157 | $ | 17.81 | Golfsmith, Michaels, OfficeMax, REI (Not Owned), Ross Dress For Less, Stickley Furniture, Toys “R” Us, WoW (Not Owned) | |||||||||||||||||||||||
| 35 | Colorado Springs, CO |
Chapel Hills East
7625-7675 North Academy Boulevard |
80920 | SC | Fee | 1996/2000 | 2011 | 100 | % | 178,252 | $ | 1,876,724 | $ | 11.29 | Best Buy, DSW, OfficeMax, Old Navy, Pep Boys, Whole Foods | |||||||||||||||||||||||
| 36 | Denver, CO |
University Hills
2730 South Colorado Boulevard |
80222 | SC | Fee | 1997 | 2003 | 100 | % | 244,607 | $ | 3,947,743 | $ | 17.19 | 24 Hour Fitness, King Soopers, Michaels, OfficeMax, Pier 1 Imports | |||||||||||||||||||||||
| 37 | Denver, CO |
Tamarac Outparcels
7777 East Hampden |
80231 | SC | Fee | 1976 | 2001 | 100 | % | 41,103 | $ | 463,944 | $ | 14.68 | ||||||||||||||||||||||||
| 38 | Fort Collins, CO | Mulberry and Lemay Crossing Mulberry Street and South Lemay Avenue | 80525 | SC | Fee | 2004 | 2003 | 100 | % | 18,988 | $ | 485,920 | $ | 25.59 | Home Depot (Not Owned), Walmart (Not Owned) | |||||||||||||||||||||||
20
Table of Contents
DDR Corp.
Shopping Center Property List at December 31, 2012
|
Location |
Center/Property |
Zip
Code |
Type of
Property (1) |
Ownership
Interest |
Year
Developed/ Redeveloped |
Year
Acquired |
DDR
Ownership Interest |
Company
Owned Gross Leasable Area (SF) |
Total
Annualized Base Rent |
Average
Base Rent (Per SF) (2) |
Anchor Tenants |
|||||||||||||||||||||||||||
| 39 | Highland Ranch, CO | 8575 South Quebec Street | 80130 | SC | Fee | 1998 | 2007 | 100 | % | 43,480 | $ | 347,840 | $ | 8.00 | Savers | |||||||||||||||||||||||
| 40 | Littleton, CO |
Aspen Grove
7301 South Santa Fe |
80120 | LC | Fee | 2002 | 1 | * | 100 | % | 245,381 | $ | 5,472,402 | $ | 27.10 | |||||||||||||||||||||||
| 41 | Parker, CO |
Parker Pavilions
11153-11183 South Parker Road |
80134 | SC | Fee (3) | 2003 | 2012 | 5 | % | 95,988 | $ | 1,488,606 | $ | 18.60 | Home Depot (Not Owned), Office Depot, Walmart (Not Owned) | |||||||||||||||||||||||
| 42 | Parker, CO |
Flatacres Marketcenter
South Parker Road |
80134 | SC | GL (3) | 2003 | 2012 | 5 | % | 132,953 | $ | 2,041,178 | $ | 15.35 | Bed Bath & Beyond, Kohl’s (Not Owned), Michaels, Sports Authority | |||||||||||||||||||||||
| Connecticut | ||||||||||||||||||||||||||||||||||||||
| 43 | Plainville, CT |
Connecticut Commons
I-84 and Route 9 |
06062 | SC | Fee (3) | 1999/2001 | 2012 | 5 | % | 566,481 | $ | 6,210,211 | $ | 12.07 | A.C. Moore, Dick’s Sporting Goods, DSW, Kohl’s, Loews Cinema, Lowe’s, Marshalls, Old Navy, PetSmart | |||||||||||||||||||||||
| 44 | Waterbury, CT | Naugatuck Valley Shopping Center 950 Wolcott Street | 06705 | SC | Fee (3) | 2003 | 2007 | 15 | % | 382,864 | $ | 3,987,571 | $ | 17.59 | Bob’s Stores, Staples, Stop & Shop, Walmart | |||||||||||||||||||||||
| 45 | Windsor, CT | Windsor Court Shopping Center 1095 Kennedy Road | 06095 | SC | Fee | 1993 | 2007 | 100 | % | 78,480 | $ | 1,328,445 | $ | 18.23 | Petco (Not Owned), Stop & Shop, Target (Not Owned) | |||||||||||||||||||||||
| Delaware | ||||||||||||||||||||||||||||||||||||||
| 46 | Dover, DE |
Kmart Shopping Center
515 North Dupont Highway |
19901 | SC | Fee (3) | 1973 | 2008 | 25.25 | % | 88,980 | $ | 305,800 | $ | 2.86 | Kmart | |||||||||||||||||||||||
| Florida | ||||||||||||||||||||||||||||||||||||||
| 47 | Apopka, FL |
Piedmont Plaza
2302-2444 East Semoran Boulevard |
32703 | SC | Fee (3) | 2004 | 2012 | 5 | % | 146,275 | $ | 856,248 | $ | 7.36 | Bealls | |||||||||||||||||||||||
| 48 | Boynton Beach, FL |
Village Square At Golf 3775 West Woolbright Road |
33436 | SC | Fee (3) | 1983/2002 | 2007 | 20 | % | 137,505 | $ | 1,354,504 | $ | 12.82 | Publix | |||||||||||||||||||||||
| 49 | Boynton Beach, FL |
Aberdeen Square 4966 Le Chalet Boulevard |
33426 | SC | Fee (3) | 1990 | 2007 | 20 | % | 70,555 | $ | 653,599 | $ | 9.96 | Publix | |||||||||||||||||||||||
| 50 | Boynton Beach, FL |
Meadows Square Hypoluxo Road North Congress Avenue |
33461 | SC | Fee (3) | 1986 | 2004 | 20 | % | 106,224 | $ | 967,834 | $ | 12.07 | ||||||||||||||||||||||||
| 51 | Bradenton, FL |
Lakewood Ranch Plaza
1755 Lakewood Ranch Boulevard |
34211 | SC | Fee (3) | 2001 | 2007 | 20 | % | 85,652 | $ | 1,016,630 | $ | 12.35 | Publix | |||||||||||||||||||||||
| 52 | Bradenton, FL |
Creekwood Crossing
7395 52nd Place East |
34203 | SC | Fee (3) | 2001 | 2007 | 20 | % | 235,459 | $ | 1,850,204 | $ | 10.18 | Bealls, Bealls Outlet, LA Fitness, Lowe’s (Not Owned), Macy’s Furniture & Mattress Clearance | |||||||||||||||||||||||
| 53 | Bradenton, FL |
Cortez Plaza
905 Cortez Road West |
34207 | SC | Fee | 1966/1988 | 2007 | 100 | % | 290,206 | $ | 2,042,861 | $ | 10.41 | Burlington Coat Factory, hhgregg, PetSmart | |||||||||||||||||||||||
| 54 | Brandon, FL |
Kmart Shopping Center
1602 Brandon Boulevard |
33511 | SC | GL | 1972/1997/2003 | 2 | * | 100 | % | 228,022 | $ | 801,435 | $ | 3.62 | Kane Furniture, Kmart | ||||||||||||||||||||||
| 55 | Brandon, FL |
Lake Brandon Plaza Causeway Boulevard |
33511 | SC | Fee | 1999 | 2009 | 100 | % | 176,113 | $ | 1,960,380 | $ | 12.14 | Babies “R” Us, CompUSA, Jo-Ann Fabric and Craft Stores, Publix | |||||||||||||||||||||||
| 56 | Brandon, FL |
Lake Brandon Village Causeway Boulevard |
33511 | SC | Fee (3) | 1997/2004 | 2012 | 5 | % | 113,986 | $ | 1,426,215 | $ | 12.51 | buybuy BABY, Lowe’s (Not Owned), PetSmart, Sports Authority | |||||||||||||||||||||||
| 57 | Casselberry, FL |
Casselberry Commons
1455 South Semoran Boulevard |
32707 | SC | Fee (3) | 1973/1998/2010 | 2007 | 20 | % | 259,067 | $ | 2,385,235 | $ | 11.24 | Publix, Ross Dress For Less, Stein Mart, T.J. Maxx | |||||||||||||||||||||||
| 58 | Clearwater, FL |
Clearwater Collection
21688-21800 U.S. Highway
|
33765 | SC | Fee | 1995/2005 | 2007 | 100 | % | 134,361 | $ | 1,617,089 | $ | 12.43 | Floor & Decor, LA Fitness | |||||||||||||||||||||||
| 59 | Crystal River, FL |
Crystal River Plaza 420 Sun Coast Highway |
33523 | SC | Fee | 1986/2001 | 1/2 | * | 100 | % | 169,101 | $ | 1,179,813 | $ | 7.39 | Bealls, Bealls Outlet, Sibex Electronics | ||||||||||||||||||||||
| 60 | Crystal River, FL |
Crystal Springs 6760 West Gulf to Lake |
34429 | SC | Fee (3) | 2001 | 2007 | 20 | % | 66,996 | $ | 715,164 | $ | 10.87 | Publix | |||||||||||||||||||||||
21
Table of Contents
DDR Corp.
Shopping Center Property List at December 31, 2012
|
Location |
Center/Property |
Zip
Code |
Type of
Property (1) |
Ownership
Interest |
Year
Developed/ Redeveloped |
Year
Acquired |
DDR
Ownership Interest |
Company
Owned Gross Leasable Area (SF) |
Total
Annualized Base Rent |
Average
Base Rent (Per SF) (2) |
Anchor Tenants |
|||||||||||||||||||||||||||
| 61 | Dania Beach, FL |
Bass Pro Outdoor World 200 Gulf Stream Way |
33004 | SC | Fee | 1999 | 2007 | 100 | % | 165,000 | $ | 1,760,000 | $ | 10.67 | Bass Pro Outdoor World | |||||||||||||||||||||||
| 62 | Dania, FL |
Sheridan Square 401-435 East Sheridan Street |
33004 | SC | Fee (3) | 1991 | 2007 | 20 | % | 67,475 | $ | 662,358 | $ | 10.73 | Publix | |||||||||||||||||||||||
| 63 | Davie, FL |
Paradise Promenade 5949-6029 Stirling Road |
33314 | SC | Fee (3) | 2004 | 2007 | 20 | % | 74,499 | $ | 964,431 | $ | 11.70 | Publix | |||||||||||||||||||||||
| 64 | Deerfield Beach, FL |
Hillsboro Square Hillsboro Boulevard and Highway One |
33441 | SC | Fee (3) | 1978/2002 | 2007 | 15 | % | 145,370 | $ | 2,186,519 | $ | 16.18 | Office Depot, Publix | |||||||||||||||||||||||
| 65 | Fort Myers, FL |
Market Square
13300 South Cleveland Avenue |
33919 | SC | Fee (3) | 2004 | 2007 | 15 | % | 118,945 | $ | 1,783,048 | $ | 14.99 | American Signature Furniture, Barnes & Noble (Not Owned), Big Al’s City Sports (Not Owned), CompUSA (Not Owned), Dollar Tree (Not Owned), DSW, Petco (Not Owned), Target (Not Owned), Total Wine & More, World Market (Not Owned) | |||||||||||||||||||||||
| 66 | Fort Myers, FL |
Cypress Trace
Cypress Lake Drive and U.S. 41 |
33907 | SC | Fee (3) | 2004 | 2007 | 15 | % | 276,288 | $ | 2,261,399 | $ | 9.48 | Bealls, Bealls Outlet, Ross Dress For Less, Stein Mart | |||||||||||||||||||||||
| 67 | Fort Walton Beach, FL |
Shoppes at Paradise Pointe
U.S. Highway 98 and Perry Avenue |
32548 | SC | Fee (3) | 1987/2000 | 2007 | 20 | % | 83,936 | $ | 696,030 | $ | 11.40 | Publix | |||||||||||||||||||||||
| 68 | Hernando, FL |
Shoppes of Citrus Hills
2601 Forest Ridge Boulevard |
34442 | SC | Fee (3) | 1994/2003 | 2007 | 20 | % | 68,927 | $ | 721,542 | $ | 10.47 | Publix | |||||||||||||||||||||||
| 69 | Hialeah, FL |
Paraiso Plaza
3300-3350 West 80th Street |
33018 | SC | Fee (3) | 1997 | 2007 | 20 | % | 60,712 | $ | 942,577 | $ | 15.53 | Publix | |||||||||||||||||||||||
| 70 | Homestead, FL |
Homestead Pavilion
Campbell Drive and Southwest 157th Avenue |
33030 | SC | Fee | 2008 | 2008 | 100 | % | 299,910 | $ | 4,825,259 | $ | 15.28 | Bed Bath & Beyond, hhgregg, Kohl’s (Not Owned), Michaels, Ross Dress For Less, Sports Authority, Staples | |||||||||||||||||||||||
| 71 | Jacksonville, FL |
Jacksonville Regional
3000 Dunn Avenue |
32218 | SC | Fee | 1988 | 1995 | 100 | % | 219,735 | $ | 1,160,031 | $ | 6.33 | Bealls Outlet (Not Owned), JCPenney, Winn Dixie Stores, Citi Trends (Not Owned) | |||||||||||||||||||||||
| 72 | Lake Mary, FL |
Shoppes of Lake Mary
4155 West Lake Mary Boulevard |
32746 | SC | Fee (3) | 2001 | 2007 | 15 | % | 74,234 | $ | 1,501,803 | $ | 20.28 | Publix (Not Owned), Staples, Target (Not Owned) | |||||||||||||||||||||||
| 73 | Lake Wales, FL |
Shoppes on the Ridge
Highway 27 and Chalet Suzanne Road |
33859 | SC | Fee (3) | 2003 | 2007 | 20 | % | 117,042 | $ | 934,914 | $ | 10.90 | Publix | |||||||||||||||||||||||
| 74 | Lakeland, FL |
Highlands Plaza
2228 Lakelands Highland Road |
33803 | SC | Fee | 1990 | 2004 | 100 | % | 102,572 | $ | 705,480 | $ | 8.68 | Winn Dixie Stores | |||||||||||||||||||||||
| 75 | Lakeland, FL |
Lakeland Square Mall
3800 U.S. Highway 98 North |
33809 | SC | Fee | 1990 | 2007 | 100 | % | 81,921 | $ | 675,848 | $ | 8.25 | Burlington Coat Factory | |||||||||||||||||||||||
| 76 | Lakeland, FL |
Lakeland Marketplace
Florida Lakeland |
33803 | SC | Fee | 2006 | 2003 | 100 | % | 77,582 | $ | 620,656 | $ | 8.00 | Bealls, Lowe’s (Not Owned) | |||||||||||||||||||||||
| 77 | Largo, FL |
Kmart Shopping Center
1000 Missouri Avenue |
33770 | SC | Fee (3) | 1969 | 2008 | 25.25 | % | 116,805 | $ | 214,921 | $ | 1.84 | Kmart | |||||||||||||||||||||||
| 78 | Largo, FL |
Bardmoor Promenade
10801 Starkey Road |
33777 | SC | Fee (3) | 1991 | 2007 | 20 | % | 152,667 | $ | 1,966,025 | $ | 12.57 | Publix | |||||||||||||||||||||||
| 79 | Melbourne, FL |
Melbourne Shopping Center
1301-1441 South Babcock |
32901 | SC | Fee (3) | 1960/1999 | 2007 | 20 | % | 229,102 | $ | 992,765 | $ | 6.84 | Big Lots, Publix | |||||||||||||||||||||||
| 80 | Miami, FL |
Plaza Del Paraiso
12100 Southwest 127th Avenue |
33186 | SC | Fee (3) | 2003 | 2007 | 20 | % | 82,441 | $ | 1,222,701 | $ | 13.30 | Publix | |||||||||||||||||||||||
| 81 | Miami, FL |
Midtown Miami
3401 North Miami Avenue |
33127 | SC | Fee | 2006 | 1 | * | 100 | % | 454,124 | $ | 6,789,289 | $ | 21.10 | HomeGoods, Loehmann’s, Marshalls, Ross Dress For Less, Target, West Elm, Sports Authority | ||||||||||||||||||||||
22
Table of Contents
DDR Corp.
Shopping Center Property List at December 31, 2012
|
Location |
Center/Property |
Zip
Code |
Type of
Property (1) |
Ownership
Interest |
Year
Developed/ Redeveloped |
Year
Acquired |
DDR
Ownership Interest |
Company
Owned Gross Leasable Area (SF) |
Total
Annualized Base Rent |
Average
Base Rent (Per SF) (2) |
Anchor Tenants |
|||||||||||||||||||||||||||
| 82 | Miramar, FL |
River Run
Miramar Parkway and Palm Avenue |
33025 | SC | Fee (3) | 1989 | 2007 | 20 | % | 93,643 | $ | 1,103,944 | $ | 11.97 | Publix | |||||||||||||||||||||||
| 83 | Naples, FL |
Countryside Shoppes
4025 Santa Barbara |
34104 | SC | Fee (3) | 1997 | 2007 | 20 | % | 73,986 | $ | 680,816 | $ | 9.86 | Sweetbay | |||||||||||||||||||||||
| 84 | Naples, FL |
Carillon Place
5010 Airport Road North |
33942 | SC | Fee (3) | 1994 | 2012 | 5 | % | 267,796 | $ | 3,379,524 | $ | 12.90 | Bealls, hhgregg, OfficeMax, Ross Dress For Less, T.J. Maxx, Walmart | |||||||||||||||||||||||
| 85 | New Port Richey, FL |
Shoppes at Golden Acres
9750 Little Road |
34654 | SC | Fee (3) | 2002 | 2007 | 20 | % | 130,707 | $ | 954,446 | $ | 12.25 | Publix | |||||||||||||||||||||||
| 86 | Ocala, FL |
Ocala West 400 Southwest College Road |
32674 | SC | Fee | 1991/2006 | 2003 | 100 | % | 105,276 | $ | 518,554 | $ | 8.04 | Blockers Furniture (Not Owned), Hobby Lobby | |||||||||||||||||||||||
| 87 | Ocala, FL |
Heather Island 7878 Southeast Maricamp |
34472 | SC | Fee (3) | 2005 | 2007 | 20 | % | 70,970 | $ | 674,614 | $ | 10.16 | Publix | |||||||||||||||||||||||
| 88 | Ocala, FL |
Steeplechase Plaza 8585 State Road 200 |
34481 | SC | Fee | 1993 | 2007 | 100 | % | 93,280 | $ | 473,718 | $ | 8.42 | ||||||||||||||||||||||||
| 89 | Ocoee, FL |
West Oaks Town Center 9537-49 West Colonial |
34761 | SC | Fee (3) | 2000 | 2007 | 20 | % | 66,539 | $ | 994,849 | $ | 17.02 | Best Buy (Not Owned), Michaels | |||||||||||||||||||||||
| 90 | Orlando, FL |
Chickasaw Trail 2300 South Chickasaw Trail |
32825 | SC | Fee (3) | 1994 | 2007 | 20 | % | 75,492 | $ | 686,540 | $ | 10.45 | Publix | |||||||||||||||||||||||
| 91 | Orlando, FL |
Conway Plaza 4400 Curry Ford Road |
32812 | SC | Fee (3) | 1985/1999 | 2007 | 20 | % | 117,723 | $ | 833,440 | $ | 9.44 | Publix | |||||||||||||||||||||||
| 92 | Orlando, FL |
Skyview Plaza 7801 Orange Blossom Trail |
32809 | SC | Fee (3) | 1994/1998 | 2007 | 20 | % | 281,260 | $ | 1,732,560 | $ | 8.20 | DD’s Discounts, Kmart, Publix | |||||||||||||||||||||||
| 93 | Orlando, FL |
West Colonial Center Good Homes Road and Colonial Drive |
32818 | SC | Fee (3) | 1999 | 2007 | 15 | % | 78,625 | $ | 484,257 | $ | 7.82 | Big Lots, Staples | |||||||||||||||||||||||
| 94 | Oviedo, FL |
Oviedo Park Crossing Route 417 and Red Bug Lake Road |
32765 | SC | Fee (3) | 1999 | 1 | * | 20 | % | 186,212 | $ | 1,933,511 | $ | 10.38 | Bed Bath & Beyond, Lowe’s (Not Owned), Michaels, OfficeMax, Ross Dress For Less, T.J. Maxx | ||||||||||||||||||||||
| 95 | Palm Beach Gardens, FL |
Northlake Commons Northlake Boulevard |
33403 | SC | Fee (3) | 1987/2003 | 2007 | 20 | % | 146,825 | $ | 1,581,483 | $ | 14.18 | CompUSA, Home Depot (Not Owned), Ross Dress For Less | |||||||||||||||||||||||
| 96 | Palm Harbor, FL |
The Shoppes of Boot Ranch 300 East Lake Road |
34685 | SC | Fee | 1990 | 1995 | 100 | % | 52,325 | $ | 1,032,961 | $ | 21.14 | Publix (Not Owned), Target (Not Owned) | |||||||||||||||||||||||
| 97 | Pembroke Pines, FL |
Flamingo Falls 2000-2216 North Flamingo Road |
33028 | SC | Fee (3) | 2001 | 2007 | 20 | % | 108,565 | $ | 1,810,952 | $ | 19.49 | The Fresh Market, LA Fitness (Not Owned) | |||||||||||||||||||||||
| 98 | Plant City, FL |
Lake Walden Square 105-240 West Alexander |
33566 | SC | Fee (3) | 1992 | 2012 | 5 | % | 257,097 | $ | 1,133,033 | $ | 9.48 | Sweetbay, Premiere Cinemas | |||||||||||||||||||||||
| 99 | Plantation, FL |
The Fountains 801 South University Drive |
33324 | SC | Fee | 1989/2010 | 2007 | 100 | % | 430,049 | $ | 5,314,452 | $ | 16.85 | Dick’s Sporting Goods, Jo-Ann Fabric and Craft Stores, Kohl’s, Marshalls, Total Wine & More | |||||||||||||||||||||||
| 100 | Spring Hill, FL |
Mariner Square
13050 Cortez Boulevard |
34613 | SC | Fee | 1988/1997 | 1/2 | * | 100 | % | 192,877 | $ | 1,656,069 | $ | 8.90 | Bealls, Ross Dress For Less, Sam’s Club (Not Owned), Walmart (Not Owned) | ||||||||||||||||||||||
| 101 | St. Petersburg, FL |
Kmart Plaza 3951 34th Street South |
33711 | SC | Fee (3) | 1973 | 2008 | 25.25 | % | 94,500 | $ | 277,400 | $ | 2.94 | ||||||||||||||||||||||||
| 102 | Tallahassee, FL |
Killearn Shopping Center 3479-99 Thomasville Road |
32309 | SC | Fee (3) | 1980 | 2007 | 20 | % | 95,229 | $ | 1,159,622 | $ | 12.56 | Hobby Lobby | |||||||||||||||||||||||
| 103 | Tallahassee, FL |
Capital West 4330 West Tennessee Street |
32312 | SC | Fee | 1994/2004 | 2003 | 100 | % | 85,951 | $ | 708,570 | $ | 8.56 | Bealls Outlet, Office Depot, Walmart (Not Owned) | |||||||||||||||||||||||
23
Table of Contents
DDR Corp.
Shopping Center Property List at December 31, 2012
|
Location |
Center/Property |
Zip
Code |
Type of
Property (1) |
Ownership
Interest |
Year
Developed/ Redeveloped |
Year
Acquired |
DDR
Ownership Interest |
Company
Owned Gross Leasable Area (SF) |
Total
Annualized Base Rent |
Average
Base Rent (Per SF) (2) |
Anchor Tenants |
|||||||||||||||||||||||||||
| 104 | Tallahassee, FL |
Southwood Village
Northwest Capital Circle and Blairstone Road |
32301 | SC | Fee (3) | 2003 | 2007 | 20 | % | 62,840 | $ | 765,373 | $ | 12.66 | Publix | |||||||||||||||||||||||
| 105 | Tamarac, FL |
Midway Plaza
University Drive and Commercial Boulevard |
33321 | SC | Fee (3) | 1985 | 2007 | 20 | % | 226,098 | $ | 2,356,945 | $ | 12.37 | Publix, Ross Dress For Less | |||||||||||||||||||||||
| 106 | Tampa, FL |
North Pointe Plaza
15001-15233 North Dale Mabry |
33618 | SC | Fee (3) | 1990 | 1/2 | * | 20 | % | 104,440 | $ | 1,053,842 | $ | 12.31 | Publix, Walmart (Not Owned) | ||||||||||||||||||||||
| 107 | Tampa, FL |
The Walk at Highwoods Preserve
18001 Highwoods Preserve Parkway |
33647 | SC | Fee (3) | 2001 | 2007 | 15 | % | 140,629 | $ | 1,881,071 | $ | 14.82 | Best Buy, HomeGoods, Michaels | |||||||||||||||||||||||
| 108 | Tampa, FL |
New Tampa Commons
Bruce B. Downs and Donna Michelle |
33647 | SC | Fee | 2005 | 2007 | 100 | % | 10,000 | $ | 333,134 | $ | 33.31 | ||||||||||||||||||||||||
| 109 | Tarpon Springs, FL |
Tarpon Square
41232 U.S. 19, North |
34689 | SC | Fee | 1974/1998 | 1/2 | * | 100 | % | 115,267 | $ | 1,119,705 | $ | 10.48 | Bealls Outlet, Big Lots, Staples | ||||||||||||||||||||||
| 110 | Tequesta, FL |
Tequesta Shoppes
105 North U.S. Highway 1 |
33469 | SC | Fee | 1986 | 2007 | 100 | % | 109,846 | $ | 800,449 | $ | 8.12 | Stein Mart | |||||||||||||||||||||||
| 111 | Valrico, FL |
Brandon Boulevard Shoppes
1930 State Route 60 East |
33594 | SC | Fee | 1994/2012 | 2007 | 100 | % | 85,377 | $ | 337,566 | $ | 14.81 | ||||||||||||||||||||||||
| 112 | Valrico, FL |
Shoppes at Lithia
3461 Lithia Pinecrest Road |
33594 | SC | Fee (3) | 2003 | 2007 | 20 | % | 71,430 | $ | 1,046,634 | $ | 15.36 | Publix | |||||||||||||||||||||||
| 113 | Venice, FL |
Jacaranda Plaza
1687 South Bypass |
34293 | SC | Fee (3) | 1974 | 2008 | 25.25 | % | 84,180 | $ | — | $ | — | ||||||||||||||||||||||||
| 114 | Wesley Chapel, FL |
The Shoppes at New Tampa
1920 Country Road 581 |
33543 | SC | Fee (3) | 2002 | 2007 | 20 | % | 158,602 | $ | 1,928,719 | $ | 12.60 | Bealls, Office Depot (Not Owned), Publix | |||||||||||||||||||||||
| 115 | Winter Park, FL |
Winter Park Palms
4270 Aloma Avenue |
32792 | SC | Fee (3) | 1985/1998 | 2012 | 5 | % | 112,292 | $ | 60,897 | $ | 9.55 | ||||||||||||||||||||||||
| Georgia | ||||||||||||||||||||||||||||||||||||||
| 116 | Atlanta, GA |
Perimeter Pointe
1155 Mount Vernon Highway |
30136 | SC | Fee | 1995/2002 | 1995 | 100 | % | 351,791 | $ | 5,694,681 | $ | 15.34 | Babies “R” Us, HomeGoods, LA Fitness, Sports Authority, Stein Mart, United Artists Theatres | |||||||||||||||||||||||
| 117 | Atlanta, GA |
Cascade Corners
3425 Cascade Road |
30311 | SC | Fee (3) | 1993 | 2007 | 20 | % | 66,844 | $ | 513,797 | $ | 7.67 | Kroger | |||||||||||||||||||||||
| 118 | Atlanta, GA |
Cascade Crossing
3695 Cascade Road Southwest |
30331 | SC | Fee (3) | 1994 | 2007 | 20 | % | 63,346 | $ | 619,087 | $ | 9.77 | Publix | |||||||||||||||||||||||
| 119 | Atlanta, GA |
Brookhaven Plaza
3974 Peachtree Road Northeast |
30319 | SC | Fee (3) | 1993 | 2007 | 20 | % | 71,320 | $ | 1,184,538 | $ | 17.44 | ||||||||||||||||||||||||
| 120 | Atlanta, GA |
Abernathy Square
6500 Roswell Road |
30328 | SC | Fee | 1983/1994 | 2007 | 100 | % | 129,770 | $ | 2,359,572 | $ | 19.18 | Publix | |||||||||||||||||||||||
| 121 | Austell, GA |
Burlington Plaza
3753-3823 Austell Road Southwest |
30106 | SC | GL (3) | 1973 | 2008 | 25.25 | % | 146,950 | $ | 517,036 | $ | 3.62 | Burlington Coat Factory | |||||||||||||||||||||||
| 122 | Buford, GA |
Marketplace at Millcreek
Mall of Georgia Boulevard |
30519 | SC | Fee (3) | 2003 | 2007 | 15 | % | 401,947 | $ | 4,436,663 | $ | 12.25 | Bed Bath & Beyond, Costco (Not Owned), DSW, Marshalls, Michaels, OfficeMax, PetSmart, REI, Ross Dress For Less, Sports Authority | |||||||||||||||||||||||
| 123 | Canton, GA |
Riverstone Plaza
1451 Riverstone Parkway |
30114 | SC | Fee (3) | 1998 | 2007 | 20 | % | 307,716 | $ | 3,172,986 | $ | 11.15 | Belk, Michaels, Publix, Ross Dress For Less, Beall’s Outlet | |||||||||||||||||||||||
24
Table of Contents
DDR Corp.
Shopping Center Property List at December 31, 2012
|
Location |
Center/Property |
Zip
Code |
Type of
Property (1) |
Ownership
Interest |
Year
Developed/ Redeveloped |
Year
Acquired |
DDR
Ownership Interest |
Company
Owned Gross Leasable Area (SF) |
Total
Annualized Base Rent |
Average
Base Rent (Per SF) (2) |
Anchor Tenants |
|||||||||||||||||||||||||||
| 124 | Canton, GA |
Hickory Flat Village
6175 Hickory Flat Highway |
30115 | SC | Fee (3) | 2000 | 2007 | 20 | % | 74,020 | $ | 732,968 | $ | 12.28 | Publix | |||||||||||||||||||||||
| 125 | Columbus, GA |
Bradley Park Crossing
1591 Bradley Park Drive |
31904 | SC | Fee | 1999 | 2003 | 100 | % | 116,768 | $ | 1,267,714 | $ | 12.03 | The Fresh Market, Michaels, PetSmart, Target (Not Owned) | |||||||||||||||||||||||
| 126 | Cumming, GA |
Cumming Marketplace
1250 Market Place Boulevard |
30041 | SC | Fee | 1997/1999 | 2003 | 100 | % | 318,665 | $ | 3,574,389 | $ | 11.29 | ApplianceSmart, Home Depot (Not Owned), Lowe’s, Michaels, OfficeMax, Walmart (Not Owned) | |||||||||||||||||||||||
| 127 | Cumming, GA |
Sharon Greens
1595 Peachtree Parkway |
30041 | SC | Fee (3) | 2001 | 2007 | 20 | % | 98,301 | $ | 852,803 | $ | 11.39 | Kroger | |||||||||||||||||||||||
| 128 | Decatur, GA |
Hairston Crossing
2075 South Hairston Road |
30035 | SC | Fee (3) | 2002 | 2007 | 20 | % | 57,884 | $ | 606,926 | $ | 11.24 | Publix | |||||||||||||||||||||||
| 129 | Decatur, GA |
Flat Shoals Crossing
3649 Flakes Mill Road |
30034 | SC | Fee (3) | 1994 | 2007 | 20 | % | 69,699 | $ | 669,623 | $ | 9.78 | Publix | |||||||||||||||||||||||
| 130 | Douglasville, GA |
Douglasville Pavilion
2900 Chapel Hill Road |
30135 | SC | Fee (3) | 1998 | 2007 | 15 | % | 266,953 | $ | 2,388,998 | $ | 10.52 | Big Lots, Marshalls, OfficeMax, PetSmart, Ross Dress For Less, Target (Not Owned) | |||||||||||||||||||||||
| 131 | Douglasville, GA |
Market Square
9503-9579 Highway 5 |
30135 | SC | Fee (3) | 1974/1990 | 2007 | 20 | % | 124,038 | $ | 737,649 | $ | 10.40 | Office Depot | |||||||||||||||||||||||
| 132 | Douglasville, GA |
Douglasville Marketplace
6875 Douglas Boulevard |
30135 | SC | Fee | 1999 | 2003 | 100 | % | 128,506 | $ | 1,499,804 | $ | 13.15 | Babies “R” Us, Best Buy, Lowe’s (Not Owned) | |||||||||||||||||||||||
| 133 | Duluth, GA |
Pleasant Hill Plaza
1630 Pleasant Hill Road |
30136 | SC | Fee | 1990 | 1994 | 100 | % | 99,025 | $ | 793,776 | $ | 11.65 | Assi Supermarket (Not Owned) | |||||||||||||||||||||||
| 134 | Duluth, GA |
So Good Bridal & Beauty
3480 Steve Reynolds Boulevard |
30096 | SC | Fee | 2004 | 2007 | 100 | % | 20,000 | $ | 160,000 | $ | 8.00 | So Good Bridal & Beauty | |||||||||||||||||||||||
| 135 | Ellenwood, GA |
Paradise Shoppes of Ellenwood
East Atlanta Road and Fairview Road |
30294 | SC | Fee (3) | 2003 | 2007 | 20 | % | 67,721 | $ | 645,226 | $ | 11.42 | ||||||||||||||||||||||||
| 136 | Fayetteville, GA |
Fayette Pavilion
New Hope Road and Georgia Highway 85 |
30214 | SC | Fee (3) | 1995/2002 | 2007 | 15 | % | 1,279,695 | $ | 10,781,903 | $ | 9.21 | Bed Bath & Beyond, Belk, Big Lots, Cinemark, Conway, Dick’s Sporting Goods, hhgregg, Hobby Lobby, Home Depot (Not Owned), Jo-Ann Fabric and Craft Stores, Kohl’s, Marshalls, PetSmart, Publix, Ross Dress For Less | |||||||||||||||||||||||
| 137 | Flowery Branch, GA |
Clearwater Crossing
7380 Spout Springs Road |
30542 | SC | Fee (3) | 2003 | 2007 | 20 | % | 90,566 | $ | 783,925 | $ | 11.27 | Kroger | |||||||||||||||||||||||
| 138 | Kennesaw, GA |
Town Center Commons
725 Earnest Barrett Parkway |
30144 | SC | Fee | 1998 | 2007 | 100 | % | 72,138 | $ | 864,176 | $ | 12.71 | Dick’s Sporting Goods (Not Owned), JCPenney | |||||||||||||||||||||||
| 139 | Kennesaw, GA |
Barrett Pavilion
740 Barrett Parkway |
30144 | SC | Fee (3) | 1998 | 2007 | 15 | % | 460,184 | $ | 6,931,147 | $ | 16.38 | AMC Theatres, Golfsmith, hhgregg, Hobby Lobby, HomeGoods, Jo-Ann Fabric and Craft Stores, Old Navy, REI, Target (Not Owned), Total Wine & More | |||||||||||||||||||||||
| 140 | Lawrenceville, GA |
Rite Aid
1545 Lawrenceville Highway |
30044 | SC | Fee | 1997 | 2007 | 100 | % | 9,504 | $ | 189,080 | $ | 19.89 | ||||||||||||||||||||||||
| 141 | Lithonia, GA |
Shops at Turner Hill
8200 Mall Parkway |
30038 | SC | Fee (3) | 2004 | 2012 | 5 | % | 32,200 | $ | 359,389 | $ | 19.86 | ||||||||||||||||||||||||
| 142 | Lithonia, GA |
Turner Hill Marketplace
I-20 and Turner Hill Road |
30038 | SC | Fee (3) | 2004 | 2012 | 5 | % | 124,975 | $ | 1,028,300 | $ | 11.37 | Bed Bath & Beyond, Best Buy, Sam’s Club (Not Owned), Toys “R” Us | |||||||||||||||||||||||
| 143 | Loganville, GA |
Midway Plaza
910 Athens Highway |
30052 | SC | Fee (3) | 1995 | 2003 | 20 | % | 91,196 | $ | 952,052 | $ | 11.23 | Kroger | |||||||||||||||||||||||
| 144 | Macon, GA |
Eisenhower Annex
4685 Presidential Parkway |
31206 | SC | Fee | 2002 | 2007 | 100 | % | 81,977 | $ | 610,410 | $ | 11.22 | hhgregg, PetSmart | |||||||||||||||||||||||
25
Table of Contents
DDR Corp.
Shopping Center Property List at December 31, 2012
|
Location |
Center/Property |
Zip
Code |
Type of
Property (1) |
Ownership
Interest |
Year
Developed/ Redeveloped |
Year
Acquired |
DDR
Ownership Interest |
Company
Owned Gross Leasable Area (SF) |
Total
Annualized Base Rent |
Average
Base Rent (Per SF) (2) |
Anchor Tenants |
|||||||||||||||||||||||||||
| 145 | Macon, GA |
Eisenhower Crossing
4685 Presidential Parkway |
31206 | SC | Fee (3) | 2002 | 2007 | 15 | % | 420,336 | $ | 4,639,664 | $ | 11.12 | Ashley Furniture, Bed Bath & Beyond, Best Buy (Not Owned), Dick’s Sporting Goods, Home Depot (Not Owned), Kroger, Marshalls, Michaels, Old Navy, Ross Dress For Less, Staples, Target (Not Owned) | |||||||||||||||||||||||
| 146 | Marietta, GA |
Towne Center Prado
50 Ernest Barrett Parkway Northeast |
30066 | SC | Fee | 1995/2002 | 1995 | 100 | % | 326,683 | $ | 3,527,902 | $ | 12.72 | Publix, Ross Dress For Less, Stein Mart | |||||||||||||||||||||||
| 147 | Mcdonough, GA |
Shoppes at Lake Dow
900-938 Highway 81 East |
30252 | SC | Fee (3) | 2002 | 2007 | 20 | % | 72,727 | $ | 837,583 | $ | 12.12 | Publix | |||||||||||||||||||||||
| 148 | Newnan, GA |
Newnan Pavilion
1074 Bullsboro Drive |
30265 | SC | Fee (3) | 1998 | 2007 | 15 | % | 468,427 | $ | 2,438,571 | $ | 12.86 | Academy Sports, Anna’s Linens, Home Depot, Kohl’s, OfficeMax, PetSmart, Ross Dress For Less | |||||||||||||||||||||||
| 149 | Newnan, GA |
Newnan Crossing
955-1063 Bullsboro Drive |
30264 | SC | Fee | 1995 | 2003 | 100 | % | 156,497 | $ | 1,310,436 | $ | 8.37 | Hobby Lobby (Not Owned), Lowe’s, Walmart (Not Owned) | |||||||||||||||||||||||
| 150 | Norcross, GA |
Jones Bridge Square
5075 Peachtree Parkway |
30092 | SC | Fee | 1999 | 2007 | 100 | % | 83,363 | $ | 787,636 | $ | 9.96 | Ingles | |||||||||||||||||||||||
| 151 | Rome, GA | 2700 Martha Berry Highway Northeast | 30165 | SC | Fee | 2001/2012 | 2007 | 100 | % | 21,853 | $ | 72,000 | $ | 8.00 | ||||||||||||||||||||||||
| 152 | Roswell, GA |
Stonebridge Square
610-20 Crossville Road |
30075 | SC | Fee (3) | 2002 | 2007 | 15 | % | 159,537 | $ | 1,743,363 | $ | 12.41 | Kohl’s, Michaels | |||||||||||||||||||||||
| 153 | Roswell, GA |
Sandy Plains Village
Georgia Highway 92 and Sandy Plains Road |
30075 | SC | Fee | 1978/1995 | 2007 | 100 | % | 180,094 | $ | 655,722 | $ | 14.61 | Movie Tavern, Walmart Neighborhood Market | |||||||||||||||||||||||
| 154 | Smyrna, GA |
Heritage Pavilion
2540 Cumberland Boulevard |
30080 | SC | Fee (3) | 1995 | 2007 | 15 | % | 255,971 | $ | 3,098,594 | $ | 12.11 | American Signature Furniture, Anna’s Linens, Marshalls, PetSmart, Ross Dress For Less, T.J. Maxx | |||||||||||||||||||||||
| 155 | Snellville, GA |
Presidential Commons
1630-1708 Scenic Highway |
30078 | SC | Fee | 2000 | 2007 | 100 | % | 375,116 | $ | 4,165,468 | $ | 11.07 | buybuy BABY, Home Depot, Jo-Ann Fabric and Craft Stores, Kroger, Stein Mart | |||||||||||||||||||||||
| 156 | Snellville, GA |
Rite Aid
3295 Centerville Highway |
30039 | SC | Fee | 1997 | 2007 | 100 | % | 10,594 | $ | 204,893 | $ | 19.34 | ||||||||||||||||||||||||
| 157 | Stone Mountain, GA |
Deshon Plaza
380 North Deshon Road |
30087 | SC | Fee (3) | 1994 | 2007 | 20 | % | 64,055 | $ | 698,943 | $ | 10.91 | Publix | |||||||||||||||||||||||
| 158 | Suwanee, GA |
Johns Creek Town Center
3630 Peachtree Parkway |
30024 | SC | Fee | 2001/2004 | 2003 | 100 | % | 293,336 | $ | 3,508,790 | $ | 12.33 | Kohl’s, Michaels, PetSmart, Shoe Gallery, Staples, Stein Mart | |||||||||||||||||||||||
| 159 | Suwanee, GA |
Suwanee Crossroads
Lawrenceville Road and Satellite Boulevard |
30024 | SC | Fee (3) | 2002 | 2007 | 15 | % | 72,100 | $ | 439,572 | $ | 12.83 | Walmart (Not Owned) | |||||||||||||||||||||||
| 160 | Sylvania, GA |
BI-LO
1129 West Ogeechee Street |
30467 | SC | Fee | 2002 | 2007 | 100 | % | 36,000 | $ | 378,000 | $ | 10.50 | BI-LO | |||||||||||||||||||||||
| 161 | Tucker, GA |
Cofer Crossing
4349-4375 Lawrenceville Highway |
30084 | SC | Fee (3) | 1998/2003 | 2003 | 20 | % | 137,757 | $ | 1,057,044 | $ | 13.13 | HomeGoods, Kroger, Walmart (Not Owned) | |||||||||||||||||||||||
| 162 | Warner Robins, GA |
Warner Robins Place
2724 Watson Boulevard |
31093 | SC | Fee | 1997 | 2003 | 100 | % | 118,692 | $ | 1,450,405 | $ | 12.60 | Lowe’s (Not Owned), Staples, T.J. Maxx, Walmart (Not Owned) | |||||||||||||||||||||||
| 163 | Woodstock, GA |
Woodstock Place
10029 Highway 928 |
30188 | SC | Fee | 1995 | 2003 | 100 | % | 170,940 | $ | 252,641 | $ | 13.08 | ||||||||||||||||||||||||
| 164 | Woodstock, GA |
Woodstock Square
120-142 Woodstock Square |
30189 | SC | Fee (3) | 2001 | 2007 | 15 | % | 218,859 | $ | 2,958,407 | $ | 13.79 | Kohl’s, OfficeMax, Old Navy, Target (Not Owned) | |||||||||||||||||||||||
26
Table of Contents
DDR Corp.
Shopping Center Property List at December 31, 2012
|
Location |
Center/Property |
Zip
Code |
Type of
Property (1) |
Ownership
Interest |
Year
Developed/ Redeveloped |
Year
Acquired |
DDR
Ownership Interest |
Company
Owned Gross Leasable Area (SF) |
Total
Annualized Base Rent |
Average
Base Rent (Per SF) (2) |
Anchor Tenants |
|||||||||||||||||||||||||||
| Idaho | ||||||||||||||||||||||||||||||||||||||
| 165 | Meridian, ID |
Meridian Crossroads
Eagle and Fairview Road |
83642 | SC | Fee |
1999/2001/2002/
2003/2004 |
1 | * | 100 | % | 527,996 | $ | 6,057,151 | $ | 13.45 | Babies “R” Us, Bed Bath & Beyond, Craft Warehouse, Office Depot, Old Navy, Ross Dress For Less, Shopko, Sportsman’s Warehouse, Walmart (Not Owned) | ||||||||||||||||||||||
| 166 | Nampa, ID |
Nampa Gateway Center
1200 North Happy Valley Road |
83687 | SC | Fee | 2008 | 1 | * | 100 | % | 469,123 | $ | 1,358,666 | $ | 13.06 | Idaho Athletic Club, JCPenney, Macy’s, Regal Cinemas, Sports Authority | ||||||||||||||||||||||
| Illinois | ||||||||||||||||||||||||||||||||||||||
| 167 | Deer Park, IL |
Deer Park Town Center
20530 North Rand Road, Suite 133 |
60010 | LC | Fee (3) | 2000/2004 | 1 | * | 25.75 | % | 359,506 | $ | 9,710,080 | $ | 31.15 | Barnes & Noble (Not Owned), Century Theatres, Crate & Barrel, Gap | ||||||||||||||||||||||
| 168 | Mchenry, IL |
The Shops at Fox River
3340 Shoppers Drive |
60050 | SC | Fee | 2006 | 1 | * | 100 | % | 315,313 | $ | 4,070,734 | $ | 12.70 | Bed Bath & Beyond, Best Buy, Dick’s Sporting Goods, JCPenney (Not Owned), Jo-Ann Fabric and Craft Stores, PetSmart, Ross Dress For Less, T.J. Maxx | ||||||||||||||||||||||
| 169 | Orland Park, IL |
Home Depot Center
15800 Harlem Avenue |
60462 | SC | Fee | 1987/1993 | 2004 | 100 | % | 149,526 | $ | 1,448,273 | $ | 10.86 | Home Depot | |||||||||||||||||||||||
| 170 | Roscoe, IL |
Hilander Village
4860 Hononegah Road |
61073 | SC | Fee (3) | 1994 | 2007 | 20 | % | 125,712 | $ | 965,153 | $ | 9.25 | Hilander | |||||||||||||||||||||||
| 171 | Schaumburg, IL |
Woodfield Village Green
1430 East Golf Road |
60173 | SC | Fee (3) | 1993/1998/2002 | 2012 | 5 | % | 508,630 | $ | 7,799,872 | $ | 18.81 | Bloomingdale’s The Outlet Store, Container Store, Costco (Not Owned), hhgregg, HomeGoods, Marshalls, Michaels, Nordstrom Rack, Saks Off 5th, PetSmart | |||||||||||||||||||||||
| 172 | Skokie, IL |
Village Crossing
5507 West Touhy Avenue |
60077 | SC | Fee (3) | 1989 | 2007 | 15 | % | 442,953 | $ | 7,594,368 | $ | 19.13 | AMC Theatres, Barnes & Noble, Bed Bath & Beyond, Best Buy, Michaels, OfficeMax, PetSmart | |||||||||||||||||||||||
| 173 | Tinley Park, IL |
Brookside Marketplace
191st Street and Harlem Avenue |
60487 | SC | Fee |
2006/2007/2008/
2009/2011 |
2012 | 100 | % | 275,712 | $ | 3,443,793 | $ | 14.01 | Best Buy, Dick’s Sporting Goods, HomeGoods, Kohl’s (Not Owned), Michaels, PetSmart, Target (Not Owned) | |||||||||||||||||||||||
| Indiana | ||||||||||||||||||||||||||||||||||||||
| 174 | Bedford, IN |
Town Fair Center
1320 James Avenue |
47421 | SC | Fee | 1993/1997 | 2 | * | 100 | % | 223,431 | $ | 1,271,855 | $ | 5.80 | Dunham’s Sports, Goody’s, JCPenney, Kmart | ||||||||||||||||||||||
| 175 | Evansville, IN |
East Lloyd Commons
6300 East Lloyd Expwy |
47715 | SC | Fee | 2005 | 2007 | 100 | % | 159,682 | $ | 2,243,208 | $ | 14.05 | Best Buy, Gordman’s, Michaels | |||||||||||||||||||||||
| 176 | Highland, IN |
Highland Grove Shopping Center
Highway 41 and Main Street |
46322 | SC | Fee (3) | 1995/2001 | 2007 | 20 | % | 312,447 | $ | 3,913,631 | $ | 12.65 |
Best Buy (Not Owned), Dick’s Sporting Goods (Not Owned), hhgregg (Not Owned), Kohl’s, Marshalls, Michaels, OfficeMax, Target (Not Owned) |
|||||||||||||||||||||||
| 177 | Indianapolis, IN |
Glenlake Plaza
2629 East 65th Street |
46220 | SC | Fee (3) | 1980 | 2007 | 20 | % | 102,184 | $ | 792,385 | $ | 8.87 | Kroger | |||||||||||||||||||||||
| 178 | South Bend, IN |
Broadmoor Plaza
1217 East Ireland Road |
46614 | SC | Fee (3) | 1987 | 2007 | 20 | % | 115,059 | $ | 1,158,429 | $ | 11.25 | Kroger | |||||||||||||||||||||||
| Iowa | ||||||||||||||||||||||||||||||||||||||
| 179 | Cedar Rapids, IA |
Northland Square
303 -367 Collins Road, Northeast |
52404 | SC | Fee | 1984 | 1998 | 100 | % | 187,068 | $ | 2,019,851 | $ | 10.80 | Barnes & Noble, Kohl’s, OfficeMax, T.J. Maxx | |||||||||||||||||||||||
| Kansas | ||||||||||||||||||||||||||||||||||||||
| 180 | Merriam, KS |
Merriam Town Center
5700 Antioch Road |
66202 | SC | Fee (3) | 1998/2004 | 2012 | 5 | % | 351,244 | $ | 4,303,852 | $ | 12.49 | Cinemark, Dick’s Sporting Goods, Hen House, Home Depot (Not Owned), Marshalls, OfficeMax, PetSmart | |||||||||||||||||||||||
| 181 | Overland Park, KS |
Overland Pointe Marketplace
Interstate 135 and Antioch Road |
66213 | SC | Fee (3) | 2001/2004 | 2012 | 5 | % | 80,047 | $ | 823,285 | $ | 18.65 | Babies “R” Us, Home Depot (Not Owned), Party City (Not Owned), Sam’s Club (Not Owned) | |||||||||||||||||||||||
| Kentucky | ||||||||||||||||||||||||||||||||||||||
| 182 | Louisville, KY |
Outer Loop Plaza
7505 Outer Loop Highway |
40228 | SC | Fee | 1973/1989/1998 | 2004 | 100 | % | 120,939 | $ | 717,721 | $ | 6.21 | Value Market | |||||||||||||||||||||||
27
Table of Contents
DDR Corp.
Shopping Center Property List at December 31, 2012
|
Location |
Center/Property |
Zip
Code |
Type of
Property (1) |
Ownership
Interest |
Year
Developed/ Redeveloped |
Year
Acquired |
DDR
Ownership Interest |
Company
Owned Gross Leasable Area (SF) |
Total
Annualized Base Rent |
Average
Base Rent (Per SF) (2) |
Anchor Tenants |
|||||||||||||||||||||||||||
| Maine | ||||||||||||||||||||||||||||||||||||||
| 183 | Brunswick, ME |
Cook’s Corners
172 Bath Road |
04011 | SC | GL | 1965 | 1997 | 100 | % | 306,390 | $ | 2,090,670 | $ | 7.70 | Big Lots, Regal Cinemas, Sears, T.J. Maxx | |||||||||||||||||||||||
| Maryland | ||||||||||||||||||||||||||||||||||||||
| 184 | Bowie, MD |
Duvall Village
4825 Glenn Dale Road |
20720 | SC | Fee | 1998 | 2007 | 100 | % | 88,022 | $ | 617,502 | $ | 22.32 | ||||||||||||||||||||||||
| 185 | Glen Burnie, MD |
Harundale Plaza
7440 Ritchie Highway |
21061 | SC | Fee (3) | 1999 | 2007 | 20 | % | 217,619 | $ | 1,571,854 | $ | 10.22 | Burlington Coat Factory, HomeGoods | |||||||||||||||||||||||
| 186 | Hagerstown, MD |
Valley Park Commons
1520 Wesel Boulevard |
21740 | SC | Fee | 1993/2006 | 2007 | 100 | % | 87,775 | $ | 1,079,555 | $ | 11.93 | Hobby Lobby, Lowe’s (Not Owned), Martin’s Food Store (Not Owned), Sam’s Club (Not Owned) | |||||||||||||||||||||||
| 187 | Salisbury, MD |
The Commons
East North Point Drive |
21801 | SC | Fee | 1999 | 1 | * | 100 | % | 130,259 | $ | 1,550,691 | $ | 14.43 | Best Buy, Home Depot (Not Owned), Michaels, Target (Not Owned) | ||||||||||||||||||||||
| 188 | Upper Marlboro, MD |
Largo Town Center
950 Largo Center Drive |
20774 | SC | Fee (3) | 1991 | 2007 | 20 | % | 277,352 | $ | 4,005,359 | $ | 13.06 | Marshalls, Regency Furniture, Shoppers Food Warehouse | |||||||||||||||||||||||
| 189 | White Marsh, MD |
Costco Plaza
9919 Pulaski Highway |
21220 | SC | Fee (3) | 1987/1992 | 2007 | 15 | % | 209,851 | $ | 1,502,407 | $ | 7.13 | Big Lots, Costco, Home Depot (Not Owned), Pep Boys, PetSmart | |||||||||||||||||||||||
| Massachusetts | ||||||||||||||||||||||||||||||||||||||
| 190 | Everett, MA |
Gateway Center
1 Mystic View Road |
02149 | SC | Fee | 2001 | 1 | * | 100 | % | 353,791 | $ | 5,206,799 | $ | 18.77 | Babies “R” Us, Bed Bath & Beyond, Costco (Not Owned), Home Depot, Michaels, OfficeMax, Old Navy, Target (Not Owned) | ||||||||||||||||||||||
| 191 | Framingham, MA |
Shoppers World
1 Worcester Road |
01701 | SC | Fee (3) | 1994 | 2012 | 5 | % | 778,476 | $ | 15,032,176 | $ | 20.70 | A.C. Moore, AMC Theatres, Babies “R” Us, Barnes & Noble, Best Buy, Bob’s Stores, DSW, Kohl’s, Macy’s, Marshalls, Nordstrom Rack, PetSmart, Sports Authority, T.J. Maxx, Toys “R” Us | |||||||||||||||||||||||
| 192 |
West Springfield,
MA |
Riverdale Shops
935 Riverdale Street |
01089 | SC | Fee (3) | 1985/2003 | 2007 | 20 | % | 273,435 | $ | 3,388,949 | $ | 13.32 | Kohl’s, Stop & Shop | |||||||||||||||||||||||
| 193 | Worcester, MA |
Worcester Plaza
301 Barber Avenue |
01606 | SC | Fee | 1998 | 2007 | 100 | % | 107,929 | $ | 1,116,581 | $ | 10.34 | ||||||||||||||||||||||||
| Michigan | ||||||||||||||||||||||||||||||||||||||
| 194 | Chesterfield, MI |
Chesterfield Corners
Marketplace Boulevard |
48051 | SC | Fee | 2006 | 2003 | 100 | % | 26,000 | $ | 71,200 | $ | 9.01 | Menards (Not Owned), Walmart (Not Owned) | |||||||||||||||||||||||
| 195 | Dearborn Heights, MI |
Walgreens
8706 North Telegraph Road |
48127 | SC | Fee | 1998/1999 | 2007 | 100 | % | 13,905 | $ | 385,510 | $ | 27.72 | ||||||||||||||||||||||||
| 196 | Grand Rapids, MI |
Green Ridge Square
3390-B Alpine Avenue Northwest |
49504 | SC | Fee | 1989/1991/1995 | 1995 | 100 | % | 216,288 | $ | 2,602,686 | $ | 12.36 | Bed Bath & Beyond, Best Buy, Michaels, T.J. Maxx, Target (Not Owned), Toys “R” Us (Not Owned) | |||||||||||||||||||||||
| 197 | Grandville, MI |
Grandville Marketplace
Intersection 44th Street and Canal Avenue |
49418 | SC | Fee (3) | 2003 | 2012 | 5 | % | 215,589 | $ | 2,133,916 | $ | 10.57 | Gander Mountain, Hobby Lobby, Lowe’s (Not Owned), OfficeMax | |||||||||||||||||||||||
| 198 | Howell, MI |
Grand River Plaza
3599 East Grand River |
48843 | SC | Fee | 1991 | 1993 | 100 | % | 214,501 | $ | 1,278,117 | $ | 7.03 | Dunham’s Sporting Goods, Elder-Beerman, T.J. Maxx | |||||||||||||||||||||||
| 199 | Lansing, MI |
Marketplace at Delta Township
8305 West Saginaw Highway 196 Ramp |
48917 | SC | Fee | 2000/2001 | 2003 | 100 | % | 135,703 | $ | 1,599,633 | $ | 11.72 | Gander Mountain, Lowe’s (Not Owned), Michaels, PetSmart, Staples, Walmart (Not Owned) | |||||||||||||||||||||||
| 200 | Livonia, MI |
Walgreens
29200 Six Mile Road |
48152 | SC | Fee | 1998/1999 | 2007 | 100 | % | 13,905 | $ | 269,061 | $ | 19.35 | ||||||||||||||||||||||||
| 201 | Milan, MI |
Milan Plaza
531 West Main Street |
48160 | SC | Fee (3) | 1955 | 2007 | 20 | % | 65,764 | $ | 260,349 | $ | 4.64 | Kroger | |||||||||||||||||||||||
28
Table of Contents
DDR Corp.
Shopping Center Property List at December 31, 2012
|
Location |
Center/Property |
Zip
Code |
Type of
Property (1) |
Ownership
Interest |
Year
Developed/ Redeveloped |
Year
Acquired |
DDR
Ownership Interest |
Company
Owned Gross Leasable Area (SF) |
Total
Annualized Base Rent |
Average
Base Rent (Per SF) (2) |
Anchor Tenants |
|||||||||||||||||||||||||||
| 202 | Mt. Pleasant, MI |
Indian Hills Plaza
4208 East Blue Grass Road |
48858 | SC | Fee | 1990/2012 | 2 | * | 100 | % | 249,680 | $ | 1,638,592 | $ | 8.81 | Dick’s Sporting Goods, Jo-Ann Fabric and Craft Stores, Kroger, T.J. Maxx | ||||||||||||||||||||||
| 203 | Sault St. Marie, MI |
Cascade Crossing
4516 I-75 Business Spur |
49783 | SC | Fee | 1993/1998 | 1994 | 100 | % | 276,361 | $ | 1,411,891 | $ | 8.12 | Dunham’s Sporting Goods, Glen’s Market, JCPenney, T.J. Maxx | |||||||||||||||||||||||
| 204 | Westland, MI |
Walgreens
7210 North Middlebelt |
48185 | SC | Fee | 2005 | 2007 | 100 | % | 13,905 | $ | 285,053 | $ | 20.50 | ||||||||||||||||||||||||
| Minnesota | ||||||||||||||||||||||||||||||||||||||
| 205 | Coon Rapids, MN |
Riverdale Village
12921 Riverdale Drive |
55433 | SC | Fee (3) | 2003 | 2012 | 5 | % | 779,012 | $ | 9,277,590 | $ | 16.03 | Bed Bath & Beyond, Best Buy, Costco (Not Owned), Dick’s Sporting Goods, DSW, JCPenney, Jo-Ann Fabric and Craft Stores, Kohl’s, Old Navy, Sears, T.J. Maxx | |||||||||||||||||||||||
| 206 | Maple Grove, MN |
Maple Grove Crossing
Weaver Lake Road and I-94 |
55369 | SC | Fee | 1995/2002 | 1996 | 100 | % | 266,091 | $ | 2,682,403 | $ | 11.76 | Barnes & Noble, Bed Bath & Beyond, Cub Foods (Not Owned), Kohl’s, Michaels | |||||||||||||||||||||||
| 207 | St. Paul, MN |
Midway Marketplace
1450 University Avenue West |
55104 | SC | Fee (3) | 1995 | 2012 | 5 | % | 324,354 | $ | 2,461,282 | $ | 9.81 | Cub Foods, Herberger’s (Not Owned), LA Fitness, Walmart | |||||||||||||||||||||||
| Mississippi | ||||||||||||||||||||||||||||||||||||||
| 208 | Gulfport, MS |
Crossroads Center
Crossroads Parkway |
39503 | SC | GL | 1999 | 2003 | 100 | % | 546,644 | $ | 5,750,537 | $ | 11.85 | Academy Sports, Barnes & Noble, Bed Bath & Beyond, Belk, Burke’s Outlet, Cinemark, Michaels, Office Depot, Ross Dress For Less, T.J. Maxx | |||||||||||||||||||||||
| 209 | Jackson, MS |
The Junction
6351 I-55 North 3 |
39213 | SC | Fee | 1996 | 2003 | 100 | % | 107,780 | $ | 1,106,776 | $ | 11.45 | Home Depot (Not Owned), Office Depot, PetSmart, Target (Not Owned) | |||||||||||||||||||||||
| 210 | Oxford, MS |
Oxford Place
2015-2035 University Avenue |
38655 | SC | Fee (3) | 2000 | 2003 | 20 | % | 71,866 | $ | 344,012 | $ | 16.00 | Kroger | |||||||||||||||||||||||
| 211 | Starkville, MS |
Starkville Crossings
882 Highway 12 West |
39759 | SC | Fee | 1999/2004 | 1994 | 100 | % | 133,691 | $ | 903,655 | $ | 6.90 | JCPenney, Kroger, Lowe’s (Not Owned) | |||||||||||||||||||||||
| 212 | Tupelo, MS |
Big Oaks Crossing
3850 North Gloster Street |
38801 | SC | Fee | 1992 | 1994 | 100 | % | 348,236 | $ | 1,970,318 | $ | 5.89 | Jo-Ann Fabric and Craft Stores, Sam’s Club, Walmart | |||||||||||||||||||||||
| Missouri | ||||||||||||||||||||||||||||||||||||||
| 213 | Arnold, MO |
Jefferson County Plaza
Vogel Road |
63010 | SC | Fee | 2002 | 1 | * | 100 | % | 42,091 | $ | 285,987 | $ | 12.63 | Home Depot (Not Owned), Target (Not Owned) | ||||||||||||||||||||||
| 214 | Brentwood, MO |
The Promenade at Brentwood
1 Brentwood Promenade Court |
63144 | SC | Fee | 1998 | 1998 | 100 | % | 299,584 | $ | 4,359,569 | $ | 14.55 | Bed Bath & Beyond, Micro Center, PetSmart, Target | |||||||||||||||||||||||
| 215 | Des Peres, MO |
Olympic Oaks Village
12109 Manchester Road |
63121 | SC | Fee | 1985 | 1998 | 100 | % | 87,372 | $ | 1,218,081 | $ | 19.56 | T.J. Maxx | |||||||||||||||||||||||
| 216 | Fenton, MO |
Fenton Plaza
Gravois and Highway 141 |
63206 | SC | Fee | 1970/1997 | 1/2 | * | 100 | % | 100,420 | $ | 930,476 | $ | 11.07 | Aldi | ||||||||||||||||||||||
| 217 | Independence, MO |
Independence Commons
900 East 39th Street |
64057 | SC | Fee | 1995/1999 | 1995 | 100 | % | 386,057 | $ | 4,739,959 | $ | 12.74 | AMC Theatres, Barnes & Noble, Best Buy, Kohl’s, Marshalls, Ross Dress For Less, Shoe Carnival | |||||||||||||||||||||||
| 218 | Springfield, MO |
Morris Corners
1425 East Battlefield |
65804 | SC | GL | 1989 | 1998 | 100 | % | 56,033 | $ | 548,416 | $ | 10.43 | Toys “R” Us | |||||||||||||||||||||||
| 219 | St. John, MO |
St. John Crossings
9000-9070 St. Charles Rock Road |
63114 | SC | Fee | 2003 | 2003 | 100 | % | 94,173 | $ | 1,136,259 | $ | 12.05 | Shop ‘N Save | |||||||||||||||||||||||
| 220 | St. Louis, MO |
Southtown Centre
Kings Highway and Chippewa |
63109 | SC | Fee | 2004/2012 | 1998 | 100 | % | 88,364 | $ | 1,264,600 | $ | 16.19 | OfficeMax | |||||||||||||||||||||||
| 221 | Sunset Hills, MO |
Plaza at Sunset Hills
10980 Sunset Plaza |
63128 | SC | Fee | 1997 | 1998 | 100 | % | 450,938 | $ | 5,575,119 | $ | 13.20 | Bed Bath & Beyond, Home Depot, Marshalls, PetSmart, Ross Dress For Less, Stein Mart, Toys “R” Us | |||||||||||||||||||||||
| Nevada | ||||||||||||||||||||||||||||||||||||||
| 222 | Reno, NV |
Reno Riverside
East First Street and Sierra |
89505 | SC | Fee | 2000 | 2000 | 100 | % | 52,474 | $ | 745,923 | $ | 14.27 | Century Theatres | |||||||||||||||||||||||
29
Table of Contents
DDR Corp.
Shopping Center Property List at December 31, 2012
|
Location |
Center/Property |
Zip
Code |
Type of
Property (1) |
Ownership
Interest |
Year
Developed/ Redeveloped |
Year
Acquired |
DDR
Ownership Interest |
Company
Owned Gross Leasable Area (SF) |
Total
Annualized Base Rent |
Average
Base Rent (Per SF) (2) |
Anchor Tenants |
|||||||||||||||||||||||||||
| New Jersey | ||||||||||||||||||||||||||||||||||||||
| 223 | East Hanover, NJ |
East Hanover Plaza
154 State Route 10 |
07936 | SC | Fee | 1994 | 2007 | 100 | % | 97,500 | $ | 1,908,597 | $ | 19.58 | Costco (Not Owned), Sports Authority, Target (Not Owned) | |||||||||||||||||||||||
| 224 | Edgewater, NJ |
Edgewater Towne Center
905 River Road |
07020 | SC | Fee | 2000 | 2007 | 100 | % | 77,508 | $ | 1,889,957 | $ | 24.38 | Whole Foods | |||||||||||||||||||||||
| 225 | Freehold, NJ |
Freehold Marketplace
New Jersey Highway 33 and West Main Street (Route 537) |
07728 | SC | Fee | 2005 | 1 | * | 100 | % | 20,743 | $ | 620,000 | $ | — | Sam’s Club (Not Owned), Walmart (Not Owned) | ||||||||||||||||||||||
| 226 | Hamilton, NJ |
Hamilton Marketplace
New Jersey State Highway 130 and Klockner Road |
08691 | SC | Fee | 2004 | 2003 | 100 | % | 531,820 | $ | 8,713,309 | $ | 15.69 | Barnes & Noble, Bed Bath & Beyond, BJ’s Wholesale Club (Not Owned), Kohl’s, Lowe’s (Not Owned), Michaels, Ross Dress For Less, Shop-Rite, Staples, Walmart (Not Owned) | |||||||||||||||||||||||
| 227 | Lumberton, NJ |
Crossroads Plaza
1520 Route 38 |
08036 | SC | Fee (3) | 2003 | 2007 | 20 | % | 89,627 | $ | 1,636,530 | $ | 18.26 | Lowe’s (Not Owned), Shop-Rite | |||||||||||||||||||||||
| 228 | Lyndhurst, NJ |
Lewandowski Commons
434 Lewandowski Street |
07071 | SC | Fee (3) | 1998 | 2007 | 20 | % | 78,097 | $ | 1,488,569 | $ | 22.51 | Stop & Shop | |||||||||||||||||||||||
| 229 | Mays Landing, NJ |
Wrangleboro Consumer Square
2300 Wrangleboro Road |
08330 | SC | Fee | 1997 | 2004 | 100 | % | 841,161 | $ | 9,988,085 | $ | 13.85 | Babies “R” Us, Best Buy, BJ’s Wholesale Club, Christmas Tree Shops, Dick’s Sporting Goods, Just Cabinets, Kohl’s, Michaels, PetSmart, Staples, Target | |||||||||||||||||||||||
| 230 | Mays Landing, NJ |
Hamilton Commons
4215 Black Horse Pike |
08330 | SC | Fee | 2001 | 2004 | 100 | % | 398,578 | $ | 6,061,260 | $ | 15.67 | Bed Bath & Beyond, hhgregg, Marshalls, Regal Cinemas, Ross Dress For Less, Sports Authority | |||||||||||||||||||||||
| 231 | Princeton, NJ |
Nassau Park Pavilion
Route 1 and Quaker Bridge Road |
02071 | SC | Fee | 1995/2000/2005 | 1997 | 100 | % | 598,329 | $ | 9,369,746 | $ | 18.22 | Babies “R” Us, Best Buy, buybuy BABY, Dick’s Sporting Goods, Home Depot (Not Owned), HomeGoods, Kohl’s, Michaels, PetSmart, Sam’s Club (Not Owned), Target (Not Owned), Walmart (Not Owned), Wegman’s Food Markets | |||||||||||||||||||||||
| 232 | Union, NJ |
Route 22 Retail Center
2700 U.S. Highway 22 East |
07083 | SC | Fee | 1997 | 2007 | 100 | % | 107,546 | $ | 1,819,484 | $ | 17.74 | Babies “R” Us, Dick’s Sporting Goods, Target (Not Owned) | |||||||||||||||||||||||
| 233 | West Long Branch, NJ |
Consumer Centre
310 State Highway #36 |
07764 | SC | Fee | 1993 | 2004 | 100 | % | 292,999 | $ | 3,824,158 | $ | 12.77 | buybuy BABY, Home Depot, PetSmart, Sports Authority | |||||||||||||||||||||||
| 234 | Woodland Park, NJ |
West Falls Plaza
1730 Route 46 |
07424 | SC | Fee (3) | 1995 | 2007 | 20 | % | 88,913 | $ | 1,991,693 | $ | 22.39 | A & P Company | |||||||||||||||||||||||
| New York | ||||||||||||||||||||||||||||||||||||||
| 235 | Amherst, NY |
Burlington Plaza
1551 Niagara Falls Boulevard |
14228 | SC | GL |
1978/1982/
1990/ 1998 |
2004 | 100 | % | 190,665 | $ | 1,883,435 | $ | 10.99 | Burlington Coat Factory, Jo-Ann Fabric and Craft Stores | |||||||||||||||||||||||
| 236 | Amherst, NY |
Tops Plaza
3190 Niagara Falls Boulevard |
14228 | SC | Fee (3) | 1986 | 2004 | 20 | % | 145,642 | $ | 1,134,970 | $ | 8.61 | Tops Markets | |||||||||||||||||||||||
| 237 | Batavia, NY |
Batavia Commons
419 West Main Street |
14020 | SC | Fee (3) | 1990 | 2012 | 5 | % | 49,431 | $ | 386,345 | $ | 8.81 | ||||||||||||||||||||||||
| 238 | Batavia, NY |
BJ’s Plaza
8326 Lewiston Road |
14020 | SC | Fee (3) | 1996 | 2012 | 5 | % | 95,846 | $ | 904,755 | $ | 9.44 | BJ’s Wholesale Club | |||||||||||||||||||||||
| 239 | Big Flats, NY |
Big Flats Consumer Square
830 County Route 64 |
14814 | SC | Fee | 1993/2001 | 2004 | 100 | % | 641,222 | $ | 4,772,755 | $ | 8.10 | Barnes & Noble, Bed Bath & Beyond, Hobby Lobby, Michaels, Old Navy, Sam’s Club, Staples, T.J. Maxx, Tops Markets | |||||||||||||||||||||||
| 240 | Buffalo, NY |
Elmwood Regal Center
1951-2023 Elmwood Avenue |
14207 | SC | Fee | 1997 | 2004 | 100 | % | 133,940 | $ | 1,893,865 | $ | 15.75 | Regal Cinemas | |||||||||||||||||||||||
| 241 | Buffalo, NY |
Delaware Consumer Square
2636-2658 Delaware Avenue |
14216 | SC | GL | 1995 | 2004 | 100 | % | 238,403 | $ | 1,946,092 | $ | 15.53 | OfficeMax, Target | |||||||||||||||||||||||
30
Table of Contents
DDR Corp.
Shopping Center Property List at December 31, 2012
|
Location |
Center/Property |
Zip
Code |
Type of
Property (1) |
Ownership
Interest |
Year
Developed/ Redeveloped |
Year
Acquired |
DDR
Ownership Interest |
Company
Owned Gross Leasable Area (SF) |
Total
Annualized Base Rent |
Average
Base Rent (Per SF) (2) |
Anchor Tenants |
|||||||||||||||||||||||||||
| 242 | Cheektowaga, NY |
Walden Consumer Square
1700-1750 Walden Avenue |
14225 | SC | Fee (3) | 1997/1999/2004 | 2012 | 5 | % | 253,225 | $ | 2,147,471 | $ | 8.62 | Michaels, Office Depot, Pricerite Supermarket, Target | |||||||||||||||||||||||
| 243 | Cheektowaga, NY | 2015 Walden Avenue | 14225 | SC | Fee (3) | 1994 | 2012 | 5 | % | 26,500 | $ | — | $ | — | ||||||||||||||||||||||||
| 244 | Cheektowaga, NY |
Walden Place
2130-2190 Walden Avenue |
14225 | SC | Fee (3) | 1994/1999 | 2012 | 5 | % | 68,002 | $ | 654,238 | $ | 12.23 | Ollie’s Bargain Outlet | |||||||||||||||||||||||
| 245 | Cheektowaga, NY |
Thruway Plaza
2195 Harlem Road |
14225 | SC | Fee |
1965/1995/
1997/ 2004 |
2004 | 100 | % | 385,040 | $ | 2,895,577 | $ | 7.36 | CW Price, Home Depot (Not Owned), Movieland 8 Theatres, M&T Bank, Tops Markets, Value City Furniture, Walmart | |||||||||||||||||||||||
| 246 | Cheektowaga, NY |
Rite Aid
2401 Gennesee Street |
14225 | SC | Fee | 2000 | 2007 | 100 | % | 10,908 | $ | 335,592 | $ | 30.77 | ||||||||||||||||||||||||
| 247 | Cheektowaga, NY |
Union Road Plaza
3637 Union Road |
14225 | SC | Fee (3) |
1979/1982/
1997/ 2003 |
2012 | 5 | % | 170,533 | $ | 810,954 | $ | 11.62 | ||||||||||||||||||||||||
| 248 | Cheektowaga, NY |
Union Consumer Square
3771-3787 and 3791-3803 Union Road |
14225 | SC | Fee (3) | 1989 | 2012 | 5 | % | 386,320 | $ | 3,461,065 | $ | 10.87 | Bed Bath & Beyond, Marshalls, OfficeMax, Sam’s Club | |||||||||||||||||||||||
| 249 | Cheektowaga, NY |
Tops Plaza
3825-3875 Union Road |
14225 | SC | Fee (3) |
1978/1989/
1995/ 2004 |
2004 | 20 | % | 151,357 | $ | 1,545,150 | $ | 11.28 | Tops Markets | |||||||||||||||||||||||
| 250 | Clarence, NY |
Jo-Ann Plaza
4101 Transit Road |
14221 | SC | Fee (3) | 1994 | 2012 | 5 | % | 92,720 | $ | 782,491 | $ | 8.44 | Big Lots, Jo-Ann Fabric and Craft Stores, OfficeMax | |||||||||||||||||||||||
| 251 | Dewitt, NY |
Michaels
3133 Erie Boulevard |
13214 | SC | Fee | 2002 | 2004 | 100 | % | 38,413 | $ | 448,543 | $ | 11.68 | Michaels | |||||||||||||||||||||||
| 252 | Dunkirk, NY |
Rite Aid
1166 Central Avenue |
14048 | SC | GL | 2000 | 2007 | 100 | % | 10,908 | $ | 210,569 | $ | 19.30 | ||||||||||||||||||||||||
| 253 | Gates, NY |
Westgate Plaza
2000 Chili Avenue |
14624 | SC | Fee | 1998 | 2004 | 100 | % | 330,146 | $ | 3,408,488 | $ | 10.21 | Staples, Walmart | |||||||||||||||||||||||
| 254 | Greece, NY |
Jo-Ann/PetSmart Plaza
3042 West Ridge Road |
14626 | SC | Fee | 1993/1999 | 2004 | 100 | % | 75,916 | $ | 837,927 | $ | 11.04 | Jo-Ann Fabric and Craft Stores, PetSmart | |||||||||||||||||||||||
| 255 | Hamburg, NY |
Mckinley Mall
3701 Mckinley Parkway |
14075 | SC | Fee | 1990/2001 | 2004 | 100 | % | 128,944 | $ | 495,881 | $ | 16.81 | ||||||||||||||||||||||||
| 256 | Hamburg, NY |
Mckinley Milestrip (Home Depot)
4405 Milestrip Road |
14219 | SC | GL | 1999/2000 | 2004 | 100 | % | 246,187 | $ | 2,569,800 | $ | 12.04 | Home Depot, Jo-Ann Fabric and Craft Stores | |||||||||||||||||||||||
| 257 | Hamburg, NY |
BJ’s Plaza
4408 Milestrip Road |
14075 | SC | GL | 1990/1997 | 2004 | 100 | % | 175,965 | $ | 1,938,927 | $ | 11.02 | BJ’s Wholesale Club, OfficeMax | |||||||||||||||||||||||
| 258 | Horseheads, NY |
Southern Tier Crossing
Ann Page Road and I-86 |
14845 | SC | Fee | 2008 | 1 | * | 100 | % | 156,810 | $ | 2,024,351 | $ | 14.29 | Aldi (Not Owned), Dick’s Sporting Goods, Jo-Ann Fabric and Craft Stores, Kohl’s (Not Owned), Walmart (Not Owned) | ||||||||||||||||||||||
| 259 | Irondequoit, NY |
Culver Ridge Plaza
2255 Ridge Road East |
14622 | SC | Fee (3) | 1972/1984/1997 | 2004 | 20 | % | 225,185 | $ | 2,436,719 | $ | 11.55 | CW Price, Regal Cinemas | |||||||||||||||||||||||
| 260 | Ithaca, NY |
Tops Plaza
614-722 South Meadow |
14850 | SC | Fee | 1990/1999/2003 | 2004 | 100 | % | 229,464 | $ | 3,349,708 | $ | 15.54 | Barnes & Noble, Michaels, Ollie’s Bargain Outlet, Tops Markets | |||||||||||||||||||||||
| 261 | Jamestown, NY |
Tops Plaza
1800-2000 Washington Street |
14702 | SC | Fee (3) | 1997 | 2004 | 20 | % | 98,001 | $ | 1,005,622 | $ | 10.89 | Tops Markets | |||||||||||||||||||||||
| 262 | Leroy, NY |
Tops Plaza
128 West Main Street |
14482 | SC | Fee (3) | 1997 | 2004 | 20 | % | 62,747 | $ | 489,994 | $ | 9.06 | Tops Markets | |||||||||||||||||||||||
| 263 | Lockport, NY |
Tops Plaza
5789 & 5839 Transit Road and Hamm |
14094 | SC | Fee | 1993 | 2004 | 100 | % | 296,582 | $ | 2,554,583 | $ | 8.99 | Sears Hometown, Tops Markets, Walmart | |||||||||||||||||||||||
31
Table of Contents
DDR Corp.
Shopping Center Property List at December 31, 2012
|
Location |
Center/Property |
Zip
Code |
Type of
Property (1) |
Ownership
Interest |
Year
Developed/ Redeveloped |
Year
Acquired |
DDR
Ownership Interest |
Company
Owned Gross Leasable Area (SF) |
Total
Annualized Base Rent |
Average
Base Rent (Per SF) (2) |
Anchor Tenants |
|||||||||||||||||||||||||||
| 264 | New Hartford, NY |
Hannaford Plaza
40 Kellogg Road |
13413 | SC | Fee | 1998 | 2004 | 100 | % | 110,732 | $ | 1,122,558 | $ | 12.94 | Hannaford | |||||||||||||||||||||||
| 265 | Niskayuna, NY |
Mohawk Commons
402-442 Balltown Road |
12121 | SC | Fee | 2002 | 2004 | 100 | % | 404,983 | $ | 4,887,528 | $ | 11.94 | Barnes & Noble, Bed Bath & Beyond, Lowe’s, Marshalls, Price Chopper, Target (Not Owned) | |||||||||||||||||||||||
| 266 | North Tonawanda, NY |
Mid-City Plaza
955-987 Payne Avenue |
14120 | SC | Fee |
1960/1976/1980/
1995/1997/2004 |
2004 | 100 | % | 222,344 | $ | 2,407,540 | $ | 11.65 | Grossman’s Bargain Outlet, Tops Markets | |||||||||||||||||||||||
| 267 | Olean, NY |
Walmart Plaza
3142 West State Street |
14760 | SC | Fee | 1993/2004 | 2004 | 100 | % | 353,326 | $ | 2,429,396 | $ | 6.93 | BJ’s Wholesale Club, Carmike Cinemas, Home Depot (Not Owned), Walmart | |||||||||||||||||||||||
| 268 | Ontario, NY |
Tops Plaza
6254-6272 Furnace Road |
14519 | SC | Fee (3) | 1998 | 2004 | 20 | % | 77,040 | $ | 697,358 | $ | 9.59 | Tops Markets | |||||||||||||||||||||||
| 269 | Orchard Park, NY |
Crossroads Centre
3245 Southwestern Boulevard |
14127 | SC | Fee (3) | 2000 | 2004 | 20 | % | 167,805 | $ | 1,724,285 | $ | 10.86 | Lowe’s (Not Owned), Stein Mart, Tops Markets | |||||||||||||||||||||||
| 270 | Penfield, NY |
Panorama Plaza
1601 Penfield Road |
14625 | SC | Fee (3) |
1959/1965/1972/
1980/1986/1994 |
2004 | 20 | % | 279,219 | $ | 3,243,143 | $ | 12.51 | Staples, Tops Markets, Tuesday Morning | |||||||||||||||||||||||
| 271 | Rome, NY |
Freedom Plaza
205-211 Erie Boulevard West |
13440 | SC | Fee |
1978/2000/
2001/ 2006 |
2004 | 100 | % | 197,397 | $ | 1,412,173 | $ | 6.96 | JCPenney, Marshalls, Staples, Tops Markets | |||||||||||||||||||||||
| 272 | Tonawanda, NY |
Sheridan Plaza
2309 Eggert Road |
14150 | SC | Fee | 1976/1985/1996 | 2004 | 100 | % | 121,846 | $ | 660,850 | $ | 9.61 | Best Fitness | |||||||||||||||||||||||
| 273 | Victor, NY |
Victor Square
2-10 Commerce Drive |
14564 | SC | Fee | 2000 | 2004 | 100 | % | 55,943 | $ | 579,396 | $ | 11.89 | Optigolf | |||||||||||||||||||||||
| 274 | Warsaw, NY |
Tops Plaza
2382 Route 19 |
14569 | SC | Fee (3) | 1998 | 2004 | 20 | % | 74,105 | $ | 512,254 | $ | 8.36 | Tops Markets, Walmart (Not Owned) | |||||||||||||||||||||||
| 275 | West Seneca, NY |
Home Depot Plaza
1881 Ridge Road |
14224 | SC | GL |
1975/1983/
1987/ 1995 |
2004 | 100 | % | 139,453 | $ | 1,445,404 | $ | 10.58 | Home Depot | |||||||||||||||||||||||
| 276 | Williamsville, NY |
Williamsville Place
5395 Sheridan Drive |
14221 | SC | Fee | 1986/1995/2003 | 2004 | 100 | % | 102,792 | $ | 1,168,054 | $ | 15.12 | ||||||||||||||||||||||||
| 277 | Williamsville, NY |
Premier Place
7864-8020 Transit Road |
14221 | SC | Fee (3) | 1986/1994/1998 | 2012 | 5 | % | 141,639 | $ | 1,204,744 | $ | 11.70 | Premier Liquors, Stein Mart | |||||||||||||||||||||||
| North Carolina | ||||||||||||||||||||||||||||||||||||||
| 278 | Apex, NC |
Apex Promenade
1201 Hadden Drive |
27502 | SC | Fee | 2009 | 2007 | 100 | % | 35,863 | $ | 471,000 | $ | 13.13 | hhgregg | |||||||||||||||||||||||
| 279 | Apex, NC |
Beaver Creek Crossings
1335 West Williams Street |
27502 | SC | Fee | 2006 | 1 | * | 100 | % | 316,803 | $ | 4,773,496 | $ | 16.07 | Dick’s Sporting Goods, Regal Cinemas, T.J. Maxx | ||||||||||||||||||||||
| 280 | Asheville, NC |
River Hills
299 Swannanoa River Road |
28805 | SC | Fee (3) | 1996 | 2012 | 5 | % | 190,970 | $ | 2,028,229 | $ | 10.62 | Carmike Cinemas, Dick’s Sporting Goods, Haverty’s, Kitchen & Company, Michaels, OfficeMax, Target (Not Owned) | |||||||||||||||||||||||
| 281 | Asheville, NC |
Oakley Plaza
Fairview Road at Interstate 240 |
28801 | SC | Fee | 1988 | 2007 | 100 | % | 118,699 | $ | 952,898 | $ | 8.24 | Babies “R” Us, BI-LO | |||||||||||||||||||||||
| 282 | Cary, NC |
hhgregg
1401 Piney Plains Road |
27511 | SC | Fee | 2000 | 2007 | 100 | % | 29,235 | $ | 292,350 | $ | 10.00 | hhgregg | |||||||||||||||||||||||
| 283 | Chapel Hill, NC |
Meadowmont Village
West Barbee Chapel Road |
27517 | SC | Fee (3) | 2002 | 2007 | 20 | % | 132,364 | $ | 2,129,513 | $ | 19.63 | Harris Teeter | |||||||||||||||||||||||
| 284 | Charlotte, NC |
Cotswold Village Shopping Center
308 South Sharon Amity Road |
28211 | SC | Fee | 1950/1993/2007 | 2011 | 100 | % | 260,654 | $ | 4,964,149 | $ | 20.09 | Books-A-Million, Harris Teeter, Marshalls, PetSmart | |||||||||||||||||||||||
| 285 | Charlotte, NC |
Terraces at South Park
4735 Sharon Road |
28210 | SC | Fee | 1998 | 2011 | 100 | % | 28,658 | $ | 920,547 | $ | 33.86 | ||||||||||||||||||||||||
| 286 | Charlotte, NC |
Camfield Corners
8620 Camfield Street |
28277 | SC | Fee | 1994 | 2007 | 100 | % | 69,857 | $ | 874,362 | $ | 12.88 | BI-LO | |||||||||||||||||||||||
32
Table of Contents
DDR Corp.
Shopping Center Property List at December 31, 2012
|
Location |
Center/Property |
Zip
Code |
Type of
Property (1) |
Ownership
Interest |
Year
Developed/ Redeveloped |
Year
Acquired |
DDR
Ownership Interest |
Company
Owned Gross Leasable Area (SF) |
Total
Annualized Base Rent |
Average
Base Rent (Per SF) (2) |
Anchor Tenants |
|||||||||||||||||||||||||||
| 287 | Charlotte, NC |
Carolina Pavilion
9425-9575 South Boulevard |
28273 | SC | Fee | 1995-1997 | 2012 | 100 | % | 730,119 | $ | 7,310,508 | $ | 11.38 | AMC Theatres, Babies “R” Us, Bed Bath & Beyond, buybuy BABY, Golfsmith, hhgregg, Jo-Ann Fabric and Craft Stores, Kohl’s, Nordstrom Rack, Old Navy, Ross Dress For Less, Sears Outlet, Sports Authority, Target (Not Owned), Value City Furniture | |||||||||||||||||||||||
| 288 | Clayton, NC |
Clayton Corners
U.S. Highway 70 West |
27520 | SC | Fee (3) | 1999 | 2007 | 20 | % | 125,708 | $ | 1,379,288 | $ | 11.80 | Lowe’s Foods | |||||||||||||||||||||||
| 289 | Cornelius, NC |
The Shops at The Fresh Market
20601 Torrence Chapel Road |
28031 | SC | Fee | 2001 | 2007 | 100 | % | 130,113 | $ | 1,277,849 | $ | 10.04 | The Fresh Market, Stein Mart | |||||||||||||||||||||||
| 290 | Durham, NC |
Oxford Commons
3500 Oxford Road |
27702 | SC | Fee | 1990/2001 | 1/2 | * | 100 | % | 208,014 | $ | 682,165 | $ | 3.76 | Burlington Coat Factory, Food Lion | ||||||||||||||||||||||
| 291 | Durham, NC |
Patterson Place
3616 Witherspoon Boulevard |
27707 | SC | Fee (3) | 2004 | 2007 | 20 | % | 160,942 | $ | 2,298,248 | $ | 14.69 | A.C. Moore, Bed Bath & Beyond, DSW, Home Depot (Not Owned), Kohl’s (Not Owned), Kroger (Not Owned) | |||||||||||||||||||||||
| 292 | Durham, NC |
South Square
4001 Durham Chapel |
27707 | SC | Fee (3) | 2005 | 2007 | 20 | % | 109,590 | $ | 1,722,302 | $ | 15.91 | Office Depot, Ross Dress For Less, Sam’s Club (Not Owned), Target (Not Owned) | |||||||||||||||||||||||
| 293 | Fayetteville, NC |
Fayetteville Pavilion
2061 Skibo Road |
28314 | SC | Fee (3) | 1998/2001 | 2007 | 20 | % | 273,969 | $ | 3,099,496 | $ | 11.31 | Dick’s Sporting Goods, Food Lion, Marshalls, Michaels, PetSmart | |||||||||||||||||||||||
| 294 | Fayetteville, NC |
Cross Pointe Centre
5075 Morganton Road |
28314 | SC | Fee | 1985/2003 | 2003 | 100 | % | 226,089 | $ | 1,953,301 | $ | 13.38 | Bed Bath & Beyond, T.J. Maxx | |||||||||||||||||||||||
| 295 | Fuquay Varina, NC |
Sexton Commons
1420 North Main Street |
27526 | SC | Fee (3) | 2002 | 2007 | 20 | % | 49,097 | $ | 768,560 | $ | 16.46 | Harris Teeter | |||||||||||||||||||||||
| 296 | Greensboro, NC |
Wendover Village
4203-4205 West Wendover Avenue |
27407 | SC | Fee | 2004 | 2007 | 100 | % | 35,895 | $ | 968,690 | $ | 26.99 | Costco (Not Owned) | |||||||||||||||||||||||
| 297 | Greensboro, NC |
Adam’s Farm
5710 High Point Road |
27407 | SC | Fee | 2004 | 2007 | 100 | % | 112,010 | $ | 977,335 | $ | 11.01 | Harris Teeter | |||||||||||||||||||||||
| 298 | Greensboro, NC |
Golden Gate
East Cornwallis Drive |
27405 | SC | Fee | 1962/2002 | 2007 | 100 | % | 151,371 | $ | 901,551 | $ | 8.29 | Food Lion, Staples | |||||||||||||||||||||||
| 299 | Greensboro, NC |
Wendover Village
West Wendover Avenue |
27407 | SC | Fee (3) | 2004 | 2007 | 20 | % | 134,810 | $ | 839,406 | $ | 14.56 | A.C. Moore | |||||||||||||||||||||||
| 300 | Huntersville, NC |
Birkdale Village
8712 Lindholm Drive, Suite 206 |
28078 | LC | Fee (3) | 2003 | 2007 | 15 | % | 300,249 | $ | 6,226,864 | $ | 23.64 | Barnes & Noble, Dick’s Sporting Goods, Regal Cinemas (Not Owned) | |||||||||||||||||||||||
| 301 | Huntersville, NC |
Rosedale Shopping Center
9911 Rose Commons Drive |
28078 | SC | Fee (3) | 2000 | 2007 | 20 | % | 119,087 | $ | 1,707,955 | $ | 15.88 | Harris Teeter | |||||||||||||||||||||||
| 302 | Indian Trail, NC |
Union Town Center
Independence and Faith Church Road |
28079 | SC | Fee | 1999 | 2004 | 100 | % | 98,160 | $ | 900,460 | $ | 9.87 | Food Lion | |||||||||||||||||||||||
| 303 | Mooresville, NC |
Mooresville Consumer Square
355 West Plaza Drive |
28117 | SC | Fee | 1999/2006 | 2004 | 100 | % | 472,182 | $ | 3,517,443 | $ | 8.05 | Gander Mountain, Ollie’s Bargain Outlet, Walmart | |||||||||||||||||||||||
| 304 | Mooresville, NC |
Winslow Bay Commons
Bluefield Road and Highway 150 |
28117 | SC | Fee (3) | 2003 | 2007 | 15 | % | 269,586 | $ | 3,656,405 | $ | 13.57 | Dick’s Sporting Goods, HomeGoods, Michaels, Ross Dress For Less, T.J. Maxx, Target (Not Owned) | |||||||||||||||||||||||
| 305 | New Bern, NC |
Rivertowne Square
3003 Claredon Boulevard |
28561 | SC | Fee | 1989/1999 | 1/2 | * | 100 | % | 68,795 | $ | 539,016 | $ | 9.16 | PetSmart, Walmart (Not Owned) | ||||||||||||||||||||||
| 306 | Raleigh, NC |
Capital Crossing
2900-2950 East Mill Brook Road |
27613 | SC | Fee | 1995 | 2007 | 100 | % | 83,200 | $ | 812,920 | $ | 9.77 | Garden Ridge (Not Owned), Lowe’s (Not Owned), Lowe’s Foods, PetSmart (Not Owned), Sam’s Club (Not Owned), Staples | |||||||||||||||||||||||
| 307 | Raleigh, NC |
Poyner Place
5900 Poyner Anchor Lane |
27616 | SC | Fee | 2004/2012 | 2012 | 100 | % | 257,051 | $ | 3,256,672 | $ | 13.77 | Cost Plus World Market, OfficeMax, Old Navy, Pier 1, Ross Dress For Less, Shoe Carnival, Super Target (Not Owned), Toys “R” Us/ Babies “R” Us | |||||||||||||||||||||||
33
Table of Contents
DDR Corp.
Shopping Center Property List at December 31, 2012
|
Location |
Center/Property |
Zip
Code |
Type of
Property (1) |
Ownership
Interest |
Year
Developed/ Redeveloped |
Year
Acquired |
DDR
Ownership Interest |
Company
Owned Gross Leasable Area (SF) |
Total
Annualized Base Rent |
Average
Base Rent (Per SF) (2) |
Anchor Tenants |
|||||||||||||||||||||||||||
| 308 | Raleigh, NC |
Alexander Place
Glenwood Avenue and Brier Creek Parkway |
27617 | SC | Fee (3) | 2004 | 2007 | 15 | % | 188,254 | $ | 2,846,370 | $ | 15.27 | hhgregg, Kohl’s, Walmart (Not Owned) | |||||||||||||||||||||||
| 309 | Salisbury, NC |
Alexander Pointe
850 Jake Alexander Boulevard |
28144 | SC | Fee (3) | 1997 | 2007 | 20 | % | 57,710 | $ | 571,076 | $ | 11.13 | Harris Teeter | |||||||||||||||||||||||
| 310 | Wake Forest, NC |
Capital Plaza
11825 Retail Drive |
27587 | SC | Fee (3) | 2004 | 2007 | 15 | % | 46,793 | $ | 462,794 | $ | 13.62 | Home Depot (Not Owned), Target (Not Owned) | |||||||||||||||||||||||
| 311 | Washington, NC |
Pamlico Plaza
536 Pamlico Plaza |
27889 | SC | Fee | 1990/1999 | 1/2 | * | 100 | % | 80,644 | $ | 570,120 | $ | 7.07 | Burke’s Outlet, Office Depot, Walmart (Not Owned) | ||||||||||||||||||||||
| 312 | Wilmington, NC |
University Centre
South College Road and New Centre Drive |
28403 | SC | Fee | 1989/2001 | 1/2 | * | 100 | % | 411,887 | $ | 3,651,294 | $ | 9.67 | Bed Bath & Beyond, Lowe’s, Old Navy, Ollie’s Bargain Outlet, Ross Dress For Less, Sam’s Club (Not Owned) | ||||||||||||||||||||||
| 313 | Wilson, NC |
Forest Hills Centre
1700 Raleigh Road Northwest |
27896 | SC | Fee | 1989 | 2007 | 100 | % | 73,102 | $ | 530,645 | $ | 7.97 | Big Lots | |||||||||||||||||||||||
| 314 | Winston Salem, NC |
Walmart
4550 Kester Mill Road |
27103 | SC | Fee | 1998 | 2007 | 100 | % | 204,931 | $ | 1,403,777 | $ | 6.85 | Walmart | |||||||||||||||||||||||
| 315 | Winston Salem, NC |
Harper Hill Commons
5049 Country Club Road |
27104 | SC | Fee (3) | 2004 | 2007 | 20 | % | 96,914 | $ | 883,913 | $ | 13.87 | Harris Teeter | |||||||||||||||||||||||
| 316 | Winston Salem, NC |
Shops at Oliver Crossing
Peters Creek Parkway Oliver Crossing |
27127 | SC | Fee (3) | 2003 | 2007 | 20 | % | 76,512 | $ | 909,654 | $ | 12.83 | Lowe’s Foods | |||||||||||||||||||||||
| Ohio | ||||||||||||||||||||||||||||||||||||||
| 317 | Alliance, OH |
Walmart
2700 West State Street |
44601 | SC | Fee | 1998 | 2007 | 100 | % | 200,084 | $ | 1,190,500 | $ | 5.95 | Walmart | |||||||||||||||||||||||
| 318 | Ashtabula, OH |
Ashtabula Commons
1144 West Prospect Road |
44004 | SC | Fee | 2000 | 2004 | 100 | % | 57,874 | $ | 872,400 | $ | 15.07 | ||||||||||||||||||||||||
| 319 | Aurora, OH |
Barrington Town Center
70-130 Barrington Town Square |
44202 | SC | Fee | 1996/2004 | 1 | * | 100 | % | 112,674 | $ | 1,208,237 | $ | 12.58 | Cinemark, Heinen’s (Not Owned) | ||||||||||||||||||||||
| 320 | Boardman, OH |
Southland Crossings
I-680 and U.S. Route 224 |
44514 | SC | Fee | 1997 | 1 | * | 100 | % | 511,654 | $ | 3,437,876 | $ | 7.68 | Babies “R” Us, Giant Eagle, Lowe’s, PetSmart, Staples, Walmart | ||||||||||||||||||||||
| 321 | Chillicothe, OH |
Chillicothe Place
867 North Bridge Street |
45601 | SC | GL (3) | 1974/1998 | 1/2 | * | 20 | % | 106,262 | $ | 1,115,843 | $ | 10.50 | Big Lots (Not Owned), Hobby Lobby (Not Owned), Kroger, OfficeMax | ||||||||||||||||||||||
| 322 | Chillicothe, OH |
Chillicothe Place (Lowe’s)
867 North Bridge Street |
45601 | SC | Fee | 1998 | 1981 | 100 | % | 130,497 | $ | 822,132 | $ | 6.30 | Lowe’s | |||||||||||||||||||||||
| 323 | Cincinnati, OH |
Kroger
6401 Colerain Avenue |
45239 | SC | Fee | 1998 | 2007 | 100 | % | 56,634 | $ | 556,486 | $ | 9.83 | Kroger | |||||||||||||||||||||||
| 324 | Cleveland, OH |
Kmart Plaza
14901-14651 Lorain Avenue |
44111 | SC | Fee (3) | 1982 | 2008 | 25.25 | % | 109,250 | $ | 708,667 | $ | 7.29 | Kmart | |||||||||||||||||||||||
| 325 | Columbus, OH |
Polaris Towne Center
1312 Polaris Parkway |
43240 | SC | Fee | 1998/1999 | 2011 | 100 | % | 443,099 | $ | 6,614,140 | $ | 14.85 | Best Buy, Big Lots, Jo-Ann Fabric and Craft Stores, Kroger, Lowe’s (Not Owned), OfficeMax, T.J. Maxx, Target (Not Owned) | |||||||||||||||||||||||
| 326 | Columbus, OH |
Lennox Town Center
1647 Olentangy River Road |
43212 | SC | Fee (3) | 1997 | 1998 | 50 | % | 352,913 | $ | 3,958,440 | $ | 15.82 | AMC Theatres, Barnes & Noble, Staples, Target | |||||||||||||||||||||||
| 327 | Columbus, OH |
Hilliard Rome Commons
1710-60 Hilliard Rome Road |
43026 | SC | Fee (3) | 2001 | 2007 | 20 | % | 110,871 | $ | 1,518,764 | $ | 13.89 | Giant Eagle | |||||||||||||||||||||||
| 328 | Columbus, OH |
Sun Center
3622-3860 Dublin Granville Road |
43017 | SC | Fee (3) | 1995 | 1998 | 79.45 | % | 315,728 | $ | 4,003,879 | $ | 12.78 | Ashley Furniture, Babies “R” Us, Michaels, Staples, Stein Mart, Whole Foods | |||||||||||||||||||||||
34
Table of Contents
DDR Corp.
Shopping Center Property List at December 31, 2012
|
Location |
Center/Property |
Zip
Code |
Type of
Property (1) |
Ownership
Interest |
Year
Developed/ Redeveloped |
Year
Acquired |
DDR
Ownership Interest |
Company
Owned Gross Leasable Area (SF) |
Total
Annualized Base Rent |
Average
Base Rent (Per SF) (2) |
Anchor Tenants |
|||||||||||||||||||||||||||
| 329 | Columbus, OH |
Easton Market
3740 Easton Market |
43230 | SC | Fee | 1998 | 1998 | 100 | % | 504,111 | $ | 5,502,127 | $ | 13.25 | Bed Bath & Beyond, buybuy BABY, Dick’s Sporting Goods, DSW, Golfsmith, Kittle’s Home Furnishings, Michaels, PetSmart, Staples, T.J. Maxx | |||||||||||||||||||||||
| 330 | Dublin, OH |
Perimeter Center
6644-6804 Perimeter Loop Road |
43017 | SC | Fee | 1996 | 1998 | 100 | % | 138,483 | $ | 1,981,057 | $ | 14.52 | Giant Eagle | |||||||||||||||||||||||
| 331 | Grove City, OH |
Derby Square
2161-2263 Stringtown Road |
43123 | SC | Fee (3) | 1992 | 1998 | 20 | % | 125,250 | $ | 1,166,691 | $ | 9.52 | Giant Eagle | |||||||||||||||||||||||
| 332 | Huber Heights, OH |
North Heights Plaza
8280 Old Troy Pike |
45424 | SC | Fee | 1990 | 1993 | 100 | % | 182,749 | $ | 1,653,125 | $ | 12.61 | Dick’s Sporting Goods, hhgregg | |||||||||||||||||||||||
| 333 | Macedonia, OH |
Macedonia Commons
Macedonia Commons Boulevard |
44056 | SC | Fee | 1994 | 1994 | 100 | % | 312,114 | $ | 4,190,982 | $ | 13.99 | Cinemark, Home Depot (Not Owned), Kohl’s, Walmart (Not Owned) | |||||||||||||||||||||||
| 334 | North Canton, OH |
Belden Park Crossings
Dressler Road |
44720 | SC | Fee (3) | 1995/2001/2003 | 1 | * | 5 | % | 478,063 | $ | 5,410,419 | $ | 11.58 | Dick’s Sporting Goods, DSW, hhgregg, Jo-Ann Fabric and Craft Stores, Kohl’s, PetSmart, Target (Not Owned), Value City Furniture | ||||||||||||||||||||||
| 335 | North Olmsted, OH |
Great Northern Plaza
25859-26437 Great Northern |
44070 | SC | Fee (3) | 1958/1998/2003 | 2012 | 5 | % | 631,151 | $ | 7,345,297 | $ | 13.64 | Bed Bath & Beyond, Best Buy, Big Lots, Burlington Coat Factory, DSW, Home Depot, Jo-Ann Fabric and Craft Stores, K&G Menswear, Marc’s, PetSmart | |||||||||||||||||||||||
| 336 | Solon, OH |
Sears Solon
6221 Som Center |
44139 | SC | Fee (3) | 1977 | 2008 | 25.25 | % | 84,180 | $ | 299,819 | $ | 3.56 | Marc’s (Not Owned), Sears Grand | |||||||||||||||||||||||
| 337 | Solon, OH |
Uptown Solon
Kruse Drive |
44139 | SC | Fee | 1998 | 1 | * | 100 | % | 183,255 | $ | 2,979,637 | $ | 17.70 | Bed Bath & Beyond, Mustard Seed Market, Old Navy, Petco, Ulta | ||||||||||||||||||||||
| 338 | Stow, OH |
Stow Community Center
Kent Road |
44224 | SC | Fee | 1997/2000/2008 | 1 | * | 100 | % | 391,654 | $ | 4,003,507 | $ | 10.70 | Bed Bath & Beyond, Giant Eagle, Hobby Lobby, Kohl’s, OfficeMax, Target (Not Owned) | ||||||||||||||||||||||
| 339 | Toledo, OH |
North Towne Commons (Dick’s)
851 West Alexis Road |
43612 | SC | Fee | 1995 | 2004 | 100 | % | 80,160 | $ | 501,000 | $ | 6.25 | Dick’s Sporting Goods, Dollar Tree (Not Owned), Kroger (Not Owned), T.J. Maxx (Not Owned), Target (Not Owned) | |||||||||||||||||||||||
| 340 | Toledo, OH |
Springfield Commons
South Holland-Sylvania Road |
43528 | SC | Fee (3) | 1999 | 1 | * | 20 | % | 271,587 | $ | 2,887,348 | $ | 11.45 | Babies “R” Us, Bed Bath & Beyond, Gander Mountain, Kohl’s, Old Navy | ||||||||||||||||||||||
| 341 | Westlake, OH |
West Bay Plaza
30100 Detroit Road |
44145 | SC | Fee | 1974/1997/2000 | 1/2 | * | 100 | % | 162,330 | $ | 1,425,830 | $ | 8.78 | Marc’s, Kmart | ||||||||||||||||||||||
| 342 | Willoughby Hills, OH |
Shoppes at Willoughby Hills
Chardon Road |
44092 | SC | Fee (3) | 1985 | 2007 | 15 | % | 381,508 | $ | 2,459,590 | $ | 9.43 | Giant Eagle, Marc’s (Not Owned), National College, OfficeMax | |||||||||||||||||||||||
| 343 | Zanesville, OH |
Kmart Shopping Center
3515 North Maple Avenue |
43701 | SC | Fee (3) | 1973 | 2008 | 25.25 | % | 84,180 | $ | 223,160 | $ | 2.65 | Kmart | |||||||||||||||||||||||
| Oklahoma | ||||||||||||||||||||||||||||||||||||||
| 344 | Enid, OK |
Kmart Plaza
4010 West Owen Garriot Road |
73703 | SC | Fee (3) | 1983 | 2008 | 25.25 | % | 84,000 | $ | 197,881 | $ | 2.36 | Kmart, United Supermarket of Oklahoma (Not Owned) | |||||||||||||||||||||||
| Oregon | ||||||||||||||||||||||||||||||||||||||
| 345 | Portland, OR |
Tanasbourne Town Center
Northwest Evergreen Parkway and Northwest Ring Road |
97006 | SC | Fee | 1995/2001 | 1996 | 100 | % | 309,617 | $ | 5,402,938 | $ | 17.70 | Barnes & Noble, Bed Bath & Beyond, Best Buy (Not Owned), Michaels, Nordstrom Rack (Not Owned), Office Depot, Old Navy, Ross Dress For Less, Sports Authority (Not Owned), Target (Not Owned) | |||||||||||||||||||||||
| Pennsylvania | ||||||||||||||||||||||||||||||||||||||
| 346 | Allentown, PA |
West Valley Marketplace
1091 Mill Creek Road |
18106 | SC | Fee | 2001/2004 | 2003 | 100 | % | 259,227 | $ | 2,682,386 | $ | 10.55 | Walmart | |||||||||||||||||||||||
| 347 | Allentown, PA |
BJ’s Wholesale Club
1785 Airport Road South |
18109 | SC | Fee | 1991 | 2004 | 100 | % | 112,230 | $ | 916,695 | $ | 8.17 | BJ’s Wholesale Club | |||||||||||||||||||||||
35
Table of Contents
DDR Corp.
Shopping Center Property List at December 31, 2012
|
Location |
Center/Property |
Zip
Code |
Type of
Property (1) |
Ownership
Interest |
Year
Developed/ Redeveloped |
Year
Acquired |
DDR
Ownership Interest |
Company
Owned Gross Leasable Area (SF) |
Total
Annualized Base Rent |
Average
Base Rent (Per SF) (2) |
Anchor Tenants |
|||||||||||||||||||||||||||
| 348 | Camp Hill, PA |
Camp Hill Center 3414 Simpson Ferry Road |
17011 | SC | Fee | 1978/2002 | 2007 | 100 | % | 62,888 | $ | 288,000 | $ | 10.03 | Michaels | |||||||||||||||||||||||
| 349 | Carlisle, PA | Carlisle Commons Shopping Center Ridge Street and Noble Boulevard | 17013 | SC | Fee (3) | 2001 | 2007 | 15 | % | 387,383 | $ | 3,359,041 | $ | 9.08 | Regal Cinemas, Ross Dress For Less, T.J. Maxx, Walmart | |||||||||||||||||||||||
| 350 | Cheswick, PA |
Rite Aid 1200 Pittsburgh Street |
15024 | SC | Fee | 2000 | 2007 | 100 | % | 10,908 | $ | 248,609 | $ | 22.79 | ||||||||||||||||||||||||
| 351 | East Norriton, PA |
Dekalb Plaza 2692 Dekalb Pike |
19401 | SC | Fee | 1975/1997 | 1/2 | * | 100 | % | 178,719 | $ | 1,194,951 | $ | 6.29 | Aldi, Big Lots, Kmart | ||||||||||||||||||||||
| 352 | Erie, PA |
Peach Street Square 1902 Keystone Drive |
16509 | SC | GL |
1995/1998/
2003/2012 |
1 | * | 100 | % | 571,013 | $ | 5,096,779 | $ | 8.61 | Burlington Coat Factory, Cinemark, Erie Sports, hhgregg, Hobby Lobby, Home Depot (Not Owned), Kohl’s, Lowe’s, PetSmart | ||||||||||||||||||||||
| 353 | Erie, PA |
Family Dollar 2184 West 12th Street |
16505 | SC | Fee | 1999 | 2007 | 100 | % | 10,908 | $ | 71,800 | $ | 6.58 | ||||||||||||||||||||||||
| 354 | Erie, PA |
Family Dollar 2923 West 26th Street |
16506 | SC | Fee | 1999 | 2007 | 100 | % | 10,908 | $ | 84,000 | $ | 7.70 | ||||||||||||||||||||||||
| 355 | Erie, PA |
Rite Aid 353 East 6th Street |
16507 | SC | Fee | 1999 | 2007 | 100 | % | 10,908 | $ | 266,969 | $ | 24.47 | ||||||||||||||||||||||||
| 356 | Erie, PA | 404 East 26th Street | 16503 | SC | Fee | 1999 | 2007 | 100 | % | 10,908 | $ | — | $ | — | ||||||||||||||||||||||||
| 357 | Erie, PA |
Rite Aid 5440 Peach Street |
16508 | SC | Fee | 2000 | 2007 | 100 | % | 10,908 | $ | 354,691 | $ | 32.52 | ||||||||||||||||||||||||
| 358 | Erie, PA |
Erie Marketplace 6660-6750 Peach Street |
16509 | SC | Fee (3) | 2003 | 2012 | 5 | % | 112,987 | $ | 1,121,741 | $ | 9.74 | Babies “R” Us, Bed Bath & Beyond, Best Buy (Not Owned), Marshalls, Target (Not Owned) | |||||||||||||||||||||||
| 359 | King Of Prussia, PA |
Overlook at King of Prussia 301 Goddard Boulevard |
19046 | SC | Fee (3) | 2002 | 2007 | 15 | % | 186,980 | $ | 5,169,613 | $ | 27.23 | Best Buy, Nordstrom Rack, United Artists Theatres | |||||||||||||||||||||||
| 360 | Monaca, PA |
Township Marketplace 115 Wagner Road |
15061 | SC | Fee (3) | 1999/2004 | 2012 | 5 | % | 298,630 | $ | 2,978,040 | $ | 10.52 | Cinemark, Lowe’s, Michaels, Party City | |||||||||||||||||||||||
| 361 | Monroeville, PA |
Goodwill 2604 Monroeville Boulevard |
15146 | SC | Fee | 1999 | 2007 | 100 | % | 10,908 | $ | 141,804 | $ | 13.00 | ||||||||||||||||||||||||
| 362 | New Castle, PA |
Rite Aid 31 North Jefferson Street |
16101 | SC | Fee | 1999 | 2007 | 100 | % | 10,908 | $ | 267,194 | $ | 24.50 | ||||||||||||||||||||||||
| 363 | Pittsburgh, PA |
Rite Aid 2501 Saw Mill Run Boulevard |
15227 | SC | Fee | 1999 | 2007 | 100 | % | 10,908 | $ | 342,233 | $ | 31.37 | ||||||||||||||||||||||||
| 364 | Pottstown, PA |
Kmart Shopping Center 2200 East High Street |
19464 | SC | Fee (3) | 1973 | 2008 | 25.25 | % | 84,180 | $ | 275,000 | $ | 3.27 | Kmart | |||||||||||||||||||||||
| 365 | Willow Grove, PA |
Kmart Shopping Center 2620 Moreland Road |
19090 | SC | Fee (3) | 1973 | 2008 | 25.25 | % | 94,500 | $ | 341,125 | $ | 3.61 | Kmart | |||||||||||||||||||||||
| Puerto Rico | ||||||||||||||||||||||||||||||||||||||
| 366 | Arecibo, PR |
Plaza Del Atlantico PR #2 Km 80.3 |
00612 | MM | Fee | 1980/1993 | 2005 | 100 | % | 223,681 | $ | 2,832,300 | $ | 12.90 | Anna’s Linens, Capri Del Atlantico, Kmart | |||||||||||||||||||||||
| 367 | Bayamon, PR |
Rexville Plaza PR #167, Km 18.8 |
00961 | SC | Fee | 1980/2002/2012 | 2005 | 100 | % | 131,058 | $ | 1,745,386 | $ | 13.92 | Anna’s Linens, Marshalls, Tiendas Capri | |||||||||||||||||||||||
| 368 | Bayamon, PR |
Plaza Rio Hondo PR#22, PR#167 |
00936 | MM | Fee | 1982/2001/2006 | 2005 | 100 | % | 550,936 | $ | 13,710,163 | $ | 26.64 | Best Buy, Caribbean Cinemas, Kmart, Marshalls, Pueblo, T.J. Maxx | |||||||||||||||||||||||
| 369 | Bayamon, PR |
Plaza Del Sol Road PR#29 & PR#167, Hato Tejas |
00961 | MM | Fee | 1998/2003/2004 | 2005 | 100 | % | 574,817 | $ | 16,064,034 | $ | 32.03 | Bed Bath & Beyond, Caribbean Cinemas, Home Depot (Not Owned), Old Navy, Walmart | |||||||||||||||||||||||
36
Table of Contents
DDR Corp.
Shopping Center Property List at December 31, 2012
|
Location |
Center/Property |
Zip
Code |
Type of
Property (1) |
Ownership
Interest |
Year
Developed/ Redeveloped |
Year
Acquired |
DDR
Ownership Interest |
Company
Owned Gross Leasable Area (SF) |
Total
Annualized Base Rent |
Average
Base Rent (Per SF) (2) |
Anchor Tenants |
|||||||||||||||||||||||||||
| 370 | Carolina, PR |
Plaza Escorial Carretera #3, Km 6.1 |
00987 | SC | Fee | 1997 | 2005 | 100 | % | 524,417 | $ | 8,159,066 | $ | 15.25 | Caribbean Cinemas, Home Depot (Not Owned), OfficeMax, Old Navy, Sam’s Club, Walmart | |||||||||||||||||||||||
| 371 | Cayey, PR |
Plaza Cayey State Road #1 & PR #735 |
00736 | SC | Fee | 1999/2004 | 2005 | 100 | % | 314,000 | $ | 2,977,056 | $ | 8.62 | Caribbean Cinemas (Not Owned), Walmart | |||||||||||||||||||||||
| 372 | Fajardo, PR |
Plaza Fajardo Road PR #3 Int PR #940 |
00738 | SC | Fee | 1992 | 2005 | 100 | % | 251,293 | $ | 4,231,913 | $ | 17.40 | Econo, Walmart | |||||||||||||||||||||||
| 373 | Guayama, PR |
Plaza Wal-Mart Road PR #3 Km 135.0 |
00784 | SC | Fee | 1994 | 2005 | 100 | % | 163,599 | $ | 1,644,846 | $ | 10.91 | Walmart | |||||||||||||||||||||||
| 374 | Hatillo, PR |
Plaza Del Norte Road#2 Km 81.9 |
00659 | MM | Fee | 1992 | 2005 | 100 | % | 680,964 | $ | 11,507,823 | $ | 22.17 | JCPenney, OfficeMax, Rooms To Go, Sears, T.J. Maxx, Toys “R” Us, Walmart | |||||||||||||||||||||||
| 375 | Humacao, PR |
Plaza Palma Real State Road #3, Km 78.20 |
00791 | SC | Fee | 1995 | 2005 | 100 | % | 448,727 | $ | 7,609,456 | $ | 18.85 | Capri, JCPenney, Marshalls, OfficeMax, Pep Boys, Walmart | |||||||||||||||||||||||
| 376 | Isabela, PR |
Plaza Isabela State Road #2 & # 454 |
00662 | SC | Fee | 1994 | 2005 | 100 | % | 259,012 | $ | 4,100,041 | $ | 15.84 | Selectos Supermarket, Walmart | |||||||||||||||||||||||
| 377 | Rio Piedras, PR |
Senorial Plaza PR #53 & PR #177 |
00926 | MM | Fee | 1978/Mutiple | 2005 | 100 | % | 201,577 | $ | 2,859,029 | $ | 17.32 | Kmart, Pueblo | |||||||||||||||||||||||
| 378 | San German, PR |
Plaza Del Oeste Road PR #2 Int PR #122 |
00683 | SC | Fee | 1991 | 2005 | 100 | % | 184,746 | $ | 2,455,938 | $ | 12.78 | Econo, Kmart | |||||||||||||||||||||||
| 379 | San German, PR |
Camino Real State Road PR #122 |
00683 | SC | Fee | 1991 | 2005 | 100 | % | 49,172 | $ | 392,395 | $ | — | Pep Boys | |||||||||||||||||||||||
| 380 | Vega Baja, PR |
Plaza Vega Baja Road PR #2 Int PR #155 |
00693 | SC | Fee | 1990 | 2005 | 100 | % | 184,900 | $ | 1,745,678 | $ | 9.76 | Econo, Kmart | |||||||||||||||||||||||
| Rhode Island | ||||||||||||||||||||||||||||||||||||||
| 381 | Middletown, RI |
Middletown Village 1315 West Main Street |
02842 | SC | Fee | 2003 | 2007 | 100 | % | 98,161 | $ | 970,192 | $ | 13.83 | Barnes & Noble, Michaels | |||||||||||||||||||||||
| 382 | Warwick, RI |
Warwick Center 1324 Bald Hill Road |
02886 | SC | Fee (3) | 2004 | 2007 | 15 | % | 159,958 | $ | 2,171,965 | $ | 17.78 | Barnes & Noble, Dick’s Sporting Goods, DSW | |||||||||||||||||||||||
| South Carolina | ||||||||||||||||||||||||||||||||||||||
| 383 | Boiling Springs, SC |
Northpoint Marketplace 8642-8760 Asheville Highway |
29316 | SC | Fee | 2001 | 2007 | 100 | % | 102,252 | $ | 606,544 | $ | 7.21 | Ingles | |||||||||||||||||||||||
| 384 | Camden, SC |
Springdale Plaza 1671 Springdale Drive |
29020 | SC | Fee | 1990/2000 | 1993 | 100 | % | 179,271 | $ | 1,126,752 | $ | 7.02 | Belk, Walmart (Not Owned) | |||||||||||||||||||||||
| 385 | Charleston, SC |
Ashley Crossing 2245 Ashley Crossing Drive |
29414 | SC | Fee | 1991/2011 | 2003 | 100 | % | 196,236 | $ | 1,448,752 | $ | 8.64 | Anna’s Linens, Food Lion, Kohl’s, Marshalls | |||||||||||||||||||||||
| 386 | Columbia, SC |
Columbiana Station 1150-1220 Bower Parkway |
29212 | SC | Fee (3) | 2003 | 2007 | 15 | % | 374,842 | $ | 4,759,416 | $ | 14.43 | buybuy BABY, Columbia Grand Theatre (Not Owned), Dick’s Sporting Goods, hhgregg, Michaels, PetSmart, Stein Mart | |||||||||||||||||||||||
| 387 | Columbia, SC |
Harbison Court Harbison Boulevard |
29212 | SC | Fee (3) | 1991 | 2012 | 5 | % | 238,715 | $ | 2,501,103 | $ | 12.72 | Anna’s Linens, Babies “R” Us (Not Owned), Barnes & Noble, Marshalls, Ross Dress For Less | |||||||||||||||||||||||
| 388 | Greenville, SC |
The Point 1140 Woodruff Road |
29601 | SC | Fee (3) | 2005 | 2007 | 20 | % | 104,614 | $ | 1,730,449 | $ | 16.54 | REI, Whole Foods | |||||||||||||||||||||||
| 389 | Greenville, SC |
Walmart 1451 Woodruff Road |
29607 | SC | Fee | 1998 | 2007 | 100 | % | 200,084 | $ | 1,272,534 | $ | 6.36 | Walmart | |||||||||||||||||||||||
| 390 | Greenville, SC | 3679 Augusta Road | 29605 | SC | Fee | 2001 | 2007 | 100 | % | 10,908 | $ | 98,172 | $ | 9.00 | ||||||||||||||||||||||||
| 391 | Lexington, SC |
Lexington Place U.S. Highway 378 and Old Cherokee Road |
29072 | SC | Fee | 2003 | 2007 | 100 | % | 83,167 | $ | 871,981 | $ | 10.48 | Kohl’s (Not Owned), Publix (Not Owned), Ross Dress For Less, T.J. Maxx | |||||||||||||||||||||||
37
Table of Contents
DDR Corp.
Shopping Center Property List at December 31, 2012
|
Location |
Center/Property |
Zip
Code |
Type of
Property (1) |
Ownership
Interest |
Year
Developed/ Redeveloped |
Year
Acquired |
DDR
Ownership Interest |
Company
Owned Gross Leasable Area (SF) |
Total
Annualized Base Rent |
Average
Base Rent (Per SF) (2) |
Anchor Tenants |
|||||||||||||||||||||||||||
| 392 | Mount Pleasant, SC |
Wando Crossing 1500 Highway 17 North |
29465 | SC | Fee | 1992/2000 | 1995 | 100 | % | 209,810 | $ | 2,466,536 | $ | 12.10 | Marshalls, Office Depot, T.J. Maxx, Walmart (Not Owned) | |||||||||||||||||||||||
| 393 | Myrtle Beach, SC |
The Plaza at Carolina Forest 3735 Renee Drive |
29579 | SC | Fee (3) | 1999 | 2007 | 20 | % | 140,437 | $ | 1,493,563 | $ | 11.96 | Kroger | |||||||||||||||||||||||
| 394 | North Charleston, SC |
North Charleston Center 5900 Rivers Avenue |
29406 | SC | Fee | 1980/1993 | 2004 | 100 | % | 236,025 | $ | 1,445,618 | $ | 8.08 | Home Decor Liquidators, Northern Tool + Equipment | |||||||||||||||||||||||
| 395 | North Charleston, SC |
North Pointe Plaza 7400 Rivers Avenue |
29406 | SC | Fee | 1989/2001 | 2 | * | 100 | % | 325,451 | $ | 2,068,141 | $ | 6.94 | A.C. Moore, OfficeMax, Walmart | ||||||||||||||||||||||
| 396 | Simpsonville, SC |
Fairview Station 621 Fairview Road |
29681 | SC | Fee | 1990 | 1994 | 100 | % | 142,086 | $ | 785,165 | $ | 5.93 | Ingles, Kohl’s | |||||||||||||||||||||||
| 397 | Taylors, SC |
Hampton Point 3033 Wade Hampton Boulevard |
29687 | SC | Fee | 1993 | 2007 | 100 | % | 58,316 | $ | 436,242 | $ | 7.96 | BI-LO | |||||||||||||||||||||||
| 398 | Taylors, SC |
North Hampton Market 6019 Wade Hampton |
29687 | SC | Fee (3) | 2004 | 2007 | 20 | % | 114,935 | $ | 1,307,815 | $ | 11.70 | Hobby Lobby, Target (Not Owned) | |||||||||||||||||||||||
| 399 | Woodruff, SC |
Rite Aid 121 North Main Street |
29388 | SC | Fee | 2002 | 2007 | 100 | % | 13,824 | $ | 288,178 | $ | 20.85 | ||||||||||||||||||||||||
| Tennessee | ||||||||||||||||||||||||||||||||||||||
| 400 | Brentwood, TN |
Cool Springs Pointe
I-65 and Moore’s Lane |
37027 | SC | Fee (3) | 1999/2004 | 2012 | 5 | % | 201,414 | $ | 2,458,515 | $ | 12.95 | Best Buy, DSW, Ross Dress For Less | |||||||||||||||||||||||
| 401 | Chattanooga, TN |
Overlook at Hamilton Place
2288 Gunbarrel Road |
37421 | SC | Fee | 1992/2004 | 2003 | 100 | % | 213,095 | $ | 1,932,615 | $ | 9.65 | Best Buy, The Fresh Market, Hobby Lobby | |||||||||||||||||||||||
| 402 | Goodlettsville, TN |
Northcreek Commons
101-139 Northcreek Boulevard |
37072 | SC | Fee (3) | 1987 | 2003 | 20 | % | 84,441 | $ | 674,508 | $ | 8.86 | Kroger | |||||||||||||||||||||||
| 403 | Hendersonville, TN |
Lowe’s Home Improvement
1050 Lowes Road |
37075 | SC | Fee | 1999 | 2003 | 100 | % | 129,044 | $ | 1,139,939 | $ | 8.83 | Lowe’s | |||||||||||||||||||||||
| 404 | Jackson, TN |
West Towne Commons
41 Stonebrook Place |
38305 | SC | Fee (3) | 1992 | 2007 | 20 | % | 62,925 | $ | 539,770 | $ | 9.02 | Kroger | |||||||||||||||||||||||
| 405 | Johnson City, TN |
Johnson City Marketplace
Franklin and Knob Creek Roads |
37604 | SC | GL | 2005 | 2003 | 100 | % | 99,997 | $ | 522,598 | $ | 16.78 | Kohl’s, Lowe’s (Not Owned) | |||||||||||||||||||||||
| 406 | Knoxville, TN |
Pavilion of Turkey Creek
10936 Parkside Drive |
37922 | SC | Fee (3) | 2001 | 2007 | 15 | % | 280,159 | $ | 3,305,632 | $ | 13.48 | Hobby Lobby, OfficeMax, Old Navy, Ross Dress For Less, Target (Not Owned), Walmart (Not Owned) | |||||||||||||||||||||||
| 407 | Knoxville, TN |
Town and Country Commons
North Peters Road and Town and Country Circle |
37923 | SC | GL (3) | 1985/1997 | 2007 | 15 | % | 643,539 | $ | 6,100,767 | $ | 10.35 | Best Buy, Burke’s Outlet, Carmike Cinemas, Dick’s Sporting Goods, Food City, Jo-Ann Fabric and Craft Stores, Lowe’s, Staples | |||||||||||||||||||||||
| 408 | Memphis, TN |
American Way
4075 American Way |
38118 | SC | Fee (3) | 1988 | 2007 | 20 | % | 121,222 | $ | 763,527 | $ | 7.77 | Kroger | |||||||||||||||||||||||
| 409 | Morristown, TN |
Crossroads Square
130 Terrace Lane |
37816 | SC | Fee (3) | 2004 | 2007 | 20 | % | 70,000 | $ | 651,400 | $ | 9.31 | OfficeMax (Not Owned), T.J. Maxx | |||||||||||||||||||||||
| 410 | Murfreesboro, TN |
Towne Centre
Old Fort Parkway |
37129 | SC | Fee (3) | 1998 | 2012 | 5 | % | 107,933 | $ | 1,047,030 | $ | 11.19 | Jo-Ann Fabric and Craft Stores, Lowe’s (Not Owned), T.J. Maxx, Target (Not Owned), Toys “R” Us (Not Owned) | |||||||||||||||||||||||
| 411 | Nashville, TN |
Willowbrook Commons
61 East Thompson Lane |
37211 | SC | Fee (3) | 2005 | 2007 | 20 | % | 93,600 | $ | 602,754 | $ | 19.02 | Kroger | |||||||||||||||||||||||
| 412 | Nashville, TN |
Bellevue Place
7625 Highway 70 South |
37221 | SC | Fee (3) | 2003 | 2007 | 15 | % | 77,099 | $ | 853,731 | $ | 12.08 | Bed Bath & Beyond, Home Depot (Not Owned), Michaels | |||||||||||||||||||||||
| 413 | Oakland, TN |
Oakland Market Place
7265 U.S. Highway 64 |
38060 | SC | Fee (3) | 2004 | 2007 | 20 | % | 64,600 | $ | 354,865 | $ | 15.05 | Kroger | |||||||||||||||||||||||
38
Table of Contents
DDR Corp.
Shopping Center Property List at December 31, 2012
|
Location |
Center/Property |
Zip
Code |
Type of
Property (1) |
Ownership
Interest |
Year
Developed/ Redeveloped |
Year
Acquired |
DDR
Ownership Interest |
Company
Owned Gross Leasable Area (SF) |
Total
Annualized Base Rent |
Average
Base Rent (Per SF) (2) |
Anchor Tenants |
|||||||||||||||||||||||||||
| Texas | ||||||||||||||||||||||||||||||||||||||
| 414 | Frisco, TX |
Frisco Marketplace
7010 Preston Road |
75035 | SC | Fee (3) | 2003 | 2012 | 5 | % | 107,543 | $ | 665,683 | $ | 22.33 | Kohl’s | |||||||||||||||||||||||
| 415 | Grand Prairie, TX |
Kroger
2525 West Interstate 20 |
75052 | SC | Fee | 1998 | 2007 | 100 | % | 60,835 | $ | 433,615 | $ | 7.13 | Kroger | |||||||||||||||||||||||
| 416 | Houston, TX |
Lowe’s Home Improvement
19935 Katy Freeway |
77094 | SC | Fee | 1998 | 2007 | 100 | % | 131,644 | $ | 917,000 | $ | 6.97 | Lowe’s | |||||||||||||||||||||||
| 417 | Irving, TX |
Macarthur Marketplace
Market Place Boulevard |
75063 | SC | Fee (3) | 2004 | 2012 | 5 | % | 248,775 | $ | 2,094,795 | $ | 11.77 | Hollywood Theaters, Kohl’s, Sam’s Club (Not Owned), Walmart (Not Owned) | |||||||||||||||||||||||
| 418 | Kyle, TX |
Kyle Crossing
I-35 and FM 1626 |
78640 | SC | Fee | 2010 | 1 | * | 50 | % | 76,098 | $ | 1,166,218 | $ | 18.78 | Ross Dress For Less, Target (Not Owned), Kohl’s (Not Owned) | ||||||||||||||||||||||
| 419 | Mckinney, TX |
Mckinney Marketplace
U.S. Highway 75 and El Dorado Parkway |
75070 | SC | Fee (3) | 2000 | 2012 | 5 | % | 118,967 | $ | 1,152,237 | $ | 10.21 | Albertsons (Not Owned), Kohl’s | |||||||||||||||||||||||
| 420 | Mesquite, TX |
Marketplace At Towne Center
Southbound Frontage Road I-635 |
75150 | SC | Fee (3) | 2001 | 2012 | 5 | % | 179,044 | $ | 2,657,030 | $ | 15.25 | Cavender’s Boot City (Not Owned), Home Depot (Not Owned), Kohl’s (Not Owned), Michaels, PetSmart, Ross Dress For Less | |||||||||||||||||||||||
| 421 | Pasadena, TX |
Kroger Junction
2619 Red Bluff Road |
77506 | SC | Fee (3) | 1984 | 2007 | 20 | % | 81,158 | $ | 433,111 | $ | 7.12 | Kroger | |||||||||||||||||||||||
| 422 | San Antonio, TX |
Terrell Plaza
1201 Austin Highway, Suite 139 |
78209 | SC | Fee | 1958/1986/2012 | 2007 | 50 | % | 108,037 | $ | 1,043,729 | $ | 11.14 | Big Lots, Target (Not Owned) | |||||||||||||||||||||||
| 423 | San Antonio, TX |
Village at Stone Oak
22610 U.S. Highway 281 North, Suite 211 |
78258 | SC | Fee | 2007 | 1 | * | 100 | % | 202,259 | $ | 4,075,827 | $ | 29.38 | Alamo Drafthouse Cinema | ||||||||||||||||||||||
| 424 | San Antonio, TX |
Village at Stone Oak
22610 U.S. Highway 281 North, Suite 211 |
78258 | SC | Fee | 2007 | 1 | * | 100 | % | 221,091 | $ | 2,986,354 | $ | 14.61 | Hobby Lobby, T.J. Maxx, Target (Not Owned) | ||||||||||||||||||||||
| 425 | San Antonio, TX |
Bandera Pointe
State Loop 1604 Bandera Road |
78227 | SC | Fee | 2001/2002 | 1 | * | 100 | % | 501,332 | $ | 5,323,796 | $ | 16.12 | Anna’s Linens, Barnes & Noble, Conn’s Appliance (Not Owned), Gold’s Gym, Jo-Ann Fabric and Craft Stores, Kohl’s (Not Owned), Lowe’s, Old Navy, Ross Dress For Less, T.J. Maxx, Target (Not Owned) | ||||||||||||||||||||||
| Utah | ||||||||||||||||||||||||||||||||||||||
| 426 | Midvale, UT |
Family Center at Fort Union
900 East Fort Union Boulevard |
84047 | SC | Fee | 1973/2000/2006 | 1998 | 100 | % | 666,320 | $ | 8,908,838 | $ | 14.58 | Babies “R” Us, Bed Bath & Beyond, Dick’s Sporting Goods, Michaels, OfficeMax, Ross Dress For Less, Smith’s Food & Drug, Walmart | |||||||||||||||||||||||
| 427 | Ogden, UT |
Family Center at Ogden 5-Points
21-129 Harrisville Road |
84404 | SC | Fee | 1977 | 1998 | 100 | % | 161,795 | $ | 911,766 | $ | 5.93 | Harmons | |||||||||||||||||||||||
| 428 | Orem, UT |
Family Center at Orem
1300 South Street |
84058 | SC | Fee | 1991/2012 | 1998 | 100 | % | 150,667 | $ | 1,448,173 | $ | 12.38 | Babies “R” Us, Dick’s Sporting Goods, Jo-Ann Fabric and Craft Stores, R.C. Willey (Not Owned), Toys “R” Us (Not Owned) | |||||||||||||||||||||||
| 429 | Riverdale, UT |
Family Center at Riverdale
1050 West Riverdale Road |
84405 | SC | Fee | 2005/2012 | 1 | * | 100 | % | 651,865 | $ | 5,004,636 | $ | 9.81 | Best Buy, Gordman’s, Home Depot (Not Owned), Jo-Ann Fabric and Craft Stores, OfficeMax, Sam’s Club (Not Owned), Sports Authority, Sportsman’s Warehouse, Target, Walmart (Not Owned) | ||||||||||||||||||||||
| 430 | Taylorsville, UT |
Family Center at Taylorsville
5600 South Redwood |
84123 | SC | Fee | 1982/2003 | 1998 | 100 | % | 761,916 | $ | 5,928,092 | $ | 10.81 | 24 Hour Fitness, Bed Bath & Beyond, F.Y.E., Harmons (Not Owned), Jo-Ann Fabric and Craft Stores, PetSmart, Ross Dress For Less, Shopko, Sports Authority | |||||||||||||||||||||||
39
Table of Contents
DDR Corp.
Shopping Center Property List at December 31, 2012
|
Location |
Center/Property |
Zip
Code |
Type of
Property (1) |
Ownership
Interest |
Year
Developed/ Redeveloped |
Year
Acquired |
DDR
Ownership Interest |
Company
Owned Gross Leasable Area (SF) |
Total
Annualized Base Rent |
Average
Base Rent (Per SF) (2) |
Anchor Tenants |
|||||||||||||||||||||||||||
| Virginia | ||||||||||||||||||||||||||||||||||||||
| 431 | Chester, VA |
Bermuda Square
12607-12649 Jefferson Davis |
23831 | SC | Fee | 1978 | 2003 | 100 | % | 116,339 | $ | 1,637,498 | $ | 14.16 | Martin’s Food Store | |||||||||||||||||||||||
| 432 | Fairfax, VA |
Fairfax Towne Center
12210 Fairfax Towne Center |
22033 | SC | Fee (3) | 1994 | 2012 | 5 | % | 253,392 | $ | 4,706,513 | $ | 18.75 | Bed Bath & Beyond, Jo-Ann Fabric and Craft Stores, Safeway, T.J. Maxx, United Artists Theatres | |||||||||||||||||||||||
| 433 | Glen Allen, VA |
Creeks at Virginia Center
9830-9992 Brook Road |
23059 | SC | Fee (3) | 2002 | 2007 | 15 | % | 266,181 | $ | 3,910,122 | $ | 14.93 | Barnes & Noble, Bed Bath & Beyond, Dick’s Sporting Goods, Michaels, Ross Dress For Less | |||||||||||||||||||||||
| 434 | Midlothian, VA |
Commonwealth Center
4600-5000 Commonwealth Center Parkway |
23112 | SC | Fee (3) | 2002 | 2007 | 15 | % | 165,413 | $ | 2,367,420 | $ | 14.76 | Barnes & Noble, Michaels, Stein Mart | |||||||||||||||||||||||
| 435 | Midlothian, VA |
Chesterfield Crossings
Highway 360 and Warbro Road |
23112 | SC | Fee (3) | 2000 | 2007 | 15 | % | 92,417 | $ | 1,291,061 | $ | 14.34 | Ben Franklin | |||||||||||||||||||||||
| 436 | Newport News, VA |
Jefferson Plaza
121 Jefferson Avenue |
23602 | SC | Fee (3) | 1999 | 2007 | 15 | % | 47,341 | $ | 768,497 | $ | 16.23 | Costco (Not Owned), The Fresh Market | |||||||||||||||||||||||
| 437 | Newport News, VA |
Denbigh Village
Warwick Boulevard and Denbigh Boulevard |
23608 | SC | Fee | 1998/2006 | 2007 | 100 | % | 340,950 | $ | 2,102,677 | $ | 8.19 | Burlington Coat Factory | |||||||||||||||||||||||
| 438 | Richmond, VA |
Downtown Short Pump
11500-900 West Broad Street |
23233 | SC | Fee | 2000 | 2007 | 100 | % | 125,868 | $ | 2,406,935 | $ | 20.18 | Barnes & Noble, Regal Cinemas | |||||||||||||||||||||||
| 439 | Springfield, VA |
Loisdale Center
6646 Loisdale Road |
22150 | SC | Fee | 1999 | 2007 | 100 | % | 120,320 | $ | 2,291,523 | $ | 19.05 | Barnes & Noble, Bed Bath & Beyond, DSW, hhgregg | |||||||||||||||||||||||
| 440 | Springfield, VA |
Spring Mall Center
6717 Spring Mall Road |
22150 | SC | Fee | 1995/2001 | 2007 | 100 | % | 56,511 | $ | 1,027,957 | $ | 18.19 | Michaels, The Tile Shop | |||||||||||||||||||||||
| 441 | Sterling, VA |
Park Place at Cascades Marketplace
Northeast Corner Cascades Parkway and Route 7 |
20165 | SC | Fee | 1998 | 2007 | 100 | % | 101,606 | $ | 1,581,521 | $ | 15.57 | Sports Authority, Staples | |||||||||||||||||||||||
| 442 | Virginia Beach, VA |
Kroger Plaza
1800 Republic Drive |
23454 | SC | Fee (3) | 1997 | 2007 | 20 | % | 63,324 | $ | 199,568 | $ | 3.31 | Kroger | |||||||||||||||||||||||
| 443 | Waynesboro, VA |
Waynesboro Commons
109 Lee Dewitt Boulevard |
22980 | SC | Fee (3) | 1993 | 2007 | 20 | % | 52,415 | $ | 419,340 | $ | 8.59 | Kroger | |||||||||||||||||||||||
| 444 | Winchester, VA |
Apple Blossom Corners
2190 South Pleasant Valley |
22601 | SC | Fee (3) | 1990/1997 | 2 | * | 20 | % | 242,686 | $ | 2,508,737 | $ | 10.37 | Books-A-Million, Kohl’s, Martin’s Food Store, OfficeMax | ||||||||||||||||||||||
| Washington | ||||||||||||||||||||||||||||||||||||||
| 445 | Olympia, WA | 2815 Capital Mall Drive Southwest | 98502 | SC | Fee | 1998 | 2007 | 100 | % | 35,776 | $ | — | $ | — | ||||||||||||||||||||||||
| West Virginia | ||||||||||||||||||||||||||||||||||||||
| 446 | Morgantown, WV |
Pierpont Centre
Interstate 68 and Pierpont Road |
26508 | SC | Fee | 1999/2000 | 2007 | 100 | % | 122,259 | $ | 1,294,870 | $ | 10.45 | Lowe’s (Not Owned), Michaels, Shop ‘N Save | |||||||||||||||||||||||
| Wisconsin | ||||||||||||||||||||||||||||||||||||||
| 447 | Brookfield, WI |
Shoppers World of Brookfield
12575 West Capitol Drive |
53005 | SC | Fee (3) | 1967 | 2012 | 5 | % | 182,722 | $ | 981,155 | $ | 7.67 | Burlington Coat Factory, OfficeMax, Pick ‘N Save (Not Owned), T.J. Maxx | |||||||||||||||||||||||
| 448 | Brown Deer, WI |
Marketplace of Brown Deer
North Green Bay Road |
53209 | SC | Fee (3) | 1989 | 2012 | 5 | % | 143,340 | $ | 1,331,463 | $ | 9.29 | Anna’s Linens, hhgregg, Pick ‘N Save | |||||||||||||||||||||||
| 449 | Brown Deer, WI |
Brown Deer Center
North Green Bay Road |
53209 | SC | Fee (3) | 1967 | 2012 | 5 | % | 261,742 | $ | 1,998,483 | $ | 7.69 | Kohl’s, Michaels, OfficeMax, Old Navy, T.J. Maxx | |||||||||||||||||||||||
40
Table of Contents
DDR Corp.
Shopping Center Property List at December 31, 2012
|
Location |
Center/Property |
Zip
Code |
Type of
Property (1) |
Ownership
Interest |
Year
Developed/ Redeveloped |
Year
Acquired |
DDR
Ownership Interest |
Company
Owned Gross Leasable Area (SF) |
Total
Annualized Base Rent |
Average
Base Rent (Per SF) (2) |
Anchor Tenants |
|||||||||||||||||||||||||||
| 450 | Milwaukee, WI |
Point Loomis
South 27th Street |
53221 | SC | Fee | 1962 | 2003 | 100 | % | 160,533 | $ | 770,127 | $ | 4.80 | Kohl’s, Pick ‘N Save | |||||||||||||||||||||||
| 451 | Racine, WI |
Village Center
5500-5740 Washington Avenue |
53406 | SC | Fee (3) | 2003 | 2007 | 20 | % | 227,922 | $ | 2,465,746 | $ | 10.85 | Kohl’s | |||||||||||||||||||||||
| 452 | West Allis, WI |
West Allis Center
West Cleveland Avenue and South 108 |
53214 | SC | Fee | 1968 | 2003 | 100 | % | 259,981 | $ | 1,505,630 | $ | 5.81 | Kohl’s, Marshalls, Menards (Not Owned), Pick ‘N Save | |||||||||||||||||||||||
| 1* | Property developed by the Company. |
| 2* | Original IPO Property. |
| (1) |
“SC” indicates a power center or a community shopping center, “LC” indicates a lifestyle center and “MM” indicates an enclosed mall. |
| (2) |
Calculated as total annualized base rentals divided by Company-Owned GLA actually leased as of December 31, 2012. Rents for assets in Brazil are paid in BRL and translated to USD at a rate of 1.94. |
| (3) |
One of the two hundred two (202) properties owned through unconsolidated joint ventures, which serve as collateral for joint venture mortgage debt aggregating approximately $4.2 billion (of which the Company’s proportionate share of $724.9 million) as of December 31, 2012, and which is not reflected in the consolidated indebtedness. |
41
Table of Contents
The Company is a party to various joint ventures with the Coventry II Fund, through which 10 existing or proposed retail properties, along with a portfolio of former Service Merchandise locations, were acquired at various times from 2003 through 2006. The properties were acquired by the joint ventures as value-add investments, with major renovation and/or ground-up development contemplated for many of the properties. The Company was generally responsible for day-to-day management of the properties through December 2011. On November 4, 2009, Coventry Real Estate Advisors L.L.C., Coventry Real Estate Fund II, L.L.C. and Coventry Fund II Parallel Fund, L.L.C. (collectively, “Coventry”) filed suit against the Company and certain of its affiliates and officers in the Supreme Court of the State of New York, County of New York. The complaint alleges that the Company: (i) breached contractual obligations under a co-investment agreement and various joint venture limited liability company agreements, project development agreements and management and leasing agreements; (ii) breached its fiduciary duties as a member of various limited liability companies; (iii) fraudulently induced the plaintiffs to enter into certain agreements; and (iv) made certain material misrepresentations. The complaint also requests that a general release made by Coventry in favor of the Company in connection with one of the joint venture properties be voided on the grounds of economic duress. The complaint seeks compensatory and consequential damages in an amount not less than $500 million, as well as punitive damages. In response, the Company filed a motion to dismiss the complaint or, in the alternative, to sever the plaintiffs’ claims. In June 2010, the court granted in part the Company’s motion, dismissing Coventry’s claim that the Company breached a fiduciary duty owed to Coventry (and denying the motion as to the other claims). Coventry filed a notice of appeal regarding that portion of the motion granted by the court. The appeals court affirmed the trial court’s ruling regarding the dismissal of Coventry’s claim for breach of fiduciary duty. The Company filed an answer to the complaint, and has asserted various counterclaims against Coventry. On October 10, 2011, the Company filed a motion for summary judgment, seeking dismissal of all of Coventry’s remaining claims. The motion is currently pending before the court.
The Company believes that the allegations in the lawsuit are without merit and that it has strong defenses against this lawsuit. The Company will continue to vigorously defend itself against the allegations contained in the complaint. This lawsuit is subject to the uncertainties inherent in the litigation process and, therefore, no assurance can be given as to its ultimate outcome and no loss provision has been recorded in the accompanying financial statements because a loss contingency is not deemed probable or estimable. However, based on the information presently available to the Company, the Company does not expect that the ultimate resolution of this lawsuit will have a material adverse effect on the Company’s financial condition, results of operations or cash flows.
On November 18, 2009, the Company filed a complaint against Coventry in the Court of Common Pleas, Cuyahoga County, Ohio, seeking, among other things, a temporary restraining order enjoining Coventry from terminating “for cause” the management agreements between the Company and the various joint ventures because the Company believes that the requisite conduct in a “for-cause” termination (i.e., fraud or willful misconduct committed by an executive of the Company at the level of at least senior vice president) did not occur. The court heard testimony in support of the Company’s motion (and Coventry’s opposition) and, on December 4, 2009, issued a ruling in the Company’s favor. Specifically, the court issued a temporary restraining order enjoining Coventry from terminating the Company as property manager “for cause.” The court found that the Company was likely to succeed on the merits, that immediate and irreparable injury, loss or damage would result to the Company in the absence of such restraint, and that the balance of equities favored injunctive relief in the Company’s favor. The Company filed a motion for summary judgment seeking a ruling by the Court that there was no basis for Coventry’s “for cause” termination as a matter of law. On August 2, 2011, the court entered an order granting the Company’s motion for summary judgment in all respects, finding that, as a matter of law and fact, Coventry did not have the right to terminate the management agreements “for cause.” Coventry filed a notice of appeal, and on March 15, 2012, the Ohio Court of Appeals issued an opinion and order unanimously affirming the trial court’s ruling. No further appeal was undertaken in this case.
42
Table of Contents
In addition to the litigation discussed above, the Company and its subsidiaries are subject to various legal proceedings, which, taken together, are not expected to have a material adverse effect on the Company. The Company is also subject to a variety of legal actions for personal injury or property damage arising in the ordinary course of its business, most of which are covered by insurance. While the resolution of all matters cannot be predicted with certainty, management believes that the final outcome of such legal proceedings and claims will not have a material adverse effect on the Company’s liquidity, financial position or results of operations.
Not Applicable.
EXECUTIVE OFFICERS
The executive officers of the Company are as follows:
|
Name |
Age |
Position and Office with the Company |
||||
|
Daniel B. Hurwitz |
48 | Chief Executive Officer | ||||
|
David J. Oakes |
34 | President and Chief Financial Officer | ||||
|
Paul W. Freddo |
57 | Senior Executive Vice President of Leasing and Development | ||||
|
Christa A. Vesy |
42 | Executive Vice President and Chief Accounting Officer | ||||
Daniel B. Hurwitz is the Chief Executive Officer as of January 1, 2013, and has served as a director of the Company since June 2009. Mr. Hurwitz had served as President and Chief Executive Officer of the Company from January 2010 to December 2012, President and Chief Operating Officer from May 2007 to December 2009, Senior Executive Vice President and Chief Investment Officer from May 2005 through May 2007 and as Executive Vice President of Leasing and Development from June 1999 through April 2005. He was previously a member of the Company’s Board of Directors from May 2002 to May 2004. Mr. Hurwitz is a member of the Sonae Sierra Brasil board of directors. Mr. Hurwitz previously served as Senior Vice President and Director of Real Estate and Corporate Development for Reading, Pennsylvania based Boscov’s Department Store, Inc., a privately held department store chain, and served as Development Director for The Shopco Group, a New York City-based developer of regional shopping malls.
David J. Oakes was appointed President and Chief Financial Officer on January 1, 2013. Mr. Oakes had served as Senior Executive Vice President and Chief Financial Officer from February 2010 to December 2012, Senior Executive Vice President of Finance and Chief Investment Officer from December 2008 to February 2010 and as Executive Vice President of Finance and Chief Investment Officer from April 2007 to December 2008. Mr. Oakes is a member of the Sonae Sierra Brasil board of directors. Prior to joining the Company, Mr. Oakes served as Senior Vice President and Portfolio Manager at Cohen & Steers Capital Management, an investment firm, from April 2002 through March 2007. In his role, Mr. Oakes oversaw the firm’s global and international real estate securities portfolios for the oldest and largest dedicated real estate securities fund manager. Previously, Mr. Oakes worked as a Research Analyst in global investment research at Goldman Sachs, where he covered U.S. REITs.
Paul W. Freddo was appointed Senior Executive Vice President of Leasing and Development in December 2008. Mr. Freddo joined the Company in August 2008 and served as Senior Vice President of Development-Western Region from August 2008 to December 2008. Mr. Freddo is a member of the Sonae Sierra Brasil board of directors. Prior to joining the Company, Mr. Freddo served as Vice President and Director of Real Estate for J.C. Penney Company, Inc., a retail department store, from January 2004 through August 2008.
43
Table of Contents
Christa A. Vesy was appointed Executive Vice President and Chief Accounting Officer in March 2012. Ms. Vesy joined the Company in November 2006 and served as Senior Vice President and Chief Accounting Officer from November 2006 to March 2012. Prior to joining the Company, Ms. Vesy worked for The Lubrizol Corporation, a specialty chemicals company, where she served as manager of external financial reporting and then as controller for the lubricant additives business segment, from September 2004 to November 2006. Prior to joining Lubrizol, Ms. Vesy held various positions with the Assurance and Business Advisory Services Group of PricewaterhouseCoopers, LLP, a registered public accounting firm, including Senior Manager from 1999 to 2004.
44
Table of Contents
| Item 5. | MARKET FOR REGISTRANT’S COMMON EQUITY, RELATED STOCKHOLDER MATTERS AND ISSUER PURCHASES OF EQUITY SECURITIES |
The high and low sale prices per share of the Company’s common shares, as reported on the New York Stock Exchange (the “NYSE”) composite tape, and declared dividends per share for the quarterly periods indicated were as follows:
| High | Low | Dividends | ||||||||||
|
2012 |
||||||||||||
|
First |
$ | 15.09 | $ | 12.05 | $ | 0.12 | ||||||
|
Second |
15.15 | 13.29 | 0.12 | |||||||||
|
Third |
15.92 | 14.42 | 0.12 | |||||||||
|
Fourth |
15.93 | 14.79 | 0.12 | |||||||||
|
2011 |
||||||||||||
|
First |
$ | 14.53 | $ | 12.98 | $ | 0.04 | ||||||
|
Second |
14.94 | 13.03 | 0.04 | |||||||||
|
Third |
15.28 | 10.19 | 0.06 | |||||||||
|
Fourth |
13.30 | 9.76 | 0.08 | |||||||||
As of February 15, 2013, there were 8,047 record holders and approximately 32,000 beneficial owners of the Company’s common shares.
The Company’s Board of Directors approved a 2013 dividend policy that it believes will continue to result in additional free cash flow, while still adhering to REIT payout requirements. In January 2013, the Company declared its first quarter 2013 dividend of $0.135 per common share, payable on April 2, 2013, to shareholders of record at the close of business on March 14, 2013.
The Company intends to continue to declare quarterly dividends on its common shares. The Company is required by the Internal Revenue Code of 1986, as amended, to distribute at least 90% of its REIT taxable income. However, no assurances can be made as to the amounts of future dividends, as the decision to declare and pay dividends on the common shares in 2013, as well as the timing, amount and composition of any such future dividends, will be at the discretion of the Company’s Board of Directors and will be subject to the Company’s cash flow from operations, earnings, financial condition, capital and debt service requirements and such other factors as the Board of Directors considers relevant.
The Company has a dividend reinvestment plan under which shareholders may elect to reinvest their dividends automatically in common shares. Under the plan, the Company may, from time to time, elect to purchase common shares in the open market on behalf of participating shareholders or may issue new common shares to such shareholders.
45
Table of Contents
ISSUER PURCHASES OF EQUITY SECURITIES
|
(a)
Total Number of Shares Purchased (1) |
(b)
Average Price Paid per Share |
(c)
Total Number of Shares Purchased as Part of Publicly Announced Plans or Programs |
(d) Maximum Number
(or Approximate Dollar Value) of Shares That May Yet Be Purchased Under the Plans or Programs (Millions) |
|||||||||||||
|
October 1 — 31, 2012 |
2,348 | $ | 15.36 | — | $ | — | ||||||||||
|
November 1 — 30, 2012 |
— | — | — | — | ||||||||||||
|
December 1 — 31, 2012 |
124,313 | 15.66 | — | — | ||||||||||||
|
|
|
|
|
|
|
|
|
|||||||||
|
Total |
126,661 | $ | 15.65 | — | $ | — | ||||||||||
| (1) |
Consists of common shares surrendered or deemed surrendered to the Company to satisfy statutory minimum tax withholding obligations in connection with the vesting and/or exercise of awards under the Company’s equity-based compensation plans. |
46
Table of Contents
The consolidated financial data included in the following table has been derived from the financial statements for the last five years and includes the information required by Item 301 of Regulation S-K. The following selected consolidated financial data should be read in conjunction with the Company’s consolidated financial statements and related notes and Item 7. Management’s Discussion and Analysis of Financial Condition and Results of Operations. All consolidated financial data has been restated, as appropriate, to reflect the impact of activity classified as discontinued operations for all periods presented.
COMPARATIVE SUMMARY OF SELECTED FINANCIAL DATA
(Amounts in thousands, except per share data)
| For the Year Ended December 31, | ||||||||||||||||||||
| 2012 | 2011 | 2010 | 2009 | 2008 | ||||||||||||||||
|
Operating Data: |
||||||||||||||||||||
|
Revenues |
$ | 800,375 | $ | 749,829 | $ | 741,932 | $ | 734,180 | $ | 755,005 | ||||||||||
|
|
|
|
|
|
|
|
|
|
|
|||||||||||
|
Expenses: |
||||||||||||||||||||
|
Rental operations |
233,077 | 226,255 | 222,046 | 212,199 | 201,124 | |||||||||||||||
|
Impairment charges |
105,395 | 67,912 | 84,855 | 12,245 | 16,021 | |||||||||||||||
|
General and administrative |
76,444 | 85,221 | 85,573 | 94,365 | 97,719 | |||||||||||||||
|
Depreciation and amortization |
248,781 | 215,928 | 202,981 | 193,410 | 183,903 | |||||||||||||||
|
|
|
|
|
|
|
|
|
|
|
|||||||||||
| 663,697 | 595,316 | 595,455 | 512,219 | 498,767 | ||||||||||||||||
|
|
|
|
|
|
|
|
|
|
|
|||||||||||
|
Interest income |
15,799 | 9,832 | 7,302 | 11,967 | 5,220 | |||||||||||||||
|
Interest expense |
(221,424 | ) | (224,024 | ) | (209,643 | ) | (205,980 | ) | (213,087 | ) | ||||||||||
|
(Loss) gain on debt retirement, net |
(13,495 | ) | (89 | ) | 485 | 145,050 | 10,455 | |||||||||||||
|
Gain (loss) on equity derivative instruments |
— | 21,926 | (40,157 | ) | (199,797 | ) | — | |||||||||||||
|
Other income (expense), net |
(17,880 | ) | (5,002 | ) | (24,148 | ) | (28,885 | ) | (27,602 | ) | ||||||||||
|
|
|
|
|
|
|
|
|
|
|
|||||||||||
| (237,000 | ) | (197,357 | ) | (266,161 | ) | (277,645 | ) | (225,014 | ) | |||||||||||
|
|
|
|
|
|
|
|
|
|
|
|||||||||||
|
(Loss) income before earnings from equity method investments and other items |
(100,322 | ) | (42,844 | ) | (119,684 | ) | (55,684 | ) | 31,224 | |||||||||||
|
Equity in net income (loss) of joint ventures |
35,250 | 13,734 | 5,600 | (9,733 | ) | 17,719 | ||||||||||||||
|
Impairment of joint venture investments |
(26,671 | ) | (2,921 | ) | (227 | ) | (184,584 | ) | (106,957 | ) | ||||||||||
|
Gain on change in control and sale of interests, net |
78,127 | 25,170 | — | 23,865 | — | |||||||||||||||
|
Tax (expense) benefit of taxable REIT subsidiaries and state franchise and income taxes |
(1,160 | ) | (1,025 | ) | (47,942 | ) | 892 | 17,628 | ||||||||||||
|
|
|
|
|
|
|
|
|
|
|
|||||||||||
|
Loss from continuing operations |
(14,776 | ) | (7,886 | ) | (162,253 | ) | (225,244 | ) | (40,386 | ) | ||||||||||
|
Loss from discontinued operations |
(16,416 | ) | (18,590 | ) | (86,786 | ) | (187,523 | ) | (49,645 | ) | ||||||||||
|
|
|
|
|
|
|
|
|
|
|
|||||||||||
|
Loss before gain on disposition of real estate |
(31,192 | ) | (26,476 | ) | (249,039 | ) | (412,767 | ) | (90,031 | ) | ||||||||||
|
Gain on disposition of real estate, net of tax |
5,863 | 7,079 | 1,318 | 9,127 | 6,962 | |||||||||||||||
|
|
|
|
|
|
|
|
|
|
|
|||||||||||
|
Net loss |
$ | (25,329 | ) | $ | (19,397 | ) | $ | (247,721 | ) | $ | (403,640 | ) | $ | (83,069 | ) | |||||
|
|
|
|
|
|
|
|
|
|
|
|||||||||||
|
Non-controlling interests |
(493 | ) | 3,543 | 38,363 | 47,047 | 11,139 | ||||||||||||||
|
|
|
|
|
|
|
|
|
|
|
|||||||||||
|
Net loss attributable to DDR |
$ | (25,822 | ) | $ | (15,854 | ) | $ | (209,358 | ) | $ | (356,593 | ) | $ | (71,930 | ) | |||||
|
|
|
|
|
|
|
|
|
|
|
|||||||||||
47
Table of Contents
| For the Year Ended December 31, | ||||||||||||||||||||
| 2012 | 2011 | 2010 | 2009 | 2008 | ||||||||||||||||
|
Earnings per share data — Basic: |
||||||||||||||||||||
|
Loss from continuing operations attributable to DDR common shareholders |
$ | (0.15 | ) | $ | (0.13 | ) | $ | (0.78 | ) | $ | (1.63 | ) | $ | (0.65 | ) | |||||
|
Loss from discontinued operations attributable to DDR common shareholders |
(0.06 | ) | (0.07 | ) | (0.25 | ) | (0.88 | ) | (0.31 | ) | ||||||||||
|
|
|
|
|
|
|
|
|
|
|
|||||||||||
|
Net loss attributable to DDR common shareholders |
$ | (0.21 | ) | $ | (0.20 | ) | $ | (1.03 | ) | $ | (2.51 | ) | $ | (0.96 | ) | |||||
|
|
|
|
|
|
|
|
|
|
|
|||||||||||
|
Weighted-average number of common shares |
291,726 | 270,278 | 244,712 | 158,816 | 119,843 | |||||||||||||||
|
Earnings per share data — Diluted: |
||||||||||||||||||||
|
Loss from continuing operations attributable to DDR common shareholders |
$ | (0.15 | ) | $ | (0.21 | ) | $ | (0.78 | ) | $ | (1.63 | ) | $ | (0.65 | ) | |||||
|
Loss from discontinued operations attributable to DDR common shareholders |
(0.06 | ) | (0.07 | ) | (0.25 | ) | (0.88 | ) | (0.31 | ) | ||||||||||
|
|
|
|
|
|
|
|
|
|
|
|||||||||||
|
Net loss attributable to DDR common shareholders |
$ | (0.21 | ) | $ | (0.28 | ) | $ | (1.03 | ) | $ | (2.51 | ) | $ | (0.96 | ) | |||||
|
|
|
|
|
|
|
|
|
|
|
|||||||||||
|
Weighted-average number of common shares |
291,726 | 271,472 | 244,712 | 158,816 | 119,843 | |||||||||||||||
|
Dividends declared |
$ | 0.48 | $ | 0.22 | $ | 0.08 | $ | 0.44 | $ | 2.07 | ||||||||||
| At December 31, | ||||||||||||||||||||
| 2012 | 2011 | 2010 | 2009 | 2008 | ||||||||||||||||
|
Balance Sheet Data: |
||||||||||||||||||||
|
Real estate (at cost) |
$ | 8,639,111 | $ | 8,270,106 | $ | 8,411,239 | $ | 8,823,719 | $ | 9,109,566 | ||||||||||
|
Real estate, net of accumulated depreciation |
6,968,394 | 6,719,063 | 6,959,127 | 7,490,403 | 7,900,663 | |||||||||||||||
|
Investments in and advances to joint ventures |
613,017 | 353,907 | 417,223 | 420,541 | 583,767 | |||||||||||||||
|
Total assets |
8,055,837 | 7,469,425 | 7,768,090 | 8,426,606 | 9,020,222 | |||||||||||||||
|
Total debt |
4,319,143 | 4,104,584 | 4,302,000 | 5,178,663 | 5,866,655 | |||||||||||||||
|
Equity |
3,366,460 | 3,077,892 | 3,134,687 | 2,952,336 | 2,864,794 | |||||||||||||||
| For the Year Ended December 31, | ||||||||||||||||||||
| 2012 | 2011 | 2010 | 2009 | 2008 | ||||||||||||||||
|
Cash Flow Data: |
||||||||||||||||||||
|
Cash flow provided by (used for): |
||||||||||||||||||||
|
Operating activities |
$ | 304,196 | $ | 273,195 | $ | 278,124 | $ | 228,935 | $ | 391,941 | ||||||||||
|
Investing activities |
(588,430 | ) | 200,696 | 31,762 | 150,884 | (468,572 | ) | |||||||||||||
|
Financing activities |
274,763 | (451,854 | ) | (317,065 | ) | (381,348 | ) | 56,296 | ||||||||||||
48
Table of Contents
| Item 7. | MANAGEMENT’S DISCUSSION AND ANALYSIS OF FINANCIAL CONDITION AND RESULTS OF OPERATIONS |
Executive Summary
The Company is a self-administered and self-managed Real Estate Investment Trust (“REIT”) in the business of acquiring, owning, developing, redeveloping, expanding, leasing and managing shopping centers. In addition, the Company engages in the origination and acquisition of loans and debt securities collateralized directly or indirectly by shopping centers. As of December 31, 2012, the Company’s portfolio consisted of 452 shopping centers (including 206 shopping centers owned through unconsolidated joint ventures and three shopping centers that are otherwise consolidated by the Company) in which the Company had an economic interest. These properties consist of shopping centers, lifestyle centers and enclosed malls owned in the United States, Puerto Rico and Brazil. At December 31, 2012, the Company owned more than 115 million total square feet of gross leasable area (“GLA”), which includes all of the aforementioned properties. These amounts do not include 44 assets that the Company did not manage since January 1, 2012, 40 of which the Company does not have an economic interest. The Company also owns more than 1,500 acres of undeveloped land, including an interest in land in Canada and Russia. At December 31, 2012, the aggregate occupancy of the Company’s operating shopping center portfolio in which the Company has an economic interest was 91.5%, as compared to 89.1% at December 31, 2011. The Company owned 432 shopping centers (including 177 shopping centers owned through unconsolidated joint ventures and two that were otherwise consolidated by the Company) and five office properties at December 31, 2011. The average annualized base rent per occupied square foot was $13.66 at December 31, 2012, as compared to $13.81 at December 31, 2011.
Current Strategy
The Company has positioned itself for growth after considerable progress in recent years recycling capital, enhancing the quality of the portfolio and improving the balance sheet. The Company issued more than $500 million of common shares in 2012 to selectively acquire prime assets (i.e., market-dominant shopping centers with high-quality tenants located in attractive markets with strong demographic profiles, which are referred to as “Prime Portfolio” or “Prime Assets”). The Company seeks to be a net acquirer of Prime Assets that will continue to improve portfolio quality, credit quality of cash flows and property-level operating results. Off-market acquisitions, lease-up and the active management of assets should contribute to growth in 2013.
The following set of core competencies is expected to continue to benefit the Company:
| • |
Strong tenant relationships with the nation’s leading retailers, maintained through a national tenant account program; |
| • |
A retail partnership group to optimize portfolio management by enhancing communication between retailers, the leasing department and other areas of the Company; |
| • |
An internal anchor store redevelopment department solely dedicated to aggressively identifying opportunities to re-tenant vacant anchor space; |
| • |
An investment group focused on selectively acquiring well-located, quality shopping centers that have leases at below-market rental rates or other cash flow growth or capital appreciation potential where the Company’s financial strength, relationships with retailers and management capabilities can enhance value; |
| • |
A focus on growth and value creation within the Prime Portfolio, from which approximately 89% of the Company’s net operating income (defined as property-level revenues less property-level operating expenses) is generated; |
| • |
A redevelopment department focused on identifying viable projects with attractive returns; |
| • |
A capital markets department with broad and diverse relationships with capital providers to facilitate access to secured and unsecured, public and private capital; |
49
Table of Contents
| • |
An experienced funds management team dedicated to generating consistent returns and disclosure for institutional partners; |
| • |
A focused asset transaction team dedicated to finding buyers for non-core assets and sourcing potential acquisition opportunities and |
| • |
A development department adhering to disciplined standards for development. |
Balance Sheet
During 2012, the Company completed approximately $4.3 billion of capital transactions and consolidated financing activity including the following:
| • |
Formed an unconsolidated joint venture, BRE DDR Retail Holdings, LLC, with an affiliate of The Blackstone Group L.P. (“Blackstone”) that closed on the acquisition of 46 shopping centers valued at $1.4 billion. DDR’s contribution to the venture was $17.0 million in common equity and $150.0 million in preferred equity with a fixed dividend rate of 10%. An affiliate of Blackstone owns 95% of the common equity of the unconsolidated joint venture, and an affiliate of DDR owns the remaining 5% of the common equity. The shopping centers had previously been managed but not owned by the Company; |
| • |
Settled forward equity agreements for 19.0 million of its common shares and received net proceeds of $231.2 million, which were used to fund the Company’s share of BRE DDR Retail Holdings, LLC and other general corporate purposes; |
| • |
Closed $2.1 billion of investments, including the BRE DDR Retail Holdings, LLC acquisition described above, of which DDR’s share is $760 million; |
| • |
Disposed of $228.6 million of non-prime operating assets, of which DDR’s share is $119.4 million; |
| • |
Sold $107.3 million of non-income producing assets, of which DDR’s share is $96 million; |
| • |
Issued $510.7 million of common shares, including issuances pursuant to the forward equity agreements described above, to fund the net acquisition of market-dominant power centers and further reduce leverage; |
| • |
Issued $200 million of its newly designated 6.50% Class J cumulative redeemable preferred shares (“6.50% Class J Preferred Shares”), the net proceeds of which were used to redeem all outstanding 7.50% Class I Preferred Shares; |
| • |
Issued $450 million, 10-year, 4.625% senior unsecured notes ($300 million, June 2012; and $150 million, 3.46% yield-to-maturity, November 2012), the net proceeds of which were used to redeem $223.5 million, 5.375% notes maturing October 2012 and repay borrowings under its revolving credit facilities; |
| • |
Closed on $350 million unsecured term loan ($300 million, 7-year tranche, with interest fixed at 3.6% for $200 million and 3.0% for $100 million; and $50 million, 5-year tranche, with interest fixed at 2.3%), the net proceeds of which were used to retire $179.5 million of convertible notes, refinance a portion of the Company’s 5.0% rate mortgage debt maturing in 2013, and reduce the outstanding balances under its revolving credit facilities; |
| • |
Closed $103 million 7-year, 3.40% mortgage loan collateralized by three prime shopping centers in Atlanta, Georgia, Princeton, New Jersey, and San Antonio, Texas; |
| • |
Closed $265 million, 7-year, 3.95% mortgage loan collateralized by four prime shopping centers in San Juan, Puerto Rico, Atlanta, Georgia, Miami, Florida, and Columbus, Ohio. The proceeds from the loan were used to repay a majority of $350 million, 5.0% rate mortgage debt set to mature in April 2013; |
| • |
Extended the weighted-average maturity of consolidated debt from 4.3 years to 5.1 years and |
| • |
Paid cash dividends of $0.48 per common share as compared to $0.22 per common share, an increase of 118% from 2011. |
50
Table of Contents
Operational Accomplishments
The Company accomplished the following in 2012 to improve cash flow and the quality of its portfolio:
| • |
Increased the portfolio occupancy rate to 91.5% at year-end 2012 from 89.1% at year-end 2011; |
| • |
Executed 1,958 new leases and renewals for 11.3 million square feet of GLA, including managed assets and |
| • |
Expended a weighted-average cost of tenant improvements and lease commissions for new leases executed during 2012 estimated at $2.92 per rentable square foot over the lease term. |
Retail Environment
Retailers continue to open stores to meet their store opening plans. With demand exceeding supply, retailers have become more flexible with their design and prototype requirements, in some cases reducing square footage requirements. Downsizing of junior anchors has also presented opportunities for landlords that can use their operational expertise to generate higher rents through new tenants. Small shop consolidation efforts to accommodate national and regional tenants are also part of the Company’s active portfolio management strategy.
Value-oriented retailers are taking market share from conventional and national chain department stores. The Company’s largest tenants, including Walmart/Sam’s Club, Target, T.J. Maxx/Marshalls and Kohl’s, have taken market share from the department stores, remaining well-capitalized and outperforming other retail categories on a relative basis.
Company Fundamentals
The following table lists the Company’s 10 largest tenants based on total annualized rental revenues and Company-owned GLA of the wholly-owned properties and the Company’s proportionate share of unconsolidated joint venture properties combined as of December 31, 2012:
|
Tenant |
% of Total
Shopping Center Base Rental Revenues |
% of Company-
Owned Shopping Center GLA |
||||||||
|
1. |
Walmart/Sam’s Club | 4.0 | % | 7.3 | % | |||||
|
2. |
TJX companies (1) |
2.5 | % | 2.8 | % | |||||
|
3. |
Bed Bath & Beyond (2) | 2.5 | % | 2.3 | % | |||||
|
4. |
PetSmart | 2.2 | % | 1.8 | % | |||||
|
5. |
Kohl’s | 1.9 | % | 3.0 | % | |||||
|
6. |
Best Buy | 1.7 | % | 1.4 | % | |||||
|
7. |
Michaels | 1.7 | % | 1.6 | % | |||||
|
8. |
Dick’s Sporting Goods | 1.5 | % | 1.6 | % | |||||
|
9. |
Ross Stores | 1.5 | % | 1.6 | % | |||||
|
10. |
OfficeMax | 1.4 | % | 1.3 | % | |||||
| (1) |
Includes T.J. Maxx, Marshalls and Homegoods. |
| (2) |
Includes Bed Bath & Beyond, World Market and other retail concepts. |
51
Table of Contents
The following table lists the Company’s 10 largest tenants based on total annualized rental revenues and Company-owned GLA of the wholly-owned properties and of the unconsolidated joint venture properties as of December 31, 2012:
| Wholly-Owned Properties | Joint Venture Properties | |||||||||||||||
|
Tenant |
% of
Shopping Center Base Rental Revenues |
% of
Company- Owned Shopping Center GLA |
% of
Shopping Center Base Rental Revenues |
% of
Company- Owned Shopping Center GLA |
||||||||||||
|
Walmart/Sam’s Club |
4.4 | % | 7.9 | % | 1.4 | % | 2.7 | % | ||||||||
|
TJX Companies (1) |
2.7 | % | 2.9 | % | 1.4 | % | 2.1 | % | ||||||||
|
Bed Bath & Beyond (2) |
2.6 | % | 2.3 | % | 1.7 | % | 2.0 | % | ||||||||
|
PetSmart |
2.3 | % | 1.8 | % | 1.6 | % | 1.6 | % | ||||||||
|
Kohl’s |
1.9 | % | 3.0 | % | 1.6 | % | 3.0 | % | ||||||||
|
Best Buy |
1.8 | % | 1.5 | % | 0.8 | % | 0.8 | % | ||||||||
|
Michaels |
1.7 | % | 1.6 | % | 1.4 | % | 1.6 | % | ||||||||
|
Lowe’s |
1.6 | % | 2.9 | % | 0.3 | % | 0.5 | % | ||||||||
|
Dick’s Sporting Goods |
1.6 | % | 1.6 | % | 1.2 | % | 1.4 | % | ||||||||
|
OfficeMax |
1.6 | % | 1.3 | % | 0.6 | % | 0.9 | % | ||||||||
|
Publix |
0.2 | % | 0.3 | % | 3.2 | % | 5.1 | % | ||||||||
|
Kroger |
0.8 | % | 1.1 | % | 1.7 | % | 3.4 | % | ||||||||
|
AMC Theatres |
1.3 | % | 0.6 | % | 1.4 | % | 1.2 | % | ||||||||
|
Ross Stores |
1.5 | % | 1.5 | % | 1.4 | % | 2.0 | % | ||||||||
| (1) |
Includes T.J. Maxx, Marshalls and Homegoods. |
| (2) |
Includes Bed Bath & Beyond, World Market and other retail concepts. |
Occupancy was 91.5% at December 31, 2012, an improvement of 240 basis points from the end of 2011. During 2012, the Company continues to sign a large number of new leases as reflected below:
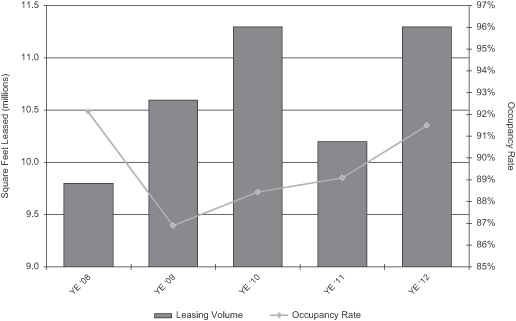
52
Table of Contents
Year in Review — 2012
For the year ended December 31, 2012, net loss attributable to common shareholders increased as compared to 2011 primarily due to the effect of the valuation adjustment associated with the warrants that were exercised in full for cash in the first quarter of 2011, the loss on debt extinguishment related to the Company’s repurchase of a portion of its 9.625% senior unsecured notes in 2012, asset dispositions and higher impairment charges on depreciable assets partially offset by organic growth, shopping center acquisitions and related investments, the gain on change in control and sale of interests primarily related to the Company’s acquisition of assets from unconsolidated joint ventures and a decrease in impairment charges of non-depreciable assets. The following provides an overview of the key financial metrics (see Funds From Operations described later in this section):
| Year Ended December 31, | ||||||||
| 2012 | 2011 | |||||||
|
Net loss attributable to common shareholders |
$ | (60,271 | ) | $ | (53,843 | ) | ||
|
|
|
|
|
|||||
|
Funds From Operations (“FFO”) attributable to common shareholders |
$ | 312,380 | $ | 227,610 | ||||
|
|
|
|
|
|||||
|
Operating FFO |
$ | 305,318 | $ | 267,107 | ||||
|
|
|
|
|
|||||
|
Earnings per share — Diluted |
$ | (0.21 | ) | $ | (0.28 | ) | ||
|
|
|
|
|
|||||
During 2012, the Company continued to pursue opportunities to position itself for long-term growth while also lowering the Company’s risk profile and cost of capital. The Company continued making progress on its balance sheet initiatives, strengthening the operations of its Prime Portfolio and recycling capital from non-prime asset sales into the acquisition of Prime Assets to improve portfolio quality. The Company continues to carefully consider opportunities that fit its selective acquisition requirements and remains prudent in its underwriting and bidding practices.
The following discussion of the Company’s financial condition and results of operations provides information that will assist in the understanding of the Company’s financial statements, the changes in certain key items and the factors that accounted for changes in the financial statements, as well as critical accounting policies that affected these financial statements.
CRITICAL ACCOUNTING POLICIES
The consolidated financial statements of the Company include the accounts of the Company and all subsidiaries where the Company has financial or operating control. The preparation of financial statements in conformity with accounting principles generally accepted in the United States requires management to make estimates and assumptions in certain circumstances that affect amounts reported in the accompanying consolidated financial statements and related notes. In preparing these financial statements, management has used available information, including the Company’s history, industry standards and the current economic environment, among other factors, in forming its estimates and judgments of certain amounts included in the consolidated financial statements, giving due consideration to materiality. It is possible that the ultimate outcome as anticipated by management in formulating its estimates inherent in these financial statements might not materialize. Application of the critical accounting policies described below involves the exercise of judgment and the use of assumptions as to future uncertainties. As a result, actual results could differ from these estimates. In addition, other companies may use different estimates that may affect the comparability of the Company’s results of operations to those of companies in similar businesses.
Revenue Recognition and Accounts Receivable
Rental revenue is recognized on a straight-line basis that averages minimum rents over the current term of the leases. Certain of these leases provide for percentage and overage rents based upon the level of sales achieved
53
Table of Contents
by the tenant. Percentage and overage rents are recognized after a tenant’s reported sales have exceeded the applicable sales breakpoint set forth in the applicable lease. The leases also typically provide for tenant reimbursements of common area maintenance and other operating expenses and real estate taxes. Accordingly, revenues associated with tenant reimbursements are recognized in the period in which the expenses are incurred based upon the tenant lease provision. Management fees are recorded in the period earned. Fee income derived from the Company’s unconsolidated joint venture investments is recognized to the extent attributable to the unaffiliated ownership interest. Ancillary and other property-related income, which includes the leasing of vacant space to temporary tenants, is recognized in the period earned. Lease termination fees are included in other revenue and recognized and earned upon termination of a tenant’s lease and relinquishment of space in which the Company has no further obligation to the tenant.
The Company makes estimates of the collectability of its accounts receivable related to base rents, including straight-line rentals, expense reimbursements and other revenue or income. The Company analyzes accounts receivable, tenant credit worthiness and current economic trends when evaluating the adequacy of the allowance for doubtful accounts. In addition, with respect to tenants in bankruptcy, the Company makes estimates of the expected recovery of pre-petition and post-petition claims in assessing the estimated collectability of the related receivable. The time to resolve these claims may exceed one year. These estimates have a direct impact on the Company’s earnings because a higher bad debt reserve and/or a subsequent write-off in excess of an estimated reserve results in reduced earnings.
Notes Receivable
Notes receivable include certain loans that are held for investment and are generally collateralized by real estate-related investments and may be subordinate to other senior loans. Loan receivables are recorded at stated principal amounts or at initial investment plus accretable yield for loans purchased at a discount. The related discounts on mortgages and other loans purchased are accreted over the life of the related loan receivable. The Company defers loan origination and commitment fees, net of origination costs, and amortizes them over the term of the related loan. The Company evaluates the collectability of both principal and interest on each loan based on an assessment of the underlying collateral value to determine whether it is impaired, and not by the use of internal risk ratings. A loan is considered to be impaired when, based upon current information and events, it is probable that the Company will be unable to collect all amounts due according to the existing contractual terms, and the amount of loss can be reasonably estimated. When a loan is considered to be impaired, the amount of loss is calculated by comparing the recorded investment to the value of the underlying collateral. As the underlying collateral for a majority of the notes receivable are real estate-related investments, the same valuation techniques are used to value the collateral as those used to determine the fair value of real estate investments for impairment purposes. Given the small number of loans, the Company does not provide for an additional allowance for loan losses based on the grouping of loans, as the Company believes the characteristics of the loans are not sufficiently similar to allow an evaluation of these loans as a group. As such, all of the Company’s loans are evaluated individually for this purpose. Interest income on performing loans is accrued as earned. A loan is placed on non-accrual status when, based upon current information and events, it is probable that the Company will not be able to collect all amounts due according to the existing contractual terms. Interest income on non-performing loans is generally recognized on a cash basis. Recognition of interest income on an accrual basis on non-performing loans is resumed when it is probable that the Company will be able to collect amounts due according to the contractual terms.
Consolidation
The Company has a number of joint venture arrangements with varying structures. The Company consolidates entities in which it owns less than a 100% equity interest if it is determined that it is a variable interest entity (“VIE”) and the Company has a controlling financial interest in that VIE, or is the controlling general partner. The analysis to identify whether the Company is the primary beneficiary of a VIE is based upon which party has (a) the power to direct activities of the VIE that most significantly affect the VIE’s economic
54
Table of Contents
performance and (b) the obligation to absorb losses or the right to receive benefits that could potentially be significant to the VIE. In determining whether it has the power to direct the activities of the VIE that most significantly affect the VIE’s performance, the Company is required to assess whether it has an implicit financial responsibility to ensure that a VIE operates as designed. This qualitative assessment has a direct impact on the Company’s financial statements, as the detailed activity of off-balance sheet joint ventures is not presented within the Company’s consolidated financial statements.
Real Estate and Long-Lived Assets
Properties are depreciated using the straight-line method over the estimated useful lives of the assets. The Company is required to make subjective assessments as to the useful lives of its properties to determine the amount of depreciation to reflect on an annual basis with respect to those properties. These assessments have a direct impact on the Company’s net income. If the Company were to extend the expected useful life of a particular asset, it would be depreciated over more years and result in less depreciation expense and higher annual net income.
On a periodic basis, management assesses whether there are any indicators that the value of real estate assets, including land held for development and construction in progress, and intangible assets may be impaired. A property’s value is impaired only if management’s estimate of the aggregate future cash flows (undiscounted and without interest charges) to be generated by the property are less than the carrying value of the property. The determination of undiscounted cash flows requires significant estimates by management. In management’s estimate of cash flows, it considers factors such as expected future operating income (loss), trends and prospects, the effects of demand, competition and other factors. If the Company is evaluating the potential sale of an asset or development alternatives, the undiscounted future cash flows analysis is probability-weighted based upon management’s best estimate of the likelihood of the alternative courses of action. Subsequent changes in estimated undiscounted cash flows arising from changes in anticipated actions could affect the determination of whether an impairment exists and whether the effects could have a material impact on the Company’s net income. To the extent an impairment has occurred, the loss will be measured as the excess of the carrying amount of the property over the fair value of the property.
The Company is required to make subjective assessments as to whether there are impairments in the value of its real estate properties and other investments. These assessments have a direct impact on the Company’s net income because recording an impairment charge results in an immediate negative adjustment to net income.
The Company allocates the purchase price to assets acquired and liabilities assumed at the date of acquisition. In estimating the fair value of the tangible and intangible assets and liabilities acquired, the Company considers information obtained about each property as a result of its due diligence, marketing and leasing activities. It applies various valuation methods, such as estimated cash flow projections using appropriate discount and capitalization rates, estimates of replacement costs net of depreciation and available market information. If the Company determines that an event has occurred after the initial allocation of the asset or liability that would change the estimated useful life of the asset, the Company will reassess the depreciation and amortization of the asset. The Company is required to make subjective estimates in connection with these valuations and allocations.
Off-Balance Sheet Arrangements — Impairment Assessment
The Company has a number of off-balance sheet joint ventures and other unconsolidated arrangements with varying structures. On a periodic basis, management assesses whether there are any indicators that the value of the Company’s investments in unconsolidated joint ventures may be impaired. An investment’s value is impaired only if management’s estimate of the fair value of the investment is less than the carrying value of the investment and such loss is deemed to be other than temporary. To the extent an impairment has occurred, the loss is measured as the excess of the carrying amount of the investment over the estimated fair value of the investment.
55
Table of Contents
Measurement of Fair Value — Real Estate and Unconsolidated Joint Venture Investments
The Company is required to assess the value of certain impaired consolidated and unconsolidated joint venture investments as well as the underlying collateral for certain financing notes receivable. The fair value of real estate investments used in the Company’s impairment calculations is estimated based on the price that would be received to sell an asset in an orderly transaction between marketplace participants at the measurement date. Investments without a public market are valued based on assumptions made and valuation techniques used by the Company. The availability of observable transaction data and inputs can make it more difficult and/or subjective to determine the fair value of such investments. As a result, amounts ultimately realized by the Company from investments sold may differ from the fair values presented, and the differences could be material.
The valuation of impaired real estate assets, investments and real estate collateral is determined using widely accepted valuation techniques including the income capitalization approach or discounted cash flow analysis on the expected cash flows of each asset considering prevailing market capitalization rates, analysis of recent comparable sales transactions, actual sales negotiations, bona fide purchase offers received from third parties and/or consideration of the amount that currently would be required to replace the asset, as adjusted for obsolescence. In general, the Company considers multiple valuation techniques when measuring fair value of an investment. However, in certain circumstances, a single valuation technique may be appropriate.
For operational real estate assets, the significant assumptions include the capitalization rate used in the income capitalization valuation as well as the projected property net operating income and expected hold period. For projects under development, the significant assumptions include the discount rate, the timing for the construction completion and project stabilization and the exit capitalization rate. For investments in unconsolidated joint ventures, the Company also considers the valuation of any underlying joint venture debt. Valuation of real estate assets is calculated based on market conditions and assumptions made by management at the measurement date, which may differ materially from actual results if market conditions or the underlying assumptions change.
Real Estate Held for Sale
Pursuant to the definition of a component of an entity, assuming no significant continuing involvement, the sale of a property is considered discontinued operations. In addition, the operations from properties classified as held for sale are considered discontinued operations. The Company generally considers assets to be held for sale when the transaction has been approved by the appropriate level of management and there are no known significant contingencies relating to the sale such that the sale of the property within one year is considered probable. This generally occurs when a sales contract is executed with no contingencies and the prospective buyer has significant funds at risk to ensure performance. Accordingly, the results of operations of operating properties disposed of or classified as held for sale, for which the Company has no significant continuing involvement, are reflected in the current period and retrospectively as discontinued operations.
Deferred Tax Assets and Tax Liabilities
The Company accounts for income taxes related to its taxable REIT subsidiary (“TRS”) under the asset and liability method, which requires the recognition of deferred tax assets and liabilities for the expected future tax consequences of events that have been included in the financial statements. The Company records net deferred tax assets to the extent it believes it is more likely than not that these assets will be realized. In making such determination, the Company considers all available positive and negative evidence, including forecasts of future taxable income, the reversal of other existing temporary differences, available net operating loss carryforwards, tax planning strategies and recent results of operations. Several of these considerations require assumptions and significant judgment about the forecasts of future taxable income and are consistent with the plans and estimates that the Company is utilizing to manage the Company. Based on this assessment, management must evaluate the need for, and amount of, valuation allowances against the Company’s deferred tax assets. The Company would
56
Table of Contents
record a valuation allowance to reduce deferred tax assets when it has determined that an uncertainty exists regarding their realizability, which would increase the provision for income taxes. To the extent facts and circumstances change in the future, adjustments to the valuation allowances may be required. In the event the Company were to determine that it would be able to realize the deferred income tax assets in the future in excess of their net recorded amount, the Company would adjust the valuation allowance, which would reduce the provision for income taxes. The Company makes certain estimates in the determination of the use of valuation reserves recorded for deferred tax assets. These estimates could have a direct impact on the Company’s earnings, as a difference in the tax provision would impact the Company’s earnings.
The Company has made estimates in assessing the impact of the uncertainty of income taxes. Accounting standards prescribe a recognition threshold and measurement attribute criteria for the financial statement recognition and measurement of a tax position taken or expected to be taken in a tax return. The standards also provide guidance on de-recognition, classification, interest and penalties, accounting in interim periods, disclosure and transition. These estimates have a direct impact on the Company’s net income because higher tax expense will result in reduced earnings.
Accrued Liabilities
The Company makes certain estimates for accrued liabilities. These estimates are subjective and based on historical payments, executed agreements, anticipated trends and representations from service providers. These estimates are prepared based on information available at each balance sheet date and are reevaluated upon the receipt of any additional information. Many of these estimates are for payments that occur within one year. These estimates have a direct impact on the Company’s net income because a higher accrual will result in reduced earnings.
Stock-Based Employee Compensation
Stock-based compensation requires all stock-based payments to employees, including grants of stock options, to be recognized in the financial statements based on their fair value. The fair value is estimated at the date of grant using a Black-Scholes option pricing model with weighted-average assumptions for the activity under stock plans. Option pricing model input assumptions, such as expected volatility, expected term and risk-free interest rate, all impact the fair value estimate. Further, the forfeiture rate has an impact on the amount of aggregate compensation. These assumptions are subjective and generally require significant analysis and judgment to develop.
When estimating fair value, some of the assumptions will be based on or determined from external data, and other assumptions may be derived from experience with stock-based payment arrangements. The appropriate weight to place on experience is a matter of judgment, based on relevant facts and circumstances.
COMPARISON OF 2012, 2011 AND 2010 RESULTS OF OPERATIONS
Continuing Operations
Shopping center properties owned as of January 1, 2011, but excluding properties under development or redevelopment and those classified in discontinued operations, are referred to herein as the “Comparable Portfolio Properties” for the comparison from 2012 to 2011. Shopping center properties owned as of January 1, 2010, but excluding properties under development or redevelopment and those classified in discontinued operations, are referred to herein as the “Comparable Portfolio Properties” for the comparison from 2011 to 2010.
57
Table of Contents
Revenues from Operations (in thousands)
| 2012 | 2011 | 2010 |
2012
vs. 2011 $ Change |
2011
vs. 2010 $ Change |
||||||||||||||||
|
Base and percentage rental revenues (A) |
$ | 548,017 | $ | 504,136 | $ | 495,493 | $ | 43,881 | $ | 8,643 | ||||||||||
|
Recoveries from tenants (B) |
174,097 | 163,123 | 162,046 | 10,974 | 1,077 | |||||||||||||||
|
Fee and other income (C) |
78,261 | 82,570 | 84,393 | (4,309 | ) | (1,823 | ) | |||||||||||||
|
|
|
|
|
|
|
|
|
|
|
|||||||||||
|
Total revenues |
$ | 800,375 | $ | 749,829 | $ | 741,932 | $ | 50,546 | $ | 7,897 | ||||||||||
|
|
|
|
|
|
|
|
|
|
|
|||||||||||
| (A) | The increase is due to the following (in millions): |
|
2012
vs. 2011 Increase (Decrease) |
2011
vs. 2010 Increase (Decrease) |
|||||||
|
Acquisition of shopping centers |
$ | 32.7 | $ | 7.7 | ||||
|
Comparable Portfolio Properties |
8.3 | 4.4 | ||||||
|
Development or redevelopment properties |
(0.8 | ) | (1.7 | ) | ||||
|
Straight-line rents |
3.7 | (1.8 | ) | |||||
|
|
|
|
|
|||||
| $ | 43.9 | $ | 8.6 | |||||
|
|
|
|
|
|||||
The following tables present the statistics for the Company’s operating shopping center portfolio (in which the Company has an economic interest) affecting base and percentage rental revenues summarized by the following portfolios: combined shopping center portfolio, wholly-owned shopping center portfolio and joint venture shopping center portfolio:
|
Shopping Center Portfolio (1) December 31, |
||||||||||||
| 2012 | 2011 | 2010 | ||||||||||
|
Centers owned |
452 | 432 | 478 | |||||||||
|
Aggregate occupancy rate |
91.5 | % | 89.1 | % | 88.4 | % | ||||||
|
Average annualized base rent per occupied square foot |
$ | 13.66 | (2) | $ | 13.81 | $ | 13.30 | |||||
|
Wholly-Owned
Shopping Centers December 31, |
Joint Venture
Shopping Centers (1) December 31, |
|||||||||||||||||||||||
| 2012 | 2011 | 2010 | 2012 | 2011 | 2010 | |||||||||||||||||||
|
Centers owned |
243 | 253 | 286 | 206 | 177 | 189 | ||||||||||||||||||
|
Centers owned through consolidated joint ventures |
N/A | N/A | N/A | 3 | 2 | 3 | ||||||||||||||||||
|
Aggregate occupancy rate |
91.9 | % | 88.8 | % | 88.6 | % | 90.9 | % | 89.5 | % | 88.1 | % | ||||||||||||
|
Average annualized base rent per occupied square foot |
$ | 12.92 | $ | 12.26 | $ | 12.23 | $ | 14.58 | (2) | $ | 15.93 | $ | 14.66 | |||||||||||
| (1) |
In 2012, excludes shopping centers owned through the Company’s joint venture with Coventry Real Estate Fund II (“Coventry II Fund”), which are no longer managed by the Company and in which the Company’s investment basis is not material. In 2011 and 2010, excludes shopping centers owned by unconsolidated joint ventures in which the Company’s investment basis is zero and in which the Company is receiving no allocation of income or loss, which includes certain Coventry II Fund investments. |
| (2) |
Decrease within the joint venture portfolio primarily due to the impact of exchange rate fluctuations with the Brazilian Real, the sale of assets in Brazil and the inclusion of the BRE DDR Retail Holdings, LLC assets in 2012. |
58
Table of Contents
| (B) | Recoveries were approximately 89.0%, 87.4% and 87.5% of reimbursable operating expenses and real estate taxes for the years ended December 31, 2012, 2011 and 2010, respectively. In 2012, the increased percentage of recoveries from tenants primarily is attributable to higher occupancy and newly acquired assets. |
| (C) | Composed of the following (in millions): |
| 2012 | 2011 | 2010 |
2012
vs. 2011 (Decrease) Increase |
2011
vs. 2010 (Decrease) Increase |
||||||||||||||||
|
Management, development, financing and other fee income |
$ | 43.8 | $ | 47.6 | $ | 54.6 | $ | (3.8 | ) | $ | (7.0 | ) | ||||||||
|
Ancillary and other property income |
27.7 | 28.5 | 20.2 | (0.8 | ) | 8.3 | ||||||||||||||
|
Lease termination fees |
6.4 | 5.9 | 7.5 | 0.5 | (1.6 | ) | ||||||||||||||
|
Other miscellaneous |
0.4 | 0.6 | 2.1 | (0.2 | ) | (1.5 | ) | |||||||||||||
|
|
|
|
|
|
|
|
|
|
|
|||||||||||
| $ | 78.3 | $ | 82.6 | $ | 84.4 | $ | (4.3 | ) | $ | (1.8 | ) | |||||||||
|
|
|
|
|
|
|
|
|
|
|
|||||||||||
Comparison of 2012 to 2011
The decrease in management, development, financing and other fee income in 2012 is largely the result of the expiration of the management contracts by their own terms with the Coventry II Fund as of December 31, 2011 (see Off-Balance Sheet Arrangements). These contracts generated approximately $2.3 million in gross fees related to the Company’s management, development and leasing of the assets in 2011. During 2012, the Company executed lease terminations on four Rite Aid spaces, three of which have been re-leased.
Comparison of 2011 to 2010
The decrease in management, development, financing and other fee income in 2011 is largely a result of asset sales by the Company’s unconsolidated joint ventures from January 1, 2010, through December 31, 2011. The increase in ancillary and other income primarily is related to increased revenue associated with cinema and entertainment operations located at two of the Company’s shopping centers.
Expenses from Operations (in thousands)
| 2012 | 2011 | 2010 |
2012
vs. 2011 $ Change |
2011
vs. 2010 $ Change |
||||||||||||||||
|
Operating and maintenance (A) |
$ | 128,821 | $ | 128,873 | $ | 123,201 | $ | (52 | ) | $ | 5,672 | |||||||||
|
Real estate taxes (A) |
104,256 | 97,382 | 98,845 | 6,874 | (1,463 | ) | ||||||||||||||
|
Impairment charges (B) |
105,395 | 67,912 | 84,855 | 37,483 | (16,943 | ) | ||||||||||||||
|
General and administrative (C) |
76,444 | 85,221 | 85,573 | (8,777 | ) | (352 | ) | |||||||||||||
|
Depreciation and amortization (A) |
248,781 | 215,928 | 202,981 | 32,853 | 12,947 | |||||||||||||||
|
|
|
|
|
|
|
|
|
|
|
|||||||||||
| $ | 663,697 | $ | 595,316 | $ | 595,455 | $ | 68,381 | $ | (139 | ) | ||||||||||
|
|
|
|
|
|
|
|
|
|
|
|||||||||||
| (A) | The changes for 2012 compared to 2011 and 2011 compared to 2010 are due to the following (in millions): |
59
Table of Contents
Comparison of 2012 to 2011
| 2012 vs. 2011 $ Change | ||||||||||||
|
Operating
and Maintenance |
Real Estate
Taxes |
Depreciation
and Amortization |
||||||||||
|
Acquisitions of shopping centers |
$ | 4.2 | $ | 6.8 | $ | 21.6 | ||||||
|
Comparable Portfolio Properties |
(1.6 | ) | (0.2 | ) | 9.7 | |||||||
|
Development or redevelopment properties |
(2.7 | ) | 0.3 | 1.6 | ||||||||
|
|
|
|
|
|
|
|||||||
| $ | (0.1 | ) | $ | 6.9 | $ | 32.9 | ||||||
|
|
|
|
|
|
|
|||||||
The decrease in operating and maintenance expense for the Comparable Portfolio Properties primarily related to a decrease in snow removal expense, bad debt expense and other property-related expenditures. The decrease in expense in the development or redevelopment properties is primarily due to the sale of a consolidated joint venture asset. The increase in depreciation expense for the Comparable Portfolio Properties is attributable to accelerated depreciation charges related to changes in the estimated useful life of certain assets that are expected to be redeveloped in future periods.
Comparison of 2011 to 2010
| 2011 vs. 2010 $ Change | ||||||||||||
|
Operating
and Maintenance |
Real Estate
Taxes |
Depreciation
and Amortization |
||||||||||
|
Acquisitions of shopping centers |
$ | 0.9 | $ | 1.6 | $ | 5.3 | ||||||
|
Comparable Portfolio Properties |
1.8 | (0.3 | ) | 6.4 | ||||||||
|
Development or redevelopment properties |
3.0 | (2.8 | ) | 1.2 | ||||||||
|
|
|
|
|
|
|
|||||||
| $ | 5.7 | $ | (1.5 | ) | $ | 12.9 | ||||||
|
|
|
|
|
|
|
|||||||
The increase in operating and maintenance expenses in 2011 for the Comparable Portfolio Properties primarily is due to higher insurance-related costs and various other property level expenditures. The increase in expense in the development or redevelopment properties is primarily due to increased expenses associated with the cinema and entertainment operations located at two of the Company’s shopping centers. The increase in depreciation expense for the Comparable Portfolio Properties primarily is related to tenant improvements that have been placed in service.
| (B) | The Company recorded impairment charges during the years ended December 31, 2012, 2011 and 2010, related to its land and shopping center assets. These impairments are more fully described in Note 11, “Impairment Charges and Impairment of Joint Venture Investments,” of the Company’s financial statements. |
| (C) | General and administrative expenses were approximately 4.7% of total revenues, including total revenues of unconsolidated joint ventures, managed properties and discontinued operations, for the year ended December 31, 2012, and 5.2% for both of the years ended December 31, 2011 and 2010. The Company continues to expense certain internal leasing salaries, legal salaries and related expenses associated with leasing and re-leasing of existing space. |
During 2012 and 2011, the Company recorded charges of $1.0 million and $11.0 million, respectively, as a result of a termination without cause of executives, including the Executive Chairman of the Board in 2011, the terms of which were pursuant to employment agreements, as applicable. Total employee separation charges recorded in 2012, 2011 and 2010 were $1.0 million, $12.4 million and $5.3 million, respectively. The decrease in general and administrative expenses in 2011 as compared to 2010, excluding separation charges, is due to general cost-saving measures.
60
Table of Contents
Other Income and Expenses (in thousands)
| 2012 | 2011 | 2010 |
2012
vs. 2011 $ Change |
2011
vs. 2010 $ Change |
||||||||||||||||
|
Interest income (A) |
$ | 15,799 | $ | 9,832 | $ | 7,302 | $ | 5,967 | $ | 2,530 | ||||||||||
|
Interest expense (B) |
(221,424 | ) | (224,024 | ) | (209,643 | ) | 2,600 | (14,381 | ) | |||||||||||
|
Loss on retirement of debt, net (C) |
(13,495 | ) | (89 | ) | 485 | (13,406 | ) | (574 | ) | |||||||||||
|
Gain (loss) on equity derivative instruments (D) |
— | 21,926 | (40,157 | ) | (21,926 | ) | 62,083 | |||||||||||||
|
Other income (expense), net (E) |
(17,880 | ) | (5,002 | ) | (24,148 | ) | (12,878 | ) | 19,146 | |||||||||||
|
|
|
|
|
|
|
|
|
|
|
|||||||||||
| $ | (237,000 | ) | $ | (197,357 | ) | $ | (266,161 | ) | $ | (39,643 | ) | $ | 68,804 | |||||||
|
|
|
|
|
|
|
|
|
|
|
|||||||||||
| (A) | The weighted-average interest rate of loan receivables, including loans to affiliates, was 8.7% at December 31, 2012 and 2011, and 9.4% at December 31, 2010. The increase in the amount of interest income recognized in 2012 is primarily due to the preferred equity investment in the unconsolidated joint venture with Blackstone (see 2012 Strategic Transaction Activity). The increase in the amount of interest income recognized in 2011 primarily is due to a full year of interest on $58.3 million in loan receivables originated and purchased in September 2010. |
| (B) | The weighted-average debt outstanding and related weighted-average interest rate including amounts allocated to discontinued operations are as follows: |
| Year Ended December 31, | ||||||||||||
| 2012 | 2011 | 2010 | ||||||||||
|
Weighted-average debt outstanding (in billions) |
$ | 4.3 | $ | 4.2 | $ | 4.6 | ||||||
|
Weighted-average interest rate |
5.3 | % | 5.6 | % | 5.1 | % | ||||||
The weighted-average interest rate (based on contractual rates and excluding convertible debt accretion and deferred financing costs) at December 31, 2012, 2011 and 2010, was 4.8%, 5.2% and 5.1%, respectively.
Interest costs capitalized in conjunction with development and redevelopment projects and unconsolidated development and redevelopment joint venture interests were $13.3 million for the year ended December 31, 2012, as compared to $12.7 million and $12.2 million for the respective periods in 2011 and 2010. The Company ceases the capitalization of interest as assets are placed in service or upon the suspension of construction activities.
The increase in 2011 interest expense primarily is due to the repayment of shorter-term, lower interest rate debt with the proceeds from long-term, higher interest rate debt, partially offset by a reduction in outstanding debt.
| (C) | For the year ended December 31, 2012, the Company repurchased $60.0 million aggregate principal amount of its 9.625% senior unsecured notes due 2016 at a premium to par value. |
| (D) | Represents the impact of the valuation adjustments for the equity derivative instruments issued as part of the stock purchase agreement with the Otto family. The share issuances, together with the warrant issuances, are collectively referred to as the “Otto Transaction,” as described in Note 10, “Non-Controlling Interests, Preferred Shares, Common Shares and Common Shares in Treasury,” of the Company’s financial statements. |
61
Table of Contents
| (E) | Other income (expense) was composed of the following (in millions): |
| Year Ended December 31, | ||||||||||||
| 2012 | 2011 | 2010 | ||||||||||
|
Transaction, abandoned projects and other (expense) income |
$ | (7.7 | ) | $ | 0.4 | $ | (2.6 | ) | ||||
|
Litigation-related expenses |
(4.8 | ) | (2.3 | ) | (14.6 | ) | ||||||
|
Note receivable reserve |
(4.3 | ) | (5.0 | ) | 0.1 | |||||||
|
Debt extinguishment costs, net |
(1.1 | ) | (0.7 | ) | (3.7 | ) | ||||||
|
Lease liability settlement gain (related obligation) |
— | 2.6 | (3.3 | ) | ||||||||
|
|
|
|
|
|
|
|||||||
| $ | (17.9 | ) | $ | (5.0 | ) | $ | (24.1 | ) | ||||
|
|
|
|
|
|
|
|||||||
Transaction, abandoned projects and other (expense) income
In 2012, the Company recorded a charge of $4.0 million as a result of a net termination fee associated with a major tenant in connection with the redevelopment of a shopping center asset.
Litigation-related expenses
In 2010, litigation expenses included a $5.1 million charge in connection with a legal matter at a property in Long Beach, California. Litigation-related expenses also include costs incurred by the Company to defend the litigation arising from joint venture assets that are owned through the Company’s investments with the Coventry II Fund (see Item 3. Legal Proceedings).
Notes receivable reserve
In June 2011, the Company sold a note receivable with a face value, including accrued but unpaid interest, of $11.8 million for proceeds of $6.8 million. This transaction resulted in the recognition of a reserve of $5.0 million prior to the sale to reduce the loan receivable to fair value. In 2012, the Company recorded a loan loss reserve based upon the estimated collateral value of a non-performing note receivable.
Lease liability settlement gain (related obligation)
In 2010, the Company established a lease liability reserve in the amount of $3.3 million for three operating leases related to an abandoned development project and two office closures. The Company reversed $2.6 million of this previously recorded charge due to the termination of the ground lease related to the abandoned development project in 2011.
Other Items (in thousands)
| 2012 | 2011 | 2010 |
2012
vs. 2011 $ Change |
2011
vs. 2010 $ Change |
||||||||||||||||
|
Equity in net income of joint ventures (A) |
$ | 35,250 | $ | 13,734 | $ | 5,600 | $ | 21,516 | $ | 8,134 | ||||||||||
|
Impairment of joint venture investments (B) |
(26,671 | ) | (2,921 | ) | (227 | ) | (23,750 | ) | (2,694 | ) | ||||||||||
|
Gain on change in control and sale of interests, net (C) |
78,127 | 25,170 | — | 52,957 | 25,170 | |||||||||||||||
|
Tax expense of taxable REIT subsidiaries and state franchise and income taxes (D) |
(1,160 | ) | (1,025 | ) | (47,942 | ) | (135 | ) | 46,917 | |||||||||||
| (A) |
The increase in equity in net income of joint ventures for the year ended December 31, 2012, compared to the prior year is primarily a result of gain on sale of three assets combined with higher income from the |
62
Table of Contents
| Company’s investment in Sonae Sierra Brasil in 2012, as discussed below, in addition to fewer impairments recorded in 2012 than 2011, partially offset by gains recognized in 2011 from the sale of assets held in unconsolidated joint ventures. |
The increase in equity in net income of joint ventures for the year ended December 31, 2011, compared to the prior year is primarily a result of the gain recognized on the sale of an asset by one unconsolidated joint venture of which the Company’s share was $12.6 million and higher income from the Company’s investment in Sonae Sierra Brasil discussed below, partially offset by the Company’s proportionate share of unconsolidated joint venture impairments, loss on sales and the elimination of equity income from unconsolidated joint venture assets sold in 2010.
At December 31, 2012 and 2011, the Company had an approximate 33% interest, as compared to an approximate 48% interest in 2010, in an unconsolidated joint venture, Sonae Sierra Brasil, which owns real estate in Brazil and is headquartered in San Paulo, Brazil. This entity uses the functional currency of Brazilian reais. The Company has generally chosen not to mitigate any of the foreign currency risk through the use of hedging instruments for this entity. The operating cash flow generated by this investment has been generally retained by the joint venture and reinvested in ground-up developments and expansions in Brazil. The weighted-average exchange rate used for recording the equity in net income were 1.94, 1.67 and 1.77 for the years ended December 31, 2012, 2011 and 2010, respectively.
The overall increase in equity in net income from the Sonae Sierra Brasil joint venture, net of the impact of foreign currency translation for the year ended December 31, 2012, as compared to 2011, primarily is due to a gain on sale of three shopping centers in addition to a gain recognized on the strategic asset swap of two assets in the portfolio, shopping center development and expansion activity coming online as well as increases in parking revenue, ancillary income and interest income. The overall increase in equity in net income from the Sonae Sierra Brasil joint venture, net of the impact of foreign currency translation for the year ended December 31, 2011, as compared to 2010, primarily is due to shopping center expansion activity coming online as well as increases in parking revenue, ancillary income and interest income.
| (B) | The other than temporary impairment charges of the joint venture investments are more fully described in Note 2, “Investments in and Advances to Joint Ventures,” of the Company’s financial statements. |
| (C) | Since January 1, 2011, the Company has acquired its partners’ interests in seven shopping centers, five in 2012 and two in 2011. These properties were previously unconsolidated, and the Company accounted for these transactions as step acquisitions. These properties are wholly-owned and consolidated at December 31, 2012. Due to the change in control that occurred, the Company recorded an aggregate net gain associated with these transactions related to the difference between the Company’s carrying value and fair value of the previously held equity interests. In November 2012, the Company sold its interest in a joint venture investment with the Coventry II Fund and recorded a gain. Also, in December 2012, the Company sold a portion of its interest in a previously consolidated joint venture that owns land held for development in Canada. The Company incurred a loss on the sale. This property is reflected as an unconsolidated joint venture at December 31, 2012. In December 2011, the Company sold its 10% interest in an unconsolidated joint venture that owned three shopping centers to its partner. Also in 2011, the Company sold its 50% interest in an unconsolidated joint venture that owned a development project in Oconomowoc, Wisconsin, to its partner. |
| (D) | Management regularly assesses established tax-related reserves and adjusts these reserves when facts and circumstances indicate that a change in estimates is warranted. The Company incurred a 2010 income tax expense of $49.9 million recognized due to the establishment of a reserve against certain deferred tax assets within its TRS, which is described in more detail in Note 16, “Income Taxes,” of the Company’s financial statements. |
63
Table of Contents
Discontinued Operations (in thousands)
| 2012 | 2011 | 2010 |
2012
vs. 2011 $ Change |
2011
vs. 2010 $ Change |
||||||||||||||||
|
Loss from discontinued operations (A) |
$ | (20,263 | ) | $ | (63,469 | ) | $ | (97,782 | ) | $ | 43,206 | $ | 34,313 | |||||||
|
Gain on deconsolidation of interests, net (B) |
— | 4,716 | 5,221 | (4,716 | ) | (505 | ) | |||||||||||||
|
Gain on disposition of real estate, net of tax (A) |
3,847 | 40,163 | 5,775 | (36,316 | ) | 34,388 | ||||||||||||||
|
|
|
|
|
|
|
|
|
|
|
|||||||||||
| $ | (16,416 | ) | $ | (18,590 | ) | $ | (86,786 | ) | $ | 2,174 | $ | 68,196 | ||||||||
|
|
|
|
|
|
|
|
|
|
|
|||||||||||
| (A) | The Company sold the following properties: |
| 2012 | 2011 | 2010 | ||||||||||||||||||||||
|
Number of
properties |
GLA
(millions) |
Number of
properties |
GLA
(millions) |
Number of
properties |
GLA
(millions) |
|||||||||||||||||||
|
Shopping centers |
24 | 2.7 | 34 | 2.9 | 31 | 2.9 | ||||||||||||||||||
|
Office |
5 | 0.4 | 1 | 0.1 | — | — | ||||||||||||||||||
Included in discontinued operations are 26 other properties that were deconsolidated for accounting purposes in 2011 and 2010, aggregating 2.3 million square feet, which primarily represent the activity associated with the DDR MDT MV joint venture. These assets were classified as discontinued operations for all periods presented, as the Company had no significant continuing involvement. Included in the reported loss for the years ended December 31, 2012, 2011 and 2010, are $21.1 million, $57.9 million and $87.1 million, respectively, of impairment charges related to assets classified as discontinued operations.
| (B) | The Company recorded a gain in the years ended December 31, 2011 and 2010, associated with the deconsolidation of assets previously owned in consolidated joint ventures that were transferred to the control of a court-appointed receiver. The joint venture no longer owned any of the assets as of December 31, 2012. The Company recorded a gain because the carrying value of the non-recourse debt exceeded the carrying value of the collateralized assets of the joint ventures. The revenues and expenses associated with these joint ventures are classified within discontinued operations. |
Gain on Disposition of Real Estate (in thousands)
| 2012 | 2011 | 2010 |
2012
vs. 2011 $ Change |
2011
vs. 2010 $ Change |
||||||||||||||||
|
Gain on disposition of real estate, net (A) |
$ | 5,863 | $ | 7,079 | $ | 1,318 | $ | (1,216 | ) | $ | 5,761 | |||||||||
| (A) | The Company recorded net gains on disposition of real estate and real estate investments as follows (in millions): |
|
Year Ended
December 31, |
||||||||||||
| 2012 | 2011 | 2010 | ||||||||||
|
Land sales |
$ | 5.6 | $ | (0.4 | ) | $ | 1.0 | |||||
|
Previously deferred gains and other gains and losses on dispositions |
0.3 | 7.5 | 0.3 | |||||||||
|
|
|
|
|
|
|
|||||||
| $ | 5.9 | $ | 7.1 | $ | 1.3 | |||||||
|
|
|
|
|
|
|
|||||||
These dispositions did not meet the criteria for discontinued operations. The previously deferred gains and other gains and losses on dispositions are a result of partial asset sales and assets that were contributed to joint ventures in prior years.
64
Table of Contents
Non-controlling interests (in thousands)
| 2012 | 2011 | 2010 |
2012
vs. 2011 $ Change |
2011
vs. 2010 $ Change |
||||||||||||||||
|
Non-controlling interests |
$ | (493 | ) | $ | 3,543 | $ | 38,363 | $ | (4,036 | ) | $ | (34,820 | ) | |||||||
The change is a result of impairment charges recorded in 2011 and 2010 by one of the Company’s 75% owned, consolidated joint ventures, which owned land held for development in Russia. In addition, in 2010 non-controlling interests included the net loss attributable to a consolidated joint venture that held assets previously occupied by Mervyns that were deconsolidated in 2010, and the operating results are reported as a component of discontinued operations.
Net Loss (in thousands)
| 2012 | 2011 | 2010 |
2012
vs. 2011 $ Change |
2011
vs. 2010 $ Change |
||||||||||||||||
|
Net loss attributable to DDR |
$ | (25,822 | ) | $ | (15,854 | ) | $ | (209,358 | ) | $ | (9,968 | ) | $ | 193,504 | ||||||
|
|
|
|
|
|
|
|
|
|
|
|||||||||||
A summary of changes in net loss attributable to DDR in 2012 as compared to 2011 and 2011 as compared to 2010 is as follows (in millions):
|
2012
vs. 2011 $ Change |
2011
vs. 2010 $ Change |
|||||||
|
Increase in net operating revenues (total revenues in excess of operating and maintenance expenses and real estate taxes) |
$ | 43.7 | $ | 3.7 | ||||
|
(Increase) decrease in consolidated impairment charges |
(37.5 | ) | 16.9 | |||||
|
Decrease in general and administrative expenses (A) |
8.8 | 0.4 | ||||||
|
Increase in depreciation expense |
(32.9 | ) | (12.9 | ) | ||||
|
Increase in interest income |
6.0 | 2.5 | ||||||
|
Decrease (increase) in interest expense |
2.6 | (14.4 | ) | |||||
|
Increase in loss on retirement of debt, net |
(13.4 | ) | (0.6 | ) | ||||
|
(Decrease) increase in gain on equity derivative instruments |
(21.9 | ) | 62.1 | |||||
|
Change in other income (expense), net |
(12.9 | ) | 19.1 | |||||
|
Increase in equity in net income of joint ventures |
21.5 | 8.1 | ||||||
|
Increase in impairment of joint venture investments |
(23.8 | ) | (2.7 | ) | ||||
|
Increase in gain on change in control and sale of interests, net |
53.0 | 25.2 | ||||||
|
(Increase) decrease in income tax expense |
(0.1 | ) | 46.9 | |||||
|
Decrease in loss from discontinued operations |
2.1 | 68.2 | ||||||
|
(Decrease) increase in gain on disposition of real estate |
(1.2 | ) | 5.8 | |||||
|
Change in non-controlling interests |
(4.0 | ) | (34.8 | ) | ||||
|
|
|
|
|
|||||
|
(Increase) decrease in net loss attributable to DDR |
$ | (10.0 | ) | $ | 193.5 | |||
|
|
|
|
|
|||||
| (A) | Included in general and administrative expenses are executive separation charges of $1.0 million, $12.4 million and $5.3 million for the years ended December 31, 2012, 2011 and 2010, respectively. |
65
Table of Contents
FUNDS FROM OPERATIONS
Definition and Basis of Presentation
The Company believes that FFO, a non-GAAP financial measure, provides an additional and useful means to assess the financial performance of REITs. FFO is frequently used by securities analysts, investors and other interested parties to evaluate the performance of REITs, most of which present FFO along with net income as calculated in accordance with GAAP.
FFO excludes GAAP historical cost depreciation and amortization of real estate and real estate investments, which assume that the value of real estate assets diminishes ratably over time. Historically, however, real estate values have risen or fallen with market conditions, and many companies use different depreciable lives and methods. Because FFO excludes depreciation and amortization unique to real estate, gains and losses from depreciable property dispositions, and extraordinary items, it can provide a performance measure that, when compared year over year, reflects the impact on operations from trends in occupancy rates, rental rates, operating costs, acquisition, disposition and development activities and interest costs. This provides a perspective of the Company’s financial performance not immediately apparent from net income determined in accordance with GAAP.
FFO is generally defined and calculated by the Company as net income (loss), adjusted to exclude: (i) preferred share dividends, (ii) gains and losses from disposition of depreciable real estate property and related investments, which are presented net of taxes, (iii) impairment charges on depreciable real estate property and related investments, (iv) extraordinary items and (v) certain non-cash items. These non-cash items principally include real property depreciation and amortization of intangibles, equity income (loss) from joint ventures and equity income (loss) from non-controlling interests, and the Company’s proportionate share of FFO from its unconsolidated joint ventures and non-controlling interests, determined on a consistent basis. For the periods presented below, the Company’s calculation of FFO is consistent with the definition of FFO provided by the National Association of Real Estate Investment Trusts (“NAREIT”). Other real estate companies may calculate FFO in a different manner.
The Company believes that certain gains and charges recorded in its operating results are not reflective of its core operating performance. As a result, the Company also computes Operating FFO and discusses it with the users of its financial statements, in addition to other measures such as net income/loss determined in accordance with GAAP as well as FFO. Operating FFO is generally calculated by the Company as FFO excluding certain charges and gains that management believes are not indicative of the results of the Company’s operating real estate portfolio. The disclosure of these charges and gains is regularly requested by users of the Company’s financial statements.
Operating FFO is a non-GAAP financial measure, and, as described above, its use combined with the required primary GAAP presentations has been beneficial to management in improving the understanding of the Company’s operating results among the investing public and making comparisons of other REITs’ operating results to the Company’s more meaningful. The adjustments may not be comparable to how other REITs or real estate companies calculate their results of operations, and the Company’s calculation of Operating FFO differs from NAREIT’s definition of FFO. The Company will continue to evaluate the usefulness and relevance of the reported non-GAAP measures, and such reported measures could change. Additionally, the Company provides no assurances that these charges and gains are non-recurring. These charges and gains could be reasonably expected to recur in future results of operations.
These measures of performance are used by the Company for several business purposes and by other REITs. The Company uses FFO and/or Operating FFO in part: (i) as a measure of a real estate asset’s performance, (ii) to influence acquisition, disposition and capital investment strategies and (iii) to compare the Company’s performance to that of other publicly traded shopping center REITs.
66
Table of Contents
For the reasons described above, management believes that FFO and Operating FFO provide the Company and investors with an important indicator of the Company’s operating performance. They provide recognized measures of performance other than GAAP net income, which may include non-cash items (often significant). Other real estate companies may calculate FFO and Operating FFO in a different manner.
Management recognizes the limitations of FFO and Operating FFO when compared to GAAP’s income from continuing operations. FFO and Operating FFO do not represent amounts available for dividends, capital replacement or expansion, debt service obligations or other commitments and uncertainties. Management does not use FFO or Operating FFO as an indicator of the Company’s cash obligations and funding requirements for future commitments, acquisitions or development activities. Neither FFO nor Operating FFO represents cash generated from operating activities in accordance with GAAP, and neither is necessarily indicative of cash available to fund cash needs, including the payment of dividends. Neither FFO nor Operating FFO should be considered an alternative to net income (computed in accordance with GAAP) or as an alternative to cash flow as a measure of liquidity. FFO and Operating FFO are simply used as additional indicators of the Company’s operating performance. The Company believes that to further understand its performance, FFO and Operating FFO should be compared with the Company’s reported net income (loss) and considered in addition to cash flows in accordance with GAAP, as presented in its consolidated financial statements.
Reconciliation Presentation
In 2012, FFO attributable to DDR common shareholders was $312.4 million, compared to $227.6 million in 2011 and $76.3 million in 2010. The increase in FFO for the year ended December 31, 2012, as compared to the prior year, primarily was due to organic growth, shopping center acquisitions and related investments partially offset by higher transaction costs, asset dispositions, the loss on debt retirement related to the Company’s repurchase of a portion of its 9.625% unsecured senior notes in 2012 and the effect of the valuation adjustment associated with the warrants that were exercised in full for cash in the first quarter of 2011.
In 2012, Operating FFO attributable to DDR common shareholders was $305.3 million, compared to $267.1 million in 2011 and $264.3 million in 2010. The increase in Operating FFO for the year ended December 31, 2012, primarily was due to organic growth and shopping center acquisitions, partially offset by asset dispositions.
The Company’s reconciliation of net loss attributable to DDR common shareholders to FFO attributable to DDR common shareholders and Operating FFO attributable to DDR common shareholders is as follows (in millions):
| For the Year Ended | ||||||||||||
| 2012 | 2011 | 2010 | ||||||||||
|
Net loss attributable to DDR common shareholders (A),(B) |
$ | (60.3 | ) | $ | (53.8 | ) | $ | (251.6 | ) | |||
|
Depreciation and amortization of real estate investments |
242.8 | 221.2 | 217.2 | |||||||||
|
Equity in net income of joint ventures |
(35.2 | ) | (13.7 | ) | (5.6 | ) | ||||||
|
Impairment of depreciable joint venture investments |
26.7 | 1.3 | 0.2 | |||||||||
|
Joint ventures’ FFO (C) |
53.6 | 57.6 | 54.7 | |||||||||
|
Non-controlling interests (OP Units) |
0.2 | 0.1 | — | |||||||||
|
Impairment of depreciable real estate assets, net of non-controlling interests |
96.3 | 62.7 | 68.2 | |||||||||
|
Gain on disposition of depreciable real estate, net |
(11.7 | ) | (47.8 | ) | (6.8 | ) | ||||||
|
|
|
|
|
|
|
|||||||
|
FFO attributable to DDR common shareholders |
312.4 | 227.6 | 76.3 | |||||||||
|
Non-operating items, net (D) |
(7.1 | ) | 39.5 | 188.0 | ||||||||
|
|
|
|
|
|
|
|||||||
|
Operating FFO attributable to DDR common shareholders |
$ | 305.3 | $ | 267.1 | $ | 264.3 | ||||||
|
|
|
|
|
|
|
|||||||
67
Table of Contents
| (A) | Includes the following deductions from net income (in millions): |
| For the Year Ended | ||||||||||||
| 2012 | 2011 | 2010 | ||||||||||
|
Preferred dividends |
$ | 28.6 | $ | 31.6 | $ | 42.3 | ||||||
|
Write-off of preferred share original issuance costs |
5.8 | 6.4 | — | |||||||||
| (B) | Straight-line rental revenue and straight-line ground rent expense, including discontinued operations, were as follows: |
| For the Year Ended | ||||||||||||
| 2012 | 2011 | 2010 | ||||||||||
|
Straight-line rents |
$ | 4.1 | $ | 0.9 | $ | 2.5 | ||||||
|
Straight-line ground rent expense |
1.1 | 2.0 | 2.0 | |||||||||
| (C) | At December 31, 2012, 2011 and 2010, the Company had an economic investment in unconsolidated joint venture interests related to 206, 177 and 189 operating shopping center properties, respectively. These joint ventures represent the investments in which the Company was recording its share of equity in net income or loss and, accordingly, FFO. |
Joint ventures’ FFO is summarized as follows (in millions):
| For the Year Ended | ||||||||||||
| 2012 | 2011 | 2010 | ||||||||||
|
Net loss attributable to unconsolidated joint ventures (1) |
$ | (49.4 | ) | $ | (251.2 | ) | $ | (64.4 | ) | |||
|
Depreciation and amortization of real estate investments |
228.7 | 182.7 | 198.3 | |||||||||
|
Impairment of depreciable real estate assets |
57.2 | 272.5 | 21.0 | |||||||||
|
(Gain) loss on sale of depreciable real estate |
(65.1 | ) | (18.7 | ) | 26.7 | |||||||
|
|
|
|
|
|
|
|||||||
|
FFO |
$ | 171.4 | $ | 185.3 | $ | 181.6 | ||||||
|
|
|
|
|
|
|
|||||||
|
FFO at DDR’s ownership interests (2) |
$ | 53.6 | $ | 57.6 | $ | 54.7 | ||||||
|
|
|
|
|
|
|
|||||||
|
Operating FFO at DDR’s ownership interests (D) |
$ | 54.2 | $ | 56.4 | $ | 54.1 | ||||||
|
|
|
|
|
|
|
|||||||
| (1) |
Revenues for the three years ended December 31, 2012, include the following (in millions): |
| 2012 | 2011 | 2010 | ||||||||||
|
Straight-line rents |
$ | 4.9 | $ | 4.6 | $ | 3.9 | ||||||
|
DDR’s proportionate share |
0.8 | 0.9 | 0.6 | |||||||||
| (2) |
FFO at DDR ownership interests considers the impact of basis differentials. |
| (D) | Amounts are described in the Operating FFO Adjustments section below. |
68
Table of Contents
Operating FFO Adjustments
The Company’s adjustments to arrive at Operating FFO are composed of the following for the years ended December 31, 2012, 2011 and 2010 (in millions). The Company provides no assurances that these charges and gains are non-recurring. These charges and gains could be reasonably expected to recur in future results of operations.
| For the Year Ended | ||||||||||||
| 2012 | 2011 | 2010 | ||||||||||
|
Impairment charges — non-depreciable consolidated assets |
$ | 30.2 | $ | 63.2 | $ | 84.8 | ||||||
|
Executive separation and related compensation and benefit charges (A) |
1.0 | 12.4 | 5.6 | |||||||||
|
Loss (gain) on debt retirement, net (B) |
13.5 | 0.1 | (0.5 | ) | ||||||||
|
(Gain) loss on equity derivative instruments (B) |
— | (21.9 | ) | 40.2 | ||||||||
|
Other expense (income), net (C) |
17.9 | 5.0 | 22.0 | |||||||||
|
Equity in net loss (income) of joint ventures — currency adjustments, transaction and other expenses, gain on sale of land and gain on debt extinguishment |
0.6 | (1.2 | ) | (0.6 | ) | |||||||
|
Impairment of joint venture investments on non-depreciable assets |
— | 1.6 | — | |||||||||
|
(Gain) loss on change in control and sale of interests, net (B) |
(70.8 | ) | (25.2 | ) | 0.4 | |||||||
|
Tax expense — deferred tax assets reserve (D) |
— | — | 49.9 | |||||||||
|
Discontinued operations — debt extinguishment costs, (gain) on deconsolidation of interests and loss on sales |
0.2 | 2.1 | (5.6 | ) | ||||||||
|
Discontinued operations — FFO associated with Mervyns Joint Venture, net of non-controlling interest |
— | — | 4.4 | |||||||||
|
(Gain) loss on disposition of non-depreciable real estate, net |
(5.5 | ) | 0.9 | (0.2 | ) | |||||||
|
Non-controlling interest — portion of impairment charges allocated to outside partners |
— | (3.9 | ) | (12.4 | ) | |||||||
|
Write-off of preferred share original issuance costs (B) |
5.8 | 6.4 | — | |||||||||
|
|
|
|
|
|
|
|||||||
|
Total adjustments from FFO to Operating FFO |
$ | (7.1 | ) | $ | 39.5 | $ | 188.0 | |||||
|
FFO attributable to DDR common shareholders |
312.4 | 227.6 | 76.3 | |||||||||
|
|
|
|
|
|
|
|||||||
|
Operating FFO attributable to DDR common shareholders |
$ | 305.3 | $ | 267.1 | $ | 264.3 | ||||||
|
|
|
|
|
|
|
|||||||
| (A) | Amounts included in general and administrative expenses. |
| (B) | Amount agrees to the face of the consolidated statements of operations. |
| (C) | Amounts included in other income (expense) in the consolidated statements of operations and detailed as follows (in millions): |
| 2012 | 2011 | 2010 | ||||||||||
|
Transaction and other expense (income) |
$ | 7.7 | $ | (0.4 | ) | $ | 2.8 | |||||
|
Litigation-related expenses, net of tax |
4.8 | 2.3 | 12.2 | |||||||||
|
Note receivable reserve |
4.3 | 5.0 | — | |||||||||
|
Debt extinguishment costs, net |
1.1 | 0.7 | 3.7 | |||||||||
|
(Settlement of) lease liability obligation |
— | (2.6 | ) | 3.3 | ||||||||
|
|
|
|
|
|
|
|||||||
| $ | 17.9 | $ | 5.0 | $ | 22.0 | |||||||
|
|
|
|
|
|
|
|||||||
| (D) | The $49.9 million net income tax expense consists of a gross valuation allowance tax expense of $58.3 million reduced by an $8.4 million tax benefit attributed to a $22.3 million abandoned project impairment charge. |
69
Table of Contents
LIQUIDITY AND CAPITAL RESOURCES
The Company periodically evaluates opportunities to issue and sell additional debt or equity securities, obtain credit facilities from lenders, or repurchase, refinance or otherwise restructure long-term debt for strategic reasons or to further strengthen the financial position of the Company. In 2012, the Company continued to strategically allocate cash flow from operating and financing activities. The Company also completed public debt and equity offerings in order to strengthen its balance sheet and improve its financial flexibility.
The Company’s consolidated and unconsolidated debt obligations generally require monthly or semi-annual payments of principal and/or interest over the term of the obligation. While the Company currently believes that it has several viable sources to obtain capital and fund its business, including capacity under its facilities described below, no assurance can be provided that these obligations will be refinanced or repaid as currently anticipated.
In January 2013, the Company amended its $750 million unsecured revolving credit facility arranged by J.P. Morgan Securities LLC and Wells Fargo Securities, LLC (the “Unsecured Credit Facility”). The $65 million unsecured revolving credit facility provided solely by PNC Bank, National Association (the “PNC Facility” and together with the Unsecured Credit Facility, the “Revolving Credit Facilities”) was amended to match the terms of the primary facility. The Company also amended its $400 million secured term loan arranged by KeyBanc Capital Markets and RBC Capital Markets. Further discussion about the amending of the facilities is described in Note 18, “Subsequent Events,” of the Company’s financial statements.
The Revolving Credit Facilities and the indentures under which the Company’s senior and subordinated unsecured indebtedness is, or may be, issued contain certain financial and operating covenants including, among other things, leverage ratios and debt service coverage and fixed charge coverage ratios, as well as limitations on the Company’s ability to incur secured and unsecured indebtedness, sell all or substantially all of the Company’s assets and engage in mergers and certain acquisitions. These credit facilities and indentures also contain customary default provisions including the failure to make timely payments of principal and interest payable thereunder, the failure to comply with the Company’s financial and operating covenants, the occurrence of a material adverse effect on the Company and the failure of the Company or its majority-owned subsidiaries (i.e., entities in which the Company has a greater than 50% interest) to pay, when due, certain indebtedness in excess of certain thresholds beyond applicable grace and cure periods. In the event the Company’s lenders or note holders declare a default, as defined in the applicable agreements governing the debt, the Company may be unable to obtain further funding, and/or an acceleration of any outstanding borrowings may occur. As of December 31, 2012, the Company was in compliance with all of its financial covenants in the agreements governing its debt. Although the Company intends to operate in compliance with these covenants, if the Company were to violate these covenants, the Company may be subject to higher finance costs and fees or accelerated maturities. The Company believes it will continue to be able to operate in compliance with these covenants in 2013 and beyond.
Certain of the Company’s credit facilities and indentures permit the acceleration of the maturity of the underlying debt in the event certain other debt of the Company has been accelerated. Furthermore, a default under a loan by the Company or its affiliates, a foreclosure on a mortgaged property owned by the Company or its affiliates or the inability to refinance existing indebtedness may have a negative impact on the Company’s financial condition, cash flows and results of operations. These facts, and an inability to predict future economic conditions, have led the Company to adopt a strict focus on lowering leverage and increasing financial flexibility.
70
Table of Contents
The Company expects to fund its obligations from available cash, current operations and utilization of its Revolving Credit Facilities; however, the Company may issue long-term debt and/or equity securities in lieu of, or in addition to, borrowing under its Revolving Credit Facilities. The following information summarizes the availability of the Revolving Credit Facilities at December 31, 2012 (in millions):
|
Cash and cash equivalents |
$ | 31.2 | ||
|
|
|
|||
|
Revolving Credit Facilities |
$ | 815.0 | ||
|
Less: |
||||
|
Amount outstanding |
(147.9 | ) | ||
|
Letters of credit |
(28.2 | ) | ||
|
|
|
|||
|
Borrowing capacity available |
$ | 638.9 | ||
|
|
|
In October 2012, the Company entered into an agreement for the future issuance of up to $200.0 million of common shares under a continuous equity program. This program replaces any previous program entered into by the Company. As of February 15, 2013, the Company had available for future issuance $125.0 million of its common shares under its continuous equity program.
The Company intends to maintain a longer-term financing strategy and continue to reduce its reliance on short-term debt. The Company believes its Revolving Credit Facilities are sufficient for its liquidity strategy and longer-term capital structure needs. Part of the Company’s overall strategy includes scheduling future debt maturities in a balanced manner, including incorporating a healthy level of conservatism regarding possible future market conditions. For additional discussion, see Financing Activities described later in this section.
The Company is focused on de-leveraging opportunities for the consolidated secured debt maturing in 2013, which aggregates $41.1 million on four assets, of which $8.4 million was repaid in February 2013 from borrowings under the Company’s Revolving Credit Facilities. The Company expects to fund its remaining obligations from available cash, current operations, utilization of its Revolving Credit Facilities or possible refinancing opportunities. No assurance can be provided that these obligations will be refinanced or repaid as currently anticipated.
At February 15, 2013, there were no other unsecured maturities until May 2015. Management believes that the scheduled debt maturities in future years are manageable. The Company continually evaluates its debt maturities and, based on management’s assessment, believes it has viable financing and refinancing alternatives. The Company continues to look beyond 2013 to ensure that it executes its strategy to lower leverage, increase liquidity, improve the Company’s credit ratings and extend debt duration, with the goal of lowering the Company’s balance sheet risk and cost of capital.
Unconsolidated Joint Ventures
The Company’s unconsolidated joint venture mortgage debt that had matured and is now past due was $118.4 million at December 31, 2012 (of which the Company’s proportionate share is $14.7 million), all of which was attributable to the Coventry II Fund assets (see Off-Balance Sheet Arrangements).
At December 31, 2012, the Company’s unconsolidated joint venture mortgage debt maturing in 2013 was $275.2 million (of which the Company’s proportionate share is $42.1 million). Of this amount, $105.8 million (of which the Company’s proportionate share is $21.2 million) is attributable to Coventry II Funds assets (see Off-Balance Sheet Arrangements). Further discussion on the 2012 refinancing of unconsolidated debt is described in Note 2, “Investments in and Advances to Joint Ventures,” of the Company’s financial statements.
71
Table of Contents
Cash Flow Activity
The Company’s core business of leasing space to well-capitalized retailers continues to generate consistent and predictable cash flow after expenses, interest payments and preferred share dividends. This capital is available for use at the Company’s discretion for investment, debt repayment and the payment of dividends on common shares.
The Company’s cash flow activities are summarized as follows (in thousands):
| Year Ended December 31, | ||||||||||||
| 2012 | 2011 | 2010 | ||||||||||
|
Cash flow provided by operating activities |
$ | 304,196 | $ | 273,195 | $ | 278,124 | ||||||
|
Cash flow (used for) provided by investing activities |
(588,430 | ) | 200,696 | 31,762 | ||||||||
|
Cash flow provided by (used for) financing activities |
274,763 | (451,854 | ) | (317,065 | ) | |||||||
Operating Activities: The change in cash flow from operating activities for the year ended December 31, 2012, as compared to the year ended December 31, 2011, primarily was due to additional cash flow from acquired properties, changes in restricted cash and increased distributions from joint ventures offset by the settlement of accreted debt discount on repayment of senior convertible notes.
Investing Activities: The change in cash flow from investing activities for the year ended December 31, 2012, as compared to the year ended December 31, 2011, primarily was due to an increase in asset acquisitions as well as an increase in contributions and advances to unconsolidated joint ventures, primarily the BRE DDR Retail Holdings, LLC joint venture discussed below.
Financing Activities: The change in cash flow from financing activities for the year ended December 31, 2012, as compared to the year ended December 31, 2011, primarily was due to an increase in proceeds from the issuance of common shares, preferred shares and debt in 2012, partially offset by an increase in debt repayments and dividend payments in 2012.
The Company satisfied its REIT requirement of distributing at least 90% of ordinary taxable income with declared common and preferred share cash dividends of $169.8 million in 2012, as compared to $92.8 million of cash dividends paid in 2011 and $62.5 million of cash dividends paid in 2010. Because actual distributions were greater than 100% of taxable income, federal income taxes were not incurred by the Company in 2012.
The Company declared cash dividends of $0.48 per common share in 2012. In January 2013, the Company declared its first quarter 2013 dividend of $0.135 per common share payable on April 2, 2013, to shareholders of record at the close of business on March 14, 2013. The Board of Directors of the Company will continue to monitor the 2013 dividend policy and provide for adjustments as determined to be in the best interests of the Company and its shareholders to maximize the Company’s free cash flow, while still adhering to REIT payout requirements.
SOURCES AND USES OF CAPITAL
2012 Strategic Transaction Activity
Acquisitions
The Company has a portfolio management strategy to recycle capital from lower quality, lower growth potential assets into Prime Assets with long-term growth potential. Further discussion on these acquisitions is described in Note 3, “Acquisitions,” of the Company’s financial statements.
In 2012, the Company acquired nine shopping centers, five of which were acquired from its unconsolidated joint venture partners. The four assets acquired from third parties (one in Arizona, one in Illinois and two in
72
Table of Contents
North Carolina) aggregate 2.0 million square feet of Company-owned GLA and were acquired for an aggregate purchase price of $324.0 million. The Company assumed $24.4 million of mortgage debt at a fair market value of $25.4 million in connection with these acquisitions. The five properties acquired from unconsolidated joint venture partners (two in Arizona, two in Missouri and one in Oregon) aggregate 1.8 million square feet of Company-owned GLA and were acquired for an aggregate purchase price of $339.4 million. The Company funded these acquisitions in part with proceeds from the issuance of common shares through its continuous equity program.
BRE DDR Retail Holdings, LLC
In June 2012, a joint venture between consolidated affiliates of the Company and Blackstone acquired a portfolio of 46 shopping centers aggregating 10.6 million square feet of GLA. These assets were previously owned by EPN Group and managed by the Company. An affiliate of Blackstone owns 95% of the common equity of the joint venture, and the remaining 5% common equity interest is owned by a consolidated affiliate of the Company. The transaction was valued at $1.4 billion. The joint venture assumed $635.6 million of senior non-recourse debt at face value and entered into an additional $320.0 million of non-recourse debt with a three-year term and two one-year extension options. The Company contributed $17.0 million to the joint venture for its common equity interest and also funded the joint venture with $150.0 million in preferred equity. The Company continues to provide leasing and property management services and has the right of first offer to acquire 10 of the assets under specified conditions. The Company funded its investment with proceeds from the forward equity agreements entered into in January 2012. The forward equity agreements were settled in June 2012, at which time the Company issued 19.0 million of its common shares for net proceeds of $231.2 million.
Dispositions
In 2012, the Company sold 24 shopping center properties and five office properties, aggregating 3.1 million square feet, and other consolidated non-income producing assets at an aggregate sales price of $193.2 million. The Company recorded a net gain of $9.7 million, which excludes the impact of an aggregate $143.7 million in related impairment charges that were recorded in prior periods related to the assets sold in 2012.
In 2012, the Company’s unconsolidated joint ventures had the following sales transactions, excluding those properties acquired by the Company as described above:
|
Joint Venture |
Company’s
Effective Ownership Percentage |
Company-
Owned Square Feet (Thousands) |
Sales
Price (Millions) (A) |
Company’s
Proportionate Share of Gain (Millions) (B) |
||||||||||||
|
Sonae Sierra Brasil BV Sarl I (three assets) (C) |
33.3 | % | 868 | $ | 102.7 | $ | 10.8 | |||||||||
|
DDR Domestic Retail Fund I (one asset) |
20.0 | % | 43 | 6.8 | 0.1 | |||||||||||
|
DDRTC Core Retail Fund (two assets) |
15.0 | % | 793 | 116.3 | 0.2 | |||||||||||
|
DPG Realty Holdings LLC (two assets) |
10.0 | % | 157 | 5.5 | — | |||||||||||
|
|
|
|
|
|
|
|||||||||||
| 1,861 | $ | 231.3 | $ | 11.1 | ||||||||||||
|
|
|
|
|
|
|
|||||||||||
| (A) | The Company also sold its 20% interest in an unconsolidated joint venture and received net proceeds of $7.5 million. |
| (B) | The Company’s proportionate share of gain was adjusted by basis differentials from the Company’s investment in the assets created by previously recorded deferred gains and impairment charges. |
| (C) | The proceeds from the sale of these assets were primarily retained by the joint venture to fund future development and acquisition activity. |
As discussed above, a part of the Company’s portfolio management strategy is to recycle capital from lower quality, lower growth assets into Prime Assets with long-term growth potential. The Company has been marketing certain non-Prime Assets for sale and is focused on selling single-tenant assets and/or smaller
73
Table of Contents
shopping centers that do not meet the Company’s current business strategy. The Company has entered into agreements, including contracts executed through February 15, 2013, to sell real estate assets that are subject to contingencies. An aggregate loss of approximately $2 million could be recorded if all such sales were consummated on the terms as negotiated through February 15, 2013. Given the Company’s experience over the past few years, it is difficult for many buyers to complete these transactions in the timing contemplated or at all. The Company has not recorded an impairment charge on the assets that would result in a loss at December 31, 2012, as the undiscounted cash flows, when considering and evaluating the various alternative courses of action that may occur, exceeded the asset’s current carrying value at December 31, 2012. The Company evaluates all potential sale opportunities taking into account the long-term growth prospects of assets being sold, the use of proceeds and the impact to the Company’s balance sheet, in addition to the impact on operating results. As a result, if actual results differ from expectations, it is possible that additional assets could be sold in subsequent periods for a gain or loss after taking into account the above considerations.
Developments and Redevelopments
As part of its portfolio management strategy to develop, expand, improve and re-tenant various consolidated properties, the Company expended an aggregate of $82.4 million on a net basis, after deducting sales proceeds from outlot sales, to develop, expand, improve and re-tenant various consolidated properties during 2012.
The Company is currently undertaking developments and redevelopment projects at 12 significant shopping centers (including one shopping center owned by a consolidated joint venture) at a projected aggregate net cost of approximately $292.3 million. At December 31, 2012, $192.7 million of costs had been incurred in relation to these redevelopment projects. In addition, the Company’s unconsolidated joint ventures have projects being developed and have incurred $228.7 million in project costs. An expected $350.5 million of costs is projected to be incurred attributable to projects under development at the Company’s joint venture in Brazil, of which $274.4 million of costs had been incurred at December 31, 2012.
The Company and its joint venture partners intend to commence construction on various other developments only after substantial tenant leasing has occurred and acceptable construction financing is available.
At December 31, 2012, the Company had $273.2 million of recorded costs related to land and projects under development, for which active construction had temporarily ceased or had not yet commenced. Based on the Company’s intentions and business plans, the Company believes that the expected undiscounted cash flows exceed its current carrying value on each of these projects. However, if the Company were to dispose of certain of these assets in the market, the Company would likely incur a loss, which may be material. The Company evaluates its intentions with respect to these assets each reporting period and records an impairment charge equal to the difference between the current carrying value and fair value when the expected undiscounted cash flows are less than the asset’s carrying value.
The Company will continue to closely monitor its expected spending in 2013 for developments and redevelopments, both for consolidated and unconsolidated projects, as the Company considers this funding to be discretionary spending. The Company does not anticipate expending a significant amount of funds on joint venture development projects in 2013, excluding projects through Sonae Sierra Brasil. The projects in Brazil are expected to be funded with operating cash flow generated by Sonae Sierra Brasil, proceeds from asset sales or proceeds from the local debt financing completed by Sonae Sierra Brasil in the first quarter of 2012.
One of the important benefits of the Company’s asset class is the ability to phase development projects over time until appropriate leasing levels can be achieved. To maximize the return on capital spending and balance the Company’s deleveraging strategy, the Company generally adheres to strict investment criteria thresholds. The revised underwriting criteria, generally followed for the past three years, includes a higher cash-on-cost project return threshold and incorporates a longer period before the leases commence and a higher stabilized vacancy rate. The Company applies this revised strategy to both its consolidated and certain unconsolidated joint ventures that own assets under development because the Company has significant influence and, in most cases, approval rights over decisions relating to significant capital expenditures.
74
Table of Contents
2011 Strategic Transaction Activity
Strategic Purchase and Sale Transactions
The Company sold its open-air mall, Town Center Plaza, in Kansas City, Kansas, to Glimcher Realty Trust (NYSE: GRT) (“Glimcher”) for approximately $139 million. Glimcher sold its power center, Polaris Towne Center, in Columbus, Ohio, to the Company for $79.6 million. The Company recognized a gain of $62.4 million in connection with the sale of Town Center Plaza.
Acquisitions
In 2011, the Company acquired four shopping centers (Polaris Towne Center in Columbus, Ohio, as discussed above, Chapel Hills East in Colorado Springs, Colorado, and Cotswold Village Shopping Center and Terraces at South Park, both in Charlotte, North Carolina) aggregating 1.2 million square feet of Company-owned GLA for an aggregate purchase price of $189.6 million. The Company assumed $112.2 million of mortgage debt at a fair market value of $122.9 million in connection with these acquisitions. In 2011, the Company acquired its partners’ 50% ownership interests in two shopping centers for an aggregate gross purchase price of $79.7 million. The Company acquired these assets pursuant to the terms of the respective underlying joint venture agreements. The Company funded these acquisitions in part with proceeds from the issuance of common shares through its continuous equity program. These acquisitions are more fully described in Note 3, “Acquisitions,” of the Company’s financial statements.
Dispositions
In 2011, the Company sold 33 shopping center properties and one office property, aggregating 2.9 million square feet, for an aggregate sales price of $271.6 million. In addition, the Company sold $58.0 million of consolidated non-income producing assets or interests in assets. The Company recorded a net loss of $47.2 million, which excludes the impact of $92.1 million in related impairment charges recorded in prior periods.
In 2011, the Company’s unconsolidated joint ventures sold seven shopping center properties, excluding those properties acquired by the Company as described above, aggregating 1.3 million square feet, for an aggregate sales price of $131.3 million, of which the Company’s proportionate share of the gain was approximately $10.1 million.
Developments and Redevelopments
During 2011, the Company expended an aggregate of $50.8 million on a net basis, after deducting sales proceeds from outlot sales, to develop, expand, improve and re-tenant various consolidated properties.
2010 Strategic Transaction Activity
Dispositions
In 2010, the Company sold 31 shopping center properties in various states, aggregating 2.9 million square feet, at a sales price of $150.7 million. The Company recorded a net gain of $5.8 million, which excludes the impact of $77.3 million in related impairment charges.
In 2010, the Company’s unconsolidated joint ventures sold 36 shopping center properties aggregating 5.6 million square feet, for an aggregate sales price of $615.8 million of which the Company’s proportionate share of the gain was approximately $4.9 million, after adjusting for impairment charges previously recorded against its investment in the joint venture.
75
Table of Contents
Developments, Redevelopments and Expansions
During 2010, the Company expended an aggregate of $102.7 million, net, after deducting sales proceeds from outlot sales, to develop, expand, improve and re-tenant various consolidated properties.
OFF-BALANCE SHEET ARRANGEMENTS
The Company has a number of off-balance sheet joint ventures and other unconsolidated entities with varying economic structures. Through these interests, the Company has investments in operating properties, development properties, two management companies and one development company. Such arrangements are generally with institutional investors located throughout the United States and Brazil.
The unconsolidated joint ventures that have total assets greater than $250 million (based on the historical cost of acquisition by the unconsolidated joint venture) at December 31, 2012, were as follows (in order of gross asset book value):
|
Unconsolidated Real Estate Ventures |
Effective
|
Assets Owned |
Company-Owned
(Millions) |
Total
|
||||||||||
|
DDRTC Core Retail Fund LLC |
15.0 | % | 39 shopping centers in several states | 10.8 | $ | 1,038.9 | ||||||||
|
DDR Domestic Retail Fund I |
20.0 | % | 59 shopping centers in several states | 8.2 | 923.3 | |||||||||
|
BRE DDR Retail Holdings, LLC |
5.0 | % ( B ) | 46 shopping centers in several states | 10.6 | 940.0 | |||||||||
|
Sonae Sierra Brasil BV Sarl |
33.3 | % | Eight shopping centers, a management company and two development projects in Brazil | 3.3 | 377.8 | |||||||||
|
DDR — SAU Retail Fund LLC |
20.0 | % | 27 shopping centers in several states | 2.4 | 182.6 | |||||||||
| (A) | Ownership may be held through different investment structures. Percentage ownerships are subject to change, as certain investments contain promoted structures. |
| (B) | Excludes interest owned through $150.0 million preferred equity investment. See 2012 Strategic Transaction Activity. |
Funding for Unconsolidated Joint Ventures
In connection with the development of shopping centers owned by certain affiliates, the Company and/or its equity affiliates have agreed to fund the required capital associated with approved development projects aggregating approximately $7.6 million at December 31, 2012. These obligations, composed principally of construction contracts, are generally due in 12 to 36 months, as the related construction costs are incurred, and are expected to be financed through new or existing construction loans, revolving credit facilities and retained capital.
The Company has provided loans and advances to certain unconsolidated entities and/or related partners in the amount of $253.4 million at December 31, 2012, for which the Company’s joint venture partners have not funded their proportionate share. Included in this amount is the $154.6 million in preferred equity with a fixed distribution rate of 10% due from BRE DDR Retail Holdings, LLC. Also included in this amount is $66.9 million of financing that the Company advanced to one of its unconsolidated joint ventures, which accrued interest at the greater of LIBOR plus 700 basis points or 12% and a default rate of 16%, and had an initial maturity of July 2011 (the “Bloomfield Loan”). This advance is reserved in full. In addition, the Company guaranteed annual base rental income at certain centers held through Service Holdings, aggregating $2.2 million at December 31, 2012.
76
Table of Contents
The Company has not recorded a liability for the guaranty, as the subtenants of Service Holdings are paying rent as due. The Company has recourse against the other parties in the joint venture for their pro rata share of any liability under this guaranty (see Coventry II Fund discussion below).
Coventry II Fund
At December 31, 2012, the Company maintained several investments with the Coventry II Fund. The Company co-invested approximately 20% in each joint venture. The Company’s management and leasing agreements with the joint ventures expired by their own terms on December 31, 2011, and the Company decided not to renew these agreements (see Item 3. Legal Proceedings).
As of December 31, 2012, the aggregate carrying amount of the Company’s net investment in the Coventry II Fund joint ventures was $3.6 million. In November 2012, the Company sold its 20% investment in the Coventry II DDR Montgomery Farm LLC joint venture. In addition to its existing equity and notes receivable, including the Bloomfield Loan, the Company has provided partial payment guaranties to third-party lenders in connection with the financing for four of the Coventry II Fund projects. The amount of each such guaranty is not greater than the proportion of the Company’s investment percentage in the underlying projects, and the aggregate amount of the Company’s guaranties was $10.1 million at December 31, 2012.
Although the Company will not acquire additional investments through the Coventry II Fund joint ventures, additional funds may be required to address ongoing operational needs and costs associated with the joint ventures undergoing development or redevelopment. The Coventry II Fund is exploring a variety of strategies to obtain such funds, including potential dispositions and financings. The Company continues to maintain the position that it does not intend to fund any of its joint venture partners’ capital contributions or their share of debt maturities.
A summary of the Coventry II Fund investments as of December 31, 2012, is as follows:
|
Unconsolidated Real Estate Ventures |
Shopping Center or
|
Loan
Balance Outstanding at December 31, 2012 |
||||
|
Coventry II DDR Bloomfield LLC |
Bloomfield Hills, Michigan | $ | 39.8 | (A),(B),(C),(D) | ||
|
Coventry II DDR Buena Park LLC |
Buena Park, California | 73.0 | (B) | |||
|
Coventry II DDR Fairplain LLC |
Benton Harbor, Michigan | 14.1 | (B),(E) | |||
|
Coventry II DDR Marley Creek Square LLC |
Orland Park, Illinois | 10.5 | (B),(C),(D),(E) | |||
|
Coventry II DDR Phoenix Spectrum LLC |
Phoenix, Arizona | 65.0 | ||||
|
Coventry II DDR Totem Lakes LLC |
Kirkland, Washington | 26.7 | (B),(D),(E) | |||
|
Coventry II DDR Tri-County LLC |
Cincinnati, Ohio | 149.6 | (B),(C),(D) | |||
|
Coventry II DDR Westover LLC |
San Antonio, Texas | 19.7 | (B) | |||
|
Service Holdings LLC |
37 retail sites in several states | 95.7 | (B),(C),(D),(E) | |||
| (A) | In 2009, the senior secured lender sent to the borrower a formal notice of default and filed a foreclosure action. The Company paid its 20% guaranty of this loan in 2009, and the senior secured lender initiated legal proceedings against the Coventry II Fund for its failure to fund its 80% payment guaranty. The senior secured lender and the Coventry II Fund subsequently entered into a settlement agreement in connection with the legal proceedings. In addition, the Bloomfield Loan from the Company is cross-defaulted with this third-party loan. The Bloomfield Loan is considered past due and has been fully reserved by the Company. |
| (B) | As of February 15, 2013, lenders are managing the cash receipts and expenditures related to the assets collateralizing these loans. |
| (C) | As of February 15, 2013, these loans are in default, and the Coventry II Fund is exploring a variety of strategies with the lenders. |
77
Table of Contents
| (D) | The Company has written its investment basis in this joint venture down to zero and is no longer reporting an allocation of income or loss. |
| (E) | As of February 15, 2013, the Company provided partial loan or interest payment guaranties that were not greater than the proportion of its investment interest. |
Deconsolidation of Mervyns Joint Venture
The Mervyns Joint Venture which owned the underlying real estate assets formerly occupied by Mervyns, declared bankruptcy in 2008 and vacated all sites as of December 31, 2008. The Company owns a 50% interest in the Mervyns Joint Venture, which was previously consolidated by the Company. In 2010, the Mervyns Joint Venture received a notice of default from the servicer for the non-recourse loan secured by all of the remaining former Mervyns stores due to the nonpayment of required monthly debt service. Also, in 2010, the court appointed a third-party receiver to manage and liquidate the remaining former Mervyns sites. Due to the receiver appointment, the Company no longer had the contractual ability to direct the activities that most significantly affected the economic performance of the Mervyns Joint Venture, nor did it have the obligation to absorb losses or receive a benefit from the Mervyns Joint Venture that could potentially be significant to the entity. As a result, the Company deconsolidated the assets and obligations of the Mervyns Joint Venture. The Mervyns Joint Venture no longer owns any of the assets as of December 31, 2012.
Other Joint Ventures
The Company is involved with overseeing the development activities for several of its unconsolidated joint ventures that are constructing or redeveloping shopping centers. The Company earns a fee for its services commensurate with the level of oversight provided. The Company generally provides a completion guaranty to the third-party lending institution(s) providing construction financing.
The Company’s unconsolidated joint ventures had aggregate outstanding indebtedness to third parties of $4.2 billion and $3.7 billion at December 31, 2012 and 2011, respectively (see Item 7A. Quantitative and Qualitative Disclosures About Market Risk). Such mortgages are generally non-recourse to the Company and its partners; however, certain mortgages may have recourse to the Company and its partners in certain limited situations, such as misuse of funds and material misrepresentations. In connection with certain of the Company’s unconsolidated joint ventures, the Company agreed to fund any amounts due to the joint venture’s lender if such amounts are not paid by the joint venture based on the Company’s pro rata share of such amount, which aggregated $15.4 million at December 31, 2012, including guaranties associated with the Coventry II Fund joint ventures.
The Company has generally chosen not to mitigate any of the foreign currency risk through the use of hedging instruments for Sonae Sierra Brasil. The Company will continue to monitor and evaluate this risk and may enter into hedging agreements at a later date.
The Company has interests in consolidated joint ventures that own real estate assets in Canada and Russia. The net assets of these subsidiaries are exposed to volatility in currency exchange rates. As such, the Company uses non-derivative financial instruments to hedge this exposure. The Company manages currency exposure related to the net assets of the Company’s Canadian and European subsidiaries primarily through foreign currency-denominated debt agreements into which the Company enters. Gains and losses in the parent company’s net investments in its subsidiaries are economically offset by losses and gains in the parent company’s foreign currency-denominated debt obligations.
For the year ended December 31, 2012, net losses were not material related to the foreign currency-denominated debt agreements and were included in the Company’s cumulative translation adjustment. As the notional amount of the non-derivative instrument substantially matches the portion of the net investment designated as being hedged and the non-derivative instrument is denominated in the functional currency of the hedged net investment, the hedge ineffectiveness recognized in earnings was not material.
78
Table of Contents
FINANCING ACTIVITIES
The Company has historically accessed capital sources through both the public and private markets. The Company’s acquisitions, developments and redevelopments are generally financed through cash provided from operating activities, revolving credit facilities, mortgages assumed, construction loans, secured debt, unsecured debt, common and preferred equity offerings, joint venture capital and asset sales. Total consolidated debt outstanding was $4.3 billion at December 31, 2012, as compared to $4.1 billion and $4.3 billion at December 31, 2011 and 2010, respectively.
Debt and equity financings are summarized as follows (in millions):
| 2012 | 2011 | 2010 | ||||||||||
|
Equity: |
||||||||||||
|
Common shares |
$ | 510.7 | (A) | $ | 190.2 | $ | 454.4 | |||||
|
Preferred Shares |
200.0 | (B) | — | — | ||||||||
|
Debt: |
||||||||||||
|
Unsecured notes |
450.0 | (C) | 300.0 | 600.0 | ||||||||
|
Unsecured Term Loan |
350.0 | (D) | — | — | ||||||||
|
Convertible unsecured notes |
— | — | 350.0 | |||||||||
|
Construction |
— | 15.2 | 3.4 | |||||||||
|
Mortgage financing |
368.0 | (E) | 201.0 | — | ||||||||
|
Mortgage debt assumed |
24.4 | 112.2 | — | |||||||||
|
|
|
|
|
|
|
|||||||
|
Total debt |
1,192.4 | 628.4 | 953.4 | |||||||||
|
|
|
|
|
|
|
|||||||
| $ | 1,903.1 | $ | 818.6 | $ | 1,407.8 | |||||||
|
|
|
|
|
|
|
|||||||
| (A) | The Company issued 36.5 million shares in 2012. The net proceeds were used primarily to fund the acquisition of assets. |
| (B) | In August 2012, the Company issued $200.0 million of its newly designated 6.50% Class J Preferred Shares at a price of $500.00 per share (or $25.00 per depositary share). The net proceeds from the issuance of the Class J Preferred Shares were used to redeem all of the Company’s 7.50% Class I Preferred Shares at a redemption price of $500.00 per share (or $25.00 per depositary share) plus accrued and unpaid dividends of $3.75 per share (or $0.1875 per depositary share). The Company recorded a charge of $5.8 million to net income attributable to common shareholders in 2012 due to the write-off of the Class I Preferred Shares original issuance costs. |
| (C) | In 2012, the Company issued $450 million aggregate principal amount of 4.625% senior unsecured notes due July 2022. Of these notes, $150 million was issued in November 2012 at a premium to par value. |
| (D) | In January 2012, the Company entered in an unsecured term loan (“Unsecured Term Loan”). At December 31, 2012, the Unsecured Term Loan consisted of a $50 million tranche at a rate of LIBOR plus 170 basis points that matures on January 31, 2017, and a $300 million tranche at a rate of LIBOR plus 210 basis points that matures on January 31, 2019. Borrowings under the Unsecured Term Loan bear interest at LIBOR plus a margin based upon DDR’s long-term senior unsecured debt ratings. Additionally, the Company entered into interest rate swaps on the $50 million, five-year tranche to fix the interest rate at 2.3% and the $300 million, seven-year tranche to fix the interest rate at 3.4%. |
| (E) | In January 2012, the Company entered in a $103.0 million mortgage loan (“Mortgage Loan”). The Mortgage Loan has a seven-year term, bears interest at 3.4% secured and is collateralized by three shopping centers. In December 2012, the Company completed a seven-year, 3.95% fixed-rate, $265 million mortgage collateralized by four shopping centers. As a result, the Company unencumbered two properties. |
79
Table of Contents
CAPITALIZATION
At December 31, 2012, the Company’s capitalization consisted of $4.3 billion of debt, $405 million of preferred shares and $4.9 billion of market equity (market equity is defined as common shares and OP Units outstanding multiplied by $15.66, the closing price of the Company’s common shares on the New York Stock Exchange at December 31, 2012), resulting in a debt to total market capitalization ratio of 0.45 to 1.0, as compared to the ratios of 0.52 to 1.0 and 0.51 to 1.0 at December 31, 2011 and 2010, respectively. The closing prices of the common shares on the New York Stock Exchange were $12.17 and $14.09 at December 31, 2011 and 2010, respectively. At December 31, 2012 and 2011, the Company’s total debt consisted of the following (in billions):
| At December 31, | ||||||||
| 2012 | 2011 | |||||||
|
Fixed-rate debt (A) |
$ | 3.9 | $ | 3.6 | ||||
|
Variable-rate debt |
0.4 | 0.5 | ||||||
|
|
|
|
|
|||||
| $ | 4.3 | $ | 4.1 | |||||
|
|
|
|
|
|||||
| (A) | Includes $632.8 million and $284.1 million of variable-rate debt that had been effectively swapped to a fixed rate through the use of interest rate derivative contracts at December 31, 2012 and 2011, respectively. |
It is management’s strategy to have access to the capital resources necessary to manage the Company’s balance sheet, to repay upcoming maturities and to consider making prudent opportunistic investments. Accordingly, the Company may seek to obtain funds through additional debt or equity financings and/or joint venture capital in a manner consistent with its intention to operate with a conservative debt capitalization policy and to reduce the Company’s cost of capital by maintaining an investment grade rating with Moody’s Investors Service, Standard and Poor’s and Fitch. The security rating is not a recommendation to buy, sell or hold securities, as it may be subject to revision or withdrawal at any time by the rating organization. Each rating should be evaluated independently of any other rating. The Company may not be able to obtain financing on favorable terms, or at all, which may negatively affect future ratings.
The Company’s credit facilities and the indentures under which the Company’s senior and subordinated unsecured indebtedness is, or may be, issued contain certain financial and operating covenants, including, among other things, debt service coverage and fixed charge coverage ratios, as well as limitations on the Company’s ability to incur secured and unsecured indebtedness, sell all or substantially all of the Company’s assets and engage in mergers and certain acquisitions. Although the Company intends to operate in compliance with these covenants, if the Company were to violate these covenants, the Company may be subject to higher finance costs and fees or accelerated maturities. In addition, certain of the Company’s credit facilities and indentures may permit the acceleration of maturity in the event certain other debt of the Company has been accelerated. Foreclosure on mortgaged properties or an inability to refinance existing indebtedness would have a negative impact on the Company’s financial condition and results of operations.
80
Table of Contents
CONTRACTUAL OBLIGATIONS AND OTHER COMMITMENTS
The Company has debt obligations relating to its revolving credit facilities, term loan, fixed-rate senior notes and mortgages payable with maturities ranging from one to 25 years. In addition, the Company has non-cancelable operating leases, principally for office space and ground leases.
These obligations are summarized as follows for the subsequent five years ending December 31 (in millions):
|
Contractual Obligations |
Total |
Less than
1 year |
1–3 years | 3–5 years |
More than
5 years |
|||||||||||||||
|
Debt |
$ | 4,307.6 | $ | 66.6 | $ | 1,287.4 | $ | 835.0 | $ | 2,118.6 | ||||||||||
|
Interest payments (A) |
1,083.5 | 204.9 | 377.1 | 264.9 | 236.6 | |||||||||||||||
|
Operating leases |
136.0 | 3.7 | 7.1 | 6.6 | 118.6 | |||||||||||||||
|
|
|
|
|
|
|
|
|
|
|
|||||||||||
|
Total |
$ | 5,527.1 | $ | 275.2 | $ | 1,671.6 | $ | 1,106.5 | $ | 2,473.8 | ||||||||||
|
|
|
|
|
|
|
|
|
|
|
|||||||||||
| (A) | Represents interest payments expected to be incurred on the Company’s consolidated debt obligations as of December 31, 2012, including capitalized interest. For variable-rate debt, the rate in effect at December 31, 2012 (or the pricing and term of the amended Revolving Credit Facilities and Secured Term Loan entered into in January 2013), is assumed to remain in effect until the respective initial maturity date of each instrument. |
The Company has loans receivable, including accrued interest, that are collateralized by certain rights in development projects, partnership interests, sponsor guaranties and real estate assets. The Company had six notes receivable outstanding at both December 31, 2012 and 2011.
At December 31, 2012, the Company had letters of credit outstanding of $44.4 million. The Company has not recorded any obligations associated with these letters of credit, the majority of which are collateral for existing indebtedness and other obligations of the Company.
In conjunction with the development of shopping centers, the Company had entered into commitments with general contractors aggregating approximately $34.9 million for its wholly-owned and consolidated joint venture properties at December 31, 2012. These obligations, composed principally of construction contracts, are generally due in 12 to 36 months, as the related construction costs are incurred, and are expected to be financed through operating cash flow, new or existing construction loans, asset sales or revolving credit facilities.
The Company has guaranteed certain special assessment and revenue bonds issued by the Midtown Miami Community Development District. The bond proceeds were used to finance certain infrastructure and parking facility improvements. In the event of a debt service shortfall, the Company is responsible for satisfying the shortfall. There are no assets held as collateral or liabilities recorded related to these guaranties. To date, tax revenues have exceeded the debt service payments for these bonds.
The Company routinely enters into contracts for the maintenance of its properties. These contracts typically can be cancelled upon 30 to 60 days’ notice without penalty. At December 31, 2012, the Company had purchase order obligations, typically payable within one year, aggregating approximately $3.0 million related to the maintenance of its properties and general and administrative expenses.
The Company has entered into employment contracts with certain executive officers. These contracts generally provide for base salary, bonuses based on factors including the financial performance of the Company and personal performance, participation in the Company’s equity plans, health and welfare benefits, participation in Company retirement plans, and reimbursement of various qualified business expenses. These employment agreements may also provide for certain perquisites (e.g., disability insurance coverage, reimbursement of
81
Table of Contents
country or social club expenses related to the conduct of the Company’s business, etc.). The employment agreements for the Company’s Chief Executive Officer and certain other senior executive officers extend through December 31, 2015, and are subject to cancellation by either the Company or the executive without cause upon at least 90 days’ notice.
INFLATION
Most of the Company’s long-term leases contain provisions designed to mitigate the adverse impact of inflation. Such provisions include clauses enabling the Company to receive additional rental income from escalation clauses that generally increase rental rates during the terms of the leases and/or percentage rentals based on tenants’ gross sales. Such escalations are determined by negotiation, increases in the consumer price index or similar inflation indices. In addition, many of the Company’s leases are for terms of less than 10 years, permitting the Company to seek increased rents at market rates upon renewal. Most of the Company’s leases require the tenants to pay their share of operating expenses, including common area maintenance, real estate taxes, insurance and utilities, thereby reducing the Company’s exposure to increases in costs and operating expenses resulting from inflation.
ECONOMIC CONDITIONS
The Company believes there has been a favorable shift in the supply-and-demand dynamic for quality locations in well-positioned shopping centers. Many retailers have strong store opening plans for 2013 and 2014. The Company continues to see strong demand from a broad range of retailers for its space, particularly in the off-price sector, which is a reflection of the general outlook of consumers who are demanding more value for their dollars. This is evidenced by the continued high volume of leasing activity, which was 11.3 million square feet of space for both new leases and renewals for the year ended December 31, 2012. The Company also benefits from its real estate asset class (shopping centers) typically have a higher return on capital expenditures, as well as a diversified tenant base with only one tenant exceeding 3.0% of total 2012 consolidated revenues and the Company’s proportionate share of unconsolidated joint venture revenues (Walmart at 4.0%). Other significant tenants include Target, Lowe’s, Home Depot, Kohl’s, TJX Companies, PetSmart, Publix and Bed Bath & Beyond, all of which have relatively strong credit ratings, remain well-capitalized and have outperformed other retail categories on a relative basis over time. The Company believes these tenants should continue providing it with a stable revenue base for the foreseeable future, given the long-term nature of these leases. Moreover, the majority of the tenants in the Company’s shopping centers provide day-to-day consumer necessities with a focus toward value and convenience, versus high-priced discretionary luxury items, which the Company believes will enable many of the tenants to continue operating within this challenging economic environment.
The retail shopping sector continues to be affected by the competitive nature of the retail business and the competition for market share as well as general economic conditions where stronger retailers have out-positioned some of the weaker retailers. These shifts have forced some market share away from weaker retailers and required them, in some cases, to declare bankruptcy and/or to downsize and close stores. Overall, the Company believes its portfolio remains stable. However, there can be no assurance that these events will not adversely affect the Company (see Item 1A. Risk Factors).
Historically, the Company’s portfolio has performed consistently throughout many economic cycles, including downward cycles. Broadly speaking, national retail sales have grown since World War II, including during several recessions and housing slowdowns. In the past, the Company has not experienced significant volatility in its long-term portfolio occupancy rate. The Company has experienced downward cycles before and has made the necessary adjustments to leasing and development strategies to accommodate the changes in the operating environment and mitigate risk. In many cases, the loss of a weaker tenant or downsizing of space creates an opportunity to re-lease space at higher rents to a stronger retailer. More importantly, the quality of the
82
Table of Contents
property revenue stream is high and consistent, as it is generally derived from retailers with good credit profiles under long-term leases, with very little reliance on overage rents generated by tenant sales performance.
The Company believes that the quality of its shopping center portfolio is strong, as evidenced by the high historical occupancy rates, which have generally ranged from 92% to 96% since the Company’s initial public offering in 1993. The shopping center portfolio occupancy rate was at 91.5% at December 31, 2012, as compared to 89.1% at December 31, 2011. Notwithstanding the lower occupancy rate compared to historic levels, the Company continues to sign new leases at rental rates that have reflected consistent growth on an annual basis.
The total portfolio average annualized base rent per occupied square foot, including the results of Sonae Sierra Brasil, was $13.66 at December 31, 2012, as compared to $13.81 at December 31, 2011. The decrease in the average annualized base rent per square foot primarily was due to exchange rate fluctuations with the Brazilian Real, the sale of assets in Brazil and the inclusion of the BRE DDR Retail Holdings, LLC assets in 2012. Moreover, the Company has been able to achieve these results without significant capital investment in tenant improvements or leasing commissions. The weighted-average cost of tenant improvements and lease commissions estimated to be incurred for leases executed during 2012 for the U.S. portfolio was only $2.92 per rentable square foot. The Company is very conscious of and sensitive to the risks posed by the economy, but believes that the position of its portfolio and the general diversity and credit quality of its tenant base should enable it to successfully navigate through these challenging economic times.
NEW ACCOUNTING STANDARDS
New Accounting Standards are more fully described in Note 1, “Summary of Significant Accounting Policies,” of the Company’s financial statements.
FORWARD-LOOKING STATEMENTS
Management’s discussion and analysis should be read in conjunction with the consolidated financial statements and the notes thereto appearing elsewhere in this report. Historical results and percentage relationships set forth in the consolidated financial statements, including trends that might appear, should not be taken as indicative of future operations. The Company considers portions of this information to be “forward-looking statements” within the meaning of Section 27A of the Securities Act of 1933 and Section 21E of the Securities Exchange Act of 1934, both as amended, with respect to the Company’s expectations for future periods. Forward-looking statements include, without limitation, statements related to acquisitions (including any related pro forma financial information) and other business development activities, future capital expenditures, financing sources and availability and the effects of environmental and other regulations. Although the Company believes that the expectations reflected in these forward-looking statements are based upon reasonable assumptions, it can give no assurance that its expectations will be achieved. For this purpose, any statements contained herein that are not statements of historical fact should be deemed to be forward-looking statements. Without limiting the foregoing, the words “will,” “believes,” “anticipates,” “plans,” “expects,” “seeks,” “estimates” and similar expressions are intended to identify forward-looking statements. Readers should exercise caution in interpreting and relying on forward-looking statements because such statements involve known and unknown risks, uncertainties and other factors that are, in some cases, beyond the Company’s control and that could cause actual results to differ materially from those expressed or implied in the forward-looking statements and that could materially affect the Company’s actual results, performance or achievements. For additional factors that could cause the results of the Company to differ materially from those indicated in the forward looking statements, please refer to Item 1A. Risk Factors included elsewhere in this report.
83
Table of Contents
Factors that could cause actual results, performance or achievements to differ materially from those expressed or implied by forward-looking statements include, but are not limited to, the following:
| • |
The Company is subject to general risks affecting the real estate industry, including the need to enter into new leases or renew leases on favorable terms to generate rental revenues, and the economic downturn may adversely affect the ability of the Company’s tenants, or new tenants, to enter into new leases or the ability of the Company’s existing tenants to renew their leases at rates at least as favorable as their current rates; |
| • |
The Company could be adversely affected by changes in the local markets where its properties are located, as well as by adverse changes in national economic and market conditions; |
| • |
The Company may fail to anticipate the effects on its properties of changes in consumer buying practices, including sales over the Internet and the resulting retailing practices and space needs of its tenants, or a general downturn in its tenants’ businesses, which may cause tenants to close stores or default in payment of rent; |
| • |
The Company is subject to competition for tenants from other owners of retail properties, and its tenants are subject to competition from other retailers and methods of distribution. The Company is dependent upon the successful operations and financial condition of its tenants, in particular its major tenants, and could be adversely affected by the bankruptcy of those tenants; |
| • |
The Company relies on major tenants, which makes it vulnerable to changes in the business and financial condition of, or demand for its space by, such tenants; |
| • |
The Company may not realize the intended benefits of acquisition or merger transactions. The acquired assets may not perform as well as the Company anticipated, or the Company may not successfully integrate the assets and realize improvements in occupancy and operating results. The acquisition of certain assets may subject the Company to liabilities, including environmental liabilities; |
| • |
The Company may fail to identify, acquire, construct or develop additional properties that produce a desired yield on invested capital, or may fail to effectively integrate acquisitions of properties or portfolios of properties. In addition, the Company may be limited in its acquisition opportunities due to competition, the inability to obtain financing on reasonable terms or any financing at all, and other factors; |
| • |
The Company may fail to dispose of properties on favorable terms. In addition, real estate investments can be illiquid, particularly as prospective buyers may experience increased costs of financing or difficulties obtaining financing, and could limit the Company’s ability to promptly make changes to its portfolio to respond to economic and other conditions; |
| • |
The Company may abandon a development opportunity after expending resources if it determines that the development opportunity is not feasible due to a variety of factors, including a lack of availability of construction financing on reasonable terms, the impact of the economic environment on prospective tenants’ ability to enter into new leases or pay contractual rent, or the inability of the Company to obtain all necessary zoning and other required governmental permits and authorizations; |
| • |
The Company may not complete development projects on schedule as a result of various factors, many of which are beyond the Company’s control, such as weather, labor conditions, governmental approvals, material shortages or general economic downturn resulting in limited availability of capital, increased debt service expense and construction costs, and decreases in revenue; |
| • |
The Company’s financial condition may be affected by required debt service payments, the risk of default and restrictions on its ability to incur additional debt or to enter into certain transactions under its credit facilities and other documents governing its debt obligations. In addition, the Company may encounter difficulties in obtaining permanent financing or refinancing existing debt. |
84
Table of Contents
|
Borrowings under the Company’s revolving credit facilities are subject to certain representations and warranties and customary events of default, including any event that has had or could reasonably be expected to have a material adverse effect on the Company’s business or financial condition; |
| • |
Changes in interest rates could adversely affect the market price of the Company’s common shares, as well as its performance and cash flow; |
| • |
Debt and/or equity financing necessary for the Company to continue to grow and operate its business may not be available or may not be available on favorable terms; |
| • |
Disruptions in the financial markets could affect the Company’s ability to obtain financing on reasonable terms and have other adverse effects on the Company and the market price of the Company’s common shares; |
| • |
The Company is subject to complex regulations related to its status as a REIT and would be adversely affected if it failed to qualify as a REIT; |
| • |
The Company must make distributions to shareholders to continue to qualify as a REIT, and if the Company must borrow funds to make distributions, those borrowings may not be available on favorable terms or at all; |
| • |
Joint venture investments may involve risks not otherwise present for investments made solely by the Company, including the possibility that a partner or co-venturer may become bankrupt, may at any time have interests or goals different from those of the Company and may take action contrary to the Company’s instructions, requests, policies or objectives, including the Company’s policy with respect to maintaining its qualification as a REIT. In addition, a partner or co-venturer may not have access to sufficient capital to satisfy its funding obligations to the joint venture. The partner could cause a default under the joint venture loan for reasons outside the Company’s control. Furthermore, the Company could be required to reduce the carrying value of its equity method investments if a loss in the carrying value of the investment is other than temporary; |
| • |
The Company’s decision to dispose of real estate assets, including land held for development and construction in progress, would change the holding period assumption in the undiscounted cash flow impairment analyses, which could result in material impairment losses and adversely affect the Company’s financial results; |
| • |
The outcome of pending or future litigation, including litigation with tenants or joint venture partners, may adversely affect the Company’s results of operations and financial condition; |
| • |
The Company may not realize anticipated returns from its real estate assets outside the United States. The Company may continue to pursue international opportunities that may subject the Company to different or greater risks than those associated with its domestic operations. The Company owns assets in Puerto Rico, an interest in an unconsolidated joint venture that owns properties in Brazil and an interest in consolidated joint ventures that were formed to develop and own properties in Canada and Russia; |
| • |
International ownership and development activities carry risks in addition to those the Company faces with its domestic properties and operations. Although the Company’s international activities are currently a relatively small portion of its business, to the extent the Company expands its international activities, these risks could significantly increase and adversely affect its results of operations and financial condition. These risks include the following: |
| ¡ |
Adverse effects of changes in exchange rates for foreign currencies; |
| ¡ |
Changes in foreign political or economic environments; |
| ¡ |
Challenges of complying with a wide variety of foreign laws, including tax laws, and addressing different practices and customs relating to corporate governance, operations and litigation; |
85
Table of Contents
| ¡ |
Different lending practices; |
| ¡ |
Cultural and consumer differences; |
| ¡ |
Changes in applicable laws and regulations in the United States that affect foreign operations; |
| ¡ |
Difficulties in managing international operations and |
| ¡ |
Obstacles to the repatriation of earnings and cash. |
| • |
The Company is subject to potential environmental liabilities; |
| • |
The Company may incur losses that are uninsured or exceed policy coverage due to its liability for certain injuries to persons, property or the environment occurring on its properties and |
| • |
The Company could incur additional expenses to comply with or respond to claims under the Americans with Disabilities Act or otherwise be adversely affected by changes in government regulations, including changes in environmental, zoning, tax and other regulations. |
|
|
AND QUALITATIVE DISCLOSURES ABOUT MARKET RISK |
The Company’s primary market risk exposure is interest rate risk. The Company’s debt, excluding unconsolidated joint venture debt, is summarized as follows:
| December 31, 2012 | December 31, 2011 | |||||||||||||||||||||||||||||||
|
Amount
(Millions) |
Weighted-
Average Maturity (Years) |
Weighted-
Average Interest Rate |
Percentage
of Total |
Amount
(Millions) |
Weighted-
Average Maturity (Years) |
Weighted-
Average Interest Rate |
Percentage
of Total |
|||||||||||||||||||||||||
|
Fixed-Rate Debt (A) |
$ | 3,885.0 | 5.3 | 5.1 | % | 89.9 | % | $ | 3,571.2 | 4.3 | 6.1 | % | 87.0 | % | ||||||||||||||||||
|
Variable-Rate Debt (A) |
$ | 434.1 | 3.0 | 1.9 | % | 10.1 | % | $ | 533.4 | 3.6 | 2.1 | % | 13.0 | % | ||||||||||||||||||
| (A) | Adjusted to reflect the $632.8 million and $284.1 million of variable-rate debt that LIBOR was swapped to at a fixed rate of 1.3% and 2.9% at December 31, 2012 and 2011, respectively. |
The Company’s unconsolidated joint ventures’ indebtedness is summarized as follows:
| December 31, 2012 | December 31, 2011 | |||||||||||||||||||||||||||||||
|
Joint
Venture Debt (Millions) |
Company’s
Proportionate Share (Millions) |
Weighted-
Average Maturity (Years) |
Weighted-
Average Interest Rate |
Joint
Venture Debt (Millions) |
Company’s
Proportionate Share (Millions) |
Weighted-
Average Maturity (Years) |
Weighted-
Average Interest Rate |
|||||||||||||||||||||||||
|
Fixed-Rate Debt |
$ | 3,083.7 | $ | 518.6 | 4.0 | 5.3 | % | $ | 3,086.1 | $ | 646.2 | 3.6 | 5.7 | % | ||||||||||||||||||
|
Variable-Rate Debt |
$ | 1,162.7 | $ | 206.3 | 4.3 | 6.9 | % | $ | 656.1 | $ | 126.7 | 3.8 | 5.7 | % | ||||||||||||||||||
The Company intends to use retained cash flow, proceeds from asset sales, equity and debt financing and variable-rate indebtedness available under its Revolving Credit Facilities to repay indebtedness and fund capital expenditures of the Company’s shopping centers. Thus, to the extent the Company incurs additional variable-rate indebtedness, its exposure to increases in interest rates in an inflationary period could increase. The Company does not believe, however, that increases in interest expense as a result of inflation will significantly impact the Company’s distributable cash flow.
The interest rate risk on a portion of the Company’s variable-rate debt described above has been mitigated through the use of interest rate swap agreements (the “Swaps”) with major financial institutions. At December 31, 2012 and 2011, the interest rate on the Company’s $632.8 million and $284.1 million, respectively, consolidated floating rate debt was swapped to fixed rates. The Company is exposed to credit risk in the event of nonperformance by the counterparties to the Swaps. The Company believes it mitigates its credit risk by entering into Swaps with major financial institutions.
86
Table of Contents
In the second quarter of 2012, the Company entered into two treasury locks with a notional amount of $200.0 million. The treasury locks were terminated in connection with the issuance of unsecured notes in June 2012. The treasury locks were executed to hedge the benchmark interest rate associated with forecasted interest payments associated with the then anticipated issuance of fixed-rate borrowings. The effective portion of these hedging relationships has been deferred in accumulated other comprehensive loss and will be reclassified into earnings over the term of the debt as an adjustment to earnings, based on the effective-yield method.
The carrying value of the Company’s fixed-rate debt is adjusted to include the $632.8 million and $284.1 million of variable-rate debt that was swapped to a fixed rate at December 31, 2012 and 2011, respectively. The fair value of the Company’s fixed-rate debt is adjusted to (i) include the swaps reflected in the carrying value and (ii) include the Company’s proportionate share of the joint venture fixed-rate debt. An estimate of the effect of a 100 basis-point increase at December 31, 2012 and 2011, is summarized as follows (in millions):
| December 31, 2012 | December 31, 2011 | |||||||||||||||||||||||
|
Carrying
Value |
Fair Value |
100
Basis- Point Increase in Market Interest Rates |
Carrying
Value |
Fair Value |
100
Basis- Point Increase in Market Interest Rates |
|||||||||||||||||||
|
Company’s fixed-rate debt |
$ | 3,885.0 | $ | 4,311.8 | (A) | $ | 4,132.2 | (B) | $ | 3,571.2 | $ | 3,757.9 | (A) | $ | 3,690.5 | (B) | ||||||||
|
Company’s proportionate share of joint venture fixed-rate debt |
$ | 518.6 | $ | 528.1 | $ | 510.2 | $ | 646.2 | $ | 633.2 | $ | 617.0 | ||||||||||||
| (A) | Includes the fair value of interest rate swaps, which was a liability of $17.1 million and $8.8 million at December 31, 2012 and 2011, respectively. |
| (B) | Includes the fair value of interest rate swaps, which was an asset of $7.8 million at December 31, 2012, and a liability of $1.9 million at December 31, 2011. |
The sensitivity to changes in interest rates of the Company’s fixed-rate debt was determined using a valuation model based upon factors that measure the net present value of such obligations that arise from the hypothetical estimate as discussed above.
Further, a 100 basis-point increase in short-term market interest rates on variable-rate debt at December 31, 2012, would result in an increase in interest expense of approximately $4.3 million for the Company and $2.1 million representing the Company’s proportionate share of the joint ventures’ interest expense relating to variable-rate debt outstanding for the 12-month period. The estimated increase in interest expense for the year does not give effect to possible changes in the daily balance of the Company’s or joint ventures’ outstanding variable-rate debt.
The Company and its joint ventures intend to continually monitor and actively manage interest costs on their variable-rate debt portfolio and may enter into swap positions based on market fluctuations. In addition, the Company believes that it has the ability to obtain funds through additional equity and/or debt offerings and joint venture capital. Accordingly, the cost of obtaining such protection agreements in relation to the Company’s access to capital markets will continue to be evaluated. The Company has not entered, and does not plan to enter, into any derivative financial instruments for trading or speculative purposes. As of December 31, 2012, the Company had no other material exposure to market risk.
87
Table of Contents
|
|
STATEMENTS AND SUPPLEMENTARY DATA |
The response to this item is included in a separate section at the end of this Annual Report on Form 10-K beginning on page F-1 and is incorporated herein by reference thereto.
| Item 9. | CHANGES IN AND DISAGREEMENTS WITH ACCOUNTANTS ON ACCOUNTING AND FINANCIAL DISCLOSURE |
None.
|
|
AND PROCEDURES |
Disclosure Controls and Procedures
Based on their evaluation as required by Securities Exchange Act Rules 13a-15(b) and 15d-15(b), the Company’s Chief Executive Officer (“CEO”) and Chief Financial Officer (“CFO”) have concluded that the Company’s disclosure controls and procedures (as defined in Securities Exchange Act Rules 13a-15(e) and 15d-15(e)) were effective as of December 31, 2012, to ensure that information required to be disclosed by the Company in reports that it files or submits under the Securities Exchange Act is recorded, processed, summarized and reported within the time periods specified in Securities and Exchange Commission rules and forms and were effective as of December 31, 2012, to ensure that information required to be disclosed by the Company issuer in the reports that it files or submits under the Securities Exchange Act is accumulated and communicated to the Company’s management, including its CEO and CFO, or persons performing similar functions, as appropriate to allow timely decisions regarding required disclosure.
Management’s Report on Internal Control Over Financial Reporting
The Company’s management is responsible for establishing and maintaining adequate internal control over financial reporting as defined in Securities Exchange Act Rule 13a-15(f) or 15d-15(f). Because of its inherent limitations, internal control over financial reporting may not prevent or detect misstatements. Also, projections of any evaluation of effectiveness to future periods are subject to the risk that controls may become inadequate because of changes in conditions, or that the degree of compliance with the policies or procedures may deteriorate. Management assessed the effectiveness of its internal control over financial reporting based on the criteria set forth by the Committee of Sponsoring Organizations of the Treadway Commission (COSO) in Internal Control—Integrated Framework. Based on those criteria, management concluded that the Company’s internal control over financial reporting was effective as of December 31, 2012.
The effectiveness of the Company’s internal control over financial reporting as of December 31, 2012, has been audited by PricewaterhouseCoopers LLP, an independent registered public accounting firm as stated in their report which appears herein and is incorporated in this Item 9A. by reference thereto.
Changes in Internal Control over Financial Reporting
During the three-month period ended December 31, 2012, there were no changes in the Company’s internal control over financial reporting that materially affected or are reasonably likely to materially affect the Company’s internal control over financial reporting.
|
|
INFORMATION |
None.
88
Table of Contents
The Company’s Board of Directors has adopted the following corporate governance documents:
| • |
Corporate Governance Guidelines that guide the Board of Directors in the performance of its responsibilities to serve the best interests of the Company and its shareholders; |
| • |
Written charters of the Audit Committee, Executive Compensation Committee and Nominating and Corporate Governance Committee; |
| • |
Code of Ethics for Senior Financial Officers that applies to the Company’s senior financial officers, including the chief executive officer, chief financial officer, chief accounting officer, controllers, treasurer and chief internal auditor, if any, of the Company (amendments to, or waivers from, the Code of Ethics for Senior Financial Officers will be disclosed on the Company’s website) and |
| • |
Code of Business Conduct and Ethics that governs the actions and working relationships of the Company’s employees, officers and directors with current and potential customers, consumers, fellow employees, competitors, government and self-regulatory agencies, investors, the public, the media and anyone else with whom the Company has or may have contact. |
Copies of the Company’s corporate governance documents are available on the Company’s website, www.ddr.com, under “Investor Relations—Corporate Governance.”
Certain other information required by this Item 10 is incorporated herein by reference to the information under the headings “Proposal One: Election of Directors—Nominees for Director” and “—Corporate Governance” and “Section 16(a) Beneficial Ownership Reporting Compliance,” contained in the Company’s Proxy Statement for the Company’s 2013 annual meeting of shareholders to be filed with the Securities and Exchange Commission pursuant to Regulation 14A (“2013 Proxy Statement”), and the information under the heading “Executive Officers” in Part I of this Annual Report on Form 10-K.
Information required by this Item 11 is incorporated herein by reference to the information under the headings “Proposal One: Election of Directors—Compensation of Directors” and “Executive Compensation” contained in the Company’s 2013 Proxy Statement.
89
Table of Contents
| Item 12. | SECURITY OWNERSHIP OF CERTAIN BENEFICIAL OWNERS AND MANAGEMENT AND RELATED STOCKHOLDER MATTERS |
Certain information required by this Item 12 is incorporated herein by reference to the “Security Ownership of Certain Beneficial Owners and Management” section of the Company’s 2013 Proxy Statement. The following table sets forth the number of securities issued and outstanding under the existing plans, as of December 31, 2012, as well as the weighted-average exercise price of outstanding options.
EQUITY COMPENSATION PLAN INFORMATION
| (a) | (b) | (c) | ||||||||||
|
Plan category |
Number of
Securities to Be Issued upon Exercise of Outstanding Options, Warrants and Rights |
Weighted-Average
Exercise Price of Outstanding Options, Warrants and Rights |
Number of Securities
Remaining Available for Future Issuance Under Equity Compensation Plans (excluding securities reflected in column (a)) |
|||||||||
|
Equity compensation plans approved by security holders (1) |
2,596,434 | (2) | $ | 25.70 | 8,908,606 | |||||||
|
Equity compensation plans not approved by security holders |
— | — | N/A | |||||||||
|
|
|
|
|
|
|
|||||||
|
Total |
2,596,434 | $ | 25.70 | 8,908,606 | ||||||||
| (1) | Includes the Company’s 1998 Equity-Based Award Plan, 2002 Equity-Based Award Plan, 2004 Equity-Based Award Plan, 2008 Equity-Based Award Plan and 2012 Equity-Based Award Plan. |
| (2) | Does not include 2,416,315 shares of restricted stock, as these shares have been reflected in the Company’s total shares outstanding. |
| Item 13. | CERTAIN RELATIONSHIPS AND RELATED TRANSACTIONS, AND DIRECTOR INDEPENDENCE |
Information required by this Item 13 is incorporated herein by reference to the “Corporate Governance—Independent Directors” and “Certain Transactions” sections of the Company’s 2013 Proxy Statement.
Incorporated herein by reference to the “Fees Paid to PricewaterhouseCoopers LLP” section of the Company’s 2013 Proxy Statement.
90
Table of Contents
| Item 15. | EXHIBITS AND FINANCIAL STATEMENT SCHEDULES |
| a) | 1. Financial Statements |
The following documents are filed as a part of this report:
Report of Independent Register Public Accounting Firm.
Consolidated Balance Sheets at December 31, 2012 and 2011.
Consolidated Statements of Operations for the three years ended December 31, 2012.
Consolidated Statements of Comprehensive Loss for the three years ended December 31, 2012.
Consolidated Statements of Equity for the three years ended December 31, 2012.
Consolidated Statements of Cash Flows for the three years ended December 31, 2012.
Notes to the Consolidated Financial Statements.
| 2. | Financial Statement Schedules |
The following financial statement schedules are filed herewith as part of this Annual Report on Form 10-K and should be read in conjunction with the Consolidated Financial Statements of the registrant:
Schedule
II — Valuation and Qualifying Accounts and Reserves for the three years ended December 31, 2012.
III — Real Estate and Accumulated Depreciation at December 31, 2012.
IV — Mortgage Loans on Real Estate at December 31, 2012.
Schedules not listed above have been omitted because they are not applicable or because the information required to be set forth therein is included in the Consolidated Financial Statements or notes thereto.
Financial statements of the Company’s unconsolidated joint venture companies, except for Sonae Sierra Brasil BV Sarl and DDRM Properties LLC, have been omitted because they do not meet the significant subsidiary definition of S-X 210.1-02(w).
| b) | Exhibits — The following exhibits are filed as part of, or incorporated by reference into, this report: |
|
Exhibit
|
Form
|
Description |
Filed Herewith or
|
|||
| 3 | 3.1 | Second Amended and Restated Articles of Incorporation of the Company, as amended effective July 31, 2012 | Quarterly Report on Form 10-Q (Filed with the SEC on August 9, 2012; File No. 001-11690) | |||
| 3 | 3.2 | Amended and Restated Code of Regulations of the Company | Quarterly Report on Form 10-Q (Filed with the SEC on May 11, 2009; File No. 001-11690) | |||
| 4 | 4.1 | Specimen Certificate for Common Shares | Annual Report on Form 10-K (Filed with the SEC on February 28, 2012; File No. 001-11690) | |||
91
Table of Contents
|
Exhibit No. Under Reg. S-K Item 601 |
Form 10-K Exhibit No. |
Description |
Filed Herewith or Incorporated Herein by Reference |
|||
| 4 | 4.2 | Specimen Certificate for 7 3/8% Class H Cumulative Redeemable Preferred Shares | Annual Report on Form 10-K (Filed with the SEC on February 26, 2010; File No. 001-11690) | |||
| 4 | 4.3 | Deposit Agreement, dated as of October 26, 2009, by and between the Company and Mellon Investor Services LLC Relating to Depositary Shares Representing 7 3/8% Class H Cumulative Redeemable Preferred Shares (including Specimen Certificate for Depositary Shares) | Annual Report on Form 10-K (Filed with the SEC on February 26, 2010; File No. 001-11690) | |||
| 4 | 4.4 | Specimen Certificate for 6.50% Class J Cumulative Redeemable Preferred Shares | Registration Statement on Form 8-A (Filed with the SEC August 1, 2012; File No. 001-11690) | |||
| 4 | 4.5 | Deposit Agreement, dated as of August 1, 2012, among the Company and Computershare Shareowner Services LLC, as Depositary, and all holders from time to time of depositary shares relating to the Depositary Shares Representing 6.50% Class J Cumulative Redeemable Preferred Shares (including Specimen Certificate for Depositary Shares) | Current Report on Form 8-K (Filed with the SEC on August 1, 2012; File No. 001-11690) | |||
| 4 | 4.6 | Indenture, dated as of May 1, 1994, by and between the Company and The Bank of New York (as successor to JP Morgan Chase Bank, N.A., successor to Chemical Bank), as Trustee | Form S-3 Registration No. 333-108361 (Filed with the SEC on August 29, 2003) | |||
| 4 | 4.7 | Indenture, dated as of May 1, 1994, by and between the Company and U.S. Bank National Association (as successor to U.S. Bank Trust National Association (as successor to National City Bank)), as Trustee | Form S-3 Registration No. 333-108361 (Filed with the SEC on August 29, 2003) | |||
| 4 | 4.8 | First Supplemental Indenture, dated as of May 10, 1995, by and between the Company and U.S. Bank National Association (as successor to U.S. Bank Trust National Association (successor to National City Bank)), as Trustee | Form S-3 Registration No. 333-108361 (Filed with the SEC on August 29, 2003) | |||
| 4 | 4.9 | Second Supplemental Indenture, dated as of July 18, 2003, by and between the Company and U.S. Bank National Association (as successor to U.S. Bank Trust National Association (successor to National City Bank)), as Trustee | Form S-3 Registration No. 333-108361 (Filed with the SEC on August 29, 2003) | |||
92
Table of Contents
|
Exhibit No. Under Reg. S-K Item 601 |
Form 10-K Exhibit No. |
Description |
Filed Herewith or Incorporated Herein by Reference |
|||
| 4 | 4.10 | Third Supplemental Indenture, dated as of January 23, 2004, by and between the Company and U.S. Bank National Association (as successor to U.S. Bank Trust National Association (successor to National City Bank)), as Trustee | Form S-4 Registration No. 333-117034 (Filed with the SEC on June 30, 2004) | |||
| 4 | 4.11 | Fourth Supplemental Indenture, dated as of April 22, 2004, by and between the Company and U.S. Bank National Association (as successor to U.S. Bank Trust National Association (successor to National City Bank)), as Trustee | Form S-4 Registration No. 333-117034 (Filed with the SEC on June 30, 2004) | |||
| 4 | 4.12 | Fifth Supplemental Indenture, dated as of April 28, 2005, by and between the Company and U.S. Bank National Association (as successor to U.S. Bank Trust National Association (successor to National City Bank)), as Trustee | Annual Report on Form 10-K (Filed with the SEC on February 21, 2007; File No. 001-11690) | |||
| 4 | 4.13 | Sixth Supplemental Indenture, dated as of October 7, 2005, by and between the Company and U.S. Bank National Association (as successor to U.S. Bank Trust National Association (successor to National City Bank)), as Trustee | Annual Report on Form 10-K (Filed with the SEC on February 21, 2007; File No. 001-11690) | |||
| 4 | 4.14 | Seventh Supplemental Indenture, dated as of August 28, 2006, by and between the Company and U.S. Bank National Association (as successor to U.S. Bank Trust National Association (successor to National City Bank)), as Trustee | Current Report on Form 8-K (Filed with the SEC on September 1, 2006; File No. 001-11690) | |||
| 4 | 4.15 | Eighth Supplemental Indenture, dated as of March 13, 2007, by and between the Company and U.S. Bank National Association (as successor to U.S. Bank Trust National Association (successor to National City Bank)), as Trustee | Current Report on Form 8-K (Filed with the SEC on March 16, 2007; File No. 001-11690) | |||
| 4 | 4.16 | Ninth Supplemental Indenture, dated as of September 30, 2009, by and between the Company and U.S. Bank National, Association (as successor to U.S. Bank Trust National Association (successor to National City Bank)), as Trustee | Form S-3 Registration No. 333-162451 (Filed on October 13, 2009) | |||
93
Table of Contents
|
Exhibit
No.Under
|
Form
|
Description |
Filed Herewith or
|
|||
| 4 | 4.17 | Tenth Supplemental Indenture, dated as of March 19, 2010, by and between the Company and U.S. Bank National, Association (as successor to U.S. Bank Trust National Association (successor to National City Bank)), as Trustee | Quarterly Report on Form 10-Q (Filed with the SEC on May 7, 2010; File No. 001-11690) | |||
| 4 | 4.18 | Eleventh Supplemental Indenture, dated as of August 12, 2010, by and between the Company and U.S. Bank National, Association (as successor to U.S. Bank Trust National Association (successor to National City Bank)), as Trustee | Quarterly Report on Form 10-Q (Filed with the SEC on November 11, 2010; File No. 001-11690) | |||
| 4 | 4.19 | Twelfth Supplemental Indenture, dated as of November 5, 2010, by and between the Company and U.S. Bank National, Association (as successor to U.S. Bank Trust National Association (successor to National City Bank)), as Trustee | Annual Report on Form 10-K (Filed with the SEC on February 28, 2011; File No. 001-11690) | |||
| 4 | 4.20 | Thirteenth Supplemental Indenture, dated as of March 7, 2011, by and between the Company and U.S. Bank National Association (as successor to U.S. Bank Trust National Association (successor to National City Bank)), as Trustee | Quarterly Report on Form 10-Q (Filed with the SEC on May 9, 2011; File No. 001-11690) | |||
| 4 | 4.21 | Fourteenth Supplemental Indenture, dated as of June 22, 2012, by and between the Company and U.S. Bank National Association (as successor to U.S. Bank Trust National Association (successor to National City Bank)), as Trustee | Form S-3 Registration No. 333-184221 (Filed with the SEC on October 1, 2012) | |||
| 4 | 4.22 | Fifteenth Supplemental Indenture, dated as of November 27, 2012, by and between the Company and U.S. Bank National Association (as successor to U.S. Bank Trust National Association (successor to National City Bank)), as Trustee | Filed herewith | |||
| 4 | 4.23 | Form of Fixed Rate Senior Medium-Term Note | Annual Report on Form 10-K (Filed with the SEC on March 30, 2000; File No. 001-11690) | |||
| 4 | 4.24 | Form of Fixed Rate Subordinated Medium-Term Note | Annual Report on Form 10-K (Filed with the SEC on March 30, 2000; File No. 001-11690) | |||
94
Table of Contents
|
Exhibit
|
Form
|
Description |
Filed Herewith or
|
|||
| 4 | 4.25 | Form of Floating Rate Subordinated Medium-Term Note | Annual Report on Form 10-K (Filed with the SEC on March 30, 2000; File No. 001-11690) | |||
| 4 | 4.26 | Eighth Amended and Restated Credit Agreement, dated as of October 20, 2010, by and among the Company, DDR PR Ventures LLC, S.E., the lenders party thereto and JPMorgan Chase Bank, N.A., as Administrative Agent | Current Report on Form 8-K (Filed with the SEC on October 21, 2010; File No. 001-11690) | |||
| 4 | 4.27 | Amendment No. 1 to the Eighth Amended and Restated Credit Agreement, dated June 28, 2011, by and among the Company, DDR PR Ventures LLC, S.E., the lenders party thereto, and JPMorgan Chase Bank, N.A., as Administrative Agent | Current Report on Form 8-K (Filed with the SEC on July 1, 2011; File No. 001-11690) | |||
| 4 | 4.28 | Amendment No. 2 to the Eight Amended and Restated Credit Agreement, dated January 17, 2013, by and among the Company, DDR PR Ventures LLC, S.E., the lenders party thereto, and JPMorgan Chase Bank, N.A., as Administrative Agent | Current Report on Form 8-K (Filed with the SEC on January 18, 2013; File No. 001-11690) | |||
| 4 | 4.29 | Second Amended and Restated Secured Term Loan Agreement, dated June 28, 2011, by and among the Company, DDR PR Ventures LLC, S.E., KeyBank National Association, as Administrative Agent, and the other several banks, financial institutions and other entities from time to time parties to such loan agreement | Current Report on 8-K (Filed with the SEC on July 1, 2011; File No. 001-11690) | |||
| 4 | 4.30 | First Amendment to the Second Amended and Restated Secured Term Loan Agreement, dated January 17, 2013, by and among the Company, DDR PR Ventures LLC, S.E., KeyBank National Association, as Administrative Agent, and the other several banks, financial institutions and other entities from time to time parties to such loan agreement | Current Report on Form 8-K (Filed with the SEC on January 18, 2013; File No. 001-11690) | |||
| 4 | 4.31 | Registration Rights Agreement, dated March 3, 2007, by and among the Company and the Initial Purchasers named therein | Current Report on Form 8-K (Filed with the SEC on March 16, 2007; File No. 001-11690) | |||
| 10 | 10.1 | Directors’ Deferred Compensation Plan (Amended and Restated as of November 8, 2000)* | Form S-8 Registration No. 333-147270 (Filed with the SEC on November 9, 2007) | |||
95
Table of Contents
|
Exhibit
|
Form
|
Description |
Filed Herewith or
|
|||
| 10 | 10.2 | DDR Corp. 2005 Directors’ Deferred Compensation Plan (January 1, 2012 Restatement)* | Annual Report on Form 10-K (Filed with the SEC on February 28, 2012; File No. 001-11690) | |||
| 10 | 10.3 | First Amendment to the DDR Corp. 2005 Directors’ Deferred Compensation Plan (effective November 30, 2012)* | Filed herewith. | |||
| 10 | 10.4 | Elective Deferred Compensation Plan (Amended and Restated as of January 1, 2004)* | Annual Report on Form 10-K (Filed with the SEC on March 15, 2004; File No. 001-11690) | |||
| 10 | 10.5 | Developers Diversified Realty Corporation Equity Deferred Compensation Plan, restated as of January 1, 2009* | Annual Report on Form 10-K (Filed with the SEC on February 27, 2009; File No. 001-11690) | |||
| 10 | 10.6 | Amended and Restated 2002 Developers Diversified Realty Corporation Equity-Based Award Plan (Amended and Restated as of December 31, 2009)* | Annual Report on Form 10-K (Filed with the SEC on February 26, 2010; File No. 001-11690) | |||
| 10 | 10.7 | Amended and Restated 2004 Developers Diversified Realty Corporation Equity-Based Award Plan (Amended and Restated as of December 31, 2009)* | Annual Report on Form 10-K (Filed with the SEC on February 26, 2010; File No. 001-11690) | |||
| 10 | 10.8 | Amended and Restated 2008 Developers Diversified Realty Corporation Equity-Based Award Plan (Amended and Restated as of June 25, 2009)* | Quarterly Report on Form 10-Q (Filed with the SEC August 7, 2009; File No. 001-11690) | |||
| 10 | 10.9 | 2012 Equity and Incentive Compensation Plan* | From S-8 Registration No. 333-181422 (Filed with the SEC on May 15, 2012) | |||
| 10 | 10.10 | Form of Restricted Share Agreement for Executive Officers under the 2004 Developers Diversified Realty Corporation Equity-Based Award Plan* | Quarterly Report on Form 10-Q (Filed with the SEC on November 9, 2006; File No. 001-11690) | |||
| 10 | 10.11 | Form Restricted Shares Agreement* | Quarterly Report on Form 10-Q (Filed with the SEC August 7, 2009; File No. 001-11690) | |||
| 10 | 10.12 | Form Restricted Shares Agreement* | Quarterly Report on Form 10-Q (Filed with the SEC May 9, 2012; File No. 001-11690) | |||
| 10 | 10.13 | Form of Incentive Stock Option Grant Agreement for Executive Officers under the 2004 Developers Diversified Realty Corporation Equity-Based Award Plan* | Quarterly Report on Form 10-Q (Filed with the SEC on November 9, 2006; File No. 001-11690) | |||
96
Table of Contents
|
Exhibit
|
Form
|
Description |
Filed Herewith or
|
|||
| 10 | 10.14 | Form of Incentive Stock Option Grant Agreement for Executive Officers (with accelerated vesting upon retirement) under the 2004 Developers Diversified Realty Corporation Equity-Based Award Plan* | Quarterly Report on Form 10-Q (Filed with the SEC on November 9, 2006; File No. 001-11690) | |||
| 10 | 10.15 | Form of Non-Qualified Stock Option Grant Agreement for Executive Officers under the 2004 Developers Diversified Realty Corporation Equity-Based Award Plan* | Quarterly Report on Form 10-Q (Filed with the SEC on November 9, 2006; File No. 001-11690) | |||
| 10 | 10.16 | Form of Non-Qualified Stock Option Grant Agreement for Executive Officers (with accelerated vesting upon retirement) under the 2004 Developers Diversified Realty Corporation Equity-Based Award Plan* | Quarterly Report on Form 10-Q (Filed with the SEC on November 9, 2006; File No. 001-11690) | |||
| 10 | 10.17 | Form Stock Option Agreement for Incentive Stock Options Grants to Executive Officers* | Quarterly Report on Form 10-Q (Filed with the SEC August 7, 2009; File No. 001-11690) | |||
| 10 | 10.18 | Form Stock Option Agreement for Non-Qualified Stock Option Grants to Executive Officers* | Quarterly Report on Form 10-Q (Filed with the SEC August 7, 2009; File No. 001-11690) | |||
| 10 | 10.19 | Form Non-Qualified Stock Option Agreement* | Quarterly Report on Form 10-Q (Filed with the SEC May 9, 2012; File No. 001-11690) | |||
| 10 | 10.20 | Form of Incentive Stock Option Agreement* | Quarterly Report on Form 10-Q (Filed with the SEC May 9, 2012; File No. 001-11690) | |||
| 10 | 10.21 | Promotion Grant Agreement, dated January 1, 2010, by and between the Company and Daniel B. Hurwitz* | Quarterly Report on Form 10-Q (Filed with the SEC on May 7, 2010; File No. 001-11690) | |||
| 10 | 10.22 | Developers Diversified Realty Corporation Value Sharing Equity Program* | Quarterly Report on Form 10-Q (Filed with the SEC on November 6, 2009; File No. 001-11690) | |||
| 10 | 10.23 | Value Sharing Equity Program Award Shares Agreement* | Filed herewith | |||
| 10 | 10.24 | 2013 Value Sharing Equity Program* | Filed herewith | |||
| 10 | 10.25 | Amended and Restated Employment Agreement, dated July 29, 2009, by and between the Company and Daniel B. Hurwitz* | Quarterly Report on Form 10-Q (Filed with the SEC on November 6, 2009; File No. 001-11690) | |||
| 10 | 10.26 | First Amendment to the Amended and Restated Employment Agreement, dated December 31, 2012, by and between the Company and Daniel B. Hurwitz* | Current Report on Form 8-K (Filed with the SEC on January 2, 2013; File No. 001-11690) | |||
97
Table of Contents
|
Exhibit
|
Form
|
Description |
Filed Herewith or
|
|||
| 10 | 10.27 | Release Agreement, dated as of April 11, 2011, by and between the Company and Scott A. Wolstein* | Quarterly Report on Form 10-Q (Filed with the SEC on November 8, 2011; File No. 001-11690) | |||
| 10 | 10.28 | Employment Agreement, dated April 12, 2011, by and between the Company and David J. Oakes* | Quarterly Report on Form 10-Q (Filed with the SEC on November 8, 2011; File No. 001-11690) | |||
| 10 | 10.29 | First Amendment to the Employment Agreement, dated December 31, 2012, by and between the Company and David J. Oakes* | Current Report on Form 8-K (Filed with the SEC on January 2, 2013; File No. 001-11690) | |||
| 10 | 10.30 | Employment Agreement, dated April 12, 2011, by and between the Company and Paul W. Freddo* | Quarterly Report on Form 10-Q (Filed with the SEC on November 8, 2011; File No. 001-11690) | |||
| 10 | 10.31 | First Amendment to the Employment Agreement, dated December 31, 2012, by and between the Company and Paul W. Freddo* | Current Report on Form 8-K (Filed with the SEC on January 2, 2013; File No. 001-11690) | |||
| 10 | 10.32 | Employment Agreement, dated April 12, 2011, by and between the Company and John S. Kokinchak* | Quarterly Report on Form 10-Q (Filed with the SEC on November 8, 2011; File No. 001-11690) | |||
| 10 | 10.33 | Employment Agreement, dated April 12, 2011, by and between the Company and Christa A. Vesy* | Quarterly Report on Form 10-Q (Filed with the SEC on November 8, 2011; File No. 001-11690) | |||
| 10 | 10.34 | Employment Agreement, dated February 29, 2012, by and between the Company and Christa A. Vesy* | Quarterly Report on Form 10-Q (Filed with the SEC on May 9, 2012; File No. 001-11690) | |||
| 10 | 10.35 | Form of Change in Control Agreement, entered into with certain officers of the Company* | Annual Report on Form 10-K (Filed with the SEC on February 27, 2009; File No. 001-11690) | |||
| 10 | 10.36 | Form of Director and Officer Indemnification Agreement* | Quarterly Report on Form 10-Q (Filed with the SEC on November 8, 2011; File No. 001-11690) | |||
| 10 | 10.37 | Form of Medium-Term Note Distribution Agreement | Annual Report on Form 10-K (Filed with the SEC on March 30, 2000; File No. 001-11690) | |||
| 10 | 10.38 | Program Agreement for Retail Value Investment Program, dated February 11, 1998, by and among Retail Value Management, Ltd., the Company and The Prudential Insurance Company of America | Annual Report on Form 10-K (Filed with the SEC on March 15, 2004; File No. 001-11690) | |||
98
Table of Contents
|
Exhibit
|
Form
|
Description |
Filed Herewith or
|
|||
| 10 | 10.39 | Investors’ Rights Agreement, dated as of May 11, 2009, by and between the Company and Alexander Otto | Current Report on Form 8-K (Filed with the SEC on May 11, 2009; File No. 001-11690) | |||
| 10 | 10.40 | Waiver Agreement, dated as of May 11, 2009, by and between the Company and Alexander Otto | Current Report on Form 8-K (Filed with the SEC on May 11, 2009; File No. 001-11690) | |||
| 21 | 21.1 | List of Subsidiaries | Filed herewith | |||
| 23 | 23.1 | Consent of PricewaterhouseCoopers LLP | Filed herewith | |||
| 31 | 31.1 | Certification of principal executive officer pursuant to Rule 13a-14(a) of the Securities Exchange Act of 1934 | Filed herewith | |||
| 31 | 31.2 | Certification of principal financial officer pursuant to Rule 13a-14(a) of the Securities Exchange Act of 1934 | Filed herewith | |||
| 32 | 32.1 | Certification of chief executive officer pursuant to Rule 13a-14(b) of the Securities Exchange Act of 1934 and 18 U.S.C. Section 1350 | Filed herewith | |||
| 32 | 32.2 | Certification of chief financial officer pursuant to Rule 13a-14(b) of the Securities Exchange Act of 1934 and 18 U.S.C. Section 1350 | Filed herewith | |||
| 101 | 101.INS | XBRL Instance Document | Submitted electronically herewith | |||
| 101 | 101.SCH | XBRL Taxonomy Extension Schema Document | Submitted electronically herewith | |||
| 101 | 101.CAL | XBRL Taxonomy Extension Calculation Linkbase Document | Submitted electronically herewith | |||
| 101 | 101.DEF | XBRL Taxonomy Extension Definition Linkbase Document | Submitted electronically herewith | |||
| 101 | 101.LAB | XBRL Taxonomy Extension Label Linkbase Document | Submitted electronically herewith | |||
| 101 | 101.PRE | XBRL Taxonomy Extension Presentation Linkbase Document | Submitted electronically herewith | |||
| * | Management contracts and compensatory plans or arrangements required to be filed as an exhibit pursuant to Item 15(b) of Form 10-K. |
99
Table of Contents
DDR Corp.
INDEX TO FINANCIAL STATEMENTS
All other schedules are omitted because they are not applicable or the required information is shown in the consolidated financial statements or notes thereto.
Financial statements of the Company’s unconsolidated joint venture companies, except for Sonae Sierra Brasil BV Sarl and DDRM Properties LLC, have been omitted because they do not meet the significant subsidiary definition of S-X 210.1-02(w).
F-1
Table of Contents
REPORT OF INDEPENDENT REGISTERED PUBLIC ACCOUNTING FIRM
To the Board of Directors and Shareholders of DDR Corp.:
In our opinion, the consolidated financial statements listed in the index appearing under Item 15(a)(1) present fairly, in all material respects, the financial position of DDR Corp. and its subsidiaries (the “Company”) at December 31, 2012 and 2011, and the results of their operations and their cash flows for each of the three years in the period ended December 31, 2012 in conformity with accounting principles generally accepted in the United States of America. In addition, in our opinion, the financial statement schedules listed in the index appearing under Item 15(a)(2) present fairly, in all material respects, the information set forth therein when read in conjunction with the related consolidated financial statements. Also in our opinion, the Company maintained, in all material respects, effective internal control over financial reporting as of December 31, 2012 based on criteria established in Internal Control—Integrated Framework issued by the Committee of Sponsoring Organizations of the Treadway Commission (COSO). The Company’s management is responsible for these financial statements and financial statement schedules, for maintaining effective internal control over financial reporting and for its assessment of the effectiveness of internal control over financial reporting, included in “Management’s Report on Internal Control over Financial Reporting” appearing under Item 9A. Our responsibility is to express opinions on these financial statements, on the financial statement schedules, and on the Company’s internal control over financial reporting based on our integrated audits. We conducted our audits in accordance with the standards of the Public Company Accounting Oversight Board (United States). Those standards require that we plan and perform the audits to obtain reasonable assurance about whether the financial statements are free of material misstatement and whether effective internal control over financial reporting was maintained in all material respects. Our audits of the financial statements included examining, on a test basis, evidence supporting the amounts and disclosures in the financial statements, assessing the accounting principles used and significant estimates made by management, and evaluating the overall financial statement presentation. Our audit of internal control over financial reporting included obtaining an understanding of internal control over financial reporting, assessing the risk that a material weakness exists, and testing and evaluating the design and operating effectiveness of internal control based on the assessed risk. Our audits also included performing such other procedures as we considered necessary in the circumstances. We believe that our audits provide a reasonable basis for our opinions.
A company’s internal control over financial reporting is a process designed to provide reasonable assurance regarding the reliability of financial reporting and the preparation of financial statements for external purposes in accordance with generally accepted accounting principles. A company’s internal control over financial reporting includes those policies and procedures that (i) pertain to the maintenance of records that, in reasonable detail, accurately and fairly reflect the transactions and dispositions of the assets of the company; (ii) provide reasonable assurance that transactions are recorded as necessary to permit preparation of financial statements in accordance with generally accepted accounting principles, and that receipts and expenditures of the company are being made only in accordance with authorizations of management and directors of the company; and (iii) provide reasonable assurance regarding prevention or timely detection of unauthorized acquisition, use, or disposition of the company’s assets that could have a material effect on the financial statements.
Because of its inherent limitations, internal control over financial reporting may not prevent or detect misstatements. Also, projections of any evaluation of effectiveness to future periods are subject to the risk that controls may become inadequate because of changes in conditions, or that the degree of compliance with the policies or procedures may deteriorate.
/s/ PricewaterhouseCoopers LLP
Cleveland, Ohio
March 1, 2013
F-2
Table of Contents
(In thousands, except share amounts)
| December 31, | ||||||||
| 2012 | 2011 | |||||||
|
Assets |
||||||||
|
Land |
$ | 1,900,401 | $ | 1,844,125 | ||||
|
Buildings |
5,773,961 | 5,461,122 | ||||||
|
Fixtures and tenant improvements |
489,626 | 379,965 | ||||||
|
|
|
|
|
|||||
| 8,163,988 | 7,685,212 | |||||||
|
Less: Accumulated depreciation |
(1,670,717 | ) | (1,550,066 | ) | ||||
|
|
|
|
|
|||||
| 6,493,271 | 6,135,146 | |||||||
|
Land held for development and construction in progress |
475,123 | 581,627 | ||||||
|
Real estate held for sale, net |
— | 2,290 | ||||||
|
|
|
|
|
|||||
|
Total real estate assets, net |
6,968,394 | 6,719,063 | ||||||
|
Investments in and advances to joint ventures |
613,017 | 353,907 | ||||||
|
Cash and cash equivalents |
31,174 | 41,206 | ||||||
|
Restricted cash |
23,658 | 30,983 | ||||||
|
Accounts receivable, net |
126,228 | 117,463 | ||||||
|
Notes receivable, net |
68,718 | 93,905 | ||||||
|
Deferred charges, less accumulated amortization of $31,071 and $27,848, respectively |
42,498 | 45,272 | ||||||
|
Other assets, net |
182,150 | 67,626 | ||||||
|
|
|
|
|
|||||
| $ | 8,055,837 | $ | 7,469,425 | |||||
|
|
|
|
|
|||||
|
Liabilities and Equity |
||||||||
|
Unsecured indebtedness: |
||||||||
|
Senior notes |
$ | 2,147,097 | $ | 2,139,718 | ||||
|
Unsecured term loan |
350,000 | — | ||||||
|
Revolving credit facilities |
147,905 | 142,421 | ||||||
|
|
|
|
|
|||||
| 2,645,002 | 2,282,139 | |||||||
|
Secured indebtedness: |
||||||||
|
Secured term loan |
400,000 | 500,000 | ||||||
|
Mortgage and other secured indebtedness |
1,274,141 | 1,322,445 | ||||||
|
|
|
|
|
|||||
| 1,674,141 | 1,822,445 | |||||||
|
|
|
|
|
|||||
|
Total indebtedness |
4,319,143 | 4,104,584 | ||||||
|
Accounts payable and other liabilities |
326,024 | 257,821 | ||||||
|
Dividends payable |
44,210 | 29,128 | ||||||
|
|
|
|
|
|||||
| 4,689,377 | 4,391,533 | |||||||
|
|
|
|
|
|||||
|
Commitments and contingencies (Note 9) |
||||||||
|
DDR Equity |
||||||||
|
Preferred shares (Note 10) |
405,000 | 375,000 | ||||||
|
Common shares, with par value, $0.10 stated value; 500,000,000 shares authorized; 315,239,299 and 277,114,784 shares issued at December 31, 2012 and 2011, respectively |
31,524 | 27,711 | ||||||
|
Paid-in capital |
4,629,257 | 4,138,812 | ||||||
|
Accumulated distributions in excess of net income |
(1,694,822 | ) | (1,493,353 | ) | ||||
|
Deferred compensation obligation |
15,556 | 13,934 | ||||||
|
Accumulated other comprehensive loss |
(27,925 | ) | (1,403 | ) | ||||
|
Less: Common shares in treasury at cost: 977,673 and 833,934 shares at December 31, 2012 and 2011, respectively |
(16,452 | ) | (15,017 | ) | ||||
|
|
|
|
|
|||||
|
Total DDR shareholders’ equity |
3,342,138 | 3,045,684 | ||||||
|
Non-controlling interests |
24,322 | 32,208 | ||||||
|
|
|
|
|
|||||
|
Total equity |
3,366,460 | 3,077,892 | ||||||
|
|
|
|
|
|||||
| $ | 8,055,837 | $ | 7,469,425 | |||||
|
|
|
|
|
|||||
The accompanying notes are an integral part of these consolidated financial statements.
F-3
Table of Contents
(In thousands, except per share amounts)
| For the Year Ended December 31, | ||||||||||||
| 2012 | 2011 | 2010 | ||||||||||
|
Revenues from operations: |
||||||||||||
|
Minimum rents |
$ | 542,900 | $ | 498,079 | $ | 490,058 | ||||||
|
Percentage and overage rents |
5,117 | 6,057 | 5,435 | |||||||||
|
Recoveries from tenants |
174,097 | 163,123 | 162,046 | |||||||||
|
Fee and other income |
78,261 | 82,570 | 84,393 | |||||||||
|
|
|
|
|
|
|
|||||||
| 800,375 | 749,829 | 741,932 | ||||||||||
|
|
|
|
|
|
|
|||||||
|
Rental operation expenses: |
||||||||||||
|
Operating and maintenance |
128,821 | 128,873 | 123,201 | |||||||||
|
Real estate taxes |
104,256 | 97,382 | 98,845 | |||||||||
|
Impairment charges |
105,395 | 67,912 | 84,855 | |||||||||
|
General and administrative |
76,444 | 85,221 | 85,573 | |||||||||
|
Depreciation and amortization |
248,781 | 215,928 | 202,981 | |||||||||
|
|
|
|
|
|
|
|||||||
| 663,697 | 595,316 | 595,455 | ||||||||||
|
|
|
|
|
|
|
|||||||
|
Other income (expense): |
||||||||||||
|
Interest income |
15,799 | 9,832 | 7,302 | |||||||||
|
Interest expense |
(221,424 | ) | (224,024 | ) | (209,643 | ) | ||||||
|
(Loss) gain on debt retirement, net |
(13,495 | ) | (89 | ) | 485 | |||||||
|
Gain (loss) on equity derivative instruments |
— | 21,926 | (40,157 | ) | ||||||||
|
Other income (expense), net |
(17,880 | ) | (5,002 | ) | (24,148 | ) | ||||||
|
|
|
|
|
|
|
|||||||
| (237,000 | ) | (197,357 | ) | (266,161 | ) | |||||||
|
|
|
|
|
|
|
|||||||
|
Loss before earnings from equity method investments and other items |
(100,322 | ) | (42,844 | ) | (119,684 | ) | ||||||
|
Equity in net income of joint ventures |
35,250 | 13,734 | 5,600 | |||||||||
|
Impairment of joint venture investments |
(26,671 | ) | (2,921 | ) | (227 | ) | ||||||
|
Gain on change in control and sale of interests, net |
78,127 | 25,170 | — | |||||||||
|
|
|
|
|
|
|
|||||||
|
Loss before tax expense of taxable REIT subsidiaries and state franchise and income taxes |
(13,616 | ) | (6,861 | ) | (114,311 | ) | ||||||
|
Tax expense of taxable REIT subsidiaries and state franchise and income taxes |
(1,160 | ) | (1,025 | ) | (47,942 | ) | ||||||
|
|
|
|
|
|
|
|||||||
|
Loss from continuing operations |
(14,776 | ) | (7,886 | ) | (162,253 | ) | ||||||
|
Loss from discontinued operations |
(16,416 | ) | (18,590 | ) | (86,786 | ) | ||||||
|
|
|
|
|
|
|
|||||||
|
Loss before gain on disposition of real estate |
(31,192 | ) | (26,476 | ) | (249,039 | ) | ||||||
|
Gain on disposition of real estate, net of tax |
5,863 | 7,079 | 1,318 | |||||||||
|
|
|
|
|
|
|
|||||||
|
Net loss |
$ | (25,329 | ) | $ | (19,397 | ) | $ | (247,721 | ) | |||
|
|
|
|
|
|
|
|||||||
|
Non-controlling interests |
(493 | ) | 3,543 | 38,363 | ||||||||
|
|
|
|
|
|
|
|||||||
|
Net loss attributable to DDR |
$ | (25,822 | ) | $ | (15,854 | ) | $ | (209,358 | ) | |||
|
|
|
|
|
|
|
|||||||
|
Write-off of preferred share original issuance costs |
(5,804 | ) | (6,402 | ) | — | |||||||
|
Preferred dividends |
(28,645 | ) | (31,587 | ) | (42,269 | ) | ||||||
|
|
|
|
|
|
|
|||||||
|
Net loss attributable to DDR common shareholders |
$ | (60,271 | ) | $ | (53,843 | ) | $ | (251,627 | ) | |||
|
|
|
|
|
|
|
|||||||
|
Per share data: |
||||||||||||
|
Basic earnings per share data: |
||||||||||||
|
Loss from continuing operations attributable to DDR common shareholders |
$ | (0.15 | ) | $ | (0.13 | ) | $ | (0.78 | ) | |||
|
Loss from discontinued operations attributable to DDR common shareholders |
(0.06 | ) | (0.07 | ) | (0.25 | ) | ||||||
|
|
|
|
|
|
|
|||||||
|
Net loss attributable to DDR common shareholders |
$ | (0.21 | ) | $ | (0.20 | ) | $ | (1.03 | ) | |||
|
|
|
|
|
|
|
|||||||
|
Diluted earnings per share data: |
||||||||||||
|
Loss from continuing operations attributable to DDR common shareholders |
$ | (0.15 | ) | $ | (0.21 | ) | $ | (0.78 | ) | |||
|
Loss from discontinued operations attributable to DDR common shareholders |
(0.06 | ) | (0.07 | ) | (0.25 | ) | ||||||
|
|
|
|
|
|
|
|||||||
|
Net loss attributable to DDR common shareholders |
$ | (0.21 | ) | $ | (0.28 | ) | $ | (1.03 | ) | |||
|
|
|
|
|
|
|
|||||||
The accompanying notes are an integral part of these consolidated financial statements.
F-4
Table of Contents
CONSOLIDATED STATEMENTS OF COMPREHENSIVE LOSS
(In thousands)
| For the Year Ended December 31, | ||||||||||||
| 2012 | 2011 | 2010 | ||||||||||
|
Net loss |
$ | (25,329 | ) | $ | (19,397 | ) | $ | (247,721 | ) | |||
|
Other comprehensive (loss) income: |
||||||||||||
|
Foreign currency translation |
(14,075 | ) | (21,527 | ) | 3,588 | |||||||
|
Change in fair value of interest-rate contracts |
(13,094 | ) | (5,978 | ) | 10,261 | |||||||
|
Amortization of interest-rate contracts |
921 | 56 | (430 | ) | ||||||||
|
|
|
|
|
|
|
|||||||
|
Total other comprehensive (loss) income |
(26,248 | ) | (27,449 | ) | 13,419 | |||||||
|
|
|
|
|
|
|
|||||||
|
Comprehensive loss |
$ | (51,577 | ) | $ | (46,846 | ) | $ | (234,302 | ) | |||
|
|
|
|
|
|
|
|||||||
|
Comprehensive (income) loss attributable to non-controlling interests: |
||||||||||||
|
Allocation of net (income) loss |
(493 | ) | 3,543 | 38,363 | ||||||||
|
Foreign currency translation |
(274 | ) | 400 | 2,678 | ||||||||
|
|
|
|
|
|
|
|||||||
|
Total comprehensive (income) loss attributable to non-controlling interests |
(767 | ) | 3,943 | 41,041 | ||||||||
|
|
|
|
|
|
|
|||||||
|
Total comprehensive loss attributable to DDR |
$ | (52,344 | ) | $ | (42,903 | ) | $ | (193,261 | ) | |||
|
|
|
|
|
|
|
|||||||
The accompanying notes are an integral part of these consolidated financial statements.
F-5
Table of Contents
CONSOLIDATED STATEMENTS OF EQUITY
(In thousands, except share amounts)
| DDR Corp. | ||||||||||||||||||||||||||||||||||||
|
Preferred
Shares |
Common
Shares |
Paid-in
Capital |
Accumulated
Distributions in Excess of Net Income (Loss) |
Deferred
Compensation Obligation |
Accumulated
Other Comprehensive Income (Loss) |
Treasury
Stock at Cost |
Non-
Controlling Interests |
Total | ||||||||||||||||||||||||||||
|
Balance, December 31, 2009 |
$ | 555,000 | $ | 20,174 | $ | 3,374,528 | $ | (1,098,661 | ) | $ | 17,838 | $ | 9,549 | $ | (15,866 | ) | $ | 89,774 | $ | 2,952,336 | ||||||||||||||||
|
Cumulative effect of adoption of a new accounting standard (Note 1) |
— | — | — | (7,848 | ) | — | — | — | (12,384 | ) | (20,232 | ) | ||||||||||||||||||||||||
|
Deconsolidation of interests |
— | — | — | — | — | — | — | 3,876 | 3,876 | |||||||||||||||||||||||||||
|
Issuance of 212,349 common shares related to related to stock plans |
— | 21 | 1,232 | — | — | — | 109 | — | 1,362 | |||||||||||||||||||||||||||
|
Issuance of 52,792,716 common shares for cash |
— | 5,279 | 433,473 | — | — | — | 1,678 | — | 440,430 | |||||||||||||||||||||||||||
|
Convertible debt instruments |
— | — | 52,497 | — | — | — | — | — | 52,497 | |||||||||||||||||||||||||||
|
Issuance of restricted stock |
— | 153 | (199 | ) | — | 741 | — | (1,542 | ) | — | (847 | ) | ||||||||||||||||||||||||
|
Vesting of restricted stock |
— | — | 4,761 | — | (4,261 | ) | — | 983 | — | 1,483 | ||||||||||||||||||||||||||
|
Stock-based compensation |
— | — | 2,698 | — | — | — | — | — | 2,698 | |||||||||||||||||||||||||||
|
Contributions from non-controlling interests |
— | — | — | — | — | — | — | 746 | 746 | |||||||||||||||||||||||||||
|
Distributions to non-controlling interests |
— | — | — | — | — | — | — | (2,886 | ) | (2,886 | ) | |||||||||||||||||||||||||
|
Dividends declared-common shares |
— | — | — | (20,205 | ) | — | — | — | — | (20,205 | ) | |||||||||||||||||||||||||
|
Dividends declared-preferred shares |
— | — | — | (42,269 | ) | — | — | — | — | (42,269 | ) | |||||||||||||||||||||||||
|
Comprehensive loss |
— | — | — | (209,358 | ) | — | 16,097 | — | (41,041 | ) | (234,302 | ) | ||||||||||||||||||||||||
|
|
|
|
|
|
|
|
|
|
|
|
|
|
|
|
|
|
|
|||||||||||||||||||
|
Balance, December 31, 2010 |
555,000 | 25,627 | 3,868,990 | (1,378,341 | ) | 14,318 | 25,646 | (14,638 | ) | 38,085 | 3,134,687 | |||||||||||||||||||||||||
|
Issuance of 178,081 common shares related to stock plans |
— | 18 | 979 | — | — | — | 432 | — | 1,429 | |||||||||||||||||||||||||||
|
Issuance of 10,000,000 common shares related to exercise of warrants |
— | 1,000 | 133,310 | — | — | — | — | — | 134,310 | |||||||||||||||||||||||||||
|
Issuance of 9,500,000 common shares for cash offering |
— | 950 | 128,715 | — | — | — | — | — | 129,665 | |||||||||||||||||||||||||||
|
Issuance of restricted stock |
— | 116 | (6,357 | ) | — | 530 | — | 6,238 | — | 527 | ||||||||||||||||||||||||||
|
Vesting of restricted stock |
— | — | 2,985 | — | (914 | ) | — | (7,049 | ) | — | (4,978 | ) | ||||||||||||||||||||||||
|
Stock-based compensation |
— | — | 3,788 | — | — | — | — | — | 3,788 | |||||||||||||||||||||||||||
|
Contributions from non-controlling interests |
— | — | — | — | — | — | — | 374 | 374 | |||||||||||||||||||||||||||
|
Distributions to non-controlling interests |
— | — | — | — | — | — | — | (2,308 | ) | (2,308 | ) | |||||||||||||||||||||||||
|
Redemption of preferred shares |
(180,000 | ) | — | 6,402 | (6,402 | ) | — | — | — | — | (180,000 | ) | ||||||||||||||||||||||||
|
Dividends declared-common shares |
— | — | — | (60,527 | ) | — | — | — | — | (60,527 | ) | |||||||||||||||||||||||||
|
Dividends declared-preferred shares |
— | — | — | (32,229 | ) | — | — | — | — | (32,229 | ) | |||||||||||||||||||||||||
|
Comprehensive loss |
— | — | — | (15,854 | ) | — | (27,049 | ) | — | (3,943 | ) | (46,846 | ) | |||||||||||||||||||||||
|
|
|
|
|
|
|
|
|
|
|
|
|
|
|
|
|
|
|
|||||||||||||||||||
|
Balance, December 31, 2011 |
375,000 | 27,711 | 4,138,812 | (1,493,353 | ) | 13,934 | (1,403 | ) | (15,017 | ) | 32,208 | 3,077,892 | ||||||||||||||||||||||||
|
Issuance of 322,481 common shares related to stock plans |
— | 32 | 2,741 | — | — | — | 262 | — | 3,035 | |||||||||||||||||||||||||||
|
Issuance of 36,334,587 common shares for cash offering |
— | 3,634 | 485,752 | — | — | — | 2,743 | — | 492,129 | |||||||||||||||||||||||||||
|
Issuance of preferred shares |
200,000 | — | (7,145 | ) | — | — | — | — | — | 192,855 | ||||||||||||||||||||||||||
|
Issuance of restricted stock |
— | 147 | (2,334 | ) | — | 910 | — | 2,026 | — | 749 | ||||||||||||||||||||||||||
|
Vesting of restricted stock |
— | — | 2,818 | — | 712 | — | (6,466 | ) | — | (2,936 | ) | |||||||||||||||||||||||||
|
Stock-based compensation |
— | — | 2,809 | — | — | — | — | — | 2,809 | |||||||||||||||||||||||||||
|
Contributions from non-controlling interests |
— | — | — | — | — | — | — | 492 | 492 | |||||||||||||||||||||||||||
|
Distributions to non-controlling interests |
— | — | — | — | — | — | — | (9,145 | ) | (9,145 | ) | |||||||||||||||||||||||||
|
Redemption of preferred shares |
(170,000 | ) | — | 5,804 | (5,804 | ) | — | — | — | — | (170,000 | ) | ||||||||||||||||||||||||
|
Dividends declared-common shares |
— | — | — | (141,152 | ) | — | — | — | — | (141,152 | ) | |||||||||||||||||||||||||
|
Dividends declared-preferred shares |
— | — | — | (28,691 | ) | — | — | — | — | (28,691 | ) | |||||||||||||||||||||||||
|
Comprehensive loss |
— | — | — | (25,822 | ) | — | (26,522 | ) | — | 767 | (51,577 | ) | ||||||||||||||||||||||||
|
|
|
|
|
|
|
|
|
|
|
|
|
|
|
|
|
|
|
|||||||||||||||||||
|
Balance, December 31, 2012 |
$ | 405,000 | $ | 31,524 | $ | 4,629,257 | $ | (1,694,822 | ) | $ | 15,556 | $ | (27,925 | ) | $ | (16,452 | ) | $ | 24,322 | $ | 3,366,460 | |||||||||||||||
|
|
|
|
|
|
|
|
|
|
|
|
|
|
|
|
|
|
|
|||||||||||||||||||
The accompanying notes are an integral part of these consolidated financial statements.
F-6
Table of Contents
(In thousands)
| For the Year Ended December 31, | ||||||||||||
| 2012 | 2011 | 2010 | ||||||||||
|
Cash flow from operating activities: |
||||||||||||
|
Net loss |
$ | (25,329 | ) | $ | (19,397 | ) | $ | (247,721 | ) | |||
|
Adjustments to reconcile net loss to net cash flow provided by operating activities: |
||||||||||||
|
Depreciation and amortization |
251,085 | 230,332 | 227,304 | |||||||||
|
Stock-based compensation |
7,553 | 7,439 | 6,459 | |||||||||
|
Amortization of deferred finance costs and settled interest rate protection agreements |
14,110 | 14,737 | 13,269 | |||||||||
|
Accretion of convertible debt discount |
10,884 | 14,914 | 8,204 | |||||||||
|
Loss (gain) on debt retirement, net |
505 | 89 | (485 | ) | ||||||||
|
(Gain) loss on equity derivative instruments |
— | (21,926 | ) | 40,157 | ||||||||
|
Settlement of accreted debt discount on repurchase of senior convertible notes |
(17,294 | ) | (9,937 | ) | (8,358 | ) | ||||||
|
Net cash paid from interest rate hedging contracts |
(4,689 | ) | (2,285 | ) | — | |||||||
|
Equity in net income of joint ventures |
(35,250 | ) | (13,734 | ) | (5,600 | ) | ||||||
|
Impairment of joint venture investments |
26,671 | 2,921 | 227 | |||||||||
|
Net gain on change in control and sale of interests |
(78,127 | ) | (29,886 | ) | (5,221 | ) | ||||||
|
Operating cash distributions from joint ventures |
13,165 | 9,424 | 7,334 | |||||||||
|
Gain on disposition of real estate |
(9,710 | ) | (47,242 | ) | (7,093 | ) | ||||||
|
Impairment charges and loan loss reserves |
130,771 | 130,844 | 171,900 | |||||||||
|
Premium on issuance of senior notes |
13,835 | — | — | |||||||||
|
Change in notes receivable accrued interest |
(6,314 | ) | (1,784 | ) | (3,005 | ) | ||||||
|
Change in restricted cash |
3,290 | (4,317 | ) | (10,876 | ) | |||||||
|
Net change in accounts receivable |
326 | 7,358 | 21,045 | |||||||||
|
Net change in accounts payable and accrued expenses |
2,580 | 1,760 | 4,323 | |||||||||
|
Net change in other operating assets and liabilities |
6,134 | 3,885 | 66,261 | |||||||||
|
|
|
|
|
|
|
|||||||
|
Total adjustments |
329,525 | 292,592 | 525,845 | |||||||||
|
|
|
|
|
|
|
|||||||
|
Net cash flow provided by operating activities |
304,196 | 273,195 | 278,124 | |||||||||
|
|
|
|
|
|
|
|||||||
|
Cash flow from investing activities: |
||||||||||||
|
Proceeds from disposition of real estate |
172,231 | 344,231 | 156,374 | |||||||||
|
Real estate developed or acquired, net of liabilities assumed |
(586,904 | ) | (217,861 | ) | (164,391 | ) | ||||||
|
Equity contributions to joint ventures |
(54,976 | ) | (7,719 | ) | (30,311 | ) | ||||||
|
(Issuances) repayments of joint venture advances, net |
(149,921 | ) | 22,378 | 442 | ||||||||
|
Distributions of proceeds from sale and refinancing of joint venture interests |
18,120 | 21,911 | 24,339 | |||||||||
|
Return of investments in joint ventures |
11,955 | 9,466 | 22,094 | |||||||||
|
Issuance of notes receivable |
(10,239 | ) | (10,000 | ) | (62,958 | ) | ||||||
|
Repayment of notes receivable |
1,080 | 33,208 | — | |||||||||
|
Decrease in restricted cash — capital improvements |
10,224 | 5,082 | 86,173 | |||||||||
|
|
|
|
|
|
|
|||||||
|
Net cash flow (used for) provided by investing activities |
(588,430 | ) | 200,696 | 31,762 | ||||||||
|
|
|
|
|
|
|
|||||||
|
Cash flow from financing activities: |
||||||||||||
|
Proceeds from (repayments of) revolving credit facilities, net |
5,511 | (138,098 | ) | (492,224 | ) | |||||||
|
Proceeds from issuance of senior notes, net of underwriting commissions and offering expenses, of $1,345, $350 and $1,183 in 2012, 2011 and 2010, respectively |
439,892 | 295,495 | 933,370 | |||||||||
|
Repayment of senior notes |
(445,682 | ) | (207,858 | ) | (541,606 | ) | ||||||
|
Proceeds from mortgages and other secured debt |
718,506 | 186,956 | 23,686 | |||||||||
|
Repayment of term loans and mortgage debt |
(785,588 | ) | (499,767 | ) | (601,678 | ) | ||||||
|
Payment of debt issuance costs |
(5,622 | ) | (13,993 | ) | (13,773 | ) | ||||||
|
Redemption of preferred shares |
(170,000 | ) | (180,000 | ) | — | |||||||
|
Proceeds from issuance of common shares, net of underwriting commissions and offering expenses, of $1,055, $835 and $998 in 2012, 2011 and 2010, respectively |
492,129 | 129,684 | 440,430 | |||||||||
|
Proceeds from issuance of common shares related to the exercise of warrants |
— | 59,978 | — | |||||||||
|
Proceeds from issuance of preferred shares, net of underwriting commissions and offering expenses, of $845 in 2012 |
192,855 | — | — | |||||||||
|
Repurchase of common shares in conjunction with equity award plans |
(3,841 | ) | (6,655 | ) | (1,763 | ) | ||||||
|
Contributions from non-controlling interests |
492 | 374 | 746 | |||||||||
|
Distributions to non-controlling interests and redeemable operating partnership units |
(9,128 | ) | (2,250 | ) | (2,886 | ) | ||||||
|
Dividends paid |
(154,761 | ) | (75,720 | ) | (61,367 | ) | ||||||
|
|
|
|
|
|
|
|||||||
|
Net cash provided by (used for) financing activities |
274,763 | (451,854 | ) | (317,065 | ) | |||||||
|
|
|
|
|
|
|
|||||||
|
Cash and cash equivalents |
||||||||||||
|
(Decrease) increase in cash and cash equivalents |
(9,471 | ) | 22,037 | (7,179 | ) | |||||||
|
Effect of exchange rate changes on cash and cash equivalents |
(561 | ) | (247 | ) | 423 | |||||||
|
Cash and cash equivalents, beginning of year |
41,206 | 19,416 | 26,172 | |||||||||
|
|
|
|
|
|
|
|||||||
|
Cash and cash equivalents, end of year |
$ | 31,174 | $ | 41,206 | $ | 19,416 | ||||||
|
|
|
|
|
|
|
|||||||
The accompanying notes are an integral part of these consolidated financial statements.
F-7
Table of Contents
Notes to Consolidated Financial Statements
1. Summary of Significant Accounting Policies
Nature of Business
DDR Corp. and its related real estate joint ventures and subsidiaries (collectively, the “Company” or “DDR”) are primarily engaged in the business of acquiring, owning, developing, redeveloping, expanding, leasing and managing shopping centers. In addition, the Company engages in the origination and acquisition of loans and debt securities, which are generally collateralized directly or indirectly by shopping centers. Unless otherwise provided, references herein to the Company or DDR include DDR Corp., its wholly-owned and majority-owned subsidiaries and its consolidated and unconsolidated joint ventures. The Company’s tenant base primarily includes national and regional retail chains and local retailers. Consequently, the Company’s credit risk is concentrated in the retail industry.
Use of Estimates in Preparation of Financial Statements
The preparation of financial statements in conformity with generally accepted accounting principles requires management to make estimates and assumptions that affect the reported amounts of assets and liabilities, the disclosure of contingent assets and liabilities and the reported amounts of revenues and expenses during the year. Actual results could differ from those estimates.
Principles of Consolidation
The Company follows the provisions of Accounting Standards Codification No. 810, Consolidation (“ASC 810”). This standard requires a company to perform an analysis to determine whether its variable interests give it a controlling financial interest in a Variable Interest Entity (“VIE”). This analysis identifies the primary beneficiary of a VIE as the entity that has (a) the power to direct the activities of the VIE that most significantly affect the VIE’s economic performance and (b) the obligation to absorb losses or the right to receive benefits that could potentially be significant to the VIE. In determining whether it has the power to direct the activities of the VIE that most significantly affect the VIE’s performance, this standard requires a company to assess whether it has an implicit financial responsibility to ensure that a VIE operates as designed.
At December 31, 2012 and 2011, the Company’s investments in consolidated real estate joint ventures in which the Company was deemed to be the primary beneficiary had total real estate assets of $184.6 million and $289.5 million, respectively, mortgages of $21.5 million and $23.5 million, respectively, and other liabilities of $1.9 million and $28.7 million, respectively.
Prior to June 15, 2012, the Company deconsolidated its interest in consolidated joint venture entities or assets, which the Company considered in-substance real estate when it no longer possessed a controlling financial interest in the entity. In 2011 and 2010, the Company had consolidated joint ventures that transferred their interest in the real estate to the control of a court-appointed receiver. Following the appointment of the receiver, the Company no longer had any effective economic rights or obligations in these entities. Subsequent to the deconsolidation of these joint ventures, the Company accounted for its retained interest in these joint venture investments, which approximated zero at December 31, 2011, under the cost method of accounting because the Company did not have the ability to exercise significant influence. Upon deconsolidation, the Company recorded $4.7 million and $5.6 million for the years ended December 31, 2011 and 2010, respectively, as Gain on Deconsolidation of Interests because the carrying value of the non-recourse debt exceeded the carrying value of the collateralized assets of the joint ventures. The revenues and expenses associated with the entities for all of the periods presented, including the Gain on Deconsolidation of Interests, are classified within discontinued operations in the consolidated statements of operations (Note 12).
F-8
Table of Contents
Statement of Cash Flows and Supplemental Disclosure of Non-Cash Investing and Financing Information
Non-cash investing and financing activities are summarized as follows (in millions):
| For the Year Ended December 31, | ||||||||||||
| 2012 | 2011 | 2010 | ||||||||||
|
Mortgages and liability assumed from acquisitions |
$ | 42.3 | $ | 137.8 | $ | — | ||||||
|
Consolidation of the net assets (excluding mortgages disclosed below) of previously unconsolidated joint ventures |
383.0 | 87.8 | — | |||||||||
|
Mortgages assumed of previously unconsolidated joint ventures |
246.2 | 50.1 | — | |||||||||
|
Deconsolidation of net assets from the adoption of ASC 810 |
— | — | 20.2 | |||||||||
|
Reduction of non-controlling interests from the adoption of ASC 810 |
— | — | 12.4 | |||||||||
|
Deconsolidation of net assets |
— | 5.0 | 15.2 | |||||||||
|
Reduction of non-controlling interests due to deconsolidation of Mervyns Joint Venture |
— | — | 3.9 | |||||||||
|
Foreclosure of note receivable and transfer of collateral |
— | — | 19.0 | |||||||||
|
Equity derivative liability – affiliate |
— | 74.3 | — | |||||||||
|
Write-off of preferred share original issuance costs |
5.8 | 6.4 | — | |||||||||
|
Dividends declared |
44.2 | 29.1 | 12.1 | |||||||||
|
Accounts payable related to construction in progress |
18.2 | 3.4 | 3.3 | |||||||||
The transactions above did not provide or use cash in the years presented and, accordingly, are not reflected in the consolidated statements of cash flows.
Real Estate
Real estate assets, which include construction in progress and land held for development, are stated at cost less accumulated depreciation.
Depreciation and amortization is recorded on a straight-line basis over the estimated useful lives of the assets as follows:
|
Buildings |
Useful lives, 31.5 years | |
|
Building improvements and fixtures |
Useful lives, ranging from 5 to 20 years | |
|
Tenant improvements |
Shorter of economic life or lease terms |
The Company periodically assesses the useful lives of its depreciable real estate assets and accounts for any revisions, which are not material for the periods presented, prospectively. Expenditures for maintenance and repairs are charged to operations as incurred. Significant expenditures that improve or extend the life of the asset are capitalized.
Land held for development and construction in progress includes land held for future development as well as construction in progress related to shopping center developments and expansions. The Company capitalized certain direct and incremental internal construction costs and software development and implementation costs of $10.5 million, $9.1 million and $9.7 million in 2012, 2011 and 2010, respectively.
Purchase Price Accounting
Upon acquisition of properties, the Company estimates the fair value of acquired tangible assets, consisting of land, building and improvements and intangible assets generally consisting of: (i) above- and below-market leases, (ii) in-place leases and (iii) tenant relationships. The Company allocates the purchase price to assets acquired and liabilities assumed on a gross basis based on their relative fair values at the date of acquisition. In
F-9
Table of Contents
estimating the fair value of the tangible and intangible assets acquired, the Company considers information obtained about each property as a result of its due diligence, marketing and leasing activities and uses various valuation methods, such as estimated cash flow projections using appropriate discount and capitalization rates, analysis of recent comparable sales transactions, estimates of replacement costs net of depreciation and other available market information. The fair value of the tangible assets of an acquired property considers the value of the property as if it were vacant. Above- and below-market lease values are recorded based on the present value (using a discount rate that reflects the risks associated with the leases acquired) of the difference between (i) the contractual amounts to be paid pursuant to each in-place lease and (ii) management’s estimate of fair market lease rates for each corresponding in-place lease, measured over a period equal to the remaining term of the lease for above-market leases and the initial term plus the estimated term of any below-market, fixed-rate renewal options for below-market leases. The capitalized above-market lease values are amortized as a reduction of base rental revenue over the remaining term of the respective leases, and the capitalized below-market lease values are amortized as an increase to base rental revenue over the remaining initial terms plus the estimated terms of any below-market, fixed-rate renewal options of the respective leases. The purchase price is further allocated to in-place lease values and tenant relationship values based on management’s evaluation of the specific characteristics of the acquired lease portfolio and the Company’s overall relationship with the anchor tenants. Such amounts are amortized to depreciation and amortization expense over the weighted average remaining initial term (and expected renewal periods for tenant relationships).
Intangible assets associated with property acquisitions are included in other assets and other liabilities, as appropriate, in the Company’s consolidated balance sheets. In the event a tenant terminates its lease prior to the contractual expiration, the unamortized portion of the related intangible asset or liability is written off. At December 31, 2012 and 2011, below-market leases aggregated a net liability of $50.4 million and $29.5 million, respectively. At December 31, 2012 and 2011, above-market leases aggregated a net asset of $17.7 million and $2.8 million, respectively. The estimated future amortization income, net, associated with the Company’s above- and below-market leases, is $0.1 million, $0.5 million, $0.7 million, $1.4 million and $2.1 million for the years ending December 31, 2013, 2014, 2015, 2016 and 2017, respectively.
Real Estate Impairment Assessment
The Company reviews its individual real estate assets, including land held for development and construction in progress, for potential impairment indicators whenever events or changes in circumstances indicate that the carrying value may not be recoverable. Impairment indicators include, but are not limited to, significant decreases in projected net operating income and occupancy percentages, projected losses on potential future sales, market factors, significant changes in projected development costs or completion dates and sustainability of development projects. An asset is considered impaired when the undiscounted future cash flows are not sufficient to recover the asset’s carrying value. The determination of anticipated undiscounted cash flows is inherently subjective and requires significant estimates made by management and considers the most likely expected course of action at the balance sheet date based on current plans, intended holding periods and available market information. If the Company’s estimates of the projected future cash flows, anticipated holding periods or market conditions change, its evaluation of impairment losses may be different, and such differences could be material to the consolidated financial statements. Plans to hold properties over longer periods decrease the likelihood of recording impairment losses. If the Company is evaluating the potential sale of an asset or land held for development, the undiscounted future cash flows analysis is probability-weighted based upon management’s best estimate of the likelihood of the alternative courses of action as of the balance sheet date. If such impairment is indicated, an impairment loss is recognized based on the excess of the carrying amount of the asset over its fair value. The Company recorded aggregate impairment charges, including those classified within discontinued operations, of $126.5 million, $125.8 million, and $171.9 million (Note 11) related to consolidated real estate investments during the years ended December 31, 2012, 2011 and 2010, respectively.
F-10
Table of Contents
Real Estate Held for Sale
The Company generally considers assets to be held for sale when management believes that a sale is probable within a year. This generally occurs when a sales contract is executed with no substantive contingencies and the prospective buyer has significant funds at risk. Assets that are classified as held for sale are recorded at the lower of their carrying amount or fair value less cost to sell.
Disposition of Real Estate and Real Estate Investments
Sales of real estate include the sale of land, operating properties and investments in real estate joint ventures. Gains from dispositions are recognized using the full accrual or partial sale methods, provided that various criteria relating to the terms of sale and any subsequent involvement by the Company with the asset sold are met. If the criteria for sale recognition or gain recognition are not met because of a form of continuing involvement, the accounting for such transactions is dependent on the nature of the continuing involvement. In certain cases, a sale might not be recognized, and in others all or a portion of the gain might be deferred.
Pursuant to the definition of a component of an entity and, assuming no significant continuing involvement, the operations of the sold asset or asset classified as held for sale are considered discontinued operations. Interest expense, which is specifically identifiable to the property, is included in the computation of interest expense attributable to discontinued operations. Consolidated interest expense at the corporate level is allocated to discontinued operations based on the proportion of net assets disposed.
Interest and Real Estate Taxes
Interest and real estate taxes incurred relating to the construction, expansion or redevelopment of shopping centers are capitalized and depreciated over the estimated useful life of the building. This includes interest incurred on funds invested in or advanced to unconsolidated joint ventures with qualifying development activities. The Company will cease the capitalization of these expenses when construction activities are substantially completed and the property is available for occupancy by tenants. If the Company suspends substantially all activities related to development of a qualifying asset, the Company will cease capitalization of interest, insurance and taxes until activities are resumed.
Interest paid during the years ended December 31, 2012, 2011 and 2010 aggregated $209.3 million, $218.6 million and $221.5 million, respectively, of which $13.3 million, $12.7 million and $12.2 million, respectively, was capitalized.
Investments in and Advances to Joint Ventures
To the extent that the Company’s cost basis is different from the basis reflected at the unconsolidated joint venture level, the basis difference is amortized over the life of the related assets and included in the Company’s share of equity in net income (loss) of the joint venture. On a periodic basis, management assesses whether there are any indicators that the value of the Company’s investments in unconsolidated joint ventures may be impaired. An investment’s value is impaired only if management’s estimate of the fair value of the investment is less than the carrying value of the investment and such difference is deemed to be other than temporary. The Company recorded aggregate impairment charges of $26.7 million, $2.9 million and $0.2 million (Note 11) related to its investments in unconsolidated joint ventures during the years ended December 31, 2012, 2011 and 2010, respectively. These impairment charges create a basis difference between the Company’s share of accumulated equity as compared to the investment balance of the respective unconsolidated joint venture. The Company allocates the aggregate impairment charge to each of the respective properties owned by the joint venture on a relative fair value basis and, where appropriate, amortizes this basis differential as an adjustment to the equity in net income (loss) recorded by the Company over the estimated remaining useful lives of the underlying assets.
F-11
Table of Contents
Cash and Cash Equivalents
The Company considers all highly liquid investments with an original maturity of three months or less to be cash equivalents. The Company maintains cash deposits with major financial institutions, which from time to time may exceed federally insured limits. The Company periodically assesses the financial condition of these institutions and believes that the risk of loss is minimal. Cash flows associated with items intended as hedges of identifiable transactions or events are classified in the same category as the cash flows from the items being hedged.
Restricted Cash
Restricted cash represents amounts with financial institutions primarily for debt service payments, real estate taxes, capital improvements, operating reserves and a bond sinking fund as required pursuant to the respective loan agreement.
Accounts Receivable
The Company makes estimates of the amounts that it believes will not be collected related to base rents, straight-line rents receivable, expense reimbursements and other amounts owed. The Company analyzes accounts receivable, tenant credit worthiness and current economic trends when evaluating the adequacy of the allowance for doubtful accounts. In addition, tenants in bankruptcy are analyzed and estimates are made in connection with the expected recovery of pre-petition and post-petition claims.
Accounts receivable, other than straight-line rents receivable, are expected to be collected within one year and are net of estimated unrecoverable amounts of $10.8 million and $19.3 million at December 31, 2012 and 2011, respectively. At December 31, 2012 and 2011, straight-line rents receivable, net of a provision for uncollectible amounts of $3.6 million and $3.2 million, respectively, aggregated $58.2 million and $55.7 million, respectively.
Notes Receivable
Notes receivable include certain loans that are held for investment and are generally collateralized by real estate-related investments and may be subordinate to other senior loans. Loan receivables are recorded at stated principal amounts or at initial investment plus accretable yield for loans purchased at a discount. The related discounts on mortgages and other loans purchased are accreted over the life of the related loan receivable. The Company defers loan origination and commitment fees, net of origination costs, and amortizes them over the term of the related loan. The Company evaluates the collectability of both principal and interest on each loan based on an assessment of the underlying collateral value to determine whether it is impaired, and not by the use of internal risk ratings. A loan is considered to be impaired when, based upon current information and events, it is probable that the Company will be unable to collect all amounts due according to the existing contractual terms. When a loan is considered to be impaired, the amount of loss is calculated by comparing the recorded investment to the value of the underlying collateral. As the underlying collateral for a majority of the notes receivable is real-estate related investments, the same valuation techniques are used to value the collateral as those used to determine the fair value of real estate investments for impairment purposes. Given the small number of loans, the Company does not provide for an additional allowance for loan losses based on the grouping of loans, as the Company believes the characteristics of its loans are not sufficiently similar to allow an evaluation of these loans as a group for a possible loan loss allowance. As such, all of the Company’s loans are evaluated individually for this purpose. Interest income on performing loans is accrued as earned. A loan is placed on non-accrual status when, based upon current information and events, it is probable that the Company will not be able to collect all amounts due according to the existing contractual terms. Interest income on non-performing loans is generally recognized on a cash basis. Recognition of interest income on an accrual basis on non-performing loans is resumed when it is probable that the Company will be able to collect amounts due according to the contractual terms.
F-12
Table of Contents
Deferred Charges
Costs incurred in obtaining indebtedness are included in deferred charges in the accompanying consolidated balance sheets and are amortized over the terms of the related debt agreements. Such amortization is reflected as interest expense in the consolidated statements of operations.
Deferred Tax Assets
The Company accounts for income taxes related to its taxable REIT subsidiary (“TRS”) under the asset and liability method, which requires the recognition of deferred tax assets and liabilities for the expected future tax consequences of events that have been included in the financial statements. Under this method, deferred tax assets and liabilities are determined based on the differences between the financial statement and tax basis of assets and liabilities using enacted tax rates in effect for the year in which the differences are expected to reverse. The effect of a change in tax rates on deferred tax assets and liabilities is recognized in the income statement in the period that includes the enactment date.
The Company records net deferred tax assets to the extent it believes it is more likely than not that these assets will be realized. In making such determination, the Company considers all available positive and negative evidence, including forecasts of future taxable income, the reversal of other existing temporary differences, available net operating loss carryforwards, tax planning strategies and recent results of operations. Several of these considerations require assumptions and significant judgment about the forecasts of future taxable income and are consistent with the plans and estimates that the Company is utilizing to manage its business. Based on this assessment, management must evaluate the need for, and amount of, valuation allowances against the Company’s deferred tax assets. To the extent facts and circumstances change in the future, adjustments to the valuation allowances may be required. In the event the Company were to determine that it would be able to realize the deferred income tax assets in the future in excess of their net recorded amount, the Company would adjust the valuation allowance, which would reduce the provision for income taxes. Accordingly, the Company would record a valuation allowance to reduce deferred tax assets when it has determined that an uncertainty exists regarding their realization, which would increase the provision for income taxes. The Company recorded a valuation allowance of $58.3 million (Note 16) during the year ended December 31, 2010.
Treasury Shares
The Company’s share repurchases are reflected as treasury shares utilizing the cost method of accounting and are presented as a reduction to consolidated shareholders’ equity. Reissuances of the Company’s treasury shares at an amount below cost are recorded as a charge to paid-in capital due to the Company’s cumulative distributions in excess of net loss.
Revenue Recognition
Minimum rents from tenants are recognized using the straight-line method over the lease term of the respective leases. Percentage and overage rents are recognized after a tenant’s reported sales have exceeded the applicable sales breakpoint set forth in the applicable lease. Revenues associated with expense reimbursements from tenants are recognized in the period that the related expenses are incurred based upon the tenant lease provision. Fee and other income includes management fees recorded in the period earned based on a percentage of collected revenue at the properties under management. Fee income derived from the Company’s unconsolidated joint venture investments is recognized to the extent attributable to the unaffiliated ownership interest. Ancillary and other property-related income, primarily composed of leasing vacant space to temporary tenants and kiosk income, is recognized in the period earned. Lease termination fees are recognized upon the effective termination of a tenant’s lease when the Company has no further obligations under the lease.
F-13
Table of Contents
Fee and other income from continuing operations was composed of the following (in thousands):
| For the Year Ended December 31, | ||||||||||||
| 2012 | 2011 | 2010 | ||||||||||
|
Management, development, financing and other fee income |
$ | 43,811 | $ | 47,539 | $ | 54,592 | ||||||
|
Ancillary and other property income |
27,665 | 28,527 | 20,196 | |||||||||
|
Lease termination fees |
6,401 | 5,897 | 7,482 | |||||||||
|
Other miscellaneous |
384 | 607 | 2,123 | |||||||||
|
|
|
|
|
|
|
|||||||
|
Total fee and other income |
$ | 78,261 | $ | 82,570 | $ | 84,393 | ||||||
|
|
|
|
|
|
|
|||||||
General and Administrative Expenses
General and administrative expenses include certain internal leasing and legal salaries and related expenses associated with the re-leasing of existing space, which are charged to operations as incurred as they are not eligible for capitalization.
Stock Option and Other Equity-Based Plans
Compensation cost relating to stock-based payment transactions classified as equity is recognized in the financial statements based upon the grant date fair value. Forfeitures are estimated at the time of grant in order to estimate the amount of share-based awards that will ultimately vest. The forfeiture rate is based on historical rates for non-executive employees and actual expectations for executives.
For the years ended December 31, 2012, 2011 and 2010, stock-based compensation cost recognized by the Company was $6.4 million, $6.8 million and $5.7 million, respectively. This amount includes $0.2 million, $1.6 million and $0.4 million as a result of accelerated vesting of awards due to employee separations in 2012, 2011 and 2010, respectively.
Income Taxes
The Company has made an election to qualify, and believes it is operating so as to qualify, as a REIT for federal income tax purposes. Accordingly, the Company generally will not be subject to federal income tax, provided that it makes distributions to its shareholders equal to at least the amount of its REIT taxable income as defined under Sections 856 through 860 of the Internal Revenue Code of 1986, as amended (the “Code”) and continues to satisfy certain other requirements.
In connection with the REIT Modernization Act, which became effective January 1, 2001, the Company is permitted to participate in certain activities that it was previously precluded from in order to maintain its qualification as a REIT, so long as these activities are conducted in entities that elect to be treated as taxable subsidiaries under the Code. As such, the Company is subject to federal and state income taxes on the income from these activities.
Foreign Currency Translation
The financial statements of the Company’s international consolidated and unconsolidated joint venture investments are translated into U.S. dollars using the exchange rate at each balance sheet date for assets and liabilities, an average exchange rate for each period for revenues, expenses, gains and losses, and at the transaction date for impairments or sales, with the Company’s proportionate share of the resulting translation adjustments recorded as Accumulated Other Comprehensive Loss. Gains or losses resulting from foreign currency transactions, translated to local currency, are included in income as incurred. Foreign currency gains or losses from changes in exchange rates were not material to the consolidated operating results.
F-14
Table of Contents
Derivative and Hedging Activities
The Company records all derivatives on the balance sheet at fair value. The accounting for changes in the fair value of derivatives depends on the intended use of the derivative, whether the Company has elected to designate a derivative in a hedging relationship and apply hedge accounting, and whether the hedging relationship has satisfied the criteria necessary to apply hedge accounting. Derivatives designated and qualifying as a hedge of the exposure to changes in the fair value of an asset, liability or firm commitment attributable to a particular risk, such as interest rate risk, are considered fair value hedges. Derivatives designated and qualifying as a hedge of the exposure to variability in expected future cash flows, or other types of forecasted transactions, are considered cash flow hedges. Derivatives may also be designated as hedges of the foreign currency exposure of a net investment in a foreign operation. Hedge accounting generally provides for the matching of the timing of gain or loss recognition on the hedging instrument with the recognition of the changes in the fair value of the hedged asset or liability that is attributable to the hedged risk in a fair value hedge or the earnings effect of the hedged forecasted transactions in a cash flow hedge. The Company may enter into derivative contracts that are intended to economically hedge certain of its risk, even if hedge accounting does not apply or the Company elects not to apply hedge accounting.
New Accounting Standards Implemented
Presentation of Other Comprehensive Income
In February 2013, the Financial Accounting Standards Board (“FASB”) issued guidance on the presentation of comprehensive income. This guidance eliminates the option to present the components of other comprehensive income as part of the consolidated statements of equity, which was the Company’s previous presentation, and requires presentation of reclassification adjustments from other comprehensive income to net income in a single note or on the face of the financial statements. The Company presented the components of comprehensive income in a separate statement beginning December 31, 2011. The effective date for the presentation of reclassification adjustments is for annual and interim reporting periods beginning after December 15, 2012 (the first quarter of 2013 for the Company). When adopted, this guidance is not expected to materially impact the Company’s consolidated financial statements.
Fair Value Measurements
In May 2011, the FASB issued Accounting Standards Update No. 2011-04, Fair Value Measurements and Disclosures (Topic 820) – Amendments to Achieve Common Fair Value Measurement and Disclosure Requirements in U.S. GAAP and IFRS (“ASU 2011-04”). ASU 2011-04 clarifies the application of existing fair value measurement requirements, changes certain principles related to measuring fair value and requires additional disclosures about fair value measurements. Specifically, the guidance specifies that the concepts of highest and best use and valuation premise in a fair value measurement are relevant only when measuring the fair value of nonfinancial assets, whereas they are not relevant when measuring the fair value of financial assets and liabilities. Required disclosures are expanded under the new guidance, especially for fair value measurements that are categorized within Level 3 of the fair value hierarchy, for which quantitative information about the unobservable inputs used, and a narrative description of the valuation processes in place and sensitivity of recurring Level 3 measurements to changes in unobservable inputs will be required. Entities will also be required to disclose the categorization by level of the fair value hierarchy for items that are not measured at fair value in the balance sheet but for which the fair value is required to be disclosed. ASU 2011-04 is effective for annual periods beginning after December 15, 2011, and is to be applied prospectively. The Company’s adoption of this guidance did not have a material impact on its financial statements.
Derecognition of in Substance Real Estate
In November 2011, the FASB ratified the Emerging Issues Task Force (“EITF”) consensus, ASU 2011-10, “Derecognition of in Substance Real Estate – a Scope Clarification.” This guidance clarifies that ASC 360-20, “Property Plant and Equipment – Real Estate Sales” (“ASC 360-20”) is the authoritative guidance when an
F-15
Table of Contents
investor loses control of real estate to a lender as a result of defaulting on a loan. Therefore, the investor is precluded from derecognizing the real estate until legal ownership has been transferred to the lender. The accounting for this fact pattern was addressed by the EITF due to diversity in practice. Under the Company’s historical accounting policies, it believed that it no longer had the contractual ability to direct the activities that most significantly affected the economic performance of entities in the control of a lender. Therefore, the Company’s historical accounting policy for evaluating these transactions was based upon ASC 810. The Company applied this consensus on a prospective basis on June 15, 2102.
2. Investments in and Advances to Joint Ventures
The Company’s equity method joint ventures at December 31, 2012, which are included in Investments in and Advances to Joint Ventures in the Company’s consolidated balance sheets, are as follows:
|
Unconsolidated Real Estate Ventures |
Effective
Ownership Percentage (A) |
Assets Owned |
||
|
Sonae Sierra Brasil BV Sarl |
33.3 | Eight shopping centers, a management company and two development projects in Brazil | ||
|
DDR Domestic Retail Fund I |
20.0 | 59 grocery-anchored retail centers in several states | ||
|
DDR Markaz II LLC |
20.0 | 13 neighborhood grocery-anchored retail centers in several states | ||
|
DDR — SAU Retail Fund LLC |
20.0 | 27 grocery-anchored retail centers in several states | ||
|
DDRTC Core Retail Fund LLC |
15.0 | 39 shopping centers in several states | ||
|
Coventry II Joint Ventures |
10.0 – 20.0 | Four shopping centers in several states | ||
|
BRE DDR Retail Holdings, LLC |
5.0 | 46 shopping centers in several states | ||
|
Other Joint Venture Interests |
25.25 – 79.45 | 14 shopping centers in several states and a management company |
The Company has a zero basis in the following equity method joint ventures at December 31, 2012, and has no intent or obligation to fund any further capital:
|
Unconsolidated Real Estate Ventures |
Effective
Ownership Percentage (A) |
Assets Owned |
||
|
Coventry II Joint Ventures |
0.0 – 20.0% | 40 retail sites/centers in several states |
| (A) | Ownership may be held through different investment structures. Percentage ownerships are subject to change, as certain investments contain promoted structures. |
F-16
Table of Contents
Condensed combined financial information of the Company’s unconsolidated joint venture investments is summarized as follows (in thousands):
| December 31, | ||||||||
| 2012 (A) | 2011 | |||||||
|
Condensed combined balance sheets |
||||||||
|
Land |
$ | 1,569,548 | $ | 1,400,469 | ||||
|
Buildings |
4,681,462 | 4,334,097 | ||||||
|
Fixtures and tenant improvements |
244,293 | 189,940 | ||||||
|
|
|
|
|
|||||
| 6,495,303 | 5,924,506 | |||||||
|
Less: Accumulated depreciation |
(833,816 | ) | (808,352 | ) | ||||
|
|
|
|
|
|||||
| 5,661,487 | 5,116,154 | |||||||
|
Land held for development and construction in progress |
348,822 | 239,036 | ||||||
|
|
|
|
|
|||||
|
Real estate, net |
6,010,309 | 5,355,190 | ||||||
|
Cash and restricted cash (B) |
467,200 | 308,008 | ||||||
|
Receivables, net |
99,098 | 108,038 | ||||||
|
Other assets |
427,014 | 177,251 | ||||||
|
|
|
|
|
|||||
| $ | 7,003,621 | $ | 5,948,487 | |||||
|
|
|
|
|
|||||
|
Mortgage debt |
$ | 4,246,407 | $ | 3,742,241 | ||||
|
Notes and accrued interest payable to DDR (C) |
143,338 | 100,470 | ||||||
|
Other liabilities |
342,614 | 214,370 | ||||||
|
|
|
|
|
|||||
| 4,732,359 | 4,057,081 | |||||||
|
Redeemable preferred equity |
154,556 | — | ||||||
|
Accumulated equity |
2,116,706 | 1,891,406 | ||||||
|
|
|
|
|
|||||
| $ | 7,003,621 | $ | 5,948,487 | |||||
|
|
|
|
|
|||||
|
Company’s share of Accumulated Equity |
$ | 432,500 | $ | 402,242 | ||||
|
|
|
|
|
|||||
| (A) | Increase in the balance sheet at December 31, 2012, is primarily attributable to the investment in BRE DDR Retail Holdings, LLC, described later in this footnote, partially offset by asset sales. |
| (B) | Increase is due to the issuance of public debt by Sonae Sierra Brasil in 2012. The proceeds were used to fund development activities. |
| (C) | The Company has amounts receivable from several joint ventures aggregating $34.3 million and $3.0 million at December 31, 2012 and 2011, respectively, which are included Investments in and Advances to Joint Ventures on the consolidated balance sheets. The remaining amounts were fully reserved by the Company in prior years. |
F-17
Table of Contents
| For the Year Ended December 31, | ||||||||||||
| 2012 | 2011 | 2010 | ||||||||||
|
Condensed combined statements of operations |
||||||||||||
|
Revenues from operations |
$ | 705,810 | $ | 659,978 | $ | 614,775 | ||||||
|
|
|
|
|
|
|
|||||||
|
Operating expenses (A) |
249,540 | 217,673 | 230,528 | |||||||||
|
Impairment charges (B) |
10,402 | 208,843 | — | |||||||||
|
Depreciation and amortization |
203,412 | 171,634 | 172,926 | |||||||||
|
Interest expense |
237,138 | 217,676 | 215,482 | |||||||||
|
|
|
|
|
|
|
|||||||
| 700,492 | 815,826 | 618,936 | ||||||||||
|
|
|
|
|
|
|
|||||||
|
Income (loss) before other items |
5,318 | (155,848 | ) | (4,161 | ) | |||||||
|
Income tax expense (primarily Sonae Sierra Brasil), net |
(25,444 | ) | (38,598 | ) | (20,247 | ) | ||||||
|
Other income (C) |
— | — | 10,592 | |||||||||
|
|
|
|
|
|
|
|||||||
|
Loss from continuing operations |
(20,126 | ) | (194,446 | ) | (13,816 | ) | ||||||
|
Discontinued operations: |
||||||||||||
|
Loss from discontinued operations (D) |
(52,619 | ) | (64,056 | ) | (23,508 | ) | ||||||
|
Gain on debt forgiveness |
— | 2,976 | — | |||||||||
|
Gain (loss) on disposition of real estate, net of tax |
11,739 | 18,705 | (26,674 | ) | ||||||||
|
|
|
|
|
|
|
|||||||
|
Loss before gain on disposition of real estate, net |
(61,006 | ) | (236,821 | ) | (63,998 | ) | ||||||
|
Gain on disposition of real estate, net |
54,582 | 1,733 | 17 | |||||||||
|
|
|
|
|
|
|
|||||||
|
Net loss |
$ | (6,424 | ) | $ | (235,088 | ) | $ | (63,981 | ) | |||
|
|
|
|
|
|
|
|||||||
|
Non-controlling interests |
(42,995 | ) | (16,132 | ) | (458 | ) | ||||||
|
|
|
|
|
|
|
|||||||
|
Net loss attributable to unconsolidated joint ventures |
$ | (49,419 | ) | $ | (251,220 | ) | $ | (64,439 | ) | |||
|
|
|
|
|
|
|
|||||||
|
Company’s share of equity in net income (loss) of joint ventures (E) |
$ | 33,512 | $ | (12,979 | ) | $ | 6,319 | |||||
|
|
|
|
|
|
|
|||||||
| (A) | Operating expenses for the year ended December 31, 2012, include transaction costs associated with the formation of the unconsolidated joint venture, BRE DDR Retail Holdings, LLC, described later in this footnote. |
| (B) | For the years ended December 31, 2012 and 2011, the Company’s proportionate share was $0.6 million and $6.7 million, respectively. |
| (C) | The 2010 activity related to debt forgiveness on one property owned by a joint venture with the Coventry II Fund (hereinafter defined), in which the Company has a zero basis. |
| (D) | For the years ended December 31, 2012, 2011 and 2010, impairment charges included in discontinued operations related to asset sales were $46.8 million, $63.6 million and $21.0 million, respectively, of which the Company’s proportionate share was $0.5 million, $6.3 million and $0.7 million, respectively. The Company’s share of the impairment charges was reduced by the impact of the other than temporary impairment charges recorded on these investments as discussed below. |
| (E) | The difference between the Company’s share of net income (loss), as reported above, and the amounts included in the consolidated statements of operations is attributable to the amortization of basis differentials, deferred gains and differences in gain (loss) on sale of certain assets due to the basis differentials and other than temporary impairment charges. The Company is not recording income or loss from those investments in which its investment basis is zero as the Company does not have the obligation or intent to fund any additional capital. Adjustments to the Company’s share of joint venture net income (loss) for these items are reflected as follows (in millions): |
F-18
Table of Contents
|
For the Year Ended
December 31, |
||||||||||||
| 2012 | 2011 | 2010 | ||||||||||
|
Income (loss), net |
$ | 1.7 | $ | 26.7 | $ | (0.7) | ||||||
Investments in and Advances to Joint Ventures include the following items, which represent the difference between the Company’s investment and its share of all of the unconsolidated joint ventures’ underlying net assets (in millions):
|
For the Year Ended
December 31, |
||||||||
| 2012 | 2011 | |||||||
|
Company’s share of accumulated equity |
$ | 432.5 | $ | 402.2 | ||||
|
Redeemable preferred equity and notes receivable from investments (A) |
155.0 | 0.4 | ||||||
|
Basis differentials (B) |
(5.9 | ) | (48.1 | ) | ||||
|
Deferred development fees, net of portion related to the Company’s interest |
(2.9 | ) | (3.6 | ) | ||||
|
Notes and accrued interest payable to DDR |
34.3 | 3.0 | ||||||
|
|
|
|
|
|||||
|
Investments in and Advances to Joint Ventures |
$ | 613.0 | $ | 353.9 | ||||
|
|
|
|
|
|||||
| (A) | Primarily relates to a $154.6 million preferred equity investment in BRE DDR Retail Holdings, LLC. See discussion regarding this newly formed unconsolidated joint venture later in this footnote. |
| (B) | This amount represents the aggregate difference between the Company’s historical cost basis and the equity basis reflected at the joint venture level. Basis differentials recorded upon transfer of assets are primarily associated with assets previously owned by the Company that have been transferred into an unconsolidated joint venture at fair value. Other basis differentials occur primarily when the Company has purchased interests in existing unconsolidated joint ventures at fair market values, which differ from its proportionate share of the historical net assets of the unconsolidated joint ventures. In addition, certain transaction and other costs, including capitalized interest, reserves on notes receivable as discussed below and impairments of the Company’s investments that were other than temporary may not be reflected in the net assets at the joint venture level. Certain basis differentials indicated above are amortized over the life of the related assets. |
Service fees and income earned by the Company through management, financing, leasing and development activities performed related to all of the Company’s unconsolidated joint ventures are as follows (in millions):
|
For the Year Ended
December 31, |
||||||||||||
| 2012 | 2011 | 2010 | ||||||||||
|
Management and other fees |
$ | 28.6 | $ | 29.8 | $ | 34.0 | ||||||
|
Financing and other fees |
— | 0.1 | 0.3 | |||||||||
|
Development fees and leasing commissions |
8.7 | 7.0 | 7.2 | |||||||||
|
Interest income |
9.7 | 0.1 | 0.4 | |||||||||
The Company’s joint venture agreements generally include provisions whereby each partner has the right to trigger a purchase or sale of its interest in the joint venture (Reciprocal Purchase Rights) or to initiate a purchase or sale of the properties (Property Purchase Rights) after a certain number of years or if either party is in default of the joint venture agreements. The Company is not obligated to purchase the interests of its outside joint venture partners under these provisions.
F-19
Table of Contents
BRE DDR Retail Holdings, LLC
In June 2012, a joint venture between consolidated affiliates of the Company and The Blackstone Group L.P. (“Blackstone”) acquired a portfolio of 46 shopping centers aggregating 10.6 million square feet of gross leasable area (“GLA”) (all references to GLA or square feet are unaudited). These assets were previously owned by EPN Group and managed by the Company. An affiliate of Blackstone owns 95% of the common equity of the joint venture, and the remaining 5% common equity interest is owned by a consolidated affiliate of the Company. The transaction was valued at $1.4 billion. The joint venture assumed $635.6 million of senior non-recourse debt at face value and entered into an additional $320.0 million of non-recourse debt with a three-year term and two one-year extension options. The Company contributed $17.0 million to the joint venture for its common equity interest and also funded the joint venture with an investment in $150.0 million in preferred equity of the venture. The preferred equity has a fixed distribution rate of 10% per annum, which is recognized as interest income within the Company’s consolidated statements of operations and is classified as a note receivable in Investments in and Advances to Joint Ventures on the Company’s consolidated balance sheets. The preferred equity entitles the Company to certain preferential cumulative distributions payable out of operating and capital proceeds pursuant to the terms and conditions of the preferred equity. Blackstone has the right to defer up to 20% of the preferred equity fixed distribution. Any deferred and unpaid preferred equity distributions will continue to accrue at a fixed distribution rate of 10% per annum. The preferred equity is redeemable: (1) at Blackstone’s option, in part, after 18 months following acquisition of the properties, and in full, after two years following acquisition of the properties; (2) at DDR’s option after seven years; (3) at varying levels based upon specified financial covenants upon a sale of properties over a certain threshold and (4) upon the incurrence of additional indebtedness by the joint venture. The Company provides leasing and property management services to all of the joint venture properties and will have the right of first offer to acquire 10 of the assets under specified conditions. The Company cannot be removed as the property and leasing manager until the preferred equity is redeemed in full (except for certain specified events).
Sonae Sierra Brasil
In 2012, the Company’s one-third-owned joint venture, Sonae Sierra Brasil, completed a strategic asset swap and partial sale that resulted in a majority ownership interest in Shopping Plaza Sul, an enclosed mall in Sao Paulo. Sonae Sierra Brasil acquired an additional 30% interest in Shopping Plaza Sul in exchange for transferring a 22% stake in Shopping Penha and $29 million in cash. As a result of these transactions, Sonae Sierra Brasil increased its ownership interest in Shopping Plaza Sul to 60% and decreased its interest in Shopping Penha to 51%. The Company’s proportionate share of the net gain on the partial sale of its interest in Shopping Penha was $2.8 million. In addition, in 2012, Sonae Sierra Brasil sold its 10% ownership interest in Patio Brasil, its remaining 51% interest in Shopping Penha and its 30% interest in Tivoli Shopping, for approximately $103 million ($34 million at DDR’s share). As the joint venture will continue to manage two of the assets pursuant to management contracts, only one of these assets is classified as discontinued operations in the condensed combined statements of operations. The weighted-average exchange rate used for recording the equity in net income was 1.94, 1.67 and 1.77 for the years ended December 31, 2012, 2011 and 2010, respectively.
Coventry II Fund
The Company and Coventry Real Estate Advisors L.L.C. (“CREA”) formed Coventry Real Estate Fund II L.L.C. and Coventry Fund II Parallel Fund, L.L.C. (collectively, the “Coventry II Fund”) to invest in a variety of retail properties that presented opportunities for value creation, such as re-tenanting, market repositioning, resale, redevelopment or expansion. The Coventry II Fund was formed with several institutional investors and CREA as the investment manager.
In the third quarter of 2012, the Company recorded a $26.1 million impairment charge on its investment in the Coventry II Montgomery Farm LLC joint venture that owned a mixed-use project located in Allen, TX, and satisfied its remaining guaranty of the construction loan. The Company determined that its investment had
F-20
Table of Contents
suffered an other than temporary impairment due to the deteriorating relations between the lender and the Company’s partner and the resulting impact on the asset’s value. In the fourth quarter of 2012, the Company subsequently sold its interest in this joint venture to the lender and recorded a $7.5 million Gain on Change in Control and Sale of Interests. At December 31, 2012, the aggregate carrying amount of the Company’s net investment in the Coventry II Fund joint ventures was $3.6 million. See discussion of legal matters surrounding the Coventry II Fund (Note 9).
Other Joint Venture Interests
In 2012, the Company purchased its unconsolidated joint venture partners’ ownership interests, held through three different joint ventures, in five assets, for an aggregate purchase price of $339.4 million. The Company recorded an aggregate Gain on Change in Control and Sale of Interests of $80.0 million related to the difference between the Company’s carrying value and fair value of the previously held equity interest for the year ended December 31, 2012. At closing, $246.2 million of aggregate mortgage debt was repaid. Upon acquisition, these shopping centers were consolidated into the results from operations.
In December 2012, the Company reduced its interest in a previously consolidated joint venture that owned land held for development in Richmond Hill, Canada. The Company sold a portion of its interest to a third party reducing its ownership from 50% to 10%. Due to the change in control that occurred, the Company deconsolidated the joint venture and accounts for its retained interest on the equity method of accounting. The Company recorded a $9.3 million Loss on Change in Control and Sale of Interests related to the transaction.
In 2012, the DDRTC Core Retail Fund, LLC joint venture, in which the Company has a 15% ownership interest, refinanced $698.7 million of maturing mortgage debt. The mortgage note payable of $540.0 million was modified through the same lender and required a cash payment of $76.0 million, of which the Company’s proportionate share was $11.4 million. The modified mortgage note payable has a three-year term with two one-year options and an interest rate of 4.63%. The joint venture also entered into a term loan of $190.0 million to repay a $158.7 million revolving credit facility. Also in 2012, the joint venture exercised an accordion feature resulting in a mortgage balance outstanding at December 31, 2012, of $214.5 million. The term loan has a three-year term with two one-year options and an interest rate of LIBOR plus 275 basis points.
Discontinued Operations
Included in discontinued operations in the combined statements of operations for the unconsolidated joint ventures are seven properties sold in 2012, eight properties sold in 2011 and 37 properties sold in 2010.
F-21
Table of Contents
3. Acquisitions
In 2012 and 2011, the Company acquired the following shopping centers:
|
Location |
Date Acquired |
Gross
Purchase Price (in millions) |
Face Value of
Mortgage Debt Assumed (in millions) |
|||||||||||||||
|
Raleigh, North Carolina |
December 2012 | $ | 44.8 | N/A | ||||||||||||||
|
Charlotte, North Carolina |
December 2012 | 106.4 | N/A | |||||||||||||||
|
Independence, Missouri |
(A | ) | September 2012 | 57.8 | $ | 33.6 | (B | ) | ||||||||||
|
St. Louis, Missouri |
(A | ) | September 2012 | 6.5 | 3.4 | (B | ) | |||||||||||
|
Tucson, Arizona |
August 2012 | 125.4 | 24.4 | |||||||||||||||
|
Phoenix, Arizona |
(A | ) | July 2012 | 137.3 | 105.4 | (B | ) | |||||||||||
|
Phoenix, Arizona |
(A | ) | April 2012 | 59.9 | 47.2 | (B | ) | |||||||||||
|
Portland, Oregon |
(A | ) | April 2012 | 77.9 | 56.6 | (B | ) | |||||||||||
|
Chicago, Illinois |
March 2012 | 47.4 | N/A | |||||||||||||||
|
Columbus, Ohio |
December 2011 | 79.6 | 45.2 | |||||||||||||||
|
Charlotte, North Carolina |
September 2011 | 74.0 | 50.8 | |||||||||||||||
|
Charlotte, North Carolina |
September 2011 | 11.0 | 6.6 | |||||||||||||||
|
Colorado Springs, Colorado |
September 2011 | 25.0 | 9.6 | |||||||||||||||
|
Macedonia, Ohio and Maple Grove, Minnesota |
(A | ) | January and March 2011 | 79.7 | 50.2 | (B | ) | |||||||||||
| (A) | Acquired from unconsolidated joint venture. Due to the change in control that occurred, the Company recorded an aggregate gain of $80.0 million and $22.7 million for the years ended December 31, 2012 and 2011, respectively, associated with these acquisitions related to the difference between the Company’s carrying value and fair value of its previously held equity interest on the respective acquisition date. |
| (B) | Mortgage repaid at closing. |
The acquisition costs were allocated as follows (in thousands):
|
Weighted Average
Amortization Period (in Years) |
||||||||||||||||
| 2012 | 2011 | 2012 | 2011 | |||||||||||||
|
Land |
$ | 118,360 | $ | 73,415 | N/A | N/A | ||||||||||
|
Buildings |
461,794 | 183,068 | N/A | N/A | ||||||||||||
|
Tenant improvements |
14,479 | 3,678 | N/A | N/A | ||||||||||||
|
In-place leases (including lease origination costs and fair market value of leases) (A) |
51,059 | 18,069 | 6.2 | 5.0 | ||||||||||||
|
Tenant relations |
45,100 | 16,977 | 9.3 | 9.6 | ||||||||||||
|
|
|
|
|
|||||||||||||
| 690,792 | 295,207 | |||||||||||||||
|
Less: Mortgage debt assumed |
(25,414 | ) | (122,885 | ) | N/A | N/A | ||||||||||
|
Less: Below-market leases |
(26,162 | ) | (14,300 | ) | 18.4 | 16.5 | ||||||||||
|
|
|
|
|
|||||||||||||
|
Net assets acquired |
$ | 639,216 | $ | 158,022 | ||||||||||||
|
|
|
|
|
|||||||||||||
| (A) | Includes above-market value of leases of $11.8 million and $1.4 million for 2012 and 2011, respectively. |
| 2012 | 2011 | |||||||
|
Consideration: |
||||||||
|
Cash (including debt repaid at closing) |
$ | 596,008 | $ | 143,063 | ||||
|
Fair value of previously held equity interests ( A ) |
43,208 | 14,959 | ||||||
|
|
|
|
|
|||||
|
Total consideration |
$ | 639,216 | $ | 158,022 | ||||
|
|
|
|
|
|||||
F-22
Table of Contents
| (A) | Prior to the acquisition, the Company’s investment basis was negative due to deferred gains and distributions in excess of equity in net income. The Company’s intent was to fund any share of future operating deficits if the need arose, even though there was no such legal obligation to fund such amounts. |
The costs related to acquisitions, which were not material, were expensed as incurred and included in other income (expense), net.
The following unaudited supplemental pro forma operating data is presented for the year ended December 31, 2012, as if the acquisition of the interests in the properties acquired in 2012 were completed on January 1, 2011. The following unaudited supplemental pro forma operating data is presented for the years ended December 31, 2011 and 2010, as if the acquisition of the interests in the properties acquired in 2011 were completed on January 1, 2010. The Gain on Change in Control related to the acquisitions from unconsolidated joint ventures were adjusted to the assumed acquisition date. The unaudited supplemental pro forma operating data is not necessarily indicative of what the actual results of operations of the Company would have been assuming the transactions had been completed as set forth above, nor do they purport to represent the Company’s results of operations for future periods.
|
For the Years
Ended December 31,
(in thousands, except per share amounts) (Unaudited) |
||||||||||||
| 2012 | 2011 | 2010 | ||||||||||
|
Pro forma revenues |
$ | 835,454 | $ | 822,719 | $ | 766,917 | ||||||
|
|
|
|
|
|
|
|||||||
|
Pro forma (loss) income from continuing operations |
$ | (92,582 | ) | $ | 48,461 | $ | (144,755 | ) | ||||
|
|
|
|
|
|
|
|||||||
|
Pro forma loss from discontinued operations |
$ | (16,416 | ) | $ | (18,590 | ) | $ | (86,786 | ) | |||
|
|
|
|
|
|
|
|||||||
|
Pro forma net (loss) income attributable to DDR common shareholders |
$ | (138,077 | ) | $ | 2,504 | $ | (234,129 | ) | ||||
|
|
|
|
|
|
|
|||||||
|
Per share data: |
||||||||||||
|
Basic earnings per share data: |
||||||||||||
|
(Loss) income from continuing operations attributable to DDR common shareholders |
$ | (0.41 | ) | $ | 0.07 | $ | (0.71 | ) | ||||
|
Loss from discontinued operations attributable to DDR common shareholders |
(0.05 | ) | (0.06 | ) | (0.25 | ) | ||||||
|
|
|
|
|
|
|
|||||||
|
Net (loss) income attributable to DDR common shareholders |
$ | (0.46 | ) | $ | 0.01 | $ | (0.96 | ) | ||||
|
|
|
|
|
|
|
|||||||
|
Diluted earnings per share data: |
||||||||||||
|
Loss from continuing operations attributable to DDR common shareholders |
$ | (0.41 | ) | $ | (0.01 | ) | $ | (0.71 | ) | |||
|
Loss from discontinued operations attributable to DDR common shareholders |
(0.05 | ) | (0.06 | ) | (0.25 | ) | ||||||
|
|
|
|
|
|
|
|||||||
|
Net loss attributable to DDR common shareholders |
$ | (0.46 | ) | $ | (0.07 | ) | $ | (0.96 | ) | |||
|
|
|
|
|
|
|
|||||||
4. Notes Receivable
The Company has notes receivable, including accrued interest, that are collateralized by certain rights in development projects, partnership interests, sponsor guaranties and/or real estate assets, some of which are subordinate to other financings.
F-23
Table of Contents
Notes receivable consist of the following (in millions):
| December 31, | Maturity Date | Interest Rate | ||||||||||
| 2012 | 2011 | |||||||||||
|
Loans receivable (A) |
$ | 60.4 | $ | 84.5 |
September 2011 to
November 2022 |
5.7% -14.0% | ||||||
|
Other notes |
3.1 | 3.0 |
November 2014 to
September 2017 |
8.5% - 12.0% | ||||||||
|
Tax Increment Financing Bonds (“TIF Bonds”) (B) |
5.2 | 6.4 |
April 2014 to
July 2026 |
5.5% - 8.5% | ||||||||
|
|
|
|
|
|||||||||
| $ | 68.7 | $ | 93.9 | |||||||||
|
|
|
|
|
|||||||||
| (A) | Amounts include loans in default and exclude notes receivable and advances from unconsolidated joint ventures at December 31, 2012 and 2011 (Note 2). |
| (B) | Principal and interest are payable solely from the incremental real estate taxes, if any, generated by the respective shopping center and development project pursuant to the terms of the financing agreement. |
As of December 31, 2012 and 2011, the Company had six loans receivable. The following table summarizes the activity in loans receivable on real estate from January 1, 2011, to December 31, 2012 (in thousands):
| 2012 | 2011 | |||||||
|
Balance at January 1 |
$ | 84,541 | $ | 103,705 | ||||
|
Additions: |
||||||||
|
New mortgage loans |
10,239 | 10,000 | ||||||
|
Interest |
876 | 811 | ||||||
|
Accretion of discount |
826 | 780 | ||||||
|
Deductions: |
||||||||
|
Payments of principal |
(104 | ) | (25,755 | ) | ||||
|
Loan loss reserve (A) |
(4,300 | ) | (5,000 | ) | ||||
|
Other (B) |
(31,700 | ) | — | |||||
|
|
|
|
|
|||||
|
Balance at December 31 |
$ | 60,378 | $ | 84,541 | ||||
|
|
|
|
|
|||||
| (A) | Amount classified in other expense, net in the consolidated statement of operations for both periods presented. In 2011, this reserve was written off upon the sale of the note. |
| (B) | Loan assumed by the Company’s unconsolidated joint venture BRE DDR Retail Holdings, LLC and reclassified into Investments in and Advances to Joint Ventures in the Company’s consolidated balance sheet at December 31, 2012 upon the Company’s acquisition of the equity interest. |
The following table summarizes the activity in the loan loss reserve from January 1, 2010, to December 31, 2012 (in thousands):
| 2012 | 2011 | 2010 | ||||||||||
|
Balance at January 1 |
$ | 10,806 | $ | 10,806 | $ | 10,806 | ||||||
|
Additions: |
||||||||||||
|
Loan loss reserve |
4,300 | 5,000 | (A) | — | ||||||||
|
Deductions: |
||||||||||||
|
Write downs |
— | (5,000 | ) (A) | — | ||||||||
|
|
|
|
|
|
|
|||||||
|
Balance at December 31 |
$ | 15,106 | $ | 10,806 | $ | 10,806 | ||||||
|
|
|
|
|
|
|
|||||||
| (A) |
In 2011, the Company sold a note receivable with a face value, including accrued interest, of $11.8 million for proceeds of $6.8 million, which resulted in the recognition of a $5.0 million reserve. At December 31, |
F-24
Table of Contents
| 2010, this note was more than 90 days past due on interest payments. A loan loss reserve had not been previously established based on the estimated value of the underlying real estate collateral. |
At December 31, 2012, the Company had one loan outstanding aggregating $9.8 million that matured in September 2011 and was more than 90 days past due. The Company is no longer accruing interest income on this note as no payments have been received. A loan loss reserve of $4.3 million was established in 2012 based on the estimated value of the underlying real estate collateral.
5. Other Assets
Other assets consist of the following (in thousands):
| December 31, | ||||||||
| 2012 | 2011 | |||||||
|
Intangible assets: |
||||||||
|
In-place leases (including lease origination costs and fair market value of leases), net |
$ | 67,105 | $ | 24,798 | ||||
|
Tenant relations, net |
62,175 | 22,772 | ||||||
|
|
|
|
|
|||||
|
Total intangible assets, net |
129,280 | 47,570 | ||||||
|
Other assets: |
||||||||
|
Prepaid expenses |
12,469 | 10,375 | ||||||
|
Deposits |
10,580 | 6,788 | ||||||
|
Other assets (A) |
29,821 | 2,893 | ||||||
|
|
|
|
|
|||||
|
Total other assets |
$ | 182,150 | $ | 67,626 | ||||
|
|
|
|
|
|||||
| (A) | Includes deferred tax asset (Note 16). |
The Company recorded amortization expense related to its intangible assets, excluding the fair market value of leases, of $17.5 million, $8.2 million and $6.6 million for the years ended December 31, 2012, 2011 and 2010, respectively. The estimated future amortization expense associated with the Company’s intangible assets, excluding the fair market value of leases, is $24.8 million, $19.5 million, $15.3 million, $12.6 million and $9.6 million for the years ending December 31, 2013, 2014, 2015, 2016 and 2017, respectively.
During 2012, the Company identified an error in the consolidated financial statements related to prior years. The error was attributable to a purchase price allocation of an asset acquired in 2004 and related amortization of the intangible asset. The Company concluded that the adjustment was not material to the results for the year ended December 31, 2012, or any prior periods. Consequently, the Company recorded an out-of-period adjustment to increase Net Loss attributable to DDR by $1.5 million in 2012. The Company also decreased land and increased other assets by $4.4 million on the consolidated balance sheet.
F-25
Table of Contents
6. Revolving Credit Facilities, Term Loans, Mortgages Payable and Scheduled Principal Repayments
The following table discloses certain information regarding the Company’s revolving credit facilities, term loan and mortgages payable (in millions):
|
Carrying Value
at December 31, |
Weighted-
Average Interest Rate at December 31, |
Maturity Date
at December 31, 2012 |
||||||||||||||||||
| 2012 | 2011 | 2012 | 2011 | |||||||||||||||||
|
Unsecured indebtedness: |
||||||||||||||||||||
|
Unsecured Credit Facility |
$ | 117.9 | $ | 102.4 | 2.2 | % | 2.7 | % | February 2016 | |||||||||||
|
PNC Facility |
30.0 | 40.0 | 1.9 | % | 1.9 | % | February 2016 | |||||||||||||
|
Unsecured Term Loan — Tranche 1 |
50.0 | — | 2.3 | % | N/A | January 2017 | ||||||||||||||
|
Unsecured Term Loan — Tranche 2 |
300.0 | — | 3.4 | % | N/A | January 2019 | ||||||||||||||
|
Secured indebtedness: |
||||||||||||||||||||
|
Secured Term Loan |
400.0 | 500.0 | 2.2 | % | 3.0 | % | September 2014 | |||||||||||||
|
Mortgage indebtedness — Fixed Rate |
1,187.9 | 1,230.4 | 4.9 | % | 5.4 | % |
|
March 2013 -
February 2022 |
|
|||||||||||
|
Mortgage indebtedness — Variable Rate |
86.2 | 91.0 | 1.7 | % | 2.0 | % |
|
April 2013 -
December 2037 |
|
|||||||||||
|
Tax-exempt certificates — Fixed Rate |
— | 1.0 | — | 6.9 | % | N/A | ||||||||||||||
Revolving Credit Facilities
The Company maintains an unsecured revolving credit facility with a syndicate of financial institutions arranged by JP Morgan Securities, LLC and Wells Fargo Securities, LLC (the “Unsecured Credit Facility”). The Unsecured Credit Facility provides for borrowings of up to $750 million, if certain financial covenants are maintained, and an accordion feature for expansion of availability to $1.25 billion upon the Company’s request, provided that new or existing lenders agree to the existing terms of the facility and increase their commitment level. The Unsecured Credit Facility includes a competitive bid option on periodic interest rates for up to 50% of the facility. The Unsecured Credit Facility also provides for an annual facility fee, which was 35 basis points on the entire facility at December 31, 2012. The Unsecured Credit Facility also allows for foreign currency-denominated borrowings. At December 31, 2012, the Company had US$6.2 million of Euro-denominated borrowings and US$51.7 million of Canadian dollar borrowings outstanding (Note 8). The Unsecured Credit Facility was amended in 2013 (Note 18).
The Company also maintains a $65 million unsecured revolving credit facility with PNC Bank, National Association (the “PNC Facility” and, together with the Unsecured Credit Facility, the “Revolving Credit Facilities”). The PNC Facility reflects terms consistent with those contained in the Unsecured Credit Facility. The PNC Facility was amended in 2013 (Note 18).
The Company’s borrowings under the Revolving Credit Facilities bear interest at variable rates at the Company’s election, based on either (i) the prime rate plus a specified spread (0.65% at December 31, 2012), as defined in the respective facility, or (ii) LIBOR, plus a specified spread (1.65% at December 31, 2012). The specified spreads vary depending on the Company’s long-term senior unsecured debt rating from Moody’s Investors Service (“Moody’s”) and Standard and Poor’s. The Company is required to comply with certain covenants under the Revolving Credit Facilities relating to total outstanding indebtedness, secured indebtedness, maintenance of unencumbered real estate assets and fixed charge coverage. The Company was in compliance with these covenants at December 31, 2012.
Unsecured Term Loan
In 2012, the Company entered into a $350 million unsecured term loan (the “Unsecured Term Loan”) with a syndicate of financial institutions, for which Wells Fargo Bank National Association and PNC Bank serve as the
F-26
Table of Contents
administrative agents. As of December 31, 2012, the Unsecured Term Loan consisted of a $50 million tranche (“Tranche 1”) and a $300 million tranche (“Tranche 2”). The Unsecured Term Loan bears interest at variable rates based on LIBOR, as defined in the loan agreement, plus a specified spread based on the Company’s long-term senior unsecured debt rating (1.7% and 2.1% for Tranche 1 and Tranche 2, respectively, at December 31, 2012). The Company is required to comply with covenants similar to those contained in the Revolving Credit Facilities. The Company was in compliance with these covenants at December 31, 2012.
Secured Term Loan
The Company maintains a collateralized term loan with a syndicate of financial institutions, for which KeyBank National Association serves as the administrative agent (the “Secured Term Loan” together with the Unsecured Term Loan, “Term Loans”). The Secured Term Loan provides for borrowings of $500 million with an accordion feature for expansion up to $600 million upon the Company’s request, provided that new or existing lenders agree to the existing terms of the facility and increase their commitment level. The Secured Term Loan matures in September 2014 with a one-year extension option. Borrowings under the Secured Term Loan bear interest at variable rates based on LIBOR, as defined in the loan agreement, plus a specified spread (1.7% at December 31, 2012) based on the Company’s long-term senior unsecured debt rating. The collateral for the Secured Term Loan is real estate assets, or investment interests in certain assets, that are already encumbered by first mortgage loans. The Company is required to comply with covenants similar to those contained in the Revolving Credit Facilities. The Company was in compliance with these covenants at December 31, 2012. The Secured Term Loan was amended in 2013 (Note 18).
Mortgages Payable
At December 31, 2012, mortgages payable, collateralized by investments and real estate with a net book value of $2.2 billion, and related tenant leases are generally due in monthly installments of principal and/or interest. Fixed interest rates on mortgages payable range from approximately 3.4% to 9.8%.
Scheduled Principal Repayments
As of December 31, 2012, the scheduled principal payments of the Revolving Credit Facilities, Term Loans, senior notes (Note 7) and mortgages payable, excluding extension options, for the next five years and thereafter are as follows (in thousands):
|
Year |
Amount | |||
|
2013 |
$ | 66,640 | ||
|
2014 |
772,829 | |||
|
2015 |
514,546 | |||
|
2016 |
459,705 | |||
|
2017 |
375,293 | |||
|
Thereafter |
2,118,627 | |||
|
|
|
|||
| 4,307,640 | ||||
|
Unamortized fair market value of assumed debt |
11,503 | |||
|
|
|
|||
|
Total indebtedness |
$ | 4,319,143 | ||
|
|
|
|||
Total gross fees paid by the Company for the Revolving Credit Facilities and Term Loans in 2012, 2011 and 2010 aggregated $3.0 million, $4.0 million and $2.9 million, respectively. For the years ended December 31, 2012, 2011 and 2010, the Company incurred debt extinguishment costs (including the write-off of unamortized debt issuance costs) associated with the prepayment of mortgages payable of $0.4 million, $7.9 million and $4.2 million, respectively, which are reflected in other expense in the Company’s consolidated statements of operations.
F-27
Table of Contents
7. Senior Notes
The following table discloses certain information regarding the Company’s Fixed-Rate Senior Notes (in millions):
|
Carrying Value
at
December 31, |
Coupon Rate
at December 31, 2012 |
Effective Interest
Rate at December 31, 2012 |
Maturity Date
at
December 31, 2012 |
|||||||||||
| 2012 | 2011 | |||||||||||||
|
Unsecured indebtedness: |
||||||||||||||
|
Senior Notes |
$ | 1,825.2 | $ | 1,658.6 | 4.625% – 9.625% | 4.8% – 9.9% |
May 2015 -
July 2022 |
|||||||
|
Senior Notes — Premium (Discount), net |
4.0 | (5.4 | ) | |||||||||||
|
Senior Convertible Notes due 2040, net (A) |
317.9 | 307.6 | 1.75% | 5.3% | November 2040 | |||||||||
|
Senior Convertible Notes due 2012, net |
— | 178.9 | N/A | N/A | N/A | |||||||||
|
|
|
|
|
|||||||||||
|
Total Senior Notes |
$ | 2,147.1 | $ | 2,139.7 | ||||||||||
|
|
|
|
|
|||||||||||
| (A) | The Company may redeem the senior convertible notes any time on or after November 15, 2015, in whole or in part, for cash equal to 100% of the principal amount of the notes plus accrued and unpaid interest through, but excluding, the redemption date. In addition, the holders of the senior convertible notes may require the Company to repurchase their notes in whole or in part on specified dates, the first of which is November 15, 2015. |
In 2012, the Company issued $450 million aggregate principal amount of 4.625% senior unsecured notes due July 2022. In June 2012, $300 million of these notes were sold at a discount to par of 98.104%, and in November 2012, $150 million were sold at a premium to par of 109.223%.
The senior convertible notes are senior unsecured obligations and rank equally with all other senior unsecured indebtedness of the Company. The senior convertible notes may be converted prior to maturity into cash equal to the lesser of the principal amount of the note or the conversion value and, to the extent the conversion value exceeds the principal amount of the note, the Company’s common shares. The senior convertible notes are subject to net settlement based on conversion prices (“Conversion Price”) that are subject to adjustment based on increases in the Company’s quarterly common share dividend. If certain conditions are met, the incremental value can be settled in cash or in the Company’s common shares at the Company’s option. The senior convertible notes may only be converted prior to maturity based on certain provisions in the governing note documents. In connection with the issuance of these notes, the Company entered into a registration rights agreement for the common shares that may be issuable upon conversion of the senior convertible notes. The senior convertible notes due 2040 have a conversion price of $15.76 and $16.19 at December 31, 2012 and 2011, respectively. The senior convertible notes due 2040 are convertible based on certain circumstances including, but not limited to, the Company’s closing sale price of its common shares for at least 20 trading days (whether or not consecutive) in the period of 30 consecutive trading days ending on the last trading day of the preceding fiscal quarter is greater than 125% of the conversion price per common share in effect on the applicable trading day.
The Company’s carrying amounts of its debt and equity balances for the senior convertible notes are as follows (in thousands):
| December 31, | ||||||||
| 2012 | 2011 | |||||||
|
Carrying value of equity component |
$ | 52,497 | $ | 69,217 | ||||
|
|
|
|
|
|||||
|
Principal amount of senior convertible notes |
$ | 350,000 | $ | 529,509 | ||||
|
Remaining unamortized debt discount |
(32,120 | ) | (43,004 | ) | ||||
|
|
|
|
|
|||||
|
Net carrying value of senior convertible notes |
$ | 317,880 | $ | 486,505 | ||||
|
|
|
|
|
|||||
F-28
Table of Contents
As of December 31, 2012, the remaining amortization period for the debt discount was 34 months for the senior convertible notes, the period during which the debt is expected to be outstanding (i.e., through the first optional redemption date or maturity date).
During the years ended December 31, 2012, 2011 and 2010, the Company purchased $60.0 million, $36.1 million and $259.1 million, respectively, aggregate principal amount of its outstanding senior unsecured notes. The Company recorded a net loss on retirement of $13.5 million and $0.1 million in 2012 and 2011, respectively, and a net gain of $0.1 million in 2010. The Company allocated the consideration paid for the senior convertible notes due 2011 and 2012 ($19.4 million and $140.6 million repurchased in 2011 and 2010, respectively) between the liability components and equity components based on the fair value of those components immediately prior to the purchases and recorded a gain based on the difference in the amount of consideration paid as compared to the carrying amount of the debt, net of the unamortized discount. The net loss on retirement recorded for the years ended December 31, 2011 and 2010, reflected a decrease of $0.1 million and $4.9 million, respectively, related to the impact of the convertible debt accretion.
The Company’s various fixed-rate senior notes have interest coupon rates averaging 5.8% and 5.9% at December 31, 2012 and 2011, respectively. Senior notes with an aggregate principal amount of $82.2 million may not be redeemed by the Company prior to maturity and will not be subject to any sinking fund requirements. The remaining senior notes may be redeemed based upon a yield maintenance calculation.
The fixed-rate senior notes and senior convertible notes were issued pursuant to indentures that contain certain covenants, including limitation on incurrence of debt, maintenance of unencumbered real estate assets and debt service coverage. Interest is paid semi-annually in arrears. At December 31, 2012 and 2011, the Company was in compliance with all of the financial and other covenants.
8. Financial Instruments
The following methods and assumptions were used by the Company in estimating fair value disclosures of financial instruments:
Fair Value Hierarchy
The standard Fair Value Measurements specifies a hierarchy of valuation techniques based upon whether the inputs to those valuation techniques reflect assumptions other market participants would use based upon market data obtained from independent sources (observable inputs). The following summarizes the fair value hierarchy:
|
• Level 1 |
Quoted prices in active markets that are unadjusted and accessible at the measurement date for identical, unrestricted assets or liabilities; | |
|
• Level 2 |
Quoted prices for identical assets and liabilities in markets that are inactive, quoted prices for similar assets and liabilities in active markets or financial instruments for which significant inputs are observable, either directly or indirectly, such as interest rates and yield curves that are observable at commonly quoted intervals and | |
|
• Level 3 |
Prices or valuations that require inputs that are both significant to the fair value measurement and unobservable. | |
In certain cases, the inputs used to measure fair value may fall into different levels of the fair value hierarchy. In such cases, the level in the fair value hierarchy within which the fair value measurement in its entirety falls has been determined based on the lowest level input that is significant to the fair value measurement in its entirety. The Company’s assessment of the significance of a particular input to the fair value measurement in its entirety requires judgment and considers factors specific to the asset or liability.
F-29
Table of Contents
Cash Flow and Fair Value Hedges
In 2012, the Company entered into treasury locks with an aggregate notional amount of $200.0 million. The treasury locks were terminated in connection with the issuance of the $300.0 million aggregate principal amount of senior notes in June 2012, resulting in a payment of $4.7 million to the counterparty. The treasury locks were executed to hedge the benchmark interest rate associated with forecasted interest payments associated with the then-anticipated issuance of fixed-rate borrowings. The effective portion of these hedging relationships has been deferred in accumulated other comprehensive income and will be reclassified into earnings over the term of the debt as an adjustment to interest expense, based on the effective-yield method. The amount of hedge ineffectiveness recorded was not material.
In 2012, the Company entered into eight interest rate swaps with an aggregate notional amount of $450.0 million. These swaps were executed to hedge the benchmark interest rate risk associated with a portion of the Company’s variable-rate borrowings.
Measurement of Fair Value
At December 31, 2012 and 2011, the Company used pay-fixed interest rate swaps to manage its exposure to changes in benchmark interest rates (the “Swaps”). The estimated fair values were determined using the market standard methodology of netting the discounted fixed cash payments and the discounted expected variable cash receipts. The variable cash receipts are based on an expectation of interest rates (forward curves) derived from observable market interest rate curves. In addition, credit valuation adjustments, which consider the impact of any credit enhancements to the contracts, are incorporated in the fair values to account for potential non-performance risk, including the Company’s own non-performance risk and the respective counterparty’s non-performance risk. The Company determined that the significant inputs used to value its derivatives fell within Level 2 of the fair value hierarchy.
Items Measured at Fair Value on a Recurring Basis
The following table presents information about the Company’s financial assets and liabilities, which consist of interest rate swap agreements (included in Other Liabilities) and marketable securities (included in Other Assets) from investments in the Company’s Elective Deferred Compensation Plan (Note 14) at December 31, 2012 and 2011, measured at fair value on a recurring basis as of December 31, 2012 and 2011, and indicates the fair value hierarchy of the valuation techniques used by the Company to determine such fair value (in millions):
| Fair Value Measurements | ||||||||||||||||
|
Assets (Liabilities): |
Level 1 | Level 2 | Level 3 | Total | ||||||||||||
|
December 31, 2012 |
||||||||||||||||
|
Derivative Financial Instruments |
$ | — | $ | (17.1 | ) | $ | — | $ | (17.1 | ) | ||||||
|
Marketable Securities |
$ | 2.9 | $ | — | $ | — | $ | 2.9 | ||||||||
|
December 31, 2011 |
||||||||||||||||
|
Derivative Financial Instruments |
$ | — | $ | (8.8 | ) | $ | — | $ | (8.8 | ) | ||||||
|
Marketable Securities |
$ | 2.7 | $ | — | $ | — | $ | 2.7 | ||||||||
The unrealized loss of $8.3 million and $3.7 million included in other comprehensive loss (“OCI”) is attributable to the net change in fair value related to derivative liabilities that remained outstanding at December 31, 2012 and 2011, respectively, none of which were reported in the Company’s consolidated statements of operations because they are documented and qualify as hedging instruments.
Other Fair Value Instruments
Investments in unconsolidated joint ventures and equity derivative instruments are considered financial assets. See discussion of fair value considerations of equity derivative instruments in Note 10 and joint venture investments in Note 11.
F-30
Table of Contents
Cash and Cash Equivalents, Restricted Cash, Accounts Receivable, Accounts Payable, Accrued Expenses and Other Liabilities
The carrying amounts reported in the consolidated balance sheets for these financial instruments approximated fair value because of their short-term maturities. The fair value of cash and cash equivalents and restricted cash are classified as Level 1 in the fair value hierarchy.
Notes Receivable and Advances to Affiliates
The fair value is estimated using a discounted cash flow analysis, in which the Company used unobservable inputs such as market interest rates determined by the loan to value and market capitalization rates related to the underlying collateral at which management believes similar loans would be made and classified as Level 3 in the fair value hierarchy. The fair value of these notes was $250.7 million and $90.6 million at December 31, 2012 and 2011, respectively, as compared to the carrying amounts of $250.4 million and $91.0 million, respectively. The carrying value of the TIF bonds, which was $5.2 million and $6.4 million at December 31, 2012 and 2011, respectively, approximated their fair value as of both dates. The fair value of loans to affiliates has been estimated by management based upon its assessment of the interest rate, credit risk and performance risk.
Debt
The fair market value of senior notes, except convertible senior notes, is determined using the trading price of the Company’s public debt. The fair market value for all other debt is estimated using a discounted cash flow technique that incorporates future contractual interest and principal payments and a market interest yield curve with adjustments for duration, optionality and risk profile including the Company’s non-performance risk and loan to value. The Company’s senior notes, except convertible senior notes, and all other debt including convertible senior notes are classified as Level 2 and Level 3, respectively, in the fair value hierarchy.
Considerable judgment is necessary to develop estimated fair values of financial instruments. Accordingly, the estimates presented herein are not necessarily indicative of the amounts the Company could realize on disposition of the financial instruments.
Debt instruments at December 31, 2012 and 2011, with carrying values that are different than estimated fair values, are summarized as follows (in thousands):
| December 31, 2012 | December 31, 2011 | |||||||||||||||
|
Carrying
Amount |
Fair Value |
Carrying
Amount |
Fair Value | |||||||||||||
|
Senior notes |
$ | 2,147,097 | $ | 2,503,127 | $ | 2,139,718 | $ | 2,282,818 | ||||||||
|
Revolving Credit Facilities and Term Loans |
897,905 | 903,210 | 642,421 | 641,854 | ||||||||||||
|
Mortgage indebtedness |
1,274,141 | 1,324,969 | 1,322,445 | 1,352,142 | ||||||||||||
|
|
|
|
|
|
|
|
|
|||||||||
| $ | 4,319,143 | $ | 4,731,306 | $ | 4,104,584 | $ | 4,276,814 | |||||||||
|
|
|
|
|
|
|
|
|
|||||||||
Risk Management Objective of Using Derivatives
The Company is exposed to certain risks arising from both its business operations and economic conditions. The Company principally manages its exposures to a wide variety of business and operational risks through management of its core business activities. The Company manages economic risks, including interest rate, liquidity and credit risk, primarily by managing the amount, sources and duration of its debt funding and, from time to time, the use of derivative financial instruments. Specifically, the Company enters into derivative financial instruments to manage exposures that arise from business activities that result in the receipt or payment of future known and uncertain cash amounts, the values of which are determined by interest rates. The
F-31
Table of Contents
Company’s derivative financial instruments are used to manage differences in the amount, timing and duration of the Company’s known or expected cash receipts and its known or expected cash payments principally related to the Company’s investments and borrowings.
The Company has interests in consolidated joint ventures that own real estate assets in Canada and Russia. The net assets of these subsidiaries are exposed to volatility in currency exchange rates. The Company uses non-derivative financial instruments to economically hedge a portion of this exposure. The Company manages its currency exposure related to the net assets of its Canadian and European subsidiaries through foreign currency-denominated debt agreements.
Cash Flow Hedges of Interest Rate Risk
The Company’s objectives in using interest rate derivatives are to manage its exposure to interest rate movements. To accomplish this objective, the Company generally uses interest rate swaps as part of its interest rate risk management strategy. Swaps designated as cash flow hedges involve the receipt of variable-rate amounts from a counterparty in exchange for the Company making fixed-rate payments over the life of the agreements without exchange of the underlying notional amount.
As of December 31, 2012 and 2011, the aggregate fair value of the Company’s $632.8 million and $284.1 million notional amount of Swaps was a liability of $17.1 million and $8.8 million, respectively, which is included in other liabilities in the consolidated balance sheets. The following table discloses certain information regarding the Company’s ten outstanding interest rate swaps (not including the specified spreads):
|
Aggregate Notional Amount (in millions) |
LIBOR
Fixed Rate |
Maturity Date | ||||
|
$100.0 |
1.0 | % | June 2014 | |||
|
$ 50.0 |
0.6 | % | June 2015 | |||
|
$100.0 |
0.5 | % | July 2015 | |||
|
$ 82.8 |
2.8 | % | September 2017 | |||
|
$100.0 |
0.9 | % | January 2018 | |||
|
$100.0 |
1.6 | % | February 2019 | |||
|
$100.0 |
1.5 | % | February 2019 | |||
All components of the Swaps were included in the assessment of hedge effectiveness. The Company expects that within the next 12 months it will reflect an increase to interest expense (and a corresponding decrease to earnings) of $7.3 million related to the Swaps.
The effective portion of changes in the fair value of derivatives designated, and that qualify, as cash flow hedges is recorded in accumulated OCI and is subsequently reclassified into earnings in the period that the hedged forecasted transaction affects earnings. During 2012, such derivatives were used to hedge the forecasted variable cash flows associated with existing or probable future obligations. The ineffective portion of the change in the fair value of derivatives is recognized directly in earnings. During the three years ended December 31, 2012, the amount of hedge ineffectiveness recorded was not material.
The table below presents the fair value of the Company’s Swaps as well as their classification on the consolidated balance sheets as of December 31, 2012 and 2011, as follows (in millions):
| Liability Derivatives | ||||||||||||
| December 31, 2012 | December 31, 2011 | |||||||||||
|
Derivatives
|
Balance Sheet
Location |
Fair Value |
Balance Sheet
Location |
Fair Value | ||||||||
|
Interest rate products |
Other liabilities | $ | 17.1 | Other liabilities | $ | 8.8 | ||||||
F-32
Table of Contents
The effect of the Company’s derivative instruments on net loss is as follows (in millions):
|
Amount of Gain (Loss)
Recognized in OCI on Derivatives (Effective Portion) |
Location of
Gain (Loss) Reclassified from Accumulated OCI into Income (Effective Portion) |
Amount of Gain (Loss)
Reclassified from Accumulated OCI into Income (Effective Portion) |
||||||||||||||||||||||||
|
Derivatives in Cash Flow Hedging |
Year Ended December 31, | Year Ended December 31, | ||||||||||||||||||||||||
| 2012 | 2011 | 2010 | 2012 | 2011 | 2010 | |||||||||||||||||||||
|
Interest rate products |
$ | (8.3 | ) | $ | (3.6 | ) | $ | 10.2 | Interest expense | $ | (0.9 | ) | $ | (0.1 | ) | $ | 0.4 | |||||||||
The Company is exposed to credit risk in the event of non-performance by the counterparties to the Swaps if the derivative position has a positive balance. The Company believes it mitigates its credit risk by entering into swaps with major financial institutions. The Company continually monitors and actively manages interest costs on its variable-rate debt portfolio and may enter into additional interest rate swap positions or other derivative interest rate instruments based on market conditions. The Company has not entered, and does not plan to enter, into any derivative financial instruments for trading or speculative purposes.
Credit Risk-Related Contingent Features
The Company has agreements with each of its Swap counterparties that contain a provision whereby if the Company defaults on certain of its unsecured indebtedness the Company could also be declared in default on its Swaps, resulting in an acceleration of payment under the Swaps.
Net Investment Hedges
The Company is exposed to foreign exchange risk from its consolidated and unconsolidated international investments. The Company has foreign currency-denominated debt agreements that expose the Company to fluctuations in foreign exchange rates. The Company has designated these foreign currency borrowings as a hedge of its net investment in its Canadian and European subsidiaries. Changes in the spot rate value are recorded as adjustments to the debt balance with offsetting unrealized gains and losses recorded in OCI. Because the notional amount of the non-derivative instrument substantially matches the portion of the net investment designated as being hedged, and the non-derivative instrument is denominated in the functional currency of the hedged net investment, the hedge ineffectiveness recognized in earnings is not material.
The effect of the Company’s net investment hedge derivative instruments on OCI is as follows (in millions):
|
Amount of Gain (Loss)
Recognized in OCI on Derivatives (Effective Portion) |
||||||||||||
| Year Ended December 31, | ||||||||||||
|
Derivatives in Net Investment Hedging Relationships |
2012 | 2011 | 2010 | |||||||||
|
Euro — denominated revolving credit facilities designated as a hedge of the Company’s net investment in its subsidiary |
$ | — | $ | (0.2 | ) | $ | 8.6 | |||||
|
Canadian dollar — denominated revolving credit facilities designated as a hedge of the Company’s net investment in its subsidiaries |
— | (0.4 | ) | (5.6 | ) | |||||||
9. Commitments and Contingencies
Legal Matters
The Company is a party to various joint ventures with the Coventry II Fund, through which 10 existing or proposed retail properties, along with a portfolio of former Service Merchandise locations, were acquired at various times from 2003 through 2006. The properties were acquired by the joint ventures as value-add
F-33
Table of Contents
investments, with major renovation and/or ground-up development contemplated for many of the properties. The Company was generally responsible for day-to-day management of the properties through December 2011. On November 4, 2009, Coventry Real Estate Advisors L.L.C., Coventry Real Estate Fund II, L.L.C. and Coventry Fund II Parallel Fund, L.L.C. (collectively, “Coventry”) filed suit against the Company and certain of its affiliates and officers in the Supreme Court of the State of New York, County of New York. The complaint alleges that the Company: (i) breached contractual obligations under a co-investment agreement and various joint venture limited liability company agreements, project development agreements and management and leasing agreements; (ii) breached its fiduciary duties as a member of various limited liability companies; (iii) fraudulently induced the plaintiffs to enter into certain agreements; and (iv) made certain material misrepresentations. The complaint also requests that a general release made by Coventry in favor of the Company in connection with one of the joint venture properties be voided on the grounds of economic duress. The complaint seeks compensatory and consequential damages in an amount not less than $500 million, as well as punitive damages. In response, the Company filed a motion to dismiss the complaint or, in the alternative, to sever the plaintiffs’ claims. In June 2010, the court granted in part the Company’s motion, dismissing Coventry’s claim that the Company breached a fiduciary duty owed to Coventry (and denying the motion as to the other claims). Coventry filed a notice of appeal regarding that portion of the motion granted by the court. The appeals court affirmed the trial court’s ruling regarding the dismissal of Coventry’s claim for breach of fiduciary duty. The Company filed an answer to the complaint, and has asserted various counterclaims against Coventry. On October 10, 2011, the Company filed a motion for summary judgment, seeking dismissal of all of Coventry’s remaining claims. The motion is currently pending before the court.
The Company believes that the allegations in the lawsuit are without merit and that it has strong defenses against this lawsuit. The Company will continue to vigorously defend itself against the allegations contained in the complaint. This lawsuit is subject to the uncertainties inherent in the litigation process and, therefore, no assurance can be given as to its ultimate outcome and no loss provision has been recorded in the accompanying financial statements because a loss contingency is not deemed probable or estimable. However, based on the information presently available to the Company, the Company does not expect that the ultimate resolution of this lawsuit will have a material adverse effect on the Company’s financial condition, results of operations or cash flows.
On November 18, 2009, the Company filed a complaint against Coventry in the Court of Common Pleas, Cuyahoga County, Ohio, seeking, among other things, a temporary restraining order enjoining Coventry from terminating “for cause” the management agreements between the Company and the various joint ventures because the Company believes that the requisite conduct in a “for-cause” termination (i.e., fraud or willful misconduct committed by an executive of the Company at the level of at least senior vice president) did not occur. The court heard testimony in support of the Company’s motion (and Coventry’s opposition) and, on December 4, 2009, issued a ruling in the Company’s favor. Specifically, the court issued a temporary restraining order enjoining Coventry from terminating the Company as property manager “for cause.” The court found that the Company was likely to succeed on the merits, that immediate and irreparable injury, loss or damage would result to the Company in the absence of such restraint, and that the balance of equities favored injunctive relief in the Company’s favor. The Company filed a motion for summary judgment seeking a ruling by the Court that there was no basis for Coventry’s “for cause” termination as a matter of law. On August 2, 2011, the court entered an order granting the Company’s motion for summary judgment in all respects, finding that, as a matter of law and fact, Coventry did not have the right to terminate the management agreements “for cause.” Coventry filed a notice of appeal, and on March 15, 2012, the Ohio Court of Appeals issued an opinion and order unanimously affirming the trial court’s ruling. No further appeal was undertaken in this case.
In addition to the litigation discussed above, the Company and its subsidiaries are subject to various legal proceedings, which, taken together, are not expected to have a material adverse effect on the Company. The Company is also subject to a variety of legal actions for personal injury or property damage arising in the ordinary course of its business, most of which are covered by insurance. While the resolution of all matters cannot be predicted with certainty, management believes that the final outcome of such legal proceedings and claims will not have a material adverse effect on the Company’s liquidity, financial position or results of operations.
F-34
Table of Contents
Commitments and Guaranties
In conjunction with the development and expansion of various shopping centers, the Company has entered into agreements with general contractors for the construction of shopping centers aggregating approximately $34.9 million as of December 31, 2012.
At December 31, 2012, the Company had outstanding letters of credit of $44.4 million. The Company has not recorded any obligation associated with these letters of credit. The majority of the letters of credit are collateral for existing indebtedness and other obligations of the Company.
In connection with the development of shopping centers owned by certain affiliates, the Company and/or its equity affiliates have agreed to fund the required capital associated with approved development projects aggregating approximately $7.6 million at December 31, 2012. These obligations, composed principally of construction contracts, are generally due in 12 to 36 months, as the related construction costs are incurred, and are expected to be financed through new or existing construction loans, revolving credit facilities and retained capital. The Company is entitled to receive a priority return on these capital advances at a rate of 8.5%.
In connection with certain of the Company’s unconsolidated joint ventures, the Company agreed to fund amounts due to the joint venture’s lender if such amounts are not paid by the joint venture based on the Company’s pro rata share of such amount, aggregating $15.4 million at December 31, 2012.
In connection with Service Holdings LLC, the Company guaranteed the annual base rental income for various affiliates of Service Holdings in the aggregate amount of $2.2 million. The Company has not recorded a liability for the guaranty, as the subtenants of Service Holdings are paying rent as due. The Company has recourse against the other parties in the partnership in the event of default. No assets of the Company are currently held as collateral to pay this guaranty.
The Company has guaranteed certain special assessment and revenue bonds issued by the Midtown Miami Community Development District. The bond proceeds were used to finance certain infrastructure and parking facility improvements. In the event of a debt service shortfall, the Company is responsible for satisfying the shortfall. There are no assets held as collateral or liabilities recorded related to these guaranties. To date, tax revenues have exceeded the debt service payments for these bonds.
Leases
The Company is engaged in the operation of shopping centers that are either owned or, with respect to certain shopping centers, operated under long-term ground leases that expire at various dates through 2070, with renewal options. Space in the shopping centers is leased to tenants pursuant to agreements that provide for terms ranging generally from one month to 30 years and, in some cases, for annual rentals subject to upward adjustments based on operating expense levels, sales volume or contractual increases as defined in the lease agreements.
The scheduled future minimum rental revenues from rental properties under the terms of all non-cancelable tenant leases, assuming no new or renegotiated leases or option extensions for such premises for the subsequent five years ending December 31, are as follows for continuing operations (in thousands):
|
2013 |
$ | 558,615 | ||
|
2014 |
501,262 | |||
|
2015 |
437,489 | |||
|
2016 |
365,587 | |||
|
2017 |
280,403 | |||
|
Thereafter |
1,010,690 | |||
|
|
|
|||
| $ | 3,154,046 | |||
|
|
|
F-35
Table of Contents
Scheduled minimum rental payments under the terms of all non-cancelable operating leases in which the Company is the lessee, principally for office space and ground leases, for the subsequent five years ending December 31, are as follows for continuing operations (in thousands):
|
2013 |
$ | 3,724 | ||
|
2014 |
3,290 | |||
|
2015 |
3,780 | |||
|
2016 |
3,609 | |||
|
2017 |
3,048 | |||
|
Thereafter |
118,557 | |||
|
|
|
|||
| $ | 136,008 | |||
|
|
|
10. Non-Controlling Interests, Preferred Shares, Common Shares and Common Shares in Treasury
Non-Controlling Interests
Non-controlling interests consist of the following (in millions):
| December 31, | ||||||||
| 2012 | 2011 | |||||||
|
Consolidated joint venture interests primarily outside the United States |
$ | 13.8 | $ | 21.6 | ||||
|
Shopping centers and development parcels in various states |
3.1 | 3.2 | ||||||
|
Operating partnership units |
7.4 | 7.4 | ||||||
|
|
|
|
|
|||||
| $ | 24.3 | $ | 32.2 | |||||
|
|
|
|
|
|||||
In 2012, the Company’s consolidated joint venture sold its investment in land held for development in Russia (the “Yaroslavl Project”) (Notes 12 and 13).
At December 31, 2012 and 2011, the Company had 369,176 operating partnership units (“OP Units”) outstanding. These OP Units, issued to different partnerships, are exchangeable, at the election of the OP Unit holder, and under certain circumstances at the option of the Company, into an equivalent number of the Company’s common shares or for the equivalent amount of cash. Most of these OP Units have registration rights agreements equivalent to the number of OP Units held by the holder if the Company elects to settle in its common shares. The OP Units are classified on the Company’s balance sheet as non-controlling interests.
The OP Unit holders are entitled to receive distributions, per OP Unit, equal to the per share distributions on the Company’s common shares. At December 31, 2012 and 2011, the Company had 29,525 redeemable OP Units outstanding. Redeemable OP Units are presented at the greater of their carrying amount (for all periods presented) or redemption value at the end of each reporting period. Changes in the value from period to period are recorded to paid-in capital in the Company’s consolidated balance sheets.
F-36
Table of Contents
Preferred Shares
The Company’s preferred shares outstanding at December 31 are as follows (in thousands):
| December 31, | ||||||||
| 2012 | 2011 | |||||||
|
Class H — 7.375% cumulative redeemable preferred shares, without par value, $500 liquidation value; 750,000 shares authorized; 410,000 shares issued and outstanding at December 31, 2012 and 2011 |
$ | 205,000 | $ | 205,000 | ||||
|
Class I — 7.5% cumulative redeemable preferred shares, without par value, $500 liquidation value; 750,000 shares authorized; 340,000 shares issued and outstanding at December 31, 2011 |
— | 170,000 | ||||||
|
Class J — 6.5% cumulative redeemable preferred shares, without par value, $500 liquidation value; 750,000 shares authorized; 400,000 shares issued and outstanding at December 31, 2012 |
200,000 | — | ||||||
|
|
|
|
|
|||||
| $ | 405,000 | $ | 375,000 | |||||
|
|
|
|
|
|||||
In August 2012, the Company issued $200.0 million of its newly designated 6.50% Class J cumulative redeemable preferred shares (“Class J Preferred Shares”) at a price of $500.00 per share (or $25.00 per depositary share). In addition, in August 2012, the Company redeemed all outstanding shares of its 7.50% Class I cumulative redeemable preferred shares (“Class I Preferred Shares”) at a redemption price of $25.1875 per Class I depositary share (the sum of $25.00 per depositary share and dividends per depositary share of $0.1875 prorated to the redemption date). The Company recorded a charge of $5.8 million to net loss attributable to common shareholders related to the write-off of the Class I Preferred Shares’ original issuance costs.
The Class H and Class J depositary shares represent 1/20 of a Class H and Class J preferred share and have a stated value of $500 per share. The Class H depositary shares are redeemable by the Company and the Class J depositary shares are not redeemable by the Company prior to August 1, 2017, except in certain circumstances relating to the preservation of the Company’s status as a REIT.
The Company’s authorized preferred shares consist of the following:
| • |
750,000 Class A Cumulative Redeemable Preferred Shares, without par value* |
| • |
750,000 Class B Cumulative Redeemable Preferred Shares, without par value* |
| • |
750,000 Class C Cumulative Redeemable Preferred Shares, without par value* |
| • |
750,000 Class D Cumulative Redeemable Preferred Shares, without par value* |
| • |
750,000 Class E Cumulative Redeemable Preferred Shares, without par value* |
| • |
750,000 Class F Cumulative Redeemable Preferred Shares, without par value* |
| • |
750,000 Class G Cumulative Redeemable Preferred Shares, without par value* |
| • |
750,000 Class H Cumulative Redeemable Preferred Shares, without par value |
| • |
750,000 Class I Cumulative Redeemable Preferred Shares, without par value** |
| • |
750,000 Class J Cumulative Redeemable Preferred Shares, without par value*** |
| • |
750,000 Class K Cumulative Redeemable Preferred Shares, without par value* |
| • |
750,000 Non-Cumulative Preferred Shares, without par value* |
| • |
2,000,000 Cumulative Voting Preferred Shares, without par value* |
| * | None outstanding at December 31, 2012 or 2011. |
| ** | None outstanding at December 31, 2012. |
| *** | None outstanding at December 31, 2011. |
F-37
Table of Contents
Common Shares
The Company’s common shares have a $0.10 per share par value. Dividends declared per share of common stock were $0.48, $0.22 and $0.08 for 2012, 2011 and 2010, respectively, which were paid in cash.
The Company issued common shares, including through the use of its continuous equity programs, for the years ended December 31, 2012, 2011 and 2010, as follows (amounts in millions, except per share):
|
Number of
Shares Sold |
Average Price
Per Share |
Net Proceeds | ||||||||||
|
2012 |
36.5 | $ | 13.98 | $ | 493.2 | |||||||
|
2011 |
9.5 | $ | 13.71 | $ | 129.7 | |||||||
|
2010 |
53.0 | $ | 8.33 | $ | 441.3 | |||||||
Equity Derivative Instruments — Otto Transaction
In 2009, the Company issued 32.9 million common shares and warrants to purchase 10.0 million common shares to Mr. Alexander Otto (the “Investor”) and certain members of the Otto family (collectively with the Investor, the “Otto Family”) for aggregate gross proceeds of $112.5 million (the “Stock Purchase Agreement”). No separate consideration was paid for the warrants. The share issuances, together with the warrant issuances, are collectively referred to as the “Otto Transaction.” In March 2011, the Otto Family exercised all 10.0 million warrants for cash at $6.00 per common share. The exercise price of the warrants was also subject to downward adjustment if the weighted-average purchase price of all additional common shares sold, as defined, from the date of issuance of the applicable warrant was less than $6.00 per share (herein, along with the share issuances, referred to as “Downward Price Protection Provisions”).
Although not triggered prior to the exercise in March 2011, the exercise price of the warrants was subject to the Downward Price Protection Provisions, described above, which resulted in the warrants being required to be recorded at fair value as of the shareholder approval date of the Stock Purchase Agreement, which was April 9, 2009, and marked-to-market through earnings as of each balance sheet date thereafter until the exercise date of March 18, 2011. These equity derivative instruments were issued as part of the Company’s overall deleveraging strategy and were not issued in connection with any speculative trading activity or to mitigate any market risks.
The fair value of the Company’s equity derivative instruments (warrants) had a fair value of $74.3 million at March 18, 2011, the exercise date. Upon exercise and issuance of common shares, this liability was reclassified to paid-in capital and aggregated with the cash proceeds in the consolidated statement of equity.
The effect of the Company’s equity derivative instruments on net loss is as follows (in millions):
|
Derivatives Not Designated as Hedging Instruments |
Year Ended December 31, | |||||||||
|
Income Statement Location |
2011 | 2010 | ||||||||
|
Warrants |
Gain (loss) on equity derivative instruments | $ | 21.9 | $ | (40.1 | ) | ||||
The gain/loss above for this contract was derived principally from the changes in the Company’s stock price from April 9, 2009, the shareholder approval date, through December 31, 2010 or March 18, 2011, the exercise date of the warrants.
Measurement of Fair Value—Equity Derivative Instruments Valued on a Recurring Basis
The valuation of these instruments was determined using an option pricing model that considered all relevant assumptions including the Downward Price Protection Provisions. The two key unobservable input assumptions included in the valuation of the warrants were the volatility and dividend yield. Both measures were
F-38
Table of Contents
susceptible to change over time given the impact of movements in the Company’s common share price on each. The dividend yield assumptions used ranged from 3.0% to 3.2% through the exercise date in 2011 and from 2.4% to 4.2% in 2010. Since the initial valuation date, the Company used historical volatility assumptions to determine the estimate of fair value of the five-year warrants. The Company believed that the long-term historic volatility better represented the long-term future volatility and was more consistent with how an investor would view the value of these securities. The Company continually reassessed these assumptions and reviewed the assumptions again in March 2011 upon notification from the Otto Family regarding its exercise of the warrants. The Company determined that an implied volatility assumption was more representative of how a market participant would value the instruments given the shorter term nature of the warrants. The volatility assumptions used were 36.6% in the first quarter of 2011 and 79.1% in 2010. The Company determined that the warrants fell within Level 3 of the fair value hierarchy due to the volatility and dividend yield assumptions used in the overall valuation.
The following table presents information about the Company’s equity derivative instrument (in millions) that was a liability at December 31, 2010, measured at fair value on a recurring basis as of December 31, 2010, and indicates the fair value hierarchy of the valuation techniques used by the Company to determine such fair value (in millions).
| Fair Value Measurements | ||||||||||||||||
| Level 1 | Level 2 | Level 3 | Total | |||||||||||||
|
December 31, 2010 |
||||||||||||||||
|
Warrants |
$ | — | $ | — | $ | 96.2 | $ | 96.2 | ||||||||
The table below presents a reconciliation of the beginning and ending balances of the equity derivative instruments that were included in Other Liabilities at December 31, 2010, having fair value measurements based on significant unobservable inputs (Level 3) (in millions):
|
Equity
Derivative Instruments— Liability |
||||
|
Balance of Level 3 at December 31, 2010 |
$ | 96.2 | ||
|
Unrealized gain |
(21.9 | ) | ||
|
Transfer out of liability to paid-in capital |
(74.3 | ) | ||
|
|
|
|||
|
Balance of Level 3 at December 31, 2011 |
$ | — | ||
|
|
|
|||
11. Impairment Charges and Impairment of Joint Venture Investments
The Company recorded impairment charges based on the difference between the carrying value of the assets or investments and the estimated fair market value as follows (in millions):
|
For the Year Ended
December 31, |
||||||||||||
| 2012 | 2011 | 2010 | ||||||||||
|
Land held for development (A) |
$ | 10.1 | $ | 54.2 | $ | 54.3 | ||||||
|
Undeveloped land (B),(C) |
20.1 | 9.0 | 30.5 | |||||||||
|
Assets marketed for sale (C) |
75.2 | 4.7 | — | |||||||||
|
|
|
|
|
|
|
|||||||
|
Total continuing operations |
$ | 105.4 | $ | 67.9 | $ | 84.8 | ||||||
|
|
|
|
|
|
|
|||||||
|
Sold assets |
21.1 | 57.9 | 51.8 | |||||||||
|
Assets formerly occupied by Mervyns (D) |
— | — | 35.3 | |||||||||
|
|
|
|
|
|
|
|||||||
|
Total discontinued operations |
$ | 21.1 | $ | 57.9 | $ | 87.1 | ||||||
|
|
|
|
|
|
|
|||||||
|
Joint venture investments (E) |
26.7 | 2.9 | 0.2 | |||||||||
|
|
|
|
|
|
|
|||||||
|
Total impairment charges |
$ | 153.2 | $ | 128.7 | $ | 172.1 | ||||||
|
|
|
|
|
|
|
|||||||
F-39
Table of Contents
| (A) | Amounts reported in the year ended December 31, 2012, primarily related to land held for development in Canada that was owned through a consolidated joint venture (Note 13). This asset impairment was triggered primarily by the Company’s decision to dispose of its interest in lieu of development and the related execution of agreements for the sale of its interest in this project to its partner. |
| Amounts reported in the year ended December 31, 2011, primarily related to the Yaroslavl Project and land held for development in Canada that were owned through consolidated joint ventures. The Company’s proportionate share of the loss was $50.4 million after adjusting for the allocation of loss to the non-controlling interest in certain of the projects. The asset impairments primarily were triggered by the Company’s decision to dispose of its interest in lieu of development for certain of the projects and the related execution of agreements for the sale or partial sale of its interest in these projects. The Company sold its interest in the land held for development in Canada in the fourth quarter of 2011 to its joint venture partner in the project (Note 13). The Yaroslavl Project was sold to a third party in the first quarter of 2012 (Note 13). |
| Amounts reported in the year ended December 31, 2010, primarily related to land held for development in Russia that included the Yaroslavl Project, which is owned through a consolidated joint venture. The Company’s proportionate share of the loss was $41.9 million after adjusting for the allocation of loss to the non-controlling interest. The asset impairments were triggered in the second quarter of 2010 primarily due to a change in the Company’s investment plans for these projects. |
| (B) | Amounts reported in 2010 include a $19.3 million impairment charge associated with an abandoned development project. A subsidiary of the Company’s TRS acquired a leasehold interest in a development project in Norwood, Massachusetts, as part of a portfolio acquisition in 2003. The Company no longer expected to fund the ground rent expense in 2010, which triggered the impairment, and the ground lease was subsequently terminated in 2011. |
| (C) | These charges were triggered primarily due to the Company’s marketing of these assets for sale and management’s assessment of the likelihood and timing of a potential transaction. |
| (D) | As discussed in Notes 1 and 12, these assets were deconsolidated in 2010, and all operating results have been reclassified as discontinued operations. For the year ended December 31, 2010, the Company’s proportionate share of these impairment charges was $16.5 million after adjusting for the allocation of loss to the non-controlling interest in this previously consolidated joint venture. The 2010 impairment charges were triggered primarily due to a change in the Company’s business plans for these assets and the resulting impact on its holding period assumptions for this substantially vacant portfolio. During 2010, the Company determined it was no longer committed to the long-term management and investment in these assets. |
| (E) | Represents “other than temporary impairment” charges on unconsolidated joint venture investments. In 2012, the Company recorded a $26.1 million charge related to its interest in the Coventry II DDR Montgomery Farm LLC joint venture that owned a mixed-use project located in Allen, TX. The Company determined that its investment had suffered an other than temporary impairment due to deteriorating relations between the lender and the Company’s partner and the resulting impact on the asset’s value. In September 2012, the Company satisfied its remaining guaranty of the construction loan. In November 2012, the Company sold its interest in the joint venture. |
Items Measured at Fair Value on a Non-Recurring Basis
The Company is required to assess the fair value of certain impaired consolidated and unconsolidated joint venture investments. The valuation of impaired real estate assets and investments is determined using widely accepted valuation techniques including discounted cash flow analysis on the expected cash flows of each asset as well as the income capitalization approach considering prevailing market capitalization rates, analysis of recent comparable sales transactions, actual sales negotiations and bona fide purchase offers received from third parties and/or consideration of the amount that currently would be required to replace the asset, as adjusted for
F-40
Table of Contents
obsolescence. In general, the Company considers multiple valuation techniques when measuring fair value of an investment. However, in certain circumstances, a single valuation technique may be appropriate.
For operational real estate assets, the significant assumptions included the capitalization rate used in the income capitalization valuation as well as the projected property net operating income. For projects under development, the significant assumptions included the discount rate, the timing and the estimated costs for the construction completion and project stabilization, projected net operating income and the exit capitalization rate. For investments in unconsolidated joint ventures, the Company also considered the valuation of any underlying joint venture debt. These valuation adjustments were calculated based on market conditions and assumptions made by management at the time the valuation adjustments were recorded, which may differ materially from actual results if market conditions or the underlying assumptions change.
Items Measured at Fair Value on a Non-Recurring Basis
The following table presents information about the Company’s impairment charges on both financial and nonfinancial assets that were measured on a fair value basis for the years ended December 31, 2012, 2011 and 2010. The table also indicates the fair value hierarchy of the valuation techniques used by the Company to determine such fair value (in millions).
| Fair Value Measurements | ||||||||||||||||||||
| Level 1 | Level 2 | Level 3 | Total | Total Losses | ||||||||||||||||
|
December 31, 2012 |
||||||||||||||||||||
|
Long-lived assets held and used |
$ | — | $ | — | $ | 180.7 | $ | 180.7 | $ | 126.5 | ||||||||||
|
Unconsolidated joint venture investments |
— | — | 4.7 | 4.7 | 26.7 | |||||||||||||||
|
Deconsolidated joint venture investment |
— | — | 56.1 | 56.1 | 9.3 | |||||||||||||||
|
December 31, 2011 |
||||||||||||||||||||
|
Long-lived assets held and used and held for sale |
— | — | 212.0 | 212.0 | 125.8 | |||||||||||||||
|
Unconsolidated joint venture investments |
— | — | 5.5 | 5.5 | 2.9 | |||||||||||||||
|
December 31, 2010 |
||||||||||||||||||||
|
Long-lived assets held and used |
— | — | 229.2 | 229.2 | 171.9 | |||||||||||||||
|
Unconsolidated joint venture investments |
— | — | — | — | 0.2 | |||||||||||||||
F-41
Table of Contents
The following table presents quantitative information about the significant unobservable inputs used by the Company to determine the fair value of non-recurring items (in millions):
| Quantitative Information about Level 3 Fair Value Measurements | ||||||||||
|
Fair Value
at 12/31/12 |
Valuation
Technique |
Unobservable
Input |
Range | |||||||
|
Impairment of consolidated assets |
$ | 136.6 | Indicative Bid | Indicative Bid | N/A (A) | |||||
|
Impairment of consolidated assets |
44.1 |
Income
Capitalization Approach (B) |
Market
Capitalization Rate |
8% - 12% (B) | ||||||
|
Price Per
Square Foot |
$15 to $47 per square
foot (B) |
|||||||||
|
Impairment of joint venture investments |
4.7 |
Income
Capitalization Approach |
Market
Capitalization Rate |
8% (C) | ||||||
|
Impairment of joint venture investments |
— |
Discounted
Cash Flow |
Discount Rate | 11% | ||||||
|
Terminal
Capitalization Rate |
5.5% - 8.5% | |||||||||
|
Deconsolidated joint venture investment (D) |
56.1 |
Discounted
Cash Flow |
Discount Rate | 8% - 15% | ||||||
| (A) | These fair value measurements were developed by third-party sources, subject to the Company’s corroboration for reasonableness. |
| (B) | Vacant space in certain assets was valued on a price per square foot. |
| (C) | The fair value measurements also include consideration of the fair market value of debt. These inputs are further described in the debt section of Note 8. |
| (D) | Related to loss reported in Change in Control and Sale of Interests (Note 2). |
12. Discontinued Operations and Disposition of Real Estate and Real Estate Investments
Discontinued Operations
During the year ended December 31, 2012, the Company sold 29 properties (including the one asset considered held for sale at December 31, 2011) that were classified as discontinued operations for the years ended December 31, 2012, 2011 and 2010.
Included in discontinued operations for the three years ended December 31, 2012, are 120 properties (including the deconsolidated properties noted below). Of these properties, 88 were previously included in the shopping center segment, and six were previously included in the other investments segment (none remaining at December 31, 2012). In addition, included in discontinued operations are 26 other properties that were deconsolidated for accounting purposes in 2011 and 2010, which primarily represented the activity associated with the joint venture that owned the underlying real estate formally occupied by Mervyns. The operations of these properties were classified as discontinued operations for all periods presented, as the Company has no significant continuing involvement.
F-42
Table of Contents
The operating results related to assets sold, designated as held for sale or deconsolidated as of December 31, 2012, is as follows (in thousands):
| For the Year Ended December 31, | ||||||||||||
| 2012 | 2011 | 2010 | ||||||||||
|
Revenues |
$ | 9,265 | $ | 48,987 | $ | 73,152 | ||||||
|
|
|
|
|
|
|
|||||||
|
Operating expenses |
4,186 | 19,735 | 32,488 | |||||||||
|
Impairment charges |
21,076 | 57,932 | 87,045 | |||||||||
|
Interest, net |
1,961 | 13,194 | 26,669 | |||||||||
|
Debt extinguishment costs, net |
— | 7,191 | 409 | |||||||||
|
Depreciation and amortization |
2,305 | 14,404 | 24,323 | |||||||||
|
|
|
|
|
|
|
|||||||
| 29,528 | 112,456 | 170,934 | ||||||||||
|
|
|
|
|
|
|
|||||||
|
Loss from discontinued operations |
(20,263 | ) | (63,469 | ) | (97,782 | ) | ||||||
|
Gain on deconsolidation of interests |
— | 4,716 | 5,221 | |||||||||
|
Gain on disposition of real estate, net of tax |
3,847 | 40,163 | 5,775 | |||||||||
|
|
|
|
|
|
|
|||||||
|
Loss from discontinued operations |
$ | (16,416 | ) | $ | (18,590 | ) | $ | (86,786 | ) | |||
|
|
|
|
|
|
|
|||||||
Disposition of Real Estate and Real Estate Investments
The Company recorded net gains on disposition of real estate and real estate investments as follows (in millions):
| For the Year Ended December 31 | ||||||||||||
| 2012 | 2011 | 2010 | ||||||||||
|
Land sales (A) |
$ | 5.6 | $ | (0.4 | ) | $ | 1.0 | |||||
|
Previously deferred gains and other gains and losses on dispositions (B) |
0.3 | 7.5 | 0.3 | |||||||||
|
|
|
|
|
|
|
|||||||
| $ | 5.9 | $ | 7.1 | $ | 1.3 | |||||||
|
|
|
|
|
|
|
|||||||
| (A) | These dispositions did not meet the criteria for discontinued operations, as the land did not have any significant operations prior to disposition. |
| (B) | These gains are a result of partial asset sales that did not meet the criteria for discontinued operations and assets that were contributed to joint ventures in prior years. |
13. Transactions with Related Parties
In 2012, the Company sold its interest in a consolidated joint venture in East Gwillimbury, Canada, to its joint venture partner (Note 11). In 2011, the Company sold its interest in a consolidated joint venture in Brampton, Canada, to its joint venture partner (Note 11). In 2011, the Company sold its interest in an unconsolidated joint venture in Wisconsin to its joint venture partner.
The Investor (Note 10) is the Chief Executive Officer of ECE Projektmanagement G.m.b.H. & Co. KG (“ECE”), which is a fully integrated international developer, owner and manager of shopping centers. In May 2007, DDR and ECE formed a joint venture to fund investments in new retail developments to be constructed in western Russia and Ukraine (“ECE Joint Venture”). DDR contributed 75% of the equity of the joint venture, and ECE contributed the remaining 25% of the equity. The Company consolidates this entity. ECE, through its wholly-owned affiliates, was to provide development, property management, leasing and asset management services to the ECE Joint Venture and be paid fees, pursuant to service agreements. In addition, two of the Company’s directors hold various positions with affiliates of ECE, the Otto Family and/or the ECE Joint
F-43
Table of Contents
Venture’s general partner. In 2011, the ECE Joint Venture entered into an agreement to sell the Yaroslavl Project (Note 10 and 11), which was sold in 2012. In connection with the sale, an affiliate of the Company’s joint venture partner entered into certain leasing and management agreements with the buyer of the Yaroslavl Project and will receive fees in exchange for its services.
In April 2009, the Company entered into a $60 million secured bridge loan with an affiliate of the Otto Family. The bridge loan was repaid in May 2009 with the proceeds of a $60 million collateralized loan also obtained from an affiliate of the Otto Family. The loan had an interest rate of 9% and was collateralized by a shopping center. The Company repaid this loan, at par, in 2010 and paid a prepayment penalty of $0.9 million. The Company paid interest of $1.9 million on these loans for the year ended December 31, 2010.
In September 2010, the Company funded a $31.7 million mezzanine loan to a subsidiary of EDT Retail Trust (“EDT”) collateralized by equity interests in six shopping center assets managed by the Company. The mezzanine loan bears interest at a fixed rate of 10% and matures in 2017. The Company recorded $1.5 million of interest income through the period in which EDT owned the assets, or June 2012, and $3.2 million and $0.9 million in interest income for the years ended December 31, 2011 and 2010, respectively. This loan was assumed by the Company’s unconsolidated joint venture BRE DDR Retail Holdings, LLC and is included in Investments in and Advances to Joint Ventures in the Company’s consolidated balance sheet at December 31, 2012 (Note 2). Although the Company’s interest in EDT was redeemed in 2009, the Company retained two positions on EDT’s board of directors through June 2012.
Transactions with the Company’s equity affiliates are described in Note 2.
14. Benefit Plans
Stock-Based Compensation
The Company’s equity-based award plans provide for grants to Company employees and directors of incentive and non-qualified options to purchase common shares, rights to receive the appreciation in value of common shares, awards of common shares subject to restrictions on transfer, awards of common shares issuable in the future upon satisfaction of certain conditions and rights to purchase common shares and other awards based on common shares. Under the terms of the plans, awards available for grant were 8.9 million common shares at December 31, 2012.
During 2012, 2011 and 2010, $6.4 million, $6.8 million and $5.7 million, respectively, was charged to expense associated with awards under the Company’s equity-based award plans. This charge is included in general and administrative expenses in the Company’s consolidated statements of operations.
Stock Options
Stock options may be granted at per-share prices not less than fair market value at the date of grant and must be exercised within the maximum contractual term of 10 years thereof. Options granted under the plans generally vest over three years in one-third increments, beginning one year after the date of grant.
In previous years, the Company granted options to its directors. Options are no longer granted to the Company’s directors. Such options were granted at the fair market value of the Company’s common shares on the date of grant.
F-44
Table of Contents
The fair values for option awards granted in 2012, 2011 and 2010 were estimated at the date of grant using the Black-Scholes option pricing model with the following weighted-average assumptions:
| For the Year Ended December 31, | ||||||
| 2012 | 2011 | 2010 | ||||
|
Weighted-average fair value of grants |
$5.07 | $5.63 | $5.30 | |||
|
Risk-free interest rate (range) |
0.5% - 1.1% | 1.4% -3.0% | 1.4% -2.6% | |||
|
Dividend yield (range) |
3.6% - 4.7% | 3.4% - 4.9% | 4.2% - 5.6% | |||
|
Expected life (range) |
4 - 5 years | 7 years | 4 - 5 years | |||
|
Expected volatility (range) |
50.8% - 66.8% | 52.1% - 69.0% | 87.0% - 97.8% | |||
The risk-free rate was based upon a U.S. Treasury Strip with a maturity date that approximates the expected term of the award. The expected life of the award was derived by referring to actual exercise experience. The expected volatility of the stock was derived by using a 50/50 blend of implied and historical changes in the Company’s historical stock prices over a time frame consistent with the expected life of the award.
The following table reflects the stock option activity described above:
|
Weighted-
Average Exercise Price |
Weighted-
Average Remaining Contractual Term (years) |
Aggregate
Intrinsic Value (thousands) |
||||||||||||||||||
| Number of Options | ||||||||||||||||||||
| Employees | Directors | |||||||||||||||||||
| (thousands) | ||||||||||||||||||||
|
Balance December 31, 2009 |
3,330 | 22 | $ | 29.02 | ||||||||||||||||
|
Granted |
373 | — | 10.37 | |||||||||||||||||
|
Exercised |
(212 | ) | — | 6.02 | ||||||||||||||||
|
Forfeited |
(268 | ) | (2 | ) | 30.21 | |||||||||||||||
|
|
|
|
|
|
|
|||||||||||||||
|
Balance December 31, 2010 |
3,223 | 20 | $ | 28.28 | ||||||||||||||||
|
Granted |
276 | — | 13.72 | |||||||||||||||||
|
Exercised |
(192 | ) | — | 6.39 | ||||||||||||||||
|
Forfeited |
(624 | ) | (10 | ) | 41.02 | |||||||||||||||
|
|
|
|
|
|
|
|||||||||||||||
|
Balance December 31, 2011 |
2,683 | 10 | $ | 25.35 | ||||||||||||||||
|
Granted |
345 | — | 13.87 | |||||||||||||||||
|
Exercised |
(266 | ) | — | 6.54 | ||||||||||||||||
|
Forfeited |
(166 | ) | (10 | ) | 26.21 | |||||||||||||||
|
|
|
|
|
|
|
|||||||||||||||
|
Balance December 31, 2012 |
2,596 | — | $ | 25.70 | 5.3 | $ | 7,877 | |||||||||||||
|
|
|
|
|
|
|
|
|
|
|
|||||||||||
|
Options exercisable at December 31, |
||||||||||||||||||||
|
2012 |
2,035 | — | $ | 29.12 | 4.5 | $ | 6,538 | |||||||||||||
|
2011 |
2,230 | 10 | $ | 28.00 | 5.2 | $ | 5,177 | |||||||||||||
|
2010 |
2,900 | 20 | $ | 30.27 | 5.8 | $ | 8,035 | |||||||||||||
F-45
Table of Contents
The following table summarizes the characteristics of the options outstanding at December 31, 2012 (in thousands):
| Options Outstanding | ||||||||||||||||||||
|
Range of Exercise Prices |
Outstanding
as of 12/31/12 |
Weighted-
Average Remaining Contractual Life (years) |
Weighted-
Average Exercise Price |
Options Exercisable | ||||||||||||||||
|
Exercisable as of
12/31/12 |
Weighted-
Average Exercise Price |
|||||||||||||||||||
|
$0.00-$6.50 |
569 | 6.0 | $ | 6.01 | 569 | $ | 6.01 | |||||||||||||
|
$6.51-$12.50 |
276 | 7.3 | 10.42 | 172 | 10.37 | |||||||||||||||
|
$12.51-$29.50 |
611 | 7.6 | 15.11 | 154 | 18.65 | |||||||||||||||
|
$29.51-$49.50 |
781 | 3.1 | 38.05 | 781 | 38.05 | |||||||||||||||
|
$49.51-$69.50 |
359 | 3.7 | 59.87 | 359 | 59.87 | |||||||||||||||
|
|
|
|
|
|
|
|
|
|
|
|||||||||||
| 2,596 | 5.3 | $ | 25.70 | 2,035 | $ | 29.12 | ||||||||||||||
|
|
|
|
|
|
|
|
|
|
|
|||||||||||
The following table reflects the activity for unvested stock option awards for the year ended December 31, 2012 (options in thousands):
| Options |
Weighted-
Average Grant Date Fair Value |
|||||||
|
Unvested at December 31, 2011 |
453 | $ | 5.34 | |||||
|
Granted |
345 | 5.06 | ||||||
|
Vested |
(184 | ) | 5.21 | |||||
|
Forfeited |
(53 | ) | 5.19 | |||||
|
|
|
|
|
|||||
|
Unvested at December 31, 2012 |
561 | $ | 5.21 | |||||
|
|
|
|
|
|||||
As of December 31, 2012, total unrecognized stock option compensation cost granted under the plans was $1.7 million, expected to be recognized over a weighted-average 1.8-year term.
Exercises of Employee Stock Options
The total intrinsic value of options exercised for the year ended December 31, 2012, was $2.2 million. The total cash received from employees as a result of employee stock option exercises for the year ended December 31, 2012 and 2011, was $1.7 million and $2.0 million, respectively. The Company settles employee stock option exercises primarily with newly issued common shares or with treasury shares, if available.
Restricted Stock Awards
In 2012, 2011 and 2010, the Board of Directors approved grants of 0.3 million, 0.2 million and 0.6 million restricted common shares, respectively, to executives of the Company. The restricted stock grants generally vest in equal annual amounts over a four-year period. Restricted share awards have the same cash dividend and voting rights as other common stock and are considered to be currently issued and outstanding. These grants have a weighted-average fair value at the date of grant ranging from $9.25 to $15.36, which was equal to the market value of the Company’s common shares at the date of grant. In 2012, 2011 and 2010, grants of 0.1 million common shares, in each year, were issued as compensation to the Company’s outside directors. These grants were issued equal to the market value of the Company’s common shares at the date of grant and immediately vested upon grant.
F-46
Table of Contents
The following table reflects the activity for unvested restricted stock awards for the year ended December 31, 2012 (awards in thousands):
| Awards |
Weighted-
Average Grant Date Fair Value |
|||||||
|
Unvested at December 31, 2011 |
728 | $ | 9.31 | |||||
|
Granted |
299 | 13.92 | ||||||
|
Vested |
(433 | ) | 8.22 | |||||
|
Forfeited |
(46 | ) | 12.76 | |||||
|
|
|
|
|
|||||
|
Unvested at December 31, 2012 |
548 | $ | 12.39 | |||||
|
|
|
|
|
|||||
As of December 31, 2012, total unrecognized compensation of restricted stock award arrangements granted under the plans was $6.8 million, expected to be recognized over a weighted-average, 2.3 year term.
Value Sharing Equity Program
In 2009, the Company’s Board of Directors approved and adopted the Value Sharing Equity Program (the “VSEP”) and the grant of awards to certain of the Company’s executives. The VSEP was designed to allow the Company to reward participants with a portion of “Value Created” on six specified measurement dates, the last of which occurred on December 31, 2012. The Company measured the Value Created during the period between the start of the VSEP and the applicable measurement date. Value Created was measured as the increase in the Company’s market capitalization (i.e., the product of the Company’s share price and the number of shares outstanding as of the measurement date), as adjusted for any equity issuances or equity repurchases between the start of the VSEP and the applicable measurement date.
Each participant was assigned a “percentage share” of the Value Created. On December 31, 2012, the final measurement date, each participant received a number of the Company’s common shares with an aggregate value equal to the participant’s full percentage share of the Value Created, although the number of the Company’s common shares awarded to a participant was reduced by the number of the Company’s common shares previously earned by the participant as of prior measurement dates. This prevented the participants from benefiting more than once for increases in the shares price of the Company’s common shares that occurred during earlier measurement periods.
The Company’s common shares granted to a participant are subject to an additional time-based vesting period and will generally vest in 20% annual increments beginning on the date of grant and on each of the first four anniversaries of the date of grant. The fair value of the VSEP grants was estimated on the date of grant using a Monte Carlo approach model based on the following assumptions:
| Range | ||
|
Risk-free interest rate |
1.9% | |
|
Dividend yield |
6.2% | |
|
Expected life |
3.4 years | |
|
Expected volatility |
88% |
F-47
Table of Contents
The following table reflects the activity for unvested VSEP awards for the year ended December 31, 2012 (awards in thousands):
| Awards |
Weighted-
Average Grant Date Fair Value |
|||||||
|
Unvested at December 31, 2011 |
1,182 | $ | 13.34 | |||||
|
Issued |
1,401 | 14.98 | ||||||
|
Vested |
(706 | ) | 14.04 | |||||
|
Forfeited |
(9 | ) | 13.42 | |||||
|
|
|
|
|
|||||
|
Unvested at December 31, 2012 |
1,868 | $ | 14.31 | |||||
|
|
|
|
|
|||||
As of December 31, 2012, $3.2 million of total unrecognized compensation costs was related to the two market-metric components associated with the awards granted under the VSEP and are expected to be recognized over the remaining four-year term, which includes the vesting period.
401(k) Plan
The Company has a 401(k) defined contribution plan covering substantially all of the officers and employees of the Company that permits participants to defer up to a maximum of 50% of their compensation subject to statutory limits. The Company matches the participant’s contribution in an amount equal to 50% of the participant’s elective deferral for the plan year up to a maximum of 6% of a participant’s base salary plus annual cash bonus, not to exceed the sum of 3% of the participant’s base salary plus annual cash bonus. The Company’s plan allows for the Company to make additional discretionary contributions. No discretionary contributions have been made. Employees’ contributions are fully vested, and the Company’s matching contributions vest 20% per year over five years. The Company funds all matching contributions with cash. The Company’s contributions for each of the three years ended December 31, 2012, 2011 and 2010, were $1.0 million, $1.1 million and $1.1 million, respectively. The 401(k) plan is fully funded at December 31, 2012.
Elective Deferred Compensation Plan
The Company has a non-qualified elective deferred compensation plan (“Elective Deferred Compensation Plan”) for certain officers that permits participants to defer up to 100% of their base salaries and annual performance-based cash bonuses, less applicable taxes and benefits deductions. The Company provides a matching contribution to any participant who has contributed the maximum permitted under the 401(k) plan. This matching contribution is equal to the difference between (a) 3% of the sum of the participant’s base salary and annual performance-based bonus deferred under the 401(k) plan and the deferred compensation combined and (b) the actual employer matching contribution under the 401(k) plan. Deferred compensation related to an employee contribution is charged to expense and is fully vested. Deferred compensation related to the Company’s matching contribution is charged to expense and vests 20% per year. Once an employee has been with the Company five years, all matching contributions are fully vested. The Company’s contributions were $0.1 million for the years ended December 31, 2012, 2011 and 2010. At December 31, 2012 and 2011, deferred compensation under the Elective Deferred Compensation Plan aggregated $2.9 million and $2.7 million, respectively. The Elective Deferred Compensation Plan is fully funded at December 31, 2012.
Equity Deferred Compensation Plan
The Company maintains the DDR Corp. Equity Deferred Compensation Plan (the “Equity Deferred Compensation Plan”), a non-qualified compensation plan for certain officers and directors of the Company to defer the receipt of restricted shares. At December 31, 2012 and 2011, there were 0.5 million and 0.4 million common shares of the Company in the Equity Deferred Compensation Plan valued at $7.2 million and $4.9 million, respectively. The Equity Deferred Compensation Plan was fully funded at December 31, 2012.
F-48
Table of Contents
Vesting of restricted share grants of approximately 0.1 million common shares in 2012, 2011 and 2010 was deferred through the Equity Deferred Compensation Plan. The Company recorded $1.8 million, $1.4 million and $1.2 million in 2012, 2011 and 2010, respectively, in equity as deferred compensation obligations for the vested restricted shares deferred into the Equity Deferred Compensation Plan.
In 2012, 2011 and 2010, certain officers elected to have their deferred compensation distributed, which resulted in a reduction of the deferred obligation of $1.1 million, $2.3 million and $5.5 million, respectively.
Directors’ Deferred Compensation Plan
In 2000, the Company established the Directors’ Deferred Compensation Plan (the “Directors Plan”), a non-qualified compensation plan for the directors of the Company to defer the receipt of quarterly compensation. At December 31, 2012 and 2011, there were 0.4 million and 0.3 million common shares of the Company in the Directors Plan valued at $5.7 million and $3.7 million, respectively. The Directors Plan was fully funded at December 31, 2012.
15. Earnings and Dividends Per Share
The Company’s unvested restricted share units contain rights to receive nonforfeitable dividends and thus are participating securities requiring the two-class method of computing earnings per share (“EPS”). Under the two-class method, EPS is computed by dividing the sum of distributed earnings to common shareholders and undistributed earnings allocated to common shareholders by the weighted-average number of common shares outstanding for the period. In applying the two-class method, undistributed earnings are allocated to both common shares and participating securities based on the weighted-average shares outstanding during the period. The following table provides a reconciliation of net loss from continuing operations and the number of common shares used in the computations of “basic” EPS, which utilizes the weighted-average number of common shares outstanding without regard to dilutive potential common shares, and “diluted” EPS, which includes all such shares (in thousands, except per share amounts):
| For the Year Ended December 31, | ||||||||||||
| 2012 | 2011 | 2010 | ||||||||||
|
Basic Earnings : |
||||||||||||
|
Continuing Operations: |
||||||||||||
|
Loss from continuing operations |
$ | (14,776 | ) | $ | (7,886 | ) | $ | (162,253 | ) | |||
|
Plus: Gain on disposition of real estate |
5,863 | 7,079 | 1,318 | |||||||||
|
Plus: (Loss) income attributable to non-controlling interests |
(493 | ) | 3,543 | 12,071 | ||||||||
|
|
|
|
|
|
|
|||||||
|
(Loss) income from continuing operations attributable to DDR |
(9,406 | ) | 2,736 | (148,864 | ) | |||||||
|
Write-off of preferred share original issuance costs |
(5,804 | ) | (6,402 | ) | — | |||||||
|
Preferred dividends |
(28,645 | ) | (31,587 | ) | (42,269 | ) | ||||||
|
|
|
|
|
|
|
|||||||
|
Basic — Loss from continuing operations attributable to DDR common shareholders |
(43,855 | ) | (35,253 | ) | (191,133 | ) | ||||||
|
Less: Earnings attributable to unvested shares and operating partnership units |
(1,114 | ) | (488 | ) | (155 | ) | ||||||
|
|
|
|
|
|
|
|||||||
|
Basic — Loss from continuing operations |
$ | (44,969 | ) | $ | (35,741 | ) | $ | (191,288 | ) | |||
|
Discontinued Operations: |
||||||||||||
|
Loss from discontinued operations |
(16,416 | ) | (18,590 | ) | (86,786 | ) | ||||||
|
Plus: Income attributable to non-controlling interests |
— | — | 26,292 | |||||||||
|
|
|
|
|
|
|
|||||||
|
Basic — Loss from discontinued operations |
(16,416 | ) | (18,590 | ) | (60,494 | ) | ||||||
|
|
|
|
|
|
|
|||||||
|
Basic — Net loss attributable to DDR common shareholders after allocation to participating securities |
$ | (61,385 | ) | $ | (54,331 | ) | $ | (251,782 | ) | |||
|
|
|
|
|
|
|
|||||||
F-49
Table of Contents
| For the Year Ended December 31, | ||||||||||||
| 2012 | 2011 | 2010 | ||||||||||
|
Diluted Earnings : |
||||||||||||
|
Continuing Operations: |
||||||||||||
|
Basic — Loss from continuing operations attributable to DDR common shareholders |
$ | (43,855 | ) | $ | (35,253 | ) | $ | (191,133 | ) | |||
|
Less: Earnings attributable to unvested shares and operating partnership units |
(1,114 | ) | (488 | ) | (155 | ) | ||||||
|
Less: Fair value of Otto Family warrants |
— | (21,926 | ) | — | ||||||||
|
|
|
|
|
|
|
|||||||
|
Diluted — Loss from continuing operations |
$ | (44,969 | ) | $ | (57,667 | ) | $ | (191,288 | ) | |||
|
Discontinued Operations: |
||||||||||||
|
Basic — Loss from discontinued operations |
(16,416 | ) | (18,590 | ) | (60,494 | ) | ||||||
|
|
|
|
|
|
|
|||||||
|
Diluted — Net loss attributable to DDR common shareholders after allocation to participating securities |
$ | (61,385 | ) | $ | (76,257 | ) | $ | (251,782 | ) | |||
|
|
|
|
|
|
|
|||||||
|
Number of Shares: |
||||||||||||
|
Basic — Average shares outstanding |
291,726 | 270,278 | 244,712 | |||||||||
|
|
|
|
|
|
|
|||||||
|
Effect of dilutive securities — Warrants |
— | 1,194 | — | |||||||||
|
|
|
|
|
|
|
|||||||
|
Diluted — Average shares outstanding |
291,726 | 271,472 | 244,712 | |||||||||
|
|
|
|
|
|
|
|||||||
|
Basic Earnings Per Share: |
||||||||||||
|
Loss from continuing operations attributable to DDR common shareholders |
$ | (0.15 | ) | $ | (0.13 | ) | $ | (0.78 | ) | |||
|
Loss from discontinued operations attributable to DDR common shareholders |
(0.06 | ) | (0.07 | ) | (0.25 | ) | ||||||
|
|
|
|
|
|
|
|||||||
|
Net loss attributable to DDR common shareholders |
$ | (0.21 | ) | $ | (0.20 | ) | $ | (1.03 | ) | |||
|
|
|
|
|
|
|
|||||||
|
Dilutive Earnings Per Share: |
||||||||||||
|
Loss from continuing operations attributable to DDR common shareholders |
$ | (0.15 | ) | $ | (0.21 | ) | $ | (0.78 | ) | |||
|
Loss from discontinued operations attributable to DDR common shareholders |
(0.06 | ) | (0.07 | ) | (0.25 | ) | ||||||
|
|
|
|
|
|
|
|||||||
|
Net loss attributable to DDR common shareholders |
$ | (0.21 | ) | $ | (0.28 | ) | $ | (1.03 | ) | |||
|
|
|
|
|
|
|
|||||||
Basic average shares outstanding do not include restricted shares totaling 2.4 million, 1.9 million and 1.9 million that were not vested at December 31, 2012, 2011, and 2010, respectively (Note 14).
The following potentially dilutive securities are considered in the calculation of EPS as described below:
Potentially Dilutive Securities
| • |
Options to purchase 2.6 million, 2.7 million and 3.2 million common shares were outstanding at December 31, 2012, 2011 and 2010, respectively (Note 14). These outstanding options were not considered in the computation of diluted EPS for all of the periods presented, as the options were anti-dilutive due to the Company’s loss from continuing operations. |
| • |
The exchange into common shares associated with OP Units was not included in the computation of diluted shares outstanding for 2012, 2011 or 2010 because the effect of assuming conversion was anti-dilutive (Note 10). |
| • |
The Company’s senior convertible notes due 2040, which are convertible into common shares of the Company with a conversion price of $15.76 at December 31, 2012, were not included in the computation |
F-50
Table of Contents
|
of diluted EPS for all periods presented because the Company’s common share price did not exceed 125% of the conversion price (Note 7) in this period and would therefore be anti-dilutive. The Company’s senior convertible notes due 2012 and 2011, which were convertible into common shares of the Company, were not included in the computation of diluted EPS for all periods presented because the Company’s common share price did not exceed the conversion prices in these periods and would therefore have been anti-dilutive. The senior convertible notes due 2012 were repaid at maturity in March 2012, and the senior convertible notes due 2011 were repaid at maturity in August 2011. In addition, the purchased options related to these two senior convertible note issuances were not included in the computation of diluted EPS for all periods presented because the purchase options were anti-dilutive. |
| • |
Shares subject to issuance under the Company’s VSEP (Note 14) were not considered in the computation of diluted EPS for the years ended December 2011 and 2010 because they were anti-dilutive due to the Company’s loss from continuing operations. The final measurement period was December 31, 2012 and, accordingly, not considered for the 2012 computation. |
| • |
Warrants to purchase 10.0 million common shares issued in 2009 and exercised in March 2011 were dilutive for 2011 and were included in the calculation of diluted EPS. In 2010, these warrants were not included in the computation of diluted EPS, as the warrants were anti-dilutive (Note 10). This agreement was not in effect in 2012, as they were exercised in March 2011. |
| • |
The 19.0 million common shares that were subject to the forward equity agreements entered into in January 2012 were not included in the computation of diluted EPS using the treasury stock method prior to the date of settlement, because they were anti-dilutive due to the Company’s loss from continuing operations. The Company settled the forward equity agreements in June 2012. This agreement was not in effect in 2011 and 2010. The forward equity agreement entered into in March 2011 for 9.5 million common shares was not included in the computation of diluted EPS using the treasury stock method for the year ended December 31, 2011, due to the Company’s loss from continuing operations. These shares were issued in April 2011. This agreement was not in effect in 2010. |
16. Income Taxes
The Company elected to be treated as a REIT under the Internal Revenue Code of 1986, as amended, commencing with its taxable year ended December 31, 1993. To qualify as a REIT, the Company must meet a number of organizational and operational requirements, including a requirement that the Company distribute at least 90% of its taxable income to its shareholders. It is management’s current intention to adhere to these requirements and maintain the Company’s REIT status. As a REIT, the Company generally will not be subject to corporate level federal income tax on taxable income it distributes to its shareholders. As the Company distributed sufficient taxable income for the three years ended December 31, 2012, no U.S. federal income or excise taxes were incurred.
If the Company fails to qualify as a REIT in any taxable year, it will be subject to federal income taxes at regular corporate rates (including any alternative minimum tax) and may not be able to qualify as a REIT for the four subsequent taxable years. Even if the Company qualifies for taxation as a REIT, the Company may be subject to certain foreign, state and local taxes on its income and property and to federal income and excise taxes on its undistributed taxable income. In addition, at December 31, 2012, the Company has taxable REIT subsidiaries that generate taxable income from non-REIT activities and is subject to federal, state and local income taxes.
In order to maintain its REIT status, the Company must meet certain income tests to ensure that its gross income consists of passive income and not income from the active conduct of a trade or business. The Company utilizes its TRS to the extent certain fee and other miscellaneous non-real estate-related income cannot be earned by the REIT. In addition, the Company is subject to income tax for its operations in Puerto Rico.
F-51
Table of Contents
At December 31, 2012, 2011 and 2010, the tax cost basis of assets was $8.7 billion, $8.5 billion and $8.6 billion, respectively. For the year ended December 31, 2012, the Company recorded a net payment of $1.1 million. For the years ended December 31, 2011 and 2010, the Company recorded a net refund of $0.5 million and $2.1 million, respectively. These amounts reflect taxes paid to federal and state authorities for franchise and other taxes.
The following represents the combined activity of the Company’s TRS and its taxable activity in Puerto Rico (in thousands):
| For the Year Ended December 31, | ||||||||||||
| 2012 | 2011 | 2010 | ||||||||||
|
Book (loss) income before income taxes — TRS |
$ | (16,934 | ) | $ | 4,738 | $ | (22,843 | ) | ||||
|
|
|
|
|
|
|
|||||||
|
Components of income tax expense (benefit) are as follows: |
||||||||||||
|
Current: |
||||||||||||
|
Federal |
$ | — | $ | 351 | $ | (1,775 | ) | |||||
|
State and local |
— | — | — | |||||||||
|
|
|
|
|
|
|
|||||||
| — | 351 | (1,775 | ) | |||||||||
|
|
|
|
|
|
|
|||||||
|
Deferred: |
||||||||||||
|
Federal |
— | — | 45,311 | |||||||||
|
State and local |
— | — | 6,663 | |||||||||
|
|
|
|
|
|
|
|||||||
| — | — | 51,974 | ||||||||||
|
|
|
|
|
|
|
|||||||
|
Total expense (benefit) — TRS |
$ | — | $ | 351 | $ | 50,199 | ||||||
|
|
|
|
|
|
|
|||||||
|
Book loss before income taxes — Puerto Rico |
$ | (19,738 | ) | $ | (20,835 | ) | $ | (17,276 | ) | |||
|
|
|
|
|
|
|
|||||||
|
Current |
$ | — | $ | — | $ | — | ||||||
|
Deferred |
— | — | — | |||||||||
|
|
|
|
|
|
|
|||||||
|
Total expense (benefit) — Puerto Rico |
$ | — | $ | — | $ | — | ||||||
|
|
|
|
|
|
|
|||||||
At December 31, 2012 and 2011, the Company had net deferred tax assets of $81.5 million and $57.6 million, respectively. The net deferred tax asset at December 31, 2012, included $36.7 million attributed to net operating loss carryforwards that expire in varying amounts between the years 2017 through 2032, $10.9 million attributable to tax restructuring of investments in order to increase capital recycling ability, and $30.0 million of Puerto Rico special partnership loss carryforwards with no expiration date.
Realization of the net deferred tax assets is dependent on the existence of significant positive evidence, such as the Company’s ability to generate sufficient income to utilize the deferred tax assets within the relevant carryforward periods. Over the past several years, the Company has initiated various tax actions within the TRS that generated income (“Tax Actions”). These Tax Actions were initiated based upon management’s expectations of the REIT’s future liquidity and cash flow strategies. Management regularly assesses established reserves and adjusts these reserves when facts and circumstances indicate that a change in estimate is necessary. Due to the Company’s continued progress in raising capital over the past several years and expected improvements within its core operating results, it discontinued initiating these actions during the second half of 2010 and expects that it is unlikely that these Tax Actions will be used in future periods. In addition, throughout 2010, the Company continued to experience unexpected adverse charges within its TRS. During the fourth quarter of 2010, the TRS recorded an impairment charge of $19.3 million and a $3.0 million lease liability charge related to a development project that the Company no longer planned to pursue, which resulted in a loss within the TRS for the year ended December 31, 2010. As of December 31, 2010, the Company had a three-year cumulative pre-tax book loss, adjusted for permanent differences. This, in conjunction with the historical and continued volatility of the activities within the TRS, is sufficient negative evidence that a future benefit of the deferred tax asset may not
F-52
Table of Contents
exist. As such, management believed that it was more likely than not that the deferred tax assets would not be used in future years, and, accordingly, a full valuation allowance against those deferred tax assets was recorded at December 31, 2010.
The Company also had a three-year cumulative pretax book loss as of December 31, 2012, with respect to its Puerto Rican activity.
The differences between total income tax expense or benefit and the amount computed by applying the statutory federal income tax rate to income before taxes were as follows (in thousands):
| For the Year Ended December 31, | ||||||||||||
| 2012 | 2011 | 2010 | ||||||||||
|
Statutory rate of 34% applied to pre-tax (loss) income |
$ | (5,757 | ) | $ | 1,611 | $ | (7,767 | ) | ||||
|
Effect of state and local income taxes, net of federal tax benefit |
(847 | ) | 237 | (1,142 | ) | |||||||
|
Valuation allowance increase (decrease) |
16,808 | (715 | ) | 58,322 | ||||||||
|
Other |
(10,204 | ) | (782 | ) | 786 | |||||||
|
|
|
|
|
|
|
|||||||
|
Total expense — TRS |
$ | — | $ | 351 | $ | 50,199 | ||||||
|
|
|
|
|
|
|
|||||||
|
Effective tax rate |
0.00 | % | 7.40 | % | (219.76 | )% (A) | ||||||
|
|
|
|
|
|
|
|||||||
| (A) | The 2010 effective tax rate includes the impact from the recording of the valuation allowance in the fourth quarter 2010. Without this impact, the effective tax rate was approximately 37.59%. |
The differences between total income tax expense or benefit and the amount computed by applying the statutory income tax rate to income before taxes with respect to its Puerto Rican activity were as follows (in thousands):
|
For the Year
Ended
December 31, |
||||
| 2012 | ||||
|
Statutory rate of 30% applied to pre-tax loss |
$ | (5,921 | ) | |
|
Valuation allowance increase |
7,049 | |||
|
Other |
(1,128 | ) | ||
|
|
|
|||
|
Total expense — Puerto Rico |
$ | — | ||
|
|
|
|||
|
Effective tax rate |
0.00 | % | ||
|
|
|
|||
Deferred tax assets and liabilities of the Company’s TRS and Puerto Rico were as follows (in thousands):
| For the Year Ended December 31, | ||||||||||||
| 2012 | 2011 | 2010 | ||||||||||
|
Deferred tax assets — TRS |
$ | 75,450 | $ | 58,297 | $ | 58,923 | ||||||
|
Deferred tax assets — Puerto Rico |
34,041 | — | — | |||||||||
|
Deferred tax liabilities — TRS |
(1,035 | ) | (690 | ) | (601 | ) | ||||||
|
Deferred tax liabilities — Puerto Rico |
(26,992 | ) | — | — | ||||||||
|
Valuation allowance — TRS |
(74,415 | ) | (57,607 | ) | (58,322 | ) | ||||||
|
Valuation allowance — Puerto Rico |
(7,049 | ) | — | — | ||||||||
|
|
|
|
|
|
|
|||||||
|
Net deferred tax asset (A) |
$ | — | $ | — | $ | — | ||||||
|
|
|
|
|
|
|
|||||||
| (A) | The components of the net deferred tax assets are primarily attributable to net operating losses, Puerto Rico special partnership losses and interest expense, subject to limitations and basis differentials in assets due to purchase price accounting. |
F-53
Table of Contents
Reconciliation of GAAP net loss attributable to DDR to taxable income is as follows (in thousands):
| For the Year Ended December 31, | ||||||||||||
| 2012 | 2011 | 2010 | ||||||||||
|
GAAP net loss attributable to DDR |
$ | (25,822 | ) | $ | (15,854 | ) | $ | (209,358 | ) | |||
|
Plus: Book depreciation and amortization (A) |
247,084 | 222,751 | 217,035 | |||||||||
|
Less: Tax depreciation and amortization (A) |
(185,230 | ) | (181,935 | ) | (179,377 | ) | ||||||
|
Book/tax differences on gains/losses from capital transactions |
(122,101 | ) | (116,395 | ) | (103,331 | ) | ||||||
|
Joint venture equity in (loss) earnings, net (A) |
(23,885 | ) | 19,190 | (28,659 | ) | |||||||
|
Dividends from subsidiary REIT investments |
480 | 954 | 1,609 | |||||||||
|
Deferred income |
8,471 | (4,327 | ) | 1,937 | ||||||||
|
Compensation expense |
(11,325 | ) | (17,614 | ) | 1,199 | |||||||
|
Impairment charges |
153,142 | 128,765 | 172,127 | |||||||||
|
Equity derivative instrument valuation |
— | (21,926 | ) | 40,157 | ||||||||
|
Senior Convertible Notes interest expense |
10,884 | 14,914 | 8,204 | |||||||||
|
Miscellaneous book/tax differences, net |
(2,755 | ) | (12,131 | ) | (12,007 | ) | ||||||
|
|
|
|
|
|
|
|||||||
|
Taxable income (loss) before adjustments |
48,943 | 16,392 | (90,464 | ) | ||||||||
|
Less: Capital Gains |
(48,943 | ) | — | — | ||||||||
|
Less: Taxable loss carried forward (B) |
— | — | 90,464 | |||||||||
|
|
|
|
|
|
|
|||||||
|
Taxable income subject to the 90% dividend requirement |
$ | — | $ | 16,392 | $ | — | ||||||
|
|
|
|
|
|
|
|||||||
| (A) | Depreciation expense from majority-owned subsidiaries and affiliates, which is consolidated for financial reporting purposes but not for tax reporting purposes, is included in the reconciliation item “Joint venture equity in (loss) earnings, net.” |
| (B) | The Company has net operating loss carryforwards expiring in 2030 of $90.5 million that can offset future undistributed taxable income. |
Reconciliation between cash dividends paid and the dividends paid deduction is as follows (in thousands):
| For the Year Ended December 31, | ||||||||||||
| 2012 | 2011 | 2010 | ||||||||||
|
Dividends paid |
$ | 153,617 | $ | 75,253 | $ | 61,204 | ||||||
|
Plus: Deemed dividends on convertible debt |
7,875 | — | — | |||||||||
|
Less: Dividends designated to prior year |
(6,967 | ) | (6,967 | ) | (6,967 | ) | ||||||
|
Plus: Dividends designated from the following year |
7,030 | 6,967 | 6,967 | |||||||||
|
Less: Return of capital |
(112,612 | ) | (58,861 | ) | (61,204 | ) | ||||||
|
|
|
|
|
|
|
|||||||
|
Dividends paid deduction |
$ | 48,943 | $ | 16,392 | $ | — | ||||||
|
|
|
|
|
|
|
|||||||
The dividends declared in the fourth quarter with respect to the Company’s common share dividends for the years ended December 31, 2012, 2011 and 2010, have been allocated and reported to shareholders in the subsequent year. The tax characterization of common share dividends per share as reported to shareholders for the years ended December 31, 2012, 2011, and 2010, are summarized as follows:
|
2012 Dividends |
Date
Paid |
Gross
Ordinary Income |
Capital Gain
Distributions |
Return of
Capital |
Total
Dividends |
|||||||||||||||
|
4th quarter 2011 |
01/06/12 | $ | — | $ | 0.0122 | $ | 0.0678 | $ | 0.0800 | |||||||||||
|
1st quarter |
04/03/12 | — | 0.0183 | 0.1017 | 0.1200 | |||||||||||||||
|
2nd quarter |
07/06/12 | — | 0.0183 | 0.1017 | 0.1200 | |||||||||||||||
|
3rd quarter |
10/02/12 | — | 0.0183 | 0.1017 | 0.1200 | |||||||||||||||
|
4th quarter |
01/04/13 | — | — | — | — | |||||||||||||||
|
|
|
|
|
|
|
|
|
|||||||||||||
| $ | — | $ | 0.0671 | $ | 0.3729 | $ | 0.4400 | |||||||||||||
|
|
|
|
|
|
|
|
|
|||||||||||||
F-54
Table of Contents
|
2011 Dividends |
Date
Paid |
Gross
Ordinary Income |
Capital Gain
Distributions |
Return of
Capital |
Total
Dividends |
|||||||||||||||
|
4th quarter 2010 |
01/05/11 | $ | — | $ | — | $ | 0.0200 | $ | 0.0200 | |||||||||||
|
1st quarter |
04/05/11 | — | — | 0.0400 | 0.0400 | |||||||||||||||
|
2nd quarter |
07/06/11 | — | — | 0.0400 | 0.0400 | |||||||||||||||
|
3rd quarter |
10/11/11 | — | — | 0.0600 | 0.0600 | |||||||||||||||
|
4th quarter |
01/06/12 | — | — | — | — | |||||||||||||||
|
|
|
|
|
|
|
|
|
|||||||||||||
| $ | — | $ | — | $ | 0.1600 | $ | 0.1600 | |||||||||||||
|
|
|
|
|
|
|
|
|
|||||||||||||
|
2010 Dividends |
Date
Paid |
Gross
Ordinary Income |
Capital Gain
Distributions |
Return of
Capital |
Total
Dividends |
|||||||||||||||
|
4th quarter 2009 |
01/06/10 | $ | — | $ | — | $ | 0.0200 | $ | 0.0200 | |||||||||||
|
1st quarter |
04/06/10 | — | — | 0.0200 | 0.0200 | |||||||||||||||
|
2nd quarter |
07/07/10 | — | — | 0.0200 | 0.0200 | |||||||||||||||
|
3rd quarter |
10/05/10 | — | — | 0.0200 | 0.0200 | |||||||||||||||
|
4th quarter |
01/05/11 | — | — | — | — | |||||||||||||||
|
|
|
|
|
|
|
|
|
|||||||||||||
| $ | — | $ | — | $ | 0.0800 | $ | 0.0800 | |||||||||||||
|
|
|
|
|
|
|
|
|
|||||||||||||
17. Segment Information
The Company has three reportable operating segments: shopping centers, loan investments and Brazil equity investment. Each consolidated shopping center is considered a separate operating segment and follows the accounting policies described in Note 1; however, each shopping center on a stand-alone basis represents less than 10% of the revenues, profit or loss, and assets of the combined reported operating segment and meets the majority of the aggregation criteria under the applicable standard. Effective July 1, 2012, the Company’s loan investments are also considered a reportable segment due to the increased level of income reported from these investments as well as how executive management analyzes these investments and allocates resources accordingly. The operating segment information for the years ended December 31, 2011 and 2010, have been restated to conform to the December 31, 2012, presentation. The carrying value of the Brazil Equity Investment is not a measure used by executive management for purposes of decision making related to asset allocation or performance assessment of this segment. The following table summarizes the Company’s shopping centers and office properties (none remaining at December 31, 2012). The table includes those assets located in Brazil:
| December 31, | ||||||||||||
| 2012 | 2011 | 2010 | ||||||||||
|
Shopping centers owned |
452 | 432 | 478 | |||||||||
|
Unconsolidated joint ventures |
206 | 177 | 189 | |||||||||
|
Consolidated joint ventures |
3 | 2 | 3 | |||||||||
|
States (A) |
39 | 38 | 39 | |||||||||
|
Office properties |
— | 5 | 6 | |||||||||
|
States |
— | 3 | 4 | |||||||||
| (A) | Excludes shopping centers owned in Puerto Rico and Brazil. |
F-55
Table of Contents
The tables below present information about the Company’s reportable operating segments and reflect the impact of discontinued operations (Note 12) (in thousands):
| For the Year Ended December 31, 2012 | ||||||||||||||||||||
|
Shopping
Centers |
Loan
Investments |
Brazil Equity
Investment |
Other | Total | ||||||||||||||||
|
Total revenues |
$ | 800,358 | $ | 17 | $ | 800,375 | ||||||||||||||
|
Operating expenses (A) |
(337,875 | ) | (597 | ) | (338,472 | ) | ||||||||||||||
|
|
|
|
|
|
|
|||||||||||||||
|
Net operating income (loss) |
462,483 | (580 | ) | 461,903 | ||||||||||||||||
|
Depreciation and amortization |
(248,781 | ) | (248,781 | ) | ||||||||||||||||
|
Interest income |
15,799 | 15,799 | ||||||||||||||||||
|
Other income (expense), net |
(4,300 | ) | $ | (13,580 | ) | (17,880 | ) | |||||||||||||
|
Gain on change in control and sale of interests, net |
78,127 | 78,127 | ||||||||||||||||||
|
Unallocated expenses (B) |
(312,523 | ) | (312,523 | ) | ||||||||||||||||
|
Equity in net (loss) income of joint ventures |
(2,570 | ) | $ | 37,820 | 35,250 | |||||||||||||||
|
Impairment of joint venture investments |
(26,671 | ) | ||||||||||||||||||
|
|
|
|||||||||||||||||||
|
Loss from continuing operations |
$ | (14,776 | ) | |||||||||||||||||
|
|
|
|||||||||||||||||||
|
As of December 31, 2012: |
||||||||||||||||||||
|
Total gross real estate assets |
$ | 8,639,111 | $ | 8,639,111 | ||||||||||||||||
|
|
|
|
|
|||||||||||||||||
|
Notes receivable, net |
$ | 246,907 | $ | (178,189 | ) (C) | $ | 68,718 | |||||||||||||
|
|
|
|
|
|
|
|||||||||||||||
F-56
Table of Contents
| For the Year Ended December 31, 2011 | ||||||||||||||||||||
|
Shopping
Centers |
Loan
Investments |
Brazil Equity
Investment |
Other | Total | ||||||||||||||||
|
Total revenues |
$ | 749,742 | $ | 87 | $ | 749,829 | ||||||||||||||
|
Operating expenses (A) |
(294,154 | ) | (13 | ) | (294,167 | ) | ||||||||||||||
|
|
|
|
|
|
|
|||||||||||||||
|
Net operating income |
455,588 | 74 | 455,662 | |||||||||||||||||
|
Depreciation and amortization |
(215,928 | ) | (215,928 | ) | ||||||||||||||||
|
Interest income |
9,832 | 9,832 | ||||||||||||||||||
|
Other income (expense), net |
(5,000 | ) | $ | (2 | ) | (5,002 | ) | |||||||||||||
|
Gain on change in control and sale of interests, net |
25,170 | 25,170 | ||||||||||||||||||
|
Unallocated expenses (B) |
(288,433 | ) | (288,433 | ) | ||||||||||||||||
|
Equity in net (loss) income of joint ventures |
(6,747 | ) | $ | 20,481 | 13,734 | |||||||||||||||
|
Impairment of joint venture investments |
(2,921 | ) | ||||||||||||||||||
|
|
|
|||||||||||||||||||
|
Loss from continuing operations |
$ | (7,886 | ) | |||||||||||||||||
|
|
|
|||||||||||||||||||
|
As of December 31, 2011: |
||||||||||||||||||||
|
Total gross real estate assets |
$ | 8,222,384 | $ | 47,722 | $ | 8,270,106 | ||||||||||||||
|
|
|
|
|
|
|
|||||||||||||||
|
Notes receivable, net |
$ | 84,541 | $ | 9,364 | $ | 93,905 | ||||||||||||||
|
|
|
|
|
|
|
|||||||||||||||
| For the Year Ended December 31, 2010 | ||||||||||||||||||||
|
Shopping
Centers |
Loan
Investments |
Brazil
Equity
Investment |
Other | Total | ||||||||||||||||
|
Total revenues |
$ | 741,551 | $ | 381 | $ | 741,932 | ||||||||||||||
|
Operating expenses (A) |
(306,890 | ) | (11 | ) | (306,901 | ) | ||||||||||||||
|
|
|
|
|
|
|
|||||||||||||||
|
Net operating income |
434,661 | 370 | 435,031 | |||||||||||||||||
|
Depreciation and amortization |
(202,981 | ) | (202,981 | ) | ||||||||||||||||
|
Interest income |
6,450 | $ | 852 | 7,302 | ||||||||||||||||
|
Other income (expense), net |
(24,148 | ) | (24,148 | ) | ||||||||||||||||
|
Unallocated expenses (B) |
(382,830 | ) | (382,830 | ) | ||||||||||||||||
|
Equity in net (loss) income of joint ventures |
(4,958 | ) | $ | 10,558 | 5,600 | |||||||||||||||
|
Impairment of joint venture investments |
(227 | ) | ||||||||||||||||||
|
|
|
|||||||||||||||||||
|
Loss from continuing operations |
$ | (162,253 | ) | |||||||||||||||||
|
|
|
|||||||||||||||||||
|
As of December 31, 2010: |
||||||||||||||||||||
|
Total gross real estate assets |
$ | 8,361,632 | $ | 49,607 | $ | 8,411,239 | ||||||||||||||
|
|
|
|
|
|
|
|||||||||||||||
|
Notes receivable, net |
$ | 103,705 | $ | 16,625 | $ | 120,330 | ||||||||||||||
|
|
|
|
|
|
|
|||||||||||||||
| (A) | Includes impairment charges of $105.4 million, $67.9 million and $84.8 million for the years ended December 31, 2012, 2011 and 2010, respectively. |
| (B) | Unallocated expenses consist of general and administrative expenses, interest expense, loss/gain on debt retirement, gain/loss on equity derivative instruments and tax expense as listed in the consolidated statements of operations. |
| (C) | Amount includes loans to affiliates classified in Investments in and Advances to Joint Ventures on the consolidated balance sheet. |
F-57
Table of Contents
18. Subsequent Events
Revolving Credit Facilities and Secured Term Loan
In January 2013, the Company amended its primary unsecured revolving credit facility arranged by J.P. Morgan Securities LLC and Wells Fargo Securities, LLC. The $65 million unsecured revolving credit facility provided solely by PNC Bank, National Association was amended to match the terms of the primary facility. The Company also amended its $400 million secured term loan arranged by KeyBanc Capital Markets and RBC Capital Markets.
The amended $750 million unsecured revolving credit facility maturity date was extended to April 2017, with a borrower option to extend an additional year, and contains an accordion feature that provides for $1.25 billion of potential total capacity. Pricing on both amended revolving credit facilities was reduced and is currently set at LIBOR plus 140 basis points, a decrease of 25 basis points from the previous rate, and is determined based upon DDR’s credit ratings from Moody’s and S&P. Further, the annual facility fee for both revolving credit facilities has been reduced from 35 basis points to 30 basis points.
The amended secured term loan was reduced to borrowings of $400 million and extended the maturity date to April 2017, with a borrower option to extend an additional year. Pricing on the amended secured term loan is currently set at LIBOR plus 155 basis points, a decrease of 15 basis points from the previous rate, and is determined based upon DDR’s credit ratings from Moody’s and S&P.
Award Plan
On December 31, 2012, the Company adopted the 2013 Value Sharing Equity Program (“2013 VSEP”), with awards effective January 1, 2013. The 2013 VSEP awards, if earned, may result in the granting of common shares of the Company to participants on future measurement dates over three years, subject to an additional time-based vesting schedule. As a result, in general, the total compensation available to participants under the 2013 VSEP, if any, will be fully earned only after seven years (the three-year performance period and the final four-year time-based vesting period).
The 2013 VSEP is designed to allow DDR to reward participants for superior financial performance and allow them to share in “Value Created” (the increase in DDR’s market capitalization and the number of shares outstanding as of the measurement date), as adjusted for equity issuances and/or equity repurchases, between the start of the 2013 VSEP and the applicable measurement date, based upon (1) increases in DDR’s adjusted market capitalization over pre-established periods and (2) increases in relative total shareholder return of DDR as compared to the performance of the FTSE NAREIT Equity REITs Total Return Index for the FTSE International Limited NAREIT U.S. Real Estate Index Series. Under the 2013 VSEP, participants are granted two types of performance-based awards — a “relative performance award” and an “absolute performance award” – that, if earned, are settled with DDR common shares that are generally subject to additional time-based vesting requirements for a period of four years.
Contract Termination
In January 2008, the Company entered into a Services Agreement (the “Agreement”) with Oxford Building Services, Inc. (“Oxford”). The Agreement required that Oxford identify and contract directly with various service providers (“Vendors”) to provide maintenance, repairs, supplies and a variety of on-site services to certain properties in the Company’s portfolio, in exchange for which Oxford would pay such Vendors for the services. Under the Agreement, the Company remitted funds to Oxford to pay the Vendors under the Vendors’ contracts with Oxford.
F-58
Table of Contents
On or about January 23, 2013, Oxford advised the Company that approximately $11 million paid by the Company to Oxford for the sole purpose of paying various Vendors had instead been used to repay commercial financing obligations incurred by Oxford and its affiliates to a third-party lender. As a result, Oxford had insufficient funds to pay the Vendors in accordance with the Agreement. On January 28, 2013, the Company terminated the Agreement based upon Oxford’s violations of the Agreement principally due to its insolvency. On February 26, 2013, Oxford and several affiliates filed petitions for Chapter 11 bankruptcy in the United States Bankruptcy Court for the District of New Jersey (Case No. 13-13821).
In their initial filings in the bankruptcy case, Oxford has claimed that the Company refused to pay Oxford approximately $5 million allegedly due and owing to Vendors for work performed at the Company’s properties prior to the termination of the Agreement. Further, Oxford threatened to commence litigation against the Company to recover the alleged amounts owed should a consensual solution not be reached. The Company denies that any sums are due to Oxford, and if any such claim is filed, the Company will vigorously defend against it. Furthermore, as a result of the funds previously paid by the Company to Oxford, the Company also denies that any sums are due from the Company to any Vendors, and if any such claim is made, the Company will vigorously defend against it.
F-59
Table of Contents
19. Quarterly Results of Operations (Unaudited)
The following table sets forth the quarterly results of operations, as restated for discontinued operations, for the years ended December 31, 2012 and 2011 (in thousands, except per share amounts):
| First | Second | Third | Fourth | Total | ||||||||||||||||
|
2012 |
||||||||||||||||||||
|
Revenues |
$ | 191,608 | $ | 193,778 | $ | 204,119 | $ | 210,870 | $ | 800,375 | ||||||||||
|
Net (loss) income attributable to DDR |
(15,056 | ) | (37,500 | ) | 26,738 | (4 | ) (A) | (25,822 | ) | |||||||||||
|
Net (loss) income attributable to DDR common shareholders |
(22,023 | ) | (44,467 | ) | 13,253 | (7,034 | ) (A) | (60,271 | ) | |||||||||||
|
Basic: |
||||||||||||||||||||
|
Net (loss) income per common share attributable to DDR common shareholders |
$ | (0.08 | ) | $ | (0.16 | ) | $ | 0.04 | $ | (0.02 | ) | $ | (0.21 | ) | ||||||
|
Weighted-average number of shares |
275,214 | 280,390 | 302,232 | 307,873 | 291,726 | |||||||||||||||
|
Diluted: |
||||||||||||||||||||
|
Net (loss) income per common share attributable to DDR common shareholders |
$ | (0.08 | ) | $ | (0.16 | ) | $ | 0.04 | $ | (0.02 | ) | $ | (0.21 | ) | ||||||
|
Weighted-average number of shares |
275,214 | 280,390 | 302,924 | 307,873 | 291,726 | |||||||||||||||
|
2011 |
||||||||||||||||||||
|
Revenues |
$ | 188,247 | $ | 185,946 | $ | 186,279 | $ | 189,357 | $ | 749,829 | ||||||||||
|
Net income (loss) attributable to DDR |
35,312 | (13,383 | ) | (42,989 | ) | 5,206 | (A) | (15,854 | ) | |||||||||||
|
Net income (loss) attributable to DDR common shareholders |
24,745 | (26,871 | ) | (49,956 | ) | (1,761 | ) (A) | (53,843 | ) | |||||||||||
|
Basic: |
||||||||||||||||||||
|
Net income (loss) per common share attributable to DDR common shareholders |
$ | 0.10 | $ | (0.10 | ) | $ | (0.18 | ) | $ | (0.01 | ) | $ | (0.20 | ) | ||||||
|
Weighted-average number of shares |
255,966 | 274,299 | 274,639 | 274,718 | 270,278 | |||||||||||||||
|
Diluted: |
||||||||||||||||||||
|
Net income (loss) per common share attributable to DDR common shareholders |
$ | 0.01 | $ | (0.10 | ) | $ | (0.18 | ) | $ | (0.01 | ) | $ | (0.28 | ) | ||||||
|
Weighted-average number of shares |
262,581 | 276,067 | 274,639 | 274,718 | 271,472 | |||||||||||||||
| (A) | Includes impairment charges of $20.6 million and $47.4 million for the three months ended December 31, 2012 and 2011, respectively. In addition, the Company recorded gain on sale of real estate of $0.4 million and $54.3 million (Note 12) for the three months ended December 31, 2012 and 2011, respectively. |
F-60
Table of Contents
SCHEDULE II
DDR Corp.
VALUATION AND QUALIFYING ACCOUNTS AND RESERVES
For the years ended December 31, 2012, 2011 and 2010
(in thousands)
|
Balance at
Beginning of Year |
Charged to
Expense |
Deductions |
Balance at
End of Year |
|||||||||||||
|
Year ended December 31, 2012 |
||||||||||||||||
|
Allowance for uncollectible accounts (A) |
$ | 33,291 | $ | 12,290 | (B) | $ | 15,580 | $ | 30,001 | |||||||
|
|
|
|
|
|
|
|
|
|||||||||
|
Valuation allowance for deferred tax assets |
$ | 57,607 | $ | 23,857 | (C) | $ | — | $ | 81,464 | |||||||
|
|
|
|
|
|
|
|
|
|||||||||
|
Year ended December 31, 2011 |
||||||||||||||||
|
Allowance for uncollectible accounts (A) |
$ | 36,794 | $ | 14,631 | (B) | $ | 18,134 | (D) | $ | 33,291 | ||||||
|
|
|
|
|
|
|
|
|
|||||||||
|
Valuation allowance for deferred tax assets |
$ | 58,322 | $ | — | $ | 715 | $ | 57,607 | ||||||||
|
|
|
|
|
|
|
|
|
|||||||||
|
Year ended December 31, 2010 |
||||||||||||||||
|
Allowance for uncollectible accounts (A) |
$ | 43,763 | $ | 13,588 | $ | 20,557 | $ | 36,794 | ||||||||
|
|
|
|
|
|
|
|
|
|||||||||
|
Valuation allowance for deferred tax assets |
$ | — | $ | 58,322 | (C) | $ | — | $ | 58,322 | |||||||
|
|
|
|
|
|
|
|
|
|||||||||
| (A) | Includes allowances on accounts receivable, straight-line rents and notes receivable. |
| (B) | Includes loan loss reserves of $4.3 million and $5.0 million for the years ended December 31, 2012 and 2011, respectively. Excludes the impairment charge of $1.6 million on a construction loan advanced to a joint venture for the year ended December 31, 2011. |
| (C) | Valuation allowance as discussed further in Note 16. |
| (D) | Includes reversal of loan loss reserves as described in Note 4. |
F-61
Table of Contents
Real Estate and Accumulated Depreciation
December 31, 2012
(In thousands)
| Initial Cost | Total Cost (1) |
Accumulated
Depreciation |
Total Cost,
Net of Accumulated Depreciation |
Encumbrances |
Depreciable
Lives (Years) (2) |
Date
of
Construction (C) Acquisition (A) |
||||||||||||||||||||||||||||||||||
| Land |
Buildings
& Improvements |
Improvements | Land |
Buildings
& Improvements |
Total | |||||||||||||||||||||||||||||||||||
|
Bayamon, PR |
$ | 132,074 | $ | 152,441 | $ | - | $ | 132,759 | $ | 165,993 | $ | 298,752 | $ | 39,712 | $ | 259,040 | $ | - | S/L 31.5 | 2005(A) | ||||||||||||||||||||
|
Carolina, PR |
28,522 | 76,947 | - | 28,601 | 81,832 | 110,433 | 20,262 | 90,171 | - | S/L 31.5 | 2005(A) | |||||||||||||||||||||||||||||
|
Humacao, PR |
16,386 | 74,059 | - | 16,386 | 82,469 | 98,855 | 21,768 | 77,087 | - | S/L 31.5 | 2005(A) | |||||||||||||||||||||||||||||
|
Isabela, PR |
8,175 | 41,094 | - | 8,236 | 42,757 | 50,993 | 10,891 | 40,102 | 22,678 | S/L 31.5 | 2005(A) | |||||||||||||||||||||||||||||
|
San German, PR |
3,215 | 24 | - | 3,215 | 41 | 3,256 | 29 | 3,227 | - | S/L 31.5 | 2005(A) | |||||||||||||||||||||||||||||
|
Cayey, PR |
18,226 | 25,101 | - | 18,538 | 26,122 | 44,660 | 6,839 | 37,821 | 21,472 | S/L 31.5 | 2005(A) | |||||||||||||||||||||||||||||
|
Bayamon, PR |
91,645 | 98,007 | - | 92,027 | 108,265 | 200,292 | 26,696 | 173,596 | 125,700 | S/L 31.5 | 2005(A) | |||||||||||||||||||||||||||||
|
Rio Piedras, PR |
10,338 | 23,285 | - | 10,338 | 29,754 | 40,092 | 7,130 | 32,962 | - | S/L 31.5 | 2005(A) | |||||||||||||||||||||||||||||
|
Bayamon, PR |
4,294 | 11,987 | - | 4,584 | 22,820 | 27,404 | 3,727 | 23,677 | - | S/L 31.5 | 2005(A) | |||||||||||||||||||||||||||||
|
Arecibo, PR |
7,965 | 29,898 | - | 8,094 | 32,351 | 40,445 | 8,139 | 32,306 | - | S/L 31.5 | 2005(A) | |||||||||||||||||||||||||||||
|
Hatillo, PR |
101,219 | 105,465 | - | 101,219 | 127,645 | 228,864 | 30,493 | 198,371 | - | S/L 31.5 | 2005(A) | |||||||||||||||||||||||||||||
|
Vega Baja, PR |
7,076 | 18,684 | - | 7,076 | 18,796 | 25,872 | 4,866 | 21,006 | - | S/L 31.5 | 2005(A) | |||||||||||||||||||||||||||||
|
Guayama, PR |
1,960 | 18,721 | - | 1,960 | 19,598 | 21,558 | 4,944 | 16,614 | 12,065 | S/L 31.5 | 2005(A) | |||||||||||||||||||||||||||||
|
Fajardo, PR |
4,376 | 41,199 | - | 4,376 | 41,730 | 46,106 | 10,660 | 35,446 | 25,816 | S/L 31.5 | 2005(A) | |||||||||||||||||||||||||||||
|
San German, PR |
6,470 | 20,751 | - | 6,470 | 21,326 | 27,796 | 5,530 | 22,266 | - | S/L 31.5 | 2005(A) | |||||||||||||||||||||||||||||
|
Brandon, FL |
- | 4,111 | - | - | 6,350 | 6,350 | 5,199 | 1,151 | - | S/L 30.0 | 1972(C) | |||||||||||||||||||||||||||||
|
Stow, OH |
993 | 9,028 | - | 993 | 36,248 | 37,241 | 14,591 | 22,650 | - | S/L 30.0 | 1969(C) | |||||||||||||||||||||||||||||
|
Westlake, OH |
424 | 3,803 | 201 | 424 | 10,375 | 10,799 | 6,532 | 4,267 | - | S/L 30.0 | 1974(C) | |||||||||||||||||||||||||||||
|
E. Norriton, PA |
70 | 4,698 | 233 | 70 | 8,841 | 8,911 | 6,832 | 2,079 | - | S/L 30.0 | 1975(C) | |||||||||||||||||||||||||||||
|
Palm Harbor, FL |
1,137 | 4,089 | - | 1,137 | 4,678 | 5,815 | 2,433 | 3,382 | - | S/L 31.5 | 1995(A) | |||||||||||||||||||||||||||||
|
Homestead, FL |
23,390 | 59,639 | - | 23,390 | 61,464 | 84,854 | 5,721 | 79,133 | - | S/L 31.5 | 2008(C) | |||||||||||||||||||||||||||||
|
Tarpon Springs, FL |
146 | 7,382 | 81 | 146 | 9,226 | 9,372 | 6,761 | 2,611 | - | S/L 30.0 | 1974(C) | |||||||||||||||||||||||||||||
|
McHenry, IL |
1,294 | 5,251 | - | 13,771 | 58,591 | 72,362 | 8,816 | 63,546 | - | S/L 31.5 | 2006(C) | |||||||||||||||||||||||||||||
|
Miami, FL |
11,626 | 30,457 | - | 26,743 | 111,274 | 138,017 | 17,554 | 120,463 | - | S/L 31.5 | 2006(C) | |||||||||||||||||||||||||||||
|
San Antonio, TX |
3,990 | 28,404 | - | 3,990 | 36,505 | 40,495 | 5,626 | 34,869 | - | S/L 31.5 | 2007(C) | |||||||||||||||||||||||||||||
|
Starkville, MS |
703 | 6,921 | - | 703 | 7,059 | 7,762 | 3,598 | 4,164 | - | S/L 31.5 | 1994(A) | |||||||||||||||||||||||||||||
|
Gulfport, MS |
- | 36,370 | - | - | 51,870 | 51,870 | 17,326 | 34,544 | 23,968 | S/L 31.5 | 2003(A) | |||||||||||||||||||||||||||||
|
Tupelo, MS |
2,213 | 14,979 | - | 2,213 | 18,880 | 21,093 | 9,892 | 11,201 | - | S/L 31.5 | 1994(A) | |||||||||||||||||||||||||||||
|
Jacksonville, FL |
2,714 | 9,425 | - | 2,714 | 9,823 | 12,537 | 5,816 | 6,721 | - | S/L 31.5 | 1995(A) | |||||||||||||||||||||||||||||
|
Long Beach, CA |
- | 111,512 | - | - | 143,943 | 143,943 | 40,238 | 103,705 | - | S/L 31.5 | 2005(C) | |||||||||||||||||||||||||||||
|
Brunswick, ME |
3,796 | 15,459 | - | 3,796 | 20,461 | 24,257 | 9,697 | 14,560 | - | S/L 31.5 | 1973(C) | |||||||||||||||||||||||||||||
|
Oceanside, CA |
- | 10,643 | - | - | 14,377 | 14,377 | 5,434 | 8,943 | - | S/L 31.5 | 2000(C) | |||||||||||||||||||||||||||||
|
Reno, NV |
- | 366 | - | 1,132 | 4,696 | 5,828 | 1,219 | 4,609 | 2,751 | S/L 31.5 | 2000(C) | |||||||||||||||||||||||||||||
|
Everett, MA |
9,311 | 44,647 | - | 9,462 | 51,488 | 60,950 | 18,478 | 42,472 | - | S/L 31.5 | 2001(C) | |||||||||||||||||||||||||||||
|
Pasadena, CA |
46,957 | 101,475 | 2,053 | 46,957 | 105,858 | 152,815 | 26,893 | 125,922 | - | S/L 31.5 | 2003(A) | |||||||||||||||||||||||||||||
|
Salisbury, MD |
2,070 | 12,495 | 277 | 2,071 | 13,051 | 15,122 | 4,912 | 10,210 | 8,506 | S/L 31.5 | 1999(C) | |||||||||||||||||||||||||||||
|
Duluth, GA |
475 | 9,374 | - | 475 | 10,117 | 10,592 | 5,911 | 4,681 | - | S/L 31.5 | 1994(A) | |||||||||||||||||||||||||||||
|
Apex, NC |
9,576 | 43,619 | - | 10,521 | 55,103 | 65,624 | 10,429 | 55,195 | - | S/L 31.5 | 2006(C) | |||||||||||||||||||||||||||||
|
Erie, PA |
6,373 | 19,201 | - | 6,373 | 51,299 | 57,672 | 23,490 | 34,182 | - | S/L 31.5 | 1995(C) | |||||||||||||||||||||||||||||
F-62
Table of Contents
DDR Corp.
Real Estate and Accumulated Depreciation
December 31, 2012
(In thousands)
| Initial Cost | Total Cost (1) |
Accumulated
Depreciation |
Total Cost,
Net of Accumulated Depreciation |
Encumbrances |
Depreciable
Lives (Years) (2) |
Date
of
Construction (C) Acquisition (A) |
||||||||||||||||||||||||||||||||||
| Land |
Buildings
& Improvements |
Improvements | Land |
Buildings
& Improvements |
Total | |||||||||||||||||||||||||||||||||||
|
San Francisco, CA |
10,464 | 25,730 | - | 10,464 | 26,135 | 36,599 | 6,818 | 29,781 | - | S/L 31.5 | 2002(A) | |||||||||||||||||||||||||||||
|
Chillicothe, OH |
43 | 2,549 | 2 | 1,170 | 4,405 | 5,575 | 2,392 | 3,183 | 4,183 | S/L 31.5 | 1974(C) | |||||||||||||||||||||||||||||
|
Phoenix, AZ |
18,701 | 18,811 | 118 | 18,701 | 19,814 | 38,515 | 4,239 | 34,276 | 17,153 | S/L 31.5 | 1999(A) | |||||||||||||||||||||||||||||
|
Macedonia, OH |
11,582 | 34,323 | - | 11,582 | 34,706 | 46,288 | 4,986 | 41,302 | 20,267 | S/L 31.5 | 2011(A) | |||||||||||||||||||||||||||||
|
Huber Hts, OH |
757 | 14,469 | - | 757 | 25,291 | 26,048 | 12,599 | 13,449 | - | S/L 31.5 | 1993(A) | |||||||||||||||||||||||||||||
|
Boardman, OH |
8,152 | 27,983 | - | 8,152 | 28,805 | 36,957 | 13,818 | 23,139 | 25,322 | S/L 31.5 | 1997(A) | |||||||||||||||||||||||||||||
|
Solon, OH |
6,220 | 7,454 | - | 6,220 | 22,531 | 28,751 | 9,429 | 19,322 | - | S/L 31.5 | 1998(C) | |||||||||||||||||||||||||||||
|
Bedford, IN |
706 | 8,425 | 6 | 1,067 | 11,509 | 12,576 | 6,136 | 6,440 | - | S/L 31.5 | 1993(A) | |||||||||||||||||||||||||||||
|
Sunset Hills, MO |
12,791 | 38,404 | - | 13,403 | 48,486 | 61,889 | 22,361 | 39,528 | 27,257 | S/L 31.5 | 1998(A) | |||||||||||||||||||||||||||||
|
Brentwood, MO |
10,018 | 32,053 | - | 10,018 | 33,135 | 43,153 | 15,202 | 27,951 | 32,139 | S/L 31.5 | 1998(A) | |||||||||||||||||||||||||||||
|
Cedar Rapids, IA |
4,219 | 12,697 | - | 4,219 | 14,067 | 18,286 | 6,585 | 11,701 | 6,490 | S/L 31.5 | 1998(A) | |||||||||||||||||||||||||||||
|
Des Peres, MO |
2,775 | 8,370 | - | 2,775 | 10,401 | 13,176 | 5,205 | 7,971 | - | S/L 31.5 | 1998(A) | |||||||||||||||||||||||||||||
|
Springfield, MO |
- | 2,048 | - | - | 2,518 | 2,518 | 1,084 | 1,434 | - | S/L 31.5 | 1998(A) | |||||||||||||||||||||||||||||
|
St. Louis, MO |
4,159 | 3,818 | - | 6,051 | 7,652 | 13,703 | 2,259 | 11,444 | - | S/L 31.5 | 2004(C) | |||||||||||||||||||||||||||||
|
Aurora, OH |
832 | 7,560 | - | 1,592 | 14,071 | 15,663 | 6,319 | 9,344 | - | S/L 31.5 | 1995(C) | |||||||||||||||||||||||||||||
|
Nampa, ID |
1,395 | 8,563 | - | 9,609 | 92,025 | 101,634 | 8,807 | 92,827 | - | S/L 31.5 | 2007(A) | |||||||||||||||||||||||||||||
|
Fenton, MO |
414 | 4,244 | 476 | 430 | 7,253 | 7,683 | 5,762 | 1,921 | - | S/L 30.0 | 1983(A) | |||||||||||||||||||||||||||||
|
Simpsonville, SC |
417 | 6,563 | - | 417 | 6,793 | 7,210 | 4,099 | 3,111 | - | S/L 31.5 | 1994(A) | |||||||||||||||||||||||||||||
|
Camden, SC |
627 | 7,519 | 7 | 1,021 | 11,686 | 12,707 | 6,570 | 6,137 | - | S/L 31.5 | 1993(A) | |||||||||||||||||||||||||||||
|
N. Charleston, SC |
911 | 11,346 | 1 | 1,081 | 16,888 | 17,969 | 10,297 | 7,672 | 10,668 | S/L 31.5 | 1993(A) | |||||||||||||||||||||||||||||
|
Mt. Pleasant, SC |
2,430 | 10,470 | - | 2,430 | 21,180 | 23,610 | 9,532 | 14,078 | 11,679 | S/L 31.5 | 1995(A) | |||||||||||||||||||||||||||||
|
Sault St. Marie, MI |
1,826 | 13,710 | - | 1,826 | 18,259 | 20,085 | 8,888 | 11,197 | - | S/L 31.5 | 1994(A) | |||||||||||||||||||||||||||||
|
Grand Rapids, MI |
3,380 | 17,323 | - | 3,380 | 24,539 | 27,919 | 10,123 | 17,796 | - | S/L 31.5 | 1995(A) | |||||||||||||||||||||||||||||
|
Howell, MI |
332 | 11,938 | 1 | 332 | 15,827 | 16,159 | 9,228 | 6,931 | - | S/L 31.5 | 1993(A) | |||||||||||||||||||||||||||||
|
Mt. Pleasant, MI |
767 | 7,769 | 20 | 1,142 | 21,242 | 22,384 | 8,795 | 13,589 | - | S/L 31.5 | 1993(A) | |||||||||||||||||||||||||||||
|
Meridian, ID |
24,591 | 31,779 | - | 24,841 | 62,317 | 87,158 | 19,376 | 67,782 | - | S/L 31.5 | 2001(C) | |||||||||||||||||||||||||||||
|
Midvale, UT |
25,662 | 56,759 | - | 28,395 | 88,405 | 116,800 | 31,107 | 85,693 | - | S/L 31.5 | 1998(A) | |||||||||||||||||||||||||||||
|
Taylorsville, UT |
24,327 | 53,686 | - | 31,368 | 77,421 | 108,789 | 32,744 | 76,045 | - | S/L 31.5 | 1998(A) | |||||||||||||||||||||||||||||
|
Orem, UT |
5,428 | 12,259 | - | 5,428 | 17,171 | 22,599 | 6,280 | 16,319 | - | S/L 31.5 | 1998(A) | |||||||||||||||||||||||||||||
|
Riverdale, UT |
24,755 | 45,635 | - | 24,755 | 57,573 | 82,328 | 21,884 | 60,444 | - | S/L 31.5 | 1998(A) | |||||||||||||||||||||||||||||
|
Ogden, UT |
3,620 | 7,716 | - | 8,305 | 8,886 | 17,191 | 4,120 | 13,071 | - | S/L 31.5 | 1998(A) | |||||||||||||||||||||||||||||
|
Birmingham, AL |
10,573 | 26,002 | - | 11,434 | 52,697 | 64,131 | 24,441 | 39,690 | 24,014 | S/L 31.5 | 1995(A) | |||||||||||||||||||||||||||||
|
Valencia, CA |
- | 15,784 | - | - | 17,950 | 17,950 | 3,301 | 14,649 | - | S/L 31.5 | 2006(A) | |||||||||||||||||||||||||||||
|
Allentown, PA |
4,408 | 4,707 | - | 4,408 | 4,707 | 9,115 | 1,368 | 7,747 | - | S/L 31.5 | 2004(A) | |||||||||||||||||||||||||||||
|
Mooresville, NC |
14,369 | 43,688 | - | 14,369 | 46,323 | 60,692 | 12,231 | 48,461 | 17,706 | S/L 31.5 | 2004(A) | |||||||||||||||||||||||||||||
|
Wilmington, NC |
4,287 | 16,852 | 1,183 | 4,287 | 34,684 | 38,971 | 19,992 | 18,979 | - | S/L 31.5 | 1989(C) | |||||||||||||||||||||||||||||
|
Spring Hill, FL |
1,084 | 4,816 | 266 | 2,096 | 11,672 | 13,768 | 6,702 | 7,066 | 3,355 | S/L 30.0 | 1988(C) | |||||||||||||||||||||||||||||
|
Broomfield, CO |
13,707 | 31,809 | - | 5,975 | 26,556 | 32,531 | 12,540 | 19,991 | - | S/L 31.5 | 2003(A) | |||||||||||||||||||||||||||||
|
Centennial, CO |
7,833 | 35,550 | - | 8,082 | 62,062 | 70,144 | 25,524 | 44,620 | - | S/L 31.5 | 1997(C) | |||||||||||||||||||||||||||||
F-63
Table of Contents
DDR Corp.
Real Estate and Accumulated Depreciation
December 31, 2012
(In thousands)
| Initial Cost | Total Cost (1) |
Accumulated
Depreciation |
Total Cost,
Net of Accumulated Depreciation |
Encumbrances |
Depreciable
Lives (Years) (2) |
Date
of
Construction (C) Acquisition (A) |
||||||||||||||||||||||||||||||||||
| Land |
Buildings
& Improvements |
Improvements | Land |
Buildings
& Improvements |
Total | |||||||||||||||||||||||||||||||||||
|
New Bern, NC |
441 | 6,575 | - | 441 | 6,593 | 7,034 | 3,700 | 3,334 | - | S/L 31.5 | 1989(C) | |||||||||||||||||||||||||||||
|
Princeton, NJ |
13,448 | 74,249 | - | 14,464 | 95,818 | 110,282 | 36,798 | 73,484 | 57,000 | S/L 31.5 | 1998(A) | |||||||||||||||||||||||||||||
|
Phoenix, AZ |
15,352 | 22,813 | 1,601 | 15,352 | 26,603 | 41,955 | 11,980 | 29,975 | 30,000 | S/L 31.5 | 2000(C) | |||||||||||||||||||||||||||||
|
Russellville, AR |
606 | 13,391 | - | 606 | 18,069 | 18,675 | 8,949 | 9,726 | - | S/L 31.5 | 1994(A) | |||||||||||||||||||||||||||||
|
N. Little Rock, AR |
907 | 17,160 | - | 907 | 21,301 | 22,208 | 9,590 | 12,618 | - | S/L 31.5 | 1994(A) | |||||||||||||||||||||||||||||
|
Washington, NC |
878 | 3,118 | 34 | 878 | 6,134 | 7,012 | 3,109 | 3,903 | - | S/L 31.5 | 1990(C) | |||||||||||||||||||||||||||||
|
Littleton, CO |
12,249 | 50,709 | - | 12,621 | 55,651 | 68,272 | 18,967 | 49,305 | - | S/L 31.5 | 2002(C) | |||||||||||||||||||||||||||||
|
Durham, NC |
2,210 | 11,671 | 278 | 1,579 | 13,081 | 14,660 | 9,849 | 4,811 | - | S/L 31.5 | 1990(C) | |||||||||||||||||||||||||||||
|
San Antonio, TX |
3,475 | 37,327 | - | 4,873 | 47,338 | 52,211 | 13,375 | 38,836 | 24,800 | S/L 31.5 | 2002(A) | |||||||||||||||||||||||||||||
|
Crystal River, FL |
1,217 | 5,796 | 365 | 1,219 | 10,245 | 11,464 | 5,923 | 5,541 | - | S/L 31.5 | 1986(C) | |||||||||||||||||||||||||||||
|
Denver, CO |
2,987 | 11,950 | - | 1,141 | 4,387 | 5,528 | 840 | 4,688 | - | S/L 31.5 | 2001(A) | |||||||||||||||||||||||||||||
|
Dublin, OH |
3,609 | 11,546 | - | 3,609 | 14,400 | 18,009 | 5,896 | 12,113 | - | S/L 31.5 | 1998(A) | |||||||||||||||||||||||||||||
|
Columbus, OH |
11,087 | 44,494 | - | 12,243 | 53,054 | 65,297 | 23,559 | 41,738 | 50,200 | S/L 31.5 | 1998(A) | |||||||||||||||||||||||||||||
|
Freehold, NJ |
2,460 | 2,475 | - | 3,166 | 3,267 | 6,433 | 417 | 6,016 | - | S/L 31.5 | 1994(A) | |||||||||||||||||||||||||||||
|
Jackson, MS |
4,190 | 6,783 | - | 4,190 | 7,474 | 11,664 | 2,306 | 9,358 | - | S/L 31.5 | 2003(A) | |||||||||||||||||||||||||||||
|
Scottsboro, AL |
788 | 2,781 | - | 788 | 3,233 | 4,021 | 1,133 | 2,888 | - | S/L 31.5 | 2003(A) | |||||||||||||||||||||||||||||
|
Ocala, FL |
1,916 | 3,893 | - | 1,916 | 6,018 | 7,934 | 1,745 | 6,189 | - | S/L 31.5 | 2003(A) | |||||||||||||||||||||||||||||
|
Tallahassee, FL |
1,881 | 2,956 | - | 1,881 | 7,299 | 9,180 | 2,070 | 7,110 | - | S/L 31.5 | 2003(A) | |||||||||||||||||||||||||||||
|
Cumming, GA |
14,249 | 23,653 | - | 14,249 | 24,954 | 39,203 | 8,282 | 30,921 | - | S/L 31.5 | 2003(A) | |||||||||||||||||||||||||||||
|
Douglasville, GA |
3,540 | 9,625 | - | 3,540 | 9,877 | 13,417 | 3,246 | 10,171 | - | S/L 31.5 | 2003(A) | |||||||||||||||||||||||||||||
|
Columbus, GA |
4,220 | 8,159 | - | 4,220 | 10,262 | 14,482 | 3,167 | 11,315 | - | S/L 31.5 | 2003(A) | |||||||||||||||||||||||||||||
|
Newnan, GA |
2,620 | 11,063 | - | 2,620 | 11,593 | 14,213 | 3,751 | 10,462 | - | S/L 31.5 | 2003(A) | |||||||||||||||||||||||||||||
|
Warner Robins, GA |
5,729 | 7,459 | - | 5,729 | 7,915 | 13,644 | 2,655 | 10,989 | 6,626 | S/L 31.5 | 2003(A) | |||||||||||||||||||||||||||||
|
Woodstock, GA |
1,486 | 2,573 | - | 1,486 | 2,630 | 4,116 | 1,853 | 2,263 | - | S/L 31.5 | 2003(A) | |||||||||||||||||||||||||||||
|
Fayetteville, NC |
8,524 | 10,627 | - | 8,524 | 14,715 | 23,239 | 4,361 | 18,878 | 9,681 | S/L 31.5 | 2003(A) | |||||||||||||||||||||||||||||
|
Charleston, SC |
3,479 | 9,850 | - | 3,479 | 16,743 | 20,222 | 7,612 | 12,610 | - | S/L 31.5 | 2003(A) | |||||||||||||||||||||||||||||
|
Denver, CO |
20,733 | 22,818 | - | 20,804 | 24,633 | 45,437 | 8,159 | 37,278 | - | S/L 31.5 | 2003(A) | |||||||||||||||||||||||||||||
|
Chattanooga, TN |
1,845 | 13,214 | - | 1,845 | 16,617 | 18,462 | 5,803 | 12,659 | 9,704 | S/L 31.5 | 2003(A) | |||||||||||||||||||||||||||||
|
Hendersonville, TN |
3,249 | 9,068 | - | 3,249 | 9,123 | 12,372 | 2,965 | 9,407 | 5,456 | S/L 31.5 | 2003(A) | |||||||||||||||||||||||||||||
|
Johnson City, TN |
- | 521 | - | - | 2,013 | 2,013 | 416 | 1,597 | - | S/L 31.5 | 2003(A) | |||||||||||||||||||||||||||||
|
Chester, VA |
10,780 | 4,752 | - | 10,780 | 7,117 | 17,897 | 2,753 | 15,144 | 7,284 | S/L 31.5 | 2003(A) | |||||||||||||||||||||||||||||
|
Milwaukee, WI |
4,527 | 3,600 | - | 4,527 | 4,888 | 9,415 | 1,528 | 7,887 | - | S/L 31.5 | 2003(A) | |||||||||||||||||||||||||||||
|
Suwanee, GA |
13,479 | 23,923 | - | 13,335 | 30,528 | 43,863 | 9,691 | 34,172 | 25,322 | S/L 31.5 | 2003(A) | |||||||||||||||||||||||||||||
|
West Allis, WI |
2,371 | 10,982 | - | 2,371 | 11,904 | 14,275 | 3,727 | 10,548 | - | S/L 31.5 | 2003(A) | |||||||||||||||||||||||||||||
|
Chesterfield, MI |
566 | 2,324 | - | 48 | 1,012 | 1,060 | 569 | 491 | - | S/L 31.5 | 2006(A) | |||||||||||||||||||||||||||||
|
Orland Park, IL |
10,430 | 13,081 | - | 10,430 | 13,403 | 23,833 | 3,679 | 20,154 | 6,532 | S/L 31.5 | 2004(A) | |||||||||||||||||||||||||||||
|
Louisville, KY |
4,180 | 747 | - | 4,288 | 2,416 | 6,704 | 587 | 6,117 | - | S/L 31.5 | 2004(A) | |||||||||||||||||||||||||||||
|
N. Charleston, SC |
5,146 | 5,990 | - | 5,146 | 10,167 | 15,313 | 2,804 | 12,509 | - | S/L 31.5 | 2004(A) | |||||||||||||||||||||||||||||
|
West Long Branch, NJ |
14,131 | 51,982 | - | 14,131 | 57,197 | 71,328 | 15,062 | 56,266 | 1,440 | S/L 31.5 | 2004(A) | |||||||||||||||||||||||||||||
F-64
Table of Contents
DDR Corp.
Real Estate and Accumulated Depreciation
December 31, 2012
(In thousands)
| Initial Cost | Total Cost (1) |
Accumulated
Depreciation |
Total Cost,
Net of Accumulated Depreciation |
Encumbrances |
Depreciable
Lives (Years) (2) |
Date
of
Construction (C) Acquisition (A) |
||||||||||||||||||||||||||||||||||
| Land |
Buildings
& Improvements |
Improvements | Land |
Buildings
& Improvements |
Total | |||||||||||||||||||||||||||||||||||
|
Mays Landing, NJ |
49,033 | 107,230 | - | 49,033 | 114,447 | 163,480 | 32,169 | 131,311 | 63,520 | S/L 31.5 | 2004(A) | |||||||||||||||||||||||||||||
|
Lakeland, FL |
2,778 | 2,302 | - | 2,778 | 2,457 | 5,235 | 1,200 | 4,035 | - | S/L 31.5 | 2004(A) | |||||||||||||||||||||||||||||
|
Toledo, OH |
1,316 | 3,961 | - | 1,316 | 3,961 | 5,277 | 1,132 | 4,145 | - | S/L 31.5 | 2004(A) | |||||||||||||||||||||||||||||
|
Mays Landing, NJ |
36,224 | 56,949 | - | 36,224 | 61,649 | 97,873 | 17,403 | 80,470 | 5,061 | S/L 31.5 | 2004(A) | |||||||||||||||||||||||||||||
|
Indian Trail, NC |
2,999 | 7,075 | - | 2,999 | 7,623 | 10,622 | 2,206 | 8,416 | - | S/L 31.5 | 2004(A) | |||||||||||||||||||||||||||||
|
Ashtabula, OH |
1,444 | 9,912 | - | 1,444 | 10,058 | 11,502 | 2,821 | 8,681 | - | S/L 31.5 | 2004(A) | |||||||||||||||||||||||||||||
|
Horseheads, NY |
659 | 2,426 | - | 4,777 | 33,390 | 38,167 | 3,660 | 34,507 | - | S/L 31.5 | 2007(A) | |||||||||||||||||||||||||||||
|
West Seneca, NY |
2,929 | 12,926 | - | 2,929 | 13,193 | 16,122 | 3,664 | 12,458 | - | S/L 31.5 | 2004(A) | |||||||||||||||||||||||||||||
|
N. Tonawanda, NY |
5,806 | 21,291 | - | 5,806 | 22,648 | 28,454 | 6,748 | 21,706 | - | S/L 31.5 | 2004(A) | |||||||||||||||||||||||||||||
|
Amherst, NY |
- | 28,331 | - | - | 25,205 | 25,205 | 9,737 | 15,468 | - | S/L 31.5 | 2004(A) | |||||||||||||||||||||||||||||
|
Ithaca, NY |
9,198 | 42,969 | - | 9,198 | 44,289 | 53,487 | 12,064 | 41,423 | 10,144 | S/L 31.5 | 2004(A) | |||||||||||||||||||||||||||||
|
Hamburg, NY |
3,303 | 16,239 | - | 3,303 | 16,546 | 19,849 | 4,720 | 15,129 | - | S/L 31.5 | 2004(A) | |||||||||||||||||||||||||||||
|
Hamburg, NY |
6,598 | 31,853 | - | 6,598 | 33,640 | 40,238 | 9,435 | 30,803 | - | S/L 31.5 | 2004(A) | |||||||||||||||||||||||||||||
|
Tonawanda, NY |
3,061 | 6,887 | - | 3,061 | 8,319 | 11,380 | 2,391 | 8,989 | - | S/L 31.5 | 2004(A) | |||||||||||||||||||||||||||||
|
Hamburg, NY |
4,152 | 22,075 | - | 4,152 | 22,738 | 26,890 | 6,338 | 20,552 | - | S/L 31.5 | 2004(A) | |||||||||||||||||||||||||||||
|
Olean, NY |
8,834 | 29,813 | - | 8,844 | 31,632 | 40,476 | 9,133 | 31,343 | - | S/L 31.5 | 2004(A) | |||||||||||||||||||||||||||||
|
Big Flats, NY |
22,229 | 52,579 | - | 22,279 | 57,956 | 80,235 | 18,174 | 62,061 | - | S/L 31.5 | 2004(A) | |||||||||||||||||||||||||||||
|
Williamsville, NY |
5,021 | 6,768 | - | 5,021 | 8,851 | 13,872 | 2,940 | 10,932 | - | S/L 31.5 | 2004(A) | |||||||||||||||||||||||||||||
|
Greece, NY |
3,901 | 4,922 | - | 3,901 | 4,923 | 8,824 | 1,392 | 7,432 | - | S/L 31.5 | 2004(A) | |||||||||||||||||||||||||||||
|
Buffalo, NY |
6,010 | 19,044 | - | 6,010 | 19,528 | 25,538 | 5,346 | 20,192 | - | S/L 31.5 | 2004(A) | |||||||||||||||||||||||||||||
|
Lockport, NY |
9,253 | 23,829 | - | 9,253 | 24,225 | 33,478 | 6,781 | 26,697 | 5,114 | S/L 31.5 | 2004(A) | |||||||||||||||||||||||||||||
|
Buffalo, NY |
3,568 | 29,001 | - | 3,620 | 29,658 | 33,278 | 8,193 | 25,085 | 9,963 | S/L 31.5 | 2004(A) | |||||||||||||||||||||||||||||
|
Cheektowaga, NY |
15,471 | 25,600 | - | 15,471 | 27,158 | 42,629 | 8,264 | 34,365 | 2,517 | S/L 31.5 | 2004(A) | |||||||||||||||||||||||||||||
|
New Hartford, NY |
1,279 | 13,685 | - | 1,279 | 13,776 | 15,055 | 3,872 | 11,183 | - | S/L 31.5 | 2004(A) | |||||||||||||||||||||||||||||
|
Gates, NY |
9,369 | 40,672 | - | 9,369 | 42,075 | 51,444 | 12,058 | 39,386 | - | S/L 31.5 | 2004(A) | |||||||||||||||||||||||||||||
|
Rome, NY |
4,565 | 5,078 | - | 4,565 | 9,411 | 13,976 | 2,424 | 11,552 | 2,023 | S/L 31.5 | 2004(A) | |||||||||||||||||||||||||||||
|
Dewitt, NY |
881 | 5,686 | - | 561 | 4,196 | 4,757 | 1,577 | 3,180 | - | S/L 31.5 | 2004(A) | |||||||||||||||||||||||||||||
|
Niskayuna, NY |
20,297 | 51,155 | - | 20,297 | 52,586 | 72,883 | 15,053 | 57,830 | 13,878 | S/L 31.5 | 2004(A) | |||||||||||||||||||||||||||||
|
Victor, NY |
2,374 | 6,433 | - | 2,374 | 7,007 | 9,381 | 1,908 | 7,473 | 5,802 | S/L 31.5 | 2004(A) | |||||||||||||||||||||||||||||
|
Allentown, PA |
5,558 | 20,060 | - | 5,558 | 23,098 | 28,656 | 6,957 | 21,699 | 12,250 | S/L 31.5 | 2003(A) | |||||||||||||||||||||||||||||
|
St. John, MO |
2,613 | 7,040 | - | 2,827 | 8,122 | 10,949 | 2,565 | 8,384 | - | S/L 31.5 | 2003(A) | |||||||||||||||||||||||||||||
|
Ft. Collins, CO |
1,129 | 2,054 | - | 1,129 | 4,579 | 5,708 | 1,376 | 4,332 | - | S/L 31.5 | 2003(A) | |||||||||||||||||||||||||||||
|
Lakeland, FL |
1,445 | - | - | 1,445 | 5,863 | 7,308 | 1,207 | 6,101 | - | S/L 31.5 | 2003(A) | |||||||||||||||||||||||||||||
|
Hamilton, NJ |
8,039 | 49,896 | - | 11,774 | 85,560 | 97,334 | 23,049 | 74,285 | 40,419 | S/L 31.5 | 2003(A) | |||||||||||||||||||||||||||||
|
Lansing, MI |
1,598 | 6,999 | - | 1,801 | 11,825 | 13,626 | 3,405 | 10,221 | 6,496 | S/L 31.5 | 2003(A) | |||||||||||||||||||||||||||||
|
San Antonio, TX |
1,613 | 10,791 | - | 6,168 | 70,946 | 77,114 | 9,264 | 67,850 | - | S/L 31.5 | 2007(C) | |||||||||||||||||||||||||||||
|
San Antonio, TX |
2,381 | 6,487 | - | 2,381 | 15,647 | 18,028 | 4,257 | 13,771 | - | S/L 31.5 | 2007(A) | |||||||||||||||||||||||||||||
|
Kyle, TX |
2,548 | 7,349 | - | 4,676 | 17,014 | 21,690 | 1,183 | 20,507 | 21,470 | S/L 31.5 | 2009(C) | |||||||||||||||||||||||||||||
|
Brandon, FL |
4,775 | 13,117 | - | 4,775 | 14,243 | 19,018 | 1,366 | 17,652 | - | S/L 31.5 | 2009(A) | |||||||||||||||||||||||||||||
F-65
Table of Contents
DDR Corp.
Real Estate and Accumulated Depreciation
December 31, 2012
(In thousands)
| Initial Cost | Total Cost (1) |
Accumulated
Depreciation |
Total Cost,
Net of Accumulated Depreciation |
Encumbrances |
Depreciable
Lives (Years) (2) |
Date
of
Construction (C) Acquisition (A) |
||||||||||||||||||||||||||||||||||
| Land |
Buildings
& Improvements |
Improvements | Land |
Buildings
& Improvements |
Total | |||||||||||||||||||||||||||||||||||
|
Atlanta, GA |
14,078 | 41,050 | - | 14,078 | 41,950 | 56,028 | 4,020 | 52,008 | 43,300 | S/L 31.5 | 2009(A) | |||||||||||||||||||||||||||||
|
Marietta, GA |
9,745 | 27,737 | - | 9,137 | 28,710 | 37,847 | 2,945 | 34,902 | - | S/L 31.5 | 2009(A) | |||||||||||||||||||||||||||||
|
Maple Grove, MN |
8,917 | 23,954 | - | 8,917 | 24,336 | 33,253 | 1,426 | 31,827 | - | S/L 31.5 | 2011(A) | |||||||||||||||||||||||||||||
|
Charlotte, NC |
27,707 | 45,021 | - | 27,707 | 45,364 | 73,071 | 1,986 | 71,085 | 50,045 | S/L 31.5 | 2011(A) | |||||||||||||||||||||||||||||
|
Charlotte, NC |
4,733 | 5,424 | - | 4,733 | 5,452 | 10,185 | 229 | 9,956 | - | S/L 31.5 | 2011(A) | |||||||||||||||||||||||||||||
|
Colorado Springs, CO |
4,075 | 20,248 | - | 4,075 | 20,663 | 24,738 | 959 | 23,779 | 9,196 | S/L 31.5 | 2011(A) | |||||||||||||||||||||||||||||
|
Columbus, OH |
18,716 | 64,617 | - | 18,716 | 64,784 | 83,500 | 2,478 | 81,022 | 44,758 | S/L 31.5 | 2011(A) | |||||||||||||||||||||||||||||
|
Portland, OR |
20,208 | 50,738 | - | 20,208 | 50,904 | 71,112 | 1,365 | 69,747 | - | S/L 31.5 | 2012(A) | |||||||||||||||||||||||||||||
|
Phoenix, AZ |
15,090 | 36,880 | - | 15,090 | 37,903 | 52,993 | 1,038 | 51,955 | - | S/L 31.5 | 2012(A) | |||||||||||||||||||||||||||||
|
Tucson, AZ |
19,298 | 94,117 | - | 19,298 | 94,203 | 113,501 | 1,486 | 112,015 | 24,202 | S/L 31.5 | 2012(A) | |||||||||||||||||||||||||||||
|
Phoenix, AZ |
34,201 | 88,475 | - | 34,201 | 90,312 | 124,513 | 1,339 | 123,174 | - | S/L 31.5 | 2012(A) | |||||||||||||||||||||||||||||
|
Independence, MO |
5,011 | 45,752 | - | 5,011 | 45,757 | 50,768 | 407 | 50,361 | - | S/L 31.5 | 2012(A) | |||||||||||||||||||||||||||||
|
Arnold, MO |
892 | 5,283 | - | 892 | 5,285 | 6,177 | 46 | 6,131 | - | S/L 31.5 | 2012(A) | |||||||||||||||||||||||||||||
|
Charlotte, NC |
11,224 | 82,124 | - | 11,224 | 82,124 | 93,348 | - | 93,348 | - | S/L 31.5 | 2012(A) | |||||||||||||||||||||||||||||
|
Raleigh, NC |
3,317 | 35,411 | - | 3,317 | 35,411 | 38,728 | - | 38,728 | - | S/L 31.5 | 2012(A) | |||||||||||||||||||||||||||||
|
Tinley Park, IL |
9,120 | 37,496 | - | 9,120 | 37,525 | 46,645 | 1,155 | 45,490 | - | S/L 31.5 | 2012(A) | |||||||||||||||||||||||||||||
|
Macon, GA |
2,940 | 5,192 | - | 2,940 | 5,477 | 8,417 | 1,025 | 7,392 | - | S/L 31.5 | 2007(A) | |||||||||||||||||||||||||||||
|
Snellville, GA |
10,185 | 51,815 | - | 10,342 | 54,205 | 64,547 | 10,250 | 54,297 | 21,200 | S/L 31.5 | 2007(A) | |||||||||||||||||||||||||||||
|
Union, NJ |
7,650 | 15,689 | - | 7,650 | 22,823 | 30,473 | 3,499 | 26,974 | - | S/L 31.5 | 2007(A) | |||||||||||||||||||||||||||||
|
Boiling Springs, SC |
1,015 | 4,486 | - | 1,015 | 4,491 | 5,506 | 1,262 | 4,244 | - | S/L 31.5 | 2007(A) | |||||||||||||||||||||||||||||
|
Taylors, SC |
1,732 | 4,506 | - | 1,732 | 4,507 | 6,239 | 863 | 5,376 | - | S/L 31.5 | 2007(A) | |||||||||||||||||||||||||||||
|
Dothan, AL |
3,358 | 26,903 | - | 3,358 | 27,968 | 31,326 | 5,261 | 26,065 | - | S/L 31.5 | 2007(A) | |||||||||||||||||||||||||||||
|
Bradenton, FL |
10,766 | 31,203 | - | 10,916 | 35,024 | 45,940 | 12,857 | 33,083 | - | S/L 31.5 | 2007(A) | |||||||||||||||||||||||||||||
|
Clearwater, FL |
5,579 | 15,855 | - | 5,579 | 17,539 | 23,118 | 3,296 | 19,822 | 6,956 | S/L 31.5 | 2007(A) | |||||||||||||||||||||||||||||
|
Tampa, FL |
1,699 | 3,338 | - | 1,699 | 3,390 | 5,089 | 634 | 4,455 | - | S/L 31.5 | 2007(A) | |||||||||||||||||||||||||||||
|
Tequesta, FL |
2,108 | 7,400 | - | 2,108 | 8,524 | 10,632 | 2,086 | 8,546 | - | S/L 31.5 | 2007(A) | |||||||||||||||||||||||||||||
|
Kennesaw, GA |
6,175 | 9,028 | - | 6,175 | 9,522 | 15,697 | 1,742 | 13,955 | - | S/L 31.5 | 2007(A) | |||||||||||||||||||||||||||||
|
Roswell, GA |
6,566 | 15,005 | - | 6,566 | 15,736 | 22,302 | 6,697 | 15,605 | - | S/L 31.5 | 2007(A) | |||||||||||||||||||||||||||||
|
Hagerstown, MD |
2,440 | 9,697 | - | 2,440 | 11,743 | 14,183 | 2,240 | 11,943 | - | S/L 31.5 | 2007(A) | |||||||||||||||||||||||||||||
|
Greensboro, NC |
5,012 | 11,162 | - | 5,105 | 11,527 | 16,632 | 2,216 | 14,416 | - | S/L 31.5 | 2007(A) | |||||||||||||||||||||||||||||
|
Greensboro, NC |
3,153 | 9,455 | - | 3,153 | 9,755 | 12,908 | 1,878 | 11,030 | 4,676 | S/L 31.5 | 2007(A) | |||||||||||||||||||||||||||||
|
East Hanover, NJ |
3,847 | 23,798 | - | 3,847 | 24,376 | 28,223 | 4,603 | 23,620 | - | S/L 31.5 | 2007(A) | |||||||||||||||||||||||||||||
|
Camp Hill, PA |
1,631 | 8,402 | - | 1,631 | 8,406 | 10,037 | 1,607 | 8,430 | - | S/L 31.5 | 2007(A) | |||||||||||||||||||||||||||||
|
Middletown, RI |
3,804 | 16,805 | - | 3,842 | 16,931 | 20,773 | 3,233 | 17,540 | - | S/L 31.5 | 2007(A) | |||||||||||||||||||||||||||||
|
Lexington, SC |
1,795 | 9,933 | - | 1,795 | 9,977 | 11,772 | 1,885 | 9,887 | 4,206 | S/L 31.5 | 2007(A) | |||||||||||||||||||||||||||||
|
Newport News, VA |
10,064 | 21,272 | - | 4,026 | 11,063 | 15,089 | 4,064 | 11,025 | - | S/L 31.5 | 2007(A) | |||||||||||||||||||||||||||||
|
Richmond, VA |
11,879 | 34,736 | - | 11,879 | 35,614 | 47,493 | 6,788 | 40,705 | 12,218 | S/L 31.5 | 2007(A) | |||||||||||||||||||||||||||||
|
Springfield, VA |
12,627 | 30,572 | - | 12,627 | 31,546 | 44,173 | 5,950 | 38,223 | 10,809 | S/L 31.5 | 2007(A) | |||||||||||||||||||||||||||||
|
Springfield, VA |
4,389 | 9,466 | - | 4,389 | 10,167 | 14,556 | 2,111 | 12,445 | - | S/L 31.5 | 2007(A) | |||||||||||||||||||||||||||||
F-66
Table of Contents
DDR Corp.
Real Estate and Accumulated Depreciation
December 31, 2012
(In thousands)
| Initial Cost | Total Cost (1) |
Accumulated
Depreciation |
Total Cost,
Net of Accumulated Depreciation |
Encumbrances |
Depreciable
Lives (Years) (2) |
Date
of
Construction (C) Acquisition (A) |
||||||||||||||||||||||||||||||||||
| Land |
Buildings
& Improvements |
Improvements | Land |
Buildings
& Improvements |
Total | |||||||||||||||||||||||||||||||||||
|
Sterling, VA |
8,426 | 18,651 | - | 8,426 | 18,689 | 27,115 | 3,532 | 23,583 | - | S/L 31.5 | 2007(A) | |||||||||||||||||||||||||||||
|
Windsor Court, CT |
6,090 | 11,745 | - | 6,090 | 11,749 | 17,839 | 2,230 | 15,609 | 7,096 | S/L 31.5 | 2007(A) | |||||||||||||||||||||||||||||
|
Ocala, FL |
2,877 | 9,407 | - | 853 | 4,475 | 5,328 | 1,796 | 3,532 | - | S/L 31.5 | 2007(A) | |||||||||||||||||||||||||||||
|
Valrico, FL |
3,282 | 12,190 | - | 3,282 | 15,031 | 18,313 | 2,334 | 15,979 | - | S/L 31.5 | 2007(A) | |||||||||||||||||||||||||||||
|
Atlanta, GA |
11,120 | 31,341 | - | 11,120 | 32,982 | 44,102 | 6,142 | 37,960 | 11,796 | S/L 31.5 | 2007(A) | |||||||||||||||||||||||||||||
|
Norcross, GA |
3,007 | 8,489 | - | 3,007 | 8,535 | 11,542 | 1,609 | 9,933 | - | S/L 31.5 | 2007(A) | |||||||||||||||||||||||||||||
|
Bowie, MD |
5,739 | 14,301 | - | 5,744 | 14,402 | 20,146 | 2,770 | 17,376 | - | S/L 31.5 | 2007(A) | |||||||||||||||||||||||||||||
|
Ashville, NC |
2,651 | 8,908 | - | 2,651 | 9,032 | 11,683 | 1,943 | 9,740 | - | S/L 31.5 | 2007(A) | |||||||||||||||||||||||||||||
|
Charlotte, NC |
2,842 | 9,807 | - | 2,842 | 10,025 | 12,867 | 1,909 | 10,958 | - | S/L 31.5 | 2007(A) | |||||||||||||||||||||||||||||
|
Cornelius, NC |
4,382 | 15,184 | - | 4,382 | 18,661 | 23,043 | 4,027 | 19,016 | - | S/L 31.5 | 2007(A) | |||||||||||||||||||||||||||||
|
Greensboro, NC |
1,682 | 7,593 | - | 1,682 | 7,654 | 9,336 | 1,861 | 7,475 | - | S/L 31.5 | 2007(A) | |||||||||||||||||||||||||||||
|
Raleigh, NC |
2,728 | 10,665 | - | 2,728 | 10,817 | 13,545 | 2,054 | 11,491 | - | S/L 31.5 | 2007(A) | |||||||||||||||||||||||||||||
|
Wilson, NC |
1,598 | 8,160 | - | 1,635 | 9,110 | 10,745 | 1,749 | 8,996 | - | S/L 31.5 | 2007(A) | |||||||||||||||||||||||||||||
|
Morgantown, WV |
4,645 | 10,341 | - | 4,645 | 10,425 | 15,070 | 2,130 | 12,940 | - | S/L 31.5 | 2007(A) | |||||||||||||||||||||||||||||
|
Edgewater, NJ |
7,714 | 30,473 | - | 7,714 | 30,855 | 38,569 | 5,786 | 32,783 | - | S/L 31.5 | 2007(A) | |||||||||||||||||||||||||||||
|
Highland Ranch, CO |
1,380 | 4,682 | - | 1,380 | 4,838 | 6,218 | 872 | 5,346 | - | S/L 31.5 | 2007(A) | |||||||||||||||||||||||||||||
|
Dania Beach, FL |
9,593 | 17,686 | - | 9,593 | 17,691 | 27,284 | 3,416 | 23,868 | - | S/L 31.5 | 2007(A) | |||||||||||||||||||||||||||||
|
Plantation, FL |
21,729 | 37,331 | - | 22,112 | 93,830 | 115,942 | 15,458 | 100,484 | 45,800 | S/L 31.5 | 2007(A) | |||||||||||||||||||||||||||||
|
Duluth, GA |
815 | 2,692 | - | 545 | 2,094 | 2,639 | 644 | 1,995 | - | S/L 31.5 | 2007(A) | |||||||||||||||||||||||||||||
|
Lawrenceville, GA |
1,457 | 1,057 | - | 1,486 | 1,146 | 2,632 | 219 | 2,413 | - | S/L 31.5 | 2007(A) | |||||||||||||||||||||||||||||
|
Rome, GA |
1,523 | 4,007 | - | 1,523 | 4,966 | 6,489 | 754 | 5,735 | - | S/L 31.5 | 2007(A) | |||||||||||||||||||||||||||||
|
Snellville, GA |
1,303 | 1,494 | - | 1,303 | 1,494 | 2,797 | 285 | 2,512 | - | S/L 31.5 | 2007(A) | |||||||||||||||||||||||||||||
|
Sylvania, GA |
431 | 3,774 | - | 431 | 3,774 | 4,205 | 747 | 3,458 | - | S/L 31.5 | 2007(A) | |||||||||||||||||||||||||||||
|
Worcester, MA |
5,395 | 10,938 | - | 1,517 | 4,583 | 6,100 | 2,084 | 4,016 | 5,264 | S/L 31.5 | 2007(A) | |||||||||||||||||||||||||||||
|
Dearborn Heights, MI |
2,463 | 2,946 | - | 2,463 | 2,946 | 5,409 | 566 | 4,843 | - | S/L 31.5 | 2007(A) | |||||||||||||||||||||||||||||
|
Livonia, MI |
1,396 | 2,680 | - | 1,396 | 2,680 | 4,076 | 516 | 3,560 | - | S/L 31.5 | 2007(A) | |||||||||||||||||||||||||||||
|
Westland, MI |
1,400 | 2,531 | - | 1,400 | 2,531 | 3,931 | 491 | 3,440 | 2,625 | S/L 31.5 | 2007(A) | |||||||||||||||||||||||||||||
|
Cary, NC |
2,264 | 4,581 | - | 1,079 | 3,742 | 4,821 | 1,206 | 3,615 | - | S/L 31.5 | 2007(A) | |||||||||||||||||||||||||||||
|
Winston-Salem, NC |
7,156 | 15,010 | - | 7,156 | 15,010 | 22,166 | 2,956 | 19,210 | 5,620 | S/L 31.5 | 2007(A) | |||||||||||||||||||||||||||||
|
Cheektowaga, NY |
1,740 | 2,417 | - | 1,740 | 2,417 | 4,157 | 460 | 3,697 | - | S/L 31.5 | 2007(A) | |||||||||||||||||||||||||||||
|
Dunkirk, NY |
- | 1,487 | - | - | 1,487 | 1,487 | 288 | 1,199 | - | S/L 31.5 | 2007(A) | |||||||||||||||||||||||||||||
|
Alliance, OH |
812 | 16,244 | - | 812 | 16,244 | 17,056 | 3,183 | 13,873 | 7,002 | S/L 31.5 | 2007(A) | |||||||||||||||||||||||||||||
|
Cincinnati, OH |
2,805 | 5,028 | - | 2,805 | 5,028 | 7,833 | 964 | 6,869 | 2,537 | S/L 31.5 | 2007(A) | |||||||||||||||||||||||||||||
|
Cheswick, PA |
863 | 2,225 | - | 863 | 2,225 | 3,088 | 424 | 2,664 | - | S/L 31.5 | 2007(A) | |||||||||||||||||||||||||||||
|
Erie, PA |
958 | 2,206 | - | 958 | 2,206 | 3,164 | 409 | 2,755 | - | S/L 31.5 | 2007(A) | |||||||||||||||||||||||||||||
|
Erie, PA |
1,525 | 2,399 | - | 378 | 921 | 1,299 | 433 | 866 | - | S/L 31.5 | 2007(A) | |||||||||||||||||||||||||||||
|
Erie, PA |
- | 1,486 | - | - | 1,486 | 1,486 | 286 | 1,200 | - | S/L 31.5 | 2007(A) | |||||||||||||||||||||||||||||
|
Erie, PA |
1,578 | 2,703 | - | 1,578 | 2,711 | 4,289 | 501 | 3,788 | - | S/L 31.5 | 2007(A) | |||||||||||||||||||||||||||||
|
Erie, PA |
1,641 | 2,015 | - | 1,641 | 2,015 | 3,656 | 384 | 3,272 | - | S/L 31.5 | 2007(A) | |||||||||||||||||||||||||||||
F-67
Table of Contents
DDR Corp.
Real Estate and Accumulated Depreciation
December 31, 2012
(In thousands)
| Initial Cost | Total Cost (1) |
Accumulated
Depreciation |
Total Cost,
Net of Accumulated Depreciation |
Encumbrances |
Depreciable
Lives (Years) (2) |
Date
of
Construction (C) Acquisition (A) |
||||||||||||||||||||||||||||||||||
| Land |
Buildings
& Improvements |
Improvements | Land |
Buildings
& Improvements |
Total | |||||||||||||||||||||||||||||||||||
|
Monroeville, PA |
1,431 | 2,006 | - | 1,431 | 2,014 | 3,445 | 372 | 3,073 | - | S/L 31.5 | 2007(A) | |||||||||||||||||||||||||||||
|
New Castle, PA |
1,331 | 2,016 | - | 1,331 | 2,016 | 3,347 | 385 | 2,962 | - | S/L 31.5 | 2007(A) | |||||||||||||||||||||||||||||
|
Pittsburgh, PA |
1,771 | 2,523 | - | 1,445 | 2,148 | 3,593 | 478 | 3,115 | - | S/L 31.5 | 2007(A) | |||||||||||||||||||||||||||||
|
Greenville, SC |
1,452 | 1,891 | - | 1,452 | 1,956 | 3,408 | 361 | 3,047 | - | S/L 31.5 | 2007(A) | |||||||||||||||||||||||||||||
|
Greenville, SC |
5,659 | 14,411 | - | 5,659 | 14,411 | 20,070 | 2,848 | 17,222 | 5,464 | S/L 31.5 | 2007(A) | |||||||||||||||||||||||||||||
|
Woodruff, SC |
1,145 | 2,353 | - | 1,145 | 2,353 | 3,498 | 454 | 3,044 | - | S/L 31.5 | 2007(A) | |||||||||||||||||||||||||||||
|
Grand Prairie, TX |
2,892 | 3,226 | - | 2,892 | 3,226 | 6,118 | 652 | 5,466 | - | S/L 31.5 | 2007(A) | |||||||||||||||||||||||||||||
|
Houston, TX |
4,380 | 8,729 | - | 4,380 | 8,775 | 13,155 | 1,747 | 11,408 | - | S/L 31.5 | 2007(A) | |||||||||||||||||||||||||||||
|
Olympia, WA |
2,946 | 3,050 | - | 2,946 | 3,050 | 5,996 | 565 | 5,431 | - | S/L 31.5 | 2007(A) | |||||||||||||||||||||||||||||
|
Lakeland, FL |
2,800 | 3,148 | - | 2,800 | 3,682 | 6,482 | 1,370 | 5,112 | - | S/L 31.5 | 2007(A) | |||||||||||||||||||||||||||||
|
Evansville, IN |
8,964 | 18,764 | - | 8,964 | 18,797 | 27,761 | 3,732 | 24,029 | - | S/L 31.5 | 2007(A) | |||||||||||||||||||||||||||||
|
Apex, NC |
2,362 | 4,452 | - | 2,362 | 4,452 | 6,814 | 499 | 6,315 | - | S/L 31.5 | 2007(A) | |||||||||||||||||||||||||||||
|
Portfolio Balance
|
205,696 | 194,608 | - | 205,697 | 194,609 | 400,306 | 1,491 | 398,815 | - | S/L 31.5 | ||||||||||||||||||||||||||||||
|
Portfolio Balance
|
62,753 | 180,721 | - | 62,753 | 180,721 | 243,474 | 60,884 | 182,590 | 46,277 | S/L 31.5 | ||||||||||||||||||||||||||||||
|
|
|
|
|
|
|
|
|
|
|
|
|
|
|
|
|
|
|
|||||||||||||||||||||||
| $ | 2,098,335 | $ | 5,327,191 | $ | 7,203 | $ | 2,154,968 | (3) | $ | 6,484,143 | (4) | $ | 8,639,111 | $ | 1,670,717 | $ | 6,968,394 | $ | 1,246,938 | (5) | ||||||||||||||||||||
|
|
|
|
|
|
|
|
|
|
|
|
|
|
|
|
|
|
|
|||||||||||||||||||||||
| (1) | The Aggregate Cost for Federal Income Tax purposes was approximately $8.7 billion at December 31, 2012. |
| (2) | S/L refers to straight-line depreciation. |
| (3) | Includes $254.6 million of land under development at December 31, 2012. |
| (4) | Includes $220.5 million of construction in progress at December 31, 2012. |
| (5) | Does not include tax-exempt certificates and fair market value of debt adjustments aggregating $15.7 million and $11.5 million, respectively. |
F-68
Table of Contents
The changes in Total Real Estate Assets, excluding real estate held for sale, for the three years ended December 31, 2012 are as follows:
| 2012 | 2011 | 2010 | ||||||||||
|
Balance, beginning of year |
$ | 8,266,839 | $ | 8,411,239 | $ | 8,812,484 | ||||||
|
Acquisitions and transfers from joint ventures |
594,633 | 260,161 | — | |||||||||
|
Developments, improvements and expansions |
105,132 | 104,245 | 174,315 | |||||||||
|
Changes in land under development and construction in progress |
3,188 | (15,153 | ) | (2,409 | ) | |||||||
|
Real estate held for sale |
— | (3,267 | ) | — | ||||||||
|
Adjustment of property carrying values |
(135,813 | ) | (125,844 | ) | (171,900 | ) | ||||||
|
Sales, transfers to joint ventures and retirements |
(194,868 | ) | (364,542 | ) | (401,251 | ) | ||||||
|
|
|
|
|
|
|
|||||||
|
Balance, end of year |
$ | 8,639,111 | $ | 8,266,839 | $ | 8,411,239 | ||||||
|
|
|
|
|
|
|
|||||||
The changes in Accumulated Depreciation and Amortization, excluding real estate held for sale, for the three years ended December 31, 2012 are as follows:
| 2012 | 2011 | 2010 | ||||||||||
|
Balance, beginning of year |
$ | 1,550,066 | $ | 1,452,112 | $ | 1,332,534 | ||||||
|
Depreciation for year |
233,619 | 230,332 | 227,304 | |||||||||
|
Real estate held for sale |
— | (977 | ) | — | ||||||||
|
Sales and retirements |
(112,968 | ) | (131,401 | ) | (107,726 | ) | ||||||
|
|
|
|
|
|
|
|||||||
|
Balance, end of year |
$ | 1,670,717 | $ | 1,550,066 | $ | 1,452,112 | ||||||
|
|
|
|
|
|
|
|||||||
F-69
Table of Contents
Schedule IV—Mortgage Loans on Real Estate
December 31, 2012
(Dollar amounts in thousands)
|
Description |
Interest Rate |
Final
|
Periodic Payment Terms |
Prior
Liens (1) |
Face Amount of
Mortgages |
Carrying Amount of
Mortgages (2) |
Principal
Amount of Loans subject to delinquent principal or interest |
|||||||||||||||
|
SENIOR LOANS |
||||||||||||||||||||||
|
Retail |
||||||||||||||||||||||
|
Borrower A |
5.73% | Sep-17 | Interest and principal | $ | — | $ | 33,000 | $ | 28,509 | $ | — | |||||||||||
|
MEZZANINE LOANS |
||||||||||||||||||||||
|
Multi-family |
||||||||||||||||||||||
|
Borrower B |
LIBOR+6.0%, Floor 11% | Feb-17 | Interest monthly, principal at maturity | 26,000 | 5,868 | 5,923 | — | |||||||||||||||
|
Retail |
||||||||||||||||||||||
|
Borrower C |
11.00% | Jun-13 | Interest monthly, principal at maturity | 51,750 | 12,800 | 11,342 | — | |||||||||||||||
|
Borrower D |
10.00% | Nov-22 | Interest monthly, principal at maturity | 59,000 | 9,000 | 9,078 | — | |||||||||||||||
|
Mixed Use |
||||||||||||||||||||||
|
Borrower E |
LIBOR+10.0%, Floor 14% | on demand (loan in default) | Interest monthly, principal at maturity | 2,500 | 11,490 | 5,526 | 9,343 | |||||||||||||||
|
Borrower F |
LIBOR+8.0%, Floor 12% | on demand (loan in default) | Interest monthly, principal at maturity | 13,990 | 10,806 | — | 10,806 | |||||||||||||||
|
|
|
|
|
|
|
|
|
|||||||||||||||
| 153,240 | 82,964 | 60,378 | 20,149 | |||||||||||||||||||
|
INVESTMENTS IN AND ADVANCES TO JOINT VENTURES |
||||||||||||||||||||||
|
Borrower G |
LIBOR+7.0%, Floor 12% | on demand (loan in default) | Interest monthly, principal at maturity | __ | 66,846 | — | 66,846 | |||||||||||||||
|
Borrower H |
10.00% | Oct-17 | Interest monthly, principal at maturity | 137,869 | 31,700 | 31,973 | — | |||||||||||||||
|
Borrower I |
10.00% | Jun-19 | Interest quarterly (partial payment), principal and unpaid interest at maturity | 952,145 | 150,756 | 154,556 | — | |||||||||||||||
|
|
|
|
|
|
|
|
|
|||||||||||||||
| $ | 1,243,254 | $ | 332,266 | $ | 246,907 | $ | 86,995 | |||||||||||||||
|
|
|
|
|
|
|
|
|
|||||||||||||||
F-70
Table of Contents
| (1) | The first mortgage loans on some properties are not held by the Company. Accordingly, the amounts of the prior liens for those properties at December 31, 2012 are estimated. |
| (2) | Carrying amount includes all applicable accrued interest and accretion of discount to date, net of amounts reserved for impairment. |
|
Year Ended
December 31, 2012 |
Year Ended
December 31, 2011 |
Year Ended
December 31, 2010 |
||||||||||
|
Balance at beginning of period |
$ | 84,541 | $ | 103,705 | $ | 58,719 | ||||||
|
Additions during period: |
||||||||||||
|
New mortgage loans |
160,995 | 10,000 | 60,618 | |||||||||
|
Interest |
4,949 | 811 | 3,106 | |||||||||
|
Accretion of discount |
826 | 780 | 250 | |||||||||
|
Deductions during period: |
||||||||||||
|
Provision for loan loss reserve |
(4,300 | ) | (5,000 | ) | — | |||||||
|
Collections of principal |
(104 | ) | (25,755 | ) | — | |||||||
|
Foreclosures |
— | — | (18,988 | ) | ||||||||
|
|
|
|
|
|
|
|||||||
|
Balance at close of period |
$ | 246,907 | $ | 84,541 | $ | 103,705 | ||||||
|
|
|
|
|
|
|
|||||||
F-71
Table of Contents
SIGNATURES
Pursuant to the requirements of Section 13 or 15(d) of the Securities Exchange Act of 1934, the Registrant has duly caused this report to be signed on its behalf by the undersigned, thereunto duly authorized.
| DDR Corp. | ||
| By: | /s/ D ANIEL B. H URWITZ | |
| Daniel B. Hurwitz, Chief Executive Officer | ||
Date: March 1, 2013
Pursuant to the requirements of the Securities Exchange Act of 1934, this report has been signed by the following persons on behalf of the Registrant and in the capacities indicated on the 1 st day of March 2013.
|
/s/ D ANIEL B. H URWITZ |
Chief Executive Officer |
|
| Daniel B. Hurwitz | ||
|
/s/ D AVID J. O AKES |
President & Chief Financial Officer (Principal Financial Officer) |
|
| David J. Oakes | ||
|
/s/ C HRISTA A. V ESY |
Executive Vice President and Chief Accounting Officer (Principal Accounting Officer) |
|
| Christa A. Vesy | ||
|
/s/ T ERRANCE R. A HERN |
Director |
|
| Terrance R. Ahern | ||
|
/s/ J AMES C. B OLAND |
Director |
|
| James C. Boland | ||
|
/s/ T HOMAS F INNE |
Director |
|
| Thomas Finne | ||
|
/s/ R OBERT H. G IDEL |
Director |
|
| Robert H. Gidel | ||
|
/s/ V OLKER K RAFT |
Director |
|
| Volker Kraft | ||
|
/s/ R EBECCA L. M ACCARDINI |
Director |
|
| Rebecca L. Maccardini | ||
|
/s/ V ICTOR B. M ACFARLANE |
Director |
|
| Victor B. MacFarlane | ||
|
/s/ C RAIG M ACNAB |
Director |
|
| Craig Macnab | ||
|
/s/ S COTT D. R OULSTON |
Director |
|
| Scott D. Roulston | ||
|
/s/ B ARRY A. S HOLEM |
Director |
|
| Barry A. Sholem | ||
F-72