SITEONE LANDSCAPE SUPPLY, INC.
10-Ks and 10-Qs
|
|
|
|
|
|
|
|
|
|
|
|
|
|
|
|
|
|
|
|
|
|
|
|
|
|
|
|
|
|
|
|
|
|
|
|
|
|
|
|
|
|
|
|
|
|
|
|
|
|
|
|
|
|
|
|
|
|
|
|
|
|
|
|
|
|
|
|
|
|
|
|
|
|
|
|
|
|
|
|
|
|
|
|
|
|
|
|
|
|
|
|
|
|
|
|
|
|
|
|
|
|
|
|
|
|
|
|
|
|
|
|
|
|
|
|
|
|
|
|
|
|
|
|
|
|
|
|
|
|
|
|
|
|
|
|
|
|
|
|
|
|
|
|
|
|
|
|
|
|
|
UNITED STATES
SECURITIES AND EXCHANGE COMMISSION
WASHINGTON, D.C. 20549
__________________________
FORM 10-K
__________________________
|
x
|
ANNUAL REPORT PURSUANT TO SECTION 13 OR 15(d) OF THE SECURITIES EXCHANGE ACT OF 1934
|
For the fiscal year ended
January 1, 2017
or
|
☐
|
TRANSITION REPORT PURSUANT TO SECTION 13 OR 15(d) OF THE SECURITIES EXCHANGE ACT OF 1934
|
For the Transition Period From __________ to
___________
Commission file number:
001-37793
SiteOne Landscape Supply, Inc.
(Exact name of registrant as specified in its charter)
__________________________
|
Delaware
|
46-4056061
|
|
(State or other jurisdiction of
incorporation or organization)
|
(IRS Employer
Identification No.)
|
|
|
|
|
Mansell Overlook, 300 Colonial Center Parkway, Suite 600, Roswell, Georgia 30076
|
|
|
(Address of principal executive offices) (Zip Code)
|
|
(470) 277-7000
(Registrant’s telephone number, including area code)
Securities registered pursuant to Section 12 (b) of the Act:
|
Common stock, par value $0.01 per share
|
New York Stock Exchange
|
|
|
(Title of Each Class)
|
(Name of Each Exchange on which Registered)
|
|
Securities registered pursuant to Section 12 (g) of the Act:
|
None
|
|
(Title of class)
|
Indicate by check mark if the registrant is a well-known seasoned issuer, as defined in Rule 405 of the Securities Act. Yes ☐ No ☒
Indicate by check mark if the registrant is not required to file reports pursuant to Section 13 or Section 15(d) of the Act. Yes ☐ No ☒
Indicate by check mark whether the registrant (1) has filed all reports required to be filed by Section 13 or 15(d) of the Securities Exchange Act of 1934 during the preceding 12 months (or for such shorter period that the registrant was required to file such reports), and (2) has been subject to such filing requirements for the past 90 days. Yes ☒ No ☐
Indicate by check mark whether the registrant has submitted electronically and posted on its corporate Web site, if any, every Interactive Data File required to be submitted and posted pursuant to Rule 405 of Regulation S-T during the preceding 12 months (or for such shorter period that the registrant was required to submit and post such files). Yes ☒ No ☐
Indicate by check mark if disclosure of delinquent filers pursuant to Item 405 of Regulation S-K is not contained herein, and will not be contained, to the best of the registrant’s knowledge, in definitive proxy or information statements incorporated by reference in Part III of this Form 10-K or any amendment to this Form 10-K.☒
Indicate by check mark whether the registrant is a large accelerated filer, an accelerated filer, a non-accelerated filer, or a smaller reporting company. See the definitions of “large accelerated filer,” “accelerated filer” and “smaller reporting company” in Rule 12b-2 of the Exchange Act (Check One):
|
Large accelerated filer
|
☐
|
Accelerated filer
|
☐
|
|
Non-accelerated filer
|
☒ (Do not check if a smaller reporting company)
|
Smaller reporting company
|
☐
|
Indicate by check mark whether the registrant is a shell company (as defined in Rule 12b-2 of the Exchange Act). Yes ☐ No ☒
As of
July 3, 2016
, there were
39,542,239
shares of common stock of SiteOne Landscape Supply, Inc. outstanding, and the aggregate market value of the voting and non-voting common equity of SiteOne Landscape Supply, Inc. held by non-affiliates (assuming only for purposes of this computation that the CD&R Investor and Deere (each as defined below), directors and officers may be affiliates) was approximately
$411,966,679
based on the closing price of SiteOne Landscape Supply, Inc.’s common stock on the NYSE on July 1, 2016 (the last trading day of our most recently completed fiscal second quarter).
As of
March 10, 2017
, the number of shares of the registrant’s common stock outstanding were
39,585,917
, par value
$0.01
per share.
DOCUMENTS INCORPORATED BY REFERENCE
Portions of the registrant’s proxy statement to be filed with the U.S. Securities and Exchange Commission in connection with the registrant’s 2017 Annual Meeting of Stockholders (the “Proxy Statement”) are incorporated by reference into Part III hereof. Such Proxy Statement will be filed within 120 days of the registrant’s fiscal year ended January 1, 2017.

|
TABLE OF CONTENTS
|
||
|
Page number
|
||
1
Regarding Forward-Looking Statements and Information
This Annual Report on Form 10-K contains forward-looking statements and cautionary statements within the meaning of the Private Securities Litigation Reform Act of 1995. Some of the forward-looking statements can be identified by the use of terms such as “may,” “intend,” “might,” “will,” “should,” “could,” “would,” “expect,” “believe,” “estimate,” “anticipate,” “predict,” “project,” “potential,” or the negative of these terms, and similar expressions. You should be aware that these forward-looking statements are subject to risks and uncertainties that are beyond our control. Further, any forward-looking statement speaks only as of the date on which it is made, and we undertake no obligation to update any forward-looking statement to reflect events or circumstances after the date on which it is made or to reflect the occurrence of anticipated or unanticipated events or circumstances. New factors emerge from time to time that may cause our business not to develop as we expect, and it is not possible for us to predict all of them. Factors that may cause actual results to differ materially from those expressed or implied by the forward-looking statements include, but are not limited to, the following:
|
•
|
cyclicality in residential and commercial construction markets;
|
|
•
|
general economic and financial conditions;
|
|
•
|
weather conditions, seasonality and availability of water to end-users;
|
|
•
|
laws and government regulations applicable to our business that could negatively impact demand for our products;
|
|
•
|
public perceptions that our products and services are not environmentally friendly;
|
|
•
|
competitive industry pressures;
|
|
•
|
product shortages and the loss of key suppliers;
|
|
•
|
product price fluctuations;
|
|
•
|
inventory management risks;
|
|
•
|
ability to implement our business strategies and achieve our growth objectives;
|
|
•
|
acquisition and integration risks;
|
|
•
|
increased operating costs;
|
|
•
|
risks associated with our large labor force;
|
|
•
|
adverse credit and financial markets events and conditions;
|
|
•
|
credit sale risks;
|
|
•
|
retention of key personnel;
|
|
•
|
performance of individual branches;
|
|
•
|
environmental, health and safety laws and regulations;
|
|
•
|
hazardous materials and related materials;
|
|
•
|
construction defect and product liability claims;
|
|
•
|
computer data processing systems;
|
|
•
|
security of personal information about our customers;
|
|
•
|
intellectual property and other proprietary rights;
|
|
•
|
requirements of being a public company;
|
|
•
|
risks related to our internal controls;
|
|
•
|
the possibility of securities litigation;
|
|
•
|
our substantial indebtedness and our ability to obtain financing in the future;
|
|
•
|
increases in interest rates; and
|
|
•
|
risks related to other factors discussed under “Risk Factors” and elsewhere in this Annual Report.
|
You should read this report completely and with the understanding that actual future results may be materially different from expectations. All forward-looking statements made in this report are qualified by these cautionary statements. These forward-looking statements are made only as of the date of this report, and we do not undertake any obligation, other than as may be required by law, to update or revise any forward-looking or cautionary statements to reflect changes in assumptions, the occurrence of events, unanticipated or otherwise, changes in future operating results over time or otherwise.
Comparisons of results for current and any prior periods are not intended to express any future trends, or indications of future performance, unless expressed as such, and should only be viewed as historical data.
2
As used in this Annual Report on Form 10-K for the fiscal year ended January 1, 2017, references to: “we,” “us,” “our,” “SiteOne,” or the “Company” refer to SiteOne Landscape Supply, Inc. and its consolidated subsidiaries. The term “Holdings” refers to SiteOne Landscape Supply, Inc. individually without its subsidiaries. References to the “2016 Fiscal Year,” “the “2015 Fiscal Year” and the “2014 Fiscal Year” refer to the fiscal year ended January 1, 2017, the fiscal year ended January 3, 2016 and the fiscal year ended December 28, 2014, respectively.
The following discussion of our business contains “forward-looking statements,” as discussed in “Regarding Forward-Looking Statements and Information” above. Our business, operations and financial condition are subject to various risks as set forth in Part I, Item 1A, ‘‘Risk Factors’’ below. The following information should be read in conjunction with the Risk Factors,
Management’s Discussion and Analysis of Financial Condition and Results of Operations and the Financial Statements and Supplementary Data and related notes included elsewhere in this Annual Report on Form 10-K.
Company Overview
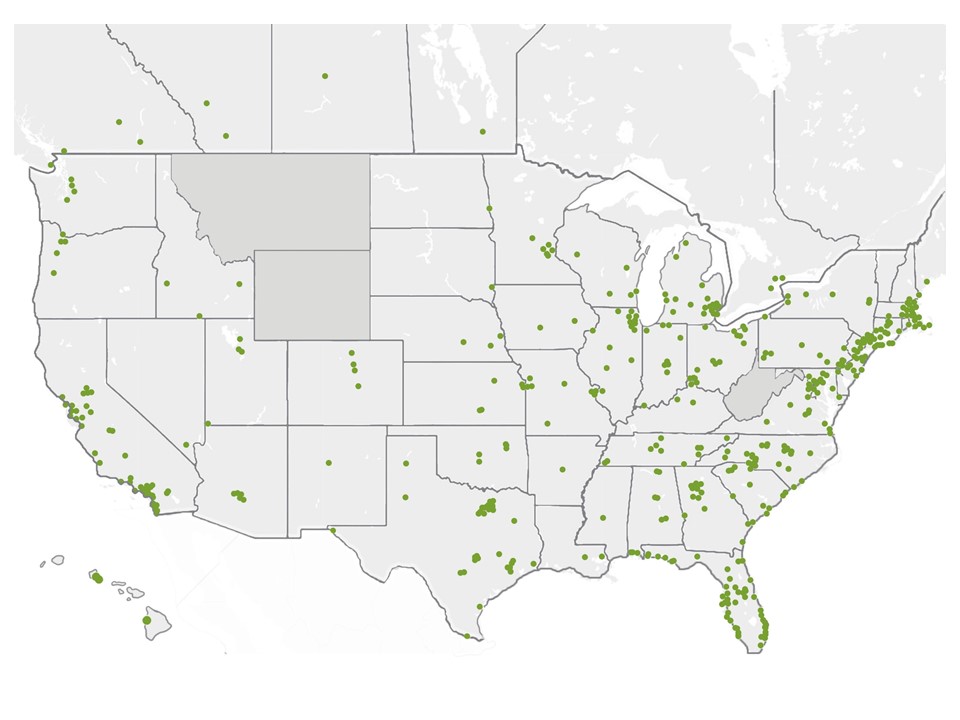
We are the largest and only national wholesale distributor of landscape supplies in the United States and have a growing presence in Canada. Our customers are primarily residential and commercial landscape professionals who specialize in the design, installation and maintenance of lawns, gardens, golf courses and other outdoor spaces. As of March 10, 2017, we had 469 branch locations in 45 states and five provinces. Through our expansive North American network, we offer a comprehensive selection of more than 100,000 SKUs including irrigation supplies, fertilizer and control products (
e.g.
, herbicides), landscape accessories, nursery goods, hardscapes (including pavers, natural stones and blocks), outdoor lighting and ice melt products. We also provide value-added consultative services to complement our product offering and to help our customers operate and grow their businesses. Based on our 2016 Fiscal Year net sales, we estimate that we are more than four times the size of our largest competitor and larger than the next two through ten competitors combined. We believe, based on management’s estimates, that we have either the number one or number two local market position in nearly 80% of MSAs where we have one or more branches. Our market leadership, coast-to-coast presence, broad product selection and extensive technical expertise provide us with significant competitive advantages and create a compelling value proposition for both our customers and suppliers.
Our customers choose us for a number of reasons, including the breadth and availability of the products we offer, our high level of expertise, the quality of our customer service, the convenience of our branch locations and the consistency of our timely delivery. Our ability to provide a “one-stop shop” experience for our customers is aligned with the growing trend of landscape contractors providing an increasingly broad array of products and services. Because extensive technical knowledge and experience are required to successfully design, install and maintain outdoor spaces, we believe our customers find great value in the advice and recommendations provided by our knowledgeable sales and service associates, many of whom are former landscape contractors or golf course superintendents. Our consultative services include assistance with irrigation network design, commercial project planning, generation of sales leads, marketing services and product support, as well as a series of technical and business management seminars that we call SiteOne University. These value-added services foster an ongoing relationship with our customers that is a key element of our business strategy.
We have a diverse base of more than 180,000 customers, and our top 10 customers accounted for approximately 4% of our 2016 Fiscal Year net sales, with no single customer accounting for more than 2% of net sales. Our typical customer is a private landscape contractor that operates in a single market. We interact regularly with our customers because of the recurring nature of landscape services and because most contractors buy products on an as-needed basis. We believe our high-touch customer service model strengthens relationships, builds loyalty and drives repeat business. In addition, our broad product portfolio, convenient branch locations and nationwide fleet of over 1,400 delivery vehicles position us well to meet the needs of our customers and ensure timely delivery of products.
Our strong supplier relationships support our ability to provide a broad selection of products at attractive prices. We believe we are the largest customer for many of our key suppliers, who benefit from the size and scale of our distribution network. We source our products from more than 2,500 suppliers, including the major irrigation equipment manufacturers, turf and ornamental fertilizer/chemical companies and a variety of suppliers who specialize in nursery goods, outdoor lighting, hardscapes and other landscape products. Some of our largest suppliers include Hunter, Rain Bird, Toro, Oldcastle, Bayer, Syngenta, BASF, Dow AgroSciences, Vista and NDS. We also develop and sell products under our proprietary and market-leading brands LESCO and Green Tech, which together accounted for approximately 19% of our 2016 Fiscal Year net sales. We believe these highly recognized brands attract customers to our branches and create incremental sales opportunities for other products.
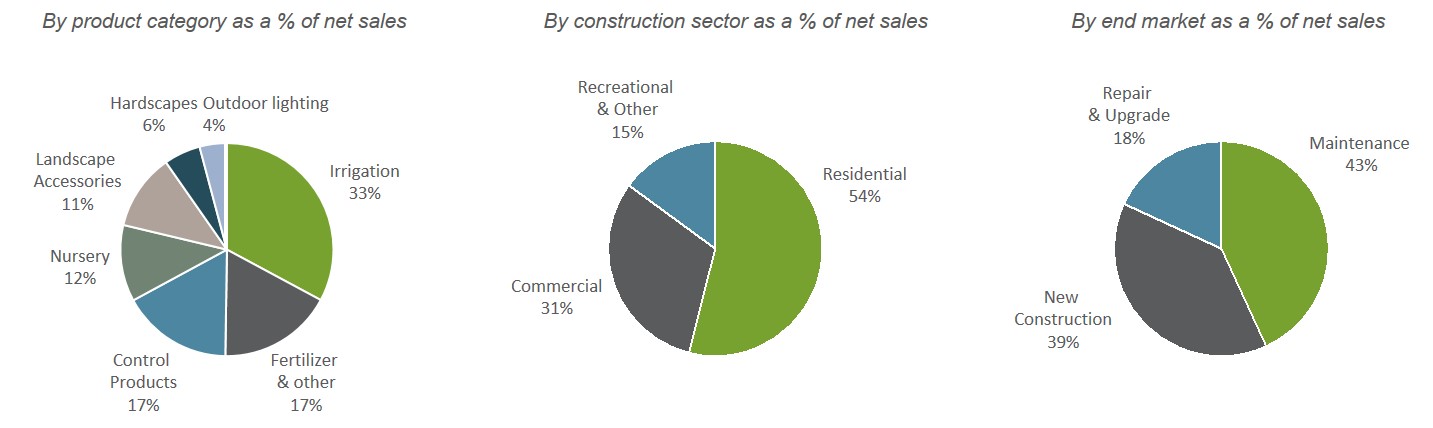
We have a balanced mix of sales across product categories, construction sectors and end markets. We derived approximately 54% of our 2016 Fiscal Year net sales from the residential construction sector, 31% from the commercial (including institutional)
3
construction sector and 15% from the recreational and other construction sector. By end market, we derived approximately 43% of our 2016 Fiscal Year net sales from maintenance of residential, commercial and recreational properties. The recurring nature of landscape maintenance demand helps to provide stability in our financial performance across economic cycles. Fertilizer and control products are the primary products used in maintenance. The sale of products relating to new construction of homes, commercial buildings and recreational spaces accounted for approximately 39% of our 2016 Fiscal Year net sales. These products primarily include irrigation, nursery, hardscapes, outdoor lighting and landscape accessories. We expect sales in the new construction end market to continue to grow as a result of the ongoing recovery in the demand for new single-family homes, multi-family housing units and non-residential buildings. Approximately 18% of our 2016 Fiscal Year net sales were derived from sales of products for the repair and upgrade of existing landscapes. These sales benefit from increasing existing home sales, increasing home prices and rising consumer spending.
Net Sales for 2016 Fiscal Year
As of March 10, 2017, we have completed the acquisition of 16 companies since the CD&R Acquisition (as defined below) in December 2013, and we intend to pursue additional acquisitions to complement our organic growth and achieve our strategic objectives. Our organic and acquisition-driven growth strategies have led to significant increases in net sales and Adjusted EBITDA. For our 2016 Fiscal Year, we generated net sales of $1,648.2 million, net income of $30.6 million and Adjusted EBITDA of $134.3 million, compared to net sales of $1,451.6 million, net income of $28.9 million and Adjusted EBITDA of $106.5 million for our 2015 Fiscal Year. See Item 7, “Management’s Discussion and Analysis of Financial Condition and Results of Operations-Results of Operations-Quarterly Results of Operations Data”
for a reconciliation of our Adjusted EBITDA to net income (loss).
Our Executive Leadership
Doug Black joined us as our Chief Executive Officer in April 2014. Mr. Black is the former President and COO of Oldcastle, the North American arm of CRH plc, where he helped grow net sales by over ten times and oversaw more than 100 acquisitions, including Oldcastle’s expansion into building products distribution. Mr. Black has joined a strong operational team with top-tier associates who have positively contributed to our performance. Mr. Black has also strengthened the capabilities of our executive leadership team by bringing in highly qualified senior managers with functional expertise in strategy development, mergers and acquisitions, talent management, marketing, category management, supply chain management, national sales and information technology. These individuals have prior experience at a number of well-known companies within the building products and industrial distribution sectors, including Oldcastle, HD Supply, Grainger, MSC Industrial Direct, Wesco, Newell Rubbermaid and The Home Depot.
Under Mr. Black’s leadership, we have established a focused business strategy to develop and attract industry-leading talent, deliver more value to customers, generate superior financial performance, drive organic growth, execute on attractive acquisitions and increase working capital efficiency. We are also undertaking a variety of initiatives targeting pricing, category management, sales force performance and supply chain management. At the local level, we have increased our focus on gaining market share by adding capabilities to our 50 geographic areas and 469 branches and by empowering area managers and their teams to develop local strategies. These initiatives are in the early stages of implementation, and we believe they will continue to enhance our growth and profitability.
Our Industry
Based on management’s estimates, we believe that our addressable market in North America for the wholesale distribution of landscape supplies represented approximately $17 billion in revenue in 2016. Growth in our industry is driven by a broad array of factors, including consumer spending, housing starts, existing home sales, home prices, commercial construction, repair and remodeling spending, and demographic trends. Within the wholesale landscape supply distribution industry, products sold for residential applications represent the largest construction sector, followed by the commercial and recreational & other sectors. Based on management estimates, we believe
4
that nursery products represent the largest product category in the industry, with sales accounting for more than one-third of industry sales, followed by landscape accessories with approximately one-fifth of industry sales and each of control products, hardscapes, irrigation products and outdoor lighting, and fertilizer & other accounting for approximately one-tenth of industry sales.
The wholesale landscape supply distribution industry is highly fragmented, consisting primarily of regional private businesses that typically have a small geographic footprint, a limited product offering and limited supplier relationships. Wholesale landscape supply distributors primarily sell to landscape service firms, ranging from sole proprietorships to national enterprises. Landscape service firms include general landscape contractors and specialty landscape firms, such as lawn care, tree and foliage maintenance firms. Over the past decade, professional landscape contractors have increasingly offered additional products and services to meet their customers’ needs. These firms historically needed to make numerous trips to branches in various locations to source their products. Consequently, landscape professionals have come to value distribution partners who offer a “one-stop shop” with a larger variety of products and services, particularly given the recurring nature of landscape maintenance services.
According to an August 2015 Freedonia Group report, the U.S. wholesale landscape supply distribution industry was expected to grow at a CAGR meaningfully higher than that of the overall economy through 2019. Hardscape and outdoor lighting products were expected to grow the fastest of our major landscape product categories through 2019 at an estimated CAGR of 7.3% and 8.1%, respectively.
Residential Construction Sector Growth Trends
The purchase of a home, whether new or existing, is a common reason for upgrading or modifying lawns, gardens and other outdoor spaces. Industry surveys indicate that the majority of homeowners prefer to hire landscape professionals for help with their outdoor projects.
Growth in the market for landscape products is primarily driven by new residential construction. Housing starts are expected to grow 6% in 2017 to 1.2 million and 8% in 2018 to 1.3 million, according to the National Association of Home Builders. The chart below sets forth the total number of U.S. housing starts from 2000 through 2015, NAHB’s projected numbers for 2016 through 2018 and the long-term median (1959-2015).
Historical and projected U.S. total housing starts (in thousands)
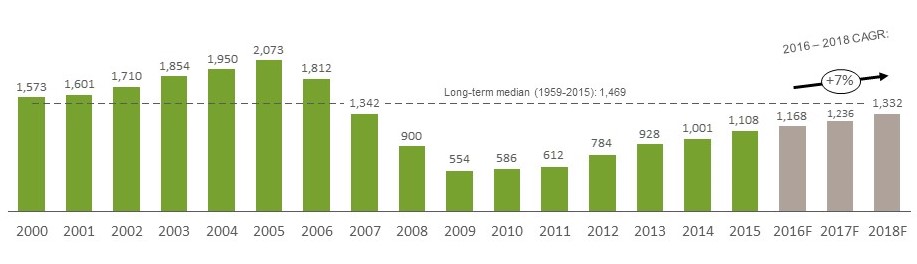
Source: U.S. Census Bureau, National Association of Homebuilders (Housing and Interest Rate Forecast).
Rising interest in more complex, decorative and functional landscaping spurred by the recent popularity of home and garden television shows and magazines has further boosted demand for professional landscape services. The increasingly popular concept of “outdoor living,” which involves relaxation, entertainment and spending more time with family and friends outdoors, continues to drive higher demand for landscape solutions that provide more functional living space and increase the value of the home. Freedonia projects that demand for outdoor lighting will increase as homeowners continue to enhance property values with architectural features, monuments and plants that warrant illumination during non-daylight hours. In addition, an increasing shift from AC to low voltage DC power sources and advances in LED technology simplify installation and facilitate more reliable and attractive outdoor lighting systems.
As residents face lawn watering restrictions resulting from recent drought conditions in the Western and Southern regions of the United States, demand for eco-friendly landscape products that promote water conservation has also grown meaningfully. This includes the use of hardscapes as lawn substitutes as well as smart water systems for increased water efficiency.
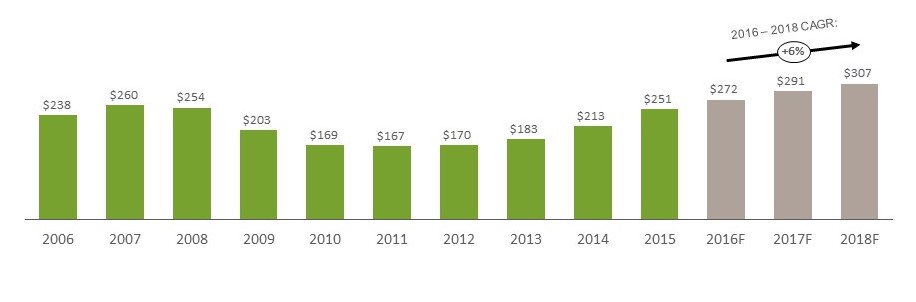
Another growth driver in our industry includes residential repair and remodel spending, which has historically been less cyclical than spending on new residential construction. According to the Harvard Joint Center for Housing Studies as of January 2016, the U.S.
5
home improvement products market reached a peak of $277 billion in 2006 before declining by approximately 20% to $222 billion in 2009. The industry has since rebounded to an estimated $297 billion in 2016.
Driven by the rebound in existing home sales, rising home prices, the ongoing rehabilitation of previously foreclosed properties, the availability of consumer capital at low interest rates, the increasing age of U.S. housing stock and demand for energy-efficient projects, industry analysts expect significant long-term growth in residential repair and remodel expenditures. The Harvard Joint Center for Housing Studies forecasts that the home improvement products market will grow at a CAGR of 7% from 2015 to 2017.
U.S. spending on home improvement products ($ in billions)
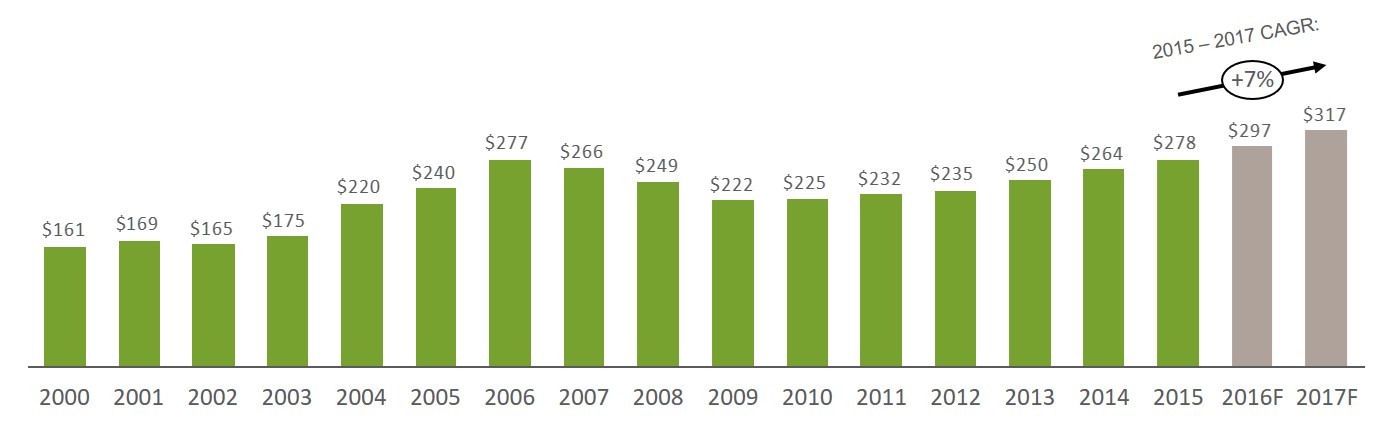
Source: Harvard JCHS
Commercial and Recreational Construction Sector Growth Trends
Demand for landscape products in the commercial and recreational construction sector is driven by factors such as new building construction and companies renovating the exteriors of their facilities to attract new customers and tenants. Additionally, eco-friendly landscape products are frequently specified by design professionals for use in commercial, institutional and municipal landscape irrigation applications. Technology solutions include fully integrated rainwater harvesting/reuse systems, organic fertilizers, remote water management systems, energy efficient pump systems and solar-powered irrigation controller assemblies.
The non-residential construction market has rebounded strongly following the 2008-2009 recession with steady growth through 2016. According to Dodge Data & Analytics, U.S. non-residential construction spending is forecasted to grow 7% in 2017 and 6% in 2018. The chart below sets forth the total dollars spent on U.S. non-residential construction from 2006 to 2018.
U.S. non-residential construction spending ($ in billions)
Source: Source: U.S. Census Bureau, Dodge Data & Analytics
6
Our Competitive Strengths
We believe we benefit from the following competitive strengths:
Clear Market Leader in an Attractive Industry
We are the largest wholesale distributor of landscape supplies in the United States. Based on our 2016 Fiscal Year net sales, we estimate that we are more than four times the size of our largest competitor and larger than the next two through ten competitors combined.
We believe, based on management’s estimates, that we have either the number one or number two local market position in nearly 80% of MSAs where we have at least one branch. Our industry is highly fragmented, comprised of thousands of small, private or family-run businesses that compete with us primarily on a local market basis. We are the only national distributor in the landscape supply industry, with an estimated market share of approximately 10% based on third quarter of 2016 Fiscal Year net sales. As a result, we believe we have significant opportunities to increase our market share. Our national scale, broad product and service offering and market leadership also enable us to play an important role in the landscape supplies value chain by connecting a large and diverse set of manufacturers with a highly fragmented customer base.
Broadest Product Offering
We believe we offer the industry’s most comprehensive portfolio of landscape products with over 100,000 SKUs from more than 2,500 suppliers. This broad product offering creates a “one-stop shop” for our customers and positively distinguishes us from our competitors. We maintain a high standard of product availability and timely delivery, which generally allows our customers to avoid investing significant capital to maintain their own inventory. In addition, our branches order specialty products directly from suppliers on behalf of our customers, who thereby benefit from our national purchasing scale, and we are able to supply custom services and products, such as fertilizers and soil blends, to meet specific job requirements. We also provide several proprietary products, including our LESCO and Green Tech brands, as well as promotional items offered through arrangements with selected manufacturers.
Superior Customer Value
We offer a variety of complementary, value-added services to support the sale of our products. At the local branch level, we have teams of experienced sales and service associates, many of whom are former landscape contractors or golf course superintendents. Our local staff provides customers with consultative services such as product selection and support, assistance with the design and implementation of landscape projects, and potential sales leads for new business opportunities. Our sales and service associates also coordinate the delivery of customer orders and help us to maintain our high delivery standards and fill rates. In addition, through our SiteOne University, we provide customers with technical training, licensing and business management seminars. We also offer a loyalty program, which we refer to as our Partners Program, under which customers can earn points redeemable for gift cards, account credits and other attractive commercial benefits. Our Partners Program, which had more than 12,000 enrolled customers as of January 1, 2017, also offers customers the opportunity to leverage our national buying power to purchase services for their businesses and employees. We believe the services we provide are an important differentiator that enhances the strength and longevity of our customer relationships.
Strong and Scalable Platform for Driving Growth
Our national scale and geographic footprint make us an attractive partner for our customers and suppliers. Over the past two and a half years, we have invested in management, corporate infrastructure and information systems for operating a company significantly larger than our current scale. Our local area and branch managers benefit from the substantial business and industry knowledge of our executive and senior operational management teams to help grow our business in their markets. We believe our platform can be leveraged to expand our customer base and grow our business with existing products and services, as well as to support the launch of new product offerings in our existing markets. We expect our greatest opportunities to expand will be in markets in which we currently operate but do not yet have a leading market position in one or more of our product categories.
Proven Ability to Identify, Execute and Integrate Acquisitions
We are a leading player in the consolidation of the fragmented industry for wholesale distribution of landscape supplies. Our current management team has extensive experience in identifying, executing and integrating acquisitions. Our industry leadership position, geographic footprint, ability to integrate acquisitions and access to financial resources make us the buyer of choice for many of our potential targets and give us an advantage over competing potential acquirers. As a result, we are able to achieve attractive multiples in primarily negotiated transactions. As of March 10, 2017, we have completed the acquisition of 16 companies since the CD&R Acquisition (as defined below) in December 2013, which we have integrated or are in the process of integrating into our business. A key element of our integration strategy is to achieve synergies at acquired companies from procurement, overhead cost reduction, sales initiatives and sharing of best practices across our organization. Our recent acquisitions have moved us into the leading position in several additional
7
local markets or product categories. We expect the execution of synergistic acquisitions to continue to be an integral part of our growth strategy, and we intend to continue expanding our product line, geographic reach, market share and operational capabilities through future acquisitions.
Balanced Mix of Maintenance, New Construction and Repair and Upgrade Business
We have strategically invested in our product portfolio to position us to benefit from the ongoing recovery in the residential and commercial construction markets and to continue to benefit from stable growth of our maintenance products. We believe the new construction and repair and upgrade end markets provide us substantial upside in an economic upturn, and we are well-positioned to grow our business as a result of the continuing recovery in the housing sector and in construction spending for commercial buildings and facilities. In addition, our distribution of maintenance products provides a steady stream of more recurring sales, which we expect will further support our business through economic cycles. We believe our balanced sales mix in support of the maintenance, new construction and repair and upgrade end markets positions us to achieve consistent growth through our branch networks nationally.
Experienced and Proven Management Team Driving Organic and Acquisition Growth
We believe our management team, including regional vice presidents, area managers, area business managers and branch managers, is among the most experienced in the industry. Members of our executive leadership team have a strong track record of improving performance and successfully driving both internal and acquisitive growth during their tenure with SiteOne and prior to joining our company. Our team not only has a clearly defined operational strategy to promote growth and profitability for SiteOne but also an ambitious vision to be a world-class leader in the industry. We believe the scale of our business and our leading market position will allow us to continue to attract and develop industry-leading talent.
Our Strategies
We intend to leverage our competitive strengths to increase shareholder value through the following core strategies:
Build Upon Strong Customer and Supplier Relationships to Expand Organically
Our national footprint and broad supplier relationships, combined with our regular interaction with a large and diverse customer base, make us an important link in the supply chain for landscape products. Our suppliers benefit from access to our more than 180,000 customers, a single point of contact for improved production planning and efficiency, and our ability to bring new product launches quickly to market on a national scale. We intend to continue to increase our size and scale in customer, geographic and product reach, which we believe will continue to benefit our supplier base. Our customers in turn benefit from our local market leadership, talented associates, broad product offering and high inventory availability, timely delivery and complementary value-added services. We will continue to work with new and existing suppliers to maintain the most comprehensive product offering for our customers at competitive prices and enhance our role as a critical player in the supply chain. As we continue to grow, we believe our strong customer and supplier relationships will enable us to expand our market share in the landscape supplies industry.
Grow at the Local Level
The vast majority of our customers operate at a local level. We believe we can grow market share in our existing markets with limited capital investment by systematically executing local strategies to expand our customer base, increase the amount of our customers’ total spending with us, optimize our network of locations, coordinate multi-site deliveries, partner with strategic local suppliers, introduce new products and services, increase our share of underrepresented products in particular markets and improve sales force performance. We currently offer our full product line in only 24% of the U.S. MSAs where we have a branch, and therefore believe we have the capacity to offer significantly more product lines and services in our geographic markets.
Pursue Value-Enhancing Strategic Acquisitions
Through recently completed acquisitions, we have added new markets in the United States and Canada, new product lines, talented associates and operational best practices. In addition, we increased our sales by introducing products from our existing portfolio to customers of newly acquired companies. We intend to continue pursuing strategic acquisitions to grow our market share and enhance our local market leadership positions by taking advantage of our scale, operational experience and acquisition know-how to pursue and integrate attractive targets. We believe we have significant opportunities to add product categories in our existing markets through acquisitions. In addition, we currently have branches in 177 of the 381 U.S. MSAs and are focused on identifying and reviewing attractive new geographic markets for expansion through acquisitions. We will continue to apply a selective and disciplined acquisition strategy to maximize synergies obtained from enhanced sales and lower procurement and corporate costs.
8
Execute on Identified Operational Initiatives
We have undertaken significant operational initiatives, utilizing our scale to improve our profitability, enhance supply chain efficiency, strengthen our pricing and category management capabilities, streamline and refine our marketing process and invest in more sophisticated information technology systems and data analytics. In addition, we work closely with our local area team leaders to improve sales, delivery and branch productivity. Although we are still in the early stages of these initiatives, they have already contributed to improvement in our profitability, and we believe we will continue to benefit from these and other operational improvements.
Be the Employer of Choice
We believe our associates are the key drivers of our success, and we aim to recruit, train, promote and retain the most talented and success-driven personnel in the industry. Our size and scale enable us to offer structured training and career path opportunities for our associates, while at the area and branch level we have built a vibrant and entrepreneurial culture that rewards performance. We promote ongoing, open and honest communication with our associates to ensure mutual trust, engagement and performance improvement. We believe that high-performing local leaders coupled with creative, adaptable and engaged associates are critical to our success and to maintaining our competitive position, and we are committed to being the employer of choice in our industry.
Our History and Ownership
Our company was established in 2001, when Deere & Company (“Deere”) entered the market for wholesale landscape distribution through the acquisition of McGinnis Farms, a supplier of irrigation and nursery products with branches located primarily in the Southeastern United States. Subsequent acquisitions under Deere’s ownership included Century Rain Aid in 2001, United Green Mark in 2005 and LESCO Inc. (“LESCO”) in 2007, each of which significantly expanded our geographic footprint and broadened our product portfolio.
Holdings indirectly owns 100% of the membership interest in SiteOne Landscape Supply Holding, LLC (referred to in this Annual Report on Form 10-K as “Landscape Holding”). Landscape Holding is the parent and sole owner of SiteOne Landscape Supply, LLC (referred to in this Annual Report on Form 10-K as “Landscape”). Prior to the CD&R Acquisition described below, Deere was the sole owner of Landscape Holding.
On December 23, 2013 (the “Closing Date”), a wholly-owned subsidiary of Holdings acquired 100% of the ownership interest in Landscape Holding from Deere in exchange for common shares of Holdings representing 40% of Holdings’ then outstanding capital stock (assuming conversion of the cumulative convertible participating redeemable preferred stock, or the “Preferred Stock”) plus cash consideration of approximately $314 million, net of pre-closing and post-closing adjustments. Holdings also issued 174,000 shares of Preferred Stock to CD&R Landscapes Holdings, L.P. (the “CD&R Investor”), an affiliate of Clayton, Dubilier & Rice, LLC (“CD&R”), representing 60% of the then outstanding capital stock of Holdings (on an as-converted basis). As part of the transaction, Landscape Holding also acquired from Deere the affiliated company LESCO. We refer to the transactions described in this paragraph as the “CD&R Acquisition.”
On May 17, 2016, we completed the initial public offering (“IPO”) of our common stock at a price to the public of $21.00 per share. In connection with the IPO, the CD&R Investor and Deere together sold an aggregate of 10,000,000 shares of common stock. The underwriters also exercised their option to purchase an additional 1,500,000 shares of common stock from the CD&R Investor and Deere, at the public offering price less the underwriting discounts and commissions. The CD&R Investor and Deere received all of the net proceeds and bore all commissions and discounts from the sale of our common stock. We did not receive any proceeds from the IPO. On the day prior to the closing of the IPO, all of our then-outstanding Preferred Stock converted into shares of common stock, resulting in the issuance by us of an additional 25,303,164 shares of our common stock. The conversion of Preferred Stock is accounted for from the date of conversion and is not retroactively adjusted in our financial statements and related notes included in this Annual Report on Form 10-K.
Holdings registered on behalf of certain stockholders the offering and sale of 9,000,000 shares of common stock, as well as 1,350,000 shares of common stock sold to the underwriters pursuant to an option to purchase additional shares. On December 5, 2016, the selling stockholders completed the offering of 10,350,000 shares of common stock at a price of $33.00 per share. Holdings did not receive any of the proceeds from the aggregate 10,350,000 shares of common stock sold by the selling stockholders.
As of March 10, 2017, the CD&R Investor and Deere hold approximately 27.9% and 14.9% of Holdings’ common stock, respectively.
Following the CD&R Acquisition, we have revitalized our acquisition strategy and have acquired 16 businesses as of March 10, 2017. The historical annual net sales of these businesses prior to their respective acquisition dates totaled more than $450 million.
9
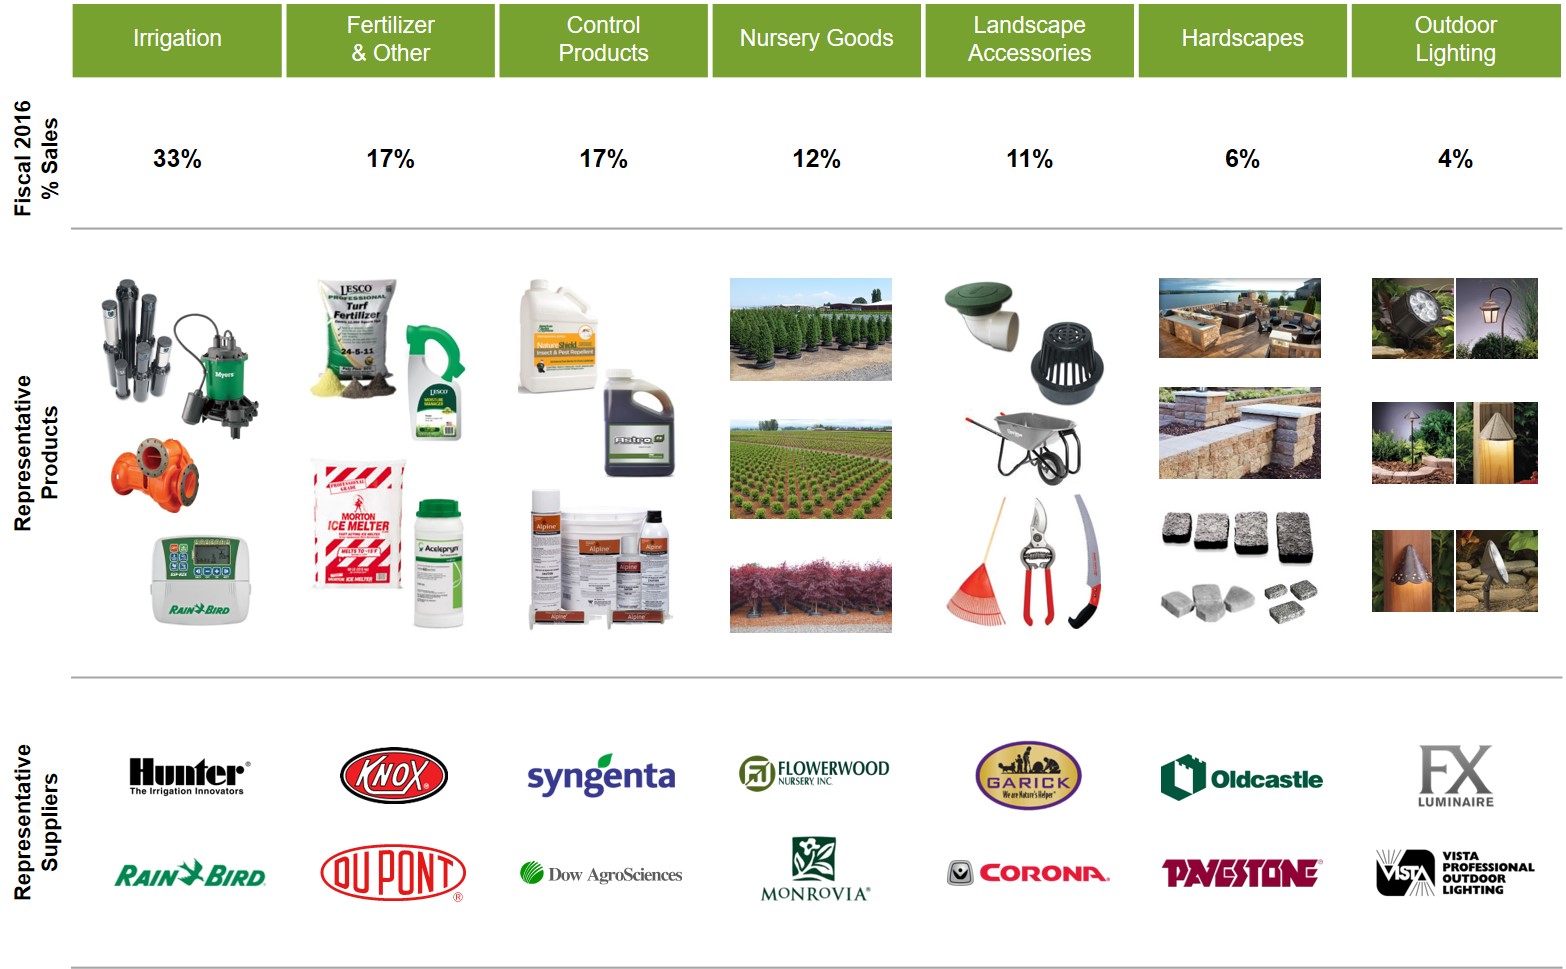
Our Products and Services
Our ability to provide a broad range of products is essential to our success. We believe we offer the industry’s most comprehensive portfolio of landscape products with over 100,000 SKUs from more than 2,500 suppliers. Our product portfolio includes irrigation, fertilizer & other, control products, landscape accessories, nursery goods, hardscapes and outdoor lighting products. In each of the 2016, 2015 and 2014 Fiscal Years, sales of irrigation, fertilizer & other and control products each accounted for 10% or more of our net sales. In addition, sales of nursery goods accounted for 10% or more of our net sales in the 2016 and 2015 Fiscal Years. Landscape accessories accounted for 10% or more of our net sales in the 2016 and 2014 Fiscal Years.
Our customers value our product breadth and geographic reach, as well as our on-site expertise and consultative services. While pricing is important to our customers, availability, convenience and expertise are also important factors in their purchase decisions. In addition to other capabilities, our ability to offer the significant yard space and special equipment that items such as nursery goods and hardscapes require provides us with a competitive advantage over many competitors who offer a more limited selection of product categories.
See Note 12 to our audited financial statements for more information on our net sales in the agronomic (fertilizer & other and control products), irrigation and outdoor lighting, landscape accessories and hardscapes and nursery goods categories.
Irrigation
Our irrigation products include controllers, valves, sprinkler heads and irrigation and drainage pipes. The market for irrigation products has historically provided stable growth and is driven primarily by new home construction and maintenance of existing irrigation systems. We believe water conservation regulations and rising consumer interest in more complex decorative and functional landscaping will continue to drive demand for upgraded irrigation systems.
Fertilizer & Other
Our fertilizer & other products include fertilizer, grass seed and ice melt products. Fertilizer products are sold to the maintenance end market and accordingly are relatively stable through economic cycles.
10
Control Products
Our control products are specialty products that include herbicides, fungicides, rodenticides and other pesticides. Similar to fertilizer products, control products sales are strongly tied to the maintenance end market and accordingly are relatively stable through economic cycles. We expect that future growth for control products will be aided by the introduction of new bio-pesticides derived from natural materials.
Landscape Accessories
Our landscape accessories products include mulches, soil amendments, tools and sod. Landscape accessories are typically sold in combination with other landscape supply products. As a result, sales of these accessories are often tied to sales fertilizers and control products, as well as sales of nursery goods and hardscape products.
Nursery Goods
Our nursery goods include deciduous shrubs, evergreen shrubs and trees, ornamental trees, shade trees, both field grown and container-grown nursery stock and hundreds of plant species and cultivars available in a number of heights and bloom colors. We believe increased demand for nursery goods will be driven by the rising interest in outdoor living spaces, including patios, outdoor kitchens, open-air living rooms and decks that extend the living space to the outdoors. We also believe the nursery goods category represents a growth opportunity due to its size and our relatively low penetration of the market to date.
Outdoor Lighting
Our outdoor lighting products include accent lights, dark lights, path lights, up lights, down lights, wall lights and pool and aquatic area lighting. Outdoor lighting products are expected to grow at an estimated 8.1% through 2019, according to Freedonia, due in part to growing trends in outdoor living and an interest in improving the exterior appearance of homes. In addition, the recent shift from AC to low voltage DC power sources and advances in LED technology are expected to contribute to additional demand for outdoor lighting products.
Hardscapes
Hardscapes include paving stones, blocks and other durable materials. According to Freedonia, the hardscape market is expected to grow at an estimated CAGR of 7.3% through 2019. We believe that this trend, combined with our relatively low market share in hardscapes, provides us with a significant growth opportunity.
Proprietary Branded Products
In addition to distributing branded products of third parties, we offer products under our proprietary brands. Sales of LESCO and Green Tech together accounted for approximately 19% of our 2016 Fiscal Year net sales, the large majority of which is attributable to LESCO.
LESCO
We acquired LESCO and its associated brands in 2007. LESCO is a premium brand and maintains strong brand awareness with golf and professional landscape contractors.
Under the LESCO brand, we offer formulations of fertilizer (liquid and granular), combination products (pesticides on a fertilizer carrier), control products (liquid and granular pesticides), specialty chemicals, turf seed, application equipment (engine powered and walk behind or other non-engine powered), paint, maintenance products like engine oil, windshield washer fluid, ice melt, trimmer line and soil tests. In 2015, we introduced Basic Seed and Basic Nutrition, “sub-brands” of LESCO, under which we offer fertilizer and landscape accessories. LESCO products are sold through our branches and retail outlets such as The Home Depot and Ace Hardware.


11
Green Tech
We offer pre-packaged landscape and irrigation management solutions that are designed to help customers manage and conserve water under the Green Tech brand. The core Green Tech product lines include central irrigation control systems, solar assemblies, fertilizer injection systems, irrigation pumps and hand-held remote control equipment.
Services
We offer a variety of complementary, value-added services to support the sale of our products. We do not derive separate revenue for these services, but we believe they are an important differentiator in establishing our value proposition to our customers.
Product Knowledge and Technical Expertise
Consultative services provided by our local staff, many of whom are former landscape contractors or golf course superintendents, include product selection and support, assistance with design and implementation of landscape projects and potential sales leads for new business opportunities. Our SiteOne University program provides customers with access to substantive training and informational seminars that directly support the growth of their businesses. The program includes technical training, licensing, certifications and business management seminars. In addition, our product category experts provide technical knowledge on the features and benefits of products we provide as well as on job installation techniques.
Project Services
We partner with our customers by providing consultative services to help them save time, money and effort in bidding for new projects and for new landscape installations. Our regionally based project services teams specialize in quoting, estimating and completing sales for customers who compete in the commercial construction sector. Other services provided by our project services teams include specifications assistance and irrigation design.
Partners Program
We also offer a loyalty program, our Partners Program, which had more than 12,000 enrolled customers as of January 1, 2017 and provides business and personal rewards, access to business services at preferred rates and technical training and support. Reward points may be spent, for example, on credit on account, trips and special events, gift cards to major retailers and SiteOne University courses and educational events. Access to preferred rate business services includes, for example, payroll and select human resources services, cell phone services, office supplies, auto and fleet insurance and fuel rebates. For the 2016 Fiscal Year, Partners Program participants accounted for approximately 48% of our net sales.
Operational Structure
Our operational philosophy is to create local area teams and branch networks specifically designed to best meet our customers’ needs at the local market level, while supporting these teams with the resources of a large company delivered through regional and divisional management, including company-wide corporate functions.
At the local market level, we organize our 469 branches and approximately 358 outside sales representatives into 50 designated “areas” that each serve a defined geography, typically a large MSA or a combination of MSAs in close proximity. Area managers are responsible for organization and talent planning, branch operations, sales strategy and product delivery strategy. Area managers are supported by an area business manager responsible for executing the local market strategies and key initiatives to grow sales and profitability. Branch managers report to the area business manager, while outside sales representatives report to the area manager directly.
We support our 469 branches and 50 areas with regional management and company-wide corporate functions providing: management of business performance; development and execution of local strategies; sharing of best practices; execution and integration of acquisitions; finance and accounting expertise (credit/collections, payables); category management and procurement; supply chain (planners, buyers); pricing strategies; marketing; and information technology. All of our branches are integrated on a single technology platform, allowing us to leverage our full operational scale for procurement, inventory management, financial support, data analytics and performance reporting.
12
Sales
We are the largest and only national wholesale distributor of landscape supplies in the United States, and we have a growing presence in Canada. We have an extensive North American platform of 469 branch locations in 45 states and five provinces. Approximately 99% of our 2016 Fiscal Year net sales were within the United States.
Our approximately 2,900 field associates including, 358 outside sales representatives, have regular interaction with our customers due to the recurring nature of landscape services and the fact that most contractors tend to buy products on an as-needed basis. We rely heavily on local teams for sales, marketing and strategy execution, with our strategic marketing initiatives supported by company-wide customer analytics and programs in order to drive acquisition and retention of customers. Our high-touch customer service model strengthens relationships, builds loyalty and drives repeat business with our customers.
Our outside sales force is organized by geographic area and specialty. Each area maintains a number of outside sales representatives who drive sales growth on behalf of several branches across a variety of accounts from landscape contractors to municipal agencies. We also maintain a sales force of agronomic sales representatives who are focused on growing sales to the golf industry.
We have a national account sales organization which leads sales strategy and execution for our largest national and regional customers. The national sales team is organized around five different market sectors: landscape and grounds maintenance, golf, retail, international and engineering, procurement and construction. Each national account manager is responsible for a group of large accounts and coordinates our business with them both nationally and locally through our local sales representatives. National account managers negotiate national programs with our largest customers in order to increase our share of their business.
13
Pricing
Our pricing strategy is developed nationally and deployed locally with input from regional and area managers to adjust for market-specific conditions. Depending upon the local competitive dynamics, pricing can be tailored to the region, market or customer level as needed. Our pricing team monitors market supply and demand trends that impact our supplier community and customer base and is able to adjust pricing based upon those trends in order to remain competitive.
Category Management
Our category management initiatives are developed at the national level, with input from local and regional level management. We track product demand, market size and share and we use this information to improve our product mix and select appropriate suppliers. We believe these initiatives enable us to provide improved service to customers and drive supply chain efficiencies, leading to increased market share and margin growth. We have a dedicated team for each category, which enables us to build specific category strategies that are nationally based but can be, through a series of menu options, tailored to support a specific region or area.
Marketing
Our marketing department is integral to our strategy and helps drive the business through brand management, print marketing, including catalogs and promotional fliers, and digital marketing, which includes search engine optimization and website development. Our marketing department is also responsible for customer management and is focused on developing ways to successfully acquire, retain and reactivate customers. We also focus on branch merchandising by evaluating our customers’ buying patterns and seeking opportunities to showcase products that we believe will attract customer interest and help promote our “one-stop shop” capabilities.
Distribution Network
We use two distribution models to offer a comprehensive selection of products and meet the needs of each local market.
Branches
Our branch network is the core of our operations and creates a highly valuable connection between our suppliers and our customers. Of our approximately 2,700 suppliers, few are set up to serve the shipping needs of our customers as their supply chains are typically focused on bulk quantities shipped from only a few locations. In contrast, many of our customers often require comparatively small quantities of products from numerous suppliers to complete a typical project, making it unfeasible to source directly from those suppliers. Our branch network provides significant value to our suppliers by maintaining local availability of core and complementary products in quantities our customers need.
The majority of our branches carry multiple product categories but do not carry all of them. Branches that carry our full product lines combine our regular branch facilities with large 8-to-15 acre yards suitable for nursery goods and hardscape products. Yards are well-equipped to manage truckload-purchased landscape, nursery and hardscape products and can maintain a diverse variety of greenhouse and nursery plants. All locations offering nursery goods have water distribution systems to maintain inventories, and many of these locations have access to municipal water supply, wells or ponds. Branches are strategically located near residential areas with good highway access. In-store merchandising displays are utilized to emphasize product features and seasonal promotions. We primarily lease 5,000 to 15,000 square foot facilities in both freestanding and multi-tenant buildings, with secured outside storage yards averaging from 10,000 to 20,000 square feet in some branches.
Direct Distribution
Our direct distribution business provides point-to-point logistics for bulk
quantities of landscape products between producers and customers. Our direct distribution business provides customers with sourcing and logistics support services for inventory management and delivery, in many cases more economically than the producers might otherwise provide. We believe that producers view us not as competitors, but as providers of a valuable service, brokering these large orders through the use of our network. We typically do not maintain inventory for direct distribution but rather use our existing producer relationships, marketing expertise and ordering and logistics infrastructure to serve this demand, requiring less working capital investment for these sales. Approximately 7% of our 2016 Fiscal Year net sales were from direct distribution.
Direct distribution is preferred for contractors with large projects, typically designed by professional landscape architects. Contractors work hand-in-hand with our outside sales and inside sales teams, including project planning support with material take-offs, product sourcing and bid preparation. Using our large vendor network, our associates arrange convenient direct shipments to jobs, coordinated and staged according to each phase of construction. This distribution channel primarily handles bulk nursery, agronomic, landscape and hardscape products.
14
Construction Sectors
We supply products primarily to contractors in the residential, commercial and recreational & other construction sectors. Approximately 54% of our 2016 Fiscal Year net sales derived from the residential sector, 31% from the commercial sector and 15% from the recreational & other construction sector.
Residential
Our residential sector includes installation work (
e.g.
, irrigation systems, nursery goods, outdoor lighting, hardscapes, etc.) for new single-family and multi-family housing as well as repair, upgrade and maintenance activities for existing homes. Demand in our residential sector is primarily influenced by general economic conditions, population growth, employment levels, mortgage rates and consumer spending. Many of the customers we serve in this sector are small, local landscape service companies and installers.
Commercial
Our commercial sector includes products for landscape installation, repair, upgrade and maintenance for non-residential buildings, such as office space, hotels, retail centers, manufacturing plants, warehouses, schools, hospitals and government facilities. The key drivers for this sector are general levels of economic activity, vacancy rates and government spending. Customers in this sector include small, private landscape contractors as well as larger, more regionally-focused landscape firms.
Recreational & Other
Our recreational sector consists primarily of the sale of agronomic products to golf courses. We also include within this sector our sales to other recreational facilities, such as parks, athletic fields and outdoor resorts; sales to infrastructure-related projects for state and municipal governments; and sales to other customers unrelated to residential or commercial construction. Key drivers of this sector are consumer confidence, levels of recreational activity and government spending. A large proportion of the customers in this sector are facility operators who buy directly from us instead of using an intermediary landscape contractor.
End Markets
Our sales can be broken down into three separate end markets: (1) landscape maintenance, (2) the installation of landscape materials for new construction and (3) the repair and upgrade of existing landscaping. These categories accounted for 43%, 39% and 18%, respectively, of our 2016 Fiscal Year net sales.
Maintenance
We sell a variety of items that are designed to maintain the health of existing landscaping, such as fertilizers and control products, pesticides and herbicides. Ice melt is also a significant maintenance product that is used to maintain walkways and driveways during cold weather periods. Our maintenance sales tend to be more stable through economic cycles than our sales for either the new construction or repair and upgrade end markets.
New Construction
We sell a variety of products that are frequently installed during the construction of new single-family or multi-family residences. These items typically include irrigation systems, nursery goods, outdoor lighting and hardscapes. These products are also frequently installed by our customers during the construction of non-residential buildings, such as commercial office space and retail centers, though often on a much larger scale. Our sales and service associates have significant expertise and tools available to assist customers with the planning and design of new landscape installations, including irrigation networks, which positively differentiates us from competitors and creates substantial value for our customers.
Repair and Upgrade
Similar to new construction, repair and upgrade of existing landscaping is common and can be triggered by a number of potential factors and events, including changing consumer preferences, home prices, environmental regulations, weather damage, product obsolescence and technological improvements. In particular, a recent or pending sale of a home has been cited as a key driver of residential repair and upgrade activity. The same types of products we sell for new construction are generally sold to our customers for repair and upgrade projects.
15
Customers
Our customers are primarily residential and commercial landscape professionals who specialize in the design, installation and maintenance of lawns, gardens, golf courses and other outdoor spaces. Our customer base consists of more than 180,000 firms and individuals, with our top 10 customers accounting for approximately 4% of our 2016 Fiscal Year net sales, with no single customer accounting for more than 2% of net sales. Small customers, with annual purchases of up to $10,000, made up 18% of our 2016 Fiscal Year net sales. Medium customers, with annual purchases between $10,000 and $200,000, made up 54% of our 2016 Fiscal Year net sales. Large customers, with annual purchases over $200,000, made up 27% of our 2016 Fiscal Year net sales. Some of our largest customers include BrightView, The Home Depot, Davey Tree Expert Company and TruGreen. Distribution of our LESCO proprietary branded products on a wholesale basis to retailers represented approximately 1% of our 2016 Fiscal Year net sales.
Suppliers
Our market leadership, coast-to-coast market presence, broad product selection and extensive technical expertise have allowed us to develop strong relationships with our suppliers. Our size and broad national network make us an attractive partner for many industry-leading manufacturers, which has allowed us to maintain strong, long-term relationships with our supply base. Our scale advantages also lead to larger volume-based rebates, and we believe we are generally able to negotiate more favorable purchasing terms than many of our smaller competitors in the industry.
We source our products from more than 2,500 suppliers, including the major irrigation equipment manufacturers, turf and ornamental fertilizer/chemical companies, and a variety of suppliers who specialize in nursery goods, outdoor lighting, hardscapes and other landscape products. Some of our largest suppliers include Hunter, Rain Bird, Toro, Oldcastle, Bayer, Syngenta, BASF, Dow AgroSciences, Vista and NDS. Purchases from our top 10 suppliers accounted for approximately 33% of total purchases for our 2016 Fiscal Year.
We generally procure our products through purchase orders rather than under long-term contracts with firm commitments. We work to develop strong relationships with a select group of suppliers that we target based on a number of factors, including brand and market recognition, price, quality, product support and service, service levels, delivery terms and their strategic positioning. We generally have annual supplier agreements, and while they generally do not provide for specific product pricing, many include volume-based financial incentives that we earn by meeting or exceeding target purchase volumes. Our ability to earn these volume-based incentives is an important factor in our financial results. In limited cases, we have entered into supply contracts with terms that exceed one year for the manufacture of our LESCO branded fertilizer and some nursery goods and grass seed, which may require us to purchase products in the future.
Competition
The majority of our competition comes from other wholesale landscape supply distributors. Among wholesale distributors, we primarily compete against a small number of regional distributors and many small, local, privately-owned distributors. Some of our competitors carry several product categories, while others mainly focus on one product category such as irrigation, fertilizer/control, nursery goods or hardscapes. SiteOne is one of the only wholesale distributors which carries the full line of irrigation, fertilizer & other, control products, landscape accessories, nursery goods, hardscapes and outdoor lighting products.
We believe our top nine largest competitors include Ewing, Harrell’s, Horizon Distributors (a subsidiary of Pool Corporation), Imperial Sprinkler Supply, Central Turf & Irrigation Supply, Atlantic Irrigation, Reinders, FIS Outdoor and Longhorn.
16
We believe smaller, regional or local competitors still comprise approximately 82% of the landscape supply industry based on 2016 net sales. The principal competitive factors in our business include, but are not limited to, location, availability of materials and supplies, technical product knowledge and expertise, advisory or other service capabilities, delivery capabilities, pricing of products and availability of credit.
Associates
As of March 10, 2017, we had approximately 3,300 associates, none of whom were affiliated with labor unions. We believe that we have good relations with our associates. Additionally, we believe that the training provided through our development programs and our entrepreneurial, performance-based culture provides significant benefits to our associates. Approximately 95% of our associates are employed on a full-time, year-round basis. Our associate count currently includes approximately 165 seasonal associates, who are temporarily employed due to the weather-dependent nature of our business. An associate is anyone employed by the Company.
Our Brand
We transitioned from using variations on the Deere name and logo to using the SiteOne brand name as of December 31, 2015. We believe the SiteOne name highlights the benefits of our “one-stop shop” business model, whereby professional landscape contractors can fulfill their landscape product needs in one place.
We believe that our strong customer and supplier relationships have led to the rapid acceptance of our new brand that supports our mission of providing top quality services and products to our customers.
Service Marks, Trademarks and Trade Names
We hold various trademark registrations, including SiteOne and LESCO, which we consider important to our marketing activities. Generally, trademark rights have a perpetual life, provided that they are renewed on a timely basis and continue to be used properly as trademarks. We intend to maintain these trademark registrations and the other trademarks associated with our business so long as they remain valuable to our business. In addition, other than commercially available software licenses, we do not believe that any of our licenses for third-party intellectual property are material to our business, taken as a whole.
Weather Conditions and Seasonality
In a typical year, our operating results are impacted by seasonality. Historically, our net sales and net income have been higher in the second and third quarters of each fiscal year due to favorable weather and longer daylight conditions during these quarters. Our net sales have been significantly lower in the first and fourth quarters due to lower landscaping, irrigation and turf maintenance activities in these quarters, and we have historically incurred net losses in these quarters. Seasonal variations in operating results may also be significantly impacted by inclement weather conditions, such as snow or rain, which can not only impact the demand for certain products like fertilizer and ice melt but also delay construction projects where our products are used.
Regulatory Compliance
Government Regulations
We are subject to various federal, state, provincial and local laws and regulations, compliance with which increases our operating costs, limits or restricts the products and services we provide or the methods by which we offer and sell those products and services or conduct our business and subjects us to the possibility of regulatory actions or proceedings. Noncompliance with these laws and regulations can subject us to fines or various forms of civil or criminal prosecution, any of which could have a material adverse effect on our reputation, business, financial position, results of operations and cash flows.
These federal, state, provincial and local laws and regulations include laws relating to consumer protection, wage and hour, deceptive trade practices, permitting and licensing, state contractor laws, workers’ safety, tax, healthcare reforms, collective bargaining and other labor matters, environmental and employee benefits.
In 2012, the United States Supreme Court upheld the majority of the provisions in the Patient Protection and Affordable Care Act (the “Act”). The Act places requirements on employers to provide a minimum level of benefits to employees and assesses penalties on employers if the benefits do not meet the required minimum level or if the cost of coverage to employees exceeds affordability thresholds specified in the Act. The minimum benefits and affordability requirements took effect in 2014. The Act also imposes an excise tax beginning in 2018 on plans whose average cost exceeds specified amounts. We have analyzed the effects on us from the provisions of the Act and we do not currently anticipate a significant financial impact.
17
Environmental, Health and Safety Matters
We are subject to numerous federal, state, provincial and local environmental, health and safety laws and regulations, including laws that regulate the emission or discharge of materials into the environment, govern the use, handling, treatment, storage, disposal and management of hazardous substances and wastes, protect the health and safety of our associates and users of our products and impose liability for investigating and remediating, and damages resulting from, present and past releases of hazardous substances at sites we have ever owned, leased or operated or used as a disposal site.
In the United States, we are regulated under many environmental, health and safety laws, including the Comprehensive Environmental Response, Compensation and Liability Act, the Federal Environmental Pesticide Control Act, the Federal Insecticide, Fungicide and Rodenticide Act, the Clean Air Act, the Clean Water Act and the Occupational Safety and Health Act, each as amended. Certain laws, such as those requiring the registration of herbicides and pesticides, and regulating their use, also involve the oversight of regulatory authorities and public health agencies. Although we strive to comply with such laws and have processes in place designed to achieve compliance, we may be unable to prevent violations of these or other laws from occurring. We could also incur significant investigation and clean-up costs for contamination at any currently or formerly owned or operated facilities, including LESCO’s manufacturing and blending facilities. See “Note 10. Commitments and Contingencies” to our audited consolidated and combined financial statements included in this Annual Report.
In addition, we cannot predict the effect of possible future environmental, health or safety laws on our operations. Changes in, or new interpretations of, existing laws, regulations or enforcement policies, the discovery of previously unknown contamination, or the imposition of other environmental liabilities or obligations in the future, including obligations with respect to any potential health hazards of our products, may lead to additional compliance or other costs.
18
You should carefully consider the factors described below, in addition to the other information set forth in this Annual Report on Form 10-K. These risk factors are important to understanding the contents of this Annual Report on Form 10-K and of other reports. Our reputation, business, financial position, results of operations and cash flows are subject to various risks. The risks and uncertainties described below are not the only ones relevant to us. Additional risks and uncertainties not currently known to us or that we currently believe are immaterial may also adversely impact our reputation, business, financial position, results of operations and cash flows.
Risks Related to Our Business and Our Industry
Cyclicality in our business could result in lower net sales and reduced cash flows and profitability. We have been, and in the future may be, adversely impacted by declines in the new residential and commercial construction sectors, as well as in spending on repair and upgrade activities.
We sell a significant portion of our products for landscaping activities associated with new residential and commercial construction sectors, which have experienced cyclical downturns, some of which have been severe. The strength of these markets depends on, among other things, housing starts, consumer spending, non-residential construction spending activity and business investment, which are a function of many factors beyond our control, including interest rates, employment levels, availability of credit, consumer confidence and capital spending. Weakness or downturns in residential and commercial construction markets could have a material adverse effect on our business, operating results or financial condition.
Sales of landscape supplies to contractors serving the residential construction sector represent a significant portion of our business, and demand for our products is highly correlated with new residential construction. Housing starts are dependent upon a number of factors, including housing demand, housing inventory levels, housing affordability, foreclosure rates, demographic changes, the availability of land, local zoning and permitting processes, the availability of construction financing and the health of the economy and mortgage markets. Unfavorable changes in any of these factors could adversely affect consumer spending, result in decreased demand for homes and adversely affect our business. Beginning in mid-2006 and continuing through late-2011, the homebuilding industry experienced a significant downturn. The decrease in homebuilding activity had a significant adverse effect on our business during such time. According to the U.S. Census Bureau, 1.2 million housing units were started in 2016, representing an increase of approximately 5% from 2015. Nevertheless, housing starts in 2016 remained significantly below their historical long-term average. In addition, some analysts project that the demand for residential construction may be negatively impacted as the number of renting households has increased in recent years and as a shortage in the supply of affordable housing is expected to result in lower home ownership rates. The timing and extent of any recovery in homebuilding activity and the resulting impact on demand for landscape supplies are uncertain.
Our net sales also depend, in significant part, on commercial construction, which similarly recently experienced a severe downturn. Previously, downturns in the commercial construction market have typically lasted about two to three years, resulting in market declines of approximately 20% to 40%, while the most recent downturn in the commercial construction market lasted over four years, resulting in a market decline of approximately 60%. According to U.S. Census Bureau, total private commercial construction put in place began to recover in 2013 and increased approximately 20% in 2014, 6% in 2015 and 11% in 2016. However, 2016 new commercial construction spending was still well below pre-recession levels. We cannot predict the duration of the current market conditions or the timing or strength of any future recovery of commercial construction activity in our markets.
We also rely, in part, on repair and upgrade of existing landscapes. High unemployment levels, high mortgage delinquency and foreclosure rates, lower home prices, limited availability of mortgage and home improvement financing, and significantly lower housing turnover, may restrict consumer spending, particularly on discretionary items such as landscape projects, and adversely affect consumer confidence levels and result in reduced spending on repair and upgrade activities.
Our business is affected by general business, financial market and economic conditions, which could adversely affect our financial position, results of operations and cash flows.
Our business and results of operations are significantly affected by general business, financial market and economic conditions. General business, financial market and economic conditions that could impact the level of activity in the wholesale landscape supply industry include the level of new home sales and construction activity, interest rate fluctuations, inflation, unemployment levels, tax rates, capital spending, bankruptcies, volatility in both the debt and equity capital markets, liquidity of the global financial markets, the availability and cost of credit, investor and consumer confidence, global economic growth, local, state and federal government regulation, and the strength of regional and local economies in which we operate. With respect to the residential construction sector in particular, spending on landscape projects is largely discretionary and lower levels of consumer spending or the decision by home-owners to perform landscape upgrades or maintenance themselves rather than outsource to contractors may adversely affect our business. There was a significant
19
decline in economic growth in the United States, which began in the second half of 2007 and continued through the last quarter of 2009. There can be no guarantee that the improvements since that time in the general economy and our markets will be sustained or continue.
Seasonality affects the demand for our products and services and our results of operations and cash flows.
The demand for our products and services and our results of operations are affected by the seasonal nature of our irrigation, outdoor lighting, nursery, landscape accessories, fertilizers, turf protection products, grass seed, turf care equipment and golf course maintenance supplies. Such seasonality causes our results of operations to vary considerably from quarter to quarter. Typically, our net sales and net income have been higher in the second and third quarters of each fiscal year due to favorable weather and longer daylight conditions during these quarters. Our net sales and net income, however, are significantly lower in the first and fourth quarters due to lower landscaping, irrigation and turf maintenance activities in these quarters. Accordingly, results for any quarter are not necessarily indicative of the results that may be achieved for the full fiscal year.
Our operations are substantially dependent on weather conditions.
We supply landscape, irrigation and turf maintenance products, the demand for each of which is affected by weather conditions, including, without limitation, potential impacts, if any, from climate change. In particular, droughts could cause shortage in the water supply, which may have an adverse effect on our business. For instance, our supply of plants could decrease, or prices could rise, due to such water shortages, and customer demand for certain types of plants may change in ways in which we are unable to predict. Such water shortages may also make irrigation or the maintenance of turf uneconomical. Governments may implement limitations on water usage that make effective irrigation or turf maintenance unsustainable, which could negatively impact the demand for our products. In California, for instance, mandatory water restrictions went into effect across the state in 2015. We have also recently seen an increased demand in California for products related to drought-tolerant landscaping, including hardscapes and plants that require low amounts of water. There is a risk that demand for landscaping products will decrease overall due to persistent drought conditions in some of the geographic markets we serve, or that demand will change in ways that we are unable to predict.
Furthermore, adverse weather conditions, such as droughts, severe storms and significant rain or snowfall, can adversely impact the demand for our products, timing of product delivery, or our ability to deliver products at all. For example, severe winter storms can cause hazardous road conditions, which may prevent personnel from traveling or delivering to service locations. In addition, unexpectedly severe weather conditions, such as excessive heat or cold, may result in certain applications in the maintenance product cycle being omitted for a season or damage to or loss of nursery goods, sod and other green products in our inventory, which could result in losses requiring writedowns.
Laws and government regulations applicable to our business could increase our legal and regulatory expenses, and impact our business, financial position, results of operations and cash flows.
Our business is subject to significant federal, state, provincial and local laws and regulations. These laws and regulations include laws relating to consumer protection, wage and hour requirements, the employment of immigrants, labor relations, permitting and licensing, building code requirements, workers’ safety, the environment, employee benefits, marketing and advertising and the application and use of herbicides, pesticides and other chemicals. In particular, we anticipate that various federal, state, provincial and local governing bodies may propose additional legislation and regulation that may be detrimental to our business, may decrease demand for the products we supply or may substantially increase our operating costs, including proposed legislation, such as environmental regulations related to chemical or nutrient use, water use, climate change, equipment efficiency standards and other environmental matters; other consumer protection laws or regulations; or health care coverage. It is difficult to predict the future impact of the broad and expanding legislative and regulatory requirements affecting our businesses and changes to such requirements may adversely affect our business, financial position, results of operations and cash flows. In addition, if we were to fail to comply with any applicable law or regulation, we could be subject to substantial fines or damages, be involved in litigation, suffer losses to our reputation or suffer the loss of licenses or incur penalties that may affect how our business is operated, which, in turn, could have a material adverse impact on our business, financial position, results of operations and cash flows.
Public perceptions that the products we use and the services we deliver are not environmentally friendly or safe may adversely impact the demand for our products or services.
We sell, among other things, fertilizers, herbicides, fungicides, pesticides, rodenticides and other chemicals. Public perception that the products we use and the services we deliver are not environmentally friendly or safe or are harmful to humans or animals, whether justified or not, or the improper application of these chemicals, could reduce demand for our products and services, increase regulation or government restrictions or actions, result in fines or penalties, impair our reputation, involve us in litigation, damage our brand names and otherwise have a material adverse impact on our business, financial position, results of operations and cash flows.
20
Our industry and the markets in which we operate are highly competitive and fragmented, and increased competitive pressures could reduce our share of the markets we serve and adversely affect our business, financial position, results of operations and cash flows.
We operate in markets with relatively few large competitors, but barriers to entry in the landscape supply industry are generally low, and we may have several competitors within a local market area. Competition varies depending on product line, type of customer and geographic area. Some local competitors may be able to offer higher levels of service or a broader selection of inventory than we can in particular local markets. As a result, we may not be able to continue to compete effectively with our competitors. Any of our competitors may foresee the course of market development more accurately than we do, provide superior service, sell or distribute superior products, have the ability to supply or deliver similar products and services at a lower cost, or on more favorable credit terms, develop stronger relationships with our customers and other consumers in the landscape supply industry, adapt more quickly to evolving customer requirements than we do, develop a superior network of distribution centers in our markets or access financing on more favorable terms than we can obtain. As a result, we may not be able to compete successfully with our competitors.
Competition can also reduce demand for our products and services, negatively affect our product sales and services or cause us to lower prices. Consolidation of professional landscape service firms may result in increased competition for their business. Certain product manufacturers that sell and distribute their products directly to landscapers may increase the volume of such direct sales. Our suppliers may also elect to enter into exclusive supplier arrangements with other distributors.
Former associates may start landscape supply businesses similar to ours, in competition with us. Our industry faces low barriers to entry, making the possibility of former associates starting similar businesses more likely. Increased competition from businesses started by former associates may reduce our market share and adversely affect our business, financial position, results of operations and cash flows.
Our customers consider the performance of the products we distribute, our customer service and price when deciding whether to use our services or purchase the products we distribute. Excess industry capacity for certain products in several geographic markets could lead to increased price competition. We may be unable to maintain our operating costs or product prices at a level that is sufficiently low for us to compete effectively. If we are unable to compete effectively with our existing competitors or new competitors enter the markets in which we operate, our financial condition, operating results and cash flows may be adversely affected.
Product shortages, loss of key suppliers, failure to develop relationships with qualified suppliers or dependence on third-party suppliers and manufacturers could affect our financial health.
Our ability to offer a wide variety of products to our customers is dependent upon our ability to obtain adequate product supply from manufacturers and other suppliers. Any disruption in our sources of supply, particularly of the most commonly sold items, could result in a loss of revenues, reduced margins and damage to our relationships with customers. Supply shortages may occur as a result of unanticipated increases in demand or difficulties in production or delivery. When shortages occur, our suppliers often allocate products among distributors. The loss of, or a substantial decrease in the availability of, products from our suppliers or the loss of key supplier arrangements could adversely impact our financial condition, operating results, and cash flows.
Our ability to continue to identify and develop relationships with qualified suppliers who can satisfy our high standards for quality and our need to be supplied with products in a timely and efficient manner is a significant challenge. Our suppliers’ ability to provide us with products can also be adversely affected in the event they become financially unstable, particularly in light of continuing economic difficulties in various regions of the United States and the world, fail to comply with applicable laws, encounter supply disruptions, shipping interruptions or increased costs, or face other factors beyond our control.
Our agreements with suppliers are generally terminable by either party on limited notice, and in some cases we do not have written agreements with our suppliers. If market conditions change, suppliers may stop offering us favorable terms. Our suppliers may increase prices or reduce discounts on the products we distribute and we may be unable to pass on any cost increase to our customers, thereby resulting in reduced margins and profits. Failure by our suppliers to continue to supply us with products on favorable terms, commercially reasonable terms, or at all, could put pressure on our operating margins or have a material adverse effect on our financial condition, results of operations and cash flows.
The prices and costs of the products we purchase may be subject to large and significant price fluctuations. We might not be able to pass cost increases through to our customers, and we may experience losses in a rising price environment. In addition, we might have to lower our prices in a declining price environment, which could also lead to losses.
We purchase and sell a wide variety of products, the price and availability of which may fluctuate, and may be subject to large and significant price increases. Many of our contracts with suppliers include prices for commodities such as grass seed and chemicals used in fertilizer that are not fixed or are tied to an index, which allows our suppliers to change the prices of their products as the input
21
prices fluctuate. Our business is exposed to these fluctuations, as well as to fluctuations in our costs for transportation and distribution. Changes in prices for the products that we purchase affect our net sales and cost of goods sold, as well as our working capital requirements, levels of debt and financing costs. We might not always be able to reflect increases in our costs in our own pricing. Any inability to pass cost increases on to customers may adversely affect our business, financial condition and results of operations. In addition, if market prices for the products that we sell decline, we may realize reduced profitability levels from selling such products and lower revenues from sales of existing inventory of such products.
We are subject to inventory management risks; insufficient inventory may result in lost sales opportunities or delayed revenue, while excess inventory may harm our gross margins.
We balance the need to maintain inventory levels that are sufficient to ensure competitive lead times against the risk of inventory obsolescence because of changing customer requirements, fluctuating commodity prices, or the life-cycle of nursery goods, sod and other green products. In order to successfully manage our inventories, including grass seed, chemicals used in fertilizers, and nursery goods, sod and other green products, we must estimate demand from our customers and purchase products that substantially correspond to that demand. If we overestimate demand and purchase too much of a particular product, we face a risk that the price of that product will fall, leaving us with inventory that we cannot sell profitably. In addition, we may have to write down such inventory if we are unable to sell it for its recorded value. Contracts with certain suppliers require us to take on additional inventory or pay a penalty, even in circumstances where we have excess inventory. By contrast, if we underestimate demand and purchase insufficient quantities of a product and the price of that product were to rise, we could be forced to purchase that product at a higher price and forego profitability in order to meet customer demand. Insufficient inventory levels may lead to shortages that result in delayed revenue or loss of sales opportunities altogether as potential end-customers turn to competitors’ products that are readily available. Our business, financial condition and results of operations could suffer a material adverse effect if either or both of these situations occur frequently or in large volumes.
Many factors, such as weather conditions, agricultural limitations and restrictions relating to the management of pests and disease, affect the supply of nursery goods, grass seed, sod and other green products. If the supply of these products available is limited, prices could rise, which could cause customer demand to be reduced and our revenues and gross margins to decline. For example, nursery goods, sod and grass seed are perishable and have a limited shelf life. Should we be unable to sell our inventory of nursery goods, grass seed, sod and other green products within a certain timeframe, we may face losses requiring write-downs. In contrast, we may not be able to obtain high-quality nursery goods and other green products in an amount sufficient to meet customer demand. Even if available, nursery goods from alternate sources may be of lesser quality or may be more expensive than those currently grown or purchased by us. If we are unable to effectively manage our inventory and that of our distribution partners, our results of operations could be adversely affected.
We may not successfully implement our business strategies, including achieving our growth objectives.
We may not be able to fully implement our business strategies or realize, in whole or in part within the expected time frames, the anticipated benefits of our various growth or other initiatives. Our various business strategies and initiatives, including our growth, operational and management initiatives, are subject to significant business, economic and competitive uncertainties and contingencies, many of which are beyond our control. The execution of our business strategy and our financial performance will continue to depend in significant part on our executive management team and other key management personnel, the smooth transition of new senior leadership and our executive management team’s ability to execute the new operational initiatives that they are undertaking. In addition, we may incur certain costs as we pursue our growth, operational and management initiatives, and we may not meet anticipated implementation timetables or stay within budgeted costs. As these initiatives are undertaken, we may not fully achieve our expected efficiency improvements or growth rates, or these initiatives could adversely impact our customer retention, supplier relationships or operations. Also, our business strategies may change from time to time in light of our ability to implement our business initiatives, competitive pressures, economic uncertainties or developments, or other factors.
We may be unable to successfully acquire and integrate other businesses.
Our historical growth has been driven in part by acquisitions, and future acquisitions are an important element of our business strategy. We may be unable to continue to grow our business through acquisitions. We may not be able to continue to identify suitable acquisition targets and may face increased competition for these acquisition targets. In addition, acquired businesses may not perform in accordance with expectations, and our business judgments concerning the value, strengths and weaknesses of acquired businesses may not prove to be correct. We may also be unable to achieve expected improvements or achievements in businesses that we acquire. At any given time, we may be evaluating or in discussions with one or more acquisition targets, including entering into non-binding letters of intent. Future acquisitions may result in the incurrence of debt and contingent liabilities, legal liabilities, goodwill impairments, increased interest expense and amortization expense and significant integration costs.
22
Acquisitions involve a number of special risks, including:
|
•
|
our inability to manage acquired businesses or control integration costs and other costs relating to acquisitions;
|
|
•
|
potential adverse short-term effects on operating results from increased costs or otherwise;
|
|
•
|
diversion of management’s attention;
|
|
•
|
failure to retain existing customers or key personnel of the acquired business and recruit qualified new associates at the location;
|
|
•
|
failure to successfully implement infrastructure, logistics and systems integration;
|
|
•
|
potential impairment of goodwill;
|
|
•
|
risks associated with the internal controls of acquired companies;
|
|
•
|
exposure to legal claims for activities of the acquired business prior to acquisition and inability to realize on any indemnification claims, including with respect to environmental and immigration claims;
|
|
•
|
the risks inherent in the systems of the acquired business and risks associated with unanticipated events or liabilities; and
|
|
•
|
our inability to obtain financing necessary to complete acquisitions on attractive terms or at all.
|
Our strategy could be impeded if we do not identify, or face increased competition for, suitable acquisition targets, and such increased competition could result in higher purchase price multiples we have to pay for acquisition targets or reduce the number of suitable targets. Our business, financial condition, results of operations and cash flows could be adversely affected if any of the foregoing factors were to occur.
Increases in operating costs could adversely impact our business, financial position, results of operations and cash flows.
Our financial performance is affected by the level of our operating expenses, such as occupancy costs associated with the leases for our branch locations and costs of fuel, vehicle maintenance, equipment, parts, wages and salaries, employee benefits, health care, self-insurance costs and other insurance premiums as well as various regulatory compliance costs, all of which may be subject to inflationary pressures. In particular, our financial performance is adversely affected by increases in these operating costs.
Most of our facilities are located in leased premises. Many of our current leases are non-cancelable and typically have terms ranging from three to five years, with options to renew for specified periods of time. We believe that leases we enter into in the future will likely be long-term and non-cancelable and have similar renewal options. However, we may be unable to renew our current or future leases on favorable terms or at all which could have an adverse effect on our operations and costs. In addition, if we close a location, we generally remain committed to perform our obligations under the applicable lease, which include, among other things, payment of the base rent for the balance of the lease term.
We deliver a substantial volume of products to our customers by truck. Petroleum prices have fluctuated significantly in recent years. Prices and availability of petroleum products are subject to political, economic and market factors that are outside our control. Political events in petroleum-producing regions as well as hurricanes and other weather-related events may cause the price of fuel to increase. Our operating profit will be adversely affected if we are unable to obtain the fuel we require or to fully offset the anticipated impact of higher fuel prices through increased prices or fuel surcharges to our customers. Besides passing fuel costs on to customers, we have not entered into any hedging arrangements that protect against fuel price increases and we do not have any long-term fuel purchase contracts. If shortages occur in the supply of necessary petroleum products and we are not able to pass along the full impact of increased petroleum prices to our customers, our results of operations would be adversely affected.
We cannot predict the extent to which we may experience future increases in costs of occupancy, fuel, vehicle maintenance, equipment, parts, wages and salaries, employee benefits, health care, self-insurance costs and other insurance premiums as well as various regulatory compliance costs and other operating costs. To the extent such costs increase, we may be prevented, in whole or in part, from passing these cost increases through to our existing and prospective customers, and the rates we pay to our suppliers may increase, any of which could have a material adverse impact on our business, financial position, results of operations and cash flows.
Risks associated with our large labor force could have a significant adverse effect on our business.
We have an employee base of approximately 3,300 associates. Various federal and state labor laws govern our relationships with our associates and affect our operating costs. These laws include employee classifications as exempt or non-exempt, minimum wage requirements, unemployment tax rates, workers’ compensation rates, overtime, family leave, anti-discrimination laws, safety standards, payroll taxes, citizenship requirements and other wage and benefit requirements for employees classified as non-exempt. As our associates may be paid at rates that relate to the applicable minimum wage, further increases in the minimum wage could increase our labor costs. Associates may make claims against us under federal or state laws, which could result in significant costs. Significant additional government regulations, including the Employee Free Choice Act, the Paycheck Fairness Act and the Arbitration Fairness Act, could materially affect our business, financial condition and results of operations. In addition, we compete with other companies for many of our associates in hourly positions, and we invest significant resources to train and motivate our associates to maintain a high level of job satisfaction. Our hourly employment positions have historically had high turnover rates, which can lead to increased spending on training and retention
23
and, as a result, increased labor costs. If we are unable to effectively retain highly qualified associates in the future, it could adversely impact our business, financial position, results of operations and cash flows.
None of our associates are currently covered by collective bargaining or other similar labor agreements. However, if a larger number of our associates were to unionize, including in the wake of any future legislation that makes it easier for associates to unionize, our business could be negatively affected. Any inability by us to negotiate collective bargaining arrangements could cause strikes or other work stoppages, and new contracts could result in increased operating costs. If any such strikes or other work stoppages occur, or if other associates become represented by a union, we could experience a disruption of our operations and higher labor costs.
In addition, certain of our suppliers have unionized work forces and certain of our products are transported by unionized truckers. Strikes, work stoppages or slowdowns could result in slowdowns or closures of facilities where the products that we sell are manufactured or could affect the ability of our suppliers to deliver such products to us. Any interruption in the production or delivery of these products could delay or reduce availability of these products and increase our costs.
We depend on a limited number of key personnel. We may not be able to attract or retain key executives, which could adversely impact our business and inhibit our ability to operate and grow successfully.
We depend upon the ability and experience of a number of our executive management and other key personnel who have substantial experience with our operations and within our industry, including Doug Black, our Chief Executive Officer. The loss of the services of one or a combination of our senior executives or key employees could have a material adverse effect on our results of operations. Our business may also be negatively impacted if one of our senior executives or key employees is hired by a competitor. Our success also depends on our ability to continue to attract, manage and retain other qualified management personnel as we grow. We may not be able to continue to attract or retain such personnel in the future.
An impairment of goodwill and/or other intangible assets could reduce net income.
Acquisitions frequently result in the recording of goodwill and other intangible assets. As of January 1, 2017, goodwill represented approximately 9% of our total assets. Goodwill is not amortized for financial reporting purposes and is subject to impairment testing at least annually using a fair-value based approach. The identification and measurement of goodwill impairment involves the estimation of the fair value of our reporting units. Our accounting for impairment contains uncertainty because management must use its judgment in determining appropriate assumptions to be used in the measurement of fair value. We determine the fair values of our reporting units by using both a market and income approach.
We evaluate the recoverability of goodwill for impairment in between our annual tests when events or changes in circumstances indicate that the carrying amount of goodwill may not be recoverable. Any impairment of goodwill will reduce net income in the period in which the impairment is recognized.
Adverse credit and financial market events and conditions could, among other things, impede access to, or increase the cost of, financing or cause our customers to incur liquidity issues that could lead to some of our products not being purchased or being cancelled, or result in reduced operating revenue and net income, any of which could have an adverse impact on our business, financial position, results of operations and cash flows.
Disruptions in credit or financial markets could, among other things, lead to impairment charges, make it more difficult for us to obtain, or increase our cost of obtaining, financing for our operations or investments or to refinance our indebtedness, cause our lenders to depart from prior credit industry practice and not give technical or other waivers under the Credit Facilities (as defined under “-Risks Related to Our Substantial Indebtedness” below), to the extent we may seek them in the future, thereby causing us to be in default under one or more of the Credit Facilities. These disruptions could also cause our customers to encounter liquidity issues that could lead to a reduction in the amount of our products purchased or services used, could result in an increase in the time it takes our customers to pay us, or could lead to a decrease in pricing for our products, any of which could adversely affect our accounts receivable, among other things, and, in turn, increase our working capital needs. In addition, adverse developments at federal, state and local levels associated with budget deficits resulting from economic conditions could result in federal, state and local governments increasing taxes or other fees on businesses, including us, to generate more tax revenues, which could negatively impact spending by customers on our products.
The majority of our net sales are derived from credit sales, which are made primarily to customers whose ability to pay is dependent, in part, upon the economic strength of the geographic areas in which they operate, and the failure to collect monies owed from customers could adversely affect our working capital and financial condition.
The majority of our net sales in our 2016 Fiscal Year were derived from the extension of credit to our customers whose ability to pay is dependent, in part, upon the economic strength of the areas where they operate. We offer credit to customers, generally on a short-term basis, either through unsecured credit that is based solely upon the creditworthiness of the customer, or secured credit for
24
materials sold for a specific project where we establish a security interest in the material used in the project. The type of credit we offer depends on the customer’s financial strength. If any of our customers are unable to repay credit that we have extended in a timely manner, or at all, our working capital, financial condition, operating results and cash flows would be adversely affected. Further, our collections efforts with respect to non-paying or slow-paying customers could negatively impact our customer relations going forward.
Because we depend on certain of our customers to repay extensions of credit, if the financial condition of our customers declines, our credit risk could increase as a result. Significant contraction in the residential and non-residential construction markets, coupled with limited credit availability and stricter financial institution underwriting standards, could adversely affect the operations and financial stability of certain of our customers. Should one or more of our larger customers declare bankruptcy, it could adversely affect the collectability of our accounts receivable, bad debt reserves and net income.
Because we operate our business through highly dispersed locations across the United States, our operations may be materially adversely affected by inconsistent practices and the operating results of individual branches may vary.
We operate our business through a network of highly dispersed locations throughout the United States, supported by corporate executives and services in our headquarters, with local branch management retaining responsibility for day-to-day operations and adherence to applicable local laws. Our operating structure could make it difficult for us to coordinate procedures across our operations in a timely manner or at all. We may have difficulty attracting and retaining local personnel. In addition, our branches may require significant oversight and coordination from headquarters to support their growth. Inconsistent implementation of corporate strategy and policies at the local level could materially and adversely affect our overall profitability, prospects, business, results of operations, financial condition and cash flows. In addition, the operating results of an individual branch may differ from that of another branch for a variety of reasons, including market size, management practices, competitive landscape, regulatory requirements and local economic conditions. As a result, certain of our branches may experience higher or lower levels of growth than other branches.
Compliance with, or liabilities under, environmental, health and safety laws and regulations, including laws and regulations pertaining to the use and application of fertilizers, herbicides, insecticides and fungicides, could result in significant costs that adversely impact our reputation, business, financial position, results of operations and cash flows.
We are subject to federal, state, provincial and local environmental, health and safety laws and regulations, including laws that regulate the emission or discharge of materials into the environment, govern the use, packaging, labeling, transportation, handling, treatment, storage, disposal and management of chemicals and hazardous substances and waste, and protect the health and safety of our associates and users of our products. Such laws also impose liability for investigating and remediating, and damages resulting from, present and past releases of hazardous substances, including releases at sites we have ever owned, leased or operated or used as a disposal site. We could be subject to fines, penalties, civil or criminal sanctions, personal injury, property damage or other third-party claims as a result of violations of, or liabilities under, these laws and regulations. We could also incur significant investigation and cleanup costs for contamination at any currently or formerly owned or operated facilities, including LESCO’s manufacturing and blending facilities. In addition, changes in, or new interpretations of, existing laws, regulations or enforcement policies, the discovery of previously unknown contamination, or the imposition of other environmental liabilities or obligations in the future, including obligations with respect to any potential health hazards of our products, may lead to additional compliance or other costs that could have a material adverse effect on our business, financial position, results of operations and cash flows.
In addition, in the United States, products containing herbicides and pesticides generally must be registered with the U.S. Environmental Protection Agency, or the “EPA,” and similar state agencies before they can be sold or applied. The failure to obtain or the cancellation of any such registration, or the withdrawal from the marketplace of such products, could have an adverse effect on our business, the severity of which would depend in part on the products involved, whether other products could be substituted and whether our competitors were similarly affected. The herbicides and pesticides we use are manufactured by independent third parties and are evaluated by the EPA as part of its ongoing exposure risk assessment. The EPA may decide that a herbicide or pesticide we use will be limited or will not be re-registered for use in the United States. We cannot predict the outcome or the severity of the effect of the EPA’s continuing evaluations.
In addition, the use of certain herbicide and pesticide products is regulated by various federal, state, provincial and local environmental and public health agencies. We may be unable to prevent violations of these or other regulations from occurring. Even if we are able to comply with all such regulations and obtain all necessary registrations and licenses, the herbicides and pesticides or other products we supply could be alleged to cause injury to the environment, to people or to animals, or such products could be banned in certain circumstances. The regulations may also apply to customers who may fail to comply with environmental, health and safety laws and subject us to liabilities. Costs to comply with environmental, health and safety laws, or to address liabilities or obligations thereunder, could have a material adverse impact on our reputation, business, financial position, results of operations and cash flows.
25
Our business exposes us to risks associated with hazardous materials and related activities, not all of which are covered by insurance.
Because our business includes the managing, handling, storing, selling and transporting and disposing of certain hazardous materials, such as fertilizers, herbicides, pesticides, fungicides and rodenticides, we are exposed to environmental, health, safety and other risks. We carry insurance to protect us against many accident-related risks involved in the conduct of our business and we maintain insurance coverage in accordance with our assessment of the risks involved, the ability to bear those risks and the cost and availability of insurance. Each of these insurance policies is subject to exclusions, deductibles and coverage limits. We do not insure against all risks and may not be able to insure adequately against certain risks and may not have insurance coverage that will pay any particular claim. We also may be unable to obtain at commercially reasonable rates in the future adequate insurance coverage for the risks we currently insure against, and certain risks are or could become completely uninsurable or eligible for coverage only to a reduced extent. Our business, financial condition and results of operations could be materially impaired by environmental, health, safety and other risks that reduce our revenues, increase our costs or subject us to other liabilities in excess of available insurance.
The nature of our business exposes us to construction defect and product liability claims as well as other legal proceedings.
We rely on manufacturers and other suppliers to provide us with the products we sell and distribute. As we do not have direct control over the quality of the products manufactured or supplied by such third-party suppliers, we are exposed to risks relating to the quality of the products we distribute. It is possible that inventory from a manufacturer or supplier could be sold to our customers and later be alleged to have quality problems or to have caused personal injury, subjecting us to potential claims from customers or third parties. We have been subject to such claims in the past, which have been resolved without material financial impact.
We operate a large fleet of trucks and other vehicles. From time to time, the drivers of these vehicles are involved in accidents which could result in material personal injuries and property damage claims and in which goods carried by these drivers may be lost or damaged.
We cannot make assurances that we will be able to obtain insurance coverage to address a portion of these types of liabilities on acceptable terms in the future, if at all, or that any such insurance will provide adequate coverage against potential claims. Further, while we seek indemnification against potential liability for products liability claims from relevant parties, including but not limited to manufacturers and suppliers, we do not have written indemnification agreements from all of our suppliers and we may be unable to recover under such indemnification agreements that exist. An unsuccessful product liability defense could be highly costly and accordingly result in a decline in revenues and profitability. Finally, even if we are successful in defending any claim relating to the products we distribute, claims of this nature could negatively impact customer confidence in our products and our company.
From time to time, we may be involved in government inquiries and investigations, as well as employment, tort proceedings, including toxic tort actions, and other litigation. We cannot predict with certainty the outcomes of these legal proceedings and other contingencies, including environmental investigation, remediation and other proceedings commenced by government authorities. The outcome of some of these legal proceedings and other contingencies could require us to take, or refrain from taking, actions which could adversely affect our operations or could require us to pay substantial amounts of money. Additionally, defending against lawsuits and proceedings may involve significant expense and diversion of management’s attention and resources from other matters regardless of the ultimate outcome.
We rely on our computer and data processing systems, and a large-scale malfunction or failure in our information technology systems could disrupt our business, create potential liabilities for us or limit our ability to effectively monitor, operate and control our operations and adversely impact our reputation, business, financial position, results of operations and cash flows.
Our ability to keep our business operating effectively depends on the functional and efficient operation of our enterprise resource planning, telecommunications, inventory tracking, billing and other information systems. We rely on these systems to track transactions, billings, payments and inventory, as well as to make a variety of day-to-day business decisions. We may experience system malfunctions, interruptions or security breaches from time to time. Our systems also run older generations of software that may be unable to perform as efficiently as, and fail to communicate well with, newer systems. We are in the process of upgrading our management information technology systems. As we implement or develop new systems in the future, we may elect to modify, replace or discontinue certain technology initiatives, which could result in write-downs, and changes or modifications to our information technology systems could cause disruptions to our operations or cause challenges with respect to our compliance with laws, regulations or other applicable standards.
A significant or large-scale malfunction, interruption or security breach of our systems could adversely affect our ability to manage and keep our operations running efficiently and damage our reputation. A malfunction that results in a wider or sustained disruption to our business could have a material adverse effect on our business, financial condition and results of operations, as well as on the ability of management to align and optimize technology to implement business strategies. A security breach might also lead to violations of privacy laws, regulations, trade guidelines or practices related to our customers and associates and could result in potential claims from
26
customers, associates, shareholders or regulatory agencies. If our disaster recovery plans do not work as anticipated, or if any third-party vendors to which we have outsourced certain information technology or other services fail to fulfill their obligations to us, our operations may be adversely impacted and any of these circumstances could adversely impact our reputation, business, financial position, results of operations and cash flows.
If we fail to protect the security of personal information about our customers, we could be subject to interruption of our business operations, private litigation, reputational damage and costly penalties.
We rely on, among other things, commercially available systems, software, tools and monitoring to provide security for collecting, processing, transmitting and storing confidential customer information, such as payment card and personally identifiable information. The systems we currently use for payment card transactions, and the technology utilized in payment cards themselves, all of which can put payment card data at risk, are central to meeting standards set by the payment card industry, or PCI. We continue to evaluate and modify our systems and protocols for PCI compliance purposes; however PCI data security standards may change from time to time. Activities by third parties, advances in computer and software capabilities and encryption technology, new tools and discoveries and other events or developments may facilitate or result in a compromise or breach of our systems. Any compromises, breaches or errors in application related to our systems or failures to comply with data security standards set by the PCI could cause damage to our reputation and interruptions in our operations, including our customers’ ability to pay for our products and services by credit card or their willingness to purchase our products and services, and could further result in a violation of applicable laws, regulations, orders, industry standards or agreements and subject us to costs, penalties, litigation and liabilities which could have a material adverse impact on our reputation, business, financial position, results of operations and cash flows.
We may not be able to adequately protect our intellectual property and other proprietary rights that are material to our business.
Our ability to compete effectively depends in part on our rights to service marks, trademarks, trade names and other intellectual property rights we own or license, particularly our registered brand names SiteOne and LESCO. We have not sought to register or protect every one of our marks or brand names either in the United States or in every country in which they are or may be used. Furthermore, because of the differences in foreign trademark, patent and other intellectual property or proprietary rights laws, we may not receive the same protection in other countries as we would in the United States. If we are unable to protect our proprietary information and brand names, we could suffer a material adverse impact on our reputation, business, financial position, results of operations and cash flows. Litigation may be necessary to enforce our intellectual property rights and protect our proprietary information, or to defend against claims by third parties that our products, services or activities infringe their intellectual property rights.
The requirements of being a public company, including compliance with the reporting requirements of the Exchange Act and the requirements of the Sarbanes-Oxley Act and the NYSE, may strain our resources, increase our costs and distract management, and we may be unable to comply with these requirements in a timely or cost-effective manner.
Our initial public offering was completed on May 17, 2016. Prior to that, we operated as a private company since our separation from Deere, and before that operated as a subsidiary of Deere. As a public company, we face significant legal, accounting, compliance and other expenses that we did not incur as a private company. We are obligated to file annual and quarterly information and other reports with the SEC, as required by the Securities Exchange Act of 1934, as amended, or the Exchange Act, and applicable SEC rules. We are also subject to other reporting and corporate governance requirements, including certain requirements of the NYSE, which impose significant compliance obligations upon us and increase our operating costs. Among other things, we instituted a comprehensive compliance function related to various regulations, established additional internal policies and controls and are required to prepare financial statements that are compliant with SEC reporting requirements on a timely basis, draft a proxy statement and hold annual meetings of stockholders, appoint independent directors, comply with additional corporate governance matters and utilize outside counsel and accountants in the above activities.
The Sarbanes-Oxley Act of 2002 and the Dodd-Frank Wall Street Reform and Consumer Protection Act, as well as rules subsequently implemented by the SEC and the NYSE, have imposed increased regulation and disclosure obligations and have required enhanced corporate governance practices of public companies. Our efforts to comply with evolving laws, regulations and standards are likely to result in increased administrative expenses and a diversion of management’s time and attention from sales-generating activities. These changes require a significant commitment of additional resources. We may not be successful in complying with these requirements. If we do not comply with such requirements, we might be subject to sanctions or investigation by regulatory authorities, such as the SEC or the NYSE. Any such action could harm our reputation and the confidence of investors and could materially adversely affect our business and cause our stock price to decline.
These changes also place additional demands on our finance and accounting staff and on our financial accounting and information systems. Other expenses associated with being a public company include increases in auditing, accounting and legal fees and expenses, investor relations expenses, increased directors’ fees and director and officer liability insurance costs, registrar and transfer agent fees
27
and listing fees, as well as other expenses. As a public company, we are required, among other things, to define and expand the roles and the duties of our board of directors and its committees and institute more comprehensive compliance and investor relations functions.
Any deficiencies in our financial reporting or internal controls could adversely affect our business and the trading price of our common stock.
As a public company, we are required to maintain internal control over financial reporting and to report any material weaknesses in such internal controls. Section 404 of the Sarbanes-Oxley Act requires that we evaluate and determine the effectiveness of our internal control over financial reporting. Beginning with our second annual report following our initial public offering, we will be required to provide a management report on internal control over financial reporting.
If we have a material weakness in our internal control over financial reporting, we may not detect errors on a timely basis and our financial statements may be materially misstated. In addition, our internal control over financial reporting may not prevent or detect all errors and fraud. Because of the inherent limitations in all control systems, no evaluation of controls can provide absolute assurance that misstatements due to error or fraud will not occur or that all control issues and instances of fraud will be detected.
If there are material weaknesses or failures in our ability to meet any of the requirements related to the maintenance and reporting of our internal controls, investors may lose confidence in the accuracy and completeness of our financial reports, which in turn could cause the price of our common stock to decline. Moreover, effective internal controls are necessary to produce reliable financial reports and to prevent fraud. If we have deficiencies in our internal controls, it may negatively impact our business, results of operations and reputation. In addition, we could become subject to investigations by the NYSE, the SEC or other regulatory authorities, which could require additional management attention and which could adversely affect our business.
We may be subject to securities litigation, which is expensive and could divert management attention and resources from our business.
Our share price may be volatile and, in the past, companies that have experienced volatility in the market price of their stock have been subject to securities class action litigation. We may be the target of this type of litigation in the future. Litigation of this type could result in substantial costs and diversion of management’s attention and resources, which could adversely impact our business. Any adverse determination in litigation could also subject us to significant liabilities.
Risks Related to Our Substantial Indebtedness
We have substantial indebtedness and may incur substantial additional indebtedness, which could adversely affect our financial health and our ability to obtain financing in the future, react to changes in our business or satisfy our obligations.
As of January 1, 2017 we had $388.9 million aggregate principal amount of total long-term consolidated indebtedness outstanding and $11.0 million of capital leases.
Landscape Holding and Landscape are parties to a credit agreement dated December 23, 2013, which has been amended pursuant to Amendment No. 1 dated June 13, 2014, Amendment No. 2 dated January 26, 2015, Amendment No. 3 dated February 13, 2015 and Amendment No. 4 dated October 20, 2015 (such agreement, as so amended, the “ABL Credit Agreement”), providing for an asset-based loan facility in the amount of up to $325.0 million, subject to availability under a borrowing base, with UBS AG, Stamford Branch, as administrative agent and collateral agent, and the other financial institutions and lenders from time to time party thereto (the “ABL Facility”).
Landscape Holding and Landscape are parties to an amended and restated credit agreement dated April 29, 2016, providing for a senior secured term loan facility in the amount of $275.0 million with UBS AG, Stamford Branch, as administrative agent and collateral agent, and the other financial institutions and lenders from time to time party thereto (the “Term Loan Facility” and, together with the ABL Facility, the “Credit Facilities”). On November 23, 2016, we amended our Term Loan Facility to increase the aggregate principal amount to $298.6 million and used the proceeds to, among other things, repay $21.0 million of borrowings under our ABL Facility. See Item 7, “Management’s Discussion and Analysis of Financial Condition and Results of Operations-Term Loan Facility Amendments.”
In addition, we are able to incur additional indebtedness in the future, subject to the limitations contained in the agreements governing our indebtedness. Our substantial indebtedness could have important consequences to you. Because of our substantial indebtedness:
|
•
|
our ability to engage in acquisitions without raising additional equity or obtaining additional debt financing is limited;
|
28
|
•
|
our ability to obtain additional financing for working capital, capital expenditures, acquisitions, debt service requirements or general corporate purposes and our ability to satisfy our obligations with respect to our indebtedness may be impaired in the future;
|
|
•
|
a large portion of our cash flow from operations must be dedicated to the payment of principal and interest on our indebtedness, thereby reducing the funds available to us for other purposes;
|
|
•
|
we are exposed to the risk of increased interest rates because borrowings under the Credit Facilities and certain floating rate operating and capital leases are at variable rates of interest;
|
|
•
|
it may be more difficult for us to satisfy our obligations to our creditors, resulting in possible defaults on, and acceleration of, such indebtedness;
|
|
•
|
we may be more vulnerable to general adverse economic and industry conditions;
|
|
•
|
we may be at a competitive disadvantage compared to our competitors with proportionately less indebtedness or with comparable indebtedness on more favorable terms and, as a result, they may be better positioned to withstand economic downturns;
|
|
•
|
our ability to refinance indebtedness may be limited or the associated costs may increase;
|
|
•
|
our flexibility to adjust to changing market conditions and ability to withstand competitive pressures could be limited; and
|
|
•
|
we may be prevented from carrying out capital spending and restructurings that are necessary or important to our growth strategy and efforts to improve operating margins of our businesses.
|
Increases in interest rates would increase the cost of servicing our indebtedness and could reduce our profitability.
Our indebtedness under the Credit Facilities bears interest at variable rates, and as a result, increases in interest rates would increase the cost of servicing our indebtedness and could materially reduce our profitability and cash flows. As of January 1, 2017 each one percentage point change in interest rates would result in an approximately $0.9 million change in the annual interest expense on the amount outstanding under the ABL Facility. As of January 1, 2017, each one percentage point change in interest rates would result in an approximately $3.0 million change in the annual interest expense on the Term Loan Facility. The impact of increases in interest rates could be more significant for us than it would be for some other companies because of our substantial indebtedness.
A lowering or withdrawal of the ratings, outlook or watch assigned to our debt securities by rating agencies may increase our future borrowing costs and reduce our access to capital.
The ratings, outlook or watch assigned to our indebtedness could be lowered or withdrawn entirely by a rating agency if, in that rating agency’s judgment, current or future circumstances relating to the basis of the rating, outlook, or watch such as adverse changes to our business, so warrant. Based on the financial performance of our businesses and the outlook for future years, our credit ratings, outlook or watch could be negatively impacted. Any lowering of our ratings, outlook or watch likely would make it more difficult or more expensive for us to obtain additional debt financing.
The agreements and instruments governing our indebtedness contain restrictions and limitations that could significantly impact our ability to operate our business.
Our Credit Facilities contain customary representations and warranties and customary affirmative and negative covenants that restrict some of our activities. The negative covenants limit the ability of Landscape Holding and Landscape to:
|
•
|
incur additional indebtedness;
|
|
•
|
pay dividends, redeem stock or make other distributions;
|
|
•
|
repurchase, prepay or redeem subordinated indebtedness;
|
|
•
|
make investments;
|
|
•
|
create restrictions on the ability of Landscape Holding’s restricted subsidiaries to pay dividends or make other intercompany transfers;
|
|
•
|
create liens;
|
|
•
|
transfer or sell assets;
|
|
•
|
make negative pledges;
|
|
•
|
consolidate, merge, sell or otherwise dispose of all or substantially all of Landscape Holding’s assets;
|
|
•
|
enter into certain transactions with affiliates; and
|
|
•
|
designate subsidiaries as unrestricted subsidiaries.
|
In addition, the ABL Facility is subject to various covenants requiring minimum financial ratios, and our additional borrowings may be limited by these financial ratios. Our ability to comply with the covenants and restrictions contained in the Credit Facilities, may be affected by economic, financial and industry conditions beyond our control including credit or capital market disruptions. The breach of any of these covenants or restrictions could result in a default that would permit the applicable lenders to declare all amounts outstanding thereunder to be due and payable, together with accrued and unpaid interest. If we are unable to repay indebtedness, lenders having secured obligations, such as the lenders under the Credit Facilities, could proceed against the collateral securing the indebtedness. In any
29
such case, we may be unable to borrow under the Credit Facilities and may not be able to repay the amounts due under such facilities. This could have serious consequences to our financial position and results of operations and could cause us to become bankrupt or insolvent.
Our ability to generate the significant amount of cash needed to pay interest and principal on our indebtedness and our ability to refinance all or a portion of our indebtedness or obtain additional financing depends on many factors beyond our control.
Our ability to make scheduled payments on, or to refinance our obligations under, our indebtedness depends on the financial and operating performance of our subsidiaries, which, in turn, depends on their results of operations, cash flows, cash requirements, financial position and general business conditions and any legal and regulatory restrictions on the payment of dividends to which they may be subject, many of which may be beyond our control.
We may be unable to maintain a level of cash flows from operating activities sufficient to permit us to pay the principal and interest on our indebtedness. If our cash flow and capital resources are insufficient to fund our debt service obligations, we may be forced to reduce or delay capital expenditures, sell assets, seek to obtain additional equity capital or restructure our indebtedness. In the future, our cash flow and capital resources may not be sufficient for payments of interest on and principal of our indebtedness, and such alternative measures may not be successful and may not permit us to meet our scheduled debt service obligations.
The final maturity date of the ABL Facility is October 20, 2020. The final maturity date of the Term Loan Facility is April 29, 2022. We may be unable to refinance any of our indebtedness or obtain additional financing, particularly because of our high levels of indebtedness. Market disruptions, such as those experienced in 2008 and 2009, as well as our significant indebtedness levels, may increase our cost of borrowing or adversely affect our ability to refinance our obligations as they become due. If we are unable to refinance our indebtedness or access additional credit, or if short-term or long-term borrowing costs dramatically increase, our ability to finance current operations and meet our short-term and long-term obligations could be adversely affected.
Risks Related to Our Common Stock
Holdings is a holding company with no operations of its own, and it depends on its subsidiaries for cash to fund all of its operations and expenses, including to make future dividend payments, if any.
Our operations are conducted entirely through our subsidiaries, and our ability to generate cash to fund operations and expenses, to pay dividends or to meet debt service obligations is highly dependent on the earnings and the receipt of funds from our subsidiaries through dividends or intercompany loans. Deterioration in the financial condition, earnings or cash flow of Landscape and its subsidiaries for any reason could limit or impair their ability to pay such distributions. Additionally, to the extent that Holdings needs funds, and its subsidiaries are restricted from making such distributions under applicable law or regulation or under the terms of our financing arrangements, or are otherwise unable to provide such funds, it could materially adversely affect our business, financial condition, results of operations and cash flows.
Further, the terms of the agreements governing the Credit Facilities restrict the ability of our subsidiaries to pay dividends, make loans or otherwise transfer assets to Holdings. Furthermore, our subsidiaries are permitted under the terms of the Credit Facilities and other indebtedness to incur additional indebtedness that may restrict or prohibit the making of distributions, the payment of dividends or the making of loans by such subsidiaries to us. In addition, Delaware law may impose requirements that may restrict our ability to pay dividends to holders of our common stock.
We do not currently expect to declare or pay dividends on our common stock for the foreseeable future. Payments of dividends, if any, will be at the sole discretion of our board of directors after taking into account various factors, including general and economic conditions, our financial condition and operating results, our available cash and current and anticipated cash needs, capital requirements, contractual, legal, tax and regulatory restrictions and implications of the payment of dividends by us to our stockholders or by our subsidiaries (including Landscape) to us, and such other factors as our board of directors may deem relevant. In addition, Delaware law may impose requirements that may restrict our ability to pay dividends to holders of our common stock. To the extent that we determine in the future to pay dividends on our common stock, none of our subsidiaries will be obligated to make funds available to us for the payment of dividends.
The market price of our common stock may be volatile.
The market price of our common stock may fluctuate significantly. Among the factors that could affect our stock price are:
|
•
|
industry or general market conditions;
|
|
•
|
domestic and international economic factors unrelated to our performance;
|
|
•
|
changes in our customers’ or their end-users’ preferences;
|
30
|
•
|
new regulatory pronouncements and changes in regulatory guidelines;
|
|
•
|
lawsuits, enforcement actions and other claims by third parties or governmental authorities;
|
|
•
|
actual or anticipated fluctuations in our quarterly operating results;
|
|
•
|
changes in securities analysts’ estimates of our financial performance or lack of research coverage and reports by industry analysts;
|
|
•
|
action by institutional stockholders or other large stockholders (including the CD&R Investor and Deere), including future sales;
|
|
•
|
failure to meet any guidance given by us or any change in any guidance given by us, or changes by us in our guidance practices;
|
|
•
|
announcements by us of significant impairment charges;
|
|
•
|
speculation in the press or investment community;
|
|
•
|
investor perception of us and our industry;
|
|
•
|
changes in market valuations or earnings of similar companies;
|
|
•
|
announcements by us or our competitors of significant contracts, acquisitions, dispositions or strategic partnerships;
|
|
•
|
war, terrorist acts and epidemic disease;
|
|
•
|
any future sales of our common stock or other securities; and
|
|
•
|
additions or departures of key personnel.
|
In particular, we cannot assure you that you will be able to resell your shares at or above your purchase price. The stock markets have experienced extreme volatility in recent years that has been unrelated to the operating performance of particular companies. These broad market fluctuations may adversely affect the trading price of our common stock. In the past, following periods of volatility in the market price of a company’s securities, class action litigation has often been instituted against the affected company. Any litigation of this type brought against us could result in substantial costs and a diversion of our management’s attention and resources, which would harm our business, results of operations, financial condition and cash flows.
Future sales of shares by us or our existing stockholders could cause our stock price to decline.
Sales of substantial amounts of our common stock in the public market, or the perception that these sales could occur, could cause the market price of our common stock to decline. These sales, or the possibility that these sales may occur, also might make it more difficult for us to sell equity securities in the future at a time and at a price that we deem appropriate.
As of March 10, 2017, we had 39,585,917 shares of common stock outstanding. Of these shares, all of the 11,500,000 shares sold in our initial public offering, and the 10,350,000 shares sold in the November 2016 secondary offering by certain of our stockholders are freely transferable without restriction or further registration under the Securities Act of 1933 (the “Securities Act”), except for any shares held by “affiliates,” as that term is defined in Rule 144 under the Securities Act. In May 2016, we filed a registration statement on Form S-8 under the Securities Act to register the shares of common stock to be issued under our equity compensation plans and, as a result, all shares of common stock acquired upon exercise of stock options granted under our plans are also freely tradable under the Securities Act, unless purchased by our affiliates. As of January 1, 2017, there were stock options outstanding to purchase a total of 3,162,642 shares of our common stock, 18,973 shares of our common stock subject to restricted stock units (“RSUs”) and 26,020 shares of our common stock subject to deferred stock units (“DSUs”). In addition, as of January 1, 2017, 1,748,464 shares of our common stock were reserved for future issuance under our Omnibus Incentive Plan.
17,692,239 shares of common stock outstanding as of January 1, 2017 are restricted securities within the meaning of Rule 144 under the Securities Act, but will be eligible for resale subject to applicable volume, means of sale, holding period and other limitations of Rule 144 under the Securities Act or pursuant to an exemption from registration under Rule 701 under the Securities Act.
In addition, our significant stockholders may distribute shares that they hold to their investors who themselves may then sell into the public market. Such sales may not be subject to the volume, manner of sale, holding period and other limitations of Rule 144 under the Securities Act. The market price of our common stock could decline if the holders of those shares sell them or are perceived by the market as intending to sell them. Furthermore, the CD&R Investor and Deere have the right to require us to register shares of common stock for resale in certain circumstances.
In the future, we may issue additional shares of common stock or other equity or debt securities convertible into common stock in connection with a financing, acquisition, litigation settlement or associate arrangement or otherwise. Any of these issuances could result in substantial dilution to our existing stockholders and could cause the trading price of our common stock to decline.
If securities or industry analysts do not publish research or publish misleading or unfavorable research about our business, our stock price and trading volume could decline.
The trading market for our common stock depends in part on the research and reports that securities or industry analysts publish about us or our business. If one or more of the analysts that cover our common stock downgrade our stock or publish misleading or unfavorable research about our business, our stock price may decline. If one or more of these analysts ceases coverage of our company
31
or fails to publish reports on us regularly, demand for our stock could decrease, which could cause our stock price or trading volume to decline.
A few significant stockholders will have significant influence over us and may not always exercise their influence in a way that benefits our public stockholders.
As of March 10, 2017, the CD&R Investor and Deere hold approximately 27.9% and 14.9%, respectively, of the outstanding shares of our common stock. In connection with our initial public offering in May 2016 we, the CD&R Investor and Deere entered into an amendment and restatement to our existing stockholders agreement, or the amended stockholders agreement, pursuant to which the CD&R Investor and Deere agreed to vote in favor of one another’s designees to our board of directors, among other matters. As a result, the CD&R Investor and Deere will continue to exercise significant influence over all matters requiring stockholder approval for the foreseeable future, including approval of significant corporate transactions, which may reduce the market price of our common stock.
The CD&R Investor and Deere no longer collectively beneficially own more than 50% of our outstanding common stock. However, they will likely still be able to assert significant influence over our board of directors and certain corporate actions, including the approval of significant corporate transactions such as mergers and the sale of substantially all of our assets. The CD&R Investor will continue to have the right to designate for nomination for election at least 20% of the total number of directors comprising our board of directors at such time as long as the CD&R Investor owns at least 15% but less than 30% of the outstanding shares of our common stock; and at least 10% of the total number of directors comprising our board of directors at such time as long as the CD&R Investor owns at least 5% but less than 15% of the outstanding shares of our common stock. Deere will continue to have the right to designate for nomination for election at least 10% of the total number of directors comprising our board of directors at such time as long as Deere owns at least 5% but less than 15% of the outstanding shares of our common stock.
Because the CD&R Investor’s and Deere’s interests may differ from your interests, actions the CD&R Investor and Deere take as our significant stockholders may not be favorable to you. For example, the concentration of ownership held by the CD&R Investor and Deere could delay, defer or prevent a change of control of us or impede a merger, takeover or other business combination which another stockholder may otherwise view favorably. Other potential conflicts could arise, for example, over matters such as employee retention or recruiting, or on our dividend policy.
Under our amended and restated certificate of incorporation, the CD&R Investor and Deere and their respective affiliates and, in some circumstances, any of our directors and officers who is also a director, officer, employee, member or partner of the CD&R Investor or Deere and their respective affiliates, have no obligation to offer us corporate opportunities.
The policies relating to corporate opportunities and transactions with the CD&R Investor or Deere set forth in our second amended and restated certificate of incorporation, or amended and restated certificate of incorporation, address potential conflicts of interest between Holdings, on the one hand, and the CD&R Investor or Deere and their respective officers, directors, employees, members or partners who are directors or officers of our company, on the other hand. In accordance with those policies, the CD&R Investor and Deere may pursue corporate opportunities, including acquisition opportunities that may be complementary to our business, without offering those opportunities to us. Any person purchasing or otherwise acquiring any interest in common stock of Holdings will be deemed to have notice of and have consented to these provisions of our amended and restated certificate of incorporation. Although these provisions are designed to resolve conflicts between us and the CD&R Investor or Deere and their respective affiliates fairly, conflicts may not be so resolved.
Future offerings of debt or equity securities may adversely affect the market price of our common stock.
If, in the future, we decide to issue debt or equity securities that rank senior to our common stock, it is likely that such securities will be governed by an indenture or other instrument containing covenants restricting our operating flexibility. Additionally, any convertible or exchangeable securities that we issue in the future may have rights, preferences and privileges more favorable than those of our common stock and may result in dilution to owners of our common stock. We and, indirectly, our stockholders, will bear the cost of issuing and servicing such securities. Because our decision to issue debt or equity securities in any future offering will depend on market conditions and other factors beyond our control, we cannot predict or estimate the amount, timing or nature of our future offerings. Thus, holders of our common stock will bear the risk of our future offerings reducing the market price of our common stock and diluting the value of their stock holdings in us.
Anti-takeover provisions in our amended and restated certificate of incorporation and amended and restated by-laws could discourage, delay or prevent a change of control of our company and may affect the trading price of our common stock.
Our amended and restated certificate of incorporation and second amended and restated by-laws, or amended and restated by-laws, include a number of provisions that may discourage, delay or prevent a change in our management or control over us that stockholders may consider favorable. For example, our amended and restated certificate of incorporation and amended and restated by-laws collectively:
32
|
•
|
authorize the issuance of “blank check” preferred stock that could be issued by our board of directors to thwart a takeover attempt;
|
|
•
|
provide for a classified board of directors, which divides our board of directors into three classes, with members of each class serving staggered three-year terms, which prevents stockholders from electing an entirely new board of directors at an annual meeting;
|
|
•
|
limit the ability of stockholders to remove directors if the CD&R Investor and Deere cease to own at least 40% of the outstanding shares of our common stock;
|
|
•
|
provide that vacancies on our board of directors, including vacancies resulting from an enlargement of our board of directors, may be filled only by a majority vote of directors then in office;
|
|
•
|
prohibit stockholders from calling special meetings of stockholders if the CD&R Investor and Deere cease to own at least 40% of the outstanding shares of our common stock;
|
|
•
|
prohibit stockholder action by written consent, thereby requiring all actions to be taken at a meeting of the stockholders, if the CD&R Investor and Deere cease to own at least 40% of the outstanding shares of our common stock;
|
|
•
|
establish advance notice requirements for nominations of candidates for election as directors or to bring other business before an annual meeting of our stockholders; and
|
|
•
|
require the approval of holders of at least 66 2⁄3% of the outstanding shares of our common stock to amend our amended and restated by-laws and certain provisions of our amended and restated certificate of incorporation if the CD&R Investor and Deere cease to own at least 40% of the outstanding shares of our common stock.
|
These provisions may prevent our stockholders from receiving the benefit from any premium to the market price of our common stock offered by a bidder in a takeover context. Even in the absence of a takeover attempt, the existence of these provisions may adversely affect the prevailing market price of our common stock if the provisions are viewed as discouraging takeover attempts in the future.
Our amended and restated certificate of incorporation and amended and restated by-laws may also make it difficult for stockholders to replace or remove our management. Furthermore, the existence of the foregoing provisions, as well as the significant amount of common stock that the CD&R Investor and Deere own, could limit the price that investors might be willing to pay in the future for shares of our common stock. These provisions may facilitate management entrenchment that may delay, deter, render more difficult or prevent a change in our control, which may not be in the best interests of our stockholders.
We do not intend to pay dividends on our common stock and, consequently, your ability to achieve a return on your investment will depend on appreciation in the price of our common stock.
We do not intend to declare and pay dividends on our common stock for the foreseeable future. We currently intend to invest our future earnings, if any, to service our debt, to fund our growth, to develop our business, for working capital needs and for general corporate purposes. Therefore, you are not likely to receive any dividends on your common stock for the foreseeable future and the success of an investment in shares of our common stock will depend upon any future appreciation in their value. There is no guarantee that shares of our common stock will appreciate in value or even maintain the price at which our stockholders have purchased their shares. In addition, Holdings’ operations are conducted entirely through our subsidiaries. As such, to the extent that we determine in the future to pay dividends on our common stock, none of our subsidiaries will be obligated to make funds available to Holdings for the payment of dividends. Further, the agreements governing the Credit Facilities significantly restrict the ability of our subsidiaries to pay dividends or otherwise transfer assets to us.
We are no longer a “controlled company” within the meaning of the NYSE rules. However, we may continue to rely on exemptions from certain corporate governance requirements during a one-year transition period.
After the completion of the November 2016 secondary offering, the CD&R Investor and Deere no longer control a majority of the voting power of our outstanding common stock. Accordingly, we are no longer a “controlled company” within the meaning of the NYSE corporate governance standards. Consequently, the NYSE rules will require that we (i) have a majority of independent directors on our board of directors within one year of the date we no longer qualified as a “controlled company”; (ii) have Compensation and Nominating and Corporate Governance Committees composed entirely of independent directors within one year of such date and (iii) perform an annual performance evaluation of the Nominating and Corporate Governance and Compensation Committees. During this transition period, we may continue to utilize the available exemptions from certain corporate governance requirements as permitted by the NYSE rules. Accordingly, during the transition period you will not have the same protections afforded to stockholders of companies that are subject to all of the corporate governance requirements of the NYSE.
33
Our amended and restated certificate of incorporation designates the Court of Chancery of the State of Delaware as the exclusive forum for certain litigation that may be initiated by our stockholders, which could limit our stockholders’ ability to obtain a favorable judicial forum for disputes with us.
Our amended and restated certificate of incorporation provides that the Court of Chancery of the State of Delaware is, to the fullest extent permitted by law, the sole and exclusive forum for (i) any derivative action or proceeding brought on our behalf, (ii) any action asserting a claim of breach of a fiduciary duty owed to us or our stockholders by any of our directors, officers, other employees, agents or stockholders, (iii) any action asserting a claim arising out of or under the General Corporation Law of the State of Delaware, or the DGCL, or as to which the DGCL confers jurisdiction on the Court of Chancery of the State of Delaware (including, without limitation, any action asserting a claim arising out of or pursuant to our amended and restated certificate of incorporation or our amended and restated by-laws) or (iv) any action asserting a claim that is governed by the internal affairs doctrine. By becoming a stockholder in our company, you will be deemed to have notice of and have consented to the provisions of our amended and restated certificate of incorporation related to choice of forum. The choice of forum provision in our amended and restated certificate of incorporation may limit our stockholders’ ability to obtain a favorable judicial forum for disputes with us or any of our directors, officers, other employees, agents or stockholders, which may discourage lawsuits with respect to such claims. Alternatively, if a court were to find the choice of forum provision contained in our amended and restated certificate of incorporation to be inapplicable or unenforceable in an action, we may incur additional costs associated with resolving such action in other jurisdictions, which could harm our business, results of operations and financial condition.
Not applicable.
Our corporate headquarters is located on leased premises at 300 Colonial Center Parkway, Suite 600, Roswell, Georgia 30076. Our corporate headquarters is approximately 43,000 square feet and the lease will expire in April 2026.
We and our operating companies own and lease a variety of facilities in 45 states and five provinces for branch operations, offices and storage. We primarily lease 5,000 to 15,000 square foot facilities in both freestanding and multi-tenant buildings, with secured outside storage yards averaging from 10,000 to 20,000 square feet in some branches. In addition, we entered into an operating lease for a distribution center and commenced shipping operations during the first quarter of 2017. The significant majority of our facilities are subject to operating leases, and we own 16 properties. As of March 10, 2017, we operated 469 branches in the following locations:
34
|
State /Province
|
Number of Locations
|
State /Province
|
Number of Locations
|
|||
|
California
|
51
|
Wisconsin
|
5
|
|||
|
Florida
|
48
|
Colorado
|
4
|
|||
|
Texas
|
35
|
Oregon
|
4
|
|||
|
North Carolina
|
31
|
Utah
|
4
|
|||
|
Massachusetts
|
20
|
Hawaii
|
3
|
|||
|
Michigan
|
18
|
Idaho
|
3
|
|||
|
New Jersey
|
18
|
Kentucky
|
3
|
|||
|
Illinois
|
18
|
Nebraska
|
3
|
|||
|
New York
|
16
|
New Hampshire
|
3
|
|||
|
Georgia
|
15
|
Iowa
|
2
|
|||
|
Ohio
|
14
|
Louisiana
|
2
|
|||
|
South Carolina
|
14
|
Arkansas
|
1
|
|||
|
Connecticut
|
13
|
Delaware
|
1
|
|||
|
Virginia
|
13
|
Maine
|
1
|
|||
|
Maryland
|
11
|
Mississippi
|
1
|
|||
|
Pennsylvania
|
11
|
Nevada
|
1
|
|||
|
Tennessee
|
11
|
New Mexico
|
1
|
|||
|
Indiana
|
10
|
North Dakota
|
1
|
|||
|
Missouri
|
10
|
Rhode Island
|
1
|
|||
|
Alabama
|
8
|
South Dakota
|
1
|
|||
|
Minnesota
|
6
|
British Columbia
|
4
|
|||
|
Oklahoma
|
6
|
Ontario
|
4
|
|||
|
Arizona
|
5
|
Alberta
|
2
|
|||
|
Kansas
|
5
|
Manitoba
|
1
|
|||
|
Washington
|
5
|
Saskatchewan
|
1
|
|||
We are not currently involved in any material litigation or arbitration. We anticipate that, similar to the rest of the landscape supply industry, we will be subject to litigation and arbitration from time to time in the ordinary course of business. At this time, we do not expect any of these proceedings to have a material effect on our reputation, business, financial position, results of operations or cash flows. However, we can give no assurance that the results of any such proceedings will not materially affect our reputation, business, financial position, results of operations and cash flows.
Not applicable.
35
Common Stock Market Prices
Shares of our common stock have traded on the NYSE under the symbol “SITE” since May 12, 2016. Prior to that date, there was no market for our common stock. The range of high and low sale prices of our common stock as reported by the NYSE is set forth in the table below:
|
High Sales Price
|
Low Sales Price
|
|||||||
|
2016:
|
||||||||
|
Second quarter (beginning May 12, 2016)
|
$
|
35.17
|
|
$
|
21.00
|
|
||
|
Third quarter
|
$
|
40.56
|
|
$
|
34.78
|
|
||
|
Fourth quarter
|
$
|
36.85
|
|
$
|
29.82
|
|
||
Holders
As of March 10, 2017, there were 18 registered holders of our common stock. The actual number of holders of our common stock is greater than this number of record holders, and includes stockholders who are beneficial owners, but whose shares are held in street name by brokers or other nominees.
Dividends
We do not expect to declare or pay dividends on our common stock for the foreseeable future. Instead, we intend to retain future earnings, if any, to service our debt, finance the growth and development of our business and for working capital and general corporate purposes. Our ability to pay dividends to holders of our common stock in the future will be limited as a practical matter by the Credit Facilities, insofar as we may seek to pay dividends out of funds made available to us by Landscape or its subsidiaries, because Landscape’s debt instruments directly or indirectly restrict Landscape’s ability to pay dividends or make loans to us. Any future determination to pay dividends on our common stock is subject to the discretion of our board of directors and will depend upon various factors, including our results of operations, financial condition, liquidity requirements, capital requirements, level of indebtedness, contractual restrictions with respect to payment of dividends, restrictions imposed by applicable law, general business conditions and other factors that our board of directors may deem relevant. See Item 7, “Management’s Discussion and Analysis of Financial Condition and Results of Operations-Liquidity and Capital Resources-Limitations of Distributions and Dividends by Subsidiaries” for a description of the restrictions on our ability to pay dividends.
Securities Authorized for Issuance Under Equity Compensation Plans
See Item 12, “Security Ownership of Certain Beneficial Owners and Management and Related Stockholder Matters” in this Annual Report on Form 10-K, which information will be set forth in SiteOne’s Proxy Statement for the 2017 Annual Meeting of Stockholders.
36
Stock Performance Graph
This performance graph shall not be deemed “soliciting material” or to be “filed” with the SEC for purposes of Section 18 of the Securities Exchange Act of 1934, as amended (Exchange Act), or otherwise subject to the liabilities under that Section, and shall not be deemed to be incorporated by reference into any of our filings under the Securities Act of 1933, as amended, or the Exchange Act.
The graph below presents the Company’s cumulative total shareholder returns relative to the performance of the NYSE Composite Index, Standard & Poor's MidCap 400 Index and Dow Jones US Industrial Supplier Index for our Fiscal Year 2016, commencing May 12, 2016 (the Company’s initial day of trading). All values assume a $100 initial investment at the opening price of the Company’s common stock on the NYSE and data for the NYSE Composite Index, Standard & Poor's MidCap 400 Index and Dow Jones US Industrial Supplier Index assumes all dividends were reinvested on the date paid. The points on the graph represent fiscal month-end values based on the last trading day of each fiscal month. The comparisons are based on historical data and are not indicative of, nor intended to forecast, the future performance of our common stock.
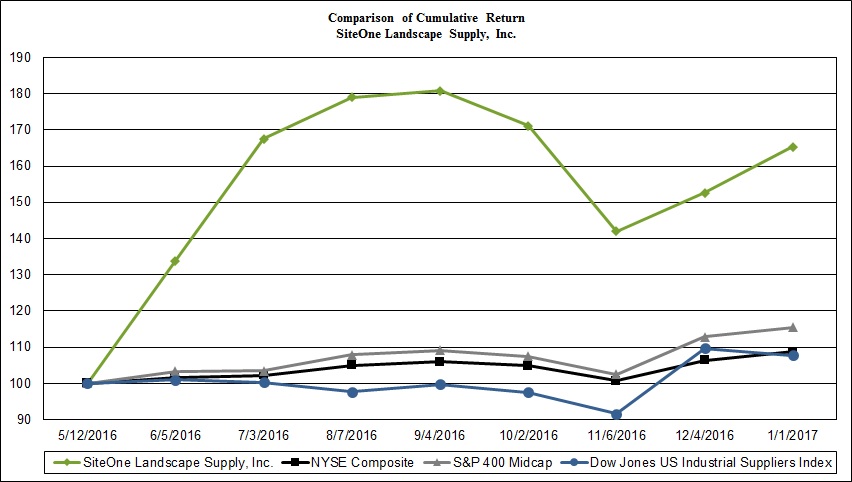
Recent Sales of Unregistered Securities
On May 16, 2016, we issued 25,303,164 shares of our common stock to CD&R Landscapes Holdings, L.P. in exchange for the Preferred Stock then held by CD&R Landscapes Holdings, L.P., in accordance with the terms of the Preferred Stock. Such issuance was deemed to be exempt from registration under the Securities Act in reliance upon Section 3(a)(9) of the Securities Act, as any security exchanged by the issuer with its existing security holders exclusively where no commission or other remuneration is paid or given directly or indirectly for soliciting such exchange. There were no underwriters employed in connection with such issuance.
Use of Proceeds
On May 11, 2016, the Company’s registration statement on Form S-1 (Registration No. 333-206444) relating to an initial public offering (“IPO”) of its common stock was declared effective by the U.S. Securities and Exchange Commission (“SEC”). On May 17, 2016, the Company completed the IPO at a price to the public of $21.00 per share. In connection with the IPO, certain of the Company’s stockholders sold an aggregate of 10,000,000 shares of common stock. The underwriters also exercised their option to purchase an additional 1,500,000 shares of common stock, at the public offering price less the underwriting discounts and commissions. The selling stockholders received all of the net proceeds and bore all commissions and discounts from the sale of the Company’s common stock. The Company did not receive any proceeds from the IPO.
37
On November 29, 2016, the Company’s registration statement on Form S-1 (Registration No. 333-214628) relating to a secondary offering (the “Secondary Offering”) of its common stock was declared effective by the SEC. On December 5, 2016, the Company completed the Secondary Offering at a price to the public of $33.00 per share. In connection with the Secondary Offering, certain of the Company’s stockholders sold an aggregate of 9,000,000 shares of common stock. The underwriters also exercised their option to purchase an additional 1,350,000 shares of common stock at the public offering price less the underwriting discounts and commissions. The selling stockholders received all of the net proceeds and bore all commissions and discounts from the sale of the Company’s common stock. The Company did not receive any proceeds from the Secondary Offering.
Purchases of Equity Securities by Issuer and Affiliates Purchasers
None.
38
The following tables set forth selected historical consolidated and combined financial data as of the dates and for the periods indicated. The selected historical financial data as of January 1, 2017 and January 3, 2016 and for each of the 2016 Fiscal Year, 2015 Fiscal Year and 2014 Fiscal Year have been derived from our audited consolidated financial statements and related notes included in this Annual Report. The selected historical financial data as of December 28, 2014 and for each of the 2013 Successor Period and 2013 Predecessor Period have been derived from our audited consolidated and combined financial statements and related notes not included in this Annual Report. The selected historical financial data as of December 29, 2013, December 22, 2013 and December 30, 2012 and for the fiscal year ended December 30, 2012 have been derived from our unaudited financial statements and related notes not included in this Annual Report on Form 10-K.
For the purpose of discussing our financial results, we refer to ourselves as the “Successor Company” in the periods following the CD&R Acquisition, and the “Predecessor Company” during the periods preceding the CD&R Acquisition.
In the opinion of our management, our condensed consolidated financial statements contain all adjustments, consisting of normal recurring accruals, necessary for a fair statement of our financial position, results of our operations and cash flows. Our historical financial data may not be indicative of our future performance. The selected historical financial and operating data are qualified in their entirety by, and should be read in conjunction with Item 7, “Management’s Discussion and Analysis of Financial Condition and Results of Operations” and our financial statements and related notes included in this Annual Report on Form 10-K.
|
Consolidated Successor Company
|
Combined Predecessor Company
|
|||||||||||||||||||||||
|
Period from December 23, 2013
|
Period from December 31, 2012
|
|||||||||||||||||||||||
|
Year ended
|
through
|
through
|
Year ended
|
|||||||||||||||||||||
|
January 1, 2017
|
January 3, 2016
|
December 28, 2014
|
December 29, 2013
(1)
|
December 22, 2013
|
December 30, 2012
|
|||||||||||||||||||
|
(in millions, except share and per share data)
|
||||||||||||||||||||||||
|
Statement of operations data:
|
||||||||||||||||||||||||
|
Net sales
|
$
|
1,648.2
|
|
$
|
1,451.6
|
|
$
|
1,176.6
|
|
$
|
5.3
|
|
$
|
1,072.7
|
|
$
|
1,062.0
|
|
||||||
|
Cost of goods sold
|
1,132.5
|
|
1,022.5
|
|
865.5
|
|
4.1
|
|
783.0
|
|
744.6
|
|
||||||||||||
|
Gross profit
|
515.7
|
|
429.1
|
|
311.1
|
|
1.2
|
|
289.7
|
|
317.4
|
|
||||||||||||
|
Selling, general and administrative
|
446.5
|
|
373.3
|
|
269.0
|
|
14.1
|
|
235.6
|
|
281.4
|
|
||||||||||||
|
Other income
|
4.8
|
|
4.0
|
|
3.1
|
|
—
|
|
3.6
|
|
5.0
|
|
||||||||||||
|
Operating income (loss)
|
74.0
|
|
59.8
|
|
45.2
|
|
(12.9
|
)
|
57.7
|
|
41.0
|
|
||||||||||||
|
Interest and other non-operating (income) expenses
|
22.1
|
|
11.4
|
|
9.1
|
|
0.1
|
|
0.1
|
|
(9.1
|
)
|
||||||||||||
|
Net income (loss) before taxes
|
51.9
|
|
48.4
|
|
36.1
|
|
(13.0
|
)
|
57.6
|
|
50.1
|
|
||||||||||||
|
Income tax (benefit) expense
|
21.3
|
|
19.5
|
|
14.4
|
|
(3.5
|
)
|
23.9
|
|
(21.0
|
)
|
||||||||||||
|
Net income (loss)
|
$
|
30.6
|
|
$
|
28.9
|
|
$
|
21.7
|
|
$
|
(9.5
|
)
|
$
|
33.7
|
|
$
|
71.1
|
|
||||||
|
Net income (loss) attributable to Successor Company common stock/Predecessor Company equity interests
(2)
|
$
|
(91.4
|
)
|
$
|
(14.8
|
)
|
$
|
(4.0
|
)
|
$
|
(9.8
|
)
|
$
|
33.7
|
|
$
|
64.9
|
|
||||||
|
Net income (loss) per common share:
(3)
|
||||||||||||||||||||||||
|
Basic
|
$
|
(3.01
|
)
|
$
|
(1.04
|
)
|
$
|
(0.29
|
)
|
$
|
(0.73
|
)
|
NM
|
|
NM
|
|
||||||||
|
Diluted
|
$
|
(3.01
|
)
|
$
|
(1.04
|
)
|
$
|
(0.29
|
)
|
$
|
(0.73
|
)
|
NM
|
|
NM
|
|
||||||||
|
Weighted average number of common shares outstanding:
|
||||||||||||||||||||||||
|
Basic
|
30,316,087
|
|
14,209,843
|
|
13,818,138
|
|
13,476,996
|
|
NM
|
|
NM
|
|
||||||||||||
|
Diluted
|
30,316,087
|
|
14,209,843
|
|
13,818,138
|
|
13,476,996
|
|
NM
|
|
NM
|
|
||||||||||||
39
|
Consolidated Successor Company
|
Consolidated Predecessor Company
|
|||||||||||||||||
|
As of
January 1, 2017 |
As of
January 3, 2016 |
As of
December 28, 2014 |
As of
December 29, 2013 |
As of
December 22, 2013 |
As of
December 30, 2012 |
|||||||||||||
|
Balance sheet data:
|
(in millions)
|
|||||||||||||||||
|
Total assets
|
742.6
|
|
668.7
|
|
555.7
|
|
544.4
|
|
567.3
|
|
541.3
|
|
||||||
|
Total debt
(4)
|
375.5
|
|
177.7
|
|
121.7
|
|
154.8
|
|
—
|
|
—
|
|
||||||
|
Redeemable convertible preferred stock
|
—
|
|
216.8
|
|
192.6
|
|
174.0
|
|
—
|
|
—
|
|
||||||
______________
|
(1)
|
The consolidated statement of operations data for the Successor Company is defined as the one week period from December 23, 2013 through December 29, 2013 and includes $9.8 million of non-recurring costs related to the CD&R Acquisition.
|
|
(2)
|
Net income (loss) attributable to common stockholders represents net income (loss) minus accumulated Preferred Stock dividends, any beneficial conversion feature amortized in the period and any undistributed earnings allocated to the Preferred Stock to arrive at net income (loss) attributable to common stockholders, as follows:
|
|
Consolidated Successor Company
|
Consolidated Predecessor Company
|
|||||||||||||||||||||||
|
Period from December 23, 2013
|
Period from December 31, 2012
|
|||||||||||||||||||||||
|
Year ended
|
through
|
through
|
Year ended
|
|||||||||||||||||||||
|
January 1, 2017
|
January 3, 2016
|
December 28, 2014
|
December 29, 2013
(1)
|
December 22, 2013
|
December 30, 2012
|
|||||||||||||||||||
|
(in millions, except share and per share data)
|
||||||||||||||||||||||||
|
Net income (loss)
|
$
|
30.6
|
|
$
|
28.9
|
|
$
|
21.7
|
|
$
|
(9.5
|
)
|
$
|
33.7
|
|
$
|
71.1
|
|
||||||
|
Less:
|
||||||||||||||||||||||||
|
Net income attributable to non-controlling interest
|
—
|
|
—
|
|
—
|
|
—
|
|
—
|
|
6.2
|
|
||||||||||||
|
Redeemable convertible preferred stock dividends
|
9.6
|
|
25.1
|
|
21.8
|
|
0.3
|
|
—
|
|
—
|
|
||||||||||||
|
Redeemable convertible preferred stock beneficial conversion feature
|
—
|
|
18.6
|
|
3.9
|
|
—
|
|
—
|
|
—
|
|
||||||||||||
|
Special cash dividend paid to preferred stockholders
|
112.4
|
|
—
|
|
—
|
|
—
|
|
—
|
|
—
|
|
||||||||||||
|
Undistributed earnings allocated to redeemable convertible preferred stock
|
—
|
|
—
|
|
—
|
|
—
|
|
—
|
|
—
|
|
||||||||||||
|
Net income (loss) attributable to Successor Company common stock/Predecessor Company equity interests
|
$
|
(91.4
|
)
|
$
|
(14.8
|
)
|
$
|
(4.0
|
)
|
$
|
(9.8
|
)
|
$
|
33.7
|
|
$
|
64.9
|
|
||||||
|
(3)
|
For the Predecessor Company periods presented prior to December 23, 2013, we were not operated as a standalone entity and were carved out from Deere upon the consummation of the CD&R Acquisition. The carved out entity consisted of two separate legal entities that are presented on a combined basis, each with a different and nominal capital structure. As the results would not be comparable and may be considered not meaningful (NM), we do not present earnings per share for the predecessor periods, during which we were operated as a component of Deere.
|
|
(4)
|
Total debt includes current and non-current portions of long-term debt offset by associated debt discount and issuance costs.
|
40
The following information should be read in conjunction with the “Selected Financial Data” and the accompanying consolidated financial statements and related notes included in this Annual Report.
The following discussion may contain forward-looking statements that reflect our plans, estimates and beliefs. Our actual results could differ materially from those discussed in these forward-looking statements. Factors that could cause or contribute to these differences include those factors discussed below and elsewhere in this Annual Report, particularly in “Special Note Regarding Forward-Looking Statements and Information” and “Risk Factors” included elsewhere in this Annual Report.
Overview
We are the largest and only national wholesale distributor of landscape supplies in the United States and have a growing presence in Canada. Our customers are primarily residential and commercial landscape professionals who specialize in the design, installation and maintenance of lawns, gardens, golf courses and other outdoor spaces. Through our expansive North American network of 469 branch locations in 45 states and five provinces, we offer a comprehensive selection of more than 100,000 SKUs, including fertilizer and control products (
e.g.
, herbicides), irrigation supplies, landscape accessories, nursery goods, hardscapes (including pavers, natural stones and blocks) and outdoor lighting. We also provide complementary, value-added consultative services to support our product offering and to help our customers operate and grow their businesses.
We have a diverse base of more than 180,000 customers, and our top 10 customers accounted for approximately 4% of our 2016 Fiscal Year net sales, with no single customer accounting for more than 2% of net sales. Our typical customer is a private landscape contractor that operates in a single market. We source our products from more than 2,500 suppliers, including the major irrigation equipment manufacturers, turf and ornamental fertilizer/chemical companies and a variety of suppliers who specialize in nursery goods, outdoor lighting, hardscapes and other landscape products. Our strong supplier relationships support our ability to provide a broad selection of products at attractive prices. We also develop and sell products under our proprietary and market-leading brands LESCO and Green Tech, which together accounted for approximately 19% of our 2016 Fiscal Year net sales. We believe these highly-recognized brands attract customers to our branches and create incremental sales opportunities for other products.
We hired Doug Black as our Chief Executive Officer in April 2014. Since joining SiteOne, Mr. Black has strengthened the capabilities of our executive leadership team by bringing in highly-qualified senior managers with functional expertise in strategy development, mergers and acquisitions, talent management, marketing, category management, supply chain management, national sales and information technology. Under Mr. Black’s leadership, we have established a focused business strategy to further develop and attract industry-leading talent, deliver more value to customers, generate superior financial performance, drive organic growth, execute on attractive acquisitions and increase working capital efficiency. We are also undertaking a variety of initiatives targeting pricing, category management, sales force performance and supply chain management. At the local level, we have increased our focus on gaining market share by adding capabilities to our 50 geographical areas and 469 branches and by empowering area managers and their teams to develop local strategies. These initiatives are in the early stages of implementation, and we believe they will continue to enhance our growth and profitability.
CD&R Acquisition
Holdings indirectly owns 100% of the membership interest in Landscape Holding. Landscape Holding is the parent and sole owner of SiteOne Landscape Supply, LLC (referred to in this report as “Landscape”). Prior to the CD&R Acquisition described below, Deere & Company (“Deere”) was the sole owner of Landscape Holding.
On December 23, 2013 (the “Closing Date”), the Company acquired 100% of the ownership interest in Landscape Holding from Deere in exchange for common shares of the Company initially representing 40% of the outstanding capital stock (on an as-converted basis) plus cash consideration of approximately $314 million, net of pre-closing and post-closing adjustments. In order to facilitate the transaction, the Company issued cumulative convertible participating redeemable preferred stock to Clayton, Dubilier & Rice, LLC (“CD&R”) for total consideration of $174 million initially representing 60% of the outstanding capital stock (on an as-converted basis). As part of the same transaction, Landscape Holding also acquired from Deere the affiliated company LESCO, Inc. (“LESCO”). The Company continues to be the sole owner of Landscape Holding.
Initial Public Offering
On May 17, 2016, we completed the IPO at a price to the public of $21.00 per share. In connection with the IPO, the CD&R Investor and Deere together sold an aggregate of 10,000,000 shares of common stock. The underwriters also exercised their option to purchase an additional 1,500,000 shares of common stock from the CD&R Investor and Deere, at the public offering price less the underwriting discounts and commissions. The CD&R Investor and Deere received all of the net proceeds and bore all commissions and
41
discounts from the sale of our common stock. We did not receive any proceeds from the IPO. On the day prior to the closing of the IPO, all of our then-outstanding Preferred Stock converted into shares of common stock, resulting in the issuance by us of an additional 25,303,164 shares of our common stock. The conversion of Preferred Stock is accounted for from the date of conversion and is not retroactively adjusted in our financial statements and related notes included in this Annual Report on Form 10-K.
Secondary Public Offering
Holdings registered on behalf of certain stockholders the offering and sale of 9,000,000 shares of common stock, as well as 1,350,000 shares of common stock sold to the underwriters pursuant to an option to purchase additional shares. On December 6, 2016, the selling stockholders completed the offering of 10,350,000 shares of common stock at a price of $33.00 per share. Holdings did not receive any of the proceeds from the aggregate 10,350,000 shares of common stock sold by the selling stockholders.
Presentation
Our financial statements included in this report have been prepared in accordance with generally accepted accounting principles in the United States of America (“GAAP”). We use a 52/53 week fiscal year with the fiscal year ending on the Sunday nearest to December 31 in each year. Our fiscal quarters end on the Sunday nearest to March 31, June 30 and September 30, respectively.
This discussion of our financial condition is presented for the fiscal year ended January 1, 2017 (the “2016 Fiscal Year”, which included 52 weeks and 253 Selling Days), the fiscal year ended January 3, 2016 (the “2015 Fiscal Year,” which included 53 weeks and 256 Selling Days), and the fiscal year ended December 28, 2014 (the “2014 Fiscal Year,” which includes 52 weeks and 252 Selling Days). “Selling Days” are defined below within the Key Business and Performance Metrics section.
We manage our business as a single reportable segment. Within our organizational framework, the same operational resources support multiple geographic regions and performance is evaluated at a consolidated level. We also evaluate performance based on discrete financial information on a regional basis. Since all of our regions have similar operations and share similar economic characteristics, we aggregate regions into a single operating and reportable segment. These similarities include (1) long-term financial performance, (2) the nature of products and services, (3) the types of customers we sell to and (4) the distribution methods used.
Key Business and Performance Metrics
We focus on a variety of indicators and key operating and financial metrics to monitor the financial condition and performance of our business. These metrics include:
Net sales
. We generate net sales primarily through the sale of landscape supplies, including irrigation systems, fertilizer & control products, landscape accessories, nursery goods, hardscapes and outdoor lighting to our customers who are primarily landscape contractors serving the residential and commercial construction sectors. Our net sales include billings for freight and handling charges, and commissions on the sale of control products that we sell as an agent. Net sales are presented net of any discounts, returns, customer rebates, and sales or other revenue-based tax.
Non-GAAP Organic Sales
.
In managing our business, we consider all growth, including the opening of new greenfield branches, to be organic growth unless it results from an acquisition. When we refer to Organic Sales growth, we include increases in growth from newly-opened greenfield branches and decreases in growth from closing existing branches but exclude increases in growth from acquired branches until they have been under our ownership for at least four full fiscal quarters at the start of the fiscal reporting period.
Non-GAAP Selling Days
.
Selling Days are defined as business days, excluding Saturdays, Sundays and holidays, that our branches are open during the year. Depending upon the location and the season, our branches may be open on Saturdays and Sundays; however for consistency, those days have been excluded from the calculation of Selling Days.
Non-GAAP Organic Daily Sales
.
We define Organic Daily Sales as Organic Sales divided by the number of Selling Days in the relevant reporting period. We believe Organic Sales growth and Organic Daily Sales growth are useful measures for evaluating our performance as we may choose to open or close branches in any given market depending upon the needs of our customers or our strategic growth opportunities.
Cost of goods sold
. Our cost of goods sold includes all inventory costs, such as purchase price paid to suppliers, net of any rebates received, as well as inbound freight and handling, and other costs associated with inventory. Our cost of goods sold excludes the cost to deliver the products to our customers through our branches, which is included in selling, general and administrative expenses. Cost of goods sold is recognized primarily using the first-in first-out method of accounting for the inventory sold.
42
Gross profit and gross margin
.
We believe that gross profit and gross margin are useful for evaluating our operating performance. We define gross profit as net sales less cost of goods sold, exclusive of depreciation. We define gross margin as gross profit divided by net sales.
Selling, general and administrative expenses (operating expenses)
. Our operating expenses are primarily comprised of selling, general and administrative costs, which include personnel expenses (salaries, wages, employee benefits, payroll taxes, stock compensation and bonuses), rent, fuel, vehicle maintenance costs, insurance, utilities, repairs and maintenance and professional fees. Operating expenses also include depreciation and amortization.
Non-GAAP Adjusted EBITDA
.
In addition to the metrics discussed above, we believe that Adjusted EBITDA is useful for evaluating our operating performance and efficiency of our business. EBITDA represents our net income (loss) plus the sum of income tax (benefit), depreciation and amortization and interest expense, net of interest income. Adjusted EBITDA represents EBITDA as further adjusted for items such as stock-based compensation expense, related party advisory fees, loss (gain) on sale of assets, other non-cash items, other non-recurring (income) and loss. See “-Results of Operations-Quarterly Results of Operations Data” for more information about how we calculate EBITDA and Adjusted EBITDA and the limitations of those metrics.
Key Factors Affecting Our Operating Results
In addition to the metrics described above, a number of other important factors may affect our results of operations in any given period.
Weather Conditions and Seasonality
In a typical year, our operating results are impacted by seasonality. Historically, our net sales and net income have been higher in the second and third quarters of each fiscal year due to favorable weather and longer daylight conditions during these quarters. Our net sales have been significantly lower in the first and fourth quarters due to lower landscaping, irrigation and turf maintenance activities; and additionally, we have historically incurred net losses in these quarters. Seasonal variations in operating results may also be significantly impacted by inclement weather conditions, such as snow or rain, which not only impact the demand for certain products like fertilizer and ice melt, but also may delay construction projects where our products are used.
Industry and Key Economic Conditions
Our business depends on demand from customers for landscape products and services. The landscape supply industry includes a significant amount of landscape products, such as irrigation systems, outdoor lighting, lawn care supplies, nursery goods and landscape accessories, for use in the construction of newly built homes, commercial buildings and recreational spaces. The landscape distribution industry has historically grown in line with rates of growth in residential housing and commercial building. The industry is also affected by trends in home prices, home sales and consumer spending. As general economic conditions improve or deteriorate, consumption of these products and services also tends to fluctuate. The landscape distribution industry also includes a significant amount of landscape products such as fertilizer, herbicides and ice melt for use in maintaining existing landscapes or facilities. The use of these products is also tied to general economic activity, but levels of sales are not as closely correlated to construction markets.
Popular Consumer Trends
Preferences in housing, lifestyle and environmental awareness can also impact the overall level of demand and mix for the products we offer. Examples of current trends we believe are important to our business include a heightened interest in professional landscape services inspired by the popularity of home and garden television shows and magazines; the increasingly popular concept of “outdoor living,” which has been a key driver of sales growth for our hardscapes and outdoor lighting products; and the social focus on eco-friendly products that promote water conservation, energy efficiency and the adoption of “green” standards.
43
Acquisitions
In addition to our organic growth we continue to grow our business through acquisitions in an effort to better service our existing customers and to attract new customers. These acquisitions have allowed us to further broaden our product lines and extend our geographic reach and leadership positions in local markets. In accordance with GAAP, the results of the acquisitions we have completed are reflected in our financial statements from the date of acquisition forward. We incur transaction costs in connection with identifying and completing acquisitions and ongoing integration costs as we integrate acquired companies and seek to achieve synergies. As of January 1, 2017, we have invested over $190 million in 14 acquisitions since December 2013, with the largest being the Shemin Nurseries investment of $57.7 million. The following is a summary of the acquisitions completed during the 2016, 2015 and 2014 Fiscal Years:
On December 19, 2016, we acquired the assets of East Haven Landscape Products, headquartered in East Haven, Connecticut, adding a full-service landscape supply location along the southeastern Connecticut coast and extending our network of existing full-service locations in Greenwich, Connecticut, Bedford Hills, New York and Windsor, Connecticut. The acquisition gives SiteOne a leading position for nursery, hardscapes and landscape supplies in the East Haven area.
On November 4, 2016, we acquired the assets of the landscape distribution business of Loma Vista Nursery, Inc., which includes two locations serving customers in Missouri and Kansas. The acquisition gives SiteOne a leading position for nursery products in the Kansas City market and bolsters our position in hardscapes.
On September 12, 2016, we acquired the assets of Glen Allen Nursery & Garden Center, Inc., which includes one branch location in Richmond, Virginia. The acquisition gives SiteOne a leading position for nursery products in the Richmond area.
On August 1, 2016, we acquired the assets of Bissett Nursery Corp. and acquired all of the outstanding stock of Bissett Equipment Corp., which together comprise Bissett. Bissett includes three branch locations serving customers throughout the New York City metropolitan area. The acquisition gives SiteOne a leading position for nursery products in the New York City metropolitan market and a strong position in equipment and hardscapes.
On April 4, 2016, we acquired the assets of Blue Max Materials, Inc., Blue Max Materials of Charleston, Inc., Blue Max Materials of Columbia, Inc. and Blue Max Materials of the Grand Strand, Inc., which together comprise Blue Max Materials. Blue Max Materials includes five locations serving both North and South Carolina. The acquisition creates a leading position for SiteOne in the North and South Carolina hardscapes and landscape accessories markets.
On January 4, 2016, we acquired the outstanding stock of Hydro-Scape Products, Inc., which includes 17 locations serving Southern California. The acquisition creates a leading position for SiteOne in the Southern California irrigation and landscape accessories markets.
On August 31, 2015, we acquired the assets of Tieco, Inc., which includes six branch locations serving Alabama and Florida with irrigation, lighting, pump and well products. The acquisition creates a leading position for SiteOne in Alabama and the Florida panhandle irrigation markets.
On August 5, 2015, we acquired all of the outstanding stock of Green Resource, LLC, which includes five branch locations serving North and South Carolina with chemicals, seed, fertilizer and erosion control products. The acquisition creates a leading position for SiteOne in North and South Carolina across all of our product lines.
On May 8, 2015, we acquired all of the outstanding stock of AMC Industries, Inc., which includes nine branch locations serving Texas and Oklahoma with irrigation products and domestic water systems. The acquisition creates a leading position for SiteOne in the South Texas and Oklahoma irrigation markets.
On February 27, 2015, we acquired all of the outstanding stock of CLP SN Holdings, Inc., the parent company of Shemin Nurseries, which includes 30 branch locations supplying primarily nursery goods in 18 major metropolitan markets across 14 states of the Eastern region of the United States and Texas. The acquisition gives SiteOne a leading position in the distribution of nursery products in the Northeast, Southeast, Midwest and Texas regions.
On October 1, 2014, we acquired the assets of Boston Irrigation Supply Company, Inc., which includes five branch locations serving the Northeast with irrigation, outdoor lighting and pump systems. The acquisition strengthens our leadership positions in the states of Massachusetts, Connecticut, New Hampshire and New York.
On September 23, 2014, we acquired the assets of Stockyard Horticultural Supply, Inc., which consists of one branch location in Arlington, Tennessee. The acquisition gives SiteOne a leading position for nursery products in the Memphis metropolitan market.
On July 28, 2014, we acquired the assets of Diamond Head Sprinkler Supply, Inc., which includes three branch locations serving the state of Hawaii with irrigation and outdoor lighting products. The acquisition creates a leading position for SiteOne in the Hawaii irrigation market.
44
On April 14, 2014, we acquired the assets of Eljay Irrigation, Ltd., which includes nine branch locations serving four provinces of Western Canada with irrigation, landscape lighting and landscape accessories. The acquisition provides us with a leading irrigation platform in Western Canada.
We expect the execution of synergistic acquisitions to continue to be an integral part of our growth strategy, and we intend to continue expanding our product line, geographic reach, market share and operational capabilities through future acquisitions.
Volume-Based Pricing
We generally procure our products through purchase orders rather than under long-term contracts with firm commitments. We work to develop strong relationships with a select group of suppliers that we target based on a number of factors, including brand and market recognition, price, quality, product support, service levels, delivery terms and their strategic positioning. We generally have annual supplier agreements, and while they generally do not provide for specific product pricing, many include volume-based financial incentives that we earn by meeting or exceeding target purchase volumes. Our ability to earn these volume-based incentives is an important factor in our financial results. In limited cases, we have entered into supply contracts with terms that exceed one year for the manufacture of our LESCO branded fertilizer and some nursery stock and grass seed, which may require us to purchase products in the future.
Strategic Initiatives
We have undertaken significant operational initiatives, utilizing our scale to improve our profitability, enhance supply chain efficiency, strengthen our pricing and category management capabilities, streamline and refine our marketing process and invest in more sophisticated information technology systems and data analytics. We are increasingly focusing on our procurement and supply chain management initiatives to reduce sourcing costs. We are also implementing new inventory planning and stocking systems and evaluating ways to further improve the freight and logistics processes in an effort to reduce costs as well as improve our reliability and level of service. In addition, we work closely with our local branches to improve sales, delivery and branch productivity. We believe we will continue to benefit from the following initiatives, among others:
Pricing initiatives, including the implementation of a centralized pricing strategy and a targeted discounting strategy, were rolled out beginning in the second quarter of 2015 and are expected to continue through 2017.
Category management initiatives, including the development of a private label strategy and reorganization of brands and product lines by preferred suppliers, were rolled out beginning in the first quarter of 2015 and are expected to continue through 2017.
Supply chain initiatives, including the implementation of new inventory planning and stocking systems, were rolled out in the fourth quarter of 2016 and are expected to continue through 2018.
Sales force performance initiatives, including the development and implementation of compensation and incentive plans and comprehensive sales force and management training, were rolled out beginning in the third quarter of 2015 and are expected to continue through 2017.
Marketing initiatives, including the SiteOne brand launch, relaunch of the Partners Program and implementation of a digital marketing strategy, were rolled out beginning in the third quarter of 2015 and are expected to continue through 2018.
Working Capital
In addition to affecting our net sales, fluctuations in prices of supplies tend to result in changes in our reported inventories, trade receivables and trade payables, even when our sales volumes and our rate of turnover of these working capital items remain relatively constant. Our business is characterized by a relatively high level of reported working capital, the effects of which can be compounded by changes in prices. Our working capital needs are exposed to these price fluctuations, as well as to fluctuations in our cost for transportation and distribution. We might not always be able to reflect these increases in our pricing. The strategic initiatives described above are designed to reduce our exposure to these fluctuations and maintain and improve our efficiency.
45
Results of Operations
In the following discussion of our results of operations, we make comparisons among the 2016 Fiscal Year, the 2015 Fiscal Year and the 2014 Fiscal Year.
|
Consolidated Statements of Operations
|
||||||||||||||||||
|
January 4, 2016 to January 1, 2017
|
December 29, 2014 to January 3, 2016
|
December 30, 2013 to December 28, 2014
|
||||||||||||||||
|
(in millions)
|
||||||||||||||||||
|
Net sales
|
$
|
1,648.2
|
|
100.0
|
%
|
$
|
1,451.6
|
|
100.0
|
%
|
$
|
1,176.6
|
|
100.0
|
%
|
|||
|
Cost of goods sold
|
1,132.5
|
|
68.7
|
%
|
1,022.5
|
|
70.4
|
%
|
865.5
|
|
73.6
|
%
|
||||||
|
Gross profit
|
515.7
|
|
31.3
|
%
|
429.1
|
|
29.6
|
%
|
311.1
|
|
26.4
|
%
|
||||||
|
Selling, general and administrative expenses
|
446.5
|
|
27.1
|
%
|
373.3
|
|
25.7
|
%
|
269.0
|
|
22.9
|
%
|
||||||
|
Other income
|
4.8
|
|
0.3
|
%
|
4.0
|
|
0.3
|
%
|
3.1
|
|
0.3
|
%
|
||||||
|
Operating income
|
74.0
|
|
4.5
|
%
|
59.8
|
|
4.1
|
%
|
45.2
|
|
3.8
|
%
|
||||||
|
Interest and other non-operating (income) expenses
|
22.1
|
|
1.3
|
%
|
11.4
|
|
0.8
|
%
|
9.1
|
|
0.8
|
%
|
||||||
|
Income tax expense
|
21.3
|
|
1.3
|
%
|
19.5
|
|
1.3
|
%
|
14.4
|
|
1.2
|
%
|
||||||
|
Net income
|
$
|
30.6
|
|
1.9
|
%
|
$
|
28.9
|
|
2.0
|
%
|
$
|
21.7
|
|
1.8
|
%
|
|||
Comparison of the 2016 Fiscal Year to the 2015 Fiscal Year
Net sales
Net sales for the 2016 Fiscal Year increased 14% to $1,648 million as compared to $1,452 million for the 2015 Fiscal Year. Organic Sales growth contributed 3% to overall growth, and acquisitions contributed an additional 11%. Net sales growth for the 2016 Fiscal Year, adjusted for one less week in the 2016 Fiscal Year compared to the 2015 Fiscal Year, would have been approximately one percentage point greater, or total net sales growth of 15% and Organic Sales growth of 4%. Organic Sales growth was driven by growth in the irrigation, nursery, landscape accessories, hardscapes and outdoor lighting categories, which together grew over 6% as a result of continued growth in residential and commercial construction. Organic Sales for fertilizer and control products decreased 2% reflecting modest market demand, fewer Selling Days, and the negative impact of branch consolidations. Acquisitions contributed $157 million to net sales growth.
Costs of goods sold
Cost of goods sold for the 2016 Fiscal Year increased 11% to $1,133 million from $1,023 million for the 2015 Fiscal Year. The increase in cost of goods sold was primarily driven by the increased net sales growth, including acquisitions, partially offset by lower material cost, including manufacturing incentives.
Gross profit and gross margin
Gross profit for the 2016 Fiscal Year increased 20% to $516 million as compared to $429 million for the 2015 Fiscal Year. Gross profit growth was driven by the net sales increase resulting from Organic Sales growth and acquisitions in addition to margin expansion resulting from our operational initiatives. Gross margin increased 170 basis points to 31.3% in the 2016 Fiscal Year as compared to 29.6% in the 2015 Fiscal Year. Operational improvements in pricing and category management were the primary contributors, each accounting for approximately half of the increase. Product mix did not have a significant impact on gross margins. Acquisitions contributed approximately 20 basis points to the margin improvement.
Selling, general and administrative expenses (operating expenses)
Operating expenses for the 2016 Fiscal Year increased 20% to $447 million from $373 million for the 2015 Fiscal Year. The increase in operating expenses was primarily driven by our growth from acquisitions. In addition, we incurred approximately $12 million in transition expenses related to our stock offerings, debt refinancing and subsequent amendment, and the termination of our consulting agreements with CD&R and Deere. Operating expenses expressed as a percentage of net sales increased to 27.1% for the 2016 Fiscal Year compared to 25.7% for the 2015 Fiscal Year. The increase was driven primarily by the transition expenses discussed above, in
46
addition to acquisitions and higher personnel costs to support our growth. Depreciation and amortization increased $6 million to $37 million primarily as result of our acquisitions.
Interest expense and other non-operating (income) expense
Interest expense and other non-operating (income) expense increased $11 million to $22 million in the 2016 Fiscal Year from $11 million in the 2015 Fiscal Year. The increase in interest expense was principally driven by the higher debt levels, a higher blended interest rate on our debt, and the write-off of unamortized debt discounts and issuance costs in connection with the refinancing and subsequent amendment transaction.
Income tax (benefit) expense
Income tax expense was $21.3 million during the 2016 Fiscal Year as compared to income tax expense of $19.5 million during the 2015 Fiscal Year. The effective tax rate was 41.0% during the 2016 Fiscal Year as compared to 40.3% for the 2015 Fiscal Year. The increase in the effective tax rate was due primarily to nondeductible transaction costs related to our 2016 stock offerings.
Net income
Net income for the 2016 Fiscal Year increased 6% to $30.6 million as compared to $28.9 million for the 2015 Fiscal Year. The increase in net income was primarily attributable to the growth in sales both organically and through acquisitions, and the expansion of gross margin resulting from operational improvements, partially offset by increased operating expenses to support our sales growth and initiatives.
Comparison of the 2015 Fiscal Year to the 2014 Fiscal Year
Net sales
Net sales for the 2015 Fiscal Year increased 23% to $1,452 million as compared to $1,177 million for the 2014 Fiscal Year. Organic Sales growth contributed 7% to overall growth, and acquisitions contributed an additional 16%. Organic Sales growth was driven by growth in the irrigation, outdoor lighting, hardscapes and landscape accessories categories, which together grew over 10% as a result of an increase in residential and commercial construction. Net sales for fertilizer and other agronomic products increased by 2%, reflecting modest market growth and poor weather, as the late wet spring negatively impacted spring fertilizer applications. Acquisitions contributed $193 million to net sales growth. Net sales growth for the 2015 Fiscal Year, adjusted for the additional week in the fiscal period compared to the 2014 Fiscal Year, would have been approximately 2 percentage points less, or 21%.
Costs of goods sold
Cost of goods sold for the 2015 Fiscal Year increased 18% to $1,023 million from $866 million for the 2014 Fiscal Year. The increase in cost of goods sold was primarily driven by the increased net sales growth, including acquisitions. Relative to net sales, cost of goods sold was lower as a result of cost savings resulting from our category management initiative and lower inbound freight costs attributable to supply chain improvements and lower fuel costs.
Gross profit and gross margin
Gross profit for the 2015 Fiscal Year increased 38% to $429 million as compared to $311 million for the 2014 Fiscal Year. Gross profit growth was driven by the increase in net sales resulting from Organic Sales growth and acquisitions in addition to margin expansion resulting from our focus on operational improvements in pricing and category management. Gross margin increased 320 basis points to 29.6% in the 2015 Fiscal Year as compared to 26.4% in the 2014 Fiscal Year. Operational improvements in pricing and category management contributed approximately 240 basis points of the improvements, with pricing and category management each accounting for approximately half. Gross margins also benefited from improved product mix (approximately 30 basis points), primarily attributable to acquisitions and reduced freight and logistics costs (approximately 40 basis points). Our 2014 and 2015 acquisitions contributed positively to our gross margins for the 2015 Fiscal Year due to their favorable product mix, synergies of integration and the high quality of the acquired companies.
Selling, general and administrative expenses (operating expenses)
Operating expenses for the 2015 Fiscal Year increased 39% to $373 million from $269 million for the 2014 Fiscal Year. The increase in operating expenses was primarily driven by the acquisitions made in 2014 and 2015 as well as investments made in personnel and information technology to support our sales growth and strategic initiatives. Operating expenses expressed as a percentage of net sales
47
increased from 25.7% for the 2015 Fiscal Year as compared to 22.9% for the 2014 Fiscal Year. The depreciation and amortization component of our operating expenses increased $11 million to $31.2 million for the 2015 Fiscal Year, primarily as a result of our acquisitions in 2014 and 2015.
Interest expense and other non-operating (income) expense
Interest expense and other non-operating (income) expense increased $2.3 million to $11.4 million in the 2015 Fiscal Year from $9.1 million in the 2014 Fiscal Year. Interest expense and other non-operating income was higher due to higher interest expense resulting from higher average outstanding borrowings and $1.2 million of unamortized debt discounts expensed as a result of a debt amendment in October 2015.
Income tax (benefit) expense
Income tax expense was $19.5 million during the 2015 Fiscal Year as compared to income tax expense of $14.4 million during the 2014 Fiscal Year. The effective tax rate was 40.3% during the 2015 Fiscal Year as compared to 39.9% for the 2014 Fiscal Year. The effective rates during the 2015 Fiscal Year and the 2014 Fiscal Year were impacted primarily by the effects of state income taxes.
Net income
Net income for the 2015 Fiscal Year increased 33% to $28.9 million as compared to $21.7 million for the 2014 Fiscal Year. The increase in net income was primarily attributable to the growth in sales both organically and through acquisitions, and the expansion of gross margin resulting from operational improvements in pricing and category management, partially offset by the one-time transaction expenses and increased operating expenses to support our sales growth and initiatives.
48
Quarterly Results of Operations Data
The following tables set forth our unaudited net sales, cost of goods sold, gross profit, selling, general and administrative expenses, net income (loss) and Adjusted EBITDA data (including a reconciliation of Adjusted EBITDA to net income (loss)) for each of the most recent eight fiscal quarters. We have prepared the quarterly data on a basis that is consistent with the financial statements included in this Annual Report. In the opinion of management, the financial information reflects all necessary adjustments, consisting only of normal recurring adjustments, necessary for a fair presentation of these data. This information is not a complete set of financial statements and should be read in conjunction with our financial statements and related notes included in this Annual Report. The results of historical periods are not necessarily indicative of the results of operations for a full year or any future period.
|
(In millions, unaudited)
|
|||||||||||||||||||||||||||||||||||||||
|
2016 Fiscal Year
|
2015 Fiscal Year
|
||||||||||||||||||||||||||||||||||||||
|
Year
|
Qtr 4
|
Qtr 3
|
Qtr 2
|
Qtr 1
|
Year
|
Qtr 4
|
Qtr 3
|
Qtr 2
|
Qtr 1
|
||||||||||||||||||||||||||||||
|
Net sales
|
$
|
1,648.2
|
|
$
|
361.8
|
|
$
|
444.5
|
|
$
|
513.4
|
|
$
|
328.5
|
|
$
|
1,451.6
|
|
$
|
339.8
|
|
$
|
404.5
|
|
$
|
481.5
|
|
$
|
225.8
|
|
|||||||||
|
Cost of goods sold
|
1,132.5
|
|
250.0
|
|
306.1
|
|
344.9
|
|
231.5
|
|
1,022.5
|
|
235.2
|
|
286.1
|
|
334.0
|
|
167.2
|
|
|||||||||||||||||||
|
Gross profit
|
515.7
|
|
111.8
|
|
138.4
|
|
168.5
|
|
97.0
|
|
429.1
|
|
104.6
|
|
118.4
|
|
147.5
|
|
58.6
|
|
|||||||||||||||||||
|
Selling, general and administrative expenses
|
446.5
|
|
116.2
|
|
107.7
|
|
118.0
|
|
104.6
|
|
373.3
|
|
110.7
|
|
98.2
|
|
91.3
|
|
73.1
|
|
|||||||||||||||||||
|
Other income
|
4.8
|
|
1.4
|
|
1.2
|
|
1.0
|
|
1.2
|
|
4.0
|
|
1.2
|
|
1.3
|
|
0.7
|
|
0.8
|
|
|||||||||||||||||||
|
Operating income (loss)
|
74.0
|
|
(3.0
|
)
|
31.9
|
|
51.5
|
|
(6.4
|
)
|
59.8
|
|
(4.9
|
)
|
21.5
|
|
56.9
|
|
(13.7
|
)
|
|||||||||||||||||||
|
Interest and other non-operating (income) expenses
|
22.1
|
|
6.7
|
|
6.3
|
|
6.5
|
|
2.6
|
|
11.4
|
|
3.7
|
|
2.7
|
|
2.6
|
|
2.4
|
|
|||||||||||||||||||
|
Income tax (benefit) expense
|
21.3
|
|
(4.1
|
)
|
10.7
|
|
18.1
|
|
(3.4
|
)
|
19.5
|
|
(2.7
|
)
|
7.4
|
|
21.1
|
|
(6.3
|
)
|
|||||||||||||||||||
|
Net income (loss)
|
$
|
30.6
|
|
$
|
(5.6
|
)
|
$
|
14.9
|
|
$
|
26.9
|
|
$
|
(5.6
|
)
|
$
|
28.9
|
|
$
|
(5.9
|
)
|
$
|
11.4
|
|
$
|
33.2
|
|
$
|
(9.8
|
)
|
|||||||||
|
Adjusted EBITDA
(1)
|
$
|
134.3
|
|
$
|
11.2
|
|
$
|
43.7
|
|
$
|
74.9
|
|
$
|
4.5
|
|
$
|
106.5
|
|
$
|
11.9
|
|
$
|
33.7
|
|
$
|
66.6
|
|
$
|
(5.7
|
)
|
|||||||||
|
Net sales as a percentage of annual net sales
|
100.0
|
%
|
22.0
|
%
|
27.0
|
%
|
31.1
|
%
|
19.9
|
%
|
100.0
|
%
|
23.4
|
%
|
27.9
|
%
|
33.2
|
%
|
15.5
|
%
|
|||||||||||||||||||
|
Gross profit as a percentage of annual gross profit
|
100.0
|
%
|
21.7
|
%
|
26.8
|
%
|
32.7
|
%
|
18.8
|
%
|
100.0
|
%
|
24.4
|
%
|
27.6
|
%
|
34.4
|
%
|
13.6
|
%
|
|||||||||||||||||||
|
Adjusted EBITDA as a percentage of annual Adjusted EBITDA
|
100.0
|
%
|
8.3
|
%
|
32.5
|
%
|
55.8
|
%
|
3.4
|
%
|
100.0
|
%
|
11.2
|
%
|
31.7
|
%
|
62.4
|
%
|
(5.3
|
)%
|
|||||||||||||||||||
_____________________________________
|
(1)
|
In addition to our net income (loss) determined in accordance with GAAP, we present Adjusted EBITDA in this Annual Report to evaluate the operating performance and efficiency of our business. EBITDA represents our net income (loss) plus the sum of income tax (benefit), depreciation and amortization and interest expense, net of interest income. Adjusted EBITDA is further adjusted for stock-based compensation expense, related party advisory fees, loss (gain) on sale of assets, other non-cash items, other non-recurring (income) and loss. We believe that Adjusted EBITDA is an important supplemental measure of operating performance because:
|
|
•
|
Adjusted EBITDA is used to test compliance with certain covenants under our Credit Facilities;
|
|
•
|
we believe Adjusted EBITDA is frequently used by securities analysts, investors and other interested parties in their evaluation of companies, many of which present an Adjusted EBITDA measure when reporting their results;
|
|
•
|
we believe Adjusted EBITDA is helpful in highlighting operating trends, because it excludes the results of decisions that are outside the control of operating management and that can differ significantly from company to company depending on long-term strategic decisions regarding capital structure, the tax jurisdictions in which companies operate, age and book depreciation of facilities and capital investments;
|
|
•
|
we consider (gains) losses on the acquisition, disposal and impairment of assets as resulting from investing decisions rather than ongoing operations; and
|
49
|
•
|
other significant non-recurring items, while periodically affecting our results, may vary significantly from period to period and have a disproportionate effect in a given period, which affects comparability of our results.
|
Adjusted EBITDA is not a measure of our liquidity or financial performance under GAAP and should not be considered as an alternative to net income, operating income or any other performance measures derived in accordance with GAAP, or as an alternative to cash flow from operating activities as a measure of our liquidity. The use of Adjusted EBITDA instead of net income has limitations as an analytical tool. For example, this measure:
|
•
|
does not reflect changes in, or cash requirements for, our working capital needs;
|
|
•
|
does not reflect our interest expense, or the cash requirements necessary to service interest or principal payments, on our debt;
|
|
•
|
does not reflect our income tax (benefit) expense or the cash requirements to pay our income taxes;
|
|
•
|
does not reflect historical cash expenditures or future requirements for capital expenditures or contractual commitments; and
|
|
•
|
although depreciation and amortization are non-cash charges, the assets being depreciated and amortized will often have to be replaced in the future, and does not reflect any cash requirements for such replacements.
|
Management compensates for these limitations by relying primarily on our GAAP results and by using Adjusted EBITDA only as a supplement to provide a more complete understanding of the factors and trends affecting the business than GAAP results alone. Because not all companies use identical calculations, our presentation of Adjusted EBITDA may not be comparable to other similarly titled measures of other companies limiting their usefulness as a comparative measure.
The following table presents a reconciliation of Adjusted EBITDA to Net income (loss):
|
(In millions, unaudited)
|
||||||||||||||||||||||||||||||||||||||||
|
2016 Fiscal Year
|
2015 Fiscal Year
|
|||||||||||||||||||||||||||||||||||||||
|
Year
|
Qtr 4
|
Qtr 3
|
Qtr 2
|
Qtr 1
|
Year
|
Qtr 4
|
Qtr 3
|
Qtr 2
|
Qtr 1
|
|||||||||||||||||||||||||||||||
|
Reported Net income (loss)
|
$
|
30.6
|
|
$
|
(5.6
|
)
|
$
|
14.9
|
|
$
|
26.9
|
|
$
|
(5.6
|
)
|
$
|
28.9
|
|
$
|
(5.9
|
)
|
$
|
11.4
|
|
$
|
33.2
|
|
$
|
(9.8
|
)
|
||||||||||
|
Income tax (benefit) expense
|
21.3
|
|
(4.1
|
)
|
10.7
|
|
18.1
|
|
(3.4
|
)
|
19.5
|
|
(2.7
|
)
|
7.4
|
|
21.1
|
|
(6.3
|
)
|
||||||||||||||||||||
|
Interest expense, net
|
22.1
|
|
6.7
|
|
6.3
|
|
6.5
|
|
2.6
|
|
11.4
|
|
3.7
|
|
2.7
|
|
2.6
|
|
2.4
|
|
||||||||||||||||||||
|
Depreciation & amortization
|
37.0
|
|
9.6
|
|
9.7
|
|
9.1
|
|
8.6
|
|
31.2
|
|
8.7
|
|
8.2
|
|
7.9
|
|
6.4
|
|
||||||||||||||||||||
|
EBITDA
|
111.0
|
|
6.6
|
|
41.6
|
|
60.6
|
|
2.2
|
|
91.0
|
|
3.8
|
|
29.7
|
|
64.8
|
|
(7.3
|
)
|
||||||||||||||||||||
|
Stock-based compensation
(a)
|
5.3
|
|
1.3
|
|
1.1
|
|
2.2
|
|
0.7
|
|
3.0
|
|
0.7
|
|
0.8
|
|
0.8
|
|
0.7
|
|
||||||||||||||||||||
|
(Gain) loss on sale of assets
(b)
|
—
|
|
0.1
|
|
—
|
|
—
|
|
(0.1
|
)
|
0.4
|
|
0.2
|
|
—
|
|
0.2
|
|
—
|
|
||||||||||||||||||||
|
Advisory fees
(c)
|
8.5
|
|
—
|
|
—
|
|
8.0
|
|
0.5
|
|
2.0
|
|
0.5
|
|
0.5
|
|
0.5
|
|
0.5
|
|
||||||||||||||||||||
|
Financing fees
(d)
|
4.6
|
|
1.1
|
|
0.4
|
|
3.1
|
|
—
|
|
5.5
|
|
3.5
|
|
2.0
|
|
—
|
|
—
|
|
||||||||||||||||||||
|
Rebranding and other adjustments
(e)
|
4.9
|
|
2.1
|
|
0.6
|
|
1.0
|
|
1.2
|
|
4.6
|
|
3.2
|
|
0.7
|
|
0.3
|
|
0.4
|
|
||||||||||||||||||||
|
Adjusted EBITDA
(f)
|
$
|
134.3
|
|
$
|
11.2
|
|
$
|
43.7
|
|
$
|
74.9
|
|
$
|
4.5
|
|
$
|
106.5
|
|
$
|
11.9
|
|
$
|
33.7
|
|
$
|
66.6
|
|
$
|
(5.7
|
)
|
||||||||||
_____________________________________
|
(a)
|
Represents stock-based compensation expense recorded during the period.
|
|
(b)
|
Represents any gain or loss associated with the sale or write-down of assets not in the ordinary course of business.
|
|
(c)
|
Represents fees paid to CD&R and Deere for consulting services. In connection with the IPO, we entered into termination agreements with CD&R and Deere pursuant to which the parties agreed to terminate the related consulting agreements.
|
|
(d)
|
Represents fees associated with our debt refinancing and debt amendments, as well as fees incurred in connection with our initial public offering and secondary offering.
|
|
(e)
|
Represents (i) expenses related to our rebranding to the name SiteOne and (ii) professional fees, retention and performance bonuses related to historical acquisitions. Although we have incurred professional fees, retention and performance bonuses related to acquisitions in several historical periods and expect to incur such fees for any future acquisitions, we cannot predict the timing or amount of any such fees.
|
|
(f)
|
Adjusted EBITDA excludes any earnings or loss of acquisitions prior to their respective acquisition dates for all periods presented.
|
50
The following table presents a reconciliation of Organic Daily Sales to Net sales:
|
(In millions, except Selling Days; unaudited)
|
||||||||||||||||||||||||||||||||||||||||
|
2016 Fiscal Year
|
2015 Fiscal Year
|
|||||||||||||||||||||||||||||||||||||||
|
Year
|
Qtr 4
|
Qtr 3
|
Qtr 2
|
Qtr 1
|
Year
|
Qtr 4
|
Qtr 3
|
Qtr 2
|
Qtr 1
|
|||||||||||||||||||||||||||||||
|
Reported Net sales
|
$
|
1,648.2
|
|
$
|
361.8
|
|
$
|
444.5
|
|
$
|
513.4
|
|
$
|
328.5
|
|
$
|
1,451.6
|
|
$
|
339.8
|
|
$
|
404.5
|
|
$
|
481.5
|
|
$
|
225.8
|
|
||||||||||
|
Organic sales
|
1,317.1
|
|
274.6
|
|
357.8
|
|
411.8
|
|
272.9
|
|
1,277.5
|
|
283.0
|
|
351.8
|
|
421.7
|
|
221.0
|
|
||||||||||||||||||||
|
Acquisition contribution
(a)
|
331.1
|
|
87.2
|
|
86.7
|
|
101.6
|
|
55.6
|
|
174.1
|
|
56.8
|
|
52.7
|
|
59.8
|
|
4.8
|
|
||||||||||||||||||||
|
Selling Days
|
253
|
|
61
|
|
63
|
|
64
|
|
65
|
|
256
|
|
65
|
|
63
|
|
64
|
|
64
|
|
||||||||||||||||||||
|
Organic Daily Sales
|
$
|
5.2
|
|
$
|
4.5
|
|
$
|
5.7
|
|
$
|
6.4
|
|
$
|
4.2
|
|
$
|
5.0
|
|
$
|
4.4
|
|
$
|
5.6
|
|
$
|
6.6
|
|
$
|
3.5
|
|
||||||||||
_____________________________________
|
(a)
|
Represents net sales from acquired branches that have not been under our ownership for at least four full fiscal quarters at the start of the fiscal year (this table excludes all acquisitions completed prior to the start of the 2015 Fiscal Year).
|
Liquidity and Capital Resources
Our ongoing liquidity needs are expected to be funded by cash on hand, net cash provided by operating activities and, as required, borrowings under the ABL Facility. We expect that cash provided from operations and available capacity under the ABL Facility will provide sufficient funds to operate our business, make expected capital expenditures, and meet our liquidity requirements for the following 12 months, including payment of interest and principal on our debt.
Our borrowing base capacity under the ABL Facility was $164.5 million as of January 1, 2017, after giving effect to approximately $91.0 million of revolving credit loans under the ABL Facility, a $37.0 million decrease from $128.0 million of revolving credit loans as of January 3, 2016. As of January 1, 2017, we had total cash and cash equivalents of $16.3 million, total debt (net of debt discounts and issuance costs) of $375.5 million and capital leases of $11.0 million.
Working capital was $304.5 million as of January 1, 2017, an increase of $7.1 million as compared to $297.4 million as of January 3, 2016. The increase in working capital is attributable to growth in the business primarily through acquisitions.
Capital expenditures were $8.8 million for Fiscal 2016 and represent an average of 0.5% net sales over the year. Capital expenditures have averaged $7.9 million from the 2014 Fiscal Year to the 2016 Fiscal Year and represent an average of 0.5% net sales over this time period.
Information about our cash flows, by category, is presented in our statements of cash flows and is summarized below:
|
For the year
|
|||||||||||
|
January 4, 2016 to January 1, 2017
|
December 29, 2014 to January 3, 2016
|
December 30, 2013 to December 28, 2014
|
|||||||||
|
(in millions)
|
|||||||||||
|
Operating activities
|
$
|
72.9
|
|
$
|
71.0
|
|
$
|
52.7
|
|
||
|
Investing activities
|
$
|
(74.9
|
)
|
$
|
(111.0
|
)
|
$
|
(26.9
|
)
|
||
|
Financing activities
|
$
|
(1.8
|
)
|
$
|
49.7
|
|
$
|
(34.2
|
)
|
||
Cash flow from operating activities
Cash flow from operating activities for the 2016 Fiscal Year was $72.9 million compared to $71.0 million for the 2015 Fiscal Year. Cash flow from operations in the 2016 Fiscal Year benefited from our improvement in EBITDA resulting from our sales growth and operational initiatives.
51
Cash flow from operating activities for the 2015 Fiscal Year was $71.0 million as compared to $52.7 million for the 2014 Fiscal Year. Cash flow from operations in the 2015 Fiscal Year benefited from higher net income and an increase in accrued liabilities, primarily attributable to the timing of our annual bonus payment.
Cash flow used in investing activities
Cash used in investing activities for the 2016 Fiscal Year was $74.9 million compared to $111.0 million in the 2015 Fiscal Year. The decrease reflects a lower investment in acquisitions during the 2016 Fiscal Year compared to the 2015 Fiscal Year primarily because we did not have an acquisition as large as the $57.7 million invested in Shemin Nurseries during the 2015 Fiscal Year. Capital expenditures of $8.8 million were also $1.7 million lower in the 2016 Fiscal Year compared to the 2015 Fiscal Year, driven primarily by the timing of investments in certain company initiatives.
Cash used in investing activities for the 2015 Fiscal Year was $111.0 million compared to $26.9 million in the 2014 Fiscal Year; $78.0 million of the increase was related to acquisitions which closed during the 2015 Fiscal Year. The remaining $6.3 million of the increase related primarily to capital expenditures for leasehold improvements and information technology investments.
Cash flow provided by (used in) financing activities
Cash used in financing activities was $1.8 million for the 2016 Fiscal Year compared to cash provided by financing activities of $49.7 million in the 2015 Fiscal Year. The decrease in cash from financing activities was primarily driven by the lower investment in acquisitions. Cash used in financing activities for dividend payments was $189.0 million for the 2016 Fiscal Year due to a one-time special cash dividend of $176.0 million and preferred stock dividends of $13.0 million. During the 2015 Fiscal Year, the preferred stock dividends were paid in-kind and no dividends were paid in cash. Net cash provided by borrowings of $197.7 million in the 2016 Fiscal Year was primarily used to pay the dividends.
Cash provided by financing activities was $49.7 million for the 2015 Fiscal Year compared to a cash use of $34.2 million for the 2014 Fiscal Year. The increase in cash provided reflected borrowings on the ABL Facility during the 2015 Fiscal Year, primarily used to support our growth.
Cash used by financing activities was $34.2 million for the 2014 Fiscal Year due primarily to repayments net of borrowings of $35.7 million on the ABL Facility, partially offset by $5.3 million of proceeds from a common stock issuance to employees.
External Financing
Term Loan Facility
Landscape Holding and Landscape (collectively, the “Term Loan Borrower”) are parties to the Amended and Restated Term Loan Credit Agreement (the “Amended and Restated Term Loan Credit Agreement”) dated April 29, 2016, as amended on November 23, 2016 (providing for a senior secured term loan facility), with UBS AG, Stamford Branch as administrative agent and collateral agent, and the other financial institutions and lenders from time to time party thereto.
Landscape Holding and Landscape are the borrowers under the Term Loan Facility. The Term Loan Facility provides for a senior secured term loan credit facility in the amount of $275.0 million, as modified by the Refinancing described below.
The final maturity date of the Term Loan Facility is April 29, 2022. In addition, however, the Amended and Restated Term Loan Credit Agreement provides the right for individual lenders to extend the maturity date of their loans upon the request of the Term Loan Borrower and without the consent of any other lender.
Subject to certain conditions, without the consent of the then existing lenders (but subject to the receipt of commitments), the Term Loan Facility may be expanded (or a new term loan facility, revolving credit facility or letter of credit facility added) by up to (i) $100.0 million plus (ii) an additional amount that will not cause the net secured leverage ratio after giving effect to the incurrence of that additional amount and any use of proceeds thereof to exceed 3.50 to 1.00.
The Term Loan Facility is subject to mandatory prepayment provisions, covenants and events of default. Failure to comply with these covenants and other provisions could result in an event of default under the Term Loan Facility. If an event of default occurs, the lenders could elect to declare all amounts outstanding under the Term Loan Facility to be immediately due and payable and enforce their interest in collateral pledged under the agreement.
52
Refinancing
On April 29, 2016, we refinanced our then-existing term loan facility, or the “Prior Term Loan Facility,” with the Term Loan Facility. We refer to this refinancing transaction in this Annual Report as the “Refinancing.” We used borrowings under the Term Loan Facility to repay all $60.3 million of borrowings outstanding under the Prior Term Loan Facility, repay $29.9 million of borrowings outstanding under the ABL Facility, pay a special cash dividend of $176.0 million, or the “Special Cash Dividend,” to holders of our common stock and Preferred Stock as of April 29, 2016 and pay fees and expenses associated with the Refinancing.
Term Loan Facility Amendments
On November 23, 2016, we amended our Term Loan Facility to, among other things, (i) add an additional credit facility under the Term Loan Facility consisting of additional term loans (the “Tranche B Term Loans”) in an aggregate principal amount of $273.6 million and (ii) increase the aggregate principal amount of Tranche B Term Loans under the Term Loan Facility to $298.6 million pursuant to an increase supplement. We refer to these amendments as the “Term Loan Facility Amendments.” Proceeds of the Tranche B Term Loans were used to, among other things, (i) repay in full the term loans outstanding under the Term Loan Facility immediately prior to effectiveness of the Term Loan Facility Amendments (the “Existing Term Loans”) and (ii) repay $21.0 million of borrowings outstanding under the ABL Facility.
The Tranche B Term Loans bear interest, at Landscape Holding’s option, at either (i) an adjusted LIBOR rate plus an applicable margin equal to 4.50% or (ii) an alternative base rate plus an applicable margin equal to 3.50%. Voluntary prepayments of the Tranche B Term Loans are permitted at any time, in minimum principal amounts, without premium or penalty, subject to a 1.00% premium payable in connection with certain repricing transactions within the first six months after the date of the initial funding of the Tranche B Term Loans. The other terms of the Tranche B Term Loans are generally the same as the terms applicable to Existing Term Loans.
ABL Facility
Landscape Holding and Landscape are borrowers under the ABL Facility of up to $325.0 million, subject to borrowing base availability. The ABL Facility is secured by a first lien on the inventory and receivables. The ABL Facility is guaranteed by Bidco. Availability is determined using borrowing base calculations of eligible inventory and receivable balances. The interest rate on the ABL Facility is LIBOR plus an applicable margin ranging from 1.25% to 2.00% or an alternate base rate for U.S. dollar-denominated borrowings plus an applicable margin ranging from 0.25% to 1.00%. The interest rates on outstanding balances at January 1, 2017 range from 2.49% to 4.50%. Additionally, the borrowers paid a 0.375% and 0.25% commitment fee on the unfunded amount as of January 1, 2017 and January 3, 2016, respectively. As of January 1, 2017, the outstanding balance on the ABL Facility was $91.0 million. The ABL Facility matures on October 20, 2020.
The ABL Facility is subject to mandatory prepayments if the outstanding loans and letters of credit exceed either the aggregate revolving commitments or the current borrowing base, in an amount equal to such excess. Additionally, the ABL Facility is subject to various covenants requiring minimum financial ratios, and additional borrowings may be limited by these financial ratios. The ABL Facility is also subject to other covenants and events of default. There are no financial covenants included in the ABL Credit Agreement, other than a springing minimum fixed charge coverage ratio of at least 1.00 to 1.00, which is tested only when specified availability is less than 10.0% of the lesser of (x) the then applicable borrowing base and (y) the then aggregate effective commitments under the ABL Facility, and continuing until such time as specified availability has been in excess of such threshold for a period of 30 consecutive calendar days. Failure to comply with the covenants and other provisions included in the ABL Credit Agreement could result in an event of default under the ABL Facility. If an event of default occurs, the lenders could elect to declare all amounts outstanding under the ABL Facility to be immediately due and payable, enforce their interest in collateral pledged under the agreement or restrict the borrowers’ ability to obtain additional borrowings thereunder.
Limitations on Distributions and Dividends by Subsidiaries
The ability of our subsidiaries to make distributions and dividends to us depends on their operating results, cash requirements and financial condition and general business conditions, as well as restrictions under the laws of our subsidiaries’ jurisdictions.
The agreements governing the Credit Facilities restrict the ability of our subsidiaries to pay dividends, make loans or otherwise transfer assets to us. Further, our subsidiaries are permitted under the terms of the Credit Facilities and other indebtedness to incur additional indebtedness that may restrict or prohibit the making of distributions, the payment of dividends or the making of loans to us.
53
Contractual Obligations
The following table presents our contractual obligations and commitments as of January 1, 2017.
|
Less than
|
|
More than
|
|
||||||||||||||||
|
Total
|
|
1 Year
|
|
1-3 Years
|
|
3-5 Years
|
|
5 Years
|
|
||||||||||
|
(in millions)
|
|||||||||||||||||||
|
Long term debt, including current maturities
(1)
|
$
|
388.9
|
|
$
|
3.0
|
|
$
|
5.2
|
|
$
|
97.7
|
|
$
|
283.0
|
|
||||
|
Interest on long term debt
(2)
|
100.4
|
|
21.2
|
|
39.1
|
|
34.6
|
|
5.5
|
|
|||||||||
|
Capital leases
(3)
|
12.1
|
|
4.8
|
|
6.0
|
|
1.3
|
|
—
|
|
|||||||||
|
Operating leases
|
177.6
|
|
36.5
|
|
52.6
|
|
25.2
|
|
63.3
|
|
|||||||||
|
Purchase obligations
(4)
|
50.8
|
|
30.9
|
|
18.1
|
|
1.8
|
|
—
|
|
|||||||||
|
Total obligations and commitments
|
$
|
729.8
|
|
$
|
96.4
|
|
$
|
121.0
|
|
$
|
160.6
|
|
$
|
351.8
|
|
||||
_____________________________________
|
(1)
|
For additional information see “Note 7. Long-Term Debt” in the notes to the condensed consolidated financial statements. In addition, the table excludes the debt issuance costs and debt discounts of $13.4 million.
|
|
(2)
|
The interest on long term debt includes payments for agent administration fees. Interest payments on debt are calculated for future periods using interest rates in effect as of January 1, 2017. Certain of these projected interest payments may differ in the future based on changes in floating interest rates or other factors and events, including our entry into the Term Loan Facility Amendments. The projected interest payments only pertain to obligations and agreements outstanding as of January 1, 2017. See “Note 7. Long-Term Debt” in the notes to the condensed consolidated financial statements for further information regarding our debt instruments.
|
|
(3)
|
Capital leases consist of leases for delivery vehicles.
|
|
(4)
|
Purchase obligations include various commitments with vendors to purchase goods and services, primarily inventory. These purchase obligations are generally cancelable, but we have no intent to cancel and incur a penalty for not meeting the minimum required purchases. In addition, this table excludes purchase obligations of acquisitions made since January 1, 2017.
|
Critical Accounting Policies and Estimates
Critical accounting policies are those that are both important to the accurate portrayal of a company’s financial condition and results and require subjective or complex judgments, often as a result of the need to make estimates about the effect of matters that are inherently uncertain.
In order to prepare financial statements in accordance with GAAP, we make estimates and assumptions that affect the amounts reported in our financial statements and accompanying notes. Certain estimates are particularly sensitive due to their significance to the financial statements and the possibility that future events may be significantly different from our expectations.
We have identified the following accounting policies that require us to make the most subjective or complex judgments in order to fairly present our consolidated financial position and results of operations.
Revenue Recognition
We recognize revenue when the following four basic criteria are met: (1) persuasive evidence of an arrangement exists; (2) delivery has occurred or services have been rendered; (3) the price to the buyer is fixed or determinable; and (4) collectability is reasonably assured.
Sales of products are recorded when the sales price is determinable and the risks and rewards of ownership are transferred to independent parties. This transfer occurs primarily when goods are picked up by a customer at the branch or when goods are delivered to a customer location. In all cases, when a sale is recorded by the Company, no significant uncertainty exists surrounding the purchaser’s obligation to pay.
Our net sales include billings for freight and handling charges and commissions on the sale of control products that we sell as an agent. Net sales are presented net of any discounts, returns, customer rebates and sales or other revenue-based tax. Provisions for returns are estimated and accrued at the time a sale is recognized. We make appropriate provisions based on experience for costs such as
54
doubtful receivables and sales incentives. We also have entered into agency agreements with certain suppliers whereby we operate as a sales agent of those suppliers. The suppliers retain title to their merchandise until we sell it and determine the prices at which we can sell the suppliers’ merchandise. As such, we recognize these agency sales on a net basis and record only their product margin as commission revenue within net sales.
Sales Incentives
We offer certain customers rebates which are accrued based on sales volumes. In addition, we offer a points-based reward program whereby reward points can be redeemed for credit on account or merchandise (such as gift cards or vacation trips). We accrue a liability for this program based on sales volumes and an estimate of points that will be redeemed before expiration. Liabilities for these sales incentives are included in accrued liabilities.
Inventory Valuation
Product inventories represent one of our largest assets and are recorded at net realizable value. Our goal is to manage our inventory so that we minimize out of stock positions. To do this, we maintain an adequate inventory of up to 100,000 SKUs at each branch based on sales history. At the same time, we continuously strive to better manage our slower moving classes of inventory. We monitor our inventory levels by branch and record provisions for excess inventories based on slower moving inventory. We define potential excess inventory as the amount of inventory on hand in excess of the historical usage, excluding items purchased in the last three months. We then review our most recent history of sales and adjustments of such excess inventory and apply our judgment as to forecasted demand and other factors, including liquidation value, to determine the required adjustments to net realizable value. In addition, at the end of each year, we evaluate our inventory at each branch and write off and dispose of obsolete products. Our inventories are generally not susceptible to technological obsolescence.
During the year, we perform periodic cycle counts and write off excess or damaged inventory as needed. Prior to year-end, we take a physical inventory and record any necessary additional write-offs.
Acquisitions
From time to time we enter into strategic acquisitions in an effort to better service existing customers and to attain new customers. When we acquire a controlling financial interest in an entity or group of assets that are determined to meet the definition of a business, we apply the acquisition method described in ASC Topic 805,
Business Combinations
. In accordance with GAAP, the results of the acquisitions we have completed are reflected in our financial statements from the date of acquisition forward.
We allocate the purchase consideration paid to acquire the business to the assets and liabilities acquired based on estimated fair values at the acquisition date, with the excess of purchase price over the estimated fair value of the net assets acquired recorded as goodwill. If during the measurement period (a period not to exceed 12 months from the acquisition date) we receive additional information that existed as of the acquisition date but at the time of the original allocation described above was unknown to us, we make the appropriate adjustments to the purchase price allocation in the reporting period the amounts are determined.
Significant judgment is required to estimate the fair value of intangible assets and in assigning their respective useful lives. Accordingly, we typically engage third-party valuation specialists, who work under the direction of management, for significant tangible and intangible assets. The fair value estimates are based on available historical information and on future expectations and assumptions deemed reasonable by management, but are inherently uncertain.
We typically use an income method to estimate the fair value of intangible assets, which is based on forecasts of the expected future cash flows attributable to the respective assets. Significant estimates and assumptions inherent in the valuations reflect a consideration of other marketplace participants, and include the amount and timing of future cash flows (including expected growth rates and profitability), a brand’s relative market position and the discount rate applied to the cash flows. Unanticipated market or macroeconomic events and circumstances may occur, which could affect the accuracy or validity of the estimates and assumptions.
Determining the useful life of an intangible asset also requires judgment. All of our acquired intangible assets (e.g., trademarks, customer relationships and non-compete arrangements) are expected to have finite useful lives. Our assessment as to whether trademarks have an indefinite life or a finite life is based on a number of factors including competitive environment, market share, brand history, underlying product life cycles, operating plans and the macroeconomic environment of the regions in which the brands are sold. Our estimates of the useful lives of finite-lived intangible assets are primarily based on these same factors.
The costs of finite-lived intangible assets are amortized to expense over their estimated lives. The value of residual goodwill is not amortized, but is tested at least annually for impairment as described in the following note.
55
Goodwill
Goodwill represents the acquired fair value of a business in excess of the fair values of tangible and identified intangible assets acquired and liabilities assumed. We test goodwill on an annual basis as of July fiscal month end and additionally if an event occurs or circumstances change that would indicate the carrying amount may be impaired.
The impairment test is a two-step process. The first step requires us to estimate and compare the fair value of a reporting unit to its carrying amount, including goodwill. If the fair value exceeds the carrying amount, the goodwill is not considered impaired. To the extent a reporting unit’s carrying amount exceeds its fair value, the reporting unit’s goodwill may be impaired and the second step of the impairment test must be performed. The second step involves assigning the reporting unit’s fair value to all of its recognized and unrecognized assets and liabilities as if the reporting unit had been acquired in a business combination in order to determine the implied fair value of the reporting unit’s goodwill as of the testing date. The implied fair value of the reporting unit’s goodwill is then compared to the carrying amount of goodwill to quantify an impairment loss, if any, which would equal the excess of the carrying amount of goodwill over the goodwill’s implied fair value. Each of our reporting units’ fair value has substantially exceeded its carrying value at each test date.
Beneficial Conversion Features
The Successor Company had issued Preferred Stock with dividends that were paid-in-kind. On the day prior to the closing of the IPO, all of the then-outstanding Preferred Stock converted into shares of common stock. Prior to the conversion, we recorded paid-in-kind dividends at carrying value on the issuance date. The paid-in-kind dividends in the form of Preferred Stock contained the same conversion ratio as the Preferred Stock issued on the Closing Date. For certain Preferred Stock issued as dividends paid-in-kind, the stated conversion price was determined to be less than the common stock price as of the dividend payment date, resulting in the recognition of a beneficial conversion feature (“BCF”) in additional paid-in capital. Since the Preferred Stock did not have a fixed or determinable redemption date and was readily convertible at any time, we immediately amortized any BCF recognized through retained earnings.
Stock-Based Compensation
Stock compensation expense for common stock options is based on the estimated fair value on the grant date using the Black-Scholes option pricing model. With respect to the deferred stock units (“DSUs”) and restricted stock units (“RSUs”), grant date fair values are equal to the fair market value of the underlying stock on the date of grant. Stock compensation expense is recorded in selling, general and administrative expenses with a corresponding increase in stockholders’ equity and generally recognized straight-line over the vesting periods. We issue new shares of common stock upon exercise of stock options and RSUs and upon settlement of DSUs.
Recently Issued and Adopted Accounting Pronouncements
See Note 1 to our audited consolidated financial statements included in this Annual Report, for a description of recently issued and adopted accounting pronouncements.
Accounting Pronouncements Issued But Not Yet Adopted
See Note 1 to our audited consolidated financial statements included in this Annual Report, for a description of accounting pronouncements that have been issued but not yet adopted.
56
Quantitative and Qualitative Disclosures about Market Risk
The economy and its impact on discretionary consumer spending, labor wages, fuel, fertilizer and other material costs, home sales, unemployment rates, insurance costs, foreign exchange and medical costs could have a material adverse impact on future results of operations.
We are aware of the potentially unfavorable effects inflationary pressures may create through higher asset replacement costs and related depreciation, higher interest rates and higher material costs.
Commodity Risk
Our operating performance may be affected by price fluctuations in commodity-based products like grass seed, fertilizer and glyphosate that we purchase and sell. We are also exposed to fluctuations in fuel costs as we deliver a substantial portion of the products we sell by truck. We seek to minimize the effects of inflation and changing prices through economies of purchasing and inventory management resulting in cost reductions and productivity improvements as well as price increases to maintain gross margins.
Product Price Risk
Our business model is to buy and sell at current market prices, in quantities approximately equal to estimated customer demand. We do not take significant “long” or “short” positions in the products we sell in an attempt to speculate on changes in product prices. Because we maintain inventories in order to serve the needs of our customers, we are subject to the risk of reductions in market prices for the products we hold in inventory, but we actively manage this risk by adjusting prices and managing our inventory levels.
Interest Rate Risk
We are subject to interest rate risk associated with our debt. While changes in interest rates do not affect the fair value of our variable-rate debt, they do affect future earnings and cash flows through higher interest expense.
|
•
|
The ABL Facility bears interest (i) in the case of U.S. dollar-denominated loans, either at LIBOR or the Prime Rate, at our option, plus applicable borrowing margins and (ii) in the case of Canadian dollar denominated loans, either at the Bankers’ Acceptances Rate or the Canadian Prime Rate, at our option, plus applicable borrowing margins. The borrowing margins are defined by a pricing grid, as included in the ABL Facility agreement, based on average excess availability for the previous quarter.
|
|
•
|
The Term Loan Facility bears interest at LIBOR (subject to a floor of 1.00%) plus a borrowing margin of 4.50% or the Prime Rate plus a borrowing margin of 3.50% at the borrower’s election.
|
A 1% increase in interest rates on our variable-rate debt would increase our annual forecasted interest expense by approximately $3.9 million
.
Credit Risk
We have a credit policy in place and monitor exposure to credit risk on an ongoing basis. We perform credit evaluations on all customers requesting credit above a specified exposure level. In the normal course of business, we provide credit to our customers, perform ongoing credit evaluations of these customers and maintain reserves for potential credit losses. Our typical credit terms extend 30 days from the date of purchase, but terms of up to 60 days are not uncommon. We typically have limited risk from a concentration of credit risk as no individual customer represents greater than 10% of the outstanding accounts receivable balance. Bad debt reserves, which we use as a proxy for our bad debt exposure, were 2.5% of gross receivables as of January 1, 2017.
Investments, if any, are only in liquid securities and only with counterparties with appropriate credit ratings. Transactions involving derivative financial instruments are with counterparties with which we have a signed netting agreement and which have appropriate credit ratings. We do not expect any counterparty to fail to meet its obligations.
57
|
INDEX TO CONSOLIDATED FINANCIAL STATEMENTS
|
||
|
Page
|
||
58
REPORT OF INDEPENDENT REGISTERED PUBLIC ACCOUNTING FIRM
To the Board of Directors and Stockholders of
SiteOne Landscape Supply, Inc.
Roswell, GA
We have audited the accompanying consolidated balance sheets of SiteOne Landscape Supply, Inc. and subsidiaries (the "Company") as of January 1, 2017 and January 3, 2016, and the related consolidated statements of operations, comprehensive income, equity, and cash flows for each of the three years in the period ended January 1, 2017. Our audits also included the financial statement schedule listed in the Index at Item 15. These financial statements and financial statement schedule are the responsibility of the Company's management. Our responsibility is to express an opinion on the financial statements and financial statement schedule based on our audits.
We conducted our audits in accordance with the standards of the Public Company Accounting Oversight Board (United States). Those standards require that we plan and perform the audit to obtain reasonable assurance about whether the financial statements are free of material misstatement. The Company is not required to have, nor were we engaged to perform, an audit of its internal control over financial reporting. Our audits included consideration of internal control over financial reporting as a basis for designing audit procedures that are appropriate in the circumstances, but not for the purpose of expressing an opinion on the effectiveness of the Company's internal control over financial reporting. Accordingly, we express no such opinion. An audit also includes examining, on a test basis, evidence supporting the amounts and disclosures in the financial statements, assessing the accounting principles used and significant estimates made by management, as well as evaluating the overall financial statement presentation. We believe that our audits provide a reasonable basis for our opinion.
In our opinion, such consolidated financial statements present fairly, in all material respects, the financial position of SiteOne Landscape Supply, Inc. and subsidiaries as of January 1, 2017 and January 3, 2016, and the results of their operations and their cash flows for each of the three years in the period ended January 1, 2017, in conformity with accounting principles generally accepted in the United States of America. Also, in our opinion, such financial statement schedule, when considered in relation to the basic consolidated financial statements taken as a whole, present fairly in all material respects the information set forth therein.
/s/ DELOITTE & TOUCHE LLP
Atlanta, Georgia
March 15, 2017
59
SiteOne Landscape Supply, Inc.
(In millions, except share and per share data)
|
January 1, 2017
|
January 3, 2016
|
|||||||
|
Assets
|
||||||||
|
Current assets
|
||||||||
|
Cash and cash equivalents
|
$
|
16.3
|
|
$
|
20.1
|
|
||
|
Accounts receivable, net of allowance for doubtful accounts of $4.3 and $3.6 for 2016 and 2015, respectively
|
169.0
|
|
136.8
|
|
||||
|
Inventory, net
|
289.6
|
|
265.9
|
|
||||
|
Income tax receivable
|
1.6
|
|
7.3
|
|
||||
|
Prepaid expenses and other current assets
|
13.5
|
|
12.1
|
|
||||
|
Total current assets
|
490.0
|
|
442.2
|
|
||||
|
Property and equipment, net (Note 3)
|
69.8
|
|
66.2
|
|
||||
|
Goodwill (Note 4)
|
70.8
|
|
48.0
|
|
||||
|
Intangible assets, net (Note 4)
|
103.3
|
|
104.3
|
|
||||
|
Other assets
|
8.7
|
|
8.0
|
|
||||
|
Total assets
|
$
|
742.6
|
|
$
|
668.7
|
|
||
|
Liabilities and Stockholders’ Equity
|
||||||||
|
Current liabilities:
|
||||||||
|
Accounts payable
|
$
|
108.3
|
|
$
|
86.4
|
|
||
|
Current portion of capital leases (Note 5)
|
4.3
|
|
4.0
|
|
||||
|
Accrued compensation
|
36.7
|
|
30.0
|
|
||||
|
Long term debt, current portion (Note 7)
|
3.0
|
|
0.6
|
|
||||
|
Accrued liabilities
|
33.2
|
|
23.8
|
|
||||
|
Total current liabilities
|
185.5
|
|
144.8
|
|
||||
|
Other long-term liabilities
|
9.1
|
|
8.9
|
|
||||
|
Capital leases, less current portion (Note 5)
|
6.7
|
|
7.1
|
|
||||
|
Deferred tax liabilities (Note 1 and Note 8)
|
20.0
|
|
26.2
|
|
||||
|
Long term debt, less current portion (Note 1 and Note 7)
|
372.5
|
|
177.1
|
|
||||
|
Total liabilities
|
593.8
|
|
364.1
|
|
||||
|
Commitment and contingencies (Note 10)
|
|
|
||||||
|
Redeemable convertible preferred stock (Note 11)
|
—
|
|
216.8
|
|
||||
|
Stockholders’ equity (Note 1 and Note 11):
|
||||||||
|
Common stock, par value $0.01; 1,000,000,000 shares authorized; 39,597,532 and 14,259,998 shares issued, and 39,576,621 and 14,250,111 shares outstanding at January 1, 2017 and January 3, 2016, respectively
|
0.4
|
|
0.1
|
|
||||
|
Additional paid-in capital
|
219.3
|
|
113.1
|
|
||||
|
Accumulated deficit
|
(69.7
|
)
|
(24.2
|
)
|
||||
|
Accumulated other comprehensive loss
|
(1.2
|
)
|
(1.2
|
)
|
||||
|
Total stockholders’ equity
|
148.8
|
|
87.8
|
|
||||
|
Total liabilities and stockholders’ equity
|
$
|
742.6
|
|
$
|
668.7
|
|
||
See Notes to Consolidated Financial Statements.
60
SiteOne Landscape Supply, Inc.
(In millions, except share and per share data)
|
For the year
January 4, 2016 to January 1, 2017 |
For the year
December 29, 2014 to January 3, 2016 |
For the year
December 30, 2013 to December 28, 2014 |
||||||||||
|
Net sales
|
$
|
1,648.2
|
|
$
|
1,451.6
|
|
$
|
1,176.6
|
|
|||
|
Cost of goods sold
|
1,132.5
|
|
1,022.5
|
|
865.5
|
|
||||||
|
Gross profit
|
515.7
|
|
429.1
|
|
311.1
|
|
||||||
|
Selling, general and administrative expenses
|
446.5
|
|
373.3
|
|
269.0
|
|
||||||
|
Other income
|
4.8
|
|
4.0
|
|
3.1
|
|
||||||
|
Operating income
|
74.0
|
|
59.8
|
|
45.2
|
|
||||||
|
Interest and other non-operating (income) expenses
|
22.1
|
|
11.4
|
|
9.1
|
|
||||||
|
Net income before taxes
|
51.9
|
|
48.4
|
|
36.1
|
|
||||||
|
Income tax expense
|
21.3
|
|
19.5
|
|
14.4
|
|
||||||
|
Net income
|
30.6
|
|
28.9
|
|
21.7
|
|
||||||
|
Less:
|
||||||||||||
|
Redeemable convertible preferred stock dividends
|
9.6
|
|
25.1
|
|
21.8
|
|
||||||
|
Redeemable convertible preferred stock beneficial conversion feature
|
—
|
|
18.6
|
|
3.9
|
|
||||||
|
Special cash dividend paid to preferred stockholders
|
112.4
|
|
—
|
|
—
|
|
||||||
|
Net loss attributable to common shares
|
$
|
(91.4
|
)
|
$
|
(14.8
|
)
|
$
|
(4.0
|
)
|
|||
|
Net loss per common share:
|
||||||||||||
|
Basic
|
$
|
(3.01
|
)
|
$
|
(1.04
|
)
|
$
|
(0.29
|
)
|
|||
|
Diluted
|
$
|
(3.01
|
)
|
$
|
(1.04
|
)
|
$
|
(0.29
|
)
|
|||
|
Weighted average number of common shares outstanding:
|
||||||||||||
|
Basic
|
30,316,087
|
|
14,209,843
|
|
13,818,138
|
|
||||||
|
Diluted
|
30,316,087
|
|
14,209,843
|
|
13,818,138
|
|
||||||
See Notes to Consolidated Financial Statements.
61
SiteOne Landscape Supply, Inc.
Consolidated Statements of Comprehensive Income
(In millions)
|
For the year
January 4, 2016 to January 1, 2017 |
For the year
December 29, 2014 to January 3, 2016 |
For the year
December 30, 2013 to December 28, 2014 |
||||||||||
|
Net income (loss)
|
$
|
30.6
|
|
$
|
28.9
|
|
$
|
21.7
|
|
|||
|
Foreign currency translation adjustments
|
—
|
|
(0.8
|
)
|
(0.4
|
)
|
||||||
|
Comprehensive income
|
$
|
30.6
|
|
$
|
28.1
|
|
$
|
21.3
|
|
|||
See Notes to Consolidated Financial Statements.
62
SiteOne Landscape Supply, Inc.
Consolidated Statements of Equity
(In millions, shares in thousands)
|
Common
Stock (shares) |
Common
Stock ($) |
Additional
Paid-in-Capital |
Accumulated
Deficit |
Accumulated
Other Comprehensive Loss |
Total Equity
|
||||||||||||||||||
|
Balance at December 29, 2013
|
13,477.0
|
|
$
|
0.1
|
|
$
|
78.1
|
|
$
|
(9.5
|
)
|
$
|
—
|
|
$
|
68.7
|
|
||||||
|
Net income
|
—
|
|
—
|
|
—
|
|
21.7
|
|
—
|
|
21.7
|
|
|||||||||||
|
Other comprehensive loss
|
—
|
|
—
|
|
—
|
|
—
|
|
(0.4
|
)
|
(0.4
|
)
|
|||||||||||
|
Redeemable convertible preferred stock dividends
|
—
|
|
—
|
|
—
|
|
(18.6
|
)
|
—
|
|
(18.6
|
)
|
|||||||||||
|
Redeemable convertible preferred stock beneficial conversion feature
|
—
|
|
—
|
|
3.9
|
|
(3.9
|
)
|
—
|
|
—
|
|
|||||||||||
|
Shares purchased by employees
|
611.7
|
|
—
|
|
6.3
|
|
—
|
|
—
|
|
6.3
|
|
|||||||||||
|
Stock based compensation
|
—
|
|
—
|
|
1.1
|
|
—
|
|
—
|
|
1.1
|
|
|||||||||||
|
Balance at December 28, 2014
|
14,088.7
|
|
$
|
0.1
|
|
$
|
89.4
|
|
$
|
(10.3
|
)
|
$
|
(0.4
|
)
|
$
|
78.8
|
|
||||||
|
Net income
|
—
|
|
—
|
|
—
|
|
28.9
|
|
—
|
|
28.9
|
|
|||||||||||
|
Other comprehensive loss
|
—
|
|
—
|
|
—
|
|
—
|
|
(0.8
|
)
|
(0.8
|
)
|
|||||||||||
|
Redeemable convertible preferred stock dividends
|
—
|
|
—
|
|
—
|
|
(24.2
|
)
|
—
|
|
(24.2
|
)
|
|||||||||||
|
Redeemable convertible preferred stock beneficial conversion feature
|
—
|
|
—
|
|
18.6
|
|
(18.6
|
)
|
—
|
|
—
|
|
|||||||||||
|
Shares purchased by employees
|
171.3
|
|
—
|
|
2.2
|
|
—
|
|
—
|
|
2.2
|
|
|||||||||||
|
Treasury stock
|
(9.9
|
)
|
—
|
|
(0.1
|
)
|
(0.1
|
)
|
|||||||||||||||
|
Stock based compensation
|
—
|
|
—
|
|
3.0
|
|
—
|
|
—
|
|
3.0
|
|
|||||||||||
|
Balance at January 3, 2016
|
14,250.1
|
|
$
|
0.1
|
|
$
|
113.1
|
|
$
|
(24.2
|
)
|
$
|
(1.2
|
)
|
$
|
87.8
|
|
||||||
|
Net income
|
—
|
|
—
|
|
—
|
|
30.6
|
|
—
|
|
30.6
|
|
|||||||||||
|
Other comprehensive income
|
—
|
|
—
|
|
—
|
|
—
|
|
—
|
|
—
|
|
|||||||||||
|
Redeemable convertible preferred stock dividends
|
—
|
|
—
|
|
0.8
|
|
(13.8
|
)
|
—
|
|
(13.0
|
)
|
|||||||||||
|
Special cash dividend paid to preferred and common stockholders
|
—
|
|
—
|
|
(113.7
|
)
|
(62.3
|
)
|
—
|
|
(176.0
|
)
|
|||||||||||
|
Issuance of common shares from conversion of redeemable convertible preferred stock
|
25,303.1
|
|
0.3
|
|
216.5
|
|
—
|
|
—
|
|
216.8
|
|
|||||||||||
|
Issuance of common shares under stock based compensation plan
|
34.4
|
|
—
|
|
0.2
|
|
—
|
|
—
|
|
0.2
|
|
|||||||||||
|
Excess tax benefits from stock based compensation
|
—
|
|
—
|
|
0.3
|
|
—
|
|
—
|
|
0.3
|
|
|||||||||||
|
Treasury stock
|
(11.0
|
)
|
|
|
(0.1
|
)
|
—
|
|
—
|
|
(0.1
|
)
|
|||||||||||
|
Stock based compensation
|
—
|
|
—
|
|
2.2
|
|
—
|
|
—
|
|
2.2
|
|
|||||||||||
|
Balance at January 1, 2017
|
39,576.6
|
|
0.4
|
|
219.3
|
|
(69.7
|
)
|
(1.2
|
)
|
148.8
|
|
|||||||||||
See Notes to Consolidated Financial Statements.
63
SiteOne Landscape Supply, Inc.
(In millions)
|
For the year
January 4, 2016 to January 1, 2017 |
For the year
December 29, 2014 to January 3, 2016 |
For the year
December 30, 2013 to December 28, 2014 |
||||||||||
|
Cash Flows from Operating Activities:
|
||||||||||||
|
Net income
|
$
|
30.6
|
|
$
|
28.9
|
|
$
|
21.7
|
|
|||
|
Adjustments to reconcile net income (loss) to net cash provided by operating activities:
|
||||||||||||
|
Depreciation
|
14.2
|
|
12.8
|
|
10.3
|
|
||||||
|
Stock-based compensation
|
4.7
|
|
3.0
|
|
2.1
|
|
||||||
|
Amortization of software and intangible assets
|
22.8
|
|
18.4
|
|
10.0
|
|
||||||
|
Amortization of debt related costs
|
2.5
|
|
3.0
|
|
3.0
|
|
||||||
|
Loss on extinguishment of debt
|
1.7
|
|
1.2
|
|
—
|
|
||||||
|
Loss on sale of equipment
|
—
|
|
0.4
|
|
0.6
|
|
||||||
|
Deferred income taxes
|
(9.9
|
)
|
(7.5
|
)
|
0.6
|
|
||||||
|
Other
|
(0.3
|
)
|
0.3
|
|
—
|
|
||||||
|
Changes in operating assets and liabilities:
|
||||||||||||
|
Receivables
|
(18.7
|
)
|
(11.4
|
)
|
4.1
|
|
||||||
|
Inventory
|
(0.6
|
)
|
3.7
|
|
(6.4
|
)
|
||||||
|
Income tax receivable
|
6.6
|
|
6.3
|
|
(12.0
|
)
|
||||||
|
Prepaid expenses and other assets
|
0.2
|
|
5.0
|
|
2.8
|
|
||||||
|
Accounts payable
|
8.2
|
|
(8.9
|
)
|
13.5
|
|
||||||
|
Accrued expenses and other liabilities
|
10.9
|
|
15.8
|
|
2.4
|
|
||||||
|
Net Cash Provided By Operating Activities
|
$
|
72.9
|
|
$
|
71.0
|
|
$
|
52.7
|
|
|||
|
Cash Flows from Investing Activities:
|
||||||||||||
|
Purchases of property and equipment
|
(8.8
|
)
|
(10.5
|
)
|
(4.3
|
)
|
||||||
|
Acquisitions, net of cash acquired
|
(66.4
|
)
|
(100.7
|
)
|
(22.7
|
)
|
||||||
|
Proceeds from the sale of property and equipment
|
0.3
|
|
0.2
|
|
0.1
|
|
||||||
|
Net Cash Used In Investing Activities
|
$
|
(74.9
|
)
|
$
|
(111.0
|
)
|
$
|
(26.9
|
)
|
|||
|
Cash Flows from Financing Activities:
|
||||||||||||
|
Equity proceeds from common stock
|
0.2
|
|
2.2
|
|
5.3
|
|
||||||
|
Purchase of treasury stock
|
(0.2
|
)
|
(0.1
|
)
|
—
|
|
||||||
|
Special cash dividend
|
(176.0
|
)
|
—
|
|
—
|
|
||||||
|
Other dividends paid
|
(13.0
|
)
|
—
|
|
—
|
|
||||||
|
Borrowings under term loan
|
570.9
|
|
—
|
|
—
|
|
||||||
|
Repayments under term loan
|
(336.2
|
)
|
(0.8
|
)
|
(0.5
|
)
|
||||||
|
Borrowings on asset-based credit facility
|
355.5
|
|
364.1
|
|
229.3
|
|
||||||
|
Repayments on asset-based credit facility
|
(392.5
|
)
|
(310.4
|
)
|
(265.0
|
)
|
||||||
|
Debt issue costs paid
|
(4.2
|
)
|
(1.0
|
)
|
—
|
|
||||||
|
Payments on capital lease obligations
|
(4.2
|
)
|
(4.3
|
)
|
(3.3
|
)
|
||||||
|
Other financing activities
|
(2.1
|
)
|
—
|
|
—
|
|
||||||
|
Net Cash Provided By (Used In) Financing Activities
|
$
|
(1.8
|
)
|
$
|
49.7
|
|
$
|
(34.2
|
)
|
|||
|
Effect of exchange rate on cash
|
—
|
|
(0.2
|
)
|
(0.3
|
)
|
||||||
|
Net Change In Cash
|
(3.8
|
)
|
9.5
|
|
(8.7
|
)
|
||||||
|
Cash and cash equivalents:
|
||||||||||||
|
Beginning
|
20.1
|
|
10.6
|
|
19.3
|
|
||||||
|
Ending
|
$
|
16.3
|
|
$
|
20.1
|
|
$
|
10.6
|
|
|||
|
Supplemental Disclosures of Cash Flow Information:
|
||||||||||||
|
Cash paid during the year for interest
|
16.5
|
|
8.4
|
|
5.3
|
|
||||||
|
Cash paid during the year for income taxes
|
24.3
|
|
21.9
|
|
25.6
|
|
||||||
|
Supplemental Disclosures of Noncash Investing and Financing Information:
|
||||||||||||
|
Acquisition of property and equipment through capital leases
|
4.3
|
|
4.8
|
|
5.1
|
|
||||||
See Notes to Consolidated Financial Statements.
64
SiteOne Landscape Supply, Inc.
Notes to Consolidated Financial Statements
Nature of business:
SiteOne Landscape Supply, Inc. is a supplier of fertilizer and control products, irrigation supplies, landscape accessories, nursery goods, hardscapes and outdoor lighting to green industry professionals. The Company also provides value-added consultative services to complement its product offering and to help customers operate and grow their businesses. Substantially all of SiteOne Landscape Supply, Inc.’s sales are to customers located in the United States of America (“U.S.”), with less than
two
percent of sales and total assets in Canada and other countries. The Company currently has over
450
branches. Based on the nature of SiteOne Landscape Supply, Inc.’s products and customers’ business cycles, sales are significantly higher in the spring and summer months.
Common Stock Split
On April 29, 2016, the Company filed a Certificate of Amendment to amend and restate the Company’s Certificate of Incorporation in the State of Delaware, effecting an
11.6181
for 1 common stock split. Each stockholder’s percentage ownership and proportional voting power remained unchanged as a result of the stock split. All applicable share data, per share amounts and related information in the consolidated financial statements and notes thereto have been adjusted retroactively to give effect to the
11.6181
for 1 common stock split.
Refinancing and Amendments of Term Loan and Special Cash Dividend
On April 29, 2016, the Company refinanced the existing term loan facility (the “Prior Term Loan Facility”) with an amended and restated
$275.0 million
term loan facility maturing in April 2022 (the “Term Loan Facility”). On April 29, 2016, the proceeds from the Term Loan Facility were used to repay all
$60.3 million
of borrowings outstanding under the Prior Term Loan Facility, to repay
$29.9 million
of borrowings outstanding under the senior asset-based credit facility (the “ABL Facility”), and to pay fees and expenses associated with the refinancing transaction.
On May 2, 2016, a one-time special cash dividend of
$176.0 million
was paid to existing holders of the Company’s common stock and cumulative convertible participating redeemable preferred stock (“Redeemable Convertible Preferred Stock”) as of April 29, 2016 out of the proceeds from the Refinancing of the Term Loan Facility. Of the
$176.0 million
paid to stockholders,
$112.4 million
was paid to holders of the Redeemable Convertible Preferred Stock in accordance with their right to participate in all distributions to common stockholders on an as-converted basis. The Redeemable Convertible Preferred Stock converted to common stock in accordance with its terms on May 16, 2016 resulting in the issuance by the Company of an additional
25,303,164
shares of its common stock which common shares are included in the weighted average common shares outstanding from that date forward. Prior to May 16, 2016, the Company’s earnings (loss) per share calculation reflected the impact of the Redeemable Convertible Preferred Stock. Since the special cash dividend was paid prior to conversion of the Redeemable Convertible Preferred Stock, the
$112.4 million
is reported as a reduction of net income attributable to common shares for the year ended January 1, 2017. In conjunction with the payment of the special cash dividend, the Company reduced the exercise price of certain outstanding options and made a cash payment of
$2.8 million
to certain holders of options to offset the dilutive impact of the special cash dividend.
On November 23, 2016, the Company amended the Term Loan Facility to, among other things, (i) add an additional credit facility under the Term Loan Facility consisting of additional term loans (the “Tranche B Term Loans”) in an aggregate principal amount of
$273.6 million
and (ii) increase the aggregate principal amount of Tranche B Term Loans under the Term Loan Facility to
$298.6 million
pursuant to an increase supplement. Proceeds of the Tranche B Term Loans were used to, among other things, (i) repay in full the term loans outstanding under the Term Loan Facility immediately prior to effectiveness of the Term Loan Facility Amendments (the “Existing Term Loans”) and (ii) repay
$21.0 million
of borrowings outstanding under the ABL Facility.
Initial Public Offering
On May 11, 2016, the Company’s registration statement on Form S-1 (Registration No. 333-206444) relating to an initial public offering (“IPO”) of its common stock was declared effective by the U.S. Securities and Exchange Commission (“SEC”). On May 17, 2016, the Company completed the IPO at a price to the public of
$21.00
per share. In connection with the IPO, certain of the Company’s stockholders sold an aggregate of
10,000,000
shares of common stock. The underwriters also exercised their option to purchase an additional
1,500,000
shares of common stock, at the public offering price less the underwriting discounts and commissions. The selling stockholders received all of the net proceeds and bore all commissions and discounts from the sale of the Company’s common stock. The Company did not receive any proceeds from the IPO.
65
Secondary Offering
On November 29, 2016, the Company’s registration statement on Form S-1 (Registration No. 333-214628) relating to a secondary offering (the “Secondary Offering”) of its common stock was declared effective by the SEC. On December 5, 2016, the Company completed the Secondary Offering at a price to the public of
$33.00
per share. In connection with the Secondary Offering, certain of the Company’s stockholders sold an aggregate of
9,000,000
shares of common stock. The underwriters also exercised their option to purchase an additional
1,350,000
shares of common stock at the public offering price less the underwriting discounts and commissions. The selling stockholders received all of the net proceeds and bore all commissions and discounts from the sale of the Company’s common stock. The Company did not receive any proceeds from the Secondary Offering.
Basis of financial statement presentation:
SiteOne Landscape Supply, Inc. (hereinafter, collectively with all its consolidated subsidiaries, referred to as the “Company” or individually as “Holdings”) indirectly owns
100%
of the membership interest in SiteOne Landscape Supply Holding, LLC (referred to herein as “Landscape Holding”). Landscape Holding is parent and sole owner of SiteOne Landscape Supply, LLC (referred to herein as “Landscape”). Prior to the transaction described below, Deere & Company (“Deere”) was the sole owner of SiteOne Landscape Supply Holding, LLC.
On December 23, 2013 (the “Closing Date”), the Company acquired
100%
of the ownership interest in Landscape Holding from Deere in exchange for common shares of the Company initially representing
40%
of the outstanding capital stock (on an as-converted basis) plus cash consideration of approximately
$314 million
, net of pre-closing and post-closing adjustments. In order to facilitate the transaction, the Company issued cumulative convertible participating redeemable preferred stock (“Redeemable Convertible Preferred Stock”) to Clayton, Dubilier & Rice, LLC (“CD&R”) for total consideration of
$174 million
initially representing
60%
of the outstanding capital stock (on an as-converted basis). As part of the same transaction, Landscape Holding also acquired from Deere the affiliated company LESCO, Inc. (“LESCO”). The Company continues to be the sole owner of Landscape Holding. The aforementioned transactions described in this paragraph are referred to herein as the “CD&R Acquisition”.
The Company’s chief operating decision maker (“CODM”) manages the business as a single reportable segment. Within the organizational framework, the same operational resources support multiple geographical regions and performance is evaluated primarily by the CODM at a consolidated level. The CODM also evaluates regional performance based on financial and operational measures and receives discrete financial information on a regional basis. Since all of the Company’s regions have similar operations and share similar economic characteristics, the Company aggregates regions into a single operating and reportable segment. These similarities include 1) long-term financial performance, 2) the nature of products and services, 3) the types of customers the Company sells to and 4) the distribution methods used. Further, all of the Company’s product categories have similar supply chain processes, classes of customers and economic characteristics.
The accompanying audited financial statements of the Company included herein have been prepared in accordance with generally accepted accounting principles in the United States of America (“U.S. GAAP”).
The Consolidated Statements of Operations, Comprehensive income (loss), Equity and Cash Flows for the Company are presented for the fiscal years ended
January 1, 2017
,
January 3, 2016
and
December 28, 2014
. The consolidated financial statements for the Company include the assets and liabilities used in operating the Company’s business, including entities in which the Company owns or controls more than
50%
of the voting shares. The Company owns
100%
of all subsidiaries presented in these financial statements. All intercompany balances and transactions have been eliminated in consolidation.
Significant accounting policies:
Use of estimates in the preparation of financial statements
: The preparation of financial statements in conformity with generally accepted accounting principles (GAAP) requires management to make estimates and assumptions that affect the reported amounts of assets and liabilities and disclosure of contingent assets and liabilities at the date of the financial statements and the reported amounts of revenues and expenses during the reporting period. Actual results could differ from those estimates.
Fiscal year
: The Company’s fiscal year is a 52- or 53-week period ending on the Sunday nearest to December 31. The year ended
January 1, 2017
includes 52 weeks. The year ended
January 3, 2016
includes 53 weeks. The year ended
December 28, 2014
includes 52 weeks.
Cash and cash equivalents
: Cash and cash equivalents include primarily cash on deposit with banks which, at times, may exceed federally insured limits. The Company has not experienced any losses in these accounts. Cash and cash equivalents also include unsettled credit card transactions.
66
Accounts receivable
: The Company carries accounts receivable at the original invoice amount less any charge-offs and the allowance for credit losses and doubtful accounts. Allowances for credit losses and doubtful accounts are maintained in amounts considered to be appropriate in relation to the receivables outstanding based on collection experience, economic conditions and credit risk quality. Receivables are written-off to the allowance when an account is considered uncollectible.
Activity in the allowance for doubtful accounts for the periods was as follows (in millions):
|
|
For the year
January 4, 2016 to January 1, 2017 |
For the year
December 29, 2014 to January 3, 2016 |
For the year
December 30, 2013 to December 28, 2014 |
|||||||||
|
Beginning balance
|
$
|
3.6
|
|
$
|
3.0
|
|
$
|
—
|
|
|||
|
Provision (reduction) for allowance
|
1.1
|
|
1.0
|
|
(0.8
|
)
|
||||||
|
Net charges and (recoveries)
|
(0.4
|
)
|
(0.4
|
)
|
3.8
|
|
||||||
|
Ending balance
|
$
|
4.3
|
|
$
|
3.6
|
|
$
|
3.0
|
|
|||
Inventory
: The majority of the Company’s inventories are valued at the lower of cost or net realizable value, with cost determined by the first-in, first-out (“FIFO”) method. Inventory is primarily considered to be finished goods. The Company establishes a reserve for excess, slow-moving, and obsolete inventory that is equal to the difference between the cost and estimated net realizable value for that inventory. These reserves are based on a review of planned and historical sales. The reserve for obsolete and excess inventory was approximately
$4.8 million
and
$4.4 million
as of
January 1, 2017
and
January 3, 2016
, respectively.
Property and equipment, net
: Property and equipment is stated at cost less accumulated depreciation. Depreciation is computed on property and equipment using the straight-line method over the estimated useful lives of the assets, as noted below. Leasehold improvements are depreciated over the lesser of their estimated useful lives or the remaining lease terms. Depreciation on property and equipment under capital lease is included in depreciation expense. Expenditures for replacement or major renewals of significant items are capitalized. Expenditures for maintenance, repairs and minor renewals are generally charged to expense as incurred.
|
Asset Class
|
Estimated Useful Life
|
|
|
Buildings and improvements
|
20 years
|
|
|
Store equipment
|
2 to 12 years
|
|
|
Furniture and fixtures
|
2 to 12 years
|
|
|
Auto and truck
|
2 to 6 years
|
|
|
Tooling
|
7 years
|
|
|
Leasehold improvements
|
Shorter of the estimated useful life or the term of the lease, considering renewal options expected to be exercised.
|
|
Acquisitions
: When the Company acquires a controlling financial interest in an entity or group of assets that are determined to meet the definition of a business, the acquisition method described in ASC Topic 805,
Business Combinations,
is applied. The Company allocates the purchase consideration paid to acquire the business to the assets and liabilities acquired based on estimated fair values at the acquisition date, with the excess of purchase price over the estimated fair value of the net assets acquired recorded as goodwill. If during the measurement period (a period not to exceed 12 months from the acquisition date) the Company receives additional information that existed as of the acquisition date but at the time of the original allocation described above was unknown, the Company makes the appropriate adjustment to the purchase price allocation in the reporting period in which the adjustment is identified.
Goodwill impairment
: Goodwill represents the acquired fair value of a business in excess of the fair values of tangible and identified intangible assets acquired and liabilities assumed. The Company tests goodwill on an annual basis as of July fiscal month end and additionally if an event occurs or circumstances change that would indicate the carrying amount may be impaired.
The impairment test is a two-step process. The first step requires the Company to estimate and compare the fair value of a reporting unit to its carrying amount, including goodwill. If the fair value exceeds the carrying amount, the goodwill is not considered impaired. To the extent a reporting unit’s carrying amount exceeds its fair value, the reporting unit’s goodwill may be impaired and the second step of the impairment test must be performed. The second step involves assigning the reporting unit’s fair value to all of its recognized and unrecognized assets and liabilities as if the reporting unit had been acquired in a business combination in order to determine the implied fair value of the reporting unit’s goodwill as of the testing date. The implied fair value of the reporting unit’s goodwill is then compared to the carrying amount of goodwill to quantify an impairment loss, if any, which would equal the excess of the carrying amount of goodwill
67
over the goodwill’s implied fair value.
No
impairment occurred during the periods presented. See Note 4 for more detailed description of goodwill.
Intangible assets, net
: Intangible assets include customer relationships, and trademarks and other, acquired through acquisitions. Intangibles assets with finite useful lives are amortized on a straight-line or an accelerated method of amortization over their estimated useful lives. An accelerated amortization method reflecting the pattern in which the asset will be consumed is utilized if that pattern can be reliably determined. If that pattern cannot be reliably determined, a straight-line amortization method is used. The Company considers the period of expected cash flows and underlying data used to measure the fair value of the intangible assets when selecting a useful life. Refer to Note 4 for a more detailed description of intangible asset amortization.
Fair value measurement
: Fair value is defined as an exit price, representing an amount that would be received to sell an asset or the amount paid to transfer a liability in the principal or most advantageous market for the asset or liability in an orderly transaction between market participants on the measurement date. The inputs used to measure fair value are prioritized into the following three-tiered value hierarchy:
|
•
|
Level 1: Unadjusted quoted prices in active markets for identical assets or liabilities.
|
|
•
|
Level 2: Unadjusted quoted prices in active markets for similar assets or liabilities, unadjusted quoted prices for identical or similar assets or liabilities in markets that are not active or inputs, other than quoted prices in active markets, which are observable either directly or indirectly.
|
|
•
|
Level 3: Unobservable inputs for which there is little or no market data.
|
The hierarchy is based upon the transparency of inputs to the valuation of an asset or liability as of the measurement date. The classification of fair value measurement within the hierarchy is based upon the lowest level of input that is significant to the measurement.
The Company’s financial instruments consist of cash and cash equivalents, accounts receivables, and long-term debt. The variable interest rate on the long-term debt is reflective of current market borrowing rates. As such, the Company has determined that the carrying value of these financial instruments approximates fair value. Because the long-term debt is not traded in an active or inactive market, and because no similar instruments or those with similar characteristics trade in an active market, the debt instruments, including the short-term portion, are Level 3.
Revenue recognition
: We recognize revenue when the following four basic criteria are met: (1) persuasive evidence of an arrangement exists; (2) delivery has occurred or services have been rendered; (3) the price to the buyer is fixed or determinable; and (4) collectability is reasonably assured.
Sales of products are recorded when the sales price is determinable and the risks and rewards of ownership are transferred to independent parties. This transfer occurs primarily when goods are picked up by a customer at the store or when goods are delivered to a customer location. In all cases, when a sale is recorded by the Company, no significant uncertainty exists surrounding the purchaser’s obligation to pay. Returns are estimated and accrued at the time a sale is recognized. The Company makes appropriate provisions based on experience for costs such as doubtful receivables and sales incentives. The Company also has entered into agency agreements with certain of its suppliers whereby the Company operates as a sales agent of those suppliers. The suppliers retain title to their merchandise until it is sold by the Company and determine the prices at which the Company can sell the suppliers’ merchandise. As such, the Company recognizes these agency sales on a net basis and records only the product margin as commission revenue within Net sales.
Sales incentives
: The Company offers certain customers rebates which are accrued based on sales volumes. In addition, the Company offers a points-based reward program whereby reward points can be redeemed for merchandise or credit on account (such as gift cards or vacation trips). The Company accrues a liability for this program based on sales volumes and an estimate of points that will be redeemed before expiration. Liabilities for these sales incentives are included in Accrued Liabilities.
Sales taxes
: The Company collects and remits taxes assessed by different governmental authorities that are both imposed on and concurrent with revenue producing transactions between the Company and its customers. These taxes may include sales, use, value-added and some excise taxes. The Company reports the collection of these taxes on a net basis (excluded from sales).
Cost of goods sold
: Cost of goods sold includes all inventory costs, such as purchase price from suppliers, net of any rebates received, as well as inbound freight and handling, and other costs associated with the inventory and is exclusive of the cost to deliver the products to customers.
Shipping and handling costs
: Shipping and handling costs associated with inbound freight are included in Cost of goods sold.
Warranty Reserves:
Provisions for estimated warranty costs for the return of nursery product are provided for in the same period the related sales are recorded. The Company offers product warranties on selected nursery items. The warranty reserve is based on historical
68
and current trends. The warranty reserve included in Accrued liabilities was approximately
$0.4 million
and
$0.5 million
as of
January 1, 2017
and
January 3, 2016
, respectively.
Advertising costs
: Advertising costs are charged to expense as incurred and were approximately
$0.9 million
,
$0.4 million
, and
$0.1 million
, during the years ended
January 1, 2017
,
January 3, 2016
and
December 28, 2014
, respectively.
Stock-based compensation
: The Company applies the fair value method to recognize compensation expense for stock-based awards. Using this method, the estimated grant-date fair value of the award is recognized on a straight-line basis over the requisite service period based on the portion of the award that is expected to vest.
Stock-based compensation expense for restricted stock units is measured based on the fair value of the Company’s common stock on the grant date. The Company utilizes the Black-Scholes option pricing model to estimate the grant-date fair value of option awards. The exercise price of option awards is set to equal the estimated fair value of the common stock at the date of the grant. The following weighted-average assumptions are also used to calculate the estimated fair value of option awards:
|
•
|
Expected volatility: The expected volatility of the Company’s shares is estimated using the historical stock price volatility over the most recent period commensurate with the estimated expected term of the awards.
|
|
•
|
Expected term: For employee stock option awards, the Company determines the weighted average expected term equal to the weighted period between the vesting period and the contract life of all outstanding options.
|
|
•
|
Dividend yield: The Company has not paid dividends and does not anticipate paying a cash dividend in the foreseeable future and, accordingly, uses an expected dividend yield of
zero
.
|
|
•
|
Risk-free interest rate: The Company bases the risk-free interest rate on the implied yield available on a U.S. Treasury note with a term equal to the estimated expected term of the awards.
|
Refer to Note 6 for further details regarding stock-based compensation.
Impairment of Long-lived assets
: Long-lived assets, primarily property and equipment, finite-lived intangible assets and long-term contracts included in other assets, are evaluated for impairment whenever events or changes in circumstances indicate the carrying value of an asset group may not be recoverable. The recoverability of an asset group is measured by a comparison of the carrying amount of the asset group to its future undiscounted cash flows.
If the recoverability test indicates the asset group balances are not recoverable, the Company would recognize an impairment charge to reduce the long-lived asset balances based on the fair value of the asset group. Prices for similar assets are used to determine the fair value of the asset group. The amount of such impairment would be charged to operations in the current period. There were
no
impairment charges recognized during the years ended
January 1, 2017
,
January 3, 2016
and
December 28, 2014
.
Other income
: Other income consists primarily of financing charges and net gain/loss on sale of assets.
Income taxes
: The Company files a consolidated federal income tax return and files both combined or unitary state income tax returns as well as separate state income tax returns in certain jurisdictions.
Deferred taxes are provided on an asset and liability method in which deferred tax assets are recognized for deductible temporary differences and operating loss and tax credit carry forwards, and deferred tax liabilities are recognized for taxable temporary differences. Temporary differences are the differences between the reported amounts of assets and liabilities and their tax basis. Deferred tax assets are reduced by a valuation allowance when, in the opinion of management, it is more likely than not that some portion or all of the deferred tax assets will not be realized. Deferred tax assets and liabilities are adjusted for the effects of changes in tax laws and rates on the date of enactment. Realization of deferred tax assets is dependent upon sufficient future taxable income.
The Company’s operations involve dealing with uncertainties and judgments in the application of complex tax regulations in a multitude of jurisdictions. The Company reports a liability for unrecognized tax benefits resulting from uncertain tax positions taken or expected to be taken in a tax return based on its estimate of whether, and the extent to which, additional taxes will be due. The Company recognizes interest, if any, related to unrecognized tax benefits within the Interest and other non-operating expenses line item, and recognizes penalties in Selling, general and administrative expenses. See Note 8 for further information pertaining to income taxes.
Foreign currency translation
: The functional currency for the Company’s Canadian operations is the Canadian dollar, the local currency. The assets and liabilities of these operations are translated into U.S. dollars at the end of the period exchange rates. The revenues and expenses are translated at average exchange rates for the period. The gains or losses from these translations are recorded in other
69
comprehensive income (loss). Gains or losses recognized on transactions denominated in a currency other than the functional currency are included in net income (loss).
Beneficial conversion features
: The Company had issued Redeemable Convertible Preferred Stock with dividends that were paid-in-kind during the years ended January 3, 2016 and December 28, 2014. The Company recorded paid-in-kind dividends at carrying value on the issuance date. The paid-in-kind dividends in the form of Redeemable Convertible Preferred Stock contained the same conversion rate as the Redeemable Convertible Preferred Stock issued on the Closing Date. For certain Redeemable Convertible Preferred Stock issued as dividends paid-in-kind, the stated conversion price was determined to be less than the common stock price as of the dividend payment date resulting in the recognition of a beneficial conversion feature (“BCF”) in additional paid-in capital. Since the Redeemable Convertible Preferred Stock did not have a fixed or determinable redemption date and was readily convertible at any time, the Company immediately amortized any BCF recognized through retained earnings. The Redeemable Convertible Preferred Stock converted to common stock in accordance to its terms on May 16, 2016.
Recently Issued and Adopted Accounting Pronouncements
In April 2015, the Financial Accounting Standards Board (“FASB”) issued Accounting Standards Update, (“ASU”) 2015-03,
Simplifying the Presentation of Debt Issuance Costs
, which requires debt issuance costs to be presented in the balance sheet as a direct deduction from the associated debt liability. The standard is effective for financial statements issued for fiscal years beginning after December 15, 2015, and interim periods within those fiscal years. Early adoption is permitted for financial statements that have not been previously issued. An entity should apply the new guidance on a retrospective basis, wherein the balance sheet or each individual period presented should be adjusted to reflect the period-specific effects of applying the new guidance. The Company has adopted this standard and as a result,
$7.3 million
of deferred financing costs were reclassified to long term debt, less current portion as of the 2015 Fiscal Year ended January 3, 2016.
In September 2015, the FASB issued ASU 2015-16,
Business Combinations
, an update to the existing guidance under the Business Combinations topic. This update simplifies the accounting for measurement-period adjustments. The amendments in this update require that an acquirer recognize adjustments to provisional amounts that are identified during the measurement period in the reporting period in which the adjustment amounts are determined. This update will be effective for all annual and interim periods beginning after December 15, 2015. The amendments in this update should be applied prospectively to adjustments to provisional amounts that occur after the effective date of this update with earlier application permitted for financial statements that have not been issued. The adoption of this standard did not have a material impact on the Company’s consolidated financial statements
.
In November, 2015, FASB issued ASU 2015-17,
Income Taxes: Balance Sheet Classification of Deferred Taxes
, which eliminates the current requirement for companies to present deferred tax liabilities and assets as current and non-current in a classified balance sheet. Instead, companies will be required to classify all deferred tax assets and liabilities as non-current. For public companies, the amendments are effective for financial statements issued for annual periods beginning after December 15, 2016, and interim periods within those annual periods. Earlier application is permitted. The Company early adopted ASU 2015-17 effective January 3, 2016 on a prospective basis. Adoption of this ASU resulted in a reclassification of the net deferred tax assets to the net non-current deferred tax liabilities in the Consolidated Balance Sheet as of January 3, 2016. No prior periods were retrospectively adjusted.
Accounting Pronouncements Issued But Not Yet Adopted
In May 2014, the Financial Accounting Standards Board (FASB) issued Accounting Standards Update (“ASU”) No. 2014-09,
Revenue from Contracts with Customers
which amends existing revenue recognition standards and establishes a new Accounting Standards Codification (“ASC”) Topic 606. The core principle of this amendment is that an entity should recognize revenue to depict the transfer of promised goods or services to customers in an amount that reflects the consideration to which the entity expects to be entitled in exchange for these goods or services. In July 2015, the FASB deferred the effective date of ASU 2014-09 to annual reporting periods beginning after December 15, 2017, and interim reporting periods within that reporting period. Earlier application is permitted only as of annual reporting periods ended beginning after December 15, 2016.
The guidance permits two implementation approaches, one requiring retrospective application of the new standard with restatement of prior years and one requiring prospective application of the new standard with disclosure of results under old standards. The Company is evaluating the effect that ASU No. 2014-09 will have on its consolidated financial statements and related disclosures. The Company has not yet selected a transition method nor has it determined the effect of the standard on its ongoing financial reporting.
In July 2015, FASB issued ASU 2015-11,
Simplifying the Measurement of Inventory
(“ASU 2015-11”), to simplify the guidance on the subsequent measurement of inventory, excluding inventory measured using last-in, first out or the retail inventory method. Under the new standard, inventory should be at the lower of cost and net realizable value. The new accounting guidance is effective for interim and annual periods beginning after December 15, 2016 with early adoption permitted. The Company is currently evaluating the impact of the pending adoption of ASU 2015-11 on the Company’s consolidated financial statements.
70
In February 2016, the FASB issued ASU 2016-02,
Leases
(“ASU 2016-02”), which sets out the principles for the recognition, measurement, presentation and disclosure of leases for both parties to a contract (i.e. lessees and lessors). The new standard requires lessees to apply a dual approach, classifying leases as either finance or operating leases based on the principle of whether or not the lease is effectively a financed purchase by the lessee. This classification will determine whether lease expense is recognized based on an effective interest method or on a straight line basis over the term of the lease, respectively. A lessee is also required to record a right-of-use asset and a lease liability for all leases with a term of greater than 12 months regardless of their classification. Leases with a term of 12 months or less will be accounted for similar to existing guidance for operating leases today. The new standard requires lessors to account for leases using an approach that is substantially equivalent to existing guidance for sales-type leases, direct financing leases and operating leases. The standard is effective for fiscal years beginning after December 15, 2019, and interim periods within fiscal years beginning after December 15, 2020. Early application of the amendment is permitted. The Company is currently evaluating the standard and the impact on its consolidated financial statements and footnote disclosures.
In March 2016, the FASB issued ASU 2016-09,
Compensation—Stock Compensation: Improvements to Employee Share-Based Payment Accounting
(“ASU 2016-09”), which simplifies several aspects of the accounting for employee share-based payment transactions for both public and nonpublic entities, including the accounting for income taxes, forfeitures, and statutory tax withholding requirements, as well as classification in the statement of cash flows. ASU 2016-09 is effective for annual periods beginning after December 15, 2016, and interim periods within annual periods beginning after December 15, 2018. Early adoption is permitted. The Company is currently evaluating the standard and the impact on its consolidated financial statements and footnote disclosures.
In June 2016, the FASB issued ASU 2016-13,
Financial Instruments - Credit Losses - Measurement of Credit Losses on Financial Instruments
(“ASU 2016-13”), which changes the way companies evaluate credit losses for most financial assets and certain other instruments. For trade and other receivables, held-to-maturity debt securities, loans and other instruments, entities will be required to use a new forward-looking “expected loss” model to evaluate impairment, potentially resulting in earlier recognition of allowances for losses. The new standard also requires enhanced disclosures, including the requirement to disclose the information used to track credit quality by year of origination for most financing receivables. ASU 2016-13 will be effective for annual periods beginning after December 15, 2019. Early adoption is permitted for all entities for annual periods beginning after December 15, 2018. The guidance must be applied using a cumulative-effect transition method. The Company is currently evaluating the standard and the impact on its condensed consolidated financial statements.
In August 2016, the FASB issued ASU 2016-15, Statement of Cash Flows (Topic 230):
Classification of Certain Cash Receipts and Cash Payments
(“ASU 2016-15”), which provides greater clarity to preparers on the treatment of eight items within an entity’s statement of cash flows with the goal of reducing the existing diversity in practice. ASU 2016-15 provides new guidance for eight specific cash flow issues including debt prepayment or debt extinguishment costs, settlement of zero-coupon bonds and bonds with “insignificant” cash coupons, contingent consideration payments made after a business combination, proceeds from the settlement of insurance claims, proceeds from the settlement of corporate-owned life insurance policies, including bank-owned life insurance policies, distributions received from equity method investees, beneficial interests in securitization transactions, and separately identifiable cash flows and application of the predominance principle. The guidance in ASU 2016-15 should be applied using a retrospective transition method to each period presented. ASU 2016-15 becomes effective in fiscal years beginning after December 15, 2017, including interim periods therein. Early adoption of the guidance, including within an interim period, is permitted. The Company is currently evaluating the standard and the impact on its condensed consolidated financial statements.
In October 2016, the FASB issued ASU 2016-16, Income Taxes (Topic 740):
Intra-Entity Transfers of Assets Other Than Inventory
(“ASU 2016-16”), which eliminates the exception for all intra-entity sales of assets other than inventory. As a result, a reporting entity would recognize the tax expense from the sale of the asset in the seller’s tax jurisdiction when the transfer occurs, even though the pre-tax effects of that transaction are eliminated in consolidation. Any deferred tax asset that arises in the buyer’s jurisdiction would also be recognized at the time of the transfer. The guidance in ASU 2016-16 does not apply to intra-entity transfers of inventory. The income tax consequences from the sale of inventory from one member of a consolidated entity to another will continue to be deferred until the inventory is sold to a third party. ASU 2016-16 will be effective for fiscal periods beginning after December 15, 2017, including interim reporting periods within those fiscal years. Early adoption is permitted, but can only be adopted in the first interim period of a fiscal year. The modified retrospective approach will be required for transition to the new guidance, with a cumulative-effect adjustment recorded in retained earnings as of the beginning of the period of adoption. The cumulative-effect adjustment would consist of the net impact from (1) the write-off of any unamortized tax expense previously deferred and (2) recognition of any previously unrecognized deferred tax assets, net of any necessary valuation allowance. The Company is currently evaluating the standard and the impact on its condensed consolidated financial statements.
In November 2016, the FASB issued ASU 2016-18, Statement of Cash Flows (Topic 230):
Restricted Cash
(“ASU 2016-18”), which require that a statement of cash flows explain the change during the period in the total of cash, cash equivalents, and amounts generally described as restricted cash or restricted cash equivalents. Therefore, amounts generally described as restricted cash and restricted cash equivalents should be included with cash and cash equivalents when reconciling the beginning-of-period and end-of period total amounts shown on the statement of cash flows. The amendments in ASU 2016-18 do not provide a definition of restricted cash or restricted
71
cash equivalents. ASU 2016-18 will be effective for fiscal years beginning after December 15, 2017, and interim periods within those fiscal years. The amendments in ASU 2016-18 should be applied using a retrospective transition method to each period presented. The Company is currently evaluating the standard and the impact on its condensed consolidated financial statements.
In January 2017, the FASB issued ASU 2017-01, Business Combinations (Topic 805):
Clarifying the Definition of a Business
(“ASU 2017-01”),
to clarify the definition of a business with the objective of adding guidance to assist entities with evaluating whether transactions should be accounted for as acquisitions (or disposals) of assets or businesses. The definition of a business affects many areas of accounting including acquisitions, disposals, goodwill, and consolidation. ASU 2017-01 provides a screen to determine when an integrated set of assets and activities (“set”) is not a business. The screen requires that when substantially all of the fair value of the gross assets acquired (or disposed of) is concentrated in a single identifiable asset or a group of similar identifiable assets, the set is not a business. This screen reduces the number of transactions that need to be further evaluated. If the screen is not met, the amendments in ASU 2017-01 (1) require that to be considered a business, a set must include, at a minimum, an input and a substantive process that together significantly contribute to the ability to create output and (2) remove the evaluation of whether a market participant could replace missing elements. Lastly, the amendments in ASU 2016-01 narrow the definition of the term output so that the term is consistent with how outputs are described in Topic 606. ASU 2017-01 will be effective for fiscal years beginning after December 15, 2017, and interim periods within those fiscal years. The amendments in ASU 2017-01 should be applied prospectively on or after the effective date. The Company is currently evaluating the standard and the impact on its condensed consolidated financial statements.
In January 2017, the FASB issued ASU 2017-04, Intangibles -Goodwill and Other (Topic 350),
Simplifying the Test for Goodwill Impairment
(“ASU 2017-04”), which eliminates Step 2 from the goodwill impairment test, which measures a goodwill impairment loss by comparing the implied fair value of a reporting unit’s goodwill with the carrying amount of that goodwill. Instead, under the amendments in ASU 2017-04, an entity should perform its annual, or interim, goodwill impairment test by comparing the fair value of a reporting unit with its carrying amount. An entity should recognize an impairment charge for the amount by which the carrying amount exceeds the reporting unit’s fair value; however, the loss recognized should not exceed the total amount of goodwill allocated to that reporting unit. Additionally, an entity should consider income tax effects from any tax deductible goodwill on the carrying amount of the reporting unit when measuring the goodwill impairment loss, if applicable. The Board also eliminated the requirements for any reporting unit with a zero or negative carrying amount to perform a qualitative assessment and, if it fails that qualitative test, to perform Step 2 of the goodwill impairment test. Therefore, the same impairment assessment applies to all reporting units. An entity is required to disclose the amount of goodwill allocated to each reporting unit with a zero or negative carrying amount of net assets. An entity still has the option to perform the qualitative assessment for a reporting unit to determine if the quantitative impairment test is necessary. An entity should apply the amendments in ASU 2017-04 on a prospective basis. An entity is required to disclose the nature of and reason for the change in accounting principle upon transition. That disclosure should be provided in the first annual period and in the interim period within the first annual period when the entity initially adopts the amendments in ASU 2017-04. The amendments in ASU 2017-04 should be adopted for annual or any interim goodwill impairment tests in fiscal years beginning after December 15, 2019. Early adoption is permitted for interim or annual goodwill impairment tests performed on testing dates after January 1, 2017. The Company is currently evaluating the standard and the impact on its condensed consolidated financial statements.
From time to time the Company enters into strategic acquisitions in an effort to better service existing customers and to attain new customers. The Company made various acquisitions during the years ended
January 1, 2017
and
January 3, 2016
. The following acquisitions had an aggregate purchase price of approximately
$67.9 million
and
$104.0 million
for the years ended
January 1, 2017
and
January 3, 2016
, respectively. The aggregate assets acquired were
$67.4 million
and
$99.9 million
, aggregate liabilities assumed were
$21.9 million
and
$32.5 million
, and excess purchase price attributed to goodwill acquired were
$22.4 million
and
$36.6 million
for the years ended
January 1, 2017
and
January 3, 2016
, respectively. The Company has completed the acquisition accounting for each acquisition made during the 2015 Fiscal Year ended
January 3, 2016
. The Company recorded the preliminary acquisition accounting related to acquisitions completed during the 2016 Fiscal Year ended
January 1, 2017
at their estimated fair values as of the respective acquisition dates.
In December, 2016, the Company acquired the assets of East Haven Landscape Products (“East Haven”). With
one
location in East Haven, Connecticut, East Haven is a leader in the distribution of nursery, hardscapes, and landscape supplies in that area.
In November 2016, the Company acquired the assets and assumed the liabilities of the landscape distribution businesses of Loma Vista Nursery, Inc., a leader in the distribution of nursery and hardscape products to landscape professionals with
two
locations serving customers in Missouri and Kansas.
72
In September 2016, the Company acquired the assets and assumed liabilities of Glen Allen Nursery & Garden Center, Inc. (“Glen Allen”). With
one
location in Richmond, VA, Glen Allen was a leader in the distribution of nursery products to landscape professionals.
In August 2016, the Company acquired the assets and assumed liabilities of Bissett Nursery Corp. and acquired all of the outstanding stock of Bissett Equipment Corp. (collectively, “Bissett”). Headquartered in Holtsville, NY, Bissett is a leader in the distribution of nursery, hardscapes, landscape supplies as well as equipment sales, rental and repairs to landscape professionals with
three
locations serving customers throughout the New York City metropolitan area.
In April 2016, the Company acquired the assets and assumed liabilities of Blue Max Materials, Inc., Blue Max Materials of Charleston, Inc., Blue Max Materials of Columbia, Inc. and Blue Max Materials of the Grand Strand, Inc., which together comprise Blue Max (“Blue Max”), a hardscapes and landscape supplier with
five
locations serving North Carolina and South Carolina.
In January 2016, the Company acquired all of the outstanding stock of Hydro-Scape Products, Inc. (“Hydro-Scape”), a leading provider of landscape products (irrigation, lighting, agronomic, outdoor living and hardscapes) with
17
locations serving customers throughout Southern California.
In August 2015, the Company acquired the assets and assumed liabilities of Tieco, Inc. (“Tieco”), a distributor of irrigation, landscape, well drilling, athletic field, and pump and well products with
six
locations throughout Alabama and Florida.
In August 2015, the Company acquired all of the member’s interests of Green Resource, LLC (“Green Resource”), a distributor of agronomic products to large maintenance and golf customers with
five
locations servicing North and South Carolina.
In May 2015, the Company acquired all of the outstanding stock of AMC Industries, Inc. (“AMC”), a full line distributor of irrigation products and domestic water systems with
nine
locations throughout Texas and Oklahoma.
In February 2015, the Company acquired all of the outstanding stock of CLP SN Holdings, Inc., the parent company of Shemin Nurseries (“Shemin”), which included
30
store locations supplying primarily nursery goods in
18
major metropolitan markets across
14
states of the Eastern region of the United States and Texas. See further description below under the heading “Shemin Acquisition Accounting”.
These transactions were accounted for by the acquisition method, and accordingly the results of operations were included in the Company’s consolidated financial statement from their respective acquisition dates.
Shemin Acquisition Accounting:
The Shemin transaction has been accounted for as a business combination using the acquisition method of accounting, whereby the purchase price was allocated to the tangible and intangible assets acquired and liabilities assumed based on their estimated fair values at the acquisition date, with the excess of purchase price over the estimated fair value of the net assets acquired recorded as goodwill. Transaction related costs incurred in connection with the Shemin acquisition were approximately
$2.7 million
. These level 3 fair value measurements have been determined based on assumptions that market participants would use in the pricing of the asset or liability. Independent third-party appraisers were engaged under the direction of management to perform valuation of certain tangible and intangible assets acquired and liabilities assumed.
The real and personal property was valued using the cost, market and income approaches. The income approach was utilized to estimate the fair value of the lease interests via the discounted cash flow methodology. Personal property was valued using the indirect method of the cost approach and the market approach. Using the indirect approach a reproduction cost of new personal property was determined from the historical cost.
Intangible assets separately valued in the transaction were customer relationships. Customer relationships were valued using the discounted cash flow method form of the income approach. After tax cash flow was discounted to present value using a
16.0%
discount rate. Revenue growth was estimated based on long-term growth rates. Annual attrition was estimated at
10.0%
.
The following table summarized the adjusted aggregate fair values of the assets acquired and liabilities assumed at the acquisition date of February 27, 2015 and subsequent adjustments. The estimate of the fair values of assets acquired and liabilities assumed is as follows (in millions):
73
|
Fair value of consideration transferred:
|
|||
|
Cash consideration
|
$
|
57.8
|
|
|
Working capital adjustment
|
(0.1
|
)
|
|
|
Net consideration transferred
|
$
|
57.7
|
|
|
Assets acquired, at fair market value:
|
|||
|
Cash and cash equivalents
|
$
|
2.3
|
|
|
Accounts receivable
|
5.7
|
|
|
|
Inventory
|
9.3
|
|
|
|
Deferred tax assets
|
3.5
|
|
|
|
Prepaid expenses and other current assets
|
2.2
|
|
|
|
Total current assets
|
23.0
|
|
|
|
Property and equipment
|
9.9
|
|
|
|
Intangible assets
|
27.2
|
|
|
|
Other assets
|
1.3
|
|
|
|
Total assets
|
$
|
61.4
|
|
|
Liabilities assumed, at fair market value:
|
|||
|
Accounts payable
|
$
|
6.1
|
|
|
Accrued liabilities
|
6.7
|
|
|
|
Deferred tax liabilities
|
12.0
|
|
|
|
Total liabilities assumed
|
24.8
|
|
|
|
Identifiable net assets acquired
|
$
|
36.6
|
|
|
Goodwill
|
21.1
|
|
|
|
Net assets acquired
|
$
|
57.7
|
|
Goodwill is calculated as the excess of the purchase price over the estimated fair values of the assets acquired and the liabilities assumed in the acquisition, and represents the future economic benefits arising from other assets acquired that could not be individually identified and separately recognized. The amount allocated to goodwill associated with the Shemin acquisition is primarily the result of anticipated synergies.
None
of the goodwill associated with this transaction will be deductible for income tax purposes.
On an unaudited pro forma basis, the following represents the consolidated results of the Company had the Company acquired Shemin as of December 31, 2013 (the first day of the Company’s fiscal year 2014):
|
|
Fiscal Years Ended
|
|||||||
|
(In millions, except for per share data)
|
January 3, 2016
|
December 28, 2014
|
||||||
|
Net sales
|
$
|
1,459.1
|
|
$
|
1,313.5
|
|
||
|
Net loss available to SiteOne common shareholders
|
$
|
(17.6
|
)
|
$
|
(5.8
|
)
|
||
|
Net loss per share of common stock attributable to SiteOne - diluted
|
$
|
(1.24
|
)
|
$
|
(0.42
|
)
|
||
The Company began consolidating the results of operations effective February 28, 2015. The acquisition added
$130.6 million
of net sales and
$2.8 million
of net income for the fiscal year ended
January 3, 2016
.
Property and equipment consisted of the following (in millions):
74
|
January 1, 2017
|
January 3, 2016
|
|||||||
|
Land
|
$
|
14.5
|
|
$
|
14.6
|
|
||
|
Buildings and leasehold improvements:
|
||||||||
|
Buildings
|
8.6
|
|
9.8
|
|
||||
|
Leasehold improvements
|
14.0
|
|
9.8
|
|
||||
|
Store equipment
|
17.6
|
|
14.3
|
|
||||
|
Office furniture and fixtures and vehicles:
|
||||||||
|
Office furniture and fixtures
|
11.1
|
|
7.9
|
|
||||
|
Vehicles
|
36.1
|
|
29.2
|
|
||||
|
Tooling
|
1.0
|
|
0.1
|
|
||||
|
Construction in process
|
3.3
|
|
3.1
|
|
||||
|
Total Property and equipment, gross
|
106.2
|
|
88.8
|
|
||||
|
Less: accumulated depreciation
|
36.4
|
|
22.6
|
|
||||
|
Total Property and equipment, net
|
$
|
69.8
|
|
$
|
66.2
|
|
||
Property and equipment includes vehicles under capital lease of approximately
$29.4 million
and
$25.1 million
and related accumulated depreciation of approximately
$13.7 million
and
$8.5 million
as of
January 1, 2017
and
January 3, 2016
, respectively.
Depreciation expense was approximately
$14.2 million
,
$12.8 million
and
$10.3 million
for the years ended
January 1, 2017
,
January 3, 2016
and
December 28, 2014
respectively.
Capitalized software has an estimated useful life of
three
years. The amounts of total capitalized software costs, including purchased and internally developed software, included in other assets at
January 1, 2017
and
January 3, 2016
were approximately
$3.6 million
and
$2.1 million
, less accumulated amortization of approximately
$1.9 million
and
$0.8 million
, respectively. Amortization of these software costs was approximately
$1.1 million
,
$0.6 million
and
$0.2 million
for the years ended
January 1, 2017
,
January 3, 2016
and
December 28, 2014
, respectively.
Goodwill
The changes in the carrying amount of goodwill for the years ended
January 1, 2017
and
January 3, 2016
are as follows (in millions):
|
|
For the year
January 4, 2016 to January 1, 2017 |
For the year
December 29, 2014 to January 3, 2016 |
||||||
|
Beginning balance
|
$
|
48.0
|
|
$
|
11.4
|
|
||
|
Goodwill acquired during the year
|
22.4
|
|
36.6
|
|
||||
|
Goodwill adjusted during the year
|
0.4
|
|
—
|
|
||||
|
Ending balance
|
$
|
70.8
|
|
$
|
48.0
|
|
||
75
There have been
no
impairments of our goodwill.
Intangible Assets
The following table summarizes the components of intangible assets (in millions):
|
|
|
January 1, 2017
|
January 3, 2016
|
|||||||||||||||||||||||
|
|
Weighted Average Remaining Useful Life (in Years)
|
Amount
|
Accumulated
Amortization |
Net
|
Amount
|
Accumulated
Amortization |
Net
|
|||||||||||||||||||
|
Customer relationships
|
17.8 years
|
$
|
147.7
|
|
$
|
47.5
|
|
$
|
100.2
|
|
$
|
127.7
|
|
$
|
26.5
|
|
$
|
101.2
|
|
|||||||
|
Trademarks and other
|
6.5 years
|
5.0
|
|
1.9
|
|
$
|
3.1
|
|
4.4
|
|
1.3
|
|
3.1
|
|
||||||||||||
|
Total intangibles
|
$
|
152.7
|
|
$
|
49.4
|
|
$
|
103.3
|
|
$
|
132.1
|
|
$
|
27.8
|
|
$
|
104.3
|
|
||||||||
During the year ended
January 1, 2017
, the Company recorded
$20.6 million
of intangible assets, including
$20.0 million
in customer relationship intangibles and
$0.6 million
in trademarks and other as a result of the
six
business acquisitions discussed in Note 2. The customer relationship intangible assets will be amortized over a weighted-average period of
20
years. The trademarks and other intangible assets recorded will be amortized over a weighted-average period of
nine
years.
During the year ended
January 3, 2016
, the Company recorded
$35.2 million
of intangible assets, all of which related to customer relationships as a result of
four
business acquisitions discussed in Note 2.
Amortization expense for intangible assets for the years ended
January 1, 2017
,
January 3, 2016
and
December 28, 2014
was approximately
$21.7 million
,
$17.9 million
, and
$9.8 million
, respectively.
Total future amortization estimated as of
January 1, 2017
, is as follows (in millions):
|
Fiscal year ending:
|
|||
|
2017
|
$
|
19.4
|
|
|
2018
|
15.9
|
|
|
|
2019
|
13.2
|
|
|
|
2020
|
11.0
|
|
|
|
2021
|
9.0
|
|
|
|
Thereafter
|
34.8
|
|
|
|
Total future amortization
|
$
|
103.3
|
|
Capital leases, consisting of vehicle leases, included the following (in millions except payment information):
|
January 1, 2017
|
January 3, 2016
|
|||||||
|
Capital lease obligations with rates ranging from 1.4% to 4.8% with monthly payments of approximately $0.4 million maturing through December 2021
|
$
|
11.0
|
|
$
|
11.1
|
|
||
|
Less current maturities
|
4.3
|
|
4.0
|
|
||||
|
Total Capital leases, less current portion
|
$
|
6.7
|
|
$
|
7.1
|
|
||
76
Future minimum lease payments under capital leases are due as follows (in millions):
|
Fiscal year:
|
|||
|
2017
|
$
|
4.8
|
|
|
2018
|
4.1
|
|
|
|
2019
|
1.9
|
|
|
|
2020
|
0.9
|
|
|
|
2021 and Thereafter
|
0.4
|
|
|
|
Total minimum lease payments
|
12.1
|
|
|
|
Less amounts representing interest
|
1.1
|
|
|
|
Present value of future minimum lease payments
|
$
|
11.0
|
|
Interest expense on capital leases was approximately
$0.4 million
,
$0.5 million
and
$0.3 million
for the years ended
January 1, 2017
,
January 3, 2016
and
December 28, 2014
, respectively.
77
The Company sponsors a defined contribution benefit plan for substantially all of its employees. Company contributions to the plan are based on a percentage of employee wages. The Company’s contributions to the plan were approximately
$5.7 million
,
$4.2 million
and
$3.3 million
for the years ended
January 1, 2017
,
January 3, 2016
and
December 28, 2014
, respectively.
Prior to the adoption of the Omnibus Equity Incentive Plan (the “Omnibus Incentive Plan”), as described below, the Company offered to key employees the ability to purchase common shares of the Company under a Stock Incentive Plan, which commenced in May 2014 as approved by stockholders. Common stock options (“options”) were granted with the purchased shares at a predetermined number of options per purchased share. Prior to a public offering these shares are not transferrable except upon the employee’s death, repurchase at the option of the Company, or with the Company’s consent. The Stock Incentive Plan provided for drag-along and tag-along rights if the stockholders sold more than
50.01%
of their shares prior to a public offering. As of the date of IPO,
762,079
shares were purchased by employees and outstanding under the Stock Incentive Plan. For the years ended
January 1, 2017
,
January 3, 2016
respectively,
11,036
shares and
9,875
shares were repurchased from certain terminated employees by the Company. The Company’s policy was to retain these repurchased shares as treasury shares and not to retire them.
The Company adopted the Omnibus Incentive Plan on April 28, 2016 in connection with the IPO. Upon the adoption of the Omnibus Incentive Plan, the Stock Incentive Plan terminated and no more awards were made thereunder. However, awards previously granted under the Stock Incentive Plan were unaffected by the termination of the Stock Incentive Plan. Awards under the Omnibus Incentive Plan may be made in the form of stock options, which may be either incentive stock options or non-qualified stock options; stock purchase rights; restricted stock; restricted stock units (“RSUs”); performance shares; performance units; stock appreciation rights (“SARs”); dividend equivalents; deferred stock units (“DSUs”); and other stock-based awards. Any shares covered by an award, or any portion thereof, granted under the Omnibus Incentive Plan or Stock Incentive Plan that terminates, is forfeited, is repurchased, expires or lapses for any reason will again be available for the grant of awards. Additionally, any shares tendered or withheld to satisfy the grant or exercise price or tax withholding obligations pursuant to any award under the Omnibus Incentive Plan will again be available for issuance.
Since the adoption of the Omnibus Incentive Plan, the Company granted
223,970
options,
26,020
DSUs and
18,973
RSUs; in addition,
17,427
options were forfeited during the year ended
January 1, 2017
. The RSUs and options granted to employees vest over a
four
-year period at 25 percent per year. The DSUs granted to non-employee directors vest immediately. Options and RSUs expire
ten years
after the date of grant. The compensation cost for options and RSUs is recognized on a straight-line basis over the requisite vesting period. The aggregate number of shares which may be issued under the Omnibus Incentive Plan is
2,000,000
shares of which
1,748,464
remain as of
January 1, 2017
.
The estimated grant-date fair value of stock options was calculated using the Black-Scholes option-pricing model, based on the following weighted-average assumptions:
|
January 1, 2017
|
January 3, 2016
|
December 28, 2014
|
||||
|
Risk-free interest rate
|
1.43%
|
1.87%
|
1.90%
|
|||
|
Expected dividends
|
—
|
—
|
—
|
|||
|
Expected volatility
|
30%
|
36%
|
40%
|
|||
|
Expected term (in years)
|
6.25
|
6.50
|
6.00
|
|||
Prior to the Company’s IPO, determining the fair value of the shares of common stock underlying stock options was historically based upon a valuation provided by a third-party valuation specialist. The Company’s approach to valuation, which required making complex and subjective judgments, was based on a combination of a discounted cash flow method of income approach and market approaches. The discounted cash flow method used estimates of revenue, driven by assumed market growth rates, and estimated costs as well as appropriate discount rates. These estimates were consistent with the plans and estimates that were used to manage the business. There was inherent uncertainty in making these estimates. Subsequent to the completion of the IPO, the Company uses the market closing price of its common stock as reported on the New York Stock Exchange to determine the fair value of the shares of common stock underlying stock options.
The fair value of each option award was estimated on the date of grant using the Black-Scholes options pricing model. Expected volatilities are based on the historical equity volatility of comparable publicly-traded companies. The expected term of options granted is derived from the output of the option valuation model and represents the period of time that options granted are expected to be outstanding. The risk-free rates utilized for periods throughout the contractual life of the options are based on the U.S. Treasury
78
security yields at the time of grant. The DSUs and RSUs have grant date fair values equal to the fair market value of the underlying stock on the date of grant.
The following table summarizes the information about stock options as of and for the years ended
January 1, 2017
and
January 3, 2016
:
|
Number of
Shares (in thousands) |
Weighted
Average Exercise Price |
Weighted Average
Remaining Contractual Term (Years) |
Aggregate
Intrinsic Value (in millions) |
||||||||||
|
Outstanding as of December 29, 2014
|
2,141.2
|
|
$
|
8.61
|
|
8.99
|
|||||||
|
Granted
|
955.0
|
|
13.23
|
|
|||||||||
|
Exercised
|
—
|
|
|||||||||||
|
Expired or forfeited
|
(36.0
|
)
|
8.61
|
|
|||||||||
|
Outstanding as of January 3, 2016
|
3,060.2
|
|
10.05
|
|
8.74
|
||||||||
|
Granted
|
224.0
|
|
27.54
|
|
|||||||||
|
Exercised
|
(34.4
|
)
|
6.57
|
|
|||||||||
|
Expired or forfeited
|
(87.2
|
)
|
7.47
|
|
|||||||||
|
Outstanding as of January 1, 2017
|
3,162.6
|
|
7.98
|
|
7.86
|
||||||||
|
Exercisable as of January 1, 2017
|
1,376.5
|
|
$
|
5.90
|
|
7.61
|
$
|
39.7
|
|
||||
|
Unvested and expected to vest after January 1, 2017
|
1,786.1
|
|
$
|
9.59
|
|
8.05
|
$
|
44.9
|
|
||||
The weighted-average grant-date fair values of options granted during the year ended
January 1, 2017
was
$8.93
per option;
34,382
options have been exercised.
The total share-based compensation expense was
$5.3 million
during the year ended
January 1, 2017
and
$3.0 million
for the year ended
January 3, 2016
. At
January 1, 2017
and
January 3, 2016
, there were
$8.8 million
and
$10.8 million
of total unrecognized compensation cost from share-based compensation arrangements granted under the plan, which is related to non-vested options. The option related compensation is expected to be recognized over a weighted-average period of approximately
2.72 years
.
Long-term debt was as follows (in millions):
|
January 1, 2017
|
January 3, 2016
|
|||||||
|
ABL facility
|
$
|
91.0
|
|
$
|
128.0
|
|
||
|
Term loan facility
|
297.9
|
|
60.5
|
|
||||
|
Less: unamortized debt issuance costs and discounts on debt
|
(13.4
|
)
|
(10.8
|
)
|
||||
|
Total debt
|
$
|
375.5
|
|
$
|
177.7
|
|
||
|
Less: current portion
|
(3.0
|
)
|
(0.6
|
)
|
||||
|
Total long-term debt
|
$
|
372.5
|
|
$
|
177.1
|
|
||
ABL Facility:
SiteOne Landscape Supply Holding, LLC (“Landscape Holding”) and SiteOne Landscape Supply, LLC (“Landscape,” and together with Landscape Holding, the “Borrowers”), each an indirect wholly-owned subsidiary of the Company, entered into a senior asset-based credit facility (“ABL Facility”) of up to
$250.0 million
, subject to borrowing base availability. On October 20, 2015 the ABL Facility was amended to extend the maturity date to October 20, 2020 and increase the availability to
$325.0 million
. The other terms of the ABL Facility were not significantly altered. The ABL Facility is secured by a first lien on the inventory and receivables. The ABL Facility is guaranteed by SiteOne Landscape Supply Bidco, Inc. (“Bidco”), an indirect wholly-owned subsidiary of the Company. The availability
79
under the ABL Facility was
$164.5 million
and
$112.5 million
as of
January 1, 2017
and
January 3, 2016
, respectively. Availability is determined using borrowing base calculations of eligible inventory and receivable balances less the current outstanding ABL Facility and letters of credit balances.
The interest rate on the ABL Facility is LIBOR plus an applicable margin ranging from
1.25%
to
2.00%
or an alternate base rate for U.S. denominated borrowings plus an applicable margin ranging from
0.25%
to
1.00%
. The interest rates on outstanding balances range from
2.49%
to
4.50%
and
2.04%
to
4.25%
as of
January 1, 2017
and
January 3, 2016
, respectively. Additionally, the Borrowers pay a
0.375%
and
0.25%
commitment fee on the unfunded amount of as of
January 1, 2017
and
January 3, 2016
, respectively.
The ABL Facility is subject to mandatory prepayments if the outstanding loans and letters of credit exceed either the aggregate revolving commitments of the current borrowing base, in an amount equal to such excess. Additionally, the credit facility is subject to various covenants requiring minimum financial ratios and additional borrowings may be limited by these financial ratios. Failure to meet any of these covenants could result in an event of default under these agreements. If an event of default occurs the lenders could elect to declare all amounts outstanding under these agreements to be immediately due and payable, enforce their interest in collateral pledged under the agreement, or restrict the Borrowers’ ability to obtain additional borrowings under these agreements.
The ABL Facility contains customary representations and warranties and customary affirmative and negative covenants which fully restrict retained earnings of the Borrowers. The negative covenants are limited to the following: fundamental changes, dividends and distributions, acquisitions, collateral, payments and modifications of restricted indebtedness, negative pledge clauses, changes in line of business, currency, commodity and other hedging transactions, transactions with affiliates, investments, limitations on indebtedness and liens. The negative covenants are subject to the customary exceptions and also permit the payment of dividends and distributions, investments, permitted acquisitions and payments or redemptions of junior indebtedness upon satisfaction of a payment condition. As of
January 1, 2017
, the Company is in compliance with these covenants.
Term Loan Facility:
The Borrowers entered into the Term Loan Facility dated April 29, 2016 in the amount of
$275.0 million
, and was amended on November 23, 2016 (see Term Loan Facility Amendments below). The Term Loan Facility is guaranteed by Bidco and each direct and indirect wholly-owned U.S. restricted subsidiary of Landscape. The Term Loan Facility has first lien on Property and equipment, Intangibles, and equity interests of Landscape, and second lien on ABL Facility assets. The final maturity date of the Term Loan Facility is April 29, 2022.
Refinancing:
On April 29, 2016, the Company refinanced its Prior Term Loan Facility with the Term Loan Facility. The proceeds under the Term Loan Facility were used to repay all
$60.3 million
of borrowings outstanding under the Prior Term Loan Facility, repay
$29.9 million
of borrowings outstanding under the ABL Facility, pay a special cash dividend of
$176.0 million
to existing holders of the Company’s common stock and Redeemable Convertible Preferred Stock (on an as-converted basis) as of April 29, 2016 and pay fees and expenses associated with the refinancing transaction.
Term Loan Facility Amendments:
On November 23, 2016, the Company amended the Term Loan Facility to, among other things, (i) add the Tranche B Term Loans under the Term Loan Facility in an aggregate principal amount of
$273.6 million
and (ii) increase the aggregate principal amount of Tranche B Term Loans under the Term Loan Facility to
$298.6 million
pursuant to an increase supplement. Proceeds of the Tranche B Term Loans were used to, among other things, (i) repay in full the term loans outstanding under the Existing Term Loans and (ii) repay
$21.0 million
of borrowings outstanding under the ABL Facility.
The Tranche B Term Loans bear interest, at Landscape Holding’s option, at either (i) an adjusted LIBOR rate plus an applicable margin equal to
4.50%
or (ii) an alternative base rate plus an applicable margin equal to
3.50%
. The other terms of the Tranche B Term Loans are generally the same as the terms applicable to Existing Term Loans.
The interest rate on the outstanding balance of the Term Loan Facility was
5.50%
as of
January 1, 2017
.
The Term Loan Facility contains customary representations and warranties and customary affirmative and negative covenants, which fully restrict retained earnings of the Borrowers. The negative covenants are limited to the following: limitations on indebtedness, restricted payments, restrictive agreements, sales of assets and subsidiary stock, transactions with affiliates, liens, fundamental changes, amendments, lines of business and limitations on certain actions of the parent borrower. The negative covenants are subject to the customary exceptions.
80
The Term Loan Facility is subject to annual mandatory prepayments in an amount equal to
50%
of excess cash flow, as defined in the Term Loan Credit Agreement, which information is hereby incorporated by reference, for the applicable fiscal year if the secured leverage ratio is greater than
3.50
to
1.00
. As of
January 1, 2017
, the Company is in compliance with these covenants.
During the years ended
January 1, 2017
,
January 3, 2016
and
December 28, 2014
, the Company incurred total interest expenses of
$22.1 million
,
$11.4 million
and
$9.1 million
, respectively, of which
$17.6 million
,
$6.9 million
and
$5.8 million
, respectively, related to interest on the ABL Facility and the Term Loan Facility. The debt issuance costs and discounts are amortized as interest expense over the life of the debt. As a result of the refinancing and amendments of the Term Loan Facility and ABL Facility, unamortized debt issuance costs and discounts in the amount of
$1.7 million
and
$1.2 million
, were written off to expense, and new discounts and debt issuance costs of
$7.0 million
and
$1.0 million
, were capitalized during the years ended
January 1, 2017
and
January 3, 2016
, respectively. Amortization expense related to debt issuance costs and discounts was
$2.5 million
,
$3.0 million
and
$3.0 million
for the years ended
January 1, 2017
,
January 3, 2016
and
December 28, 2014
, respectively. The remaining
$0.3 million
,
$0.3 million
and
$0.3 million
of interest is primarily related to capital leases for the years ended
January 1, 2017
,
January 3, 2016
and
December 28, 2014
, respectively.
Maturities of long-term debt outstanding, in principal amounts at
January 1, 2017
are summarized below (in millions):
|
Fiscal year:
|
|||
|
2017
|
$
|
3.0
|
|
|
2018
|
2.2
|
|
|
|
2019
|
3.0
|
|
|
|
2020
|
94.7
|
|
|
|
2021
|
3.0
|
|
|
|
Thereafter
|
283.0
|
|
|
|
Total
|
$
|
388.9
|
|
Components of net income (loss) before taxes were as follows (in millions):
|
For the year
January 4, 2016 to January 1, 2017 |
For the year
December 29, 2014 to January 3, 2016 |
For the year
December 30, 2013 to December 28, 2014 |
||||||||||
|
U.S.
|
$
|
49.6
|
|
$
|
47.1
|
|
$
|
34.8
|
|
|||
|
Foreign
|
2.3
|
|
1.3
|
|
1.3
|
|
||||||
|
Total
|
$
|
51.9
|
|
$
|
48.4
|
|
$
|
36.1
|
|
|||
Components of income tax expense (benefit) were as follows (in millions):
81
|
For the year
January 4, 2016 to January 1, 2017 |
For the year
December 29, 2014 to January 3, 2016 |
For the year
December 30, 2013 to December 28, 2014 |
||||||||||
|
Current income tax expense
|
||||||||||||
|
U.S. federal
|
$
|
26.1
|
|
$
|
21.7
|
|
$
|
11.7
|
|
|||
|
U.S. state and local
|
4.5
|
|
4.9
|
|
1.7
|
|
||||||
|
Foreign
|
0.6
|
|
0.4
|
|
0.4
|
|
||||||
|
Total current
|
31.2
|
|
27.0
|
|
13.8
|
|
||||||
|
Deferred income tax (benefit) expense
|
||||||||||||
|
U.S. federal
|
(8.9
|
)
|
(6.8
|
)
|
0.4
|
|
||||||
|
U.S. state and local
|
(1.0
|
)
|
(0.7
|
)
|
0.3
|
|
||||||
|
Foreign
|
—
|
|
—
|
|
(0.1
|
)
|
||||||
|
Total deferred
|
(9.9
|
)
|
(7.5
|
)
|
0.6
|
|
||||||
|
Total
|
$
|
21.3
|
|
$
|
19.5
|
|
$
|
14.4
|
|
|||
The Company’s effective tax rate was
41.0%
,
40.3%
, and
39.9%
for the years ended
January 1, 2017
,
January 3, 2016
, and
December 28, 2014
, respectively. The following table provides a reconciliation of income tax expense (benefit) at the statutory U.S. federal tax rate to actual income tax expense (benefit) for the periods presented (in millions):
|
For the year
January 4, 2016 to January 1, 2017 |
For the year
December 29, 2014 to January 3, 2016 |
For the year
December 30, 2013 to December 28, 2014 |
||||||||||
|
U.S. federal statutory expense (benefit)
|
$
|
18.2
|
|
$
|
16.9
|
|
$
|
12.6
|
|
|||
|
State and local income taxes, net
|
1.9
|
|
2.5
|
|
1.4
|
|
||||||
|
Transaction costs
|
1.1
|
|
—
|
|
—
|
|
||||||
|
Nondeductible items
|
0.2
|
|
0.2
|
|
0.5
|
|
||||||
|
Other, net
|
(0.1
|
)
|
(0.1
|
)
|
(0.1
|
)
|
||||||
|
Income tax expense (benefit)
|
$
|
21.3
|
|
$
|
19.5
|
|
$
|
14.4
|
|
|||
U.S. income tax has not been recognized on the excess of the amount for financial reporting over the tax basis of the Company’s investment in the Canadian subsidiary caused by foreign earnings that are indefinitely reinvested outside the U.S. The amount of such temporary differences totaled approximately
$6.3 million
as of
January 1, 2017
. These temporary differences will reverse in the future when earnings are repatriated to the U.S. Due to the complexities associated with the hypothetical calculation, including the availability of foreign tax credits, the Company has concluded it is not practicable to determine the unrecognized deferred tax liability related to these unremitted earnings.
Deferred income taxes reflect the expected future tax consequences of temporary differences between the financial statement carrying amount of the Company’s assets and liabilities, tax credits, and loss carry forwards. The significant components of deferred income taxes are as follows (in millions):
82
|
January 1, 2017
|
January 3, 2016
|
|||||||
|
Deferred tax assets:
|
||||||||
|
Net operating losses
|
$
|
4.1
|
|
$
|
4.2
|
|
||
|
Allowance for uncollectible accounts
|
4.2
|
|
3.0
|
|
||||
|
Inventory
|
3.1
|
|
1.9
|
|
||||
|
Reserve for sales bonuses
|
4.2
|
|
3.0
|
|
||||
|
Accrued compensation
|
3.1
|
|
2.7
|
|
||||
|
Stock compensation
|
2.5
|
|
1.6
|
|
||||
|
Rent accrual
|
2.1
|
|
1.2
|
|
||||
|
Environmental reserve
|
0.9
|
|
0.9
|
|
||||
|
Deferred transaction costs
|
2.3
|
|
3.6
|
|
||||
|
Other
|
1.8
|
|
1.4
|
|
||||
|
Total gross deferred tax assets
|
28.3
|
|
23.5
|
|
||||
|
Valuation allowance
|
(4.1
|
)
|
(4.2
|
)
|
||||
|
Total net deferred tax assets
|
24.2
|
|
19.3
|
|
||||
|
Deferred tax liabilities:
|
||||||||
|
Fixed assets and land
|
(8.0
|
)
|
(7.9
|
)
|
||||
|
Intangible assets
|
(30.3
|
)
|
(34.8
|
)
|
||||
|
Goodwill
|
(2.8
|
)
|
(2.3
|
)
|
||||
|
Deferred financing costs
|
(2.4
|
)
|
—
|
|
||||
|
Other
|
(0.7
|
)
|
(0.5
|
)
|
||||
|
Total deferred tax liabilities
|
(44.2
|
)
|
(45.5
|
)
|
||||
|
Net deferred tax liabilities
|
$
|
(20.0
|
)
|
$
|
(26.2
|
)
|
||
The Company evaluates its deferred tax assets to determine the need for a valuation allowance, and to conclude whether it is more likely than not that those deferred income tax assets will be realized. Management assesses the available positive and negative evidence to establish whether sufficient future taxable income will be generated to permit use of the existing deferred tax assets. On the basis of this evaluation, as of
January 1, 2017
and
January 3, 2016
, a valuation allowance of
$4.1 million
and
$4.2 million
, respectively, has been recorded against deferred tax assets related primarily to state net operating loss carryforwards for separate returns the Company believes are more likely than not to expire unused. Activity within the tax valuation allowance for the periods was as follows (in millions):
|
For the year
January 4, 2016 to January 1, 2017 |
For the year
December 29, 2014 to January 3, 2016 |
For the year
December 30, 2013 to December 28, 2014 |
||||||||||
|
Beginning balance
|
$
|
4.2
|
|
$
|
4.6
|
|
$
|
4.6
|
|
|||
|
Increase in valuation allowance
|
—
|
|
—
|
|
—
|
|
||||||
|
Decrease in valuation allowance
|
(0.1
|
)
|
(0.4
|
)
|
—
|
|
||||||
|
Ending balance
|
$
|
4.1
|
|
$
|
4.2
|
|
$
|
4.6
|
|
|||
As of
January 1, 2017
, the Company had available tax-effected state NOL carryforwards of approximately
$4.1 million
that will expire at various dates from 2016 through 2028, if not utilized.
The Company recognizes the tax effects of uncertain tax positions only if it is more likely than not to be sustained based solely upon its technical merits at the reporting date. The Company refers to the difference between the tax benefit recognized in its financial statements and the tax benefit claimed in the income tax return as an “unrecognized tax benefit.” There was
no
expense or liability recorded for unrecognized tax benefits for each period presented. The Company does not expect that the unrecognized tax benefit will materially change over the next 12 months.
The Company’s policy for recording interest and penalties, if any, associated with uncertain tax positions is to recognize interest within the Interest and other non-operating expenses line item, and to recognize penalties in Selling, general and administrative expenses. For each period presented, the Company had no accrued interest or penalties related to uncertain tax positions.
83
The Company is subject to U.S. federal income tax, as well as income tax in multiple state jurisdictions. With limited exceptions, years prior to 2009 are no longer open to federal, state and local examination by taxing authorities. As part of the Deere & Company consolidated federal return audit, the Company is currently under audit for federal income tax years 2009 through 2013. After the CD&R Acquisition date, the Company is currently under audit for federal income tax year 2014. The Company is also under audit by a number of state and local jurisdictions; however no audit adjustments are anticipated that would result in a material change to the Company’s financial position.
Deere has indemnified the Company against any taxes, penalties or interest for tax periods prior to the CD&R Acquisition, accruing after the CD&R Acquisition date.
The Company periodically purchases inventory from Deere subsidiaries. Purchases of inventory were
$0.0 million
,
$0.0 million
and
$0.5 million
for the years ended
January 1, 2017
,
January 3, 2016
and
December 28, 2014
, respectively. There were
no
outstanding payables as of
January 1, 2017
and
January 3, 2016
, respectively.
The Company offers a financing plan to its customers through John Deere Financial, f.s.b. (“John Deere Financial”) a wholly-owned subsidiary of Deere. The Company pays John Deere Financial a fee related to the financing offered, which was approximately
$0.5 million
,
$0.3 million
and
$0.4 million
for the years ended
January 1, 2017
,
January 3, 2016
, and
December 28, 2014
, respectively.
CD&R provided consulting services in conjunction with the CD&R Acquisition and received compensation of approximately
$13.6 million
as part of the closing funds flow. Approximately
$8.2 million
of these costs were related to the Company’s direct effort to arrange financing for the CD&R Acquisition and are included as a debt discount. The remaining
$5.4 million
related to due diligence and other transaction fee.
The agreement for these initial services also contemplated additional consulting services at an annual fee of approximately
$1.3 million
plus expense reimbursement for a
10
year term or earlier termination if CD&R’s ownership of the Company is reduced below
10%
.
Deere provided consulting services under
two
agreements executed with the CD&R Acquisition. The Transaction Services Agreement (“TSA”) allowed continuation of administrative services including payroll processing, employee benefit management, tax compliance, and other services for specified term and fee for each service. In aggregate for the year ended December 28, 2014 the Company paid Deere
$0.3 million
under the TSA. The consulting agreement offers services that include review and recommendation concerning the Company’s staffing, compensation, benefit plans, financial and risk management, business strategy and operational improvement. Compensation for these services will be an annual fee of approximately
$0.7 million
plus expense reimbursement for a
10
year term or earlier termination if Deere’s ownership of the Company is reduced below
10%
.
On May 17, 2016, the Company entered into termination agreements with CD&R and Deere pursuant to which the Company paid CD&R and Deere an aggregate fee of approximately
$7.5 million
to terminate the Consulting Agreements in connection with the consummation of the IPO. See “Note 11. Redeemable Convertible Preferred Stock” for a discussion of dividends paid to the CD&R investor.
TruGreen is a customer under common ownership of CD&R and therefore became a related party at the time of the CD&R Acquisition. Net sales included in the Company’s consolidated statement of operations with the customer were
$3.9 million
and
$4.0 million
for the years ended
January 1, 2017
and
January 3, 2016
, respectively. Accounts receivable included in the Company’s consolidated balance sheets were
$0.4 million
and
$0.1 million
as of
January 1, 2017
and
January 3, 2016
, respectively.
Litigation
: From time to time, the Company is subject to certain claims and lawsuits that have been filed in the ordinary course of business. The Company believes the reasonably possible range of losses for these unresolved legal actions in addition to amounts accrued would not have a material effect on the Company’s assets and liabilities as of
January 1, 2017
and
January 3, 2016
and revenues, expenses, changes in equity, and cash flows for the years ended
January 1, 2017
,
January 3, 2016
, and
December 28, 2014
.
Environmental liability
: As part of the sale of LESCO manufacturing assets in 2005, the Company retained the environmental liability associated with those assets. Remediation activities can vary substantially in duration and cost and it is difficult to develop precise estimates of future site remediation costs. The Company estimated in accrued liabilities the undiscounted cost of future remediation efforts to be approximately
$4.0 million
and
$4.6 million
as of
January 1, 2017
and
January 3, 2016
, respectively. As part of the CD&R Acquisition, Deere agreed to pay the first
$2.5 million
of the liability and cap the Company exposure to approximately
$2.4 million
. The Company has an indemnification asset against the liability as a result of these actions of
$1.6 million
and
$2.2 million
as of
January 1, 2017
and
January 3, 2016
, respectively.
84
Letter of credit
: As of
January 1, 2017
and
January 3, 2016
, outstanding letters of credit were
$2.9 million
and
$1.8 million
respectively. There were
no
amounts drawn on the letters of credit for either period presented.
Purchase commitments
: The Company has entered into contracts with various farmers that obligate the Company to purchase certain nursery products and grass seeds. These contracts run from 2014 through fiscal year 2019. The total future obligation was approximately
$49.1 million
as of
January 1, 2017
with expected payments of approximately
$29.5 million
,
$10.6 million
,
$7.2 million
,
$1.1 million
and
$0.7 million
during the years ending December
2017
,
2018
,
2019
,
2020
and
2021
, respectively. The Company’s purchases were approximately
$28.1 million
,
$20.4 million
and
$25.4 million
for the years ended
January 1, 2017
,
January 3, 2016
and
December 28, 2014
, respectively. In addition, the Company has entered into various service commitments; of which, the maximum total future obligation was approximately
$1.7 million
as of
January 1, 2017
.
Operating leases
: The Company leases buildings and equipment under certain non-cancelable operating leases that expire in various periods through December 2022. Rent expense under operating leases was approximately
$43.5 million
,
$37.3 million
and
$28.9 million
during the years ended
January 1, 2017
,
January 3, 2016
and
December 28, 2014
, respectively. Certain leases have been subleased to third parties.
Approximate future minimum lease payments under non-cancelable operating leases, net of sublease income, are as follows (in millions):
|
Gross lease
payments |
Sublease
Income |
Net lease
payments |
||||||||||
|
Fiscal year:
|
||||||||||||
|
2017
|
$
|
36.8
|
|
$
|
(0.3
|
)
|
$
|
36.5
|
|
|||
|
2018
|
29.8
|
|
(0.1
|
)
|
29.7
|
|
||||||
|
2019
|
23.0
|
|
(0.1
|
)
|
22.9
|
|
||||||
|
2020
|
15.4
|
|
(0.1
|
)
|
15.3
|
|
||||||
|
2021
|
9.9
|
|
—
|
|
9.9
|
|
||||||
|
Thereafter
|
63.3
|
|
—
|
|
63.3
|
|
||||||
|
Total minimum lease payments
|
$
|
178.2
|
|
$
|
(0.6
|
)
|
$
|
177.6
|
|
|||
During the past several years the Company has closed locations under operating leases. The remaining lease payments are accrued and included in accrued liabilities and other long-term liabilities. The aggregate reserve liability was approximately
$0.0 million
and
$0.5 million
at
January 1, 2017
and
January 3, 2016
, respectively.
In connection with the CD&R Acquisition, the Company issued Redeemable Convertible Preferred Stock to the CD&R Investor. On the day prior to the closing of the IPO, all of the then-outstanding Redeemable Convertible Preferred Stock converted into shares of common stock, resulting in the issuance by the Company of an additional
25,303,164
shares of common stock.
The CD&R Equity Investment
On the closing date of CD&R Acquisition, funds affiliated with CD&R contributed
$174.0 million
to the Company in exchange for
174,000
shares of Redeemable Convertible Preferred Stock. Each share of Redeemable Convertible Preferred Stock was convertible into
116.18
shares of Common Stock at the option of the holder and upon certain contingent events, representing
20.2 million
shares of common stock or
60%
of the voting power and Common Stock of the Company on an as-converted basis.
Certain Terms of the Redeemable Convertible Preferred Stock
On December 16, 2013, the Company filed the Certificate of Designations of the Redeemable Convertible Preferred Stock (the “Certificate of Designations”) setting forth the terms, rights, powers, and preferences, and the qualifications, limitations and restrictions thereof, of the Redeemable Convertible Preferred Stock.
Liquidation Value
. Each share of Redeemable Convertible Preferred Stock had a liquidation preference equal to the greater of: (i)
$1,000
plus accrued but unpaid dividends and (ii) the as-if converted value.
Rank
. The Redeemable Convertible Preferred Stock ranked senior as to dividend rights and rights upon liquidation to the common stock and each other class or series of the Company’s equity securities. The Company did not have any outstanding equity securities that were senior to the Redeemable Convertible Preferred Stock. In accordance with the Certificate of Designations, the issuance of any senior equity securities of the Company required the approval of the holders of the Redeemable Convertible Preferred Stock.
85
Dividends
. The Redeemable Convertible Preferred Stock was entitled to (a) a
12%
fixed, cumulative dividend payable quarterly if and when declared by the Company’s Board of Directors (the “Cumulative Dividend”), and (b) dividends on an as-converted basis if and when declared on common stock. The first eight quarterly Cumulative Dividend payments were required to be paid in-kind and thereafter, the Company could elect to pay the Cumulative Dividends in cash or shares of Redeemable Convertible Preferred Stock. The Cumulative Dividends were eliminated upon the achievement of certain EBITDA targets.
The Company paid Cumulative Dividends in-kind on January 31, 2014, April 30, 2014, July 31, 2014, October 31, 2014, February 2, 2015, April 30, 2015, July 31, 2015, and November 2, 2015 at a pro rata rate of
12%
per annum.
Conversion
. The holders of the Redeemable Convertible Preferred Stock had the right, at any time, at their option to convert any or all of their Redeemable Convertible Preferred Stock into shares of the Company’s common stock. The initial conversion ratio was
116.18
common shares for 1 share of Redeemable Convertible Preferred Stock plus accrued but unpaid dividends which ratio was subject to customary anti-dilution adjustments.
Vote
. The holders of Redeemable Convertible Preferred Stock were entitled to vote with the holders of common stock on an as-converted basis on all matters submitted for a vote of holders of shares of the Company’s common stock, voting together with the holders of common stock as one class.
Certain matters required the approval of the holders of a majority of the outstanding Redeemable Convertible Preferred Stock, voting as a separate class, including (1) amendments or modifications to the Company’s Certificate of Incorporation, by-laws or the Certificate of Designations, that would adversely affect the terms or the powers, preferences, rights or privileges of the Redeemable Convertible Preferred Stock, (2) authorization, creation, increase in the authorized amount of, or issuance of any class or series of senior, parity or junior securities or any security convertible into, or exchangeable or exercisable for, shares of such securities, (3) any increase or decrease in the authorized number of shares of Redeemable Convertible Preferred Stock or the issuance of additional shares of Redeemable Convertible Preferred Stock, and (4) amendment of current debt financing agreements or entering into any agreements relating to indebtedness that include more restrictive provisions relating to the Company’s ability to pay dividends.
Restriction on Junior Security Dividends and Repurchases
. Without the consent of the holders of a majority of the outstanding Redeemable Convertible Preferred Stock, the Company was prohibited from paying any dividend with respect to the Company’s Common Stock or other junior securities or repurchasing any Junior Securities (with the exception of repurchase made pursuant to the Company’s Management Incentive Plan). Such consent was not required to the extent the Company had met certain conditions related to payment of the Cumulative Dividends, including a past history of paying such dividends in cash and sufficient funds to make future Cumulative Dividend payments in cash.
Accounting for the Redeemable Convertible Preferred Stock
In accordance with the SEC guidance within ASC Topic 480,
Distinguishing Liabilities from Equity: Classification and Measurement of Redeemable Securities
, the Company classified the Redeemable Convertible Preferred Stock as mezzanine equity because the Redeemable Convertible Preferred Stock contained a redemption feature which was contingent upon certain change of control events, the occurrence of which was not solely within the control of the Company. These contingent events were not considered probable of occurring and as such the Company did not accrete the mezzanine equity to its redemption value each period. The Company determined that none of the features included in the Redeemable Convertible Preferred Stock were required to be accounted for separately as a derivative under ASC Topic 815,
Derivatives and Hedging.
The initial issuance of Redeemable Convertible Preferred Stock did not include a beneficial conversion feature (“BCF”) because the conversion price used to set the conversion ratio at the time of issuance was greater than the initial common stock price. The paid-in-kind dividends in the form of Redeemable Convertible Preferred Stock contained the same conversion price as the original issuance and in certain cases did include a BCF as of the dividend payment date. Since the Redeemable Convertible Preferred Stock did not have a fixed or determinable redemption date and was freely convertible at any time, the Company immediately amortized any BCF recognized through retained earnings. As disclosed in Note 1, on May 2, 2016, the Company paid a one-time special cash dividend to all existing stockholders as of April 29, 2016. CD&R Investor received
$112.4 million
in accordance with its right to participate in all distributions to common stock on an as-converted basis, in accordance with its right as a preferred stockholder. The Redeemable Convertible Preferred Stock converted to common stock in accordance with its terms on May 16, 2016. During the year ended
January 1, 2017
, the Company paid the cumulative dividends in cash; and accordingly,
no
BCF was recognized. For the year ended
January 3, 2016
, BCF amortization was
$18.6 million
.
The below table summarizes the changes in the carrying value of the Redeemable Convertible Preferred Stock (in millions):
86
|
|
|
||
|
Balance as of December 30, 2013
|
$
|
174.0
|
|
|
Cumulative Dividends paid-in-kind during the period
|
18.6
|
|
|
|
Balance as of December 28, 2014
|
192.6
|
|
|
|
Cumulative Dividends paid-in-kind during the period
|
24.2
|
|
|
|
Balance as of January 3, 2016
|
216.8
|
|
|
|
Shares converted to Common Stock
|
(216.8
|
)
|
|
|
Balance as of January 1, 2017
|
$
|
—
|
|
Net Sales from external customers by product category were as follows:
|
|
For the year
January 4, 2016 to January 1, 2017 |
For the year
December 29, 2014 to January 3, 2016 |
For the year
December 30, 2013 to December 28, 2014 |
|||||||||
|
Agronomic
|
$
|
567.9
|
|
$
|
525.1
|
|
$
|
473.7
|
|
|||
|
Irrigation and Outdoor Lighting
|
605.9
|
|
512.4
|
|
432.5
|
|
||||||
|
Landscape and other
|
283.9
|
|
233.3
|
|
176.2
|
|
||||||
|
Nursery
|
190.5
|
|
180.8
|
|
94.2
|
|
||||||
|
$
|
1,648.2
|
|
$
|
1,451.6
|
|
$
|
1,176.6
|
|
||||
Agronomic Net sales include fertilizer and control product categories.
Basic earnings (loss) per common share is computed by dividing net income (loss) attributable to common shares by the weighted average number of common shares outstanding for the period. The Redeemable Convertible Preferred Stock had the right to participate in all distributions declared and paid on the Company’s common stock on an as-converted basis, and was therefore considered a participating security. The Company calculates basic earnings per share using the “two-class” method, and for the years ended
January 1, 2017
,
January 3, 2016
and
December 28, 2014
did not allocate the loss available to common stockholders to the Redeemable Convertible Preferred Stock as those holders did not have a contractual obligation to share in net losses. In periods with income available to common stockholders, the Company would reduce income available to common stockholders to reflect the hypothetical distribution of undistributed earnings to the Redeemable Convertible Preferred Stock in accordance with its contractual rights. The Company reduced income available to common stockholders and increased loss available to common stockholders to reflect the cumulative dividend on the Company’s Redeemable Convertible Preferred Stock whether or not declared or paid during the period. Similarly, the Company reduced income available to common stockholders and increased loss available to common stockholders for any amortization of beneficial conversion features recorded during each period. See Note 11 for a detailed description of the terms of the Redeemable Convertible Preferred Stock.
As disclosed in Note 1, on May 2, 2016, a one-time special cash dividend of
$176.0 million
was paid to existing stockholders of the Company as of April 29, 2016. Of the
$176.0 million
special cash dividend,
$112.4 million
was paid to holders of the Redeemable Convertible Preferred Stock in accordance with its right to participate in all distributions to common stockholders on an as-converted basis. Prior to May 16, 2016, the earnings (loss) per share calculation reflected the impact of the Redeemable Convertible Preferred Stock. Since the special cash dividend was paid prior to conversion of the Redeemable Convertible Preferred Stock, the
$112.4 million
is reported as a reduction of net income attributable to common shares during the year ended January 1, 2017.
The Company’s computation of diluted earnings (loss) per common share includes the effect of potential common stock, if dilutive. For the years ended
January 1, 2017
,
January 3, 2016
and
December 28, 2014
, the assumed exercises the Company’s employee stock options, RSUs and DSUs and the conversion of Redeemable Convertible Preferred Stock were anti-dilutive and, therefore, the following potential shares of common stock were not included in the diluted loss per common share calculation:
87
|
|
January 1, 2017
|
January 3, 2016
|
December 28, 2014
|
||||||
|
Weighted average potential common shares excluded because anti-dilutive
|
|||||||||
|
Redeemable Convertible Preferred Stock
|
9,202,870
|
|
23,876,230
|
|
21,234,297
|
|
|||
|
Employee Stock Options
|
3,160,457
|
|
2,836,919
|
|
1,007,591
|
|
|||
On January 20, 2017, the Company acquired the assets and assumed the liabilities of Aspen Valley Landscape Supply, Inc. (“Aspen Valley”) with
three
locations. Headquartered in Homer Glen, Illinois, Aspen Valley is a market leader in the distribution of hardscapes and landscape supplies in the Chicago Metropolitan Area.
On February 6, 2017, the Company acquired the assets and assumed the liabilities of Stone Forest Materials, LLC (“Stone Forest”) with
one
location in Kennesaw, Georgia. Stone Forest is a leader in the distribution of hardscape products to landscape professionals.
On March 13, 2017, the Company acquired the assets and assumed the liabilities of Angelo’s Supplies, Inc. (“Angelo’s”) with
two
locations in Wixom and Farmington Hills, MI, both suburbs of Detroit. Angelo’s is a hardscape and landscape supply distributor and has been a market leader since 1984.
On March 13, 2017, the Company acquired all of the outstanding stock of American Builders Supply, Inc. and MasonryClub, Inc. and subsidiary (collectively, “AB Supply”) with
10
locations in the greater Los Angeles area and
two
locations in Las Vegas. AB Supply is a leader in the distribution of hardscapes, natural stone and related products to landscape professionals.
The acquisitions are not material and not expected to have a significant impact on the consolidated financial statements.
88
None.
Evaluation of Disclosure Controls and Procedures
We carried out an evaluation, under the supervision and with the participation of our management, including our Chief Executive Officer and our Chief Financial Officer, of the effectiveness of the design and operation of our disclosure controls and procedures (as such term is defined in Rule 13a-15(e) under the Securities Exchange Act of 1934 as amended) as of January 1, 2017. Based upon that evaluation, our Chief Executive Officer and our Chief Financial Officer concluded that as of January 1, 2017, our disclosure controls and procedures are designed at a reasonable assurance level and are effective to provide reasonable assurance that information we are required to disclose in reports that we file or submit under the Exchange Act is recorded, processed, summarized, and reported within the time periods specified in the rules and forms of the Securities and Exchange Commission (SEC), and that such information is accumulated and communicated to our management, including our CEO and CFO, as appropriate, to allow timely decisions regarding required disclosure.
Management’s Report on Internal Control over Financial Reporting
The Annual Report on Form 10-K does not include a report of management’s assessment regarding internal control over financial reporting or an attestation report of our independent registered public accounting firm due to a transition period established by the rules of the SEC for newly public companies.
None.
89
The information required by this Item for SiteOne will be set forth in SiteOne’s Proxy Statement for the 2017 Annual Meeting of Stockholders, which information is hereby incorporated by reference. SiteOne has omitted the information required by this Item pursuant to General Instruction I to the Form 10-K.
The information required by this Item for SiteOne will be set forth in SiteOne’s Proxy Statement for the 2017 Annual Meeting of Stockholders, which information is hereby incorporated by reference. SiteOne has omitted the information required by this Item pursuant to General Instruction I to the Form 10-K.
The information required by this Item for SiteOne will be set forth in SiteOne’s Proxy Statement for the 2017 Annual Meeting of Stockholders, which information is hereby incorporated by reference. SiteOne has omitted the information required by this Item pursuant to General Instruction I to the Form 10-K.
The information required by this Item for SiteOne will be set forth in SiteOne’s Proxy Statement for the 2017 Annual Meeting of Stockholders, which information is hereby incorporated by reference. SiteOne has omitted the information required by this Item pursuant to General Instruction I to the Form 10-K.
The information required by this Item for SiteOne will be set forth in SiteOne’s Proxy Statement for the 2017 Annual Meeting of Stockholders, which information is hereby incorporated by reference. SiteOne has omitted the information required by this Item pursuant to General Instruction I to the Form 10-K.
90
(a). Financial Statements, Schedules and Exhibits.
1. Financial Statements
See
Index to Financial Statements
in Item 8 of Part II of this Annual Report on Form 10-K.
2. Financial Statements Schedules
3. Exhibits
The exhibits filed with this report are listed on the Exhibit Index. Entries marked by the symbol † next to the exhibit’s number identify management contracts or compensatory plans or arrangements.
91
SIGNATURES
Pursuant to the requirements of the Securities Exchange Act of 1934, the Registrant has duly caused this report to be signed on its behalf by the undersigned thereunto duly authorized.
|
|
SITEONE LANDSCAPE SUPPLY, INC.
|
|||
|
(Registrant)
|
||||
|
|
|
|
||
|
Date:
|
March 15, 2017
|
By:
|
/s/ John T. Guthrie
|
|
|
|
|
Name:
|
John T. Guthrie
|
|
|
|
|
Title:
|
Executive Vice President, Chief Financial Officer and Assistant Secretary
|
|
|
(Principal Financial and Principal Accounting Officer)
|
||||
92
Pursuant to the requirements of the Securities Exchange Act of 1934, this report has been signed below by the following persons on behalf of the registrant and in the capacities and on the dates indicated.
|
Date:
|
March 15, 2017
|
By:
|
/s/ Paul S. Pressler
|
|
|
|
|
Name:
|
Paul S. Pressler
|
|
|
|
|
Title:
|
Director and Chairman of the Board
|
|
|
Date:
|
March 15, 2017
|
By:
|
/s/ Doug Black
|
|
|
Name:
|
Doug Black
|
|||
|
Title:
|
President and Chief Executive Officer, Director (Principal Executive Officer)
|
|||
|
Date:
|
March 15, 2017
|
By:
|
/s/ John T. Guthrie
|
|
|
Name:
|
John T. Guthrie
|
|||
|
Title:
|
Executive Vice President, Chief Financial Officer and Assistant Secretary (Principal Financial Officer and Principal Accounting Officer)
|
|||
|
Date:
|
March 15, 2017
|
By:
|
/s/ William W. Douglas, III
|
|
|
Name:
|
William W. Douglas, III
|
|||
|
Title:
|
Director
|
|||
|
Date:
|
March 15, 2017
|
By:
|
/s/ Kenneth A. Giuriceo
|
|
|
Name:
|
Kenneth A. Giuriceo
|
|||
|
Title:
|
Director
|
|||
|
Date:
|
March 15, 2017
|
By:
|
/s/ Jeri L. Isbell
|
|
|
Name:
|
Jeri L. Isbell
|
|||
|
Title:
|
Director
|
|||
|
Date:
|
March 15, 2017
|
By:
|
/s/ Roy Dunbar
|
|
|
Name:
|
Roy Dunbar
|
|||
|
Title:
|
Director
|
|||
|
Date:
|
March 15, 2017
|
By:
|
/s/ Wes Robinson
|
|
|
Name:
|
Wes Robinson
|
|||
|
Title:
|
Director
|
|||
|
Date:
|
March 15, 2017
|
By:
|
/s/ David H. Wasserman
|
|
|
Name:
|
David H. Wasserman
|
|||
|
Title:
|
Director
|
|||
|
Date:
|
March 15, 2017
|
By:
|
/s/ Jack L. Wyszomierski
|
|
|
Name:
|
Jack L. Wyszomierski
|
|||
|
Title:
|
Director
|
|||
93
Schedule I - SiteOne Landscape Supply, Inc.’s Condensed Financial Statements
SiteOne Landscape Supply, Inc.
Parent Company Only
Condensed Balance Sheets
(In millions, except share data)
|
January 1, 2017
|
January 3, 2016
|
|||||||
|
Assets
|
||||||||
|
Investment in wholly owned subsidiary
|
$
|
147.0
|
|
$
|
300.8
|
|
||
|
Deferred tax asset (Note 4)
|
1.8
|
|
2.0
|
|
||||
|
Total assets
|
$
|
148.8
|
|
$
|
302.8
|
|
||
|
Liabilities and Stockholders' Equity
|
||||||||
|
Total liabilities
|
—
|
|
—
|
|
||||
|
Redeemable Convertible Preferred Stock (Note 3)
|
—
|
|
216.8
|
|
||||
|
Stockholders' Equity:
|
||||||||
|
Common stock, par value $0.01; 1,000,000,000 shares authorized; 39,597,532 and 14,259,998 shares issued, and 39,576,621 and 14,250,111 shares outstanding at January 1, 2017 and January 3, 2016, respectively
|
0.4
|
|
0.1
|
|
||||
|
Additional paid in capital
|
219.3
|
|
100.5
|
|
||||
|
Accumulated deficit
|
(69.7
|
)
|
(13.4
|
)
|
||||
|
Accumulated other comprehensive income
|
$
|
(1.2
|
)
|
$
|
(1.2
|
)
|
||
|
Total stockholders' equity
|
148.8
|
|
86.0
|
|
||||
|
Total liabilities and stockholders' equity
|
$
|
148.8
|
|
$
|
302.8
|
|
||
See Notes to Condensed Financial Statements.
94
SiteOne Landscape Supply, Inc.
Parent Company Only
Condensed Statements of Operations and Comprehensive Income
(In millions)
|
For the year
|
For the year
|
For the year
|
||||||||||
|
January 4, 2016
|
December 29, 2014
|
December 30, 2013
|
||||||||||
|
to January 1, 2017
|
to January 3, 2016
|
to December 28, 2014
|
||||||||||
|
Equity in net income of subsidiary
|
$
|
30.6
|
|
$
|
28.9
|
|
$
|
21.7
|
|
|||
|
Net income before taxes
|
30.6
|
|
28.9
|
|
21.7
|
|
||||||
|
Income tax (benefit) expense (Note 4)
|
—
|
|
—
|
|
—
|
|
||||||
|
Net income
|
$
|
30.6
|
|
$
|
28.9
|
|
$
|
21.7
|
|
|||
|
Other comprehensive loss, net of tax
|
—
|
|
(0.8
|
)
|
(0.4
|
)
|
||||||
|
Comprehensive income
|
$
|
30.6
|
|
$
|
28.1
|
|
$
|
21.3
|
|
|||
See Notes to Condensed Financial Statements.
95
SiteOne Landscape Supply, Inc.
Parent Company Only
Condensed Statements of Cash Flows
(In millions)
|
For the year
|
For the year
|
For the year
|
||||||||||
|
January 4, 2016
|
December 29, 2014
|
December 30, 2013
|
||||||||||
|
to January 1, 2017
|
to January 3, 2016
|
to December 28, 2014
|
||||||||||
|
Cash Flows from Operating Activities:
|
||||||||||||
|
Net income (loss)
|
$
|
30.6
|
|
$
|
28.9
|
|
$
|
21.7
|
|
|||
|
Adjustments to reconcile net income (loss) to net cash provided by operating activities:
|
||||||||||||
|
Equity in net income of subsidiary
|
(30.6
|
)
|
(28.9
|
)
|
(21.7
|
)
|
||||||
|
Distribution from subsidiary
|
49.6
|
|
||||||||||
|
Net cash provided by operating activities
|
$
|
49.6
|
|
$
|
—
|
|
$
|
—
|
|
|||
|
Cash Flows from Investing Activities:
|
||||||||||||
|
Distribution received from subsidiary
|
142.2
|
|
—
|
|
—
|
|
||||||
|
Net cash provided by investing activities
|
$
|
142.2
|
|
$
|
—
|
|
$
|
—
|
|
|||
|
Cash Flows from Financing Activities:
|
||||||||||||
|
Special cash dividend
|
(176.0
|
)
|
—
|
|
—
|
|
||||||
|
Other dividends paid
|
(13.0
|
)
|
—
|
|
—
|
|
||||||
|
Other financing activities
|
(2.8
|
)
|
—
|
|
—
|
|
||||||
|
Net cash used in financing activities
|
$
|
(191.8
|
)
|
$
|
—
|
|
$
|
—
|
|
|||
|
Net change in cash and cash equivalents
|
—
|
|
—
|
|
—
|
|
||||||
|
Cash and cash equivalents:
|
||||||||||||
|
Beginning
|
—
|
|
—
|
|
—
|
|
||||||
|
Ending
|
$
|
—
|
|
$
|
—
|
|
$
|
—
|
|
|||
See Notes to Condensed Financial Statements.
96
Notes to Condensed Parent Company Only Financial Statements
SiteOne Landscape Supply, Inc. (“Holdings” or the “Parent”) indirectly owns
100%
of the membership interest in SiteOne Landscape Supply Holding, LLC (“Landscape Holding” or “subsidiary”), which it acquired from Deere & Company on December 23, 2013 (the “Closing Date”) in exchange for its common stock initially representing
40%
of the outstanding capital stock (on an as-converted basis). In addition, Holdings issued cumulative convertible participating redeemable preferred stock (“Redeemable Convertible Preferred Stock”) to Clayton, Dubilier & Rice, LLC (“CD&R”) initially representing
60%
of its remaining outstanding capital stock (on an as-converted basis) (both events collectively referred to herein as the “CD&R Acquisition”). Holdings has no significant operations or assets other than its indirect ownership of the equity of Landscape Holding. Accordingly, the Holdings is dependent upon distributions from Landscape Holding to fund its obligations. However, under the terms of Landscape Holding’s credit agreements governing Landscape Holding’s ABL Facility and Term Loan Facility, Landscape Holding’s ability to pay dividends or lend to Holdings is restricted. Landscape Holding has no obligation to pay dividends to Holdings except to pay specified amounts to Holdings in order to fund the payment of Holdings’ tax obligations.
The accompanying Condensed Parent Only Financial Statements include the amounts of Holdings and its investment in subsidiary since the Closing Date under the equity method, and do not present the financial statements of Holdings and its subsidiary on a consolidated basis. Under the equity method, investment in subsidiary is stated at cost plus contributions and equity in undistributed income (loss) of subsidiary less distributions received since the date of acquisition. These condensed Parent Company Only Financial Statements should be read in conjunction with SiteOne Landscape Supply, Inc. Consolidated Financial Statements and their accompanying Notes to Consolidated Financial Statements.
In connection with the CD&R Acquisition, the Company issued Redeemable Convertible Preferred Stock to the CD&R Investor. On the day prior to the closing of the IPO, all of the then-outstanding Redeemable Convertible Preferred Stock converted into shares of common stock, resulting in the issuance by the Company of an additional
25,303,164
shares of common stock.
On the Closing Date, funds affiliated with CD&R contributed
$174 million
to Holdings in exchange for
174,000
shares of Redeemable Convertible Preferred Stock. Each share of Redeemable Convertible Preferred Stock was convertible into
116.18
shares of common stock at the option of the holder and upon certain contingent events, representing
20.2 million
shares of common stock or
60%
of the voting power and common stock of Holdings on an as-converted basis as of the Closing Date.
Holdings paid cumulative dividends in-kind on January 31, 2014, April 30, 2014, July 31, 2014, October 31, 2014, February 2, 2015, April 30, 2015, July 31, 2015, and November 2, 2015 at a pro rata rate of
12%
per annum.
The initial issuance of Redeemable Convertible Preferred Stock did not include a beneficial conversion feature (“BCF”) because the conversion price used to set the conversion ratio at the time of issuance was greater than the initial common stock price. The paid-in-kind dividends in the form of Redeemable Convertible Preferred Stock contained the same conversion price as the original issuance and in certain cases did include a BCF as of the dividend payment date. Since the Redeemable Convertible Preferred Stock did not have a fixed or determinable redemption date and was freely convertible at any time, the Company immediately amortized any BCF recognized through retained earnings. As disclosed in Note 1, on May 2, 2016, the Company paid a one-time special cash dividend to all existing stockholders as of April 29, 2016. CD&R Investor received
$112.4 million
in accordance with its right to participate in all distributions to common stock on an as-converted basis, in accordance with its right as a preferred stockholder. The Redeemable Convertible Preferred Stock converted to common stock in accordance with its terms on May 16, 2016.
97
The below table summarizes the changes in the carrying value of the Redeemable Convertible Preferred Stock:
|
|
(in millions)
|
||
|
Balance as of December 30, 2013
|
174.0
|
|
|
|
Cumulative Dividends paid-in-kind during the period
|
18.6
|
|
|
|
Balance as of December 28, 2014
|
192.6
|
|
|
|
Cumulative Dividends paid-in-kind during the period
|
24.2
|
|
|
|
Balance as of January 3, 2016
|
216.8
|
|
|
|
Shares converted to Common Stock
|
(216.8
|
)
|
|
|
Balance as of January 1, 2017
|
$
|
—
|
|
With respect to the CD&R Acquisition,
$9.8 million
of transaction expenses were recorded within the period ended December 29, 2013. Of the
$9.8 million
of transaction expenses,
$3.7 million
were not deductible for tax purposes, and the remaining
$6.1 million
(
$2.2 million
tax-effected) were capitalized for tax purposes as a deferred tax asset. During the years end
January 1, 2017
and
January 3, 2016
, respectively,
$0.4 million
(
$0.2 million
tax-effected) and
$0.4 million
(
$0.1 million
tax-effected) has been amortized, which gives rise to a net operating loss and current tax benefit that offsets the deferred tax expense by the same amount. As of January 1, 2017, the deferred tax asset related to these transaction expenses has a balance of
$1.8 million
.
98
Exhibit Index
Note Regarding Reliance on Statements in Our Contracts
: In reviewing the agreements included as exhibits to this Annual Report on Form 10-K, please remember that they are included to provide you with information regarding their terms and are not intended to provide any other factual or disclosure information about Holdings, its subsidiaries or affiliates, or the other parties to the agreements. The agreements contain representations and warranties by each of the parties to the applicable agreement. These representations and warranties have been made solely for the benefit of the other parties to the applicable agreement and (i) should not in all instances be treated as categorical statements of fact, but rather as a way of allocating the risk to one of the parties if those statements prove to be inaccurate; (ii) have been qualified by disclosures that were made to the other party in connection with the negotiation of the applicable agreement, which disclosures are not necessarily reflected in the agreement; (iii) may apply standards of materiality in a way that is different from what may be viewed as material to investors; and (iv) were made only as of the date of the applicable agreement or such other date or dates as may be specified in the agreement and are subject to more recent developments. Accordingly, these representations and warranties may not describe the actual state of affairs as of the date they were made or at any other time. Additional information about Holdings, its subsidiaries and affiliates may be found elsewhere in this Annual Report on Form 10-K.
|
Exhibit
Number
|
Description
|
|
2.1
|
Investment Agreement, dated as of October 26, 2013, by and among CD&R Landscapes Holdings, L.P., SiteOne Landscape Supply Bidco, Inc. (f/k/a CD&R Landscapes Bidco, Inc.), CD&R Landscapes Merger Sub, Inc., CD&R Landscapes Merger Sub 2, Inc., SiteOne Landscape Supply Holding, LLC (f/k/a JDA Holding LLC), Deere & Company and SiteOne Landscape Supply, LLC (f/k/a John Deere Landscapes LLC), is incorporated by reference to Exhibit 2.1 to the Registration Statement on Form S-1 of SiteOne Landscape Supply, Inc., Registration No. 333-206444 (the “Form S-1”).
|
|
3.1
|
Second Amended and Restated Certificate of Incorporation of SiteOne Landscape Supply, Inc., is incorporated by reference to Exhibit 3.1 to the Registration Statement on Form S-8 of SiteOne Landscape Supply, Inc., Registration No. 333-211422 (the “Form S-8”).
|
|
3.2
|
Second Amended and Restated By-Laws of SiteOne Landscape Supply, Inc., is incorporated by reference to Exhibit 3.2 to the Form S-8.
|
|
4.1
|
Form of Common Stock Certificate, is incorporated by reference to Exhibit 4.1 to the Form S-1.
|
|
10.1
|
Stockholders Agreement of SiteOne Landscape Supply, Inc. (f/k/a CD&R Landscapes Parent, Inc.), dated as of December 23, 2013, by and among SiteOne Landscape Supply, Inc., Deere & Company and CD&R Landscapes Holdings, L.P., is incorporated by reference to Exhibit 10.1 of the Form S-1.
|
|
10.2
|
Amended and Restated Stockholders Agreement, dated as of May 12, 2016, by and among SiteOne Landscape Supply, Inc., CD&R Landscapes Holdings, L.P. and Deere & Company, is incorporated by reference to Exhibit 10.1 to the Form 10-Q of SiteOne Landscape Supply, Inc., for the quarter ended April 3, 2016, file number 001-37760 (the “Q1 2016 Form 10-Q”).
|
|
10.3
|
Registration Rights Agreement of SiteOne Landscape Supply, Inc. (f/k/a CD&R Landscapes Parent, Inc.), dated as of December 23, 2013, by and among SiteOne Landscape Supply, Inc., CD&R Landscapes Holdings, L.P. and Deere & Company, is incorporated by reference to Exhibit 10.3 of the Form S-1.
|
|
10.4
|
Transition Services Agreement, dated as of December 23, 2013, by and between SiteOne Landscape Supply, LLC (f/k/a John Deere Landscapes LLC) and Deere & Company, is incorporated by reference to Exhibit 10.4 of the Form S-1.
|
|
10.5
|
Intellectual Property Assignment Agreement, dated as of December 23, 2013, by and between SiteOne Landscape Supply, LLC (f/k/a John Deere Landscapes LLC) and Deere & Company, is incorporated by reference to Exhibit 10.5 of the Form S-1.
|
|
10.6
|
Consulting Agreement, dated as of December 23, 2013, by and among SiteOne Landscape Supply, Inc. (f/k/a CD&R Landscapes Parent, Inc.), SiteOne Landscape Supply Midco, Inc. (f/k/a CD&R Landscapes Midco, Inc.), SiteOne Landscape Supply Bidco, Inc. (f/k/a CD&R Landscapes Bidco, Inc.), SiteOne Landscape Supply Holding, LLC (f/k/a JDA Holding LLC), SiteOne Landscape Supply, LLC (f/k/a John Deere Landscapes LLC) and Clayton, Dubilier & Rice LLC, is incorporated by reference to Exhibit 10.6 of the Form S-1.
|
99
|
Exhibit
Number
|
Description
|
|
10.7
|
Consulting Agreement, dated as of December 23, 2013, by and among SiteOne Landscape Supply, Inc. (f/k/a CD&R Landscapes Parent, Inc.), Deere & Company, SiteOne Landscape Supply Midco, Inc. (f/k/a CD&R Landscapes Midco, Inc.), SiteOne Landscape Supply Bidco, Inc. (f/k/a CD&R Landscapes Bidco, Inc.), SiteOne Landscape Supply Holding, LLC (f/k/a JDA Holding LLC), SiteOne Landscape Supply, LLC (f/k/a John Deere Landscapes LLC) and Deere & Company, is incorporated by reference to Exhibit 10.7 of the Form S-1, is incorporated by reference to Exhibit 10.7 to the Form S-1.
|
|
10.8
|
Indemnification Agreement, dated as of December 23, 2013, by and among SiteOne Landscape Supply, Inc. (f/k/a CD&R Landscapes Parent, Inc.), SiteOne Landscape Supply Midco, Inc. (f/k/a CD&R Landscapes Midco, Inc.), SiteOne Landscape Supply Bidco, Inc. (f/k/a CD&R Landscapes Bidco, Inc.), SiteOne Landscape Supply Holding, LLC (f/k/a JDA Holding LLC), SiteOne Landscape Supply, LLC (f/k/a John Deere Landscapes LLC ), CD&R Landscapes Holdings, L.P., Clayton, Dubilier & Rice Fund VIII, L.P., CD&R Friends & Family Fund VIII, L.P., CD&R Advisor Fund VIII Co-Investor, L.P., Clayton. Dubilier & Rice Inc., and Clayton, Dubilier & Rice LLC, is incorporated by reference to Exhibit 10.8 to the Form S-1.
|
|
10.9
|
Indemnification Agreement, dated as of December 23, 2013, by and among SiteOne Landscape Supply, Inc. (f/k/a CD&R Landscapes Parent, Inc.), SiteOne Landscape Supply Midco, Inc. (f/k/a CD&R Landscapes Midco, Inc.), SiteOne Landscape Supply Bidco, Inc. (f/k/a CD&R Landscapes Bidco, Inc.), SiteOne Landscape Supply Holding, LLC (f/k/a JDA Holding LLC), SiteOne Landscape Supply, LLC (f/k/a John Deere Landscapes LLC) and Deere & Company, is incorporated by reference to Exhibit 10.9 to the Form S-1.
|
|
10.10
|
ABL Credit Agreement, dated as of December 23, 2013, by and among CD&R Landscapes Merger Sub, Inc., CD&R Landscapers Merger Sub 2, Inc., the Lenders (as defined therein), the Borrowers (as defined therein), UBS AG, Stamford Branch, as issuing lender, swingline lender, administrative agent and collateral agent, ING Capital LLC, as syndication agent, and the Co-Documentation Agents and Joint Lead Arrangers and Joint Bookrunners (each as defined therein), is incorporated by reference to Exhibit 10.10 to the Form S-1.
|
|
10.11
|
Amendment No. 1 to the ABL Credit Agreement, dated as of June 13, 2014, by and among SiteOne Landscape Supply Holding, LLC (f/k/a JDA Holding LLC), SiteOne Landscape Supply, LLC (f/k/a John Deere Landscapes LLC), other subsidiary borrowers and the several banks and other financial institutions from time to time party thereto, and UBS AG, Stamford Branch, as administrative agent, is incorporated by reference to Exhibit 10.11 to the Form S-1.
|
|
10.12
|
Amendment No. 2 to the ABL Credit Agreement, dated as of January 26, 2015, by and among SiteOne Landscape Supply Holding, LLC (f/k/a JDA Holding LLC), SiteOne Landscape Supply, LLC (f/k/a John Deere Landscapes LLC), other subsidiary borrowers and the several banks and other financial institutions from time to time party thereto, and UBS AG, Stamford Branch, as administrative agent, is incorporated by reference to Exhibit 10.12 to the Form S-1.
|
|
10.13
|
Amendment No. 3 to the ABL Credit Agreement, dated as of February 13, 2015, by and among SiteOne Landscape Supply Holding, LLC (f/k/a JDA Holding LLC), SiteOne Landscape Supply, LLC (f/k/a John Deere Landscapes LLC), other subsidiary borrowers and the several banks and other financial institutions from time to time party thereto, and UBS AG, Stamford Branch, as administrative agent, is incorporated by reference to Exhibit 10.13 to the Form S-1.
|
|
10.14
|
Amendment No. 4 to the ABL Credit Agreement, dated October 20, 2015, by and among SiteOne Landscape Supply Holding, LLC (f/k/a JDA Holding LLC), SiteOne Landscape Supply, LLC (f/k/a John Deere Landscapes LLC), other subsidiary borrowers and the several banks and other financial institutions from time to time party thereto, and UBS AG, Stamford Branch, as administrative agent is incorporated by reference to Exhibit 10.14 to the Form S-1.
|
|
10.15
|
Term Loan Credit Agreement, dated as of December 23, 2013, by and among CD&R Landscapes Merger Sub, Inc., CD&R Landscapers Merger Sub 2, Inc., lenders party thereto, ING Capital LLC, as administrative agent and collateral agent, UBS Securities LLC, as syndication agent, and the Co-Documentation Agents, Joint Leader Arrangers and Joint Bookrunners (each as defined herein) is incorporated by reference to Exhibit 10.15 to the Form S-1.
|
|
10.16
|
Amendment No. 1 to the Term Loan Credit Agreement, dated as of June 13, 2014, by and among SiteOne Landscape Supply Holding, LLC (f/k/a JDA Holding LLC), SiteOne Landscape Supply, LLC (f/k/a John Deere Landscapes LLC), other subsidiary borrowers and the several banks and other financial institutions from time to time party thereto, and ING Capital LLC, as administrative agent, is incorporated by reference to Exhibit 10.16 to the Form S-1.
|
100
|
Exhibit
Number
|
Description
|
|
10.17
|
Amendment No. 2 to the Term Loan Credit Agreement, dated as of January 26, 2015, by and among SiteOne Landscape Supply Holding, LLC (f/k/a JDA Holding LLC), SiteOne Landscape Supply, LLC (f/k/a John Deere Landscapes LLC), other subsidiary borrowers and the several banks and other financial institutions from time to time party thereto, and ING Capital LLC, as administrative agent, is incorporated by reference to Exhibit 10.17 to the Form S-1.
|
|
10.18
|
Amendment No. 3 to the Term Loan Credit Agreement, dated as of April 29, 2016, by and among SiteOne Landscape Supply Holding, LLC (f/k/a JDA Holding LLC), SiteOne Landscape Supply, LLC (f/k/a John Deere Landscapes LLC), other subsidiary borrowers and the several banks and other financial institutions from time to time party thereto, and UBS AG, Stamford Branch LLC, as successor administrative agent, is incorporated by reference to Exhibit 10.18 to the Form S-1.
|
|
10.18A
|
Amended and Restated Term Loan Credit Agreement, dated as of April 29, 2016 SiteOne Landscape Supply Holding, LLC (f/k/a JDA Holding LLC), SiteOne Landscape Supply, LLC (f/k/a John Deere Landscapes LLC), other subsidiary borrowers and the several banks and other financial institutions from time to time party thereto, and UBS AG, Stamford Branch, as administrative agent, is incorporated by reference to Exhibit 10.18A to the Form S-1.
|
|
10.19
|
ABL Guarantee and Collateral Agreement, dated as of December 23, 2013, by and among SiteOne Landscape Supply Bidco, Inc. (f/k/a CD&R Landscapes Bidco, Inc.), SiteOne Landscape Supply Holding, LLC (f/k/a JDA Holding LLC) and UBS AG, Stamford Branch, as collateral agent, is incorporated by reference to Exhibit 10.19 to the Form S-1.
|
|
10.20
|
Term Loan Guarantee and Collateral Agreement, dated as of December 23, 2013, by and among SiteOne Landscape Supply Bidco, Inc. (f/k/a CD&R Landscapes Bidco, Inc.), SiteOne Landscape Supply Holding, LLC (f/k/a JDA Holding LLC) and ING Capital LLC, as collateral agent, is incorporated by reference to Exhibit 10.20 to the Form S-1.
|
|
10.21†
|
Amended and Restated SiteOne Landscape Supply, Inc. Stock Incentive Plan is incorporated by reference to Exhibit 10.21 to the Form S-1.
|
|
10.22†
|
Form of Employee Stock Option Agreement, is incorporated by reference to Exhibit 10.22 to the Form S-1.
|
|
10.23†
|
Form of Employee Stock Subscription Agreement, is incorporated by reference to Exhibit 10.23 to the Form S-1.
|
|
10.24†
|
Employment Agreement, dated as of April 21, 2014, by and among SiteOne Landscape Supply, LLC (f/k/a John Deere Landscapes LLC), SiteOne Landscape Supply, Inc. (f/k/a CD&R Landscapes Parent, Inc.) and Doug Black is incorporated by reference to Exhibit 10.24 to the Form S-1.
|
|
10.25†
|
Form of Director Indemnification Agreement between SiteOne Landscape Supply, Inc. and each of its directors, is incorporated by reference to Exhibit 10.25 to the Form S-1.
|
|
10.26†
|
SiteOne Landscape Supply, Inc. 2016 Omnibus Incentive Plan, is incorporated by reference to Exhibit 10.26 to the Form S-1.
|
|
10.27
|
Consulting Agreement Termination Letter Agreement, dated May 17, 2016, by and among SiteOne Landscape Supply, Inc., SiteOne Landscape Supply Midco, Inc., SiteOne Landscape Supply Bidco, Inc., SiteOne Landscape Supply Holding, LLC, SiteOne Landscape Supply, LLC and Clayton, Dubilier & Rice, LLC, is incorporated by reference to Exhibit 10.12 to the Q1 2016 Form 10-Q.
|
|
10.28
|
Consulting Agreement Termination Letter Agreement, dated May 17, 2016, by and among SiteOne Landscape Supply, Inc., SiteOne Landscape Supply Midco, Inc., SiteOne Landscape Supply Bidco, Inc., SiteOne Landscape Supply Holding, LLC, SiteOne Landscape Supply, LLC and Deere & Company, is incorporated by reference to Exhibit 10.13 to the Q1 2016 Form 10-Q.
|
|
10.29
|
Registration Rights Waiver Agreement, dated as of October 7, 2015, by and among SiteOne Landscape Supply, Inc., CD&R Landscapes Holdings, L.P. and Deere & Company, is incorporated by reference to Exhibit 10.29 to the Form S-1.
|
|
10.30†
|
Form of Separation Benefit Agreement, is incorporated by reference to Exhibit 10.30 to the Form S-1.
|
|
10.31†
|
Form of Employee Offer Letter, is incorporated by reference to Exhibit 10.31 to the Form S-1.
|
101
|
Exhibit
Number
|
Description
|
|
10.32†
|
2016 Form of Employee Option Agreement, is incorporated by reference to Exhibit 10.32 to the Form S-1.
|
|
10.33†
|
2016 Form of Employee Restricted Stock Unit Agreement, is incorporated by reference to Exhibit 10.33 to the Form S-1.
|
|
10.34†
|
2016 Form of Non-Employee Director Deferred Stock Unit Agreement, is incorporated by reference to Exhibit 10.34 to the Form S-1.
|
|
10.35†
|
Summary of Non-Employee Director Compensation Program, is incorporated by reference to Exhibit 10.35 to the Form S-1.
|
|
10.36†
|
Hiring Bonus Repayment Agreement, dated as of August 17, 2015, by and among SiteOne Landscape Supply (f/k/a John Deere Landscapes) and Briley Brisendine, is incorporated by reference to Exhibit 10.36 to the Form S-1.
|
|
10.37†
|
Executive Stock Ownership Policy, is incorporated by reference to Exhibit 10.37 to the Form S-1.
|
|
10.38†
|
Separation Benefit Agreement, dated as of May 27, 2016, by and among SiteOne Landscape Supply, LLC, SiteOne Landscape Supply, Inc. and Pascal Convers.
|
|
10.39†
|
Separation Benefit Agreement, dated as of May 27, 2016, by and among SiteOne Landscape Supply, LLC, SiteOne Landscape Supply, Inc. and John Guthrie.
|
|
10.40†
|
Separation Benefit Agreement, dated as of May 27, 2016, by and among SiteOne Landscape Supply, LLC, SiteOne Landscape Supply, Inc. and Joe Ketter.
|
|
10.41†
|
Separation Benefit Agreement, dated as of August 17, 2015, by and among SiteOne Landscape Supply, LLC, SiteOne Landscape Supply, Inc. and Briley Brisendine.
|
|
10.42†
|
Form of Employee Stock Option Agreement, as amended November 2016, is incorporated by reference to Exhibit 10.42 to the November 2016 Form S-1.
|
|
10.43†
|
Form of Employee Restricted Stock Unit Agreement, as amended November 2016, is incorporated by reference to Exhibit 10.43 to the November 2016 Form S-1.
|
|
10.44
|
First Amendment to Amended and Restated Credit Agreement, dated as of November 23, 2016, by and among SiteOne Landscape Supply Holding, LLC (f/k/a JDA Holding LLC), SiteOne Landscape Supply, LLC (f/k/a John Deere Landscapes LLC), UBS AG, Stamford Branch, as administrative agent and collateral agent, and the several banks and other financial institutions party thereto, is incorporated by reference to Exhibit 10.1 to the Current Report on Form 8-K of SiteOne Landscape Supply, Inc., filed November 23, 2016.
|
|
10.45
|
Increase Supplement, dated as of November 23, 2016, by and among SiteOne Landscape Supply Holding, LLC (f/k/a JDA Holding LLC) and UBS AG, Stamford Branch, as increasing lender, is incorporated by reference to Exhibit 10.2 to the Current Report on Form 8-K of SiteOne Landscape Supply, Inc., filed November 23, 2016.
|
|
21.1
|
List of Subsidiaries of SiteOne Landscape Supply, Inc. incorporated by reference to Exhibit 21.1 to the November 2016 Form S-1.
|
|
23.1*
|
Consent of Deloitte & Touche LLP.
|
|
31.1*
|
Certification of Chief Executive Officer of SiteOne Landscape Supply, Inc. pursuant to Rule 13a-14, as adopted pursuant to Section 302 of the Sarbanes-Oxley Act of 2002.
|
|
31.2*
|
Certification of Chief Financial Officer of SiteOne Landscape Supply, Inc. pursuant to Rule 13a-14, as adopted pursuant to Section 302 of the Sarbanes-Oxley Act of 2002.
|
|
32.1*
|
Certification of Chief Executive Officer of SiteOne Landscape Supply, Inc. pursuant to Section 1350 of Chapter 63 of Title 18 of the United States Code, as adopted pursuant to Section 906 of the Sarbanes-Oxley Act of 2002.
|
|
32.2*
|
Certification of Chief Financial Officer of SiteOne Landscape Supply, Inc. pursuant to Section 1350 of Chapter 63 of Title 18 of the United States Code, as adopted pursuant to Section 906 of the Sarbanes-Oxley Act of 2002.
|
|
101.INS*
|
XBRL Instance Document
|
102
|
Exhibit
Number
|
Description
|
|
101.SCH*
|
XBRL Taxonomy Extension Schema
|
|
101.CAL*
|
XBRL Taxonomy Extension Calculation Linkbase
|
|
101.DEF*
|
XBRL Taxonomy Extension Definition Linkbase
|
|
101.LAB*
|
XBRL Taxonomy Extension Label Linkbase
|
|
101.PRE*
|
XBRL Extension Presentation Linkbase
|
______________
*
Filed herewith.
† Denotes management contract or compensatory plan or arrangement.
103
TABLE OF CONTENTS
Part IItem 1. BusinessItem 1A. Risk FactorsItem 1B. Unresolved Staff CommentsItem 2. PropertiesItem 3. Legal ProceedingsItem 4. Mine Safety DisclosuresPart IIItem 5. Market For Registrant's Common Equity, Related Stockholder Matters and Issuer Purchases Of Equity SecuritiesItem 6. Selected Financial DataItem 7. Management S Discussion and Analysis Of Financial Condition and Results Of OperationsItem 7A. Quantitative and Qualitative Disclosures About Market RiskItem 8. Financial StatementsNote 1. Nature Of Business and Significant Accounting PoliciesNote 2. AcquisitionsNote 3. Property and EquipmentNote 4. Goodwill and Intangible AssetsNote 5. Capital LeasesNote 6. Employee Benefit and Stock Incentive PlansNote 7. Long-term DebtNote 8. Income TaxesNote 9. Related Party TransactionsNote 10. Commitments and ContingenciesNote 11. Redeemable Convertible Preferred StockNote 12. Net Sales By ProductNote 13. Earnings (loss) Per ShareNote 14. Subsequent EventsItem 9. Changes in and Disagreements with Accountants on Accounting and Financial DisclosureItem 9A. Controls and ProceduresItem 9B. Other InformationPart IIIItem 10. Directors, Executive Officers and Corporate GovernanceItem 11. Executive CompensationItem 12. Security Ownership Of Certain Beneficial Owners and Management and Related Stockholder MattersItem 13. Certain Relationships and Related Transactions, and Director IndependenceItem 14. Principal Accountant Fees and ServicesPart IVItem 15. ExhibitsNote 1. Description Of Siteone Landscape Supply, IncNote 2. Basis Of PresentationNote 3. Redeemable Convertible Preferred StockNote 4. Income Taxes