UNITED STATES
SECURITIES AND EXCHANGE
COMMISSION
Washington, D.C.
20549
FORM 10-K
(Mark One)
[X]
ANNUAL REPORT PURSUANT TO SECTION 13 OR 15(d) OF THE SECURITIES
EXCHANGE ACT OF 1934
For the fiscal year ended December 31, 2019
OR
[ ]
TRANSITION
REPORT UNDER SECTION 13 OR 15(d) OF THE EXCHANGE ACT OF
1934
From the transition period
from to
Commission File Number 001-38819
SUPER LEAGUE GAMING, INC.
(Exact name of small business issuer as specified in its
charter)
|
Delaware
|
47-1990734
|
|
(State or other jurisdiction of incorporation or
organization)
|
(IRS Employer Identification No.)
|
2906 Colorado Ave.
Santa Monica, California 90404
(Address of principal executive offices)
Company: (802) 294-2754; Investor Relations:
949-574-3860
(Issuer’s telephone number)
Securities registered pursuant to Section 12(b) of the
Act:
|
Title of each class
|
Trading Symbol(s)
|
Name of each exchange on which registered
|
|
Common Stock, par value $0.001 per share
|
SLGG
|
NASDAQ Capital Market
|
Indicate by check mark if the registrant is a well-known seasoned
issuer, as defined in Rule 405 of the Securities
Act.
Yes [
] No [X]
Indicate by check mark if the registrant is not required to
file reports pursuant to Section 13 or Section 15(d) of the
Act.
Y
es [ ] No
[X]
Indicate by check mark whether the registrant (1) has filed
all reports required to be filed by Section 13 or 15(d) of
the Securities Exchange Act of 1934 during the preceding 12 months
(or for such shorter period that the registrant was required to
file such reports), and (2) has been subject to such
filing requirements for the past 90 days.
Yes [X] No [
]
Indicate by check mark whether the registrant has submitted
electronically every Interactive Data File required to be submitted
pursuant to Rule 405 of Regulation S-T (§ 232.405 of this
chapter) during the preceding 12 months (or for such shorter period
that the registrant was required to submit such
files).
Yes [X] No
[ ]
Indicate by check mark if disclosure of delinquent filers pursuant
to Item 405 of Regulation S-K is not contained herein, and will not
be contained, to the best of registrant’s knowledge, in
definitive proxy or information statements incorporated by
reference in Part III of this Form 10-K or any amendment to this
Form 10-K. [ ]
Indicate
by check mark whether the registrant is a large accelerated
filer, an accelerated filer, a non-accelerated
filer, a smaller reporting company, or an emerging growth
company. See the definitions of “large accelerated
filer,” “accelerated filer,”
“smaller reporting company,” and "emerging growth
company" in Rule 12b-2 of the Exchange Act.
|
Large
accelerated filer
|
☐
|
Accelerated
filer
|
☐
|
|
Non–Accelerated
filer
|
☐
|
Small
reporting company
|
☒
|
|
|
|
Emerging
growth company
|
☒
|
If an emerging growth company, indicate by check mark if the
registrant has elected not to use the extended transition period
for complying with any new or revised financial accounting
standards provided pursuant to Section 13(a) of the Exchange
Act.
[ ]
Indicate by check mark whether the registrant is a shell company
(as defined in Rule 12b-2 of the Act).
[ ] Yes
[X]
No
The
aggregate market value of the common stock of the registrant held
by non-affiliates of the registrant on June 30, 2019, the last
business day of the registrant's second fiscal quarter was
approximately $67,874,000.
As of March 12, 2020, there were
8,573,922
shares of the registrant’s common stock,
$0.001 par value, issued and outstanding.
DOCUMENTS INCORPORATED BY REFERENCE
Items 10, 11, 12, 13 and 14 of Part III incorporate by
reference certain information from Super League Gaming,
Inc.’s definitive proxy statement, to be filed with the
Securities and Exchange Commission on or before April 29,
2020.
TABLE O
F
CONTENTS
|
|
Item No.
|
|
Page No.
|
|
|
|||
|
|
1
|
||
|
|
20
|
||
|
|
40
|
||
|
|
40
|
||
|
|
40
|
||
|
|
4. |
Mine Safety
Disclosures
|
40
|
|
|
|
|
|
|
41
|
|||
|
|
42
|
||
|
|
44
|
||
|
|
59
|
||
|
|
59
|
||
|
|
59
|
||
|
|
60
|
||
|
|
60
|
||
|
|
|||
|
|
61
|
||
|
|
61
|
||
|
|
61
|
||
|
|
61
|
||
|
|
61
|
||
|
|
|
||
|
62
|
|||
|
62
|
|||
|
63
|
|||
References in this Annual Report on Form 10-K to “Super
League Gaming, Inc.” “Company,” “we,”
“us,” “our,” or similar references mean
Super League Gaming, Inc. References to the “SEC” refer
to the U.S. Securities and Exchange Commission.
This Annual Report on Form 10-K (this “Report”)
contains forward-looking statements that involve substantial risks
and uncertainties. The forward-looking statements are contained
principally in the sections of this Report entitled
“Risk
Factors,” “Management’s
Discussion and Analysis of Financial Condition and Results of
Operations” and “Business,” but are also
contained elsewhere in this Report. In some cases, you can identify
forward-looking statements by the words “anticipate,”
“believe,” “continue,” “could,”
“estimate,” “expect,” “intend,”
“may,” “might,” “objective,”
“ongoing,” “plan,” “predict,”
“project,” “potential,”
“should,” “will,” or “would,”
or the negative of these terms, or other comparable terminology
intended to identify statements about the future. These statements
involve known and unknown risks, uncertainties and other factors
that may cause our actual results, levels of activity, performance
or achievements to be materially different from the information
expressed or implied by these forward-looking statements. Although
we believe that we have a reasonable basis for each forward-looking
statement contained in this Report, we caution you that these
statements are based on a combination of facts and factors
currently known by us and our expectations of the future, about
which we cannot be certain. Forward-looking statements include
statements about:
●
overall
strength and stability of general economic conditions and of the
electronic video game sports (“esports”) industry in
the United States and globally;
●
changes
in consumer demand for, and acceptance of, our services and the
games that we license for our tournaments and other experiences, as
well as online gaming in general;
●
changes
in the competitive environment, including adoption of technologies,
services and products that compete with our own;
●
our
ability to generate consistent revenue;
●
our
ability to effectively execute our business plan;
●
changes
in the price of streaming services, licensing fees, and network
infrastructure, hosting and maintenance;
●
changes
in laws or regulations governing our business and
operations;
●
our
ability to maintain adequate liquidity and financing sources and an
appropriate level of debt on terms favorable to us;
●
our
ability to effectively market our services;
●
costs
and risks associated with litigation;
●
our
ability to obtain and protect our existing intellectual property
protections, including patents, trademarks and
copyrights;
●
our
ability to obtain and enter into new licensing agreements with game
publishers and owners;
●
changes
in accounting principles, or their application or interpretation,
and our ability to make estimates and the assumptions underlying
the estimates, which could have an effect on earnings;
●
interest
rates and the credit markets; and
●
other
risks described from time to time in periodic and current reports
that we file with the SEC.
This list of factors that may affect future performance and the
accuracy of forward-looking statements is illustrative, but not
exhaustive. New risk factors and uncertainties not described here
or elsewhere in this Report, including in the sections entitled
“Risk Factors,” may emerge from time to time. Moreover,
because we operate in a competitive and rapidly changing
environment, it is not possible for our management to predict all
risk factors and uncertainties, nor can we assess the impact of all
factors on our business or the extent to which any factor, or
combination of factors, may cause actual results to differ
materially from those contained in any forward-looking statements
we may make. The forward-looking statements are also subject to the
risks and uncertainties specific to our Company, including but not
limited to the fact that we have a limited operating history as a
public company. In light of these risks, uncertainties and
assumptions, the future events and trends discussed in this Report
may not occur, and actual results could differ materially and
adversely from those anticipated or implied in the forward-looking
statements.
You should not rely upon forward-looking statements as predictions
of future events. Although we believe the expectations reflected in
the forward-looking statements are reasonable, we cannot guarantee
that the future results, levels of activity, performance and events
and circumstances reflected in the forward-looking statements will
be achieved or occur. Moreover, neither we nor any other person
assume responsibility for the accuracy and completeness of the
forward-looking statements. Except as required by applicable
law, including the securities laws of the United States, we do not
intend to update any of the forward-looking statements to conform
these statements to actual results.
You should read this Reports, any documents referenced herein and
those documents filed as exhibits to this Report with the
understanding that our actual future results, levels of activity,
performance and achievements may be materially different from what
we expect.
PA
R
T I
Item 1. Business.
OUR BUSINESS
Overview
We are
a leading amateur esports community and content platform offering a
personalized experience to the large and underserved global
audience of 2.6 billion gamers, as estimated by NewZoo. According
to the Electronic Software Association, the avid gamer,
identified as individuals who are
considered the most frequent gamers,
sees gameplay as
central to their social life with 55% playing video games to
connect with friends and 46% to spend time with family members. As
a first-mover in defining the esports category for the everyday
gamer in 2015, we believe gamers are seeking shared experiences.
Through independent, Company-funded research conducted by
Interpret, 69% of competitive gamers polled indicated they would
like out-of-home opportunities to compete and socialize with other
gamers.
The
Esports Player Pyramid
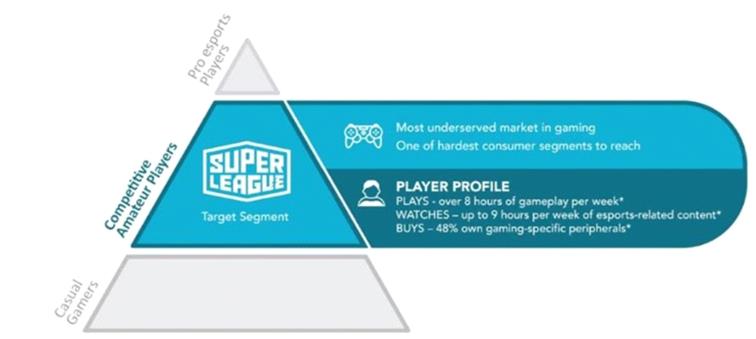
______________________
* Based
on the average esports viewer, Nielsen Esports Playbook,
2017.
Through
our cloud-based, digital products platform, we offer our community
of gamers immersive, team-based esports leagues and competitions
supported by real-life playing fields through our connected network
of retail venue partners. In addition to the tools to facilitate
local, national and global tournaments and leaderboards, players
can socialize, share personal highlights, and view esports
entertainment content through our proprietary digital channels.
Anchored in our city club system which creates local connections
and belonging for gamers both at home and in hometown venues, we
enable and capture tens of millions of gameplay hours and
entertainment content annually, the majority of which is
user-generated content submitted to us by our community. Our
products range from offers that speak to a wide market of
competitive gamers through always on, highly participatory and
social gameplay, as well as offers that ladder to our more
heightened competitions through city-based leagues. We work closely
with top-tier game publishers and brands to bring premium esports
experiences and entertainment to this under-served market of
Generation X and Millennial gamers that are not just the highly
engaged player and content creator, but also the
viewer.
We
currently monetize in two distinct ways. First, we attract brand
sponsorship and advertising revenues by serving as a marketing
channel for brands to reach their target audiences across our
physical and digital network of esports leagues and experiences.
Second, as players come into our gameplay experiences, often
free-to-play, we introduce opportunities to monetize the gamer
through our recently launched consumer subscription offer and
tournament fees for advanced gameplay.
Our Vision
Our
vision is to make Super League Gaming a vital brand in the lives of
everyday gamers. While the games are digital, our players are
human. In a world of increasing de-socialization, we believe gamers
are seeking new ways to deepen their bonds to each other and their
preferred form of entertainment. Our community platform provides
the tools to allow our players around the world to compete,
socialize, share and spectate amateur esports
gameplay.
Milestones and Key Performance Indicators
(“KPIs”)
We have
continually strengthened our brand and platform by:
●
developing our
proprietary, highly automated community, tournament and broadcast
system;
●
launching our City
Club League consisting of 16 city-based teams across the U.S.
supported by a fleet of installed gaming auditoriums;
●
expanding our North
American and international venue footprint through strategic
partnerships with TopGolf, Wanda Cinemas and ggCircuit’s
network of gaming center partners
;
●
executing brand
partnerships with sponsors such as Logitech and game publishers
such as Tencent;
●
growing our
registered player base and deepening engagement through loyalty and
revenue generating subscription programs;
●
growing audience
through our branded digital channels of Framerate, Minehut and
SLG.TV to expand sponsorship and advertising inventory for premium
content monetization;
●
securing 38
protected logos and wordmarks domestically, collectively, and two
logos and wordmarks in China for our master brand and 16 of our
City Clubs; and
●
establishing three
patent families in the U.S. around multi-player gameplay and
visualization.
The
KPIs driving our business model are related to scalable offers
across our scaling footprint of destinations and access to players.
The significant growth we achieved in 2019 was a function of the
advancement of our technology platform, expansion of our venue
networks and game title library, and the acceleration of our
audience growth through the expansion of our digital network of
online gameplay and viewing channels.
Our Customer Key Performance
Indicators
|
|
2017
|
2018
|
2019
|
|
Venues
(1)
|
20
|
34
|
500+
|
|
Game Titles
(2)
|
2
|
4
|
10+
|
|
Registered Users
(3)
|
43,000
|
300,000
|
950,000
|
|
Annual Views
(4)
|
-
|
1,000,000
|
120,000,000
|
|
Engagement Hours
(5)
|
61,000
|
175,000
|
15,000,000
|
____________________
(1)
Venues
represent unique venues where a Super League experience has been
activated and which continue to be part of our current network of
venues for future activations.
(2)
Game
titles
represent game titles which have been incorporated into a Super
League experience.
(3)
Registered
users represent individuals who have registered on our platform,
providing applicable identifying information, that have engaged
with our platform at some point.
(4)
Annual
views
represent number of views of our video content which is distributed
on several platforms.
(5)
Engagement
hours represent time spent engaging with Super League in the form
of participating in our experiences, viewing our content, and/or
spending time on our website.
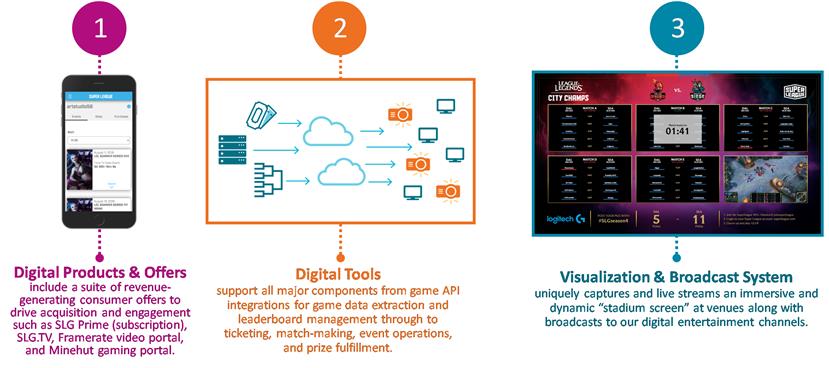
Our Platform
Our
proprietary cloud-based platform provides amateur gamers a
modernized way to connect, play and view games in real-time and
on-demand. We believe our platform will become central to the
esports ecosystem and allow us to capture a significant portion of
our players’ gameplay hours and share-of-wallet for greater
lifetime value. Our platform aggregates a diverse audience of
gamers across multiple game titles and provides users with access
to online, in-person and hybrid competitive experiences and
broadcasts that are accessible to a broad range of ages and
demographics. Through our platform, we have three core components
that enable differentiated and immersive gameplay at scale for both
online and in-person experiences.
Super League’s Scalable Technology
Components
Industry Overview
The consumer appetite for esports continues to grow at a rapid pace
with passionate fans across the globe. According to Statista, the
overall value of the
global gaming
market could reach approximately $180.0 billion by the end of 2021,
representing an estimated increase of 18.0%, or $27.9 billion from
2019.
Key trends fueling this growth
include:
●
the rise of live
streaming and do-it-yourself content;
●
game design that is
inherently competitive;
●
increased
accessibility through cloud-based gaming and 5G
broadband;
●
the further
establishment of professional esports teams and leagues;
and
●
multi-generational
and mass participatory gaming.
In
particular, the professional esports industry is growing quickly,
evidenced through new leagues, teams and broadcast distribution
channels, and this growth is attracting high-profile esports
investments from brands, media organizations and traditional sports
rights holders. As professional esports player salaries and the
value of broadcast media rights have risen substantially, there is
large unmet demand at the amateur level for competitions and
viewing content, which, for esports fans, is predominantly consumed
through live streaming and over-the-top (“OTT”)
channels. The following data points illustrate the vast growth
opportunity for global esports:
The esports audience is already comparable to leading entertainment
platforms, with gamers and viewer numbers in the hundreds of
millions.
Esports,
a term generally used to refer to competitive video game play by
professional players, have been around for as long as the video
game industry itself. However, recent growth in the gaming audience
and player engagement has elevated esports into mainstream culture
with a massive global following that, in some instances, exceeds
the monthly audience of large professional sports leagues. The
following chart reflects the monthly average audience size in 2017
for the four largest professional sports leagues, as compared to
the global monthly esports audience in 2017:
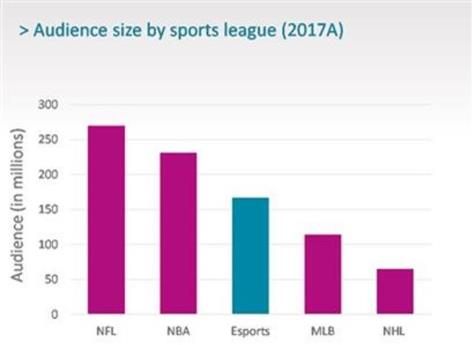
Source:
Goldman Sachs: The World of Games- esports- From Wild West to
Mainstream, June 26, 2018. Figures reflect global monthly average
audience sizes in 2017.
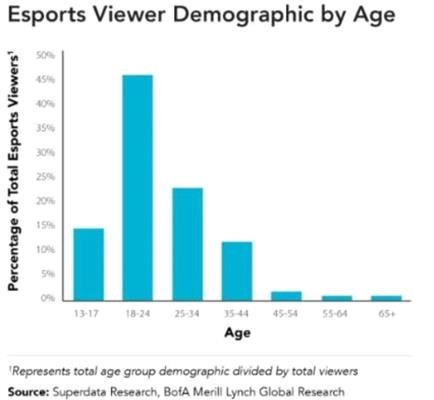
The
esports audience is also young, digital and global. Is it estimated
that more than half of esports viewers are in Asia and 79% of
viewers are under the age of 35 (Goldman Sachs Esports Equity
Research, 2018). In addition, online video sites like YouTube
Gaming and Twitch have larger audiences than HBO, Netflix and ESPN
combined, as shown below:

Source:
Goldman Sachs: The World of Games- esports- From Wild West to
Mainstream, June 26, 2018. Amounts reported for each platform
represent annual audience figures data as of the end of
2016.
Moreover,
there is still a vast opportunity for audience growth in esports
with the introduction of new game titles and increasing popularity
of online gaming content.
●
A
portfolio of just a few top tier game titles can bring access to
hundreds of millions of gamers, as the estimated monthly active
users (“MAU”) for Fortnite, League of Legends and
Minecraft is 125 million, 100 million and 74 million, respectively
(Statista and Microsoft, 2018).
●
In
2018, approximately 560 billion minutes of esports
were viewed on Twitch
, an increase of 58%
year-over-year (TwitchTracker.com).
Demographics centered on the
highly sought after, younger segments
.
Video games have a positive social impact.
●
70% of
parents believing gaming “has a positive influence on their
children’s lives” (Electronic Software Association,
2018).
●
Esports
enthusiasts, on average, have higher college graduation rates and
average household incomes, with 43% earning greater than $75,000
per year, relative to traditional sports fans (Mindshare, Esports
Fans: What Marketers Should Now, 2016).
Revenue potential is valued at billions of dollars, is broad based
and growing rapidly.
●
Recent
reports show a “$15 billion blue sky revenue
opportunity” for professional esports due to the highly
engaged and untapped fanbase (Merrill Lynch Interactive Report,
2018).
●
Gaming
video content is estimated to be a $4.6 billion market with more
viewers than HBO, Netflix, ESPN and Hulu combined (SuperData
Research, 2017).
●
In
2017,
gaming revenues
eclipsed all other major entertainment categories. Gaming
revenues in 2017 totaled $116 billion, as compared to television
revenues of $105 billion, film box office revenues of $41 billion
and digital music revenues of $17 billion (Newzoo forecast for
gaming revenue, Statista for TV and global box office revenue, IFPI
actual data for global digital music revenue, Reuters Plus June
2018).
●
Currently,
an estimated 40% of professional esports revenues come from brand
and media sponsorships (endemic and non-endemic) and 19% from media
rights, with the latter expected to grow to 40% by 2022 (BofA
Merrill Lynch Global Research, 2018).
Our Opportunity
Despite
the significant growth potential outlined above, there are several
key challenges facing stakeholders in the esports
landscape:
●
Mainstream Competitive Gamers
are a highly fragmented, often
anonymous community with limited ways to find gamers of similar
skill-level and gaming interest online and locally. In addition,
the lack of a recreational esports infrastructure results in few
experiences with no clear path to the professional esports level
for players who wish to develop and test their skills while forging
social connections.
●
Game Publishers
must find alternative methods to attract new
gamer audiences to their game titles and offer premium experiences
that drive greater gamer retention. The lack of diversity in
gaming, along with increased competition amongst titles, requires
marketing partnerships to extend the lifecycle and franchise value
of their intellectual property.
●
Venue Operators,
including restaurants and retailers, must
grow same-store sales in order to capture new sources of
foot-traffic and deeper customer loyalty. Millennials and
Generation Z generally value experiences, but tend to purchase more
content and products online, making them an attractive demographic
to widen a venue’s customer base and improve asset
utilization.
●
Sponsors and Advertisers
are limited in their channels to
reach the “cord cutting” Generation Z and Millennials
due to the increasing fragmentation of content distribution and use
of advertising-blocking technology. Given these demographic groups
consume most content online, brands are challenged to target these
audiences in an authentic way and achieve efficient marketing
spend.
●
Professional Esports Teams and Owners
have made significant
investments in their teams and must rapidly develop a fanbase to
achieve franchise values similar to traditional sports teams.
However, there is no formal structure to identify the next
generation of esports professionals to build their long-term
rosters to support long-term fan loyalty.
Super League’s Solution for Esports Ecosystem
Stakeholders
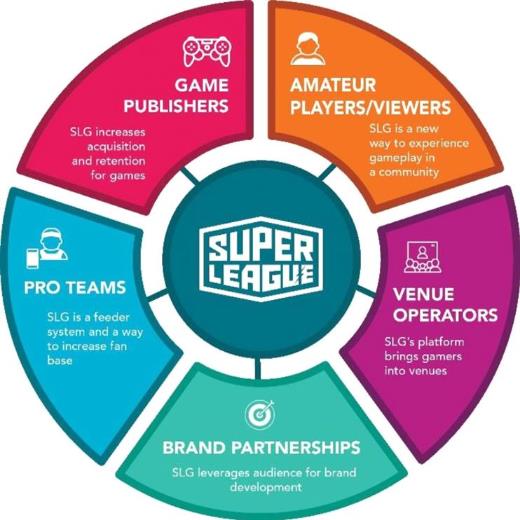
Our platform offers the following solutions for these
key stakeholders:
●
For Mainstream Competitive
Gamers,
our software platform
enables online and in-person player connections and a league-based
structure that provides participants and spectators with a unique
lens on local, recreational esports. We will continue to grow our
digital network to bring large audiences to view this derivative
gameplay and entertainment content through both our own proprietary
network and third-party content channels.
●
For Game Publishers,
our platform introduces their game
titles to new audiences and drives retention by providing an
immersive, premium way to play games, leading to deeper player
engagement. Through our data analytics, we believe we will become a
central component to new game development and launches, and will
have the ability to drive cross-game behavior across a wide
portfolio of game titles.
●
For Venue
Operators
we provide
access to our platform in order to operate esports experiences that
enable these enterprises to attract new foot traffic, improve
day-part utilization and drive same-store sales. In addition, we
expect to provide venue operators with predictive customer activity
information for more targeted offers to existing customers and our
users.
●
For Sponsors and
Advertisers,
our platform
provides a highly targeted marketing channel that offers a relevant
path for brands to build affinity with the hard to reach, yet
highly sought after, Generation Z and Millennial demographics.
Based on our player data, we will have the ability to target
audiences based on our preferred game titles and other profile
information for more efficient marketing spend.
●
For Professional Esports Teams
and Owners,
we cultivate the
future professional esports fanbase through recreational
competitive youth and young adult leagues, while providing an
amateur feeder system as a path to the professional leagues.
Looking forward, we will have a comprehensive set of data and tools
to provide player analytics and progress skill
levels.
Our Amateur Esports Capabilities
Super
League is an “always-on” operation with scalable
technology and deep experiential capabilities to deliver a unique
and differentiated player and spectator experience for the
competitive video gamer. The breadth and diversity of our offers
speak to a wide array of gamers, irrespective of game title. Our
value propositions are:
●
Public-facing gamer persona that connects our players to our
community for rankings and recognition:
Users can create a
gamer profile that provides key gamer information, such as their
unique game title identification, enabling us to manage player
matchmaking, tournament gameplay and statistics tracking. Player
results are dynamically updated on individual profile pages, along
with national and local leaderboards.
●
Premium, immersive gameplay experiences online and
in-person:
Players can join highly accessible, free-to-play,
online experiences on superleague.com and Minehut which offers both
social and gameplay elements. Players wanting a heightened social
and competitive experience can take their participation to one of
our retail partner venues for advanced gameplay.
●
City Clubs enabling local community and connections:
Through
our City Club footprint, we offer digitally native gamers an
opportunity to deepen social connections through in-person
experiences. City Clubs not only enable our seasonal competitions,
but also act as a unifying local umbrella across game titles, age
groups and skill levels. Available in 16 major U.S. cities and
expanding domestically and into Canada, Mexico and China, our owned
and operated City Clubs enable civic pride for esports which is
currently unavailable to everyday gamers.
●
Esports viewing content from a unique perspective:
Our
user-generated content platform coupled with our cloud-based
broadcast tools offer a variety of competitive and entertainment
content and across our digital video channel network. Additionally,
these automated tools allow for a real-time, in-venue livestream
which provides an interactive and contextualized birds-eye
perspective for a more immersive spectating experience. From
watching livestream gameplay and original story-driven content to
gamers sharing their highlight reels on our Framerate social
channels, players, their family and friends can engage in the full
competitive experience.
●
Consumer subscription and exclusive
member benefits:
Players can earn rewards for both the
length and quality of their gameplay and gain exposure on national
and local leaderboards. All participating players can earn a basic
level of loyalty points for prizing redemption locally in-venue.
Players who upgrade to our paid monthly subscription offer enjoy
additional benefits including the ability to earn points faster,
access to exclusive competitions and the Super League global prize
vault, and added benefits from our brand
sponsors.
A Sample of Super League Consumer Offers

●
Super League Prime:
Our beta consumer subscription offer
launched in December 2019 focuses on PC-players in our gaming
center venues network and offers accelerated loyalty benefits and
exclusive experiences for $5.00 per month. We intend to expand this
offer across new platforms including mobile and console games as
well as bring the offer into the home environment.
●
Minehut:
Attracting younger gamers, Minehut is an
‘always on” social and gaming portal for hundreds of
thousands of avid Minecraft players. The COPPA compliant platform
offers a way for parents to secure private spaces for their
children’s gameplay to control who they are playing with
along with offering a unique marketing channel for age-appropriate
content.
●
Framerate:
Targeting more competitive, young-adult gamers,
Framerate, a set of social channels, along with our superleague.com
video portal enable any gamer playing any game, anywhere to submit
their own user-generated highlight reel for recognition. Once
submitted, the content becomes ours to promote, repackage and
monetize across our digital and physical network. Combined with our
proprietary digital channels, we generate tens of millions of
monthly views providing a marketing channel for sponsors and
advertisers to authentically reach gamers.
●
SLG.TV:
Focused on the widest breadth of gamers across all
genres, ages and skill levels, SLG.TV offers esport competitions
and entertainment programming following the leagues, the teams, and
players. Content is available in both livestream and on-demand
video on superleague.com along with our branded Twitch, YouTube and
Facebook channels.
●
City Champs:
Built on the foundation of
our owned and operated City Clubs, our signature, elite league,
City Champs, is offered in seasonal formats across various game
titles. Players compete in intra-city competitions to earn the
right to represent their hometown in city versus city battles for
the ultimate amateur esports experience.
Super League’s City Clubs

Our Scalable Technology Platform
Our
technology platform represents an important intellectual property
asset for our Company. It consists of various custom
developed components that come together in uniquely configured ways
to deliver scalable competitions, experiences and content
opportunities.
Our
platform is focused on the customer journey and player discovery.
Gamers are introduced to Super League through our online digital
channels and marketing or through our distributed network of venue
partners, at which point they are encouraged to register for their
profile and/or for an event through superleague.com or through our
direct interface on the gaming screen at our gaming center partner
venues. Once registered for an experience, gamers have many
touchpoints for further engagement. First, they log back into
superleague.com or their venue gaming screen to get matched into
teams, managed through tournaments and initiate gameplay so we can
capture relevant content including statistics for leaderboard
management. This as well leads to livestream or on-demand
broadcasts in-venue or digitally offering integration of dynamic
leaderboards, statistics and tournament-specific content including
brand sponsor integrations, local team information, instructional
tips and other pertinent content. Next, they can continue to engage
post-game through the sharing of highlights and monitoring of their
statistics on persistent leaderboards along with participating in
our social forums.
Super League’s Consumer Portal
Example

Early
in our inception, we utilized a local hardware solution to create
interactive physical spaces, to create in-person gaming experiences
for mainstream competitive gamers. We had two opportunities ahead
of us for both scale and differentiation. Firstly, we created a
second-screen perspective that would make the experience more
immersive for players and entertaining for spectators much like
professional sporting events resulting in our proprietary
Heads-Up-Display (“
HUD
”) for a stadium screen
experience. Secondly, we moved our platform to the cloud for scale,
and now offer a wide use of our platform to operate Super League
experiences by leveraging the infrastructure, operations and
marketing of an established retail venue network.
Super League’s HUD
Experience

Our proprietary visualization and broadcast system, which provides
compelling livestream content delivery, automates and scales
various gameplay processes and functions that would otherwise need
to be accomplished manually. These processes and functions
primarily include ways to ensure that visualizations of gameplay
and other value-added data and graphics are both captured and
delivered efficiently and timely. For example, our
proprietary software is used during our experiences to ensure that
we are showing the most interesting aspects of gameplay, as well as
switching to matches that are most relevant to the
competition. Further, we use computer vision to glean key
events, graphics or data from the game screen, especially when the
game publisher might not make such information available via an
API. We intend to improve upon our use of computer vision in
our automated technology to continue to provide differentiated
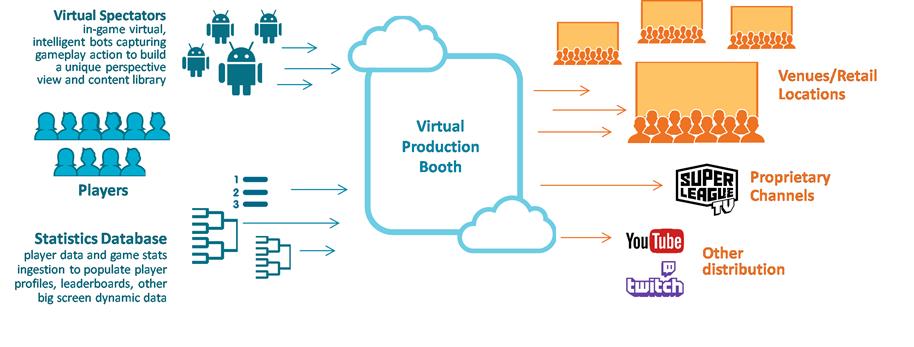
gameplay and spectating experiences. Our virtual, intelligent and
automated production booth for real-time, high quality esports
entertainment broadcasts is illustrated below:
Super League’s Virtual Production Booth
Capability
In
addition to the customer facing experience and broadcasting
functionality, our platform offers digital consumer features that
allow us to aggregate and serve communities of players across
locations and game titles with a common set of player features
including gameplay, matchmaking, leaderboards and statistics,
personal profiles, chat, loyalty and rewards, and video portal
sharing and viewing among others. More specifically, our
proprietary matchmaking software,
“
The Arena,
”
extracts player and game data
that allows us to create a variety of competitive formats with
deeper stratification. The Arena enables players to find and
compete with others of a similar skill level and/or geography in an
automated way. Our competitions can test certain skill levels,
player positions or team pairings and becomes a rating system that
brings more depth to the overall gaming
experience.
Furthermore our platform enables digital tools for scale including,
but not limited to data services, event creation and management,
ecommerce, advertising technology, COPPA compliance, search engine
optimization, email and mobile marketing, and our HUD automated,
production and streaming technology. With respect to data services,
the platform ingests from multiple data sources, including game
publisher application programming interfaces (“API”),
and offer a wide variety of gameplay experiences across multiple
environments, often simultaneously, with a vast array of resulting
content publishing opportunities.
Super League Monetization
The fundamental drivers of our monetization are creating deep
community engagement through our highly contextualized, local
experiences that, when coupled with the critical mass of large
digital audiences, provides the depth and volume for premium
content and offer monetization that is differentiated from a more
traditional, commoditized advertising model. The powerful
combination of our physical venue network and digital programming
channels, with Super League’s platform as the hub, creates
the opportunity for not just a share of the player’s wallet,
but also the advertiser’s wallet.
Prospective
players and viewers are introduced to Super League through six
primary channels that feed our customer funnel, consisting
of:
(i)
top-tier games
titles that provide access to communities in the hundreds of
millions;
(ii)
continued press and
public relations activities that drive brand
awareness;
(iii)
generation of
interest and audience development through SLG.TV, Framerate and
Minehut;
(iv)
retail
venue partners that provide geographic coverage and access to
built-in customer bases;
(v)
brand
sponsors who amplify our sales and marketing through their own
customer and social reach; and
(vi)
brand
ambassadors and user referrals that drive organic word-of-mouth
advertising for deeper engagement, and round out the integral
feedback loop for a network effect.
In addition to
these channels, we also market our community and platform through
in-game promotion, search engine optimization, online advertising,
social influencers, e-mail marketing and established gamer chat
forums such as Discord, to enhance customer
acquisition.
Gamer Monetization: Direct to Consumer Offers
Gamers typically begin their relationship with Super League by
viewing content on our digital network, registering an email
address, and/or by participating in a free-to-play experience.
Users become more engaged by creating a profile to join our network
of players and share more information about their gaming interests,
geographic location and other attributes. Joining Super League is
free, but we do monetize gamers as activity grows with paid
experiences in the form of tournament fees, merchandise sales, and
our newly introduced monthly subscription
program.
For our
pilot subscription offer, Super League Prime, we are targeting PC
gamers in our gaming center partner locations. This segment not
only represents our most competitive set of gamers, but also
provides a captive, highly engaged audience for which we can fine
tune the offer eventually extending it into alternative venues,
including the home, and across console and mobile gamers. Players
in these gaming centers can sign up for Super League’s basic
level of membership through a direct interface between the local
gaming screen and superleague.com. This free offer entitles them to
earn and redeem Super League Points (“SP”) for local
gaming rewards as well as create a basic public-facing profile to
track stats and align with their City Club.
Players
who wish to upgrade to our paid monthly subscription offer, Super
League Prime, will receive accelerated SP earning power for
redemption in our proprietary global rewards vault, access to
exclusive competitions and prizing, and discounts from brand
partners. Set at an affordable price-point with free trial, Super
League Prime is offered at $5.00 per month with an estimated value
of $50.00 and $60.00 in annual revenue per subscriber in the
future.
As we continue to expand our
City Club network, we will create a more direct connection between
the local our signature City Champs league, and the growing set of
hometown venues which support our social and competitive
experience.
Content Monetization: Brand Partnerships, Sponsorships and
Advertising
The highly sought after Millennial and Generation Z audience is
increasingly difficult for brands to reach due to the proliferation
of new content distribution channels, ad-blocking technology and a
sentiment against overt marketing and promotion. This difficulty is
compounded by the limited ways to directly reach gamers, given game
publishers control of in-game content. Our ability to uniquely
aggregate a diverse user base across age ranges, skill levels and
game titles can direct authentic brand integrations to our players
in a targeted way. We stand for inclusive, positive gameplay and
believe that our brand is at the forefront in the mainstreaming of
esports which provides a positive access point for both endemic and
non-endemic brands to enter the category.
Historically,
our largest revenue stream comes by way of brand sponsorship, and
we have been able to monetize our content largely through larger
scale partnerships with brands and game publishers by way
of:
●
Master
brand sponsorships covering all appropriate game titles and
subscription types, providing our brand partners with promotion
opportunities through our online and in-person offerings for
targeted, deep engagement along with user benefits specific to the
sponsors’ products and offers including discounts, free
trials, and exclusive content and experiences.
●
Tournament
and game specific sponsorships, allowing brands to more narrowly
target specific age ranges, game genres and other demographic
objectives.
●
City
Club sponsorships, allowing regional and local brands to
participate in geo-targeted promotion to cultivate unique gamer
lifestyle brands within our City Club metropolitan
areas.
●
Digital
programming sponsorships enable brands to achieve wider reach
through our broadcast distribution network, including our
proprietary channels of Minehut and Framerate along with our
in-venue screens, for both mainstream esports players and
spectators.
●
Tailored
experience-specific sponsorships, providing brands with an
opportunity to design unique experiences and content for deeper
integration and wider media distribution.
Throughout
2019, we significantly increased our audience through viewership
and registered users creating a larger level of advertising
inventory we can now make available to brands and advertisers. We
have developed in-house capability to monetize this added inventory
and expect to extract additional revenue from this large volume of
distributed content through advertising income. We expect to
continue to grow brand and media partnerships across various
vertical categories, in order to attract both brands that are
already deeply committed to esports and brands just entering the
esports space and seeking a mainstream, safe brand partner and
entry point. Our core differentiator is our ability to provide
sponsors and advertisers with very precisely targeted, high quality
and authentic brand integrations that deliver premium costs per
impressions (“CPM”) advertising rates.
Our Strengths
We differentiate ourselves from potential competition by being a
game and location agnostic software platform with a material
network of physical venues, digital programming channels and
established brand partnerships that ultimately aggregate a gaming
community, with whom we have a direct relationship, and their
content. Our core strengths include the
following:
●
Game Publisher Agreements
provide access
to existing user bases via strategic partnerships with some of the
largest game publishers. These partnerships bring players into our
customer funnel and draw subscription interest. Our ability to
interact with this highly attractive, engaged user base draws
brands and sponsors to us to reach this otherwise hard-to-reach
demographic.
●
Proprietary and Curated Content,
reaching in the tens of millions of hours being generated through
our platform per year, provides us with a unique perspective and
library of recreational esports content. This content is currently
absent from the esports ecosystem and is highly complementary and
valuable to the needs of large on-demand and streaming video
providers. Furthermore, the majority of this content is
user-generated (
“
UGC
”
)
with no production costs and can be easily ingested into our
library via tools on our platform.
●
Patent-Pending Technology
allows for unique, intelligent
content capture enabling us to display the most relevant gameplay
activity in real time and broad visualization of active gameplay to
facilitate maximum scale of interactive, in-person gaming,
broadcast experience, and content monetization.
●
Over Five Years of Brand and Technology
Development
provides us a strong, distinctive lead on
followers with no obvious competitors in the holistic community,
league operations and media platform category that also currently
and directly own the relationship with the gamer.
●
A Diverse Set of Enterprise and Commercial
Revenue Streams
enabled by a pure platform play that
protects us from the risk of online-only offers subject to
commoditization and advertising revenue dependency and
work-for-hire tournament operators.
●
A Growing Player and Viewer Base
approaching critical mass that when coupled with highly customized
gaming and viewing experiences allows us to capture a global,
highly engaged, yet somewhat elusive community that will provide
many new ways to monetize over time.
●
Creation of Intangible Brand Value
in
the quality of our offer, game titles, brand partners and investor
base that validates our trusted, premium brand and distinctive
positioning to drive value in the fragmented, burgeoning esports
landscape.
Our Growth Strategy
Our
core strategy is to pursue initiatives that promote the viral
growth of our audience and player base, and in doing so, drive
subscription, sponsorships, advertising and other new revenue
streams. Our customer acquisition and retention funnel provide the
primary lens for community growth, engagement and long-term brand
equity.
●
Viewer Growth and Network Effect
is
driven organically through compelling user-generated content
supplemented by direct marketing, partner and influencer promotion,
and search engine optimization. We believe the most efficient
customer acquisition, however, will come through organic word of
mouth and other customer-based referrals through the establishment
of hometown venue and city clubs.
●
Mutually Beneficial Relationships with Game
Publishers,
along with our game-agnostic platform interface,
allow us to access large, built-in customer bases from game titles
amassing access to hundreds of millions of MAU and offering
enhanced competitive gameplay experiences to deepen their
connection to the game titles. In some cases, we offer integrated
launches with game publishers where they are paying us to create
leagues and offering direct marketing to their
communities.
●
Strategic Retail Venue Partnerships
allow us to reach domestic and international scale by leveraging
the infrastructure, operations and marketing efforts of our retail
venue partners to create daily, weekly and monthly in-person
experiences and persistent gameplay and leaderboards with
competitive gamers to drive more users and content through our
platform.
●
Brand and Media Partnerships,
which
often include commitments to promote our brand events and content
across their social channels outside of our events and platform,
have the potential to extend the utilization of our platform by
leveraging the reach of our partners’ existing broadcast,
social and customer loyalty programs which, in turn, can extend our
audience reach and potentially drive more gamers
and viewers to our amateur esports gaming content and
technology platform.
●
International Expansion
will continue to
enable us to access the massive global scale of gamers worldwide
and unlock greater brand sponsorship and advertising revenue
opportunities through global audience development along with
consumer monetization.
●
Opp
ortunistic Acquisitions. We intend to pursue
one or more opportunistic acquisitions that will
allow us to
add complementary users, revenues, and/or technology components to
accelerate our recreational esports offerings and viewer and player
base and further enhance our revenue growth.
Intellectual Property and Patents
Similar
to other interactive entertainment and esports companies, our
business depends heavily on the creation, acquisition, licensing,
use and protection of intellectual property. We have developed and
own various intellectual properties, including pending and issued
trademarks, patents, and copyrights. For example, each of our
City Clubs have pending trademarks related to naming and logo. We
also have obtained licenses to valuable intellectual property with
game publishers. We leverage these licenses and service
agreements to operate online and location-based competitions, and
in parallel, use them to generate a wide array of
content.
To
protect our intellectual property, we rely on a combination of
patent applications, copyrights, pending and issued trademarks,
confidentiality provisions and procedures, other contractual
provisions, trade secret laws, and restrictions on disclosure. We
intend to vigorously protect our technology and proprietary rights;
however, no assurances can be given that our efforts will be
successful. Even if our efforts are successful, we may incur
significant costs in defending our rights. From time to time, third
parties may initiate litigation against us, alleging infringement
of their proprietary rights or claiming they have not infringed our
intellectual property rights. See the section entitled “Risk
Factors” for additional information regarding the risks we
face with respect to litigation related to intellectual property
claims. As of the date hereof, we have filed three
nonprovisional patent applications, all of which are currently
pending, and various trademark applications, some granted and most
of which are currently pending, covering our technologies and
brands, as more specifically set forth below. We intend to file
additional applications for the grant of patents and registration
of our trademarks in the United States and foreign jurisdictions as
our business expands.
Our
patent applications relate to creating unique, place-based visual
experiences. These experiences manifest via display by web
streams of gameplay in combination with related textual, graphical,
and video content targeted for consumption by players and
spectators alike. In order to achieve visualization of
certain games (e.g., Minecraft or Clash Royale), we have developed
technology that places a “managed” character into these
games for the purpose of capturing and sharing the first-person
perspective that is created. We also filed a patent
application for certain bleeding edge virtualization technologies
that allow us to generate visualizations from the cloud. Instead of
requiring complex and expensive local installation of hardware to
enable the place-based experience, we use this technology to create
web streams of all gameplay and supplementary content. The
effect of this capability is to dramatically reduce the barrier to
entry for venues of all types to participate in Super League
experiences.
Operations
With
over 5,000 experiences completed since 2015, we have a broad
understanding of the requirements to deliver online and in-person
competitions from an operations, technology and customer support
perspective. With our national venue fleet and contractor
network, we established training and protocols for new brand
ambassadors and venue operators for scale. Our operations
network includes the following:
●
Action Squad
serves as an
extension of Super League’s experience team on an as needed
basis and is responsible for logistics at some local venues and
facilitating an engaging and fair player experience. The team,
comprised of approximately 175 contract-based members, has been
interviewed and trained by Super League.
●
Our Customer Service Team
uses Zendesk to manage customer
inquiries that come from various channels including email, web
forms, and Facebook. We run a 24-hour email and ticketing
escalation system and support live chat during normal business
hours and experiences. Our customer service team includes on-site
staff and remote contractors that can scale based on the number of
simultaneous gameplay experiences.
●
The NOC
is equipped with tools to streamline issue
resolution while accommodating a large volume of simultaneous
gameplay experiences. All locations are set up with remote
monitoring of the LAN and player device performance alerting for
real-time customer service and technical escalations. The
technicians are scaled on demand depending on the number of
experiences run simultaneously using remote, real-time network and
tournament monitoring.
Our Values and Company Culture
Super
League is a player-first company, a credo embraced by every
employee. We are committed to enhancing and celebrating the player
experience by providing gameplay formats, competitive frameworks,
technical stability, content, information and customer support that
exceed player expectations.
Having
produced more than 5,000 experiences over more than five years in
locations ranging from movie theatres to restaurants, and retail
stores to LAN centers to esports arenas, Super League specializes
in delivering positive experiences to a wide range of demographic
audiences that bring players and their families and friends a sense
of genuine belonging to a peer group that understands them and
shares their passions.
Employees and Labor Relations
As of
December 31, 2019, we had 55 full-time and full-time equivalent
employees. Additionally, we occasionally enter into agreements with
contractors, on an as-needed basis, to perform certain services. As
of December 31, 2019, four of our full-time employees were subject
to fixed-term employment agreements with us, and all other
employees served at-will pursuant to the terms set forth in their
offer letters.
We
believe that we maintain a good working relationship with our
employees, and we have not experienced any labor disputes. None of
our employees are represented by labor unions.
Governmental Regulation
Our
online gaming platforms, which target individuals ranging from
elementary school age children to adults, are subject to laws and
regulations relating to privacy and child protection. Through our
website, online platforms and in person gaming activities we may
monitor and collect certain information about child users of these
forums. A variety of laws and regulations have been adopted in
recent years aimed at protecting children using the internet, such
as COPPA. COPPA sets forth, among other things, a number of
restrictions related to what information may be collected with
respect to children under the age of 13, as the kinds of content
that website operators may present to children under such age.
There are also a variety of laws and regulations governing
individual privacy and the protection and use of information
collected from individuals, particularly in relation to an
individual’s personally identifiable information (e.g.,
credit card numbers). We employ a kick-out procedure during user
registration whereby anyone identifying themselves as being under
the age of 13 during the process is not allowed to register for a
player account on our website or participate in any of our online
experiences or tournaments without linking their account to that of
a parent or guardian.
In
addition, as a part of our experiences, we offer
prizes and/or gifts as incentives to play. The
federal Deceptive Mail Prevention and Enforcement Act and
certain state prize, gift or sweepstakes statutes may apply to
certain experiences we run from time to time, and other federal and
state consumer protection laws applicable to online collection, use
and dissemination of data, and the presentation of website or other
electronic content, may require us to comply with certain standards
for notice, choice, security and access. We believe that we are in
compliance with any applicable law or regulation when we run these
experiences.
Cost of Compliance with Environmental Laws
We have
not incurred any costs associated with compliance with
environmental regulations, nor do we anticipate any future costs
associated with environmental compliance; however, no assurances
can be given that we will not incur such costs in the
future.
RISK FACTORS
Investing in our common stock involves a high degree of risk. You
should carefully consider the risks described below, as well as the
other information in this Report, including our financial
statements and the related notes thereto and
“Management’s Discussion and Analysis of Financial
Condition and Results of Operations,” before deciding whether
to invest in our common stock. The occurrence of any of the events
or developments described below could harm our business, financial
condition, operating results, and growth prospects. In such an
event, the market price of our common stock could decline, and you
may lose all or part of your investment. Additional risks and
uncertainties not presently known to us or that we currently deem
immaterial also may impair our business operations.
Risks Related to Our Business and Industry
We have incurred significant losses since our inception, and we may
continue to experience losses in the future.
We incurred net losses of $30.7 million and $20.6 million during
the year ended December 31, 2019 and 2018, respectively.
Noncash expenses (excluding depreciation and amortization of fixed
and intangible assets) totaled $16.2 million and $8.9 million for
the year ended December 31, 2019 and 2018, respectively. As of
December 31, 2019, we had an accumulated deficit of $85.8 million.
Moreover, the report of our independent registered public
accounting firm to the financial statements for our fiscal year
ended December 31,
2019,
included elsewhere herein, contains an explanatory paragraph
stating that our recurring losses from operations, accumulated
deficit and cash used in operating activities raise substantial
doubt about our ability to continue as a going concern.
We cannot predict if we will achieve
profitability soon or at all. We expect to continue to expend
substantial financial and other resources on, among other
things:
●
investments
to expand and enhance our esports technology platform and
technology infrastructure, make improvements to the scalability,
availability and security of our platform, and develop new
offerings;
●
sales
and marketing, including expanding our customer acquisition and
sales organization and marketing programs, and expanding our
programs directed at increasing our brand awareness among current
and new customers;
●
investments
in bandwidth to support our video streaming
functionality;
●
contract
labor costs and other expenses to host our leagues and
tournaments;
●
costs
to retain and attract gamers and license first tier game titles,
grow our online gamer community and generally expand our business
operations;
●
hiring
additional employees;
●
expansion
of our operations and infrastructure, both domestically and
internationally; and
●
general
administration, including legal, accounting and other expenses
related to being a public company.
We may not generate sufficient revenue to offset such costs to
achieve or sustain profitability in the future. We expect to
continue to invest heavily in our operations, our online and in
person experiences, business development related to game
publishers, advertisers, sponsors and gamer acquisition, to
accelerate as well as maintain our current market position, support
anticipated future growth and to meet our expanded reporting and
compliance obligations as a public company.
We expect operating losses to continue in the near term in order to
carry out our strategic objectives. We consider historical
operating results, capital resources and financial position, in
combination with current projections and estimates, as part of our
plan to fund operations over a reasonable period of
time.
We believe our current cash position, absent receipt of additional
capital either from operations or that may be available from future
issuance(s) of common stock or debt financings, is not sufficient
to fund our planned operations for the twelve months following the
date of this Report.
We are focused on expanding our service offerings and revenue
growth opportunities through internal development, collaborations,
and through one or more strategic acquisitions. Management is
currently exploring several alternatives for raising capital to
facilitate our growth and execute our business strategy, including
strategic partnerships or other forms of equity or debt
financings.
We intend to continue implementing our business strategy with the
expectation that there will be no material adverse developments in
our business, liquidity or capital requirements. If one or more of
these factors do not occur as expected, it could have a material
adverse impact on our activities, including (i) reduction or delay
of our business activities, (ii) forced sales of material assets,
(iii) defaults on our obligations, or (iv) insolvency. Our planned
investments may not result in increased revenue or growth of our
business. We cannot assure you that we will be able to generate
revenue sufficient to offset our expected cost increases and
planned investments in our business and platform. As a result, we
may incur significant losses for the foreseeable future, and may
not be able to achieve and/or sustain profitability. If we fail to
achieve and sustain profitability, then we may not be able to
achieve our business plan, fund our business or continue as a going
concern. The financial statements included in this Annual Report on
Form 10-K do not contain any adjustments which might be necessary
if we were unable to continue as a going concern.
We are a relatively young company, and we may not be able to
sustain our rapid growth, effectively manage our anticipated future
growth or implement our business strategies.
We have a limited operating history. Although we have experienced
significant growth since our gaming platform for amateur online and
in person gaming experiences was launched, and we established our
amateur city leagues, tournaments and competitions, our historical
growth rate may not be indicative of our future performance due to
our limited operating history and the rapid evolution of our
business model, including a focus on direct to consumer-based
gaming. We may not be able to achieve similar results or accelerate
growth at the same rate as we have historically. As our amateur
city leagues, tournaments and competitions continue to develop, we
may adjust our strategy and business model to adapt. These
adjustments may not achieve expected results and may have a
material and adverse impact on our financial condition and results
of operations.
In addition, our rapid
growth and expansion have placed, and continue to
place, significant strain on our management and resources. This
level of significant growth may not be sustainable or achievable at
all in the future. We believe that our continued growth will depend
on many factors, including our ability to develop new sources of
revenues, diversify monetization methods including our direct to
consumer offerings, attract and retain competitive gamers, increase
engagement, continue developing innovative technologies,
tournaments and competitions in response to shifting demand in
esports and online gaming, increase brand awareness, and expand
into new markets. We cannot assure you that we will achieve any of
the above, and our failure to do so may materially and adversely
affect our business and results of operations.
We are subject to risks associated with operating in a rapidly
developing industry and a relatively new market.
Many elements of our business are unique, evolving and relatively
unproven. Our business and prospects depend on the continuing
development of live streaming of competitive esports gaming. The
market for esports and amateur online gaming competition is
relatively new and rapidly developing and are subject to
significant challenges. Our business relies upon our ability to
cultivate and grow an active gamer community, and our ability to
successfully monetize such community through tournament fees,
digital subscriptions for our esports gaming services, and
advertising and sponsorship opportunities. In addition, our
continued growth depends, in part, on our ability to respond to
constant changes in the esports gaming industry, including rapid
technological evolution, continued shifts in gamer trends and
demands, frequent introductions of new games and titles and the
constant emergence of new industry standards and practices.
Developing and integrating new games, titles, content, products,
services or infrastructure could be expensive and time-consuming,
and these efforts may not yield the benefits we expect to achieve
at all. We cannot assure you that we will succeed in any of these
aspects or that the esports gaming industry will continue to grow
as rapidly as it has in the past.
We generate a portion of our revenues from advertising and
sponsorship. If we fail to attract more advertisers and sponsors to
our gaming platform or tournaments or competitions, or if
advertisers or sponsors are less willing to advertise with or
sponsor us, our revenues may be adversely affected.
We generate a growing portion of our revenues from advertising and
sponsorship, which we expect to further develop and expand in the
near future as online viewership of our esports gaming offerings
expand. Our revenues from advertising and sponsorship partly depend
on the continual development of the online advertising industry and
advertisers’ willingness to allocate budgets to online
advertising in the esports gaming industry. In addition, companies
that decide to advertise or promote online may utilize more
established methods or channels, such as more established internet
portals or search engines, over advertising on our gaming platform.
If the online advertising and sponsorship market does not continue
to grow, or if we are unable to capture and retain a sufficient
share of that market, our ability to increase our current level of
advertising and sponsorship revenue and our profitability and
prospects may be materially and adversely affected.
Furthermore, our core and long-term priority of optimizing the
gamer experience and satisfaction may limit our gaming
platform’s ability to generate revenues from advertising and
sponsorship. For example, in order to provide our gamers with an
uninterrupted competitive gaming experience, we do not place
significant amounts of advertising on our streaming interface or
insert pop-up advertisements during streaming. While this
decision could adversely affect our operating results in the
short-term, we believe it enables us to provide a superior gamer
experience on our gaming platform, which will help us expand and
maintain our current base of gamers and enhance our monetization
potential in the long-term. However, this philosophy of putting our
gamers first may also negatively impact our relationships with
advertisers, sponsors or other third parties, and may not result in
the long-term benefits that we expect, in which case the success of
our business and operating results could be harmed.
Our revenue model may not remain effective and we cannot guarantee
that our future monetization strategies will be successfully
implemented or generate sustainable revenues and
profit.
We generate revenues from advertising and sponsorship of our league
tournaments, and through the operation of our live streaming gaming
platform using a revenue model whereby gamers can get free access
to certain live streaming of amateur tournaments, and gamers pay
fees to compete in league competition. We have generated, and
expect to continue to generate, a substantial portion of revenues
using this revenue model in the near term. We are, however,
particularly focused on implementing a direct to consumer model for
our expanding gamer base. Although our business has experienced
significant growth in recent years, there is no guarantee that our
direct to consumer packages will gain significant traction to
maximize our growth rate in the future, as the demand for our
offerings may change, decrease substantially or dissipate, or we
may fail to anticipate and serve gamer demands
effectively.
The loss of or a substantial reduction in activity by one or more
of our largest customers and/or vendors could materially and
adversely affect our business, financial condition and results of
operations.
During the year ended December 31, 2019 and 2018, (i) five
customers accounted for 69% of our revenue and three customers
accounted for 74%, respectively, (ii) one customer accounted for
70% and three customers accounted for 96% of accounts receivable,
respectively, and (iii) one vendor accounted for 21% and three
vendors accounted for
43% of
accounts payable, respectively. The loss of or a substantial
reduction in activity by one or more of our largest customers could
materially and adversely affect our business, financial condition
and results of operations.
Our marketing and advertising efforts may fail to resonate with
amateur gamers.
Our amateur city league tournaments and competitions are marketed
through a diverse spectrum of advertising and promotional programs
such as online and mobile advertising, marketing through websites,
event sponsorship and direct communications with our gaming
community including via email, blogs and other electronic means. An
increasing portion of our marketing activity is taking place on
social media platforms that are either outside, or not totally
within, our direct control. Changes to gamer preferences,
marketing regulations, privacy and data protection laws, technology
changes or service disruptions may negatively impact our ability to
reach target gamers. Our ability to market our amateur city league
tournaments and competitions is dependent in part upon the success
of these programs. If the marketing for our amateur city league
tournaments and competitions fails to resonate and expand with the
gamer community, or if advertising rates or other media placement
costs increase, our business and operating results could be
harmed.
We have a unique community culture that is vital to our success.
Our operations may be materially and adversely affected if we fail
to maintain this community culture as we expand in our addressable
gamer communities.
We have cultivated an interactive and vibrant online social gamer
community centered around amateur online and in person gaming. We
ensure a superior gamer experience by continuously improving the
user interface and features of our gaming platform along with
offering a multitude of competitive and recreational gaming
experiences with first tier esports games. We believe that
maintaining and promoting a vibrant community culture is critical
to retaining and expanding our gamer community. We have taken
multiple initiatives to preserve our community culture and values.
Despite our efforts, we may be unable to maintain our community
culture and cease to be the preferred platform for our target
gamers as we expand our gamer footprint, which would be detrimental
to our business operations.
The amateur esports gaming industry is intensely competitive.
Gamers may prefer our competitors’ amateur leagues,
competitions or tournaments over our own.
Competition in the amateur esports gaming industry generally is
intense. Our competitors range from established leagues and
championships owned directly, as well as leagues franchised by,
well known and capitalized game publishers and developers,
interactive entertainment companies and diversified media companies
to emerging start-ups, and we expect new competitors to continue to
emerge throughout the amateur esports gaming ecosystem. If our
competitors develop and launch competing amateur city leagues,
tournaments or competitions, or develop a more successful amateur
online gaming platform, our revenue, margins, and profitability
will decline.
The amateur esports gaming industry is very “hit”
driven. We may not have access to “hit” games or
titles.
Select game titles dominate competitive amateur esports and online
gaming, and many new games titles are regularly introduced in each
major industry segment (console, mobile and PC free-to-download).
Despite the number of new entrants, only a very few
“hit” titles account for a significant portion of total
revenue in each segment.
The size and engagement level of our online and
in person gamers are critical to our success and are
closely linked to the quality and popularity of the esports game
publishers with which we have licenses. Esports game publishers on
our gaming platform, including those who have entered into license
agreements with us, may leave us for other gaming platforms or
amateur leagues which may offer better competition, and terms and
conditions than we do. Furthermore, we may lose esports game
publishers if we fail to generate the number of gamers to our
amateur tournaments and competitions expected by such publishers.
In addition, if popular esports game publishers cease to license
their games to us, or our live streams fail to attract gamers, we
may experience a decline in gamer traffic, direct to consumer
opportunities and engagement, which may have a material and adverse
impact on our results of operations and financial
conditions.
Although we have entered into multi-year agreements with certain
publishers, if we fail to license multiple additional
“hit” games or any of our existing
licensed esports game publishers with which we currently have
a license decide to breach the license agreement or choose not to
continue with us once the term of the license agreement expires,
the popularity of our amateur city leagues, tournaments and
competitions may decline and the number of our gamers may decrease,
which could materially and adversely affect our results of
operations and financial condition.
In addition to the esports games we have licensed, we must continue
to attract and retain the most popular esports gaming titles in
order to maintain and increase the popularity of our amateur city
leagues, tournaments and competitions, and ensure the sustainable
growth of our gamer community. We must continue to identify and
enter into license agreements with esports gaming publishers
developing “hit’ games that resonate with our community
on an ongoing basis. We cannot assure you that we can continue to
attract and retain the same level of first-tier esports game
publishers and our ability to do so is critical to our future
success.
We have not entered into definitive license agreements with certain
game publishers that we currently have relationships with, and we
may never do so.
We currently do not have definitive license agreements in place
with game publishers for the use of certain of the game titled
played on our platform, as these publishers currently permit us to
integrate the specifications of the game title with our technology.
We may not ever enter into license agreements with these parties in
the future, instead continuing our relationship with these game
publishers without a license agreement. These game publishers may
unilaterally choose to discontinue their relationship with the
Company, thereby preventing us from offering experiences on our
platform using their game titles, as the case may be. Should those
game publishers choose not to allow us to offer experiences
involving their respective game titles to our users, the
popularity of our amateur city leagues, tournaments and
competitions may decline and the number of our gamers may decrease,
which could materially and adversely affect our results of
operations and financial condition.
If we fail to keep our existing gamers highly engaged, to acquire
new gamers, to successfully implement a direct to consumer model
for our gaming community, our business, profitability and prospects
may be adversely affected.
Our success depends on our ability to maintain and grow the number
of amateur gamers attending and participating in our in-person and
online tournaments and competitions, and using our gaming platform,
and keeping our gamers highly engaged. Of particular importance is
the successful deployment and expansion of our direct to consumer
model to our gaming community for purposes of creating predictable
recurring revenues.
In order to attract, retain and engage amateur gamers and remain
competitive, we must continue to develop and expand our city
leagues, including internationally, produce engaging tournaments
and competitions, successfully license the newest “hit”
esports games and titles, implement new technologies and
strategies, improve features of our gaming platform and stimulate
interactions in our gamer community.
A decline in the number of our amateur gamers in our ecosystem may
adversely affect the engagement level of our gamers, the vibrancy
of our gamer community, or the popularity of our amateur league
play, which may in turn reduce our monetization opportunities, and
have a material and adverse effect on our business, financial
condition and results of operations. If we are unable to attract
and retain, or convert gamers into direct to consumer-based paying
gamers, our revenues may decline, and our results of operations and
financial condition may suffer.
We cannot assure you that our online and in person gaming
platform will remain sufficiently popular with amateur gamers to
offset the costs incurred to operate and expand it. It is vital to
our operations that we remain sensitive and responsive to evolving
gamer preferences and offer first-tier esports game content that
attracts our amateur gamers. We must also keep providing amateur
gamers with new features and functions to enable superior content
viewing, and social interaction. Further, we will need to continue
to develop and improve our gaming platform and to enhance our brand
awareness, which may require us to incur substantial costs and
expenses. If such increased costs and expenses do not effectively
translate into an improved gamer experience and direct to
consumer-based, long-term engagement, our results of operations may
be materially and adversely affected.
The ability to grow our business is dependent in part on the
success and availability of mass media channels developed by third
parties, as well as our ability to develop commercially successful
content, and amateur tournaments and competitions.
The success of our business is driven in part by the commercial
success and adequate supply of third-party mass media channels for
which we may distribute our content, amateur league tournaments and
competitions, including Twitch, YouTube and ESL.tv. Our success
also depends on our ability to accurately predict which channels
and platforms will be successful with the esports gaming community,
our ability to develop commercially successful content and
distribute via SLG.TV, which is presently available on Twitch,
amateur tournaments and competition for these channels and gaming
platforms and our ability to effectively manage the transition of
our gamers from one generation or demographic to the next.
Additionally, we may enter into certain exclusive licensing
arrangements that affect our ability to deliver or market our
amateur gaming tournaments and competitions on certain channels and
platforms. A channel or platform may not succeed as expected or new
channels or platforms may take market share and gamers away from
platforms for which we have devoted significant resources. If
demand for the channels or platforms for which we are developing
amateur tournaments or competitions is lower than our expectations,
we may be unable to fully recover the investments we have made, and
our financial performance may be harmed. Alternatively, a channel
or platform for which we have not devoted significant resources
could be more successful than we initially anticipated, causing us
to not be able to take advantage of meaningful revenue
opportunities.
Our business is subject to risks generally associated with the
entertainment industry.
Our business is subject to risks that are generally associated with
the entertainment industry, many of which are beyond our control.
These risks could negatively impact our operating results and
include the popularity, price to play, and timing of release of our
esports licensed games, economic conditions that adversely affect
discretionary consumer spending, changes in gamer demographics, the
availability and popularity of other forms of entertainment, and
critical reviews and public tastes and preferences, which may
change rapidly and cannot necessarily be predicted.
If we fail to maintain and enhance our brand or if we incur
excessive expenses in this effort, our business, results of
operations and prospects may be materially and adversely
affected.
We believe that maintaining and enhancing our brand is of
significant importance to the success of our business. A
well-recognized brand is important to increasing the number of
esports gamers and the level of engagement of our overall gaming
community which is critical in enhancing our attractiveness to
advertisers and sponsors. Since we operate in a highly competitive
market, brand maintenance and enhancement directly affect our
ability to maintain and enhance our market position.
Although we have developed our brand and amateur tournaments and
competitions through word of mouth referrals, key strategic
partners and our esports game publisher licensors, as we expand, we
may conduct various marketing and brand promotion activities using
various methods to continue promoting our brand. We cannot assure
you, however, that these activities will be successful or that we
will be able to achieve the brand promotion effect we
expect.
In addition, any negative publicity in relation to our league
tournaments or competitions, or operations, regardless of its
veracity, could harm our brands and reputation. Negative publicity
or public complaints from gamers may harm our reputation, and if
complaints against us are not addressed to their satisfaction, our
reputation and our market position could be significantly harmed,
which may materially and adversely affect our business, results of
operations and prospects.
Negative gamer perceptions about our brand, gaming platform,
amateur city leagues, tournaments or competitions and/or business
practices may damage our business and increase the costs incurred
in addressing gamer concerns.
Esports gamer expectations regarding the quality, performance and
integrity of our amateur city league tournaments and competitions
are high. Esports gamers may be critical of our brand, gaming
platform, amateur city leagues, tournaments or competitions and/or
business practices for a wide variety of reasons. These negative
gamer reactions may not be foreseeable or within our control to
manage effectively, including perceptions about gameplay fairness,
negative gamer reactions to game content via social media or other
outlets, components and services, or objections to certain of our
business practices. Negative gamer sentiment about our business
practices also can lead to investigations from regulatory agencies
and consumer groups, as well as litigation, which, regardless of
their outcome, may be costly, damaging to our reputation and harm
our business.
Actual or threatened epidemics, pandemics, outbreaks, or other
public health crises may adversely affect our
business.
Our business could be materially and adversely affected by the
risks, or the public perception of the risks, related to an
epidemic, pandemic, outbreak, or other public health crisis, such
as the recent outbreak of novel coronavirus (COVID-19). The risk,
or public perception of the risk, of a pandemic or media coverage
of infectious diseases could cause a decrease to the attendance of
our in person gaming experiences, or cause certain of our partners,
such as Wanda Theaters in China, to avoid holding in person events.
Moreover, an epidemic, pandemic, outbreak or other public health
crisis, such as COVID-19, could cause members of our Action Squad,
in whom we rely to manage the logistics of our in person
experiences, or on-site employees of partners to avoid any
involvement with our in person experiences or other events, which
would adversely affect our ability to hold such events. The
ultimate extent of the impact of any epidemic, pandemic or other
health crisis on our business, financial condition and results of
operations will depend on future developments, which are highly
uncertain and cannot be predicted, including new information that
may emerge concerning the severity of such epidemic, pandemic or
other health crisis and actions taken to contain or prevent their
further spread, among others. These and other potential impacts of
an epidemic, pandemic or other health crisis, such as COVID-19,
could therefore adversely affect our business, financial condition
and results of operations.
Technology changes
rapidly in our business and if we fail to anticipate
or
successfully implement new
technologies or adopt new business strategies, technologies or
methods, the quality, timeliness and competitiveness of our amateur
city leagues, tournaments or competition may
suffer.
Rapid technology changes in the esports gaming market require us to
anticipate, sometimes years in advance, which technologies we must
develop, implement and take advantage of in order to be and remain
competitive in the esports gaming market. We have invested, and in
the future may invest, in new business strategies including a
direct to consumer model, technologies, products, or games or
first-tier game titles to continue to persistently engage the
amateur gamer and deliver the best online and
in person gaming experience. Such endeavors may involve
significant risks and uncertainties, and no assurance can be given
that the technology we choose to adopt and the features that we
pursue will be successful. If we do not successfully implement
these new technologies, our reputation may be materially adversely
affected and our financial condition and operating results may be
impacted. We also may miss opportunities to adopt technology, or
develop amateur city leagues, tournaments or competitions that
become popular with gamers, which could adversely affect our
financial results. It may take significant time and resources to
shift our focus to such technologies, putting us at a competitive
disadvantage.
Our development process usually starts with particular gamer
experiences in mind, and a range of technical development and
feature goals that we hope to be able to achieve. We may not be
able to achieve these goals, or our competitors may be able to
achieve them more quickly and effectively than we can based on
having greater operating capital and personnel resources. If we
cannot achieve our technology goals within the original development
schedule, then we may delay their release until these goals can be
achieved, which may delay or reduce revenue and increase our
development expenses. Alternatively, we may be required to
significantly increase the resources employed in research and
development in an attempt to accelerate our development of new
technologies, either to preserve our launch schedule or to keep up
with our competitors, which would increase our development
expenses.
We may experience security breaches and cyber threats.
We continually face cyber risks and threats that seek to damage,
disrupt or gain access to our networks and our gaming platform,
supporting infrastructure, intellectual property and other assets.
In addition, we rely on technological infrastructure, including
third party cloud hosting and broadband, provided by third party
business partners to support the in person and online
functionality of our gaming platform. These business partners are
also subject to cyber risks and threats. Such cyber risks and
threats may be difficult to detect. Both our partners and we
have implemented certain systems and processes to guard against
cyber risks and to help protect our data and systems. However, the
techniques that may be used to obtain unauthorized access or
disable, degrade, exploit or sabotage our networks and gaming
platform change frequently and often are not detected. Our systems
and processes, and the systems and processes of our third-party
business partners, may not be adequate. Any failure to prevent or
mitigate security breaches or cyber risks, or respond adequately to
a security breach or cyber risk, could result in interruptions to
our gaming platform, degrade the gamer experience, cause gamers to
lose confidence in our gaming platform and cease utilizing it, as
well as significant legal and financial exposure. This could
harm our business and reputation, disrupt our relationships with
partners and diminish our competitive position.
Successful exploitation of our networks and gaming platform can
have other negative effects upon the gamer experience we offer. In
particular, the virtual economies that exist in certain of our
licensed game publishers’ games are subject to abuse,
exploitation and other forms of fraudulent activity that can
negatively impact our business. Virtual economies involve the
use of virtual currency and/or virtual assets that can be used or
redeemed by a player within a particular online game or
service.
Our business could be adversely affected if our data privacy and
security practices are not adequate, or perceived as being
inadequate, to prevent data breaches, or by the application of data
privacy and security laws generally.
In the course of our business, we may collect, process, store and
use gamer and other information, including personally identifiable
information, passwords and credit card information, the latter of
which is subject to PCI-DSS compliance. Although we take measures
to protect this information from unauthorized access, acquisition,
disclosure and misuse, our security controls, policies and
practices may not be able to prevent the improper or unauthorized
access, acquisition or disclosure of such information. The
unauthorized access, acquisition or disclosure of this information,
or a perception that we do not adequately secure this information
could result in legal liability, costly remedial measures,
governmental and regulatory investigations, harm our profitability
and reputation and cause our financial results to be materially
affected. In addition, third party vendors and business partners
receive access to information that we collect. These vendors and
business partners may not prevent data security breaches with
respect to the information we provide them or fully enforce our
policies, contractual obligations and disclosures regarding the
collection, use, storage, transfer and retention of personal data.
A data security breach of one of our vendors or business partners
could cause reputational harm to them and/or negatively impact our
ability to maintain the credibility of our gamer
community.
Data privacy, data protection, localization, security and
consumer-protection laws are evolving, and the interpretation and
application of these laws in the United States, Europe (including
compliance with the General Data Protection Regulation), and
elsewhere often are uncertain, contradictory and changing. It is
possible that these laws may be interpreted or applied in a manner
that is averse to us or otherwise inconsistent with our practices,
which could result in litigation, regulatory investigations and
potential legal liability or require us to change our practices in
a manner adverse to our business. As a result, our reputation and
brand may be harmed, we could incur substantial costs, and we could
lose both gamers and revenue.
We depend on servers to operate our games with online features and
our proprietary online gaming service. If we were to lose server
functionality for any reason, our business may be negatively
impacted.
Our business relies on the continuous operation of servers, some of
which are owned and operated by third parties. Although we strive
to maintain more than sufficient server capacity, and provide for
active redundancy in the event of limited hardware failure, any
broad-based catastrophic server malfunction, a significant
service-disrupting attack or intrusion by hackers that circumvents
security measures, a failure of disaster recovery service or the
failure of a company on which we are relying for server capacity to
provide that capacity for whatever reason could degrade or
interrupt the functionality of our platform, and could prevent the
operation of our platform for both in-person and online gaming
experiences.
We also rely on networks operated by third parties to support
content on our platform, including networks owned and operated by
game publishers. An extended interruption to any of these services
could adversely affect the use of our platform, which would have a
negative impact on our business.
Further, insufficient server capacity could also negatively impact
our business. Conversely, if we overestimate the amount of server
capacity required by our business, we may incur additional
operating costs.
Our online gaming platform and games offered through our gaming
platform may contain defects.
Our online gaming platform and the games offered through our gaming
platform are extremely complex and are difficult to develop and
distribute. We have quality controls in place to detect defects in
our gaming platform before they are released. Nonetheless, these
quality controls are subject to human error, overriding, and
reasonable resource or technical constraints. Further, we have not
undertaken independent third-party testing, verification or
analysis of our gaming platform and associated systems and
controls. Therefore, our gaming platform and quality controls and
preventative measures we have implemented may not be effective in
detecting all defects in our gaming platform. In the event a
significant defect in our gaming platform and associated systems
and controls is realized, we could be required to offer refunds,
suspend the availability of our city league competitions and other
gameplay, or expend significant resources to cure the defect, each
of which could significantly harm our business and operating
results.
We may experience system failures, outages and/or disruptions of
the functionality of our platform. Such failures, delays and other
problems could harm our reputation and business, cause us to lose
customers and expose us to customer liability.
We may experience system failures, outages and/or disruptions of
our infrastructure, including information technology system
failures and network disruptions, cloud hosting and broadband
availability at in person and online experiences. Our
operations could be interrupted or degraded by any damage to or
failure of:
●
our
computer software or hardware, or our customers’ or
suppliers’ computer software or hardware;
●
our
network, our customers’ networks or our suppliers’
networks; or
●
our
connections and outsourced service arrangements with third
parties.
●
Our systems and operations are also vulnerable to damage or
interruption from:
●
power
loss, transmission cable cuts and other telecommunications and
utility failures;
●
hurricanes,
fires, earthquakes, floods and other natural disasters
●
a
terrorist attack in the U.S. or in another country in which we
operate;
●
interruption
of service arising from facility migrations, resulting from changes
in business operations including acquisitions and planned data
center migrations;
●
computer
viruses or software defects;
●
loss
or misuse of proprietary information or customer data that
compromises security, confidentiality or integrity; or
●
errors
by our employees or third-party service providers.
From time to time in the ordinary course of our business, our
network nodes and other systems experience temporary outages. As a
means of ensuring continuity in the services we provide to our
community and partners, we have invested in system
redundancies via partnerships with industry leading cloud service
providers, proactive alarm monitoring and other back-up
infrastructure, though we cannot assure you that we will be able to
re-route our services over our back-up facilities and provide
continuous service to customers in all circumstances without
material degradation. Because many of our services play a critical
role for our community and partners, any damage to or failure of
the infrastructure we rely on could disrupt or degrade the
operation of our network, our platform and the provision of our
services and result in the loss of current and potential community
members and/or partners and harm our ability to conduct normal
business operations.
We use third-party services and technologies in connection with our
business, and any disruption to the provision of these services and
technologies to us could result in negative publicity and a
slowdown in the growth of our users, which could materially and
adversely affect our business, financial condition and results of
operations.
Our business partially depends on services provided by, and
relationships with, various third parties, including cloud hosting
and broadband providers, among others. To this end, when our cloud
hosting and broadband vendors experience outages, our esports
gaming services will be negatively impacted and alternative
resources will not be immediately available. In addition, certain
third-party software we use in our operations is currently publicly
available free of charge. If the owner of any such software decides
to charge users or no longer makes the software publicly available,
we may need to incur significant costs to obtain licensing, find
replacement software or develop it on our own. If we are unable to
obtain licensing, find or develop replacement software at a
reasonable cost, or at all, our business and operations may be
adversely affected.
We exercise no control over the third-party vendors that we rely
upon for cloud hosting, broadband and software service. If such
third parties increase their prices, fail to provide their services
effectively, terminate their service or agreements or discontinue
their relationships with us, we could suffer service interruptions,
reduced revenues or increased costs, any of which may have a
material adverse effect on our business, financial condition and
results of operations.
Growth and engagement of our gamer community depends upon effective
interoperability with mobile operating systems, networks, mobile
devices and standards that we do not control.
We make our services available across a variety of mobile operating
systems and devices. We are dependent on the interoperability of
our services with popular mobile devices and mobile operating
systems that we do not control, such as Android and iOS. Any
changes in such mobile operating systems or devices that degrade
the functionality of our services or give preferential treatment to
competitive services could adversely affect usage of our services.
In order to deliver high quality services, it is important that our
services work well across a range of mobile operating systems,
networks, mobile devices and standards that we do not control. We
may not be successful in developing relationships with key
participants in the mobile industry or in developing services that
operate effectively with these operating systems, networks, devices
and standards. In the event that it is difficult for our users to
access and use our services, particularly on their mobile devices,
our user growth and user engagement could be harmed, and our
business and operating results could be adversely
affected.
Our business depends substantially on the continuing efforts of our
executive officers, key employees and qualified personnel, and our
business operations may be severely disrupted if we lose their
services.
Our future success depends substantially on the continued efforts
of our executive officers and key employees. If one or more of our
executive officers or key employees were unable or unwilling to
continue their services with us, we might not be able to replace
them easily, in a timely manner, or at all. Since the esports
gaming industry is characterized by high demand and intense
competition for talents, we cannot assure you that we will be able
to attract or retain qualified staff or other highly skilled
employees. In addition, as the Company is relatively young, our
ability to train and integrate new employees into our operations
may not meet the growing demands of our business which may
materially and adversely affect our ability to grow our business
and hence our results of operations.
If any of our executive officers and key employees terminates their
services with us, our business may be severely disrupted, our
financial condition and results of operations may be materially and
adversely affected and we may incur additional expenses to recruit,
train and retain qualified personnel. If any of our executive
officers or key employees joins a competitor or forms a competing
company, we may lose gamers, know-how and key
professionals and staff members. Certain of our executive officers
and key employees have entered into a non-solicitation and
non-competition agreements with us. However, certain provisions
under the non-solicitation and non-competition agreement may
be deemed legally invalid or unenforceable. If any dispute arises
between our executive officers and us, we cannot assure you that we
would be able to enforce
these non-compete agreements.
Our business is subject to regulation, and changes in applicable
regulations may negatively impact our business.
We are subject to a number of foreign and domestic laws and
regulations that affect companies conducting business on the
Internet. In addition, laws and regulations relating to user
privacy, data collection, retention, electronic commerce, virtual
items and currency, consumer protection, content, advertising,
localization, and information security have been adopted or are
being considered for adoption by many jurisdictions and countries
throughout the world. These laws could harm our business by
limiting the products and services we can offer consumers or the
manner in which we offer them. The costs of compliance with these
laws may increase in the future as a result of changes in
interpretation. Furthermore, any failure on our part to comply with
these laws or the application of these laws in an unanticipated
manner may harm our business and result in penalties or significant
legal liability.
In addition, we include modes in our gaming platform that allow
players to compete against each other. Although we structure and
operate these skill-based competitions with applicable laws in
mind, our skill-based competitions in the future could become
subject to evolving rules and regulations and expose us to
significant liability, penalties and reputational
harm.
Changes in tax laws or regulations that are applied adversely to us
or our customers may have a material adverse effect on our
business, cash flow, financial condition or results of
operations.
New income, sales, use or other tax laws, statutes, rules,
regulations or ordinances could be enacted at any time, which could
affect the tax treatment of our earnings and adversely affect our
operations, and our business and financial performance. Further,
existing tax laws, statutes, rules, regulations or ordinances could
be interpreted, changed, modified or applied adversely to us.
For example, on December 22, 2017, President Trump signed tax
legislation into law, commonly referred to as the Tax Cuts and Jobs
Act of 2017, that contains many significant changes to the U.S. tax
laws. The new legislation reduced the corporate income tax
rate from 34% to 21% effective January 1, 2018, causing all of our
deferred income tax assets and liabilities, including NOLs, to be
measured using the new rate and which value is reflected in the
valuation of these assets as of December 31, 2017. As a result, the
value of our deferred tax assets decreased by approximately $4.3
million and the related valuation allowance has been reduced by the
same amount. Our analysis and interpretation of this legislation is
ongoing. Given the full valuation allowance provided for net
deferred tax assets for the periods presented herein, the change in
tax law did not have a material impact on our financial statements
provided herein. There may, however, be additional tax impacts
identified in subsequent fiscal periods in accordance with
subsequent interpretive guidance issued by the SEC or the Internal
Revenue Service. Further, there may be other material adverse
effects resulting from the legislation that we have not yet
identified. No estimated tax provision has been recorded in the
financial statements included herein for tax attributes that are
incomplete or subject to change.
The foregoing items could have a material adverse effect on our
business, cash flow, financial condition or results of
operations. In addition, it is unclear how these U.S. federal
income tax changes will affect state and local taxation, which
often uses federal taxable income as a starting point for computing
state and local tax liabilities. The impact of this tax
legislation on holders of our common stock is also uncertain and
could be adverse. We urge our stockholders and investors to consult
with our legal and tax advisors with respect to this legislation
and the potential tax consequences of investing in or holding our
common stock.
Our online activities are subject to various laws and regulations
relating to privacy and child protection, which, if violated, could
subject us to an increased risk of litigation and regulatory
actions.
In addition to our gaming platform, we use third-party
applications, websites, and social media platforms to promote our
amateur tournaments and competitions and engage gamers, as well as
monitor and collect certain information about gamers in our online
forums. A variety of laws and regulations have been adopted in
recent years aimed at protecting children using the internet such
as the Children’s Online Privacy and Protection Act of 1998
(“COPPA”). COPPA sets forth, among other things, a
number of restrictions on what website operators can present to
children under the age of 13 and what information can be collected
from them. COPPA is of particular concern to us, and in an effort
to minimize our risk of potential exposure, we retained a COPPA
expert as a consultant and have posted a compliant privacy policy,
terms of use and various other policies on our website. We
undertake significant effort to implement certain precautions to
ensure that access to our gaming platform for competitive gameplay
is COPPA compliant. Despite our efforts, no assurances can be given
that such measures will be sufficient to completely avoid exposure
and COPPA violations, any of which could expose us to significant
liability, penalties, reputational harm and loss of revenue, among
other things.
The laws and regulations concerning data privacy are continually
evolving. Failure to comply with these laws and regulations could
harm our business.
Consumers are able to play our licensed game titles online, using
our platform. We collect and store information about our consumers
both personally identifying and non-personally identifying
information. Numerous federal, state and international laws address
privacy, data protection and the collection, storing, sharing, use,
disclosure and protection of personally identifiable information
and other user data. Numerous states already have, and are looking
to expand, data protection legislation requiring companies like
ours to consider solutions to meet differing needs and expectations
of creators and attendees. Outside the United States, personally
identifiable information and other user data is increasingly
subject to legislation and regulations in numerous jurisdictions
around the world, the intent of which is to protect the privacy of
information that is collected, processed and transmitted in or from
the governing jurisdiction. Foreign data protection, privacy,
information security, user protection and other laws and
regulations are often more restrictive than those in the United
States. In particular, the European Union and its member states
traditionally have taken broader views as to types of data that are
subject to privacy and data protection laws and regulations and
have imposed greater legal obligations on companies in this regard.
For example, in April 2016, European legislative bodies adopted the
General Data Protection Regulation (“GDPR”), which
became effective on May 25, 2018. The GDPR applies
to any company established in the European Union as well as to
those outside of the European Union if they collect and use
personal data in connection with the offering of goods or services
to individuals in the European Union or the monitoring of their
behavior. The GDPR enhances data protection obligations
for processors and controllers of personal data, including, for
example, expanded disclosures about how personal information is to
be used, limitations on retention of information, mandatory data
breach notification requirements and onerous new obligations on
service providers. Non-compliance with
the GDPR may result in monetary penalties of up to
€20 million or 4% of annual worldwide revenue, whichever
is higher. In addition, some countries are considering or have
passed legislation implementing data protection requirements or
requiring local storage and processing of data or similar
requirements that could increase the cost and complexity of
delivering our services. The GDPR and other changes in
laws or regulations associated with the enhanced protection of
certain types of personal data could greatly increase our cost of
providing our products and services or even prevent us from
offering certain services in jurisdictions in which we operate. The
European Commission is also currently negotiating a new ePrivacy
Regulation that would address various matters, including provisions
specifically aimed at the use of cookies to identify an
individual’s online behavior, and any such ePrivacy
Regulation may provide for new compliance obligations and
significant penalties. Any of these changes to European Union data
protection law or its interpretation could disrupt and/or harm our
business.
Further, following a referendum in June 2016 in which voters in the
United Kingdom approved an exit from the European Union, the United
Kingdom government has initiated a process to leave the European
Union, which has created uncertainty with regard to the regulation
of data protection in the United Kingdom. In particular, although a
Data Protection Bill designed to be consistent with
the GDPR is pending in the United Kingdom’s
legislative process, it is unclear whether the United Kingdom will
enact data protection laws or regulations designed to be consistent
with the GDPR and how data transfers to and from the
United Kingdom will be regulated. The interpretation and
application of many privacy and data protection laws are, and will
likely remain, uncertain, and it is possible that these laws may be
interpreted and applied in a manner that is inconsistent with our
existing data management practices or product features. Although
player interaction on our platform is subject to our privacy
policies, end user license agreements (“EULAs”), and
terms of service, if we fail to comply with our posted privacy
policies, EULAs, or terms of service, or if we fail to comply with
existing privacy-related or data protection laws and regulations,
it could result in proceedings or litigation against us by
governmental authorities or others, which could result in fines or
judgments against us, damage our reputation, impact our financial
condition and/or harm our business.
In addition to government regulation, privacy advocacy and industry
groups may propose new and different self-regulatory standards that
either legally or contractually apply to us. Any inability to
adequately address privacy, data protection and data security
concerns or comply with applicable privacy, data protection or data
security laws, regulations, policies and other obligations could
result in additional cost and liability to us, damage our
reputation, inhibit sales and harm our business. Further, our
failure, and/or the failure by the various third-party service
providers and partners with which we do business, to comply with
applicable privacy policies or federal, state or similar
international laws and regulations or any other obligations
relating to privacy, data protection or information security, or
any compromise of security that results in the unauthorized release
of personally identifiable information or other user data, or the
perception that any such failure or compromise has occurred, could
damage our reputation, result in a loss of creators or attendees,
discourage potential creators and attendees from trying our
platform and/or result in fines and/or proceedings by governmental
agencies and/or users, any of which could have an adverse effect on
our business, results of operations and financial condition. In
addition, given the breadth and depth of changes in data protection
obligations, ongoing compliance with evolving interpretation of
the GDPR and other regulatory requirements requires time
and resources and a review of the technology and systems currently
in use against the requirements of GDPR and other
regulations.
The preparation of our financial statements involves the use of
good faith estimates, judgments and assumptions, and our financial
statements may be materially affected if such good faith estimates,
judgments or good faith assumptions prove to be
inaccurate
.
Financial statements prepared in accordance with accounting
principles generally accepted in the United States of America
(“GAAP”) typically require the use of good faith
estimates, judgments and assumptions that affect the reported
amounts. Often, different estimates, judgments and assumptions
could reasonably be used that would have a material effect on such
financial statements, and changes in these estimates, judgments and
assumptions may occur from period to period over time. Significant
areas of accounting requiring the application of management’s
judgment include, but are not limited to, determining the fair
value of assets, share-based compensation and the timing and amount
of cash flows from assets. These estimates, judgments and
assumptions are inherently uncertain and, if our estimates were to
prove to be wrong, we would face the risk that charges to income or
other financial statement changes or adjustments would be required.
Any such charges or changes would require a restatement of our
financial statements and could harm our business, including our
financial condition and results of operations and the price of our
securities. See “
Management’s Discussion and Analysis
of Financial Condition and Results of Operations
” for a discussion of the accounting
estimates, judgments and assumptions that we believe are the most
critical to an understanding of our financial statements and our
business.
A reversal of the U.S. economic recovery and a return to
volatile or recessionary conditions in the United States or abroad
could adversely affect our business or our access to capital
markets in a material manner.
To date, our principal sources of capital used to fund our
operations have been the net proceeds we received from sales of
equity securities and proceeds received from the issuance of
convertible debt, as described herein.
We have and will continue to use significant
capital for the growth and development of our business, and, as
such, we expect to seek additional capital either from operations
or that may be available from future issuance(s) of common stock or
debt financings, to fund our planned
operations.
Accordingly, our results of operations and the implementation of
our long-term business strategy could be adversely affected by
general conditions in the global economy, including conditions that
are outside of our control, such as the impact of health and safety
concerns from the current outbreak of COVID-19. The most recent
global financial crisis caused by COVID-19 resulted in extreme
volatility and disruptions in the capital and credit markets. A
severe or prolonged economic downturn could result in a variety of
risks to our business and could have a material adverse effect on
us, including limiting our obtain additional capital from the
capital markets. We could also be adversely affected by such
factors as changes in foreign currency rates and weak economic and
political conditions in each of the countries in which we
operate.
From time to time we may become involved in legal
proceedings.
From time to time we may become subject to legal proceedings,
claims, litigation and government investigations or inquiries,
which could be expensive, lengthy, disruptive to normal business
operations and occupy a significant amount of our employees’
time and attention. In addition, the outcome of any legal
proceedings, claims, litigation, investigations or inquiries may be
difficult to predict and could have a material adverse effect on
our business, operating results, or financial
condition.
Our amended and restated bylaws designate a state or federal court
located within the State of Delaware as the exclusive forum for
certain litigation that may be initiated by our stockholders, which
could limit our stockholders’ ability to obtain a favorable
judicial forum for disputes with us.
Pursuant to our amended and restated bylaws, unless we consent in
writing to the selection of an alternative forum, the sole and
exclusive forum for (i) any derivative action or proceeding
brought on our behalf, (ii) any action asserting a claim of
breach of a fiduciary duty owed by any of our directors, officers
or other employees to us or our stockholders, (iii) any action
asserting a claim against us arising pursuant to any provision of
the Delaware General Corporation Law, or (iv) any action
asserting a claim against us that is governed by the internal
affairs doctrine shall be a state or federal court located within
the State of Delaware, in all cases subject to the court’s
having personal jurisdiction over indispensable parties named as
defendants. Any person or entity purchasing or otherwise acquiring
any interest in shares of our capital stock shall be deemed to have
notice of and consented to this provision. The forum
selection clause in our amended and restated bylaws may have
the effect of discouraging lawsuits against us or our directors and
officers and may limit our stockholders’ ability to obtain a
favorable judicial forum for disputes with us.
Because the
applicability of the exclusive forum provision is limited to the
extent permitted by law, we believe that the exclusive forum
provision would not apply to suits brought to enforce any duty or
liability created by the Securities Exchange Act of 1934, as
amended (the “Exchange Act”), the Securities Act of
1933, as amended (the “Securities Act”), any other
claim for which the federal courts have exclusive jurisdiction
or
concurrent
jurisdiction
over all suits
brought to enforce any duty or liability created by the Securities
Act. We note that there is uncertainty as to whether a court would
enforce the provision and that investors cannot waive compliance
with the federal securities laws and the rules and regulations
thereunder. Although we believe this provision benefits us by
providing increased consistency in the application of Delaware law
in the types of lawsuits to which it applies, the provision may
have the effect of discouraging lawsuits against our directors and
officers.
Risks Related to Intellectual Property
We may be subject to claims of infringement of third-party
intellectual property rights.
From time to time, third parties may claim that we have infringed
their intellectual property rights. For example, patent holding
companies may assert patent claims against us in which they seek to
monetize patents they have purchased or otherwise obtained.
Although we take steps to avoid knowingly violating the
intellectual property rights of others, it is possible that third
parties still may claim infringement.
Existing or future infringement claims against us, whether valid or
not, may be expensive to defend and divert the attention of our
employees from business operations. Such claims or litigation could
require us to pay damages, royalties, legal fees and other costs.
We also could be required to stop offering, distributing or
supporting esports games, our gaming platform or other features or
services which incorporate the affected intellectual property
rights, redesign products, features or services to avoid
infringement, or obtain a license, all of which could be costly and
harm our business.
In addition, many patents have been issued that may apply to
potential new modes of delivering, playing or monetizing
interactive entertainment software products and services, such as
those offered on our gaming platform or that we would like to offer
in the future. We may discover that future opportunities to provide
new and innovative modes of game play and game delivery to gamers
may be precluded by existing patents that we are unable to license
on reasonable terms.
Our technology, content and brands are subject to the threat of
piracy, unauthorized copying and other forms of intellectual
property infringement.
We regard our technology, content and brands as proprietary and
take measures to protect our technology, content and brands and
other confidential information from infringement. Piracy and other
forms of unauthorized copying and use of our technology, content
and brands are persistent, and policing is difficult. Further, the
laws of some countries in which our products are or may be
distributed either do not protect our intellectual property rights
to the same extent as the laws of the United States or are poorly
enforced. Legal protection of our rights may be ineffective in such
countries. In addition, although we take steps to enforce and
police our rights, factors such as the proliferation of technology
designed to circumvent the protection measures used by our business
partners or by us, the availability of broadband access to the
Internet, the refusal of Internet service providers or platform
holders to remove infringing content in certain instances, and the
proliferation of online channels through which infringing product
is distributed all have contributed to an expansion in unauthorized
copying of our technology, content and brands.
Third parties may register trademarks or domain names or purchase
internet search engine keywords that are similar to our registered
trademark or pending trademarks, brands or websites, or
misappropriate our data and copy our gaming platform, all of which
could cause confusion, divert gamers away from our gaming platform
and league tournaments, or harm our reputation.
Competitors and other third parties may purchase
(i) trademarks that are similar to our trademarks and
(ii) keywords that are confusingly similar to our brands or
websites in Internet search engine advertising programs and in the
header and text of the resulting sponsored links or advertisements
in order to divert gamers from us to their websites. Preventing
such unauthorized use is inherently difficult. If we are unable to
prevent such unauthorized use, competitors and other third parties
may continue to drive potential gamers away from our gaming
platform to competing, irrelevant or potentially offensive
platforms, which could harm our reputation and cause us to lose
revenue.
We may not be able to prevent others from unauthorized use of our
intellectual property, which could harm our business and
competitive position.
We regard our registered trademark and pending trademarks, service
marks, pending patents, domain names, trade secrets, proprietary
technologies and similar intellectual property as critical to our
success. We rely on trademark and patent law, trade secret
protection and confidentiality and license agreements with our
employees and others to protect our proprietary
rights.
We have invested significant resources to develop our own
intellectual property and acquire licenses to use and distribute
the intellectual property of others on our gaming platform. Failure
to maintain or protect these rights could harm our business. In
addition, any unauthorized use of our intellectual property by
third parties may adversely affect our current and future revenues
and our reputation.
Policing unauthorized use of proprietary technology is difficult
and expensive. We rely on a combination of patent, copyright,
trademark and trade secret laws and restrictions on disclosure to
protect our intellectual property rights. Further, we require every
employee and consultant to execute proprietary information and
invention agreements prior to commencing work. Despite our efforts
to protect our proprietary rights, third parties may attempt to
copy or otherwise obtain and use our intellectual property or seek
court declarations that they do not infringe upon our intellectual
property rights. Monitoring unauthorized use of our intellectual
property is difficult and costly, and we cannot assure you that the
steps we have taken will prevent misappropriation of our
intellectual property. From time to time, we may have to resort to
litigation to enforce our intellectual property rights, which could
result in substantial costs and diversion of our
resources.
Our patent and trademark applications may not be granted and our
patent and trademark rights, once patents are issued and trademarks
are registered, may be contested, circumvented, invalidated or
limited in scope, and our patent and trademark rights may not
protect us effectively once issued and registered, respectively. In
particular, we may not be able to prevent others from developing or
exploiting competing technologies and trademarks, which could have
a material and adverse effect on our business operations, financial
condition and results of operations.
Currently, we have three patent applications pending, one
registered trademark and eighteen pending trademark applications,
along with licenses from game publishers to utilize their
proprietary games. For our pending patent applications and we
cannot assure you that we will be granted patents pursuant to our
pending applications as well as future patent applications we
intend to file. Even if our patent applications succeed, it is
still uncertain whether these patents will be contested,
circumvented or invalidated in the future. In addition, the rights
granted under any issued patents may not provide us with sufficient
protection or competitive advantages. The claims under any patents
that issue from our patent applications may not be broad enough to
prevent others from developing technologies that are similar or
that achieve results similar to ours. It is also possible that the
intellectual property rights of others will bar us from licensing
and from exploiting any patents that issue from our pending
applications. Numerous U.S. and foreign issued patents and pending
patent applications owned by others exist in the fields in which we
have developed and are developing our technology. These patents and
patent applications might have priority over our patent
applications and could subject our patent applications to
invalidation. Finally, in addition to those who may claim priority,
any of our pending patent and trademark applications may also be
challenged by others on the basis that they are otherwise invalid
or unenforceable.
We may be held liable for information or content displayed on,
retrieved from or linked to our gaming platform, or distributed to
our users.
Our interactive live streaming platform enables gamers to exchange
information and engage in various other online activities. Although
we require our gamers to register their real name, we do not
require user identifications used and displayed during gameplay to
contain any real-name information, and hence we are unable to
verify the sources of all the information posted by our gamers. In
addition, because a majority of the communications on our online
and in person gaming platform is conducted in real time,
we are unable to examine the content generated by gamers before
they are posted or streamed. Therefore, it is possible that gamers
may engage in illegal, obscene or incendiary conversations or
activities, including publishing of inappropriate or illegal
content that may be deemed unlawful. If any content on our platform
is deemed illegal, obscene or incendiary, or if appropriate
licenses and third-party consents have not been obtained, claims
may be brought against us for defamation, libel, negligence,
copyright, patent or trademark infringement, other unlawful
activities or other theories and claims based on the nature and
content of the information delivered on or otherwise accessed
through our platform. Moreover, the costs of compliance may
continue to increase when more content is made available on our
platform as a result of our growing base of gamers, which may
adversely affect our results of operations.
Intensified government regulation of the Internet industry could
restrict our ability to maintain or increase the level of traffic
to our gaming platform as well as our ability to capture other
market opportunities.
The Internet industry is increasingly subject to strict scrutiny.
New laws and regulations may be adopted from time to time to
address new issues that come to the authorities’ attention.
We may not timely obtain or maintain all the required licenses or
approvals or make all the necessary filings in the future. We also
cannot assure you that we will be able to obtain the required
licenses or approvals if we plan to expand into other Internet
businesses. If we fail to obtain or maintain any of the required
licenses or approvals or make the necessary filings, we may be
subject to various penalties, which may disrupt our business
operations or derail our business strategy, and materially and
adversely affect our business, financial condition and results of
operations.
Risks Related to our Common Stock
Although our common stock is listed on the Nasdaq Capital Market,
our shares are likely to be thinly traded for some time and an
active market may never develop.
Although our common stock is listed on the Nasdaq Capital
Market,
it is likely that
initially there will be a very limited trading market for our
common stock, and we cannot ensure that a robust trading market
will ever develop or be sustained. Our shares of common stock may
be thinly traded, and the price, if traded, may not reflect our
actual or perceived value. There can be no assurance that there
will be an active market for our shares of common stock in the
future. The market liquidity will be dependent on the perception of
our operating business, competitive forces, state of the esports
gaming industry, growth rate and becoming cash flow profitable on a
sustainable basis, among other things. We may, in the future, take
certain steps, including utilizing investor awareness campaigns,
press releases, road shows, and conferences to increase awareness
of our business and any steps that we might take to bring us to the
awareness of investors may require we compensate financial public
relations firms with cash and/or stock. There can be no assurance
that there will be any awareness generated or the results of any
efforts will result in any impact on our trading volume.
Consequently, investors may not be able to liquidate their
investment or liquidate it at a price that reflects the value of
the business and trading may be at an inflated price relative to
the performance of our company due to, among other things,
availability of sellers of our shares. If a market should develop,
the price may be highly volatile. Because there may be a low price
for our shares of common stock, many brokerage firms or clearing
firms may not be willing to effect transactions in the securities
or accept our shares for deposit in an account. Even if an investor
finds a broker willing to effect a transaction in the shares of our
common stock, the combination of brokerage commissions, transfer
fees, taxes, if any, and any other selling costs may exceed the
selling price. Further, many lending institutions will not permit
the use of low-priced shares of common stock as collateral for any
loans.
Our stock price may be volatile, and you could lose all or part of
your investment.
The trading price of our common stock following
our offering may fluctuate substantially and may be higher or lower
than the initial public offering price. This may be especially true
for companies with a small public float. The trading price of our
common stock following our offering will depend on several factors,
including those described in this “
Risk
Factors
” section, many of
which are beyond our control and may not be related to our
operating performance. These fluctuations could cause you to lose
all or part of your investment in our common stock since you might
be unable to sell your shares at or above the price you paid in the
offering. Factors that could cause fluctuations in the trading
price of our common stock include:
●
changes
to our industry, including demand and regulations;
●
we
may not be able to compete successfully against current and future
competitors;
●
competitive
pricing pressures;
●
our
ability to obtain working capital financing as
required;
●
additions
or departures of key personnel;
●
sales
of our common stock;
●
our
ability to execute our business plan;
●
operating
results that fall below expectations;
●
loss
of any strategic relationship, sponsor or licensor;
●
any
major change in our management;
●
changes
in accounting standards, procedures, guidelines, interpretations or
principals; and
●
economic,
geo-political and other external factors.
In
addition, the stock market in general, and the market for
technology companies in particular, have experienced extreme price
and volume fluctuations that have often been unrelated or
disproportionate to the operating performance of those companies.
Broad market and industry factors, as well as general economic,
political and market conditions such as recessions or interest rate
changes, may seriously affect the market price of our common stock,
regardless of our actual operating performance. These fluctuations
may be even more pronounced in the trading market for our stock
shortly following our offering. If the market price of our common
stock after our offering does not exceed the initial public
offering price, you may not realize any return on your investment
in us and may lose some or all of your
investment.
In addition, in the past, following periods of volatility in the
overall market and the market prices of particular companies’
securities, securities class action litigations have often been
instituted against these companies. Litigation of this type, if
instituted against us, could result in substantial costs and a
diversion of our management’s attention and resources. Any
adverse determination in any such litigation or any amounts paid to
settle any such actual or threatened litigation could require that
we make significant payments.
If securities industry analysts do not publish research reports on
us, or publish unfavorable reports on us, then the market price and
market trading volume of our common stock could be negatively
affected.
Any trading market for our common stock will be influenced in part
by any research reports that securities industry analysts publish
about us. We may not obtain any future research coverage by
securities industry analysts. In the event we are covered by
research analysts, and one or more of such analysts downgrade our
securities, or otherwise reports on us unfavorably, or discontinues
coverage of us, the market price and market trading volume of our
common stock could be negatively affected.
We have not paid cash dividends in the past and do not expect to
pay dividends in the future. Any return on investment will likely
be limited to the value of our common stock.
We have never paid cash dividends on our common stock and do not
anticipate doing so in the foreseeable future. The payment of
dividends on our common stock will depend on earnings, financial
condition and other business and economic factors affecting us at
such time as our board of directors may consider relevant. If we do
not pay dividends, our common stock may be less valuable because a
return on your investment will only occur if our stock price
appreciates.
Since we do not anticipate paying any cash dividends on our capital
stock in the foreseeable future, stock price appreciation, if any,
will be your sole source of gain.
We currently intend to retain all of our future earnings, if any,
to finance the growth and development of our business. In addition,
the terms of any future debt agreements may preclude us from paying
dividends. As a result, appreciation, if any, in the market price
of our common stock will be your sole source of gain for the
foreseeable future.
Future issuances of debt securities, which would rank senior to our
common stock upon our bankruptcy or liquidation, and future
issuances of preferred stock, which would rank senior to our common
stock for the purposes of dividends and liquidating distributions,
may adversely affect the level of return you may be able to achieve
from an investment in our common stock
.
In the future, we may attempt to increase our capital resources by
offering debt securities. In the event of a bankruptcy or
liquidation, holders of our debt securities, and lenders with
respect to other borrowings we may make, would receive
distributions of our available assets prior to any distributions
being made to holders of our common stock. Moreover, if we issue
preferred stock in the future, the holders of such preferred stock
could be entitled to preferences over holders of common stock in
respect of the payment of dividends and the payment of liquidating
distributions. Because our decision to issue debt or preferred
securities in any future offering, or borrow money from lenders,
will depend in part on market conditions and other factors beyond
our control, we cannot predict or estimate the amount, timing or
nature of any such future offerings or borrowings. Holders of our
common stock must bear the risk that any such future offerings we
conduct or borrowings we make may adversely affect the level of
return they may be able to achieve from an investment in our common
stock.
We are an emerging growth company, and any decision on our
part to comply only with certain reduced reporting and disclosure
requirements applicable to emerging growth companies could make our
common stock less attractive to investors.
We are an emerging growth company, and, for as long as we
continue to be an emerging growth company, we may choose to
take advantage of exemptions from various reporting requirements
applicable to other public companies that are not “emerging
growth companies,” including:
●
not being required
to have our independent registered public accounting firm audit our
internal control over financial reporting under Section 404 of the
Sarbanes-Oxley Act;
●
reduced disclosure
obligations regarding executive compensation in our periodic
reports and annual report on Form 10-K; and
●
exemptions from the
requirements of holding a non-binding advisory vote on executive
compensation and stockholder approval of any golden parachute
payments not previously approved.
W
e could be an emerging growth company
for up to five years following the completion of our offering. Our
status as an emerging growth company will end as soon as
any of the following takes place:
●
the last day of the
fiscal year in which we have more than $1.07 billion in annual
revenue;
●
the
date we qualify as a “large accelerated filer,” with at
least $700 million of equity securities held by
non-affiliates;
●
the
date on which we have issued, in any three-year period, more than
$1.0 billion in non-convertible debt securities; or
●
the
last day of the fiscal year ending after the fifth anniversary of
the completion of our offering.
We cannot predict if investors will find our common stock less
attractive if we choose to rely on the exemptions afforded emerging
growth companies. If some investors find our common stock less
attractive because we rely on any of these exemptions, there may be
a less active trading market for our common stock and the market
price of our common stock may be more volatile.
Under the JOBS Act, emerging growth companies can also delay
adopting new or revised accounting standards until such time as
those standards apply to private companies. We have elected to use
this extended transition period for complying with new or revised
accounting standards that have different effective dates for public
and private companies until the earlier of the date we (i) are no
longer an emerging growth company or
(ii) affirmatively and irrevocably opt out of the extended
transition period provided in the JOBS Act. As a result, our
financial statements may not be comparable to companies that comply
with new or revised accounting pronouncements as of public company
effective dates.
Because of our status as an emerging growth company, you will not
be able to depend on any attestation from our independent
registered public accounting firm as to our internal control over
financial reporting for the foreseeable future
.
Our independent registered public accounting firm will not be
required to attest to the effectiveness of our internal control
over financial reporting pursuant to Section 404 of the
Sarbanes-Oxley Act until the later of the year following our first
annual report required to be filed with the SEC or the date we are
no longer an “emerging growth company” as defined in
the JOBS Act. Accordingly, you will not be able to depend on any
attestation concerning our internal control over financial
reporting from our independent registered public accounting firm
for the foreseeable future. Subsequent to the time frame
above, our independent registered public accounting firm will not
be required to attest to the effectiveness of our internal control
over financial reporting pursuant to the Sarbanes-Oxley
Act until such time that the Company becomes an
“accelerated filer,” as defined by the
SEC.
We have granted, and may continue to grant, share incentive awards,
which may result in increased share-based compensation
expenses.
We adopted our Amended and Restated 2014 Stock Option and Incentive
Plan (the “2014 Plan”) in October 2014, for purposes of
granting share-based compensation awards to employees, directors
and consultants to incentivize their performance and align their
interests with ours. We account for compensation costs for all
share-based awards issued under the 2014 Plan using a fair-value
based method and recognize expenses in our statements of
comprehensive loss in accordance with GAAP. Under the 2014 Plan, we
are authorized to grant options to purchase shares of common stock
of our Company, restricted share units to receive shares of common
stock and restricted shares of common stock. For the year ended
December 31, 2019 and 2018, we recorded share-based compensation
expense of $6.2 million and $3.9 million, respectively, primarily
related to issuances and vesting of awards under the 2014
Plan.
We believe the granting of share incentive awards is important to
our ability to attract and retain employees, and we will continue
to grant share incentive awards to employees in the future. As a
result, our expenses associated with share-based compensation may
increase, which may have an adverse effect on our results of
operations.
None.
ITEM 2. P
ROPERTIES
Our
executive offices are located in approximately 4,965 square feet of
office space at 2906 Colorado Avenue, Santa Monica, California
90404, which we occupy under a month-to-month lease agreement at
$19,734 per month. In addition, we lease an additional 1,650 square
feet on a month-to-month basis in the same complex to serve as a
content studio at $5,197 per month.
We
anticipate no difficulty in extending the leases of our facilities
or obtaining comparable facilities in suitable locations, as
needed, and we consider our facilities to be adequate for our
current needs.
ITEM 3. LEGAL PROCEEDINGS
As of
the date hereof, we are not a party to any material legal or
administrative proceedings. There are no proceedings in which any
of our directors, executive officers or affiliates, or any
registered or beneficial stockholder, is an adverse party or has a
material interest adverse to our interest. We may from time to time
be subject to various legal or administrative claims and
proceedings arising in the ordinary course of business. Litigation
or any other legal or administrative proceeding, regardless of the
outcome, is likely to result in substantial cost and diversion of
our resources, including our management’s time and
attention.
ITEM 4. MINE S
A
FETY
DISCLOSURES
None.
P
A
R
T
II
ITEM 5. MARKET FOR REGISTRANT’S COMMON EQUITY, RELATED
STOCKHOLDER MATTERS AND ISSUER PURCHASES OF EQUITY
SECURITIES
Market Information and Holders
Our common stock is listed on the Nasdaq Capital Market under the
ticker symbol “SLGG.”
Shown below is the range of high and low sales prices for our
common stock for the periods indicated as reported by the Nasdaq
Capital Market. Our common stock began trading on the Nasdaq
Capital Market on February 27, 2019, and the following table
reflects the high and low sales prices for our common stock
subsequent to that date:
|
|
High
|
Low
|
|
Fiscal
Year Ending December 31, 2019
|
|
|
|
First quarter
ending March 31, 2019 (beginning February 27, 2019)
|
$
9.73
|
$
6.27
|
|
Second quarter
ending June 30, 2019
|
$
9.28
|
$
6.05
|
|
Third quarter
ending September 30, 2019
|
$
8.75
|
$
3.90
|
|
Fourth quarter
ending December 31, 2019
|
$
4.99
|
$
1.85
|
As of February 25,
2020, we
had
160
holders of record of
our common stock based upon the records of our transfer agent,
which do not include beneficial owners of common stock whose shares
are held in the names of various securities brokers, dealers and
registered clearing agencies.
Dividend Policy
We have never declared or paid cash dividends on our capital stock.
We currently intend to retain all available funds and any future
earnings for use in the operation of our business. Therefore, we do
not currently expect to pay any cash dividends on our common stock
for the foreseeable future. Any future determination to pay cash
dividends will be at the discretion of our Board and will depend
upon our results of operations, financial condition, capital
requirements, general business conditions, and other factors that
our board of directors deems relevant. Our ability to pay dividends
may also be restricted by the terms of any future credit agreement
or any future debt or preferred equity securities.
Recent Sales of Unregistered Equity Securities
Conversion of Convertible Debt
.
On February 27, 2019, Super League completed its
initial public offering of shares of its common stock, as described
below
. Concurrent with the
closing of the
initial public
offering
on February 27, 2019,
in accordance with the underlying convertible debt agreements, all
outstanding principal and interest of the 9.00% convertible notes
outstanding, totaling $13,793,000, was automatically converted into
1,475,164 shares of the Company’s common stock at a
conversion price of $9.35.
In connection with the issuance of the convertible debt, we
provided each holder with registration rights to register the
shares of common stock issuable upon conversion, subject to certain
limitations. In addition, the holders of the notes agreed to
certain lock-up restrictions on the shares of common stock
underlying the notes and the warrants that limited the ability of
each holder to freely trade such shares during the 180-day period
following the completion of the initial public
offering.
Restricted Stock Units
. In December 2019, we
issued a total of 4,000 restricted stock units to two individual
accredited investors in consideration for strategic sales and
marketing services rendered to our company. No underwriters were
involved in the foregoing issuance of securities. The securities
were issued to an accredited investor in reliance upon the
exemption from the registration requirements of the Securities Act,
as set forth in Section 4(a)(2) under the Securities Act,
relative to transactions by an issuer not involving any public
offering, to the extent an exemption from such registration was
required.
Use of Proceeds
On February 27, 2019 (the “IPO Closing Date”), Super
League completed its initial public offering (“IPO”) of
shares of its common stock, pursuant to which an aggregate of
2,272,727 shares were offered and sold at a public offering price
of $11.00 per share, resulting in net proceeds of $22,458,000 after
deducting underwriting discounts, commissions and offering costs of
$2,542,000.The principal purposes of the IPO were to obtain
additional capital to support our operations, to create a public
market for our common stock and to facilitate our future access to
the public equity markets. We have and continue to use the net
proceeds received from the IPO for working capital and general
corporate purposes, including sales and marketing activities,
product development and capital expenditures. We have and may
continue to use a portion of the net proceeds for the strategic
acquisition of, or investment in, technologies, solutions or
businesses that may complement our business and or accelerate our
growth. The amounts and timing of our actual expenditures,
including expenditure related to sales and marketing and product
development will depend on numerous factors, including the status
of our product development efforts, our sales and marketing
activities, expansion internationally, the amount of cash generated
or used by our operations, competitive pressures and other
factors.
There has been no material change in the use of proceeds since our
IPO, as described in our final Prospectus filed with the SEC
pursuant to Rule 424(b) of the Securities Act of 1933, as amended,
and other periodic reports previously filed with the
SEC.
Performance Graph
As a smaller reporting company, we are not required to provide the
performance graph required by Item 201(e) of Regulation
S-K.
ITEM 6. S
ELE
C
TED FINANCIAL
DATA
We derived the selected financial data as of and for the years
ended December 31, 2019 (“fiscal year 2019”) and 2018
(“fiscal year 2018”), set forth below, from our audited
financial statements included elsewhere herein, and should be read
in conjunction with those audited financial statements and related
notes thereto, as well as the information found under the sections
titled “
Management’s Discussion and Analysis
of Financial Condition and Results of Operations
” included elsewhere herein. Our historical
results are not necessarily indicative of the results to be
expected in future periods.
|
|
Fiscal
Year
|
|
|
|
2019
|
2018
|
|
Statement of Operations Data:
|
|
|
|
Revenues
|
$
1,084,000
|
$
1,046,000
|
|
Cost of
revenues
|
513,000
|
684,000
|
|
Gross
profit
|
571,000
|
362,000
|
|
|
|
|
|
Operating
expenses:
|
|
|
|
Sales,
marketing and advertising
|
4,488,000
|
4,319,000
|
|
Technology
platform and infrastructure
|
4,520,000
|
4,183,000
|
|
General and
administrative
|
12,333,000
|
8,020,000
|
|
Total
operating expense
|
21,341,000
|
16,522,000
|
|
Loss from
operations
|
(20,770,000
)
|
(16,160,000
)
|
|
|
|
|
|
Other income
(expense), net
|
(9,909,000
)
|
(4,467,000
)
|
|
Net loss
|
$
(30,679,000
)
|
$
(20,627,000
)
|
|
|
|
|
|
Net loss per share:
|
|
|
|
Basic and diluted
|
$
(3.89
)
|
$
(4.48
)
|
|
Weighted
average common shares used to compute net loss per
share:
|
|
|
|
Basic and
diluted(1)
|
7,894,326
|
4,606,961
|
_______________
(1) All
share and per share data has been retrospectively adjusted to
reflect the one-for-three Reverse Stock Split, which was effected
on February 8, 2019.
|
|
As
of December 31,
|
|
|
|
2019
|
2018
|
|
Balance
Sheet Data:
|
|
|
|
Cash and cash
equivalents
|
$
8,442,000
|
$
2,774,000
|
|
Accounts
receivable
|
293,000
|
488,000
|
|
Prepaid expenses
and other current assets
|
924,000
|
487,000
|
|
Property and
equipment, net
|
239,000
|
531,000
|
|
Intangible and
other assets, net
|
1,984,000
|
707,000
|
|
Goodwill
|
2,565,000
|
-
|
|
Accounts payable,
accrued expenses and deferred revenue
|
1,004,000
|
858,000
|
|
Convertible debt,
net
|
-
|
10,923, 000
|
|
Total
stockholders’ equity (deficit)
|
13,443,000
|
(6,794,000
)
|
____________________________
Factors Affecting Comparability:
●
Cash and Convertible
Debt.
Concurrent with the
closing of our IPO on February 27, 2019, in accordance with the
underlying agreements,
all outstanding principal and
interest for the 9.00% convertible notes outstanding, totaling
$13,793,000, was automatically converted into 1,475,164 shares of
the Company’s common stock at a conversion price of
$9.35.
●
Noncash Stock Compensation
Expense.
Noncash stock-based
compensation expense for the periods presented was comprised of the
following:
|
|
Fiscal Year
|
|
|
|
2019
|
2018
|
|
Stock
options
|
$
3,573,000
|
$
2,490,000
|
|
Warrants
|
2,182,000
|
1,400,000
|
|
Restricted
stock units
|
370,000
|
14,000
|
|
Earn-out
compensation expense
|
58,000
|
-
|
|
Other
|
34,000
|
39,000
|
|
Total
noncash stock compensation expense
|
$
6,217,000
|
$
3,943,000
|
Noncash stock-based compensation expense for the periods presented
was included in the following financial statement line
items
:
|
|
Fiscal Year
|
|
|
|
2019
|
2018
|
|
Sales,
marketing and advertising
|
$
635,000
|
$
504,000
|
|
Technology platform
and infrastructure
|
129,000
|
200,000
|
|
General and
administrative
|
5,453,000
|
3,239,000
|
|
Total
noncash stock compensation expense
|
$
6,217,000
|
$
3,943,000
|
Noncash
stock compensation expense increased during fiscal year 2019
primarily due to certain performance-based options and warrants
previously granted to certain executives, which vested upon the
achievement of certain performance-based milestones, pursuant to
October 2018 amended employee agreements and/or vesting conditions
in the underlying equity grant agreements. Performance-based
milestones included the completion of our IPO in February 2019 and
other operational performance targets. During fiscal year 2019,
325,000 of performance-based stock options and warrants vested,
resulting in noncash stock compensation expense of $2,766,000.
Refer to Note 8 to the financial statements included elsewhere
herein.
●
Convertible Debt Noncash
Interest Expense.
Interest expense for the periods presented
primarily relates to the issuance of 9.00% secured convertible
promissory notes, described below.
As
a result of the automatic conversion of the 2018 Notes (defined
below) and the application of conversion accounting, the Company
recorded an immediate charge to interest expense of $1,384,000,
representing the write-off of the unamortized balance of debt
discounts associated with the 2018 warrants and cash commissions
and warrants issued to third parties. Further, as described below,
the non-detachable conversion feature embedded in the 2018 Notes
provided for a conversion rate that was below market value at the
commitment date, and therefore, represented a beneficial conversion
feature (defined below). The intrinsic value of the beneficial
conversion feature on the IPO closing date, was approximately
$7,067,000, and is reflected as additional interest expense in the
statement of operations for fiscal year 2019.
ITEM 7. M
AN
A
GEMENT’S
DISCUSSION AND ANALYSIS OF FINANCIAL CONDITION AND RESULTS OF
OPERATIONS
You should read the following discussion and analysis of our
financial condition and results of our operations together with our
financial statements and the notes thereto appearing elsewhere in
this Report. This discussion contains forward-looking statements
reflecting our current expectations, whose actual outcomes involve
risks and uncertainties. Actual results and the timing of events
may differ materially from those stated in or implied by these
forward-looking statements due to a number of factors, including
those discussed in the sections entitled “Risk
Factors,” “Special Note Regarding Forward-Looking
Statements” and elsewhere in this Report
.
General
Super League Gaming, Inc. (“Super League,” the
“Company,” “we” or
“our”) is a global leader in the mission to
bring live and digital esports entertainment and experiences
directly to everyday competitive gamers around the world. Utilizing
our proprietary technology platform, Super League operates physical
and digital experiences in partnership with publishers of top-tier
game titles and owners/operators of a distributed footprint of
venues, a network of digital social and viewing channels, and an
association/organization of city-based amateur gaming clubs and
teams. In addition to providing premium experiences by operating
city-vs-city amateur esports leagues and producing thousands of
social gaming experiences across North America and our
ever-expanding international footprint, the Super League
Network features multiple forms of content celebrating the
love of play via social media, live streaming and video-on-demand,
along with continuous gameplay and leaderboards. Inside our network
is Framerate, a large independent social video esports network
powered by user-generated highlight reels, and our exclusive
proprietary platform Minehut, providing a social and gameplay
forum for the avid Minecraft community. Through our partnerships
with high-profile venue owners such as Wanda Theatres in China, and
Topgolf and Cinemark Theatres in North America, along with
ggCircuit,
an
esports services
company that provides gaming center management software solutions
and access to a global network of gaming centers,
Super League is committed
to supporting the development of local, grassroots player
communities, while providing a global, scalable infrastructure for
esports competition and engagement. We address not only a wide
range of gamers across game titles, ages and skill levels, but also
a wide range of content-capture beyond just gameplay. This
positions Super League as more than a tournament operator; we are a
lifestyle and media company focused on capturing, generating,
aggregating and distributing content across the genre of all things
esports.
Executive Summary
We
believe Super League is on the leading edge of the rapidly growing
competitive video gaming industry, which has become an established
and vital part of the entertainment landscape.
According to
Reuters Plus, 2018, gaming is now the world’s favorite form
of entertainment, as the gaming industry generated more revenue in
2017 than television, movies and music.
At the professional
level, thousands of professional players on hundreds of teams
compete in dozens of high stakes competitions that draw significant
audiences, both in person and online. In addition, the value of
brand sponsorships, media rights and prize money continue to rise,
as are professional team valuations and the purchase price for
securing franchises in professional leagues.
With
NewZoo reporting 2.6 billion gamers globally, we believe there is a
larger opportunity for the world of mainstream competitive players
who want their own esports experience. These amateur gamers are
players who enjoy the competition, the social interaction and
community, and the entertainment value associated with playing and
watching others play. According to Nielsen Esports Playbook, 2017,
competitive amateur gamers take part in over eight hours of
gameplay and watch up to nine hours of esports-related content each
week. We believe this is an under-served market that seeks their
own opportunities for team-based play on real playing
fields.
Super
League is a critically important component in providing the
infrastructure for mainstream esports that is synergistic and
accretive to the greater esports ecosystem. Over the past five
years, we believe we have become the preeminent brand for amateur
esports by providing a proprietary software platform that allows
our gamers to compete, socialize and spectate premium amateur
esports gameplay and entertainment, both physically and digitally.
We celebrate everyday competitive gamers and provide a
differentiated way for players and spectators to unite around their
city clubs and hometown venues for a better, more inclusive social
experience not previously available. Not only do we offer premium
amateur esports leagues and community, but we are able to leverage
our derivative gameplay content to become a comprehensive amateur
esports content network. As we expand our city clubs, partner venue
network, breadth of game titles and reach into the home, we bring
new players into our customer funnel to drive audience growth, and
ultimately, consumer and content monetization.
In
fiscal year 2019, management focused on the acceleration of
development of the building blocks in place for our two primary
revenue sources: (1) sponsorships and advertising revenues, the
monetization of our content, and (2) direct to consumer revenues,
or gamer monetization. Further, as detailed below, we further
de-risked the business, achieving game title fluidity, venue
diversity, and an enhanced and more scalable technology
platform
.
We also established a premium advertising model for future
monetization and expanded our sales team to facilitate delivery,
launched our first effort at meaningful consumer monetization, and
expanded globally, both digitally and physically.
We
offer a variety of ways gamers can engage digitally across our
Super League content network and our network of hometown venues
serving as the playing fields for recreational esports. In the
first quarter of 2020, we expanded our city-based gaming club and
league system from 16 to 24 cities across North America, including
Canada and Mexico, and we expect further expansion beyond North
America in the future.
The
fundamental drivers of our business model and monetization strategy
are creating deep community engagement through our highly
contextualized, local experiences that, when coupled with the
critical mass of our large digital audiences, provides the depth
and volume for premium content and offer monetization
differentiated from a more traditional, commoditized advertising
model. The combination of our physical venue network and digital
programming channels, with Super League’s technology platform
at the hub, creates the opportunity for not just a share of the
player’s wallet, but also the advertiser’s wallet. We
do this by offering brand sponsors and advertisers a premium
marketing channel to reach elusive Generation Z and Millennial
gamers and offering players ways to access exclusive tournaments,
rewards and programming through our Super League consumer
subscription offer and other consumer offerings.
|
Our
potential partners also include game publishers, retailers and
brands across various categories who engage us to develop their own
customized branded gameplay experiences, powered by our flexible
gaming and content technology platform for their own
customers.
|
|
Additionally,
we can monetize our content commercially through advertising
revenues on our own digital channels and by selling our content to
third-parties.
|
Direct to Consumer
- Gamer monetization.
The second way we
monetize content is through direct-to-consumer pay walls for access
to premium digital and physical experiences and viewing content. We
have historically offered a freemium model where consumers can join
Super League for free-to-play, casual competitive experiences and
charged for access to premium gameplay experiences. We intend to
expand our breadth of consumer digital offers in 2020.
|
|
To
date, our revenues have been weighted towards experience
monetization, however we expect to see content monetization begin
to emerge as a revenue opportunity.
Key Performance Indicators.
We focus on five key performance
indicators (“KPIs”), as outlined below, to assess our
progress and drive revenue growth. The number of game titles and
number of retail partner venues drive audience, introducing more
players and spectators to Super League’s gaming and content
platform. Growth in physical and digital experiences across a wider
portfolio can increase the number of registered users, including
subscribers, and number of gameplay hours which will have a
significant impact on our content library. This focus on audience
and content generation ultimately impacts our viewership, which has
an amplification effect on potential revenue streams and customer
acquisition.
We
significantly outperformed the KPI goals we established at the
beginning of 2019, setting us up for fiscal 2020 with a focus on
accelerated revenue growth. During 2019, we achieved the following
KPI related results:
|
●
|
Game titles
: We ended fiscal 2018 with four game titles in
our portfolio and as of the end of fiscal 2019, had over 20 game
titles, including the addition of Capcom's Street Fighter® V:
Arcade Edition during the second quarter of 2019 and Tencent
America's Player Unknown's Battlegrounds Mobile (“PUBG
Mobile”), during the third quarter of 2019. The increase in
game titles reflects the flexibility of our technology platform and
our platform’s ability to rapidly ingest game titles across a
wide spectrum of game genres. Further, our digital content network,
which features user-generated content submitted to us from any
gamer, anywhere, has a limitless library of featured titles. The
diversity of our portfolio differentiates us as a truly
game-agnostic platform speaking to a wide spectrum of players and
viewers.
|
|
●
|
Ret
ail Partner Venues
: While we are just
seeding the build out and monetization of our retail footprint, our
national-level announcements with Top golf and ggCircuit LAN
centers, as well as our expanded agreement with ggCircuit, which
allows us to expand internationally, provides us with access to
hundreds of physical venue locations. We ended fiscal 2018 with 46
active venues and grew to over 500 total active venues as of
December 31, 2019. Our domestic and global footprint establishes us
as a leader in aggregating local esports fields for everyday
competitive gamers.
|
|
●
|
Registered Users
: We ended fiscal 2018 with approximately
300,000 registered users. During the year ended December 31, 2019,
we increased our registered users by approximately 227%, to 980,000
registered users. This increase in registered users represents more
gamers from whom we can gather user generated content and convert
into subscribers and/or upsell into other paid offers.
|
|
●
|
Gameplay Hours:
As of December 31, 2019, including our live
gaming experiences and our expanding digital gameplay channels, we
generated approximately 15.0 million hours of gameplay experiences,
as compared to approximately 1.8 million full year 2018 gameplay
hours. We are just beginning to explore the ways we can repackage
and distribute this significant derivative content library for
further monetization.
|
|
●
|
Viewership
: Proving that we can attract viewers to our
platform and leverage the audiences our brand partners provide, we
generated 120.0 million views during fiscal year 2019, compared to
our full-year 2018 views of 925,000, leveraging our own programming
and experiences and the significant expansion of our audience reach
in connection with the acquisition of Framerate. The increase in
views resulted in the exponential growth of our monetizable
advertising inventory. Additionally, our increase in views was
achieved largely via user generated content submitted to us by our
community, significantly limiting the production cost and overall
investment required to achieve the growth in viewership in
2019.
|
Initial Public Offering
On February 27, 2019, we completed our IPO, pursuant to which we
issued and sold an aggregate of 2,272,727 shares of our common
stock at a public offering price of $11.00 per
share
pursuant to a
registration statement on Form
S-1, declared effective by the Securities and
Exchange Commission on February 25, 2019 (File No. 333-229144). We
raised net proceeds of approximately $22,458,000 after underwriting
discounts, commissions and other offering costs of
$2,542,000.
The principal purposes of the IPO were to obtain additional capital
to support our operations, to create a public market for our common
stock and to facilitate our future access to the public equity
markets. We have and continue to use the net proceeds received from
the offering for working capital and general corporate purposes,
including sales and marketing activities, product development and
capital expenditures. We have and may continue to use a portion of
the net proceeds for the strategic acquisition of, or investment
in, technologies, solutions or businesses that may complement our
business and or accelerate our growth. The amounts and timing of
our actual expenditures, including expenditure related to sales and
marketing and product development will depend on numerous factors,
including the status of our product development efforts, our sales
and marketing activities, expansion internationally, the amount of
cash generated or used by our operations, competitive pressures and
other factors described under “
Risk
Factors
” in our
Prospectus filed pursuant to Rule 424(b) under the Securities Act
with the SEC on February 27, 2019, as well as Item I, Part 1A of
this Report. Our management has broad discretion in the application
of the net proceeds, and investors will be relying on our judgment
regarding the application of the net proceeds from the
IPO.
Concurrent with the closing of the IPO on February 27, 2019, in
accordance with the underlying agreements, all outstanding
principal and interest for the 9.00% convertible notes outstanding,
totaling $13,793,000, was automatically converted into 1,475,164
shares of the Company’s common stock at a conversion price of
$9.35.
Acquisition of Framerate, Inc.
On June 3, 2019, the Company and SLG Merger Sub, Inc., a Delaware
corporation and wholly-owned subsidiary of the Company
(“Merger Sub”), entered into an agreement and plan of
merger (the “Merger Agreement”) with Framerate, Inc., a
Delaware corporation (“Framerate”), pursuant to which
Framerate merged with and into Merger Sub, with Merger Sub
continuing as the surviving corporation (the
“Acquisition”).
Framerate is a cross-platform esports social video network
delivering the best in gameplay highlights, news and entertainment
to today’s generation of video gamers. The company’s
focus on user generated content and social distribution changes the
way traditional esports video content is produced, distributed and
shared by millions of esports fans worldwide. The acquisition of
Framerate represents a strategic step in our audience-building
efforts with an average of 15 million video views a month during
the second half of 2019, built around everyday gamers uploading
their personal esports highlight reels for recognition across our
wide audience.
The Acquisition was consummated on June 6, 2019 when the
certificate of merger of Merger Sub and Framerate was filed with
the Secretary of State of the State of Delaware (the
“Effective Date”). As consideration for the
Acquisition, we ratably paid and/or issued to the former
shareholders of Framerate an aggregate of $1.5 million in cash and
$1.0 million worth of shares of our common stock at a price per
share of $7.4395 (the “Closing Shares”).
In addition to the issuance of the Closing Shares, the Merger
Agreement provides for the issuance of up to an additional $980,000
worth of shares of our common stock at the same price per share as
the Closing Shares (the “Earn-Out Shares”) in the event
Framerate achieves certain performance-based milestones during the
two-year period following the closing of the Acquisition, or June
6, 2021. Upon achievement of the applicable performance-based
milestones, if any, one-half of the Earn-Out Shares will be
issuable on the one-year anniversary of the Effective Date, and the
remaining one-half will be issuable on the second anniversary of
the Effective Date.
The Acquisition was approved by the board of directors of each of
Super League Gaming, Inc. and Framerate, and was approved by the
stockholders of Framerate. Refer to Note 5 to our financial
statements included elsewhere herein for additional information
about the Acquisition.
Expanded Agreement with ggCircuit, LLC
On September 23, 2019, Super League and ggCircuit,
LLC (“ggCircuit”), an
esports services company that provides gaming
center management software solutions and other esports
offerings,
entered into an
expanded commercial partnership agreement
(“Expanded Agreement”) pursuant to
which
Super League became
the primary consumer-facing brand within
ggCircuit’s
leading
gaming center
software
platform, known as “ggLeap.” Under the terms of the
Expanded Agreement,
commencing with the November 2019 ggLeap
software update release, the consumer facing components
of ggLeap, including its leaderboards, its competitive
seasons and its local loyalty programs, were rebranded as
“Super League Gaming,” and are managed by Super League.
ggLeap is a B2B software platform and B2C application created and
owned by ggCircuit. ggLeap is licensed and distributed to owners
and operators of video gaming centers throughout the world. It
helps gaming centers manage the PCs in their venue, administer
loyalty programs for local players, and provides the interface and
local operating system through which players log into computers and
launch all of their gameplay sessions within the gaming centers
where ggLeap is deployed.
The
December 2019 software release included, the pilot launch of a
consumer subscription offer, “Super League Prime,”
through which players in gaming centers will be able to access
special member benefits along with an underpinning global loyalty
program for all in players to earn points and prizing for local
rewards.
In consideration for the rights granted by ggCircuit to Super
League, including the right to commercially exploit Super League
Prime and to feature the “Super League Gaming” brand on
the applicable ggCircuit customer platform, Super League paid an
upfront fee of $340,000 and, commencing in the first quarter of
2020, will pay quarterly fees over the term of the Expanded
Agreement ranging from $0 to $150,000, based on contractual revenue
levels. Pursuant to the terms and conditions of the Expanded
Agreement, revenues generated in connection with applicable
activities under the Expanded Agreement will be shared between
Super League and ggCircuit based on contractual revenue sharing
percentages. The initial term of the Expanded Agreement commences
on the effective date and concludes on the fifth anniversary of the
effective date, subject to certain automatic renewal provisions.
The upfront fee is included in intangible assets and other, net in
the accompanying balance sheet and is being amortized over the
initial term of the Expanded Agreement of five years, commencing
October 1, 2019.
Wanda Cinemas Games Partnership
In
January 2020, we announced a new partnership
with Wanda Cinemas Games, a subsidiary of Chinese media
conglomerate Wanda Media. The new alliance will initially bring
live, competitive gaming experiences to Wanda’s 700+ owned
and operated theaters in multiple cities across China, with more
activations to be announced in the future. This new venture
provides Super League with the opportunity to greatly expand our
reach into the world’s largest market of 1.2 billion gamers,
more than the entire population of the United States.
In the
agreement, Wanda theatres will be transformed into esports venues
hosting live Super League events and tournaments throughout China,
driving an entirely new gaming experience for the massive Wanda
customer base. Passionate players will see their local movie
theatre serve as a competitive and social playing field for the
video games they love. The unique gaming experiences created by
Super League will propel Wanda venues to the center of the global
esports phenomena. The partnership will continue to fuel Super
League’s focus on the vast opportunity to monetize gamers and
the content they generate.
Prime Subscription Offer
In
December 2019, we launched in beta Super League Prime, our consumer
subscription offer, in North America, with an international launch
scheduled for 2020. Super League Prime is a subscription offer that
recognizes and rewards players, both locally and globally, through
ggCircuit-enabled gaming centers. Players can earn rewards for both
the length and quality of their gameplay and gain exposure on
national and local leaderboards. All participating players can earn
a basic level of loyalty points for prizing redemption locally
in-venue. Players who upgrade to our paid monthly subscription
offer enjoy additional benefits including the ability to earn
points faster, access to exclusive competitions and the Super
League global prize vault, and added benefits from our brand
sponsors.
Critical Accounting Estimates
Our financial statements have been prepared in accordance with
accounting principles generally accepted in the United States of
America. Preparation of our financial statements requires
management to make judgments and estimates. Some accounting
policies have a significant impact on amounts reported in our
financial statements. The SEC has defined a company’s
critical accounting policies as the ones that are most important to
the portrayal of a company’s financial condition and results
of operations, and which require a company to make its most
difficult and subjective judgments. A summary of significant
accounting policies and a description of accounting policies that
are considered critical may be found in the audited financial
statements and notes thereto included elsewhere herein. The
following accounting policies were identified during the periods
presented, based on activities occurring during the periods
presented, as critical and requiring significant judgments and
estimates.
Revenue Recognition
Revenue is recognized when we transfer promised goods or services
to customers in an amount that reflects the consideration to which
we expect to be entitled in exchange for those goods and services.
In this regard, revenue is recognized when: (i) the parties to the
contract have approved the contract (in writing, orally, or in
accordance with other customary business practices) and are
committed to perform their respective obligations; (ii) we can
identify each party’s rights regarding the goods or services
to be transferred; (iii) we can identify the payment terms for the
goods or services to be transferred; (iv) the contract has
commercial substance (that is, the risk, timing, or amount of the
entity’s future cash flows is expected to change as a result
of the contract); and (v) it is probable that the entity will
collect substantially all of the consideration to which we will be
entitled in exchange for the goods or services that will be
transferred to the customer.
Super League generates revenues and related cash flows from (i)
brand and media sponsorships, (ii) Platform-As-A-Service
arrangements, (iii)
advertising and third-party content
and (iv) direct to consumer offers
including tournament fees for participation in our physical and
online multiplayer gaming experiences, digital subscriptions and
merchandise sales.
Brand and Media Sponsorships
.
We generate brand and media sponsorship revenues
primarily from sales of various forms of sponsorships and
promotional campaigns for our online platforms and from sponsorship
at our in-person esports experiences. Brand and media sponsorship
revenue arrangements may include: exclusive or non-exclusive title
sponsorships, marketing benefits, official product status
exclusivity, product visibly and additional infrastructure
placement, social media rights (including rights to create and post
social content and clips), rights to on-screen activations and
promotions, display material rights,
media rights,
hospitality and tickets and merchandising rights. Brand and media
sponsorship arrangements typically include contract terms for time
periods ranging from several weeks to multi-year
arrangements.
For
brand and media sponsorship arrangements that include performance
obligations satisfied over time, customers typically simultaneously
receive and consume the benefits under the arrangement as we
satisfy our performance obligations, over the applicable contract
term. As such, revenue is recognized over the contract term based
upon estimates of progress toward complete satisfaction of the
contract performance obligations (typically utilizing a time,
effort or delivery-based method of estimation).
Platform-As-A-Service.
We
generate platform-as-a-service (“
PaaS
”) revenues pursuant to arrangements with
brand and media partners, retail venues, game publishers and
broadcasters that allow our partners to run amateur esports
experiences, and or capture specifically curated gameplay content
that is customized for our partners’ distribution channels,
leveraging the flexibility of, and powered by our Super League
gaming and content technology platform.
Revenue for PaaS arrangements for one-off branded experiences
and/or the development of content tailored specifically for our
partners’ distribution channels that provide for a
contractual delivery or performance date, is recognized when
performance is substantially complete and or delivery occurs.
Revenue for PaaS arrangements
that include performance
obligations satisfied over time whereby customers simultaneously
receive and consume the benefits under the agreement as we satisfy
our performance obligations over the applicable contract term, is
recognized over the contract term based upon estimates of progress
toward complete satisfaction of the contract performance
obligations (typically utilizing a time, effort or delivery-based
method of estimation).
Advertising and Third-Party Content Revenue
. We generate
content through digital and physical experiences that offer
opportunities for generating advertising revenue on our proprietary
digital channels. In addition, we license our content to third
parties seeking esports content for their own distribution
channels.
For
advertising and third-party content arrangements that include
performance obligations satisfied over time, customers typically
simultaneously receive and consume the benefits under the
arrangement as we satisfy our performance obligations, over the
applicable contract term. As such, revenue is recognized over the
contract term based upon estimates of progress toward complete
satisfaction of the contract performance obligations (typically
utilizing a time, effort or delivery-based method of
estimation).
Direct to Consumer Revenue
.
Direct to consumer revenues include tournament fees, digital
subscriptions and merchandise. Direct to consumer revenues have
primarily consisted of the sale of season passes to gamers for
participation in our in-person and or online multiplayer gaming
experiences. For the periods presented herein, season passes for
gaming experiences were comprised of multi-week packages and
one-time, single experience admissions. Digital subscription
revenues include revenues related to our Minehut asset acquisition
in June 2018, which provides various Minecraft server hosting
services on a subscription basis to the Minecraft gaming community,
and Super League Prime subscription offer which was launched in
beta in the fourth quarter of 2019.
Revenue from single experiences is recognized when the experience
occurs. Revenue from multi-week packages is recognized over time as
the multi-week experiences occur based on estimates of the progress
toward complete satisfaction of the applicable offer and related
performance obligations. Subscription revenue is recognized over
the applicable subscription term.
We make estimates and judgments when determining whether the
collectability of accounts receivable is reasonably assured. We
assess the collectability of receivables based on a number of
factors, including past transaction history and the
credit-worthiness of our customers. If it is determined that
collection is not reasonably assured, amounts due are recognized
when collectability becomes reasonably assured, assuming all other
revenue recognition criteria have been met, which is generally upon
receipt of cash for transactions where collectability may have been
an issue. Management’s estimates regarding collectability
impact the actual revenues recognized each period and the timing of
the recognition of revenues. Our assumptions and judgments
regarding future collectability could differ from actual events and
thus materially impact our financial position and results of
operations.
Depending on the complexity of the underlying revenue arrangement
and related terms and conditions, significant judgments,
assumptions and estimates may be required to determine each parties
rights regarding the goods or services to be transferred, each
parties performance obligations, whether performance obligations
are satisfied at a point in time or over time, the timing of
satisfaction of performance obligations, and the appropriate period
or periods in which, or during which, the completion of the
earnings process occurs. Depending on the magnitude of specific
revenue arrangements, if different judgments, assumptions and
estimates are made regarding revenue arrangements in any specific
period, our periodic financial results may be materially
affected.
Stock-Based Compensation Expense
Compensation
expense for stock-based awards is measured at the grant date, based
on the estimated fair value of the award, and is recognized as an
expense, typically on a straight-line basis over the
employee’s requisite service period (generally the vesting
period of the equity award), which is generally two to four years.
Compensation expense for awards with
performance conditions that affect vesting is recorded only for
those awards expected to vest or when the performance criteria are
met.
The fair value of restricted stock and restricted stock
unit awards is determined by the product of the number of shares or
units granted and the grant date market price of the underlying
common stock. The fair value of stock option and common stock
purchase warrant awards is estimated on the date of grant utilizing
the Black-Scholes-Merton option pricing model. The Company accounts
for forfeitures of awards as they occur.
Grants
of equity-based awards (including warrants) to non-employees in
exchange for consulting or other services are accounted for using
the fair value of the consideration received (i.e., the value of
the goods or services) or the fair value of the equity instruments
issued, whichever is more reliably
measurable.
Determining the fair value of stock-based awards at the grant date
requires significant estimates and judgments, including estimating
the market price volatility of our common stock, determination of
grant dates, future employee stock option exercise behavior and
requisite service periods.
Accounting for Business Combinations
In connection with the application of purchase accounting for the
acquisition of Framerate, as described above, we estimated the fair
values of the assets acquired and liabilities assumed. A fair
value measurement is determined as the price we would receive to
sell an asset or pay to transfer a liability in an orderly
transaction between market participants at the measurement date. In
the absence of active markets for the identical assets or
liabilities, such measurements involve developing assumptions based
on market observable data and, in the absence of such data,
internal information that is consistent with what market
participants would use in a hypothetical transaction that occurs at
the measurement date. In the context of purchase accounting, the
determination of fair value often involves significant judgments
and estimates by management, including the selection of valuation
methodologies, estimates of future revenues, costs and cash flows,
discount rates, and selection of comparable
companies. The estimated fair values reflected in the
purchase accounting rely on management’s judgment and the
expertise of a third-party valuation firm engaged to assist in
concluding on the fair value measurements.
Results of Operations
Results of Operations for Fiscal Years 2019 and 2018
The
following table sets forth a summary of our statements of
operations for the years ended December 31, 2019 and
2018:
|
|
Fiscal Year
|
|
|
|
2019
|
2018
|
|
REVENUES
|
$
1,084,000
|
$
1,046,000
|
|
COST OF REVENUES
|
513,000
|
684,000
|
|
GROSS PROFIT
|
571,000
|
362,000
|
|
|
|
|
|
OPERATING EXPENSES
|
|
|
|
Selling,
marketing and advertising
|
4,488,000
|
4,319,000
|
|
Technology
platform and infrastructure
|
4,520,000
|
4,183,000
|
|
General
and administrative
|
12,333,000
|
8,020,000
|
|
Total
operating expenses
|
21,341,000
|
16,522,000
|
|
|
|
|
|
NET LOSS FROM OPERATIONS
|
(20,770,000
)
|
(16,160,000
)
|
|
|
|
|
|
OTHER INCOME (EXPENSE), NET
|
(9,909,000
)
|
(4,467,000
)
|
|
|
|
|
|
NET LOSS
|
$
(30,679,000
)
|
$
(20,627,000
)
|
|
|
|
|
Comparison of the Results of Operations for Fiscal Years 2019 and
2018
Revenue
|
|
Fiscal
Year
|
|
|
|
|
|
2019
|
2018
|
$
Change
|
%
Change
|
|
Brand and Media
Sponsorships
|
$
451,000
|
$
549,000
|
$
(98,000
)
|
(18
)%
|
|
Platform-as-a-service
|
532,000
|
291,000
|
241,000
|
83
%
|
|
Advertising and
content sales
|
68,000
|
69,000
|
(1,000
)
|
(1
)%
|
|
Direct to
Consumer
|
33,000
|
137,000
|
(104,000
)
|
(76
)%
|
|
|
$
1,084,000
|
$
1,046,000
|
$
38,000
|
4
%
|
Revenue
for fiscal year 2019 increased $38,000, or 4%, compared to fiscal
year 2018. Revenues for the periods presented was comprised of the
following:
Sponsorships and
Advertising:
●
Brand and Media Sponsorships
. Period to
period changes in brand and media sponsorship revenues are
attributable to fluctuations in brand and media sponsorship
activities period to period, which is based on the specific
partnership arrangements with activities during a particular
period, the related performance obligations satisfied during the
period and the contractual consideration associated with the
activities during the period. Brand and media sponsorship revenues
for fiscal year 2019 included revenues for our Red Bull North
America, Inc. (“Red Bull”) brand partnership, Red Bull
Allstars experience in April 2019, Logitech G Challenge and
Play/Train/Win online tournaments, Sony related build competitions
and related experiences and our Red Games Lego Brawls live stream
sponsorship activation. Brand and media sponsorship revenues for
fiscal year 2018 was primarily comprised of revenues from our
Logitech, Inc. and Red Bull brand sponsorships and our 2018 Red
Bull Allstars experience.
●
Platform-As-A-Service.
We generate PaaS
revenues pursuant to arrangements with brand and media partners,
retail venues, game publishers and broadcasters that allow our
partners to hold amateur esports experiences, and or capture
specifically curated gameplay content that is customized for our
partners’ distribution channels, leveraging the flexibility
of, and powered by our Super League gaming and content technology
platform. PaaS revenue for fiscal year 2019 included revenues from
our Samsung Fortnite event held in New York in March 2019, Capcom,
Inc. related to our Street Fighter® V: Arcade Edition
partnership, Sony related to certain build competitions and related
experiences, Sprint related to our Sprint 5G LA activation, our Cox
Paladins gameplay experience and our Tencent Games and OnePlus
Mobile Player Unknown’s Battlegrounds Mobile, or PUBG Mobile,
premium content, competitive experiences and sponsorship
activation.
●
Adv
ertising and Content
Sales.
Revenues for fiscal year
2019 included revenues from campaigns launched related to our
Framerate acquisition and advertising revenues from Snapchat
related content sales and our Minehut digital property. Revenues
for fiscal year 2018 included revenues from the sale of gameplay
and other content generated by us to Nickelodeon (third-party
broadcaster) to supplement their YouTube channel programming. We
expect to continue to expand our advertising revenue and revenue
from the sale of our proprietary and third-party content derived
from our technology platform in future periods, as we expand our
advertising inventory, viewership and related sales
activities.
Direct
to Consumer:
●
The decrease in direct to consumer revenue was primarily due to a
decrease in the number of paid events held during fiscal year 2019,
as compared to the prior year period. During fiscal year 2019, we
held paid events and a higher number of events that were free to
play, consistent with our strategic focus on increasing the volume
of new gamers and spectators introduced into our customer funnel,
to increase the number of registered users on our platform, drive
consumer conversion, and increase the overall awareness of the
Super League brand and technology platform offerings. We intend to
continue to offer a combination of paid and free to play
experiences going forward. Digital subscription revenues included
in direct to consumer revenues for fiscal year 2019 were primarily
comprised of subscription revenues related to our Minehut digital
property acquired in June 2018, which provides various Minecraft
server hosting services on a subscription basis to the Minecraft
gaming community.
Cost of Revenue
|
|
Fiscal
Year
|
|
||
|
|
2019
|
2018
|
$ Change
|
% Change
|
|
Cost
of revenue
|
$
513,000
|
$
684,000
|
$
(171,000
)
|
25
%
|
Cost of
revenue for fiscal year 2019 decreased $171,000 or 25% compared to
fiscal year 2018, as compared to a 4% increase in revenues for the
same periods. The trend in cost of sales for the periods presented
was primarily due to operational efficiencies and lower direct
costs incurred for fiscal year 2019 in connection with our physical
and digital experiences.
Operating Expenses
|
|
Fiscal
Year
|
|
||
|
|
2019
|
2018
|
$ Change
|
% Change
|
|
Selling,
Marketing and Advertising
|
$
4,488,000
|
$
4,319,000
|
$
169,000
|
4
%
|
|
Technology
Platform and Infrastructure
|
4,520,000
|
4,183,000
|
337,000
|
8
%
|
|
General
and Administrative
|
12,333,000
|
8,020,000
|
4,313,000
|
54
%
|
|
Total
operating expenses
|
$
21,341,000
|
$
16,522,000
|
$
4,819,000
|
29
%
|
Selling, Marketing and Advertising
. The increase in selling,
marketing and advertising expense was primarily due to a 27%
increase in personnel costs associated with
the continued expansion of our operations
requiring additional internal resources across our product,
creative and commercial departments,
and an increase in
marketing and promotional experiences focused on widening our
customer funnel and attracting increased numbers of registered
users to our platform. The increase included increased costs
related to contract labor, influencers, event operations, content
capture and other costs to execute various marketing and
promotional experiences during the period. The increase was
partially offset by a decrease in amortization of noncash in-kind
advertising costs, totaling $667,000, which were initially
capitalized pursuant to a June 2017 third-party investment
agreement. The investment agreement included in-kind advertising
for use in future periods, valued at $1.0 million, as a component
of the consideration paid to us in exchange for equity in the
Company. The prepaid advertising cost was amortized over an
18-month period ending as of December 31, 2018.
Technology Platform and Infrastructure.
Technology platform
and infrastructure costs include (i) allocated personnel costs,
including salaries, noncash stock compensation, taxes and benefits
related to our internal software developers and engineers, employed
by Super League, engaged in the operation, maintenance, management,
administration, testing, development and enhancement of our
proprietary gaming and content technology platform, (ii)
third-party contract software development and engineering resources
engaged in developing and enhancing our proprietary gaming and
content technology platform, (iii) the amortization of capitalized
internal use software costs, and (iv) technology platform related
cloud services and broadband costs.
Capitalized internal use s
oftware
development costs are amortized on a straight-line basis over the
software’s estimated useful life.
The period over period increase primarily reflects
an increase in engineering headcount since the end of the prior
year in connection with the expansion of our engineering and
internal use software development activities and
an increase
in technology platform related cloud services costs
.
General and Administrative.
General and administrative
expense for the periods presented was comprised of the
following:
|
|
Fiscal
Year
|
|
|
|
|
|
2019
|
2018
|
$ Change
|
% Change
|
|
Personnel
costs
|
$
2,755,000
|
$
1,902,000
|
$
853,000
|
45
%
|
|
Office
and facilities
|
403,000
|
367,000
|
36,000
|
10
%
|
|
Professional
fees
|
911,000
|
816,000
|
95,000
|
12
%
|
|
Stock-based
compensation
|
5,453,000
|
3,236,000
|
2,217,000
|
69
%
|
|
Depreciation
and amortization
|
445,000
|
851,000
|
(406,000
)
|
(-48
)%
|
|
Other
|
2,366,000
|
848,000
|
1,518,000
|
179
%
|
|
Total
general and administrative expense
|
$
12,333,000
|
$
8,020,000
|
$
4,313,000
|
54
%
|
A summary of the main drivers of the
net increase in general
and administrative expenses for the periods presented
is as follows:
●
General
and
administrative personnel costs increased 45%, primarily due to
approximately $455,000 of management performance-based bonuses paid
in connection with the achievement of certain performance-based
milestones during fiscal year 2019, including the closing of the
IPO and other operational performance targets. The
increase
in personnel costs also reflects an increase in recruiting expense
and a 4% net increase in personnel expense compared to the prior
year period in connection with the expansion of our operations.
During fiscal year 2019 and 2018, across all departments, we had
average full-time equivalent employees of 51 and 44,
respectively.
●
Office
and facilities expense increased 9%, primarily due to an increase
in leased office space commencing in June 2018 in connection with
the expansion of our SLG.TV studio operations.
●
Noncash stock compensation expense included in general and
administrative expense increased 69%, primarily due to certain
performance options and warrants previously granted to certain
executives, which vested upon the achievement of certain
performance-based milestones, pursuant to October 2018 amended
employee agreements and/or vesting conditions in the underlying
equity grant agreements. Performance targets included the
completion of our IPO in February 2019 and other operational
performance targets. During fiscal year 2019, approximately 300,000
of performance-based stock options and warrants vested with grant
date fair values ranging from $8.28 to $8.50, resulting in noncash
stock compensation expense of $2,617,000. The remaining increase
also reflects $58,000 of stock-based compensation expense related
to our acquisition of Framerate, as described at Note 8 to the
financial statements included elsewhere herein.
|
|
●
Depreciation
and amortization expense decreased 48% due primarily to a decrease
in scheduled amortization related to fully depreciated assets with
useful lives that expired during fiscal 2019 or prior, and the
acceleration of depreciation related to certain networking and
related equipment disposed of during fiscal 2019.
●
Pro
fessional
fees and other general and administrative expenses increased 12%
and 179%, respectively, primarily due to a significant increase in
directors and officer's insurance premiums in connection with our
February 2019 IPO, and an increase in legal, audit and other
administrative public company costs.
Other Income (expense)
Other
income (expense), net, for fiscal year 2019 and 2018, totaling
$9,909,000 and $4,467,000, respectively, was primarily comprised of
interest expense related to the convertible notes outstanding
during the periods presented as follows:
|
|
Fiscal Year
|
|
|
|
|
|
2019
|
2018
|
$ Change
|
% Change
|
|
Accretion
of discount on convertible notes
|
$
2,475,000
|
$
1,394,000
|
1,081,000
|
78
%
|
|
Accrued
interest expense on convertible notes
|
187,000
|
311,000
|
(124,000
)
|
(40
)%
|
|
Accretion
of convertible note issuance costs
|
209,000
|
143,000
|
66,000
|
46
%
|
|
Beneficial
conversion feature
|
7,067,000
|
-
|
7,067,000
|
100
%
|
|
To
tal interest expense
|
$
9,938,000
|
$
1,848,000
|
$
8,090,000
|
>300%
|
Interest Expense.
Interest expense for the periods presented
primarily relates to the issuance of 9.00% secured convertible
promissory notes, commencing in February 2018 through August 2018,
as described below under
Liquidity
and Capital Resources
. Principal and interest as of February
27, 2019, the closing date of the IPO and December 31, 2018 totaled
$13,793,000 and $13,606,000, respectively.
Concurrent with the closing of the IPO on February
27, 2019, in accordance with the related agreements,
all
outstanding principal and interest for the 9.00% convertible notes
outstanding was automatically converted into 1,475,164 shares of
the Company’s common stock at a conversion price of $9.35. As
of and subsequent to February 27, 2019, we have no debt
outstanding.
As a result of the
automatic conversion of the 2018 Notes (defined below) and the
application of conversion accounting, the Company recorded an
immediate charge to interest expense of $1,384,000, representing
the write-off of the unamortized balance of debt
discounts associated with the 2018 warrants and cash commissions
and warrants issued to third parties. Unamortized debt discounts at
December 31, 2018 totaled $2,684,000,
respectively.
The non-detachable conversion feature embedded in the 2018 Notes
provides for a conversion rate that was below market value at the
commitment date, and therefore, represented a beneficial conversion
feature (“BCF”). The BCF is generally recognized
separately at issuance by allocating a portion of the debt proceeds
equal to the intrinsic value of the BCF to additional paid-in
capital. The resulting convertible debt discount is recognized as
interest expense using the effective yield method. However, the
conversion feature associated with the 2018 Notes was not
exercisable until the consummation of an initial public offering by
the Company of its common stock, and therefore, was not required to
be recognized in earnings until the IPO related contingency was
resolved, which occurred on the IPO Closing Date. The commitment
date is the IPO Closing Date and the commitment date stock price
was $11.00 per share. The intrinsic value of the BCF on the IPO
Closing Date, which was limited to the net proceeds allocated to
the debt on a relative fair value basis, was approximately
$7,067,000, and is reflected as additional interest expense in the
statement of operations for the year ended December 31,
2019.
Liquidity and Capital Resources
General
Cash and cash equivalents totaled $8.4 million and $2.8
million at December 31, 2019 and 2018, respectively.
We have experienced net losses and negative cash flows from
operations since our inception. As of December 31, 2019 and 2018,
we had working capital of approximately $8.7 million and ($8.0)
million, respectively, and sustained cumulative losses since
inception attributable to common stockholders of approximately
$85.8 million. Total noncash charges included in accumulated
deficit since inception, primarily related to noncash stock
compensation, restricted stock units issued in connection with a
license agreement, amortization of the discount on the 2018 Notes
(defined below) and in-kind advertising expense, totaled
approximately $34.6 million. On February 27, 2019, we completed our
IPO, pursuant to which we issued and sold an aggregate of 2,272,727
shares of our common stock at a public offering price of $11.00 per
share
pursuant to a
registration statement on Form
S-1, declared effective by the Securities and
Exchange Commission on February 25, 2019 (File No. 333-229144). We
raised net proceeds of approximately $22,458,000 after underwriting
discounts, commissions and other offering costs of $2,542,000.
During Fiscal 2018, the Company issued 9.00% secured convertible
promissory notes, as described below, in an aggregate principal
amount of approximately $13,000,000.
Concurrent with the
closing of the IPO on February 27, 2019, in accordance with the
related agreements, all outstanding principal and interest for the
9.00% convertible notes outstanding was automatically converted
into shares of the Company’s common stock as described below.
Approximately 1.3 million of the
warrants issued in conjunction with the 2018 Notes are callable at
the election of the Company at any time following the completion of
our IPO.
To date, our principal sources of capital used to fund our
operations have been the net proceeds we received from sales of
equity securities and proceeds received from the issuance of
convertible debt, as described herein.
We have and will continue to use significant
capital for the growth and development of our business. Our
management team expects operating losses to continue in the near
term in connection with the pursuit of our strategic objectives. As
such, we believe our current cash position, absent receipt of
additional capital either from operations or that may be available
from future issuance(s) of common stock or debt financings, is not
sufficient to fund our planned operations for the twelve months
following the date of this Report. We believe these conditions
raise substantial doubt about our ability to continue as a going
concern. In addition, we may encounter unforeseen difficulties that
may deplete our capital resources more rapidly than anticipated,
including those set forth under the heading “Risk
Factors” included in Part 1, Item 1A of this
Report.
We are focused on expanding our service offerings and revenue
growth opportunities through internal development, collaborations,
and through one or more strategic acquisitions. Management is
currently exploring several alternatives for raising capital to
facilitate our growth and execute our business strategy, including
strategic partnerships or other forms of equity or debt
financings.
We continue to evaluate potential strategic acquisitions. To
finance such strategic acquisitions, we may find it necessary to
raise additional equity capital, incur additional debt, or both.
Any efforts to seek additional funding could be made through
issuances of equity or debt, or other external financing. However,
additional funding may not be available on favorable terms, or at
all. The capital and credit markets have experienced extreme
volatility and disruption periodically and such volatility and
disruption may occur in the future. If we fail to obtain additional
financing when needed, we may not be able to execute our business
plans which, in turn, would have a material adverse impact on our
financial condition, our ability to meet our obligations, and our
ability to pursue our business strategies.
Cash Flows for Fiscal Years 2019 and 2018
The following table summarizes the change in cash
balances
for the periods presented:
|
|
Fiscal Year
|
|
|
|
2019
|
2018
|
|
|
|
|
|
Net
cash used in operating activities
|
$
(13,646,000
)
|
$
(10,680,000
)
|
|
Net
cash used in investing activities
|
(3,164,000
)
|
(866,000
)
|
|
Net
cash provided by financing activities
|
22,478,000
|
12,611,000
|
|
Increase
in cash
|
5,668,000
|
1,065,000
|
|
Cash
and cash equivalents, at beginning of period
|
2,774,000
|
1,709,000
|
|
Cash
and cash equivalents, at end of period
|
$
8,442,000
|
$
2,774,000
|
Cash Flows from Operating Activities.
Net cash used in operating activities during
fiscal year 2019 was $13,646,000, which primarily reflected
our net GAAP loss of $30,679,000, net of adjustments to
reconcile net GAAP loss to net cash used in operating activities
of $17,033,000, which included $6,217,000 of noncash stock
compensation charges, $2,871,000 of noncash accrued interest and
accretion of debt discount, $7,067,0000 of noncash interest expense
related to the recognition of the beneficial conversion feature
upon the automatic conversion of the 2018 Notes upon close of the
IPO, and depreciation and amortization of $862,000. Changes in
working capital primarily reflected the impact of the prepayment of
increased directors and officer’s insurance premiums in
connection with the consummation of our IPO and the settlement of
payables in the ordinary course. Net cash used in operating
activities during fiscal year 2018 was $10,680,000, which primarily
reflected our net loss of $20,627,000, net of adjustments to
reconcile net loss to net cash used in operating activities of
$9,947,000, which included $3,942,000 of non-cash stock
compensation, noncash amortization of prepaid in-kind advertising
totaling $667,000 and $1,106,000 of non-cash depreciation and
amortization charges. Changes in working capital primarily
reflected increases in receivables and the settlement of payables
in the ordinary course of business during the
period.
Cash Flows from Investing Activities.
Cash flows from investing activities were
comprised of the following
for the periods
presented
:
|
|
Fiscal Year
|
|
|
|
2019
|
2018
|
|
|
|
|
|
Cash
paid for acquisition of Framerate, net
|
$
(1,506,000
)
|
$
-
|
|
Purchase
of property and equipment
|
(73,000
)
|
(255,000
)
|
|
Capitalization
of software development costs
|
(1,079,000
)
|
(519,000
)
|
|
Acquisition
of other intangible and other assets
|
(506,000
)
|
(92,000
)
|
|
Net cash used in investing activities
|
$
(3,164,000
)
|
$
(866,000
)
|
Acquisition of Framerate, Inc
.
On June 3, 2019, the Company and
Merger Sub, entered into the
Merger Agreement
with Framerate, pursuant to which Framerate merged
with and into Merger Sub, with Merger Sub continuing as the
surviving corporation. The Acquisition was consummated on the
Effective Date when the certificate of merger of Merger Sub and
Framerate was filed with the Secretary of State of the State of
Delaware. As consideration for the Acquisition, we ratably paid
and/or issued to the former shareholders of Framerate an aggregate
of $1.5 million in cash and $1.0 million worth of shares of our
common stock, at a price per share of $7.4395, which price was
equal to the volume weighted average price of our common stock over
the five trading days preceding the date of the Merger Agreement,
as reported on the Nasdaq Capital Market.
In addition to the issuance of the Closing Shares, the Merger
Agreement provides for the issuance of up to an additional $980,000
worth of shares of our common stock at the same price per share as
the Closing Shares in the event Framerate achieves certain
performance-based milestones during the two-year period following
the closing of the Acquisition, or June 6, 2021. One-half of the
Earn-Out Shares will be issuable on the one-year anniversary of the
Effective Date, and the remaining one-half will be issuable on the
second anniversary of the Effective Date.
Expanded Agreement with ggCircuit.
On September 23, 2019,
the Company and ggCircuit entered into an Expanded Agreement
pursuant to which
Super League became
the primary consumer facing brand within ggCircuit’s
B2B gaming center
software platform.
In consideration for the rights granted by
ggCircuit to Super League, Super League paid an upfront fee of
$340,000 in the fourth quarter of 2019. The upfront fee is included
as "Licenses" in intangible assets and other assets, net, in the
accompanying balance sheet and is being amortized over the initial
term of the Expanded Agreement of five years, commencing October 1,
2019.
Capitalized Internal Use Software Costs
. Software
development costs incurred to develop internal-use software during
the application development stage are capitalized and amortized on
a straight-line basis over the software’s estimated useful
life, which is generally three years. Software development costs
incurred during the preliminary stages of development are charged
to expense as incurred. Maintenance and training costs are charged
to expense as incurred. Upgrades or enhancements to existing
internal-use software that result in additional functionality are
capitalized and amortized on a straight-line basis over the
applicable estimated useful life.
Cash Flows from Financing Activities.
Cash flows from financing activities were
comprised of the following
for the periods
presented
:
|
|
Fiscal Year
|
|
|
|
2019
|
2018
|
|
|
|
|
|
Proceeds
from issuance of common stock, net of issuance costs
|
$
22,458,000
|
$
-
|
|
Proceeds
from convertible notes payable, net of issuance cost
|
-
|
12,611,000
|
|
Proceeds
from common stock purchase warrant exercises
|
20,000
|
-
|
|
Net cash provided by financing activities
|
$
22,478,000
|
$
12,611,000
|
Initial Public
Offering
. On February 27, 2019,
we completed our IPO, pursuant to which we issued and sold an
aggregate of 2,272,727 shares of our common stock at a public
offering price of $11.00 per share. We raised net proceeds of
approximately $22,458,000 after deducting underwriting discounts,
commissions and other offering costs of $2,542,00. The net proceeds
received from the offering have been used for working capital and
general corporate purposes, including sales and marketing
activities, product development and capital expenditures. We have,
and may in the future, use a portion of the net proceeds for the
acquisition of, or investment in, technologies, solutions or
businesses that may compliment or business and or accelerate or
growth. The amounts and timing of our actual expenditure, including
expenditure related to sales and marketing and product development
will depend on numerous factors, including the status of our
product development efforts, our sales and marketing activities,
expansion internationally, the amount of cash generated or used by
our operations, competitive pressures and other factors described
under “Risk Factors” in our Prospectus filed pursuant
to Rule 424(b) under the Securities Act with the SEC on February
27, 2019, as well as Item I, Part 1A of this Report. Our management
has broad discretion in the application of the net proceeds, and
investors will be relying on our judgment regarding the application
of the net proceeds from the IPO.
Pursuant to the related underwriting agreement, in connection with
the completion of the IPO, for the purchase price of $50.00, we
issued a warrant to purchase shares of our common stock equal to
3.0% of the shares sold in the IPO, or 68,182 shares, at an
exercise price of $11.00 per share (the “Underwriters’
Warrants”). The Underwriters’ Warrants are exercisable
during the period commencing from the date of the close of the IPO
and ending five years from the closing date of the IPO. The
Underwriters’ Warrants represent additional noncash offering
costs, with an estimated grant date fair value of $547,000, which
was reflected in additional-paid-in capital when issued and as a
corresponding offering cost in the statement of shareholders equity
for the year ended December 31, 2019.
Convertible Debt Issuances
. In February and April 2018, we
issued 9.00% secured convertible promissory notes with a collective
face value of $3,000,000 (the “Initial 2018 Notes”).
The Initial 2018 Notes (i) accrued simple interest at the rate of
9.00% per annum, (ii) matured on the earlier of December 31, 2018
or the close of a $15,000,000 equity financing (“Qualifying
Equity Financing”) by us, and (iii) all outstanding principal
and accrued interest was automatically convertible into equity or
equity-linked securities sold in a Qualifying Equity Financing
based upon a conversion rate equal to (x) a 10% discount to the
price per share of a Qualifying Equity Financing, with (y) a floor
of $10.80 per share. In addition, the holders of the Initial 2018
Notes were collectively issued warrants to purchase approximately
55,559 shares of common stock, at an exercise price of $10.80 per
share and a term of five years (the “Initial 2018
Warrants”).
In May through August 2018, we issued additional 9.00% secured
convertible promissory notes with a collective face value of
$10,000,000 (the “Additional 2018 Notes”). In May 2018,
all of the Initial 2018 Notes and related accrued interest,
totaling $3,056,182, were converted into the Additional 2018 Notes,
resulting in an aggregate principal amount of $13,056,182
(hereinafter collectively, the “2018 Notes”). The
holders of the converted Initial 2018 Notes retained their
respective Initial 2018 Warrants.
The 2018 Notes (i) accrued simple interest at the rate of 9.00% per
annum, (ii) matured on the earlier of the closing of an
IPO
of our common stock on a national securities
exchange or April 30, 2019, and (iii) all outstanding principal and
accrued interest was automatically convertible into shares of
common stock upon the closing of the IPO at the lesser of (x)
$10.80 per share or (y) a 15% discount to the price per share of
the IPO. In addition, the holders of the 2018 Notes were
collectively issued 1,396,383 warrants to purchase common
stock equal to 100% of the aggregate principal amount of the 2018
Notes divided by $9.35 per share (the “2018 Warrants”).
The 2018 Warrants are exercisable for a term of five years,
commencing on the close of the IPO, at an exercise price equal to
the lesser of (x) $10.80 per share or (y) a 15% discount to the IPO
price per share and are callable at our election at any time
following the closing of an IPO.
Concurrent with the closing of the IPO on February 27, 2019, in
accordance with the related agreements,
all outstanding
principal and interest for the 9.00% convertible notes outstanding,
totaling $13,793,000, was automatically converted into 1,475,164
shares of the Company’s common stock at a conversion price of
$9.35. As of December 31, 2019, there is no debt outstanding.
Refer to Note 6 to the
accompany financial statements elsewhere in this Report for
additional information
.
Contractual Obligations
As of December 31, 2019, except as described below, we had no
significant commitments for capital expenditures, nor do we have
any committed lines of credit, noncancelable operating leases
obligations, other committed funding or long-term debt, and no
guarantees.
The operating lease for our corporate
headquarters expired on May 31, 2017 and was subsequently amended
to operate on a month-to-month basis.
In consideration for the rights granted by ggCircuit to Super
League in connection with the Expanded Agreement described above,
including the right to commercially exploit Super League Prime and
to feature the “Super League Gaming” brand on the
applicable ggCircuit customer platform, commencing in the first
quarter of 2020, Super League will pay quarterly fees over the term
of the Expanded Agreement ranging from $0 to $150,000, based on
contractual revenue levels.
Off-Balance Sheet Commitments and Arrangements
We have not entered into any off-balance sheet financial
guarantees or other off-balance sheet commitments to
guarantee the payment obligations of any third parties. We have not
entered into any derivative contracts that are indexed to our
shares and classified as stockholder’s equity or that are not
reflected in our financial statements included elsewhere herein.
Furthermore, we do not have any retained or contingent interest in
assets transferred to an unconsolidated entity that serves as
credit, liquidity or market risk support to such entity. We do not
have any variable interest in any unconsolidated entity that
provides financing, liquidity, market risk or credit support to us
or engages in leasing, hedging or product development services with
us.
Contingencies
Certain
conditions may exist as of the date the financial statements are
issued, which may result in a loss to the Company, but which will
only be resolved when one or more future events occur or fail to
occur. The Company’s management, in consultation with its
legal counsel as appropriate, assesses such contingent liabilities,
and such assessment inherently involves an exercise of judgment. In
assessing loss contingencies related to legal proceedings that are
pending against the Company or unasserted claims that may result in
such proceedings, the Company, in consultation with legal counsel,
evaluates the perceived merits of any legal proceedings or
unasserted claims, as well as the perceived merits of the amount of
relief sought or expected to be sought therein. If the assessment
of a contingency indicates it is probable that a material loss has
been incurred and the amount of the liability can be estimated,
then the estimated liability would be accrued in the
Company’s financial statements. If the assessment indicates a
potentially material loss contingency is not probable, but is
reasonably possible, or is probable, but cannot be estimated, then
the nature of the contingent liability, together with an estimate
of the range of possible loss, if determinable and material, would
be disclosed. Loss contingencies considered remote are generally
not disclosed unless they involve guarantees, in which case the
guarantees would be disclosed.
Recent Accounting Pronouncements
Refer
to Note 2 to the financial statements included elsewhere
herein.
Relaxed Ongoing Reporting Requirements
Upon the completion of our IPO, we elected to report as an
“emerging growth company” (as defined in the JOBS Act)
under the reporting rules set forth under the Exchange Act. For so
long as we remain an “emerging growth company,” we may
take advantage of certain exemptions from various reporting
requirements that are applicable to other Exchange Act reporting
companies that are not “emerging growth companies,”
including but not limited to:
●
not being required
to comply with the auditor attestation requirements of Section 404
of the Sarbanes-Oxley Act;
●
taking advantage of
extensions of time to comply with certain new or revised financial
accounting standards;
●
being permitted to
comply with reduced disclosure obligations regarding executive
compensation in our periodic reports and proxy statements;
and
●
being exempt from
the requirement to hold a non-binding advisory vote on executive
compensation and stockholder approval of any golden parachute
payments not previously approved.
We are
subject to ongoing public reporting requirements that are less
rigorous than Exchange Act rules for companies that are not
“emerging growth companies,” and our stockholders could
receive less information than they might expect to receive from
more mature public companies.
We
expect to take advantage of these reporting exemptions until we are
no longer an emerging growth company. We will remain an
“emerging growth company” for up to five years,
although if the market value of our Common Stock that is held by
non-affiliates exceeds $700 million as of any June 30 before that
time, we would cease to be an “emerging growth company”
as of the following December 31.
ITEM 7A.
QU
A
NTITATIVE AND QUALITATIVE DISCLOSURES ABOUT
MARKET RISK
In the
ordinary course of our business, we are not currently exposed to
market risk of the sort that may arise from changes in interest
rates or foreign currency exchange rates, or that may otherwise
arise from transactions in derivatives.
The
preparation of financial statements in conformity with GAAP
requires our management to make estimates and assumptions that
affect the reported amounts of assets and liabilities and the
disclosure of contingent assets and liabilities at the date of the
financial statements, and the reported amounts of revenues and
expenses during the reporting period. Actual results could differ
from those estimates. The Company’s significant estimates and
assumptions include the fair value of the Company’s common
stock, stock-based compensation, the recoverability and useful
lives of long-lived assets, and the valuation allowance relating to
the Company’s deferred tax assets.
ITEM 8. FIN
ANCIAL STATEMENTS AND SUPPLEMENTARY
DATA
The financial statements and related financial information required
to be filed hereunder are indexed under Item 15 of this report and
are incorporated herein by reference.
ITEM 9. CHANGES IN AND DISAGREEMENTS WITH ACCOUNTANTS ON ACCOUNTING
AND FINANCIAL DISCLOSURE
None.
ITEM 9A. CO
N
TROLS AND
PROCEDURES
Management’s
Assessment of the Effectiveness of our Internal Control Over
Financial Reporting and
Report
of Independent Registered Public Accounting
Firm
We are
an “emerging growth company,” as defined in Rule 405 of
the Securities Act. This annual report does not include a report of
management's assessment regarding internal control over financial
reporting or an attestation report of the company's registered
public accounting firm due to a transition period established by
rules of the Securities and Exchange Commission for newly public
companies.
Inherent Limitations on Effectiveness of Controls
Our
management, including our Chief Executive Officer and Chief
Financial Officer, does not expect that our disclosure controls or
our internal control over financial reporting will prevent or
detect all errors and all fraud. A control system, no matter how
well designed and operated, can provide only reasonable, not
absolute, assurance that the control system’s objectives will
be met. The design of a control system must reflect the fact that
there are resource constraints, and the benefits of controls must
be considered relative to their costs. Further, because of the
inherent limitations in all control systems, no evaluation of
controls can provide absolute assurance that misstatements due to
error or fraud will not occur or that all control issues and
instances of fraud, if any, have been detected. The design of any
system of controls is based in part on certain assumptions about
the likelihood of future events, and there can be no assurance that
any design will succeed in achieving its stated goals under all
potential future conditions. Projections of any evaluation of the
effectiveness of controls to future periods are subject to risks.
Over time, controls may become inadequate because of changes in
conditions or deterioration in the degree of compliance with
policies or procedures.
I
TEM 9B. OTHER
INFORMATION
None.
P
A
RT III
ITEM 10. DIRECTORS, EXECUTIVE OFFICERS AND CORPORATE
GOVERNANCE
Except as provided below, in accordance with General Instruction
G(3) to Form 10-K, certain information required by this Item is
incorporated herein by reference to our definitive proxy statement
for our 2020 annual meeting of stockholders to be filed with the
SEC no later than April 29, 2020.
ITEM 11. EXECUTIVE COMPENSATION.
Except as provided below, in accordance with General Instruction
G(3) to Form 10-K, certain information required by this Item is
incorporated herein by reference to our definitive proxy statement
for our 2020 annual meeting of stockholders to be filed with the
SEC no later than April 29, 2020.
ITEM 12. SECURITY OWNERSHIP OF CERTAIN BENEFICIAL OWNERS AND
MANAGEMENT AND RELATED STOCKHOLDER MATTERS
Except as provided below, in accordance with General Instruction
G(3) to Form 10-K, certain information required by this Item is
incorporated herein by reference to our definitive proxy statement
for our 2020 annual meeting of stockholders to be filed with the
SEC no later than April 29, 2020.
ITEM 13. CERTAIN RELATIONSHIPS AND RELATED TRANSACTIONS, AND
DIRECTOR INDEPENDENCE
Except as provided below, in accordance with General Instruction
G(3) to Form 10-K, certain information required by this Item is
incorporated herein by reference to our definitive proxy statement
for our 2020 annual meeting of stockholders to be filed with the
SEC no later than April 29, 2020.
ITEM 14. PRINCIPAL ACCOUNTING FEES AND SERVICES
Except as provided below, in accordance with General Instruction
G(3) to Form 10-K, certain information required by this Item is
incorporated herein by reference to our definitive proxy statement
for our 2020 annual meeting of stockholders to be filed with the
SEC no later than April 29, 2020.
P
A
R
T IV
ITEM 15. EXHIBITS, FINANCIAL STATEMENT SCHEDULES
|
Exhibit No.
|
Name
|
|
Incorporation by Reference
|
|
Agreement and Plan
of Merger Agreement and Plan of Merger by and among Super League
Gaming, Inc., SLG Merger Sub, Inc. and Framerate, Inc.
|
|
Exhibit 2.1 to the
Current Report on Form 8-K, filed on June 7, 2019.
|
|
|
Second Amended and
Restated Certificate of Incorporation of Super League Gaming, Inc.,
dated November 19, 2018.
|
|
Exhibit 3.1 to the
Registration Statement, filed on January 4, 2019
|
|
|
Second Amended and
Restated Bylaws of Super League Gaming, Inc.
|
|
Exhibit 3.2 to the
Registration Statement, filed on January 4, 2019
|
|
|
Certificate of
Amendment to the Second Amended and Restated Certificate of
Incorporation of Super League Gaming, Inc., dated February 8,
2019.
|
|
Exhibit 3.3 to the
Amendment No. 2 to the Registration Statement , filed on
February 12, 2019
|
|
|
Form of Common
Stock Certificate.
|
|
Exhibit 4.1 to the
Amendment No. 2 to the Registration Statement , filed on
February 12, 2019
|
|
|
Form of
Registration Rights Agreement, among Super League Gaming, Inc. and
certain accredited investors.
|
|
Exhibit 4.2 to the
Registration Statement on Form S-1 , filed on January 4,
2019
|
|
|
Common Stock
Purchase Warrant dated June 16, 2017 issued to Ann
Hand.
|
|
Exhibit 4.3 to the
Registration Statement on Form S-1, filed on January 4,
2019
|
|
|
Form of 9.00%
Secured Convertible Promissory Note.
|
|
Exhibit 4.4 to the
Registration Statement on Form S-1, filed on January 4,
2019
|
|
|
Form of Callable
Common Stock Purchase Warrant, issued to certain accredited
investors.
|
|
Exhibit 4.5 to the
Registration Statement on Form S-1, filed on January 4,
2019
|
|
|
Form of
Representative’s Warrant.
|
|
Exhibit 4.6 to the
Amendment No. 2 to the Registration Statement on Form S-1, filed on
February 12, 2019
|
|
|
Super League
Gaming, Inc. Amended and Restated 2014 Stock Option and Incentive
Plan.
|
|
Exhibit 10.1 to the
Registration Statement , filed on January 4, 2019
|
|
|
Form of Stock
Option Agreement under 2014 Stock Option and Incentive
Plan.
|
|
Exhibit 10.2 to the
Registration Statement , filed on January 4, 2019
|
|
|
Subscription
Agreement, among Nth Games, Inc. and certain accredited
investors.
|
|
Exhibit 10.3 to the
Registration Statement , filed on January 4, 2019
|
|
|
Subscription
Agreement, among Super League Gaming, Inc. and certain accredited
investors.
|
|
Exhibit 10.4 to the
Registration Statement, filed on January 4, 2019
|
|
|
Form of Theater
Agreement, filed herewith.
|
|
Exhibit 10.5 to the
Registration Statement , filed on January 4, 2019
|
|
|
Lease between Super
League Gaming, Inc. and Roberts Business Park Santa Monica LLC,
dated June 1, 2016.
|
|
Exhibit 10.6 to the
Registration Statement, filed on January 4, 2019
|
|
|
License Agreement
between Super League Gaming, Inc. and Riot Games, Inc., dated June
22, 2016.
|
|
Exhibit 10.7 to the
Registration Statement , filed on January 4, 2019
|
|
|
Amended and
Restated License Agreement between Super League Gaming, Inc. and
Mojang AB, dated August 1, 2016.
|
|
Exhibit 10.8 to the
Registration Statement , filed on January 4, 2019
|
|
|
Master Agreement
between Super League Gaming, Inc. and Viacom Media Networks, dated
June 9, 2017.
|
|
Exhibit 10.9 to the
Registration Statement, filed on January 4, 2019
|
|
|
Form of Common
Stock Purchase Agreement, among Super League Gaming, Inc. and
certain accredited investors.
|
|
Exhibit 10.10 to
the Registration Statement , filed on January 4,
2019
|
|
|
Form of
Investors’ Rights Agreement, among Super League Gaming, Inc.
and certain accredited investors.
|
|
Exhibit 10.11 to
the Registration Statement, filed on January 4, 2019
|
|
|
Employment
Agreement, between Super League Gaming, Inc. and Ann Hand, dated
June 16, 2017.
|
|
Exhibit 10.12 to
the Registration Statement , filed on January 4,
2019
|
|
|
Employment
Agreement, between Super League Gaming, Inc. and David Steigelfest,
dated October 31, 2017.
|
|
Exhibit 10.13 to
the Registration Statement, filed on January 4, 2019
|
|
|
Riot Games, Inc.
Extension Letter, dated November 21, 2017.
|
|
Exhibit 10.14 to
the Registration Statement, filed on January 4, 2019
|
|
|
Form of Note
Purchase Agreement, among Super League Gaming, Inc. and certain
accredited investors.
|
|
Exhibit 10.15 to
the Registration Statement , filed on January 4,
2019
|
|
|
Form of Security
Agreement, between Super League Gaming, Inc. and certain accredited
investors.
|
|
Exhibit 10.16 to
the Registration Statement, filed on January 4, 2019
|
|
|
Form of
Intercreditor and Collateral Agent Agreement, among Super League
Gaming, Inc. and certain accredited investors.
|
|
Exhibit 10.17 to
the Registration Statement , filed on January 4,
2019
|
|
Form of
Investors’ Rights Agreement (9% Secured Convertible
Promissory Notes), among Super League Gaming, Inc. and certain
accredited investors.
|
|
Exhibit 10.18 to
the Registration Statement , filed on January 4,
2019
|
|
|
Master Service
Agreement and Initial Statement of Work between Super League
Gaming, Inc. and Logitech Inc., dated March 1,
2018.
|
|
Exhibit 10.19 to
the Registration Statement , filed on January 4,
2019
|
|
|
Asset Purchase
Agreement, between Super League Gaming, Inc. and Minehut, dated
June 22, 2018.
|
|
Exhibit 10.20 to
the Registration Statement, filed on January 4, 2019
|
|
|
Amended and
Restated Employment Agreement, between Super League Gaming, Inc.
and Ann Hand, dated November 15, 2018.
|
|
Exhibit 10.21 to
the Registration Statement , filed on January 4,
2019
|
|
|
Amended and
Restated Employment Agreement, between Super League Gaming, Inc.
and David Steigelfest, dated November 1, 2018.
|
|
Exhibit 10.22 to
the Registration Statement, filed on January 4, 2019
|
|
|
Employment
Agreement, between Super League Gaming, Inc. and Matt Edelman,
dated November 1, 2018.
|
|
Exhibit 10.23 to
the Registration Statement, filed on January 4, 2019
|
|
|
Employment
Agreement, between Super League Gaming, Inc. and Clayton Haynes,
dated November 1, 2018.
|
|
Exhibit 10.24 to
the Registration Statement , filed on January 4,
2019
|
|
|
Commercial
Partnership Agreement between Super League Gaming, Inc., and
ggCircuit, LLC, dated September 23, 2019.
|
|
Exhibit 10.1 to the
Quarterly Report on Form 10-Q for the period ended September 30,
2019, filed November 14, 2019.
|
|
|
Super League
Gaming, Inc. Code of Business Conduct and Ethics.
|
|
Exhibit 14.1 to the
Registration Statement , filed on January 4, 2019
|
|
|
Certification of
Principal Executive Officer Pursuant to Section 302 of the
Sarbanes-Oxley Act.
|
|
|
|
|
Certification of
Principal Financial and Accounting Officer Pursuant to Section 302
of the Sarbanes-Oxley Act.
|
|
|
|
|
Certification
Pursuant to Section 906 of the Sarbanes-Oxley Act.
|
|
|
|
101.INS
|
XBRL Instance Document.
|
|
|
|
|
101.SCH
|
XBRL Taxonomy Extension Schema Document.
|
|
|
|
|
101.CAL
|
XBRL Taxonomy Calculation Linkbase Document.
|
|
|
|
|
101.DEF
|
XBRL Taxonomy Extension Definition Document.
|
|
|
|
|
101.LAB
|
XBRL Taxonomy Label Linkbase Document.
|
|
|
|
|
101.PRE
|
XBRL Taxonomy Presentation Linkbase Document.
|
|
*
|
Filed
herewith.
|
|
†
|
Identifies exhibits
that consist of a management contract or compensatory plan or
arrangement.
|
|
+
|
Confidential
treatment has been requested for certain confidential portions of
this exhibit pursuant to Rule 406 under the Securities Act of 1933,
as amended, and Rule 24b-2 under the Securities Exchange Act of
1934, as amended (together, the “Rules”). In accordance
with the Rules, these confidential portions have been omitted from
this exhibit and filed separately with the Securities and Exchange
Commission.
|
|
++
|
Certain portions of
this exhibit (indicated by “[*****]”) have been omitted
as the Company has determined (i) the omitted information is not
material and (ii) the omitted information would likely cause harm
to the Company if publicly disclosed.
|
INDEX TO FINANCIAL STATEMENTS
SUPER LEAGUE GAMING, INC.
|
|
|
|
|
|
|
Page
|
|
|
|
|
|
Report
of Independent Registered Public Accounting Firm
|
|
F-2
|
|
|
|
|
|
Financial Statements for the Years Ended December 31, 2019 and
2018
|
|
|
|
|
|
|
|
Balance
Sheets as of December 31, 2019 and 2018
|
|
F-3
|
|
Statements
of Operations for the years ended December 31, 2019 and
2018
|
|
F-4
|
|
Statements
of Stockholders’ Equity (Deficit) for the years ended
December 31, 2019 and 2018
|
|
F-5
|
|
Statements
of Cash Flows for the years ended December 31, 2019 and
2018
|
|
F-6
|
|
Notes
to Financial Statements
|
|
F-7
|
|
|
|
|
REPORT OF INDEPENDENT REGISTERED PUBLIC ACCOUNTING
FIRM
To the
Stockholders and Board of Directors
Super
League Gaming, Inc.
Opinion on the Financial Statements
We have
audited the accompanying balance sheets of Super League Gaming,
Inc. (the “Company”) as of December 31, 2019 and 2018,
the related statements of operations, stockholders’ equity
and cash flows for the years then ended, and the related notes to
the financial statements (collectively, the financial statements).
In our opinion, the financial statements present fairly, in all
material respects, the financial position of the Company as of
December 31, 2019 and 2018, and the results of its operations and
its cash flows for the years then ended, in conformity with
accounting principles generally accepted in the United States of
America.
Other Matter
The
accompanying financial statements have been prepared assuming that
the Company will continue as a going concern. As discussed in Note
2 to the financial statements, the Company has suffered recurring
losses from operations, has negative operating cash flows, and has
a significant accumulated deficit that raise substantial doubt
about its ability to continue as a going concern.
Management’s plans regarding those matters are also described
in Note 2. The financial statements do not include any adjustments
that might result from the outcome of this
uncertainty.
Basis for Opinion
These
financial statements are the responsibility of the Company’s
management. Our responsibility is to express an opinion on the
Company’s financial statements based on our audits. We are a
public accounting firm registered with the Public Company
Accounting Oversight Board (United States) ("PCAOB") and are
required to be independent with respect to the Company in
accordance with U.S. federal securities laws and the applicable
rules and regulations of the Securities and Exchange Commission and
the PCAOB.
We
conducted our audits in accordance with the standards of the PCAOB.
Those standards require that we plan and perform the audits to
obtain reasonable assurance about whether the financial statements
are free of material misstatement, whether due to error or fraud.
The Company is not required to have, nor were we engaged to
perform, an audit of its internal control over financial reporting.
As part of our audits, we are required to obtain an understanding
of internal control over financial reporting but not for the
purpose of expressing an opinion on the effectiveness of the
Company’s internal control over financial reporting.
Accordingly, we express no such opinion.
Our
audits included performing procedures to assess the risks of
material misstatement of the financial statements, whether due to
error or fraud, and performing procedures that respond to those
risks. Such procedures included examining, on a test basis,
evidence regarding the amounts and disclosures in the financial
statements. Our audits also included evaluating the accounting
principles used and significant estimates made by management, as
well as evaluating the overall presentation of the financial
statements. We believe that our audits provide a reasonable basis
for our opinion.
/s/
Squar Milner LLP
We have
served as the Company’s auditor since 2016.
Irvine,
California
March
20, 2020
SUPER LEAGUE GAMING, INC.
BALANCE SHEETS
DECEMBER 31, 2019 AND 2018
|
|
2019
|
2018
|
|
ASSETS
|
|
|
|
Current
Assets
|
|
|
|
Cash and cash
equivalents
|
$
8,442,000
|
$
2,774,000
|
|
Accounts
receivable
|
293,000
|
488,000
|
|
Prepaid expenses
and other current assets
|
924,000
|
487,000
|
|
Total current
assets
|
9,659,000
|
3,749,000
|
|
Property and
Equipment, net
|
239,000
|
531,000
|
|
Intangible and
Other Assets, net
|
1,984,000
|
707,000
|
|
Goodwill
|
2,565,000
|
-
|
|
Total
assets
|
$
14,447,000
|
$
4,987,000
|
|
|
|
|
|
LIABILITIES
AND STOCKHOLDERS’ EQUITY (DEFICIT)
|
|
|
|
|
|
|
|
Current
Liabilities
|
|
|
|
Accounts payable
and accrued expenses
|
$
853,000
|
$
813,000
|
|
Deferred
revenue
|
151,000
|
45,000
|
|
Convertible
debt and accrued interest, net
|
-
|
10,923,000
|
|
Total current
liabilities
|
1,004,000
|
11,781,000
|
|
|
|
|
|
Commitments and
Contingencies (Note 10)
|
|
|
|
|
|
|
|
Stockholders’
Equity (Deficit)
|
|
|
|
Preferred stock,
par value $0.001 per share; 10,000,000 shares authorized; no shares
issued or outstanding
|
-
|
-
|
|
Common stock, par
value $0.001 per share; 100,000,000 shares authorized; 8,573,922
and 4,610,109 shares issued and outstanding as of December 31, 2019
and 2018, respectively.
|
18,000
|
14,000
|
|
Additional paid-in
capital
|
99,237,000
|
48,325,000
|
|
Accumulated
deficit
|
(85,812,000
)
|
(55,133,000
)
|
|
Total
stockholders’ equity (deficit)
|
13,443,000
|
(6,794,000
)
|
|
|
|
|
|
Total liabilities
and stockholders’ equity
|
$
14,447,000
|
$
4,987,000
|
The accompanying notes are an integral part of these financial
statements.
SUPER LEAGUE GAMING, INC.
STATEMENTS OF OPERATIONS
FOR THE YEARS ENDED DECEMBER 31, 2019 AND 2018
|
|
2019
|
2018
|
|
|
|
|
|
REVENUES
|
$
1,084,000
|
$
1,046,000
|
|
|
|
|
|
COST
OF REVENUES
|
513,000
|
684,000
|
|
|
|
|
|
GROSS
PROFIT
|
571,000
|
362,000
|
|
|
|
|
|
OPERATING
EXPENSES
|
|
|
|
Selling, marketing
and advertising
|
4,488,000
|
4,319,000
|
|
Technology platform
and infrastructure
|
4,520,000
|
4,183,000
|
|
General and
administrative
|
12,333,000
|
8,020,000
|
|
Total operating
expenses
|
21,341,000
|
16,522,000
|
|
|
|
|
|
NET
OPERATING LOSS
|
(20,770,000
)
|
(16,160,000
)
|
|
|
|
|
|
OTHER
INCOME (EXPENSE)
|
|
|
|
Interest
expense
|
(9,938,000
)
|
(4,469,000
)
|
|
Other
|
29,000
|
2,000
|
|
Total
other income (expense)
|
(9,909,000
)
|
(4,467,000
)
|
|
|
|
|
|
NET
LOSS
|
$
(30,679,000
)
|
$
(20,627,000
)
|
|
|
|
|
|
Net
loss attributable to common stockholders - basic and
diluted
|
|
|
|
Basic and diluted
loss per common share
|
$
(3.89
)
|
$
(4.48
)
|
|
Weighted-average
number of shares outstanding, basic and diluted
|
7,894,326
|
4,606,961
|
The accompanying notes are an integral part of these financial
statements.
SUPER LEAGUE GAMING, INC.
STATEMENTS OF STOCKHOLDERS’ EQUITY(DEFICIT)
FOR THE YEARS ENDED DECEMBER 31,
2019 AND 2018
|
|
2019
|
2018
|
|
Common stock (Shares)
|
|
|
|
Balance,
beginning of period
|
4,610,109
|
4,603,443
|
|
Initial
public offering of common stock, net of issuance costs (Note
7)
|
2,272,727
|
-
|
|
Automatic
conversion of convertible debt to common stock (Note
6)
|
1,475,164
|
-
|
|
Common
stock issued for Framerate Acquisition
|
134,422
|
-
|
|
Stock-based
compensation
|
14,833
|
6,666
|
|
Warrant
Exercises
|
66,667
|
-
|
|
Balance, end of period
|
8,573,922
|
4,610,109
|
|
|
|
|
|
Common stock (Amount):
|
|
|
|
Balance,
beginning of period
|
$
14,000
|
$
14,000
|
|
Initial
public offering of common stock, net of issuance costs (Note
7)
|
2,000
|
-
|
|
Automatic
conversion of convertible debt to common stock (Note
6)
|
2,000
|
-
|
|
Common
stock issued for Framerate Acquisition
|
-
|
-
|
|
Balance, end of period
|
$
18,000
|
$
14,000
|
|
|
|
|
|
Additional paid-in-capital:
|
|
|
|
Balance,
beginning of period
|
$
48,325,000
|
$
38,191,000
|
|
Initial
public offering of common stock, net of issuance costs (Note
7)
|
22,456,000
|
-
|
|
Automatic
conversion of convertible debt to common stock (Note
6)
|
13,791,000
|
-
|
|
Issuance
of warrants with convertible notes (Note 6)
|
-
|
6,156,000
|
|
Beneficial
conversion feature (Note 6)
|
7,067,000
|
-
|
|
Common
stock issued for Framerate Acquisition (Note 5)
|
1,000,000
|
-
|
|
Framerate
Earn-Out (Note 5)
|
454,000
|
-
|
|
Stock-based
compensation
|
6,124,000
|
3,978,000
|
|
Warrant
exercises
|
20,000
|
-
|
|
Balance, end of period
|
$
99,237,000
|
$
48,325,000
|
|
|
|
|
|
Accumulated Deficit:
|
|
|
|
Balance,
beginning of period
|
$
(55,133,000
)
|
$
(34,506,000
)
|
|
Net
loss
|
(30,679,000
)
|
(20,627,000
)
|
|
Balance,
end of period
|
(85,812,000
)
|
(55,133,000
)
|
|
Total stockholders’ equity (deficit)
|
$
13,443,000
|
$
(6,794,000
)
|
The accompanying notes are an integral part of these financial
statements.
SUPER LEAGUE GAMING, INC.
STATEMENTS OF CASH FLOWS
FOR THE YEARS ENDED DECEMBER 31, 2019 AND 2018
|
|
2019
|
2018
|
|
|
|
|
|
CASH
FLOWS FROM OPERATING ACTIVITIES
|
|
|
|
Net
loss
|
$
(30,679,000
)
|
$
(20,627,000
)
|
|
Adjustments to
reconcile net loss to net cash used in operating
activities:
|
|
|
|
Depreciation and
amortization
|
862,000
|
1,106,000
|
|
Stock-based
compensation
|
6,217,000
|
3,942,000
|
|
Amortization of
discount on convertible notes (Note 6)
|
2,684,000
|
-
|
|
Beneficial
conversion feature (Note 6)
|
7,067,000
|
3,863,000
|
|
In-kind
contribution of services
|
-
|
667,000
|
|
Changes in assets
and liabilities:
|
|
|
|
Accounts
receivable
|
199,000
|
(374,000
)
|
|
Prepaid expenses
and other current assets
|
(329,000
)
|
(340,000
)
|
|
Accounts payable
and accrued expenses
|
40,000
|
432,000
|
|
Deferred
revenue
|
106,000
|
45,000
|
|
Accrued interest on
convertible notes
|
187,000
|
606,000
|
|
Net
cash used in operating activities
|
(13,646,000
)
|
(10,680,000
)
|
|
|
|
|
|
CASH
FLOWS FROM INVESTING ACTIVITIES
|
|
|
|
Framerate
acquisition
|
(1,506,000
)
|
-
|
|
Purchase of
property and equipment
|
(73,000
)
|
(255,000
)
|
|
Capitalization of
software development costs
|
(1,079,000
)
|
(519,000
)
|
|
Acquisition of
other intangible and other assets
|
(506,000
)
|
(92,000
)
|
|
Net
cash used in investing activities
|
(3,164,000
)
|
(866,000
)
|
|
|
|
|
|
CASH
FLOWS FROM FINANCING ACTIVITIES
|
|
|
|
Proceeds from
issuance of common stock, net of issuance costs
|
22,458,000
|
-
|
|
Proceeds from
convertible note payable, net of issuance costs
|
-
|
12,611,000
|
|
Proceeds from
warrant exercise
|
20,000
|
-
|
|
Net
cash provided by financing activities
|
22,478,000
|
12,611,000
|
|
|
|
|
|
INCREASE
IN CASH AND CASH EQUIVALENTS
|
5,668,000
|
1,065,000
|
|
|
|
|
|
CASH AND CASH EQUIVALENTS –
beginning of year
|
2,774,000
|
1,709,000
|
|
|
|
|
|
CASH
AND
CASH EQUIVALENTS
– end of year
|
$
8,442,000
|
$
2,774,000
|
|
|
|
|
|
SUPPLEMENTAL NONCASH FINANCING ACTIVITIES
|
|
|
|
Automatic
conversion of convertible debt to common stock (Note
6)
|
$
13,793,000
|
$
3,000,000
|
|
Issuance
of common stock for Framerate Acquisition (Note 5)
|
$
1,000,000
|
$
-
|
|
Common
stock purchase warrants – discount on convertible
debt
|
$
-
|
$
5,207,000
|
|
Common
stock issued for prepaid services
|
$
18,000
|
$
72,000
|
The accompanying notes are an integral part of these financial
statements.
SUPER LEAGUE GAMING, INC.
NOTES TO FINANCIAL STATEMENTS
|
1.
|
DESCRIPTION OF BUSINESS
|
Super League Gaming, Inc. (“Super League,” the
“Company,” “we” or
“our”) is a global leader in the mission to
bring live and digital esports entertainment and experiences
directly to everyday competitive gamers around the world. Utilizing
our proprietary technology platform, Super League operates physical
and digital experiences in partnership with publishers of top-tier
game titles and owners/operators of a distributed footprint of
venues, a network of digital social and viewing channels, and an
association/organization of city-based amateur gaming clubs and
teams. In addition to providing premium experiences by operating
city-vs-city amateur esports leagues and producing thousands of
social gaming experiences across North America and our
ever-expanding international footprint, the Super League
Network features multiple forms of content celebrating the
love of play via social media, live streaming and video-on-demand,
along with continuous gameplay and leaderboards. Inside our network
is Framerate, a large independent social video esports network
powered by user-generated highlight reels, and our exclusive
proprietary platform Minehut, providing a social and gameplay
forum for the avid Minecraft community. Through our partnerships
with high-profile venue owners such as Wanda Theatres in China, and
Topgolf and Cinemark Theatres in North America, along with
ggCircuit,
an
esports services
company that provides gaming center management software solutions
and access to a global network of gaming centers,
Super League is committed
to supporting the development of local, grassroots player
communities, while providing a global, scalable infrastructure for
esports competition and engagement. We address not only a wide
range of gamers across game titles, ages and skill levels, but also
a wide range of content-capture beyond just gameplay. This
positions Super League as more than a tournament operator; we are a
lifestyle and media company focused on capturing, generating,
aggregating and distributing content across the genre of all things
esports.
Super
League was incorporated on October 1, 2014 as Nth Games, Inc. under
the laws of the State of Delaware and changed its name to Super
League Gaming, Inc. on June 15, 2015. We are an “emerging
growth company” as defined by the Jumpstart Our Business
Startups Act of 2012, as amended.
Initial Public Offering
On February 27, 2019, Super League completed its initial public
offering (“IPO”) of shares of its common stock,
pursuant to which an aggregate of 2,272,727 shares were offered and
sold at a public offering price of $11.00 per share, resulting in
net proceeds of $22,458,000 after deducting underwriting discounts,
commissions and offering costs of $2,542,000.
The principal purposes of the IPO were to obtain additional capital
to support our operations, to create a public market for our common
stock and to facilitate our future access to the public equity
markets. We have and continue to use the net proceeds received from
the IPO for working capital and general corporate purposes,
including sales and marketing activities, product development and
capital expenditures. We have and may continue to use a portion of
the net proceeds for the strategic acquisition of, or investment
in, technologies, solutions or businesses that may complement our
business and or accelerate our growth. The amounts and timing of
our actual expenditures, including expenditure related to sales and
marketing and product development will depend on numerous factors,
including the status of our product development efforts, our sales
and marketing activities, expansion internationally, the amount of
cash generated or used by our operations, competitive pressures and
other factors.
Concurrent with the closing of the IPO on February 27, 2019 (the
“IPO Closing Date”), in accordance with the related
agreements,
all outstanding principal and interest of the
9.00% convertible notes outstanding, totaling $13,793,000, was
automatically converted into 1,475,164 shares of the
Company’s common stock at a conversion price of
$9.35.
|
2.
|
SUMMARY OF SIGNIFICANT ACCOUNTING POLICIES
|
Basis of Presentation
The
financial statements and accompanying notes have been prepared in
accordance with accounting principles generally accepted in the
United States of America (“U.S. GAAP”).
Use of Estimates
The
preparation of financial statements in conformity with U.S. GAAP
requires management to make estimates and assumptions that affect
the reported amounts of assets and liabilities and disclosure of
contingent assets and liabilities at the date of the financial
statements and the reported amounts of revenues and expenses during
the reporting period. Actual results could differ from these
estimates. The Company believes that, of the significant accounting
policies described herein, the accounting policies associated with
revenue recognition, the valuation of convertible notes and related
common stock purchase warrants (hereinafter,
“warrants”) discussed at Note 6, stock-based
compensation expense, accounting for business combinations as
discussed at Note 5, income taxes and valuation allowances against
net deferred tax assets, require its most difficult, subjective or
complex judgments.
Going Concern
The accompanying financial statements have been prepared assuming
the Company will continue as a going concern, which contemplates
the realization of assets and satisfaction of liabilities in the
normal course of business. As presented in the financial
statements, the Company incurred net losses of $30.7 million and
$20.6 million during the years ended December 31, 2019 and 2018,
respectively, and had an accumulated deficit of $85.8 million as of
December 31, 2019. Noncash expenses (excluding depreciation and
amortization of fixed and intangible assets, respectively) included
in net loss, primarily comprised of noncash interest charges and
stock-based compensation, totaled $16.2 million and $8.4 million
for the years ended December 31, 2019 and 2018, respectively. Net
cash used in operating activities totaled $13.6 million and $10.7
million, for the years ended December 31, 2019 and 2018,
respectively.
As of December 31, 2019, the Company had cash and cash equivalents
of approximately $8.4 million. The Company has used and will
continue to use significant capital for the growth and development
of its business. The Company’s management expects operating
losses to continue in the near term in connection with the pursuit
of its strategic objectives. As such, management believes its
current cash position, absent receipt of additional capital either
from operations or that may be available from future issuance(s) of
common stock or debt financings, is not sufficient to fund our
planned operations for the twelve months following the issuance of
these financial statements. As a result, our current financial
condition raises substantial doubt about our ability to continue as
a going concern.
We are focused on expanding our service offerings and revenue
growth opportunities through internal development, collaborations,
and through one or more strategic acquisitions. Management is
currently exploring several alternatives for raising capital to
facilitate our growth and execute our business strategy, including
strategic partnerships or other forms of equity or debt
financings.
The Company considers historical operating results, capital
resources and financial position, in combination with current
projections and estimates, as part of its plan to fund operations
over a reasonable period. Management's considerations assume, among
other things, that the Company will continue to be successful
implementing its business strategy, that there will be no material
adverse developments in the business, liquidity or capital
requirements and, if necessary, the Company will be able to raise
additional equity or debt financing on acceptable terms. If one or
more of these factors do not occur as expected, it could cause a
reduction or delay of its business activities, sales of material
assets, default on its obligations, or forced insolvency. The
accompanying financial statements do not contain any adjustments
which might be necessary if the Company were unable to continue as
a going concern. No assurance can be given that any future
financing will be available or, if available, that it will be on
terms that are satisfactory to the Company.
Revenue Recognition
Revenue is recognized when the Company transfers promised goods or
services to customers in an amount that reflects the consideration
to which the company expects to be entitled in exchange for those
goods and services. In this regard, revenue is recognized when: (i)
the parties to the contract have approved the contract (in writing,
orally, or in accordance with other customary business practices)
and are committed to perform their respective obligations; (ii) the
entity can identify each party’s rights regarding the goods
or services to be transferred; (iii) the entity can identify the
payment terms for the goods or services to be transferred; (iv) the
contract has commercial substance (that is, the risk, timing, or
amount of the entity’s future cash flows is expected to
change as a result of the contract);and (v) it is probable that the
entity will collect substantially all of the consideration to which
it will be entitled in exchange for the goods or services that will
be transferred to the customer.
Super League generates revenues and related cash flows from (i)
brand and media sponsorships, (ii) Platform-As-A-Service
arrangements, (iii)
advertising and third-party content
and (iv) direct to consumer offers
including tournament fees for participation in our physical and
online multiplayer gaming experiences, digital subscriptions and
merchandise sales.
Sponsorships and
Advertising
Brand and Media Sponsorships.
The Company generates brand and media
sponsorship revenues primarily from sales of various forms of
sponsorships and promotional campaigns for its online platforms and
from sponsorship at its in-person esports experiences. Brand and
media sponsorship revenue arrangements may include: exclusive or
non-exclusive title sponsorships, marketing benefits, official
product status exclusivity, product visibly and additional
infrastructure placement, social media rights (including rights to
create and post social content and clips), rights to on-screen
activations and promotions, display material rights, media rights,
hospitality and tickets and merchandising rights. Brand and media
sponsorship arrangements typically include contract terms for time
periods ranging from several weeks to multi-year
arrangements.
For
brand and media sponsorship arrangements that include performance
obligations satisfied over time, customers typically simultaneously
receive and consume the benefits under the agreement as the Company
satisfies its performance obligations, over the applicable contract
term. As such, revenue is recognized over the contract term based
upon estimates of progress toward complete satisfaction of the
contract performance obligations (typically utilizing a time,
effort or delivery-based method of estimation).
Payments are typically due from customers during
the term of the arrangement.
Platform-As-A-Service.
The
Company generates Platform-as-a-Service (“PaaS”)
revenues pursuant to arrangements with brand and media partners,
retail venues, game publishers and broadcasters that allow its
partners to run amateur esports experiences, and or capture
specifically curated gameplay content that is customized for its
partners’ distribution channels, leveraging the flexibility
of, and powered by the Super League gaming and content technology
platform.
Revenue for PaaS arrangements for one-off branded experiences
and/or the development of content tailored specifically for the
Company’s partners’ distribution channels that provide
for a contractual delivery or performance date, is recognized when
performance is substantially complete and or delivery occurs.
Revenue for PaaS arrangements
that include performance
obligations satisfied over time whereby customers simultaneously
receive and consume the benefits under the agreement as the Company
satisfies its performance obligations over the applicable contract
term, is recognized over the contract term based upon estimates of
progress toward complete satisfaction of the contract performance
obligations (typically utilizing a time, effort or delivery-based
method of estimation).
Payments are
typically due from customers during the term of the
arrangement.
Advertising and Third-Party Content Revenue
. We generate
content through digital and physical experiences that offer
opportunities for generating advertising revenue on our proprietary
digital channels. In addition, we license our content to third
parties seeking esports content for their own distribution
channels.
For
advertising and third-party content arrangements that include
performance obligations satisfied over time, customers typically
simultaneously receive and consume the benefits under the
arrangement as we satisfy our performance obligations, over the
applicable contract term. As such, revenue is recognized over the
contract term based upon estimates of progress toward complete
satisfaction of the contract performance obligations (typically
utilizing a time, effort or delivery-based method of estimation).
Payments are typically due from
customers during the term of the arrangement for longer-term
campaigns, and once delivery is complete for shorter-term
campaigns.
Direct to
Consumer
Direct to consumer revenues include tournament fees, digital
subscriptions and merchandise. Direct to consumer revenues have
primarily consisted of the sale of season passes to gamers for
participation in Super League’s in-person and or online
multiplayer gaming experiences. For the applicable periods
presented herein, season passes for gaming experiences were
primarily comprised of multi-week packages and one-time, single
experience admissions. For the year ended December 31, 2019,
digital subscription revenues included revenues related to the
Company’s Minehut asset acquisition in June 2018, which
provides various Minecraft server hosting services on a
subscription basis to the Minecraft gaming community, and Super
League Prime subscription offer which was launched in beta in the
fourth quarter of 2019.
Revenue from single experiences is recognized when the experience
occurs. Revenue from multi-week packages is recognized over time as
the multi-week experiences occur based on estimates of the progress
toward complete satisfaction of the applicable offer and related
performance obligations. Subscription revenue is recognized over
the applicable subscription term. Payments are typically due from
customers at the point of sale.
Revenue
billed or collected in advance is recorded as deferred revenue
until the event occurs or until applicable performance obligations
are satisfied as described above.
Revenue
was comprised of the following for the periods
presented:
|
|
2019
|
2018
|
|
Brand and Media
Sponsorships
|
$
451,000
|
$
549,000
|
|
Platform-as-a-service
|
532,000
|
291,000
|
|
Advertising and
content sales
|
68,000
|
69,000
|
|
Direct to
Consumer
|
33,000
|
137,000
|
|
|
$
1,084,000
|
$
1,046,000
|
For the
years ended December 31, 2019 and 2018, 33% and 39% of revenues
were recognized at a single point in time, and 67% and 61% of
revenues were recognized over time, respectively.
Cost of Revenues
Cost of
sales includes direct costs incurred in connection with the
production of Super League’s in-person and online gaming
events, including venue rental, venue entertainment, licenses,
direct marketing, prizing, talent and contract
services.
Advertising
Gaming
experience and Super League brand related advertising costs include
the cost of ad production, social media, print media, marketing,
promotions, and merchandising. The Company expenses advertising
costs as incurred. Advertising expenses for the years ended
December 31, 2019 and 2018 were $409,000 and $614,000,
respectively, and are included in selling, marketing and
advertising expenses in the accompanying statements of
operations.
Technology Platform and Infrastructure Costs
Technology
platform and infrastructure costs include (i) allocated personnel
costs, including salaries, noncash stock compensation, taxes and
benefits related to our internal software developers and engineers,
employed by Super League, engaged in the operation, maintenance,
management, administration, testing and enhancement of our
proprietary gaming and content technology platform, (ii)
third-party contract software development and engineering resources
engaged in developing and enhancing our proprietary gaming and
content technology platform (iii) the amortization of capitalized
internal use software costs, and (iv) technology platform related
cloud services and broadband costs.
Cash and Cash Equivalents
Super
League considers all highly liquid, short-term investments with
original maturities of three months or less when purchased to be
cash equivalents. As of December 31, 2019, the Company’s cash
equivalents consisted of investments in AAA rated money market
funds. As of December 31, 2018, the Company did not have any cash
equivalents.
Accounts Receivable
Accounts
receivable are recorded at the original invoice amount, less an
estimate made for doubtful accounts, if any. The Company provides
an allowance for doubtful accounts for potential credit losses
based on its evaluation of the collectability and the
customers’ creditworthiness. Accounts receivable are written
off when they are determined to be uncollectible. As of December
31, 2019 and 2018, no allowance for doubtful accounts was
considered necessary.
Fair Value Measurements
Fair value is defined as the exchange price that would be received
from selling an asset or paid to transfer a liability in the
principal or most advantageous market for the asset or liability in
an orderly transaction between market participants on the
measurement date. The Company measures financial assets and
liabilities at fair value at each reporting period using a fair
value hierarchy which requires the Company to maximize the use of
observable inputs and minimize the use of unobservable inputs when
measuring fair value. A financial instrument’s classification
within the fair value hierarchy is based upon the lowest level of
input that is significant to the fair value measurement. Three
levels of inputs may be used to measure fair value:
Level 1.
Quoted prices in active markets for identical
assets or liabilities.
Level 2
. Quoted prices for similar assets and
liabilities in active markets or inputs other than quoted prices
which are observable for the assets or liabilities, either directly
or indirectly through market corroboration, for substantially the
full term of the financial instruments.
Level 3.
Unobservable inputs which are
supported by little or no market activity and which are significant
to the fair value of the assets or liabilities.
The Company does not have any instruments that are measured at fair
value on a recurring basis. However, the Company measured certain
acquired intangible assets and the Earn-Out using Level 3 inputs on
a nonrecurring basis.
Concentration of Credit Risks
The
Company maintains its cash on deposit with a bank that is insured
by the Federal Deposit Insurance Corporation. At various times, the
Company maintained balances in excess of insured amounts. The
Company has not experienced any significant losses on its cash held
in banks.
Deferred Equity Financing Costs
Specific
incremental costs directly attributable to a proposed or actual
offering of securities or debt are deferred and charged against the
gross proceeds of the financing. In the event that the proposed or
actual financing is not completed, or is deemed not likely to be
completed, such costs are expensed in the period that such
determination is made. Deferred costs related to proposed offerings
of securities totaled $0 and $154,354 at December 31, 2019 and
2018, respectively. Deferred financing costs, if any, are included
in other current assets in the accompanying balance sheet. Total
financing costs charged against gross proceeds in connection with
the close of the Company’s IPO totaled $517,000.
Property and Equipment
Property
and equipment are recorded at cost. Major additions and
improvements that materially extend useful lives of property and
equipment are capitalized. Maintenance and repairs are charged
against the results of operations as incurred. When these assets
are sold or otherwise disposed of, the asset and related
depreciation are relieved, and any gain or loss is included in the
statements of operations for the period of sale or disposal.
Depreciation and amortization are computed on a straight-line basis
over the estimated useful lives of the assets, typically over a
three to five-year period.
Intangible Assets
Intangible
assets primarily consist of (i) internal-use software development
costs, (ii) domain name, copyright and patent registration costs,
(iii) commercial licenses and branding rights and (iv) other
intangible assets, which are recorded at cost and amortized using
the straight-line method over the estimated useful lives of the
assets, ranging from three to 10 years.
Software
development costs incurred to develop internal-use software during
the application development stage are capitalized and amortized on
a straight-line basis over the software’s estimated useful
life, which is generally three years. Software development costs
incurred during the preliminary stages of development are charged
to expense as incurred. Maintenance and training costs are charged
to expense as incurred. Upgrades or enhancements to existing
internal-use software that result in additional functionality are
capitalized and amortized on a straight-line basis over the
applicable estimated useful life.
Goodwill
Goodwill
represents the excess of the purchase price of the acquired
business over the acquisition date fair value of the net assets
acquired. Goodwill is tested for impairment at the reporting unit
level (operating segment or one level below an operating segment)
on an annual basis (December 31) and between annual tests if an
event occurs or circumstances change that would more likely than
not reduce the fair value of a reporting unit below its carrying
value. The Company considers its market capitalization and the
carrying value of its assets and liabilities, including goodwill,
when performing its goodwill impairment test. When conducting its
annual goodwill impairment assessment, the Company initially
performs a qualitative evaluation of whether it is more likely than
not that goodwill is impaired. If it is determined by a qualitative
evaluation that it is more likely than not that goodwill is
impaired, the Company then applies a two-step impairment test. The
two-step impairment test first compares the fair value of the
Company’s reporting unit to its carrying or book value. If
the fair value of the reporting unit exceeds its carrying value,
goodwill is not impaired, and the Company is not required to
perform further testing. If the carrying value of the reporting
unit exceeds its fair value, the Company determines the implied
fair value of the reporting unit’s goodwill and if the
carrying value of the reporting unit’s goodwill exceeds its
implied fair value, then an impairment loss equal to the difference
is recorded in the statement of operations. The Company operates in
one reporting segment.
Impairment of Long-Lived Assets
The
Company assesses the recoverability of long-lived assets whenever
events or changes in circumstances indicate that their carrying
value may not be recoverable. If the cost basis of a long-lived
asset is greater than the projected future undiscounted net cash
flows from such asset, an impairment loss is recognized. Impairment
losses are calculated as the difference between the cost basis of
an asset and its estimated fair value. Management believes that
there was no impairment of long-lived assets for the periods
presented herein. There can be no assurance, however, that market
conditions or demand for the Company’s products or services
will not change, which could result in long-lived asset impairment
charges in the future.
Stock-Based Compensation
Compensation
expense for stock-based awards is measured at the grant date, based
on the estimated fair value of the award, and is recognized as an
expense, typically on a straight-line basis over the
employee’s requisite service period (generally the vesting
period of the equity award) which is generally two to four years.
Compensation expense for awards with
performance conditions that affect vesting is recorded only for
those awards expected to vest or when the performance criteria are
met.
The fair value of restricted stock and restricted stock
unit awards is determined by the product of the number of shares or
units granted and the grant date market price of the underlying
common stock. The fair value of stock option and common stock
purchase warrant awards is estimated on the date of grant utilizing
the Black-Scholes-Merton option pricing model. The Company utilizes
the simplified method for estimating the expected term for options
granted to employees due to the lack of available or sufficient
historical exercise data for the Company for the applicable options
terms. The Company accounts for forfeitures of awards as they
occur.
Grants
of equity-based awards (including warrants) to non-employees in
exchange for consulting or other services are accounted for using
the fair value of the consideration received (i.e., the value of
the goods or services) or the fair value of the equity instruments
issued, whichever is more reliably measurable.
Risks and Uncertainties
Concentrations
.
The Company had
certain customers whose revenue individually represented 10% or
more of the Company’s total revenue, or whose accounts
receivable balances individually represented 10% or more of the
Company’s total accounts receivable, and vendors whose
accounts payable balances individually represented 10% or more of
the Company’s total accounts payable, as
follows:
For the years ended December 31, 2019 and 2018, 5 customers
accounted for 69% and four customers accounted for 82% of revenue,
respectively.
At
December 31, 2019, one customer accounted for 70% of accounts
receivable. At December 31, 2018, three customers accounted
for 96% of accounts receivable. At December 31, 2019, one vendor
accounted for 21% of accounts payable. At December 31,
2018, three vendors accounted for 43% of accounts
payable.
Segment Information
The
Company operates in one segment.
Earnings (Loss) Per Share
Basic
earnings (loss) per share is computed by dividing the income or
loss by the weighted-average number of outstanding shares of common
stock for the applicable period. Diluted earnings per share is
computed by dividing the income or loss by the weighted-average
number of outstanding shares of common stock for the applicable
period, including the dilutive effect of common stock equivalents.
Potentially dilutive common stock equivalents primarily consist of
employee stock options, warrants issued to employees and
non-employees in exchange for services and warrants issued in
connection with financings. All outstanding stock options,
restricted stock units and warrants, totaling 4,096,000 and
4,117,000 at December 31, 2019 and 2018, respectively, have been
excluded from the computation of diluted loss per share because the
effect of inclusion would have been anti-dilutive.
Income Taxes
Income
taxes are accounted for using an asset and liability approach that
requires the recognition of deferred tax assets and liabilities for
the expected future tax consequences of events that have been
recognized in the Company’s financial statements or income
tax returns. A valuation allowance is established to reduce
deferred tax assets if all, or some portion, of such assets will
more than likely not be realized, or if it is determined that there
is uncertainty regarding future realization of such
assets.
Under
U.S. GAAP, a tax position is a position in a previously filed tax
return, or a position expected to be taken in a future tax filing
that is reflected in measuring current or deferred income tax
assets and liabilities. Tax positions are recognized only when it
is more likely than not, based on technical merits, that the
position will be sustained upon examination. Tax positions that
meet the more likely than not thresholds are measured using a
probability weighted approach as the largest amount of tax benefit
being realized upon settlement. The Company considers many factors
when evaluating and estimating its tax positions and tax benefits,
which may require periodic adjustments, and which may not
accurately forecast actual outcomes. Management believes the
Company has no uncertain tax positions for the years ended December
31, 2019 and 2018.
The
Company has elected to include interest and penalties related to
its tax contingences as a component of income tax expense. There
were no accruals for interest and penalties related to uncertain
tax positions for the periods presented. Income tax returns remain
open for examination by applicable authorities, generally three
years from filing for federal and four years for state. The Company
is not currently under examination by any taxing authority nor has
it been notified of an impending examination.
Recent Accounting Guidance
Recent Accounting Pronouncements - Recently Adopted.
In May 2014, the FASB issued a new accounting standard update
(“ASU”) addressing revenue from contracts with
customers, which clarifies existing accounting literature relating
to how and when a company recognizes revenue. Under the standard, a
company will recognize revenue when it transfers promised goods or
services to customers in an amount that reflects the consideration
to which the company expects to be entitled in exchange for those
goods and services. In doing so, the Company is required to use
more judgment and make more estimates in connection with the
accounting for revenue contracts with customers than under previous
guidance. Such areas may include: (i) identifying performance
obligations in the contract, (ii) estimating the timing of
satisfaction of performance obligations, (iii) determining whether
a promised good or service is distinct from other promised goods or
services, including whether the customer can benefit from the good
or service on its own and whether the promise to transfer a good or
service is separately identifiable from other promises in the
contract, (iv) evaluating whether performance obligations are
satisfied at a point in time or over time, (v) allocating the
transaction price to separate performance obligations, and (vi)
determining whether contracts contain a significant financing
component.
The Company used the modified retrospective method of adoption,
which would require the cumulative effect of initially applying the
new revenue standard as an adjustment to the opening balance of
retained earnings on January 1, 2019. Comparative prior year
periods would not be adjusted. The new accounting standard was
applied to all contracts at the date of initial application. There
was no cumulative effect of applying the new revenue standard to
contracts executed in prior periods. As such, the adoption of the
new accounting standard had no impact on the balance sheet and
statement of operations in the current or prior
periods.
Recent Accounting Pronouncements – Not Yet
Adopted.
In
January 2017, the FASB issued new guidance that eliminates Step 2
from the goodwill impairment test. Instead, if an entity forgoes a
Step 0 test, that entity will be required to perform its annual or
interim goodwill impairment test by comparing the fair value of a
reporting unit, as determined in Step 1 from the goodwill
impairment test, with its carrying amount and recognize an
impairment charge, if any, for the amount by which the carrying
amount exceeds the reporting unit’s fair value, not to exceed
the total amount of goodwill allocated to the reporting unit. The
new standard is effective for fiscal years beginning after
December 15, 2019, and should be applied prospectively. Early
adoption is permitted. The effect of adoption should be reflected
as of the beginning of the fiscal year of adoption. The Company
does not currently expect this new accounting guidance to have a
material impact on our financial statements upon
adoption.
In
February 2016, the FASB issued an ASU that requires lessees to
present right-of-use assets and lease liabilities on the balance
sheet. The new guidance is to be applied using a modified
retrospective approach at the beginning of the earliest comparative
periods in the financial statements and is effective for fiscal
years beginning after December 15, 2020 and early adoption is
permitted. The Company is evaluating the impact that this guidance
will have on its financial position, results of operations and
financial statement disclosures.
In June
2016, the FASB issued guidance on the measurement and recognition
of credit losses on most financial assets. For trade receivables,
loans, and held-to-maturity debt securities, the current probable
loss recognition methodology is being replaced by an expected
credit loss model. For available-for-sale debt securities, the
recognition model on credit losses is generally unchanged, except
the losses will be presented as an adjustable allowance. The
guidance will be applied retrospectively with the cumulative effect
recognized as of the date of adoption. The guidance will become
effective at the beginning of the Company’s first quarter of
the fiscal year ending December 31, 2021 but can be adopted as
early as the beginning of the first quarter of fiscal year ending
December 31, 2020. The Company is currently assessing the impact
that adopting this new accounting guidance will have on its
financial statements and footnote disclosures.
|
3.
|
PROPERTY AND EQUIPMENT
|
Property
and equipment consisted of the following at December 31, 2019 and
2018:
|
|
2019
|
2018
|
|
|
|
|
|
Furniture
and fixtures
|
$
334,000
|
$
207,000
|
|
Computer
hardware
|
3,141,000
|
3,195,000
|
|
|
3,475,000
|
3,402,000
|
|
Less:
accumulated depreciation and amortization
|
(3,236,000
)
|
(2,871,000
)
|
|
|
$
239,000
|
$
531,000
|
Depreciation
and amortization expense for property and equipment was $365,000
and $861,214 for the years ended December 31, 2019 and 2018,
respectively.
|
4.
|
INTANGIBLE AND OTHER ASSETS
|
Intangible
and other assets consisted of the following at December 31, 2019
and 2018:
|
|
2019
|
2018
|
|
|
|
|
|
Capitalized
software development costs
|
$
2,363,000
|
$
1,281,000
|
|
Licenses
|
340,000
|
-
|
|
Tradename
|
189,000
|
-
|
|
Domain
|
68,000
|
67,000
|
|
Copyrights and
other
|
289,000
|
127,000
|
|
|
3,249,000
|
1,475,000
|
|
Less:
accumulated amortization
|
(1,265,000
)
|
(768,000
)
|
|
|
$
1,984,000
|
$
707,000
|
Amortization
expense totaled $497,000 and $245,000 for the years ended December
31, 2019 and 2018, respectively.
Future
amortization expense of intangible and other assets is expected to
be as follows:
|
For the years
ending December 31:
|
|
|
2020
|
$
711,000
|
|
2021
|
643,000
|
|
2022
|
328,000
|
|
2023
|
149,000
|
|
2024
|
105,000
|
|
Thereafter
|
48,000
|
|
|
$
1,984,000
|
On September 23, 2019, the Company and ggCircuit,
LLC (“ggCircuit”), an
esports services company that provides gaming
center management software solutions and other esports
offerings,
entered into an
expanded commercial partnership agreement (the
“Expanded Agreement”) pursuant to
which
Super League became
the primary consumer-facing brand within
ggCircuit’s
B2B
gaming center
software
platform.
ggCircuit’s
software platform is a B2B platform and B2C application created and
owned by ggCircuit, which is licensed and distributed to owners and
operators of video gaming centers throughout the
world.
In consideration for the rights granted by ggCircuit to Super
League, Super League paid an upfront fee of $340,000 and will pay
quarterly fees over the term of the Agreement, commencing with the
first quarter of 2020, ranging from $0 to $150,000, based on
predetermined contractual revenue levels. Pursuant to the terms and
conditions of the Expanded Agreement, revenues generated in
connection with applicable activities under the Expanded Agreement
will be shared between Super League and ggCircuit based on
contractual revenue sharing percentages. The initial term of the
Expanded Agreement commences on October 1, 2019, the effective date
and concludes on the fifth anniversary of the effective date,
subject to certain automatic renewal provisions. The upfront fee is
included as "Licenses" in intangible assets and other assets, net,
in the accompanying balance sheet and will be amortized over the
initial term of the Expanded Agreement of five years, commencing
October 1, 2019.
|
5.
|
AQUISITION OF FRAMERATE, INC.
|
On June 3, 2019, Super League and SLG Merger Sub, Inc., a Delaware
corporation and wholly-owned subsidiary of the Company
(“Merger Sub”), entered into an agreement and plan of
merger (the “Merger Agreement”) with Framerate, Inc., a
Delaware corporation (“Framerate”), pursuant to which
Framerate merged with and into Merger Sub, with Merger Sub
continuing as the surviving corporation (the
“Acquisition”). The Acquisition was consummated on June
6, 2019 when the certificate of merger of Merger Sub and Framerate
was filed with the Secretary of State of the State of Delaware (the
“Effective Date”). As consideration for the
Acquisition, the Company ratably paid and/or issued to the former
shareholders of Framerate an aggregate of (i) $1.5 million paid in
cash and (ii) $1.0 million paid by the issuance of a total of
134,422 shares of the Company’s common stock, at a price per
share of $7.4395 (the “Closing Shares”). The Merger Sub
was dissolved subsequent to the consummation of the
Acquisition.
The Acquisition was approved by the board of directors of each of
the Company and Framerate, and was approved by the stockholders of
Framerate. Transaction costs incurred relating to this acquisition
were not material. The acquisition of Framerate expands the
Company’s digital programming footprint and enhances the
Company’s ability to provide value to its gaming and
spectator communities through multiple forms of
engagement.
In addition to the issuance of the Closing Shares, the Merger
Agreement provides for the issuance of up to an additional $980,000
worth of shares of the Company’s common stock at the same
price per share as the Closing Shares (the “Earn-Out
Shares”) in the event Framerate achieves certain
performance-based milestones during the two-year period following
the closing of the Acquisition, or June 6, 2021 (the
“Earn-Out”). One-half of the Earn-Out Shares will be
issuable on the one-year anniversary of the Effective Date, and the
remaining one-half will be issuable on the second anniversary of
the Effective Date. The fair value of the Earn-Out on the Effective
Date was estimated to be $454,000.
The Company has determined that the Acquisition constitutes a
business acquisition as defined by Accounting Standards
Codification (“ASC”) 805,
Business
Combinations
. Accordingly, the
assets acquired and liabilities assumed in the transaction were
recorded at their estimated acquisition date fair values, while
transaction costs associated with the acquisition were expensed as
incurred pursuant to the purchase method of accounting in
accordance with ASC 805. Super League’s preliminary
purchase price allocation was based on an evaluation of the
appropriate fair values and represents management’s best
estimate based on available data. Fair values are determined based
on the requirements of ASC 820,
Fair Value Measurements and
Disclosures
(“ASC
820”).
The Company hired the former Chief Executive of Framerate
(“Framerate Executive”), who was also a selling
shareholder of Framerate. Pursuant to the provisions of the
Earn-Out included in the Merger Agreement, in the event that the
Framerate Executive is terminated for cause or resigns from his
employment with the Company at any time on or before the second
anniversary of the Effective Date, and any such resignation is
without “Good Reason” as such term is defined in his
employment agreement, then the maximum amount of any portion of the
Earn-Out that has not yet been earned as of the date of resignation
shall be reduced by 44.0164%. Under ASC 805, a contingent
consideration arrangement in which the payments are automatically
forfeited if employment terminates is considered to be compensation
for post-combination services, and not acquisition consideration.
As such approximately 44% of the estimated fair value of the
Earn-Out, or $200,000, is accounted for as deferred compensation
expense and being amortized in the statement of operations over the
two-year period ending on the second anniversary of the Effective
date. Noncash compensation expense related to the portion of the
Earn-Out treated as compensation for the year ended December 31,
2019 was $58,000. The portion of the Earn-Out included as purchase
consideration was $254,000.
The
Earn-Out arrangement does not meet the liability classification
criteria outlined in ASC 480, “Distinguishing Liabilities
from Equity,” and is both (i) indexed to the Company’s
own shares and (ii) classified in shareholders’ equity in the
accompanying balance sheet. Equity-classified contingent
consideration is measured initially at fair value on the
acquisition date and is not remeasured subsequent to initial
recognition. As such, the initial value recognized for the Earn-Out
on the acquisition date is not adjusted for changes in the fair
value of the Earn-Out as of any future settlement date. Subsequent
differences between the estimated fair value of the Earn-Out
recorded at the acquisition date and the actual amount of Earn-Out
paid based on actual performance will be reflected as a charge or
credit, as applicable, in the statement of operations.
The following table summarizes the fair value of purchase price
consideration paid to acquire Framerate:
|
|
Amount
|
|
|
|
|
Cash
consideration at closing
|
$
1,515,000
|
|
Equity
consideration at closing
|
1,000,000
|
|
Fair value of
Earn-Out shares
|
254,000
|
|
Total
|
$
2,769,000
|
The preliminary purchase price allocation was based upon an
estimate of the fair value of the assets acquired and the
liabilities assumed by the Company in connection with the
acquisition of Framerate, as follows:
|
|
Amount
|
|
|
|
|
Accounts
receivable
|
$
15,000
|
|
Intangible assets -
trade name
|
189,000
|
|
Goodwill
|
2,565,000
|
|
Total
purchase price
|
$
2,769,000
|
The identifiable intangible asset acquired, totaling $189,000, was
comprised of Framerate’s trade name with an estimated useful
life of approximately five years, and is included in intangible and
other assets, net in the accompanying balance sheet. The trade name
intangible asset is being amortized over the estimated useful life
on a straight-line basis. Amortization expense for the year ended
December 31, 2019 was $22,000. Goodwill recognized primarily
reflects anticipated cost and growth synergies associated with the
combined operations.
Management is responsible for determining the fair value of the
identifiable intangible assets acquired as of the Effective Date.
Management considered a number of factors, including reference to
an analysis under ASC 805 solely for the purpose of allocating the
purchase price to the assets acquired.
The fair values of the acquired intangible asset,
as described above, was determined using the following
methods:
|
Description
|
|
Valuation Method
|
|
Valuation Method Description
|
|
Assumptions
|
|
Trade Name
|
|
Relief-from-Royalty method under the income approach
|
|
Under the Relief-from-Royalty method, the royalty savings is
calculated by estimating a reasonable royalty rate that a third
party would negotiate in a licensing agreement. Such royalties are
most commonly expressed as a percentage of total revenue involving
a trade name.
|
|
Useful life: 5 years; Royalty Rate: 05%; Discount Rate:
50%
|
|
|
|
|
|
|
|
|
|
Earn-Out
|
|
Scenario Based Model
|
|
The payoff structure was determined to be linear and the Earn-Out
is payable within two years. Revenue scenarios were estimated and a
probability for each scenario based on the likelihood of achieving
the forecasted revenues was estimated. The estimated payments from
the scenarios were then discounted based on the Company's credit
risk and the related risk-free rate. The value per share was then
adjusted for the time period through the payout date. The option
methodology employed was the Black-Scholes Option
Model.
|
|
Volatility: 75% - 100%; Term 1 -2 years; Risk Free Rate 2.21% -
1.95%;
|
The Acquisition was treated for tax purposes as a nontaxable
transaction and as such, the historical tax bases of the acquired
assets, net operating losses, and other tax attributes of Framerate
will carryover. As a result, no new goodwill for tax purposes was
be created in connection with the Acquisition as there is no
step-up to fair value of the underlying tax bases of the acquired
net assets.
The historical balance sheets and statements of operations of
Framerate were not material.
|
6.
|
CONVERTIBLE NOTE PAYABLE
|
In
February through April 2018, the Company issued 9.00% secured
convertible promissory notes with a collective face value of
$3,000,000 (the “Initial 2018 Notes”). The Initial 2018
Notes (i) accrued simple interest at the rate of 9.00% per annum,
(ii) matured on the earlier of December 31, 2018 or the close of a
$15,000,000 equity financing (“Qualifying Equity
Financing”) by the Company, and (iii) all outstanding
principal and accrued interest was automatically convertible into
equity or equity-linked securities sold in a Qualifying Equity
Financing based upon a conversion rate equal to (x) a 10% discount
to the price per share of a Qualifying Equity Financing, with (y) a
floor of $10.80 per share. In addition, the holders of the Initial
2018 Notes were collectively issued warrants to purchase
approximately 55,559 shares of common stock, at an exercise price
of $10.80 per share and a term of five years (the “Initial
2018 Warrants”).
In May
through August 2018, the Company issued additional 9.00% secured
convertible promissory notes with a collective face value of
$10,000,000 (the “Additional 2018 Notes”). In May 2018,
all of the Initial 2018 Notes and related accrued interest,
totaling $3,056,000, were converted into the Additional 2018 Notes,
resulting in an aggregate principal amount of $13,056,000
(hereinafter collectively, the “2018 Notes”). The
holders of the converted Initial 2018 Notes retained their
respective Initial 2018 Warrants.
The
2018 Notes (i) accrued simple interest at the rate of 9.00% per
annum, (ii) matured on the earlier of the closing of an initial
public offering of the Company’s common stock on a national
securities exchange or April 30, 2019, and (iii) all outstanding
principal and accrued interest was automatically convertible into
shares of common stock upon the closing of an IPO at the lesser of
(x) $10.80 per share or (y) a 15% discount to the price per share
of the IPO. In addition, the holders of the 2018 Notes were
collectively issued 1,396,420 warrants to purchase common stock
equal to 100% of the aggregate principal amount of the 2018 Notes
divided by $9.35 per share (the “2018 Warrants”). The
2018 Warrants are exercisable for a term of five years, commencing
on the close of an IPO, at an exercise price of $9.35 and are
callable at the election of the Company at any time following the
closing of an IPO. The 2018 Notes were secured by a security
interest in all of the assets, tangible and intangible, of the
Company.
The
proceeds from the sale of the 2018 Notes, the 2018 Warrants and the
Initial 2018 Warrants, were allocated to the instruments based on
the relative fair values of the convertible debt instrument without
the warrants and of the warrants themselves at the time of
issuance. The portion of the proceeds, totaling $5,933,000
allocated to the 2018 Warrants, was accounted for as a discount to
the debt, with the offsetting credit to additional paid-in capital.
The remainder of the proceeds were allocated to the convertible
debt instrument portion of the transaction. The resulting debt
discount is amortized over the period from issuance to April 30,
2019, the stated maturity date of the debt.
Debt
issuance costs were comprised of $389,000 of cash commissions and
warrants with a fair value of $223,000, paid and issued,
respectively, to third-parties in connection with the debt
financing, and are reflected as a discount to the debt instrument,
net of accumulated amortization, in the December 31, 2018 balance
sheet. Debt issuance costs are amortized over the term of the debt
as interest expense in the statement of operations.
Concurrent
with the closing of the IPO on February 27, 2019, all outstanding
principal and accrued interest outstanding under the 2018 Notes
totaling $13,793,000 was automatically converted into 1,475,164
shares of the Company’s common stock at a conversion price
per share of $9.35. As a result of the automatic conversion of the
2018 Notes and the application of conversion accounting, the
Company recorded an immediate charge to interest expense of
$1,384,000 for the year ended December 31, 2019, representing
the write-off of the unamortized balance of debt
discounts associated with the 2018 Warrants and cash commissions
and warrants issued to third parties. Unamortized debt discounts at
December 31, 2019 and 2018 totaled $0 and $2,684,000,
respectively.
The
non-detachable conversion feature embedded in the 2018 Notes
provides for a conversion rate that is below market value at the
commitment date, and therefore, represents a beneficial conversion
feature (“BCF”). The BCF is generally recognized
separately at issuance by allocating a portion of the debt proceeds
equal to the intrinsic value of the BCF to additional paid-in
capital. The resulting convertible debt discount is recognized as
interest expense using the effective yield method. The BCF is
measured using the commitment date stock price. However, the
conversion feature associated with the 2018 Notes was not
exercisable until the consummation of an initial public offering by
the Company of its common stock, and therefore, was not required to
be recognized in earnings until the IPO related contingency was
resolved, which occurred on the IPO Closing Date. The commitment
date is the IPO Closing Date and the commitment date stock price
was $11.00 per share. The intrinsic value of the BCF on the IPO
Closing Date, which was limited to the net proceeds allocated to
the debt on a relative fair value basis, was approximately
$7,067,000, and is reflected as additional interest expense in the
statement of operations for the year ended December 31,
2019.
The
weighted-average grant date fair value of
2018
Warrants issued during the year ended
December 31, 2018 was $7.98. The aggregate fair value of
2018
Warrants that vested
during the year ended December 31, 2018 was $10,296,926.
The weighted-average exercise price
and weighted-average remaining contractual term for the 2018
Warrants was $9.41 and 4.5 years. At December 31, 2019 the
aggregate intrinsic value of the 2018 Warrants totaled
$(10,230,000).
The
fair value of Debt Warrants issued was estimated on their
respective issue dates using the Black Scholes-Merton option
pricing model and the following weighted-average
assumptions:
|
Volatility
|
96%
|
|
Risk–free
interest rate
|
2.75
|
|
Dividend
yield
|
-%
|
|
Expected life of
options (in years)
|
5
|
|
Weighted-average
fair value of common stock
|
$
9.41
|
|
7.
|
STOCKHOLDERS’ EQUITY
|
Preferred Stock
The
Company’s initial certificate of incorporation authorized
5,000,000 shares of preferred stock, par value $0.001 per share. No
preferred stock had been issued and outstanding since inception of
the Company. In October 2016, the Company’s Board of
Directors and a majority of the holders of the Company’s
common stock approved an amendment and restatement of the
certificate of incorporation which, in part, eliminated the
authorized preferred stock. In August 2018, the Company’s
Board of Directors approved a second amendment and restatement of
the Company’s amended and restated certificate of
incorporation (the “Amended and Restated Charter”) to,
in part, increase the Company’s authorized capital to a total
of 110.0 million shares, including 10.0 million shares of newly
created preferred stock, par value $0.001 per share
(“Preferred Stock”), authorize the Company’s
Board of Directors to fix the designation and number of each series
of Preferred Stock, and to determine or change the designation,
relative rights, preferences, and limitations of any series of
Preferred Stock. The Amended and Restated Charter was approved by a
majority of the Company’s stockholders in September
2018, and was filed with the State of Delaware in November
2018. All references in the accompanying financial statements to
Preferred Stock have been restated to reflect the Amended and
Restated Charter.
Common Stock
The
Amended and Restated Charter also increased the Company’s
authorized capital to include 100.0 million shares of common stock,
par value $0.001, and removed the deemed liquidation provision, as
such term is defined in the Amended and Restated Charter. Each
holder of common stock is entitled to one vote for each share of
common stock held at all meetings of stockholders.
|
|
|
Initial Public Offering
On February 27, 2019, Super League completed its IPO of its common
stock, pursuant to which the Company issued and sold an aggregate
of 2,272,727 shares of common stock at $11.00 per share, raising
aggregate net proceeds of $22,458,000 after deducting underwriting
discounts, commissions and offering costs of $2,542,000. Concurrent
with the closing of the IPO on February 27, 2019 (the “IPO
Closing Date”), in accordance with the related
agreements,
all outstanding principal and interest for the
9.00% convertible notes outstanding, totaling $13,793,000, was
automatically converted into 1,475,164 shares of the
Company’s common stock at a conversion price of
$9.35.
Super League has and continues to use the net proceeds received
from the offering for working capital and general corporate
purposes,
including sales and
marketing activities, product development and capital expenditures.
Super League may also use a portion of the net proceeds for the
acquisition of, or investment in, technologies, solutions or
businesses that may compliment the Company’s business and or
accelerate the Company’s growth.
Upon closing of the IPO, 83,333 options and 125,000 warrants
previously granted to the CEO (with an average grant date fair
value of $8.50) became fully vested.
As a result, the
Company recorded an additional $1,770,000 of stock-based
compensation during the year ended December 31, 2019.
Pursuant to the related underwriting agreement, in connection with
the completion of the IPO, for the purchase price of $50.00, the
Company issued a warrant to purchase shares of our common stock
equal to 3.0% of the shares sold in the IPO, or 68,182 shares, at
an exercise price of $11.00 per share (the
“Underwriters’ Warrants”). The
Underwriters’ Warrants are exercisable during the period
commencing from the date of the close of the IPO and ending five
years from the closing date of the IPO. The Underwriters’
Warrants represent additional noncash offering costs, with an
estimated grant date fair value of $547,000, which was reflected in
additional-paid-in capital when issued and as a corresponding
offering cost in the statement of shareholders equity for the year
ended December 31, 2019.
The fair value of the
Underwriters’ Warrant was estimated on February 27, 2019, the
grant date, using the Black Scholes-Merton option pricing model and
the following weighted-average assumptions: (i) volatility of 95%,
(ii) risk-free interest rate of 2.5%, and (iii) expected term of
five years.
Reverse Stock Split
On
February 8, 2019, the Company filed an amendment to the
Company’s amended and restated certificate of incorporation
to effect a reverse split of shares of the Company’s common
stock on a one-for-three basis (the “Reverse Stock
Split”). All references to common stock, warrants to purchase
common stock, options to purchase common stock, early exercised
options, restricted stock, share data, per share data and related
information contained in the financial statements have been
retrospectively adjusted to reflect the effect of the Reverse Stock
Split for all periods presented. No fractional shares were issued
in connection with the Reverse Stock Split. Any fractional shares
resulting from the Reverse Stock Split will be rounded down to a
whole share, and any effected stockholders will receive a cash
payment equal to the value of such fractional shares.
|
8.
|
STOCK-BASED INCENTIVE PLANS
|
The
Super League 2014 Stock Option and Incentive Plan (the
“Plan” or “SOP”) was approved by the Board
of Directors and the stockholders of Super League in October 2014.
The Plan was subsequently amended in
May 2015, May 2016, July 2017 and October 2018.
The Plan
allows grants of stock options, stock awards and performance shares
with respect to common stock of the Company to eligible
individuals, which generally includes directors, officers,
employees, advisors and consultants. The Plan provides for both the
direct award and sale of shares of common stock and for the grant
of options to purchase shares of common stock. Options granted
under the Plan include non-statutory options as well as incentive
options intended to qualify under Section 422 of the Internal
Revenue Code of 1986, as amended.
The
Board of Directors administers the Plan and determines which
eligible individuals are to receive option grants or stock
issuances under the Plan, the times when the grants or issuances
are to be made, the number of shares of common stock subject to
each grant or issuance, the status of any granted option as either
an incentive stock option or a non-statutory stock option under the
federal tax laws, the vesting schedule to be in effect for the
option grant or stock issuance and the maximum term for which any
granted option is to remain outstanding. The exercise price of
options is generally equal to the fair market value of common stock
of the Company on the date of grant. Options generally begin
to be exercisable six months to one year after grant and typically
expire 10 years after grant. Stock options and restricted
shares generally vest over two to four years (generally
representing the requisite service period). The Plan terminates
automatically on July 1, 2027. The Plan provides for the following
programs:
Option Grants
Under
the discretionary option grant program, Super League’s
compensation committee may grant (1) non-statutory options to
purchase shares of common stock to eligible individuals in the
employ or service of Super League or its affiliates (including
employees, non-employee members of the Board of Directors and
consultants) at an exercise price not less than 85% of the fair
market value of such shares on the grant date, and (2) incentive
stock options to purchase shares of common stock to eligible
employees at an exercise price not less than 100% of the fair
market value of such shares on the grant date (not less than 110%
of fair market value if such employee actually or constructively
owns more than 10% of Super League’s voting stock or the
voting stock of any of its subsidiaries).
Stock Awards or Sales
Under
the stock award or sales program, eligible individuals may be
issued shares of common stock of the Company directly, upon the
attainment of performance milestones or the completion of a
specified period of service or as a bonus for past services. Under
this program, the purchase price for the shares will not be less
than 100% of the fair market value of the shares on the date of
issuance, and payment may be in the form of cash or past services
rendered. Eligible individuals will have no stockholder rights with
respect to any unvested restricted shares or restricted stock units
issued to them under the stock award or sales program; however,
eligible individuals will have the right to receive any regular
cash dividends paid on such shares.
The
initial reserve under the Plan was 583,334 shares of common stock,
which reserve was subsequently increased to 1,000,000 shares upon
stockholders’ approval in May 2016. In July 2017, the Company
amended and restated the SOP to increase the number of shares of
common stock reserved thereunder from1,000,000 shares to 1,500,000
shares. In October 2018, the Company amended and restated the SOP
to increase the number of shares of common stock reserved
thereunder from 1,500,000 shares to 1,833,334 shares. As of
December 31, 2019, 308,479 shares remained available for issuance
under the Plan.
Super
League issues new shares of common stock upon the exercise of stock
options, the grant of restricted stock, or the delivery of shares
pursuant to vested restricted stock units. The compensation
committee of the Board of Directors may amend or modify the Plan at
any time, subject to any required approval by the stockholders of
the Company, pursuant to the terms therein.
Stock Options
The
fair value of stock options granted were estimated on their
respective grant dates using the Black-Scholes-Merton option
pricing model and the following weighted-average assumptions for
the years ended December 31, 2019 and 2018:
|
|
2019
|
2018
|
|
Volatility
|
95
%
|
96
%
|
|
Risk–free
interest rate
|
1.99
%
|
2.82
%
|
|
Dividend
yield
|
-
%
|
-
%
|
|
Expected life of
options (in years)
|
6.08
|
5.78
|
|
Weighted-average
fair value of common stock
|
$
7.45
|
$
10.80
|
A
summary of stock option activity for the year ended December 31,
2019 is as follows:
|
|
|
Weighted-Average
|
|
|
|
|
Options (#)
|
Exercise
Price Per Share ($)
|
Remaining
Contractual Term (Years)
|
Aggregate
Intrinsic Value ($)
|
|
|
|
|
|
|
|
Outstanding
at December 31, 2018
|
1,524,000
|
$
9.18
|
7.34
|
$
(10,327,000
)
|
|
Granted
|
165,000
|
$
7.45
|
|
|
|
Exercised
|
-
|
-
|
|
|
|
Canceled
/ forfeited
|
(138,000
)
|
$
10.60
|
|
|
|
Outstanding
at December 31, 2019
|
1,551,000
|
$
8.86
|
7.51
|
$
(10,088,000
)
|
|
Vested
and exercisable at December 31, 2019
|
1,153,000
|
$
8.66
|
7.04
|
$
(7,259,000
)
|
The
weighted-average grant date fair value of stock options granted
during the years ended December 31, 2019 and 2018 was $5.76 and
$8.85, respectively. The aggregate fair value of stock options that
vested during the years ended December 31, 2019 and 2018 was
$3,989,000 and $4,720,000, respectively. As of December 31, 2019,
the total unrecognized compensation expense related to non-vested
stock option awards was $2,840,000, which is expected to be
recognized over a weighted-average term of approximately 2.83
years.
Restricted Stock Units
The
following table summarizes non-vested restricted stock unit
activity for the year ended December 31, 2019:
|
|
Restricted
Stock
Units (#)
|
Weighted Average
Grant Date
Fair Value ($)
|
|
Non-vested
restricted stock units at December 31, 2018
|
10,000
|
$
7.11
|
|
Granted
|
33,000
|
$
9.68
|
|
Vested
|
(14,000
)
|
$
6.13
|
|
Canceled
|
–
|
|
|
Non-vested
restricted stock units at December 31, 2019
|
29,000
|
$
10.40
|
As of
December 31, 2019, the total unrecognized compensation expenses
related to non-vested restricted stock units was $52,000 which will
be recognized over a weighted-average term of approximately 0.12
years.
Warrants Issued to Employees and Nonemployees for
Services
During
the year ended December 31, 2018, the Company issued common stock
purchase warrants
to certain employees
in exchange for services performed, subject to certain vesting
conditions. The warrants have expiration dates of 10 years from the
date of grant and an exercise price of $10.80 per share. A summary
of employee and nonemployee warrant activity for the year ended
December 31, 2019 is as follows:
|
|
|
Weighted-Average
|
|
|
|
|
Warrants (#)
|
Exercise
Price Per Share ($)
|
Remaining
Contractual Term (Years)
|
Aggregate
Intrinsic Value ($)
|
|
|
|
|
|
|
|
Outstanding
at December 31, 2018
|
1,098,000
|
$
9.33
|
2.66
|
|
|
Exercised
|
(67,000
)
|
$
0.17
|
|
$
137,000
|
|
Outstanding
at December 31, 2019
|
1,031,000
|
$
9.92
|
2.83
|
$
(7,797,000
)
|
|
Vested
and exercisable as of December 31, 2019
|
763,000
|
$
10.16
|
3.34
|
$
(5,952,000
)
|
Compensation
expense related to common stock purchase warrants was $2,182,000
and $1,400,000 for the years ended December 31, 2019 and 2018,
respectively. The weighted-average grant date fair value of
warrants granted during the year ended December 31, 2018 was $7.80.
No warrants were granted to
employees
or non-employees in exchange for services performed
during
the year ended December 31, 2019. The aggregate fair value of
warrants that vested during the years ended December 31, 2019 and
2018 was $2,092,000 and $1,401,000, respectively.
As of
December 31, 2019, the total unrecognized compensation expense
related to warrants was $275,000, which is expected to be
recognized over a weighted-average term of approximately 0.4
years.
Noncash Stock Compensation Expense
Noncash stock-based compensation expense for the periods presented
was comprised of the following:
|
|
For the Year Ended December 31,
|
|
|
|
2019
|
2018
|
|
Stock
options
|
$
3,573,000
|
$
2,490,000
|
|
Warrants
|
2,182,000
|
1,400,000
|
|
Restricted
stock units
|
370,000
|
14,000
|
|
Earn-out compensation expense
(Note 5)
|
58,000
|
-
|
|
Other
|
34,000
|
39,000
|
|
Total
noncash stock compensation expense
|
$
6,217,000
|
$
3,943,000
|
Noncash stock-based compensation expense for the periods presented
was included in the following financial statement line
items:
|
|
Fiscal Year
|
|
|
|
2019
|
2018
|
|
Sales,
marketing and advertising
|
$
635,000
|
$
504,000
|
|
Technology
platform and infrastructure
|
129,000
|
200,000
|
|
General and
administrative
|
5,453,000
|
3,239,000
|
|
Total
noncash stock compensation expense
|
6,217,000
|
$
3,943,000
|
Noncash stock-based compensation expense for the year ended
December 31, 2019 included compensation expense resulting from the
vesting of certain performance-based options and warrants
previously granted to certain
executives, which vested upon the achievement of certain
performance-based milestones, pursuant to vesting conditions in the
underlying equity grant agreements. Performance targets included
the completion of our IPO in February 2019 and other operational
performance-based milestones. During fiscal year 2019, 325,000 of
performance-based stock options and warrants vested with grant date
fair values ranging from $8.28 to $8.50, resulting in noncash stock
compensation expense of $2,766,000 during fiscal year 2019.
The fair
value of these equity awards was estimated on October 31, 2018,
their original grant date, using the Black Scholes-Merton option
pricing model and the following weighted-average assumptions: (i)
volatility of 93%, (ii) risk-free interest rate of 3.0%,
and (iii) expected term of 6.5 years.
|
9.
|
INCOME TAXES
|
Super
League’s provision for income taxes consisted of the
following for the years ended December 31, 2019 and
2018:
|
|
2019
|
2018
|
|
Current:
|
|
|
|
Federal
taxes
|
$
–
|
$
–
|
|
State
taxes
|
|
|
|
Total
current
|
|
|
|
|
|
|
|
|
2019
|
2018
|
|
Deferred:
|
|
|
|
Federal
taxes
|
$
4,098,000
|
$
4,073,000
|
|
State
taxes
|
1,374,000
|
1,609,000
|
|
Subtotal
|
5,472,000
|
5,682,000
|
|
Change
in valuation allowance
|
(5,472,000
)
|
(5,682,000
)
|
|
Total
deferred
|
–
|
–
|
|
|
|
|
|
Provision
for income taxes
|
$
-
|
$
-
|
The tax
effects of temporary differences and carryforwards that give rise
to significant portions of deferred tax assets and liabilities
consist of the following as of
December 31, 2019 and 2018.
|
|
2019
|
2018
|
|
Deferred
tax assets (liabilities):
|
|
|
|
Net
operating loss and credits
|
$
14,456,000
|
$
11,129,000
|
|
Stock
compensation
|
3,992,000
|
3,452,000
|
|
Accrued
interest expense
|
1,541,000
|
938,000
|
|
Fixed
assets and intangibles
|
118,000
|
87,000
|
|
Total
deferred tax assets
|
20,107,000
|
15,606,000
|
|
Valuation
allowance
|
(20,107,000
)
|
(15,606,000
)
|
|
Total
deferred tax assets, net of valuation allowance
|
$
-
|
$
-
|
A
reconciliation of the federal statutory income tax rate and the
effective income tax rate is as follows:
|
|
2019
|
2018
|
|
|
|
|
|
Statutory
federal tax rate - (benefit) expense
|
21
%
|
35
%
|
|
Non-deductible
permanent items
|
(6
)
|
(1
)
|
|
Change
in tax rate
|
-
|
(29
)
|
|
Valuation
allowance
|
(15
)
|
(5
)
|
|
|
-
%
|
-
%
|
For the
years ended December 31, 2019 and 2018, the Company recorded full
valuation allowances against its net deferred tax assets due to
uncertainty regarding future realizability pursuant to guidance set
forth in the FASB’s Accounting Standards Codification Topic
No. 740,
Income Taxes
. In
future periods, if the Company determines it will more likely than
not be able to realize these amounts, the applicable portion of the
benefit from the release of the valuation allowance will generally
be recognized in the statements of operations in the period the
determination is made.
At
December 31, 2019, the Company had U.S. federal and state
income tax net operating loss carryforwards of approximating
$49,795,000 and $52,665,000, respectively, expiring through 2039.
Utilization of the net operating loss carryforwards may be subject
to a substantial annual limitation due to ownership change
limitations that may have occurred or that could occur in the
future, as required by Section 382 of the Internal Revenue
Code of 1986, as amended, as well as similar state provisions. The
Company has not completed a study to assess whether an ownership
change has occurred or whether there have been multiple ownership
changes since the Company’s formation due to the complexity
and cost associated with such a study, and the fact that there may
be additional such ownership changes in the future.
On December 22, 2017, new U.S. federal tax legislation was enacted
that significantly changed the U.S. federal income taxation of U.S.
corporations, including by reducing the U.S. corporate income tax
rate from 35% to 21%, revising the rules governing net operating
losses and foreign tax credits, and introducing new anti-base
erosion provisions. Many of the changes were effective immediately,
without any transition periods or grandfathering for existing
transactions. The legislation is unclear in many respects and could
be subject to potential amendments and technical corrections, as
well as interpretations and implementing regulations by the U.S.
Department of the Treasury and the Internal Revenue Service
(“IRS”), any of which could decrease or increase
certain adverse impacts of the legislation. In addition, it is
unclear how these U.S. federal income tax changes will affect state
and local taxation, which often uses federal taxable income as a
starting point for computing state and local tax
liabilities.
The new legislation reduced the corporate income tax rate from 35%
to 21% effective January 1, 2018. As a result, all deferred income
tax assets and liabilities, including NOL’s, have been
measured using the new rate under and are reflected in the
valuation of these assets as of December 31, 2019 and 2018. As a
result, as of December 31, 2017, the value of our deferred tax
assets was reduced by $4,279,000 and the related valuation
allowance was reduced by the same amount. Given the full valuation
allowance provided for net deferred tax assets, the change in tax
law did not have a material impact on the Company’s financial
statements.
|
10.
|
COMMITMENTS AND CONTINGENCIES
|
Operating Leases
The
Company leases office space under an operating lease agreement
which expired on May 31, 2017 and was amended to a month-to-month
lease.
Rent
expense for the years ended December 31, 2019 and 2018 was
approximately $349,000 and $329,000, respectively, and is included
in general and administrative expenses in the accompanying
statements of operations. Rental payments are expensed in the
statements of operations in the period to which they relate.
Scheduled rent increases, if any, are amortized on a straight-line
basis over the lease term.
Related Party Transactions
In May
2018, the Company entered into a consulting agreement with a member
of the Company's Board of Directors, pursuant to which the board
member provides the Company with strategic advice and planning
services for which he receives a cash payment of $7,500 per month
from the Company. The Consulting Agreement has an initial term that
runs until December 31, 2019, but may be extended upon mutual
agreement of the board member and the Company.
|
11.
|
SUBSEQUENT EVENTS
|
The
Company evaluated subsequent events for their potential impact on
the financial statements and disclosures through the date the
annual audited financial statements were available to be issued
and determined that no subsequent
events occurred that were reasonably expected to impact the
financial statements presented herein.
SI
G
NATURES
Pursuant
to the requirements of Section 13 or 15(d) of the Securities
Exchange Act of 1934, the registrant has duly caused this report to
be signed on its behalf by the undersigned, thereunto duly
authorized.
|
|
|
SUPER LEAGUE GAMING, INC.
|
|
|
|
|
|
|
|
|
|
By
|
/s/
Ann Hand
|
|
|
|
|
Ann Hand
President and Chief Executive Officer
(Principal Executive Officer)
|
|
|
|
By
|
/s/
Clayton Haynes
|
|
|
|
|
Clayton Haynes
Chief Financial Officer
(Principal Financial and Accounting Officer)
|
|
Date: March 20, 2020
|
|
|
|
Pursuant
to the requirements of the Securities Exchange Act of 1934, this
report has been signed below by the following persons on behalf of
the registrant and in the capacities and on the dates
indicated.
|
Signature
|
Title
|
Date
|
|
|
|
|
|
/s/ Ann
Hand
|
Chief
Executive Officer,
|
March 20
, 2020
|
|
Ann
Hand
|
President,
Chair of the Board
|
|
|
|
(Principal
Executive Officer)
|
|
|
|
|
|
|
/s/
Clayton Haynes
|
Chief
Financial Officer
|
March 20
, 2020
|
|
Clayton
Haynes
|
(Principal
Financial and Accounting Officer)
|
|
|
|
|
|
|
/s/
David Steigelfest
|
Director
|
March 20
, 2020
|
|
David
Steigelfest
|
|
|
|
|
|
|
|
/s/
Jeff Gehl
|
Director
|
March 20
, 2020
|
|
Jeff
Gehl
|
|
|
|
|
|
|
|
/s/
Robert Stewart
|
Director
|
March 20
, 2020
|
|
Robert
Stewart
|
|
|
|
|
|
|
|
/s/
Kristin Patrick
|
Director
|
March 20
, 2020
|
|
Kristin
Patrick
|
|
|
|
|
|
|
|
/s/
Mark Jung
|
Director
|
March 20
,
2020
|
|
Mark
Jung
|
|
|
|
|
|
|
|
/s/ Michale Keller
|
Director
|
March 20
, 2020
|
|
Michael
Keller
|
|
|
|
|
|
|
-63-
TABLE OF CONTENTS
Part IItem 1. BusinessItem 1A. R Isk FactorsItem 1A. RItem 1B. Unresolved Staff CommentsItem 1B. UItem 2. PropertiesItem 3. Legal ProceedingsItem 4. Mine Safety DisclosuresPart IIItem 5. Market For Registrant S Common Equity, Related Stockholder Matters and Issuer Purchases Of Equity SecuritiesItem 6. Selected Financial DataItem 7. Management S Discussion and Analysis Of Financial Condition and Results Of OperationsItem 7A. Quantitative and Qualitative Disclosures About Market RiskItem 8. Financial Statements and Supplementary DataItem 8. FinItem 9. Changes in and Disagreements with Accountants on Accounting and Financial DisclosureItem 9A. Controls and ProceduresItem 9B. Other InformationPart IIIItem 10. Directors, Executive Officers and Corporate GovernanceItem 11. Executive CompensationItem 12. Security Ownership Of Certain Beneficial Owners and Management and Related Stockholder MattersItem 13. Certain Relationships and Related Transactions, and Director IndependenceItem 14. Principal Accounting Fees and ServicesPart IVItem 15. Exhibits, Financial Statement Schedules