SLM CORP
10-Ks and 10-Qs
|
|
|
|
|
|
|
|
|
|
|
|
|
|
|
|
|
|
|
|
|
|
|
|
|
|
|
|
|
|
|
|
|
|
|
|
|
|
|
|
|
|
|
|
|
|
|
|
|
|
|
|
|
|
|
|
UNITED STATES
SECURITIES AND EXCHANGE COMMISSION
Washington, D.C. 20549
Form 10-K
(Mark One)
|
þ
|
ANNUAL REPORT PURSUANT TO SECTION 13 OR 15(d) OF THE SECURITIES EXCHANGE
|
ACT OF 1934
For the fiscal year ended
December 31, 2018
or
|
¨
|
TRANSITION REPORT PURSUANT TO SECTION 13 or 15(d) OF THE SECURITIES EXCHANGE
|
ACT OF 1934
For the transition period from to
Commission file number 001-13251
SLM Corporation
(Exact Name of Registrant as Specified in Its Charter)
|
Delaware
|
52-2013874
|
|
(State of Other Jurisdiction of
Incorporation or Organization)
|
(I.R.S. Employer
Identification No.)
|
|
300 Continental Drive, Newark, Delaware
|
19713
|
|
(Address of Principal Executive Offices)
|
(Zip Code)
|
(302) 451-0200
(Registrant’s Telephone Number, Including Area Code)
Securities registered pursuant to Section 12(b) of the Act
Common Stock, par value $.20 per share.
Name of Exchange on which Listed:
The NASDAQ Global Select Market
Floating Rate Non-Cumulative Preferred Stock, Series B, par value $.20 per share
Name of Exchange on which Listed:
The NASDAQ Global Select Market
Securities registered pursuant to Section 12(g) of the Act:
None.
Indicate by check mark if the registrant is a well-known seasoned issuer, as defined in Rule 405 of the Securities Act. Yes
þ
No
¨
Indicate by check mark if the registrant is not required to file reports pursuant to Section 13 or 15(d) of the Act. Yes
¨
No
þ
Indicate by check mark whether the registrant: (1) has filed all reports required to be filed by Section 13 or 15(d) of the Securities Exchange Act of 1934 during the preceding 12 months (or for such shorter period that the registrant was required to file such reports), and (2) has been subject to such filing requirements for the past 90 days. Yes
þ
No
¨
Indicate by check mark whether the registrant has submitted electronically every Interactive Data File required to be submitted pursuant to Rule 405 of Regulation S-T during the preceding 12 months (or for such shorter period that the registrant was required to submit and post such files). Yes
þ
No
¨
Indicate by check mark if disclosure of delinquent filers pursuant to Item 405 of Regulation S-K is not contained herein, and will not be contained, to the best of registrant’s knowledge, in definitive proxy or information statements incorporated by reference in Part III of this Form 10-K or any amendment to this Form 10-K.
¨
Indicate by check mark whether the registrant is a large accelerated filer, an accelerated filer, a non-accelerated filer, a smaller reporting company, or an emerging growth company. See the definitions of “large accelerated filer,” “accelerated filer,” “smaller reporting company,” and “emerging growth company” in Rule 12b-2 of the Exchange Act. (Check one):
|
Large accelerated filer
þ
|
|
|
Accelerated filer
¨
|
|
Non-accelerated filer
¨
|
(Do not check if a smaller reporting company)
|
Smaller reporting company
¨
|
|
|
Emerging growth company
¨
|
|
|
|
If an emerging growth company, indicate by check mark if the registrant has elected not to use the extended transition period for complying with any new or revised financial accounting standards provided pursuant to Section 13(a) of the Exchange Act.
¨
Indicate by check mark whether the registrant is a shell company (as defined in Rule 12b-2 of the Exchange Act). Yes
¨
No
þ
The aggregate market value of voting common stock held by non-affiliates of the Registrant as of June 30,
2018
was
$5.0 billion
(based on closing sale price of $11.45 per share as reported for the NASDAQ Global Select Market).
As of
January 31, 2019
, there were
436,802,555
shares of common stock outstanding.
DOCUMENTS INCORPORATED BY REFERENCE
Portions of the proxy statement relating to the Registrant’s 2019 Annual Meeting of Stockholders are incorporated by reference into Part III of this Annual Report on
Form 10-K.
SLM CORPORATION
TABLE OF CONTENTS
|
|
Page Number
|
|
|
PART I
|
||
|
Item 1.
|
||
|
Item 1A.
|
||
|
Item 1B.
|
||
|
Item 2.
|
||
|
Item 3.
|
||
|
Item 4.
|
||
|
PART II
|
||
|
Item 5.
|
||
|
Item 6.
|
||
|
Item 7.
|
||
|
Item 7A.
|
||
|
Item 8.
|
||
|
Item 9.
|
||
|
Item 9A.
|
||
|
Item 9B.
|
||
|
PART III.
|
||
|
Item 10.
|
||
|
Item 11.
|
||
|
Item 12.
|
||
|
Item 13.
|
||
|
Item 14.
|
||
|
PART IV
|
||
|
Item 15.
|
||
FORWARD-LOOKING AND CAUTIONARY STATEMENTS
References in this Annual Report on Form 10-K to “we,” “us,” “our,” “Sallie Mae,” “SLM” and the “Company” refer to SLM Corporation and its subsidiaries, except as otherwise indicated or unless the context otherwise requires.
This Annual Report on Form 10-K contains “forward-looking” statements and information based on management’s current expectations as of the date of this report. Statements that are not historical facts, including statements about our beliefs, opinions or expectations and statements that assume or are dependent upon future events, are forward-looking statements. This includes, but is not limited to, our expectation and ability to pay a quarterly cash dividend on our common stock in the future, subject to the determination by our Board of Directors, and based on an evaluation of our earnings, financial condition and requirements, business conditions, capital allocation determinations, and other factors, risks and uncertainties. Forward-looking statements are subject to risks, uncertainties, assumptions and other factors that may cause actual results to be materially different from those reflected in such forward-looking statements. These factors include, among others, the risks and uncertainties set forth in Item 1A. “Risk Factors” and elsewhere in this Annual Report on Form 10-K and subsequent filings with the Securities and Exchange Commission (“SEC”); increases in financing costs; limits on liquidity; increases in costs associated with compliance with laws and regulations; failure to comply with consumer protection, banking and other laws; changes in accounting standards and the impact of related changes in significant accounting estimates; any adverse outcomes in any significant litigation to which we are a party; credit risk associated with our exposure to third-parties, including counterparties to our derivative transactions; and changes in the terms of education loans and the educational credit marketplace (including changes resulting from new laws and the implementation of existing laws). We could also be affected by, among other things: changes in our funding costs and availability; reductions to our credit ratings; failures or breaches of our operating systems or infrastructure, including those of third-party vendors; damage to our reputation; risks associated with restructuring initiatives, including failures to successfully implement cost-cutting programs and the adverse effects of such initiatives on our business; changes in the demand for educational financing or in financing preferences of lenders, educational institutions, students and their families; changes in law and regulations with respect to the student lending business and financial institutions generally; changes in banking rules and regulations, including increased capital requirements; increased competition from banks and other consumer lenders; the creditworthiness of our customers; changes in the general interest rate environment, including the rate relationships among relevant money-market instruments and those of our earning assets versus our funding arrangements; rates of prepayment on the loans that we own; changes in general economic conditions and our ability to successfully effectuate any acquisitions; and other strategic initiatives. The preparation of our consolidated financial statements also requires management to make certain estimates and assumptions, including estimates and assumptions about future events. These estimates or assumptions may prove to be incorrect. All forward-looking statements contained in this Annual Report on Form 10-K are qualified by these cautionary statements and are made only as of the date of this report. We do not undertake any obligation to update or revise these forward-looking statements to conform such statements to actual results or changes in our expectations.
1
AVAILABLE INFORMATION
Our website address is www.salliemae.com. Copies of our Annual Reports on Form 10-K, Quarterly Reports on Form 10-Q and Current Reports on Form 8-K, as well as any amendments to those reports, and our Proxy Statements and any significant investor presentations, are available free of charge through our website as soon as reasonably practicable after they are electronically filed with, or furnished to, the SEC. The SEC maintains a website at www.sec.gov that contains all such filed or furnished reports and other information. In addition, copies of our Board Governance Guidelines, Code of Business Conduct (which includes the code of ethics applicable to our Principal Executive Officer, Principal Financial Officer and Principal Accounting Officer) and the governing charters for each committee of our Board of Directors are available free of charge on our website, as well as in print to any stockholder upon request. We intend to disclose any amendments to or waivers of our Code of Business Conduct (to the extent applicable to our Principal Executive Officer, Principal Financial Officer or Principal Accounting Officer) by posting such information on our website. Information contained or referenced on our website is not incorporated by reference into and does not form a part of this Annual Report on Form 10-K.
2
PART I.
Item 1. Business
Company History
SLM Corporation, more commonly known as Sallie Mae, is the nation’s leading saving, planning and paying for college company. Our purpose is to equip aspiring minds to create the lives they imagine. That mission is firmly grounded in helping families achieve the dream of a higher education. To that end, we have helped more than 35 million Americans pay for college. There is no single way to achieve this task, so we provide tools, resources, and financing to produce our country’s future engineers, doctors, nurses, teachers, entrepreneurs, business leaders, and more.
Our primary business is to originate and service high-quality Private Education Loans we make to students and their families. “Private Education Loans” are education loans for students or their families that are not made, insured or guaranteed by any state or federal government. We also offer a range of deposit products insured by the Federal Deposit Insurance Corporation (the “FDIC”) and operate a consumer savings network that provides financial rewards on everyday purchases to help families save for college.
We were formed in 1972 as the Student Loan Marketing Association, a federally-chartered government-sponsored enterprise (“GSE”), with the goal of furthering access to higher education by providing a national secondary market and warehousing facilities for loans insured or guaranteed under the previously existing Federal Family Education Loan program (“FFELP Loans”). The GSE’s federal charter prohibited it from originating student loans in the primary market.
In 1996, the United States Congress passed the Student Loan Marketing Association Reorganization Act, which set the stage for the “privatization” of the GSE. As part of the privatization process, we incorporated SLM Corporation in 1997 as a Delaware corporation, the GSE became a subsidiary of SLM Corporation, and by mid-2004 the GSE stopped purchasing FFELP Loans in the secondary market and was dissolved by the end of 2004.
On November 3, 2005, SLM Corporation formed Sallie Mae Bank, a Utah industrial bank subsidiary (the “Bank”), to fund and originate Private Education Loans on behalf of SLM Corporation. While the Bank first originated Private Education Loans in February 2006, SLM Corporation continued to purchase a portion of its Private Education Loans from its third-party lending partners through mid-2009. With some minor exceptions, the Bank became the sole originator of Private Education Loans for SLM Corporation beginning with the 2009-2010 academic year, the first academic year following the launch of the Bank’s Smart Option Student Loan program in mid-2009.
On March 30, 2010, President Obama signed into law the Federal Direct Student Loan Program (the “DSLP”), effective July 1, 2010. At that time, the federal guaranteed student loan program (under which FFELP Loans were made) was eliminated, although the terms and conditions of existing guaranteed student loans were not altered or affected.
On April 30, 2014, we completed our plan to legally separate (the “Spin-Off”) into two distinct publicly-traded entities: an education loan management, servicing and asset recovery business, named Navient Corporation (“Navient”), which retained all assets and liabilities generated prior to the Spin-Off other than those explicitly retained by SLM Corporation; and a consumer banking business, named SLM Corporation. We sometimes refer to the SLM Corporation that existed prior to the Spin-Off as “pre-Spin-Off SLM.”
Our principal executive offices are located at 300 Continental Drive, Newark, Delaware 19713, and our telephone number is (302) 451-0200.
3
Our Business
Our primary business is to originate and service high-quality Private Education Loans. In
2018
, nearly 374,000 families chose us as their Private Education Loan provider, more than any other private student loan lender. We originated $5.3 billion of Private Education Loans, an increase of 11 percent from the year ended
December 31, 2017
. As of
December 31, 2018
, we had $20.3 billion of Private Education Loans, net, outstanding. In 2016, we began to purchase unsecured personal loans used for non-educational purposes (“Personal Loans”), and in 2018 we began to originate Personal Loans. At December 31, 2018, we had $1.1 billion of Personal Loans, net outstanding.
Private Education Loans
The Private Education Loans we make to students and families serve primarily to bridge the gap between the cost of higher education and the amount funded through financial aid, federal loans and student and families’ resources. We also extend Private Education Loans as an alternative to similar federal education loan products where we believe our rates are competitive. We earn interest income on our Private Education Loan portfolio.
In 2009, we introduced the Smart Option Student Loan, our Private Education Loan product emphasizing in-school payment features that can produce shorter terms and reduce customers’ total finance charges. Customers generally elect one of three Smart Option repayment types at the time of loan origination. The first two, Interest Only and Fixed Payment options, require monthly payments while the student is in school and during the grace period thereafter, and accounted for approximately 55 percent of the Private Education Loans the Bank originated during 2018. The third repayment option is the more traditional deferred Private Education Loan product where customers are not required to make payments while the student is in school and during the grace period after separation from school. (The grace period for a Smart Option Student Loan generally runs for six months after the borrower separates from school, but can run for up to 36 months for a small subset of graduate loans). Lower interest rates on the Interest Only and Fixed Payment options encourage customers to elect those options. Making payments while in school helps customers reduce their total loan cost compared with the traditional deferred loan, and also helps them become accustomed to making on-time regular loan payments. We offer both variable-rate and fixed-rate loans.
In 2018, we expanded our graduate school offerings to include six new graduate program specific loan products. These included the Sallie Mae Law School Loan, the Sallie Mae MBA Loan, the Sallie Mae Health Professions Graduate Loan, the Sallie Mae Medical School Loan, the Sallie Mae Dental School Loan, and the Sallie Mae Graduate School Loan. These products were designed to address the specific needs of graduate students, such as extended grace periods for medical students.
We regularly review and update the terms of our Private Education Loan products. Our Private Education Loans include important protections for the family, including loan forgiveness in case of death or permanent disability of the student borrower, a free, quarterly FICO score benefit to students and cosigners, and study services to help students advance their education with a Smart Option Student Loan.
As a holder of Private Education Loans, we bear the full credit risk of the customers. We manage this risk by underwriting and pricing based on customized credit scoring criteria and the addition of qualified cosigners. For Private Education Loans originated during the year ended
December 31, 2018
, our average FICO scores (representing the higher credit scores of the cosigners or borrowers) at the time of original approval were 746 and approximately 87.2 percent of our loans were cosigned. In addition, we voluntarily require school certification of both the need for, and the amount of, every Private Education Loan we originate (to prevent unnecessary borrowing beyond a school’s cost of attendance), and we disburse the loan proceeds directly to the higher education institutions to ensure loan proceeds are applied directly to the student’s education expenses.
The core of our marketing strategy is to promote our products on campuses through financial aid offices as well as through online and direct marketing to students and families. Our on-campus efforts with approximately 2,400 higher education institutions are led by our sales force, the largest in the industry, which has become a trusted resource for financial aid offices.
Our loans are high credit quality and the overwhelming majority of our customers manage their payments with great success. Loans in repayment include loans on which customers are making interest only or fixed payments, as well as loans that have entered full principal and interest repayment status after any applicable grace period. At
December 31, 2018
,
2.6
percent
4
of loans in repayment were greater than 30 days delinquent, and loans in forbearance were
3.8
percent of loans in repayment and forbearance. In
2018
, net charge-offs as a percentage of average loans in repayment was
1.01
percent.
Sallie Mae Bank
Since 2006, the Bank, which is regulated by the Utah Department of Financial Institutions (the “UDFI”), the FDIC, and the Consumer Financial Protection Bureau (the “CFPB”), has originated Private Education Loans and accepted deposits. At
December 31, 2018
, the Bank had total assets of $26.5 billion, including $20.3 billion of Private Education Loans, net, $1.1 billion of Personal Loans, net, and $848 million of FFELP Loans, net, and total deposits of $19.3 billion.
Our ability to obtain deposit funding and offer competitive interest rates on deposits will be necessary to sustain the growth of our Private Education Loan and other originations. Our ability to obtain such funding is dependent, in part, on the capital levels of the Bank and its compliance with other applicable regulatory requirements. At the time of this filing, there are no regulatory restrictions on our ability to obtain deposit funding or the interest rates we offer other than those restrictions generally applicable to all FDIC-insured banks of similar charter and size. We further diversified our funding base by raising $1.9 billion in term funding collateralized by pools of Private Education Loans in the long-term asset-backed securities (“ABS”) market in 2018, which brought our total ABS funding to $4.1 billion, or 20 percent of our total Private Education Loan portfolio. We plan to continue to do so, market conditions permitting. This helps us better match-fund our assets and reduce our reliance on deposits to fund our growth.
See the subsection titled “Regulation of Sallie Mae Bank” under “Supervision and Regulation” for additional details about the Bank.
Operational Infrastructure
We perform the origination, servicing and collections activities for all of our Private Education Loans in the United States with dedicated representatives assisting customers with various needs, including military personnel who may be eligible for military benefits. We expect the Bank or affiliates of the Bank to retain servicing of all Private Education Loans the Bank originates, regardless of whether the loans are held, sold or securitized.
Over the past few years, we have implemented several improvements in our ability to interact with our customers, including:
|
•
|
an integrated platform that allows customers and servicing agents to simultaneously access the same systems in real time interaction;
|
|
•
|
an on-line chat function for customer service;
|
|
•
|
a mobile application accessible through smart phones and the Apple watch; and
|
|
•
|
initiation of customer surveys to gain feedback on areas for improvement within our servicing function.
|
These and other enhancements have contributed to streamlined originations and servicing processes, increased customer self-services rates, and improved customer satisfaction in all channels.
Personal Loans
We began purchasing Personal Loans from a marketplace lender in 2016 and discontinued those purchases in July 2018. In 2017, we developed infrastructure so that in early 2018 we had the capability to originate and service Personal Loans. In 2018, we originated $455 million and acquired an additional $703 million of Personal Loans. At December 31, 2018, we owned a high-quality portfolio of Personal Loans that totaled $1.1 billion and had an average FICO score at original approval of 719.
Upromise
Upromise is a free to join rewards program helping Americans save for college. Members can earn cash back rewards when shopping at participating on-line retailers, dining out at participating restaurants, and by using their Upromise Mastercard. Since inception, Upromise members have earned more than $1 billion through the program, and more than 300,000 members use their Upromise credit card to save.
5
Our Approach to Advising Students and Families on Paying for College
Our annual research, “How America Pays for College,”
1
confirms students and families cover the cost of college using multiple sources. According to this research, roughly 40 percent of families have a plan to pay for college. Sallie Mae offers free online tools, resources and educational content on SallieMae.com to help families build a strategy to save, plan and pay for college. Our College Planning Calculator helps families set college savings goals, project the full cost of a college degree, and estimate future student loan payments and the annual starting salary level needed to keep payments manageable.
To encourage responsible borrowing, Sallie Mae advises students and families to follow a three-step approach to paying for college:
Start with money you won’t have to pay back.
Supplement your college savings and income by maximizing scholarships, grants, and work-study.
We provide access to an extensive, free, online scholarship database, which includes information about more than 5 million scholarships with an aggregate value in excess of $24 billion. For academic year 2017-2018, more than 16,000 students reported receiving at least one scholarship via our database, covering more than $49 million in college costs. In addition, we recently launched a scholarship search tool tailored specifically for graduate students. It includes access to 950,000 graduate school scholarships with an aggregate value of more than $1 billion. We distribute these scholarship tools in multiple channels, including through partners, high schools and higher education institutions.
Through the Bank, we offer traditional savings products, such as high-yield savings accounts, money market accounts, and certificates of deposit (“CDs”).
In addition, our SmartyPig™ product is a free, FDIC-insured, online, goal-based savings account that helps consumers save for long- and short-term goals. Its tiered interest rates reward consumers for growing their savings. Finally, the Upromise rewards program helps families jump start their save-for-college plans by providing financial rewards on everyday purchases made at participating merchants.
Explore federal student loans.
We encourage students to explore federal student loan options by completing the Free Application for Federal Student Aid.
Consider a responsible private student loan.
Fill the gap between your available resources and the cost of college.
We offer competitively-priced Private Education Loan products to bridge the gap between family resources, federal loans, grants, student aid and scholarships, and the cost of a college education.
Our Approach to Assisting Students and Families Borrowing and Repaying Private Education Loans
To ensure applicants borrow only what they need to cover their school’s cost of attendance, we actively engage with schools and require school certification before we disburse a Private Education Loan. To help applicants understand their loan and its terms, we provide multiple, customized disclosures explaining the applicant’s starting interest rate, the interest rate during the life of the loan, and the loan’s total cost under the available repayment options. Our Smart Option Student Loan features no origination fees and no prepayment penalties, and also features interest rate reductions for those who enroll in and make monthly payments through auto debit, free access to quarterly FICO credit scores, a choice of repayment options and a choice of either variable or fixed interest rates. Beginning in 2017, all newly-originated Smart Option Student Loans included the benefit of free access to tutoring and study services at an online third-party vendor to assist students in advancing their education.
____________________
1
Sallie Mae’s
How America Pays for College 2018
, conducted by Ipsos, www.salliemae.com/howamericapays.
6
The majority of our Smart Option Student Loan customers elect an in-school repayment option. By making in-school payments, customers learn to establish good repayment patterns, reduce their total loan cost, and graduate with less debt. We send monthly communications to customers while they are in school, even if they have no monthly payments scheduled, to keep them informed and encourage them to reduce the amount they will owe when they leave school.
Some customers transitioning from school to the work force may require more time before they are financially capable of making full payments of principal and interest. Sallie Mae created a Graduated Repayment Program (the “GRP”) to assist borrowers with additional payment flexibility, allowing customers to make interest-only payments instead of full principal and interest payments for a period of 12 months if they elect within a specified time frame to participate in the GRP. The time frame for electing to participate in the GRP begins six months before expiration of a borrower’s grace period and extends until 12 months after the expiration of the grace period. The 12-month interest only payments under the GRP begin upon expiration of a borrower’s grace period or election of the GRP, whichever is later.
Our experience has taught us the successful transition from school to full principal and interest repayment status involves making and carrying out a financial plan. As customers approach the principal and interest repayment period on their loans, Sallie Mae engages with them and communicates what to expect during the transition. In addition, SallieMae.com provides educational content for customers on how to organize loans, set up a monthly budget, and understand repayment obligations. Examples are provided to help explain how payments are applied and allocated, and see how the accrued interest on alternative repayment programs could affect the cost of customers’ loans. The site also provides important information on benefits available to service men and women under the Servicemembers Civil Relief Act (the “SCRA”).
After graduation, a customer may apply for the cosigner to be released from the loan. This option is available after 12 principal and interest payments are made and the student borrower adequately meets our credit requirements. In the event of a cosigner’s death, the student borrower automatically continues as the sole individual on the loan with the same terms.
If a customer’s account becomes delinquent, we work with the customer and/or the cosigner to understand their ability to make ongoing payments. If the customer is in financial hardship, we work with the customer and/or cosigner to understand their financial circumstances and identify any available alternative arrangements designed to reduce monthly payment obligations. These can include extended repayment schedules, temporary interest rate reductions and, if appropriate, short-term hardship forbearance (which typically is retroactive and granted by our collections department), suited to their individual circumstances and ability to make payments. Our servicing department also grants prospective forbearance in increments of three months at a time, for up to 12 months, if a customer who is current requests it. When we grant forbearance, we counsel customers on the effect forbearance will have on their loan balance.
In some cases, loan modifications and other efforts may be insufficient for those experiencing extreme long-term hardship. Sallie Mae has long supported bankruptcy reform that (i) would permit the discharge of education loans, both private and federal, after a required period of good faith attempts to repay and (ii) is prospective in application, so as not to rewrite existing contracts. Any reform should recognize education loans have unique characteristics and benefits as compared to other consumer loan classes.
Key Drivers of Private Education Loan Market Growth
The size of the Private Education Loan market is based primarily on three factors: college enrollment levels, the costs of attending college, and the availability of funds from the federal government to pay for a college education. The amounts students and their families can contribute toward college costs and the availability of scholarships and institutional grants are also important. If the cost of education increases at a pace exceeding the sum of family income, savings, federal lending, and scholarships, more students and families can be expected to rely on Private Education Loans. If enrollment levels or college costs decline, or the availability of federal education loans, grants or subsidies and scholarships significantly increases, Private Education Loan demand could decrease.
7
We focus primarily on students attending public and private not-for-profit four-year degree granting institutions. We lend to some students attending two-year and for-profit schools. Due to the low cost of two-year programs, federal grant and loan programs are typically sufficient for the funding needs of these students. The for-profit industry has been the subject of increased scrutiny and regulation over the last several years. Since 2007, we have reduced the number of for-profit institutions included in our lending program. Approximately 10 percent or $505 million of our 2018 Private Education Loan originations were for students attending for-profit schools. The for-profit schools where we continue to do business are primarily focused on career training and health care fields. We expect students who attend and complete programs at for-profit schools to support the same repayment performance as students who attend and graduate from public and private not-for-profit four-year degree granting institutions.
Our competitors
1
in the Private Education Loan market include large banks such as Wells Fargo Bank, N.A., Discover Bank, Citizens Financial Group, Inc. and PNC Bank, National Association, as well as a number of smaller specialty finance companies and members of the Education Finance Council. Beginning in 2019, Navient, from whom we separated in 2014, can begin to originate Private Education Loans and consolidate loans already in our portfolio. We compete based on our products, originations capability, and customer service.
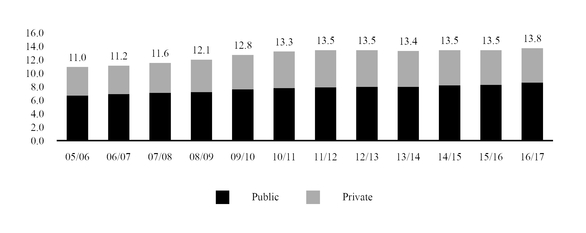
Enrollment
We expect modest enrollment growth over the next several years.
Enrollment at Four-Year Degree Granting Institutions
2
(in millions)
|
•
|
According to the U.S. Department of Education’s projections released in September 2017, the high school graduate population is projected to remain relatively flat from 2019 to 2025.
2
|
_________________________
1
Source: MeasureOne Q1 2018 Private Student Loan Report, June 2018. www.measureone.com.
2
Source: U.S. Department of Education, National Center for Education Statistics, Projections of Education Statistics to 2025 (NCES, September 2017), Enrollment in Postsecondary Institutions (NCES, November 2017). These are the most recent sources available to us for this information.
8
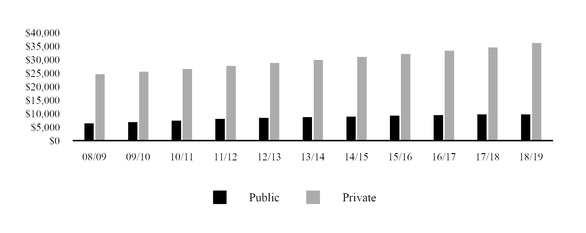
Tuition Rates
|
•
|
Average published tuition and fees (exclusive of room and board) at four-year public and private not-for-profit institutions increased at compound annual growth rates of 4.5 percent and 3.7 percent, respectively, from academic years (“AYs”) 2008-2009 through 2018-2019. Growth rates have been more modest the last two AYs, with average published tuition and fees at public and private four-year not-for-profit institutions increasing 3.2 percent and 3.6 percent, respectively, between AYs 2016-2017 and 2017-2018 and 2.5 percent and 3.3 percent, respectively, between AYs 2017-2018 and 2018-2019.
3
Tuition and fees are likely to continue to grow at the more modest rates of recent years.
|
Published Tuition and Fees
3
(Dollars in actuals)
______
3
Source: The College Board-Trends in College Pricing 2018. © 2018 The College Board. www.collegeboard.org. The College Board restates its data annually, which may cause previously reported results to vary.
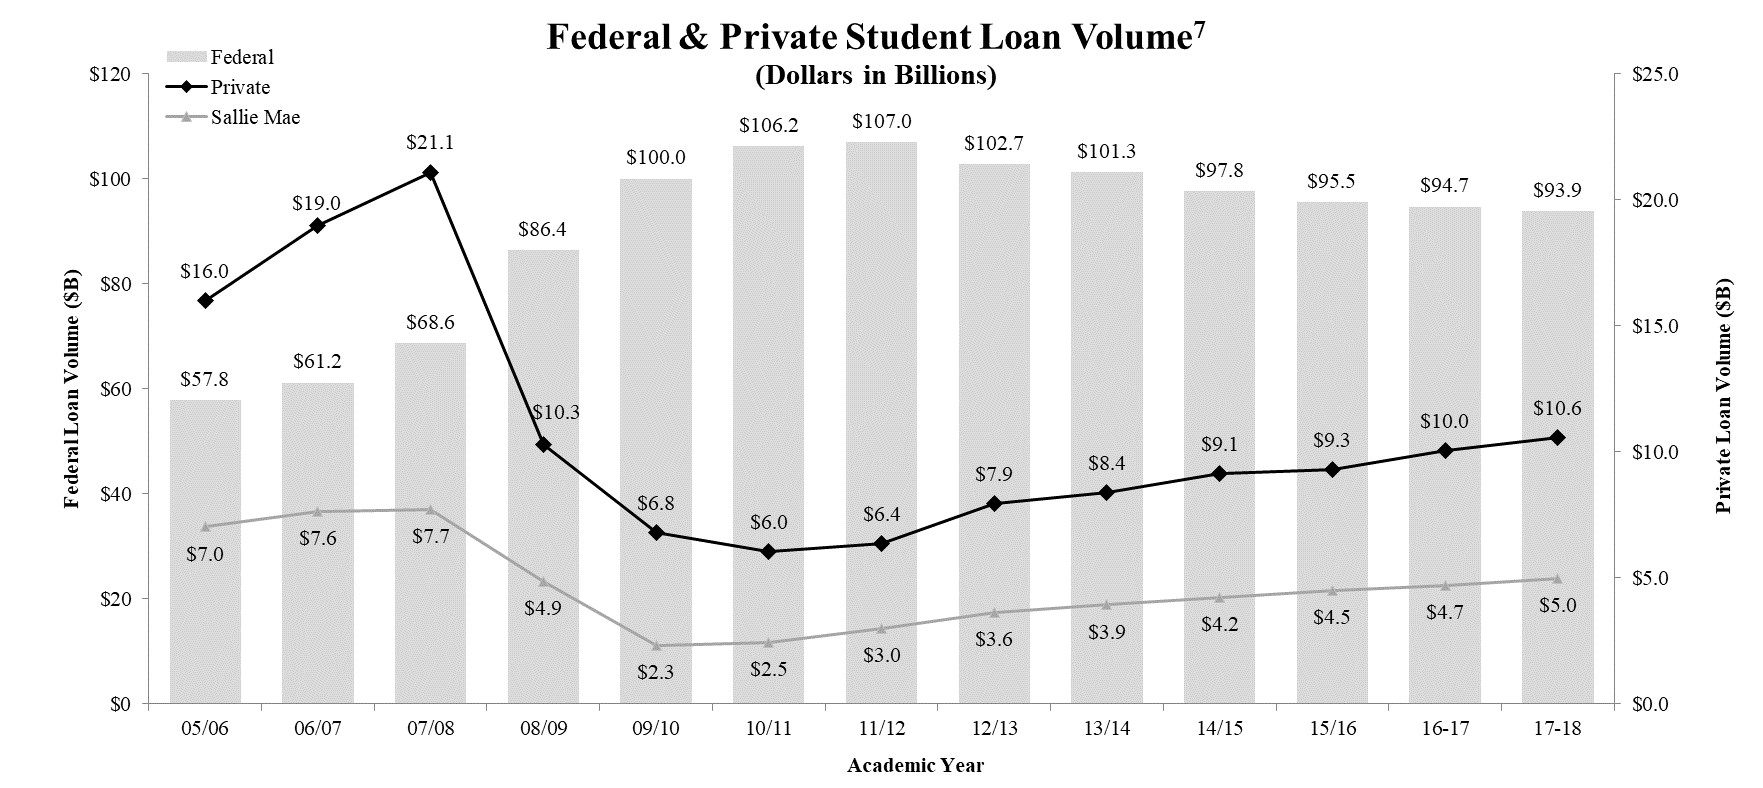
Sources of Funding
|
•
|
Borrowing through federal education loan programs increased at a compound annual growth rate of 10 percent between AYs 2005-2006 and 2011-2012.
6
Federal borrowing increased considerably during the recession, with borrowing increasing 26 percent between AYs 2007-2008 and 2008-2009 alone. In response to the recession, unsubsidized Stafford loan limits for undergraduate students were raised and have not been adjusted since 2008.
4
Federal education loan program borrowing peaked in AY 2011-2012. Since then it has declined every year. We believe these declines are principally driven by enrollment declines in the for-profit schools’ sector.
5
Between AYs 2007-2008 and 2017-2018, federal grants for college students increased 121 percent to $41.7 billion.
6
|
_________________________
4
Source: FinAid, History of Student Financial Aid and Historical Loan Limits. © 2017 by FinAid. www.FinAid.org.
5
Source: U.S. Department of Education, National Center for Education Statistics, Enrollment in Postsecondary Institutions (NCES, November 2017).
6
Source: The College Board-Trends in Student Aid 2018. © 2018 The College Board. www.collegeboard.org.
9
These increases in federal financing for higher education had a significant impact on the market for Private Education Loans. Annual originations of Private Education Loans peaked at $21.1 billion in AY 2007-2008 and declined to $6.0 billion in AY 2010-2011. Contributing to the decline in Private Education Loan originations was a significant tightening of underwriting standards by Private Education Loan providers, including Sallie Mae. Private Education Loan originations increased to an estimated $10.6 billion in AY 2017-2018, up 6.0 percent over the previous year.
7
_______
7
Source: The College Board-Trends in Student Aid 2016.
©
2016 The College Board.
www.collegeboard.org
and The College Board-Trends in Student Aid 2018.
©
2018 The College Board.
www.collegeboard.org
. Funding sources in current dollars and include federal and private loan data. 2018 Private Education market assumptions use The College Board-Trends in Student Aid 2016
©
2016 trends and College Board-Trends in Student Aid 2018
©
2018 data. Other sources for the size of the Private Education Loan market exist and may cite the size of the market differently. We believe the College Board source includes Private Education Loans made by major financial institutions in the Private Education Loan market, with an unknown adjustment for Private Education Loans made by smaller lenders such as credit unions. The College Board restates its data annually, which may cause previously reported results to vary.
10
|
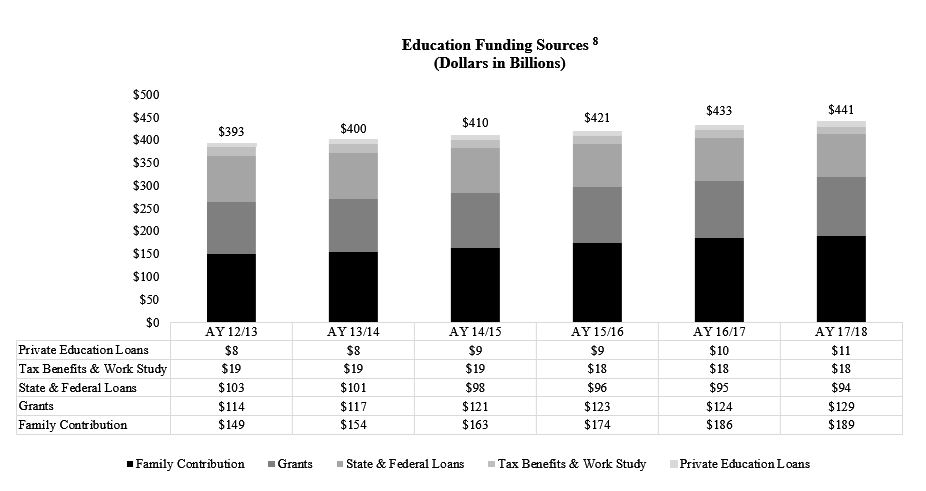
•
|
We estimate total spending on higher education was $441 billion in the AY 2017-2018, up from $393 billion in the AY 2012-2013. Private Education Loans represent just 2 percent of total spending on higher education. Modest growth in total spending can lead to meaningful increases in Private Education Loans in the absence of growth in other sources of funding.
8
|
|
•
|
Over the AY 2012-2018 period, increases in total spending have been absorbed primarily through increased family contributions. If household finances continue to improve, we would expect this trend to continue.
|
_________________________
|
8
Source: Total post-secondary education spending is estimated by Sallie Mae determining the full-time equivalents for both graduates and undergraduates and multiplying by the estimated total per person cost of attendance for each school type. In doing so, we utilize information from the U.S. Department of Education, National Center for Education Statistics, Projections of Education Statistics to 2025 (NCES 2017, September 2017), The Integrated Postsecondary Education Data System (IPEDS), College Board -Trends in Student Aid 2016. © 2016 The College Board, www.collegeboard.org, College Board -Trends in Student Aid 2018. © 2018 The College Board, www.collegeboard.org, College Board -Trends in Student Pricing 2018. © 2018 The College Board, www.collegeboard.org, National Student Clearinghouse - Term Enrollment Estimates, and Company analysis. 2018 Private Education market assumptions use The College Board-Trends in Student Aid 2016
©
2016 trends and College Board-Trends in Student Aid 2018
©
2018 data. Other sources for these data points also exist publicly and may vary from our computed estimates. NCES, IPEDS, and College Board restate their data annually, which may cause previous reports to vary. We have also recalculated figures in our Company analysis to standardize all costs of attendance to dollars not adjusted for inflation. This has a minimal impact on historically-stated numbers.
|
11
Supervision and Regulation
Overview
We are subject to extensive regulation, examination and supervision by various federal, state and local authorities. The more significant aspects of the laws and regulations that apply to us and our subsidiaries are described below. These descriptions are qualified in their entirety by reference to the full text of the applicable statutes, legislation, regulations and policies, as they may be amended, and as interpreted and applied, by federal, state and local agencies.
The Dodd-Frank Wall Street Reform and Consumer Protection Act of 2010 (the “Dodd-Frank Act”) was adopted to reform and strengthen regulation and supervision of the U.S. financial services industry. It contains comprehensive provisions to govern the practices and oversight of financial institutions and other participants in the financial markets. It mandates significant regulations, additional requirements and oversight on almost every aspect of the U.S. financial services industry, including increased capital and liquidity requirements, limits on leverage and enhanced supervisory authority. It requires the issuance of many regulations, which will take effect over several years.
Consumer Protection Laws and Regulations
Our origination, servicing, first-party collection and deposit taking activities subject us to federal and state consumer protection, privacy and related laws and regulations. Some of the more significant laws and regulations that are applicable to our business include:
|
•
|
various state and federal laws governing unfair, deceptive or abusive acts or practices;
|
|
•
|
the federal Truth-In-Lending Act and Regulation Z, which govern disclosures of credit terms to consumer borrowers;
|
|
•
|
the Fair Credit Reporting Act and Regulation V, which govern the use and provision of information to consumer reporting agencies;
|
|
•
|
the Equal Credit Opportunity Act and Regulation B, which prohibit creditor practices that discriminate on the basis of race, religion and other prohibited factors in extending credit;
|
|
•
|
the SCRA, which applies to all debts incurred prior to commencement of active military service (including education loans) and limits the amount of interest, including fees, that may be charged;
|
|
•
|
the Truth in Savings Act and Regulation DD, which mandate certain disclosures related to consumer deposit accounts;
|
|
•
|
the Expedited Funds Availability Act, Check Clearing for the 21st Century Act and Regulation CC issued by the Federal Reserve Bank (“FRB”), which relate to the availability of deposit funds to consumers;
|
|
•
|
the Right to Financial Privacy Act, which imposes a duty to maintain the confidentiality of consumer financial records and prescribes procedures for complying with federal government requests for and subpoenas of financial records;
|
|
•
|
the Electronic Funds Transfer Act and Regulation E, which govern automated transfers of funds and consumers’ rights related thereto;
|
|
•
|
the Telephone Consumer Protection Act, which governs communication methods that may be used to contact customers; and
|
|
•
|
the Gramm-Leach-Bliley Act, which governs the ability of financial institutions to disclose nonpublic information about consumers to non-affiliated third-parties.
|
12
Consumer Financial Protection Bureau
The Consumer Financial Protection Act, a part of the Dodd-Frank Act, established the CFPB, which has broad authority to promulgate regulations under federal consumer financial protection laws and to directly or indirectly enforce those laws, including providing regulatory oversight of the Private Education Loan industry, and to examine financial institutions for compliance. It is authorized to collect fines and order consumer restitution in the event of violations, engage in consumer financial education, track consumer complaints, request data and promote the availability of financial services to underserved consumers and communities. It has authority to prevent unfair, deceptive or abusive acts and practices by issuing regulations that define the same or by using its enforcement authority without first issuing regulations. The CFPB has been active in its supervision, examination and enforcement of financial services companies, notably bringing enforcement actions, imposing fines and mandating large refunds to customers of several large banking institutions. On January 1, 2015, the CFPB became the Bank’s primary consumer compliance supervisor with compliance examination authority and primary consumer protection enforcement authority. The CFPB began its formal examination of us in 2016. The UDFI and FDIC remain the prudential regulatory authorities with respect to the Bank’s financial strength.
The Dodd-Frank Act created the Private Education Loan Ombudsman within the CFPB to receive and attempt to informally resolve inquiries about Private Education Loans. The Private Education Loan Ombudsman reports to Congress annually on the trends and issues identified through this process. The CFPB continues to take an active interest in the student loan industry, undertaking a number of initiatives related to the Private Education Loan market and student loan servicing.
Regulation of Sallie Mae Bank
The Bank was chartered in 2005 and is a Utah industrial bank regulated by the FDIC, the UDFI and the CFPB. We are not a bank holding company under the Bank Holding Company Act and therefore are not subject to the federal regulations applicable to bank holding companies. However, we and our non-bank subsidiaries are subject to regulation and oversight as institution-affiliated parties. The following discussion sets forth some of the elements of the bank regulatory framework applicable to us, the Bank and our other non-bank subsidiaries.
General
The Bank is currently subject to prudential regulation and examination by the FDIC and the UDFI, and consumer compliance regulation and examination by the CFPB. Numerous other federal and state laws and regulations govern almost all aspects of the operations of the Bank and, to some degree, our operations and those of our non-bank subsidiaries as institution-affiliated parties.
Actions by Federal and State Regulators
Under federal and state laws and regulations pertaining to the safety and soundness of insured depository institutions, the UDFI and the FDIC have the authority to compel or restrict certain actions of the Bank if it is determined to lack sufficient capital or other resources, or is otherwise operating in a manner deemed to be inconsistent with safe and sound banking practices. Under this authority, the Bank’s regulators can require it to enter into informal or formal supervisory agreements, including board resolutions, memoranda of understanding, written agreements and consent or cease and desist orders, pursuant to which the Bank would be required to take identified corrective actions to address cited concerns and refrain from taking certain actions.
13
Enforcement Powers of Regulators
As “institution-affiliated parties” of the Bank, we, our non-bank subsidiaries and our management, employees, agents, independent contractors and consultants are subject to potential civil and criminal penalties for violations of law, regulations or written orders of a government agency. Violations can include failure to timely file required reports, filing false or misleading information or submitting inaccurate reports. Civil penalties may be as high as $1,000,000 per day for such violations, and criminal penalties for some financial institution crimes may include imprisonment for 20 years. Regulators have flexibility to commence enforcement actions against institutions and institution-affiliated parties, and the FDIC has the authority to terminate deposit insurance. When issued by a banking agency, cease and desist and similar orders may, among other things, require affirmative action to correct any harm resulting from a violation or practice, including by compelling restitution, reimbursement, indemnifications or guarantees against loss. A financial institution may also be ordered to restrict its growth, dispose of certain assets, rescind agreements or contracts, or take other actions determined to be appropriate by the ordering agency. The federal banking regulators also may remove a director or officer from an insured depository institution (or bar them from the industry) if a violation is willful or reckless.
On May 13, 2014, the Bank reached settlement with the Department of Justice (the “DOJ”) regarding compliance with the SCRA. In connection with the settlement, the Bank became subject to a Consent Order (the “DOJ Consent Order”), which was approved by the U.S. District Court for the District of Delaware on September 29, 2014. Under the terms of the Separation and Distribution Agreement executed in connection with the Spin-Off (the “Separation and Distribution Agreement”), Navient is responsible for funding all liabilities under the order and, as of the date hereof, has funded all liabilities other than fines directly levied against the Bank in connection with this matter which the Bank is required to pay.
The DOJ Consent Order expired by its terms on September 29, 2018, and the related case was dismissed with prejudice on October 4, 2018.
In May 2014, the Bank received a Civil Investigative Demand (“CID”) from the CFPB as part of the CFPB’s separate investigation relating to customer complaints, fees and charges assessed in connection with the servicing of student loans and related collection practices of pre-Spin-Off SLM by entities now subsidiaries of Navient during a time period prior to the Spin-Off (the “CFPB Investigation”). Two state attorneys general also provided the Bank identical CIDs and other state attorneys general have become involved in the inquiry over time (collectively, the “Multi-State Investigation”). To the extent requested, the Bank has been cooperating fully with the CFPB and the attorneys general conducting the Multi-State Investigation. Given the timeframe covered by the CIDs, the CFPB Investigation and the Multi-State Investigation, and the focus on practices and procedures previously conducted by Navient and its servicing subsidiaries prior to the Spin-Off, Navient is leading the response to these investigations. Consequently, we have no basis from which to estimate either the duration or ultimate outcome of these investigations.
With regard to the CFPB Investigation, we note that on January 18, 2017, the CFPB filed a complaint in federal court in Pennsylvania against Navient, along with its subsidiaries, Navient Solutions, Inc. and Pioneer Credit Recovery, Inc. The complaint alleges these Navient entities, among other things, engaged in deceptive practices with respect to their historic servicing and debt collection practices. Neither SLM, the Bank, nor any of their current subsidiaries are named in, or otherwise a party to, the lawsuit and are not alleged to have engaged in any wrongdoing. The CFPB’s complaint asserts Navient’s assumption of these liabilities pursuant to the Separation and Distribution Agreement.
On January 18, 2017, the Illinois Attorney General filed a lawsuit in Illinois state court against Navient - its subsidiaries Navient Solutions, Inc., Pioneer Credit Recovery, Inc., and General Revenue Corporation - and the Bank arising out of the Multi-State Investigation. On March 20, 2017, the Bank moved to dismiss the Illinois Attorney General action as to the Bank, arguing, among other things, the complaint failed to allege with sufficient particularity or specificity how the Bank was responsible for any of the alleged conduct, most of which predated the Bank’s existence. On July 10, 2018, the Court granted the Bank’s motion to dismiss without prejudice. On August 7, 2018, the Illinois Attorney General filed a First Amended Complaint and, on October 9, 2018, the Bank again moved to dismiss the action based on grounds similar to those raised in its March 20, 2017 motion. The Illinois Attorney General filed its response on November 21, 2018, and the Bank filed its reply on December 10, 2018. Oral argument on the motion took place on January 9, 2019. The Court took the motion under advisement.
On July 17, 2018, the Mississippi Attorney General filed a lawsuit in Mississippi state court against Navient, Navient Solutions, LLC, and the Bank arising out of the Multi-State Investigation. The complaint alleges unfair and deceptive trade practices against all three defendants as to private loan origination practices from 2000 to 2009, and against the two Navient
14
defendants as to servicing practices between 2010 and the present. The complaint further alleges that Navient assumed responsibility for these matters under the Separation and Distribution Agreement for alleged conduct that pre-dated the Spin-Off. On September 27, 2018, the Mississippi Attorney General filed an amended complaint. On October 8, 2018, the Bank moved to dismiss the Mississippi Attorney General’s action as to the Bank, arguing, among other things, that the complaint failed to allege with sufficient particularity or specificity how the Bank was responsible for any of the alleged conduct, most of which predated the Bank’s existence. On November 20, 2018, the Mississippi Attorney General filed an opposition brief, and the Bank filed a reply on December 21, 2018. A hearing on the motion to dismiss is scheduled for April 11, 2019.
To date, three other state attorneys general (California, Washington and Pennsylvania) have filed suits against Navient and one or more of its current subsidiaries arising out of the Multi-State Investigation. Neither SLM, the Bank, nor any of their current subsidiaries are named in, or otherwise a party to, the California, Washington or Pennsylvania lawsuits, and no claims are asserted against them. Each complaint asserts in its own fashion that Navient assumed responsibility under the Separation and Distribution Agreement for the alleged conduct in the complaints prior to the Spin-Off. On September 24, 2018, the Washington Attorney General served a third-party subpoena on the Bank calling for the production of certain records. The Bank has responded to the subpoena.
Additional lawsuits may arise from the Multi-State Investigation which may or may not name the Company, the Bank or any of their current subsidiaries as parties to these suits. Pursuant to the terms of the Separation and Distribution Agreement, and as contemplated by the structure of the Spin-Off, Navient is legally obligated to indemnify the Bank against all claims, actions, damages, losses or expenses that may arise from the conduct of all activities of pre-Spin-Off SLM occurring prior to the Spin-Off, except for certain liabilities related to the conduct of the pre-Spin-Off consumer banking business that were specifically assumed by the Bank (and as to which the Bank is obligated to indemnify Navient). Navient has acknowledged its indemnification obligations under the Separation and Distribution Agreement, in connection with the Multi-State Investigation and the related lawsuits in which the Bank has been named as a party, and has indemnified the Bank for all costs incurred to date in defending the Illinois lawsuit. Navient has informed the Bank, however, that it believes that the Bank may be responsible to indemnify Navient against certain potential liabilities arising from the above-described lawsuits under the Separation and Distribution Agreement and/or a separate loan servicing agreement between the parties, and has suggested that the parties defer further discussion regarding indemnification obligations, and reimbursement of ongoing legal costs, in connection with the lawsuits until the lawsuits are resolved. The Bank disagrees with Navient’s position and the Bank has reiterated to Navient that Navient is responsible for promptly indemnifying the Bank against all liabilities arising out of the conduct of pre-Spin-Off SLM that are at issue in the Multi-State Investigation and in the above-described lawsuits.
Standards for Safety and Soundness
The Federal Deposit Insurance Act requires the federal bank regulatory agencies such as the FDIC to prescribe, by regulation or guidance, operational and managerial standards for all insured depository institutions, such as the Bank, relating to internal controls, information systems and audit systems, loan documentation, credit underwriting, interest rate risk exposure, and asset quality. The agencies also must prescribe standards for earnings and stock valuation, as well as standards for compensation, fees and benefits. The federal banking regulators have implemented these required standards through regulations and interagency guidance designed to identify and address problems at insured depository institutions before capital becomes impaired. Under the regulations, if a regulator determines a bank fails to meet any prescribed standards, the regulator may require the bank to submit an acceptable plan to achieve compliance, consistent with deadlines for the submission and review of such safety and soundness compliance plans.
Dividends
The Bank is chartered under the laws of the State of Utah and its deposits are insured by the FDIC. The Bank’s ability to pay dividends is subject to the laws of Utah and the regulations of the FDIC. Generally, under Utah’s industrial bank laws and regulations as well as FDIC regulations, the Bank may pay dividends to the Company from its net profits without regulatory approval if, following the payment of the dividend, the Bank’s capital and surplus would not be impaired. The Bank paid no dividends on its common stock for the years ended December 31, 2018, 2017 and 2016.
The Company pays quarterly cash dividends on its outstanding Floating-Rate Non-Cumulative Preferred Stock, Series B (the “Series B Preferred Stock”) when, as, and if declared by its Board of Directors, in the Board’s discretion. On January 23, 2019, the Company announced that it had initiated a new policy to pay a regular, quarterly cash dividend on its common stock
15
as well, beginning in the first quarter of 2019, and its Board of Directors had approved a new common stock share repurchase program.
Common stock dividend declarations are subject to determination by, and the discretion of, the Company’s Board of Directors. The Company may change its new common stock dividend policy at any time.
The new share repurchase program, which was effective upon announcement and expires on January 22, 2021, permits the Company to repurchase from time to time shares of its common stock up to an aggregate repurchase price not to exceed $200 million. The timing and volume of any repurchases will be subject to market conditions, and there can be no guarantee that the Company will repurchase up to the limit of the program or at all.
We expect that the Bank will pay dividends to the Company as may be necessary to enable the Company to pay any declared dividends on its Series B Preferred Stock and common stock and to consummate any common share repurchases by the Company under the new share repurchase program.
Regulatory Capital Requirements
The Bank is subject to various regulatory capital requirements administered by the FDIC and the UDFI. Failure to meet minimum capital requirements can initiate certain mandatory and possibly additional discretionary actions by regulators that, if undertaken, could have a material adverse effect on our business, results of operations and financial position. Under the FDIC’s regulations implementing the Basel III capital framework (“U.S. Basel III”) and the regulatory framework for prompt corrective action, the Bank must meet specific capital standards that involve quantitative measures of its assets, liabilities and certain off-balance sheet items as calculated under regulatory accounting practices. The Bank’s capital amounts and its classification under the prompt corrective action framework are also subject to qualitative judgments by the regulators about components of capital, risk weightings and other factors.
U.S. Basel III is aimed at increasing both the quantity and quality of regulatory capital. Certain aspects of U.S. Basel III, including new deductions from and adjustments to regulatory capital and a capital conservation buffer, are being phased in over several years.
The Bank is subject to the following minimum capital ratios under U.S. Basel III: a Common Equity Tier 1 risk-based capital ratio of 4.5 percent, a Tier 1 risk-based capital ratio of 6.0 percent, a Total risk-based capital ratio of 8.0 percent, and a Tier 1 leverage ratio of 4.0 percent. In addition, the Bank is subject to a phased-in Common Equity Tier 1 capital conservation buffer: 1.875 percent for 2018; and the fully phased-in level of greater than 2.5 percent effective as of January 1, 2019. Failure to maintain the buffer will result in restrictions on the Bank’s ability to make capital distributions, including the payment of dividends, and to pay discretionary bonuses to executive officers. Including the buffer, as of January 1, 2019, the Bank is required to maintain the following minimum capital ratios: a Common Equity Tier 1 risk-based capital ratio of greater than 7.0 percent, a Tier 1 risk-based capital ratio of greater than 8.5 percent and a Total risk-based capital ratio of greater than 10.5 percent.
To qualify as “well capitalized” under the prompt corrective action framework for insured depository institutions, the Bank must maintain a Common Equity Tier 1 risk-based capital ratio of at least 6.5 percent, a Tier 1 risk-based capital ratio of at least 8.0 percent, a Total risk-based capital ratio of at least 10.0 percent, and a Tier 1 leverage ratio of at least 5.0 percent.
Stress Testing Requirements
The Dodd-Frank Act as enacted imposed stress testing requirements on banking organizations with total consolidated assets, averaged over the four most recent consecutive quarters, of more than $10 billion. As of September 30, 2014, the Bank met this asset threshold. Under the FDIC’s implementing regulations, the Bank was required to conduct annual company-run stress tests utilizing scenarios provided by the FDIC. The Bank completed its third annual stress test using the scenarios provided with the January 1, 2018 stress testing cycle. As a result of the passage of the Economic Growth, Regulatory Relief, and Consumer Protection Act, signed into law on May 24, 2018, the Bank became exempt from formally filing and publishing the results. However, under regulatory guidance, the Bank still conducts annual capital stress tests, the results of which it presents to its prudential regulators - the FDIC and the UDFI - for their review. The Bank also conducts annual and quarterly
16
liquidity stress tests to evaluate the adequacy of its liquidity sources under various stress scenarios and submits the results of those tests to its prudential regulators.
Deposit Insurance and Assessments
Deposits at the Bank are insured up to the applicable legal limits by the FDIC - administered Deposit Insurance Fund (the “DIF”), which is funded primarily by quarterly assessments on insured banks. An insured bank’s assessment is calculated by multiplying its assessment rate by its assessment base. A bank’s assessment base and assessment rate are determined each quarter.
The Bank’s insurance assessment base currently is its average consolidated total assets minus its average tangible equity during the assessment period. The Bank’s assessment rate is determined by the FDIC using a number of factors, including the results of supervisory evaluations, the Bank’s capital ratios and its financial condition, as well as the risk posed by the Bank to the DIF. Assessment rates for insured banks also are subject to adjustment depending on a number of factors, including significant holdings of brokered deposits in certain instances and the issuance or holding of certain types of debt.
Deposits
With respect to brokered deposits, an insured depository institution must be well capitalized to accept, renew or roll over such deposits without FDIC clearance. An adequately capitalized insured depository institution must obtain a waiver from the FDIC to accept, renew or roll over brokered deposits. Undercapitalized insured depository institutions generally may not accept, renew or roll over brokered deposits. For more information on the Bank’s deposits, see Part II, Item 7. “Management’s Discussion and Analysis of Financial Condition and Results of Operations — Key Financial Measures — Funding Sources.”
Regulatory Examinations
The Bank currently undergoes regular on-site examinations by the Bank’s regulators, who examine for adherence to a range of legal and regulatory compliance responsibilities. A regulator conducting an examination has complete access to the books and records of the examined institution. The results of the examination are confidential. The cost of examinations may be assessed against the examined institution as the agency deems necessary or appropriate.
Source of Strength
Under the Dodd-Frank Act, we are required to serve as a source of financial strength to the Bank and to commit resources to support the Bank in circumstances when we might not do so absent the statutory requirement. Any loan by us to the Bank would be subordinate in right of payment to depositors and to certain other indebtedness of the Bank.
Community Reinvestment Act
The Community Reinvestment Act (the “CRA”) requires the FDIC to evaluate the record of the Bank in meeting the credit needs of its local community, including low- and moderate-income neighborhoods. These evaluations are considered in evaluating mergers, acquisitions and applications to open a branch or facility. Failure to adequately meet these criteria could result in additional requirements and limitations on the Bank. The Bank has received a CRA rating of Outstanding.
Privacy Laws
The federal banking regulators, as required by the Gramm-Leach-Bliley Act, have adopted regulations that limit the ability of banks and other financial institutions to disclose nonpublic information about consumers to nonaffiliated third-parties. Financial institutions are required to disclose to consumers their policies for collecting and protecting confidential customer information. Customers generally may prevent financial institutions from sharing nonpublic personal financial information with nonaffiliated third-parties, with some exceptions, such as the processing of transactions requested by the consumer. Financial institutions generally may not disclose certain consumer or account information to any nonaffiliated third-party for use in telemarketing, direct mail marketing or other marketing. The privacy regulations also restrict information sharing among affiliates for marketing purposes and govern the use and provision of information to consumer reporting agencies. Federal and
17
state banking agencies have prescribed standards for maintaining the security and confidentiality of consumer information, and the Bank is subject to such standards, as well as certain federal and state laws or standards for notifying consumers in the event of a security breach.
Other Sources of Regulation
Many other aspects of our businesses are subject to federal and state regulation and administrative oversight. Some of the most significant of these are described below.
Oversight of Derivatives
Title VII of the Dodd-Frank Act requires all standardized derivatives, including most interest rate swaps, to be submitted for clearing to central intermediaries to reduce counterparty risk. Two of the central intermediaries we use are the Chicago Mercantile Exchange (the “CME”) and the London Clearing House (the “LCH”). The CME and the LCH made amendments to their respective rules that resulted in the prospective accounting treatment of certain daily variation margin payments being considered as the legal settlement of the outstanding exposure of the derivative instead of the posting of collateral. The CME rule changes, which became effective in January 2017, and the LCH rule changes, which became effective in January 2018, result in all variation margin payments on derivatives cleared through the CME and LCH being accounted for as legal settlement. As of December 31, 2018, $
5.4
billion notional of our derivative contracts were cleared on the CME and $0.6 billion were cleared on the LCH. The derivative contracts cleared through the CME and the LCH represent 90.2 percent and 9.8 percent, respectively, of our total notional derivative contracts of $6.0 billion at December 31, 2018. See Part II, Item 7. “Management’s Discussion and Analysis of Financial Condition and Results of Operations — Critical Accounting Policies and Estimates — Derivative Accounting” for information regarding amendments made by the CME and the LCH to their respective rules resulting in prospective accounting treatment of certain daily variation margin payments being considered as the legal settlement of the outstanding exposure of the derivative instead of the posting of collateral. Our exposure is limited to the value of the derivative contracts in a gain position less any collateral held and plus any collateral posted. When there is a net negative exposure, we consider our exposure to the counterparty to be zero.
Credit Risk Retention
In October 2014, the Department of the Treasury, the Federal Reserve, the Office of the Comptroller of the Currency, the FDIC, the SEC, the Federal Housing Finance Agency and the Department of Housing and Urban Development issued final rules to implement the credit risk retention requirements of Section 941 of the Dodd-Frank Act for ABS, including those backed by residential and commercial mortgages and automobile, commercial, credit card, and student loans, except for certain transactions with limited connections to the United States and U.S. investors. The final Dodd-Frank risk retention rules generally require sponsors of ABS, such as Sallie Mae, to retain an economic interest in an ABS transaction that represents at least five percent of the credit risk of the assets being securitized. The final rules took effect in December 2015 for securitization transactions backed by residential mortgages and became effective in December 2016 for other securitization transactions, including those collateralized by Private Education Loans. The Bank early adopted the Dodd-Frank risk retention rules beginning with its 2016-A securitization transaction completed in May 2016. For its 2016-A transaction and subsequent securitizations to date, the Bank complies with the Dodd-Frank risk retention rules by retaining (for a requisite period of time) an “eligible horizontal interest” comprised of residual certificates representing at least 5 percent of the fair value of all interests issued in the securitization transaction, determined as of the date sale. Prior to May 2016, the Bank’s on-balance sheet securitizations complied with the credit risk retention requirements of the FDIC “safe harbor” rule, which generally reduces the risk to securitization investors in the event of an insolvency of the Bank, by retaining 5 percent of each class of securities issued in each securitization transaction. The risk retention provisions of the FDIC safe harbor rule were superseded by the Dodd-Frank risk retention rules.
Anti-Money Laundering, the USA PATRIOT Act, and U.S. Economic Sanctions
The USA PATRIOT Act of 2001 (the “USA Patriot Act”), which amended the Bank Secrecy Act, substantially broadened the scope of United States anti-money laundering laws and regulations by imposing significant new compliance and due diligence obligations, creating new crimes and penalties and expanding the extra-territorial jurisdiction of the United States. The U.S. Treasury Department has issued and, in some cases proposed, a number of regulations that apply various requirements
18
of the USA Patriot Act to financial institutions such as the Bank. These regulations impose obligations on financial institutions to maintain appropriate internal policies, procedures and controls to detect, prevent and report money laundering and terrorist financing and to verify the identity of their customers. In addition, U.S. law generally prohibits or substantially restricts U.S. persons from doing business with countries designated by the U.S. Department of State as state sponsors of terrorism. Under U.S. law, there are similar prohibitions or restrictions with countries subject to other U.S. economic sanctions administered by the U.S. Department of the Treasury’s Office of Foreign Assets Control or other agencies. We maintain policies and procedures designed to ensure compliance with relevant U.S. laws and regulations applicable to U.S. persons.
Volcker Rule
In December 2013, the U.S. banking agencies, the SEC and the U.S. Commodity Futures Trading Commission issued final rules to implement the “Volcker Rule” provisions of the Dodd-Frank Act. The rules prohibit insured depository institutions and their affiliates from engaging in proprietary trading and from investing in, sponsoring or having certain financial relationships with certain private funds. These prohibitions are subject to a number of important exclusions and exemptions that, for example, permit insured depository institutions and their affiliates to trade for risk-mitigating hedging and liquidity management, subject to certain conditions and restrictions. A conformance period ended on July 21, 2015. We do not expect the Volcker Rule to have a meaningful effect on our current operations or those of our subsidiaries, as we do not materially engage in the businesses prohibited by the Volcker Rule.
Employees
At
December 31, 2018
, we had approximately 1,700 employees, none of whom are covered by collective bargaining agreements.
19
Item 1A. Risk Factors
Economic Environment
Economic conditions could have a material adverse effect on our business, results of operations, financial condition and/or liquidity.
Our business is significantly influenced by economic conditions. In general, economic growth in the United States remains uneven. Employment levels in the United States are often sensitive not only to domestic economic growth but to the performance of major foreign economies and commodity prices. High unemployment rates and the failure of our in-school borrowers to graduate are two of the most significant macroeconomic factors that could increase loan delinquencies, defaults and loan modifications, or otherwise negatively affect performance of our existing education loan portfolios. Likewise, high unemployment and decreased savings rates may impede Private Education Loan and Personal Loan originations growth, as well as growth in credit cards and the development of other financial products, as loan applicants and cosigners may experience trouble repaying credit obligations or may not meet our credit standards. Additionally, if interest rates rise causing payments on variable-rate loans to increase, borrowers and cosigners could experience trouble repaying loans we have made to them. Consequently, for a number of reasons, our borrowers may experience more trouble in repaying loans we have made to them, which could increase our loan delinquencies, defaults and loan modifications. In addition, some consumers may find that higher education is an unnecessary investment during uncertain economic times and defer enrollment in educational institutions until the economy grows at a stronger pace, or they may turn to less costly forms of secondary education, thus decreasing our education loan application and funding volumes. Higher credit-related losses and weaker credit quality negatively affect our business, financial condition and results of operations and limit funding options, which could also adversely impact our liquidity position.
Competition/Concentration
We operate in a competitive environment. Our product offerings are primarily concentrated in loan products for higher education and deposit products for online depositors. Such concentrations and the competitive environment subject us to risks that could adversely affect our financial position.
At December 31, 2018, approximately 76 percent of our assets were comprised of Private Education Loans. This concentration poses the risk that any disruption, dislocation or other negative event or trend in the Private Education Loan market could disproportionately and adversely affect our business, financial condition and results of operations. We compete in the Private Education Loan and the Personal Loan markets with banks and other consumer lending institutions, many with strong consumer brand name recognition and greater financial resources. Many of those lenders also have a greater level of diversification in their mix of assets, which can enable them to be more competitive in uncertain or challenging economic times. Moreover, our competition will increase as various lending institutions and other competitors enter or re-enter the Private Education Loan and the Personal Loan markets. We compete based on our products, origination capability and customer service. To the extent our competitors compete more aggressively or effectively, we could lose market share to them or subject our existing loans to consolidation or refinancing risk.
Competition plays a significant role in our online deposit gathering activities. The market for online deposits is highly competitive, based primarily on a combination of reputation and rate. Increased competition for deposits could cause our cost of funds to increase, which could negatively impact our loan pricing and net interest margin.
In addition to competition with banks and other consumer lending institutions, the federal government, through the DSLP, poses significant competition to our Private Education Loan products. The availability and terms of loans the government originates or guarantees affect the demand for Private Education Loans because students and their families often rely on Private Education Loans to bridge a gap between available funds, including family savings, scholarships, grants, and federal and state loans, and the costs of post-secondary education. The federal government currently places both annual and aggregate limits on the amount of federal loans any student can receive and determines the criteria for student eligibility. Parents and graduate students may obtain additional federal education loans through other programs. These federal education lending programs are generally adjusted in connection with funding authorizations from the U.S. Congress for programs under the Higher Education Act of 1965 (the “HEA”). The HEA’s reauthorization is currently pending in the U.S. Congress, but it remains unclear if a
20
Republican-led Senate and Democratic-controlled House can produce legislation. Should legislation be enacted, one possible component could be increased federal education loan limits, which could decrease demand for Private Education Loans. Other components of any legislation also could have a negative impact on our business and financial condition.
Consumer access to alternative means of financing the costs of education and other factors may reduce demand for, or adversely affect our ability to retain, Private Education Loans, which could have a material adverse effect on our business, financial condition, results of operations and/or cash flows.
The demand for Private Education Loans could weaken if families and student borrowers use other vehicles to bridge the gap between available funds and costs of post-secondary education. These vehicles include, among others:
|
•
|
Home equity loans or other borrowings available to families to finance their education costs;
|
|
•
|
Pre-paid tuition plans, which allow students to pay tuition at today’s rates to cover tuition costs in the future;
|
|
•
|
Section 529 plans, which include both pre-paid tuition plans and college savings plans that allow a family to save funds on a tax-advantaged basis;
|
|
•
|
Education IRAs, now known as Coverdell Education Savings Accounts, under which a holder can make annual contributions for education savings;
|
|
•
|
Government education loan programs such as the DSLP; and
|
|
•
|
Direct loans from colleges and universities, as well as income sharing agreements with schools.
|
In addition, our ability to grow Private Education Loan originations and retain assets could be negatively affected if:
|
•
|
demographic trends in the United States result in a decrease in college-age individuals;
|
|
•
|
demand for higher education decreases;
|
|
•
|
the cost of attendance of higher education decreases;
|
|
•
|
prepayment rates on our Private Education Loans increase or accelerate due to greater market liquidity, availability of alternative means of financing, improved household incomes, increasing consumer confidence, and/or various other factors; or
|
|
•
|
public resistance to increasing higher education costs strengthens.
|
Consolidation or refinancing of existing Private Education Loans could have a material adverse effect on our business, financial condition, results of operations and/or cash flows.
We believe the design of our Private Education Loan products, with emphasis on rigorous underwriting, credit-worthy cosigners and variable or fixed interest rates, creates sustainable, competitive loan products. However, increasing amounts of private education consolidation loans at interest rates below those of our existing portfolio - whether from private sources (including financial technology (“FinTech”) companies) or otherwise - have contributed to an increase in the prepayment rates of our existing Private Education Loans and, if prolonged and continuous, could have a material adverse effect on our business, financial condition, results of operations and cash flows.
Since 2010, there have been a number of bills introduced in the United States Congress to promote federal financing for consolidation or refinancing of existing student loans, as well as an increase in the number of lenders offering similar products. Also, on July 31, 2018, the Office of the Comptroller of the Currency (the “OCC”) issued a policy statement announcing that it would consider applications from FinTech companies to become special purpose national banks. The special purpose national bank charter is available to qualifying companies engaged in a limited range of banking activities, including paying checks or lending money, but that do not take deposits. Concurrent with the announcement, the OCC issued a supplement to the Comptroller’s licensing manual to provide guidance for evaluating special purpose national bank charters for FinTechs. The New York Department of Financial Services and the Conference of State Banking supervisors have separately sued the OCC to stop it from granting applications for the special purpose national bank charter, arguing that the OCC lacks statutory authority
21
to charter special purpose national banks that do not take deposits. While the OCC has not approved any applications from FinTech companies for special purpose national bank charters, we are still evaluating the potential competitive impact if the OCC begins to charter FinTech companies that offer bank products and services, including loans to consolidate or refinance existing student loans.
We are dependent on key personnel and the loss of one or more of those key personnel could harm our business.
Our future success depends significantly on the continued services and performance of our management team. We believe our management team’s depth and breadth of experience in our industry is integral to executing our business plan. We also will need to continue to attract, motivate and retain other key personnel. The loss of the services of members of our management team or other key personnel to our competitors or other companies or the inability to attract additional qualified personnel as needed could have a material adverse effect on our business, financial position, results of operations and/or cash flows.
Regulatory
Failure to comply with consumer protection laws could subject us to civil and criminal penalties or litigation, including class actions, and have a material adverse effect on our business.
We are subject to a broad range of federal and state consumer protection laws applicable to our Private Education Loan and Personal Loan lending and retail banking activities, including laws governing fair lending, unfair, deceptive and abusive acts and practices, service member protections, interest rates and loan fees, disclosures of loan terms, marketing, servicing and collections. Such federal and state consumer protection laws also will be applicable to other consumer financial products that we may offer in the future, including credit cards.
Violations of, or changes in, federal or state consumer protection laws or related regulations, or in the prevailing interpretations thereof, may expose us to litigation, administrative fines, penalties and restitution, result in greater compliance costs, constrain the marketing of Private Education Loans or other products, adversely affect the collection of balances due on the loan assets held by us or by securitization trusts or otherwise adversely affect our business. We could incur substantial additional expense complying with these requirements and may be required to create new processes and information systems. Moreover, changes in federal or state consumer protection laws and related regulations, or in the prevailing interpretations thereof, could invalidate or call into question the legality of certain of our services and business practices.
The CFPB is the Bank’s primary consumer compliance supervisor, with exclusive authority to conduct examinations for the purposes of assessing compliance with the requirements of Federal consumer financial laws and with primary consumer compliance enforcement authority. CFPB jurisdiction could result in additional regulation and supervision, which could increase our costs and limit our ability to pursue business opportunities. Consent orders, decrees or settlements entered into with governmental agencies may also increase our compliance costs or restrict certain of our activities.
Finally, we operate in an environment of heightened political and regulatory scrutiny of education loan lending, servicing and originations. The rising cost of higher education, questions regarding the quality of education provided, particularly among for-profit institutions, and the increasing level of student loan debt in the United States have prompted this heightened and ongoing scrutiny. This environment could lead to further laws and regulations applicable to, or limiting, our business. As one example of potential laws and regulations limiting our business, increasing numbers of allegations or findings levied against for-profit institutions could lead us to further curtail the loans we make to students of these institutions or increase the risk of enforceability of our existing loans to graduates of particular institutions found to have fraudulently misrepresented or to have not provided reasonably expected training or educational benefits.
22
We operate in a highly regulated environment and the laws and regulations that govern our operations, or changes in these laws and regulations, or our failure to comply with them, may adversely affect us.
In addition to consumer protection laws, we are also subject to extensive regulation and supervision that govern almost all
aspects of our operations. Intended to protect clients, depositors, the DIF, and the overall financial system, these laws and regulations may, among other matters:
|
•
|
prescribe minimum capital requirements;
|
|
•
|
limit the rates of growth of our business;
|
|
•
|
impose limitations on the business activities in which we can engage;
|
|
•
|
limit the dividends or distributions the Bank can pay to us;
|
|
•
|
restrict the ability of institutions to guarantee our debt;
|
|
•
|
limit proprietary trading and investments in certain private funds;
|
|
•
|
impose certain specific accounting requirements on us that may be more restrictive; and
|
|
•
|
result in greater or earlier charges to earnings or reductions in our capital than would result under generally accepted accounting principles.
|
The FDIC has the authority to limit the Bank’s annual total balance sheet growth, but no such limitations were imposed in recent years. There can be no assurance that limitations will not be imposed in the future, however.
As our business, capital and balance sheet continue to grow, we expect to be able to achieve our annual Private Education Loan origination targets for 2019 without the need to sell loans to third-parties. We may reconsider loan sales from time to time, however, based on a number of factors, including our risk-based capital levels and input from our regulators.
Compliance with laws and regulations can be difficult and costly, and changes to laws and regulations, as well as increased intensity in supervision, often impose additional compliance costs. We, like the rest of the banking sector, are facing increased regulation and supervision of our industry by bank regulatory agencies and expect there may be additional and changing requirements and conditions imposed on us. Our failure to comply with these laws and regulations, even if the failure is inadvertent or reflects a difference in interpretation, could subject us to fines, other penalties and restrictions on our business activities, any of which could adversely affect our business, financial condition, cash flows, results of operations, capital base and/or the price of our securities.
Significant increases in our FDIC insurance premiums could have an adverse impact on our financial position, results of operations and/or cash flows.
Deposits at the Bank are insured up to the applicable legal limits by the DIF, which is funded primarily by quarterly assessments on insured banks. An insured bank’s assessment is calculated by multiplying its assessment rate by its assessment base. A bank’s assessment base and assessment rate are determined each quarter. See Item 1. “Business — Supervision and Regulation — Regulation of Sallie Mae Bank — Deposit Insurance and Assessments.”
On July 1, 2016, the FDIC began imposing a 4.5 basis point premium surcharge on banks, such as ours, with $10 billion or more in assets. The FDIC may further redefine how assessments are calculated, impose special assessments or surcharges on us or increase our deposit insurance premiums.
Regulatory agencies have increased their expectations with respect to how regulated institutions oversee their relationships with third-party vendors and service providers.
The CFPB and the FDIC have issued guidance to supervised banks with respect to increased responsibilities to supervise the activities of service providers to ensure compliance with federal consumer protection laws. The issuance of regulatory guidance and the enforcement of the enhanced vendor management standards via examination and investigation of us or any third-party with whom we do business may increase our costs, require increased management attention and adversely impact
23
our operations. In the event we should fail to meet the heightened standards for management of service providers, we could be subject to supervisory orders to cease and desist, civil monetary penalties or other actions due to claimed noncompliance, which could have an adverse effect on our business, financial condition, operating results and/or cash flows.
Capital and Liquidity
Adverse market conditions or an inability to effectively manage our liquidity risk could negatively impact our ability to meet our liquidity and funding needs, which could materially and adversely impact our business operations and our overall financial condition.
We must effectively manage the liquidity risk inherent in our business. We require liquidity to meet cash requirements for such things as day-to-day operating expenses, funding of our Private Education Loan and Personal Loan originations, deposit withdrawals and maturities, payment of any declared dividends on our preferred stock and common stock, and payment for any shares of common stock acquired under our common stock repurchase program or otherwise. Our primary sources of liquidity and funding are customer deposits, payments received on Private Education Loans and FFELP Loans that we hold, and proceeds from securitization transactions. We may maintain too much liquidity, which can be costly, or we may be too illiquid, which could result in financial distress during times of economic stress or capital market disruptions.
For at least the next several years, our ability to grow our business to its fullest potential will be heavily reliant on our ability to obtain deposits and obtain financing through asset-backed securitizations. Should growth opportunities exceed the pace at which we can increase deposits or generate asset-backed financing, business growth could be less than planned.
If we are unable to obtain liquidity sufficient to fund new Private Education Loan and Personal Loan originations, our business, financial condition, results of operations and cash flows could be materially adversely affected. We must also maintain appropriate levels of risk-based capital to support increased levels of funding.
We fund Private Education Loan and Personal Loan originations through term and liquid brokered and retail deposits, as well as Educational 529 and Health Savings Account deposits, raised by the Bank and financing raised through asset-backed securitizations. Assets funded through deposits result in refinancing risk because the average term of the deposits is shorter than the expected term of the Private Education Loan and Personal Loan assets we originate. Also, our ability to maintain our current level of deposits or grow our deposit base could be affected by regulatory restrictions, including the possible imposition by our regulators of prior approval requirements or restrictions on deposit growth through brokered deposits. As a supervisory matter, reliance on brokered deposits as a significant source of funding is discouraged. As a result, to grow our deposit base, we will need to continue to expand our non-brokered channels for deposit generation, including through new marketing and advertising efforts, which may require significant time, expense, capital, and effort to implement. Further, the significant competition for deposits from other banking organizations that are also seeking stable deposits to support their funding needs may affect deposit renewal rates, costs or availability. If we are unable to expand existing channels or develop new sources of deposit generation on favorable terms, it could have a material adverse effect on our business, results of operations, financial position and/or cash flows. In addition, our ability to maintain existing balances or obtain additional deposits may be affected by factors, including those beyond our control, such as a rising stock market, perceptions about our financial strength, quality of deposit servicing or online banking generally, and general economic conditions, including high unemployment and decreased savings rates, which could reduce the number of consumers choosing to make deposits with us.
Our short-term success also depends on our ability to structure Private Education Loan securitizations or execute other secured funding transactions. Several factors may have a material adverse effect on both our ability to obtain such funding and the time it takes us to structure and execute these transactions, including the following:
|
•
|
Persistent and prolonged disruption or volatility in the capital markets or in the education loan ABS sector specifically;
|
|
•
|
Our inability to generate sufficient Private Education Loan volume;
|
|
•
|
Degradation of the credit quality or performance of the Private Education Loans we sell or finance through securitization trusts, or adverse rating agency assumptions, rating actions or conclusions with respect to those trusts or the education loan-backed securitization trusts sponsored by other issuers;
|
|
•
|
A material breach of our obligations to purchasers of our Private Education Loans, including securitization trusts;
|
24
|
•
|
The timing, pricing and size of education loan asset-backed securitizations other parties issue, or the adverse performance of, or other problems with, such securitizations;
|
|
•
|
Challenges to the enforceability of Private Education Loans based on violations of, or changes to, federal or state consumer protection or licensing laws and related regulations, or imposition of penalties or liabilities on assignees of Private Education Loans for violation of such laws and regulations; and
|
|
•
|
Our inability to structure and gain market acceptance for new products or services to meet new demands of ABS investors, rating agencies or credit facility providers.
|
If rates of growth require funding beyond that which we may be able to obtain through deposits and proceeds from ABS transactions, we may need to raise additional liquidity through other forms of secured and unsecured debt financing which, in turn, could increase our funding costs and reduce our net interest margin. Several factors, some of which may be beyond our control, may have a material adverse effect on our ability to raise this additional funding in the amounts, at the rates, or within the timeframes we desire. If this occurs, our business, results of operations, financial position and/or cash flow could be materially and adversely affected.
We currently maintain sufficient risk-based capital through adequate retention and reinvestment of earnings from operations. If growth rates require capital above and beyond what we generate through retained earnings, we may need to raise capital for our business by issuing additional equity to investors. Several factors, some of which may be beyond our control, may have a material adverse effect on our ability to issue additional equity in the amounts, at the prices, or within the timeframes we desire. If this occurs, our business, results of operations, financial position and/or cash flow could be materially and adversely affected.
In structuring and facilitating securitizations of Private Education Loans, administering securitization trusts or providing portfolio management, we may incur liabilities to transaction parties.
Under applicable state and federal securities laws, if investors incur losses as a result of purchasing ABS issued in connection with our securitization transactions, we could be deemed responsible and could be liable to investors for damages. We could also be liable to investors or other parties for certain updated performance information that we may provide subsequent to the original issuances. If we fail to cause the securitization trusts or other transaction parties to disclose adequately all material information regarding an investment in any securities, if we or the trusts make statements that are misleading in any material respect in information delivered to investors in any securities, if we breach any representations or warranties made in connection with securitization of the loans, or if we breach any other duties as the administrator or servicer of the securitization trusts, it is possible we could be sued and ultimately held liable to an investor or other transaction party. This risk includes failure to properly administer or oversee servicing or collections and may increase if the performance of the securitization trusts’ loan portfolios degrades. In addition, under various agreements, we may be contractually bound to indemnify transaction parties if an investor is successful in seeking to recover any loss from those parties and the securitization trusts are found to have made a materially misleading statement or to have omitted material information. We may also be required to repurchase affected loans if we were to breach certain representations, warranties or covenants in various agreements. Incurring substantial liabilities to securitization transaction parties could adversely affect our business, financial condition, operating results and/or cash flows.
If we are liable to an investor or other transaction party for a loss incurred in any securitization we facilitated or structured and any insurance that we may have does not cover this liability or proves to be insufficient, our business, financial position, results of operations and/or cash flows could be materially adversely affected.
The interest rate and maturity characteristics of our earning assets do not always match the interest rate and maturity characteristics of our funding arrangements, which may increase the price of, or decrease our ability to obtain, necessary liquidity. We are also subject to repayment and prepayment risks, which can adversely affect our financial condition.
Net interest income is the primary source of cash flow generated by our loan portfolios. Interest earned on our variable-rate Private Education Loans and FFELP Loans is primarily indexed to one-month LIBOR rates, but our cost of funds is primarily related to deposit rates. Certain of our Private Education Loans and all of our Personal Loans currently bear fixed interest rates. These loans are not specifically match funded with fixed-rate deposits or fixed-rate funding obtained through
25
asset-backed securitization. Likewise, the average term of our deposits is shorter than the expected term of our Private Education Loans, FFELP Loans and Personal Loans.
The different interest rate and maturity characteristics of our loan portfolio and the liabilities funding that portfolio result in interest rate risk, basis risk and re-pricing risk. In certain interest rate environments, this mismatch may reduce our net interest margin (the interest yield earned on our portfolio less the rate paid on our interest-bearing liabilities). It is not possible to hedge all of our exposure to such risks. While the assets, liabilities and related hedging derivative contract re-pricing indices are typically highly correlated, there can be no assurance that the historically high correlation will not be disrupted by capital market dislocations or other factors outside our control. In these circumstances, our earnings could be materially adversely affected.
We are also subject to risks associated with changes in repayment and prepayment rates on Private Education Loans and Personal Loans. Increases in employment levels, wages, family income, alternative sources of financing or third-party consolidations or refinancings may also contribute to higher than expected prepayment rates, which can adversely affect our financial condition.
Our use of derivatives to manage interest rate sensitivity exposes us to credit and market risk that could have a material adverse effect on our earnings.
We maintain an overall interest rate strategy that uses derivatives to reduce the economic effect of interest rate changes. Developing an effective hedging strategy for dealing with movements in interest rates is complex, and no strategy can completely avoid the risks associated with these fluctuations. For example, our education loan portfolios remain subject to prepayment risk that could cause them to be under- or over-hedged, which could result in material losses. In addition, some of our interest rate risk management activities expose us to mark-to-market losses if interest rates move in a materially different way than was expected when we entered into the related derivative contracts. As a result, there can be no assurance hedging activities using derivatives will effectively manage our interest rate sensitivity, have the desired beneficial impact on our results of operations or financial condition or not adversely impact our liquidity and earnings.
Our use of derivatives also exposes us to market risk and credit risk. Market risk is the chance of financial loss resulting from changes in interest rates and market liquidity. Some of the interest rate swaps we use to economically hedge interest rate risk between our assets and liabilities do not qualify for hedge accounting treatment. Therefore, the change in fair value, called the “mark-to-market,” of the swaps that do not qualify as an accounting hedge is included in our statement of income. A decline in the fair value of those derivatives could have an adverse effect on our reported earnings.
We are also subject to the creditworthiness of third-parties, including counterparties to derivative transactions. For example, we have exposure to the financial conditions of various lending, investment and derivative counterparties. If a counterparty fails to perform its obligations, we could, depending on the type of counterparty arrangement, experience a loss of liquidity or an economic loss. In addition, if a derivative counterparty fails to perform, we might not be able to cost effectively replace the derivative position, depending on the type of derivative and the current economic environment, and thus could be exposed to a greater level of interest rate risk, potentially leading to additional losses. Our counterparty exposure is more fully discussed in Part II, Item 7. “Management’s Discussion and Analysis of Financial Condition and Results of Operations — Liquidity and Capital Resources — Counterparty Exposure.” If our counterparties are unable to perform their obligations, such inability could have a material adverse impact on our business, financial condition, results of operations and/or cash flows.
The future of LIBOR as a “benchmark” interest rate is uncertain and that uncertainty or any change to the LIBOR benchmark could adversely affect the value of or the interest rates on our assets and obligations tied to LIBOR, as well as the revenue and expenses associated with those assets and obligations.
The interest rates on our variable-rate Private Education Loans and certain other assets are tied to LIBOR, the London interbank offered rate. Certain of our interest rate swaps, notes issued under our term ABS and our student loan multi-lender secured borrowing facility (the “Secured Borrowing Facility”), brokered and non-brokered deposits and other obligations also are tied to LIBOR. In each case, the terms of the relevant agreements define LIBOR and provide differing methods for how it may be replaced or computed if LIBOR is no longer available as defined. LIBOR is used worldwide as a reference for setting interest rates on loans, derivatives, and other assets and obligations.
26
On July 27, 2017, the United Kingdom's Financial Conduct Authority, which regulates LIBOR, publicly announced that it intends to stop persuading or compelling banks on the London interbank market to submit LIBOR rates after 2021. It is unclear at this time, and we are not able to predict, whether or when LIBOR will cease to exist, whether or when new methods of calculating LIBOR will be established such that it continues to exist after 2021, or whether or when alternative benchmark or reference rates will be available, either through regulatory action or financial market developments, as viable alternatives to LIBOR. If one or more replacement benchmark or reference rates is available, it is unknown at this time, and we are unable to predict, whether any such alternatives will be acceptable to investors, financial markets or regulators, or applied consistently and concurrently to various assets, obligations or financial instruments. Certain of our existing assets and obligations do not include provisions clearly specifying a method for transitioning from LIBOR to an alternative benchmark rate. Given this situation, it is unclear what consents or approvals, if any, will be required, and from whom they will be required, to replace LIBOR under our various agreements. As a result of these potential changes and related uncertainties, the interest rates on and value of our assets and obligations tied to LIBOR, and the revenue and expenses associated with those assets and obligations, could be affected in disparate ways at disparate times, which could have an adverse effect on our business and results of operation.
Defaults on our loans, particularly Private Education Loans and Personal Loans, could adversely affect our business, financial position, results of operations and/or cash flows.
We bear the full credit exposure on our Private Education Loans and Personal Loans. If they were to default at rates much higher than anticipated, our business, financial position, results of operations and/or cash flows could be adversely affected. Delinquencies are an important indicator of the potential future credit performance of those loan portfolios. Our Private Education Loan delinquencies (loans greater than 30 days past due), as a percentage of Private Education Loans in repayment, were 2.6 percent at December 31, 2018. Our Personal Loan delinquencies (loans greater than 30 days past due), as a percentage of Personal Loans in repayment, were 1.5 percent at December 31, 2018. In addition, we will bear full credit exposure on credit cards and other products we may introduce to the market.
Our allowance for loan losses may not be adequate to cover actual losses, and we may be required to materially increase our allowance, which may adversely affect our capital, financial condition, and/or results of operations.
The evaluation of our allowance for loan losses is inherently subjective, as it requires material estimates that may be subject to significant changes. As of December 31, 2018, our allowance for Private Education Loan losses was approximately $278 million. During the year ended December 31, 2018, we recognized provisions for Private Education Loan losses of approximately $169 million. As of December 31, 2018, our allowance for Personal Loan losses was approximately $62 million. During the year ended December 31, 2018, we recognized provisions for Personal Loan losses of approximately $74 million. The provision for loan losses reflects the respective Private Education Loan and Personal Loan performance for the applicable period and establishes the allowance at a level that management believes is appropriate to cover probable losses inherent in the loan portfolio. However, future defaults can be higher than anticipated due to a variety of factors outside of our control, such as downturns in the economy, rising interest rates, regulatory or operational changes and other unforeseen future trends. Losses on Private Education Loans are also determined by risk characteristics such as school type, loan status (in-school, grace, forbearance, repayment and delinquency), loan seasoning (number of months in active repayment), underwriting criteria (e.g., credit scores), presence of a cosigner and the current economic environment. Losses on Personal Loans are affected by risk characteristics such as FICO scores at origination and seasoning. Worsening general economic and employment conditions may lead to higher rates of loan defaults. In addition, our product offerings may prove to be unprofitable and may result in higher than expected losses. If actual loan performance is worse than currently estimated, it could materially increase our estimate of the allowance for loan losses in our balance sheet and the related provision for loan losses in our statements of income and, as a result, adversely affect our capital, financial condition and results of operations.
Changes in accounting standards could adversely affect our capital levels, results of operation and/or financial condition.
We are subject to the requirements of entities that set and interpret the accounting standards governing the preparation of our financial statements and other financial reports. These entities, which include the Financial Accounting Standards Board (“FASB”), the SEC, banking regulators and our independent registered public accounting firm, may add new requirements or change their interpretations of how those standards should be applied.
27
For example, the FASB approved a final accounting standard in 2016 related to the calculation of loan loss reserves that will require us to apply a current expected credit loss (“CECL”) model when recording impairment of loans and other financial instruments. The CECL model, which will become effective on January 1, 2020, will require us to record an allowance for estimated life of loan losses at each balance sheet date. Currently, for those Private Education Loans that are not TDRs (as defined below), we apply an inherent loss model and only record an allowance for losses expected to be realized in the 12 months following the balance sheet date. Adoption of the CECL life of loan model will significantly increase our allowance for loan losses and thereby materially affect our financial condition, results of operations and capital levels. See Notes to Consolidated Financial Statements, Note 2, “Significant Accounting Policies — Recently Issued but Not Yet Adopted Accounting Pronouncements” for further details.
The Bank is subject to various regulatory capital requirements administered by the FDIC and the UDFI. Failure to meet minimum capital requirements can initiate certain mandatory and possibly additional discretionary actions by regulators that, if undertaken, could have a material adverse effect on our business, results of operations and/or financial condition.
Under U.S. Basel III and the regulatory framework for prompt corrective action, the Bank must meet specific capital standards that involve quantitative measures of its assets, liabilities and certain off-balance sheet items as calculated under regulatory accounting practices. The Bank’s capital amounts and its classification under the prompt corrective action framework are also subject to qualitative judgments by the regulators about components of capital, risk weightings and other factors.
The Bank is required to maintain the following minimum regulatory capital ratios under U.S. Basel III: a Common Equity Tier 1 risk-based capital ratio of 4.5 percent, a Tier 1 risk-based capital ratio of 6.0 percent, a Total risk-based capital ratio of 8.0 percent, and a Tier 1 leverage ratio of 4.0 percent. In addition, on a fully phased-in basis by January 1, 2019, banks will be subject to a greater than 2.5 percent Common Equity Tier 1 capital conservation buffer; in 2018, the phase-in amount of the buffer was 75 percent of the fully phased-in requirement. Institutions that do not maintain the buffer will face restrictions on dividend payments, share repurchases and the payment of discretionary bonuses to executive officers. Including the buffer, as of January 1, 2019, the Bank is required to maintain the following minimum capital ratios: a Common Equity Tier 1 risk-based capital ratio of greater than 7.0 percent, a Tier 1 risk-based capital ratio of greater than 8.5 percent and a Total risk-based capital ratio of greater than 10.5 percent.
To qualify as “well capitalized” under the prompt corrective action framework for insured depository institutions, an insured depository institution must maintain a Common Equity Tier 1 risk-based capital ratio of at least 6.5 percent, a Tier 1 risk-based capital ratio of at least 8.0 percent, a Total risk-based capital ratio of at least 10.0 percent, and a Tier 1 leverage ratio of at least 5.0 percent. As of December 31, 2018, the Bank had a Common Equity Tier 1 risk-based capital ratio of
12.1
percent, a Tier 1 risk-based capital ratio of
12.1
percent, a Total risk-based capital ratio of
13.3
percent and a Tier 1 leverage ratio of
11.1
percent.
If the Bank fails to satisfy regulatory risk-based or leverage capital requirements, it may be subject to serious regulatory sanctions that could prevent us from successfully executing our business plan and may have a material adverse effect on our business, results of operations, financial position and/or cash flows. See Item 1. “Business — Supervision and Regulation — Regulation of Sallie Mae Bank — Regulatory Capital Requirements.”
28
Unfavorable results from the periodic stress tests we conduct under regulatory guidance may adversely affect our business and result in regulatory action that could adversely affect our cost of capital and liquidity position.
Pursuant to regulatory guidance, the Bank conducts annual capital stress tests utilizing systemic and company-specific stress scenarios. In 2018, the Bank conducted its annual capital stress tests and the results of these tests were presented to and reviewed by the Bank’s senior management, the Bank’s Board of Directors and the Board’s Risk Committee. In addition, the Bank made the results of the stress tests available to its prudential regulators - the FDIC and UDFI. Generally, the stress test results include certain measures that evaluate the Bank’s ability to absorb losses in severely adverse economic and financial conditions. From time to time, our regulators may require the Bank to raise additional capital or take other actions, or may impose restrictions on our business, based on the results of the stress tests. We may not be able to raise additional capital if required to do so, or may not be able to do so on terms which are advantageous to us. Any such capital raises, if required, may also be dilutive to our existing stockholders.
We also conduct annual and quarterly liquidity stress tests to evaluate the adequacy of our liquidity sources under several stress scenarios, including a severely adverse scenario. The results of these scenarios may lead regulators to demand that higher levels of liquidity be maintained at significant incremental expense to the Bank.
Operations
Failure of our operating systems or infrastructure or the inability to adapt to changes could disrupt our business, cause significant losses, result in regulatory action or damage our reputation.
Our business is dependent on our ability to process and monitor large numbers of transactions in compliance with legal and regulatory standards and our product specifications. As processing demands change and our loan portfolios grow in both volume and differing terms and conditions, developing and maintaining our operating systems and infrastructure become increasingly challenging. There is no assurance we can adequately or efficiently develop, maintain or acquire access to such systems and infrastructure.
Our loan originations and the servicing, financial, accounting, data processing or other operating systems and facilities that support them may fail to operate properly, become disabled as a result of events beyond our control or be unable to be rapidly configured to timely address regulatory changes, in each case potentially adversely affecting our ability to process these transactions. Any such failure could adversely affect our ability to service our customers, result in financial loss or liability to our customers and investors, disrupt our business, result in regulatory action or cause reputational damage. Despite the plans and facilities we have in place, our ability to conduct business may be adversely affected by a disruption in the infrastructure that supports our businesses. This may include a disruption involving electrical, communications, internet, information technology, transportation or other services used by us or third-parties with whom we conduct business. Notwithstanding our efforts to maintain business continuity, a disruptive event impacting our processing locations could adversely affect our business, financial condition, results of operations and/or cash flows.
Our business processes are becoming increasingly dependent upon technological advancement, and we could lose market share if we are not able to keep pace with rapid changes in technology.
Our future success depends, in part, on our ability to underwrite and approve loans, and process loan applications and payments and provide other customer services in a safe, automated manner with high-quality service standards. The volume of loan originations we are able to process is based, in large part, on the systems and processes we have implemented and developed. These systems and processes are becoming increasingly dependent upon technological advancement, such as the ability to process loans and payments over the internet via personal computers or mobile devices, accept electronic signatures and provide initial decisions instantly. Our future success also depends, in part, on our ability to develop and implement technology solutions that anticipate and keep pace with continuing changes in technology, industry standards and client preferences, including FinTech developments, and technological innovations such as bitcoin. We may not be successful in anticipating or responding to these developments on a timely basis. We have made, and need to continue to make, investments in our technology platform to provide competitive products and services. We may be required to expend significant funds to develop or acquire new technologies. If competitors introduce products, services, systems and processes that are better than
29
ours or that are more cost-effective or that gain greater market acceptance, those we offer or use may become obsolete or noncompetitive and we could lose market share. Any one of these circumstances could have a material adverse effect on our business reputation and ability to obtain and retain clients and, therefore, could materially adversely affect our business, financial condition and/or results of operations.
We depend on secure information technology and a breach of those systems or those of third-party vendors could result in significant losses, unauthorized disclosure of confidential customer information and reputational damage, which could materially adversely affect our business, financial condition and/or results of operations and could lead to significant financial and legal exposure.
Our operations rely on the secure collection, processing, storage and transmission of personal, confidential and other information in a significant number of customer transactions on a continuous basis through our computer systems and networks and those of our third-party service providers. To access our products and services, our customers may use computers, smart phones, tablets and other mobile devices that are outside our security systems and those of our third-party service providers. Information security risks for financial institutions and third-party service providers have increased in recent years and continue to evolve in part because of the proliferation of new technologies, the use of the internet and telecommunications technologies to conduct financial transactions, and the increased sophistication and activities of organized crime, hackers, terrorists, activists and other external parties, including foreign state-sponsored actors. These parties also may fraudulently induce employees, customers and others who use our or our service providers’ systems or have access to our or our customers’ data, to gain access to our and our customers’ data. As further evidence that cyber incidents have been accelerating in frequency and impact, in recent years several financial institutions and major companies across industries have reported cyber-attacks that compromised significant customer or employee data, or resulted in the theft of funds, or the theft or destruction of corporate information or other assets.
While we have not been materially impacted by these reported or other cyber incidents, we continue to evolve our security controls to effectively prevent, detect and respond to the continually changing threats, and we may be required to expend significant additional resources in the future to modify and enhance our security controls in response to new or more sophisticated threats, new regulations related to cybersecurity and other developments. Additionally, while we, and our third-party service providers, commit resources to the design, implementation, maintenance, and monitoring of our networks and systems, there is no guarantee that our security controls, or those of our third-party service providers, can provide absolute security.
Despite the measures we and our third-party service providers implement to protect our systems and our or our customers’ data, we may not be able to anticipate, identify, prevent or detect cyber-attacks, particularly because the techniques used by attackers change frequently or are not recognized until launched, and because cyber-attacks can originate from a wide variety of sources, including third parties who are or may be involved in organized crime or linked to terrorist organizations or hostile foreign governments. Such third parties may seek to gain unauthorized access to our systems either directly or using equipment or security passwords belonging to employees, customers, third-party service providers or other users of our systems. Or, they may seek to disrupt or disable our or our service providers’ services through attacks such as denial-of-service and ransomware attacks. In addition, we or our service providers may be unable to identify, or may be significantly delayed in identifying, cyber-attacks and incidents due to the increasing use of techniques and tools that are designed to circumvent controls, to avoid detection, and to remove or obfuscate forensic artifacts. As a result, our computer systems, software and networks, as well as those of third-party vendors we utilize, may be vulnerable to unauthorized access, computer viruses, malicious attacks and other events that could have a security impact beyond our control. Our staff, technologies, systems, networks and those of third-parties we utilize also may become the target of cyber-attacks, unauthorized access, malicious code, computer viruses, denial of service attacks, ransomware, and physical attacks that could result in information security breaches, the unauthorized release, gathering, monitoring, misuse, loss or destruction of our or our customers’ confidential, proprietary and other information, or otherwise disrupt our or our customers’ or other third-party service providers’ business operations. We also routinely transmit and receive personal, confidential and proprietary information, some through third parties, which may be vulnerable to interception, misuse or mishandling.
If one or more of such events occur, personal, confidential and other information processed and stored in, and transmitted through our computer systems and networks, or those of third-party vendors, could be compromised or could cause interruptions or malfunctions in our or our customers’ or service providers’ operations that could result in significant losses, loss
30
of confidence by and business from customers, customer dissatisfaction, significant litigation, regulatory exposures and harm to our reputation and brand.
In the event personal, confidential or other information is threatened, intercepted, misused, mishandled, accessed, acquired or otherwise compromised without authorization, we may be required to expend significant additional resources to modify our protective measures, to investigate the circumstances surrounding the event and implement mitigation and remediation measures. We also may be subject to fines, penalties, litigation (including securities fraud class action lawsuits) and regulatory investigation costs and settlements and financial losses that are either not insured against or not fully covered through any insurance maintained by us. If one or more of such events occur, our business, financial condition and/or results of operations could be significantly and adversely affected.
While we seek to mitigate cyber and related risks associated with outsourcing to third-party service providers, including through our vendor management processes, both operational and technological cyber risks remain and certain risks are beyond our security and control systems. Cyber-attacks targeted at our service providers may result in unauthorized interception, misuse, mishandling, access, acquisition, loss or destruction of our or our customers’ data, or other cyber incidents, that may affect the availability of our services, and impose costs and other liabilities that significantly and adversely affect us in the ways discussed above.
We depend significantly on third-parties for a wide array of our operations and customer services and key components of our information technology infrastructure, and a breach of security or service levels, or violation of law by one of these third-parties, could disrupt our business or provide our competitors with an opportunity to enhance their position at our expense.
We depend significantly on third-parties for a wide array of our operations and customer services and key components of our information technology and security infrastructures. Third-party vendors are significantly involved in aspects of our servicing for Private Education Loans, FFELP Loans and Personal Loans, Bank deposit-taking activities, payroll software and systems development, data center and operations, including the timely and secure transmission of information across our data communication network, and for other telecommunications, email, processing, storage, remittance and technology-related services in connection with our business. If a service provider fails to provide the services we require or expect, or fails to meet applicable regulatory or contractual requirements, such as service levels, protection of our customers’ personal and confidential information, or compliance with applicable laws, that failure could negatively impact our business by adversely affecting our ability to process customers’ transactions in a timely and accurate manner, otherwise hampering our ability to serve our customers and investors, or subjecting us to litigation and regulatory risk for matters as diverse as poor vendor oversight, improper release or protection of personal information, or release of incorrect information. Such a failure could adversely affect the perception of the reliability of our networks and services, and the quality of our brands, and could materially adversely affect our business, financial condition or results of operations.
We may face risks from our operations related to litigation or regulatory actions that could result in significant legal expenses and settlement or damage awards.
Pursuant to the terms of the Separation and Distribution Agreement, and as contemplated by the structure of the Spin-Off, Navient is legally obligated to indemnify the Bank against all claims, actions, damages, losses or expenses that may arise from the conduct of all activities of pre-Spin-Off SLM occurring prior to the Spin-Off, except for certain liabilities specifically assumed by the Bank in the agreement as to which the Bank would be obligated to indemnify Navient. Among other things, Navient is obligated to indemnify us for any liabilities, costs or expenses we may incur arising from any action or threatened action related to the servicing, operations and collections activities of pre-Spin-Off SLM and its subsidiaries with respect to Private Education Loans and FFELP Loans that were assets of the Bank or Navient at the time of the Spin-Off, but that obligation extends only to claims or potential claims for which Navient has received notice from us on or before April 30, 2017. Due to Navient’s indemnification obligations and the smaller, relatively younger vintages of our Private Education Loans, over the near term our dispute-related expenses may be lower than might otherwise be expected. As our business grows, we will likely be subject to additional claims and litigation, which could seriously harm our business and require us to incur significant costs. Defending against litigation may require significant attention and resources of management and, regardless of the outcome, such actions could result in significant expenses. If we are a party to material litigation and if the defenses we assert are ultimately unsuccessful, or if we are unable to achieve a favorable settlement, we could be liable for large damages and that could have a material adverse effect on our business, results of operations and/or financial condition. Likewise, similar material
31
adverse effects could occur if Navient is unwilling or unable to honor its indemnification or other obligations under the Separation and Distribution Agreement.
Our ability to sustain or exceed our recent rates of earnings growth over the long term is dependent upon, among other things, achieving our goal of diversifying our consumer products beyond Private Education Loans, which may be difficult.
Our success in sustaining or exceeding our recent rates of earnings growth over the long term is dependent upon, among other things, our ability to profitably acquire or originate a more diversified suite of complimentary consumer products. Our ability to profitably acquire or originate complimentary consumer products is in turn dependent on a number of factors, some of which are beyond our control, including general economic conditions, demographic trends, demand for other consumer products, and capital markets conditions. There also may be substantial regulatory, operational and credit challenges, risks and uncertainties associated with these efforts. We may invest significant time and resources in developing, launching and/or attempting to acquire new products or services, yet not be successful in achieving our goal regarding earnings growth, credit performance and/or profitability due to any or all of the factors, risks and uncertainties noted above, as well as others. In addition, our initial timetables for the introduction and development or acquisition of new products or services may not be met, market acceptance may fall short of our expectations, and price and profitability targets for any or all of our products may not prove achievable, which could in turn unnecessarily divert management’s attention and focus and have a material negative effect on our perception in the marketplace, our business, results of operations and/or financial condition.
In 2019, we expect to continue our diversification efforts by originating unsecured Personal Loans or other types of financial products. The various risks and uncertainties described above are inherent in each of these efforts. For example, if we are unable to originate Personal Loans of acceptable credit quality and in sufficient quantities; or our Personal Loan portfolio and program does not otherwise perform as expected; or the third-parties from whom we purchased Personal Loans or who service them for us suffer compliance or operational lapses in their businesses, then our business, results of operations and/or financial condition could be significantly and negatively affected.
The expected launch of a new credit card raises risks and uncertainties specific to that particular product. For example, economic conditions can reduce the usage of credit cards in general and the average purchase amount of transactions industry-wide, including our card, which reduces interest income and transaction fees. Competition is intense in the credit card industry, and customers may frequently switch credit cards or transfer balances to another card. Competition in credit cards is also based on the value provided to the customer by a related rewards program. Our rewards program could be viewed as less attractive to customers than other credit card issuers’ reward programs and thereby adversely impact the timing and/or success of any new credit card product of ours.
Incorrect estimates and assumptions by management in connection with the preparation of our consolidated financial statements could adversely affect our reported assets, liabilities, income and/or expenses.
The preparation of our consolidated financial statements requires us to make critical accounting estimates and assumptions that affect the reported amounts of assets, liabilities, income and expenses during the reporting periods. Incorrect estimates and assumptions by us in connection with the preparation of our consolidated financial statements could adversely affect the reported amounts of assets, liabilities, income and expenses. A description of our critical accounting estimates and assumptions may be found in Part II, Item 7. “Management’s Discussion and Analysis of Financial Condition and Results of Operations — Critical Accounting Policies and Estimates” and Notes to Consolidated Financial Statements, Note 2, “Significant Accounting Policies” to the consolidated financial statements included in this Form 10-K. If we make incorrect assumptions or estimates, we may under- or overstate reported financial results, which could materially and adversely affect our business, financial condition and/or results of operations.
Our framework for managing risks may not be effective in mitigating our risk of loss.
Our risk management framework seeks to mitigate risk and appropriately balance risk and return. We have established processes and procedures intended to identify, measure, monitor, control and report the types of risk to which we are subject. We seek to monitor and control our risk exposure through a framework of policies, procedures, limits and reporting requirements.
We also rely on quantitative models to measure and manage risks and estimate certain financial values. Models may be used in such processes as product pricing, extending credit, measuring interest rate and other market risk, estimating losses,
32
calculating and assessing capital levels, estimating the value of financial instruments and balance sheet items, and various other processes. If the models that we use to measure and/or mitigate these risks and values are poorly designed, based upon incorrect or incomplete information, poorly implemented, or are otherwise inadequate, our business decisions may be adversely affected, we may provide inaccurate information to the public or regulators, and/or we may incur increased losses.
In addition, there may be existing or developing risks that we have not appropriately anticipated, identified or mitigated. If our risk management framework does not effectively identify or mitigate our risks, we could suffer unexpected losses and our business, financial condition and/or results of operations could be materially adversely affected.
Our internal controls over financial reporting and disclosure controls may be ineffective.
Our management is responsible for maintaining, regularly assessing and, as necessary, making changes to our internal controls over financial reporting and our disclosure controls. Nevertheless, our internal controls over financial reporting and our disclosure controls can provide only reasonable assurances regarding the reliability of our financial reporting and the preparation of our financial statements for external purposes in accordance with generally accepted accounting principles in the United States (“GAAP”) and may not prevent or detect misstatements. Any failure or circumvention of our internal controls over financial reporting or our disclosure controls, failure to comply with rules and regulations related to such controls or failure to make sound and appropriate application of the criteria established in the framework set forth in Internal Control-Integrated Framework (2013) issued by the Committee of Sponsoring Organizations of the Treadway Commission could have a material adverse effect on our financial condition and/or results of operations.
We are subject to reputational and other risks.
Our reputation as an originator and servicer of high-quality Private Education Loans and Personal Loans is very dependent upon how our customers, our regulators, legislators, the education community and the broader market perceive our business practices, financial heath and integrity and the business practices, financial health and integrity of the overall student loan market or personal loan market, as applicable. Negative publicity, including as a result of our actual or alleged conduct or public opinion of the student loan or personal loan industry generally, could damage our reputation and business and adversely impact the price of our common stock.
Any internal, market or other developments, including those relating to our competitors, that result in a negative impact on our reputation or the reputation of the student loan industry or personal loan industry could have an adverse effect on our ability to originate, service and retain Private Education Loans or Personal Loans, as applicable, result in greater regulatory, legislative and media scrutiny, increase our risk of litigation and regulatory sanctions or other actions, and have a material adverse effect on our financial condition and/or results of operations.
As described above, any failure of our operating systems or infrastructure or cyber-attacks on or other unauthorized access to our information technology systems could harm our reputation and brand and result in significant financial losses. In addition, employee and customer misconduct could severely harm our reputation, subjecting us to financial losses, lawsuits and/or regulatory sanctions. Misconduct by our customers could include such activities as providing fraudulent credentials, information or authorization on behalf of a family member or other cosigner through identification theft or by other means in order to secure loan approval. Customers also may attempt to fraudulently secure Private Education Loan or Personal Loan proceeds. Misconduct by our employees could include, among other things, theft of our or our customers’ confidential information, or making unauthorized payments on behalf of a collection client in order to meet certain incentive thresholds.
If our operating systems or infrastructure fail or our security and other internal controls fail to prevent or detect compromised records or data, data breaches or an occurrence of customer or employee fraud, or if any resulting loss is not insured or exceeds applicable insurance limits, or if insurance is denied, such occurrence could have a material adverse effect on our reputation, financial condition and/or results of operations.
A low ESG or sustainability score could result in the exclusion of our common shares from consideration by certain investment funds and a negative perception of us by certain investors.
Certain organizations that provide corporate governance and other corporate risk information to investors and shareholders have developed scores and ratings to evaluate companies and investment funds based upon environmental, social
33
and governance (“ESG”) or “sustainability” metrics. Currently, there are no universal standards for such scores or ratings, but the importance of sustainability evaluations is becoming more broadly accepted by investors and shareholders. Indeed, many investment funds focus on positive ESG business practices and sustainability scores when making investments. In addition, investors, particularly institutional investors, use these scores to benchmark companies against their peers and if a company is perceived as lagging, these investors may engage with companies to require improved ESG disclosure or performance. Moreover, certain members of the broader investment community may consider a company’s sustainability score as a reputational or other factor in making an investment decision. Consequently, a low sustainability score could result in exclusion of the Company’s common shares from consideration by certain investment funds, engagement by investors seeking to improve such scores and a negative perception of the Company by certain investors.
Risks Related to the Spin-Off
We continue to rely on Navient’s Private Education Loan data and, because of Navient’s indemnification obligations, have significant exposures to risks related to its creditworthiness. If we are unable to rely on this data or to obtain indemnification payments from Navient, we could experience higher than expected costs and operating expenses and our results of operations, cash flows and/or financial condition could be materially and adversely affected.
Through the end of 2018, Navient regularly provided us with a significant amount of current and historical data on their portfolios of Private Education Loans, including data that supported, among other things, the tracking of loan performance metrics such as default and recovery rates on those loans, including loans classified as troubled debt restructurings, and, in connection with our ABS financing transactions, our ability to provide investors with historical information about Private Education Loan performance. We also used these metrics in the development of certain critical accounting assumptions.
Pursuant to the terms of the Separation and Distribution Agreement, and as contemplated by the structure of the Spin-Off, Navient is legally obligated to indemnify the Bank against all claims, actions, damages, losses or expenses that may arise from the conduct of all activities of pre-Spin-Off SLM occurring prior to the Spin-Off, except for certain liabilities specifically assumed by the Bank in the agreement as to which the Bank would be obligated to indemnify Navient. Some significant examples of the types of indemnification obligations Navient has under the Separation and Distribution Agreement and related ancillary agreements include:
|
•
|
Navient is required to indemnify us for any liabilities, costs or expenses we may incur arising from any action or threatened action related to the servicing, operations and collections activities of pre-Spin-Off SLM and its subsidiaries with respect to Private Education Loans and FFELP Loans that were assets of the Bank or Navient at the time of the Spin-Off; provided that written notice was provided to Navient on or prior to April 30, 2017, the third anniversary date of the Spin-Off. Navient is not required to indemnify for changes in law or changes in prior existing interpretations of law that occur on or after April 30, 2014.
|
|
•
|
In connection with the Spin-Off, we recorded a liability related to uncertain tax positions of $27 million for which we are indemnified by Navient. As of December 31, 2018, the remaining balance of the indemnification receivable related to those uncertain tax positions was $24 million.
|
The Separation and Distribution Agreement provides specific processes and procedures pursuant to which we may submit claims for indemnification to Navient. If for any reason Navient is unable or unwilling to pay claims made against it, our costs, operating expenses, cash flows and/or financial condition could be materially and adversely affected over time.
34
Risks Related to Our Securities
Our common and preferred stock prices may fluctuate significantly.
The market price of shares of our common stock may fluctuate significantly due to a number of factors, some of which may be beyond our control, including:
|
•
|
Actual or anticipated fluctuations in our operating results;
|
|
•
|
Our smaller market capitalization as compared to pre-Spin-Off SLM;
|
|
•
|
Changes in earnings estimated by securities analysts or our ability to meet those estimates;
|
|
•
|
Any existence or lack of, or change in, capital return initiatives or policies regarding our common stock;
|
|
•
|
The operating and stock price performance of comparable companies;
|
|
•
|
News reports relating to trends, concerns and other issues in the student loan industry or other parts of the financial services industry, including regulatory actions against other financial institutions or proposed legislation that may affect the student loan industry or other parts of the financial services industry;
|
|
•
|
Perceptions in the marketplace regarding us and/or our competitors;
|
|
•
|
New technology used, or services offered, by competitors;
|
|
•
|
Significant acquisitions or business combinations, strategic partnerships, joint ventures or capital commitments by or involving us or our competitors;
|
|
•
|
Changes to the regulatory and legal environment under which we and our subsidiaries operate;
|
|
•
|
Our ability to securitize our loans; and
|
|
•
|
Domestic and worldwide economic conditions.
|
The market price of shares of our preferred stock may fluctuate significantly due to a number of factors, some of which may be beyond our control, including:
|
•
|
Significant sales of our preferred stock, or the expectation of significant sales;
|
|
•
|
Lack of or a downgrade of credit agency ratings;
|
|
•
|
Movements in interest rates and spreads that negatively affect return; and
|
|
•
|
Call and redemption features.
|
In addition, when the market price of a company’s common stock drops significantly, stockholders often institute securities class action lawsuits against the company. A securities class action lawsuit against the Company could cause it to incur substantial costs and could divert the time and attention of its management and other resources, which could materially adversely affect our business, financial condition and/or results of operations.
An investment in our securities is not an insured deposit.
Our common stock, preferred stock and indebtedness are not bank deposits and, therefore, are not insured against loss by the FDIC, any other deposit insurance fund or by any other public or private entity. Investment in our common stock is inherently risky for the reasons described in this “Risk Factors” section and elsewhere in this report and is subject to the same market forces that affect the price of securities of any company. As a result, if you acquire our common stock, preferred stock or indebtedness, you may lose some or all of your investment.
35
The holders of our preferred stock have rights that are senior to those of our common shareholders.
At December 31, 2018, we had issued and outstanding 4.0 million shares of our Series B Preferred Stock.
Our Series B Preferred Stock is senior to our shares of common stock in right of payment of dividends and other distributions. Generally, we must be current on dividends payable to holders of our Series B Preferred Stock before any dividends can be paid on our common stock. We also must comply with certain provisions that are protective of the Series B Preferred Stock in order to effectuate any repurchases under our new common stock share repurchase program. In the event of our bankruptcy, dissolution or liquidation, the holders of our Series B Preferred Stock must be satisfied before any distributions can be made to our common shareholders.
We may be limited in our ability to pay dividends on, and repurchase, our common stock.
On January 23, 2019, we announced that we had initiated a new policy to pay a regular, quarterly cash dividend on our common stock, beginning in the first quarter of 2019, and our Board of Directors had approved a new common stock share repurchase program.
The declaration and payment of future common stock dividends, as well as the amount thereof, are subject to determination by, and the discretion of, our Board of Directors. In addition, we may change our policy regarding the payment of dividends and reduce or eliminate our common stock dividend in the future, which could adversely affect the market price of our common stock.
The new share repurchase program, which was effective upon announcement and expires on January 22, 2021, permits us to repurchase from time to time shares of our common stock up to an aggregate repurchase price not to exceed $200 million. The timing and volume of any repurchases will be subject to market conditions, and there can be no guarantee that we will repurchase up to the limit of the program or at all, which could adversely affect the market price of our common stock.
We are dependent on funds obtained from the Bank to fund dividend payments and any share repurchases. Regulatory and other legal restrictions may limit our ability to transfer funds freely, either to or from our subsidiaries. In particular, the Bank is subject to laws and regulations that authorize regulatory bodies to block or reduce the flow of funds to us, or that prohibit such transfers altogether in certain circumstances. These laws, regulations and rules may hinder our ability to access funds that we may need to make payments in respect of our stock or to satisfy our other responsibilities. The FDIC has the authority to prohibit or limit the payment of dividends by the Bank and SLM Corporation.
Restrictions on Ownership
The ability of a third-party to acquire us is limited under applicable U.S. and state banking laws and regulations.
Under the Change in Bank Control Act of 1978, as amended (“CIBC Act”), the FDIC’s regulations thereunder, and similar Utah banking laws, any person, either individually or acting through or in concert with one or more other persons, must provide notice to, and effectively receive prior approval from, the FDIC and UDFI before acquiring “control” of us. In practice, the process for obtaining such approval is complicated and time-consuming, often taking longer than six months, and a proposed acquisition may be disapproved for a variety of factors, including, but not limited to, antitrust concerns, financial condition and managerial competence of the applicant, and failure of the applicant to furnish all required information. Under the FDIC’s CIBC Act regulations, control is rebuttably presumed to exist, and notice is required, where a person owns, controls or holds with the power to vote 10 percent or more of any class of our voting shares and no other person owns, controls or holds with the power to vote a greater percentage of that class of voting shares.
Item 1B. Unresolved Staff Comments
None.
36
Item 2. Properties
The following table lists the principal facility owned by us as of
December 31, 2018
:
|
Location
|
Function
|
Approximate
Square Feet
|
||
|
Newark, DE
|
Headquarters
|
160,000
|
||
The following table lists the principal facilities leased by us as of
December 31, 2018
:
|
Location
|
Function
|
Approximate
Square Feet
|
|||
|
Indianapolis, IN
|
Administrative Offices
|
115,000
|
|
||
|
New Castle, DE
|
Loan Servicing Center
|
57,000
|
|
||
|
Reston, VA
|
Administrative Offices
|
32,000
|
|
||
|
Newton, MA
|
Administrative Offices
|
24,000
|
|
||
|
Salt Lake City, UT
|
Sallie Mae Bank
|
17,000
|
|
||
The facility that we own is not encumbered by a mortgage. We believe that our headquarters, loan servicing centers, data center, back-up facility and data management and collection centers are generally adequate to meet our long-term lending and business goals. Our headquarters are currently located in owned space at 300 Continental Drive, Newark, Delaware, 19713.
37
|
Item 3.
|
Legal Proceedings
|
We and our subsidiaries and affiliates are subject to various claims, lawsuits and other actions that arise in the normal course of business. It is common for the Company, our subsidiaries and affiliates to receive information and document requests and investigative demands from state attorneys general, legislative committees and administrative agencies. These requests may be for informational or regulatory purposes and may relate to our business practices, the industries in which we operate, or other companies with whom we conduct business. Our practice has been and continues to be to cooperate with these bodies and be responsive to any such requests.
Pursuant to the terms of the Spin-Off and applicable law, Navient is responsible for all liabilities (whether accrued, contingent or otherwise and whether known or unknown) arising out of or resulting from the conduct of pre-Spin-Off SLM and its subsidiaries’ businesses prior to the Spin-Off, other than certain specifically identified liabilities relating to the conduct of our consumer banking business for which the Bank is responsible. Nonetheless, given the prior usage of the Sallie Mae and SLM names by entities now owned by Navient, we and our subsidiaries may from time to time be improperly named as defendants in legal proceedings where the allegations at issue are the legal responsibility of Navient. Most of these legal proceedings involve matters that arose in whole or in part in the ordinary course of business of pre-Spin-Off SLM. Likewise, as the period of time since the Spin-Off increases, so does the likelihood any allegations that may be made may be in part for our own actions in a post-Spin-Off time period and in part for Navient’s conduct in a pre-Spin-Off time period. We will not be providing information on these proceedings unless there are material issues of fact or disagreement with Navient as to the bases of the proceedings or responsibility therefor that we believe could have a material, adverse impact on our business, assets, financial condition, liquidity or outlook if not resolved in our favor.
On January 18, 2017, the Illinois Attorney General filed a lawsuit in Illinois state court against Navient - its subsidiaries Navient Solutions, Inc., Pioneer Credit Recovery, Inc., and General Revenue Corporation - and the Bank arising out of the Multi-State Investigation. On March 20, 2017, the Bank moved to dismiss the Illinois Attorney General action as to the Bank, arguing, among other things, the complaint failed to allege with sufficient particularity or specificity how the Bank was responsible for any of the alleged conduct, most of which predated the Bank’s existence. On July 10, 2018, the Court granted the Bank’s motion to dismiss without prejudice. On August 7, 2018, the Illinois Attorney General filed a First Amended Complaint and, on October 9, 2018, the Bank again moved to dismiss the action based on grounds similar to those raised in its March 20, 2017 motion. The Illinois Attorney General filed its response on November 21, 2018, and the Bank filed its reply on December 10, 2018. Oral argument on the motion took place on January 9, 2019. The Court took the motion under advisement.
On July 17, 2018, the Mississippi Attorney General filed a lawsuit in Mississippi state court against Navient, Navient Solutions, LLC, and the Bank arising out of the Multi-State Investigation. The complaint alleges unfair and deceptive trade practices against all three defendants as to private loan origination practices from 2000 to 2009, and against the two Navient defendants as to servicing practices between 2010 and the present. The complaint further alleges that Navient assumed responsibility for these matters under the Separation and Distribution Agreement for alleged conduct that pre-dated the Spin-Off. On September 27, 2018, the Mississippi Attorney General filed an amended complaint. On October 8, 2018, the Bank moved to dismiss the Mississippi Attorney General’s action as to the Bank, arguing, among other things, that the complaint failed to allege with sufficient particularity or specificity how the Bank was responsible for any of the alleged conduct, most of which predated the Bank’s existence. On November 20, 2018, the Mississippi Attorney General filed an opposition brief and the Bank filed a reply on December 21, 2018. A hearing on the motion to dismiss is scheduled for April 11, 2019.
To date, three other state attorneys general (California, Washington and Pennsylvania) have filed suits against Navient and one or more of its current subsidiaries arising out of the Multi-State Investigation. Neither SLM, the Bank, nor any of their current subsidiaries are named in, or otherwise a party to, the California, Washington or Pennsylvania lawsuits, and no claims are asserted against them. Each complaint asserts in its own fashion that Navient assumed responsibility under the Separation and Distribution Agreement for the alleged conduct in the complaints prior to the Spin-Off. On September 24, 2018, the Washington Attorney General served a third-party subpoena on the Bank calling for the production of certain records. The Bank has responded to the subpoena.
Additional lawsuits may arise from the Multi-State Investigation which may or may not name the Company, the Bank or any of their current subsidiaries as parties to these suits. Pursuant to the terms of the Separation and Distribution Agreement, and as contemplated by the structure of the Spin-Off, Navient is legally obligated to indemnify the Bank against all claims, actions, damages, losses or expenses that may arise from the conduct of all activities of pre-Spin-Off SLM occurring prior to
38
the Spin-Off, except for certain liabilities related to the conduct of the pre-Spin-Off consumer banking business that were specifically assumed by the Bank (and as to which the Bank is obligated to indemnify Navient). Navient has acknowledged its indemnification obligations under the Separation and Distribution Agreement, in connection with the Multi-State Investigation and the related lawsuits in which the Bank has been named as a party, and has indemnified the Bank for all costs incurred to date in defending the Illinois lawsuit. Navient has informed the Bank, however, that it believes that the Bank may be responsible to indemnify Navient against certain potential liabilities arising from the above-described lawsuits under the Separation and Distribution Agreement and/or a separate loan servicing agreement between the parties, and has suggested that the parties defer further discussion regarding indemnification obligations, and reimbursement of ongoing legal costs, in connection with the lawsuits until the lawsuits are resolved. The Bank disagrees with Navient’s position and the Bank has reiterated to Navient that Navient is responsible for promptly indemnifying the Bank against all liabilities arising out of the conduct of pre-Spin-Off SLM that are at issue in the Multi-State Investigation and in the above-described lawsuits.
Regulatory Update
On May 13, 2014, the Bank reached settlement with the DOJ regarding compliance with the SCRA. In connection with the settlement, the Bank became subject to the DOJ Consent Order, which was approved by the U.S. District Court for the District of Delaware on September 29, 2014. Under the terms of the Separation and Distribution Agreement, Navient is responsible for funding all liabilities under the order and, as of the date hereof, has funded all liabilities other than fines directly levied against the Bank in connection with these matters which the Bank is required to pay.
The DOJ Consent Order expired by its terms on September 29, 2018, and the related case was dismissed with prejudice on October 4, 2018.
In May 2014, the Bank received a CID from the CFPB as part of the CFPB Investigation. Two state attorneys general also provided the Bank identical CIDs and other state attorneys general have become involved in the Multi-State Investigation. To the extent requested, the Bank has been cooperating fully with the CFPB and the attorneys general conducting the Multi-State Investigation. Given the timeframe covered by the CIDs, the CFPB Investigation and the Multi-State Investigation, and the focus on practices and procedures previously conducted by Navient and its servicing subsidiaries prior to the Spin-Off, Navient is leading the response to these investigations. Consequently, we have no basis from which to estimate either the duration or ultimate outcome of these investigations.
With regard to the CFPB Investigation, we note that on January 18, 2017, the CFPB filed a complaint in federal court in Pennsylvania against Navient, along with its subsidiaries, Navient Solutions, Inc. and Pioneer Credit Recovery, Inc. The complaint alleges these Navient entities, among other things, engaged in deceptive practices with respect to their historic servicing and debt collection practices. Neither SLM, the Bank, nor any of their current subsidiaries are named in, or otherwise a party to, the lawsuit and are not alleged to have engaged in any wrongdoing. The CFPB’s complaint asserts Navient’s assumption of these liabilities pursuant to the Separation and Distribution Agreement.
|
Item 4.
|
Mine Safety Disclosures
|
N/A
39
PART II.
|
Item 5.
|
Market for Registrant’s Common Equity, Related Stockholder Matters and Issuer Purchases of Equity Securities
|
Our common stock is listed and has traded on the Nasdaq Global Select Market (“Nasdaq”) under the symbol SLM since December 12, 2011. Previously, our common stock was listed and traded on the New York Stock Exchange. As of
January 31, 2019
, there were
436,802,555
shares of our common stock outstanding and 287 holders of record.
For the years ended December 31, 2018 and 2017, we did not pay dividends on our common stock.
On January 23, 2019, we announced that we had initiated a new policy to pay a regular, quarterly cash dividend on our common stock, beginning in the first quarter of 2019. Common stock dividend declarations are subject to determination by, and the discretion of, our Board of Directors. We may change our new common stock dividend policy at any time.
Issuer Purchases of Equity Securities
The following table provides information relating to our purchase of shares of our common stock in the three months ended
December 31, 2018
. We only repurchased common stock acquired as a result of taxes withheld in connection with award exercises and vesting under our employee stock-based compensation plans.
|
(In thousands, except per share data)
|
Total Number
of Shares
Purchased
(1)
|
Average Price
Paid per
Share
|
Total Number of
Shares Purchased
as Part of Publicly
Announced Plans
or Programs
|
Approximate Dollar
Value
of Shares That
May Yet Be
Purchased Under
Publicly Announced
Plans or
Programs
|
||||||
|
Period:
|
|
|
|
|
||||||
|
October 1 - October 31, 2018
|
3
|
|
$10.26
|
—
|
|
—
|
|
|||
|
November 1 - November 30, 2018
|
12
|
|
$10.36
|
—
|
|
—
|
|
|||
|
December 1 - December 31, 2018
|
15
|
|
$8.84
|
—
|
|
—
|
|
|||
|
|
|
|
|
|||||||
|
Total fourth-quarter 2018
|
30
|
|
$9.60
|
—
|
|
|
||||
_
|
(1)
|
All shares purchased are shares of our common stock tendered to us to satisfy the exercise price in connection with cashless exercises of stock options, and tax withholding obligations in connection with exercise of stock options and vesting of restricted stock and restricted stock units.
|
The closing price of our common stock on Nasdaq on December 31, 2018 was $8.31.
On January 23, 2019, we announced that our Board of Directors had approved a new common share repurchase program. The new share repurchase program, which was effective upon announcement and expires on January 22, 2021, permits us to repurchase from time to time shares of our common stock up to an aggregate repurchase price not to exceed $200 million. The timing and volume of any repurchases will be subject to market conditions, and there can be no guarantee that we will repurchase up to the limit of the program or at all. In addition to any repurchases that we may make under the new share repurchase program, we expect to repurchase common stock acquired as a result of taxes withheld in connection with award exercises and vesting under our employee stock-based compensation plans.
40
Stock Performance
The following graph compares the five-year cumulative total returns of SLM Corporation, the S&P Supercomposite Consumer Finance Sub-Industry Index, and the S&P 400 Regional Bank Sub-Industry Index. In previous years, we used the S&P Midcap 400 Index and the KBW Bank Index as our comparators. We changed our comparators in this 2018 annual report because we believe the new comparators provide a more appropriate basis for comparison of the performance of our business. In addition, the new comparators are used by the Nominations, Governance and Compensation Committee of our Board of Directors in assessing portions of the long-term incentive plan compensation for our executive officers.
This graph assumes $100 was invested in the stock or the relevant index on December 31, 2013, and also assumes the reinvestment of dividends through
December 31, 2018
, including the Company’s distribution to its shareholders of one share of Navient Corporation common stock for every share of SLM Corporation on April 30, 2014. For the purpose of this graph, the Navient Corporation distribution is treated as a non-taxable cash dividend of $16.56 that would have been reinvested in SLM Corporation common stock at the close of business on April 30, 2014.
Five-Year Cumulative Total Stockholder Return

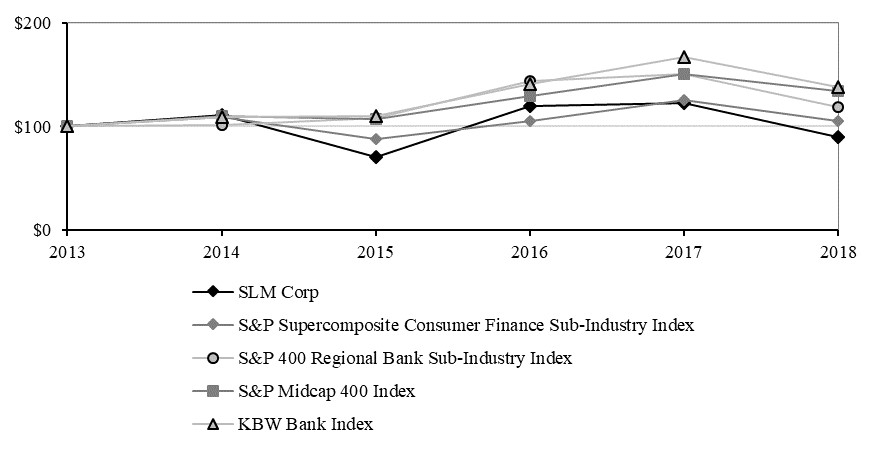
|
Company/Index
|
12/31/13
|
12/31/14
|
12/31/15
|
12/31/16
|
12/31/17
|
12/31/18
|
||||||||||||
|
SLM Corporation
|
|
$100.0
|
|
|
$110.6
|
|
|
$70.8
|
|
|
$119.6
|
|
|
$122.6
|
|
|
$90.2
|
|
|
S&P Supercomposite Consumer Finance Sub-Industry Index
|
100.0
|
|
109.0
|
|
87.4
|
|
105.0
|
|
125.7
|
|
104.9
|
|
||||||
|
S&P 400 Regional Bank Sub-Industry Index
|
100.0
|
|
101.2
|
|
107.8
|
|
143.4
|
|
150.9
|
|
118.6
|
|
||||||
|
S&P Midcap 400 Index
|
100.0
|
|
109.7
|
|
107.3
|
|
129.6
|
|
150.6
|
|
133.9
|
|
||||||
|
KBW Bank Index
|
100.0
|
|
109.4
|
|
109.9
|
|
141.2
|
|
167.5
|
|
137.8
|
|
||||||
_________
Source: Bloomberg Total Return Analysis
41
|
Item 6.
|
Selected Financial Data.
|
Selected Financial Data 2014-2018
(Dollars in millions, except per share amounts)
The following table sets forth our selected financial and other operating information. The selected financial data in the table is derived from our consolidated financial statements. The data should be read in conjunction with the consolidated financial statements, related notes, and Item 7. “Management’s Discussion and Analysis of Financial Condition and Results of Operations.”
|
|
2018
|
2017
|
2016
|
2015
|
2014
(1)
|
|||||||||||||||
|
Operating Data:
|
|
|
||||||||||||||||||
|
Net interest income
|
$
|
1,413
|
|
$
|
1,129
|
|
$
|
891
|
|
$
|
702
|
|
$
|
578
|
|
|||||
|
Non-interest income (loss)
|
(52
|
)
|
(3
|
)
|
69
|
|
183
|
|
157
|
|
||||||||||
|
Total revenue
|
1,361
|
|
1,126
|
|
960
|
|
885
|
|
735
|
|
||||||||||
|
Net income attributable to SLM Corporation
|
$
|
487
|
|
$
|
289
|
|
$
|
250
|
|
$
|
274
|
|
$
|
194
|
|
|||||
|
Basic earnings per common share attributable to SLM Corporation
|
$
|
1.08
|
|
$
|
0.63
|
|
$
|
0.54
|
|
$
|
0.60
|
|
$
|
0.43
|
|
|||||
|
Diluted earnings per common share attributable to SLM Corporation
|
$
|
1.07
|
|
$
|
0.62
|
|
$
|
0.53
|
|
$
|
0.59
|
|
$
|
0.42
|
|
|||||
|
Dividends per common share attributable to SLM Corporation common shareholders
(2)
|
$
|
—
|
|
$
|
—
|
|
$
|
—
|
|
$
|
—
|
|
$
|
—
|
|
|||||
|
Return on common stockholders’ equity
|
20
|
%
|
14
|
%
|
14
|
%
|
18
|
%
|
15
|
%
|
||||||||||
|
Net interest margin
|
6.10
|
|
5.93
|
|
5.68
|
|
5.49
|
|
5.26
|
|
||||||||||
|
Return on assets
|
2.01
|
|
1.43
|
|
1.52
|
|
2.04
|
|
1.68
|
|
||||||||||
|
Average equity/average assets
|
11.22
|
|
11.92
|
|
13.40
|
|
14.49
|
|
13.92
|
|
||||||||||
|
Non-GAAP operating efficiency ratio
(3)
|
41.0
|
|
39.6
|
|
40.1
|
|
46.9
|
|
45.1
|
|
||||||||||
|
Balance Sheet Data:
|
|
|
|
|
||||||||||||||||
|
Total education loan portfolio, net
|
$
|
21,143
|
|
$
|
18,174
|
|
$
|
15,125
|
|
$
|
11,631
|
|
$
|
9,510
|
|
|||||
|
Total Personal Loans, net
|
1,128
|
|
394
|
|
13
|
|
—
|
|
—
|
|
||||||||||
|
Total assets
|
26,638
|
|
21,780
|
|
18,533
|
|
15,214
|
|
12,972
|
|
||||||||||
|
Total deposits
|
18,943
|
|
15,505
|
|
13,436
|
|
11,488
|
|
10,541
|
|
||||||||||
|
Total borrowings
|
4,284
|
|
3,275
|
|
2,168
|
|
1,079
|
|
—
|
|
||||||||||
|
Total SLM Corporation stockholders’ equity
|
2,973
|
|
2,474
|
|
2,347
|
|
2,096
|
|
1,830
|
|
||||||||||
|
Book value per common share
|
5.90
|
|
4.80
|
|
4.15
|
|
3.59
|
|
2.99
|
|
||||||||||
_________
(1) For the year ended December 31, 2014, the selected financial data is presented on a basis of accounting that reflects a change in reporting entity and has been adjusted for the effects of the Spin-Off. The carved-out financial information represents only those operations, assets, liabilities and equity that form SLM on a stand-alone basis.
(2) As of December 31, 2018, we have not paid dividends on our common stock. On January 23, 2019, however, we announced that we had initiated a new policy to pay a regular, quarterly cash dividend on our common stock, beginning in the first quarter of 2019. Common stock dividend declarations are subject to determination by, and the discretion of, our Board of Directors. We may change our new common stock dividend policy at any time.
(3) Our operating efficiency ratio is a non-GAAP measure because we adjust (a) the total non-interest expense numerator by deducting restructuring and other reorganization expenses, and (b) the net revenue denominator (which otherwise would consist of net interest income, before provisions for credit losses, and non-interest income) by excluding any gains and losses on sales of loans and securities, net and the net impact of derivative accounting as defined in the Core Earnings adjustments to GAAP table set forth in Item 7. “Management’s Discussion and Analysis of Financial Condition and Results of Operations — Key Financial Measures — Core Earnings” of this Annual Report on Form 10-K. We believe doing so provides useful information to investors because it is a measure used by our management team to monitor our effectiveness in managing operating expenses. Other companies may use similarly titled non-GAAP financial measures that are calculated differently from the way we calculate our ratio. Accordingly, our non-GAAP operating efficiency ratio may not be comparable to similar measures used by other companies.
42
|
Item 7.
|
Management’s Discussion and Analysis of Financial Condition and Results of Operations
|
The following discussion and analysis should be read in conjunction with our consolidated financial statements and related notes included elsewhere in this Annual Report on Form 10-K. This discussion and analysis also contains forward-looking statements and should also be read in conjunction with the disclosures and information contained in “Forward-Looking and Cautionary Statements” and Item 1A. “Risk Factors” in this Annual Report on Form 10-K.
Through this discussion and analysis, we intend to provide the reader with some narrative context for how our management views our consolidated financial statements, additional context within which to assess our operating results, and information on the quality and variability of our earnings, liquidity and cash flows.
Overview
The following discussion and analysis presents a review of our business and operations as of and for the year ended
December 31, 2018
.
Key Financial Measures
Set forth below are brief summaries of our key financial measures. Our operating results are primarily driven by net interest income from our Private Education Loan portfolio, provision expense for credit losses, and operating expenses. The growth of our business and the strength of our financial condition are primarily driven by our ability to achieve our annual Private Education Loan origination goals while sustaining credit quality and maintaining cost-efficient funding sources to support our originations.
Net Interest Income
Most of our earnings are generated from the interest income earned on assets in our education loan portfolios and on Personal Loans, net of the interest expense we pay on the funding for those loans. We report these earnings as net interest income. We also often refer to the net interest margin, which is the net interest yield earned on our interest-earning assets less the rate paid on our related interest-bearing liabilities. The majority of our interest income comes from our Private Education Loan portfolio. FFELP Loans have a lower net interest yield and carry lower risk than Private Education Loans, as a result of the federal government guarantee supporting FFELP Loans. Personal Loans tend to be higher risk and shorter term than Private Education Loans and also have a higher overall interest rate. We do not expect to acquire more FFELP Loans, and the balance of our FFELP Loan portfolio is expected to decline due to normal amortization.
Allowance for Loan Losses
Management estimates and maintains an allowance for loan losses at a level sufficient to cover charge-offs expected over the next year, plus an additional allowance to cover life-of-loan expected losses for loans classified as troubled debt restructurings (“TDRs”). See Item 7. “Management’s Discussion and Analysis of Financial Condition and Results of Operations — Critical Accounting Policies and Estimates — Allowance for Loan Losses.” Allowances for loan losses are an important indicator of management’s perspective on the future performance of a loan portfolio. Each quarter, management makes an adjustment to the allowance for loan losses to reflect its most up-to-date estimate of future losses by recording a charge against quarterly revenues known as provision expense. As they occur, actual loan charge-offs and recoveries are then charged or credited, respectively, against the allowance for loan losses rather than against earnings.
The allowance for loan losses and provision expense rise when future charge-offs are expected to increase and fall when future charge-offs are expected to decline. We bear the full credit exposure on our Private Education Loans and Personal Loans. Losses on our Private Education Loans are affected by risk characteristics such as loan status (in-school, grace, forbearance, repayment and delinquency), loan seasoning (number of months in active repayment), underwriting criteria (e.g., credit scores), presence of a cosigner and the current economic environment. Losses typically emerge once a borrower separates from school and enters full principal and interest repayment after the borrower’s grace period (six months, typically) ends. Our experience indicates that approximately 50 percent of expected losses on a Private Education Loan occur in the first two years after a loan enters full principal and interest repayment. Therefore, changes in our allowance for loan losses will be driven in large measure
43
by the amount and age of our Private Education Loans in full principal and interest repayment. As a larger proportion of our Private Education Loan portfolio enters full principal and interest repayment in the coming years, we would expect the amount of TDRs, as well as our allowance for loan losses and charge-offs, to increase. Losses on our Personal Loans are affected by risk characteristics such as FICO scores at origination and seasoning.
Our allowance for loan losses for FFELP Loans and related periodic provision expense are small because we generally bear a maximum of three percent loss exposure due to the federal guarantee on such loans. We maintain an allowance for loan losses for our FFELP Loans at a level sufficient to cover charge-offs expected over the next two years.
We maintain an allowance for Personal Loan losses at an amount sufficient to absorb losses estimated and viewed at the reporting date as probable credit losses to be incurred in the portfolio. In determining the allowance for loan losses on our Personal Loans that are not TDRs, we estimate the principal amount of the loans that will default over the next twelve months (twelve months being the expected period between a loss event and default) and how much we expect to recover over the same twelve-month period related to the defaulted amounts. The expected defaults less our expected recoveries adjusted for any qualitative factors equal the allowance related to this portfolio of Personal Loans that are not TDRs.
Charge-Offs and Delinquencies
Delinquencies are another important indicator of potential future credit performance. When a Private Education Loan or Personal Loan reaches 120 days delinquent, it is charged against the allowance for loan losses. Charge-off data provides relevant information with respect to the actual performance of a loan portfolio over time. Management focuses on delinquencies as well as the progression of loans from early to late stage delinquency as a key metric in estimating the allowance for loan losses and tailoring its future collections strategies. We manage our charged-off loans through a mix of in-house collectors, third-party collectors and to third-parties.
Operating Expenses
The cost of operating our business directly affects our profitability. We continue to measure our effectiveness in managing operating expenses by monitoring our non-GAAP operating efficiency ratio. We calculate and report our non-GAAP operating efficiency ratio as the ratio of (a) the total non-interest expense numerator to (b) the net revenue denominator (which consists of the sum of net interest income, before provision for credit losses, and non-interest income, excluding any gains and losses on sales of loans and securities, net and the net impact of derivative accounting as defined in our “Core Earnings” adjustments to GAAP table in “- ‘Core Earnings’ ’’ in this Form 10-K). We believe doing so provides useful information to investors because it is a measure used by our management team to monitor our effectiveness in managing operating expenses. Other companies may use similarly titled non-GAAP financial measures that are calculated differently from the way we calculate our ratio. Accordingly, our non-GAAP operating efficiency ratio may not be comparable to similar measures used by other companies. Our long-term objective is to achieve steady declines in this ratio over the next several years.
44
Core Earnings
We prepare financial statements in accordance with GAAP. However, we also produce and report our after-tax earnings on a separate basis that we refer to as “Core Earnings.” The difference between our “Core Earnings” and GAAP results for periods presented generally is driven by the unrealized, mark-to-market gains (losses) on derivatives contracts recognized in GAAP, but not in “Core Earnings.”
“Core Earnings” recognizes the difference in accounting treatment based upon whether a derivative qualifies for hedge accounting treatment. We enter into derivative instruments to economically hedge interest rate and cash flow risk associated with our portfolio. We believe that our derivatives are effective economic hedges, and as such, are a critical element of our interest rate risk management strategy. Those derivative instruments that qualify for hedge accounting treatment have their related cash flows recorded in interest income or interest expense along with the hedged item. Some of our derivatives do not qualify for hedge accounting treatment and the stand-alone derivative must be marked-to-fair value in the income statement with no consideration for the corresponding change in fair value of the hedged item. These gains and losses, recorded in “Gains (losses) on derivatives and hedging activities, net,” are primarily caused by interest rate volatility and changing credit spreads during the period as well as the volume and term of derivatives not receiving hedge accounting treatment. Cash flows on derivative instruments that do not qualify for hedge accounting are not recorded in interest income and interest expense; they are recorded in non-interest income: “Gains (losses) on derivatives and hedging activities, net.”
In the third quarter of 2018, we elected to early adopt Accounting Standards Update (“ASU”) No. 2017-12, “Derivatives and Hedging: Targeted Improvements to Accounting for Hedging Activities,” effective July 1, 2018. The new standard requires the recording of any accounting ineffectiveness in the same line item in the consolidated statements of income that is used to present the earnings effect of the hedged item. As such, accounting ineffectiveness for hedging relationships will no longer be recorded in “Gains (losses) on derivatives and hedging activities, net.” Under the new standard, for fair value hedges, the entire change in the fair value of the hedging instrument included in the assessment of hedge effectiveness is recorded in the same line item in the consolidated statements of income that is used to present the earnings effect of the hedged item. For cash flow hedges, the entire change in the fair value of the hedging instrument included in the assessment of hedge effectiveness is recorded in other comprehensive income (loss) and subsequently reclassified to earnings, in the same line item in the consolidated statements of income as impacted by the hedged item, when the hedged item affects earnings. See Note 2, “Significant Accounting Policies,” to the Notes to the Consolidated Financial Statements for further details.
Beginning with the third quarter of 2018, we have changed our definition of “Core Earnings” to no longer exclude ineffectiveness related to derivative instruments that are receiving hedge accounting treatment. As such, the only adjustments required to reconcile from our “Core Earnings” results to our GAAP results of operations, net of tax, relate to differing treatments for those derivative instruments used to hedge our economic risks that do not qualify for hedge accounting treatment. For periods beginning July 1, 2018, the amount recorded in “Gains (losses) on derivatives and hedging activities, net” includes (a) the accrual of the current payment on those interest rate swaps that do not qualify for hedge accounting treatment and (b) the change in fair values related to future expected cash flows for derivatives that do not qualify for hedge accounting treatment. For purposes of “Core Earnings,” we are including in GAAP earnings the current period accrual amounts (interest reclassification) on the swaps and excluding the change in fair values for those derivatives not qualifying for hedge accounting treatment. “Core Earnings” is meant to represent what earnings would have been had these derivatives qualified for hedge accounting and there was no ineffectiveness. ASU No. 2017-12 significantly reduces the future expected ineffectiveness for our derivatives that receive hedge accounting treatment to an immaterial amount. As our previous definition of “Core Earnings” was intended to exclude the impact of ineffectiveness, we believe the change in definition will have an immaterial effect on “Core Earnings” in future periods. Prior period “Core Earnings” were not restated using the updated definition because the changes would have been immaterial if ASU No. 2017-12 had been applied for “Core Earnings” purposes to those past periods.
For periods prior to July 1, 2018, the amount recorded in “Gains (losses) on derivatives and hedging activities, net” includes (a) the accrual of the current payment on those interest rate swaps that do not qualify for hedge accounting treatment, (b) the change in fair values related to future expected cash flows for derivatives that do not qualify for hedge accounting treatment and (c) ineffectiveness on derivatives that receive hedge accounting treatment. For purposes of “Core Earnings” in those periods prior to July 1, 2018, we are including in GAAP earnings the current period accrual amounts (interest reclassification) on the swaps and excluding the remaining ineffectiveness (and change in fair values for those derivatives not qualifying for hedge accounting treatment). “Core Earnings” in those periods is meant to represent what earnings would have been had these derivatives qualified for hedge accounting and there was no ineffectiveness.
45
Core Earnings” are not a substitute for reported results under GAAP. We provide a “Core Earnings” basis of presentation because (i) earnings per share computed on a “Core Earnings” basis is one of several measures we utilize in establishing management incentive compensation and (ii) we believe it better reflects the financial results for derivatives that are economic hedges of interest rate risk, but which do not qualify for hedge accounting treatment.
GAAP provides a uniform, comprehensive basis of accounting. Our “Core Earnings” basis of presentation differs from GAAP in the way it treats derivatives as described above.
The following table shows the amount in “Losses on derivatives and hedging activities, net” that relates to the interest reclassification on the derivative contracts.
|
Years Ended December 31,
|
||||||||||||
|
(Dollars in thousands)
|
2018
|
2017
|
2016
|
|||||||||
|
Hedge ineffectiveness (losses) gains prior to adoption of ASU No. 2017-12
(1)
|
$
|
2,684
|
|
$
|
(4,504
|
)
|
$
|
(2,615
|
)
|
|||
|
Unrealized losses on instruments not in a hedging relationship
|
(1,400
|
)
|
(3,693
|
)
|
(513
|
)
|
||||||
|
Interest reclassification
|
(1,371
|
)
|
(69
|
)
|
2,170
|
|
||||||
|
Losses on derivatives and hedging activities, net
|
$
|
(87
|
)
|
$
|
(8,266
|
)
|
$
|
(958
|
)
|
|||
______
(1) The hedge ineffectiveness gains of $2.7 million for the year ended December 31, 2018 relate to hedging relationships that were discontinued in 2018 prior to the adoption of ASU No. 2017-12.
46
The following table reflects adjustments associated with our derivative activities.
|
Years Ended December 31,
|
||||||||||||
|
(Dollars in thousands, except per share amounts)
|
2018
|
2017
|
2016
|
|||||||||
|
“
Core Earnings
”
adjustments to GAAP:
|
||||||||||||
|
GAAP net income
|
$
|
487,476
|
|
$
|
288,934
|
|
$
|
250,327
|
|
|||
|
Preferred stock dividends
|
15,640
|
|
15,714
|
|
21,204
|
|
||||||
|
GAAP net income attributable to SLM Corporation common stock
|
$
|
471,836
|
|
$
|
273,220
|
|
$
|
229,123
|
|
|||
|
Adjustments:
|
||||||||||||
|
Net impact of derivative accounting
(1)
|
(1,284
|
)
|
8,197
|
|
3,127
|
|
||||||
|
Net tax effect
(2)
|
(312
|
)
|
3,131
|
|
1,199
|
|
||||||
|
Total “Core Earnings” adjustments to GAAP
|
(972
|
)
|
5,066
|
|
1,928
|
|
||||||
|
“Core Earnings” attributable to SLM Corporation common stock
|
$
|
470,864
|
|
$
|
278,286
|
|
$
|
231,051
|
|
|||
|
GAAP diluted earnings per common share
|
$
|
1.07
|
|
$
|
0.62
|
|
$
|
0.53
|
|
|||
|
Derivative adjustments, net of tax
|
—
|
|
0.01
|
|
—
|
|
||||||
|
“Core Earnings” diluted earnings per common share
|
$
|
1.07
|
|
$
|
0.63
|
|
$
|
0.53
|
|
|||
______
(1) Derivative Accounting: “Core Earnings” exclude periodic unrealized gains and losses caused by the mark-to-market valuations on derivatives that do not qualify for hedge accounting treatment under GAAP, but include current period accruals on the derivative instruments. For periods prior to July 1, 2018, “Core Earnings” also exclude the periodic unrealized gains and losses that are a result of ineffectiveness recognized related to effective hedges under GAAP, net of tax. Under GAAP, for our derivatives held to maturity, the cumulative net unrealized gain or loss over the life of the contract will equal $0.
(2) “Core Earnings” tax rate is based on the effective tax rate at the Bank where the derivative instruments are held.
47
Private Education Loan Originations
Private Education Loans are the principal asset on our balance sheet, and the amount of new Private Education Loan originations we generate each year is a key indicator of the trajectory of our business, including our future earnings and asset growth.
Funding Sources
Deposits
We utilize brokered, retail and other core deposits to meet funding needs and enhance our liquidity position. These deposits can be term or liquid deposits. Term brokered deposits may have terms as long as seven years. Interest rates on most of our long-term deposits are swapped into one-month LIBOR. This structure has the effect of matching our interest rate exposure to the index on which our assets reset, thereby minimizing our financing cost exposure to interest rate risk. Retail deposits are sourced through a direct banking platform and serve as an important source of diversified funding. Brokered deposits are sourced through a network of brokers and provide a stable source of funding. In addition, we accept certain deposits considered non-brokered that are held in large accounts structured to allow FDIC insurance to flow through to underlying individual depositors. In 2016, we began adding deposits from Educational 529 and Health Savings plans as a way to diversify our funding sources. These and other large omnibus accounts, aggregating the deposits of many individual depositors, represented $5.9 billion of our deposit total as of
December 31, 2018
.
Loan Securitizations
We have diversified our funding sources by issuing term ABS and by entering into the Secured Borrowing Facility (which was previously called the asset-backed commercial paper facility, or ABCP Facility). Term ABS financing provides long-term funding for our Private Education Loan portfolio at attractive interest rates and at terms that effectively match the average life of the assets. Loans associated with these transactions will remain on our balance sheet if we retain the residual interest in these trusts. The Secured Borrowing Facility provides an extremely flexible source of funds that can be drawn upon on short notice to meet funding needs within the Bank. Borrowings under our Secured Borrowing Facility are accounted for as secured financings.
48
Reconciliation of the Effect of Tax-Related Items on the GAAP Consolidated Statements of Income
The Tax Cuts and Jobs Act of 2017 (the “Tax Act”), which was signed into law by President Trump on December 22, 2017, lowered the federal statutory corporate income tax rate from 35 percent to 21 percent, beginning in 2018. Because the Tax Act was enacted during the fourth-quarter 2017, we were required in late 2017 to reflect the application of the lower tax rate in future years to our deferred tax assets, liabilities and indemnification receivables. Therefore, at December 31, 2017, we recorded a provisional estimate that resulted in a $15 million net increase in tax expense and reduced other income by $24 million to reflect the effect of the lower tax rate.
Unrelated to the Tax Act, we also reduced other income in 2017 and 2018 to reflect the reduction in our tax indemnification receivable because of the expiration of certain statutes of limitations related to a portion of our indemnified uncertain tax positions. When reflecting these reductions, income taxes payable and income tax expense were reduced by corresponding amounts for the relevant periods.
We report in this Annual Report certain effects of the Tax Act and reductions to other income due to the reduction in our tax indemnification receivable because of the expiration of certain statutes of limitations related to a portion of our indemnified uncertain tax positions. We believe this additional disclosure will be helpful to investors by illustrating and quantifying the impact of tax-related items. Our financial results absent the effect of the Tax Act and reductions to other income due to the reduction in our tax indemnification receivable because of the expiration of certain statutes of limitations related to a portion of our indemnified uncertain tax positions are unique to our company, are not defined terms within GAAP and may not be comparable to adjustments made by, or to similarly captioned measures reported by, other companies.
The table below reflects the adjustments to certain line items in the GAAP Consolidated Statements of Income related to these tax-related items.
49
|
Year Ended
|
Year Ended
|
|||||||||||||||||||||||
|
|
December 31, 2018
|
December 31, 2017
|
||||||||||||||||||||||
|
(Dollars in thousands, except per share amounts)
|
As
Reported
|
Tax-Related Items
|
Adjusted
(Non-GAAP)
|
As
Reported
|
Tax-Related Items
|
Adjusted
(Non-GAAP)
|
||||||||||||||||||
|
Non-interest income (loss):
|
||||||||||||||||||||||||
|
Gains on sales of loans, net
|
$
|
2,060
|
|
$
|
—
|
|
$
|
2,060
|
|
$
|
—
|
|
$
|
—
|
|
$
|
—
|
|
||||||
|
Losses on sales of securities, net
|
(1,549
|
)
|
—
|
|
(1,549
|
)
|
—
|
|
—
|
|
—
|
|
||||||||||||
|
Gains (losses) on derivatives and hedging activities, net
|
(87
|
)
|
—
|
|
(87
|
)
|
(8,266
|
)
|
—
|
|
(8,266
|
)
|
||||||||||||
|
Other income (loss)
|
(52,319
|
)
|
93,857
|
|
(1)
|
41,538
|
|
5,364
|
|
34,749
|
|
(3)
|
40,113
|
|
||||||||||
|
Total non-interest income (loss)
|
$
|
(51,895
|
)
|
$
|
93,857
|
|
$
|
41,962
|
|
$
|
(2,902
|
)
|
$
|
34,749
|
|
$
|
31,847
|
|
||||||
|
Income before income tax expense
|
$
|
559,329
|
|
$
|
93,857
|
|
$
|
653,186
|
|
$
|
491,465
|
|
$
|
34,749
|
|
$
|
526,214
|
|
||||||
|
Income tax expense
|
$
|
71,853
|
|
$
|
93,857
|
|
(2)
|
$
|
165,710
|
|
$
|
202,531
|
|
$
|
(3,818
|
)
|
(4)
|
$
|
198,713
|
|
||||
|
Net income
|
$
|
487,476
|
|
$
|
—
|
|
$
|
487,476
|
|
$
|
288,934
|
|
$
|
38,567
|
|
$
|
327,501
|
|
||||||
|
Net income attributable to SLM Corporation common stock
|
$
|
471,836
|
|
$
|
—
|
|
$
|
471,836
|
|
$
|
273,220
|
|
$
|
38,567
|
|
$
|
311,787
|
|
||||||
|
Basic earnings per common share attributable to SLM Corporation
|
$
|
1.08
|
|
$
|
—
|
|
$
|
1.08
|
|
$
|
0.63
|
|
$
|
0.09
|
|
$
|
0.72
|
|
||||||
|
Diluted earnings per common share attributable to SLM Corporation
|
$
|
1.07
|
|
$
|
—
|
|
$
|
1.07
|
|
$
|
0.62
|
|
$
|
0.09
|
|
$
|
0.71
|
|
||||||
_____
(1) Represents the reduction in the tax indemnification receivable because of the expiration of certain statutes of limitations related to a portion of indemnified uncertain tax positions.
(2) Represents the net reduction to income tax expense because of the expiration of certain statute of limitations related to a portion of indemnified uncertain tax positions.
(3) Represents the $24 million reduction in a tax-related indemnification receivable due to the lower federal corporate tax rate set forth in the Tax Act and an $11 million reduction in the tax indemnification receivable because of the expiration of certain statutes of limitations related to a portion of indemnified uncertain tax positions.
(4) Represents the net reduction in deferred tax assets and liabilities of $15 million due to the lower federal corporate tax rate set forth in the Tax Act, and an $11 million reduction in the tax indemnification receivable because of the expiration of certain statutes of limitations related to a portion of indemnified uncertain tax positions.
50
2018 Management Objectives
For 2018, we set out the following major goals for ourselves: (1) prudently grow our Private Education Loan assets and revenues while continuing to diversify the mix of our funding sources; (2) maintain our strong capital position; (3) expand our product offerings to increase the level of engagement with our existing customers and attract new customers; (4) manage operating expenses while improving efficiency; (5) maintain our strong governance, risk oversight and compliance infrastructure; and (6) leverage our culture to engage employees, recognize and reward contributions to business results, and develop talent to support our business strategy and growth. The following describes our performance relative to each of these goals.
Prudently Grow Private Education Loan Assets and Revenues
We pursued managed growth in our Private Education Loan portfolio in 2018 by leveraging our Sallie Mae brand, our relationship with more than 2,000 colleges and universities, and our direct consumer marketing efforts. In 2018, we introduced six new graduate student loan products tailored to meet the needs of students in their specific fields of study and originated $186 million of that product in 2018. We are determined to maintain overall credit quality and cosigner rates in our Smart Option Student Loan originations. Private Education Loan originations were 11 percent higher in 2018 compared with 2017. The average FICO scores at approval and the cosigner rates for originations for the year ended December 31, 2018 were 746 and 87.2 percent, compared with 747 and 88.0 percent for originations in the year ended December 31, 2017, respectively. In addition, to help facilitate the expected increase in our Private Education Loan originations and the increasing percentage of fixed-rate loans being selected by our customers, we continued to diversify the mix of our funding sources in 2018. In 2018, we completed three secured financings totaling $1.9 billion compared with two secured financings totaling $1.4 billion in 2017. We also raised fixed-rate brokered CDs in longer terms to manage potential interest rate risk.
Maintain Our Strong Capital Position
As our balance sheet grew in 2018, our regulatory capital ratios remained stable and we generated earnings and capital sufficient to cover the growth in our risk-weighted assets and remain significantly in excess of the capital levels required to be considered “well capitalized” by our regulators. As of December 31, 2018, the Bank had a Common Equity Tier 1 risk-based capital ratio of
12.1
percent, a Tier 1 risk-based capital ratio of
12.1
percent, a Total risk-based capital ratio of
13.3
percent and a Tier 1 leverage ratio of
11.1
percent, all exceeding the current regulatory guidelines for “well capitalized” institutions by a significant amount.
Expand Our Product Offerings to Increase Level of Engagement With Our Existing Customers and Attract New Customers
We made investments in 2018 that accelerated the diversification of our consumer lending platform into the Personal Loan and credit card businesses. In 2018, we began to offer six new graduate student loan products that are tailored to meet the needs of students in their specific fields of study.
In 2018, we began to originate Personal Loans and originated $455 million in total Personal Loans during the year. In addition, in 2018, we acquired $703 million of Personal Loans originated by third parties.
During the year, we began to lay the foundation for our credit card business. This process included identifying and selecting a partner to help issue and service credit card accounts, assembling the team to execute our business plan and limited issuances of credit cards to test our processes and systems.
We believe that these two new consumer finance products are an extension of our core competencies of underwriting, marketing and servicing unsecured credits and that these new product offerings will also enhance our Private Education Loan business.
Manage Operating Expenses While Improving Efficiency
We measure our effectiveness in managing operating expenses by monitoring our non-GAAP operating efficiency ratio. See Item 6. “Selected Financial Data” and Item 7. “Management’s Discussion and Analysis of Financial Condition and Results of Operations — Key Financial Measures — Operating Expenses,” for a discussion of the method for calculating this ratio. Full-year non-interest expenses grew
24
percent year-over-year, while the non-GAAP operating efficiency ratio was
41.0
percent for the year ended December 31, 2018, compared with
39.6
percent for the year ended December 31, 2017. The non-
51
GAAP operating efficiency ratio for the year ended December 31, 2018 was unfavorably affected by a $94 million decrease in other income due to a decrease in our tax indemnification receivable arising from the expiration of certain statutes of limitations regarding certain indemnified uncertain tax positions. Excluding this item, the non-GAAP operating efficiency ratio would have been 38.3 percent for the year ended December 31, 2018. The non-GAAP operating efficiency ratio for the year ended December 31, 2017 was unfavorably affected by a $24 million decrease in other income due to a lower valuation of tax indemnification receivables as a result of the reduction of the federal statutory corporate income tax rate from 35 percent to 21 percent under the Tax Act enacted in 2017, and, unrelated to the Tax Act, an $11 million reduction in other income due to the expiration of certain statutes of limitations regarding a portion of indemnified uncertain tax positions. Excluding these tax-related items, the non-GAAP operating efficiency ratio would have been 38.4 percent for the year ended December 31, 2017. The increase in non-interest expenses was driven by growth in our loan portfolio and investments associated with the development of our Personal Loan product, as well as investments related to other product diversification and platform enhancements.
In early 2018, we indicated our intention to invest $40 million to accelerate the diversification of our consumer lending platform into the Personal Loan and credit card businesses and to migrate our technology infrastructure to the cloud. Non-interest expenses associated with these efforts totaled $44 million in 2018. Expenses in our primary education loan business increased 14 percent in 2018 compared to 2017, excluding the technology infrastructure migration costs.
Maintain Our Strong Governance, Risk Oversight and Compliance Infrastructure
We have built customer protection policies, procedures and compliance management systems sufficient to meet or exceed currently applicable regulatory standards. In addition, we have developed a strong governance framework, which includes robust oversight, education, policies and procedures supported by Enterprise Risk Management, Compliance and Internal Audit functions. Our goal is to consistently comply with or exceed regulatory standards for compliance and risk management. The DOJ Consent Order expired by its terms on September 29, 2018, and the related case was dismissed with prejudice on October 4, 2018. This is a further indication of the strength and sustainability of the Bank’s governance, risk oversight and compliance infrastructure.
Leverage Our Culture to Engage Employees, Recognize and Reward Contributions to Business Results, and Develop Talent to Support our Business Strategy and Growth
In the first half of 2018, we completed focus groups with a cross-functional representative sample of employees to better understand and act upon their feedback through the annual employee engagement survey. We continued to reward top performers during the year-end compensation process through differentiation of pay based on the results of the performance measurement process. Each area of the business completed its organizational planning to identify critical talent needed now and in the future, against which leadership will develop talent and employees will align their development plans.
In the second quarter of 2018, we launched a new competency model that will provide a framework and common language to define the type of talent to move the organization forward. The core and leadership competencies will provide several tools for our employees to chart their career development. We also continued to focus on talent development by piloting a leadership development program to enhance leadership competencies and more effectively achieve results. This experience included a launch of a new multi-rater assessment tool that will be leveraged to create individual development plans.
In the third quarter of 2018, we launched a learning management system. The system provides access to learning and development courses. In addition, members of the leadership development program pilot that launched in the second quarter benefited from the expansion of our multi-rater competency assessment tool that will be leveraged in development planning in support of our succession plan.
In the fourth quarter of 2018, we implemented a new applicant tracking system which we use to identify and track the best job applicants - internal and external - to support the growth of our business. Throughout the year, we also recognized our highest performing employees through our Awards of Excellence Program.
52
Environmental, Social and Governance Practices
Our mission is to equip aspiring minds to create the lives they imagine. That mission is firmly grounded in helping families achieve the dream of a higher education. To further fulfill our mission, we’ve introduced a number of programs and thought-leadership initiatives, including: (i) Sallie Mae’s Bridging the Dream Scholarship Program; (ii) Financial Literacy Initiatives with Educator, Turned Hip-Hop Artist, Dee-1; (iii) national and state partnerships to develop and distribute college planning materials; and (iv) annual research and thought leadership regarding paying and saving for college, as well as management of finances by students. In addition, we are passionate about getting involved and giving back in the communities where we live and work. We strive to help create brighter futures by working directly with not-for-profit organizations in order to help students, families, and individuals in our communities. The Sallie Mae Employee Volunteer Program gives full-time employees paid time off to volunteer in their communities. Also, the Sallie Mae Employee Matching Gift Program encourages employees’ voluntary support of non-profit organizations, by matching personal donations to Internal Revenue Service registered charities through our charitable organization (The Sallie Mae Fund) dollar for dollar from $25 to a maximum of $1,000 per employee per calendar year. Since the Spin-Off, the Sallie Mae Fund has contributed more than $1.8 million to address key barriers to college access and support the community. In addition, we continue to make environmental improvements at our facilities as we are committed to improving the environmental sustainability of our business and to using resources and materials thoughtfully.
2019 Management Objectives
In 2019, we intend to devote ourselves to growing our primary student loan business, maintaining and enhancing our best-in-class customer experience platform, and continuing our efforts to diversify into other consumer finance products. We have set out the following major goals for ourselves: (1) prudently grow our Private Education Loan assets and revenues; (2) maintain our strong capital position; (3) continue our Personal Loan and credit card initiatives to increase the level of engagement with our existing customers and attract new customers; (4) manage operating expenses while improving efficiency; (5) maintain our strong governance, risk oversight and compliance infrastructure; and (6) leverage our culture to engage employees, recognize and reward contributions to business results, and develop talent to support our business strategy and growth.
53
Results of Operations
We present the results of operations below first on a consolidated basis in accordance with GAAP.
GAAP Statements of Income
|
Increase (Decrease)
|
||||||||||||||||||||||||||
|
|
Years Ended December 31,
|
2018 vs. 2017
|
2017 vs. 2016
|
|||||||||||||||||||||||
|
(Dollars in millions, except per share data)
|
2018
|
2017
|
2016
|
$
|
%
|
$
|
%
|
|||||||||||||||||||
|
Interest income:
|
|
|
|
|
|
|
||||||||||||||||||||
|
Loans
|
$
|
1,895
|
|
$
|
1,413
|
|
$
|
1,060
|
|
$
|
482
|
|
34
|
%
|
$
|
353
|
|
33
|
%
|
|||||||
|
Investments
|
6
|
|
8
|
|
9
|
|
(2
|
)
|
(25
|
)
|
(1
|
)
|
(11
|
)
|
||||||||||||
|
Cash and cash equivalents
|
34
|
|
16
|
|
8
|
|
18
|
|
113
|
|
8
|
|
100
|
|
||||||||||||
|
|
|
|
|
|
|
|
|
|||||||||||||||||||
|
Total interest income
|
1,935
|
|
1,437
|
|
1,077
|
|
498
|
|
35
|
|
360
|
|
33
|
|
||||||||||||
|
|
|
|
|
|
|
|
|
|||||||||||||||||||
|
Total interest expense
|
522
|
|
308
|
|
186
|
|
214
|
|
69
|
|
122
|
|
66
|
|
||||||||||||
|
|
|
|
|
|
|
|
|
|||||||||||||||||||
|
Net interest income
|
1,413
|
|
1,129
|
|
891
|
|
284
|
|
25
|
|
238
|
|
27
|
|
||||||||||||
|
Less: provisions for credit losses
|
245
|
|
186
|
|
159
|
|
59
|
|
32
|
|
27
|
|
17
|
|
||||||||||||
|
|
|
|
|
|
|
|
|
|||||||||||||||||||
|
Net interest income after provisions for credit losses
|
1,168
|
|
943
|
|
732
|
|
225
|
|
24
|
|
211
|
|
29
|
|
||||||||||||
|
Non-interest income (loss):
|
|
|
|
|
|
|
|
|||||||||||||||||||
|
Gains on sales of loans, net
|
2
|
|
—
|
|
—
|
|
2
|
|
—
|
|
—
|
|
—
|
|
||||||||||||
|
Losses on sales of securities, net
|
(2
|
)
|
—
|
|
—
|
|
(2
|
)
|
—
|
|
—
|
|
—
|
|
||||||||||||
|
Losses on derivatives and hedging activities, net
|
—
|
|
(8
|
)
|
(1
|
)
|
8
|
|
100
|
|
(7
|
)
|
(700
|
)
|
||||||||||||
|
Other income
|
(52
|
)
|
5
|
|
70
|
|
(58
|
)
|
(1,160
|
)
|
(65
|
)
|
(93
|
)
|
||||||||||||
|
|
|
|
|
|
|
|
|
|||||||||||||||||||
|
Total non-interest income (loss)
|
(52
|
)
|
(3
|
)
|
69
|
|
(49
|
)
|
(1,633
|
)
|
(72
|
)
|
(104
|
)
|
||||||||||||
|
Non-interest expenses:
|
|
|
|
|
|
|
|
|||||||||||||||||||
|
Total non-interest expenses
|
557
|
|
449
|
|
386
|
|
108
|
|
24
|
|
63
|
|
16
|
|
||||||||||||
|
|
|
|
|
|
|
|
|
|||||||||||||||||||
|
Income before income tax expense
|
559
|
|
491
|
|
415
|
|
68
|
|
14
|
|
76
|
|
18
|
|
||||||||||||
|
Income tax expense
|
72
|
|
203
|
|
164
|
|
(131
|
)
|
(65
|
)
|
39
|
|
24
|
|
||||||||||||
|
|
|
|
|
|
||||||||||||||||||||||
|
Net income
|
487
|
|
289
|
|
250
|
|
199
|
|
69
|
|
37
|
|
15
|
|
||||||||||||
|
Preferred stock dividends
|
16
|
|
16
|
|
21
|
|
—
|
|
—
|
|
(5
|
)
|
(24
|
)
|
||||||||||||
|
|
|
|
|
|
|
|
|
|||||||||||||||||||
|
Net income attributable to SLM Corporation common stock
|
$
|
472
|
|
$
|
273
|
|
$
|
229
|
|
$
|
199
|
|
73
|
%
|
$
|
44
|
|
19
|
%
|
|||||||
|
|
|
|
|
|
|
|
|
|||||||||||||||||||
|
Basic earnings per common share attributable to SLM Corporation
|
$
|
1.08
|
|
$
|
0.63
|
|
$
|
0.54
|
|
$
|
0.45
|
|
71
|
%
|
$
|
0.09
|
|
17
|
%
|
|||||||
|
|
|
|
|
|
|
|
|
|||||||||||||||||||
|
Diluted earnings per common share attributable to SLM Corporation
|
$
|
1.07
|
|
$
|
0.62
|
|
$
|
0.53
|
|
$
|
0.45
|
|
73
|
%
|
$
|
0.09
|
|
17
|
%
|
|||||||
54
GAAP Consolidated Earnings Summary
Year Ended December 31, 2018 Compared with Year Ended December 31, 2017
For the year ended December 31, 2018, net income was $487 million, or $1.07 diluted earnings per common share, compared with net income of $289 million, or $0.62 diluted earnings per common share, for the year ended December 31, 2017. The year-over-year increase was primarily attributable to a $4.1 billion increase in average earning assets, a 17 basis point increase in net interest margin and a $131 million decrease in income tax expense (primarily as a result of the impact of the Tax Act and the reduction of the federal statutory corporate income tax rate), which more than offset the $108 million increase in total non-interest expenses. See Item 7. “Management’s Discussion and Analysis of Financial Condition and Results of Operations — Key Financial Measures — Reconciliation of the Effect of Tax-Related Items on the GAAP Consolidated Statements of Income” for additional details.
The primary contributors to each of the identified drivers of change in net income for the current year period compared with the year-ago period are as follows:
|
•
|
Net interest income increased by $284 million compared with the year-ago period primarily due to a $3.8 billion increase in average loans outstanding. Net interest margin increased by 17 basis points primarily because of the benefit from an increase in LIBOR rates, which increased the yield on our variable-rate Private Education Loan portfolio more than it increased our cost of funds, and because of growth in the higher-yielding Personal Loan portfolio. Cost of funds increased primarily due to the increase in LIBOR rates as well as a higher percentage of our total interest-bearing liabilities consisting of higher cost other interest-bearing liabilities, which include both our unsecured and secured borrowings.
|
|
•
|
Provisions for credit losses increased $59 million compared with the year-ago period primarily due to a $67 million increase in the provision for Personal Loans. The provision for Personal Loans grew because the portfolio of Personal Loans increased from $400 million at December 31, 2017 to $1.2 billion at December 31, 2018. Provision for Private Education Loans declined $9 million in 2018 when compared to 2017 as a result of improved credit performance and increases in interest rates that had a favorable impact on the provision for losses on TDR loans.
|
|
•
|
Gains on sales of loans, net, resulted in a net gain of $2 million in 2018 as we sold the $43 million Split Loan (as hereinafter defined) portfolio in second-quarter 2018. See Item 7. “Management’s Discussion and Analysis of Financial Condition and Results of Operations — Risk Management — Arrangements with Navient Corporation — Amended Loan Participation and Purchase Agreement.” There were no gains on sales of loans, net in the year-ago period.
|
|
•
|
Losses on sales of securities, net, were $2 million in 2018 due to the sale of $41 million of mortgage-backed securities in second-quarter 2018. There were no sales of securities in the year-ago period.
|
|
•
|
Losses on derivatives and hedging activities, net, resulted in a net loss less than $1 million in 2018 compared with a net loss of $8 million in the year-ago period.
|
|
•
|
Other income in the year ended December 31, 2018 decreased $58 million from the year-ago period. This change was affected by unusual items that occurred in both 2017 and 2018. In 2018, we reduced other income by $94 million to reflect the reduction in our tax indemnification receivable because of the expiration of certain statutes of limitations related to a portion of indemnified uncertain tax positions. Income taxes payable and income tax expense were reduced by a corresponding amount. In 2017, to reflect the application of the reduction of the federal statutory corporate income tax rate from 35 percent to 21 percent pursuant to the Tax Act enacted in the fourth-quarter 2017, we reduced other income by $24 million due to a lower valuation of tax indemnification receivables for future years. Unrelated to the change in the federal income tax rate, we also reduced other income in 2017 by $11 million due to the expiration of certain statutes of limitations related to a portion of indemnified uncertain tax positions. Absent these tax-related items, other income in 2018 was $2 million greater than in 2017, primarily due to increased credit card revenue from the Company’s Upromise subsidiary.
|
|
•
|
For the year ended December 31, 2018, non-interest expenses were $557 million, compared with $449 million in the year-ago period. Full-year non-interest expenses grew 24.0 percent year-over-year, and the non-GAAP operating efficiency ratio increased to 41.0 percent in 2018 from 39.6 percent in 2017. Absent the tax-related items described above, the non-GAAP operating efficiency ratio would have been 38.3 and 38.4 percent for 2018 and 2017, respectively. The increase in non-interest expenses was driven by the growth in our loan portfolio and investments
|
55
associated with the development of our Personal Loan product, as well as investments related to other product diversification and platform enhancements.
In early 2018, we indicated our intention to invest $40 million to accelerate the diversification of our consumer lending platform into the Personal Loan and credit card businesses and to migrate our technology infrastructure to the cloud. Non-interest expenses associated with these efforts were $44 million in the year ended December 31, 2018. Expenses in our primary education loan business for the year ended December 31, 2018 increased 14 percent from the year-ago period, excluding the technology infrastructure migration costs.
|
•
|
Income tax expense decreased to $72 million in 2018 from $203 million in 2017. Our effective income tax rate decreased to
12.8
percent in 2018 from
41.2
percent in 2017. The decrease in the effective tax rate was primarily due to a $94 million decrease in income tax expense in 2018 due to the previously mentioned expiration of certain statutes of limitations regarding a portion of indemnified uncertain tax positions. Absent that item, our effective tax rate for 2018 would have been 25.4 percent. The further decrease in the effective tax rate is primarily due to the reduction in the federal statutory corporate income tax rate from 35 percent to 21 percent under the Tax Act enacted in 2017. For a reconciliation of the effect of these tax-related items on tax expense in the GAAP Consolidated Statements of Income of the Company, see Item 7. “Management’s Discussion and Analysis of Financial Condition and Results of Operations — Key Financial Measures — Reconciliation of the Effect of Tax-Related Items on the GAAP Consolidated Statements of Income” for additional details.
|
Year Ended December 31, 2017 Compared with Year Ended December 31, 2016
For the year ended December 31, 2017, net income was $289 million, or $0.62 diluted earnings per common share, compared with net income of $250 million, or $0.53 diluted earnings per common share, for the year ended December 31, 2016. The year-over-year increase was primarily attributable to a $3.3 billion increase in average earning assets and a 25 basis point increase in net interest margin. Negatively impacting 2017 results was the required accounting treatment for the effects of the Tax Act. See Item 7. “Management’s Discussion and Analysis of Financial Condition and Results of Operations — Key Financial Measures — Reconciliation of the Effect of Tax-Related Items on the GAAP Consolidated Statements of Income” for additional details.
The primary contributors to each of the identified drivers of change in net income for 2017 compared with 2016 are as follows:
|
•
|
Net interest income increased in 2017 by $238 million compared with 2016, primarily due to a $3.4 billion increase in average Private Education Loans outstanding and a 25 basis point increase in net interest margin. Net interest margin increased primarily as a result of an increase in the ratio of higher-yielding Private Education Loans relative to our other interest earning assets, growth in the higher-yielding Personal Loan portfolio, and the benefit from increases in LIBOR rates, which increased the yield on our variable-rate Private Education Loan portfolio more than it increased our cost of funds. Cost of funds increased primarily as a result of the increase in LIBOR rates, as well as an increase in the amount of funding from higher-cost, long-term secured borrowings.
|
|
•
|
Provisions for credit losses in 2017 increased $27 million compared with 2016. This increase was primarily the result of an additional $2.5 billion of Private Education Loans being in repayment at December 31, 2017, compared with loans being in repayment at December 31, 2016. This increase in loans in repayment more than offset the benefit from an increase in LIBOR rates, which had the effect of lowering the allowance for losses on our TDR portfolio, and a change in our policy for the identification of TDRs.
|
|
•
|
Losses on derivatives and hedging activities, net, resulted in a net loss of $8 million in 2017 compared with a net loss of $1 million in 2016. The primary factors affecting the change were changes in interest rates and whether derivatives qualified for hedge accounting treatment.
|
|
•
|
Other income decreased $65 million in 2017 compared with 2016. In 2017, to reflect the application of the Tax Act’s lower tax rate in future years, we reduced other income by $24 million due to a lower valuation of tax indemnification receivables. Unrelated to the Tax Act, we also reduced other income in 2017 by $11 million due to the expiration of certain statutes of limitations regarding a portion of indemnified uncertain tax positions. Tax expense was reduced by corresponding amounts for both of these items. Absent these two tax-related items, other income in 2017 was $29 million lower than in 2016 primarily due to lower credit card revenue in 2017, a $10 million one-time gain recorded in
|
56
2016 resulting from a change in reserve estimates for our Upromise rewards program and a $9 million increase recorded in 2016 regarding the tax indemnification receivable related to uncertain tax positions.
|
•
|
Total non-interest expenses were $449 million in 2017 compared with $386 million in 2016. Full-year operating expenses grew 16 percent year-over-year, while the non-GAAP operating efficiency ratio decreased to 39.6 percent in 2017 from 40.1 percent in 2016. Absent the impact of the Tax Act and the reduction in indemnified uncertain tax positions that, when combined, reduced other income by $35 million in 2017, the non-GAAP operating efficiency ratio would have been 38.4 percent for 2017. The increase in non-interest expense in 2017 was primarily attributable to increased technology costs, FDIC assessments and expenses related to portfolio growth.
|
|
•
|
Income tax expense increased to $203 million in 2017 from $164 million in 2016. Our effective income tax rate increased to 41.2 percent in 2017 from 39.6 percent in 2016. The increase in the effective tax rate was primarily the result of the one-time revaluation of our deferred tax assets and liabilities to apply the Tax Act’s lower tax rate in future years. We recorded a $15 million net increase in tax expense in 2017 from the revaluation of an indemnified liability (a $23 million reduction in expense) and all other deferred tax assets and liabilities (a $38 million increase in expense). Unrelated to the Tax Act, we recorded an $11 million decrease in tax expense in 2017 due to the previously-mentioned expiration of certain statutes of limitations regarding a portion of indemnified uncertain tax positions. Absent these three items, our effective tax rate for 2017 would have been 37.8 percent.
|
57
Financial Condition
Average Balance Sheets - GAAP
The following table reflects the rates earned on interest-earning assets and paid on interest-bearing liabilities and reflects our net interest margin on a consolidated basis.
|
Years Ended December 31,
|
|||||||||||||||||||||
|
|
2018
|
2017
|
2016
|
||||||||||||||||||
|
(Dollars in thousands)
|
Balance
|
Rate
|
Balance
|
Rate
|
Balance
|
Rate
|
|||||||||||||||
|
Average Assets
|
|
|
|
|
|
|
|||||||||||||||
|
Private Education Loans
|
$
|
19,282,500
|
|
9.10
|
%
|
$
|
16,176,351
|
|
8.43
|
%
|
$
|
12,747,756
|
|
8.02
|
%
|
||||||
|
FFELP Loans
|
888,301
|
|
4.57
|
|
970,738
|
|
3.91
|
|
1,063,325
|
|
3.53
|
|
|||||||||
|
Personal Loans
|
900,152
|
|
11.08
|
|
112,644
|
|
9.90
|
|
710
|
|
8.53
|
|
|||||||||
|
Taxable securities
|
235,700
|
|
2.61
|
|
326,757
|
|
2.53
|
|
407,860
|
|
2.24
|
|
|||||||||
|
Cash and other short-term investments
|
1,844,404
|
|
1.88
|
|
1,454,557
|
|
1.07
|
|
1,480,574
|
|
0.52
|
|
|||||||||
|
Total interest-earning assets
|
23,151,057
|
|
8.36
|
%
|
19,041,047
|
|
7.55
|
%
|
15,700,225
|
|
6.86
|
%
|
|||||||||
|
|
|||||||||||||||||||||
|
Non-interest-earning assets
|
1,157,628
|
|
1,104,598
|
|
772,167
|
|
|||||||||||||||
|
|
|||||||||||||||||||||
|
Total assets
|
$
|
24,308,685
|
|
$
|
20,145,645
|
|
$
|
16,472,392
|
|
||||||||||||
|
|
|
|
|
|
|
|
|||||||||||||||
|
Average Liabilities and Equity
|
|
|
|
|
|
|
|||||||||||||||
|
Brokered deposits
|
$
|
9,028,589
|
|
2.43
|
%
|
$
|
7,224,869
|
|
1.75
|
%
|
$
|
7,154,218
|
|
1.31
|
%
|
||||||
|
Retail and other deposits
|
8,142,449
|
|
2.08
|
|
6,939,520
|
|
1.40
|
|
5,095,631
|
|
1.06
|
|
|||||||||
|
Other interest-bearing liabilities
(1)
|
3,948,001
|
|
3.37
|
|
2,932,681
|
|
2.88
|
|
1,476,740
|
|
2.58
|
|
|||||||||
|
Total interest-bearing liabilities
|
21,119,039
|
|
2.47
|
%
|
17,097,070
|
|
1.80
|
%
|
13,726,589
|
|
1.35
|
%
|
|||||||||
|
|
|||||||||||||||||||||
|
Non-interest-bearing liabilities
|
461,327
|
|
647,294
|
|
539,215
|
|
|||||||||||||||
|
Equity
|
2,728,319
|
|
2,401,281
|
|
2,206,588
|
|
|||||||||||||||
|
Total liabilities and equity
|
$
|
24,308,685
|
|
$
|
20,145,645
|
|
$
|
16,472,392
|
|
||||||||||||
|
|
|||||||||||||||||||||
|
Net interest margin
|
6.10
|
%
|
5.93
|
%
|
5.68
|
%
|
|||||||||||||||
_________________
|
(1)
|
Includes the average balance of our unsecured borrowing, as well as secured borrowings and amortization expense of transaction costs related to our term asset-backed securitizations and our Secured Borrowing Facility.
|
58
Rate/Volume Analysis - GAAP
The following rate/volume analysis shows the relative contribution of changes in interest rates and asset volumes.
|
(Dollars in thousands)
|
Increase
(Decrease)
|
Change Due To
(1)
|
||||||||||
|
Rate
|
Volume
|
|||||||||||
|
2018 vs. 2017
|
|
|
|
|||||||||
|
Interest income
|
$
|
498,049
|
|
$
|
165,548
|
|
$
|
332,501
|
|
|||
|
Interest expense
|
214,206
|
|
131,283
|
|
82,923
|
|
||||||
|
Net interest income
|
$
|
283,843
|
|
$
|
33,831
|
|
$
|
250,012
|
|
|||
|
|
|
|
|
|||||||||
|
2017 vs. 2016
|
|
|
|
|||||||||
|
Interest income
|
$
|
360,057
|
|
$
|
115,223
|
|
$
|
244,834
|
|
|||
|
Interest expense
|
122,174
|
|
70,094
|
|
52,080
|
|
||||||
|
Net interest income
|
$
|
237,883
|
|
$
|
41,223
|
|
$
|
196,660
|
|
|||
_____________
|
(1)
|
Changes in income and expense due to both rate and volume have been allocated in proportion to the relationship of the absolute dollar amounts of the change in each. The changes in income and expense are calculated independently for each line in the table. The totals for the rate and volume columns are not the sum of the individual lines.
|
Summary of Our Loan Portfolio
Ending Loan Balances, net
|
December 31, 2018
|
||||||||||||||||
|
(Dollars in thousands)
|
Private
Education
Loans
|
FFELP
Loans
|
Personal
Loans
|
Total
Portfolio
|
||||||||||||
|
Total loan portfolio:
|
|
|
|
|||||||||||||
|
In-school
(1)
|
$
|
4,037,125
|
|
$
|
163
|
|
$
|
—
|
|
$
|
4,037,288
|
|
||||
|
Grace, repayment and other
(2)
|
16,467,340
|
|
846,324
|
|
1,190,091
|
|
18,503,755
|
|
||||||||
|
Total, gross
|
20,504,465
|
|
846,487
|
|
1,190,091
|
|
22,541,043
|
|
||||||||
|
Deferred origination costs and unamortized premium/(discount)
|
68,321
|
|
2,379
|
|
297
|
|
70,997
|
|
||||||||
|
Allowance for loan losses
|
(277,943
|
)
|
(977
|
)
|
(62,201
|
)
|
(341,121
|
)
|
||||||||
|
Total loan portfolio, net
|
$
|
20,294,843
|
|
$
|
847,889
|
|
$
|
1,128,187
|
|
$
|
22,270,919
|
|
||||
|
|
|
|
|
|||||||||||||
|
% of total
|
91
|
%
|
4
|
%
|
5
|
%
|
100
|
%
|
||||||||
_________
|
(1)
|
Loans for customers still attending school and who are not yet required to make payments on the loans.
|
|
(2)
|
Includes loans in deferment or forbearance. Loans in repayment include loans on which borrowers are making interest only or fixed payments, as well as loans that have entered full principal and interest repayment status after any applicable grace period.
|
59
|
December 31, 2017
|
||||||||||||||||
|
(Dollars in thousands)
|
Private
Education
Loans
|
FFELP
Loans
|
Personal
Loans
|
Total
Portfolio
|
||||||||||||
|
Total loan portfolio:
|
||||||||||||||||
|
In-school
(1)
|
$
|
3,740,237
|
|
$
|
257
|
|
$
|
—
|
|
$
|
3,740,494
|
|
||||
|
Grace, repayment and other
(2)
|
13,691,930
|
|
927,403
|
|
400,280
|
|
15,019,613
|
|
||||||||
|
Total, gross
|
17,432,167
|
|
927,660
|
|
400,280
|
|
18,760,107
|
|
||||||||
|
Deferred origination costs and unamortized premium/(discount)
|
56,378
|
|
2,631
|
|
—
|
|
59,009
|
|
||||||||
|
Allowance for loan losses
|
(243,715
|
)
|
(1,132
|
)
|
(6,628
|
)
|
(251,475
|
)
|
||||||||
|
Total loan portfolio, net
|
$
|
17,244,830
|
|
$
|
929,159
|
|
$
|
393,652
|
|
$
|
18,567,641
|
|
||||
|
|
|
|
|
|||||||||||||
|
% of total
|
93
|
%
|
5
|
%
|
2
|
%
|
100
|
%
|
||||||||
_________
|
(1)
|
Loans for customers still attending school and who are not yet required to make payments on the loans.
|
|
(2)
|
Includes loans in deferment or forbearance. Loans in repayment include loans on which borrowers are making interest only or fixed payments, as well as loans that have entered full principal and interest repayment status after any applicable grace period.
|
|
December 31, 2016
|
||||||||||||||||
|
(Dollars in thousands)
|
Private
Education
Loans
|
FFELP
Loans
|
Personal
Loans
|
Total
Portfolio
|
||||||||||||
|
Total loan portfolio:
|
|
|
|
|||||||||||||
|
In-school
(1)
|
$
|
3,371,870
|
|
$
|
377
|
|
$
|
—
|
|
$
|
3,372,247
|
|
||||
|
Grace, repayment and other
(2)
|
10,879,805
|
|
1,010,531
|
|
12,893
|
|
11,903,229
|
|
||||||||
|
Total, gross
|
14,251,675
|
|
1,010,908
|
|
12,893
|
|
15,275,476
|
|
||||||||
|
Deferred origination costs and unamortized premium/(discount)
|
44,206
|
|
2,941
|
|
—
|
|
47,147
|
|
||||||||
|
Allowance for loan losses
|
(182,472
|
)
|
(2,171
|
)
|
(58
|
)
|
(184,701
|
)
|
||||||||
|
Total loan portfolio, net
|
$
|
14,113,409
|
|
$
|
1,011,678
|
|
$
|
12,835
|
|
$
|
15,137,922
|
|
||||
|
|
|
|
|
|||||||||||||
|
% of total
|
93
|
%
|
7
|
%
|
—
|
%
|
100
|
%
|
||||||||
_________
|
(1)
|
Loans for customers still attending school and who are not yet required to make payments on the loans.
|
|
(2)
|
Includes loans in deferment or forbearance. Loans in repayment include loans on which borrowers are making interest only or fixed payments, as well as loans that have entered full principal and interest repayment status after any applicable grace period.
|
60
|
December 31, 2015
|
December 31, 2014
|
|||||||||||||||||||||||
|
(Dollars in thousands)
|
Private
Education
Loans
|
FFELP
Loans
|
Total
Portfolio
|
Private
Education
Loans
|
FFELP
Loans
|
Total
Portfolio
|
||||||||||||||||||
|
Total loan portfolio:
|
|
|
|
|
|
|
||||||||||||||||||
|
In-school
(1)
|
$
|
2,823,035
|
|
$
|
582
|
|
$
|
2,823,617
|
|
$
|
2,548,721
|
|
$
|
1,185
|
|
$
|
2,549,906
|
|
||||||
|
Grace, repayment and other
(2)
|
7,773,402
|
|
1,115,081
|
|
8,888,483
|
|
5,762,655
|
|
1,263,622
|
|
7,026,277
|
|
||||||||||||
|
Total, gross
|
10,596,437
|
|
1,115,663
|
|
11,712,100
|
|
8,311,376
|
|
1,264,807
|
|
9,576,183
|
|
||||||||||||
|
Deferred origination costs and unamortized premium/(discount)
|
27,884
|
|
3,114
|
|
30,998
|
|
13,845
|
|
3,600
|
|
17,445
|
|
||||||||||||
|
Allowance for loan losses
|
(108,816
|
)
|
(3,691
|
)
|
(112,507
|
)
|
(78,574
|
)
|
(5,268
|
)
|
(83,842
|
)
|
||||||||||||
|
Total loan portfolio, net
|
$
|
10,515,505
|
|
$
|
1,115,086
|
|
$
|
11,630,591
|
|
$
|
8,246,647
|
|
$
|
1,263,139
|
|
$
|
9,509,786
|
|
||||||
|
|
|
|
|
|
||||||||||||||||||||
|
% of total
|
90
|
%
|
10
|
%
|
100
|
%
|
87
|
%
|
13
|
%
|
100
|
%
|
||||||||||||
_________
|
(1)
|
Loans for customers still attending school and who are not yet required to make payments on the loans.
|
|
(2)
|
Includes loans in deferment or forbearance. Loans in repayment include loans on which borrowers are making interest only or fixed payments, as well as loans that have entered full principal and interest repayment status after any applicable grace period.
|
Average Loan Balances (net of unamortized premium/discount)
|
Years Ended December 31,
|
|||||||||||||||||||||
|
(Dollars in thousands)
|
2018
|
2017
|
2016
|
||||||||||||||||||
|
Private Education Loans
|
$
|
19,282,500
|
|
92
|
%
|
$
|
16,176,351
|
|
94
|
%
|
$
|
12,747,756
|
|
92
|
%
|
||||||
|
FFELP Loans
|
888,301
|
|
4
|
|
970,738
|
|
6
|
|
1,063,325
|
|
8
|
|
|||||||||
|
Personal Loans
|
900,152
|
|
4
|
|
112,644
|
|
1
|
|
710
|
|
—
|
|
|||||||||
|
Total portfolio
|
$
|
21,070,953
|
|
100
|
%
|
$
|
17,259,733
|
|
100
|
%
|
$
|
13,811,791
|
|
100
|
%
|
||||||
61
Loan Activity
|
Year Ended December 31, 2018
|
||||||||||||||||
|
(Dollars in thousands)
|
Private
Education
Loans
|
FFELP
Loans
|
Personal Loans
|
Total
Portfolio
|
||||||||||||
|
Beginning balance
|
$
|
17,244,830
|
|
$
|
929,159
|
|
$
|
393,652
|
|
$
|
18,567,641
|
|
||||
|
Acquisitions and originations
|
|
|
|
|
|
|
|
|
||||||||
|
Fixed-rate
|
3,082,544
|
|
—
|
|
1,157,875
|
|
4,240,419
|
|
||||||||
|
Variable-rate
|
2,252,948
|
|
—
|
|
—
|
|
2,252,948
|
|
||||||||
|
Total acquisitions and originations
|
5,335,492
|
|
—
|
|
1,157,875
|
|
6,493,367
|
|
||||||||
|
Capitalized interest and deferred origination cost premium amortization
|
597,997
|
|
31,093
|
|
(71
|
)
|
629,019
|
|
||||||||
|
Sales
|
(42,772
|
)
|
—
|
|
—
|
|
(42,772
|
)
|
||||||||
|
Loan consolidations to third-parties
|
(991,044
|
)
|
(30,076
|
)
|
—
|
|
(1,021,120
|
)
|
||||||||
|
Repayments and other
(1)
|
(1,849,660
|
)
|
(82,287
|
)
|
(423,269
|
)
|
(2,355,216
|
)
|
||||||||
|
Ending balance
|
$
|
20,294,843
|
|
$
|
847,889
|
|
$
|
1,128,187
|
|
$
|
22,270,919
|
|
||||
|
Year Ended December 31, 2017
|
||||||||||||||||
|
(Dollars in thousands)
|
Private
Education
Loans
|
FFELP
Loans
|
Personal Loans
|
Total
Portfolio
|
||||||||||||
|
Beginning balance
|
$
|
14,113,409
|
|
$
|
1,011,678
|
|
$
|
12,835
|
|
$
|
15,137,922
|
|
||||
|
Acquisitions and originations
|
|
|
|
|
|
|
|
|
||||||||
|
Fixed-rate
|
1,524,893
|
|
—
|
|
424,889
|
|
1,949,782
|
|
||||||||
|
Variable-rate
|
3,293,950
|
|
—
|
|
—
|
|
3,293,950
|
|
||||||||
|
Total acquisitions and originations
|
4,818,843
|
|
—
|
|
424,889
|
|
5,243,732
|
|
||||||||
|
Capitalized interest and deferred origination cost premium amortization
|
462,030
|
|
31,396
|
|
—
|
|
493,426
|
|
||||||||
|
Sales
|
(6,992
|
)
|
—
|
|
—
|
|
(6,992
|
)
|
||||||||
|
Loan consolidations to third-parties
|
(630,877
|
)
|
(36,856
|
)
|
—
|
|
(667,733
|
)
|
||||||||
|
Repayments and other
(1)
|
(1,511,583
|
)
|
(77,059
|
)
|
(44,072
|
)
|
(1,632,714
|
)
|
||||||||
|
Ending balance
|
$
|
17,244,830
|
|
$
|
929,159
|
|
$
|
393,652
|
|
$
|
18,567,641
|
|
||||
|
Year Ended December 31, 2016
|
||||||||||||||||
|
(Dollars in thousands)
|
Private
Education
Loans
|
FFELP
Loans
|
Personal Loans
|
Total
Portfolio
|
||||||||||||
|
Beginning balance
|
$
|
10,515,505
|
|
$
|
1,115,086
|
|
$
|
—
|
|
$
|
11,630,591
|
|
||||
|
Acquisitions and originations
|
|
|
|
|
|
|
||||||||||
|
Fixed-rate
|
771,814
|
|
—
|
|
12,926
|
|
784,740
|
|
||||||||
|
Variable-rate
|
3,913,808
|
|
—
|
|
—
|
|
3,913,808
|
|
||||||||
|
Total acquisitions and originations
|
4,685,622
|
|
—
|
|
12,926
|
|
4,698,548
|
|
||||||||
|
Capitalized interest and deferred origination cost premium amortization
|
339,163
|
|
35,774
|
|
—
|
|
374,937
|
|
||||||||
|
Sales
|
(9,521
|
)
|
—
|
|
—
|
|
(9,521
|
)
|
||||||||
|
Loan consolidations to third-parties
|
(277,636
|
)
|
(45,014
|
)
|
—
|
|
(322,650
|
)
|
||||||||
|
Repayments and other
(1)
|
(1,139,724
|
)
|
(94,168
|
)
|
(91
|
)
|
(1,233,983
|
)
|
||||||||
|
Ending balance
|
$
|
14,113,409
|
|
$
|
1,011,678
|
|
$
|
12,835
|
|
$
|
15,137,922
|
|
||||
_________
|
(1)
|
Includes the change in the Allowance for Loan Losses.
|
62
“Loan consolidations to third-parties” and “Repayments and other” are both significantly affected by the volume of loans in our portfolio in full principal and interest repayment status. Loans in full principal and interest repayment status in our Private Education Loan portfolio at December 31, 2018 increased by 27 percent compared with December 31, 2017, and total 44 percent of our Private Education Loan portfolio at December 31, 2018.
“Loan consolidations to third-parties” for the year ended December 31, 2018 total 11.0 percent of our Private Education Loan portfolio in full principal and interest repayment status at December 31, 2018, or 4.9 percent of our total Private Education Loan portfolio at December 31, 2018, compared with the year-ago period of 8.9 percent of our Private Education Loan portfolio in full principal and interest repayment status, or 3.7 percent of our total Private Education Loan portfolio, respectively. The increase in consolidations in 2018 was the result of an increase in the number of active competitors in this market and the increase in our loans in repayment. We expect consolidations to increase in 2019 as a result of market competition, including competition from Navient now that the non-compete covenant it entered into as part of the Spin-Off has expired. Historical experience has shown that loan consolidation activity is heightened in the period when the loan initially enters full principal and interest repayment status and then subsides over time.
The “Repayments and other” category includes all scheduled repayments, as well as voluntary prepayments, made on loans in repayment (including loans in full principal and interest repayment status) and also includes charge-offs. Consequently, this category can be significantly affected by the volume of loans in repayment. The increase in the volume of loans in repayment during 2018 accounts for the vast majority of the aggregate increase in loan consolidations, scheduled repayments, unscheduled prepayments and capitalized interest set forth above.
Private Education Loan Originations
The following table summarizes our Private Education Loan originations.
|
|
Years Ended December 31,
|
||||||||||||||||||||
|
(Dollars in thousands)
|
2018
|
%
|
2017
|
%
|
2016
|
%
|
|||||||||||||||
|
Smart Option - interest only
(1)
|
$
|
1,164,229
|
|
22
|
%
|
$
|
1,071,470
|
|
22
|
%
|
$
|
1,044,032
|
|
22
|
%
|
||||||
|
Smart Option - fixed pay
(1)
|
1,410,124
|
|
27
|
|
1,222,799
|
|
26
|
|
1,250,491
|
|
27
|
|
|||||||||
|
Smart Option - deferred
(1)
|
2,017,927
|
|
38
|
|
1,889,682
|
|
39
|
|
1,802,365
|
|
39
|
|
|||||||||
|
Smart Option - principal and interest
|
8,450
|
|
—
|
|
6,831
|
|
—
|
|
5,977
|
|
—
|
|
|||||||||
|
Graduate Loan
|
609,742
|
|
11
|
|
536,125
|
|
11
|
|
534,274
|
|
11
|
|
|||||||||
|
Parent Loan
|
104,771
|
|
2
|
|
73,253
|
|
2
|
|
29,124
|
|
1
|
|
|||||||||
|
Total Private Education Loan originations
|
$
|
5,315,243
|
|
100
|
%
|
$
|
4,800,160
|
|
100
|
%
|
$
|
4,666,263
|
|
100
|
%
|
||||||
|
Percentage of loans with a cosigner
|
87.2
|
%
|
88.0
|
%
|
89.1
|
%
|
|||||||||||||||
|
Average FICO at approval
(2)
|
746
|
|
747
|
|
748
|
|
|||||||||||||||
________
|
(1)
|
Interest only, fixed pay and deferred describe the payment option while in school or in grace period. See Item 1. “Business - Our Business - Private Education Loans” for further discussion.
|
|
(2)
|
Represents the higher credit score of the cosigner or the borrower.
|
63
Allowance for Loan Losses
Allowance for Loan Losses Activity
|
|
Years Ended December 31,
|
|||||||||||||||||||||||||||||||
|
|
2018
|
2017
|
||||||||||||||||||||||||||||||
|
(Dollars in thousands)
|
Private
Education
Loans
|
FFELP
Loans
|
Personal Loans
|
Total
Portfolio
|
Private
Education
Loans
|
FFELP
Loans
|
Personal Loans
|
Total
Portfolio
|
||||||||||||||||||||||||
|
Beginning balance
|
$
|
243,715
|
|
$
|
1,132
|
|
$
|
6,628
|
|
$
|
251,475
|
|
$
|
182,472
|
|
$
|
2,171
|
|
$
|
58
|
|
$
|
184,701
|
|
||||||||
|
Less:
|
|
|
|
|
|
|
||||||||||||||||||||||||||
|
Charge-offs
|
(154,701
|
)
|
(1,135
|
)
|
(19,690
|
)
|
(175,526
|
)
|
(130,063
|
)
|
(954
|
)
|
(579
|
)
|
(131,596
|
)
|
||||||||||||||||
|
Loan sales
(1)
|
(1,216
|
)
|
—
|
|
—
|
|
(1,216
|
)
|
(4,871
|
)
|
—
|
|
—
|
|
(4,871
|
)
|
||||||||||||||||
|
Plus:
|
|
|
|
|
|
|
||||||||||||||||||||||||||
|
Recoveries
|
20,858
|
|
—
|
|
946
|
|
21,804
|
|
17,635
|
|
—
|
|
11
|
|
17,646
|
|
||||||||||||||||
|
Provision for loan losses
|
169,287
|
|
980
|
|
74,317
|
|
244,584
|
|
178,542
|
|
(85
|
)
|
7,138
|
|
185,595
|
|
||||||||||||||||
|
Ending balance
|
$
|
277,943
|
|
$
|
977
|
|
$
|
62,201
|
|
$
|
341,121
|
|
$
|
243,715
|
|
$
|
1,132
|
|
$
|
6,628
|
|
$
|
251,475
|
|
||||||||
|
|
|
|
|
|
|
|
||||||||||||||||||||||||||
|
Troubled debt restructurings
(2)
|
$
|
1,257,856
|
|
$
|
—
|
|
$
|
—
|
|
$
|
1,257,856
|
|
$
|
990,351
|
|
$
|
—
|
|
$
|
—
|
|
$
|
990,351
|
|
||||||||
|
|
Years Ended December 31,
|
||||||||||||||||||||||||||||||||||||||||
|
|
2016
|
2015
|
2014
|
||||||||||||||||||||||||||||||||||||||
|
(Dollars in thousands)
|
Private
Education
Loans
|
FFELP
Loans
|
Personal Loans
|
Total
Portfolio
|
Private
Education
Loans
|
FFELP
Loans
|
Total
Portfolio
|
Private
Education Loans |
FFELP
Loans |
Total
Portfolio |
|||||||||||||||||||||||||||||||
|
Beginning balance
|
$
|
108,816
|
|
$
|
3,691
|
|
$
|
—
|
|
$
|
112,507
|
|
$
|
78,574
|
|
$
|
5,268
|
|
$
|
83,842
|
|
$
|
61,763
|
|
$
|
6,318
|
|
$
|
68,081
|
|
|||||||||||
|
Less:
|
|
|
|
|
|
|
|
|
|
||||||||||||||||||||||||||||||||
|
Charge-offs
|
(90,203
|
)
|
(1,348
|
)
|
—
|
|
(91,551
|
)
|
(55,357
|
)
|
(2,582
|
)
|
(57,939
|
)
|
(14,442
|
)
|
(2,996
|
)
|
(17,438
|
)
|
|||||||||||||||||||||
|
Loan sales
(1)
|
(6,034
|
)
|
—
|
|
—
|
|
(6,034
|
)
|
(7,565
|
)
|
—
|
|
(7,565
|
)
|
(53,485
|
)
|
—
|
|
(53,485
|
)
|
|||||||||||||||||||||
|
Plus:
|
|
|
|
|
|
|
|
|
|
||||||||||||||||||||||||||||||||
|
Recoveries
|
10,382
|
|
—
|
|
—
|
|
10,382
|
|
5,820
|
|
—
|
|
5,820
|
|
1,155
|
|
—
|
|
1,155
|
|
|||||||||||||||||||||
|
Provision for loan losses
|
159,511
|
|
(172
|
)
|
58
|
|
159,397
|
|
87,344
|
|
1,005
|
|
88,349
|
|
83,583
|
|
1,946
|
|
85,529
|
|
|||||||||||||||||||||
|
Ending balance
|
$
|
182,472
|
|
$
|
2,171
|
|
$
|
58
|
|
$
|
184,701
|
|
$
|
108,816
|
|
$
|
3,691
|
|
$
|
112,507
|
|
$
|
78,574
|
|
$
|
5,268
|
|
$
|
83,842
|
|
|||||||||||
|
|
|
|
|
|
|
|
|||||||||||||||||||||||||||||||||||
|
Troubled debt restructurings
(2)
|
$
|
612,606
|
|
$
|
—
|
|
$
|
—
|
|
$
|
612,606
|
|
$
|
265,831
|
|
$
|
—
|
|
$
|
265,831
|
|
$
|
60,278
|
|
$
|
—
|
|
$
|
60,278
|
|
|||||||||||
_________
|
(1)
|
Represents fair value adjustments on loans sold.
|
|
(2)
|
Represents the unpaid principal balance of loans classified as troubled debt restructurings.
|
64
Private Education Loan Allowance for Loan Losses
In establishing the allowance for Private Education Loan losses as of
December 31, 2018
, we considered several factors with respect to our Private Education Loan portfolio, in particular, credit quality and delinquency, forbearance and charge-off trends.
Private Education Loan provision for credit losses in 2018 decreased $9 million compared with the year-ago period. This decrease was primarily the result of increases in interest rates that have a favorable impact on the provision for TDR loans and improved credit performance in our Private Education Loan portfolio.
The allowance for losses on our variable-rate TDR portfolio is sensitive to changes in interest rates because we set the effective interest rate used to discount the future cash flows on these loans at the time they become TDRs. As interest rates rise, the future expected cash flows on variable-rate loans increase, which will in turn increase the net present values of the loans and lower the allowance. The converse is true when interest rates decline.
In the fourth quarter of 2017, we changed our policy for identifying TDRs to include an evaluation of the refreshed FICO scores for borrowers and cosigners receiving forbearance before determining if their loans will become TDRs. This change in policy will have the effect of slowing the growth rate of our TDR portfolio, while also increasing our loss rate for the TDR portfolio. This new policy was applied prospectively beginning in the fourth quarter of 2017 and was not applied to our historic TDR balances.
Changes in our allowance for loan losses are driven in large measure by the amount and age of our loans in full principal and interest repayment. As a larger proportion of our portfolio enters full principal and interest repayment in the coming years, we would expect the amount of TDRs, as well as our allowance for loan losses and charge-offs, to increase.
In 2016, we changed our methodology for determining loans in full principal and interest repayment status, and that metric now includes only loans for which scheduled full principal and interest payments were due at the end of each applicable reporting period. Private Education Loans in full principal and interest repayment status were 44 percent of our total Private Education Loan portfolio at
December 31, 2018
, compared with 41 percent at December 31, 2017 and 36 percent at December 31, 2016.
For a more detailed discussion of our policy for determining the identification of TDRs, the collectability of Private Education Loans and maintaining our allowance for Private Education Loan losses, see Item 7. “Management’s Discussion and Analysis of Financial Condition and Results of Operations — Critical Accounting Policies and Estimates — Allowance for Loan Losses.”
Our default aversion strategies are focused on the final stages of delinquency. A loss emergence period represents the expected period between the first occurrence of an event likely to cause a loss on a loan and the date the loan is expected to be charged off, taking into consideration account management practices that affect the timing of a loss, such as the usage of forbearance. The loss emergence period we have used since the Spin-Off is one year for our Private Education Loans.
65
The table below presents our Private Education Loan delinquency trends. Loans in repayment includes loans on which borrowers are making interest only and fixed payments, as well as loans that have entered full principal and interest repayment status after any applicable grace period.
|
|
December 31,
|
||||||||||||||||||||
|
|
2018
|
2017
|
2016
|
||||||||||||||||||
|
(Dollars in thousands)
|
Balance
|
%
|
Balance
|
%
|
Balance
|
%
|
|||||||||||||||
|
Loans in-school/grace/deferment
(1)
|
$
|
5,260,445
|
|
$
|
4,757,732
|
|
|
$
|
4,189,955
|
|
|||||||||||
|
Loans in forbearance
(2)
|
577,164
|
|
468,402
|
|
|
351,962
|
|
||||||||||||||
|
Loans in repayment and percentage of each status:
|
|
|
|||||||||||||||||||
|
Loans current
|
14,289,705
|
|
97.4
|
%
|
11,911,128
|
|
97.6
|
%
|
9,509,394
|
|
97.9
|
%
|
|||||||||
|
Loans delinquent 31-60 days
(3)
|
231,216
|
|
1.6
|
|
179,002
|
|
1.5
|
|
124,773
|
|
1.3
|
|
|||||||||
|
Loans delinquent 61-90 days
(3)
|
95,105
|
|
0.7
|
|
78,292
|
|
0.6
|
|
51,423
|
|
0.5
|
|
|||||||||
|
Loans delinquent greater than 90 days
(3)
|
50,830
|
|
0.3
|
|
37,611
|
|
0.3
|
|
24,168
|
|
0.3
|
|
|||||||||
|
Total Private Education Loans in repayment
|
14,666,856
|
|
100.0
|
%
|
12,206,033
|
|
100.0
|
%
|
9,709,758
|
|
100.0
|
%
|
|||||||||
|
Total Private Education Loans, gross
|
20,504,465
|
|
17,432,167
|
|
|
14,251,675
|
|
|
|||||||||||||
|
Private Education Loans deferred origination costs and unamortized premium/(discount)
|
68,321
|
|
56,378
|
|
|
44,206
|
|
|
|||||||||||||
|
Total Private Education Loans
|
20,572,786
|
|
17,488,545
|
|
|
14,295,881
|
|
|
|||||||||||||
|
Private Education Loans allowance for losses
|
(277,943
|
)
|
(243,715
|
)
|
|
(182,472
|
)
|
|
|||||||||||||
|
Private Education Loans, net
|
$
|
20,294,843
|
|
$
|
17,244,830
|
|
|
$
|
14,113,409
|
|
|
||||||||||
|
|
|
|
|
|
|||||||||||||||||
|
Percentage of Private Education Loans in repayment
|
71.5
|
%
|
|
70.0
|
%
|
68.1
|
%
|
||||||||||||||
|
|
|
|
|||||||||||||||||||
|
Delinquencies as a percentage of Private Education Loans in repayment
|
|
2.6
|
%
|
|
2.4
|
%
|
2.1
|
%
|
|||||||||||||
|
|
|
|
|
|
|
||||||||||||||||
|
Loans in forbearance as a percentage of Private Education Loans in repayment and forbearance
|
|
3.8
|
%
|
|
3.7
|
%
|
3.5
|
%
|
|||||||||||||
_________
|
(1)
|
Deferment includes customers who have returned to school or are engaged in other permitted educational activities and are not yet required to make payments on the loans (e.g., residency periods for medical students or a grace period for bar exam preparation).
|
|
(2)
|
Loans for customers who have requested extension of grace period generally during employment transition or who have temporarily ceased making full payments due to hardship or other factors, consistent with established loan program servicing policies and procedures.
|
|
(3)
|
The period of delinquency is based on the number of days scheduled payments are contractually past due.
|
66
The following table summarizes changes in the allowance for Private Education Loan losses.
|
|
Years Ended December 31,
|
|||||||||||||||||||
|
(Dollars in thousands)
|
2018
|
2017
|
2016
|
2015
|
2014
|
|||||||||||||||
|
Beginning balance
|
$
|
243,715
|
|
$
|
182,472
|
|
$
|
108,816
|
|
$
|
78,574
|
|
$
|
61,763
|
|
|||||
|
Total provision
|
169,287
|
|
178,542
|
|
159,511
|
|
87,344
|
|
83,583
|
|
||||||||||
|
Net charge-offs:
|
||||||||||||||||||||
|
Charge-offs
(1)
|
(154,701
|
)
|
(130,063
|
)
|
(90,203
|
)
|
(55,357
|
)
|
(14,442
|
)
|
||||||||||
|
Recoveries
|
20,858
|
|
17,635
|
|
10,382
|
|
5,820
|
|
1,155
|
|
||||||||||
|
Net charge-offs
|
(133,843
|
)
|
(112,428
|
)
|
(79,821
|
)
|
(49,537
|
)
|
(13,287
|
)
|
||||||||||
|
Loan sales
(2)
|
(1,216
|
)
|
(4,871
|
)
|
(6,034
|
)
|
(7,565
|
)
|
(53,485
|
)
|
||||||||||
|
Ending Balance
|
$
|
277,943
|
|
$
|
243,715
|
|
$
|
182,472
|
|
$
|
108,816
|
|
$
|
78,574
|
|
|||||
|
|
|
|
|
|
|
|
||||||||||||||
|
Allowance as a percentage of the ending total loan balance
|
1.36
|
%
|
1.40
|
%
|
1.28
|
%
|
1.03
|
%
|
0.95
|
%
|
||||||||||
|
Allowance as a percentage of the ending loans in repayment
(3)
|
1.90
|
%
|
2.00
|
%
|
1.88
|
%
|
1.57
|
%
|
1.53
|
%
|
||||||||||
|
Allowance coverage of net charge-offs
|
2.08
|
|
2.17
|
|
2.29
|
|
2.20
|
|
5.91
|
|
||||||||||
|
Net charge-offs as a percentage of average loans in repayment
(3)
|
1.01
|
%
|
1.03
|
%
|
0.96
|
%
|
0.82
|
%
|
0.30
|
%
|
||||||||||
|
Delinquencies as a percentage of ending loans in repayment
(3)
|
2.57
|
%
|
2.42
|
%
|
2.06
|
%
|
2.23
|
%
|
2.01
|
%
|
||||||||||
|
Loans in forbearance as a percentage of ending loans in repayment and forbearance
(3)
|
3.79
|
%
|
3.70
|
%
|
3.50
|
%
|
3.36
|
%
|
2.56
|
%
|
||||||||||
|
Ending total loans, gross
|
$
|
20,504,465
|
|
$
|
17,432,167
|
|
$
|
14,251,675
|
|
$
|
10,596,437
|
|
$
|
8,311,376
|
|
|||||
|
Average loans in repayment
(3)
|
$
|
13,303,801
|
|
$
|
10,881,058
|
|
$
|
8,283,036
|
|
$
|
6,031,741
|
|
$
|
4,495,709
|
|
|||||
|
Ending loans in repayment
(3)
|
$
|
14,666,856
|
|
$
|
12,206,033
|
|
$
|
9,709,758
|
|
$
|
6,927,266
|
|
$
|
5,149,215
|
|
|||||
_______
|
(1)
|
Prior to the Spin-Off, we sold all loans greater than 90 days delinquent to an entity that is now a subsidiary of Navient, prior to being charged off. Consequently, many of the pre-Spin-Off, historical credit indicators and period-over-period trends are not comparable and may not be indicative of future performance.
|
|
(2)
|
Represents fair value adjustments on loans sold.
|
|
(3)
|
Loans in repayment include loans on which borrowers are making interest only or fixed payments, as well as loans that have entered full principal and interest repayment status after any applicable grace period.
|
As part of concluding on the adequacy of the allowance for loan losses, we review key allowance and loan metrics. The most significant of these metrics considered are the allowance coverage of net charge-offs ratio; the allowance as a percentage of ending total loans and of ending loans in repayment; and delinquency and forbearance percentages. The allowance as a percentage of ending total loans and ending loans in repayment increased over the past three years primarily as a result of an increase in the balance of our TDRs, for which we hold a life-of-loan allowance.
67
Use of Forbearance as a Private Education Loan Collection Tool
We modify the terms of loans for certain borrowers when we believe such modifications will increase the collectability of the loan. These modifications generally take the form of a forbearance, a temporary interest rate reduction or an extended repayment plan. The majority of our loans that are considered TDRs involve a temporary forbearance of payments and do not change the contractual interest rate of the loan.
Forbearance involves granting the customer a temporary cessation of payments (or temporary acceptance of smaller than scheduled payments) for a specified period of time. Using forbearance extends the original term of the loan. Forbearance does not grant any reduction in the total repayment obligation (principal or interest). While a loan is in forbearance status, interest continues to accrue and is capitalized to principal when the loan re-enters repayment status. Our forbearance policies include limits on the number of forbearance months granted consecutively and the total number of forbearance months granted over the life of the loan. We grant forbearance in our servicing centers if a borrower who is current requests it for increments of three months at a time, for up to 12 months. Forbearance as a collection tool is used most effectively when applied based on a customer’s unique situation, including historical information and judgments. We leverage updated customer information and other decision support tools to best determine who will be granted forbearance based on our expectations as to a customer’s ability and willingness to repay their obligation. This strategy is aimed at mitigating the overall risk of the portfolio as well as encouraging cash resolution of delinquent loans. In some instances, we require good faith payments before granting forbearance. Exceptions to forbearance policies are permitted when such exceptions are judged to increase the likelihood of collection of the loan.
Forbearance may be granted to customers who are exiting their grace period to provide additional time to obtain employment and income to support their obligations, or to current customers who are faced with a hardship and request forbearance time to provide temporary payment relief. In these circumstances, a customer’s loan is placed into a forbearance status in limited monthly increments and is reflected in the forbearance status at month-end during this time. At the end of their granted forbearance period, the customer will enter repayment status as current and is expected to begin making scheduled monthly payments on a go-forward basis.
Forbearance may also be granted to customers who are delinquent in their payments. If specific requirements are met, the forbearance can cure the delinquency and the customer is returned to a current repayment status. In more limited instances, delinquent customers will also be granted additional forbearance time.
When we give a borrower facing financial difficulty an interest rate reduction, we temporarily reduce the rate to a lower rate (currently 2.0 percent) for a two-year period and, in the vast majority of cases, permanently extend the final maturity of the loan. The combination of these two loan term changes helps reduce the monthly payment due from the borrower and increases the likelihood the borrower will remain current during the interest rate modification period as well as when the loan returns to its original contractual interest rate. At December 31, 2018 and December 31, 2017, 6.4 percent and 4.9 percent, respectively, of our loans then currently in full principal and interest repayment status were subject to interest rate reductions made under our rate modification program.
The tables below show the composition and status of the Private Education Loan portfolio aged by number of months in active repayment status (months for which a scheduled monthly payment was due). Active repayment status includes loans on which borrowers are making interest only or fixed payments, as well as loans that have entered full principal and interest repayment status after any applicable grace period. Our experience shows that the percentage of loans in forbearance status decreases the longer the loans have been in active repayment status. At December 31, 2018, loans in forbearance status as a percentage of total Private Education Loans in repayment and forbearance were 2.7 percent for Private Education Loans that have been in active repayment status for fewer than 25 months. Approximately 72 percent of our Private Education Loans in forbearance status have been in active repayment status less than 25 months.
68
|
(Dollars in millions)
December 31, 2018
|
Private Education Loans Monthly Scheduled Payments Due
|
Not Yet in
Repayment
|
Total
|
|||||||||||||||||||||||||
|
0 to 12
|
13 to 24
|
25 to 36
|
37 to 48
|
More than 48
|
||||||||||||||||||||||||
|
Loans in-school/grace/deferment
|
$
|
—
|
|
$
|
—
|
|
$
|
—
|
|
$
|
—
|
|
$
|
—
|
|
$
|
5,260
|
|
$
|
5,260
|
|
|||||||
|
Loans in forbearance
|
338
|
|
75
|
|
66
|
|
52
|
|
46
|
|
—
|
|
577
|
|
||||||||||||||
|
Loans in repayment - current
|
4,477
|
|
3,333
|
|
2,615
|
|
1,897
|
|
1,968
|
|
—
|
|
14,290
|
|
||||||||||||||
|
Loans in repayment - delinquent 31-60 days
|
94
|
|
43
|
|
38
|
|
27
|
|
29
|
|
—
|
|
231
|
|
||||||||||||||
|
Loans in repayment - delinquent 61-90 days
|
39
|
|
19
|
|
15
|
|
10
|
|
12
|
|
—
|
|
95
|
|
||||||||||||||
|
Loans in repayment - delinquent greater than 90 days
|
21
|
|
11
|
|
8
|
|
5
|
|
6
|
|
—
|
|
51
|
|
||||||||||||||
|
Total
|
$
|
4,969
|
|
$
|
3,481
|
|
$
|
2,742
|
|
$
|
1,991
|
|
$
|
2,061
|
|
$
|
5,260
|
|
20,504
|
|
||||||||
|
Deferred origination costs and unamortized premium/(discount)
|
|
|
|
|
|
|
69
|
|
||||||||||||||||||||
|
Allowance for loan losses
|
|
|
|
|
|
|
(278
|
)
|
||||||||||||||||||||
|
Total Private Education Loans, net
|
|
|
|
|
|
|
$
|
20,295
|
|
|||||||||||||||||||
|
|
|
|
|
|
|
|
|
|||||||||||||||||||||
|
Loans in forbearance as a percentage of total Private Education Loans in repayment and forbearance
|
2.22
|
%
|
0.49
|
%
|
0.44
|
%
|
0.34
|
%
|
0.30
|
%
|
—
|
%
|
3.79
|
%
|
||||||||||||||
|
(Dollars in millions)
December 31, 2017
|
Private Education Loans Monthly Scheduled Payments Due
|
Not Yet in
Repayment
|
Total
|
|||||||||||||||||||||||||
|
0 to 12
|
13 to 24
|
25 to 36
|
37 to 48
|
More than 48
|
||||||||||||||||||||||||
|
Loans in-school/grace/deferment
|
$
|
—
|
|
$
|
—
|
|
$
|
—
|
|
$
|
—
|
|
$
|
—
|
|
$
|
4,758
|
|
$
|
4,758
|
|
|||||||
|
Loans in forbearance
|
272
|
|
74
|
|
58
|
|
36
|
|
28
|
|
—
|
|
468
|
|
||||||||||||||
|
Loans in repayment - current
|
3,855
|
|
3,095
|
|
2,326
|
|
1,436
|
|
1,199
|
|
—
|
|
11,911
|
|
||||||||||||||
|
Loans in repayment - delinquent 31-60 days
|
78
|
|
36
|
|
28
|
|
19
|
|
18
|
|
—
|
|
179
|
|
||||||||||||||
|
Loans in repayment - delinquent 61-90 days
|
35
|
|
16
|
|
12
|
|
7
|
|
8
|
|
—
|
|
78
|
|
||||||||||||||
|
Loans in repayment - delinquent greater than 90 days
|
17
|
|
8
|
|
5
|
|
4
|
|
4
|
|
—
|
|
38
|
|
||||||||||||||
|
Total
|
$
|
4,257
|
|
$
|
3,229
|
|
$
|
2,429
|
|
$
|
1,502
|
|
$
|
1,257
|
|
$
|
4,758
|
|
17,432
|
|
||||||||
|
Deferred origination costs and unamortized premium/(discount)
|
|
|
|
|
|
|
57
|
|
||||||||||||||||||||
|
Allowance for loan losses
|
|
|
|
|
|
|
(244
|
)
|
||||||||||||||||||||
|
Total Private Education Loans, net
|
|
|
|
|
|
|
$
|
17,245
|
|
|||||||||||||||||||
|
|
|
|
|
|
|
|
|
|||||||||||||||||||||
|
Loans in forbearance as a percentage of total Private Education Loans in repayment and forbearance
|
2.15
|
%
|
0.58
|
%
|
0.46
|
%
|
0.29
|
%
|
0.22
|
%
|
—
|
%
|
3.70
|
%
|
||||||||||||||
69
|
(Dollars in millions)
December 31, 2016
|
Private Education Loans Monthly Scheduled Payments Due
|
Not Yet in
Repayment
|
Total
|
|||||||||||||||||||||||||
|
0 to 12
|
13 to 24
|
25 to 36
|
37 to 48
|
More than 48
|
||||||||||||||||||||||||
|
Loans in-school/grace/deferment
|
$
|
—
|
|
$
|
—
|
|
$
|
—
|
|
$
|
—
|
|
$
|
—
|
|
$
|
4,190
|
|
$
|
4,190
|
|
|||||||
|
Loans in forbearance
|
211
|
|
56
|
|
42
|
|
25
|
|
18
|
|
—
|
|
352
|
|
||||||||||||||
|
Loans in repayment - current
|
3,437
|
|
2,739
|
|
1,766
|
|
876
|
|
692
|
|
—
|
|
9,510
|
|
||||||||||||||
|
Loans in repayment - delinquent 31-60 days
|
55
|
|
29
|
|
20
|
|
11
|
|
10
|
|
—
|
|
125
|
|
||||||||||||||
|
Loans in repayment - delinquent 61-90 days
|
23
|
|
12
|
|
8
|
|
4
|
|
4
|
|
—
|
|
51
|
|
||||||||||||||
|
Loans in repayment - delinquent greater than 90 days
|
11
|
|
5
|
|
4
|
|
2
|
|
2
|
|
—
|
|
24
|
|
||||||||||||||
|
Total
|
$
|
3,737
|
|
$
|
2,841
|
|
$
|
1,840
|
|
$
|
918
|
|
$
|
726
|
|
$
|
4,190
|
|
14,252
|
|
||||||||
|
Deferred origination costs and unamortized premium/(discount)
|
|
|
|
|
|
|
43
|
|
||||||||||||||||||||
|
Allowance for loan losses
|
|
|
|
|
|
|
(182
|
)
|
||||||||||||||||||||
|
Total Private Education Loans, net
|
|
|
|
|
|
|
$
|
14,113
|
|
|||||||||||||||||||
|
|
|
|
|
|
|
|
|
|||||||||||||||||||||
|
Loans in forbearance as a percentage of total Private Education Loans in repayment and forbearance
|
2.10
|
%
|
0.55
|
%
|
0.42
|
%
|
0.25
|
%
|
0.18
|
%
|
—
|
%
|
3.50
|
%
|
||||||||||||||
Private Education Loan Types
The following table provides information regarding the loans in repayment balance and total loan balance by Private Education Loan product type for the years ended December 31, 2018 and 2017.
|
December 31, 2018
|
||||||||||||||||||||
|
(Dollars in thousands
|
Signature and
Other
|
Parent Loan
|
Smart Option
|
Career
Training
|
Total
|
|||||||||||||||
|
$ in repayment
(1)
|
$
|
297,844
|
|
$
|
175,885
|
|
$
|
14,180,350
|
|
$
|
12,777
|
|
$
|
14,666,856
|
|
|||||
|
$ in total
|
$
|
512,259
|
|
$
|
177,750
|
|
$
|
19,801,184
|
|
$
|
13,272
|
|
$
|
20,504,465
|
|
|||||
|
December 31, 2017
|
||||||||||||||||||||
|
(Dollars in thousands
|
Signature and
Other
|
Parent Loan
|
Smart Option
|
Career
Training
|
Total
|
|||||||||||||||
|
$ in repayment
(1)
|
$
|
190,571
|
|
$
|
94,221
|
|
$
|
11,907,047
|
|
$
|
14,194
|
|
$
|
12,206,033
|
|
|||||
|
$ in total
|
$
|
352,456
|
|
$
|
95,293
|
|
$
|
16,969,941
|
|
$
|
14,477
|
|
$
|
17,432,167
|
|
|||||
_______
(1)
Loans in repayment include loans on which borrowers are making interest only or fixed payments, as well as loans that have entered full principal and interest repayment status after any applicable grace period.
70
Accrued Interest Receivable
The following table provides information regarding accrued interest receivable on our Private Education Loans. The table also discloses the amount of accrued interest on loans greater than 90 days past due as compared to our allowance for uncollectible interest. The allowance for uncollectible interest exceeds the amount of accrued interest on our 90 days past due portfolio for all periods presented.
|
Private Education Loans
|
||||||||||||
|
|
Accrued Interest Receivable
|
|||||||||||
|
(Dollars in thousands)
|
Total Interest Receivable
|
Greater Than
90 Days
Past Due
|
Allowance for
Uncollectible
Interest
|
|||||||||
|
December 31, 2018
|
$
|
1,168,823
|
|
$
|
1,920
|
|
$
|
6,322
|
|
|||
|
December 31, 2017
|
$
|
951,138
|
|
$
|
1,372
|
|
$
|
4,664
|
|
|||
|
December 31, 2016
|
$
|
739,847
|
|
$
|
845
|
|
$
|
2,898
|
|
|||
|
December 31, 2015
|
$
|
542,919
|
|
$
|
791
|
|
$
|
3,332
|
|
|||
|
December 31, 2014
|
$
|
445,710
|
|
$
|
443
|
|
$
|
3,517
|
|
|||
Personal Loan Delinquencies
The following table provides information regarding the loan status of our Personal Loans.
|
|
Personal Loans
|
|||||||||||||
|
December 31,
|
||||||||||||||
|
|
2018
|
2017
|
||||||||||||
|
(Dollars in thousands)
|
Balance
|
%
|
Balance
|
%
|
||||||||||
|
Loans in repayment and percentage of each status:
|
||||||||||||||
|
Loans current
|
$
|
1,172,776
|
|
98.5
|
%
|
$
|
398,988
|
|
99.7
|
%
|
||||
|
Loans delinquent 31-60 days
(1)
|
6,722
|
|
0.6
|
|
761
|
|
0.2
|
|
||||||
|
Loans delinquent 61-90 days
(1)
|
5,416
|
|
0.5
|
|
340
|
|
0.1
|
|
||||||
|
Loans delinquent greater than 90 days
(1)
|
5,177
|
|
0.4
|
|
191
|
|
—
|
|
||||||
|
Total Personal Loans in repayment
|
1,190,091
|
|
100.0
|
%
|
400,280
|
|
100.0
|
%
|
||||||
|
Total Personal Loans, gross
|
1,190,091
|
|
400,280
|
|
||||||||||
|
Personal Loans deferred origination costs and unamortized premium/(discount)
|
297
|
|
—
|
|
||||||||||
|
Total Personal Loans
|
1,190,388
|
|
400,280
|
|
||||||||||
|
Personal Loans allowance for losses
|
(62,201
|
)
|
(6,628
|
)
|
||||||||||
|
Personal Loans, net
|
$
|
1,128,187
|
|
$
|
393,652
|
|
||||||||
|
Delinquencies as a percentage of Personal Loans in repayment
|
1.5
|
%
|
0.3
|
%
|
||||||||||
_______
|
(1)
|
The period of delinquency is based on the number of days scheduled payments are contractually past due.
|
71
Liquidity and Capital Resources
Funding and Liquidity Risk Management
Our primary liquidity needs include our ongoing ability to fund our businesses throughout market cycles, including during periods of financial stress, our ongoing ability to fund originations of Private Education Loans and Personal Loans and servicing our Bank deposits. To achieve these objectives, we analyze and monitor our liquidity needs, maintain excess liquidity and access diverse funding sources, such as deposits at the Bank, issuance of secured debt primarily through asset-backed securitizations and other financing facilities. It is our policy to manage operations so liquidity needs are fully satisfied through normal operations to avoid unplanned asset sales under emergency conditions. Our liquidity management is governed by policies approved by our Board of Directors. Oversight of these policies is performed in the Asset and Liability Committee, a management-level committee.
These policies take into account the volatility of cash flow forecasts, expected maturities, anticipated loan demand and a variety of other factors to establish minimum liquidity guidelines.
Key risks associated with our liquidity relate to our ability to access the capital markets and the markets for bank deposits at reasonable rates. This ability may be affected by our performance, competitive pressures, the macroeconomic environment and the impact they have on the availability of funding sources in the marketplace.
Sources of Liquidity and Available Capacity
Ending Balances
|
December 31,
|
||||||||||||
|
(Dollars in thousands)
|
2018
|
2017
|
2016
|
|||||||||
|
Sources of primary liquidity:
|
|
|
||||||||||
|
Unrestricted cash and liquid investments:
|
|
|
||||||||||
|
Holding Company and other non-bank subsidiaries
|
$
|
25,990
|
|
$
|
17,723
|
|
$
|
18,133
|
|
|||
|
Sallie Mae Bank
(1)
|
2,533,116
|
|
1,516,616
|
|
1,900,660
|
|
||||||
|
Available-for-sale investments
|
176,245
|
|
244,088
|
|
208,603
|
|
||||||
|
Total unrestricted cash and liquid investments
|
$
|
2,735,351
|
|
$
|
1,778,427
|
|
$
|
2,127,396
|
|
|||
____
(1) This amount will be used primarily to originate Private Education Loans and Personal Loans at the Bank.
Average Balances
|
Years Ended December 31,
|
||||||||||||
|
(Dollars in thousands)
|
2018
|
2017
|
2016
|
|||||||||
|
Sources of primary liquidity:
|
|
|
||||||||||
|
Unrestricted cash and liquid investments:
|
|
|
||||||||||
|
Holding Company and other non-bank subsidiaries
|
$
|
22,570
|
|
$
|
24,892
|
|
$
|
19,426
|
|
|||
|
Sallie Mae Bank
(1)
|
1,677,922
|
|
1,317,147
|
|
1,422,335
|
|
||||||
|
Available-for-sale investments
|
201,937
|
|
227,322
|
|
204,905
|
|
||||||
|
Total unrestricted cash and liquid investments
|
$
|
1,902,429
|
|
$
|
1,569,361
|
|
$
|
1,646,666
|
|
|||
____
(1) This amount will be used primarily to originate Private Education Loans and Personal Loans at the Bank.
72
Deposits
The following table summarizes total deposits.
|
December 31,
|
||||||||
|
(Dollars in thousands)
|
2018
|
2017
|
||||||
|
Deposits - interest bearing
|
$
|
18,942,082
|
|
$
|
15,504,330
|
|
||
|
Deposits - non-interest bearing
|
1,076
|
|
1,053
|
|
||||
|
Total deposits
|
$
|
18,943,158
|
|
$
|
15,505,383
|
|
||
Our total deposits of
$18.9 billion
were comprised of
$10.3 billion
in brokered deposits and
$8.6 billion
in retail and other deposits at December 31,
2018
, compared with total deposits of
$15.5 billion
, which were comprised of
$8.2 billion
in brokered deposits and
$7.3 billion
in retail and other deposits, at December 31,
2017
.
Interest bearing deposits as of
December 31, 2018
and
2017
consisted of retail and brokered non-maturity savings deposits, retail and brokered non-maturity money market deposit accounts (“MMDAs”) and retail and brokered CDs. Interest bearing deposits include deposits from Educational 529 and Health Savings plans that diversify our funding sources and add deposits we consider to be core. These and other large omnibus accounts, aggregating the deposits of many individual depositors, represented $
5.9
billion of our deposit total as of December 31,
2018
, compared with $5.5 billion at December 31, 2017.
Some of our deposit products are serviced by third-party providers. Placement fees associated with the brokered CDs are amortized into interest expense using the effective interest rate method. We recognized placement fee expense of
$13
million,
$9
million, and
$10
million in the years ended
December 31, 2018
,
2017
and
2016
, respectively. Fees paid to third-party brokers related to brokered CDs were
$26
million,
$12
million, and
$4
million during the years ended
December 31, 2018
,
2017
and
2016
, respectively.
Interest bearing deposits at
December 31, 2018
and
2017
are summarized as follows:
|
|
December 31, 2018
|
December 31, 2017
|
|||||||||||||
|
(Dollars in thousands)
|
Amount
|
Year-End Weighted Average Stated Rate
(1)
|
Amount
|
Year-End Weighted Average Stated Rate
(1)
|
|||||||||||
|
Money market
|
$
|
8,687,766
|
|
2.46
|
%
|
$
|
7,731,966
|
|
1.80
|
%
|
|||||
|
Savings
|
702,342
|
|
2.00
|
|
738,243
|
|
1.10
|
|
|||||||
|
Certificates of deposit
|
9,551,974
|
|
2.74
|
|
7,034,121
|
|
1.93
|
|
|||||||
|
Deposits - interest bearing
|
$
|
18,942,082
|
|
$
|
15,504,330
|
|
|||||||||
__
(1)
Includes the effect of interest rate swaps in effective hedge relationships.
As of December 31,
2018
and
2017
, there were
$523
million and
$396
million, respectively, of deposits exceeding FDIC insurance limits. Accrued interest on deposits was
$53
million and
$28
million at December 31,
2018
and
2017
, respectively.
73
Counterparty Exposure
Counterparty exposure related to financial instruments arises from the risk that a lending, investment or derivative counterparty will not be able to meet its obligations to us.
Excess cash is generally invested with the FRB on an overnight basis or in the FRB’s Term Deposit Facility, minimizing counterparty exposure on cash balances.
Our investment portfolio is primarily comprised of a small portfolio of mortgage-backed securities issued by government agencies and government-sponsored enterprises that are purchased to meet CRA targets. Additionally, our investing activity is governed by Board-approved limits on the amount that is allowed to be invested with any one issuer based on the credit rating of the issuer, further minimizing our counterparty exposure. Counterparty credit risk is considered when valuing investments and considering impairment.
Related to derivative transactions, protection against counterparty risk is generally provided by International Swaps and Derivatives Association, Inc. Credit Support Annexes (“CSAs”), or clearinghouses for over-the-counter derivatives. CSAs require a counterparty to post collateral if a potential default would expose the other party to a loss. All derivative contracts entered into by the Bank are covered under CSAs or clearinghouse agreements and require collateral to be exchanged based on the net fair value of derivatives with each counterparty. Our exposure is limited to the value of the derivative contracts in a gain position, less any collateral held by us and plus collateral posted with the counterparty.
Title VII of the Dodd-Frank Act requires all standardized derivatives, including most interest rate swaps, to be submitted for clearing to central counterparties to reduce counterparty risk. Two of the central counterparties we use are the CME and the LCH. The CME and the LCH made amendments to their respective rules that resulted in the prospective accounting treatment of certain daily variation margin payments being considered as the legal settlement of the outstanding exposure of the derivative instead of the posting of collateral. The CME rule changes, which became effective in January 2017, and the LCH rule changes, which became effective in January 2018, result in all variation margin payments on derivatives cleared through the CME and LCH being accounted for as legal settlement. As of
December 31, 2018
, $5.4 billion notional of our derivative contracts were cleared on the CME and $0.6 billion were cleared on the LCH. The derivative contracts cleared through the CME and LCH represent 90.2 percent and 9.8 percent, respectively, of our total notional derivative contracts of $6.0 billion at
December 31, 2018
.
For derivatives cleared through the CME and LCH, the net gain (loss) position includes the variation margin amounts as settlement of the derivative and not collateral against the fair value of the derivative. The amount of variation margin included as settlement as of December 31, 2018 was $(16.7) million and $(6.1) million for the CME and LCH, respectively. Interest income (expense) related to variation margin on derivatives that are not designated as hedging instruments or are designated as fair value relationships is recognized as a gain (loss) rather than as interest income (expense). Changes in fair value for derivatives not designated as hedging instruments will be presented as realized gains (losses).
Our exposure is limited to the value of the derivative contracts in a gain position less any collateral held and plus any collateral posted. When there is a net negative exposure, we consider our exposure to the counterparty to be zero. At
December 31, 2018
and December 31, 2017, we had a net positive exposure (derivative gain positions to us, less collateral held by us and plus collateral posted with counterparties) related to derivatives of $27 million and $20 million, respectively.
We have liquidity exposure related to collateral movements between us and our derivative counterparties. Movements in the value of the derivatives, which are primarily affected by changes in interest rates, may require us to return cash collateral held or may require us to access primary liquidity to post collateral to counterparties.
As of
December 31, 2018
, LCH was not rated by any of the major rating agencies. However, all derivative counterparties are evaluated internally for credit worthiness. LCH has been deemed by management to have strong liquidity and robust capital levels as of our most recent credit review and has been assigned our strongest risk rating.
74
The table below highlights exposure related to our derivative counterparties as of
December 31, 2018
.
|
(Dollars in thousands)
|
SLM Corporation
and Sallie Mae Bank
Contracts
|
|||
|
Total exposure, net of collateral
|
$
|
27,209
|
|
|
|
Exposure to counterparties with credit ratings, net of collateral
|
$
|
19,881
|
|
|
|
Percent of exposure to counterparties with credit ratings below S&P AA- or Moody’s Aa3
|
—
|
%
|
||
|
Percent of exposure to counterparties with credit ratings below S&P A- or Moody’s A3
|
—
|
%
|
||
Regulatory Capital
The Bank is subject to various regulatory capital requirements administered by federal and state banking authorities. Failure to meet minimum capital requirements can initiate certain mandatory and possibly additional discretionary actions by regulators that, if undertaken, could have a direct material adverse effect on our business, results of operations and financial condition. Under U.S. Basel III and the regulatory framework for prompt corrective action, the Bank must meet specific capital standards that involve quantitative measures of its assets, liabilities and certain off-balance sheet items as calculated under regulatory accounting practices. The Bank’s capital amounts and its classification under the prompt corrective action framework are also subject to qualitative judgments by the regulators about components of capital, risk weightings and other factors.
“Well capitalized” regulatory requirements are the quantitative measures established by regulation to ensure capital adequacy. To qualify as “well capitalized,” the Bank must maintain minimum amounts and ratios (set forth in the table below) of Common Equity Tier 1, Tier 1 and Total capital to risk-weighted assets and of Tier 1 capital to average assets. The following capital amounts and ratios are based upon the Bank’s assets.
|
|
Actual
|
“Well Capitalized” Regulatory Requirements
|
|||||||||||
|
(Dollars in thousands)
|
Amount
|
Ratio
|
Amount
|
Ratio
|
|||||||||
|
As of December 31, 2018:
|
|||||||||||||
|
Common Equity Tier 1 Capital (to Risk-Weighted Assets)
|
$
|
2,896,091
|
|
12.1
|
%
|
$
|
1,558,174
|
|
>
|
6.5
|
%
|
||
|
Tier 1 Capital (to Risk-Weighted Assets)
|
$
|
2,896,091
|
|
12.1
|
%
|
$
|
1,917,752
|
|
>
|
8.0
|
%
|
||
|
Total Capital (to Risk-Weighted Assets)
|
$
|
3,196,279
|
|
13.3
|
%
|
$
|
2,397,190
|
|
>
|
10.0
|
%
|
||
|
Tier 1 Capital (to Average Assets)
|
$
|
2,896,091
|
|
11.1
|
%
|
$
|
1,299,032
|
|
>
|
5.0
|
%
|
||
|
As of December 31, 2017:
|
|||||||||||||
|
Common Equity Tier 1 Capital (to Risk-Weighted Assets)
|
$
|
2,350,081
|
|
11.9
|
%
|
$
|
1,288,435
|
|
>
|
6.5
|
%
|
||
|
Tier 1 Capital (to Risk-Weighted Assets)
|
$
|
2,350,081
|
|
11.9
|
%
|
$
|
1,585,767
|
|
>
|
8.0
|
%
|
||
|
Total Capital (to Risk-Weighted Assets)
|
$
|
2,597,926
|
|
13.1
|
%
|
$
|
1,982,208
|
|
>
|
10.0
|
%
|
||
|
Tier 1 Capital (to Average Assets)
|
$
|
2,350,081
|
|
11.0
|
%
|
$
|
1,067,739
|
|
>
|
5.0
|
%
|
||
75
Capital Management
The Bank seeks to remain “well capitalized” at all times with sufficient capital to support asset growth and operating needs, address unexpected credit risks and to protect the interests of depositors and the DIF administered by the FDIC. The Bank is required by its regulators, the UDFI and the FDIC, to comply with mandated capital ratios. We intend to maintain levels of capital at the Bank that significantly exceed the levels of capital necessary to be considered “well capitalized” by the FDIC. The Company is a source of strength for the Bank and will provide additional capital if necessary. The Board of Directors and management periodically evaluate the quality of assets, the stability of earnings, and the adequacy of the allowance for loan losses for the Bank. We believe that current and projected capital levels are appropriate for the remainder of 2019. As our balance sheet continues to grow in 2019, these ratios will be stable as we expect to generate earnings and capital sufficient to cover growth in our risk-weighted assets and remain significantly in excess of the capital levels required to be considered “well capitalized” by our regulators for 2019.
The Bank must comply with U.S. Basel III, which is aimed at increasing both the quantity and quality of regulatory capital. Certain aspects of U.S. Basel III, including new deductions from and adjustments to regulatory capital and a capital conservation buffer, were phased in over several years. The Bank’s Capital Policy requires management to monitor these capital standards and the Bank’s compliance with them. The Bank is subject to the following minimum regulatory capital ratios under U.S. Basel III: a Common Equity Tier 1 risk-based capital ratio of 4.5 percent, a Tier 1 risk-based capital ratio of 6.0 percent, a Total risk-based capital ratio of 8.0 percent, and a Tier 1 leverage ratio of 4.0 percent. In addition, the Bank is subject to a phased-in Common Equity Tier 1 capital conservation buffer: 1.875 percent for 2018; and the fully phased-in level of greater than 2.5 percent effective as of January 1, 2019. Failure to maintain the buffer will result in restrictions on the Bank’s ability to make capital distributions, including the payment of dividends, and to pay discretionary bonuses to executive officers. Including the buffer, as of January 1, 2019, the Bank is required to maintain the following minimum capital ratios: a Common Equity Tier 1 risk-based capital ratio of greater than 7.0 percent, a Tier 1 risk-based capital ratio of greater than 8.5 percent and a Total risk-based capital ratio of greater than 10.5 percent.
To qualify as “well capitalized” under the prompt corrective action framework for insured depository institutions, the Bank must maintain a Common Equity Tier 1 risk-based capital ratio of at least 6.5 percent, a Tier 1 risk-based capital ratio of at least 8.0 percent, a Total risk-based capital ratio of at least 10.0 percent, and a Tier 1 leverage ratio of at least 5.0 percent.
As of December 31,
2018
, the Bank had a Common Equity Tier 1 risk-based capital ratio and a Tier 1 risk-based capital ratio of
12.1
percent, a Total risk-based capital ratio of
13.3
percent and a Tier 1 leverage ratio of
11.1
percent, which are each well in excess of the current “well capitalized” standard for insured depository institutions. If calculated today based on the fully phased-in U.S. Basel III standards, our ratios would also exceed the capital levels required under U.S. Basel III and the “well capitalized” standard.
Dividends
The Bank is chartered under the laws of the State of Utah and its deposits are insured by the FDIC. The Bank’s ability to pay dividends is subject to the laws of Utah and the regulations of the FDIC. Generally, under Utah’s industrial bank laws and regulations as well as FDIC regulations, the Bank may pay dividends to the Company from its net profits without regulatory approval if, following the payment of the dividend, the Bank’s capital and surplus would not be impaired. The Bank paid no dividends on its common stock for the years ended December 31, 2018, 2017 and 2016.
See Part I, Item 1. “Business — Supervision and Regulation — Regulation of Sallie Mae Bank — Dividends,” regarding the expectation that the Bank will pay dividends to the Company as may be necessary to enable the Company to pay any declared dividends on its Series B Preferred Stock and common stock and to consummate any common share repurchases by the Company under the new share repurchase program. See also Part I, Item 1A. “Risk Factors — Risks Related to Our Securities” for possible limitations on the payments of our dividends.
76
Borrowings
Outstanding borrowings consist of unsecured debt and secured borrowings issued through our term ABS program and our Secured Borrowing Facility (which was previously called the asset-backed commercial paper facility or ABCP Facility). The issuing entities for those secured borrowings are variable interest entities and are consolidated for accounting purposes. The following table summarizes our secured borrowings at December 31,
2018
and
2017
. For additional information, see Notes to Consolidated Financial Statements, Note 9, “Borrowings.”
|
December 31, 2018
|
December 31, 2017
|
|||||||||||||||||||||||
|
(Dollars in thousands)
|
Short-Term
|
Long-Term
|
Total
|
Short-Term
|
Long-Term
|
Total
|
||||||||||||||||||
|
Unsecured borrowings:
|
||||||||||||||||||||||||
|
Unsecured debt (fixed)
|
$
|
—
|
|
$
|
197,348
|
|
$
|
197,348
|
|
$
|
—
|
|
$
|
196,539
|
|
$
|
196,539
|
|
||||||
|
Total unsecured borrowings
|
—
|
|
197,348
|
|
197,348
|
|
—
|
|
196,539
|
|
196,539
|
|
||||||||||||
|
Secured borrowings:
|
||||||||||||||||||||||||
|
Private Education Loan term securitizations:
|
||||||||||||||||||||||||
|
Fixed-rate
|
—
|
|
2,284,347
|
|
2,284,347
|
|
—
|
|
1,565,760
|
|
1,565,760
|
|
||||||||||||
|
Variable-rate
|
—
|
|
1,802,609
|
|
1,802,609
|
|
—
|
|
1,512,971
|
|
1,512,971
|
|
||||||||||||
|
Total Private Education Loan term securitizations
|
—
|
|
4,086,956
|
|
4,086,956
|
|
—
|
|
3,078,731
|
|
3,078,731
|
|
||||||||||||
|
Secured Borrowing Facility
|
—
|
|
—
|
|
—
|
|
—
|
|
—
|
|
—
|
|
||||||||||||
|
Total secured borrowings
|
—
|
|
4,086,956
|
|
4,086,956
|
|
—
|
|
3,078,731
|
|
3,078,731
|
|
||||||||||||
|
Total
|
$
|
—
|
|
$
|
4,284,304
|
|
$
|
4,284,304
|
|
$
|
—
|
|
$
|
3,275,270
|
|
$
|
3,275,270
|
|
||||||
Short-term borrowings
On February 21, 2018 and February 20, 2019, we amended and extended the maturity of our $
750 million
Secured Borrowing Facility. We hold
100 percent
of the residual interest in the Secured Borrowing Facility trust. Under the amended Secured Borrowing Facility, we incur financing costs of between
0.35 percent
and
0.45 percent
on unused borrowing capacity and a variable-yield rate plus
0.85 percent
on outstandings. The amended Secured Borrowing Facility extends the revolving period, during which we may borrow, repay and reborrow funds, until February 19, 2020. The scheduled amortization period, during which amounts outstanding under the Secured Borrowing Facility must be repaid, ends on February 19, 2021 (or earlier, if certain material adverse events occur). For additional information, see Notes to Consolidated Financial Statements, Note 23, “Subsequent Events.” At December 31,
2018
and December 31, 2017, there were
no
borrowings outstanding under the Secured Borrowing Facility.
Long-term borrowings
Unsecured Debt
On April 5, 2017, we issued an unsecured debt offering of
$200 million
of
5.125 percent
Senior Notes due April 5, 2022 at par. At December 31, 2018, the outstanding balance was
$197 million
.
Secured Financings
2018 Transactions
On March 21, 2018, we executed our
$670 million
SMB Private Education Loan Trust 2018-A term ABS transaction, which was accounted for as a secured financing. We sold
$670 million
of notes to third parties and retained a
100 percent
interest in the residual certificates issued in the securitization, raising approximately
$668 million
of gross proceeds. The Class A and Class B notes had a weighted average life of
4.43 years
and priced at a weighted average LIBOR equivalent cost of 1-
77
month LIBOR plus
0.78 percent
. At December 31, 2018,
$647 million
of our Private Education Loans were encumbered because of this transaction.
On June 20, 2018, we executed our
$687 million
SMB Private Education Loan Trust 2018-B term ABS transaction, which was accounted for as a secured financing. We sold
$687 million
of notes to third parties and retained a
100 percent
interest in the residual certificates issued in the securitization, raising approximately
$683 million
of gross proceeds. The Class A and Class B notes had a weighted average life of
4.40 years
and priced at a weighted average LIBOR equivalent cost of 1-month LIBOR plus
0.76 percent
. At December 31, 2018,
$678 million
of our Private Education Loans were encumbered because of this transaction.
On September 19, 2018, we executed our
$544 million
SMB Private Education Loan Trust 2018-C term ABS transaction, which was accounted for as a secured financing. We sold
$544 million
of notes to third parties and retained a
100 percent
interest in the residual certificates issued in the securitization, raising approximately
$541 million
of gross proceeds. The Class A and Class B notes had a weighted average life of
4.32 years
and priced at a weighted average LIBOR equivalent cost of 1-month LIBOR plus
0.77 percent
. At December 31, 2018,
$544 million
of our Private Education Loans were encumbered because of this transaction.
2017 Transactions
On February 8, 2017, we executed our
$772 million
SMB Private Education Loan Trust 2017-A term ABS transaction, which was accounted for as a secured financing. We sold $772 million of notes to third parties and retained a 100 percent interest in the residual certificates issued in the securitization, raising approximately $768 million of gross proceeds. The Class A and Class B notes had a weighted average life of 4.27 years and priced at a weighted average LIBOR equivalent cost of 1-month LIBOR plus 0.93 percent. At December 31, 2018,
$631 million
of our Private Education Loans were encumbered as a result of this transaction.
On November 8, 2017, we executed our $676 million SMB Private Education Loan Trust 2017-B term ABS transaction, which was accounted for as a secured financing. We sold $676 million of notes to third parties and retained a 100 percent interest in the residual certificates issued in the securitization, raising approximately $674 million of gross proceeds. The Class A and Class B notes had a weighted average life of 4.07 years and priced at a weighted average LIBOR equivalent cost of 1-month LIBOR plus 0.80 percent. At December 31, 2018,
$617 million
of our Private Education Loans were encumbered as a result of this transaction.
Pre-2017 Transactions
Prior to 2017, we executed a total of $2.4 billion in ABS transactions that were accounted for as secured financings. At December 31, 2018, $1.9 billion of our Private Education Loans were encumbered as a result of these transactions.
Other Borrowing Sources
We maintain discretionary uncommitted Federal Funds lines of credit with various correspondent banks, which totaled $
125
million at
December 31, 2018
. The interest rate we are charged on these lines of credit is priced at Fed Funds plus a spread at the time of borrowing, and is payable daily. We did not utilize these lines of credit in the years ended December 31, 2018 and 2017.
We established an account at the FRB to meet eligibility requirements for access to the Primary Credit borrowing facility at the FRB’s Discount Window (the “Window”). The Primary Credit borrowing facility is a lending program available to depository institutions that are in generally sound financial condition. All borrowings at the Window must be fully collateralized. We can pledge asset-backed and mortgage-backed securities, as well as FFELP Loans and Private Education Loans, to the FRB as collateral for borrowings at the Window. Generally, collateral value is assigned based on the estimated fair value of the pledged assets. At
December 31, 2018
and
December 31, 2017
, the value of our pledged collateral at the FRB was $
3.1
billion and $
2.6
billion, respectively. The interest rate charged to us is the discount rate set by the FRB. We did not utilize this facility in the years ended December 31, 2018 and 2017.
78
Contractual Loan Commitments
When we approve a Private Education Loan at the beginning of an academic year, that approval may cover the borrowing for the entire academic year. As such, we do not always disburse the full amount of the loan at the time of such approval, but instead have a commitment to fund a portion of the loan at a later date (usually at the start of the second semester or subsequent trimesters). At
December 31, 2018
, we had $
2
billion of outstanding contractual loan commitments which we expect to fund during the remainder of the 2018/2019 academic year. At
December 31, 2018
, we had a
$2 million
reserve recorded in “Other Liabilities” to cover expected losses that may occur during the one-year loss emergence period on these unfunded commitments.
Contractual Cash Obligations
The following table provides a summary of our contractual principal obligations associated with long-term Bank deposits, secured borrowings, unsecured debt, loan commitments and lease obligations at
December 31, 2018
.
|
1 Year
or Less
|
1 to 3
Years
|
3 to 5
Years
|
Over 5
Years
|
Total
|
||||||||||||||||
|
(Dollars in thousands)
|
||||||||||||||||||||
|
Long-term bank deposits
(1)(2)
|
$
|
6,409,315
|
|
$
|
5,360,584
|
|
$
|
2,361,289
|
|
$
|
172,627
|
|
$
|
14,303,815
|
|
|||||
|
Secured borrowings
(3)
|
545,769
|
|
1,408,749
|
|
1,338,754
|
|
814,821
|
|
4,108,093
|
|
||||||||||
|
Unsecured debt
|
—
|
|
200,000
|
|
—
|
|
—
|
|
200,000
|
|
||||||||||
|
Loan commitments
(1)
|
2,009,666
|
|
1,078
|
|
—
|
|
—
|
|
2,010,744
|
|
||||||||||
|
Lease obligations
|
5,680
|
|
9,234
|
|
8,239
|
|
16,507
|
|
39,660
|
|
||||||||||
|
Total contractual cash obligations
|
$
|
8,970,430
|
|
$
|
6,979,645
|
|
$
|
3,708,282
|
|
$
|
1,003,955
|
|
|
$
|
20,662,312
|
|
||||
____
(1)
Interest obligations are either variable or fixed in nature.
(2)
Excludes derivative market value adjustments of $41 million.
(3)
Amounts reflect the contractual requirements of the Private Education Loan term securitizations, based on the expected paydown of the underlying collateral.
79
Critical Accounting Policies and Estimates
Management’s Discussion and Analysis of Financial Condition and Results of Operations addresses our consolidated financial statements, which have been prepared in accordance with GAAP. Notes to Consolidated Financial Statements, Note 2, “Significant Accounting Policies” includes a summary of the significant accounting policies and methods used in the preparation of our consolidated financial statements. The preparation of these financial statements requires management to make estimates and assumptions that affect the reported amounts of assets and liabilities and the reported amounts of income and expenses during the reporting periods. Actual results may differ from these estimates under varying assumptions or conditions. On a quarterly basis, management evaluates its estimates, particularly those that include the most difficult, subjective or complex judgments and are often about matters that are inherently uncertain. The most significant judgments, estimates and assumptions relate to the following critical accounting policies that are discussed in more detail below.
Allowance for Loan Losses
In determining the allowance for loan losses on our Private Education Loan non-TDR portfolio, we estimate the principal amount of loans that will default over the next year (one year being the expected “loss emergence period,” which represents the expected period between the first occurrence of an event likely to cause a loss on a loan and the date the loan is expected to be charged off, taking into consideration account management practices that affect the timing of a loss, such as the usage of forbearance) and how much we expect to recover over the same one-year period related to the defaulted amount. The expected defaults less our expected recoveries adjusted for any qualitative factors (discussed below) equal the allowance related to this portfolio. Our historical experience indicates that, on average, the time between the date that a customer experiences a default causing event (i.e., the loss trigger event) and the date that we charge off the unrecoverable portion of that loan is one year.
In estimating both the non-TDR and TDR allowance amounts, we start with historical experience of customer delinquency and default behavior. We make judgments about which historical period to start with and then make further judgments about whether that historical experience is representative of future expectations and whether additional adjustments may be needed to those historical default rates. We also take certain other qualitative factors into consideration when calculating the allowance for loan losses. These qualitative factors include, but are not limited to, changes in the economic environment, changes in lending policies and procedures, including changes in underwriting standards and collection, charge-off and recovery practices not already included in the analysis, and the effect of other external factors such as legal and regulatory requirements on the level of estimated credit losses.
Our non-TDR allowance for loan losses is estimated using an analysis of delinquent and current accounts. Our model is used to estimate the likelihood that a loan receivable may progress through the various delinquency stages and ultimately charge off (“roll rate analysis”). Once a charge-off forecast is estimated, a recovery assumption is included.
Our default strategies are focused on loans that are 30 to 120 days delinquent.
The roll rate analysis model is based upon actual historical collection experience using the 120 day charge-off default aversion strategies. Once the quantitative calculation is performed, we review the adequacy of the allowance for loan losses and determine if qualitative adjustments need to be considered.
Separately, for our TDR portfolio, we estimate an allowance amount sufficient to cover life-of-loan expected losses through an impairment calculation based on the difference between the loan’s basis and the present value of expected future cash flows (which would include life-of-loan default and recovery assumptions) discounted at the loan’s original effective interest rate.
Our TDR portfolio is comprised mostly of loans with interest rate reductions and forbearance usage greater than three months. All of our loans are collectively assessed for impairment, except for loans classified as TDRs (where we conduct individual assessments of impairment). We modify the terms of loans for certain borrowers when we believe such modifications may increase the ability and willingness of a borrower to make payments and thus increase the ultimate overall amount collected on a loan. These modifications generally take the form of a forbearance, a temporary interest rate reduction or an extended repayment plan. When we give a borrower facing financial difficulty an interest rate reduction, we temporarily reduce the rate (currently to 2.0 percent) for a two-year period and, in the vast majority of cases, permanently extend the final maturity of the loan. The combination of these two loan term changes helps reduce the monthly payment due from the borrower and
80
increases the likelihood the borrower will remain current during the interest rate modification period as well as when the loan returns to its original contractual interest rate. Until the fourth quarter of 2017, we generally considered a loan that was in full principal and interest repayment status which had received more than three months of forbearance in a 24-month period to be a TDR; however, during the first nine months after a loan had entered full principal and interest repayment status, we did not count up to the first six months of forbearance received during that period against the three-month policy limit.
Beginning in the fourth quarter of 2017, we revised the policy described above for identifying when a loan should be classified as a TDR due to forbearance. Historically, all loans receiving forbearance under the thresholds described above were classified as TDRs. However, with the refinement, those loans with a FICO score above a certain threshold (based on the most recent quarterly FICO score refresh) that are granted a forbearance will not be classified as TDRs, while loans with a FICO score under the threshold (based on the most recent quarterly FICO score refresh) that are granted a forbearance will be classified as TDRs, once they reach our policy limit for forbearances described above (i.e., more than three months in a 24-month period, subject to the exceptions described for the first nine months after a loan enters full principal and interest repayment status). This change in our determination of when loans should be classified as TDRs did not affect any of our then existing loans classified as TDRs and it did not change any of the existing thresholds regarding length of forbearance for becoming a TDR. Instead, it is an additional filter in the TDR analysis that is applied after the loan has met the requisite number of months in forbearance. This change was adopted prospectively beginning in the fourth quarter of 2017 and had an immaterial effect on the allowance for loan losses and provision for loan losses in 2017.
A loan also becomes a TDR when it is modified to reduce the interest rate on the loan (regardless of when such modification occurs and/or whether such interest rate reduction is temporary). The majority of our loans that are considered TDRs involve a temporary forbearance of payments and do not change the contractual interest rate of the loan. Once a loan qualifies for TDR status, it remains a TDR for allowance purposes for the remainder of its life.
The separate allowance estimates for our TDR and non-TDR portfolios are combined into our total allowance for Private Education Loan losses. The evaluation of the allowance for loan losses is inherently subjective, as it requires material estimates and assumptions that may be susceptible to significant changes. If actual future performance in delinquency, charge-offs or recoveries is significantly different than estimated, this could materially affect our estimate of the allowance for loan losses and the related provision for credit losses on our income statement.
As part of concluding on the adequacy of the allowance for loan losses, we review key allowance and loan metrics. The most relevant of these metrics are the allowance coverage of charge-offs ratio; the allowance as a percentage of total loans and of ending loans in repayment; and delinquency and forbearance percentages.
We consider a loan to be delinquent 31 days after the last payment was contractually due. We use a model to estimate the amount of uncollectible accrued interest on Private Education Loans and reserve for that amount against current period interest income.
We maintain an allowance for Personal Loan losses at an amount sufficient to absorb probable losses incurred in this portfolio at the reporting date based on a projection of estimated probable credit losses incurred in the portfolio. In determining the allowance for loan losses on our Personal Loan portfolio that are not TDRs, we estimate the principal amount of the loans that will default over the next twelve months (twelve months being the expected period between a loss event and default) and how much we expect to recover over the same twelve-month period related to the defaulted amounts. The expected defaults less our expected recoveries adjusted for any qualitative factors equal the allowance related to this portfolio. At December 31, 2018, there were no Personal Loans classified as TDRs.
FFELP Loans are insured as to their principal and accrued interest in the event of default, subject to a risk-sharing level based on the date of loan disbursement. These insurance obligations are supported by contractual rights against the United States. For loans disbursed on or after July 1, 2006, we receive 97 percent reimbursement on all qualifying default claims. For loans disbursed after October 1, 1993, and before July 1, 2006, we receive 98 percent reimbursement. For loans disbursed prior to October 1, 1993, we receive 100 percent reimbursement.
The allowance for FFELP Loan losses uses historical experience of customer default, behavior and a two-year loss emergence period to estimate the credit losses incurred in the loan portfolio at the reporting date. We apply the default rate
81
projections, net of applicable risk sharing, to each category for the current period to perform our quantitative calculation. Once the quantitative calculation is performed, we review the adequacy of the allowance for loan losses and determine if qualitative adjustments need to be considered.
Derivative Accounting
The most significant judgments related to derivative accounting are: (1) concluding the derivative is an effective hedge and qualifies for hedge accounting and (2) determining the fair value of certain derivatives and hedged items. To qualify for hedge accounting, a derivative must be a highly effective hedge upon designation and on an ongoing basis. There are no “bright line” tests on what is considered a highly effective hedge. We use a historical regression analysis to prove ongoing and prospective hedge effectiveness. See the previous discussion in the section titled “Critical Accounting Policies and Estimates — Fair Value Measurement” for significant judgments related to the valuation of derivatives. Although some of our valuations are more judgmental than others, we compare the fair values of our derivatives that we calculate to those fair values provided by our counterparties on a monthly basis. We view this as a critical control which helps validate these judgments. Any significant differences with our counterparties are identified and resolved appropriately.
On August 28, 2017, the FASB issued ASU No. 2017-12, “Derivatives and Hedging: Targeted Improvements to Accounting for Hedging Activities,” which (a) improves the financial reporting of hedging relationships to better portray the economic results of an entity’s risk management activities in its financial statements and (b) makes certain targeted improvements to simplify the application of the hedge accounting guidance. The effective date for the standard is January 1, 2019, with early adoption permitted. We elected to early adopt the standard effective July 1, 2018. One of the key changes is that the new standard eliminates the separate measurement and reporting of hedge ineffectiveness. In accordance with the new standard, certain provisions were required to be applied on a modified retrospective basis, which requires a cumulative effect adjustment to accumulated other comprehensive income with a corresponding adjustment to retained earnings as of the beginning of the fiscal year of adoption, or January 1, 2018 in our case.
The accounting for derivative instruments requires that every derivative instrument, including certain derivative instruments embedded in other contracts, be recorded on the balance sheet as either an asset or liability measured at fair value. Our derivative instruments are classified and accounted for by us as fair value hedges, cash flow hedges, or trading hedges.
Fair Value Hedges
We generally use fair value hedges to offset the exposure to changes in fair value of a recognized fixed-rate liability. We enter into interest rate swaps to economically convert fixed-rate liabilities into variable-rate liabilities. For fair value hedges, we generally consider all components of the derivative’s gain and/or loss when assessing hedge effectiveness and generally hedge changes in fair values due to interest rates. Under the new standard, for fair value hedges, the entire change in the fair value of the hedging instrument included in the assessment of hedge effectiveness is recorded in the same line item in the consolidated statements of income that is used to present the earnings effect of the hedged component of the hedged item. The timing of recognition of the change in fair value of a hedging instrument included in the assessment of hedge effectiveness is the same as prior to the adoption of ASU No. 2017-12.
Cash Flow Hedges
We use cash flow hedges to hedge the exposure to variability in cash flows of floating-rate liabilities. This strategy is used primarily to minimize the exposure to volatility in cash flows from future changes in interest rates. In assessing hedge effectiveness, generally all components of each derivative’s gains or losses are included in the assessment. We hedge exposure to changes in cash flows due to changes in interest rates or total changes in cash flow. Under the new standard, for cash flow hedges, the entire change in the fair value of the hedging instrument included in the assessment of hedge effectiveness is recorded in other comprehensive income (loss). Those amounts are subsequently reclassified to earnings, in the same line item in the consolidated statements of income as impacted by the hedged item, when the hedged item affects earnings.
Amounts reported in accumulated other comprehensive income related to derivatives will be reclassified to interest expense as interest payments are made on our variable-rate deposits. During the next twelve months, we estimate that $5.5 million will be reclassified as an increase to interest expense.
82
Trading Activities
When derivative instruments do not qualify for hedge accounting treatment, they are accounted for at fair value with all changes in fair value recorded through earnings. All of our derivative instruments entered into with maturities of less than 3 years are economically hedging risk, but do not receive hedge accounting treatment. Trading derivatives also include any hedges that originally received hedge accounting treatment, but lost hedge accounting treatment due to failed effectiveness testing, as well as the activity of certain derivatives prior to those derivatives receiving hedge accounting treatment.
Cumulative effect of applying the new standard
As a result of the cumulative effect of applying the new hedging standard to our fair value hedges on July 1, 2018, we recorded a $2.0 million basis increase to our hedged deposit balances with a corresponding increase to retained earnings of approximately $0.8 million, net of taxes and a $3.0 million loss to “gains (losses) on derivatives and hedging activities, net” in our consolidated statements of income to adjust the life-to-date ineffectiveness. To reflect the adoption of the new hedging standard on our cash flow hedging relationships at July 1, 2018, we recorded a $0.2 million, net of taxes decrease to retained earnings and a corresponding $0.3 million increase to accumulated other comprehensive income.
The new standard also requires modifications to existing presentation and disclosure requirements. We did not apply adjustments to our prior period consolidated balance sheets or consolidated statements of income as a result of adopting the new hedging standard. However, certain disclosures within the notes to the financial statements set forth in this report, regarding the years ended December 31, 2017 and 2016, conform to the disclosure requirements of ASU No. 2017-12. For further details, refer to Note 10, “Derivative Financial Instruments,” in the Notes to Consolidated Financial Statements.
CME and LCH rule changes
The CME and the LCH made amendments to their respective rules that resulted in the prospective accounting treatment of certain daily variation margin payments being considered as the legal settlement of the outstanding exposure of the derivative instead of the posting of collateral. The CME rule changes, which became effective in January 2017, and the LCH rule changes, which became effective in January 2018, result in all variation margin payments on derivatives cleared through the CME and LCH being accounted for as legal settlement. As of December 31, 2018, $5.4 billion notional of our derivative contracts were cleared on the CME and $0.6 billion were cleared on the LCH. The derivative contracts cleared through the CME and LCH represent 90.2 percent and 9.8 percent, respectively, of our total notional derivative contracts of $6.0 billion at December 31, 2018.
For derivatives cleared through the CME and the LCH, the net gain (loss) position includes the variation margin amounts as settlement of the derivative and not collateral against the fair value of the derivative. The amount of variation margin included as settlement as of December 31, 2018 was $(16.7) million and $(6.1) million for the CME and LCH, respectively. Interest income (expense) related to variation margin on derivatives that are not designated as hedging instruments or are designated as fair value relationships is recognized as a gain (loss) rather than as interest income (expense). Changes in fair value for derivatives not designated as hedging instruments will be presented as realized gains (losses).
Transfers of Financial Assets and the Variable Interest Entity (“VIE”) Consolidation Model
We account for loan sales in accordance with the applicable accounting guidance. If a transfer of loans qualifies as a sale, we derecognize the loan and recognize a gain or loss as the difference between the carry basis of the loan sold and liabilities retained and the compensation received. We recognize the results of a transfer of loans based upon the settlement date of the transaction.
If we have a variable interest in a VIE and we determine that we are the primary beneficiary, then we will consolidate the VIE. We are considered the primary beneficiary if we have both: (1) the power to direct the activities of the VIE that most significantly impact the VIE’s economic performance and (2) the obligation to absorb losses or receive benefits of the entity that could potentially be significant to the VIE. There can be considerable judgment as it relates to determining the primary beneficiary of a VIE. There are no “bright line” tests. Rather, the assessment of who has the power to direct the activities of the VIE that most significantly affect the VIE’s economic performance and who has the obligation to absorb losses or receive benefits of the entity that could potentially be significant to the VIE can be very qualitative and judgmental in nature. We have
83
determined that as the sponsor and servicer of Sallie Mae securitization trusts, we meet the first primary beneficiary criterion because we have the power to direct the activities of the VIE that most significantly impact the VIE’s economic performance.
In the past four years, we have executed both secured financings and securitized loan sale transactions. Based upon our relationships with these securitizations, we believe the consolidation assessment is straightforward. We consolidated our secured financing transactions because either we did not meet the accounting criterion for sales treatment or we determined we were the primary beneficiary of the VIE because we retained (a) the residual interest in the securitization and, therefore, had the obligation to absorb losses or receive benefits of the entity that could potentially be significant to the VIE, as well as (b) the power to direct the activities of the VIE in our role as servicer. For those accounted for as securitized loan sales, we only retained servicing and, therefore, are not the primary beneficiary because we have no obligation to absorb losses or receive benefits of the entity that could potentially be significant to the VIE.
Risk Management
Our Approach
Risk is inherent in our business activities and the specialized lending industry we serve. The ability of management to anticipate, identify and remediate risk in a timely manner is critical to our continued success. Our enterprise risk management (“ERM”) framework is designed to identify, remediate, control and report these risks and escalate as appropriate to the Board of Directors or its designee.
Risk Oversight
Our Board of Directors oversees our overall strategic direction, including our risk management capability and effectiveness. The Board has oversight of key policies as well as the risk management framework developed and administered by the management team. We have a robust process to escalate to the Board meaningful departures from our risk appetite statements. The Board of Directors oversaw the continued development and maturation of the ERM program.
The Governance Framework
Our overall objective is to ensure all significant risks inherent in our business can be identified, remediated where appropriate, controlled and reported. To this end, we have adopted the “three lines of defense” approach to governance. Specifically, the business units form the “first line of defense” and are the “owners” of risks inherent in their business activities. As the risk owner, the first line of defense is accountable for the day-to-day execution of risk and control policy and procedures (including activities performed by third-party contractors). Our ERM and Compliance functions constitute the “second line of defense” and provide oversight of the execution by the first line of defense. Rather than focusing on execution, the second line of defense is accountable for the related policy and standards executed upon by the first line of defense. Finally, the Internal Audit function comprises the “third line of defense.” The Internal Audit function provides opinions to the Board of Directors on the effectiveness of the first and second lines of defense, as reflected in audit reports. The lines of defense distinction determines accountabilities; the ERM framework contains the processes and infrastructure necessary to deliver on those accountabilities.
Enterprise Risk Management Policy and Framework
The ERM policy and risk appetite framework are designed to establish a stable risk and control environment across the enterprise. The policy, which is approved by the Board of Directors, outlines the framework used to ensure that risk and control issues across the enterprise are identified, remediated, controlled and reported. The ERM policy, the risk appetite framework and the related policies and procedures constitute the core of the overall governance program. The framework is evolving to reflect the product diversification efforts being undertaken by the Bank.
The risk appetite statements are at the core of the overall framework. The risk appetite statements establish the level of risk we are willing to accept within each risk category, described below, in pursuit of our business objectives. Compliance with our risk appetite is monitored using a set of performance metrics, with thresholds and limits, for each risk type. The Enterprise Risk Committee (the “ERC”) provides oversight of the risk appetite framework with escalation to the Board of Directors, as appropriate. Our Board of Directors approves the risk appetite framework annually and requires that management provide ongoing updates on adherence to the framework.
84
Board of Directors Committee Structure
We have a robust committee structure that facilitates oversight, effective challenge and escalation of risk and control issues.
Risk Committee.
The Risk Committee was established to assist the Board of Directors in fulfilling its risk management oversight responsibilities. Annually, the Risk Committee recommends the ERM policy and the risk appetite framework to the Board of Directors for approval. The Risk Committee receives periodic updates on compliance with the framework from the Chief Risk Officer (the “CRO”). The Risk Committee is the governing body for our diversification efforts.
Audit Committee.
The Audit Committee is responsible for oversight of the Internal Audit function. Additionally, the Audit Committee oversees the quality and integrity of our financial reporting process and financial statements; the qualifications, hiring, performance and independence of our independent registered accounting firm; and our system of internal controls.
Nominations, Governance and Compensation Committee.
The Nominations, Governance and Compensation Committee, among other things: (1) periodically reviews management’s succession planning; (2) confirms our compensation practices properly balance risk and reward and do not promote excessive risk-taking; (3) implements good governance policies for us and our Board of Directors; (4) approves all compensation and benefits for our Chief Executive Officer, Executive Vice Presidents, and independent members of our Board of Directors; (5) approves our equity-based compensation plans and management’s administration of employee benefit plans; (6) reviews related party transactions; (7) conducts assessments of the performance of our Board of Directors and its committees; and (8) recommends nominees for election to our Board of Directors.
Preferred Stock Committee.
The Preferred Stock Committee monitors and evaluates proposed actions that may impact the rights of holders of our preferred stock.
Strategic Planning Committee.
The purpose of the Strategic Planning Committee is to engage the Chief Executive Officer and senior management in the strategic planning process, to exchange information and ideas in order to develop proposals regarding our long-term strategic agenda initiatives, and to report on such proposals to our Board of Directors.
Compliance Committee.
The purpose of the Compliance Committee of the Board of Directors of the Bank is to assist the Board of Directors in: (1) overseeing the continuing maintenance and enhancement of a strong and sustainable compliance culture; (2) providing oversight of the compliance management system; (3) approving sound policies and objectives and effectively supervising all compliance - related activities; (4) ensuring that the Bank has a qualified Chief Compliance Officer with sufficient authority, independence and resources to administer an effective compliance management system; (5) ensuring our compliance with the Code of Business Conduct; and (6) exercising and performing all other duties and responsibilities delegated to the Committee.
Management-Level Committee Structure
Enterprise Risk Committee
. The ERC is authorized by the Risk Committee of the Board of Directors to provide management oversight of compliance with the risk appetite framework. The ERC is the conduit from management to the Risk Committee of the Board and provides for escalation in the instances of non-compliance with the framework. Additionally, the ERC is authorized to create sub-committees to assist in the fulfillment of its oversight activities. During 2018, we operated the following sub-committees:
Credit Committee
. The Credit Committee is responsible for credit and counterparty risk, product pricing, and credit and collections operations.
Operational Risk Committee (“ORC”)
. The ORC is the oversight body for risk related to inadequate or failed internal processes, people and systems or from external events. It also reviews information technology risk, and regulatory and legal risks.
Asset and Liability Committee (“ALCO”).
ALCO is responsible for the strategy, processes and authorities with which the Bank’s interest rate risk, liquidity and capital adequacy are managed.
Model Risk Management Committee (“MRMC”).
The MRMC is responsible for the administration and execution of the model risk management program, including policies and procedures.
Each of these standing sub-committees is comprised of subject matter experts from the senior management team and is accountable to the ERC. Moreover, these sub-committees may be supported by steering or working groups, as appropriate.
85
Disclosure Committee.
Our Disclosure Committee assists our Chief Executive Officer and Chief Financial Officer in their review of periodic SEC reporting documents, earnings releases, investor materials and related disclosure policies and procedures.
Compliance Committee.
Our management-level Bank Compliance Committee is authorized by the Compliance Committee of the Board of Directors of the Bank to oversee regulatory compliance risk management activities for the Bank and its affiliates.
Internal Audit Risk Assessment
Internal Audit regularly monitors our various risk management and compliance efforts, identifies areas that may require increased focus and resources, and reports significant control issues and recommendations to executive management and the Audit Committee of the Board of Directors. Annually, Internal Audit performs an independent risk assessment to evaluate the risk of all significant components of the Company and uses the results to develop their annual Internal Audit plan. Additionally, Internal Audit performs selected reviews of both risk management and compliance functions, including key controls, processes and systems, in order to assess the effectiveness of the overall risk management framework.
Risk Categories
Our ERM framework is designed to address the following risk categories:
Credit Risk
. Credit risk is the risk to earnings or capital resulting from an obligor’s failure to meet the terms of any contract with us or other failure to perform as agreed. Credit risk is found in all activities where success depends on counterparty, issuer or borrower performance.
We have credit or counterparty risk exposure with borrowers and cosigners on loans we have made or purchased, the various counterparties with whom we have entered into derivative contracts, and the various issuers with whom we make investments. Credit and counterparty risks are overseen by the CRO, his staff and the Credit Committee. The CRO, as well as the Chief Credit Officer of the Bank, report regularly to the Board of Directors.
The credit risk related to Private Education Loans is managed within a credit risk infrastructure that includes: (i) a well-defined underwriting, asset quality and collection policy framework; (ii) an ongoing monitoring and review process of portfolio composition and trends; (iii) assignment and management of credit authorities and responsibilities; and (iv) establishment of an allowance for loan losses that covers estimated future losses based upon an analysis of portfolio metrics and economic factors.
Credit risk related to derivative contracts is managed by reviewing counterparties for credit strength on an ongoing basis and through our credit policies, which place limits on the amount of exposure we may take with any one counterparty and require collateral to secure the position. The credit and counterparty risk associated with derivatives is measured based on the replacement cost should the counterparty with contracts in a gain position to us fail to perform under the terms of the contract.
Operational Risk
. Operational risk is the risk to earnings resulting from inadequate or failed internal processes, people and systems and third-party vendors, or from external events. Operational risk is pervasive in that it exists in all business lines, functional units, legal entities and geographic locations, and it includes information technology risk, physical security risk on tangible assets, as well as regulatory, legal and governance risk.
Operational risk exposures are managed through a combination of first line of defense risk, and control activities and second line of defense oversight. The ORC is the management committee responsible for operational risk, and it supports the ERC in its oversight duties. The ORC is responsible for escalation to the ERC, as appropriate. Additionally, operational risk metrics, thresholds and limits are included in the periodic reporting to the Risk Committee of the Board.
Legal Risk.
Legal risk is the risk to earnings, capital or reputation manifested by claims made through the legal system and may arise from a product, a transaction, a business relationship, property (real, personal or intellectual), conduct of an employee or a change in law or regulation.
86
Primary ownership and responsibility for legal risk is placed with the first lines of defense, working with their legal colleagues, to identify and manage their specific legal risks. Compliance supports these activities by providing extensive training, monitoring and testing of the processes, policies and procedures utilized by the first lines of defense, maintaining relevant legal and regulatory requirements, and working in close coordination with our Legal group. The ORC has oversight of the establishment of standards related to our monitoring and control of legal risks, and the General Counsel reports regularly to the Risk Committee of the Board of Directors.
Our Code of Business Conduct and the on-going training our employees receive in many compliance areas provide a framework for our employees to conduct themselves with the highest integrity. We instill a risk-conscious culture through communications, training, policies and procedures. We have strengthened the linkage between the management performance process and individual compensation to encourage employees to work toward corporate-wide compliance goals.
Market Risk.
Market risk is the risk to earnings or capital resulting from changes in market conditions, such as interest rates, credit spreads or other volatilities. We are exposed to various types of market risk, in particular the risk of loss resulting from interest rate risk, basis risk and other risks that arise through the management of our investment, debt and loan portfolios. Market risk exposures are managed primarily through ALCO. These activities are closely tied to those related to the management of our funding and liquidity risks. The Risk Committee of our Board of Directors periodically reviews and approves the investment and asset and liability management policies and contingency funding plan developed and administered by ALCO. The Chief Financial Officer provides reports to the Risk Committee of the Board of Directors on market risk management.
Funding and Liquidity Risk
. Funding and liquidity risk is the risk to earnings, capital or the conduct of our business arising from the inability to meet our obligations when they become due without incurring unacceptable losses, such as the inability to fund liability maturities and deposit withdrawals, or invest in future asset growth and business operations at reasonable market rates, as well as the inability to fund Private Education Loan and Personal Loan originations. Our primary liquidity needs include our ongoing ability to: meet our funding needs through market cycles, including periods of financial stress; manage the relative maturities of assets and liabilities on our balance sheet; fund disbursements of Private Education Loans and Personal Loans; and service our indebtedness and bank deposits. Ultimately, our funding and liquidity risk relates to our ability to access the capital markets at reasonable rates and to maintain retail deposits and other funding sources through the Bank.
Our funding and liquidity risk activities are centralized within our Corporate Finance department, which is responsible for developing and executing our funding strategy. We analyze and monitor our liquidity risk, maintain excess liquidity and access diverse funding sources depending on current market conditions. Funding and liquidity risks are overseen and recommendations approved primarily through ALCO. The Risk Committee of our Board of Directors is responsible for periodically reviewing the funding and liquidity positions and contingency funding plan developed and administered by ALCO.
Reputational Risk
. Reputational risk is the risk to shareholder value and growth trajectory from a negative perception, whether true or not, of an organization by its key stakeholders, the changing expectations of its stakeholders and/or inadequate internal coordination of business decisions. This could expose us to litigation, financial loss or other damage to our business or brand.
Management proactively assesses and manages reputational risk. We have established our government relations function to manage our review of and response to all formal inquiries from members of Congress, state legislators, and their staff, as well as providing targeted messaging that reinforces our public policy goals. We review and consider reputational risk on matters as diverse as the launch of new products and services, our credit underwriting activities and how we fund operations. Our public relations, marketing and media teams continuously monitor print, electronic and social media to understand how we are perceived; proactively address customer complaints; and endeavor to enhance the value of our corporate brand. Metrics related to reputational risk are reported to and monitored by the ERC and the Risk Committee of the Board of Directors. Our Legal, Government Relations and Compliance groups regularly meet and collaborate with our Media and Investor Relations teams to provide more coordinated monitoring and management of our reputational risks.
Strategic Risk
. Strategic risk is the risk to shareholder value and growth trajectory from adverse business decisions and/or improper implementation of business strategies. Management must be able to develop and implement business strategies that
87
leverage the organization’s core competencies and are appropriately structured, resourced and executed. Oversight for this strategic planning process is provided by the Strategic Planning Committee of the Board of Directors. Our performance, relative to our annual business plan and our longer term strategic plan, is reviewed by management and the Strategic Planning Committee of the Board of Directors.
Common Stock
Our shareholders have authorized the issuance of 1.125 billion shares of common stock (par value of $0.20). At
December 31, 2018
,
436
million shares were issued and outstanding and
41
million shares were unissued but encumbered for outstanding stock options, restricted stock units, performance stock units and dividend equivalent units for employee compensation and remaining authority for stock-based compensation plans. See Notes to Consolidated Financial Statements, Note 11, “Stockholders’ Equity” for additional details.
Arrangements with Navient Corporation
In connection with the Spin-Off, we entered into a Separation and Distribution Agreement. We also entered into various other ancillary agreements with Navient to effect the Spin-Off and provide a framework for our relationship with Navient thereafter, such as a transition services agreement, a tax sharing agreement, an employee matters agreement, a loan servicing and administration agreement, a joint marketing agreement, a key services agreement, a data sharing agreement and a master sublease agreement. The majority of these agreements are transitional in nature with most having terms that have expired or will expire within the next
one
to
two years
.
We continue to have exposure to risks related to Navient’s creditworthiness. If we are unable to obtain indemnification payments from Navient, our results of operations and financial condition could be materially and adversely affected.
Pursuant to the terms of the Spin-Off and applicable law, Navient is responsible for all liabilities (whether accrued, contingent or otherwise and whether known or unknown) arising out of or resulting from the conduct of pre-Spin-Off SLM and its subsidiaries’ businesses prior to the Spin-Off, other than certain specifically identified liabilities relating to the conduct of our consumer banking business for which the Bank is responsible. Nonetheless, given the prior usage of the Sallie Mae and SLM names by entities now owned by Navient, we and our subsidiaries may from time to time be improperly named as defendants in legal proceedings where the allegations at issue are the legal responsibility of Navient. Most of these legal proceedings involve matters that arose in whole or in part in the ordinary course of business of pre-Spin-Off SLM. Likewise, as the period of time since the Spin-Off increases, so does the likelihood any allegations that may be made may be in part for our own actions in a post-Spin-Off time period and in part for Navient’s conduct in a pre-Spin-Off time period. We will not be providing information on these proceedings unless there are material issues of fact or disagreement with Navient as to the bases of the proceedings or responsibility therefor that we believe could have a material, adverse impact on our business, assets, financial condition, liquidity or outlook if not resolved in our favor.
We briefly summarize below some of the most significant agreements and relationships we continue to have with Navient. For additional information regarding the Separation and Distribution Agreement and the other ancillary agreements, see our Current Report on Form 8-K filed on May 2, 2014.
Separation and Distribution Agreement
The Separation and Distribution Agreement addresses, among other things, the following activities:
|
•
|
the obligation of each party to indemnify the other against liabilities retained or assumed by that party pursuant to the Separation and Distribution Agreement and in connection with claims of third-parties;
|
|
•
|
the allocation among the parties of rights and obligations under insurance policies; and
|
88
|
•
|
the creation of a governance structure, including a separation oversight committee of representatives from us and Navient, by which matters related to the separation and other transactions contemplated by the Separation and Distribution Agreement will be monitored and managed.
|
The Separation and Distribution Agreement provides specific processes and procedures pursuant to which we may submit claims for indemnification to Navient. If for any reason Navient is unable or unwilling to pay claims made against it, our costs, operating expenses, cash flows and financial condition could be materially and adversely affected over time.
Indemnification Obligations
Pursuant to the terms of the Separation and Distribution Agreement, and as contemplated by the structure of the Spin-Off, Navient is legally obligated to indemnify the Bank against all claims, actions, damages, losses or expenses that may arise from the conduct of all activities of pre-Spin-Off SLM occurring prior to the Spin-Off, except for certain liabilities specifically assumed by the Bank in the agreement as to which the Bank would be obligated to indemnify Navient. Some significant examples of the types of indemnification obligations Navient has under the Separation and Distribution Agreement and related ancillary agreements include:
|
•
|
Navient is required to indemnify the Company and the Bank for any liabilities, costs or expenses they may incur arising from any action or threatened action related to the servicing, operations and collections activities of pre-Spin-Off SLM and its subsidiaries with respect to Private Education Loans and FFELP Loans that were assets of the Bank or Navient at the time of the Spin-Off; provided that written notice was provided to Navient on or prior to April 30, 2017, the third anniversary date of the Spin-Off. Navient is not required to indemnify for changes in law or changes in prior existing interpretations of law that occur on or after April 30, 2014.
|
|
•
|
In connection with the Spin-Off, we recorded a liability related to uncertain tax positions of $27 million for which we are indemnified by Navient. As of December 31, 2018, the remaining balance of the indemnification receivable related to those uncertain tax positions was $24 million.
|
Long-Term Arrangements
The loan servicing and administration agreement governs the terms by which Navient provides servicing, administration and collection services for the Bank’s portfolio of FFELP Loans, as well as servicing history information with respect to Private Education Loans previously serviced by Navient and access to certain promissory notes in Navient’s possession. The term of the loan servicing and administration agreement has been extended to April 30, 2022.
The data sharing agreement states we will continue to have the right to obtain from Navient certain post-Spin-Off performance data relating to Private Education Loans owned or serviced by Navient to support and facilitate ongoing underwriting, originations, forecasting, performance and reserve analyses. Unless extended by the parties, the term of the data sharing agreement will expire on April 29, 2019.
The tax sharing agreement governs the respective rights, responsibilities and obligations of us and Navient after the Spin-Off relating to taxes, including with respect to the payment of taxes, the preparation and filing of tax returns and the conduct of tax contests. Under this agreement, each party is generally liable for taxes attributable to its business. The agreement also addresses the allocation of tax liabilities that are incurred as a result of the Spin-Off and related transactions. Additionally, the agreement restricts the parties from taking certain actions that could prevent the Spin-Off from qualifying for the anticipated tax treatment.
Amended Loan Participation and Purchase Agreement
Prior to the Spin-Off, the Bank sold substantially all of its Private Education Loans to several former affiliates, now subsidiaries of Navient (collectively, the “Purchasers”), pursuant to an Amended Loan Participation and Purchase Agreement. The agreement predates the Spin-Off but was significantly amended and reduced in scope in connection with the Spin-Off. Post-Spin-Off, the Bank retained only the right to require the Purchasers to purchase loans whose borrowers had a lending
89
relationship with both the Bank and Navient (“Split Loans”) (such purchases to be made at fair value) when the Split Loans either (1) are more than 90 days past due; (2) have been restructured; (3) have been granted a hardship forbearance or more than six months of administrative forbearance; or (4) have a borrower or cosigner who has filed for bankruptcy. In the second quarter of 2018, we sold our remaining $43 million portfolio of Split Loans (both current and non-current loans) to Navient and recognized a net gain of $2 million.
During the year ended December 31, 2017, the Bank sold loans to the Purchasers in the amount of $
12
million in principal and $
0.3
million in accrued interest income. During the year ended December 31, 2016, the Bank sold loans to the Purchasers in the amount of
$16
million in principal and
$0.3
million in accrued interest income. There was
no
gain or loss resulting from loans sold to the Purchasers in the years ended December 31, 2017 and 2016, respectively. Total write-downs to fair value for loans sold to the Purchasers with a fair value lower than par totaled $5 million and $6 million in the years ended December 31, 2017 and 2016, respectively. Navient is the servicer for all of these loans.
90
|
Item 7A.
|
Quantitative and Qualitative Disclosures about Market Risk
|
Interest Rate Sensitivity Analysis
Our interest rate risk management program seeks to manage and control interest rate risk, thereby reducing our exposure to fluctuations in interest rates and achieving consistent and acceptable levels of profit in any rate environment, and sustainable growth in net interest income over the long term. We evaluate and monitor interest rate risk through two primary methods:
•
Earnings at Risk (“EAR”), which measures the impact of hypothetical changes in interest rates on net interest income; and
•
Economic Value of Equity (“EVE”), which measures the sensitivity or change in the economic value of equity to changes in interest rates.
A number of potential interest rate scenarios are simulated using our asset liability management system. The Bank is the primary source of interest rate risk within the Company. At present, a significant portion of the Bank’s earning assets are priced off of 1-month LIBOR. Therefore, 1-month LIBOR is considered a core rate in our interest rate risk analysis. Other interest rate changes are correlated to changes in 1-month LIBOR for analytic purposes, with higher or lower correlations based on historical relationships. In addition, key rates are modeled with a floor, which indicates how low each specific rate is likely to move in practice. Rates are adjusted up or down via a set of scenarios that includes both rate shocks and ramps. Rate shocks represent an immediate and sustained change in 1-month LIBOR, with the resulting changes in other indices correlated accordingly. Interest rate ramps represent a linear increase in 1-month LIBOR over the course of 12 months, with the resulting changes in other indices correlated accordingly.
The following tables summarize the potential effect on earnings over the next 24 months and the potential effect on market values of balance sheet assets and liabilities at December 31, 2018 and 2017, based upon a sensitivity analysis performed by management assuming a hypothetical increase or decrease in market interest rates of 100 basis points and a hypothetical increase in market interest rates of 300 basis points while funding spreads remain constant. The EVE sensitivity is applied only to financial assets and liabilities, including hedging instruments, that existed at the balance sheet date, and does not take into account new assets, liabilities, commitments or hedging instruments that may arise in the future.
With increases in the level of interest rates, it became possible in the first quarter of 2017 to measure meaningfully the impact of a downward rate shock of 100 basis points. At today’s levels of interest rates, a 300 basis point downward rate shock does not provide a meaningful indication of interest rate sensitivity. These results indicate a market risk profile that has changed slightly from the prior year’s results, but that indicates a relatively low level of interest rate sensitivity.
|
December 31,
|
||||||||||||||||||
|
2018
|
2017
|
|||||||||||||||||
|
+300 Basis
Points |
+100 Basis
Points |
-100 Basis
Points |
+300 Basis
Points |
+100 Basis
Points |
-100 Basis
Points |
|||||||||||||
|
EAR - Shock
|
+6.8
|
%
|
+2.2
|
%
|
-2.2
|
%
|
+8.8
|
%
|
+2.9
|
%
|
-2.8
|
%
|
||||||
|
EAR - Ramp
|
+7.1
|
%
|
+2.1
|
%
|
-2.1
|
%
|
+6.9
|
%
|
+2.2
|
%
|
-1.8
|
%
|
||||||
|
EVE
|
+1.6
|
%
|
+0.5
|
%
|
-0.4
|
%
|
+2.8
|
%
|
+0.8
|
%
|
-0.8
|
%
|
||||||
The EVE results in the table above reflect a change in the calculation of both the 2018 and 2017 rate sensitivities. A modification of the discounting methodology resulted in a higher baseline EVE measurement, which results in lower sensitivities. The actual dollar changes in EVE in response to interest rate shocks has changed only slightly. Prior to the change in calculation, the EVE sensitivities at December 31, 2017 were +6.4 percent for “+300 basis points”, +2.0 percent for “+100 basis points” and -1.9 percent for “-100 basis points.”
91
A primary objective in our funding is to manage our sensitivity to changing interest rates by generally funding our assets with liabilities of similar interest rate repricing characteristics. This funding objective is frequently obtained through the use of derivatives. Uncertainty in loan repayment cash flows and the pricing behavior of our non-maturity retail deposits pose challenges in achieving our interest rate risk objectives. In addition to these considerations, we can have a mismatch in the index (including the frequency of reset) of floating rate debt versus floating rate assets.
As part of its suite of financial products, the Bank offers fixed-rate Private Education Loans. As with other Private Education Loans, the term to maturity is lengthy, and the customer has the option to repay the loan faster than the promissory note requires. Asset securitization and fixed-rate CDs provide intermediate to long-term fixed-rate funding for some of these assets. Additionally, a portion of the fixed-rate loans have been hedged with derivatives, which have been used to convert a portion of variable-rate funding to fixed-rate to match the anticipated cash flows of these loans. Any unhedged position arising from the fixed-rate loan portfolio is monitored and modeled to ensure that the interest rate risk does not cause the Company to exceed its policy limits for earnings at risk or for the value of equity at risk.
In the preceding tables, the interest rate sensitivity analysis reflects the heavy balance sheet mix of fully variable LIBOR-based loans, which exceeds the mix of fully variable funding, which includes brokered CDs that have been converted to LIBOR through derivative transactions. The analysis does not anticipate that retail MMDAs or retail savings balances, while relatively sensitive to interest rate changes, will reprice to the full extent of interest rate shocks or ramps. Also considered is (i) the impact of FFELP loans, which receive floor income in low interest rate environments, and will therefore not reprice fully with interest rate shocks and (ii) the impact of fixed-rate loans that have not been fully match-funded through derivative transactions and fixed-rate funding from CDs and asset securitization. An additional consideration is the implementation of a loan cap of 25 percent on variable-rate loans originated on and after September 25, 2016. As of December 31, 2018, there were $8.7 billion of loans with 25 percent interest rate caps on the balance sheet. The overall slightly asset-sensitive position will generally cause net interest income to increase somewhat when interest rates rise, and decrease somewhat when interest rates fall. However, this sensitivity position will fluctuate somewhat during the year, depending on the funding mix in place at the time of the analysis.
Although we believe that these measurements provide an estimate of our interest rate sensitivity, they do not account for potential changes in credit quality, balance sheet mix and size of our balance sheet. They also do not account for other business developments that could affect net income, or for management actions that could affect net income or could be taken to change our risk profile. Accordingly, we can give no assurance that actual results would not differ materially from the estimated outcomes of our simulations. Further, such simulations do not represent our current view of expected future interest rate movements.
92
Asset and Liability Funding Gap
The table below presents our assets and liabilities (funding) arranged by underlying indices as of
December 31, 2018
. In the following GAAP presentation, the funding gap only includes derivatives that qualify as effective hedges (those derivatives which are reflected in net interest income, as opposed to those reflected in the “(losses) gains on derivatives and hedging activities, net” line on the consolidated statements of income). The difference between the asset and the funding is the funding gap for the specified index. This represents our exposure to interest rate risk in the form of basis risk and repricing risk, which is the risk that the different indices may reset at different frequencies or may not move in the same direction or at the same magnitude. (Note that all fixed-rate assets and liabilities are aggregated into one line item, which does not capture the differences in time due to maturity.)
|
(Dollars in millions)
Index
|
Frequency of
Variable
Resets
|
Assets
|
Funding
(1)
|
Funding
Gap
|
||||||||||
|
Fed Funds Effective Rate
|
daily/weekly
|
$
|
—
|
|
$
|
275.0
|
|
$
|
(275.0
|
)
|
||||
|
3-month Treasury bill
|
weekly
|
123.4
|
|
—
|
|
123.4
|
|
|||||||
|
Prime
|
monthly
|
2.3
|
|
—
|
|
2.3
|
|
|||||||
|
3-month LIBOR
|
quarterly
|
—
|
|
399.2
|
|
(399.2
|
)
|
|||||||
|
1-month LIBOR
|
monthly
|
13,743.2
|
|
8,023.7
|
|
5,719.5
|
|
|||||||
|
1-month LIBOR
|
daily
|
723.1
|
|
—
|
|
723.1
|
|
|||||||
|
Non-Discrete reset
(2)
|
daily/weekly
|
2,681.9
|
|
3,547.7
|
|
(865.8
|
)
|
|||||||
|
Fixed-Rate
(3)
|
|
9,364.3
|
|
14,392.6
|
|
(5,028.3
|
)
|
|||||||
|
Total
|
|
$
|
26,638.2
|
|
$
|
26,638.2
|
|
$
|
—
|
|
||||
______________________
|
(1)
|
Funding (by index) includes all derivatives that qualify as effective hedges.
|
|
(2)
|
Assets include restricted and unrestricted cash equivalents and other overnight type instruments. Funding includes liquid retail deposits and the obligation to return cash collateral held related to derivatives exposures.
|
|
(3)
|
Assets include receivables and other assets (including premiums and reserves). Funding includes unswapped time deposits, liquid MMDAs swapped to fixed rates and stockholders’ equity.
|
The “Funding Gap” in the above table shows primarily mismatches in the 1-month LIBOR, fixed-rate and Non-Discrete reset categories. We expect the fixed-rate gap to drop significantly with the addition of fixed-rate private student loans in the first quarter of 2019, for which longer term fixed-rate funding has already been put in place. The Non-Discrete bucket is our liquid retail deposit portfolio, which we have significant flexibility to reprice at any time, and which fairly closely tracks other short-term interest rate indices, such as 1-month LIBOR, and partially offsets the 1-month LIBOR gap. Funding in the fixed-rate bucket includes $2.6 billion of equity and $0.4 billion of non-interest bearing liabilities. We consider our overall risk to be moderate, demonstrating some positive sensitivity to rising interest rates. This risk profile is consistent with other analyses of our interest rate sensitivity.
We use interest rate swaps and other derivatives to achieve our risk management objectives. Our asset liability management strategy is to match assets with debt (in combination with derivatives) that have the same underlying index and reset frequency or have interest rate characteristics that we believe are highly correlated. The use of funding with index types and reset frequencies that are different from our assets exposes us to interest rate risk in the form of basis and repricing risk. This could result in our cost of funds not moving in the same direction or with the same magnitude as the yield on our assets. While we believe this risk is low, as all of these indices are short-term with rate movements that are highly correlated over a long period of time, market disruptions (which have occurred in recent years) can lead to a temporary divergence between indices, resulting in a negative impact to our earnings.
93
Weighted Average Life
The following table reflects the weighted average lives of our earning assets and liabilities at
December 31, 2018
.
|
Weighted
|
|||
|
Average
|
|||
|
(Averages in Years)
|
Life
|
||
|
Earning assets
|
|
||
|
Education loans
|
5.37
|
|
|
|
Personal Loans
|
1.41
|
|
|
|
Cash and investments
|
0.48
|
|
|
|
Total earning assets
|
4.63
|
|
|
|
|
|
||
|
Deposits
|
|
||
|
Short-term deposits
|
0.53
|
|
|
|
Long-term deposits
|
2.85
|
|
|
|
Total deposits
|
1.14
|
|
|
|
Borrowings
|
|||
|
Short-term borrowings
|
—
|
|
|
|
Long-term borrowings
|
4.15
|
|
|
|
Total borrowings
|
4.15
|
|
|
94
Item 8. Financial Statements and Supplementary Data
Reference is made to the financial statements listed under the heading “(a) 1.A. Financial Statements” of Item 15 hereof, which financial statements are incorporated by reference in response to this Item 8.
Item 9. Changes in and Disagreements with Accountants on Accounting and Financial Disclosure
Nothing to report.
Item 9A. Controls and Procedures
Disclosure Controls and Procedures
Our management, with the participation of our principal executive officer and principal financial officer, evaluated the effectiveness of our disclosure controls and procedures (as defined in Rules 13a-15(e) and 15d-15(e) under the Securities Exchange Act of 1934, as amended (the “Exchange Act”)) as of
December 31, 2018
. Based on this evaluation, our principal executive officer and principal financial officer concluded that, as of
December 31, 2018
, our disclosure controls and procedures were effective to ensure that information required to be disclosed by us in the reports that we file or submit under the Exchange Act is (a) recorded, processed, summarized and reported within the time periods specified in the SEC’s rules and forms and (b) accumulated and communicated to our management, including our principal executive officer and principal financial officer as appropriate, to allow timely decisions regarding required disclosure.
Management’s Report on Internal Control over Financial Reporting
Our management is responsible for establishing and maintaining adequate internal control over financial reporting (as defined in Rule 13a-15(f) under the Exchange Act). Under the supervision and with the participation of our management, including our principal executive officer and principal financial officer, we assessed the effectiveness of our internal control over financial reporting as of
December 31, 2018
. In making this assessment, our management used the criteria established in Internal Control — Integrated Framework (2013) issued by the Committee of Sponsoring Organizations of the Treadway Commission. Based on our assessment and those criteria, management concluded that, as of
December 31, 2018
, our internal control over financial reporting is effective.
KPMG LLP, an independent registered public accounting firm, audited the effectiveness of the Company’s internal control over financial reporting as of
December 31, 2018
, as stated in their report listed under the heading “(a) 1.A. Financial Statements” of Item 15 hereof.
Because of its inherent limitations, internal control over financial reporting may not prevent or detect misstatements. Also, projections of any evaluation of effectiveness to future periods are subject to the risk that controls may become inadequate because of changes in conditions, or that the degree of compliance with the policies or procedures may deteriorate.
Changes in Internal Control over Financial Reporting
No change in our internal control over financial reporting (as defined in Rules 13a-15(f) and 15d-15(f) under the Exchange Act) occurred during the fiscal quarter ended
December 31, 2018
that has materially affected, or is reasonably likely to materially affect, our internal control over financial reporting.
Item 9B. Other Information
Nothing to report.
95
PART III.
Item 10. Directors, Executive Officers and Corporate Governance
The information contained in the 2019 Proxy Statement, including information appearing in the sections titled “Proposal 1 — Election of Directors,” “Executive Officers,” “Compensation Discussion and Analysis — Other Arrangements, Policies and Practices Related to Executive Compensation Programs — Section 16(a) Beneficial Ownership Reporting Compliance,” and “Corporate Governance” in the 2019 Proxy Statement, is incorporated herein by reference.
Item 11. Executive Compensation
The information contained in the 2019 Proxy Statement, including information appearing in the sections titled “Executive Compensation” and “Director Compensation” in the 2019 Proxy Statement, is incorporated herein by reference.
Item 12. Security Ownership of Certain Beneficial Owners and Management and Related Stockholder Matters
The information contained in the 2019 Proxy Statement, including information appearing in the sections titled “Equity Compensation Plan Information,” “Ownership of Common Stock by 5 Percent or More Holders” and “Ownership of Common Stock by Directors and Executive Officers” in the 2019 Proxy Statement, is incorporated herein by reference.
Item 13. Certain Relationships and Related Transactions, and Director Independence
The information contained in the 2019 Proxy Statement, including information appearing under “Corporate Governance — Related Party Transactions” and “Corporate Governance — Director Independence” in the 2019 Proxy Statement, is incorporated herein by reference.
Item 14. Principal Accounting Fees and Services
The information contained in the 2019 Proxy Statement, including information appearing under “Independent Registered Public Accounting Firm” in the 2019 Proxy Statement, is incorporated herein by reference.
96
PART IV.
Item 15. Exhibits, Financial Statement Schedules
(a) 1. Financial Statements
A. The following consolidated financial statements of SLM Corporation and the Report of the Independent Registered Public Accounting Firm thereon are included in Item 8 above:
2. Financial Statement Schedules
All schedules are omitted because they are not applicable or the required information is shown in the consolidated financial statements or notes thereto.
3. Exhibits
The exhibits listed in the accompanying index to exhibits are filed or incorporated by reference as part of this Annual Report on Form 10-K.
We will furnish at cost a copy of any exhibit filed with or incorporated by reference into this Annual Report on Form 10-K. Oral or written requests for copies of any exhibits should be directed to the Corporate Secretary.
97
(b) Exhibits
|
2.2
|
|
|
3.1
|
|
|
3.2
|
|
|
4.1
|
|
|
4.2
|
|
|
10.1†
|
|
|
10.2†
|
|
|
10.3†
|
|
|
10.4†
|
|
|
10.5†
|
|
|
10.6†
|
|
|
10.7†
|
|
|
10.8†
|
|
|
10.9†
|
|
|
10.10†
|
|
|
10.11†
|
|
|
10.12†
|
|
|
10.13†
|
|
|
10.14†
|
|
98
|
10.15†
|
|
|
10.16†
|
|
|
10.17†
|
|
|
10.18†
|
|
|
10.19†
|
|
|
10.20†
|
|
|
10.21†
|
|
|
10.22†
|
|
|
10.23†
|
|
|
10.24†
|
|
|
10.25†
|
|
|
10.26†
|
|
|
10.27†
|
|
|
10.28†
|
|
|
10.29†
|
|
|
10.30†
|
|
|
10.31†
|
|
|
10.32†
|
|
|
10.33†
|
|
|
10.34†
|
|
|
10.35†
|
|
99
|
10.36†
|
|
|
10.37†
|
|
|
10.38†
|
|
|
10.39†
|
|
|
10.40†
|
|
|
10.41†
|
|
|
10.42†
|
|
|
10.43†
|
|
|
10.44†
|
|
|
10.45†
|
|
|
10.46†
|
|
|
10.47†
|
|
|
10.50
|
|
|
10.51
|
|
|
10.52†
|
|
|
10.53†
|
|
|
10.54†
|
|
|
10.55†
|
|
|
10.56†
|
|
|
10.57†
|
|
|
10.58†
|
|
100
|
10.59†
|
|
|
10.60†
|
|
|
21.1*
|
|
|
23.1*
|
|
|
31.1*
|
|
|
31.2*
|
|
|
32.1*
|
|
|
32.2*
|
|
|
101.INS
|
XBRL Instance Document.
|
|
101.SCH
|
XBRL Taxonomy Extension Schema Document.
|
|
101.CAL
|
XBRL Taxonomy Extension Calculation Linkbase Document.
|
|
101.DEF
|
XBRL Taxonomy Extension Definition Linkbase Document.
|
|
101.LAB
|
XBRL Taxonomy Extension Label Linkbase Document.
|
|
101.PRE
|
XBRL Taxonomy Extension Presentation Linkbase Document.
|
|
†
|
Management Contract or Compensatory Plan or Arrangement
|
|
*
|
Filed herewith
|
101
SIGNATURES
Pursuant to the requirements of Section 13 or 15(d) of the Securities Exchange Act of 1934, as amended, the Registrant has duly caused this report to be signed on its behalf by the undersigned hereunto duly authorized.
Dated: February 28, 2019
|
SLM CORPORATION
|
|
|
By:
|
/
S
/ RAYMOND J. QUINLAN
|
|
|
Raymond J. Quinlan
Executive Chairman and Chief Executive Officer
|
Pursuant to the requirement of the Securities Exchange Act of 1934, as amended, this report has been signed below by the following persons on behalf of the Registrant and in the capacities and on the dates indicated.
|
/S/ RAYMOND J. QUINLAN
|
||
|
Raymond J. Quinlan
|
Executive Chairman and Chief Executive Officer
(Principal Executive Officer)
|
February 28, 2019
|
|
/S/ STEVEN J. MCGARRY
|
||
|
Steven J. McGarry
|
Executive Vice President and Chief Financial Officer
(Principal Financial Officer)
|
February 28, 2019
|
|
/S/ JONATHAN R. BOYLES
|
||
|
Jonathan R. Boyles
|
Senior Vice President and Controller
(Principal Accounting Officer)
|
February 28, 2019
|
|
/S/ PAUL G. CHILD
|
||
|
Paul G. Child
|
Director
|
February 28, 2019
|
|
/S/ MARY CARTER WARREN FRANKE
|
||
|
Mary Carter Warren Franke
|
Director
|
February 28, 2019
|
|
/S/ EARL A. GOODE
|
||
|
Earl A. Goode
|
Director
|
February 28, 2019
|
|
/S/ MARIANNE M. KELER
|
||
|
Marianne M. Keler
|
Director
|
February 28, 2019
|
|
/S/ JIM MATHESON
|
||
|
Jim Matheson
|
Director
|
February 28, 2019
|
|
/S/ JED H. PITCHER
|
||
|
Jed H. Pitcher
|
Director
|
February 28, 2019
|
102
|
/S/ FRANK C. PULEO
|
||
|
Frank C. Puleo
|
Director
|
February 28, 2019
|
|
/S/ VIVIAN C. SCHNECK-LAST
|
||
|
Vivian C. Schneck-Last
|
Director
|
February 28, 2019
|
|
/S/ WILLIAM N. SHIEBLER
|
||
|
William N. Shiebler
|
Director
|
February 28, 2019
|
|
/S/ ROBERT S. STRONG
|
||
|
Robert S. Strong
|
Director
|
February 28, 2019
|
|
/S/ KIRSTEN O. WOLBERG
|
||
|
Kirsten O. Wolberg
|
Director
|
February 28, 2019
|
103
CONSOLIDATED FINANCIAL STATEMENTS
INDEX
|
|
Page
|
F-1
Report of Independent Registered Public Accounting Firm
To the Stockholders and Board of Directors
SLM Corporation:
Opinion on the Consolidated Financial Statements
We have audited the accompanying consolidated balance sheets of SLM Corporation and subsidiaries (the Company) as of December 31, 2018 and 2017, the related consolidated statements of income, comprehensive income, changes in equity, and cash flows for each of the years in the three-year period ended December 31, 2018, and the related notes (collectively, the consolidated financial statements). In our opinion, the consolidated financial statements present fairly, in all material respects, the financial position of the Company as of December 31, 2018 and 2017, and the results of its operations and its cash flows for each of the years in the three-year period ended December 31, 2018, in conformity with U.S. generally accepted accounting principles.
We also have audited, in accordance with the standards of the Public Company Accounting Oversight Board (United States) (PCAOB), the Company’s internal control over financial reporting as of December 31, 2018, based on criteria established in Internal Control – Integrated Framework (2013) issued by the Committee of Sponsoring Organizations of the Treadway Commission, and our report dated February 28, 2019 expressed an unqualified opinion on the effectiveness of the Company’s internal control over financial reporting.
Basis for Opinion
These consolidated financial statements are the responsibility of the Company’s management. Our responsibility is to express an opinion on these consolidated financial statements based on our audits. We are a public accounting firm registered with the PCAOB and are required to be independent with respect to the Company in accordance with the U.S. federal securities laws and the applicable rules and regulations of the Securities and Exchange Commission and the PCAOB.
We conducted our audits in accordance with the standards of the PCAOB. Those standards require that we plan and perform the audit to obtain reasonable assurance about whether the consolidated financial statements are free of material misstatement, whether due to error or fraud. Our audits included performing procedures to assess the risks of material misstatement of the consolidated financial statements, whether due to error or fraud, and performing procedures that respond to those risks. Such procedures included examining, on a test basis, evidence regarding the amounts and disclosures in the consolidated financial statements. Our audits also included evaluating the accounting principles used and significant estimates made by management, as well as evaluating the overall presentation of the consolidated financial statements. We believe that our audits provide a reasonable basis for our opinion.
/s/ KPMG LLP
We have served as the Company’s auditor since 2013.
McLean, Virginia
February 28, 2019
F-2
Report of Independent Registered Public Accounting Firm
To the Stockholders and Board of Directors
SLM Corporation:
Opinion on Internal Control Over Financial Reporting
We have audited SLM Corporation and subsidiaries’ (the Company) internal control over financial reporting as of December 31, 2018, based on criteria established in Internal Control – Integrated Framework (2013) issued by the Committee of Sponsoring Organizations of the Treadway Commission. In our opinion, the Company maintained, in all material respects, effective internal control over financial reporting as of December 31, 2018, based on criteria established in Internal Control – Integrated Framework (2013) issued by the Committee of Sponsoring Organizations of the Treadway Commission.
We also have audited, in accordance with the standards of the Public Company Accounting Oversight Board
(United States) (PCAOB), the consolidated balance sheets of the Company as of December 31, 2018 and 2017, the related consolidated statements of income, comprehensive income, changes in equity, and cash flows for each of the years in the three-year period ended December 31, 2018, and the related notes
(collectively, the consolidated financial statements), and our report dated February 28, 2019 expressed an unqualified opinion on those consolidated financial statements.
Basis for Opinion
The Company’s management is responsible for maintaining effective internal control over financial reporting and for its assessment of the effectiveness of internal control over financial reporting, included in the accompanying Management’s Report on Internal Control over Financial Reporting. Our responsibility is to express an opinion on the Company’s internal control over financial reporting based on our audit. We are a public accounting firm registered with the PCAOB and are required to be independent with respect to the Company in accordance with the U.S. federal securities laws and the applicable rules and regulations of the Securities and Exchange Commission and the PCAOB.
We conducted our audit in accordance with the standards of the PCAOB. Those standards require that we plan and perform the audit to obtain reasonable assurance about whether effective internal control over financial reporting was maintained in all material respects. Our audit of internal control over financial reporting included obtaining an understanding of internal control over financial reporting, assessing the risk that a material weakness exists, and testing and evaluating the design and operating effectiveness of internal control based on the assessed risk. Our audit also included performing such other procedures as we considered necessary in the circumstances. We believe that our audit provides a reasonable basis for our opinion.
Definition and Limitations of Internal Control Over Financial Reporting
A company’s internal control over financial reporting is a process designed to provide reasonable assurance regarding the reliability of financial reporting and the preparation of financial statements for external purposes in accordance with generally accepted accounting principles. A company’s internal control over financial reporting includes those policies and procedures that (1) pertain to the maintenance of records that, in reasonable detail, accurately and fairly reflect the transactions and dispositions of the assets of the company; (2) provide reasonable assurance that transactions are recorded as necessary to permit preparation of financial
F-3
statements in accordance with generally accepted accounting principles, and that receipts and expenditures of the company are being made only in accordance with authorizations of management and directors of the company; and (3) provide reasonable assurance regarding prevention or timely detection of unauthorized acquisition, use, or disposition of the company’s assets that could have a material effect on the financial statements.
Because of its inherent limitations, internal control over financial reporting may not prevent or detect misstatements. Also, projections of any evaluation of effectiveness to future periods are subject to the risk that controls may become inadequate because of changes in conditions, or that the degree of compliance with the policies or procedures may deteriorate.
/s/ KPMG LLP
McLean, Virginia
February 28, 2019
F-4
SLM CORPORATION
CONSOLIDATED BALANCE SHEETS
(In thousands, except share and per share amounts)
|
December 31,
|
||||||||
|
2018
|
2017
|
|||||||
|
Assets
|
||||||||
|
Cash and cash equivalents
|
$
|
2,559,106
|
|
$
|
1,534,339
|
|
||
|
Available-for-sale investments at fair value (cost of $182,325 and $247,607, respectively)
|
176,245
|
|
244,088
|
|
||||
|
Loans held for investment (net of allowance for losses of $341,121 and $251,475, respectively)
|
22,270,919
|
|
18,567,641
|
|
||||
|
Restricted cash
|
122,789
|
|
101,836
|
|
||||
|
Other interest-earning assets
|
27,157
|
|
21,586
|
|
||||
|
Accrued interest receivable
|
1,191,981
|
|
967,482
|
|
||||
|
Premises and equipment, net
|
105,504
|
|
89,748
|
|
||||
|
Income taxes receivable, net
|
41,570
|
|
—
|
|
||||
|
Tax indemnification receivable
|
39,207
|
|
168,011
|
|
||||
|
Other assets
|
103,695
|
|
84,853
|
|
||||
|
Total assets
|
$
|
26,638,173
|
|
$
|
21,779,584
|
|
||
|
Liabilities
|
||||||||
|
Deposits
|
$
|
18,943,158
|
|
$
|
15,505,383
|
|
||
|
Long-term borrowings
|
4,284,304
|
|
3,275,270
|
|
||||
|
Income taxes payable, net
|
—
|
|
102,285
|
|
||||
|
Upromise member accounts
|
213,104
|
|
243,080
|
|
||||
|
Other liabilities
|
224,951
|
|
179,310
|
|
||||
|
Total liabilities
|
23,665,517
|
|
19,305,328
|
|
||||
|
Commitments and contingencies
|
|
|
||||||
|
Equity
|
||||||||
|
Preferred stock, par value $0.20 per share, 20 million shares authorized:
|
||||||||
|
Series B: 4 million and 4 million shares issued, respectively, at stated value of $100 per share
|
400,000
|
|
400,000
|
|
||||
|
Common stock, par value $0.20 per share, 1.125 billion shares authorized: 449.9 million and 443.5 million shares issued, respectively
|
89,972
|
|
88,693
|
|
||||
|
Additional paid-in capital
|
1,274,635
|
|
1,222,277
|
|
||||
|
Accumulated other comprehensive income (net of tax expense of $3,436 and $1,696, respectively)
|
10,623
|
|
2,748
|
|
||||
|
Retained earnings
|
1,340,017
|
|
868,182
|
|
||||
|
Total SLM Corporation stockholders’ equity before treasury stock
|
3,115,247
|
|
2,581,900
|
|
||||
|
Less: Common stock held in treasury at cost: 14.2 million and 11.1 million shares, respectively
|
(142,591
|
)
|
(107,644
|
)
|
||||
|
Total equity
|
2,972,656
|
|
2,474,256
|
|
||||
|
Total liabilities and equity
|
$
|
26,638,173
|
|
$
|
21,779,584
|
|
||
See accompanying notes to consolidated financial statements.
F-5
SLM CORPORATION
CONSOLIDATED STATEMENTS OF INCOME
(In thousands, except per share amounts)
|
|
Years Ended December 31,
|
|||||||||||
|
|
2018
|
2017
|
2016
|
|||||||||
|
Interest income:
|
||||||||||||
|
Loans
|
$
|
1,894,687
|
|
$
|
1,413,505
|
|
$
|
1,060,487
|
|
|||
|
Investments
|
6,162
|
|
8,288
|
|
9,160
|
|
||||||
|
Cash and cash equivalents
|
34,503
|
|
15,510
|
|
7,599
|
|
||||||
|
Total interest income
|
1,935,352
|
|
1,437,303
|
|
1,077,246
|
|
||||||
|
Interest expense:
|
||||||||||||
|
Deposits
|
389,349
|
|
223,691
|
|
148,408
|
|
||||||
|
Interest expense on short-term borrowings
|
5,833
|
|
6,341
|
|
7,322
|
|
||||||
|
Interest expense on long-term borrowings
|
127,106
|
|
78,050
|
|
30,178
|
|
||||||
|
Total interest expense
|
522,288
|
|
308,082
|
|
185,908
|
|
||||||
|
Net interest income
|
1,413,064
|
|
1,129,221
|
|
891,338
|
|
||||||
|
Less: provisions for credit losses
|
244,864
|
|
185,765
|
|
159,405
|
|
||||||
|
Net interest income after provisions for credit losses
|
1,168,200
|
|
943,456
|
|
731,933
|
|
||||||
|
Non-interest (loss) income:
|
||||||||||||
|
Gains on sales of loans, net
|
2,060
|
|
—
|
|
230
|
|
||||||
|
Losses on sales of securities, net
|
(1,549
|
)
|
—
|
|
—
|
|
||||||
|
Losses on derivatives and hedging activities, net
|
(87
|
)
|
(8,266
|
)
|
(958
|
)
|
||||||
|
Other (loss) income
|
(52,319
|
)
|
5,364
|
|
69,544
|
|
||||||
|
Total non-interest (loss) income
|
(51,895
|
)
|
(2,902
|
)
|
68,816
|
|
||||||
|
Non-interest expenses:
|
||||||||||||
|
Compensation and benefits
|
252,346
|
|
213,319
|
|
183,996
|
|
||||||
|
FDIC assessment fees
|
32,786
|
|
28,950
|
|
19,209
|
|
||||||
|
Other operating expenses
|
271,844
|
|
206,820
|
|
183,108
|
|
||||||
|
Total non-interest expenses
|
556,976
|
|
449,089
|
|
386,313
|
|
||||||
|
Income before income tax expense
|
559,329
|
|
491,465
|
|
414,436
|
|
||||||
|
Income tax expense
|
71,853
|
|
202,531
|
|
164,109
|
|
||||||
|
Net income
|
487,476
|
|
288,934
|
|
250,327
|
|
||||||
|
Preferred stock dividends
|
15,640
|
|
15,714
|
|
21,204
|
|
||||||
|
Net income attributable to SLM Corporation common stock
|
$
|
471,836
|
|
$
|
273,220
|
|
$
|
229,123
|
|
|||
|
Basic earnings per common share attributable to SLM Corporation
|
$
|
1.08
|
|
$
|
0.63
|
|
$
|
0.54
|
|
|||
|
Average common shares outstanding
|
435,054
|
|
431,216
|
|
427,876
|
|
||||||
|
Diluted earnings per common share attributable to SLM Corporation
|
$
|
1.07
|
|
$
|
0.62
|
|
$
|
0.53
|
|
|||
|
Average common and common equivalent shares outstanding
|
439,681
|
|
438,551
|
|
432,919
|
|
||||||
See accompanying notes to consolidated financial statements.
F-6
SLM CORPORATION
CONSOLIDATED STATEMENTS OF COMPREHENSIVE INCOME
(In thousands)
|
|
Years Ended December 31,
|
|||||||||||
|
|
2018
|
2017
|
2016
|
|||||||||
|
Net income
|
$
|
487,476
|
|
$
|
288,934
|
|
$
|
250,327
|
|
|||
|
Other comprehensive income (loss):
|
||||||||||||
|
Unrealized losses on investments
|
(2,561
|
)
|
(716
|
)
|
(1,792
|
)
|
||||||
|
Unrealized gains (losses) on cash flow hedges
|
11,907
|
|
19,195
|
|
13,764
|
|
||||||
|
Total unrealized gains (losses)
|
9,346
|
|
18,479
|
|
11,972
|
|
||||||
|
Income tax (expense) benefit
|
(2,333
|
)
|
(7,060
|
)
|
(4,584
|
)
|
||||||
|
Other comprehensive income (losses), net of tax (expense) benefit
|
7,013
|
|
11,419
|
|
7,388
|
|
||||||
|
Total comprehensive income
|
$
|
494,489
|
|
$
|
300,353
|
|
$
|
257,715
|
|
|||
See accompanying notes to consolidated financial statements.
F-7
SLM CORPORATION
CONSOLIDATED STATEMENTS OF CHANGES IN EQUITY
(In thousands, except share and per share amounts)
|
Common Stock Shares
|
||||||||||||||||||||||||||||||||||||||||
|
Preferred Stock Shares
|
Issued
|
Treasury
|
Outstanding
|
Preferred Stock
|
Common Stock
|
Additional Paid-In Capital
|
Accumulated
Other
Comprehensive
Income (Loss)
|
Retained Earnings
|
Treasury Stock
|
Total SLM Corporation Equity
|
||||||||||||||||||||||||||||||
|
Balance at December 31, 2015
|
7,300,000
|
|
430,677,434
|
|
(4,374,190
|
)
|
426,303,244
|
|
$
|
565,000
|
|
$
|
86,136
|
|
$
|
1,135,860
|
|
$
|
(16,059
|
)
|
$
|
366,609
|
|
$
|
(41,223
|
)
|
$
|
2,096,323
|
|
|||||||||||
|
Net income
|
—
|
|
—
|
|
—
|
|
—
|
|
—
|
|
—
|
|
—
|
|
—
|
|
250,327
|
|
—
|
|
250,327
|
|
||||||||||||||||||
|
Other comprehensive loss, net of tax
|
—
|
|
—
|
|
—
|
|
—
|
|
—
|
|
—
|
|
—
|
|
7,388
|
|
—
|
|
—
|
|
7,388
|
|
||||||||||||||||||
|
Total comprehensive income
|
—
|
|
—
|
|
—
|
|
—
|
|
—
|
|
—
|
|
—
|
|
—
|
|
—
|
|
—
|
|
257,715
|
|
||||||||||||||||||
|
Cash dividends:
|
||||||||||||||||||||||||||||||||||||||||
|
Preferred Stock, series A ($3.49 per share)
|
—
|
|
—
|
|
—
|
|
—
|
|
—
|
|
—
|
|
—
|
|
—
|
|
(11,501
|
)
|
—
|
|
(11,501
|
)
|
||||||||||||||||||
|
Preferred Stock, series B ($2.41 per share)
|
—
|
|
—
|
|
—
|
|
—
|
|
—
|
|
—
|
|
—
|
|
—
|
|
(9,703
|
)
|
—
|
|
(9,703
|
)
|
||||||||||||||||||
|
Dividend equivalent units related to employee stock-based compensation plans
|
—
|
|
—
|
|
—
|
|
—
|
|
—
|
|
—
|
|
410
|
|
—
|
|
(410
|
)
|
—
|
|
—
|
|
||||||||||||||||||
|
Issuance of common shares
|
—
|
|
5,955,045
|
|
5,955,045
|
|
—
|
|
1,191
|
|
18,000
|
|
—
|
|
—
|
|
—
|
|
19,191
|
|
||||||||||||||||||||
|
Tax benefit related to employee stock-based compensation
|
—
|
|
—
|
|
—
|
|
—
|
|
—
|
|
—
|
|
(1,650
|
)
|
—
|
|
—
|
|
—
|
|
(1,650
|
)
|
||||||||||||||||||
|
Stock-based compensation expense
|
—
|
|
—
|
|
—
|
|
—
|
|
—
|
|
—
|
|
22,944
|
|
—
|
|
—
|
|
—
|
|
22,944
|
|
||||||||||||||||||
|
Shares repurchased related to employee stock-based compensation plans
|
—
|
|
—
|
|
(3,354,730
|
)
|
(3,354,730
|
)
|
—
|
|
—
|
|
—
|
|
—
|
|
—
|
|
(26,261
|
)
|
(26,261
|
)
|
||||||||||||||||||
|
Balance at December 31, 2016
|
7,300,000
|
|
436,632,479
|
|
(7,728,920
|
)
|
428,903,559
|
|
$
|
565,000
|
|
$
|
87,327
|
|
$
|
1,175,564
|
|
$
|
(8,671
|
)
|
$
|
595,322
|
|
$
|
(67,484
|
)
|
$
|
2,347,058
|
|
|||||||||||
See accompanying notes to consolidated financial statements.
F-8
SLM CORPORATION
CONSOLIDATED STATEMENTS OF CHANGES IN EQUITY
(In thousands, except share and per share amounts)
|
Common Stock Shares
|
||||||||||||||||||||||||||||||||||||||||
|
Preferred Stock Shares
|
Issued
|
Treasury
|
Outstanding
|
Preferred Stock
|
Common Stock
|
Additional Paid-In Capital
|
Accumulated
Other
Comprehensive
Income (Loss)
|
Retained Earnings
|
Treasury Stock
|
Total SLM Corporation Equity
|
||||||||||||||||||||||||||||||
|
Balance at December 31, 2016
|
7,300,000
|
|
436,632,479
|
|
(7,728,920
|
)
|
428,903,559
|
|
$
|
565,000
|
|
$
|
87,327
|
|
$
|
1,175,564
|
|
$
|
(8,671
|
)
|
$
|
595,322
|
|
$
|
(67,484
|
)
|
$
|
2,347,058
|
|
|||||||||||
|
Net income
|
—
|
|
—
|
|
—
|
|
—
|
|
—
|
|
—
|
|
—
|
|
—
|
|
288,934
|
|
—
|
|
288,934
|
|
||||||||||||||||||
|
Other comprehensive income, net of tax
|
—
|
|
—
|
|
—
|
|
—
|
|
—
|
|
—
|
|
—
|
|
11,419
|
|
—
|
|
—
|
|
11,419
|
|
||||||||||||||||||
|
Total comprehensive income
|
—
|
|
—
|
|
—
|
|
—
|
|
—
|
|
—
|
|
—
|
|
—
|
|
—
|
|
—
|
|
300,353
|
|
||||||||||||||||||
|
Cumulative effect of the new stock compensation standard
|
—
|
|
—
|
|
—
|
|
—
|
|
—
|
|
—
|
|
429
|
|
—
|
|
(264
|
)
|
—
|
|
165
|
|
||||||||||||||||||
|
Cash dividends:
|
—
|
|
—
|
|
—
|
|
—
|
|
—
|
|
—
|
|
—
|
|
—
|
|
—
|
|
—
|
|
—
|
|
||||||||||||||||||
|
Preferred Stock, series A ($1.74 per share)
|
—
|
|
—
|
|
—
|
|
—
|
|
—
|
|
—
|
|
—
|
|
—
|
|
(3,961
|
)
|
—
|
|
(3,961
|
)
|
||||||||||||||||||
|
Preferred Stock, series B ($2.91 per share)
|
—
|
|
—
|
|
—
|
|
—
|
|
—
|
|
—
|
|
—
|
|
—
|
|
(11,753
|
)
|
—
|
|
(11,753
|
)
|
||||||||||||||||||
|
Redemption of Series A Preferred Stock
|
(3,300,000
|
)
|
—
|
|
—
|
|
—
|
|
(165,000
|
)
|
—
|
|
—
|
|
—
|
|
—
|
|
—
|
|
(165,000
|
)
|
||||||||||||||||||
|
Dividend equivalent units related to employee stock-based compensation plans
|
—
|
|
—
|
|
—
|
|
—
|
|
—
|
|
—
|
|
96
|
|
—
|
|
(96
|
)
|
—
|
|
—
|
|
||||||||||||||||||
|
Issuance of common shares
|
—
|
|
6,831,108
|
|
6,831,108
|
|
—
|
|
1,366
|
|
18,289
|
|
—
|
|
—
|
|
—
|
|
19,655
|
|
||||||||||||||||||||
|
Stock-based compensation expense
|
—
|
|
—
|
|
—
|
|
—
|
|
—
|
|
—
|
|
27,899
|
|
—
|
|
—
|
|
—
|
|
27,899
|
|
||||||||||||||||||
|
Shares repurchased related to employee stock-based compensation plans
|
—
|
|
—
|
|
(3,358,417
|
)
|
(3,358,417
|
)
|
—
|
|
—
|
|
—
|
|
—
|
|
—
|
|
(40,160
|
)
|
(40,160
|
)
|
||||||||||||||||||
|
Balance at December 31, 2017
|
4,000,000
|
|
443,463,587
|
|
(11,087,337
|
)
|
432,376,250
|
|
$
|
400,000
|
|
$
|
88,693
|
|
$
|
1,222,277
|
|
$
|
2,748
|
|
$
|
868,182
|
|
$
|
(107,644
|
)
|
$
|
2,474,256
|
|
|||||||||||
See accompanying notes to consolidated financial statements.
F-9
SLM CORPORATION
CONSOLIDATED STATEMENTS OF CHANGES IN EQUITY
(In thousands, except share and per share amounts)
|
Common Stock Shares
|
||||||||||||||||||||||||||||||||||||||||
|
Preferred Stock Shares
|
Issued
|
Treasury
|
Outstanding
|
Preferred Stock
|
Common Stock
|
Additional Paid-In Capital
|
Accumulated
Other
Comprehensive
Income
|
Retained Earnings
|
Treasury Stock
|
Total SLM Corporation Equity
|
||||||||||||||||||||||||||||||
|
Balance at December 31, 2017
|
4,000,000
|
|
443,463,587
|
|
(11,087,337
|
)
|
432,376,250
|
|
$
|
400,000
|
|
$
|
88,693
|
|
$
|
1,222,277
|
|
$
|
2,748
|
|
$
|
868,182
|
|
$
|
(107,644
|
)
|
$
|
2,474,256
|
|
|||||||||||
|
Net income
|
—
|
|
—
|
|
—
|
|
—
|
|
—
|
|
—
|
|
—
|
|
—
|
|
487,476
|
|
—
|
|
487,476
|
|
||||||||||||||||||
|
Other comprehensive income, net of tax
|
—
|
|
—
|
|
—
|
|
—
|
|
—
|
|
—
|
|
—
|
|
7,013
|
|
—
|
|
—
|
|
7,013
|
|
||||||||||||||||||
|
Total comprehensive income
|
—
|
|
—
|
|
—
|
|
—
|
|
—
|
|
—
|
|
—
|
|
—
|
|
—
|
|
—
|
|
494,489
|
|
||||||||||||||||||
|
Reclassification resulting from the adoption of ASU No. 2018-02
|
—
|
|
—
|
|
—
|
|
—
|
|
—
|
|
—
|
|
—
|
|
592
|
|
(592
|
)
|
—
|
|
—
|
|
||||||||||||||||||
|
Reclassification resulting from the adoption of ASU No. 2017-12
|
—
|
|
—
|
|
—
|
|
—
|
|
—
|
|
—
|
|
—
|
|
270
|
|
591
|
|
—
|
|
861
|
|
||||||||||||||||||
|
Cash dividends:
|
||||||||||||||||||||||||||||||||||||||||
|
Preferred Stock, series B ($3.91 per share)
|
—
|
|
—
|
|
—
|
|
—
|
|
—
|
|
—
|
|
—
|
|
—
|
|
(15,640
|
)
|
—
|
|
(15,640
|
)
|
||||||||||||||||||
|
Issuance of common shares
|
—
|
|
6,392,634
|
|
6,392,634
|
|
—
|
|
1,279
|
|
20,834
|
|
—
|
|
—
|
|
—
|
|
22,113
|
|
||||||||||||||||||||
|
Stock-based compensation expense
|
—
|
|
—
|
|
—
|
|
—
|
|
—
|
|
—
|
|
31,524
|
|
—
|
|
—
|
|
—
|
|
31,524
|
|
||||||||||||||||||
|
Shares repurchased related to employee stock-based compensation plans
|
—
|
|
—
|
|
(3,087,396
|
)
|
(3,087,396
|
)
|
—
|
|
—
|
|
—
|
|
—
|
|
—
|
|
(34,947
|
)
|
(34,947
|
)
|
||||||||||||||||||
|
Balance at December 31, 2018
|
4,000,000
|
|
449,856,221
|
|
(14,174,733
|
)
|
435,681,488
|
|
$
|
400,000
|
|
$
|
89,972
|
|
$
|
1,274,635
|
|
$
|
10,623
|
|
$
|
1,340,017
|
|
$
|
(142,591
|
)
|
$
|
2,972,656
|
|
|||||||||||
See accompanying notes to consolidated financial statements.
F-10
SLM CORPORATION
CONSOLIDATED STATEMENTS OF CASH FLOWS
(In thousands)
|
|
Years Ended December 31,
|
|||||||||||
|
|
2018
|
2017
|
2016
|
|||||||||
|
Operating activities
|
||||||||||||
|
Net income
|
$
|
487,476
|
|
$
|
288,934
|
|
$
|
250,327
|
|
|||
|
Adjustments to reconcile net income to net cash (used in) provided by operating activities:
|
||||||||||||
|
Provisions for credit losses
|
244,864
|
|
185,765
|
|
159,405
|
|
||||||
|
Deferred tax benefit
|
(63,301
|
)
|
(58,752
|
)
|
(88,732
|
)
|
||||||
|
Amortization of brokered deposit placement fee
|
13,055
|
|
9,372
|
|
10,133
|
|
||||||
|
Amortization of Secured Borrowing Facility upfront fee
|
1,128
|
|
1,316
|
|
1,229
|
|
||||||
|
Amortization of deferred loan origination costs and loan premium/(discounts), net
|
10,905
|
|
8,258
|
|
5,811
|
|
||||||
|
Net amortization of discount on investments
|
1,712
|
|
2,082
|
|
2,043
|
|
||||||
|
Reduction of tax indemnification receivable
|
92,815
|
|
31,888
|
|
(12,283
|
)
|
||||||
|
Depreciation of premises and equipment
|
13,829
|
|
11,171
|
|
9,592
|
|
||||||
|
Stock-based compensation expense
|
31,524
|
|
27,899
|
|
22,944
|
|
||||||
|
Unrealized losses (gains) on derivative and hedging activities, net
|
(1,353
|
)
|
7,248
|
|
2,263
|
|
||||||
|
Gains on sale of loans, net
|
(2,060
|
)
|
—
|
|
(230
|
)
|
||||||
|
Losses on sales of securities, net
|
1,549
|
|
—
|
|
—
|
|
||||||
|
Other adjustments to net income, net
|
7,446
|
|
6,305
|
|
4,430
|
|
||||||
|
Changes in operating assets and liabilities:
|
||||||||||||
|
Increase in accrued interest receivable
|
(864,461
|
)
|
(703,081
|
)
|
(582,361
|
)
|
||||||
|
(Increase) decrease in other interest-earning assets
|
(5,571
|
)
|
27,528
|
|
5,731
|
|
||||||
|
Decrease in tax indemnification receivable
|
35,989
|
|
59,633
|
|
59,633
|
|
||||||
|
Increase in other assets
|
(69,777
|
)
|
(72,646
|
)
|
(47,442
|
)
|
||||||
|
Decrease in income tax payable, net
|
(79,693
|
)
|
(19,687
|
)
|
(20,647
|
)
|
||||||
|
Increase in accrued interest payable
|
25,979
|
|
14,304
|
|
3,736
|
|
||||||
|
Increase in other liabilities
|
15,204
|
|
1,304
|
|
15,395
|
|
||||||
|
Total adjustments
|
(590,217
|
)
|
(460,093
|
)
|
(449,350
|
)
|
||||||
|
Total net cash used in operating activities
|
(102,741
|
)
|
(171,159
|
)
|
(199,023
|
)
|
||||||
|
Investing activities
|
||||||||||||
|
Loans acquired and originated
|
(6,493,367
|
)
|
(5,243,732
|
)
|
(4,698,548
|
)
|
||||||
|
Net proceeds from sales of loans held for investment
|
44,832
|
|
6,992
|
|
9,521
|
|
||||||
|
Proceeds from claim payments
|
54,659
|
|
49,146
|
|
64,869
|
|
||||||
|
Net decrease in loans held for investment
|
3,076,992
|
|
2,065,727
|
|
1,332,341
|
|
||||||
|
Purchases of available-for-sale securities
|
(15,876
|
)
|
(78,327
|
)
|
(55,767
|
)
|
||||||
|
Proceeds from sales and maturities of available-for-sale securities
|
77,897
|
|
40,044
|
|
38,721
|
|
||||||
|
Total net cash used in investing activities
|
(3,254,863
|
)
|
(3,160,150
|
)
|
(3,308,863
|
)
|
||||||
|
Financing activities
|
||||||||||||
|
Brokered deposit placement fee
|
(25,785
|
)
|
(12,200
|
)
|
(4,371
|
)
|
||||||
|
Net increase (decrease) in certificates of deposit
|
2,525,040
|
|
1,579,615
|
|
(434,740
|
)
|
||||||
|
Net increase in other deposits
|
918,420
|
|
508,389
|
|
2,412,221
|
|
||||||
|
Issuance costs for collateralized borrowings
|
—
|
|
—
|
|
(2,090
|
)
|
||||||
|
Borrowings collateralized by loans in securitization trusts - issued
|
1,891,027
|
|
1,440,127
|
|
1,775,692
|
|
||||||
|
Borrowings collateralized by loans in securitization trusts - repaid
|
(888,640
|
)
|
(534,905
|
)
|
(187,686
|
)
|
||||||
|
Borrowings under Secured Borrowing Facility
|
300,000
|
|
300,000
|
|
376,325
|
|
||||||
|
Repayment of borrowings under Secured Borrowing Facility
|
(300,000
|
)
|
(300,000
|
)
|
(876,500
|
)
|
||||||
|
Fees paid - Secured Borrowing Facility
|
(1,098
|
)
|
(1,281
|
)
|
(1,450
|
)
|
||||||
|
Issuance costs for unsecured debt offering
|
—
|
|
(1,057
|
)
|
—
|
|
||||||
|
Unsecured debt issued
|
—
|
|
197,000
|
|
—
|
|
||||||
|
Redemption of Series A Preferred Stock
|
—
|
|
(165,000
|
)
|
—
|
|
||||||
F-11
|
Preferred stock dividends paid
|
(15,640
|
)
|
(15,714
|
)
|
(21,204
|
)
|
||||||
|
Net cash provided by financing activities
|
4,403,324
|
|
2,994,974
|
|
3,036,197
|
|
||||||
|
Net increase (decrease) in cash, cash equivalents and restricted cash
|
1,045,720
|
|
(336,335
|
)
|
(471,689
|
)
|
||||||
|
Cash, cash equivalents and restricted cash at beginning of year
|
1,636,175
|
|
1,972,510
|
|
2,444,199
|
|
||||||
|
Cash, cash equivalents and restricted cash at end of year
|
$
|
2,681,895
|
|
$
|
1,636,175
|
|
$
|
1,972,510
|
|
|||
|
Cash disbursements made for:
|
||||||||||||
|
Interest
|
$
|
472,459
|
|
$
|
269,017
|
|
$
|
169,854
|
|
|||
|
Income taxes paid
|
$
|
228,074
|
|
$
|
282,278
|
|
$
|
271,721
|
|
|||
|
Income taxes refunded
|
$
|
(13,449
|
)
|
$
|
(1,401
|
)
|
$
|
(86
|
)
|
|||
|
Reconciliation of the Consolidated Statements of Cash Flows to the Consolidated Balance Sheets:
|
||||||||||||
|
Cash and cash equivalents
|
$
|
2,559,106
|
|
$
|
1,534,339
|
|
$
|
1,918,793
|
|
|||
|
Restricted cash
|
122,789
|
|
101,836
|
|
53,717
|
|
||||||
|
Total cash, cash equivalents and restricted cash
|
$
|
2,681,895
|
|
$
|
1,636,175
|
|
$
|
1,972,510
|
|
|||
See accompanying notes to consolidated financial statements.
F-12
SLM CORPORATION
NOTES TO CONSOLIDATED FINANCIAL STATEMENTS
(Dollars in thousands, unless otherwise noted)
|
1.
|
Organization and Business
|
SLM Corporation (“Sallie Mae,” “SLM,” the “Company,” “we,” “our” or “us”) is a holding company that operates through a number of subsidiaries. Its predecessor was formed in 1972 as the Student Loan Marketing Association, a federally-chartered government-sponsored enterprise (the “GSE”), with the goal of furthering access to higher education by providing liquidity to the education loan marketplace. The GSE’s federal charter prohibited it from originating student loans in the primary market.
In 1996, the United States Congress passed the Student Loan Marketing Association Reorganization Act, which set the stage for the “privatization” of the GSE. As part of the privatization process, we incorporated SLM Corporation in 1997 as a Delaware corporation, the GSE became a subsidiary of SLM Corporation, and by mid-2004 the GSE stopped purchasing loans insured or guaranteed under the Federal Family Education Loan Program (“FFELP Loans”) in the secondary market and was dissolved by the end of 2004.
On November 3, 2005, SLM Corporation formed Sallie Mae Bank, a Utah industrial bank subsidiary (the “Bank”), to fund and originate Private Education Loans on behalf of SLM Corporation. While the Bank first originated Private Education Loans (hereinafter defined) in February 2006, SLM Corporation continued to purchase a portion of its Private Education Loans from its third-party lending partners through mid-2009. With some minor exceptions, the Bank became the sole originator of Private Education Loans for SLM Corporation beginning with the 2009-2010 academic year, the first academic year following the launch of the Bank’s Smart Option Student Loan program in mid-2009.
On April 30, 2014, we completed our plan to legally separate into
two
distinct publicly-traded entities: an education loan management, servicing and asset recovery business, named Navient Corporation (“Navient”), which retained all assets and liabilities generated prior to the Spin-Off (hereinafter defined) other than those explicitly retained by SLM Corporation; and a consumer banking business, named SLM Corporation. The separation of Navient from SLM Corporation (the “Spin-Off”) was preceded by an internal corporate reorganization, which was the first step to separate the education loan management, servicing and asset recovery business from the consumer banking business. As a result of a holding company merger under Section 251(g) of the Delaware General Corporation Law, which is referred to herein as the “SLM Merger,” all of the shares of then existing SLM Corporation’s common stock were converted, on a
1
-to-1 basis, into shares of common stock of New BLC Corporation, a newly formed company that was a subsidiary of pre-Spin-Off SLM Corporation (“pre-Spin-Off SLM”), and, pursuant to the SLM Merger, New BLC Corporation replaced then existing SLM Corporation as the publicly-traded registrant and changed its name to SLM Corporation. As part of the internal corporate reorganization, the assets and liabilities associated with the education loan management, servicing and asset recovery business were transferred to Navient, and those assets and liabilities associated with the consumer banking business remained with or were transferred to the newly-constituted SLM Corporation. The separation and distribution were accounted for on a substantially tax-free basis.
Our primary business is to originate and service loans we make to students and their families to finance the cost of their education. We use “Private Education Loans” to mean education loans to students or their families that are not made, insured or guaranteed by any state or federal government. Private Education Loans do not include FFELP Loans. The core of our marketing strategy is to generate Private Education Loan originations by promoting our products on campuses through the financial aid offices as well as through online and direct marketing to students and their families. We also originate unsecured personal loans (“Personal Loans”) that are used for non-educational purposes by borrowers. The Bank is regulated by the Utah Department of Financial Institutions (the “UDFI”), the Federal Deposit Insurance Corporation (the “FDIC”) and the Consumer Financial Protection Bureau (the “CFPB”). We also operate Upromise, Inc. (“Upromise”), a save-for-college rewards program helping Americans save for higher education.
F-13
SLM CORPORATION
NOTES TO CONSOLIDATED FINANCIAL STATEMENTS (Continued)
(Dollars in thousands, unless otherwise noted)
|
2.
|
Significant Accounting Policies
|
Use of Estimates and Assumptions
The financial reporting and accounting policies of SLM Corporation conform to generally accepted accounting principles in the United States of America (“GAAP”). The preparation of financial statements in conformity with GAAP requires management to make estimates and assumptions that affect the reported amounts of assets and liabilities and disclosure of contingent assets and liabilities at the date of the financial statements and the reported amounts of revenues and expenses during the reporting period. Actual results could differ from those estimates. Key accounting policies that include significant judgments and estimates include the valuation of allowance for loan losses and derivative accounting.
Consolidation
The consolidated financial statements include the accounts of SLM Corporation and its majority-owned and controlled subsidiaries after eliminating the effects of intercompany accounts and transactions.
We consolidate any variable interest entity (“VIE”) where we have determined we are the primary beneficiary. The primary beneficiary is the entity which has both: (1) the power to direct the activities of the VIE that most significantly impact the VIE’s economic performance and (2) the obligation to absorb losses or receive benefits of the entity that could potentially be significant to the VIE.
Cash and Cash Equivalents
Cash and cash equivalents include cash held in the Federal Reserve Bank of San Francisco (the “FRB”) and commercial bank accounts, and other short-term liquid instruments with original maturities of three months or less. Fees associated with investing cash and cash equivalents are amortized into interest income using the effective interest rate method.
Investments
Investments consisted of mortgage-backed securities and Utah Housing Corporation bonds. We record our investment purchases and sales on a trade date basis. The amortized cost of debt securities is adjusted for amortization of premiums and accretion of discounts, which are amortized using the effective interest rate method.
Our investments are classified as available-for-sale and reported at fair value. Unrealized gains or losses on available-for-sale investments are recorded in equity and reported as a component of other comprehensive income (loss), net of applicable income taxes, unless a decline in the investment’s value is considered to be other-than-temporary, in which case the loss is recorded directly to earnings.
Management reviews all investments at least quarterly to determine whether any impairment is other-than-temporary. Impairment is evaluated by considering several factors, including the length of time and extent to which the fair value has been less than cost, the financial condition and near-term prospects of the issuer, and the intent and ability to retain the investment to allow for an anticipated recovery in fair value. If, based on the analysis, it is determined that the impairment is other-than-temporary, the investment is written down to fair value and a loss is recognized through earnings.
F-14
SLM CORPORATION
NOTES TO CONSOLIDATED FINANCIAL STATEMENTS (Continued)
(Dollars in thousands, unless otherwise noted)
|
2.
|
Significant Accounting Policies (Continued)
|
|
Loans Held for Investment
Loans, consisting of Private Education Loans, FFELP Loans and Personal Loans, that we have the ability and intent to hold for the foreseeable future are classified as held for investment, and are carried at amortized cost. Amortized cost includes the unamortized premiums, discounts, and capitalized origination costs and fees, all of which are amortized to interest income as discussed under “Loan Interest Income.” Loans which are held for investment are reported net of an allowance for loan losses.
Restricted Cash
Restricted cash primarily includes amounts held in student loan securitization trusts and other secured borrowings. This cash must be used to make payments related to trust obligations. Amounts on deposit in these accounts are primarily the result of timing differences between when principal and interest is collected on the trust assets and when principal and interest is paid on trust liabilities.
Allowance for Loan Losses
We maintain an allowance for loan losses at an amount sufficient to absorb probable losses incurred in our portfolios, as well as regarding future loan commitments, at the reporting date based on a projection of estimated probable credit losses incurred in the portfolio. We consider a loan to be impaired when, based on current information, a loss has been incurred and it is probable that we will not receive all contractual amounts due. When making our assessment as to whether a loan is impaired, we also take into account more than insignificant delays in payment. We generally evaluate impaired loans on an aggregate basis by grouping similar loans.
We analyze our portfolios to determine the effects that the various stages of delinquency and forbearance have on borrower default behavior and ultimate charge off. We estimate the allowance for loan losses for our loan portfolios using a roll rate analysis of delinquent and current accounts. A “roll rate analysis” is a technique used to estimate the likelihood that a loan receivable may progress through the various delinquency stages and ultimately charge off. We also take into account the current and future economic environment and certain other qualitative factors when calculating the allowance for loan losses.
The evaluation of the allowance for loan losses is inherently subjective, as it requires material estimates that may be susceptible to significant changes. Our default estimates are based on a loss emergence period of
one year
for Private Education Loans and Personal Loans and
two years
for FFELP Loans. A loss emergence period represents the expected period between the first occurrence of an event likely to cause a loss on a loan and the date the loan is expected to be charged off, taking into consideration account management practices that affect the timing of a loss, such as the usage of forbearance. The loss emergence period underlying the allowance for loan losses is subject to a number of assumptions. If actual future performance in delinquency, charge-offs and recoveries is significantly different than estimated, or account management assumptions or practices were to change, this could materially affect the estimate of the allowance for loan losses, the timing of when losses are recognized, and the related provision for credit losses on our consolidated statements of income.
We utilize various models to determine an appropriate allowance for loan losses. Changes to model inputs are made as deemed necessary. These models are reviewed and validated periodically.
Below we describe in further detail our policies and procedures for the allowance for loan losses as they relate to our Private Education Loan, Personal Loan, and FFELP Loan portfolios.
F-15
SLM CORPORATION
NOTES TO CONSOLIDATED FINANCIAL STATEMENTS (Continued)
(Dollars in thousands, unless otherwise noted)
|
2.
|
Significant Accounting Policies (Continued)
|
|
Allowance for Private Education Loan Losses
In determining the allowance for loan losses on our Private Education Loans that are not troubled debt restructurings (“TDRs”), we estimate the principal amount of loans that will default over the next year (
one year
being the expected period between a loss event and default) using a roll rate model and how much we expect to recover over the same
one
-year period related to the defaulted amount. The expected defaults less our expected recoveries adjusted for any qualitative factors (discussed below) equal the allowance related to this portfolio. Our historical experience indicates that, on average, the time between the date that a customer experiences a default causing event (i.e., the loss trigger event) and the date that we charge off the unrecoverable portion of that loan is
one
year.
In estimating both the non-TDR and TDR allowance amounts, we start with historical experience of customer delinquency and default behavior. We make judgments about which historical period to start with and then make further judgments about whether that historical experience is representative of future expectations and whether additional adjustments may be needed to those historical default rates. We also take certain other qualitative factors into consideration when calculating the allowance for loan losses. These qualitative factors include, but are not limited to, changes in the economic environment, changes in lending policies and procedures, including changes in underwriting standards and collection, charge-off and recovery practices not already included in the analysis, and the effect of other external factors such as legal and regulatory requirements on the level of estimated credit losses.
Our non-TDR allowance for loan losses is estimated using an analysis of delinquent and current accounts. Our roll rate model is used to estimate the likelihood that a loan receivable may progress through the various delinquency stages and ultimately charge off. Once a charge-off forecast is estimated, a recovery assumption is layered on top. In estimating recoveries, we use both estimates of what we would receive from the sale of defaulted loans as well as historical borrower payment behavior to estimate the timing and amount of future recoveries on charged-off loans.
The roll rate analysis model is based upon actual experience using the
120
day charge-off default aversion strategies. Once the quantitative calculation is performed, we review the adequacy of the allowance for loan losses and determine if qualitative adjustments need to be considered.
We collect on defaulted loans through a mix of in-house, third-party collectors and sales to third-parties. For December 31, 2018, 2017 and 2016, we used both an estimate of recovery rates from in-house collections as well as expectations of future sales of defaulted loans to estimate the timing and amount of future recoveries on charged-off loans.
In connection with the Spin-Off, we retained the right to require Navient to purchase certain delinquent loans (at fair value) when the borrower has a lending relationship with both us and Navient (“Split Loans”). In the second quarter of 2018, we sold our remaining
$43 million
portfolio of Split Loans (both current and non-current loans) to Navient and recognized a net gain of $
2 million
.
Allowance for Personal Loans
In December 2016, we began to acquire newly-originated Personal Loans from a marketplace lender, but discontinued those purchases in July 2018. In 2018, we began to originate Personal Loans. We maintain an allowance for Personal Loan losses at an amount sufficient to absorb losses estimated and viewed at the reporting date as probable credit losses to be incurred in the portfolio. In determining the allowance for loan losses on our Personal Loan portfolio that are not TDRs, we estimate the principal amount of the loans that will default over the next twelve months (twelve months being the expected period between a loss event and default) and how much we expect to recover over the same twelve-month period related to the defaulted amounts. The expected defaults less our expected recoveries adjusted for any qualitative factors equal the allowance related to this portfolio. At December 31, 2018, and 2017, we held $
1.1
billion and $
393.7
million, respectively, in Personal Loans, net of allowance. At December 31, 2018, there were no Personal Loans classified as TDRs.
F-16
SLM CORPORATION
NOTES TO CONSOLIDATED FINANCIAL STATEMENTS (Continued)
(Dollars in thousands, unless otherwise noted)
|
2.
|
Significant Accounting Policies (Continued)
|
|
Troubled Debt Restructurings
Separately, for our TDR portfolio, we estimate an allowance amount sufficient to cover life-of-loan expected losses through an impairment calculation based on the difference between the loan’s basis and the present value of expected future cash flows (which would include life-of-loan default and recovery assumptions) discounted at the loan’s original effective interest rate. Our TDR portfolio is comprised mostly of loans with interest rate reductions and loans with forbearance usage greater than
three months
, as further described below.
We modify the terms of loans for certain borrowers when we believe such modifications may increase the ability and willingness of a borrower to make payments and thus increase the ultimate overall amount collected on the loan. These modifications generally take the form of a forbearance, a temporary interest rate reduction or an extended repayment plan. When we give a borrower facing financial difficulty an interest rate reduction, we temporarily reduce the rate (currently to
2.0 percent
) for a two-year period and, in the vast majority of cases, permanently extend the final maturity of the loan. The combination of these two loan term changes helps reduce the monthly payment due from the borrower and increases the likelihood the borrower will remain current during the interest rate modification period as well as when the loan returns to its original contractual interest rate.
Until the fourth quarter of 2017, we generally considered a loan that was in full principal and interest repayment status which had received more than
three months
of forbearance in a
24
-month period to be a TDR; however, during the first
nine months
after a loan had entered full principal and interest repayment status, we did not count up to the first
six months
of forbearance received during that period against the three-month policy limit.
Beginning in the fourth quarter of 2017, we revised the policy described above for identifying when a loan should be classified as a TDR due to forbearance. Historically, all loans receiving forbearance under the thresholds described above were classified as TDRs. However, with the refinement, those loans with a FICO score above a certain threshold (based on the most recent quarterly FICO score refresh) that are granted a forbearance will not be classified as TDRs, while loans with a FICO score under the threshold (based on the most recent quarterly FICO score refresh) that are granted a forbearance will be classified as TDRs, once they reach our policy limit for forbearances described above (i.e., more than three months in a 24-month period, subject to the exceptions described for the first nine months after a loan enters full principal and interest repayment status). This change in our determination of when loans should be classified as TDRs did not affect any of our then existing loans classified as TDRs and it did not change any of the existing thresholds regarding length of forbearance for becoming a TDR. Instead, it is an additional filter in the TDR analysis that is applied after the loan has met the requisite number of months in forbearance. This change was adopted prospectively beginning in the fourth quarter of 2017 and had an immaterial effect on the allowance for loan losses and provision for loan losses in 2017.
A loan also becomes a TDR when it is modified to reduce the interest rate on the loan (regardless of when such modification occurs and/or whether such interest rate reduction is temporary). Once a loan qualifies for TDR status, it remains a TDR for allowance purposes for the remainder of its life. The majority of our loans that are considered TDRs involve a temporary forbearance of payments and do not change the contractual interest rate of the loan. As of December 31, 2018 and 2017, approximately
57
percent and
66
percent, respectively, of TDRs were classified as such due to their forbearance status.
F-17
SLM CORPORATION
NOTES TO CONSOLIDATED FINANCIAL STATEMENTS (Continued)
(Dollars in thousands, unless otherwise noted)
|
2.
|
Significant Accounting Policies (Continued)
|
|
Key Credit Quality Indicators
We determine the collectability of our Private Education Loan portfolio by evaluating certain risk characteristics. We consider credit score at original approval and periodically refreshed/updated credit scores through the loan’s term, existence of a cosigner, loan status and loan seasoning as the key credit quality indicators because they have the most significant effect on the determination of the adequacy of our allowance for loan losses. Credit scores are an indicator of the creditworthiness of borrowers and the higher the credit scores the more likely it is the borrowers will be able to make all of their contractual payments. Loan status affects the credit risk because a past due loan is more likely to result in a credit loss than a current loan. Additionally, loans in the deferred payment status have different credit risk profiles compared with those in current pay status. Loan seasoning affects credit risk because a loan with a history of making payments generally has a lower incidence of default than a loan with a history of making infrequent or no payments. The existence of a cosigner lowers the likelihood of default as well. We monitor and update these credit quality indicators in the analysis of the adequacy of our allowance for loan losses on a quarterly basis.
For Personal Loans, we consider FICO scores at original approval, seasoning and loan status to be our key credit quality indicators for the same reasons discussed above.
Certain Private Education Loans do not require borrowers to begin repayment until at least six months after they have graduated or otherwise left school. Consequently, the loss estimates for these loans is generally low while the borrower is in school. At December 31, 2018 and 2017,
26 percent
and
27 percent
, respectively, of the principal balance in the Private Education Loan portfolio was related to borrowers who are in an in-school (fully deferred), grace, or deferment status and not required to make payments. As this population of borrowers leaves school, they will be required to begin payments on their loans, and the allowance for losses may change accordingly.
Similar to the rules governing FFELP payment requirements, our collection policies allow for periods of nonpayment for borrowers requesting additional payment grace periods upon leaving school or experiencing temporary difficulty meeting payment obligations. This is referred to as forbearance status and is considered separately in the allowance for loan losses. The loss emergence period is in alignment with the typical collection cycle and takes into account these periods of nonpayment.
As part of concluding on the adequacy of the allowance for loan losses, we review key allowance and loan metrics. The most relevant of these metrics considered are the allowance coverage of net charge-offs ratio; the allowance as a percentage of ending total loans and of ending loans in repayment; and delinquency and forbearance percentages.
We consider a loan to be delinquent
31 days
after the last payment was contractually due. We use a model to estimate the amount of uncollectible accrued interest on Private Education Loans and reserve for that amount against current period interest income.
Allowance for FFELP Loan Losses
FFELP Loans are insured as to their principal and accrued interest in the event of default subject to a risk-sharing level based on the date of loan disbursement. These insurance obligations are supported by contractual rights against the United States. For loans disbursed on or after July 1, 2006, we receive
97 percent
reimbursement on all qualifying default claims. For loans disbursed after October 1, 1993, and before July 1, 2006, we receive
98 percent
reimbursement. For loans disbursed prior to October 1, 1993, we receive
100 percent
reimbursement.
The allowance for FFELP Loan losses uses historical experience of customer default behavior and a
two
-year loss emergence period to estimate the credit losses incurred in the loan portfolio at the reporting date. We apply the default rate projections, net of applicable risk sharing, to each category for the current period to perform our quantitative calculation. Once the quantitative calculation is performed, we review the adequacy of the allowance for loan losses and determine if qualitative adjustments need to be considered.
F-18
SLM CORPORATION
NOTES TO CONSOLIDATED FINANCIAL STATEMENTS (Continued)
(Dollars in thousands, unless otherwise noted)
|
2.
|
Significant Accounting Policies (Continued)
|
|
Deposits
Our retail deposit accounts are principally certificates of deposit (“CDs”), money market deposit accounts (“MMDAs”) and high-yield savings (“HYS”) accounts. CDs are accounts that have a stipulated maturity and interest rate. Retail CDs may be withdrawn early, but a penalty is assessed. MMDA and HYS accounts are both interest and non-interest bearing accounts that have no maturity or expiration date. For retail MMDA and HYS accounts, the depositor may be required to give written notice of any intended withdrawal not less than
seven days
before the withdrawal is made.
The Bank also includes brokered CDs in its funding base. Early withdrawal of brokered CDs is prohibited (except in the case of death or legal incapacity). Other deposit accounts include large interest-bearing omnibus accounts deposited in the Bank by commercial entities having custodial responsibilities for many underlying accounts. These omnibus accounts may be structured with or without fixed maturities, and may have fixed or variable interest rates.
Upromise Member Accounts
Upromise member accounts represent amounts owed to Upromise rewards members for rebates they have earned from qualifying purchases from Upromise’s participating merchants. These amounts are held in trust for the benefit of the members until distributed in accordance with the Upromise member’s request and/or the terms of the Upromise service agreement. Upromise, which acts as the trustee for the trust, has deposited a majority of the cash with the Bank pursuant to a money market deposit account agreement between the Bank and Upromise as trustee of the trust.
Fair Value Measurement
We use estimates of fair value in applying various accounting standards for our financial statements. Fair value measurements are used in one of four ways:
|
•
|
In the consolidated balance sheet with changes in fair value recorded in the consolidated statement of income;
|
|
•
|
In the consolidated balance sheet with changes in fair value recorded in the accumulated other comprehensive income section of the consolidated statement of changes in equity;
|
|
•
|
In the consolidated balance sheet for instruments carried at lower of cost or fair value with impairment charges recorded in the consolidated statement of income; and
|
|
•
|
In the notes to the consolidated financial statements.
|
Fair value is defined as the price to sell an asset or transfer a liability in an orderly transaction between willing and able market participants. In general, our policy in estimating fair value is to first look at observable market prices for identical assets and liabilities in active markets, where available. When these are not available, other inputs are used to model fair value such as prices of similar instruments, yield curves, volatilities, prepayment speeds, default rates and credit spreads (including for our liabilities), relying first on observable data from active markets. Depending on current market conditions, additional adjustments to fair value may be based on factors such as liquidity, credit, and bid/offer spreads. Transaction costs are not included in the determination of fair value. When possible, we seek to validate the model’s output to market transactions. Depending on the availability of observable inputs and prices, different valuation models could produce materially different fair value estimates. The values presented may not represent future fair values and may not be realizable.
We categorize our fair value estimates based on a hierarchical framework associated with three levels of price transparency utilized in measuring financial instruments at fair value. Classification is based on the lowest level of input that is significant to the fair value of the instrument. The three levels are as follows:
|
•
|
Level 1 — Quoted prices (unadjusted) in active markets for identical assets or liabilities that we have the ability to access at the measurement date. The types of financial instruments included in level 1 are highly liquid instruments with quoted prices.
|
F-19
SLM CORPORATION
NOTES TO CONSOLIDATED FINANCIAL STATEMENTS (Continued)
(Dollars in thousands, unless otherwise noted)
|
2.
|
Significant Accounting Policies (Continued)
|
|
|
•
|
Level 2 — Inputs from active markets, other than quoted prices for identical instruments, are used to determine fair value. Significant inputs are directly observable from active markets for substantially the full term of the asset or liability being valued.
|
|
•
|
Level 3 — Pricing inputs significant to the valuation are unobservable. Inputs are developed based on the best information available. However, significant judgment is required by us in developing the inputs.
|
Loan Interest Income
For all loans, including impaired loans, classified as held for investment, we recognize interest income as earned, adjusted for the amortization of deferred direct origination and acquisition costs. This adjustment is recognized based upon the expected yield of the loan over its life after giving effect to prepayments and extensions. We consider our constant prepayment rate (“CPR”) estimates a significant accounting assumption used to measure the expected prepayment activity in our education loan portfolio. The estimates are based on a number of factors such as historical prepayment rates for loans with similar loan characteristics, assumptions about portfolio composition and loan terms, and the prepayment curve’s tendency to follow a ramp pattern (i.e., the prepayment rate typically increases during the in-school and early repayment periods, then stabilizes). The CPR measures the expected prepayment activity over the life of the loan and is applied as a flat-rate input assumption when used in forecasting. Additionally, interest earned on education loans reflects potential non-payment adjustments in accordance with our uncollectible interest recognition policy as discussed further in “Allowance for Loan Losses” of this Note 2. Because of this, we do not place loans in nonaccrual status prior to charge-off. We do not amortize any adjustments to the basis of education loans when they are classified as held-for-sale.
Our CPR estimates include the effect of voluntary prepayments and consolidation (if the loans are consolidated to third parties), both of which shorten the lives of loans. CPR estimates also consider the utilization of deferment, forbearance, and extended repayment plans, which lengthen the lives of loans. We regularly evaluate the assumptions used to estimate the CPRs. In instances where there are changes to the assumptions, amortization of deferred direct origination and acquisition costs is adjusted on a cumulative basis to reflect the change since the origination or purchase of the loan. For the year ended December 31, 2018, our CPR for Private Education Loans was
6.83 percent
, compared with a CPR of
5.94 percent
for the year ended December 31, 2017.
We also pay to the U.S. Department of Education (the “DOE”) an annual
105
basis point Consolidation Loan Rebate Fee on FFELP consolidation loans, which is netted against loan interest income. Additionally, interest earned on education loans reflects potential non-payment adjustments in accordance with our uncollectible interest recognition policy. We do not amortize any adjustments to the basis of loans when they are classified as held-for-sale.
We recognize certain fee income (primarily late fees) on education loans when earned according to the contractual provisions of the promissory notes, as well as our expectation of collectability. Fee income is recorded when earned in “other non-interest income” in the accompanying consolidated statements of income.
Interest Expense
Interest expense is based upon contractual interest rates adjusted for the amortization of issuance costs. We incur interest expense on interest bearing deposits comprised of non-maturity savings deposits, brokered and retail CDs, and brokered and retail MMDAs, as well as on unsecured and secured financings. Interest expense is recognized when amounts are contractually due to deposit and debt holders and is adjusted for net payments/receipts related to interest rate swap agreements that qualify and are designated hedges of interest bearing liabilities. Interest expense also includes the amortization of deferred gains and losses on closed hedge transactions that qualified as hedges. Amortization of debt issuance costs, premiums, discounts and terminated hedge-basis adjustments are recognized using the effective interest rate method. We incur certain fees related to our Private Education Loan multi-lender secured borrowing facility (the “Secured Borrowing Facility,” which was previously called the asset-backed commercial paper facility or ABCP Facility), including an unused Secured Borrowing Facility fee, and also
F-20
SLM CORPORATION
NOTES TO CONSOLIDATED FINANCIAL STATEMENTS (Continued)
(Dollars in thousands, unless otherwise noted)
|
2.
|
Significant Accounting Policies (Continued)
|
|
incur fees related to our term asset-backed securities (“ABS”). These fees are included in interest expense. Refer to Note 8, “Deposits,” and Note 9, “Borrowings” for further details of our interest bearing liabilities.
Gains on Sale of Loans, Net
We may participate and sell loans to third-parties and affiliates, including entities that were related parties prior to the Spin-Off. These sales may occur through whole loan sales or securitization transactions that qualify for sales treatment. If a transfer of loans qualifies as a sale, we derecognize the loan and recognize a gain or loss as the difference between the carry basis of the loan sold and liabilities retained and the compensation received. We recognize the results of a transfer of loans based upon the settlement date of the transaction. These loans were initially recorded as held for investment and were transferred to held-for-sale immediately prior to sale or securitization.
Prior to the Spin-Off, the Bank sold loans to an entity that is now a subsidiary of Navient when loans became
90 days
delinquent and to facilitate securitization transactions. In the second quarter of 2018, we sold our remaining
$43 million
portfolio of Split Loans (both current and non-current loans) to Navient and recognized a net gain of
$2 million
. See Note 15, “Arrangements with Navient Corporation,” for further discussion regarding loan purchase agreements. We did not sell loans in 2017 and 2016, other than Split Loans.
Other Income
Our Upromise subsidiary has a number of programs that encourage consumers to save for the cost of college education. We have established a consumer savings network, which is designed to promote college savings by consumers who are members of this program by encouraging them to purchase goods and services from the merchants that participate in the program. Participating merchants generally pay Upromise fees based on member purchase volume, either online or in stores, depending on the contractual arrangement with the merchant. We recognize revenue as marketing and administrative services are rendered, based upon contractually determined rates and member purchase volumes.
Also included in other income are late fees on both Private Education Loans and FFELP Loans, which we recognize when the cash has been received, fees related to our credit card affinity program, income for servicing private student loans for third-parties and changes to our tax indemnification receivable from Navient.
Securitization Accounting
Our securitization transactions use a two-step structure with a special purpose entity VIE that legally isolates the transferred assets from us in the event of bankruptcy or receivership. Transactions receiving sale treatment are also structured to ensure that the holders of the beneficial interests issued are not constrained from pledging or exchanging their interests, and that we do not maintain effective control over the transferred assets. If these criteria are not met, then the transaction is accounted for as an on-balance sheet secured borrowing. If a securitization qualifies as a sale, we then assess whether we are the primary beneficiary of the securitization trust and are required to consolidate such trust. We are considered the primary beneficiary if we have both: (1) the power to direct the activities of the VIE that most significantly impact the VIE’s economic performance and (2) the obligation to absorb losses or receive benefits of the entity that could potentially be significant to the VIE. There can be considerable judgment as it relates to determining the primary beneficiary of the VIEs. There are no “bright line” tests. Rather, the assessment of who has the power to direct the activities of the VIE that most significantly affect the VIE’s economic performance and who has the obligation to absorb losses or receive benefits of the entity that could potentially be significant to the VIE can be very qualitative and judgmental in nature. If we are the primary beneficiary, then no gain or loss is recognized.
We have determined that as the servicer of Sallie Mae securitization trusts, we meet the first primary beneficiary criterion because we have the power to direct the activities of the VIE that most significantly impact the VIE’s economic performance.
Irrespective of whether a securitization receives sale or on-balance sheet treatment, our continuing involvement with our securitization trusts is generally limited to:
F-21
SLM CORPORATION
NOTES TO CONSOLIDATED FINANCIAL STATEMENTS (Continued)
(Dollars in thousands, unless otherwise noted)
|
2.
|
Significant Accounting Policies (Continued)
|
|
|
•
|
Owning the equity certificates of certain trusts;
|
|
•
|
The servicing of the student loan assets within the securitization trusts, on both a pre- and post-default basis;
|
|
•
|
Our acting as administrator for the securitization transactions we sponsored;
|
|
•
|
Our responsibilities relative to representation and warranty violations; and
|
|
•
|
The option to exercise the clean-up call and purchase the student loans from the trust when the pool balance is
10 percent
or less of the original pool balance.
|
In 2015 and 2014, we executed both secured financing and securitized loan sale transactions. Based upon our relationships with these securitizations, we believe the consolidation assessment is straightforward. We consolidated our secured financing transactions because either we did not meet the accounting criterion for sales treatment or we determined we were the primary beneficiary of the VIE because we retained (a) the residual interest in the securitization and therefore had the obligation to absorb losses or receive benefits of the entity that could potentially be significant to the VIE, as well as (b) the power to direct the activities of the VIE in our role as servicer. For those transactions accounted for as securitized loan sales, we were not the primary beneficiary because we have no obligation to absorb losses or receive benefits of the entity that could potentially be significant to the VIE.
The investors in our securitization trusts have no recourse to our other assets should there be a failure of the trust to pay when due. Generally, the only recourse the securitization trusts have to us is in the event we breach a seller representation or warranty or our duties as master servicer and servicer, in which event we are obligated to repurchase the related loans from the trust.
We did not record a servicing asset or servicing liability related to our securitization transactions because we determined the servicing fees we receive are at market rate.
Derivative Accounting
We account for our derivatives, consisting of interest rate swaps, at fair value on the consolidated balance sheets as either an asset or liability. Derivative positions are recorded as net positions by counterparty based on master netting arrangements (see Note 10, “Derivative Financial Instruments”), exclusive of accrued interest and cash collateral held or pledged. The Chicago Mercantile Exchange (the “CME”) and the London Clearing House (the “LCH”) made amendments to their respective rules that resulted in the prospective accounting treatment of certain daily payments historically treated as the posting of collateral (variation margin payments) being considered as the legal settlement of the outstanding exposure of the derivative. The CME rule changes became effective in January 2017, and the LCH rule changes became effective in January 2018. The rule changes result in all variation margin payments on derivatives cleared through the CME and LCH being accounted for as legal settlement. As of December 31, 2018,
$5.4 billion
notional of our derivative contracts were cleared on the CME and
$0.6 billion
were cleared on the LCH. The derivative contracts cleared through the CME and LCH represent
90.2 percent
and
9.8 percent
, respectively, of our total notional derivative contracts of
$6.0 billion
at December 31, 2018.
For derivatives cleared through the CME and LCH, the net gain (loss) position includes the variation margin amounts as settlement of the derivative and not collateral against the fair value of the derivative. The amount of variation margin included as settlement as of December 31, 2018 was $
(16.7) million
and $
(6.1) million
for the CME and LCH, respectively. Interest income (expense) related to variation margin on derivatives that are not designated as hedging instruments or are designated as fair value relationships is recognized as a gain (loss) rather than as interest income (expense). Changes in fair value for derivatives not designated as hedging instruments will be presented as realized gains (losses).
We determine the fair value for our derivative contracts primarily using pricing models that consider current market conditions and the contractual terms of the derivative contracts. These pricing models consider interest rates, time value, forward interest rate curves, and volatility factors. Inputs are generally from active financial markets.
F-22
SLM CORPORATION
NOTES TO CONSOLIDATED FINANCIAL STATEMENTS (Continued)
(Dollars in thousands, unless otherwise noted)
|
2.
|
Significant Accounting Policies (Continued)
|
|
The accounting for derivative instruments requires that every derivative instrument, including certain derivative instruments embedded in other contracts, be recorded on the balance sheet as either an asset or liability measured at fair value. Our derivative instruments are classified and accounted for by us as fair value hedges, cash flow hedges, and trading hedges.
We elected to early adopt Accounting Standards Update (“ASU”) No. 2017-12 effective July 1, 2018. Under the new standard, we are no longer required to separately measure and report hedge ineffectiveness, which was previously recorded in “gains (losses) on derivatives and hedging activities, net” in our consolidated statements of income. In accordance with the new standard, certain provisions were required to be applied on a modified retrospective basis, which requires a cumulative effect adjustment to accumulated other comprehensive income with a corresponding adjustment to retained earnings as of the beginning of the fiscal year of adoption, or January 1, 2018 in our case. See Note 2, “Significant Accounting Policies — Recently Issued and Adopted Accounting Pronouncements” for a more detailed discussion.
Each derivative is designated to a specific (or pool of) liability(ies) on the consolidated balance sheets, and is designated as either a “fair value” hedge or a “cash flow” hedge. Fair value hedges are designed to hedge our exposure to the changes in fair value of a fixed-rate liability. For effective fair value hedges, both the hedge and the hedged item (for the risk being hedged) are recorded at fair value with any difference reflecting ineffectiveness recorded immediately in the consolidated statements of income. Cash flow hedges are designed to hedge our exposure to variability in cash flows related to variable-rate deposits. The assessment of the hedge’s effectiveness is performed at inception and on an ongoing basis, using regression testing. For hedges of a pool of liabilities, tests are performed to demonstrate the similarity of individual instruments of the pool. When it is determined that a derivative is not currently an effective hedge, ineffectiveness is recognized for the full change in fair value of the derivative with no offsetting amount from the hedged item since the last time it was effective. If it is also determined the hedge will not be effective in the future, we discontinue the hedge accounting prospectively and begin amortization of any basis adjustments that exist related to the hedged item.
Stock-Based Compensation
We recognize stock-based compensation cost in our consolidated statements of income using the fair value method. Under this method, we determine the fair value of the stock-based compensation at the time of the grant and recognize the resulting compensation expense over the vesting period of the stock-based grant. We do not apply a forfeiture rate to our stock-based compensation expense, but rather record forfeitures when they occur. We record all excess tax benefits/deficiencies related to the settlement of employee stock-based compensation to the income tax expense line item on our consolidated statements of income.
ASU No. 2016-09, “Compensation - Stock Compensation (Topic 718): Improvements to Employee Share-Based Payment Accounting”
In March 2016, the Financial Accounting Standards Board (“FASB”) issued ASU No. 2016-09, “Compensation - Stock Compensation (Topic 718): Improvements to Employee Share-Based Payment Accounting,” which amended the stock compensation guidance. The amendments simplified the accounting for the taxes related to stock-based compensation, including adjustments to how excess tax benefits and a company’s payments for tax withholdings should be classified. The standard became effective for fiscal periods beginning after December 15, 2016, with early adoption permitted. We adopted this standard effective January 1, 2017 and recorded an
$8.5 million
benefit in income tax expense in 2017 because of this new standard. We previously recorded the excess tax benefits/deficiencies to the additional paid-in capital line item on our consolidated balance sheets. Under the new guidance, we also elected the option to no longer apply a forfeiture rate to our stock-based compensation expense, but to record forfeitures when they occur, and, as a result, under a modified retrospective basis we recorded a cumulative effect of the new stock compensation standard in total equity of
$0.2 million
, net of tax, in the first quarter of 2017.
F-23
SLM CORPORATION
NOTES TO CONSOLIDATED FINANCIAL STATEMENTS (Continued)
(Dollars in thousands, unless otherwise noted)
|
2.
|
Significant Accounting Policies (Continued)
|
|
Income Taxes
We account for income taxes under the asset and liability approach, which requires the recognition of deferred tax liabilities and assets for the expected future tax consequences of temporary differences between the carrying amounts and tax basis of our assets and liabilities. To the extent tax laws change, deferred tax assets and liabilities are adjusted in the period that the tax change is enacted.
On December 22, 2017, President Trump signed into law the Tax Cuts and Jobs Act of 2017 (the “Tax Act”), which lowered federal corporate income tax rates from 35 percent to 21 percent, beginning January 1, 2018. Because the Tax Act was enacted during the fourth-quarter 2017, we were required to reflect the application of the lower tax rate in future years to our deferred assets, liabilities and indemnification receivables. We recognized additional discrete tax expense of
$15
million for the year ended December 31, 2017, primarily due to the remeasurement of our deferred tax assets and liabilities following the enactment of the Tax Act. At December 31, 2018, our accounting for the Tax Act is complete under the SEC’s Staff Accounting Bulletin No. 118.
“Income tax expense (benefit)” includes (i) deferred tax expense (benefit), which represents the net change in the deferred tax asset or liability balance during the year when applicable, and (ii) current tax expense (benefit), which represents the amount of tax currently payable to or receivable from a tax authority plus amounts accrued for unrecognized tax benefits. Income tax expense (benefit) excludes the tax effects related to adjustments recorded in equity.
An uncertain tax position is recognized only if it is more likely than not to be sustained upon examination based on the technical merits of the position. The amount of tax benefit recognized in the consolidated financial statements is the largest amount of benefit that is more than fifty percent likely of being sustained upon ultimate settlement of the uncertain tax position. We recognize interest and penalties related to unrecognized tax benefits in income tax expense (benefit).
In connection with the Spin-Off, we recorded a liability related to uncertain tax positions of $
27
million for which we are indemnified by Navient. If there is an adjustment to the indemnified uncertain tax liability, an offsetting adjustment to the indemnification receivable will be recorded as pre-tax adjustment to other income in the income statement.
As of the date of the Spin-Off on April 30, 2014, we recorded a liability of $
310
million ($
283
million related to deferred taxes and $
27
million related to uncertain tax positions) and an indemnification receivable of $
291
million ($
310
million less the $
19
million discount). As of December 31, 2018, with respect to those amounts recorded at the Spin-Off, the remaining liability balance is $
24
million (related to uncertain tax positions) and the remaining indemnification receivable balance is $
24
million (related to uncertain tax positions).
Reclassifications
Certain reclassifications have been made to the balances as of and for the years ended December 31, 2017 and 2016, to be consistent with classifications adopted for 2018, which had no effect on net income, total assets or total liabilities.
Recently Issued and Adopted Accounting Pronouncements
Amendments to “Revenue from Contracts with Customers (Topic 606)”
In May 2014, the FASB issued ASU No. 2014-09, “Revenue from Contracts with Customers (Topic 606).” The guidance in this ASU supersedes existing revenue recognition requirements in Topic 605, Revenue Recognition, including an assortment of transaction-specific and industry-specific rules. We adopted the new revenue recognition model on January 1, 2018. This ASU establishes a principles-based model under which revenue from a contract is allocated to the distinct performance obligations within the contract and recognized in income as each performance obligation is satisfied. ASU Topic 606 does not
F-24
SLM CORPORATION
NOTES TO CONSOLIDATED FINANCIAL STATEMENTS (Continued)
(Dollars in thousands, unless otherwise noted)
|
2.
|
Significant Accounting Policies (Continued)
|
|
apply to rights or obligations associated with financial instruments (for example, interest income from loans or investments, or interest expense on debt), and therefore our net interest income should not be affected.
Certain of our fee income related to our Upromise rewards business is within the scope of these rules. Management has concluded that timing and measurement of fee income related to our Upromise rewards business will remain substantially unchanged under the new standard. This conclusion covers the vast majority of our revenue that is within the scope of the new standard. The adoption of this standard did not materially affect our consolidated financial statements in 2018.
In March 2016, the FASB issued ASU No. 2016-08, “Revenue from Contracts with Customers (Topic 606): Principal versus Agent Considerations (Reporting Revenue Gross versus Net).” The guidance in this ASU provides clarification on the principal versus agent concept in relation to revenue recognition guidance issued as part of ASU No. 2014-09, “Revenue from Contracts with Customers (Topic 606).” Topic 606 requires a company to determine whether it is a principal or an agent in a transaction in which another party is involved in providing goods or services to a customer by evaluating the nature of its promise to the customer. ASU No. 2016-08 provides clarification for identifying the good, service or right being transferred in a revenue transaction and identifies the principal as the party that controls the good, service or right prior to its transfer to the customer. The ASU provides further clarity on how to evaluate control in this context. We adopted the new standard on January 1, 2018. The adoption did not result in different conclusions regarding our revenue arrangements that involve a principal-agent relationship.
ASU No. 2016-01, “Financial Instruments - Overall (Subtopic 825-10): Recognition and Measurement of Financial Assets and Financial Liabilities”
In January 2016, the FASB issued ASU No. 2016-01, “Financial Instruments-Overall (Subtopic 825-10): Recognition and Measurement of Financial Assets and Financial Liabilities.” The ASU does not change the guidance for classifying and measuring investments in debt securities or loans. The standard requires entities to measure certain cost-method equity investments at fair value with changes in value recognized in net income. Equity investments that do not have readily determinable fair values will be carried at cost, less any impairment, plus or minus changes resulting from any observable price changes in orderly transactions for an identical or similar investment of the same issuer. This ASU requires public entities to use the exit price notion when measuring the fair value of financial instruments for disclosure purposes and requires separate presentation of financial assets and financial liabilities by measurement category and form of financial asset (i.e., securities or loans) on the balance sheet or the accompanying notes to the financial statements. We adopted the new standard on January 1, 2018. The adoption did not materially affect our consolidated financial statements.
ASU No. 2016-18, “Statement of Cash Flows (Topic 230): Restricted Cash”
In November 2016, the FASB issued ASU No. 2016-18, “Statement of Cash Flows (Topic 230): Restricted Cash.” Whereas restricted cash balances have traditionally been excluded from the statement of cash flows, this ASU requires restricted cash and restricted cash equivalents to be included within the beginning and ending totals of cash, cash equivalents and restricted cash presented on the statement of cash flows for all periods presented. Restricted cash and restricted cash equivalent inflows and outflows with external parties are required to be classified within the operating, investing, and/or financing activity sections of the statement of cash flows, whereas transfers between cash and cash equivalents and restricted cash and restricted cash equivalents should no longer be presented on the statement of cash flows. ASU No. 2016-18 also requires (a) the nature of the restrictions to be disclosed to help provide information about the sources and uses of these balances during a reporting period and (b) a reconciliation of the cash, cash equivalents and restricted cash totals on the statement of cash flows to the related balance sheet line items when cash, cash equivalents, and restricted cash are presented in more than one line item on the balance sheet. The reconciliation can be presented either on the face of the statement of cash flows or in the notes to the financial statements and must be provided for each period that a balance sheet is presented. We adopted the new accounting pronouncement on January 1, 2018, and the adoption did not have a material impact to our statement of cash flows.
F-25
SLM CORPORATION
NOTES TO CONSOLIDATED FINANCIAL STATEMENTS (Continued)
(Dollars in thousands, unless otherwise noted)
|
2.
|
Significant Accounting Policies (Continued)
|
|
ASU No. 2017-09, “Compensation-Stock Compensation (Topic 718): Scope of Modification Accounting”
In May 2017, the FASB issued ASU 2017-09, “Compensation-Stock Compensation (Topic 718): Scope of Modification Accounting, ” which clarifies what constitutes a modification of a share-based payment award. The ASU is effective for all entities for annual and interim periods in fiscal years beginning after December 15, 2017, with early adoption permitted. We adopted this standard on January 1, 2018, and the adoption did not have a material impact on our consolidated financial statements.
ASU No. 2017-12, “Derivatives and Hedging: Targeted Improvements to Accounting for Hedging Activities”
On August 28, 2017, the FASB issued ASU No. 2017-12, “Derivatives and Hedging: Targeted Improvements to Accounting for Hedging Activities,” which (a) improves the financial reporting of hedging relationships to better portray the economic results of an entity’s risk management activities in its financial statements and (b) makes certain targeted improvements to simplify the application of the hedge accounting guidance. The effective date for the standard is January 1, 2019, with early adoption permitted. We elected to early adopt the standard effective July 1, 2018. One of the key changes is that the standard eliminates the separate measurement and reporting of hedge ineffectiveness. In accordance with the new standard, certain provisions were required to be applied on a modified retrospective basis, which requires a cumulative effect adjustment to accumulated other comprehensive income with a corresponding adjustment to retained earnings as of the beginning of the fiscal year of adoption, or January 1, 2018 in our case.
As a result of the cumulative effect of applying the new hedging standard to our fair value hedges on July 1, 2018, we recorded a
$2.0 million
basis increase to our hedged deposit balances with a corresponding increase to retained earnings of approximately
$0.8 million
, net of taxes and a
$3.0 million
loss to “gains (losses) on derivatives and hedging activities, net” in our consolidated statements of income to adjust the life-to-date ineffectiveness. To reflect the adoption of the new hedging standard on our cash flow hedging relationships at July 1, 2018, we recorded a
$0.2 million
, net of taxes decrease to retained earnings and a corresponding
$0.3 million
increase to accumulated other comprehensive income.
The new standard also requires modifications to existing presentation and disclosure requirements. We did not apply adjustments to our prior period consolidated balance sheets or consolidated statements of income as a result of adopting the new hedging standard. However, certain disclosures within the notes to the financial statements set forth in this report, regarding the years ended December 31, 2017 and 2016, conform to the disclosure requirements of ASU No. 2017-12. For further details, refer to Note 10, “Derivative Financial Instruments.”
F-26
SLM CORPORATION
NOTES TO CONSOLIDATED FINANCIAL STATEMENTS (Continued)
(Dollars in thousands, unless otherwise noted)
|
2.
|
Significant Accounting Policies (Continued)
|
|
ASU No. 2018-02, “Income Statement - Reporting Comprehensive Income (Topic 220): Reclassification of Certain Tax Effects from Accumulated Other Comprehensive Income”
In February 2018, the FASB issued ASU No. 2018-02, “Income Statement - Reporting Comprehensive Income (Topic 220): Reclassification of Certain Tax Effects from Accumulated Other Comprehensive Income,” which allows a reclassification from accumulated other comprehensive income to retained earnings for stranded tax effects resulting from the tax law and tax rate changes under the Tax Cuts and Jobs Act of 2017 (the “Tax Act”) enacted on December 22, 2017. Under the Tax Act, deferred taxes were adjusted to reflect the reduction of the historical corporate income tax rate to the newly enacted corporate income tax rate, which left the tax effects on items within accumulated other comprehensive income stranded at an inappropriate tax rate. This guidance is effective for fiscal years beginning after December 15, 2018, and for interim periods within those fiscal years, with early adoption permitted. We adopted this standard effective January 1, 2018 and recorded a
$0.6 million
reclass from accumulated other comprehensive income to retained earnings in the first quarter of 2018.
Recently Issued but Not Yet Adopted Accounting Pronouncements
ASU No. 2016-02, “Leases”
In February 2016, the FASB issued ASU No. 2016-02, “Leases,” a comprehensive new lease standard which will supersede previous lease guidance. The standard requires a lessee to recognize in its balance sheet assets and liabilities related to long-term leases that were classified as operating leases under previous guidance. An asset will be recognized related to the right to use the underlying asset and a liability will be recognized related to the obligation to make lease payments over the term of the lease. The standard also requires expanded disclosures surrounding leases. The standard is effective for fiscal periods beginning after December 15, 2018, and requires modified retrospective adoption, with early adoption permitted. We adopted this guidance on January 1, 2019. In doing so, we identified and evaluated the related lease contracts and revised our controls and processes to address the lease standard. The adoption of this guidance will not have a material impact on our consolidated financial statements.
ASU No. 2016-13, “Financial Instruments-Credit Losses (Topic 326): Measurement of Credit Losses on Financial Instruments”
In June 2016, the FASB issued ASU No. 2016-13, “Financial Instruments-Credit Losses (Topic 326): Measurement of Credit Losses on Financial Instruments.” This ASU eliminates the incurred loss threshold for initial recognition of credit impairment in current GAAP and replaces it with the expected loss concept. For all loans carried at amortized cost, we will be required to measure our allowance for loan losses based on our current estimate of all expected credit losses (“CECL”) over the remaining contractual term of the assets. Because it eliminates the incurred loss trigger, the new accounting guidance will require us, upon the origination of a loan, to record an estimate of all expected credit losses on that loan through an immediate charge to earnings. Updates to that estimate each period will be recorded through provision expense. The estimate of loan losses must be based on historical experience, current conditions and reasonable and supportable forecasts. The ASU does not mandate the use of any specific method for estimating credit loss, permitting companies to use judgment in selecting the approach that is most appropriate in their circumstances.
The standard will become effective for us on January 1, 2020, with early adoption permitted no sooner than January 1, 2019. Upon adoption, a cumulative effect adjustment to retained earnings will be recorded as of the beginning of the first reporting period in which the guidance is effective in an amount necessary to adjust the allowance for loan losses to equal the current estimate of expected losses on financial assets held at that date. We have evaluated the standard and initiated implementation efforts. We have identified the loss forecasting approach and have built the loss models for our Private Education Loans and those Personal Loans acquired from third-parties. In 2019, we plan to complete our loss model for Personal Loans we originate and complete the testing and validation for all of the models to be used to implement CECL. We
F-27
SLM CORPORATION
NOTES TO CONSOLIDATED FINANCIAL STATEMENTS (Continued)
(Dollars in thousands, unless otherwise noted)
|
2.
|
Significant Accounting Policies (Continued)
|
|
also plan to run our CECL solution parallel to our current process in 2019, in preparation for the 2020 implementation date. Adoption of the standard will have a material impact on how we record and report our financial condition and results of operations, and on regulatory capital. The extent of the impact upon adoption will likely depend on the characteristics of our loan portfolio and economic conditions at that date, as well as forecasted conditions thereafter.
3. Cash and Cash Equivalents
As of
December 31, 2018
, cash and cash equivalents include cash due from the FRB of $
2.5
billion and cash due from depository institutions of
$62.2
million. As of
December 31, 2017
, cash and cash equivalents include cash due from the FRB of
$1.5
billion and cash due from depository institutions of $
43.1
million. As of
December 31, 2018
and
2017
, we had
no
outstanding cash equivalents.
The FRB Term Deposit Facility program is used to facilitate the conduct of monetary policy by providing a tool that may be used to manage the aggregate quantity of reserve balances held by depository institutions. Under this program, the FRB accepts deposits for a stated maturity at a rate of interest determined via auction. The funds are removed from the accounts of participating institutions for the life of the term deposit. We participated in these auctions in
2018
and
2017
, resulting in interest income of
$0.2
million and
$0.5
million, respectively. As of
December 31, 2018
and
2017
,
no
funds were on deposit with the FRB under this program.
4. Investments
The amortized cost and fair value of securities available for sale are as follows:
|
December 31, 2018
|
||||||||||||||||
|
Amortized Cost
|
Gross Unrealized Gains
|
Gross Unrealized Losses
|
Estimated Fair Value
|
|||||||||||||
|
Available for sale:
|
||||||||||||||||
|
Mortgage-backed securities
|
$
|
159,937
|
|
$
|
155
|
|
$
|
(5,517
|
)
|
$
|
154,575
|
|
||||
|
Utah Housing Corporation bonds
|
22,388
|
|
23
|
|
(741
|
)
|
21,670
|
|
||||||||
|
Total
|
$
|
182,325
|
|
$
|
178
|
|
$
|
(6,258
|
)
|
$
|
176,245
|
|
||||
|
December 31, 2017
|
||||||||||||||||
|
Amortized Cost
|
Gross Unrealized Gains
|
Gross Unrealized Losses
|
Estimated Fair Value
|
|||||||||||||
|
Available for sale:
|
||||||||||||||||
|
Mortgage-backed securities
|
$
|
227,607
|
|
$
|
650
|
|
$
|
(3,210
|
)
|
$
|
225,047
|
|
||||
|
Utah Housing Corporation bonds
|
20,000
|
|
—
|
|
(959
|
)
|
19,041
|
|
||||||||
|
Total
|
$
|
247,607
|
|
$
|
650
|
|
$
|
(4,169
|
)
|
$
|
244,088
|
|
||||
F-28
SLM CORPORATION
NOTES TO CONSOLIDATED FINANCIAL STATEMENTS (Continued)
(Dollars in thousands, unless otherwise noted)
|
4.
|
Investments (Continued)
|
|
The following table summarizes the amount of gross unrealized losses for our mortgage-backed securities and Utah Housing Corporation bonds and the estimated fair value for securities having gross unrealized loss positions, categorized by length of time the securities have been in an unrealized loss position:
|
Less than 12 months
|
12 months or more
|
Total
|
||||||||||||||||||||||
|
Gross Unrealized Losses
|
Estimated Fair Value
|
Gross Unrealized Losses
|
Estimated Fair Value
|
Gross Unrealized Losses
|
Estimated Fair Value
|
|||||||||||||||||||
|
As of December 31, 2018:
|
||||||||||||||||||||||||
|
Mortgage-backed securities
|
$
|
(228
|
)
|
$
|
16,948
|
|
$
|
(5,289
|
)
|
$
|
125,537
|
|
$
|
(5,517
|
)
|
$
|
142,485
|
|
||||||
|
Utah Housing Corporation bonds
|
—
|
|
—
|
|
(741
|
)
|
16,647
|
|
(741
|
)
|
16,647
|
|
||||||||||||
|
Total
|
$
|
(228
|
)
|
$
|
16,948
|
|
$
|
(6,030
|
)
|
$
|
142,184
|
|
$
|
(6,258
|
)
|
$
|
159,132
|
|
||||||
|
As of December 31, 2017:
|
||||||||||||||||||||||||
|
Mortgage-backed securities
|
$
|
(772
|
)
|
$
|
77,356
|
|
$
|
(2,438
|
)
|
$
|
110,500
|
|
$
|
(3,210
|
)
|
$
|
187,856
|
|
||||||
|
Utah Housing Corporation bonds
|
(77
|
)
|
4,923
|
|
(882
|
)
|
14,118
|
|
(959
|
)
|
19,041
|
|
||||||||||||
|
Total
|
$
|
(849
|
)
|
$
|
82,279
|
|
$
|
(3,320
|
)
|
$
|
124,618
|
|
$
|
(4,169
|
)
|
$
|
206,897
|
|
||||||
Our investment portfolio is comprised primarily of mortgage-backed securities issued by Ginnie Mae, Fannie Mae and Freddie Mac, with amortized costs of
$64
million, $
46
million, and $
50
million, respectively, at
December 31, 2018
. We own these securities to meet our requirements under the Community Reinvestment Act. In the second quarter of 2018, we elected to sell
nine
securities totaling
$41 million
to better align the portfolio with the Community Reinvestment Act requirements, and we recognized a
$2 million
loss upon the sale of those securities. As of
December 31, 2018
, there were
74
of
86
separate mortgage-backed securities with unrealized losses in our investment portfolio, and
34
of the
74
securities in a net loss position were issued under Ginnie Mae programs that carry a full faith and credit guarantee from the U.S. Government. The remaining securities in a net loss position carry a principal and interest guarantee by Fannie Mae or Freddie Mac, respectively. We have the intent and ability to hold these bonds for a period of time sufficient for the market price to recover to at least the adjusted amortized cost of the security. As of
December 31, 2017
, there were
62
of
92
separate mortgage-backed securities with unrealized losses in our investment portfolio, and
31
of the
62
securities in a net loss position were issued under Ginnie Mae programs that carry a full faith and credit guarantee from the U.S. Government. The remainder carried a principal and interest guarantee by Fannie Mae or Freddie Mac, respectively.
We also invest in Utah Housing Corporation bonds for the purpose of complying with the Community Reinvestment Act. These bonds are Aa3 rated by Moody’s Investors Service. The amortized cost of the investment on the consolidated balance sheet at December 31, 2018 and December 31, 2017 was
$22
million and
$20
million, respectively. We have the intent and ability to hold these bonds for a period of time sufficient for the market price to recover to at least the adjusted amortized cost of the security.
F-29
SLM CORPORATION
NOTES TO CONSOLIDATED FINANCIAL STATEMENTS (Continued)
(Dollars in thousands, unless otherwise noted)
|
4.
|
Investments (Continued)
|
|
As of
December 31, 2018
, the amortized cost and fair value of securities, by contractual maturities, are summarized below. Contractual maturities versus actual maturities may differ due to the effect of prepayments.
|
Year of Maturity
|
Amortized Cost
|
Estimated Fair Value
|
||||||
|
2038
|
$
|
265
|
|
$
|
279
|
|
||
|
2039
|
2,963
|
|
3,060
|
|
||||
|
2042
|
8,689
|
|
8,156
|
|
||||
|
2043
|
14,192
|
|
13,779
|
|
||||
|
2044
|
22,132
|
|
21,556
|
|
||||
|
2045
|
23,918
|
|
23,005
|
|
||||
|
2046
|
37,939
|
|
36,290
|
|
||||
|
2047
|
56,376
|
|
54,216
|
|
||||
|
2048
|
15,851
|
|
15,904
|
|
||||
|
Total
|
$
|
182,325
|
|
$
|
176,245
|
|
||
The mortgage-backed securities have been pledged to the FRB as collateral against any advances and accrued interest under the Primary Credit lending program sponsored by the FRB. We had
$147
million and $
218
million par value of mortgage-backed securities pledged to this borrowing facility at
December 31, 2018
and
2017
, respectively, as discussed further in Note 9, “Borrowings.”
F-30
SLM CORPORATION
NOTES TO CONSOLIDATED FINANCIAL STATEMENTS (Continued)
(Dollars in thousands, unless otherwise noted)
5. Loans Held for Investment
Loans Held for Investment consist of Private Education Loans, FFELP Loans and Personal Loans.
Our Private Education Loans are made largely to bridge the gap between the cost of higher education and the amount funded through financial aid, government loans and customers’ resources. Private Education Loans bear the full credit risk of the customer. We manage this risk through risk-performance underwriting strategies and qualified cosigners. Private Education Loans may be fixed rate or may carry a variable rate indexed to LIBOR. As of
December 31, 2018
and 2017,
67 percent
and
77 percent
, respectively, of our Private Education Loans were indexed to LIBOR. We provide incentives for customers to include a cosigner on the loan, and the vast majority of loans in our portfolio are cosigned. We also encourage customers to make payments while in school.
In connection with the Spin-Off, we retained the right to require Navient to purchase delinquent loans (at fair value) when the borrower has a lending relationship with both us and Navient. In the second quarter of 2018, we sold our remaining
$43 million
portfolio of Split Loans (both current and non-current loans) to Navient and recognized a net gain of
$2 million
. See Note 15, “Arrangements with Navient Corporation,” for further discussion regarding loan purchase agreements.
FFELP Loans are insured as to their principal and accrued interest in the event of default, subject to a risk-sharing level based on the date of loan disbursement. These insurance obligations are supported by contractual rights against the United States. For loans disbursed on or after July 1, 2006, we receive
97 percent
reimbursement on all qualifying claims. For loans disbursed after October 1, 1993, and before July 1, 2006, we receive
98 percent
reimbursement. For loans disbursed prior to October 1, 1993, we receive
100 percent
reimbursement.
In 2016, we began to acquire Personal Loans from a marketplace lender, but discontinued those purchases in July 2018. In 2018, we began to originate and service Personal Loans.
F-31
SLM CORPORATION
NOTES TO CONSOLIDATED FINANCIAL STATEMENTS (Continued)
(Dollars in thousands, unless otherwise noted)
|
5.
|
Loans Held for Investment (Continued)
|
|
Loans held for investment are summarized as follows:
|
December 31,
|
||||||||
|
2018
|
2017
|
|||||||
|
Private Education Loans:
|
||||||||
|
Fixed-rate
|
$
|
6,759,019
|
|
$
|
4,000,447
|
|
||
|
Variable-rate
|
13,745,446
|
|
13,431,720
|
|
||||
|
Total Private Education Loans, gross
|
20,504,465
|
|
17,432,167
|
|
||||
|
Deferred origination costs and unamortized premium/ (discount)
|
68,321
|
|
56,378
|
|
||||
|
Allowance for loan losses
|
(277,943
|
)
|
(243,715
|
)
|
||||
|
Total Private Education Loans, net
|
20,294,843
|
|
17,244,830
|
|
||||
|
FFELP Loans
|
846,487
|
|
927,660
|
|
||||
|
Deferred origination costs and unamortized premium/ (discount)
|
2,379
|
|
2,631
|
|
||||
|
Allowance for loan losses
|
(977
|
)
|
(1,132
|
)
|
||||
|
Total FFELP Loans, net
|
847,889
|
|
929,159
|
|
||||
|
Personal Loans (fixed-rate)
|
1,190,091
|
|
400,280
|
|
||||
|
Deferred origination costs and unamortized premium/ (discount)
|
297
|
|
—
|
|
||||
|
Allowance for loan losses
|
(62,201
|
)
|
(6,628
|
)
|
||||
|
Total Personal Loans, net
|
1,128,187
|
|
393,652
|
|
||||
|
Loans held for investment, net
|
$
|
22,270,919
|
|
$
|
18,567,641
|
|
||
The estimated weighted average life of education loans in our portfolio was approximately
5.4 years
and
5.5
years at
December 31, 2018
and
2017
, respectively.
F-32
SLM CORPORATION
NOTES TO CONSOLIDATED FINANCIAL STATEMENTS (Continued)
(Dollars in thousands, unless otherwise noted)
|
5.
|
Loans Held for Investment (Continued)
|
|
The average balance and the respective weighted average interest rates of loans in our portfolio are summarized as follows:
|
Years Ended December 31,
|
|||||||||||||||||||||
|
2018
|
2017
|
2016
|
|||||||||||||||||||
|
Average Balance
|
Weighted Average Interest Rate
|
Average Balance
|
Weighted Average Interest Rate
|
Average Balance
|
Weighted Average Interest Rate
|
||||||||||||||||
|
Private Education Loans
|
$
|
19,282,500
|
|
9.10
|
%
|
$
|
16,176,351
|
|
8.43
|
%
|
$
|
12,747,756
|
|
8.02
|
%
|
||||||
|
FFELP Loans
|
888,301
|
|
4.57
|
|
970,738
|
|
3.91
|
|
1,063,325
|
|
3.53
|
|
|||||||||
|
Personal Loans
|
900,152
|
|
11.08
|
|
112,644
|
|
9.90
|
|
710
|
|
8.53
|
|
|||||||||
|
Total portfolio
|
$
|
21,070,953
|
|
$
|
17,259,733
|
|
$
|
13,811,791
|
|
||||||||||||
Certain Collection Tools — Private Education Loans
Forbearance involves granting the customer a temporary cessation of payments (or temporary acceptance of smaller than scheduled payments) for a specified period of time. Using forbearance extends the original term of the loan. Forbearance does not grant any reduction in the total repayment obligation (principal or interest). While in forbearance status, interest continues to accrue and is capitalized to principal when the loan re-enters repayment status. Our forbearance policies include limits on the number of forbearance months granted consecutively and the total number of forbearance months granted over the life of the loan. We grant forbearance in our servicing centers if a borrower who is current requests it for increments of three months at a time, for up to twelve months. Forbearance as a collection tool is used most effectively when applied based on a customer’s unique situation, including historical information and judgments. We leverage updated customer information and other decision support tools to best determine who will be granted forbearance based on our expectations as to a customer’s ability and willingness to repay their obligation. This strategy is aimed at mitigating the overall risk of the portfolio as well as encouraging cash resolution of delinquent loans. In some instances, we require good-faith payments before granting forbearance. Exceptions to forbearance policies are permitted when such exceptions are judged to increase the likelihood of collection of the loan.
Forbearance may be granted to customers who are exiting their grace period to provide additional time to obtain employment and income to support their obligations, or to current customers who are faced with a hardship and request forbearance time to provide temporary payment relief. In these circumstances, a customer’s loan is placed into a forbearance status in limited monthly increments and is reflected in the forbearance status at month-end during this time. At the end of the granted forbearance period, the customer will enter repayment status as current and is expected to begin making scheduled monthly payments on a go-forward basis.
Forbearance may also be granted to customers who are delinquent in their payments. If specific requirements are met, the forbearance can cure the delinquency and the customer is returned to a current repayment status. In more limited instances, delinquent customers will also be granted additional forbearance time.
We also have an interest rate reduction program to assist customers in repaying their Private Education Loans through reduced payments, while continuing to reduce their outstanding principal balance. This program is offered in situations where the potential for principal recovery, through an interest rate reduction that results in a lower monthly payment amount, is more suitable than other alternatives currently available. As part of demonstrating the ability and willingness to pay, the customer must make
three
consecutive monthly payments at the reduced rate to qualify for the program. Once the customer has made the
F-33
SLM CORPORATION
NOTES TO CONSOLIDATED FINANCIAL STATEMENTS (Continued)
(Dollars in thousands, unless otherwise noted)
|
5.
|
Loans Held for Investment (Continued)
|
|
initial
three
payments, the loan’s status is returned to current and the interest rate is reduced (currently, to
2.0 percent
) for a
twenty-four month
period and, in the vast majority of cases, the final maturity date of the loan is permanently extended.
The period of delinquency for loans is based on the number of days scheduled payments are contractually past due. As of
December 31, 2018
and
2017
, we had
$42.9
million and
$66.9
million, respectively, of FFELP Loans and
$50.8
million and
$37.6
million, respectively, of Private Education Loans held for investment which were more than
90
days delinquent that continue to accrue interest. At
December 31, 2018
and
2017
, we had
no
loans in nonaccrual status.
Borrower-in-Custody Arrangements
We maintain Borrower-in-Custody arrangements with the FRB. Under these arrangements, we can pledge FFELP consolidation loans or Private Education Loans to the FRB to secure any advances and accrued interest generated under the Primary Credit program at the FRB. As of
December 31, 2018
and
2017
, we had
$3.4
billion and
$2.7
billion, respectively, of Private Education Loans pledged to this borrowing facility, as discussed further in Note 9, “Borrowings.” We did not have any FFELP consolidation loans pledged at December 31, 2018 or 2017.
Loans Held for Investment by Region
At
December 31, 2018
,
39.9
percent of total education loans were concentrated in the following states:
|
2018
|
|||
|
New York
|
10.3
|
%
|
|
|
California
|
9.3
|
|
|
|
Pennsylvania
|
8.5
|
|
|
|
New Jersey
|
6.8
|
|
|
|
Illinois
|
5.0
|
|
|
|
39.9
|
%
|
||
At December 31,
2017
,
40.4
percent of total education loans were concentrated in the following states:
|
2017
|
|||
|
New York
|
10.5
|
%
|
|
|
California
|
9.3
|
|
|
|
Pennsylvania
|
8.5
|
|
|
|
New Jersey
|
6.9
|
|
|
|
Illinois
|
5.2
|
|
|
|
40.4
|
%
|
||
No other state had a concentration of total education loans in excess of
5
percent of the aggregate outstanding education loans held for investment.
F-34
SLM CORPORATION
NOTES TO CONSOLIDATED FINANCIAL STATEMENTS (Continued)
(Dollars in thousands, unless otherwise noted)
6. Allowance for Loan Losses
Our provision for credit losses represents the periodic expense of maintaining an allowance sufficient to absorb incurred probable losses in the held-for-investment loan portfolios. The evaluation of the allowance for loan losses is inherently subjective, as it requires material estimates that may be susceptible to significant changes. We believe the allowance for loan losses is appropriate to cover probable losses incurred in the loan portfolios. See Note 2, “Significant Accounting Policies — Allowance for Loan Losses — Allowance for Private Education Loan Losses, — Allowance for Personal Loans, and — Allowance for FFELP Loan Losses” for a more detailed discussion.
Allowance for Loan Losses Metrics
|
|
Allowance for Loan Losses
|
|||||||||||||||
|
|
Year Ended December 31, 2018
|
|||||||||||||||
|
FFELP
Loans
|
Private Education
Loans
|
Personal
Loans
|
Total
|
|||||||||||||
|
Allowance for Loan Losses
|
||||||||||||||||
|
Beginning balance
|
$
|
1,132
|
|
$
|
243,715
|
|
$
|
6,628
|
|
$
|
251,475
|
|
||||
|
Total provision
|
980
|
|
169,287
|
|
74,317
|
|
244,584
|
|
||||||||
|
Net charge-offs:
|
||||||||||||||||
|
Charge-offs
|
(1,135
|
)
|
(154,701
|
)
|
(19,690
|
)
|
(175,526
|
)
|
||||||||
|
Recoveries
|
—
|
|
20,858
|
|
946
|
|
21,804
|
|
||||||||
|
Net charge-offs
|
(1,135
|
)
|
(133,843
|
)
|
(18,744
|
)
|
(153,722
|
)
|
||||||||
|
Loan sales
(1)
|
—
|
|
(1,216
|
)
|
—
|
|
(1,216
|
)
|
||||||||
|
Ending Balance
|
$
|
977
|
|
$
|
277,943
|
|
$
|
62,201
|
|
$
|
341,121
|
|
||||
|
Allowance:
|
||||||||||||||||
|
Ending balance: individually evaluated for impairment
|
$
|
—
|
|
$
|
120,110
|
|
$
|
—
|
|
$
|
120,110
|
|
||||
|
Ending balance: collectively evaluated for impairment
|
$
|
977
|
|
$
|
157,833
|
|
$
|
62,201
|
|
$
|
221,011
|
|
||||
|
Loans:
|
||||||||||||||||
|
Ending balance: individually evaluated for impairment
|
$
|
—
|
|
$
|
1,257,856
|
|
$
|
—
|
|
$
|
1,257,856
|
|
||||
|
Ending balance: collectively evaluated for impairment
|
$
|
846,487
|
|
$
|
19,246,609
|
|
$
|
1,190,091
|
|
$
|
21,283,187
|
|
||||
|
Net charge-offs as a percentage of average loans in repayment
(2)
|
0.16
|
%
|
1.01
|
%
|
2.11
|
%
|
||||||||||
|
Allowance as a percentage of the ending total loan balance
|
0.12
|
%
|
1.36
|
%
|
5.23
|
%
|
||||||||||
|
Allowance as a percentage of the ending loans in repayment
(2)
|
0.15
|
%
|
1.90
|
%
|
5.23
|
%
|
||||||||||
|
Allowance coverage of net charge-offs
|
0.86
|
|
2.08
|
|
3.32
|
|
||||||||||
|
Ending total loans, gross
|
$
|
846,487
|
|
$
|
20,504,465
|
|
$
|
1,190,091
|
|
|||||||
|
Average loans in repayment
(2)
|
$
|
691,406
|
|
$
|
13,303,801
|
|
$
|
889,348
|
|
|||||||
|
Ending loans in repayment
(2)
|
$
|
665,807
|
|
$
|
14,666,856
|
|
$
|
1,190,091
|
|
|||||||
____________
(1)
Represents fair value adjustments on loans sold.
(2)
Loans in repayment include loans on which borrowers are making interest only or fixed payments, as well as loans that have entered full principal and interest repayment status after any applicable grace period.
F-35
SLM CORPORATION
NOTES TO CONSOLIDATED FINANCIAL STATEMENTS (Continued)
(Dollars in thousands, unless otherwise noted)
|
6.
|
Allowance for Loan Losses (Continued)
|
|
|
|
Allowance for Loan Losses
|
|||||||||||||||
|
|
Year Ended December 31, 2017
|
|||||||||||||||
|
FFELP
Loans
|
Private Education
Loans
|
Personal
Loans
|
Total
|
|||||||||||||
|
Allowance for Loan Losses
|
||||||||||||||||
|
Beginning balance
|
$
|
2,171
|
|
$
|
182,472
|
|
$
|
58
|
|
$
|
184,701
|
|
||||
|
Total provision
|
(85
|
)
|
178,542
|
|
7,138
|
|
185,595
|
|
||||||||
|
Net charge-offs:
|
||||||||||||||||
|
Charge-offs
|
(954
|
)
|
(130,063
|
)
|
(579
|
)
|
(131,596
|
)
|
||||||||
|
Recoveries
|
—
|
|
17,635
|
|
11
|
|
17,646
|
|
||||||||
|
Net charge-offs
|
(954
|
)
|
(112,428
|
)
|
(568
|
)
|
(113,950
|
)
|
||||||||
|
Loan sales
(1)
|
—
|
|
(4,871
|
)
|
—
|
|
(4,871
|
)
|
||||||||
|
Ending Balance
|
$
|
1,132
|
|
$
|
243,715
|
|
$
|
6,628
|
|
$
|
251,475
|
|
||||
|
Allowance:
|
||||||||||||||||
|
Ending balance: individually evaluated for impairment
|
$
|
—
|
|
$
|
94,682
|
|
$
|
—
|
|
$
|
94,682
|
|
||||
|
Ending balance: collectively evaluated for impairment
|
$
|
1,132
|
|
$
|
149,033
|
|
$
|
6,628
|
|
$
|
156,793
|
|
||||
|
Loans:
|
||||||||||||||||
|
Ending balance: individually evaluated for impairment
|
$
|
—
|
|
$
|
990,351
|
|
$
|
—
|
|
$
|
990,351
|
|
||||
|
Ending balance: collectively evaluated for impairment
|
$
|
927,660
|
|
$
|
16,441,816
|
|
$
|
400,280
|
|
$
|
17,769,756
|
|
||||
|
Net charge-offs as a percentage of average loans in repayment
(2)
|
0.13
|
%
|
1.03
|
%
|
0.47
|
%
|
||||||||||
|
Allowance as a percentage of the ending total loan balance
|
0.12
|
%
|
1.40
|
%
|
1.66
|
%
|
||||||||||
|
Allowance as a percentage of the ending loans in repayment
(2)
|
0.15
|
%
|
2.00
|
%
|
1.66
|
%
|
||||||||||
|
Allowance coverage of net charge-offs
|
1.19
|
|
2.17
|
|
11.67
|
|
||||||||||
|
Ending total loans, gross
|
$
|
927,660
|
|
$
|
17,432,167
|
|
$
|
400,280
|
|
|||||||
|
Average loans in repayment
(2)
|
$
|
745,039
|
|
$
|
10,881,058
|
|
$
|
119,606
|
|
|||||||
|
Ending loans in repayment
(2)
|
$
|
746,456
|
|
$
|
12,206,033
|
|
$
|
400,280
|
|
|||||||
____________
|
(1)
|
Represents fair value adjustments on loans sold.
|
|
(2)
|
Loans in repayment include loans on which borrowers are making interest only or fixed payments, as well as loans that have entered full principal and interest repayment status after any applicable grace period.
|
F-36
SLM CORPORATION
NOTES TO CONSOLIDATED FINANCIAL STATEMENTS (Continued)
(Dollars in thousands, unless otherwise noted)
|
6.
|
Allowance for Loan Losses (Continued)
|
|
|
|
Allowance for Loan Losses
|
|||||||||||||||
|
|
Year Ended December 31, 2016
|
|||||||||||||||
|
FFELP
Loans
|
Private Education
Loans
|
Personal
Loans
|
Total
|
|||||||||||||
|
Allowance for Loan Losses
|
||||||||||||||||
|
Beginning balance
|
$
|
3,691
|
|
$
|
108,816
|
|
$
|
—
|
|
$
|
112,507
|
|
||||
|
Total provision
|
(172
|
)
|
159,511
|
|
58
|
|
159,397
|
|
||||||||
|
Net charge-offs:
|
||||||||||||||||
|
Charge-offs
|
(1,348
|
)
|
(90,203
|
)
|
—
|
|
(91,551
|
)
|
||||||||
|
Recoveries
|
—
|
|
10,382
|
|
—
|
|
10,382
|
|
||||||||
|
Net charge-offs
|
(1,348
|
)
|
(79,821
|
)
|
—
|
|
(81,169
|
)
|
||||||||
|
Loan sales
(1)
|
—
|
|
(6,034
|
)
|
—
|
|
(6,034
|
)
|
||||||||
|
Ending Balance
|
$
|
2,171
|
|
$
|
182,472
|
|
$
|
58
|
|
$
|
184,701
|
|
||||
|
Allowance:
|
||||||||||||||||
|
Ending balance: individually evaluated for impairment
|
$
|
—
|
|
$
|
86,930
|
|
$
|
—
|
|
$
|
86,930
|
|
||||
|
Ending balance: collectively evaluated for impairment
|
$
|
2,171
|
|
$
|
95,542
|
|
$
|
58
|
|
$
|
97,771
|
|
||||
|
Loans:
|
||||||||||||||||
|
Ending balance: individually evaluated for impairment
|
$
|
—
|
|
$
|
612,606
|
|
$
|
—
|
|
$
|
612,606
|
|
||||
|
Ending balance: collectively evaluated for impairment
|
$
|
1,010,908
|
|
$
|
13,639,069
|
|
$
|
12,894
|
|
$
|
14,662,871
|
|
||||
|
Net charge-offs as a percentage of average loans in repayment
(2)
|
0.17
|
%
|
0.96
|
%
|
—
|
%
|
||||||||||
|
Allowance as a percentage of the ending total loan balance
|
0.21
|
%
|
1.28
|
%
|
—
|
%
|
||||||||||
|
Allowance as a percentage of the ending loans in repayment
(2)
|
0.28
|
%
|
1.88
|
%
|
—
|
%
|
||||||||||
|
Allowance coverage of net charge-offs
|
1.61
|
|
2.29
|
|
—
|
|
||||||||||
|
Ending total loans, gross
|
$
|
1,010,908
|
|
$
|
14,251,675
|
|
$
|
—
|
|
|||||||
|
Average loans in repayment
(2)
|
$
|
793,203
|
|
$
|
8,283,036
|
|
$
|
—
|
|
|||||||
|
Ending loans in repayment
(2)
|
$
|
786,332
|
|
$
|
9,709,758
|
|
$
|
—
|
|
|||||||
____________
|
(1)
|
Represents fair value adjustments on loans sold.
|
|
(2)
|
Loans in repayment include loans on which borrowers are making interest only or fixed payments, as well as loans that have entered full principal and interest repayment status after any applicable grace period.
|
F-37
SLM CORPORATION
NOTES TO CONSOLIDATED FINANCIAL STATEMENTS (Continued)
(Dollars in thousands, unless otherwise noted)
|
6.
|
Allowance for Loan Losses (Continued)
|
|
Troubled Debt Restructurings
All of our loans are collectively assessed for impairment, except for loans classified as TDRs (where we conduct individual assessments of impairment). At December 31, 2018 and 2017,
6.4 percent
and
4.9 percent
, respectively, of our loans then currently in full principal and interest repayment status were subject to interest rate reductions made under our rate modification program. Once a loan qualifies for TDR status, it remains a TDR for allowance purposes for the remainder of its life. As of December 31, 2018 and 2017, approximately
57 percent
and
66 percent
, respectively, of TDRs were classified as such due to their forbearance status. See Note 2, “Significant Accounting Policies — Allowance for Loan Losses” for a more detailed discussion.
Within the Private Education Loan portfolio, loans greater than
90 days
past due are considered to be nonperforming. FFELP Loans are at least
97 percent
guaranteed as to their principal and accrued interest by the federal government in the event of default and, therefore, we do not deem FFELP Loans as nonperforming from a credit risk standpoint at any point in their life cycle prior to claim payment, and we continue to accrue interest through the date of claim.
At December 31,
2018
and
2017
, all of our TDR loans had a related allowance recorded. The following table provides the recorded investment, unpaid principal balance and related allowance for our TDR loans.
|
Recorded Investment
|
Unpaid Principal Balance
|
Allowance
|
||||||||||
|
December 31, 2018
|
||||||||||||
|
TDR Loans
|
$
|
1,280,713
|
|
$
|
1,257,856
|
|
$
|
120,110
|
|
|||
|
December 31, 2017
|
||||||||||||
|
TDR Loans
|
$
|
1,007,141
|
|
$
|
990,351
|
|
$
|
94,682
|
|
|||
The following table provides the average recorded investment and interest income recognized for our TDR loans.
|
Years Ended December 31,
|
||||||||||||||||||||||||
|
2018
|
2017
|
2016
|
||||||||||||||||||||||
|
Average Recorded Investment
|
Interest Income Recognized
|
Average Recorded Investment
|
Interest Income Recognized
|
Average Recorded Investment
|
Interest Income Recognized
|
|||||||||||||||||||
|
TDR Loans
|
$
|
1,141,993
|
|
$
|
77,670
|
|
$
|
822,145
|
|
$
|
61,119
|
|
$
|
422,527
|
|
$
|
30,700
|
|
||||||
F-38
SLM CORPORATION
NOTES TO CONSOLIDATED FINANCIAL STATEMENTS (Continued)
(Dollars in thousands, unless otherwise noted)
|
6.
|
Allowance for Loan Losses (Continued)
|
|
The following table provides information regarding the loan status and aging of TDR loans.
|
|
December 31,
|
December 31,
|
||||||||||||
|
|
2018
|
2017
|
||||||||||||
|
Balance
|
%
|
Balance
|
%
|
|||||||||||
|
TDR loans in in-school/grace/deferment
(1)
|
$
|
69,212
|
|
$
|
51,745
|
|
||||||||
|
TDR loans in forbearance
(2)
|
69,796
|
|
69,652
|
|
||||||||||
|
TDR loans in repayment
(3)
and percentage of each status:
|
||||||||||||||
|
Loans current
|
994,411
|
|
88.9
|
%
|
774,222
|
|
89.1
|
%
|
||||||
|
Loans delinquent 31-60 days
(4)
|
63,074
|
|
5.6
|
|
48,377
|
|
5.6
|
|
||||||
|
Loans delinquent 61-90 days
(4)
|
36,804
|
|
3.3
|
|
28,778
|
|
3.3
|
|
||||||
|
Loans delinquent greater than 90 days
(4)
|
24,559
|
|
2.2
|
|
17,577
|
|
2.0
|
|
||||||
|
Total TDR loans in repayment
|
1,118,848
|
|
100.0
|
%
|
868,954
|
|
100.0
|
%
|
||||||
|
Total TDR loans, gross
|
$
|
1,257,856
|
|
$
|
990,351
|
|
||||||||
_____
|
(1)
|
Deferment includes customers who have returned to school or are engaged in other permitted educational activities and are not yet required to make payments on the loans (e.g., residency periods for medical students or a grace period for bar exam preparation).
|
|
(2)
|
Loans for customers who have requested extension of grace period generally during employment transition or who have temporarily ceased making full payments due to hardship or other factors, consistent with established loan program servicing policies and procedures.
|
|
(3)
|
Loans in repayment include loans on which borrowers are making interest only or fixed payments, as well as loans that have entered full principal and interest repayment status after any applicable grace period.
|
|
(4)
|
The period of delinquency is based on the number of days scheduled payments are contractually past due.
|
F-39
SLM CORPORATION
NOTES TO CONSOLIDATED FINANCIAL STATEMENTS (Continued)
(Dollars in thousands, unless otherwise noted)
|
6.
|
Allowance for Loan Losses (Continued)
|
|
The following table provides the amount of modified loans (which includes forbearance and reductions in interest rates) that became TDRs in the periods presented. Additionally, for the periods presented, the table summarizes charge-offs occurring in the TDR portfolio, as well as TDRs for which a payment default occurred in the relevant period presented and within 12 months of the loan first being designated as a TDR. We define payment default as
60 days
past due for this disclosure.
|
Years Ended December 31,
|
||||||||||||||||||||||||||||||||||||
|
2018
|
2017
|
2016
|
||||||||||||||||||||||||||||||||||
|
Modified Loans
(1)
|
Charge-offs
|
Payment-Default
|
Modified Loans
(1)
|
Charge-offs
|
Payment-Default
|
Modified Loans
(1)
|
Charge-offs
|
Payment-Default
|
||||||||||||||||||||||||||||
|
TDR Loans
|
$
|
394,639
|
|
$
|
52,823
|
|
$
|
90,231
|
|
$
|
498,812
|
|
$
|
48,469
|
|
$
|
92,532
|
|
$
|
398,324
|
|
$
|
24,628
|
|
$
|
64,811
|
|
|||||||||
_______
(1) Represents the principal balance of loans that have been modified during the period and resulted in a TDR.
F-40
SLM CORPORATION
NOTES TO CONSOLIDATED FINANCIAL STATEMENTS (Continued)
(Dollars in thousands, unless otherwise noted)
|
6.
|
Allowance for Loan Losses (Continued)
|
|
Private Education Loan Key Credit Quality Indicators
FFELP Loans are at least
97 percent
insured and guaranteed as to their principal and accrued interest in the event of default; therefore, there are no key credit quality indicators associated with FFELP Loans.
For Private Education Loans, the key credit quality indicators are FICO scores, the existence of a cosigner, the loan status and loan seasoning. The FICO scores are assessed at original approval and periodically refreshed/updated through the loan’s term. The following table highlights the gross principal balance of our Private Education Loan portfolio stratified by key credit quality indicators.
|
|
December 31, 2018
|
December 31, 2017
|
||||||||||||
|
Credit Quality Indicators:
|
Balance
(1)
|
% of Balance
|
Balance
(1)
|
% of Balance
|
||||||||||
|
Cosigners:
|
||||||||||||||
|
With cosigner
|
$
|
18,378,398
|
|
90
|
%
|
$
|
15,658,539
|
|
90
|
%
|
||||
|
Without cosigner
|
2,126,067
|
|
10
|
|
1,773,628
|
|
10
|
|
||||||
|
Total
|
$
|
20,504,465
|
|
100
|
%
|
$
|
17,432,167
|
|
100
|
%
|
||||
|
FICO at Original Approval
(2)
:
|
||||||||||||||
|
Less than 670
|
$
|
1,409,789
|
|
7
|
%
|
$
|
1,153,591
|
|
6
|
%
|
||||
|
670-699
|
3,106,983
|
|
15
|
|
2,596,959
|
|
15
|
|
||||||
|
700-749
|
6,759,721
|
|
33
|
|
5,714,554
|
|
33
|
|
||||||
|
Greater than or equal to 750
|
9,227,972
|
|
45
|
|
7,967,063
|
|
46
|
|
||||||
|
Total
|
$
|
20,504,465
|
|
100
|
%
|
$
|
17,432,167
|
|
100
|
%
|
||||
|
FICO-Refreshed
(2)(3)
:
|
||||||||||||||
|
Less than 670
|
$
|
2,416,979
|
|
12
|
%
|
$
|
1,964,962
|
|
11
|
%
|
||||
|
670-699
|
2,504,467
|
|
12
|
|
2,138,379
|
|
12
|
|
||||||
|
700-749
|
6,144,489
|
|
30
|
|
5,220,245
|
|
30
|
|
||||||
|
Greater than or equal to 750
|
9,438,530
|
|
46
|
|
8,108,581
|
|
47
|
|
||||||
|
Total
|
$
|
20,504,465
|
|
100
|
%
|
$
|
17,432,167
|
|
100
|
%
|
||||
|
Seasoning
(4)
:
|
||||||||||||||
|
1-12 payments
|
$
|
4,969,334
|
|
24
|
%
|
$
|
4,256,592
|
|
24
|
%
|
||||
|
13-24 payments
|
3,481,235
|
|
17
|
|
3,229,465
|
|
19
|
|
||||||
|
25-36 payments
|
2,741,954
|
|
13
|
|
2,429,238
|
|
14
|
|
||||||
|
37-48 payments
|
1,990,049
|
|
10
|
|
1,502,327
|
|
9
|
|
||||||
|
More than 48 payments
|
2,061,448
|
|
10
|
|
1,256,813
|
|
7
|
|
||||||
|
Not yet in repayment
|
5,260,445
|
|
26
|
|
4,757,732
|
|
27
|
|
||||||
|
Total
|
$
|
20,504,465
|
|
100
|
%
|
$
|
17,432,167
|
|
100
|
%
|
||||
|
(1)
|
Balance represents gross Private Education Loans.
|
|
(2)
|
Represents the higher credit score of the cosigner or the borrower.
|
|
(3)
|
Represents the FICO score updated as of the fourth-quarter 2018.
|
|
(4)
|
Number of months in active repayment (whether interest only payment, fixed payment, or full principal and interest payment status) for which a scheduled payment was due.
|
F-41
SLM CORPORATION
NOTES TO CONSOLIDATED FINANCIAL STATEMENTS (Continued)
(Dollars in thousands, unless otherwise noted)
|
6.
|
Allowance for Loan Losses (Continued)
|
|
Personal Loan Key Credit Quality Indicators
For Personal Loans, the key credit quality indicators are FICO scores and loan seasoning. The FICO scores are assessed at original approval and periodically refreshed/updated through the loan’s term. The following table highlights the gross principal balance of our Personal Loan portfolio stratified by key credit quality indicators.
|
Personal Loans
|
||||||||||||||
|
|
Credit Quality Indicators
|
|||||||||||||
|
|
December 31, 2018
|
December 31, 2017
|
||||||||||||
|
Credit Quality Indicators:
|
Balance
(1)
|
% of Balance
|
Balance
(1)
|
% of Balance
|
||||||||||
|
FICO at Original Approval:
|
||||||||||||||
|
Less than 670
|
$
|
77,702
|
|
7
|
%
|
$
|
32,156
|
|
8
|
%
|
||||
|
670-699
|
339,053
|
|
28
|
|
114,731
|
|
29
|
|
||||||
|
700-749
|
554,700
|
|
47
|
|
182,025
|
|
45
|
|
||||||
|
Greater than or equal to 750
|
218,636
|
|
18
|
|
71,368
|
|
18
|
|
||||||
|
Total
|
$
|
1,190,091
|
|
100
|
%
|
$
|
400,280
|
|
100
|
%
|
||||
|
Seasoning
(2)
:
|
||||||||||||||
|
0-12 payments
|
$
|
1,008,758
|
|
85
|
%
|
$
|
400,280
|
|
100
|
%
|
||||
|
13-24 payments
|
181,333
|
|
15
|
|
—
|
|
—
|
|
||||||
|
25-36 payments
|
—
|
|
—
|
|
—
|
|
—
|
|
||||||
|
37-48 payments
|
—
|
|
—
|
|
—
|
|
—
|
|
||||||
|
More than 48 payments
|
—
|
|
—
|
|
—
|
|
—
|
|
||||||
|
Total
|
$
|
1,190,091
|
|
100
|
%
|
$
|
400,280
|
|
100
|
%
|
||||
___________
|
(1)
|
Balance represents gross Personal Loans.
|
|
(2)
|
Number of months in active repayment for which a scheduled payment was due.
|
F-42
SLM CORPORATION
NOTES TO CONSOLIDATED FINANCIAL STATEMENTS (Continued)
(Dollars in thousands, unless otherwise noted)
|
6.
|
Allowance for Loan Losses (Continued)
|
|
Private Education Loan Delinquencies
The following table provides information regarding the loan status of our Private Education Loans. Loans in repayment include loans on which borrowers are making interest only or fixed payments, as well as loans that have entered full principal and interest repayment status after any applicable grace period.
|
|
Private Education Loans
|
||||||||||||||||||||
|
|
December 31,
|
||||||||||||||||||||
|
|
2018
|
2017
|
2016
|
||||||||||||||||||
|
Balance
|
%
|
Balance
|
%
|
Balance
|
%
|
||||||||||||||||
|
Loans in-school/grace/deferment
(1)
|
$
|
5,260,445
|
|
$
|
4,757,732
|
|
$
|
4,189,955
|
|
||||||||||||
|
Loans in forbearance
(2)
|
577,164
|
|
468,402
|
|
351,962
|
|
|||||||||||||||
|
Loans in repayment and percentage of each status:
|
|||||||||||||||||||||
|
Loans current
|
14,289,705
|
|
97.4
|
%
|
11,911,128
|
|
97.6
|
%
|
9,509,394
|
|
97.9
|
%
|
|||||||||
|
Loans delinquent 31-60 days
(3)
|
231,216
|
|
1.6
|
|
179,002
|
|
1.5
|
|
124,773
|
|
1.3
|
|
|||||||||
|
Loans delinquent 61-90 days
(3)
|
95,105
|
|
0.7
|
|
78,292
|
|
0.6
|
|
51,423
|
|
0.5
|
|
|||||||||
|
Loans delinquent greater than 90 days
(3)
|
50,830
|
|
0.3
|
|
37,611
|
|
0.3
|
|
24,168
|
|
0.3
|
|
|||||||||
|
Total Private Education Loans in repayment
|
14,666,856
|
|
100.0
|
%
|
12,206,033
|
|
100.0
|
%
|
9,709,758
|
|
100.0
|
%
|
|||||||||
|
Total Private Education Loans, gross
|
20,504,465
|
|
17,432,167
|
|
14,251,675
|
|
|||||||||||||||
|
Private Education Loans deferred origination costs and unamortized premium/(discount)
|
68,321
|
|
56,378
|
|
44,206
|
|
|||||||||||||||
|
Total Private Education Loans
|
20,572,786
|
|
17,488,545
|
|
14,295,881
|
|
|||||||||||||||
|
Private Education Loans allowance for losses
|
(277,943
|
)
|
(243,715
|
)
|
(182,472
|
)
|
|||||||||||||||
|
Private Education Loans, net
|
$
|
20,294,843
|
|
$
|
17,244,830
|
|
$
|
14,113,409
|
|
||||||||||||
|
Percentage of Private Education Loans in repayment
|
71.5
|
%
|
70.0
|
%
|
68.1
|
%
|
|||||||||||||||
|
Delinquencies as a percentage of Private Education Loans in repayment
|
2.6
|
%
|
2.4
|
%
|
2.1
|
%
|
|||||||||||||||
|
Loans in forbearance as a percentage of Private Education Loans in repayment and forbearance
|
3.8
|
%
|
3.7
|
%
|
3.5
|
%
|
|||||||||||||||
|
(1)
|
Deferment includes customers who have returned to school or are engaged in other permitted educational activities and are not yet required to make payments on the loans (e.g., residency periods for medical students or a grace period for bar exam preparation).
|
|
(2)
|
Loans for customers who have requested extension of grace period generally during employment transition or who have temporarily ceased making full payments due to hardship or other factors, consistent with established loan program servicing policies and procedures.
|
|
(3)
|
The period of delinquency is based on the number of days scheduled payments are contractually past due.
|
F-43
SLM CORPORATION
NOTES TO CONSOLIDATED FINANCIAL STATEMENTS (Continued)
(Dollars in thousands, unless otherwise noted)
|
6.
|
Allowance for Loan Losses (Continued)
|
|
Personal Loan Delinquencies
The following table provides information regarding the loan status of our Personal Loans.
|
|
Personal Loans
|
|||||||||||||
|
December 31,
|
||||||||||||||
|
|
2018
|
2017
|
||||||||||||
|
Balance
|
%
|
Balance
|
%
|
|||||||||||
|
Loans in repayment and percentage of each status:
|
||||||||||||||
|
Loans current
|
$
|
1,172,776
|
|
98.5
|
%
|
$
|
398,988
|
|
99.7
|
%
|
||||
|
Loans delinquent 31-60 days
(1)
|
6,722
|
|
0.6
|
|
761
|
|
0.2
|
|
||||||
|
Loans delinquent 61-90 days
(1)
|
5,416
|
|
0.5
|
|
340
|
|
0.1
|
|
||||||
|
Loans delinquent greater than 90 days
(1)
|
5,177
|
|
0.4
|
|
191
|
|
—
|
|
||||||
|
Total Personal Loans in repayment
|
1,190,091
|
|
100.0
|
%
|
400,280
|
|
100.0
|
%
|
||||||
|
Total Personal Loans, gross
|
1,190,091
|
|
400,280
|
|
||||||||||
|
Personal Loans deferred origination costs and unamortized premium/(discount)
|
297
|
|
—
|
|
||||||||||
|
Total Personal Loans
|
1,190,388
|
|
400,280
|
|
||||||||||
|
Personal Loans allowance for losses
|
(62,201
|
)
|
(6,628
|
)
|
||||||||||
|
Personal Loans, net
|
$
|
1,128,187
|
|
$
|
393,652
|
|
||||||||
|
Delinquencies as a percentage of Personal Loans in repayment
|
1.5
|
%
|
0.3
|
%
|
||||||||||
_______
|
(1)
|
The period of delinquency is based on the number of days scheduled payments are contractually past due.
|
F-44
SLM CORPORATION
NOTES TO CONSOLIDATED FINANCIAL STATEMENTS (Continued)
(Dollars in thousands, unless otherwise noted)
|
6.
|
Allowance for Loan Losses (Continued)
|
|
Accrued Interest Receivable
The following table provides information regarding accrued interest receivable on our Private Education Loans. The table also discloses the amount of accrued interest on loans greater than
90 days
past due as compared to our allowance for uncollectible interest. The allowance for uncollectible interest exceeds the amount of accrued interest on our
90 days
past due portfolio for all periods presented.
|
|
Private Education Loans
|
|||||||||||
|
Accrued Interest Receivable
|
||||||||||||
|
Total Interest
Receivable
|
Greater Than
90 Days
Past Due
|
Allowance for
Uncollectible
Interest
|
||||||||||
|
December 31, 2018
|
$
|
1,168,823
|
|
$
|
1,920
|
|
$
|
6,322
|
|
|||
|
December 31, 2017
|
$
|
951,138
|
|
$
|
1,372
|
|
$
|
4,664
|
|
|||
F-45
SLM CORPORATION
NOTES TO CONSOLIDATED FINANCIAL STATEMENTS (Continued)
(Dollars in thousands, unless otherwise noted)
7. Premises and Equipment, net
The following is a summary of our premises and equipment.
|
December 31,
|
||||||||
|
2018
|
2017
|
|||||||
|
Land and land improvements
|
$
|
12,356
|
|
$
|
12,356
|
|
||
|
Buildings and leasehold improvements
|
71,919
|
|
61,409
|
|
||||
|
Furniture, fixtures and equipment
|
20,794
|
|
15,261
|
|
||||
|
Software
|
65,023
|
|
55,205
|
|
||||
|
Premises and equipment, gross
|
170,092
|
|
144,231
|
|
||||
|
Accumulated depreciation
|
(64,588
|
)
|
(54,483
|
)
|
||||
|
Premises and equipment, net
|
$
|
105,504
|
|
$
|
89,748
|
|
||
Depreciation expense for premises and equipment was
$14
million,
$11
million and
$10
million for the years ended December 31,
2018
,
2017
and
2016
, respectively.
8. Deposits
The following table summarizes total deposits at December 31,
2018
and
2017
.
|
December 31,
|
||||||||
|
2018
|
2017
|
|||||||
|
Deposits - interest bearing
|
$
|
18,942,082
|
|
$
|
15,504,330
|
|
||
|
Deposits - non-interest bearing
|
1,076
|
|
1,053
|
|
||||
|
Total deposits
|
$
|
18,943,158
|
|
$
|
15,505,383
|
|
||
Our total deposits of
$18.9 billion
were comprised of
$10.3 billion
in brokered deposits and
$8.6 billion
in retail and other deposits at December 31,
2018
, compared with total deposits of
$15.5 billion
, which were comprised of
$8.2 billion
in brokered deposits and
$7.3 billion
in retail and other deposits, at December 31,
2017
.
Interest bearing deposits as of December 31,
2018
and
2017
consisted of retail and brokered non-maturity savings deposits, retail and brokered non-maturity MMDAs and retail and brokered CDs. Interest bearing deposits include deposits from Educational 529 and Health Savings plans that diversify our funding sources and add deposits we consider to be core. These and other large omnibus accounts, aggregating the deposits of many individual depositors, represented $
5.9
billion of our deposit total as of December 31,
2018
, compared with
$5.5 billion
at December 31,
2017
.
Some of our deposit products are serviced by third-party providers. Placement fees associated with the brokered CDs are amortized into interest expense using the effective interest rate method. We recognized placement fee expense of
$13
million,
$9
million, and
$10
million in the years ended December 31,
2018
,
2017
and
2016
, respectively. Fees paid to third-party brokers related to these CDs were
$26
million,
$12
million, and
$4
million during the years ended December 31,
2018
,
2017
and
2016
, respectively.
F-46
SLM CORPORATION
NOTES TO CONSOLIDATED FINANCIAL STATEMENTS (Continued)
(Dollars in thousands, unless otherwise noted)
|
8.
|
Deposits (Continued)
|
|
Interest bearing deposits at December 31,
2018
and
2017
are summarized as follows:
|
|
December 31, 2018
|
December 31, 2017
|
||||||||||||
|
Amount
|
Year-End Weighted
Average Stated Rate
(1)
|
Amount
|
Year-End Weighted
Average Stated Rate
(1)
|
|||||||||||
|
Money market
|
$
|
8,687,766
|
|
2.46
|
%
|
$
|
7,731,966
|
|
1.80
|
%
|
||||
|
Savings
|
702,342
|
|
2.00
|
|
738,243
|
|
1.10
|
|
||||||
|
Certificates of deposit
|
9,551,974
|
|
2.74
|
|
7,034,121
|
|
1.93
|
|
||||||
|
Deposits - interest bearing
|
$
|
18,942,082
|
|
|
|
$
|
15,504,330
|
|
||||||
___
(1)
Includes the effect of interest rate swaps in effective hedge relationships.
Certificates of deposit remaining maturities are summarized as follows:
|
|
December 31,
|
|||||||
|
2018
|
2017
|
|||||||
|
One year or less
|
$
|
4,098,520
|
|
$
|
3,716,183
|
|
||
|
After one year to two years
|
2,045,861
|
|
1,550,130
|
|
||||
|
After two years to three years
|
1,479,292
|
|
806,488
|
|
||||
|
After three years to four years
|
494,654
|
|
447,592
|
|
||||
|
After four years to five years
|
1,274,198
|
|
445,884
|
|
||||
|
After five years
|
159,449
|
|
67,844
|
|
||||
|
Total
|
$
|
9,551,974
|
|
$
|
7,034,121
|
|
||
As of December 31,
2018
and
2017
, there were
$523
million and
$396
million, respectively, of deposits exceeding FDIC insurance limits. Accrued interest on deposits was
$53
million and
$28
million at December 31,
2018
and
2017
, respectively.
F-47
SLM CORPORATION
NOTES TO CONSOLIDATED FINANCIAL STATEMENTS (Continued)
(Dollars in thousands, unless otherwise noted)
9. Borrowings
Outstanding borrowings consist of unsecured debt and secured borrowings issued through our term ABS program and our Secured Borrowing Facility. The following table summarizes our secured borrowings at December 31,
2018
and 2017.
|
December 31, 2018
|
December 31, 2017
|
|||||||||||||||||||||||
|
Short-Term
|
Long-Term
|
Total
|
Short-Term
|
Long-Term
|
Total
|
|||||||||||||||||||
|
Unsecured borrowings:
|
||||||||||||||||||||||||
|
Unsecured debt (fixed)
|
$
|
—
|
|
$
|
197,348
|
|
$
|
197,348
|
|
$
|
—
|
|
$
|
196,539
|
|
$
|
196,539
|
|
||||||
|
Total unsecured borrowings
|
—
|
|
197,348
|
|
197,348
|
|
—
|
|
196,539
|
|
196,539
|
|
||||||||||||
|
Secured borrowings:
|
||||||||||||||||||||||||
|
Private Education Loan term securitizations:
|
||||||||||||||||||||||||
|
Fixed-rate
|
—
|
|
2,284,347
|
|
2,284,347
|
|
—
|
|
1,565,760
|
|
1,565,760
|
|
||||||||||||
|
Variable-rate
|
—
|
|
1,802,609
|
|
1,802,609
|
|
—
|
|
1,512,971
|
|
1,512,971
|
|
||||||||||||
|
Total Private Education Loan term securitizations
|
—
|
|
4,086,956
|
|
4,086,956
|
|
—
|
|
3,078,731
|
|
3,078,731
|
|
||||||||||||
|
Secured Borrowing Facility
|
—
|
|
—
|
|
—
|
|
—
|
|
—
|
|
—
|
|
||||||||||||
|
Total secured borrowings
|
—
|
|
4,086,956
|
|
4,086,956
|
|
—
|
|
3,078,731
|
|
3,078,731
|
|
||||||||||||
|
Total
|
$
|
—
|
|
$
|
4,284,304
|
|
$
|
4,284,304
|
|
$
|
—
|
|
$
|
3,275,270
|
|
$
|
3,275,270
|
|
||||||
Short-term Borrowings
Secured Borrowing Facility
On February 21, 2018 and February 20, 2019, we amended and extended the maturity of our $
750 million
Secured Borrowing Facility. We hold
100 percent
of the residual interest in the Secured Borrowing Facility trust. Under the amended Secured Borrowing Facility, we incur financing costs of between
0.35 percent
and
0.45 percent
on unused borrowing capacity and a variable-yield rate plus
0.85 percent
on outstandings. The amended Secured Borrowing Facility extends the revolving period, during which we may borrow, repay and reborrow funds, until February 19, 2020. The scheduled amortization period, during which amounts outstanding under the Secured Borrowing Facility must be repaid, ends on February 19, 2021 (or earlier, if certain material adverse events occur). For additional information, see Note 23, “Subsequent Events.” At December 31,
2018
and December 31, 2017, there were
no
borrowings outstanding under the Secured Borrowing Facility.
Short-term borrowings have a remaining term to maturity of one year or less. The following table summarizes the outstanding short-term borrowings, the weighted average interest rates at the end of the period and the related average balance and weighted average interest rates during the period. The Secured Borrowing Facility’s contractual maturity is
two years
from the date of inception or renewal (
one
-year revolving period plus a
one
-year amortization period); however, we classify advances under our Secured Borrowing Facility as short-term borrowings because it is our intention to repay those advances within one year. Rates reflect stated interest of borrowings and related discounts and premiums.
F-48
SLM CORPORATION
NOTES TO CONSOLIDATED FINANCIAL STATEMENTS (Continued)
(Dollars in thousands, unless otherwise noted)
|
9.
|
Borrowings (Continued)
|
|
December 31, 2018
|
Year Ended
December 31, 2018
|
|||||||||||||
|
Ending Balance
|
Weighted Average
Interest Rate
|
Average Balance
|
Weighted Average
Interest Rate
|
|||||||||||
|
Short-term borrowings:
|
||||||||||||||
|
Secured Borrowing Facility
|
$
|
—
|
|
—
|
%
|
$
|
52,603
|
|
8.91
|
%
|
||||
|
Maximum outstanding at any month end
|
$
|
300,000
|
|
|||||||||||
|
December 31, 2017
|
Year Ended
December 31, 2017
|
|||||||||||||
|
Ending Balance
|
Weighted Average
Interest Rate
|
Average Balance
|
Weighted Average
Interest Rate
|
|||||||||||
|
Short-term borrowings:
|
||||||||||||||
|
Secured Borrowing Facility
|
$
|
—
|
|
—
|
%
|
$
|
81,370
|
|
6.09
|
%
|
||||
|
Maximum outstanding at any month end
|
$
|
300,000
|
|
|||||||||||
Long-term Borrowings
Unsecured Debt
On April 5, 2017, we issued an unsecured debt offering of
$200 million
of
5.125 percent
Senior Notes due April 5, 2022 at par. At December 31, 2018, the outstanding balance was
$197 million
.
Secured Financings
2018 Transactions
On March 21, 2018, we executed our
$670 million
SMB Private Education Loan Trust 2018-A term ABS transaction, which was accounted for as a secured financing. We sold
$670 million
of notes to third parties and retained a
100 percent
interest in the residual certificates issued in the securitization, raising approximately
$668 million
of gross proceeds. The Class A and Class B notes had a weighted average life of
4.43 years
and priced at a weighted average LIBOR equivalent cost of 1-month LIBOR plus
0.78 percent
. At December 31, 2018,
$647 million
of our Private Education Loans were encumbered because of this transaction.
On June 20, 2018, we executed our
$687 million
SMB Private Education Loan Trust 2018-B term ABS transaction, which was accounted for as a secured financing. We sold
$687 million
of notes to third parties and retained a
100 percent
interest in the residual certificates issued in the securitization, raising approximately
$683 million
of gross proceeds. The Class A and Class B notes had a weighted average life of
4.40 years
and priced at a weighted average LIBOR equivalent cost of 1-month LIBOR plus
0.76 percent
. At December 31, 2018,
$678 million
of our Private Education Loans were encumbered because of this transaction.
On September 19, 2018, we executed our
$544 million
SMB Private Education Loan Trust 2018-C term ABS transaction, which was accounted for as a secured financing. We sold
$544 million
of notes to third parties and retained a
100 percent
interest in the residual certificates issued in the securitization, raising approximately
$541 million
of gross proceeds. The Class
F-49
SLM CORPORATION
NOTES TO CONSOLIDATED FINANCIAL STATEMENTS (Continued)
(Dollars in thousands, unless otherwise noted)
|
9.
|
Borrowings (Continued)
|
A and Class B notes had a weighted average life of
4.32 years
and priced at a weighted average LIBOR equivalent cost of 1-month LIBOR plus
0.77 percent
. At December 31, 2018,
$544 million
of our Private Education Loans were encumbered because of this transaction.
2017 Transactions
On February 8, 2017, we executed our
$772 million
SMB Private Education Loan Trust 2017-A term ABS transaction, which was accounted for as a secured financing. We sold
$772 million
of notes to third parties and retained a
100 percent
interest in the residual certificates issued in the securitization, raising approximately
$768 million
of gross proceeds. The Class A and Class B notes had a weighted average life of
4.27
years and priced at a weighted average LIBOR equivalent cost of 1-month LIBOR plus
0.93 percent
. At December 31, 2018,
$631 million
of our Private Education Loans were encumbered as a result of this transaction.
On November 8, 2017, we executed our
$676 million
SMB Private Education Loan Trust 2017-B term ABS transaction, which was accounted for as a secured financing. We sold
$676 million
of notes to third parties and retained a
100 percent
interest in the residual certificates issued in the securitization, raising approximately
$674 million
of gross proceeds. The Class A and Class B notes had a weighted average life of
4.07
years and priced at a weighted average LIBOR equivalent cost of 1-month LIBOR plus
0.80 percent
. At December 31, 2018,
$617 million
of our Private Education Loans were encumbered as a result of this transaction.
Prior to 2017, we executed a total of
$2.4 billion
in ABS transactions that were accounted for as secured financings. At December 31, 2018,
$1.9 billion
of our Private Education Loans were encumbered as a result of these transactions.
The following table summarizes the outstanding long-term borrowings, the weighted average interest rates at the end of the period and the related average balance during the period. Rates reflect stated interest of borrowings and related discounts and premiums. The long-term borrowings amortize over time and mature serially from 2023 to 2040.
|
December 31, 2018
|
Year Ended
December 31, 2018 |
December 31, 2017
|
Year Ended
December 31, 2017
|
|||||||||||||||||||
|
Ending Balance
|
Weighted Average
Interest Rate |
Average Balance
|
Ending Balance
|
Weighted Average
Interest Rate
|
Average Balance
|
|||||||||||||||||
|
Floating-rate borrowings
|
$
|
1,802,609
|
|
3.26
|
%
|
$
|
1,720,540
|
|
$
|
1,512,970
|
|
2.32
|
%
|
$
|
1,422,856
|
|
||||||
|
Fixed-rate borrowings
|
2,481,695
|
|
3.28
|
|
2,172,993
|
|
1,762,300
|
|
3.04
|
|
1,420,737
|
|
||||||||||
|
Total long-term borrowings
|
$
|
4,284,304
|
|
3.27
|
%
|
$
|
3,893,533
|
|
$
|
3,275,270
|
|
2.71
|
%
|
$
|
2,843,593
|
|
||||||
F-50
SLM CORPORATION
NOTES TO CONSOLIDATED FINANCIAL STATEMENTS (Continued)
(Dollars in thousands, unless otherwise noted)
|
9.
|
Borrowings (Continued)
|
As of
December 31, 2018
, the stated maturity and maturity to call date of our brokered deposits and borrowings are summarized below.
|
December 31, 2018
|
|||||||||||||||||||||||||||||||
|
Stated Maturity
(1)
|
Maturity to Call Date
(2)
|
||||||||||||||||||||||||||||||
|
Brokered Deposits
|
Unsecured Debt
|
Secured Borrowings
|
Total
|
Brokered Deposits
|
Unsecured Debt
|
Secured Borrowings
|
Total
|
||||||||||||||||||||||||
|
Year of Maturity
|
|||||||||||||||||||||||||||||||
|
2019
|
$
|
2,990,740
|
|
$
|
—
|
|
$
|
586,536
|
|
$
|
3,577,276
|
|
$
|
2,990,740
|
|
$
|
—
|
|
$
|
586,536
|
|
$
|
3,577,276
|
|
|||||||
|
2020
|
1,706,761
|
|
—
|
|
500,618
|
|
2,207,379
|
|
1,706,761
|
|
—
|
|
500,618
|
|
2,207,379
|
|
|||||||||||||||
|
2021
|
1,381,842
|
|
—
|
|
459,920
|
|
1,841,762
|
|
1,381,842
|
|
—
|
|
459,920
|
|
1,841,762
|
|
|||||||||||||||
|
2022
|
465,809
|
|
200,000
|
|
459,720
|
|
1,125,529
|
|
465,809
|
|
200,000
|
|
459,720
|
|
1,125,529
|
|
|||||||||||||||
|
2023
|
1,272,479
|
|
—
|
|
473,033
|
|
1,745,512
|
|
1,272,479
|
|
—
|
|
473,033
|
|
1,745,512
|
|
|||||||||||||||
|
2024 and after
|
161,549
|
|
—
|
|
1,794,896
|
|
1,956,445
|
|
161,549
|
|
—
|
|
1,794,896
|
|
1,956,445
|
|
|||||||||||||||
|
7,979,180
|
|
200,000
|
|
4,274,723
|
|
12,453,903
|
|
7,979,180
|
|
200,000
|
|
4,274,723
|
|
12,453,903
|
|
||||||||||||||||
|
Hedge accounting adjustments
|
(10,330
|
)
|
—
|
|
—
|
|
(10,330
|
)
|
(10,330
|
)
|
—
|
|
—
|
|
(10,330
|
)
|
|||||||||||||||
|
Total
|
$
|
7,968,850
|
|
$
|
200,000
|
|
$
|
4,274,723
|
|
$
|
12,443,573
|
|
$
|
7,968,850
|
|
$
|
200,000
|
|
$
|
4,274,723
|
|
$
|
12,443,573
|
|
|||||||
____________
(1)
We view our securitization trust debt as long-term based on the contractual maturity dates and projected principal paydowns based on our current estimates regarding loan prepayment speeds. The projected principal paydowns in year 2019 include
$586 million
related to the securitization trust debt.
(2)
The aggregate principal amount of debt that matures in each period is
$3.6 billion
in 2019,
$2.2 billion
in 2020,
$1.8 billion
in 2021,
$1.1 billion
in 2022,
$1.7 billion
in 2023, and
$2.0 billion
in 2024 and after.
F-51
SLM CORPORATION
NOTES TO CONSOLIDATED FINANCIAL STATEMENTS (Continued)
(Dollars in thousands, unless otherwise noted)
|
9.
|
Borrowings (Continued)
|
Secured Financings
|
Issue
|
Date Issued
|
Total Issued
|
Weighted Average Cost of Funds
(1)
|
Weighted Average Life
(in years)
|
||||||
|
Private Education:
|
||||||||||
|
2017-A
|
February 2017
|
$
|
772,000
|
|
1-month LIBOR plus 0.93%
|
4.27
|
||||
|
2017-B
|
November 2017
|
676,000
|
|
1-month LIBOR plus 0.80%
|
4.07
|
|||||
|
|
|
—
|
|
|
|
|||||
|
Total notes issued in 2017
|
$
|
1,448,000
|
|
|||||||
|
Total loan and accrued interest amount securitized at inception in 2017
|
$
|
1,606,804
|
|
|||||||
|
2018-A
|
March 2018
|
$
|
670,000
|
|
1-month LIBOR plus 0.78%
|
4.43
|
||||
|
2018-B
|
June 2018
|
686,500
|
|
1-month LIBOR plus 0.76%
|
4.40
|
|||||
|
2018-C
|
September 2018
|
544,000
|
|
1-month LIBOR plus 0.77%
|
4.32
|
|||||
|
Total notes issued in 2018
|
$
|
1,900,500
|
|
|||||||
|
Total loan and accrued interest amount securitized at inception in 2018
|
$
|
2,101,644
|
|
|||||||
____________
(1)
Represents LIBOR equivalent cost of funds for floating and fixed-rate bonds, excluding issuance costs.
F-52
SLM CORPORATION
NOTES TO CONSOLIDATED FINANCIAL STATEMENTS (Continued)
(Dollars in thousands, unless otherwise noted)
|
9.
|
Borrowings (Continued)
|
Consolidated Funding Vehicles
We consolidate our financing entities that are VIEs as a result of our being the entities’ primary beneficiary. As a result, these financing VIEs are accounted for as secured borrowings.
|
December 31, 2018
|
||||||||||||||||||||||||||||
|
Debt Outstanding
|
Carrying Amount of Assets Securing Debt Outstanding
|
|||||||||||||||||||||||||||
|
Short-Term
|
Long-Term
|
Total
|
Loans
|
Restricted Cash
|
Other Assets
(1)
|
Total
|
||||||||||||||||||||||
|
Secured borrowings:
|
||||||||||||||||||||||||||||
|
Private Education Loan term securitizations
|
$
|
—
|
|
$
|
4,086,956
|
|
$
|
4,086,956
|
|
$
|
5,030,837
|
|
$
|
113,431
|
|
$
|
326,570
|
|
$
|
5,470,838
|
|
|||||||
|
Secured Borrowing Facility
|
—
|
|
—
|
|
—
|
|
—
|
|
—
|
|
157
|
|
157
|
|
||||||||||||||
|
Total
|
$
|
—
|
|
$
|
4,086,956
|
|
$
|
4,086,956
|
|
$
|
5,030,837
|
|
$
|
113,431
|
|
$
|
326,727
|
|
$
|
5,470,995
|
|
|||||||
|
December 31, 2017
|
||||||||||||||||||||||||||||
|
Debt Outstanding
|
Carrying Amount of Assets Securing Debt Outstanding
|
|||||||||||||||||||||||||||
|
Short-Term
|
Long-Term
|
Total
|
Loans
|
Restricted Cash
|
Other Assets
(1)
|
Total
|
||||||||||||||||||||||
|
Secured borrowings:
|
||||||||||||||||||||||||||||
|
Private Education Loan term securitizations
|
$
|
—
|
|
$
|
3,078,731
|
|
$
|
3,078,731
|
|
$
|
3,691,024
|
|
$
|
95,966
|
|
$
|
240,208
|
|
$
|
4,027,198
|
|
|||||||
|
Secured Borrowing Facility
|
—
|
|
—
|
|
—
|
|
—
|
|
1,017
|
|
161
|
|
1,178
|
|
||||||||||||||
|
Total
|
$
|
—
|
|
$
|
3,078,731
|
|
$
|
3,078,731
|
|
$
|
3,691,024
|
|
$
|
96,983
|
|
$
|
240,369
|
|
$
|
4,028,376
|
|
|||||||
________
(1)
Other assets primarily represent accrued interest receivable.
Other Borrowing Sources
We maintain discretionary uncommitted Federal Funds lines of credit with various correspondent banks, which totaled $
125
million at December 31, 2018. The interest rate we are charged on these lines of credit is priced at Fed Funds plus a spread at the time of borrowing, and is payable daily. We did not utilize these lines of credit in the years ended December 31,
2018
and 2017.
We established an account at the FRB to meet eligibility requirements for access to the Primary Credit borrowing facility at the FRB’s Discount Window (the “Window”). The Primary Credit borrowing facility is a lending program available to depository institutions that are in generally sound financial condition. All borrowings at the Window must be fully collateralized. We can pledge asset-backed and mortgage-backed securities, as well as FFELP Loans and Private Education Loans, to the FRB as collateral for borrowings at the Window. Generally, collateral value is assigned based on the estimated fair value of the pledged assets. At December 31,
2018
and December 31, 2017, the value of our pledged collateral at the FRB totaled $
3.1
billion and $
2.6
billion, respectively. The interest rate charged to us is the discount rate set by the FRB. We did not utilize this facility in the years ended December 31,
2018
and 2017.
F-53
SLM CORPORATION
NOTES TO CONSOLIDATED FINANCIAL STATEMENTS (Continued)
(Dollars in thousands, unless otherwise noted)
10. Derivative Financial Instruments
Risk Management Strategy
We maintain an overall interest rate risk management strategy that incorporates the use of derivative instruments to reduce the economic effect of interest rate changes. Our goal is to manage interest rate sensitivity by modifying the repricing frequency and underlying index characteristics of certain balance sheet assets or liabilities so any adverse impacts related to movements in interest rates are managed within low to moderate limits. As a result of interest rate fluctuations, hedged balance sheet positions will appreciate or depreciate in market value or create variability in cash flows. Income or loss on the derivative instruments linked to the hedged item will generally offset the effect of this unrealized appreciation or depreciation or volatility in cash flows for the period the item is being hedged. We view this strategy as a prudent management of interest rate risk.
Although we use derivatives to reduce the risk of interest rate changes, the use of derivatives does expose us to both market and credit risk. Market risk is the chance of financial loss resulting from changes in interest rates and market liquidity. Credit risk is the risk that a counterparty will not perform its obligations under a contract and it is limited to the loss of the fair value gain in a derivative that the counterparty owes us less collateral held and plus collateral posted. When the fair value of a derivative contract less collateral held and plus collateral posted is negative, we owe the counterparty and, therefore, we have no credit risk exposure to the counterparty; however, the counterparty has exposure to us. We minimize the credit risk in derivative instruments by entering into transactions with reputable counterparties that are reviewed regularly by our Credit Department. We also maintain a policy of requiring that all derivative contracts be governed by an International Swaps and Derivatives Association, Inc. Master Agreement. Depending on the nature of the derivative transaction, bilateral collateral arrangements are required as well. When we have more than one outstanding derivative transaction with the counterparty, and there exists legally enforceable netting provisions with the counterparty (i.e., a legal right to offset receivable and payable derivative contracts), the “net” mark-to-market exposure, less collateral held and plus collateral posted, represents exposure with the counterparty. We refer to this as the “net position.” When there is a net negative exposure, we consider our exposure to the counterparty and the net position to be zero.
Title VII of the Dodd-Frank Wall Street Reform and Consumer Protection Act of 2010 requires all standardized derivatives, including most interest rate swaps, to be submitted for clearing to central counterparties to reduce counterparty risk. Two of the central counterparties we use are the CME and the LCH. The CME and the LCH made amendments to their respective rules that resulted in the prospective accounting treatment of certain daily variation margin payments being considered as the legal settlement of the outstanding exposure of the derivative instead of the posting of collateral. The CME rule changes, which became effective in January 2017, and the LCH rule changes, which became effective in January 2018, result in all variation margin payments on derivatives cleared through the CME and LCH being accounted for as legal settlement. As of December 31, 2018, $
5.4
billion notional of our derivative contracts were cleared on the CME and
$0.6 billion
were cleared on the LCH. The derivative contracts cleared through the CME and LCH represent
90.2 percent
and
9.8 percent
, respectively, of our total notional derivative contracts of $
6.0
billion at December 31, 2018.
For derivatives cleared through the CME and LCH, the net gain (loss) position includes the variation margin amounts as settlement of the derivative and not collateral against the fair value of the derivative. The amount of variation margin included as settlement as of December 31, 2018 was $
(16.7) million
and $
(6.1) million
for the CME and LCH, respectively. Interest income (expense) related to variation margin on derivatives that are not designated as hedging instruments or are designated as fair value relationships is recognized as a gain (loss) rather than as interest income (expense). Changes in fair value for derivatives not designated as hedging instruments will be presented as realized gains (losses).
Our exposure is limited to the value of the derivative contracts in a gain position less any collateral held and plus any collateral posted. When there is a net negative exposure, we consider our exposure to the counterparty to be zero. At December 31,
2018
and
2017
, we had a net positive exposure (derivative gain positions to us, less collateral held by us and plus collateral posted with counterparties) related to derivatives of
$27
million and
$20
million, respectively.
F-54
SLM CORPORATION
NOTES TO CONSOLIDATED FINANCIAL STATEMENTS (Continued)
(Dollars in thousands, unless otherwise noted)
|
10.
|
Derivative Financial Instruments (Continued)
|
|
Accounting for Derivative Instruments
The accounting for derivative instruments requires that every derivative instrument, including certain derivative instruments embedded in other contracts, be recorded on the balance sheet as either an asset or liability measured at fair value. Our derivative instruments are classified and accounted for by us as fair value hedges, cash flow hedges, and trading hedges.
We elected to early adopt ASU No. 2017-12 effective July 1, 2018. Under the new standard, we are no longer required to separately measure and report hedge ineffectiveness, which was previously recorded in “gains (losses) on derivatives and hedging activities, net” in our consolidated statements of income. In accordance with the new standard, certain provisions were required to be applied on a modified retrospective basis, which requires a cumulative effect adjustment to accumulated other comprehensive income with a corresponding adjustment to retained earnings as of the beginning of the fiscal year of adoption, or January 1, 2018 in our case.
Among other provisions, the new standard required modifications to existing presentation and disclosure requirements. As such, the disclosures for the year ended December 31, 2018 in the “Impact of Derivatives on the Consolidated Statements of Income” table below, conform to the disclosure requirements of ASU No. 2017-12. See Note 2, “Significant Accounting Policies — Recently Issued and Adopted Accounting Pronouncements” for additional information related to the adoption of this new standard.
Fair Value Hedges
We generally use fair value hedges to offset the exposure to changes in fair value of a recognized fixed-rate liability. We enter into interest rate swaps to economically convert fixed-rate liabilities into variable-rate liabilities. For fair value hedges, we generally consider all components of the derivative’s gain and/or loss when assessing hedge effectiveness and generally hedge changes in fair values due to interest rates. Under the new standard, for fair value hedges, the entire change in the fair value of the hedging instrument included in the assessment of hedge effectiveness is recorded in the same line item in the consolidated statements of income that is used to present the earnings effect of the hedged component of the hedged item. The timing of recognition of the change in fair value of a hedging instrument included in the assessment of hedge effectiveness is the same as prior to the adoption of ASU No. 2017-12.
Cash Flow Hedges
We use cash flow hedges to hedge the exposure to variability in cash flows of floating-rate liabilities. This strategy is used primarily to minimize the exposure to volatility in cash flows from future changes in interest rates. In assessing hedge effectiveness, generally all components of each derivative’s gains or losses are included in the assessment. We hedge exposure to changes in cash flows due to changes in interest rates or total changes in cash flow. Under the new standard, for cash flow hedges, the entire change in the fair value of the hedging instrument included in the assessment of hedge effectiveness is recorded in other comprehensive income (loss). Those amounts are subsequently reclassified to earnings, in the same line item in the consolidated statements of income as impacted by the hedged item, when the hedged item affects earnings.
Amounts reported in accumulated other comprehensive income related to derivatives will be reclassified to interest expense as interest payments are made on our variable-rate deposits. During the next twelve months, we estimate that $
5.5
million will be reclassified as an increase to interest expense.
Trading Activities
When derivative instruments do not qualify for hedge accounting treatment, they are accounted for at fair value with all changes in fair value recorded through earnings. All of our derivative instruments entered into with maturities of less than 3 years are economically hedging risk, but do not receive hedge accounting treatment. Trading derivatives also include any
F-55
SLM CORPORATION
NOTES TO CONSOLIDATED FINANCIAL STATEMENTS (Continued)
(Dollars in thousands, unless otherwise noted)
|
10.
|
Derivative Financial Instruments (Continued)
|
|
hedges that originally received hedge accounting treatment, but lost hedge accounting treatment due to failed effectiveness testing, as well as the activity of certain derivatives prior to those derivatives receiving hedge accounting treatment.
Summary of Derivative Financial Statement Impact
The following tables summarize the fair values and notional amounts of all derivative instruments at December 31,
2018
and
2017
, and their impact on earnings and other comprehensive income for the years ended December 31,
2018
,
2017
and
2016
.
Impact of Derivatives on the Consolidated Balance Sheets
|
Cash Flow Hedges
|
Fair Value Hedges
|
Trading
|
Total
|
|||||||||||||||||||||||||||||||
|
December 31,
|
December 31,
|
December 31,
|
December 31,
|
December 31,
|
December 31,
|
December 31,
|
December 31,
|
|||||||||||||||||||||||||||
|
2018
|
2017
|
2018
|
2017
|
2018
|
2017
|
2018
|
2017
|
|||||||||||||||||||||||||||
|
Fair Values
(1)
|
Hedged Risk Exposure
|
|||||||||||||||||||||||||||||||||
|
Derivative Assets:
(2)
|
||||||||||||||||||||||||||||||||||
|
Interest rate swaps
|
Interest rate
|
$
|
—
|
|
$
|
—
|
|
$
|
2,000
|
|
$
|
630
|
|
$
|
90
|
|
$
|
182
|
|
$
|
2,090
|
|
$
|
812
|
|
|||||||||
|
Derivative Liabilities:
(2)
|
||||||||||||||||||||||||||||||||||
|
Interest rate swaps
|
Interest rate
|
(2,032
|
)
|
(2,584
|
)
|
—
|
|
—
|
|
—
|
|
—
|
|
(2,032
|
)
|
(2,584
|
)
|
|||||||||||||||||
|
Total net derivatives
|
$
|
(2,032
|
)
|
$
|
(2,584
|
)
|
$
|
2,000
|
|
$
|
630
|
|
$
|
90
|
|
$
|
182
|
|
$
|
58
|
|
$
|
(1,772
|
)
|
||||||||||
__________
|
(1)
|
Fair values reported include accrued interest and variation margin as legal settlement of the derivative contract. Assets and liabilities are presented without consideration of master netting agreements. Derivatives are carried on the balance sheet based on net position by counterparty under master netting agreements and classified in other assets or other liabilities depending on whether in a net positive or negative position.
|
|
(2)
|
The following table reconciles gross positions with the impact of master netting agreements to the balance sheet classification:
|
|
Other Assets
|
Other Liabilities
|
|||||||||||||||
|
December 31,
|
December 31,
|
December 31,
|
December 31,
|
|||||||||||||
|
2018
|
2017
|
2018
|
2017
|
|||||||||||||
|
Gross position
(1)
|
$
|
2,090
|
|
$
|
812
|
|
$
|
(2,032
|
)
|
$
|
(2,584
|
)
|
||||
|
Impact of master netting agreement
|
(1,389
|
)
|
(812
|
)
|
1,389
|
|
812
|
|
||||||||
|
Derivative values with impact of master netting agreements (as carried on balance sheet)
|
701
|
|
—
|
|
(643
|
)
|
(1,772
|
)
|
||||||||
|
Cash collateral pledged
(2)
|
27,151
|
|
—
|
|
—
|
|
21,586
|
|
||||||||
|
Net position
|
$
|
27,852
|
|
$
|
—
|
|
$
|
(643
|
)
|
$
|
19,814
|
|
||||
__________
|
(1)
|
Gross position amounts include accrued interest and variation margin as legal settlement of the derivative contract.
|
|
(2)
|
Cash collateral pledged excludes amounts that represent legal settlement of the derivative contracts.
|
F-56
SLM CORPORATION
NOTES TO CONSOLIDATED FINANCIAL STATEMENTS (Continued)
(Dollars in thousands, unless otherwise noted)
|
10.
|
Derivative Financial Instruments (Continued)
|
|
|
Cash Flow
|
Fair Value
|
Trading
|
Total
|
||||||||||||||||||||||||||||||
|
December 31,
|
December 31,
|
December 31,
|
December 31,
|
December 31,
|
December 31,
|
December 31,
|
December 31,
|
||||||||||||||||||||||||||
|
2018
|
2017
|
2018
|
2017
|
2018
|
2017
|
2018
|
2017
|
||||||||||||||||||||||||||
|
Notional Values
|
|||||||||||||||||||||||||||||||||
|
Interest rate swaps
|
$
|
1,280,367
|
|
$
|
1,408,649
|
|
$
|
3,137,965
|
|
$
|
3,062,849
|
|
$
|
1,577,978
|
|
$
|
987,577
|
|
$
|
5,996,310
|
|
$
|
5,459,075
|
|
|||||||||
As of December 31, 2018, and December 31, 2017, the following amounts were recorded on the consolidated balance sheet related to cumulative basis adjustments for fair value hedges:
|
Line Item in the Balance Sheet in Which the Hedged Item is Included:
|
Carrying Amount of the Hedged Assets/(Liabilities)
|
Cumulative Amount of Fair Value Hedging Adjustment Included in the Carrying Amount of the Hedged Assets/(Liabilities)
|
||||||||||||||
|
December 31,
|
December 31,
|
December 31,
|
December 31,
|
|||||||||||||
|
2018
|
2017
|
2018
|
2017
|
|||||||||||||
|
Deposits
|
$
|
(3,114,304
|
)
|
$
|
(3,036,671
|
)
|
$
|
14,202
|
|
$
|
22,168
|
|
||||
F-57
SLM CORPORATION
NOTES TO CONSOLIDATED FINANCIAL STATEMENTS (Continued)
(Dollars in thousands, unless otherwise noted)
|
10.
|
Derivative Financial Instruments (Continued)
|
|
Impact of Derivatives on the Consolidated Statements of Income
|
Years Ended December 31,
|
||||||||||||
|
2018
|
2017
|
2016
|
||||||||||
|
Fair Value Hedges
|
||||||||||||
|
Interest rate swaps:
|
||||||||||||
|
Interest recognized on derivatives
|
$
|
(11,642
|
)
|
$
|
8,286
|
|
$
|
27,810
|
|
|||
|
Hedged items recorded in interest expense
|
(7,966
|
)
|
16,155
|
|
14,447
|
|
||||||
|
Derivatives recorded in interest expense
|
8,123
|
|
(20,115
|
)
|
(15,482
|
)
|
||||||
|
Total
|
$
|
(11,485
|
)
|
$
|
4,326
|
|
$
|
26,775
|
|
|||
|
Cash Flow Hedges
|
||||||||||||
|
Interest rate swaps:
|
||||||||||||
|
Amount of gain (loss) reclassified from accumulated other comprehensive income into interest expense
|
$
|
(1,455
|
)
|
$
|
(11,187
|
)
|
$
|
(17,665
|
)
|
|||
|
Total
|
$
|
(1,455
|
)
|
$
|
(11,187
|
)
|
$
|
(17,665
|
)
|
|||
|
Trading
|
||||||||||||
|
Interest rate swaps:
|
||||||||||||
|
Change in fair value of future interest payments recorded in earnings
|
$
|
(1,400
|
)
|
$
|
(3,693
|
)
|
$
|
(513
|
)
|
|||
|
Total
|
(1,400
|
)
|
(3,693
|
)
|
(513
|
)
|
||||||
|
Total
|
$
|
(14,340
|
)
|
$
|
(10,554
|
)
|
$
|
8,597
|
|
|||
F-58
SLM CORPORATION
NOTES TO CONSOLIDATED FINANCIAL STATEMENTS (Continued)
(Dollars in thousands, unless otherwise noted)
|
10.
|
Derivative Financial Instruments (Continued)
|
|
Impact of Derivatives on the Statements of Changes in Stockholders’ Equity
|
Years Ended December 31,
|
||||||||||||
|
2018
|
2017
|
2016
|
||||||||||
|
Amount of gain (loss) recognized in other comprehensive income (loss)
|
$
|
10,452
|
|
$
|
8,008
|
|
$
|
(3,901
|
)
|
|||
|
Amount of loss reclassified in interest expense
|
(1,455
|
)
|
(11,187
|
)
|
(17,665
|
)
|
||||||
|
Total change in other comprehensive income (loss) for unrealized gains (losses) on derivatives, before income tax (expense) benefit
|
$
|
11,907
|
|
$
|
19,195
|
|
$
|
13,764
|
|
|||
______
Cash Collateral
As of December 31, 2018, cash collateral held and pledged excludes amounts that represent legal settlement of the derivative contracts held with the CME and LCH. There was no cash collateral held related to derivative exposure between us and our derivatives counterparties at December 31,
2018
and
2017
, respectively. Collateral held is recorded in “Other Liabilities” on the consolidated balance sheets. Cash collateral pledged related to derivative exposure between us and our derivatives counterparties was
$27.2
million and
$21.6
million at December 31,
2018
and
2017
, respectively. Collateral pledged is recorded in “Other interest-earning assets” on the consolidated balance sheets.
F-59
SLM CORPORATION
NOTES TO CONSOLIDATED FINANCIAL STATEMENTS (Continued)
(Dollars in thousands, unless otherwise noted)
11. Stockholders’ Equity
Preferred Stock
On May 5, 2017, we redeemed, with the proceeds from our unsecured debt offering (see Note 9, “Borrowings”), the outstanding
3.3
million shares of our
6.97
percent Cumulative Redeemable Preferred Stock, Series A (the “Series A Preferred Stock”). The Series A Preferred Stock was redeemed at a price of $
50
per share, plus accrued and unpaid dividends from May 1, 2017 to, but excluding, the May 5, 2017 redemption date.
At December 31,
2018
, we had
4.0
million shares of Floating-Rate Non-Cumulative Preferred Stock, Series B (the “Series B Preferred Stock”) outstanding. The Series B Preferred Stock does not have a maturity date, but can be redeemed at our option. Redemption would include any accrued and unpaid dividends for the then current quarterly dividend period, up to the redemption date. The shares have no preemptive or conversion rights and are not exchangeable for any of our other securities or property. Dividends are not mandatory and are paid quarterly, when, as, and if declared by the Board of Directors. Holders of Series B Preferred Stock are entitled to receive quarterly dividends based on
3-month LIBOR plus 170 basis points per annum
in arrears. Upon liquidation or dissolution of the Company, holders of the Series B Preferred Stock are entitled to receive $
100
per share, plus an amount equal to accrued and unpaid dividends for the then current quarterly dividend period, pro rata, and before any distribution of assets are made to holders of our common stock.
Common Stock
Our shareholders have authorized the issuance of
1.125
billion shares of common stock (par value of $0
.20
). At December 31,
2018
,
436
million shares were issued and outstanding and
41
million shares were unissued but encumbered for outstanding stock options, restricted stock, restricted stock units, performance stock units and dividend equivalent units for employee compensation and remaining authority for stock-based compensation plans.
We did
no
t pay common stock dividends for the years ended December 31,
2018
,
2017
and
2016
. On January 23, 2019, we announced that we had initiated a new policy to pay a regular, quarterly cash dividend on our common stock, beginning in the first quarter of 2019. Common stock dividend declarations are subject to determination by, and the discretion of, our Board of Directors. We may change our new common stock dividend policy at any time.
We are dependent on funds obtained from the Bank to fund dividend payments. Regulatory and other legal restrictions may limit our ability to transfer funds freely, either to or from our subsidiaries. In particular, the Bank is subject to laws and regulations that authorize regulatory bodies to block or reduce the flow of funds to us, or that prohibit such transfers altogether in certain circumstances. These laws, regulations and rules may hinder our ability to access funds that we may need to make payments in respect of our stock or to satisfy our other responsibilities. The FDIC has the authority to prohibit or limit the payment of dividends by the Bank and SLM Corporation.
On January 23, 2019, we also announced that our Board of Directors had approved a new common share repurchase program. The new share repurchase program, which was effective upon announcement and expires on January 22, 2021, permits us to repurchase from time to time shares of our common stock up to an aggregate repurchase price not to exceed
$200 million
.
For the years ended December 31, 2018, 2017 and 2016, we only repurchased common stock acquired in connection with taxes withheld resulting from award exercises and vesting under our employee stock-based compensation plans. The following table summarizes our common share repurchases and issuances associated with these programs.
F-60
SLM CORPORATION
NOTES TO CONSOLIDATED FINANCIAL STATEMENTS (Continued)
(Dollars in thousands, unless otherwise noted)
|
11.
|
Stockholders’ Equity (Continued)
|
|
|
Years Ended December 31,
|
|||||||||
|
(Shares and per share amounts in actuals)
|
2018
|
2017
|
2016
|
||||||
|
Shares repurchased related to employee stock-based compensation plans
(1)
|
3,087,396
|
|
3,358,417
|
|
3,354,730
|
|
|||
|
Average purchase price per share
|
$11.32
|
$11.96
|
$7.83
|
||||||
|
Common shares issued
(2)
|
6,392,634
|
|
6,831,108
|
|
5,955,045
|
|
|||
_________
|
(1)
|
Comprises shares withheld from stock option exercises and vesting of restricted stock for employees’ tax withholding obligations and shares tendered by employees to satisfy option exercise costs.
|
|
(2)
|
Common shares issued under our various compensation and benefit plans.
|
The closing price of our common stock on December 31,
2018
was $
8.31
.
F-61
SLM CORPORATION
NOTES TO CONSOLIDATED FINANCIAL STATEMENTS (Continued)
(Dollars in thousands, unless otherwise noted)
12. Earnings per Common Share
Basic earnings per common share (“EPS”) are calculated using the weighted average number of shares of common stock outstanding during each period. A reconciliation of the numerators and denominators of the basic and diluted EPS calculations follows.
|
Years Ended December 31,
|
||||||||||||
|
(In thousands, except per share data)
|
2018
|
2017
|
2016
|
|||||||||
|
Numerator:
|
||||||||||||
|
Net income
|
$
|
487,476
|
|
$
|
288,934
|
|
$
|
250,327
|
|
|||
|
Preferred stock dividends
|
15,640
|
|
15,714
|
|
21,204
|
|
||||||
|
Net income attributable to SLM Corporation common stock
|
$
|
471,836
|
|
$
|
273,220
|
|
$
|
229,123
|
|
|||
|
Denominator:
|
||||||||||||
|
Weighted average shares used to compute basic EPS
|
435,054
|
|
431,216
|
|
427,876
|
|
||||||
|
Effect of dilutive securities:
|
||||||||||||
|
Dilutive effect of stock options, restricted stock, restricted stock units and Employee Stock Purchase Plan (“ESPP”)
(1)(2)
|
4,627
|
|
7,335
|
|
5,043
|
|
||||||
|
Weighted average shares used to compute diluted EPS
|
439,681
|
|
438,551
|
|
432,919
|
|
||||||
|
Basic earnings per common share attributable to SLM Corporation
|
$
|
1.08
|
|
$
|
0.63
|
|
$
|
0.54
|
|
|||
|
Diluted earnings per common share attributable to SLM Corporation
|
$
|
1.07
|
|
$
|
0.62
|
|
$
|
0.53
|
|
|||
__________
|
(1)
|
Includes the potential dilutive effect of additional common shares that are issuable upon exercise of outstanding stock options, restricted stock, restricted stock units, and the outstanding commitment to issue shares under the ESPP, determined by the treasury stock method.
|
|
(2)
|
For the years ended December 31,
2018
,
2017
and
2016
, securities covering less than
1
million shares,
no
shares and approximately
1
million shares, respectively, were outstanding but not included in the computation of diluted earnings per share because they were anti-dilutive.
|
F-62
SLM CORPORATION
NOTES TO CONSOLIDATED FINANCIAL STATEMENTS (Continued)
(Dollars in thousands, unless otherwise noted)
13. Stock-Based Compensation Plans and Arrangements
Plan Summaries
As of December 31,
2018
, we had
one
active stock-based compensation plan that provides for grants of equity awards to our employees and non-employee directors. We also maintained an Employee Stock Purchase Plan (the “ESPP”). Shares issued under these stock-based compensation plans may be either shares reacquired by us or shares that are authorized but unissued.
The SLM Corporation 2012 Omnibus Incentive Plan was approved by shareholders on May 24, 2012. An amendment to the plan was approved and other material terms of the plan were re-approved by shareholders on June 22, 2017. At December 31, 2018,
20 million
shares, as adjusted to reflect the effects of the Spin-Off, were authorized to be issued from this plan.
An amendment to the ESPP was approved by shareholders on May 24, 2012 that authorized the issuance of
6 million
shares under the plan and kept the terms of the plan substantially the same. The number of shares authorized under the plan was subsequently adjusted to
15 million
shares on June 25, 2014, to reflect the effects of the Spin-Off.
Stock-Based Compensation
The total stock-based compensation cost recognized in the consolidated statements of income for the years ended December 31,
2018
,
2017
and
2016
was
$31.5
million,
$27.9
million and
$22.9
million, respectively. As of December 31,
2018
, there was $
12.0
million of total unrecognized compensation expense related to unvested stock awards, which is expected to be recognized over a weighted average period of
1.3 years
. We amortize compensation expense on a straight-line basis over the related vesting periods of each tranche of each award.
Stock Options
Stock options granted prior to 2012 expire
10
years after the grant date, and those granted since 2012 expire in
5
years. The exercise price must be equal to or greater than the market price of our common stock on the grant date. We have granted time-vested, price-vested and performance-vested options to our employees and non-employee directors. Time-vested options granted to management and non-management employees generally vest over
three years
. Price-vested options granted to management employees vest upon our common stock reaching a targeted closing price for a set number of days. Performance-vested options granted to management employees vest one-third per year for
three years
based on corporate earnings-related performance targets. Options granted to non-employee directors vest upon the director’s election to the Board.
There were
no
options granted in the years ended December 31,
2018
, 2017 and 2016.
F-63
SLM CORPORATION
NOTES TO CONSOLIDATED FINANCIAL STATEMENTS (Continued)
(Dollars in thousands, unless otherwise noted)
|
13.
|
Stock-Based Compensation Plans and Arrangements (Continued)
|
|
The following table summarizes stock option activity for the year ended December 31,
2018
.
|
(Dollars in thousands, except per share data)
|
Number of
Options
|
Weighted
Average
Exercise
Price per
Share
|
Weighted
Average
Remaining
Contractual
Term
|
Aggregate
Intrinsic
Value
(1)
|
||||||||
|
Outstanding at December 31, 2017
|
4,460,993
|
|
$
|
11.34
|
|
|||||||
|
Granted
|
—
|
|
—
|
|
||||||||
|
Exercised
(2)(3)
|
(3,051,858
|
)
|
5.88
|
|
||||||||
|
Canceled
|
(17,316
|
)
|
6.19
|
|
||||||||
|
Outstanding at December 31, 2018
(4)
|
1,391,819
|
|
$
|
10.44
|
|
1.2 years
|
$
|
5,624
|
|
|||
|
Exercisable at December 31, 2018
|
1,391,819
|
|
$
|
4.27
|
|
1.2 years
|
$
|
5,624
|
|
|||
____________
|
(1)
|
The aggregate intrinsic value represents the total intrinsic value (the aggregate difference between our closing stock price on December 31, 2018 and the exercise price of in-the-money options) that would have been received by the option holders if all in-the-money options had been exercised on December 31, 2018.
|
|
(2)
|
The total intrinsic value of options exercised was
$16.9
million,
$16.5
million, and
$9.3
million for the years ended December 31,
2018
,
2017
and
2016
, respectively.
|
|
(3)
|
Cash of
$0.4
million was received from option exercises for the year ended December 31, 2018. The actual tax benefit realized for the tax deductions from option exercises totaled
$1.7
million for the year ended December 31, 2018.
|
|
(4)
|
For net-settled options, gross number is reflected.
|
F-64
SLM CORPORATION
NOTES TO CONSOLIDATED FINANCIAL STATEMENTS (Continued)
(Dollars in thousands, unless otherwise noted)
|
13.
|
Stock-Based Compensation Plans and Arrangements (Continued)
|
|
Restricted Stock
Restricted stock awards generally vest over
one year
. Outstanding restricted stock is entitled to dividend equivalent units that vest subject to the same vesting requirements or lapse of transfer restrictions, as applicable, as the underlying restricted stock award. The fair value of restricted stock awards is based on our stock price at the grant date.
The following table summarizes restricted stock activity for the year ended December 31,
2018
.
|
(Shares and per share amounts in actuals)
|
Number of
Shares
|
Weighted
Average Grant
Date
Fair Value
|
||||
|
Non-vested at December 31, 2017
|
81,103
|
|
$
|
10.85
|
|
|
|
Granted
|
84,392
|
|
11.73
|
|
||
|
Vested
(1)
|
(81,103
|
)
|
10.85
|
|
||
|
Canceled
|
—
|
|
—
|
|
||
|
Non-vested at December 31, 2018
(2)
|
84,392
|
|
$
|
11.73
|
|
|
_________
|
(1)
|
The total fair value of shares that vested during the years ended December 31,
2018
,
2017
and
2016
was
$0.9
million,
$0.8
million and
$0.8
million, respectively.
|
|
(2)
|
As of December 31,
2018
, there was
$0.5
million of unrecognized compensation cost related to restricted stock, which is expected to be recognized over a weighted average period of
0.5 years
.
|
F-65
SLM CORPORATION
NOTES TO CONSOLIDATED FINANCIAL STATEMENTS (Continued)
(Dollars in thousands, unless otherwise noted)
|
13.
|
Stock-Based Compensation Plans and Arrangements (Continued)
|
|
Restricted Stock Units and Performance Stock Units
Restricted stock units (“RSUs”) and performance stock units (“PSUs”) are equity awards granted to employees that entitle the holder to shares of our common stock when the award vests. RSUs may be time-vested over
three years
or vested at grant but subject to transfer restrictions, while PSUs vest based on corporate performance targets over a
three
-year period.
Outstanding RSUs and PSUs are entitled to dividend equivalent units that vest subject to the same vesting requirements or lapse of transfer restrictions, as applicable, as the underlying award. The fair value of RSUs is based on our stock price at the grant date.
The following table summarizes RSU and PSU activity for the year ended December 31,
2018
.
|
(Shares and per share amounts in actuals)
|
Number of
RSUs/
PSUs
|
Weighted
Average Grant
Date
Fair Value
|
||||
|
Outstanding at December 31, 2017
|
5,945,290
|
|
$
|
8.60
|
|
|
|
Granted
|
2,522,075
|
|
11.61
|
|
||
|
Vested and converted to common stock
(1)
|
(3,023,152
|
)
|
8.37
|
|
||
|
Canceled
|
(106,179
|
)
|
10.62
|
|
||
|
Outstanding at December 31, 2018
(2)
|
5,338,034
|
|
$
|
10.11
|
|
|
__________
|
(1)
|
The total fair value of RSUs/PSUs that vested and converted to common stock during the years ended December 31,
2018
,
2017
and
2016
was
$25.3
million,
$29.2
million and
$22.2
million, respectively.
|
|
(2)
|
As of December 31,
2018
, there was
$11.2
million of unrecognized compensation cost related to RSUs/PSUs, which is expected to be recognized over a weighted average period of
1.4 years
.
|
Employee Stock Purchase Plan
Employees may purchase shares of our common stock at the end of a
12
-month offering period at a price equal to the share price at the beginning of the 12-month period, less
15 percent
, up to a maximum purchase price of
$7,500
(whole dollars). The purchase price for each offering is determined at the beginning of the offering period on August 1.
The fair values of the stock purchase rights of the ESPP offerings were calculated using a Black-Scholes option pricing model with the following weighted average assumptions:
|
|
Years Ended December 31,
|
||||||||||
|
(Dollars per share)
|
2018
|
2017
|
2016
|
||||||||
|
Risk-free interest rate
|
2.44
|
%
|
1.22
|
%
|
0.50
|
%
|
|||||
|
Expected volatility
|
27
|
%
|
32
|
%
|
32
|
%
|
|||||
|
Expected dividend rate
|
—
|
%
|
—
|
%
|
—
|
%
|
|||||
|
Expected life of the option
|
1 year
|
|
1 year
|
|
1 year
|
|
|||||
|
Weighted average fair value of stock purchase rights
|
$
|
2.32
|
|
$
|
2.36
|
|
$
|
1.53
|
|
||
The expected volatility is based on implied volatility from publicly-traded options on our stock at the grant date and historical volatility of our stock consistent with the expected life. The risk-free interest rate is based on the U.S. Treasury bill
F-66
SLM CORPORATION
NOTES TO CONSOLIDATED FINANCIAL STATEMENTS (Continued)
(Dollars in thousands, unless otherwise noted)
|
13.
|
Stock-Based Compensation Plans and Arrangements (Continued)
|
|
rate at the grant date consistent with the expected life. The dividend yield is
zero
, as we did not pay dividends on our common stock in 2018.
The fair values were amortized to compensation cost on a straight-line basis over a
one
-year vesting period. As of December 31,
2018
, there was
$0.3
million of unrecognized compensation cost related to the ESPP, which is expected to be recognized by July 2019.
During the years ended December 31, 2018 and 2017, plan participants purchased
233,232
shares and
283,952
shares, respectively, of our common stock.
No
shares were purchased for the year ended December 31, 2016, as our stock price on July 31, 2016 was less than the offering price for the ESPP plan.
F-67
SLM CORPORATION
NOTES TO CONSOLIDATED FINANCIAL STATEMENTS (Continued)
(Dollars in thousands, unless otherwise noted)
14. Fair Value Measurements
We use estimates of fair value in applying various accounting standards for the consolidated financial statements.
We categorize our fair value estimates based on a hierarchal framework associated with three levels of price transparency utilized in measuring financial instruments at fair value. For additional information regarding our policies for determining fair value and the hierarchical framework, see Note 2, “Significant Accounting Policies — Fair Value Measurement.”
The following table summarizes the valuation of our financial instruments that are marked-to-fair value on a recurring basis.
|
|
Fair Value Measurements on a Recurring Basis
|
|||||||||||||||||||||||||||||||
|
|
December 31, 2018
|
December 31, 2017
|
||||||||||||||||||||||||||||||
|
Level 1
|
Level 2
|
Level 3
|
Total
|
Level 1
|
Level 2
|
Level 3
|
Total
|
|||||||||||||||||||||||||
|
Assets
|
||||||||||||||||||||||||||||||||
|
Available-for-sale investments
|
$
|
—
|
|
$
|
176,245
|
|
$
|
—
|
|
$
|
176,245
|
|
$
|
—
|
|
$
|
244,088
|
|
$
|
—
|
|
$
|
244,088
|
|
||||||||
|
Derivative instruments
|
—
|
|
2,090
|
|
—
|
|
2,090
|
|
—
|
|
812
|
|
—
|
|
812
|
|
||||||||||||||||
|
Total
|
$
|
—
|
|
$
|
178,335
|
|
$
|
—
|
|
$
|
178,335
|
|
$
|
—
|
|
$
|
244,900
|
|
$
|
—
|
|
$
|
244,900
|
|
||||||||
|
Liabilities
|
||||||||||||||||||||||||||||||||
|
Derivative instruments
|
$
|
—
|
|
$
|
(2,032
|
)
|
$
|
—
|
|
$
|
(2,032
|
)
|
$
|
—
|
|
$
|
(2,584
|
)
|
$
|
—
|
|
$
|
(2,584
|
)
|
||||||||
|
Total
|
$
|
—
|
|
$
|
(2,032
|
)
|
$
|
—
|
|
$
|
(2,032
|
)
|
$
|
—
|
|
$
|
(2,584
|
)
|
$
|
—
|
|
$
|
(2,584
|
)
|
||||||||
F-68
SLM CORPORATION
NOTES TO CONSOLIDATED FINANCIAL STATEMENTS (Continued)
(Dollars in thousands, unless otherwise noted)
|
14.
|
Fair Value Measurements (Continued)
|
|
The following table summarizes the fair values of our financial assets and liabilities, including derivative financial instruments.
|
|
December 31, 2018
|
December 31, 2017
|
||||||||||||||||||||||
|
Fair
Value
|
Carrying
Value
|
Difference
|
Fair
Value
|
Carrying
Value
|
Difference
|
|||||||||||||||||||
|
Earning assets:
|
||||||||||||||||||||||||
|
Loans held for investment, net:
|
||||||||||||||||||||||||
|
Private Education Loans
|
$
|
22,313,419
|
|
$
|
20,294,843
|
|
$
|
2,018,576
|
|
$
|
19,327,044
|
|
$
|
17,244,830
|
|
$
|
2,082,214
|
|
||||||
|
FFELP Loans
|
859,185
|
|
847,889
|
|
11,296
|
|
946,213
|
|
929,159
|
|
17,054
|
|
||||||||||||
|
Personal Loans
|
1,156,531
|
|
1,128,187
|
|
28,344
|
|
399,879
|
|
393,652
|
|
6,227
|
|
||||||||||||
|
Cash and cash equivalents
|
2,559,106
|
|
2,559,106
|
|
—
|
|
1,534,339
|
|
1,534,339
|
|
—
|
|
||||||||||||
|
Available-for-sale investments
|
176,245
|
|
176,245
|
|
—
|
|
244,088
|
|
244,088
|
|
—
|
|
||||||||||||
|
Accrued interest receivable
|
1,285,842
|
|
1,191,981
|
|
93,861
|
|
967,482
|
|
967,482
|
|
—
|
|
||||||||||||
|
Tax indemnification receivable
|
39,207
|
|
39,207
|
|
—
|
|
168,011
|
|
168,011
|
|
—
|
|
||||||||||||
|
Derivative instruments
|
2,090
|
|
2,090
|
|
—
|
|
812
|
|
812
|
|
—
|
|
||||||||||||
|
Total earning assets
|
$
|
28,391,625
|
|
$
|
26,239,548
|
|
$
|
2,152,077
|
|
$
|
23,587,868
|
|
$
|
21,482,373
|
|
$
|
2,105,495
|
|
||||||
|
Interest-bearing liabilities:
|
||||||||||||||||||||||||
|
Money-market and savings accounts
|
$
|
9,370,957
|
|
$
|
9,390,108
|
|
$
|
19,151
|
|
$
|
8,470,209
|
|
$
|
8,470,209
|
|
$
|
—
|
|
||||||
|
Certificates of deposit
|
9,513,194
|
|
9,551,974
|
|
38,780
|
|
7,044,208
|
|
7,034,121
|
|
(10,087
|
)
|
||||||||||||
|
Short-term borrowings
|
—
|
|
—
|
|
—
|
|
—
|
|
—
|
|
—
|
|
||||||||||||
|
Long-term borrowings
|
4,278,931
|
|
4,284,304
|
|
5,373
|
|
3,299,871
|
|
3,275,270
|
|
(24,601
|
)
|
||||||||||||
|
Accrued interest payable
|
61,341
|
|
61,341
|
|
—
|
|
35,363
|
|
35,363
|
|
—
|
|
||||||||||||
|
Derivative instruments
|
2,032
|
|
2,032
|
|
—
|
|
2,584
|
|
2,584
|
|
—
|
|
||||||||||||
|
Total interest-bearing liabilities
|
$
|
23,226,455
|
|
$
|
23,289,759
|
|
$
|
63,304
|
|
$
|
18,852,235
|
|
$
|
18,817,547
|
|
$
|
(34,688
|
)
|
||||||
|
Excess of net asset fair value over carrying value
|
$
|
2,215,381
|
|
$
|
2,070,807
|
|
||||||||||||||||||
The methods and assumptions used to estimate the fair value of each class of financial instruments are as follows:
Cash and Cash Equivalents
Cash and cash equivalents are carried at cost. Carrying value approximated fair value for disclosure purposes. These are level 1 valuations.
Investments
Investments are classified as available-for-sale and are carried at fair value in the consolidated financial statements. Investments in mortgage-backed securities and Utah Housing Corporation bonds are valued using observable market prices of similar assets. As such, these are level 2 valuations.
F-69
SLM CORPORATION
NOTES TO CONSOLIDATED FINANCIAL STATEMENTS (Continued)
(Dollars in thousands, unless otherwise noted)
|
14.
|
Fair Value Measurements (Continued)
|
|
Loans Held For Investment and Accrued Interest Receivable
Our Private Education Loans, FFELP Loans and Personal Loans are accounted for at cost or at the lower of cost or market if the loan is held-for-sale. For both Private Education Loans and FFELP Loans, fair value was determined by modeling expected loan level cash flows using stated terms of the assets and internally developed assumptions to determine aggregate portfolio yield, net present value and average life. The significant assumptions used to determine fair value are prepayment speeds, default rates, cost of funds and required return on equity. Significant inputs into the model are not observable. However, we do calibrate the model based on market transactions when appropriate. As such, these are level 3 valuations. A portion of the fair value that has been modeled is attributable to accrued interest receivable that has not yet been capitalized, and has been allocated to the accrued interest receivable line item. The remaining accrued interest receivable that will not be capitalized into the principal balance of the loan is carried at cost.
Tax Indemnification Receivable
Tax indemnification receivable is carried at cost. The carrying value approximates fair value. This is a level 2 valuation.
Money Market and Savings Accounts
Some of our MMDAs are fixed-rate deposits that are subject to minimum balances for a specified period of time. The fair values of these deposits are estimated using discounted cash flows based on rates currently offered for deposits of similar maturities. These are level 2 valuations. The fair values of our remaining money market and savings accounts equal the amounts payable on demand at the balance sheet date and are reported at their carrying value. These are level 1 valuations.
Certificates of Deposit
The fair values of CDs are estimated using discounted cash flows based on rates currently offered for deposits of similar remaining maturities. These are level 2 valuations.
Accrued Interest Payable
Accrued interest payable is carried at cost. The carrying value approximates fair value due to its short-term nature. This is a level 1 valuation.
Borrowings
Borrowings are accounted for at cost in the consolidated financial statements. The carrying value of short-term borrowings approximated fair value for disclosure purposes, due to the short-term nature of those borrowings. This is a level 1 valuation. The fair value of long-term borrowings is estimated using current market prices. This is a level 2 valuation.
Derivatives
All derivatives are accounted for at fair value in the consolidated financial statements. The fair value of derivative financial instruments was determined by a standard derivative pricing and option model using the stated terms of the contracts and observable market inputs. It is our policy to compare the derivative fair values to those received from our counterparties in order to evaluate the model’s outputs.
When determining the fair value of derivatives, we take into account counterparty credit risk for positions where we are exposed to the counterparty on a net basis by assessing exposure net of collateral held. When the counterparty has exposure to us under derivative contracts with the Company, we fully collateralize the exposure (subject to certain thresholds).
F-70
SLM CORPORATION
NOTES TO CONSOLIDATED FINANCIAL STATEMENTS (Continued)
(Dollars in thousands, unless otherwise noted)
|
14.
|
Fair Value Measurements (Continued)
|
|
Interest rate swaps are valued using a standard derivative cash flow model with a LIBOR swap yield curve, which is an observable input from an active market. These derivatives are level 2 fair value estimates in the hierarchy.
The carrying value of borrowings designated as the hedged item in a fair value hedge is adjusted for changes in fair value due to changes in the benchmark interest rate (one-month LIBOR). These valuations are determined through standard pricing models using the stated terms of the borrowings and observable yield curves.
15. Arrangements with Navient Corporation
In connection with the Spin-Off, we entered into a Separation and Distribution Agreement with Navient (the “Separation and Distribution Agreement”). We also entered into various other ancillary agreements with Navient to effect the Spin-Off and provide a framework for our relationship with Navient thereafter, such as a transition services agreement, a tax sharing agreement, an employee matters agreement, a loan servicing and administration agreement, a joint marketing agreement, a key services agreement, a data sharing agreement and a master sublease agreement. The majority of these agreements are transitional in nature with most having terms that have expired or will expire within the next
one
to
two years
.
We continue to have exposure to risks related to Navient’s creditworthiness. If we are unable to obtain indemnification payments from Navient, our results of operations and financial condition could be materially and adversely affected.
Pursuant to the terms of the Spin-Off and applicable law, Navient is responsible for all liabilities (whether accrued, contingent or otherwise and whether known or unknown) arising out of or resulting from the conduct of pre-Spin-Off SLM and its subsidiaries’ businesses prior to the Spin-Off, other than certain specifically identified liabilities relating to the conduct of our consumer banking business for which the Bank is responsible. Nonetheless, given the prior usage of the Sallie Mae and SLM names by entities now owned by Navient, we and our subsidiaries may from time to time be improperly named as defendants in legal proceedings where the allegations at issue are the legal responsibility of Navient. Most of these legal proceedings involve matters that arose in whole or in part in the ordinary course of business of pre-Spin-Off SLM. Likewise, as the period of time since the Spin-Off increases, so does the likelihood any allegations that may be made may be in part for our own actions in a post-Spin-Off time period and in part for Navient’s conduct in a pre-Spin-Off time period. We will not be providing information on these proceedings unless there are material issues of fact or disagreement with Navient as to the bases of the proceedings or responsibility therefor that we believe could have a material, adverse impact on our business, assets, financial condition, liquidity or outlook if not resolved in our favor.
We briefly summarize below some of the most significant agreements and relationships we continue to have with Navient. For additional information regarding the Separation and Distribution Agreement and the other ancillary agreements, see our Current Report on Form 8-K filed on May 2, 2014.
Separation and Distribution Agreement
The Separation and Distribution Agreement addresses, among other things, the following activities:
|
•
|
the obligation of each party to indemnify the other against liabilities retained or assumed by that party pursuant to the Separation and Distribution Agreement and in connection with claims of third-parties;
|
|
•
|
the allocation among the parties of rights and obligations under insurance policies; and
|
F-71
SLM CORPORATION
NOTES TO CONSOLIDATED FINANCIAL STATEMENTS (Continued)
(Dollars in thousands, unless otherwise noted)
|
15.
|
Arrangements with Navient Corporation (Continued)
|
|
|
•
|
the creation of a governance structure, including a separation oversight committee of representatives from us and Navient, by which matters related to the separation and other transactions contemplated by the Separation and Distribution Agreement will be monitored and managed.
|
The Separation and Distribution Agreement provides specific processes and procedures pursuant to which we may submit claims for indemnification to Navient. If for any reason Navient is unable or unwilling to pay claims made against it, our costs, operating expenses, cash flows and financial condition could be materially and adversely affected over time.
Indemnification Obligations
Pursuant to the terms of the Separation and Distribution Agreement, and as contemplated by the structure of the Spin-Off, Navient is legally obligated to indemnify the Bank against all claims, actions, damages, losses or expenses that may arise from the conduct of all activities of pre-Spin-Off SLM occurring prior to the Spin-Off, except for certain liabilities specifically assumed by the Bank in the agreement as to which the Bank would be obligated to indemnify Navient. Some significant examples of the types of indemnification obligations Navient has under the Separation and Distribution Agreement and related ancillary agreements include:
|
•
|
Navient is required to indemnify the Company and the Bank for any liabilities, costs or expenses they may incur arising from any action or threatened action related to the servicing, operations and collections activities of pre-Spin-Off SLM and its subsidiaries with respect to Private Education Loans and FFELP Loans that were assets of the Bank or Navient at the time of the Spin-Off; provided that written notice was provided to Navient on or prior to April 30, 2017, the third anniversary date of the Spin-Off. Navient is not required to indemnify for changes in law or changes in prior existing interpretations of law that occur on or after April 30, 2014.
|
|
•
|
In connection with the Spin-Off, we recorded a liability related to uncertain tax positions of $
27
million for which we are indemnified by Navient. As of December 31, 2018, the remaining balance of the indemnification receivable related to those uncertain tax positions was $
24
million.
|
Long-Term Arrangements
The loan servicing and administration agreement governs the terms by which Navient provides servicing, administration and collection services for the Bank’s portfolio of FFELP Loans, as well as servicing history information with respect to Private Education Loans previously serviced by Navient and access to certain promissory notes in Navient’s possession. The term of the loan servicing and administration agreement has been extended to April 30, 2022.
The data sharing agreement states we will continue to have the right to obtain from Navient certain post-Spin-Off performance data relating to Private Education Loans owned or serviced by Navient to support and facilitate ongoing underwriting, originations, forecasting, performance and reserve analyses. Unless extended by the parties, the term of the data sharing agreement will expire on April 29, 2019.
The tax sharing agreement governs the respective rights, responsibilities and obligations of us and Navient after the Spin-Off relating to taxes, including with respect to the payment of taxes, the preparation and filing of tax returns and the conduct of tax contests. Under this agreement, each party is generally liable for taxes attributable to its business. The agreement also addresses the allocation of tax liabilities that are incurred as a result of the Spin-Off and related transactions. Additionally, the agreement restricts the parties from taking certain actions that could prevent the Spin-Off from qualifying for the anticipated tax treatment.
F-72
SLM CORPORATION
NOTES TO CONSOLIDATED FINANCIAL STATEMENTS (Continued)
(Dollars in thousands, unless otherwise noted)
|
15.
|
Arrangements with Navient Corporation (Continued)
|
|
Amended Loan Participation and Purchase Agreement
Prior to the Spin-Off, the Bank sold substantially all of its Private Education Loans to several former affiliates, now subsidiaries of Navient (collectively, the “Purchasers”), pursuant to this agreement. This agreement predates the Spin-Off, but was significantly amended and reduced in scope in connection with the Spin-Off. Post-Spin-Off, the Bank retained only the right to require the Purchasers to purchase Split Loans (at fair value) when the Split Loans either (1) were more than
90 days
past due; (2) had been restructured; (3) had been granted a hardship forbearance or more than
six months
of administrative forbearance; or (4) had a borrower or cosigner who had filed for bankruptcy. In the second quarter of 2018, we sold our remaining
$43 million
portfolio of Split Loans (both current and non-current loans) to Navient and recognized a net gain of
$2 million
.
During the year ended December 31, 2017, the Bank sold loans to the Purchasers in the amount of $
12
million in principal and $
0.3
million in accrued interest income. During the year ended December 31, 2016, the Bank sold loans to the Purchasers in the amount of
$16
million in principal and
$0.3
million in accrued interest income. There was
no
gain or loss resulting from loans sold to the Purchasers in the years ended December 31, 2017 and 2016, respectively. Total write-downs to fair value for loans sold to the Purchasers with a fair value lower than par totaled
$5
million and
$6
million in the years ended December 31, 2017 and 2016, respectively. Navient is the servicer for all of these loans.
F-73
SLM CORPORATION
NOTES TO CONSOLIDATED FINANCIAL STATEMENTS (Continued)
(Dollars in thousands, unless otherwise noted)
16. Regulatory Capital
The Bank is subject to various regulatory capital requirements administered by the FDIC and UDFI. Failure to meet minimum capital requirements can initiate certain mandatory and possibly additional discretionary actions by regulators that, if undertaken, could have a direct material adverse effect on our business, results of operations and financial condition. Under the FDIC’s regulations implementing the Basel III capital framework (“U.S. Basel III”) and the regulatory framework for prompt corrective action, the Bank must meet specific capital standards that involve quantitative measures of its assets, liabilities and certain off-balance sheet items as calculated under regulatory accounting practices. The Bank’s capital amounts and its classification under the prompt corrective action framework are also subject to qualitative judgments by the regulators about components of capital, risk weightings and other factors.
The Bank is required to report regulatory capital and ratios in accordance with U.S. Basel III. Among other things, U.S. Basel III established Common Equity Tier 1 as a tier of capital, modified methods for calculating risk-weighted assets, introduced a capital conservation buffer (which is has been phased in over several years), and revised the capital thresholds of the prompt corrective action framework, including the “well capitalized” standard.
“Well capitalized” regulatory requirements are the quantitative measures established by regulation to ensure capital adequacy. To qualify as “well capitalized,” the Bank must maintain minimum amounts and ratios (set forth in the table below) of Common Equity Tier 1, Tier 1 and Total capital to risk-weighted assets and of Tier 1 capital to average assets. The following capital amounts and ratios are based upon the Bank’s assets.
|
|
Actual
|
“Well Capitalized”
Regulatory Requirements |
|||||||||||
|
Amount
|
Ratio
|
Amount
|
Ratio
|
||||||||||
|
As of December 31, 2018:
|
|||||||||||||
|
Common Equity Tier 1 Capital (to Risk-Weighted Assets)
|
$
|
2,896,091
|
|
12.1
|
%
|
$
|
1,558,174
|
|
>
|
6.5
|
%
|
||
|
Tier 1 Capital (to Risk-Weighted Assets)
|
$
|
2,896,091
|
|
12.1
|
%
|
$
|
1,917,752
|
|
>
|
8.0
|
%
|
||
|
Total Capital (to Risk-Weighted Assets)
|
$
|
3,196,279
|
|
13.3
|
%
|
$
|
2,397,190
|
|
>
|
10.0
|
%
|
||
|
Tier 1 Capital (to Average Assets)
|
$
|
2,896,091
|
|
11.1
|
%
|
$
|
1,299,032
|
|
>
|
5.0
|
%
|
||
|
As of December 31, 2017:
|
|||||||||||||
|
Common Equity Tier 1 Capital (to Risk-Weighted Assets)
|
$
|
2,350,081
|
|
11.9
|
%
|
$
|
1,288,435
|
|
>
|
6.5
|
%
|
||
|
Tier 1 Capital (to Risk-Weighted Assets)
|
$
|
2,350,081
|
|
11.9
|
%
|
$
|
1,585,767
|
|
>
|
8.0
|
%
|
||
|
Total Capital (to Risk-Weighted Assets)
|
$
|
2,597,926
|
|
13.1
|
%
|
$
|
1,982,208
|
|
>
|
10.0
|
%
|
||
|
Tier 1 Capital (to Average Assets)
|
$
|
2,350,081
|
|
11.0
|
%
|
$
|
1,067,739
|
|
>
|
5.0
|
%
|
||
Bank Dividends
The Bank is chartered under the laws of the State of Utah and its deposits are insured by the FDIC. The Bank’s ability to pay dividends is subject to the laws of Utah and the regulations of the FDIC. Generally, under Utah’s industrial bank laws and regulations as well as FDIC regulations, the Bank may pay dividends from its net profits without regulatory approval if, following the payment of the dividend, the Bank’s capital and surplus would not be impaired. The Bank paid
no
dividends on its common stock for the years ended December 31,
2018
,
2017
and 2016, respectively. In the future, we expect that the Bank will pay dividends to the Company as may be necessary to pay any declared dividends on its Series B Preferred Stock and common stock and to consummate any common share repurchases by the Company under the new repurchase program.
F-74
SLM CORPORATION
NOTES TO CONSOLIDATED FINANCIAL STATEMENTS (Continued)
(Dollars in thousands, unless otherwise noted)
17. Defined Contribution Plans
We participate in a defined contribution plan which is intended to qualify under section 401(k) of the Internal Revenue Code. The Sallie Mae 401(k) Savings Plan covers substantially all employees. After
six
months of service, we match
100 percent
of the first
five percent
of contributions for eligible employees. For the years ended December 31,
2018
,
2017
and
2016
, we contributed $
5.4
million, $
5.0
million and
$4.4
million, respectively, to this plan.
18. Commitments, Contingencies and Guarantees
Commitments
When we approve a Private Education Loan at the beginning of an academic year, that approval may cover the borrowing for the entire academic year. As such, we do not always disburse the full amount of the loan at the time of such approval, but instead have a commitment to fund a portion of the loan at a later date (usually at the start of the second semester or subsequent trimesters). At December 31,
2018
, we had $
2
billion of outstanding contractual loan commitments which we expect to fund during the remainder of the 2018/2019 academic year. At December 31,
2018
, we had a
$2 million
reserve recorded in “Other Liabilities” to cover expected losses that may occur during the
one
-year loss emergence period on these unfunded commitments.
Regulatory Matters
On May 13, 2014, the Bank reached settlement with the Department of Justice (“DOJ”) regarding compliance with the Servicemembers Civil Relief Act (“SCRA”). In connection with the settlement, the Bank became subject to the DOJ Consent Order, which was approved by the U.S. District Court for the District of Delaware on September 29, 2014. Under the terms of the Separation and Distribution Agreement, Navient is responsible for funding all liabilities under the order and, as of the date hereof, has funded all liabilities other than fines directly levied against the Bank in connection with these matters which the Bank is required to pay.
The DOJ Consent Order expired by its terms on September 29, 2018, and the related case was dismissed with prejudice on October 4, 2018.
In May 2014, the Bank received a Civil Investigative Demand (“CID”) from the CFPB as part of the CFPB’s separate investigation relating to customer complaints, fees and charges assessed in connection with the servicing of student loans and related collection practices of pre-Spin-Off SLM by entities now subsidiaries of Navient during a time period prior to the Spin-Off (the “CFPB Investigation”).
Two
state attorneys general also provided the Bank identical CIDs and other state attorneys general have become involved in the inquiry over time (collectively, the “Multi-State Investigation”). To the extent requested, the Bank has been cooperating fully with the CFPB and the attorneys general conducting the Multi-State Investigation. Given the timeframe covered by the CIDs, the CFPB Investigation and the Multi-State Investigation, and the focus on practices and procedures previously conducted by Navient and its servicing subsidiaries prior to the Spin-Off, Navient is leading the response to these investigations. Consequently, we have no basis from which to estimate either the duration or ultimate outcome of these investigations.
F-75
SLM CORPORATION
NOTES TO CONSOLIDATED FINANCIAL STATEMENTS (Continued)
(Dollars in thousands, unless otherwise noted)
|
18.
|
Commitments, Contingencies and Guarantees (Continued)
|
|
With regard to the CFPB Investigation, we note that on January 18, 2017, the CFPB filed a complaint in federal court in Pennsylvania against Navient, along with its subsidiaries, Navient Solutions, Inc. and Pioneer Credit Recovery, Inc. The complaint alleges these Navient entities, among other things, engaged in deceptive practices with respect to their historic servicing and debt collection practices. Neither SLM, the Bank, nor any of their current subsidiaries are named in, or otherwise a party to, the lawsuit and are not alleged to have engaged in any wrongdoing. The CFPB’s complaint asserts Navient’s assumption of these liabilities pursuant to the Separation and Distribution Agreement.
On January 18, 2017, the Illinois Attorney General filed a lawsuit in Illinois state court against Navient - its subsidiaries Navient Solutions, Inc., Pioneer Credit Recovery, Inc., and General Revenue Corporation - and the Bank arising out of the Multi-State Investigation. On March 20, 2017, the Bank moved to dismiss the Illinois Attorney General action as to the Bank, arguing, among other things, the complaint failed to allege with sufficient particularity or specificity how the Bank was responsible for any of the alleged conduct, most of which predated the Bank’s existence. On July 10, 2018, the Court granted the Bank’s motion to dismiss without prejudice. On August 7, 2018, the Illinois Attorney General filed a First Amended Complaint and, on October 9, 2018, the Bank again moved to dismiss the action based on grounds similar to those raised in its March 20, 2017 motion. The Illinois Attorney General filed its response on November 21, 2018, and the Bank filed its reply on December 10, 2018. Oral argument on the motion took place on January 9, 2019. The Court took the motion under advisement.
On July 17, 2018, the Mississippi Attorney General filed a lawsuit in Mississippi state court against Navient, Navient Solutions, LLC, and the Bank arising out of the Multi-State Investigation. The complaint alleges unfair and deceptive trade practices against all three defendants as to private loan origination practices from 2000 to 2009, and against the two Navient defendants as to servicing practices between 2010 and the present. The complaint further alleges that Navient assumed responsibility for these matters under the Separation and Distribution Agreement for alleged conduct that pre-dated the Spin-Off. On September 27, 2018, the Mississippi Attorney General filed an amended complaint. On October 8, 2018, the Bank moved to dismiss the Mississippi Attorney General’s action as to the Bank, arguing, among other things, that the complaint failed to allege with sufficient particularity or specificity how the Bank was responsible for any of the alleged conduct, most of which predated the Bank’s existence. On November 20, 2018, the Mississippi Attorney General filed an opposition brief and the Bank filed a reply on December 21, 2018. A hearing on the motion to dismiss is scheduled for April 11, 2019.
To date,
three
other state attorneys general (California, Washington and Pennsylvania) have filed suits against Navient and one or more of its current subsidiaries related to matters arising from the Multi-State Investigation. Neither SLM, the Bank, nor any of their current subsidiaries are named in, or otherwise a party to, the California, Washington or Pennsylvania lawsuits, and no claims are asserted against them. Each complaint asserts in its own fashion that Navient assumed responsibility under the Separation and Distribution Agreement for the alleged conduct in the complaints. On September 24, 2018, the Washington Attorney General served a third-party subpoena on the Bank calling for the production of certain records. The Bank has responded to the subpoena.
Additional lawsuits may arise from the Multi-State Investigation which may or may not name the Company, the Bank or any of their current subsidiaries as parties to these suits. Pursuant to the terms of the Separation and Distribution Agreement, and as contemplated by the structure of the Spin-Off, Navient is legally obligated to indemnify the Bank against all claims, actions, damages, losses or expenses that may arise from the conduct of all activities of pre-Spin-Off SLM occurring prior to the Spin-Off, except for certain liabilities related to the conduct of the pre-Spin-Off consumer banking business that were specifically assumed by the Bank (and as to which the Bank is obligated to indemnify Navient). Navient has acknowledged its indemnification obligations under the Separation and Distribution Agreement, in connection with the Multi-State Investigation and the related lawsuits in which the Bank has been named as a party, and has indemnified the Bank for all costs incurred to date in defending the Illinois lawsuit. Navient has informed the Bank, however, that it believes that the Bank may be responsible to indemnify Navient against certain potential liabilities arising from the above-described lawsuits under the Separation and Distribution Agreement and/or a separate loan servicing agreement between the parties, and has suggested that the parties defer further discussion regarding indemnification obligations, and reimbursement of ongoing legal costs, in
F-76
SLM CORPORATION
NOTES TO CONSOLIDATED FINANCIAL STATEMENTS (Continued)
(Dollars in thousands, unless otherwise noted)
|
18.
|
Commitments, Contingencies and Guarantees (Continued)
|
|
connection with the lawsuits until the lawsuits are resolved. The Bank disagrees with Navient’s position and the Bank has reiterated to Navient that Navient is responsible for promptly indemnifying the Bank against all liabilities arising out of the conduct of pre-Spin-Off SLM that are at issue in the Multi-State Investigation and in the above-described lawsuits.
Contingencies
In the ordinary course of business, we and our subsidiaries are routinely defendants in or parties to pending and threatened legal actions and proceedings, including actions brought on behalf of various classes of claimants. These actions and proceedings may be based on alleged violations of consumer protection, securities, employment and other laws. In certain of these actions and proceedings, claims for substantial monetary damage may be asserted against us and our subsidiaries.
It is common for the Company, our subsidiaries and affiliates to receive information and document requests and investigative demands from state attorneys general, legislative committees, and administrative agencies. These requests may be for informational or regulatory purposes and may relate to our business practices, the industries in which we operate, or other companies with whom we conduct business. Our practice has been and continues to be to cooperate with these bodies and be responsive to any such requests.
We are required to establish reserves for litigation and regulatory matters where those matters present loss contingencies that are both probable and estimable. When loss contingencies are not both probable and estimable, we do not establish reserves.
Based on current knowledge, management does not believe there are loss contingencies, if any, arising from pending investigations, litigation or regulatory matters for which reserves should be established.
F-77
SLM CORPORATION
NOTES TO CONSOLIDATED FINANCIAL STATEMENTS (Continued)
(Dollars in thousands, unless otherwise noted)
19. Income Taxes
Reconciliations of the statutory U.S. federal income tax rates to our effective tax rate for continuing operations follow:
|
|
Years Ended December 31,
|
||||||||
|
|
2018
|
2017
|
2016
|
||||||
|
Statutory rate
|
21.0
|
%
|
35.0
|
%
|
35.0
|
%
|
|||
|
Tax reform
|
(0.3
|
)
|
3.1
|
|
—
|
|
|||
|
State tax, net of federal benefit
|
3.8
|
|
2.6
|
|
3.1
|
|
|||
|
Reverse federal impact of indemnification adjustments
|
3.5
|
|
2.5
|
|
(0.7
|
)
|
|||
|
Unrecognized tax benefits, U.S. federal and state, net of federal benefit
|
(15.9
|
)
|
(2.0
|
)
|
1.6
|
|
|||
|
Excess tax benefits/deficiencies for employee stock-based compensation, federal and state, net of federal benefit
|
(0.6
|
)
|
(1.7
|
)
|
—
|
|
|||
|
Impact of state rate change on net deferred tax liabilities, net of federal benefit
|
(0.4
|
)
|
0.6
|
|
(0.5
|
)
|
|||
|
State, valuation allowance adjustments on net operating losses
|
0.4
|
|
0.2
|
|
1.0
|
|
|||
|
Other, net
|
1.4
|
|
0.9
|
|
0.1
|
|
|||
|
Effective tax rate
|
12.9
|
%
|
41.2
|
%
|
39.6
|
%
|
|||
The effective tax rate varies from the statutory U.S. federal rate of
21 percent
primarily due to the reduction in uncertain tax positions related to statutes of limitations expirations and the impact of state taxes, net of federal benefit, for the year ended December 31,
2018
; the impact of tax reform and state taxes, net of federal benefit, for the year ended December 31,
2017
; and the impact of state taxes, net of federal benefit, for the year ended December 31,
2016
.
Income tax expense consists of:
|
|
December 31,
|
|||||||||||
|
2018
|
2017
|
2016
|
||||||||||
|
Current provision:
|
||||||||||||
|
Federal
|
$
|
102,516
|
|
$
|
248,191
|
|
$
|
228,505
|
|
|||
|
State
|
32,638
|
|
13,092
|
|
24,336
|
|
||||||
|
Total current provision
|
135,154
|
|
261,283
|
|
252,841
|
|
||||||
|
Deferred (benefit)/provision:
|
||||||||||||
|
Federal
|
(57,076
|
)
|
(58,124
|
)
|
(89,518
|
)
|
||||||
|
State
|
(6,225
|
)
|
(628
|
)
|
786
|
|
||||||
|
Total deferred benefit
|
(63,301
|
)
|
(58,752
|
)
|
(88,732
|
)
|
||||||
|
Provision for income tax expense
|
$
|
71,853
|
|
$
|
202,531
|
|
$
|
164,109
|
|
|||
F-78
SLM CORPORATION
NOTES TO CONSOLIDATED FINANCIAL STATEMENTS (Continued)
(Dollars in thousands, unless otherwise noted)
|
19.
|
Income Taxes (Continued)
|
|
The tax effect of temporary differences that give rise to deferred tax assets and liabilities is summarized below.
|
|
December 31,
|
|||||||
|
2018
|
2017
|
|||||||
|
Deferred tax assets:
|
||||||||
|
Loan reserves
|
$
|
85,100
|
|
$
|
62,603
|
|
||
|
Stock-based compensation plans
|
9,312
|
|
10,216
|
|
||||
|
Deferred revenue
|
1,081
|
|
782
|
|
||||
|
Operating loss carryovers
|
—
|
|
4,186
|
|
||||
|
Accrued expenses not currently deductible
|
12,896
|
|
5,356
|
|
||||
|
Unrecorded tax benefits
|
5,106
|
|
3,781
|
|
||||
|
Market value adjustments on student loans, investments and derivatives
|
1,460
|
|
1,974
|
|
||||
|
Other
|
953
|
|
436
|
|
||||
|
Total deferred tax assets
|
115,908
|
|
89,334
|
|
||||
|
Deferred tax liabilities:
|
||||||||
|
Gains on repurchased debt
|
—
|
|
40,175
|
|
||||
|
Fixed assets
|
7,150
|
|
5,303
|
|
||||
|
Acquired intangible assets
|
5,179
|
|
4,595
|
|
||||
|
Unrealized gains
|
3,436
|
|
1,104
|
|
||||
|
Federal deferred for state receivable
|
2,083
|
|
3,584
|
|
||||
|
Student loan premiums and discounts, net
|
1,971
|
|
1,051
|
|
||||
|
Other
|
285
|
|
298
|
|
||||
|
Total deferred tax liabilities
|
20,104
|
|
56,110
|
|
||||
|
Net deferred tax assets
|
$
|
95,804
|
|
$
|
33,224
|
|
||
Included in operating loss carryovers is a valuation allowance of $
19.1
million and $
68.6
million as of December 31,
2018
and 2017, respectively, against our state net operating loss carryovers that management believes is more likely than not to expire prior to being realized. The ultimate realization of the deferred tax assets is dependent upon the generation of future taxable income of the appropriate character (i.e., capital or ordinary) during the period in which the temporary differences become deductible. Management considers, among other things, the scheduled reversals of deferred tax liabilities and the history of positive taxable income in evaluating the realizability of the deferred tax assets. Management believes that it is more likely than not that the results of future operations will generate sufficient taxable income to realize our deferred tax assets (other than state net operating loss carryovers as outlined above).
As of December 31,
2018
, the state net operating loss carryforwards will begin to expire in 2029.
F-79
SLM CORPORATION
NOTES TO CONSOLIDATED FINANCIAL STATEMENTS (Continued)
(Dollars in thousands, unless otherwise noted)
|
19.
|
Income Taxes (Continued)
|
|
Accounting for Uncertainty in Income Taxes
The following table summarizes changes in unrecognized tax benefits:
|
|
December 31,
|
|||||||||||
|
2018
|
2017
|
2016
|
||||||||||
|
Unrecognized tax benefits at beginning of year
|
$
|
131,608
|
|
$
|
152,581
|
|
$
|
47,109
|
|
|||
|
Increases resulting from tax positions taken during a prior period
|
4,121
|
|
7,482
|
|
110,894
|
|
||||||
|
Decreases resulting from tax positions taken during a prior period
|
—
|
|
(7,025
|
)
|
(3,285
|
)
|
||||||
|
Increases resulting from tax positions taken during the current period
|
3,169
|
|
1,656
|
|
817
|
|
||||||
|
Decreases related to settlements with taxing authorities
|
(601
|
)
|
(3,594
|
)
|
(123
|
)
|
||||||
|
Reductions related to the lapse of statute of limitations
|
(86,138
|
)
|
(19,492
|
)
|
(2,831
|
)
|
||||||
|
Unrecognized tax benefits at end of year
|
$
|
52,159
|
|
$
|
131,608
|
|
$
|
152,581
|
|
|||
As of December 31,
2018
, the gross unrecognized tax benefits are
$52.2
million. Included in the
$52.2
million are
$47.2
million of unrecognized tax benefits that, if recognized, would favorably impact the effective tax rate. As a part of the Spin-Off, the Company recorded a liability related to uncertain tax positions for which it is indemnified by Navient. See Note 2, “Significant Accounting Policies — Income Taxes,” for additional details.
Tax related interest and penalty expense is reported as a component of income tax expense. As of December 31,
2018
,
2017
and 2016, the total amount of income tax-related accrued interest and penalties, net of related benefit, recognized in the consolidated balance sheets was $
13.6
million, $
21.2
million and $
20.2
million, respectively.
For the years ended December 31,
2018
,
2017
and
2016
, the total amount of income tax-related accrued interest, net of related tax benefit, recognized in the consolidated statements of income was $
(7.3)
million, $
2.7
million and $
5.1
million, respectively.
The Company or one of its subsidiaries files income tax returns at the U.S. federal level and in most U.S. states. U.S. federal income tax returns filed for years 2014 and prior are no longer subject to examination. Various combinations of subsidiaries, tax years, and jurisdictions remain open for review, subject to statute of limitations periods (typically
3
to
4
prior years). We do not expect the resolution of open audits to have a material impact on our unrecognized tax benefits.
It is reasonably possible that the uncertain tax position reserve may decrease by as much as $
6.2
million during the next 12 months due to the expiration of statutes of limitations primarily related to indemnified tax liabilities. The reduction in the uncertain tax position reserve would be reflected as a tax benefit. We recorded a tax indemnification receivable from Navient for the indemnified tax liabilities which are included in the uncertain tax position reserve. A portion of the tax benefit will be offset by an expense related to the write-down of the indemnification receivable.
F-80
SLM CORPORATION
NOTES TO CONSOLIDATED FINANCIAL STATEMENTS (Continued)
(Dollars in thousands, unless otherwise noted)
20. Concentrations of Risk
Our business is primarily focused on helping students and their families save, plan and pay for college. We primarily originate, service and/or collect loans made to students and their families to finance the cost of their education. We provide funding, delivery and servicing support for education loans in the United States through our Private Education Loan program. Because of this concentration in one industry, we are exposed to credit, legislative, operational, regulatory, and liquidity risks associated with the student loan industry.
Concentration Risk in the Revenues Associated with Private Education Loans
We compete in the Private Education Loan market with banks and other consumer lending institutions, some with strong consumer brand name recognition and greater financial resources. We compete based on our products, origination capability and customer service. To the extent our competitors compete aggressively or more effectively, we could lose market share to them or subject our existing loans to refinancing risk. Our product offerings may not prove to be profitable and may result in higher than expected losses.
We are a leading provider of saving- and paying-for-college products and programs. This concentration gives us a competitive advantage in the marketplace. This concentration also creates risks in our business, particularly in light of our concentration as a Private Education Loan lender. If population demographics result in a decrease in college-age individuals, if demand for higher education decreases, if the cost of attendance of higher education decreases, if public resistance to higher education costs strengthens, or if the demand for higher education loans decreases, our consumer lending business could be negatively affected. In addition, the federal government, through the Federal Direct Student Loan Program (the “DSLP”), poses significant competition to our private credit loan products. If loan limits under the DSLP increase, DSLP loans could be more widely available to students and their families and DSLP loans could increase, resulting in further decreases in the size of the Private Education Loan market and demand for our Private Education Loan products.
F-81
SLM CORPORATION
NOTES TO CONSOLIDATED FINANCIAL STATEMENTS (Continued)
(Dollars in thousands, unless otherwise noted)
21. Parent Only Statements
The following parent company-only financial information should be read in conjunction with the other notes to the consolidated financial statements. The accounting policies for the parent company-only financial statements are the same as those used in the presentation of the consolidated financial statements other than the parent company-only financial statements account for the parent company’s investments in its subsidiaries under the equity method.
Parent Only Condensed Balance Sheets
|
December 31,
|
||||||||
|
2018
|
2017
|
|||||||
|
Assets
|
||||||||
|
Cash and cash equivalents
|
$
|
191,776
|
|
$
|
260,255
|
|
||
|
Total investments in subsidiaries (primarily Sallie Mae Bank)
|
2,963,949
|
|
2,401,114
|
|
||||
|
Tax indemnification receivable
|
39,207
|
|
168,011
|
|
||||
|
Due from subsidiaries, net
|
48,798
|
|
37,521
|
|
||||
|
Other assets
|
2,246
|
|
1,279
|
|
||||
|
Total assets
|
$
|
3,245,976
|
|
$
|
2,868,180
|
|
||
|
Liabilities and Equity
|
||||||||
|
Liabilities
|
||||||||
|
Long-term borrowings
|
$
|
197,348
|
|
$
|
196,539
|
|
||
|
Income taxes payable, net
|
37,271
|
|
159,954
|
|
||||
|
Payable due to Navient
|
9,480
|
|
10,575
|
|
||||
|
Other liabilities
|
29,221
|
|
26,856
|
|
||||
|
Total liabilities
|
273,320
|
|
393,924
|
|
||||
|
Equity
|
||||||||
|
Preferred stock, par value $0.20 per share, 20 million shares authorized:
|
||||||||
|
Series B: 4 million and 4 million shares issued, respectively, at stated value of $100 per share
|
400,000
|
|
400,000
|
|
||||
|
Common stock, par value $0.20 per share, 1.125 billion shares authorized: 449.9 million and 443.5 million shares issued, respectively
|
89,972
|
|
88,693
|
|
||||
|
Additional paid-in capital
|
1,274,635
|
|
1,222,277
|
|
||||
|
Accumulated other comprehensive income (net of tax expense of $3,436 and $1,696, respectively)
|
10,623
|
|
2,748
|
|
||||
|
Retained earnings
|
1,340,017
|
|
868,182
|
|
||||
|
Total SLM Corporation stockholders’ equity before treasury stock
|
3,115,247
|
|
2,581,900
|
|
||||
|
Less: Common stock held in treasury at cost: 14.2 million and 11.1 million shares, respectively
|
(142,591
|
)
|
(107,644
|
)
|
||||
|
Total equity
|
2,972,656
|
|
2,474,256
|
|
||||
|
Total liabilities and equity
|
$
|
3,245,976
|
|
$
|
2,868,180
|
|
||
F-82
SLM CORPORATION
NOTES TO CONSOLIDATED FINANCIAL STATEMENTS (Continued)
(Dollars in thousands, unless otherwise noted)
|
21.
|
Parent Only Statements (Continued)
|
|
Parent Only Condensed Statements of Income
|
Years Ended December 31,
|
||||||||||||
|
2018
|
2017
|
2016
|
||||||||||
|
Interest income
|
$
|
4,693
|
|
$
|
5,497
|
|
$
|
5,367
|
|
|||
|
Interest expense
|
11,059
|
|
8,170
|
|
—
|
|
||||||
|
Net interest income (loss)
|
(6,366
|
)
|
(2,673
|
)
|
5,367
|
|
||||||
|
Non-interest income (loss)
|
(93,176
|
)
|
(33,956
|
)
|
9,396
|
|
||||||
|
Non-interest expenses
|
41,893
|
|
35,810
|
|
32,553
|
|
||||||
|
Loss before income tax benefit and equity in net income from subsidiaries
|
(141,435
|
)
|
(72,439
|
)
|
(17,790
|
)
|
||||||
|
Income tax benefit
|
(96,170
|
)
|
(40,598
|
)
|
(2,839
|
)
|
||||||
|
Equity in net income from subsidiaries (primarily Sallie Mae Bank)
|
532,741
|
|
320,775
|
|
265,278
|
|
||||||
|
Net income
|
487,476
|
|
288,934
|
|
250,327
|
|
||||||
|
Preferred stock dividends
|
15,640
|
|
15,714
|
|
21,204
|
|
||||||
|
Net income attributable to SLM Corporation common stock
|
$
|
471,836
|
|
$
|
273,220
|
|
$
|
229,123
|
|
|||
F-83
SLM CORPORATION
NOTES TO CONSOLIDATED FINANCIAL STATEMENTS (Continued)
(Dollars in thousands, unless otherwise noted)
|
21.
|
Parent Only Statements (Continued)
|
|
Parent Only Condensed Statements of Cash Flows
|
Years Ended December 31,
|
||||||||||||
|
2018
|
2017
|
2016
|
||||||||||
|
Cash flows from operating activities:
|
||||||||||||
|
Net income
|
$
|
487,476
|
|
$
|
288,934
|
|
$
|
250,327
|
|
|||
|
Adjustments to reconcile net income to net cash (used in) provided by operating activities:
|
|
|
|
|||||||||
|
Undistributed earnings of subsidiaries
|
(532,741
|
)
|
(320,775
|
)
|
(265,278
|
)
|
||||||
|
Reduction (income) on tax indemnification receivable
|
92,815
|
|
31,888
|
|
(12,283
|
)
|
||||||
|
Amortization of unsecured debt upfront fees
|
809
|
|
596
|
|
—
|
|
||||||
|
Decrease in investment in subsidiaries, net
|
9,495
|
|
1,158
|
|
63,222
|
|
||||||
|
Decrease in tax indemnification receivable
|
35,989
|
|
59,633
|
|
59,633
|
|
||||||
|
Increase in due from subsidiaries, net
|
(11,277
|
)
|
(5,687
|
)
|
(10,438
|
)
|
||||||
|
Increase in other assets
|
(18,040
|
)
|
(24,627
|
)
|
(8,972
|
)
|
||||||
|
Decrease in income taxes payable, net
|
(123,083
|
)
|
(87,983
|
)
|
(54,175
|
)
|
||||||
|
(Decrease) increase in payable due to entity that is a subsidiary of Navient
|
(1,089
|
)
|
(593
|
)
|
553
|
|
||||||
|
Increase in other liabilities
|
6,807
|
|
10,205
|
|
8,856
|
|
||||||
|
Total adjustments
|
(540,315
|
)
|
(336,185
|
)
|
(218,882
|
)
|
||||||
|
Net cash (used in) provided by operating activities
|
(52,839
|
)
|
(47,251
|
)
|
31,445
|
|
||||||
|
Cash flows from investing activities:
|
||||||||||||
|
Net cash (used in) provided by investing activities
|
—
|
|
—
|
|
—
|
|
||||||
|
Cash flows from financing activities:
|
||||||||||||
|
Unsecured debt issued
|
—
|
|
197,000
|
|
—
|
|
||||||
|
Issuance costs for unsecured debt offering
|
—
|
|
(1,057
|
)
|
—
|
|
||||||
|
Redemption of Series A Preferred Stock
|
—
|
|
(165,000
|
)
|
—
|
|
||||||
|
Preferred stock dividends paid
|
(15,640
|
)
|
(15,714
|
)
|
(21,204
|
)
|
||||||
|
Net cash (used in) provided by financing activities
|
(15,640
|
)
|
15,229
|
|
(21,204
|
)
|
||||||
|
Net (decrease) increase in cash and cash equivalents
|
(68,479
|
)
|
(32,022
|
)
|
10,241
|
|
||||||
|
Cash and cash equivalents at beginning of year
|
260,255
|
|
292,277
|
|
282,036
|
|
||||||
|
Cash and cash equivalents at end of year
|
$
|
191,776
|
|
$
|
260,255
|
|
$
|
292,277
|
|
|||
F-84
SLM CORPORATION
NOTES TO CONSOLIDATED FINANCIAL STATEMENTS (Continued)
(Dollars in thousands, unless otherwise noted)
22. Selected Quarterly Financial Information (unaudited)
|
2018
|
||||||||||||||||
|
First
|
Second
|
Third
|
Fourth
|
|||||||||||||
|
(Dollars in thousands, except per share data)
|
Quarter
|
Quarter
|
Quarter
|
Quarter
|
||||||||||||
|
Net interest income
|
$
|
332,614
|
|
$
|
340,950
|
|
$
|
356,633
|
|
$
|
382,867
|
|
||||
|
Less: provisions for credit losses
|
53,931
|
|
63,267
|
|
70,047
|
|
57,619
|
|
||||||||
|
Net interest income after provisions for credit losses
|
278,683
|
|
277,683
|
|
286,586
|
|
325,248
|
|
||||||||
|
Gains on sales of loans, net
|
—
|
|
2,060
|
|
—
|
|
—
|
|
||||||||
|
Losses on sales of securities, net
|
—
|
|
(1,549
|
)
|
—
|
|
—
|
|
||||||||
|
Gains (losses) on derivative and hedging activities, net
|
3,892
|
|
(5,268
|
)
|
(4,949
|
)
|
6,238
|
|
||||||||
|
Other income (loss)
|
9,642
|
|
12,295
|
|
(80,702
|
)
|
6,446
|
|
||||||||
|
Total non-interest expenses
|
124,966
|
|
135,315
|
|
150,724
|
|
145,971
|
|
||||||||
|
Income tax expense (benefit)
|
40,997
|
|
40,074
|
|
(53,667
|
)
|
44,449
|
|
||||||||
|
Net income
|
126,254
|
|
109,832
|
|
103,878
|
|
147,512
|
|
||||||||
|
Preferred stock dividends
|
3,397
|
|
3,920
|
|
4,124
|
|
4,199
|
|
||||||||
|
Net income attributable to SLM Corporation common stock
|
$
|
122,857
|
|
$
|
105,912
|
|
$
|
99,754
|
|
$
|
143,313
|
|
||||
|
Basic earnings per common share attributable to SLM Corporation
(1)
|
$
|
0.28
|
|
$
|
0.24
|
|
$
|
0.23
|
|
$
|
0.33
|
|
||||
|
Diluted earnings per common share attributable to SLM Corporation
(1)
|
$
|
0.28
|
|
$
|
0.24
|
|
$
|
0.23
|
|
$
|
0.33
|
|
||||
______
(1)
Basic and diluted earnings per common share attributable to SLM Corporation are computed independently for each of the quarters presented. Therefore, the sum of quarterly basic and diluted earnings per common share information may not equal annual basic and diluted earnings per common share.
F-85
SLM CORPORATION
NOTES TO CONSOLIDATED FINANCIAL STATEMENTS (Continued)
(Dollars in thousands, unless otherwise noted)
|
22.
|
Selected Quarterly Financial Information (unaudited) (Continued)
|
|
2017
|
||||||||||||||||
|
First
|
Second
|
Third
|
Fourth
|
|||||||||||||
|
(Dollars in thousands, except per share data)
|
Quarter
|
Quarter
|
Quarter
|
Quarter
|
||||||||||||
|
Net interest income
|
$
|
268,076
|
|
$
|
269,893
|
|
$
|
282,061
|
|
$
|
309,191
|
|
||||
|
Less: provisions for credit losses
|
25,296
|
|
50,215
|
|
54,930
|
|
55,324
|
|
||||||||
|
Net interest income after provisions for credit losses
|
242,780
|
|
219,678
|
|
227,131
|
|
253,867
|
|
||||||||
|
(Losses) gains on derivative and hedging activities, net
|
(5,378
|
)
|
(3,609
|
)
|
1,661
|
|
(940
|
)
|
||||||||
|
Other income (loss)
|
11,346
|
|
10,629
|
|
4,455
|
|
(21,066
|
)
|
||||||||
|
Total non-interest expenses
|
102,794
|
|
111,368
|
|
116,259
|
|
118,668
|
|
||||||||
|
Income tax expense
|
51,011
|
|
44,713
|
|
40,617
|
|
66,190
|
|
||||||||
|
Net income
|
94,943
|
|
70,617
|
|
76,371
|
|
47,003
|
|
||||||||
|
Preferred stock dividends
|
5,575
|
|
3,974
|
|
3,028
|
|
3,137
|
|
||||||||
|
Net income attributable to SLM Corporation common stock
|
$
|
89,368
|
|
$
|
66,643
|
|
$
|
73,343
|
|
$
|
43,866
|
|
||||
|
Basic earnings per common share attributable to SLM Corporation
(1)
|
$
|
0.21
|
|
$
|
0.15
|
|
$
|
0.17
|
|
$
|
0.10
|
|
||||
|
Diluted earnings per common share attributable to SLM Corporation
(1)
|
$
|
0.20
|
|
$
|
0.15
|
|
$
|
0.17
|
|
$
|
0.10
|
|
||||
_____
(1)
Basic and diluted earnings per common share attributable to SLM Corporation are computed independently for each of the quarters presented. Therefore, the sum of quarterly basic and diluted earnings per common share information may not equal annual basic and diluted earnings per common share.
F-86
SLM CORPORATION
NOTES TO CONSOLIDATED FINANCIAL STATEMENTS (Continued)
(Dollars in thousands, unless otherwise noted)
23. Subsequent Events
Amendment to the Secured Borrowing Facility
On February 20, 2019, we amended and extended the maturity of the Secured Borrowing Facility, discussed in Note 9, “Borrowings.” The amended Secured Borrowing Facility is a
$750 million
Secured Borrowing Facility, under which the full
$750 million
is available for us to draw. Under the amended Secured Borrowing Facility, we incur financing costs of between
0.35 percent
and
0.45 percent
on unused borrowing capacity and a variable-yield rate plus
0.85 percent
on outstandings. The amended Secured Borrowing Facility extends the revolving period, during which we may borrow, repay and reborrow funds, until February 19, 2020. The scheduled amortization period, during which amounts outstanding under the Secured Borrowing Facility must be repaid, ends on February 19, 2021 (or earlier, if certain material adverse events occur).
F-87
TABLE OF CONTENTS
Part IItem 1. BusinessItem 1A. Risk FactorsItem 1B. Unresolved Staff CommentsItem 2. PropertiesItem 3. Legal ProceedingsItem 4. Mine Safety DisclosuresPart IIItem 5. Market For Registrant S Common Equity, Related Stockholder Matters and Issuer Purchases Of Equity SecuritiesItem 6. Selected Financial DataItem 7. Management S Discussion and Analysis Of Financial Condition and Results Of OperationsItem 7A. Quantitative and Qualitative Disclosures About Market RiskItem 8. Financial Statements and Supplementary DataItem 9. Changes in and Disagreements with Accountants on Accounting and Financial DisclosureItem 9A. Controls and ProceduresItem 9B. Other InformationPart IIIItem 10. Directors, Executive Officers and Corporate GovernanceItem 11. Executive CompensationItem 12. Security Ownership Of Certain Beneficial Owners and Management and Related Stockholder MattersItem 13. Certain Relationships and Related Transactions, and Director IndependenceItem 14. Principal Accounting Fees and ServicesPart IVItem 15. Exhibits, Financial Statement Schedules