STABILIS ENERGY, INC.
10-Ks and 10-Qs
|
|
|
|
|
|
|
|
|
|
|
|
|
|
|
|
|
|
|
|
|
|
|
|
|
|
|
|
|
|
|
|
|
|
|
|
|
|
|
|
|
|
|
|
|
|
|
|
|
|
|
|
|
|
|
|
|
|
UNITED STATES
SECURITIES AND EXCHANGE COMMISSION
Washington, D.C. 20549
______________________________
FORM 10-K
______________________________
|
☒
|
ANNUAL REPORT PURSUANT TO SECTION 13 OR 15 (d) OF THE SECURITIES EXCHANGE ACT OF 1934
|
FOR THE FISCAL YEAR ENDED
December 31, 2019
|
☐
|
TRANSITION REPORT PURSUANT TO SECTION 13 OR 15 (d) OF THE SECURITIES EXCHANGE ACT OF 1934
|
FOR THE TRANSITION PERIOD FROM
TO
Commission File No. 000-24575
_____________________________
STABILIS ENERGY, INC.
(Exact name of registrant as specified in its charter)
_____________________________
|
Florida
|
59-3410234
|
|
(State or other jurisdiction
of incorporation or organization) |
(I.R.S. Employer
Identification No.) |
10375 Richmond Avenue, Suite 700, Houston, TX 77042
(Address of principal executive offices, including zip code)
(832) 456-6500
(Registrant’s telephone number, including area code)
Securities registered pursuant to Section 12(b) of the Act:
|
Title of each class
|
Trading symbol
|
Name of each exchange on which registered
|
|
Common Stock, $.001 par value per share
|
SLNG
|
The OTCQX Best Market
|
Securities registered pursuant to Section 12(g) of the Act: None
Indicate by check mark if the registrant is a well-known seasoned issuer, as defined in Rule 405 of the Securities Act. Yes
☐
No
☒
Indicate by check mark if the registrant is not required to file reports pursuant to Section 13 or Section 15(d) of the Act. Yes
☐
No
☒
Indicate by check mark whether the registrant (1) has filed all reports required to be filed by Section 13 or 15(d) of the Securities Exchange Act of 1934 during the preceding 12 months (or for such shorter period that the registrant was required to file such reports), and (2) has been subject to such filing requirements for the past 90 days. Yes
☒
No
☐
Indicate by check mark whether the registrant has submitted electronically every Interactive Data File required to be submitted pursuant to Rule 405 of Regulation S-T (S. 232.405 of this chapter) during the preceding 12 months (or for such shorter period that the registrant was required to submit such files). Yes
☒
No
☐
Indicate by check mark whether the registrant is a large accelerated filer, an accelerated filer, a non-accelerated filer, a smaller reporting company or an emerging growth company. See the definitions of “large accelerated filer,” “accelerated filer,” “smaller reporting company,” and “emerging growth company” in Rule 12b-2 of the Exchange Act:
|
Large accelerated filer
|
☐
|
Accelerated filer
|
☐
|
|||
|
Non-accelerated filer
|
☐
|
Smaller reporting company
|
☒
|
|||
|
Emerging growth company
|
☐
|
|||||
If an emerging growth company, indicate by check mark if the registrant has elected not to use the extended transition period for complying with any new or revised financial accounting standards provided pursuant to Section 13(a) of the Exchange Act.
☐
Indicate by check mark whether the registrant is a shell company (as defined in Rule 12b-2 of the Exchange Act). Yes
☐
No
☒
The aggregate market value of the registrant’s common stock held by non-affiliates of the registrant was $4,427,550 based on the closing sale price on June 30, 2019 as reported by the NASDAQ Stock Market.
As of February 29,
2020
, there were
16,835,318
outstanding shares of our common stock, par value $.001 per share.
STABILIS ENERGY, INC. AND SUBSIDIARIES
ANNUAL REPORT ON FORM 10-K
For the Fiscal Year Ended
December 31, 2019
TABLE OF CONTENTS
|
Page
|
||
|
Item 1.
|
||
|
Item 1A.
|
||
|
Item 1B.
|
||
|
Item 2.
|
||
|
Item 3.
|
||
|
Item 4.
|
Mine Safety Disclosures
|
|
|
Item 5.
|
||
|
Item 7.
|
||
|
Item 7A.
|
||
|
Item 8.
|
||
|
Item 9.
|
||
|
Item 9A.
|
||
|
Item 9B.
|
||
|
Item 10.
|
||
|
Item 11.
|
||
|
Item 12.
|
||
|
Item 13.
|
||
|
Item 14.
|
||
|
Item 15.
|
||
|
Item 16.
|
||
2
CAUTIONARY STATEMENT REGARDING FORWARD-LOOKING STATEMENTS
This document includes statements that constitute forward-looking statements within the meaning of the federal securities laws. These statements are subject to risks and uncertainties. These statements may relate to, but are not limited to, information or assumptions about us, our capital and other expenditures, dividends, financing plans, capital structure, cash flow, our recent business combination, pending legal and regulatory proceedings and claims, including environmental matters, future economic performance, operating income, cost savings, and management’s plans, strategies, goals and objectives for future operations and growth. These forward-looking statements generally are accompanied by words such as “intend,” “anticipate,” “believe,” “estimate,” “expect,” “should,” “seek,” “project,” “plan” or similar expressions. Any statement that is not a historical fact is a forward-looking statement. It should be understood that these forward-looking statements are necessarily estimates reflecting the best judgment of senior management, not guarantees of future performance. They are subject to a number of assumptions, risks and uncertainties that could cause actual results to differ materially from those expressed or implied in the forward-looking statements. When considering forward-looking statements, you should keep in mind the risk factors and other cautionary statements described in Part I. “Item 1A. Risk Factors” in this document.
Forward-looking statements represent intentions, plans, expectations, assumptions and beliefs about future events and are subject to risks, uncertainties and other factors. Many of those factors are outside of our control and could cause actual results to differ materially from the results expressed or implied by those forward-looking statements. In addition to the risk factors and other cautionary statements described in Part I. “Item 1A. Risk Factors” in this document, the factors include:
|
•
|
our ability to execute our business strategy;
|
|
•
|
our limited operating history;
|
|
•
|
our ability to obtain additional financing to effect our strategy;
|
|
•
|
loss of one or more of our customers;
|
|
•
|
cyclical or other changes in the demand for and price of LNG and natural gas;
|
|
•
|
operational, regulatory, environmental, political, legal and economic risks pertaining to the construction and operation of our facilities;
|
|
•
|
the effects of current and future worldwide economic conditions and demand for oil and natural gas and power system equipment and services;
|
|
•
|
hurricanes or other natural or man-made disasters;
|
|
•
|
public health crises, such as the coronavirus outbreak beginning in early 2020, which could impact economic conditions;
|
|
•
|
dependence on contractors for successful completions of our energy related infrastructure;
|
|
•
|
reliance on third party engineers;
|
|
•
|
competition from third parties in our business;
|
|
•
|
failure of LNG to be a competitive source of energy in the markets in which we operate, and seek to operate;
|
|
•
|
increased labor costs, and the unavailability of skilled workers or our failure to attract and retain qualified personnel;
|
|
•
|
major health and safety incidents relating to our business;
|
|
•
|
failure to obtain and maintain approvals and permits from governmental and regulatory agencies including with respect to our planned operational expansion in Mexico;
|
|
•
|
changes to health and safety, environmental and similar laws and governmental regulations that are adverse to our operations;
|
|
•
|
volatility of the market price of our common stock;
|
|
•
|
our ability to integrate successfully acquisitions in the expected timeframe; and
|
|
•
|
future benefits to be derived from our investments in technologies, joint ventures and acquired companies;
|
Should one or more of these risks or uncertainties materialize, or should any of our assumptions prove incorrect, actual results may vary in material respects from those projected in the forward-looking statements contained herein. We undertake no obligation to update or revise any forward-looking statements, whether as a result of new information, future events or otherwise, except as may be required under applicable securities laws. All forward-looking statements included in this document are expressly qualified in their entirety by the cautionary statements contained or referred to in this section. This cautionary statement should also be considered in connection with any subsequent written or oral forward-looking statements that we or persons acting on our behalf may issue.
In this Annual Report on Form 10-K, we may rely on and refer to information from market research reports, analyst reports and other publicly available information. Although we believe that this information is reliable, we cannot guarantee the accuracy and completeness of this information, and we have not independently verified it.
3
PART I
ITEM 1. BUSINESS
OVERVIEW
Our Company
Stabilis Energy, Inc. and its subsidiaries (the “Company”, “Stabilis”, “our”, “us” or “we”) are a vertically integrated provider of distributed liquefied natural gas (“LNG”) production, distribution and fueling services to multiple end markets in North America. We have safely delivered over 200 million gallons of LNG through more than 20,000 truck deliveries during our 15-year operating history, which we believe makes us one of the largest and most experienced small-scale LNG providers in North America. We provide LNG to customers in diverse end markets, including the industrial, energy, mining, utility, pipeline, commercial, and high horsepower transportation markets. Our customers use LNG as an alternative to traditional fuel sources, such as distillate fuel oil and propane, to lower fuel costs and reduce harmful environmental emissions. Our customers also use LNG as a “virtual pipeline” solution when natural gas pipelines are not available or are curtailed.
We also provide electrical and instrumentation construction, installation and service to the oil and gas, marine, and industrial markets in Brazil and build electrical systems for sale in China through our 40% interest in our Chinese joint venture, BOMAY Electric Industries, Inc.
Our Industry
LNG can be used to deliver natural gas to locations where pipeline service is not available, has been interrupted, or needs to be supplemented. LNG can also be used to replace a variety of alternative fuels, including distillate fuel oil (including diesel fuel and other fuel oils) and propane, among others. We believe that these alternative fuel markets are large and provide significant opportunities for LNG substitution.
According to the Shell LNG Outlook 2020, the global LNG market is projected to grow by nearly 100% over the next 20 years due to the declining cost of natural gas and growing environmental concerns that are driving the use of cleaner fuels. We believe that similar macro trends are driving increased demand for small-scale LNG in North America. According to ADI Analytics, an independent energy market research and advisory firm, the North American small-scale LNG market was 499 million gallons in 2018 and is projected to grow by 271% to 1.9 billion gallons by 2030 (a 11.5% compound annual growth rate) due to the increased adoption of LNG across multiple end markets.
RECENT DEVELOPMENTS
On July 26, 2019 (the “Effective Date”), the Share Exchange with American Electric and its subsidiaries was completed. In the Share Exchange, American Electric acquired directly
100%
of the outstanding limited liability company membership interests of Stabilis Energy, LLC (“Stabilis LLC”) from LNG Investment Company, LLC ("LNG Investment") and
20%
of the outstanding limited liability membership interests of PEG Partners, LLC ("PEG") from AEGIS NG LLC ("AEGIS"). AEGIS owned a
20%
noncontrolling interest of PEG. The remaining
80%
of the outstanding limited liability company interests of PEG were owned directly by Stabilis LLC. As a result, Stabilis became a direct
100%
owned subsidiary of American Electric and PEG became an indirectly-owned
100%
subsidiary of American Electric. Under the Share Exchange Agreement, American Electric issued
13,178,750
post-split shares of common stock to acquire Stabilis LLC, which represented approximately
90%
of the total amount of common stock of American Electric which was issued and outstanding as of July 26, 2019. The proposed transaction was approved by the shareholders of American Electric at a Special Meeting of Stockholders. The Share Exchange resulted in a change of control of American Electric to control by Casey Crenshaw by virtue of his beneficial ownership of
88.4%
of the common stock of American Electric to be outstanding as of July 26, 2019.
Immediately following the Effective Date, the Company declared a reverse stock split of its outstanding common stock at a ratio of
one-for-eight
, American Electric changed its name to Stabilis Energy, Inc., and our common stock began trading under the ticker symbol “SLNG”. Our common stock traded under the symbol “SLNG” on the Nasdaq Stock Market from July 29, 2019 to October 2, 2019. On October 3, 2019 the Company’s common shares commenced trading on the OTCQX Best Market under the same symbol. Unless otherwise noted, any share or per share amounts in the accompanying consolidated financial statements and related notes give retroactive effect to the reverse stock split.
Because the former owners of Stabilis LLC owned
88.4%
of the voting stock of the combined company immediately following the Effective Date, and certain other factors including that directors designated by LNG Investment constitute a majority of the post-closing board of directors, Stabilis LLC is treated as the acquiror of American Electric in the Share Exchange for accounting purposes. As a result, the Share Exchange is treated by American Electric as a reverse acquisition under the purchase method of accounting in
4
accordance with United States generally accepted accounting principles (“US GAAP”). For further information regarding this transaction, see Note 2—Acquisitions in the Notes to Consolidated Financial Statements.
On August 20, 2019, we expanded our presence in Mexico, acquiring a subsidiary that specializes in virtual LNG distribution systems, providing LNG to customers who use it as a fuel in mobile high horsepower applications and to customers who do not have natural gas pipeline access. The acquisition expands the Company's presence in the distributed LNG and compressed natural gas (“CNG”) markets in Mexico. We also established a joint venture to pursue investments in distributed natural gas production and distribution assets in Mexico.
OUR BUSINESS
Summary
Stabilis provides our customers with safe, reliable and cost effective LNG fueling solutions. We provide multiple products and services to our customers, including:
LNG Production and Sales
—Stabilis builds and operates cryogenic natural gas processing facilities, called “liquefiers”, that convert natural gas into LNG through a multiple stage cooling process. We currently own and operate a liquefier that is designed to produce up to 100,000 LNG gallons (379 cubic meters) per day. We also purchase LNG from third-party production sources which allows us to support customers in markets where we do not own liquefiers. We define “small-scale” LNG production to include liquefiers that produce less than 1,000,000 LNG gallons per day (3,788 cubic meters per day).
Transportation and Logistics Services
—Stabilis offers our customers a “virtual natural gas pipeline” by providing them with turnkey LNG transportation and logistics services in North America. We deliver LNG to our customers’ work sites from both our own production facility and our network of 25 third-party production sources located throughout North America. We own a fleet of LNG fueled trucks and cryogenic trailers to transport and deliver LNG. We also outsource similar equipment and transportation services from qualified third-party providers as required to support our customer base. We define “small-scale” LNG distribution to include distribution by trailer or tank container (up to 15,000 LNG gallons) or marine vessels that carry less than 8,000,000 LNG gallons (approximately 30,000 cubic meters).
Cryogenic Equipment Rental
—Stabilis owns and operates a rental fleet of approximately 150 mobile LNG storage and vaporization assets, including: transportation trailers, electric and gas-fired vaporizers, ambient vaporizers, storage tanks, and mobile vehicle fuelers. We also own several stationary storage and regasification assets. We believe this is one of the largest fleets of small-scale LNG equipment in North America. Our fleet consists primarily of trailer-mounted mobile assets, making delivery to and between customer locations more efficient. We deploy these assets on job sites to provide our customers with the equipment required to transport, store, and consume LNG in their fueling operations.
Engineering and Field Support Services
—Stabilis has experience in the safe, cost effective, and reliable use of LNG in multiple customer applications. We have also developed many processes and procedures that we believe improve our customers’ use of LNG in their operations. Our engineers help our customers design and integrate LNG into their fueling operations and our field service technicians help our customers mobilize, commission and reliably operate on the job site.
Stabilis generates revenue by selling and delivering LNG, which in many instances involves us providing engineering and field support services, to our customers. We also generate revenue by renting cryogenic equipment to our customers. We sell each product and service separately or as a bundle depending on the customer’s needs. LNG pricing depends on market pricing for natural gas and competing fuel sources (such as diesel, fuel oil, and propane among others), as well as the customer’s purchased volume, contract duration and credit profile.
Stabilis’ customers use natural gas in their operations for multiple reasons, including lower fuel cost, more stable fuel costs, reduced environmental emissions, and improved operating performance. We serve customers in a variety of end markets, including industrial, energy, mining, commercial, utilities and pipelines, and high horsepower transportation. We believe that LNG consumption will continue to increase in these end markets in the future.
Stabilis believes that our extensive operating experience positions us to be a leader in the North American small-scale LNG market. We operate an LNG liquefier and have executed approximately 200 turnkey LNG supply and distribution projects for our customers. We plan to leverage this experience to grow our business by investing in new LNG production and distribution assets throughout North America. We will also seek to consolidate the market by acquiring existing LNG production and distribution assets to create greater operating scale and efficiencies.
5
Power Delivery Solutions
—We also provide electrical and instrumentation construction, installation and service to the oil and gas, marine, and industrial markets in Brazil and build electrical systems for sale in China through our 40% interest in our Chinese joint venture, BOMAY Electric Industries, Inc.
Market for Small-Scale LNG in North America
LNG can be used to deliver natural gas to locations where pipeline service is not available, has been interrupted, or needs to be supplemented. LNG can also be used to replace a variety of alternative fuels, including distillate fuel oil (including diesel fuel and other fuel oils) and propane, among others. We believe that these alternative fuel markets are large and provide significant opportunities for LNG substitution. U.S. Energy Information Administration (“EIA”) data for the U.S. market size for these alternative fuels in 2018 was as follows:
|
|
|
|
|
ADI Estimated LNG Market Size (LNG Gallons)
|
||||||||||||
|
|
EIA
Reported
Gallons
(Billions)
|
Cubic
Meters
(Millions)
|
LNG Gallon
Equivalent
(Billions)
|
2018
(Billions)
|
% 2018
Combined
|
2030
(Billions)
|
% 2018
Combined
|
|||||||||
|
Distillate Fuel Oil
|
63.4
|
|
408.0
|
|
107.7
|
|
|
|
|
|
||||||
|
Propane
|
13.1
|
|
54.7
|
|
14.4
|
|
|
|
|
|
||||||
|
Combined
|
76.5
|
|
462.7
|
|
122.1
|
|
0.5
|
0.4%
|
1.9
|
1.6%
|
||||||
Note: Assumes 1.7 LNG gallons per distillate fuel oil gallon, 1.1 LNG gallons per propane gallon, and 264 LNG gallons per cubic meter
Source: U.S. Energy Information Administration and ADI Analytics
According to ADI Analytics ("ADI"), the North American small-scale LNG market was 499 million gallons in 2018 and is projected to be 1.9 billion gallons by 2030. This implies that LNG comprised approximately 0.4% of the combined U.S. distillate and propane markets in 2018 and will comprise approximately 1.6% of the current combined market size by 2030. We believe that LNG is a suitable substitute for most diesel and propane applications and that the LNG market share growth projected in the table above should be achievable based on current market trends.
We believe that the following factors could drive significant LNG market growth in North America over the next decade:
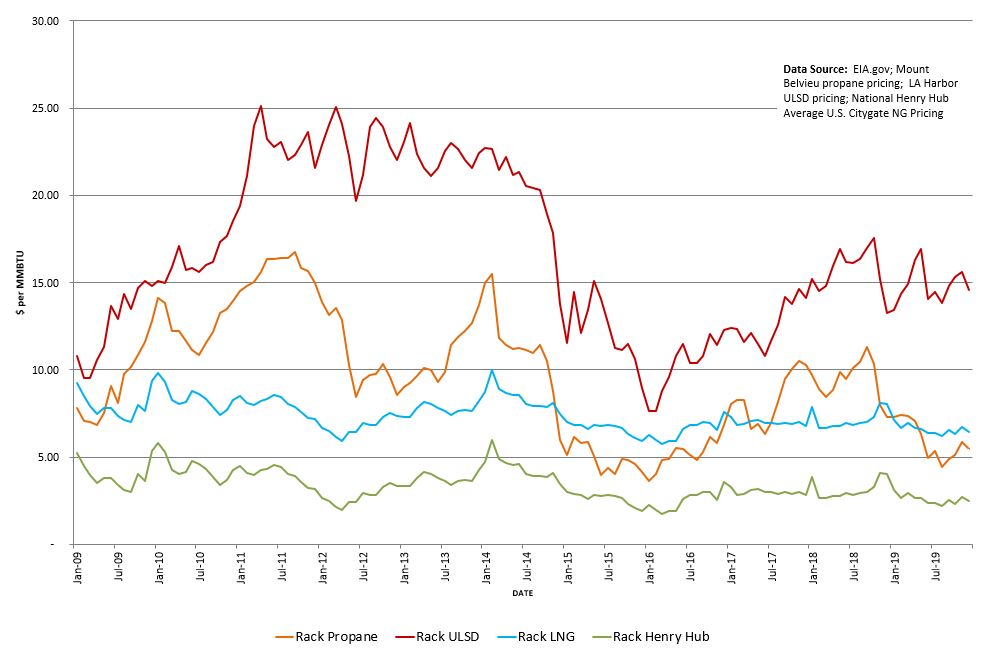
Less Expensive than Alternative Fuels
. Technological advances in natural gas production have unlocked significant new reserves in North America. We believe that these proven, abundant and growing reserves of natural gas have the potential to produce among the highest volumes of natural gas in the world. This abundant supply of natural gas has supported relatively low natural gas prices in North America. The cost of natural gas in the United States and Canada currently is less than the cost of crude oil on an energy equivalent basis. In addition, because the price of the natural gas commodity makes up a smaller portion of the total cost of LNG relative to the commodity portion of competing fuels, the price of LNG is less sensitive to variations in the underlying commodity cost. These factors have made LNG cheaper than competing fuel sources at most times over the past ten years, and we believe that LNG will maintain this cost advantage into the foreseeable future.
6
The following chart sets forth the wholesale price of Propane, Ultra-Low No. 2 Diesel, Indicative Liquefied Natural Gas and Natural Gas (Henry Hub).
ULSD, Propane & LNG pricing-2009 to Current
Lower Emissions than Alternative Fossil Fuels.
Natural gas contains less carbon than most other fossil fuels and, as a result, produces fewer carbon dioxide emissions when burned. The National Energy Technology Laboratory indicates that new natural gas power plants emit between 50% and 60% less carbon dioxide compared with emissions from a typical coal plant. The Argonne National Laboratory indicates that natural gas vehicles produce between 13% and 21% fewer greenhouse gas emissions than comparable gasoline and diesel fueled vehicles. Additional studies indicate that natural gas also produces lower particulate matter and sulphur emissions than other fossil fuels. We believe the relative environmental benefits of natural gas as a fuel could become increasingly important if, as we expect, air quality regulations become increasingly stringent, new regulations mandating low carbon fuels are enacted, and our customers expand their corporate sustainability mandates to lower greenhouse gas emissions and increase fuel diversity.
Better Safety than Alternative Fuels.
The physical characteristics of LNG make it a safer fuel when compared to diesel and propane because it boils and dissipates rapidly into the air when spilled instead of pooling on or near the ground. If released, LNG is also less combustible than diesel and propane because it ignites at relatively high temperatures and within a narrow flammability range when mixed with air. In addition, LNG fuel tanks and systems used in natural gas applications are subjected to a number of federal and state required safety tests, such as fire, environmental hazard, burst pressure and crash testing that ensure their safety.
Established LNG Production and Distribution Technology.
ADI reports that small-scale LNG production and distribution technologies have been proven and are now widely available from multiple vendors. Small-scale liquefiers are available in modular formats from several vendors and many of them have established track records of reliable and safe operating performance. LNG transport trailers, storage vessels, and vaporization equipment are also available from multiple vendors, and most of this equipment also comes with an established operating track record. We believe that the availability of proven small-scale LNG production and distribution technologies reduces the technology risk in growing the industry, but it also places a premium on the owner’s or operator’s construction and operating capabilities.
7
Increasing Growth in Renewable Energy Production:
Energy production from renewable energy sources, in particular wind and solar, is growing rapidly across the world as many governments and businesses seek to reduce their carbon emissions. The International Renewable Energy Agency (“IRENA”) reports that global power capacity based on renewable energy increased 7.9% in 2018 with solar and wind accounting for 84% of the growth. IRENA projects similar growth trends for the renewable energy production over the next several years. However, wind and solar are intermittent energy sources that require back-up energy sources that can come into service quickly and reliably. We believe that natural gas driven turbines are preferred viable back-up power source as they meet these operating requirements and use relatively clean natural gas fuel. We believe that natural gas power generation could support the growth of wind and solar energy production and that LNG could be a preferred source of natural gas fuel for off-pipeline applications.
Our Products, Services and Other Business Activities
Stabilis’ principal products, services and business activities are described below. Financial information about the revenue we receive from these activities is discussed in this report in Management’s Discussion and Analysis of Financial Condition and Results of Operations.
LNG Production.
Stabilis owns and operates an LNG liquefier near George West, Texas, which we refer to as the “George West Liquefier”, that has the capacity to produce 36.5 million LNG gallons (129,395 cubic meters) per year or 100,000 LNG gallons (379 cubic meters) per day. This plant includes a dual truck trailer loading system and a 270,000 LNG gallon (1,023 cubic meters) storage tank system. The George West Liquefier was 98.6% dispatchable in 2019 with the only shutdowns coming for routine scheduled maintenance. We intend to build or acquire additional liquefiers throughout North America over the next several years as we seek to optimize our North American LNG supply network.
Stabilis believes that our new liquefiers will be able to produce LNG at costs that make it a competitive fuel source for our customers. Based on our operating experience at the George West Liquefier, our direct costs to liquefy gas range from $0.15 - $0.20 per LNG gallon ($1.82 - $2.42 per MMBtu) when the plant is operating in excess of 50% capacity. This includes plant operating costs, such as electricity and labor, but does not include the cost of the natural gas feedstock. This liquefaction cost could vary by time and plant location if input costs change. Our direct cost to deliver LNG via truck transportation is approximately $0.05 - $0.10 per gallon per every 100 miles traveled. These costs of liquefaction and transportation exclude corporate expenses such as sales and marketing, administration, and financing, among others. We believe that this cost of production and distribution will allow our LNG to be competitive with alternative fuel sources in most commodity market environments.
Stabilis owns a second liquefier that has a production capacity of 9.1 million LNG gallons (34,470 cubic meters) per year or 25,000 LNG gallons (95 cubic meters) per day. This liquefier is in storage awaiting deployment and we are actively exploring sites where it could be located. We are also in the process of evaluating other opportunities to develop liquefiers throughout North America, including several locations in Mexico.
LNG Sales.
Stabilis supplies our customers with LNG produced at our own liquefaction facility as well as LNG produced at third-party facilities. We make the determination of LNG supply sources based on the cost of LNG, the transportation cost to deliver to regional customer locations, and the reliability of the supply source. Our network of 25 third-party LNG production facilities located throughout North America includes: 1) utility owned peak shaving plants, 2) natural gas/helium processing facilities, and 3) other merchant LNG production facilities similar to our George West Liquefier. We have contracts with these production sources that allow us to purchase LNG for our customers as required and without firm or long-term volume commitments. We believe that our third-party supply network is the largest and most complete in North America allowing us access to approximately 500 million LNG gallons (1.9 million cubic meters) of capacity annually on an as required basis. Occasionally the LNG we obtain from third parties may be purchased under take-or-pay contracts that require us to purchase minimum volumes. In situations where firm take or pay contracts are required, we try to support them with back-to-back customer purchase agreements. Currently we have one take-or-pay LNG supply contract that is matched to contracted customer demand. In
2019
, we purchased approximately 40% of our LNG from third-party suppliers and we produced the remainder at the George West Liquefier.
Stabilis sells LNG on a bulk or wholesale basis to our customers. We sell LNG through supply contracts that are priced on a regional commodity index-plus basis, such that LNG sales under these contracts increase or decrease as a result of changes in the commodity cost of natural gas. We sell LNG to our customers based on the same commodity index we buy natural gas to reduce our exposure to commodity prices changes. We sell LNG fuel at prices we set based on prevailing market conditions. Our pricing methodology depends on our cost of natural gas and LNG production, the customer’s commercial requirements, the price of competing
8
energy sources, volumes required, contract duration, and the customer’s credit profile. Although we have long-term commercial relationships with many of our customers, our customer contracts are generally short-term in nature.
Transportation and Logistics Services
. Stabilis offers its customers a “virtual natural gas pipeline” by providing them with turnkey transportation and logistics services for delivery from the LNG production source to the LNG consumption site. Our logistics and scheduling team offers 24-hour support to our customers. We utilize customized telemetry and fuel dispatch software systems to optimize our LNG deliveries. Customers can call our logistics team and have LNG delivered quickly and efficiently to almost any location in North America. We deliver LNG to our customers’ sites with our fleet of 42 tanker trailers, where it is stored and then vaporized on demand to fuel our customers consuming equipment which includes engines, turbines, generators, furnaces, dryers, boilers, kilns, pipelines, and other high horsepower applications.
Stabilis owns a fleet of LNG fueled trucks that are used to make deliveries to our customers near the George West Liquefier. We also have contracts with multiple national and regional trucking companies to deliver LNG to our customers. These carriers are certified to transport hazardous materials and the drivers are trained on safe LNG operating and delivery procedures. We believe that our established relationships with these carriers gives us a unique ability to reliably and safely deliver LNG to almost any location in North America on short notice.
Cryogenic Equipment Rental
. Stabilis believes that we own the largest rental fleet of mobile LNG storage, transportation and vaporization equipment in North America. Our asset base includes
151
pieces of equipment, including: transportation trailers, electric and gas-fired vaporizers, ambient vaporizers, storage tanks, and mobile vehicle fuelers. We use these assets to provide customers with the necessary equipment to transport, store, and consume LNG in their operations.
Stabilis rents our cryogenic and related equipment to customers based on day rates that vary by the cost and availability of our equipment, and align with our customers’ contract terms. Our equipment is designed specifically for use in small-scale LNG applications and includes the safety and operational features that our customers and our regulators require. We believe that our current fleet of equipment can support significant growth in volumes in our business. We continually evaluate adding additional equipment as required by our customers to optimize their operations.
Mobile Asset Base
|
Asset Type
|
Qty
|
Description
|
|||
|
Mobile Storage and Vaporization Units
|
92
|
|
Located on customer sites for storage and delivery of LNG fuel
|
||
|
Transport Trailers
|
42
|
|
Deliver LNG from production sources to customer sites
|
||
|
Mobile Truck Fuelers
|
8
|
|
Mobile fueling station used to fill heavy duty trucks
|
||
|
Other Cryogenic Assets
|
9
|
|
Includes hose reels, pump skids, generators, and other
|
||
|
Total
|
151
|
|
|
||
Engineering and Field Service Support Services
. Stabilis believes it has significant experience in the safe, cost efficient and reliable use of LNG in multiple customer applications. Our engineering team provides our customers with safe and effective LNG fueling plans. Our engineering services are usually included in our efforts to sell and commission customer projects, however sometimes we bill customers for them on an hourly or fixed project basis. Our staff of approximately 14 trained field service technicians help our customers use LNG safely and efficiently on their job sites. We generally bill our customers for field service technicians on a day rate basis but sometimes this cost is included in bundled pricing.
Power Delivery Solutions
—As a result of the business combination with American Electric, we provide power delivery services and products for the oil and gas, marine vessel, power generation and broad industrial market segments in Brazil, and build electrical systems for sale in China through our
40%
interest in BOMAY.
Our Customers
Stabilis serves customers in a variety of end markets, including industrial, energy, utilities and pipelines, mining, commercial, and transportation within the United States, Mexico and Canada. We believe these customer markets are well suited to use LNG because they consume relatively high volumes of fuel, operate in mobile, temporary or off-pipeline locations, have limited access to alternative fuel sources, and/or are facing increasingly stringent emissions or other environmental requirements. We currently serve approximately 74 customers. For the year ended December 31, 2019, Noble Energy, Inc. accounted for more than 10% of our revenues. For the year ended December 31, 2018, Noble Energy, Inc. and Blue Roads Solutions, LLC each accounted for more than 10% of our revenues. During such periods, no other purchaser accounted for 10% or more of our revenue. We believe that the loss
9
of any of these purchasers would not result in a material adverse effect on our financial condition or results of operations because LNG is a fungible product with well-established markets and numerous purchasers.
Industrial.
Industrial applications for LNG include sand and aggregate producers, asphalt plants, greenhouses, food processers, paper mills, agricultural dryers, and general manufacturing facilities. Remote sand producers and mobile asphalt plants that use LNG to produce heat for their processing and drying operation are among our largest customers. LNG often replaces propane, fuel oil, or diesel fuel in these applications. These customers often cannot justify the cost of new pipeline infrastructure and using LNG requires minimal up-front costs, regulatory approvals, and lead time requirements. We believe LNG is optimal for these applications because it is cost-effective with stable pricing, offers consistent supply without curtailments, provides an energy density that minimizes storage requirements, and has a clean and consistent burn that makes heating operations more predictable. Based on our experience, sand production facilities can consume 10,000 to 20,000 LNG gallons per day, and asphalt plants can use 5,000 to 10,000 LNG gallons per day.
Energy.
Energy producers use high horsepower engines to power their drilling and pressure pumping operations. LNG displaces some of the total diesel fuel consumption in these applications using dual-fuel engine technology. We believe that energy producers can use LNG to reduce fuel costs and to meet environmental emissions requirements. Based on our experience, dual-fuel drill rigs can consume 1,000 to 5,000 LNG gallons per day and dual-fuel pressure pumping spreads can consume 10,000 to 20,000 LNG gallons per day. Recently, energy producers began using the field gas being produced in their operations to fuel the turbine engines that power their pressure pumping spreads. While turbines can burn field gas, they often require significant amounts of LNG for primary or back-up fuel supply because field gas often varies widely in volume, composition, and pressure. Based on our experience, turbine driven pressure pumping operations can consume 30,000 to 60,000 LNG gallons per day when using LNG as the primary fuel.
Utilities and Pipelines
. North America has an expansive network of pipelines that, based on age and increasingly more stringent regulations, require routine testing and maintenance. During such events LNG fueling solutions can provide flow assurance to address natural gas supply interruptions during pipeline hydrostatic testing, repairs, gas distribution system curtailments, or unplanned outages. Such solutions can also provide a bridge for large industrial or utility customers before permanent pipelines are installed. LNG is becoming more predominant in regions where natural gas demand is growing and utilities and pipelines are required to continue to meet critical peak gas demand. LNG can provide an economic solution to support these supply requirements during peak weather conditions, gas curtailments and/or pipeline repairs. LNG usage in utility and pipeline applications varies significantly by project type.
Mining
. Mines, including those producing metals, rare earth materials, and coal, are often located in remote locations that are off the electrical grid and do not have natural gas pipeline access. Mines use LNG to fuel electrical generators and to produce heat for their processing activities. Several mines have also tested using LNG as a fuel for their mine trucks and other high horsepower engine equipment. In addition to fuel cost benefits, LNG can help reduce emissions at mines that are often located in environmentally sensitive areas. Based on our experience, power generation and heating applications at mines can consume 10,000 to 100,000 LNG gallons per day.
Commercial
. Commercial locations, including offices, calls centers, data centers, campuses, often need fuel for primary or back-up power generation. LNG often replaces propane or diesel fuel in these applications. LNG usage in commercial applications varies significantly by location size and purpose.
Transportation
. LNG is being used to fuel high horsepower engines in multiple transportation applications, including over-the-road trucking, mine haul trucks, locomotives, and marine engines due to reduced emissions and cost savings benefits. Extensive LNG fueling networks exist currently in the United States, the European Union, and China. Regulatory requirements are accelerating the adoption of LNG as a transportation fuel in other markets, particularly in the marine sector. The International Maritime Organization (“IMO”) has imposed a global sulphur cap of 0.5% on ships trading outside of established emission control areas starting in January 2020, a level that could be difficult to achieve using common marine fuels, such as heavy fuel oil, but could be achieved using LNG. Large marine vessels can take several hundred thousand gallons of LNG in a single fuel bunkering event. LNG is also being tested as a fuel for rail locomotives and mining trucks, and is also a commonly used rocket propellant. LNG usage in transportation application varies by the horsepower requirements of the application.
Mexico.
The volume of U.S. produced natural gas going to Mexico has been increasing significantly over the last several years as pipelines have been built to deliver natural gas to major Mexican cities and utility sites. However, a large portion of Mexico does not have access to these pipelines and is not expected to have access soon so LNG can be used to provide energy to these areas. We believe we are currently one of the largest small-scale LNG exporters to Mexico with multiple truckloads crossing the border from
10
our George West Liquefier daily. Primary end markets for LNG in Mexico include the industrial, mining, and commercial sectors. We believe that the demand for LNG will continue to grow as the population and economy grow.
We actively deliver LNG through virtual distribution systems, providing LNG to customers who use it as a fuel in mobile high horsepower applications and to customers who do not have natural gas pipeline access.
Brazil.
We offer a range of electrical and instrumentation construction and installation services to our customers. These services include new construction as well as electrical and instrumentation turnarounds, maintenance and renovation projects.
China.
Through our
40%
interest in BOMAY, we provide power and control systems for the land drilling market in China.
Growth Strategy
Stabilis’ primary business objective is to provide superior returns to our shareholders by becoming the leading vertically integrated small-scale LNG provider in the Americas. We intend to accomplish this objective by implementing the following growth strategies:
Expand our LNG production business throughout North America.
Stabilis believes that the customers and markets we serve could benefit from localized LNG supply sourcing. To this end, we believe that expanding our LNG liquefaction footprint throughout North America will enhance our competitive position by lowering our delivered cost and by creating a comprehensive and reliable supply network for our customers. We intend to leverage our liquefier development, construction, and operations experience to develop new liquefiers in markets that require LNG supply. We plan to both build new liquefiers and acquire existing liquefiers based on whichever offers the best service to our customers and returns to our investors.
In addition to growth in our existing domestic markets, Stabilis plans to focus on opening liquefiers in Mexico and Canada. We believe that both countries are attractive development opportunities given their lack of natural gas pipeline infrastructure in certain regions and focus on reducing environmentally harmful emissions. Both markets are also home to large fuel consumers such as mines, manufacturing and process facilities, and remote commercial and residential communities. Currently we are pursuing partnerships and acquisition opportunities that we believe will give us the capabilities required to grow rapidly.
Expand our LNG distribution business throughout North America.
Stabilis believes that expanding our LNG distribution capabilities throughout North America will enhance our competitive position by creating a comprehensive and reliable supply network for our customers, lowering our delivered LNG costs, and expanding our ability to service new industries and geographies. We currently provide LNG distribution and field service support throughout the United States and parts of Mexico and Canada. We plan to expand our distribution capabilities by adding equipment to our fleet, including the high-flow, high pressure vaporization equipment required by pipelines and turbine powered pressure pumping spreads. In addition, we plan to explore opportunities that expand our geographic reach and industry expertise, including acquisitions of companies that already service our targeted customers. Finally, we plan to explore opportunities to expand into the compressed natural gas (“CNG”) market to become a comprehensive mobile natural gas solution provider for our customers.
Consistent with our strategy to expand of our LNG production business, Stabilis will focus the expansion of our LNG distribution business on the United States, Mexico and Canada. We believe that supporting our liquefiers with our distribution capabilities optimizes our asset base and our ability to service our customers. We also plan to expand our third-party LNG supply network in these markets so we can provide our customers with comprehensive and reliable service.
Use our LNG production and distribution expertise to expand into Latin and South America.
Stabilis believes there is a significant opportunity to leverage our expertise in LNG production and distribution to expand our business into power generation opportunities in Latin and South America. Our business development team is identifying utilities and industrial energy consumers that may view LNG as a compelling alternative to traditional distillate fuels. We believe it will be compelling for them to enter into long-term contracts that support the development of the infrastructure required to deliver LNG directly to their power generation and other assets. We are currently developing partnerships and customer relationships in various regions of Latin and South America. We expect that these markets will require some combination of LNG production or sourcing, local logistics, distribution services and field support, paired with Stabilis-owned power generation assets in some instances.
Maintain financial strength and flexibility
. Stabilis will seek to maintain a conservative balance sheet which we believe will allow us to better react to market opportunities. We believe that maintaining adequate balance sheet flexibility, along with positive cash flows from operations, will provide us with sufficient liquidity to execute on our business strategies.
11
Competition
The market for natural gas is highly competitive. Stabilis believes the biggest competition for LNG in these applications are distillate fuels and propane as they power the majority of engines and generators in our target markets. We also compete with other fuel sources including pipeline natural gas and CNG. We believe we have multiple competitors in the market for natural gas fuel, including, but not limited to:
|
•
|
Producers and distributors of LNG, including Clean Energy Fuels Corp., Applied LNG, New Fortress Energy LLC, Kinetrex Energy, Pivotal LNG Inc., numerous utilities located across the country which produces LNG for peak shaving purposes, and numerous local providers of cryogenic distribution and field services; and
|
|
•
|
Producers and distributors of CNG, including NG Advantage LLC, Xpress Natural Gas LLC, Compass Natural Gas Partners LP and Certarus Ltd.
|
Stabilis competes with other natural gas companies, as well as other fossil fuel sources, based on a variety of factors, including, among others, cost, supply, availability, quality, cleanliness and safety of the fuel. Location is often a primary competitive factor as transportation costs limit the distance LNG can be hauled at competitive prices. We believe we compare favorably with many of our competitors on the basis of these factors; however, some of our competitors have longer operating histories and market based experience, larger customer bases, more expansive brand recognition, deeper market penetration and substantially greater financial, marketing and other resources than our business. As a result, they may be able to respond more quickly to changes in customer preferences, legal requirements or other industry or regulatory trends, devote greater resources to the development, promotion and sale of their products, adopt more aggressive pricing policies, dedicate more effort to infrastructure and systems development in support of their business or product development activities and exert more influence on the regulatory landscape that impacts the natural gas fuel market. Additionally, utilities and their affiliates typically have unique competitive advantages, including a lower cost of capital, substantial and predictable cash flows, long-standing customer relationships, greater brand awareness, and large sales and marketing organizations.
Stabilis does not believe that we compete with mid-scale and world-scale LNG liquefiers that produce more than 1,000,000 LNG-gallons (18,939 cubic meters) per day. These large LNG production facilities, such as those operated by Cheniere Energy and Freeport LNG, typically are designed and permitted to fill large marine vessels that deliver cargos of 21,120,000 LNG-gallons (80,000 cubic meters) or more to large import terminals in foreign markets. We do not believe that any of them currently have or plan to have truck loading facilities that would be required to supply LNG to small-scale LNG customers. We also do not believe that any mid-scale or large-scale liquefiers currently have plans to install LNG loading capabilities for vessels smaller than 7,920,000 LNG-gallons (30,000 cubic meters).
Competitive Strengths
Stabilis believes that we are well positioned to execute our business strategies based on the following competitive strengths:
LNG is an economically and environmentally attractive product.
Stabilis believes that the combination of cost benefits and environmental benefits makes LNG a compelling fuel source for many energy consumers. We believe that LNG can be delivered to customers at prices that are lower and more stable than what they would pay for distillate fuels or propane. In addition, several of our customers have reported that LNG as a fuel decreases their operating costs by reducing equipment maintenance requirements and providing more consistent burn characteristics. We also believe that many of our customers use LNG because it can significantly reduce harmful carbon dioxide, nitrogen oxide, sulphur, particulate matter, and other emissions as compared to oil-based fuels.
Demonstrated ability to execute LNG projects safely and cost effectively.
Stabilis has produced and delivered over 200 million gallons of LNG to our customers throughout our 15-year operating history. Our experience includes building and operating LNG production facilities, delivering LNG from third-party sources to our customers, and designing and executing a wide-variety of turnkey LNG fueling solutions for our customers using our cryogenic equipment fleet supported by our field service team. We have experience serving customers in multiple end markets including industrial, energy, utilities and pipelines, mining, commercial, and transportation. We also have experience exporting LNG to Mexico and Canada. Finally, we believe our team is among the most experienced in the small-scale LNG industry. We believe that we can leverage this proven LNG execution experience to grow our business in existing markets and expand our business into new markets.
Comprehensive provider of “virtual natural gas pipeline” solutions throughout North America.
Stabilis offers our customers a comprehensive off-pipeline natural gas solution by providing the supply infrastructure, transportation and logistics, and field service support necessary to deliver LNG to them in a program that is tailored to their consumption needs. We believe we own one of the largest fleets of cryogenic transportation, storage, and vaporization equipment in North America. We can provide our customers LNG and related services for a wide variety of applications almost anywhere in United States, and we plan to expand our geographic
12
coverage in Mexico and Canada. We believe that our ability to be a “one stop shop” for all of our customers’ off-pipeline natural gas requirements throughout North America is unique among LNG providers.
Ability to leverage existing LNG production and delivery capabilities into new markets.
Stabilis believes that our experience producing and distributing LNG can be leveraged to grow into new geographic and service end markets. Since our founding we have expanded our service area across the United States, northeastern Mexico, and western Canada. We have also expanded our industry coverage to include multiple new end markets and customers. We accomplished this expansion into new markets by leveraging our LNG production and distribution expertise, in combination with our cryogenic engineering and project development capabilities, to meet new customer needs.
Sales and Marketing
Stabilis markets our products and services primarily through our direct sales force, which includes sales representatives covering all of our major geographic and customer markets, as well as attendance at trade shows and participation in industry conferences and events. Our technical, sales and marketing teams also work closely with federal, state and local government agencies to provide education about the value of natural gas as a fuel and to keep abreast of proposed and newly adopted regulations that affect our industry.
Seasonality
A portion of Stabilis’ operating revenues and profits relate to providing backup gas for the local distribution infrastructure in the United States and Mexico to support utilities during times of peak heating demand from November through March. Revenues are generally lower from April to October during the months when heating demand is seasonally lower.
Government Regulation and Environmental Matters
Stabilis is subject to a variety of federal, international, state, provincial and local laws and regulations relating to the environment, health and safety, labor and employment, building codes and construction, zoning and land use, public reporting and taxation, among others. Any changes to existing laws or regulations, the adoption of new laws or regulations, or failure by us to comply with applicable laws or regulations could result in significant additional expense to us or our customers or a variety of administrative, civil and criminal enforcement measures, any of which could have a material adverse effect on our business, reputation, financial condition and results of operations. Regulations that significantly affect our operating activities are described below. Compliance with these regulations has not had a material effect on our capital expenditures, earnings or competitive position to date, but new laws or regulations or amendments to existing laws or regulations to make them more stringent could have such an effect in the future. We cannot estimate the costs that may be required for us to comply with potential new laws or changes to existing laws, and these unknown costs are not contemplated by our existing customer agreements or our budgets and cost estimates. We believe that we are in compliance with all environmental and other governmental regulations. Our compliance has, to date, had no material effect on our capital expenditures, earnings, or competitive position.
Construction and Operation of LNG Liquefaction Plants.
To build and operate LNG liquefaction plants, Stabilis must apply for facility permits or licenses that address many factors, including storm water and wastewater discharges, waste handling, and air emissions related to production activities and equipment operation. The construction of LNG plants must also be approved by local planning boards and fire departments.
Transportation of LNG.
Federal and state safety standards require that LNG is moved by qualified drivers in cryogenic containers designed for LNG transportation. Drivers are subject to US Department of Transportation (“USDOT”) regulations, such as FMCSA, Hazardous Materials Regulations, and state certification requirements, such as certifications by the Alternative Energy Division of the Railroad Commission of Texas. Cryogenic containers have to undergo annual USDOT visual inspections and periodic pressure tests. Motor vehicles equipped with an LNG container or other motor vehicles used principally for transporting LNG in portable containers in Texas have to be registered with the Railroad Commission of Texas.
Transfer of LNG.
Federal safety standards require each transfer of LNG to be conducted in accordance with specific written safety procedures. These procedures must require that qualified personnel be in attendance during all LNG transfer operations, and these procedures must be implemented, and copies of the procedures must be available/displayed, at each LNG transfer location.
Storage and Vaporization of LNG at Customer Sites.
To install and operate both temporary and permanent storage and vaporization equipment, Stabilis may apply for permits or licenses that address many factors, including waste handling and air
13
emissions related to onsite storage and equipment operation or consult with customers so they may apply for needed permits. The operation and siting of storage and vaporization of LNG may also require approval by local planning boards and fire departments.
Import & Export of LNG.
To import or export LNG from the United States to Mexico and Canada via truck, numerous authorizations are required. In support of our business in Canada, Stabilis maintains an import and export license from the United States Department of Energy (“DOE”) and from the National Energy Board of Canada (“NEB”). We maintain an Emergency Response Action Plan (“ERAP”) with Transport Canada. In support of our business in Mexico, we maintain an export license from the DOE and maintain import permits to bring the LNG into the country. Exporting LNG in large quantities would require additional permits and licenses from various regulatory agencies, including the DOE and the Federal Energy Regulatory Commission (“FERC”). We do not have these permits at this time but could file for such authorizations in the future.
Employees
As of
December 31, 2019
, Stabilis had 162 employees. We believe our relations with employees are satisfactory. None of our employees are currently subject to a collective bargaining agreement.
Intellectual Property
The intellectual property portfolio of Stabilis and its subsidiaries includes patents and trademarks. The Company has two pending patent applications in the United States, specifically a non-provisional patent application for the use of natural gas for well-enhancement and a non-provisional patent application for natural gas deliquification. The Company has four pending foreign patent applications (two in Canada and two in Mexico). Additionally, the Company owns or has exclusive license to five U.S. and one foreign (Mexico) patents. The last patent to expire in the U.S. will expire in January 2031, absent any adjustments or extensions. The Company has ten U.S. trademark registrations and one foreign trademark registration (Canada). The Company has no pending trademark applications.
Additional Information
The Company was originally incorporated on October 21, 1996 as American Access Technologies, Inc., a Florida corporation. On May 15, 2007, American Access Technologies, Inc. completed a business combination with M&I Electric Industries, Inc. (“M&I” or “M&I Electric”), a Texas corporation, and changed its name to American Electric Technologies, Inc. On August 12, 2018, all of the U.S. business operations of American Electric Technologies, Inc. based in the United States (“U.S.”) were sold to an affiliate of Myers Power Products, Inc. As a result, 100% of the company’s ongoing business was from international operations conducted through a Brazilian subsidiary, and an interest in a Chinese joint venture.
As previously discussed under Recent Developments, Stabilis completed the Share Exchange with American Electric and its subsidiaries on July 26, 2019. Immediately following the completion, the Company declared a reverse stock split of its outstanding common stock at a ratio of
one-for-eight
, American Electric changed its name to Stabilis Energy, Inc., and our common stock began trading under the ticker symbol “SLNG”.
Stabilis’ principal executive office is located at 10375 Richmond Ave., Suite 700, Houston, Texas 77042. Our telephone number is 832-456-6500 and our website address is www.stabilisenergy.com. We make our annual reports on Form 10-K, quarterly reports on Form 10-Q, current reports on Form 8-K, amendments to those reports and other information filed with or furnished to the SEC available, free of charge, through our website, as soon as reasonably practicable after those reports and other information are electronically filed with or furnished to the SEC. The reference to Stabilis’ website is not intended to incorporate the information on the website into this report.
ITEM 1A. RISK FACTORS
Investing in shares of our common stock involves a high degree of risk. You should carefully consider the risks described below with all of the other information included in this report in evaluating an investment in our common stock. If any of the following risks were to occur, our business, financial condition, results of operations, and cash flows could be materially adversely affected. In that case, the trading price of our common stock could decline and you could lose all or part of your investment. Additional risks not presently known to us or that we currently deem immaterial may also impair our business operations.
Risks Related to Our Business
Our ability to implement our business strategy may be materially and adversely affected by many known and unknown factors.
14
Our business strategy relies upon our future ability to successfully market natural gas to end-users, develop and maintain cost-effective logistics in our supply chain and construct, develop and operate energy-related infrastructure in North America. Our business strategy assumes that we will be able to expand our operations further in North America, enter into long-term purchase and supply contracts with end-users, acquire and transport LNG at attractive prices, develop infrastructure, and other future projects, into efficient and profitable operations in a timely and cost-effective way, obtain approvals from all relevant federal, international, state and local authorities, as needed, for the construction and operation of these projects and other relevant approvals, and obtain long-term capital appreciation and liquidity with respect to such investments. Our strategy may also be affected by future governmental laws and regulations. It also assumes that we will be able to enter into strategic relationships with energy end-users, power utilities, LNG providers, shipping companies, infrastructure developers, financing counterparties and other partners. These assumptions are subject to significant economic, competitive, regulatory and operational uncertainties, contingencies and risks, many of which are beyond our control. Additionally, in furtherance of our business strategy, we may acquire operating businesses or other assets in the future. Any such acquisitions would be subject to significant risks and contingencies, including the risk of integration, and we may not be able to realize the benefits of any such acquisitions.
Our future ability to execute our business strategy is uncertain, and it can be expected that one or more of our assumptions will prove to be incorrect and that we will face unanticipated events and circumstances that may adversely affect our business. Any one or more of the following factors may have a material adverse effect on our ability to implement our proposed strategy and achieve our targets:
|
•
|
failure to develop cost-effective logistics solutions;
|
|
•
|
failure to manage expanding operations in the projected time frame;
|
|
•
|
inability to structure innovative and profitable energy-related transactions and to optimally price and manage position, performance and counterparty risks;
|
|
•
|
inability to develop infrastructure and other future projects in a timely and cost-effective manner;
|
|
•
|
inability to attract and retain personnel in a timely and cost-effective manner;
|
|
•
|
failure of investments in technology and machinery, such as liquefaction technology or LNG tank truck technology, to perform as expected;
|
|
•
|
increases in competition which could increase costs and undermine profits;
|
|
•
|
inability to source LNG in sufficient quantities and/or at economically attractive prices;
|
|
•
|
failure to anticipate and adapt to new trends in the energy sector in North America and elsewhere;
|
|
•
|
increases in operating costs, including the need for capital improvements, insurance premiums, general taxes, real estate taxes and utilities, affecting our profit margins;
|
|
•
|
inability to raise significant additional debt and equity capital in the future to implement our business strategy as well as to operate and expand our business;
|
|
•
|
general economic, political and business conditions in North America and in the other geographic areas we now operate and intend to operate in the future;
|
|
•
|
inflation, depreciation of the currencies of the countries in which we operate and fluctuations in interest rates;
|
|
•
|
failure to win new bids or contracts;
|
|
•
|
failure to obtain approvals from governmental regulators and relevant local authorities for the construction and operation of potential future projects and other relevant approvals;
|
|
•
|
existing and future governmental laws and regulations; or
|
|
•
|
inability, or failure, of any customer or contract counterparty to perform their contractual obligations to us (for further discussion of counterparty risk, see “—Risks Related to Our Business—Our current ability to generate cash is substantially dependent upon the performance by customers under short-term contracts that we have entered into or will enter into in the near future, and we could be materially and adversely affected if any customer fails to perform its contractual obligations for any reason, including nonpayment and nonperformance, or if we fail to enter into such contracts at all”).
|
If we experience any of these failures, such failure may adversely affect our financial condition, results of operations and ability to execute our business strategy.
15
Investment in us is speculative.
Our strategy may not be successful, and if unsuccessful, we may be unable to modify it in a timely and successful manner. We cannot give you any assurance that we will be able to implement our strategy on a timely basis, if at all, or achieve our internal model or that our assumptions will be accurate. Accordingly, your investment in our company is speculative and subject to a high degree of risk, and you should understand that there is a possibility of the loss of your entire investment. Our limited history also means that we continue to develop and implement various policies and procedures including those related to data privacy and other matters.
We will continue to incur significant capital and operating expenditures while we develop infrastructure for our supply chain and other future projects. We will need to invest significant amounts of additional capital to implement our strategy. We could experience delays beyond the expected development period which could increase the level of operating losses and negative operating cash flows. Our future liquidity may also be affected by the timing of construction financing availability in relation to the incurrence of construction costs and other outflows and by the timing of receipt of cash flows under our customer contracts in relation to the incurrence of project and operating expenses. Our ability to generate any positive operating cash flow and achieve profitability in the future is dependent on, among other things, our ability to develop an efficient supply chain and successfully and timely complete necessary infrastructures and fulfill our gas delivery obligations under our customer contracts.
Our business is dependent upon obtaining substantial additional funding from various sources, which may not be available or may only be available on unfavorable terms.
Our net working capital may not be sufficient to fully execute our business plan in the future. Assuming the accuracy of our assumptions relating to our business strategy, we believe that our cash resources will only be sufficient to meet projected capital expenditures, financing obligations and operating requirements in the near term. In the future, we expect to pursue additional offerings of debt or equity securities to assist us in developing our operations. If we are unable to secure additional funding, or if it is only available on terms that we determine are not acceptable, we may be unable to fully execute our business plan, and our business, financial condition or results of operations may be adversely affected. Our ability to raise additional capital will depend on financial, economic and market conditions and other factors, many of which are beyond our control. We cannot assure you that such additional funding will be available on acceptable terms, or at all.
A variety of factors beyond our control could impact the availability or cost of capital, including domestic or international economic conditions, increases in key benchmark interest rates and/or credit spreads, the adoption of new or amended banking or capital market laws or regulations, the re-pricing of market risks and volatility in capital and financial markets, risks relating to the credit risk of our customers and the jurisdictions in which we operate, as well as general risks applicable to the energy sector. Our financing costs could increase or future borrowings or equity offerings may be unavailable to us or unsuccessful, which could cause us to be unable to pay or refinance our indebtedness or to fund our other liquidity needs. We may rely on borrowings under debt instruments to fund our capital expenditures. If any of the lenders under these potential debt instruments were unable to perform on its commitments, we may need to seek replacement financing, which may not be available as needed, or may be available in more limited amounts or on more expensive or otherwise unfavorable terms.
After our recent acquisitions, we may not be profitable for an indeterminate period of time.
We have a limited operating history and therefore have not achieved consistent profitability on an annual basis. We will need to make significant additional investments to develop, improve and operate our business. We also expect to make significant expenditures and investments in identifying, acquiring and/or developing other future projects. We also expect to incur significant expenses in connection with the launch and continued growth of our business, including costs for LNG purchases, truck transportation, shipping and logistics, personnel and technological improvements. We may need to raise significant additional debt and equity capital to achieve our goals.
We may not be able to achieve profitability, and if we do, we cannot assure you that we would be able to sustain such profitability in the future. Our failure to achieve or sustain profitability would have a material adverse effect on our business and the value of our common stock.
Because we are currently dependent upon a limited number of customers, the loss of a significant customer could adversely affect our operating results.
A limited number of customers currently represent a substantial majority of our income. Our operating results are currently contingent on our ability to maintain LNG services to these customers. At least in the short term, we expect that a substantial majority of our sales will continue to arise from a concentrated number of customers, such as power utilities, energy producers and industrial end-users. We may be unable to accomplish our business plan to diversify and expand our customer base by attracting a broad array of customers, which could negatively affect our business, results of operations and financial condition.
16
Our current ability to generate cash is substantially dependent upon the performance by customers under short-term contracts that we have entered into or will enter into in the near future, and we could be materially and adversely affected if any customer fails to perform its contractual obligations for any reason, including nonpayment and nonperformance, or if we fail to enter into such contracts at all.
Our current results of operations and liquidity are, and will continue to be in the near future, substantially dependent upon performance by a small number of customers, which have each entered into supply agreements and other similar contracts of variable durations. Our near term ability to generate cash is dependent on the small number of customers’ continued willingness and ability to perform their obligations under their respective contracts. If any of these customers fails to perform its obligations under their contracts, our operating results, cash flow and liquidity could be materially and adversely affected, even if we were ultimately successful in seeking damages from any of these customers for a breach of the contract.
Risks of nonpayment and nonperformance by customers are a consideration in our businesses, and our credit procedures and policies may be inadequate to sufficiently eliminate customer credit risk. As part of our business strategy, we intend to target customers who have not been traditional purchasers of natural gas, including customers in developing countries, and these customers may have greater credit risk than typical natural gas purchasers. Therefore, we may request pre-payments in advance for purchasing LNG or our services for certain customers that pose a greater customer credit risk than other companies in the industry. Further, adverse economic conditions in the energy industry increase the risk of nonpayment and nonperformance by customers, particularly customers that have sub-investment grade credit ratings or significant counterparty risks.
Our customer contracts are subject to termination under certain circumstances.
Our customer contracts contain various termination rights. For example, each of the long-term customer contracts we maintain contains various termination rights including, without limitation:
|
•
|
for no cause by giving notice as agreed in the contract;
|
|
•
|
upon the occurrence of certain events of force majeure;
|
|
•
|
if we fail to make available specified scheduled cargo quantities;
|
|
•
|
upon the occurrence of certain uncured payment defaults;
|
|
•
|
upon the occurrence of an insolvency event;
|
|
•
|
upon the occurrence of certain uncured, material breaches; and
|
|
•
|
if we fail to commence commercial operations within the agreed timeframes.
|
We may not be able to replace these contracts on desirable terms, or at all, if they are terminated. Contracts that we enter into in the future may contain similar provisions. If any of these current or future contracts are terminated, such termination could have a material adverse effect on our business, contracts, financial condition, operating results, cash flows, liquidity and prospects.
Cyclical or other changes in the demand for and price of LNG and natural gas may adversely affect our business and the performance of our customers and could have a material adverse effect on our business, contracts, financial condition, operating results, cash flows, liquidity and prospects.
Our business and the development of energy-related infrastructure and projects generally is based on assumptions about the future availability and price of natural gas and LNG markets. Natural gas and LNG prices have at various times been and may become volatile due to one or more of the following factors:
|
•
|
additions to competitive regasification capacity in North America and other markets, which could divert LNG or natural gas from our business;
|
|
•
|
insufficient or oversupply of natural gas liquefaction or export capacity worldwide;
|
|
•
|
insufficient LNG tanker capacity;
|
|
•
|
weather conditions and natural disasters;
|
|
•
|
reduced demand and lower prices for natural gas;
|
|
•
|
increased natural gas production deliverable by pipelines, which could suppress demand for LNG;
|
|
•
|
decreased oil and natural gas exploration activities, which may decrease the production of natural gas, or decrease the demand for LNG used in the oil and gas exploration and production process;
|
|
•
|
cost improvements that allow competitors to offer LNG regasification services at reduced prices;
|
17
|
•
|
changes in supplies of, and prices for, alternative energy sources such as coal, oil, nuclear, hydroelectric, wind and solar energy, which may reduce the demand for natural gas;
|
|
•
|
changes in regulatory, tax or other governmental policies regarding imported or exported LNG, natural gas or alternative energy sources, which may reduce the demand for imported or exported LNG and/or natural gas;
|
|
•
|
political conditions in natural gas producing regions;
|
|
•
|
imposition of tariffs by China or any other jurisdiction on imports of LNG from the United States; and
|
|
•
|
cyclical trends in general business and economic conditions that cause changes in the demand for natural gas.
|
Adverse trends or developments affecting any of these factors could result in decreases in the prices at which we are able to sell LNG and natural gas and related services or increases in the prices we have to pay for natural gas or LNG, which could materially and adversely affect the performance of our customers, and could have a material adverse effect on our business, contracts, financial condition, operating results, cash flows, liquidity and prospects.
Failure to maintain sufficient working capital could limit our growth and harm our business, financial condition and results of operations.
We have significant working capital requirements, primarily driven by the delay between the purchase of and payment for natural gas and the payment terms that we offer our customers. Differences between the date when we pay our LNG supply and service providers and the date when we receive payments from our customers may adversely affect our liquidity and our cash flows. We expect our working capital needs to increase as our total business increases. If we do not have sufficient working capital, we may not be able to pursue our growth strategy, respond to competitive pressures or fund key strategic initiatives, such as the development of our facilities, which may harm our business, financial condition and results of operations.
Operation of our LNG infrastructure and other facilities that we may construct involves significant risks.
As more fully discussed in this report, our existing facilities and expected future facilities face operational risks, including the following: performing below expected levels of efficiency, breakdowns or failures of equipment, operational errors by trucks, operational errors by us or any contracted facility operator, labor disputes and weather-related or natural disaster interruptions of operations.
Any of these risks could disrupt our operations and increase our costs, which would adversely affect our business, operating results, cash flows and liquidity.
The operation of our plants will involve particular, significant risks.
The operation of our plants will involve particular, significant risks, including, among others: failure to maintain the required license(s) or other permits required to operate our plants; pollution or environmental contamination affecting operation of our plants; the inability, or failure, of any counterparty to any plant-related agreements to perform their contractual obligations to us and planned and unplanned power outages due to maintenance, expansion and refurbishment. We cannot assure you that future occurrences of any of the events listed above or any other events of a similar or dissimilar nature would not significantly decrease or eliminate the revenues from, or significantly increase the costs of operating, our plants. As a consequence, there may be reduced or no revenues from our plants which could have a material adverse effect on our business, contracts, financial condition, operating results, cash flow, liquidity and prospects.
Global climate change may in the future increase the frequency and severity of weather events and the losses resulting therefrom, which could have a material adverse effect on the economies in the markets in we operate or plan to operate in the future and therefore on our business.
Over the past several years, changing weather patterns and climatic conditions, such as global warming, have added to the unpredictability and frequency of natural disasters in certain parts of the world, including the markets in which we operate and intend to operate, and have created additional uncertainty as to future trends. There is a growing consensus today that climate change increases the frequency and severity of extreme weather events and, in recent years, the frequency of major weather events appears to have increased. We cannot predict whether or to what extent damage that may be caused by natural events, such as severe tropical storms and hurricanes, will affect our operations or the economies in our current or future market areas, but the increased frequency and severity of such weather events could increase the negative impacts to economic conditions in these regions and result in a decline in the value or the destruction of our liquefiers and downstream facilities or affect our ability to transmit LNG. In particular, if one of the regions in which we operate is impacted by such a natural catastrophe in the future, it could have a material adverse effect on our business. Further, the economies of such impacted areas may require significant time to recover and there is no assurance
18
that a full recovery will occur. Even the threat of a severe weather event could impact our business, financial condition or the price of our common stock.
Hurricanes or other natural or manmade disasters could result in an interruption of our operations, a delay in the completion of our liquefaction facilities, higher construction costs or the deferral of the dates on which payments are due under our customer contracts, all of which could adversely affect us.
Storms and related storm activity and collateral effects, or other disasters such as explosions, fires, seismic events, floods or accidents, could result in damage to, or interruption of operations in our supply chain, including at our facilities or related infrastructure, as well as delays or cost increases in the construction and the development of our proposed facilities or other infrastructure. Due to the concentration of our current plant operations in coastal areas of North America, we are particularly exposed to the risks posed by hurricanes, tropical storms and their collateral effects. For example, the 2018 Atlantic hurricane season caused extensive and costly damage across the U.S. Gulf Coast, Eastern Seaboard, and the Caribbean. We are unable to predict with certainty the impact of future storms on our customers, infrastructure or operations.
If one or more trailer, terminals, pipelines, facilities, equipment or electronic systems that we own, lease or operate or that deliver products to us or that supply our facilities and our customers’ facilities are damaged by severe weather or any other disaster, accident, catastrophe, terrorist or cyber-attack or event, our operations and construction projects could be delayed and our operations could be significantly interrupted. These delays and interruptions could involve significant damage to people, property or the environment, and repairs could take a week or less for a minor incident to six months or more for a major interruption. Any event that interrupts the revenues generated by our operations, or that causes us to make significant expenditures not covered by insurance, could have a material adverse effect on our business, contracts, financial condition, operating results, cash flow, liquidity and prospects.
We intend to maintain insurance against certain risks and losses. We may not be able to maintain desired or required insurance in the future at rates that we consider reasonable. The occurrence of a significant event not fully insured or indemnified against could have a material adverse effect on our business, contracts, financial condition, operating results, cash flow, liquidity and prospects.
The rapid spread of a contagious illness such as a novel coronavirus, or fear of such an event, may adversely affect our business, operations and financial condition.
Our business could be adversely affected by the effects of a widespread outbreak of contagious disease, including the recent outbreak of respiratory illness caused by a novel coronavirus. As the outbreak is still evolving, much of its impact remains unknown. However, our reliance on third-party suppliers, contractors, service providers, and commodity markets exposes us to possibility of delay or interruption of our operations. In addition, if our customers are impacted, we may experience a lower demand for LNG or natural gas. It is impossible to predict the effect of the continued spread, or fear of continued spread, of the coronavirus globally. Should the coronavirus continue to spread globally or not be contained to countries with current outbreaks, our business, financial condition and results of operations could be negatively impacted.
A cyber incident could result in information theft, data corruption, operational disruption, operational delays and/or financial loss.
Our business has become increasingly dependent on digital technologies to conduct day-to-day operations. We depend on digital technology to manage our operations and other business processes and to record financial, operating and other sensitive data. Our business partners, including vendors, customers and financial institutions, are also dependent on digital technology. Our technologies, systems networks, and those of our business partners, may become the target of cyber-attacks or information security breaches that could result in the disruption of our business operations. As cyber threats continue to evolve, we may be required to expend significant additional resources to continue to modify or enhance our protective measures or to investigate and remediate any cyber vulnerabilities. A cyber incident could lead to losses of sensitive information, critical infrastructure, personnel, or capabilities essential to our operations and could have a material adverse effect on our reputation, business, financial condition and results of operations.
Our insurance may be insufficient to cover losses that may occur to our property or result from our operations.
Our current operations and future projects are subject to the inherent risks associated with LNG, natural gas and power operations, including explosions, pollution, release of toxic substances, fires, seismic events, hurricanes and other adverse weather conditions, and other hazards, each of which could result in significant delays in commencement or interruptions of operations and/or result in damage to or destruction of our facilities and assets or damage to persons and property. In addition, such operations and the modes of transport of third parties on which our current operations and future projects may be dependent face possible risks associated with acts of aggression or terrorism. Some of the regions in which we operate are affected by hurricanes or tropical storms. We do not, nor do we intend to, maintain insurance against all of these risks and losses. In particular, we do not carry business interruption insurance for hurricanes and other natural disasters. Therefore, the occurrence of one or more significant events not fully insured or
19
indemnified against could create significant liabilities and losses which could have a material adverse effect on our business, contracts, financial condition, operating results, cash flow, liquidity and prospects.
We may be unable to procure adequate insurance coverage at commercially reasonable rates in the future. For example, environmental regulations have led in the past to increased costs for, and in the future may result in the lack of availability of, insurance against risks of environmental damage or pollution. A catastrophic release of natural gas, marine disaster or natural disasters could result in losses that exceed our insurance coverage, which could harm our business, financial condition and operating results. Any uninsured or underinsured loss could harm our business and financial condition. In addition, our insurance may be voidable by the insurers as a result of certain of our actions.
Changes in the insurance markets attributable to terrorist attacks or political change may also make certain types of insurance more difficult for us to obtain. In addition, the insurance that may be available may be significantly more expensive than our existing coverage.
From time to time, we may be involved in legal proceedings and may experience unfavorable outcomes.
In the future we may be subject to material legal proceedings in the course of our business, including, but not limited to, actions relating to contract disputes, business practices, intellectual property and other commercial and tax matters. Such legal proceedings may involve claims for substantial amounts of money or for other relief or might necessitate changes to our business or operations, and the defense of such actions may be both time consuming and expensive. Further, if any such proceedings were to result in an unfavorable outcome, it could have a material adverse effect on our business, financial position and results of operations.
The construction of our energy-related infrastructure is subject to operational, regulatory, environmental, political, legal and economic risks, which may result in delays, increased costs or decreased cash flows.
The construction of energy-related infrastructure, including liquefaction facilities, as well as other future projects, involves numerous operational, regulatory, environmental, political, legal and economic risks beyond our control and may require the expenditure of significant amounts of capital during construction and thereafter. These potential risks include, among other things, the following:
|
•
|
we may be unable to complete construction projects on schedule or at the budgeted cost due to the unavailability of required construction personnel or materials, accidents or weather conditions;
|
|
•
|
we will not receive any material increase in operating cash flows until a project is completed, even though we may have expended considerable funds during the construction phase, which may be prolonged;
|
|
•
|
we may construct facilities to capture anticipated future energy consumption growth in a region in which such growth does not materialize;
|
|
•
|
the completion or success of our construction project may depend on the completion of a third-party construction project (e.g., additional public utility infrastructure projects) that we do not control and that may be subject to numerous additional potential risks, delays and complexities;
|
|
•
|
we may not be able to obtain key permits or land use approvals including those required under environmental laws on terms that are satisfactory for our operations and on a timeline that meets our commercial obligations, and there may be delays, perhaps substantial in length, such as in the event of challenges by citizens groups or non-governmental organizations, including those opposed to fossil fuel energy sources;
|
|
•
|
we may be subject to local opposition, including the efforts by environmental groups; and
|
|
•
|
we may be unable to obtain rights-of-way to construct additional energy-related infrastructure or the cost to do so may be uneconomical.
|
A materialization of any of these risks could adversely affect our ability to achieve growth in the level of our cash flows or realize benefits from future projects, which could have a material adverse effect on our business, financial condition and results of operations.
We expect to be dependent on our primary building contractor and other contractors for the successful completion of our energy-related infrastructure.
Timely and cost-effective completion of energy-related infrastructure, including liquefaction facilities, as well as future projects, in compliance with agreed specifications is central to our business strategy and is highly dependent on the performance of our primary building contractor and subcontractors. The ability of our primary building contractor and our other contractors to perform successfully under their agreements with us is dependent on a number of factors, including the contractor’s ability to:
20
|
•
|
design and engineer each of our facilities to operate in accordance with specifications;
|
|
•
|
engage and retain third-party subcontractors and procure equipment and supplies;
|
|
•
|
respond to difficulties such as equipment failure, delivery delays, schedule changes and failures to perform by subcontractors, some of which are beyond their control;
|
|
•
|
attract, develop and retain skilled personnel, including engineers;
|
|
•
|
post required construction bonds and comply with the terms thereof;
|
|
•
|
manage the construction process generally, including coordinating with other contractors and regulatory agencies; and
|
|
•
|
maintain their own financial condition, including adequate working capital.
|
Until we have entered into an Engineering, Procurement and Construction (“EPC”) contract for a particular project, in which the EPC contractor agrees to meet our planned schedule and projected total costs for a project, we are subject to potential fluctuations in construction costs and other related project costs. Although some agreements may provide for liquidated damages if the contractor fails to perform in the manner required with respect to certain of its obligations, the events that trigger a requirement to pay liquidated damages may delay or impair the operation of the applicable facility, and any liquidated damages that we receive may be delayed or insufficient to cover the damages that we suffer as a result of any such delay or impairment. The obligations of our primary building contractor and other contractors to pay liquidated damages under their agreements with us are subject to caps on liability, as set forth therein. Furthermore, we may have disagreements with our contractors about different elements of the construction process, which could lead to the assertion of rights and remedies under our contracts and increase the cost of the applicable facility or result in a contractor’s unwillingness to perform further work. If any contractor is unable or unwilling to perform according to the negotiated terms and timetable of its respective agreement for any reason or terminates its agreement for any reason, we would be required to engage a substitute contractor, which could be particularly difficult in certain of the markets in which we operate or plan to operate. This would likely result in significant project delays and increased costs, which could have a material adverse effect on our business, contracts, financial condition, operating results, cash flow, liquidity and prospects.
We are relying on third party engineers to estimate the future rated capacity and performance capabilities of our existing and future facilities, and these estimates may prove to be inaccurate.
We are relying on third parties for the design and engineering services underlying our estimates of the future rated capacity and performance capabilities of our liquefaction facilities, as well as other future projects. If any of these facilities, when actually constructed, fails to have the rated capacity and performance capabilities that we intend, our estimates may not be accurate. Failure of any of our existing or future facilities to achieve our intended future capacity and performance capabilities could prevent us from achieving the commercial start dates under our customer contracts and could have a material adverse effect on our business, contracts, financial condition, operating results, cash flow, liquidity and prospects.
We may not be able to purchase or receive physical delivery of natural gas in sufficient quantities and/or at economically attractive prices to satisfy our delivery obligations under our commercial agreements, which could have a material adverse effect on our business.
We may not be able to purchase or receive physical delivery of sufficient quantities of LNG or natural gas to satisfy delivery obligations, which may provide customers with the right to terminate our commercial agreements. In addition, price fluctuations in natural gas and LNG may make it expensive or uneconomical for us to acquire adequate supply of these items.
We will be dependent upon third party LNG suppliers and shippers and facilities to provide delivery options to and from their energy-related infrastructure. If LNG were to become unavailable for current or future volumes of natural gas due to repairs or damage to supplier facilities, lack of capacity or any other reason, our ability to continue delivering natural gas to end-users could be restricted, thereby reducing revenues. Any permanent interruption at any key LNG supply chains that caused a material reduction in volumes could have a material adverse effect on our business, financial condition, operating results, cash flow, liquidity and prospects.
Recently, the LNG industry has experienced increased volatility. If market disruptions and bankruptcies of third party LNG suppliers and shippers negatively impacts our ability to purchase a sufficient amount of LNG or significantly increases our costs for purchasing LNG, our business, operating results, cash flows and liquidity could be materially and adversely affected. There can be no assurances that we will be able to supply our customers with LNG produced at our own facilities.
We face competition based upon market price for LNG or natural gas.
Our business is subject to the risk of natural gas and LNG price competition at times when we need to replace any existing customer contract, whether due to natural expiration, default or otherwise, or enter into new customer contracts. Factors relating to
21
competition may prevent us from entering into new or replacement customer contracts on economically comparable terms to existing customer contracts, or at all. Such an event could have a material adverse effect on our business, contracts, financial condition, operating results, cash flow, liquidity and prospects. Factors which may negatively affect potential demand for natural gas from our business are diverse and include, among others:
|
•
|
increases in worldwide LNG production capacity and availability of LNG for market supply;
|
|
•
|
increases in demand for natural gas but at levels below those required to maintain current price equilibrium with respect to supply;
|
|
•
|
increases or decreases in the cost of LNG;
|
|
•
|
decreases in the cost of competing sources of natural gas, LNG or alternate fuels such as coal, heavy fuel oil and diesel; and
|
|
•
|
displacement of LNG or fossil fuels more broadly by alternate fuels or energy sources or technologies (including but not limited to nuclear, wind, solar, biofuels and batteries) in locations where access to these energy sources is not currently available or prevalent.
|
Technological innovation may render our processes obsolete.
The success of our current operations and future projects will depend in part on our ability to create and maintain a competitive position in the natural gas liquefaction industry. In particular, although we plan to utilize proven technologies such as those currently in operation at our George West plant, we do not have any exclusive rights to any of these technologies. In addition, such technologies may be rendered obsolete or uneconomical by legal or regulatory requirements, technological advances, more efficient and cost-effective processes or entirely different approaches developed by one or more of our competitors or others, which could materially and adversely affect our business, ability to realize benefits from future projects, results of operations, financial condition, liquidity and prospects.
Changes in legislation and regulations could have a material adverse impact on our business, results of operations, financial condition, liquidity and prospects.
Our business is subject to governmental laws, rules, regulations and requires permits that impose various restrictions and obligations that may have material effects on our results of operations. In addition, each of the applicable regulatory requirements and limitations is subject to change, either through new regulations enacted on the federal, state or local level, or by new or modified regulations that may be implemented under existing law. The nature and extent of any changes in these laws, rules, regulations and permits may be unpredictable and may have material effects on our business. Future legislation and regulations or changes in existing legislation and regulations, or interpretations thereof, such as those relating to the liquefaction, storage, or regasification of LNG, or its transportation could cause additional expenditures, restrictions and delays in connection with our operations as well as other future projects, the extent of which cannot be predicted and which may require us to limit substantially, delay or cease operations in some circumstances. Revised, reinterpreted or additional laws and regulations that result in increased compliance costs or additional operating costs and restrictions could have an adverse effect on our business, our ability to expand our business, including into new markets, results of operations, financial condition, liquidity and prospects.
Increasing trucking regulations may increase costs and negatively impact our results of operations.
We are using transportation systems that include trucks that we own and operate. Such operations are subject to various trucking safety regulations, including those which are enacted, reviewed and amended by the Federal Motor Carrier Safety Administration (“FMCSA”). These regulatory authorities exercise broad powers, governing activities such as the authorization to engage in motor carrier operations, driver licensing, insurance requirements, financial reporting and review of certain mergers, consolidations and acquisitions, and transportation of hazardous materials. To a large degree, intrastate motor carrier operations are subject to state and/or local safety regulations that mirror federal regulations but also regulate the weight and size dimensions of loads.
All federally regulated carriers’ safety ratings are measured through a program implemented by the FMCSA known as the Compliance Safety Accountability (“CSA”) program. The CSA program measures a carrier’s safety performance based on violations observed during roadside inspections as opposed to compliance audits performed by the FMCSA. The quantity and severity of any violations are compared to a peer group of companies of comparable size and annual mileage. If a company rises above a threshold established by the FMCSA, it is subject to action from the FMCSA. There is a progressive intervention strategy that begins with a company providing the FMCSA with an acceptable plan of corrective action that the company will implement. If the issues are not corrected, the intervention escalates to on-site compliance audits and ultimately an “unsatisfactory” rating and the revocation of the company’s operating authority by the FMCSA, which could result in a material adverse effect on our business and consolidated results of operations and financial position.
22
Any trucking operations would be subject to possible regulatory and legislative changes that may increase our costs. Some of these possible changes include changes in environmental regulations, changes in the hours of service regulations which govern the amount of time a driver may drive or work in any specific period, onboard black box recorder device requirements or limits on vehicle weight and size.
Competition in the LNG industry is intense, and some of our competitors have greater financial, technological and other resources than we currently possess.
We plan to operate in the highly competitive area of LNG production and face intense competition from independent, technology-driven companies as well as from both major and other independent oil and natural gas companies and utilities, many of which have been in operation longer than us.
Many competing companies have secured access to, or are pursuing development or acquisition of, LNG facilities in North America. We may face competition from major energy companies and others in pursuing the proposed business strategy to provide LNG. Some of these competitors have longer operating histories, more development experience, greater name recognition, larger staffs and substantially greater financial, technical and marketing resources than we currently possess. We also face competition for the contractors needed to build our facilities. The superior resources that some of these competitors have available for deployment could allow them to compete successfully against us, which could have a material adverse effect on our business, ability to realize benefits from future projects, results of operations, financial condition, liquidity and prospects.
Failure of LNG to be a competitive source of energy in the markets in which we operate, and seek to operate, could adversely affect our expansion strategy.
Our operations are, and will be, dependent upon LNG being a competitive source of energy in the markets in which we operate. In the United States, due mainly to a historic abundant supply of natural gas and discoveries of substantial quantities of unconventional, or shale, natural gas, imported LNG has not developed into a significant energy source. The success of the domestic liquefaction component of our business plan is dependent, in part, on the extent to which natural gas can, for significant periods and in significant volumes, be produced in the United States at a lower cost than the cost to produce some domestic supplies of other alternative energy sources, and that it can be transported at reasonable rates through appropriately-scaled infrastructure.
Additionally, natural gas competes with other sources of energy, including coal, oil, nuclear, hydroelectric, wind and solar energy, which may become available at a lower cost in certain markets. As a result of this and other factors, natural gas may not be a competitive source of energy in the markets we intend to serve or elsewhere. The failure of natural gas to be a competitive supply alternative to oil and other alternative energy sources could adversely affect our ability to deliver LNG or natural gas to our customers in North America or other locations on a commercial basis.
Our risk management strategies cannot eliminate all LNG price and supply risks. In addition, any non-compliance with our risk management strategies could result in significant financial losses.
When engaged in marketing activities, it is our strategy to maintain a manageable balance between LNG purchases, on the one hand, and sales or future delivery obligations, on the other hand. Through these transactions, we seek to earn a margin for the LNG purchased by selling LNG for physical delivery to third-party users, such as public utilities, industrial users, trucking fleets and other potential end-users converting from traditional diesel or oil fuel to natural gas. These strategies cannot, however, eliminate all price risks. For example, any event that disrupts our anticipated supply chain could expose us to risk of loss resulting from price changes if we are required to obtain alternative supplies to cover these transactions. We are also exposed to basis risks when LNG is purchased against one pricing index and sold against a different index. Moreover, we are also exposed to other risks, including price risks on LNG we own, which must be maintained in order to facilitate transportation of the LNG to our customers or to our facilities. In addition, our marketing operations involve the risk of non-compliance with our risk management policies. We cannot assure you that our processes and procedures will detect and prevent all violations of our risk management strategies, particularly if deception or other intentional misconduct is involved. If we were to incur a material loss related to commodity price risks, including non-compliance with our risk management strategies, it could have a material adverse effect on our financial position, results of operations and cash flows. There can be no assurance that we will be able to supply our customers with LNG produced at its own facilities.
We may experience increased labor costs, and the unavailability of skilled workers or failure to attract and retain qualified personnel could adversely affect us.
We are dependent upon the available labor pool of skilled employees, including truck drivers. We compete with other energy companies and other employers to attract and retain qualified personnel with the technical skills and experience required to construct and operate energy-related infrastructure and to provide our customers with the highest quality service. In addition, the tightening of the transportation related labor market due to the shortage of skilled truck drivers may affect our ability to hire and retain skilled truck drivers and require us to pay increased wages. We, and our subsidiaries in the United States who hire personnel, are also subject
23
to the Fair Labor Standards Act, which governs such matters as minimum wage, overtime and other working conditions. We are also subject to applicable labor regulations in the other jurisdictions in which we operate, including Canada and Mexico. We may face challenges and costs in hiring, retaining and managing our employee base. A shortage in the labor pool of skilled workers or other general inflationary pressures or changes in applicable laws and regulations, could make it more difficult for us to attract and retain qualified personnel and could require an increase in the wage and benefits packages that we offer, thereby increasing our operating costs. Any increase in our operating costs could materially and adversely affect our business, financial condition, operating results, liquidity and prospects.
We may incur impairments to goodwill or long-lived assets.
We test our long-lived assets for impairment whenever events or changes in circumstances indicate that the carrying amount of these assets may not be recoverable. We currently intend to test goodwill for impairment annually, or more frequently as circumstances dictate. Significant negative industry or economic trends, and decline of market capitalization, reduced estimates of future cash flows for business segments or disruptions to business could lead to an impairment charge of the long-lived assets, including our goodwill. Our valuation methodology for assessing impairment requires management to make judgments and assumptions based on historical experience and to rely heavily on projections of future operating performance. Projections of future operating results and cash flows may vary significantly from results. In addition, if our analysis results in an impairment to our goodwill or long-lived assets, we may be required to record a charge to earnings in our consolidated financial statements during a period in which such impairment is determined to exist, which may negatively impact our operating results.
A major health and safety incident involving LNG or the energy industry more broadly or relating to our business may lead to more stringent regulation of LNG operations or the energy business generally, could result in greater difficulties in obtaining permits, including under environmental laws, on favorable terms, and may otherwise lead to significant liabilities and reputational damage.
Health and safety performance is critical to the success of all areas of our business. Any failure in health and safety performance from our operations may result in an event that causes personal harm or injury to our employees, other persons, and/or the environment, as well as the imposition of injunctive relief and/or penalties for non-compliance with relevant regulatory requirements or litigation. Any such failure that results in a significant health and safety incident may be costly in terms of potential liabilities, and may result in liabilities that exceed the limits of our insurance coverage. Such a failure, or a similar failure elsewhere in the energy industry (including, in particular, LNG liquefaction, storage, transportation or regasification operations), could generate public concern, which may lead to new laws and/or regulations that would impose more stringent requirements on our operations, have a corresponding impact on our ability to obtain permits and approvals, and otherwise jeopardize our reputation or the reputation of our industry as well as our relationships with relevant regulatory agencies and local communities. Individually or collectively, these developments could adversely impact our ability to expand our business, including into new markets. Similarly, such developments could have a material adverse effect on our business, contracts, financial condition, operating results, cash flow, liquidity and prospects.
Failure to obtain and maintain permits, approvals and authorizations from governmental and regulatory agencies on favorable terms with respect to the design, construction and operation of our facilities could impede operations and construction and could have a material adverse effect on us.
The design, construction and operation of energy-related infrastructure, including existing and proposed facilities, the import and export of LNG and the transportation of natural gas, are highly regulated activities at the federal, state and local levels. Approvals of the Department of Energy (“DOE”) under Section 3 of the Natural Gas Act (“NGA”), as well as several other material governmental and regulatory permits, approvals and authorizations, including under the Clean Air Act (“CAA”) and the Clean Water Act (“CWA”) and their state analogues, may be required in order to construct and operate an LNG facility and export LNG. Permits, approvals and authorizations obtained from the Federal Energy Regulatory Commission (“FERC”), DOE and other federal and state regulatory agencies also contain ongoing conditions, and additional requirements may be imposed. Certain federal permitting processes may trigger the requirements of the National Environmental Policy Act (“NEPA”), which requires federal agencies to evaluate major agency actions that have the potential to significantly impact the environment. Compliance with NEPA may extend the time and/or increase the costs for obtaining necessary governmental approvals associated with our operations and create independent risk of legal challenges to the adequacy of the NEPA analysis, which could result in delays that may adversely affect our business, contracts, financial condition, operating results, cash flow, liquidity and profitability. We may also be subject to yet additional requirements in Canada and Mexico or other jurisdictions, including with respect to land use approvals needed to construct and operate our facilities.
We cannot control the outcome of any review and approval process, including whether or when any such permits, approvals and authorizations will be obtained, the terms of their issuance, or possible appeals or other potential interventions by third parties that could interfere with our ability to obtain and maintain such permits, approvals and authorizations or the terms thereof. If we are unable to obtain and maintain such permits, approvals and authorizations on favorable terms, we may not be able to recover our investment in our projects. Many of these permits, approvals and authorizations require public notice and comment before they can
24
be issued, which can lead to delays to respond to such comments, and even potentially to revise the permit application. There is no assurance that we will obtain and maintain these governmental permits, approvals and authorizations on favorable terms, or that we will be able to obtain them on a timely basis, and failure to obtain and maintain any of these permits, approvals or authorizations could have a material adverse effect on our business, financial condition, operating results, liquidity and prospects. Moreover, many of these permits, approvals and authorizations are subject to administrative and judicial challenges, which can delay and protract the process for obtaining and implementing permits and can also add significant costs and uncertainty.
Existing and future environmental, health and safety laws and regulations could result in increased compliance costs or additional operating costs or construction costs and restrictions.
Our business is now and will in the future be subject to extensive federal, international, state and local laws and regulations both in the United States and in other jurisdictions where we operate that regulate and restrict, among other things, the siting and design of our facilities, discharges to air, land and water, with particular respect to the protection of human health, the environment and natural resources from risks associated with storing, receiving and transporting LNG; the handling, storage and disposal of hazardous materials, hazardous waste and petroleum products; and remediation associated with the release of hazardous substances. For example, the Pipeline Hazardous Materials Safety Administration (“PHMSA”) has promulgated detailed regulations governing LNG facilities under its jurisdiction to address LNG facility siting, design, construction, equipment, operations, maintenance, personnel qualifications and training, fire protection and security. State and local regulators can impose similar siting, design, construction and operational requirements.
Federal and state laws impose liability, without regard to fault or the lawfulness of the original conduct, for the release of certain types or quantities of hazardous substances into the environment. As the owner and operator of our facilities, we could be liable for the costs of cleaning up any such hazardous substances that may be released into the environment at or from our facilities and for resulting damage to natural resources.
Many of these laws and regulations, such as the CAA and the CWA, and analogous state laws and regulations, restrict or prohibit the types, quantities and concentration of substances that can be emitted into the environment in connection with the construction and operation of our facilities, and require us to obtain and maintain permits and provide governmental authorities with access to our facilities for inspection and reports related to compliance. Relevant local authorities may also require us to obtain and maintain permits associated with the construction and operation of our facilities, including with respect to land use approvals. Failure to comply with these laws and regulations could lead to substantial liabilities, fines and penalties or capital expenditures related to pollution control equipment and restrictions or curtailment of operations, which could have a material adverse effect on our business, contracts, financial condition, operating results, cash flow, liquidity and prospects.
Other future legislation and regulations could cause additional expenditures, restrictions and delays in our business and to our proposed construction, the extent of which cannot be predicted and which may require us to limit substantially, delay or cease operations in some circumstances. In October 2017, the U.S. Government Accountability Office issued a legal determination that a 2013 interagency guidance document was a “rule” subject to the Congressional Review Act (“CRA”). This legal determination could open a broader set of agency guidance documents to potential disapproval and invalidation under the CRA, potentially increasing the likelihood that laws and regulations applicable to our business will become subject to revised interpretations in the future that we cannot predict. Revised, reinterpreted or additional laws and regulations that result in increased compliance costs or additional operating or construction costs and restrictions could have a material adverse effect on our business, contracts, financial condition, operating results, cash flow, liquidity and prospects.
Greenhouse Gases/Climate Change
. From time to time, there may be federal and state regulatory and policy initiatives to reduce GHG emissions in the United States from a variety of sources. Other federal and state initiatives are being considered or may be considered in the future to address GHG emissions through, for example, United States treaty commitments or other international agreements, direct regulation, a carbon emissions tax, or cap-and-trade programs.
Responding to scientific reports regarding threats posed by global climate change, the U.S. Congress has in the past considered legislation to reduce emissions of GHGs. In addition, some states and foreign jurisdictions have individually or in regional cooperation, imposed restrictions on GHG emissions under various policies and approaches, including establishing a cap on emissions, requiring efficiency measures, or providing incentives for pollution reduction, use of renewable energy sources, or use of replacement fuels with lower carbon content.
The adoption and implementation of any U.S. federal, state or local regulations or foreign regulations imposing obligations on, or limiting emissions of GHGs from, our equipment and operations could require us to incur significant costs to reduce emissions of GHGs associated with their operations or could adversely affect demand for natural gas and natural gas products. The potential increase in our operating costs could include new costs to operate and maintain our facilities, install new emission controls on our facilities, acquire allowances to authorize our GHG emissions, pay taxes related to our GHG emissions, and administer and manage a GHG emissions program. We may not be able to recover such increased costs through increases in customer prices or rates. In
25
addition, changes in regulatory policies that result in a reduction in the demand for hydrocarbon products that are deemed to contribute to GHGs, or restrict their use, may reduce volumes available to us for processing, transportation, marketing and storage. These developments could have a material adverse effect on our financial position, results of operations and cash flows.
In addition, due to concerns over climate change, numerous countries around the world have adopted or are considering adopting laws or regulations to reduce GHG emissions. In December 2015, the U.S. and 195 other nations attending the United Nations Climate Change Conference adopted the Paris Agreement on global climate change, which establishes a universal framework for addressing GHG emissions based on nationally determined contributions. The Paris Agreement calls for zero net anthropogenic GHG emission to be reached during the second half of the 21st century. The Paris Agreement does not create any binding obligations for nations to limit their GHG emissions but rather includes pledges to voluntarily limit or reduce future emissions. It also creates a process for participating countries to review and increase their intended emissions reduction goals every five years. Although the United States became a party to the Paris Agreement in April 2016, the Trump administration subsequently announced in June 2017 its intention either to withdraw from the Paris Agreement or renegotiate more favorable terms. However, the Paris Agreement stipulates that participating countries must wait four years before withdrawing from the agreement. It is not possible to know how quickly renewable energy technologies may advance, but the increased use of renewable energy could ultimately reduce future demand for hydrocarbons. These developments could have a material adverse effect on our financial position, results of operations and cash flows.
Fossil Fuels
. Our business activities depend upon a sufficient and reliable supply of natural gas feedstock, and are therefore subject to concerns in certain sectors of the public about the exploration, production and transportation of natural gas and other fossil fuels and the consumption of fossil fuels more generally. Legislative and regulatory action, and possible litigation, in response to such public concerns may also adversely affect our operations. We may be subject to future laws, regulations, or actions to address such public concern with fossil fuel generation, distribution and combustion, greenhouse gases and the effects of global climate change. Our customers may also move away from using fossil fuels such as LNG for their power generation needs for reputational or perceived risk-related reasons. These matters represent uncertainties in the operation and management of our business, and could have a material adverse effect on our financial position, results of operations and cash flows.
Risks Inherent in an Investment in Us
We expect that we may incur losses over the next several years and may never achieve or maintain profitability.
We expect that we may continue to incur significant expenses and operating losses for the foreseeable future. The net losses the Company incurs may fluctuate significantly from quarter to quarter. We anticipate that our expenses will increase substantially if and as we:
|
•
|
seek to identify additional expansion of business operation opportunities;
|
|
•
|
develop manufacturing processes and distribution processes;
|
|
•
|
establish a sales, marketing and distribution infrastructure to commercialize its business and products;
|
|
•
|
hire additional personnel;
|
|
•
|
add operational, financial and management information systems and personnel, including personnel to support our business development and planned future commercialization efforts; and
|
|
•
|
continue to operate as a public company.
|
To become and remain profitable, our company must develop and execute its business plan. This will require it to be successful in a range of challenging activities. Our company may never succeed in these activities and, even if it does, may never generate revenues that are significant or large enough to achieve profitability. If our company does achieve profitability, it may not be able to sustain or increase profitability on a quarterly or annual basis. Our company’s failure to become and remain profitable would decrease the value of the company and could impair its ability to raise capital, maintain its existing business operations and development efforts, expand its business or continue its operations and may require it to raise additional capital that may dilute the ownership interest of common stockholders. A decline in the value of the company could also cause stockholders to lose all or part of their investment.
Our company may need substantial additional funding. If we are unable to raise capital when needed, we would be compelled to delay, reduce or eliminate portions of its existing business operations and development efforts.
We expect our expenses to increase in parallel with our ongoing activities. If we are unable to raise capital when needed or on attractive terms, we may be forced to delay, reduce or eliminate parts of our existing business and development efforts.
Based upon current operating plans, our net cash to fund our operations will be challenging. We may need to raise additional funds to pursue business activities and opportunities. Additionally, our funding needs may fluctuate significantly based on a number
26
of factors. Accordingly, we will need to continue to rely on additional financing to achieve our business objectives. Adequate additional financing may not be available to us on acceptable terms, or at all.
Raising additional capital may cause dilution to our stockholders or restrict our operations.
We expect to finance our cash needs through a combination of additional equity offerings and debt financings. To the extent that we raise additional capital through the sale of equity or convertible debt securities, the ownership interest of common stockholders will be diluted, and the terms of these securities may include liquidation or other preferences that adversely affect the rights of common stockholders. Debt financing and preferred equity financing, if available, may involve agreements that include covenants limiting or restricting its ability to take specific actions, such as incurring additional debt, making capital expenditures or declaring dividends.
We cannot be certain that additional funding will be available on acceptable terms, or at all. If we are unable to raise additional funds when needed, we may be required to delay, limit, reduce or terminate our product development or future commercialization efforts.
Following the Share Exchange, the market price of our common stock declined, and we expect the stock price of our common stock to continue to be volatile.
The market price of our common stock could continue to fluctuate. Market prices for securities of energy producers, distributors and other businesses in the energy generation and distribution industry have been particularly volatile. Some of the factors that may cause the market price of the common stock of the Company to fluctuate include:
|
•
|
our ability to obtain regulatory approvals for LNG business expansions, and delays or failures to obtain such approvals;
|
|
•
|
failure of any of our business strategy to achieve commercial success;
|
|
•
|
issues in developing and expanding our LNG infrastructure and facilities, and service and delivery operations;
|
|
•
|
the results of our current and any future business operations related to LNG distribution or production;
|
|
•
|
the entry into, or termination of, key agreements, including key commercial partner agreements;
|
|
•
|
the initiation of, material developments in, or conclusion of litigation to enforce or defend any of our rights under our material contracts or defend against the rights of others;
|
|
•
|
the introduction of technological innovations or new energy products or methods of distribution that compete with our potential products;
|
|
•
|
the loss of key employees;
|
|
•
|
changes in estimates or recommendations by securities analysts, if any, who cover our common stock;
|
|
•
|
general and industry-specific economic conditions that may affect our research and development expenditures; and
|
|
•
|
period-to-period fluctuations in our financial results.
|
Moreover, the stock markets in general have experienced substantial volatility that has often been unrelated to the operating performance of individual companies. These broad market fluctuations may also adversely affect the trading price of our common stock.
In the past, following periods of volatility in the market price of a company’s securities, stockholders have often instituted class action securities litigation against those companies. In addition, we may become involved in securities class action litigation or shareholder litigation in connection with the Share Exchange. Such litigation, if instituted, could result in substantial costs and diversion of management attention and resources, which could significantly harm our profitability and reputation. Our insurance coverage may not be sufficient to cover all costs and damages.
If securities analysts do not publish research or reports about our business, or if they publish negative evaluations or recommendations, our share price could decline.
The trading market for our common stock may be impacted by the availability or lack of research and reports that third-party industry or financial analysts publish about us. There are many large, publicly-traded companies active in the energy and power generation and distribution industry, which may mean it will be less likely that we receive widespread analyst coverage. Furthermore, if one or more of the analysts who do cover us downgrade our stock, our stock price would likely decline. If we do not receive
27
adequate coverage by reputable analysts that have an understanding of our business and industry, we could fail to achieve visibility in the market, which in turn could cause our stock price to decline.
We are a “smaller reporting company” and, as a result of the reduced disclosure and governance requirements applicable to smaller reporting companies, our common stock may be less attractive to investors.
We are a “smaller reporting company,” within the meaning of the Exchange Act. As a “smaller reporting company,” we are subject to lesser disclosure obligations in our SEC filings compared to other issuers. Specifically, “smaller reporting companies” are able to provide simplified executive compensation disclosures in their filings, are exempt from the provisions of Section 404(b) of the Sarbanes-Oxley Act requiring that independent registered public accounting firms provide an attestation report on the effectiveness of internal control over financial reporting, and have certain other decreased disclosure obligations in their SEC filings, including, among other things, only being required to provide two years of audited financial statements in annual reports. Decreased disclosures in our SEC filings due to our status a “smaller reporting company” may make it harder for investors to analyze our operating results and financial prospects and make our common stock less attractive to investors.
As a result of the Share Exchange, Casey Crenshaw has voting control over our company.
As of
December 31, 2019
, Casey Crenshaw has beneficial ownership of 77.1% of the outstanding shares of our common stock. As a result, Mr. Crenshaw may control all matters that require stockholder approval, as well as its management and affairs. For example, Mr. Crenshaw may unilaterally approve the election of directors and any merger, consolidation or sale of all or substantially all of our assets. This concentration of ownership control may:
|
•
|
delay, defer or prevent a change in control;
|
|
•
|
entrench its management and the board of directors; or
|
|
•
|
impede a merger, consolidation, takeover or other business combination involving the company that other stockholders may desire.
|
The failure to integrate successfully the businesses of Stabilis Energy, LLC and American Electric in the expected timeframe could adversely affect our future results.
Following the Share Exchange, the continued operation of our business is, and will continue to be, complex. Our success will depend, in part, on our ability to realize the anticipated benefits from combining the businesses of American Electric and Stabilis Energy, LLC and its subsidiaries.
The failure to integrate successfully and to manage successfully the challenges presented by the integration process may result in our failure to achieve some or all of the anticipated benefits of the Share Exchange.
Potential difficulties that may be encountered in the integration process include the following:
|
•
|
using our Company’s cash and other assets efficiently to develop our business;
|
|
•
|
appropriately managing our liabilities;
|
|
•
|
potential unknown or currently unquantifiable liabilities associated with the Share Exchange and our operations; and
|
|
•
|
performance shortfalls as a result of the diversion of management’s attention caused by focusing on the integration of operations following the Share Exchange.
|
We will continue to incur costs and demands upon management as a result of complying with the laws and regulations affecting public companies.
We incur and will continue to incur significant legal, accounting and other expenses that Stabilis Energy, LLC and its subsidiaries did not incur as private companies, including costs associated with public company reporting requirements. We also incur costs associated with corporate governance requirements, including requirements under the Sarbanes-Oxley Act and rules and regulations promulgated by the SEC. These rules and regulations increase our legal and financial compliance costs and make some activities more time-consuming and costly. These rules and regulations may also make it difficult and expensive for us to obtain directors’ and officers’ liability insurance. As a result, it may be more difficult to attract and retain qualified individuals to serve on our board of directors (the “Board” or “Board of Directors”) or as executive officers, which may adversely affect investor confidence in us and could cause our business or stock price to suffer.
If we fail to establish and maintain proper and effective internal control over financial reporting, our operating results and our ability to operate its business could be harmed.
28
Ensuring that we have adequate internal financial and accounting controls and procedures in place so that we can produce accurate financial statements on a timely basis is a costly and time-consuming effort that needs to be re-evaluated frequently. Internal control over financial reporting is a process designed to provide reasonable assurance regarding the reliability of financial reporting and the preparation of financial statements in accordance with U.S. GAAP.
In addition, we are required to be compliant with public company internal control requirements mandated under Section 302 and 906 of the Sarbanes-Oxley Act. We are implementing measures designed to improve our internal controls over financial reporting, including the hiring of accounting personnel and establishing new accounting and financial reporting procedures to establish an appropriate level of internal controls over financial reporting. However, we cannot provide assurances that we will be successful in doing so. If we are unable to successfully implement internal controls over financial reporting, the accuracy and timing of our financial reporting, and our stock price, may be adversely affected and we may be unable to maintain compliance with the applicable stock exchange listing requirements.
Implementing any appropriate changes to our internal controls may distract our officers and employees, entail substantial costs to modify existing processes and take significant time to complete. These changes may not, however, be effective in maintaining the adequacy of our internal controls, and any failure to maintain that adequacy, or consequent inability to produce accurate financial statements on a timely basis, could increase operating costs and harm the business. In addition, investors’ perceptions that our internal controls are inadequate or that we are unable to produce accurate financial statements on a timely basis may harm our stock price.
In addition to Mr. Crenshaw’s ability to control all matters that require stockholder approval, provisions in our corporate charter documents and under Florida law could make an acquisition of the Company, which may be beneficial to its stockholders, more difficult and may prevent attempts by our stockholders to replace or remove our current management.
Provisions in our corporate charter and bylaws may discourage, delay or prevent a merger, acquisition or other change in control of our company that stockholders may consider favorable, including transactions in which our stockholders might otherwise receive a premium for their shares. These provisions could also limit the price that investors might be willing to pay in the future for shares of our common stock, thereby depressing the market price of our common stock. In addition, because the Board of Directors is responsible for appointing the members of our management team, these provisions may frustrate or prevent any attempts by stockholders to replace or remove the current management by making it more difficult for stockholders to replace members of the Board of Directors. Among other things, these provisions:
|
•
|
allow the authorized number of our directors to be fixed only by resolution of our Board of Directors;
|
|
•
|
establish advance notice requirements for stockholder proposals that can be acted on at stockholder meetings and nominations to our Board of Directors;
|
|
•
|
require that stockholder actions must be effected at a duly called stockholder meeting or by our stockholders by written consent of the holders of over 50% of the votes that all our stockholders would be entitled to cast;
|
|
•
|
authorize our Board of Directors to issue preferred stock without stockholder approval, which could be used to institute a shareholder rights plan, or so-called “poison pill,” that would work to dilute the stock ownership of a potential hostile acquirer, effectively preventing acquisitions that have not been approved by our Board of Directors;
|
|
•
|
require the proposal of our Board of Directors and the approval of the holders of over 50% of the votes that all our stockholders would be entitled to cast to amend our charter; and
|
|
•
|
require the approval of the holders of over 50% of the votes that all our stockholders would be entitled to cast to amend our bylaws.
|
Moreover, because we are incorporated in Florida, we are governed by the provisions of Section 607.0901 and 607.0102 of the Florida Business Corporation Act.
In general, Section 607.0901 regulates certain transactions between a corporation and an “interested shareholder,” one who beneficially owns more than ten percent of the corporation’s outstanding voting shares. The statute provides significant protection to minority shareholders by assuring that the transactions covered by the statute are either (a) procedurally fair (i.e., the transaction is approved by disinterested directors or disinterested shareholders) or (b) substantively fair (i.e., result in a fair price to the shareholders).
In general, Section 607.0902 focuses on the acquisition of “control shares” in an issuing public corporation. When control shares are acquired in a “control share acquisition,” the shares do not have voting rights. Voting rights may be restored only if the bidder files an acquiring person statement and requests a shareholder meeting to vote on whether the bidder’s shares should be accorded voting rights. Voting rights are restored only to the extent approved by the disinterested shareholders (which excludes both the bidder and management shareholders). Alternatively, the bidder’s shares will have voting rights if the acquisition is approved by
29
the target company’s board of directors. As a result, mergers or other takeover or change in control attempts of us may be discouraged or prevented.
We do not anticipate that we will pay any cash dividends in the foreseeable future.
The current expectation is that for the foreseeable future, we will retain our future earnings to fund the development and growth of our business. Any payment of future dividends will be at the discretion of our board of directors and will depend on, among other things, our earnings, financial condition, capital requirements, level of indebtedness, statutory and contractual restrictions applying to the payment of dividends and other considerations that the board of directors deems relevant. As a result, capital appreciation, if any, of our common stock will be the sole source of gain, if any, for any stockholders for the foreseeable future.
Our present and future success depends on key members of our management team and certain employees and our ability to retain such key members, the loss of any of whom could disrupt our business operations.
We are highly dependent on principal members of our management team and certain of our other employees. The loss of the services of any member of our management team could disrupt our operations, adversely impact the achievement of our objections and increase our exposure to the other risks described in this “Risk Factors” section. We have not entered into employment agreements with Mr. Reddinger, Mr. Puhala and other principal members of our management team, and any of them could leave our employment at any time.
Our success will also depend on pre-existing relationships with third parties, which relationships may be affected by the Share Exchange. Any adverse changes in these relationships could adversely affect our business, financial condition or results of operations.
Our success will be dependent on the ability to maintain and renew relationships with pre-existing third-party relationships. There can be no assurance that we will be able to maintain pre-existing business relationships, or enter into or maintain new business relationships, on acceptable terms, if at all. The failure to maintain important pre-existing third-party relationships could have a material adverse effect on our business, financial condition or results of operations.
ITEM 1B. UNRESOLVED STAFF COMMENTS
None.
ITEM 2. PROPERTIES
The corporate headquarters of Stabilis are located at 10375 Richmond Avenue, Suite 700, Houston, TX 77042. Stabilis leases its general office space at its corporate headquarters. The lease expires in January 31, 2025. Stabilis or its subsidiaries currently own or lease the following additional principal properties:
|
Facility Location
|
Use
|
Size
|
Leased or Owned
|
Expiration of Lease
|
|
Houston, TX
|
Office
|
8,583 sq. ft.
|
Leased
|
January 31, 2025
|
|
Denver, CO
|
Office
|
2,122 sq. ft.
|
Leased
|
February 28, 2021
|
|
George West, TX
|
LNG Plant
|
3,400 sq. ft. on 31.04 acres
|
Owned
|
N/A
|
|
Bellevue, WA
|
Office
|
1,610 sq. ft.
|
Leased
|
June 30, 2022
|
|
Hudson, CO
|
Storage Site
|
On 2 acres
|
Leased
|
May 31, 2020
|
|
Macaé, Brazil
|
Offices and shop services
|
24,756 sq. ft.
|
Leased
|
January 14, 2022
|
|
Rio de Janeiro, Brazil
|
Offices and shop services
|
6,460 sq. ft.
|
Leased
|
July 31, 2020
|
|
Belo Horizonte, Brazil
|
Offices
|
2,152 sq. ft.
|
Leased
|
March 20, 2021
|
We believe that our existing facilities are adequate for our operations and their locations allow us to efficiently serve our customers.
ITEM 3. LEGAL PROCEEDINGS
The Company becomes involved in various legal proceedings and claims in the normal course of business. In management’s opinion, the ultimate resolution of these matters will not have a material effect on our financial position or results of operations.
30
See Note 13—Commitments and Contingencies for a discussion of outstanding legal matters.
ITEM 4. MINE SAFETY DISCLOSURES
None.
PART II
ITEM 5. MARKET FOR REGISRANT'S COMMON EQUITY, RELATED STOCKHOLDER MATTERS AND ISSUER
PURCHASES OF EQUITY SECURITIES.
Market Information
Our common stock traded under the symbol “SLNG” on the Nasdaq Stock Market from July 29, 2019 to October 2, 2019. On October 3, 2019 the Company’s common shares commenced trading on the OTCQX Best Market under the symbol “SLNG.” Prior to the Share Exchange, it traded under the symbol “AETI.”
The Company did not declare or pay cash dividends on common shares in either fiscal year
2019
or
2018
. The Company anticipates that, for the foreseeable future, it will retain any earnings for use in the operations of its business.
Holders
As of February 29, 2020, we had 23 holders of record of our common stock and
16,835,318
shares of common stock outstanding, based on information provided by our transfer agent. We also have outstanding Warrants to purchase
103,125
shares of our Common Stock.
Equity Compensation Plan
The information relating to the Company's equity compensation plans required by Item 5 is included in Item 12. Security Ownership of Certain Beneficial Owners and Management and Related Stockholder Matters contained herein.
ITEM 7. MANAGEMENT’S DISCUSSION AND ANALYSIS OF FINANCIAL CONDITION AND RESULTS OF OPERATIONS
The following discussion should be read in conjunction with the consolidated financial statements and notes thereto included in Item 8. Financial Statements and Supplementary Data of this Form 10-K. Historical results and percentage relationships set forth in the consolidated statements of operations and cash flows, including trends that might appear, are not necessarily indicative of future operations or cash flows.
OVERVIEW
Stabilis is a vertically integrated provider of small-scale LNG production, distribution and fueling services to multiple end markets in North America. Our diverse customer base utilizes LNG as a fuel source in a variety of applications in the industrial, energy, mining, utilities and pipelines, commercial, and high horsepower transportation markets. Our customers use LNG as an alternative to traditional fuel sources, such as diesel, fuel oil, and propane, and as a means to lower fuel costs and reduce their environmental footprint. Our customers also use LNG as a “virtual pipeline” solution when natural gas pipelines are not available or are curtailed.
Stabilis seeks to provide our customers with safe, reliable and cost effective LNG fueling and power delivery solutions. We provide multiple products and services to our customers, including:
LNG Production and Sales
—Stabilis builds and operates cryogenic natural gas processing facilities, called “liquefiers”, that convert natural gas into LNG through a multiple stage cooling process. We currently own and operate a liquefier that can produce up to 100,000 LNG gallons (379 cubic meters) per day. We also purchase LNG from third-party production sources which allows us to support customers in markets where we do not own liquefiers. We define “small-scale” LNG production to include liquefiers that produce less than 1,000,000 LNG gallons per day (3,788 cubic meters per day).
31
Transportation and Logistics Services
—Stabilis offers our customers a “virtual natural gas pipeline” by providing them with turnkey LNG transportation and logistics services in North America. We deliver LNG to our customers’ work sites from both our own production facility and our network of 25 third-party production sources located throughout North America. We own a fleet of LNG fueled trucks and cryogenic trailers to transport and deliver LNG. We also outsource similar equipment and transportation services from qualified third-party providers as required to support our customer base. We define “small-scale” LNG distribution to include distribution by trailer or tank container (up to 15,000 LNG gallons) or marine vessels that carry less than 8,000,000 LNG gallons (approximately 30,000 cubic meters).
Cryogenic Equipment Rental
—Stabilis owns and operates a rental fleet of approximately 150 mobile LNG storage and vaporization assets, including: transportation trailers, electric and gas-fired vaporizers, ambient vaporizers, storage tanks, and mobile vehicle fuelers. We also own several stationary storage and regasification assets. We believe this is one of the largest fleets of small-scale LNG equipment in North America. Our fleet consists primarily of trailer-mounted mobile assets, making delivery to and between customer locations more efficient. We deploy these assets on job sites to provide our customers with the equipment required to transport, store, and consume LNG in their fueling operations.
Engineering and Field Support Services
—Stabilis has experience in the safe, cost effective, and reliable use of LNG in multiple customer applications. We have also developed many processes and procedures that we believe improve our customers’ use of LNG in their operations. Our engineers help our customers design and integrate LNG into their fueling operations and our field service technicians help our customers mobilize, commission and reliably operate on the job site.
Stabilis generates revenue by selling and delivering LNG to our customers. We also generate revenue by renting cryogenic equipment and providing engineering and field support services. We sell each product and service separately or as a bundle depending on the customer’s needs. LNG pricing depends on market pricing for natural gas and competing fuel sources (such as diesel, fuel oil, and propane among others), as well as the customer’s purchased volume, contract duration and credit profile.
Stabilis’ customers use natural gas in their operations for multiple reasons, including lower fuel cost, more stable fuel costs, reduced environmental emissions, and improved operating performance. We serve customers in a variety of end markets, including industrial, energy, mining, commercial, utilities and pipelines, and high horsepower transportation. We believe that LNG consumption will continue to increase in these end markets in the future.
Power Delivery Solutions
—As a result of the business combination with American Electric, Stabilis provides power delivery services and products for the oil and gas, marine vessel, power generation and broad industrial market segments in Brazil, and builds electrical systems for sale in China through our
40%
interest in BOMAY.
Key Operating Data
In evaluating our operating performance, our management focuses primarily on gallons delivered and plant utilization.
Stabilis supplies our customers with LNG produced at our own liquefaction facility as well as LNG produced at third-party facilities. We make the determination of LNG supply sources based on the cost of LNG, the transportation cost to deliver to regional customer locations, and the reliability of the supply source. The following table summarizes the volume of LNG gallons delivered to our customers.
|
Gallons Delivered
|
|||||
|
(unaudited in thousands)
|
|||||
|
December 31,
|
|||||
|
2019
|
2018
|
||||
|
George West
|
25,418
|
|
17,855
|
|
|
|
3rd Party
|
17,115
|
|
18,464
|
|
|
|
Total Gallons Delivered
|
42,533
|
|
36,319
|
|
|
Utilization is an important measure used by management to assess operational output at our George West plant. Utilization is calculated as actual gallons produced divided by capacity. For the year ended
December 31, 2019
, utilization was 69.6%, compared to 48.9% for the year ended
December 31, 2018
. The increase was primarily the result of expansion of our customer base in sand drying applications and increased demand from existing customers in Mexico.
32
2019 and 2018 Developments
On July 26, 2019, the Share Exchange transaction with American Electric and its subsidiaries was completed. The Share Exchange and its related proposals, which included a company name change and a reverse stock split, were approved by American Electric stockholders at a Special Meeting of Stockholders on July 17, 2019. On July 29, 2019, the company began operating under the name Stabilis Energy, Inc. and our common stock began trading under the ticker symbol “SLNG”. Because the former owners of Stabilis LLC owned approximately
90%
of the voting stock of the combined company at the completion of the Share Exchange and certain other factors including that directors designated by LNG Investment constitute a majority of the board of directors, Stabilis LLC is treated as the acquiror of American Electric in the Share Exchange for accounting purposes. As a result, the Share Exchange is treated by American Electric as a reverse acquisition under the purchase method of accounting in accordance with United States generally accepted accounting principles (“US GAAP”). In addition, the company’s shares outstanding now reflect a one-for-eight reverse split. Unless otherwise noted, any share or per share amounts give retroactive effect to the reverse stock split.
For further information regarding this transaction, see Note 2—Acquisitions of Notes to Consolidated Financial Statements.
The financial information represents the historical results of Stabilis for periods prior to the Share Exchange. The operations of American Electric are included in our financial statements from the completion of the Share Exchange on July 26, 2019. For further information regarding this transaction, see Note 2—Acquisitions of Notes to Consolidated Financial Statements.
On August 5, 2019, we entered into an exchange agreement (the “Exchange Agreement”) with Chart Energy & Chemicals, Inc. (“Chart E&C”), Stabilis LLC, and Stabilis LNG EF for the satisfaction of indebtedness of Stabilis LNG to Chart E&C in the principal amount of
$7 million
(the “Exchanged Indebtedness”) in exchange for unregistered shares of our common stock (such transactions, the “Chart Transaction”). We issued to Chart E&C
1,470,807
shares of Company common stock, based on the per share price of Company common stock of
90%
of the average of the dollar volume-weighted average prices per share of the common stock as calculated by Bloomberg for each of the
five
consecutive trading days ending on and including the third trading day immediately preceding the closing date, which took place on August 30, 2019. At closing, Stabilis LNG EF also paid to Chart E&C an amount in cash equal to the accrued and unpaid interest on the Exchanged Indebtedness due through the closing, plus a cash amount to be paid in lieu of the issuance of fractional shares of our Common Stock. Management determined the modifications to be substantial and pursuant to ASC 470, the transaction was treated as a debt extinguishment for accounting purposes. Accordingly, the Company recognized a gain on extinguishment of debt of
$0.1 million
, which is included in Other Income in the accompanying Consolidated Statement of Operations.
On September 11, 2019, we entered into Amendment No. 1 to the Exchange Agreement, which eliminated the right of Chart E&C to elect an additional exchange of all or any portion of the balance of the unpaid principal amount of the Note. The Exchange Agreement previously provided for Chart E&C to elect an additional exchange, on a second closing date, of all or any portion of the balance of the unpaid principal amount of the Note, for additional shares of our common stock based on the foregoing pricing calculation related to the closing date. For further information regarding this transaction, see Note 10—Debt of Notes to Consolidated Financial Statements.
On August 20, 2019, we completed our acquisition of Diversenergy, LLC (“Diversenergy”) and its subsidiaries, creating what we believe will be one of the leading LNG marketing and distribution companies in Mexico. Diversenergy specializes in virtual LNG distribution systems, providing LNG to customers who use it as a fuel in mobile high horsepower applications and to customers who do not have natural gas pipeline access. We purchased all of the issued and outstanding membership interests of Diversenergy for total consideration of
684,963
shares of Company common stock and
$2 million
in cash. The completion of the acquisition will expand the Company's presence in the distributed LNG and compressed natural gas (“CNG”) markets in Mexico. For further information regarding this transaction, see Note 2—Acquisitions of Notes to Consolidated Financial Statements.
On August 20, 2019, we established Energía Superior Gas Natural LLC (“Energía Superior”) as a joint venture with CryoMex Investment Group LLC (“CryoMex”), to pursue investments in distributed natural gas production and distribution assets in Mexico (the “Joint Venture”). CryoMex is led by Grupo CLISA, a Monterrey, Mexico-based developer and operator of businesses in multiple end markets including energy.
The Joint Venture plans to invest in LNG and compressed natural gas production, transportation, storage, and regasification assets that serve multiple end markets throughout Mexico, including the industrial, mining, pipeline, utility, marine, and over-the-road transportation markets.
33
RESULTS OF OPERATIONS
The following table reflects line items from the accompanying Consolidated Statements of Operations for the year ended
December 31, 2019
(the “Current Year”) as compared to the year ended
December 31, 2018
(the “Prior Year”):
Stabilis Energy, Inc.
Consolidated Statements of Operations
|
Years Ended December 31,
|
Change
|
% Change
|
||||||||||||
|
2019
|
2018
|
|||||||||||||
|
(In thousands, excluding percentages)
|
||||||||||||||
|
Revenue:
|
||||||||||||||
|
LNG product
|
$
|
34,244
|
|
$
|
30,200
|
|
$
|
4,044
|
|
13.4
|
%
|
|||
|
Rental, service and other
|
12,827
|
|
7,142
|
|
5,685
|
|
79.6
|
|
||||||
|
Total revenues
|
47,071
|
|
37,342
|
|
9,729
|
|
26.1
|
|
||||||
|
Operating expenses:
|
||||||||||||||
|
Costs of LNG product
|
23,489
|
|
23,804
|
|
(315
|
)
|
(1.3
|
)
|
||||||
|
Costs of rental, service and other
|
8,437
|
|
4,648
|
|
3,789
|
|
81.5
|
|
||||||
|
Selling, general and administrative
|
11,304
|
|
7,350
|
|
3,954
|
|
53.8
|
|
||||||
|
Depreciation
|
9,271
|
|
8,822
|
|
449
|
|
5.1
|
|
||||||
|
Total operating expenses
|
52,501
|
|
44,624
|
|
7,877
|
|
17.7
|
|
||||||
|
Loss from operations before equity income
|
(5,430
|
)
|
(7,282
|
)
|
1,852
|
|
(25.4
|
)
|
||||||
|
Net equity income from foreign joint ventures' operations:
|
||||||||||||||
|
Income from investments in foreign joint ventures
|
1,257
|
|
—
|
|
1,257
|
|
100.0
|
|
||||||
|
Foreign joint venture's operations related expenses
|
(124
|
)
|
—
|
|
(124
|
)
|
100.0
|
|
||||||
|
Net equity income from foreign joint ventures' operations
|
1,133
|
|
—
|
|
1,133
|
|
100.0
|
|
||||||
|
Loss from operations
|
(4,297
|
)
|
(7,282
|
)
|
2,985
|
|
(41.0
|
)
|
||||||
|
Other income (expense):
|
||||||||||||||
|
Interest expense, net
|
(33
|
)
|
(122
|
)
|
89
|
|
(73.0
|
)
|
||||||
|
Interest expense, net - related parties
|
(1,175
|
)
|
(4,299
|
)
|
3,124
|
|
(72.7
|
)
|
||||||
|
Other income
|
97
|
|
298
|
|
(201
|
)
|
(67.4
|
)
|
||||||
|
Gain (loss) from disposal of assets
|
16
|
|
319
|
|
(303
|
)
|
(95.0
|
)
|
||||||
|
Total other income (expense)
|
(1,095
|
)
|
(3,804
|
)
|
2,709
|
|
(71.2
|
)
|
||||||
|
Loss before income tax expense
|
(5,392
|
)
|
(11,086
|
)
|
5,694
|
|
(51.4
|
)
|
||||||
|
Income tax expense
|
116
|
|
—
|
|
116
|
|
100.0
|
|
||||||
|
Net loss
|
(5,508
|
)
|
(11,086
|
)
|
5,578
|
|
(50.3
|
)
|
||||||
|
Net income (loss) attributable to noncontrolling interests
|
207
|
|
(42
|
)
|
249
|
|
(592.9
|
)
|
||||||
|
Net loss attributable to controlling interests
|
$
|
(5,715
|
)
|
$
|
(11,044
|
)
|
$
|
5,329
|
|
(48.3
|
)%
|
|||
34
Segment Results
The Company’s revenues are derived from two operating segments: LNG and Power Delivery. The Company evaluates the performance of its segments based primarily on segment operating income.
LNG Segment
Our LNG segment supplies LNG to the industrial, midstream, and oilfield sectors in North America and provides turnkey fuel solutions to help users of propane, diesel and other crude-based fuel products convert to LNG.
|
Years Ended December 31,
|
Change
|
% Change
|
||||||||||||
|
2019
|
2018
|
|||||||||||||
|
(In thousands, excluding percentages)
|
||||||||||||||
|
Revenue:
|
||||||||||||||
|
LNG product
|
$
|
34,244
|
|
$
|
30,200
|
|
$
|
4,044
|
|
13.4
|
%
|
|||
|
Rental, service and other
|
9,406
|
|
7,142
|
|
2,264
|
|
31.7
|
|
||||||
|
Total revenues
|
43,650
|
|
37,342
|
|
6,308
|
|
16.9
|
|
||||||
|
Operating expenses:
|
||||||||||||||
|
Costs of LNG product
|
23,489
|
|
23,804
|
|
(315
|
)
|
(1.3
|
)
|
||||||
|
Costs of rental, service and other
|
5,788
|
|
4,648
|
|
1,140
|
|
24.5
|
|
||||||
|
Selling, general and administrative
|
10,262
|
|
7,350
|
|
2,912
|
|
39.6
|
|
||||||
|
Depreciation
|
9,127
|
|
8,822
|
|
305
|
|
3.5
|
|
||||||
|
Total operating expenses
|
48,666
|
|
44,624
|
|
4,042
|
|
9.1
|
|
||||||
|
Loss from operations before equity income
|
$
|
(5,016
|
)
|
$
|
(7,282
|
)
|
$
|
2,266
|
|
(31.1
|
)%
|
|||
Power Delivery Segment
Our Power Delivery segment provides power delivery solutions to the global energy industry through our subsidiary in Brazil and our joint venture in China.
|
Years Ended December 31,
|
Change
|
% Change
|
||||||||||||
|
2019
|
2018
|
|||||||||||||
|
(In thousands, excluding percentages)
|
||||||||||||||
|
Revenue:
|
||||||||||||||
|
Rental, service and other
|
$
|
3,421
|
|
$
|
—
|
|
$
|
3,421
|
|
100.0
|
%
|
|||
|
Total revenues
|
3,421
|
|
—
|
|
3,421
|
|
100.0
|
|
||||||
|
Operating expenses:
|
||||||||||||||
|
Costs of rental, service and other
|
2,649
|
|
—
|
|
2,649
|
|
100.0
|
|
||||||
|
Selling, general and administrative
|
1,042
|
|
—
|
|
1,042
|
|
100.0
|
|
||||||
|
Depreciation
|
144
|
|
—
|
|
144
|
|
100.0
|
|
||||||
|
Total operating expenses
|
3,835
|
|
—
|
|
3,835
|
|
100.0
|
|
||||||
|
Loss from operations before equity income
|
(414
|
)
|
—
|
|
(414
|
)
|
100.0
|
|
||||||
|
Net equity income from foreign joint ventures' operations:
|
||||||||||||||
|
Income from equity investments in foreign joint ventures
|
1,257
|
|
—
|
|
1,257
|
|
100.0
|
|
||||||
|
Foreign joint venture's operations related expenses
|
(124
|
)
|
—
|
|
(124
|
)
|
100.0
|
|
||||||
|
Net equity income from foreign joint ventures' operations
|
1,133
|
|
—
|
|
1,133
|
|
100.0
|
|
||||||
|
Loss from operations
|
719
|
|
—
|
|
719
|
|
100.0
|
|
||||||
2019
Compared to
2018
35
Revenue
LNG Product Revenue.
During the Current Year LNG Product revenues
increase
d
$4.0 million
or
13.4%
versus the Prior Year primarily attributable to growth in LNG plant product sales of $5.4 million. Key factors behind this growth were expansion of our customer base in sand drying applications and increased demand from existing customers in Mexico. LNG product revenue from distribution sales decreased $1.2 million related to decreased sales to oilfield customers.
Rental, Service, and Other Revenue.
Rental, service and other revenues
increase
d by
$5.7 million
or
79.6%
in the Current Year compared to Prior Year primarily due to the completion of the Share Exchange transaction with American Electric. Revenue related to the acquired business of $3.4 million is included in our results of operations following the completion of the Share Exchange on July 26, 2019. Equipment rental in oilfield, pipeline and winter peaking projects accounted for an increase in revenues of $2.3 million.
Operating Expenses
Costs of LNG Product.
Cost of product in the Current Year
decrease
d
$0.3 million
or
1.3%
compared to Prior Year. As a percentage of LNG product revenue, overall cost of product
decrease
d from
79%
to
69%
primarily due to higher utilization of our liquefaction facility and a reduction in gas prices.
Costs of Rental, Service, and Other Revenue.
This cost
increase
d
$3.8 million
or
81.5%
in the Current Year consistent with the increase in rental, service, and other revenue. The
increase
in costs is primarily a result of the completion of the Share Exchange with American Electric. Costs related to the acquired business of $2.6 million are included in our results of operations following the completion of the Share Exchange on July 26, 2019. Costs related to the LNG business increased by $1.2 million, consistent with the increase in rental, service, and other revenue.
Selling, general and administrative
. Selling, general and administrative expense
increase
d
$4.0 million
or
53.8%
during the Current Year as compared to the Prior Year. This increase was primarily driven by audit, legal and consulting fees of $1.6 million associated with the business combination with American Electric. Expenses related to the acquired business of $1.0 million are included in our results of operations following the completion of the Share Exchange on July 26, 2019. Expenses related to the acquisition of Diverse of $0.2 million are included in our results of operations. Business development fees and increased costs of the consolidated business accounted for $1.2 million of the increase.
Depreciation
. Depreciation expense
increase
d
$0.4 million
or
5.1%
during the Current Year as compared to the Prior Year due to the upgrade of mobile equipment and depreciation costs related to the acquired businesses.
Net Equity Income From Foreign Joint Ventures' Operations
Income from Investments in Foreign Joint Ventures.
As a result of the completion of the Share Exchange transaction with American Electric, income from Investments in Foreign Joint Ventures
increase
d
$1.3 million
. Equity income of the acquired joint venture, BOMAY, is included in our results of operations following the completion of the Share Exchange on July 26, 2019.
Operating expenses related to foreign joint ventures.
Operating expenses related to BOMAY were
$0.1 million
for the period following the completion of the Share Exchange on July 26, 2019.
Other Income (Expense)
Interest expense, net.
Interest expense
decrease
d
$0.1 million
during the Current Year as compared to the Prior Year.
Interest expense, net - related parties.
Interest expense
decrease
d
$3.1 million
during the Current Year as compared to the Prior Year. This decrease was primarily attributable to debt being converted to equity in November of 2018 and a $2.4 million debt repayment.
Other income.
Other income
decrease
d
$0.2 million
in the Current Year primarily due to Alternative Fuel excise tax credits received in the Prior Year.
36
Gain / (loss) on the disposal of fixed assets
. The gain from disposal of fixed assets
decrease
d
$0.3 million
due to a Prior Year sale of equipment.
Income tax expense
. The Company incurred state and foreign income tax expense of
$0.1 million
during the Current Year. No income tax expense was incurred in the Prior Year.
SEASONALITY AND INFLATION
A portion of Stabilis’ operating revenues and profits relate to providing backup gas for the local distribution infrastructure in the United States and Mexico to support utilities during times of peak heating demand from November through March. Revenues are generally lower from April to October during the months when heating demand is seasonally lower.
Historically, inflation has not significantly affected our operating results; however, costs for construction, repairs, maintenance, electricity and insurance are all subject to inflationary pressures, which could affect our ability to maintain our facilities adequately, build new facilities, expand our existing facilities or pursue additional facilities, and could materially increase our operating costs.
LIQUIDITY AND CAPITAL RESOURCES
Overview
As of
December 31, 2019
, we had
$4.0 million
in cash and cash equivalents on hand and
$11.7 million
in outstanding debt and finance lease obligations (of which
$5.0 million
is due in the next twelve months).
We have historically funded the business primarily through cash flows from operations, short-term notes payable, debt from finance companies and related parties, and capital contributions. We have used a portion of our cash flows to invest in fixed assets to support growth. We have also used cash to pay interest and principal amounts outstanding under our borrowings.
The Company is subject to substantial business risks and uncertainties inherent in the LNG industry. There is no assurance that the Company will be able to generate sufficient cash flows in the future to sustain itself or to support future growth.
Management concluded positive cash flows from operations are attainable primarily due to the following: (i) recent increases in sales volumes in both 2018 and 2019 and (ii) the August 2019 cancellation of $7.0 million of Chart Industries indebtedness in exchange for Stabilis common stock.
Improved cash flow projections are supported by the recent increase in sales, and the reduction of operating costs as a percent of sales. Accordingly, management believes the business will generate sufficient cash flows from its operations to fund the business for the next 12 months.
Cash Flows
Cash flows provided by (used in) our operating, investing and financing activities are summarized below (in thousands):
|
Years Ended December 31,
|
|||||||
|
2019
|
2018
|
||||||
|
(In thousands)
|
|||||||
|
Net cash provided by (used in):
|
|||||||
|
Operating activities
|
$
|
4,111
|
|
$
|
(425
|
)
|
|
|
Investing activities
|
(3,243
|
)
|
69
|
|
|||
|
Financing activities
|
1,940
|
|
114
|
|
|||
|
Effect of exchange rate changes on cash
|
(76
|
)
|
—
|
|
|||
|
Net increase (decrease) in cash and cash equivalents
|
2,732
|
|
(242
|
)
|
|||
|
Cash and cash equivalents, beginning of period
|
1,247
|
|
1,489
|
|
|||
|
Cash and cash equivalents, end of period
|
$
|
3,979
|
|
$
|
1,247
|
|
|
Operating Activities
37
Net cash
provided by
operating activities totaled
$4.1 million
for the
twelve months ended December 31, 2019
compared to
$0.4 million
used in operating activities for the same period
2018
. The
increase
in net cash
provided by
operating activities of
$4.5 million
as compared to the Prior Year was primarily attributable to reduced operating losses and net working capital.
Investing Activities
Net cash
used in
investing activities totaled
$3.2 million
and
$69 thousand
for the
twelve months ended December 31, 2019
and
2018
, respectively. The change was driven by the acquisitions of American Electric and Diversenergy. The Company also purchased $2.1 million of equipment during the
twelve months ended December 31, 2019
, partially offset by proceeds from sales of equipment of $0.1 million.
Financing Activities
Net cash
provided by
financing activities totaled
$1.9 million
and
$0.1 million
for the
twelve months ended December 31, 2019
and
2018
, respectively. The
increase
of
$1.8 million
compared to the Prior Year was primarily attributable to:
|
•
|
a $0.1 million net increase in proceeds from short-term notes payable, and
|
|
•
|
an increase in net proceeds of $1.8 million from related party long-term borrowings in 2019.
|
Sources of Liquidity and Capital Resources
Our principal sources of liquidity have consisted of cash on hand, cash provided by our operations, and proceeds from asset sales. In addition, the Company secured financing from a key vendor and obtained equipment financing from MG Finance, a related party.
Future Cash Requirements
Uses of Liquidity and Capital Resources
We require cash to fund our operating expenses and working capital requirements, including costs associated with fuel sales, capital expenditures, debt repayments and repurchases, equipment purchases, maintenance of LNG production facilities, mergers and acquisitions (if any), pursuing market expansion, supporting sales and marketing activities, support of legislative and regulatory initiatives, and other general corporate purposes. While we believe we have sufficient liquidity and capital resources to fund our operations and repay our debt, we may elect to pursue additional financing activities such as refinancing existing debt, or debt or equity offerings to provide flexibility with our cash management.
Capital Expenditures
Our business plan calls for approximately $3 million to $4 million in capital expenditures in 2020. These capital expenditures primarily relate to expansion plans in Mexico.
Debt Level and Debt Compliance
We had total indebtedness of
$7.6 million
in principal as of
December 31, 2019
with the expected maturities as follows.
|
December 31, 2019
|
|||
|
2020
|
$
|
1,558
|
|
|
2021
|
3,428
|
|
|
|
2022
|
2,649
|
|
|
|
2023
|
—
|
|
|
|
2024
|
—
|
|
|
|
Thereafter
|
—
|
|
|
|
Total long-term debt, including current maturities
|
$
|
7,635
|
|
We expect our total interest payment obligations relating to our indebtedness to be approximately $0.9 million for the year ending
December 31,
2020
. Certain of the agreements governing our outstanding debt, which are discussed in Note 10—Debt to our Consolidated Financial
38
Statements, have certain non-financial covenants with which we must comply. As of
December 31, 2019
, we were in compliance with all of these covenants.
CONTRACTUAL OBLIGATIONS
We are committed to make cash payments in the future pursuant to certain of our contracts. The following table summarizes certain contractual obligations in place as of
December 31, 2019
:
|
Payments Due By Period
|
|||||||||||||||||||||||||||
|
Total
|
2020
|
2021
|
2022
|
2023
|
2024
|
Thereafter
|
|||||||||||||||||||||
|
(In thousands)
|
|||||||||||||||||||||||||||
|
Note Payable to Chart Energy & Chemicals Inc.(1)
|
$
|
2,077
|
|
$
|
1,000
|
|
$
|
1,077
|
|
$
|
—
|
|
$
|
—
|
|
$
|
—
|
|
$
|
—
|
|
||||||
|
Interest—Chart Energy & Chemicals Inc.(1)
|
170
|
|
110
|
|
60
|
|
—
|
|
—
|
|
—
|
|
—
|
|
|||||||||||||
|
Related Party Debt & Cap Leases(2)
|
9,081
|
|
3,435
|
|
2,997
|
|
2,649
|
|
—
|
|
—
|
|
—
|
|
|||||||||||||
|
Interest—Related Party Debt & Cap
Leases(2)
|
1,417
|
|
768
|
|
474
|
|
175
|
|
—
|
|
—
|
|
—
|
|
|||||||||||||
|
Operating Lease Obligations(3)
|
1,167
|
|
421
|
|
252
|
|
175
|
|
145
|
|
149
|
|
25
|
|
|||||||||||||
|
Total
|
$
|
13,912
|
|
$
|
5,734
|
|
$
|
4,860
|
|
$
|
2,999
|
|
$
|
145
|
|
$
|
149
|
|
$
|
25
|
|
||||||
___________
|
(1)
|
Debt relates to the construction of a LNG liquefaction plant in Texas. Principle and accrued interest at LIBOR + 3% are due annually.
|
|
(2)
|
Obligation to related party is equipment leased from a subsidiary of The Modern Group, Ltd.
|
|
(3)
|
Operating lease obligations primarily relate to office lease space in Colorado, Texas and Washington. Colorado lease began in 2014 and will expire in 2021, Washington lease renewed in 2018 for an additional 4 year term and Texas office lease begin in 2019 with expiration on January 31, 2025. Obligations can be found in Note 13—Commitments and Contingencies to our Notes to Consolidated Financial Statements.
|
Contingencies
In the normal course of our business, we become involved in various litigation matters. In addition, from time to time, we are involved in tax and other disputes with various government agencies. Management has used estimates in determining our potential exposure to these matters and has recorded reserves in our financial statements related thereto as appropriate. It is possible that a change in estimate related to these exposures could occur, but we do not expect such changes in the estimated costs would have a material effect on our business, consolidated financial position or results of operations.
Off-Balance Sheet Arrangements
As of
December 31, 2019
, we had no transactions that met the definition of off-balance sheet arrangements that may have a current or future material effect on our consolidated financial position or operating results.
NEW ACCOUNTING STANDARDS
See Note 1—Basis of Presentation and Summary of Significant Accounting Policies to our Notes to Consolidated Financial Statements included elsewhere in this report for information on new accounting standards.
CRITICAL ACCOUNTING POLICIES AND ESTIMATES
The discussion and analysis of our financial condition and results of operations are based on our consolidated financial statements, which have been prepared in accordance with U.S. GAAP. The preparation of these consolidated financial statements requires us to make estimates and assumptions that affect the reported amounts of assets and liabilities, disclosures of contingent assets and liabilities known to exist at the date of the consolidated financial statements and the reported amounts of revenues and expenses during the reporting period. We evaluate our estimates on an ongoing basis, based on historical experience and on various other assumptions that are believed to be reasonable under the circumstances. There can be no assurance that actual results will not differ from those estimates.
39
Critical Accounting Policies
Revenue Recognition
The Company recognizes revenue associated with the sale of LNG at the point in time when the customer obtains control of the asset. In evaluating when a customer has control of the asset, the Company primarily considers whether the transfer of legal title and physical delivery has occurred, whether the customer has significant risks and rewards of ownership, and whether the customer accepted delivery and a right of payment exists. Revenues from the providing of services, transportation and equipment to customers is recognized as the service is performed.
Revenue is measured as consideration specified in a contract with a customer and excludes any sales incentives and amounts collected on behalf of third parties. The Company recognizes revenue when it satisfies a performance obligation by transferring control over a product or service to a customer. Amounts are billed upon completion of service or transfer of a product and are generally due within 30 days.
Revenues from contracts with customers are disaggregated into (1) LNG product and (2) rental, service, and other.
LNG product revenue generated includes the revenue from the product and delivery of the LNG to our customer’s location. The Company acts as a principal when using third party transportation companies and therefore recognizes the gross revenue for the delivery of LNG. Product contracts are established by agreeing on a sales price or transaction price for the related item. Revenue is recognized when the customer has taken control of the product. Payment terms for product contracts are generally within
thirty days
from the receipt of the invoice. Product revenue is recognized upon delivery of the related item to the customer, at which point the customer controls the product and the Company has an unconditional right to payment. The Company acts as a principal when using third party transportation companies and therefore recognizes the gross revenue for the delivery of LNG.
Rental and service revenue generated by the Company includes equipment and people provided to the customer to support the use of LNG and power delivery solutions in their application. Rental contracts are established by agreeing on a rental price or transaction price for the related piece of equipment and the rental period which is generally daily or monthly. The Company maintains control of the equipment that the customer uses and can replace the rented equipment with similar equipment should the rented equipment become inoperable or the Company chooses to replace the equipment for maintenance purposes. Revenue is recognized as the rental period is completed and for periods that cross month end, revenue is recognized for the portion of the rental period that has been completed to date. Payment terms for rental contracts are generally within
thirty days
from the receipt of the invoice. Performance obligations for rental revenue are considered to be satisfied as the rental period is completed based upon the terms of the related contract. LNG service revenue generated by the Company consists of mobilization and demobilization of equipment and onsite technical support while customers are consuming LNG in their applications. Power Delivery Service revenue is generated from time and material projects and consulting services. Service revenue is billed based on contractual terms that can be based on an event (i.e. mobilization or demobilization) or an hourly rate. Revenue is recognized as the event is completed or work is done. Payment terms for service contracts are generally within
thirty days
from the receipt of the invoice. Performance obligations for service revenue are considered to be satisfied as the event is completed or work is done per the terms of the related contract. Other revenues include the resale of electrical and instrumentation equipment billed upon delivery and are generally due within
thirty days
from the receipt of the invoice.
All outstanding accounts receivable, net of allowance, on the consolidated balance sheet are typically due and collected within the next
30 days
for our LNG business and
12 months
for our Power Delivery business.
Impairment of Long-Lived Assets and Goodwill
LNG liquefaction facilities, and other long-lived assets held and used by the Company are reviewed periodically for potential impairment whenever events or changes in circumstances indicate that a particular asset’s carrying value may not be recoverable. Recoverability generally is determined by comparing the carrying value for the asset to the expected undiscounted future cash flows of the asset. If the carrying value of the asset is not recoverable, the amount of impairment loss is measured as the excess, if any, of the carrying value of the asset over its estimated fair value. The estimated undiscounted future cash flows are based on projections of future operating results; these projections contain estimates of the value of future contracts that have not yet been obtained, future commodity pricing and our future cost structure, among others. Projections of future operating results and cash flows may vary significantly from actual results. Management reviews its estimates of cash flows on an ongoing basis using historical experience, business plans, overall market conditions, and other factors.
Goodwill represents the excess of the cost of an acquired entity over the fair value of the assets acquired less liabilities assumed. Intangible assets are assets that lack physical substance (excluding financial assets). Goodwill acquired in a business combination
40
and intangible assets with indefinite useful lives are not amortized, and intangible assets with finite useful lives are amortized. Goodwill and intangible assets not subject to amortization are tested for impairment annually or more frequently if events or changes in circumstances indicate the assets carrying value may not be recoverable. We currently intend to test goodwill for impairment annually beginning in the third quarter of 2020.
Income Taxes
Deferred income taxes are accounted for under the asset-and-liability method. Deferred tax assets and liabilities are recognized for the future tax consequences attributable to differences between the financial statement carrying amounts of existing assets and liabilities and their respective tax basis and operating loss and tax credit carryforwards. Deferred tax assets and liabilities are measured using enacted tax rates expected to apply to taxable income in the years in which those temporary differences are expected to be recovered or settled. The effect on deferred tax assets and liabilities of a change in tax rates is recognized in income in the period that includes the enactment date.
The Company recognizes the effect of income tax positions only if those positions are more likely than not to be sustained. Recognized income tax positions are measured at the largest amount that is greater than 50% likely of being realized. Changes in recognition or measurement are reflected in the period in which the change in judgment occurs. The Company records interest related to unrecognized tax benefits in interest expense and penalties in selling, general and administrative expenses.
Fair Value Measurements
The Company utilizes valuation techniques that maximize the use of observable inputs and minimize the use of unobservable inputs to the extent possible. The Company determines fair value based on assumptions that market participants would use in pricing an asset or liability in the principal or most advantageous market. When considering market participant assumptions in the fair value measurements, the following fair value hierarchy distinguishes between observable and unobservable inputs, which are categorized in one of the following levels in accordance with US GAAP:
Level 1 Inputs—Unadjusted quoted prices in active markets for identical assets or liabilities accessible to the reporting entity at the measurement date.
Level 2 Inputs—Other than quoted prices included in Level 1 inputs that are observable for the asset or liability, either directly or indirectly, for substantially the full term of the asset or liability.
Level 3 Inputs—Unobservable inputs for the asset or liability used to measure fair value to the extent that observable inputs are not available, thereby, allowing for situations in which there is little, if any, market activity for the asset or liability at measurement date.
Recently Adopted Accounting Changes and Recently Issued and Adopted Accounting Standards.
For descriptions of recently adopted and issued accounting standards, see Note 1—Basis of Presentation and Summary of Significant Accounting Policies to our Notes to Consolidated Financial Statements.
ITEM 7A. QUANTITATIVE AND QUALITATIVE DISCLOSURES ABOUT MARKET RISK
Quantitative and Qualitative Disclosures about Market Risk
In the normal course of business, the Company encounters several significant types of market risks including commodity and interest rate risks.
Commodity Price Risk
Due to the nature of the LNG distribution business, the Company has short term agreements with suppliers to contract for LNG purchases. These contracts extend for various period and minimums. The index rate pricing for natural gas may increase or decrease in the future based upon market conditions.
Commodity price risk is the risk of loss arising from adverse changes in market rates and prices. We are able to limit our exposure to fluctuations in natural gas prices by structuring our contract pricing with customers so that it mirrors the volatility in our supply cost with vendors. Our exposure to market risk associated with LNG price changes may adversely impact our business.
41
We do not currently have any derivative arrangements to protect against fluctuations in commodity prices, but to mitigate the effect of fluctuations in LNG prices on our operations, we may enter into various derivative instruments.
We are subject to market risk from fluctuating market prices of certain raw materials related to power delivery solutions. While such materials are typically available from numerous suppliers, commodity raw materials are subject to price fluctuations. We endeavor to recoup these price increases from our customers on an individual contract basis to avoid operating margin erosion. Although historically we have not entered into any contracts to hedge commodity risk, we may do so in the future. Commodity price changes can have a material impact on our prospective earnings and cash flows. Copper, steel and aluminum represent a significant element of our material cost. Significant increases in the prices of these materials could reduce our estimated operating margins if we are unable to recover such increases from our customers.
Interest Rate Risk
On September 30, 2013, the Company entered into a Secured Term Note Payable with Chart E&C. This Note Payable bears interest at a variable rate and exposes us to interest rate risk. Interest is calculated under the terms of the Note Payable based on a calculation of 3% plus the London interbank offered rate at the end of each month. Following the August 30, 2019 debt exchange with Chart E&C, a 1% increase or decrease in the interest rate would have a de mininis impact on annual interest expense. See Note 10—Debt to the Notes to Consolidated Financial Statements included elsewhere in this report for information on the terms of the Note Payable.
We do not currently have or intend to enter into any derivative arrangements to protect against fluctuations in interest rates applicable to our outstanding indebtedness.
Foreign Currency Exchange Rate Risk
We operate subsidiaries in Brazil and Mexico and maintain an equity method investment in our Chinese joint venture, BOMAY. The functional currency of the Brazilian and Mexican subsidiaries are the Brazilian Real and Mexican Peso, respectively. The functional currency of the Chinese joint venture is the Chinese Yuan. Investments are translated into United States Dollars at the exchange rate in effect at the end of each quarterly reporting period. The resulting translation adjustment has been an accumulated loss of
$291 thousand
and is recorded as Accumulated Other Comprehensive Loss, net of taxes, in our Consolidated Balance Sheet at
December 31, 2019
.
As of
December 31, 2019
, we had a non-U.S. dollar denominated working capital balance of approximately $1.0 million. An adverse change of 10% in the underlying foreign currency exchange rate would reduce our working capital balance by approximately $0.1 million.
We do not currently have or intend to enter into any derivative arrangements to protect against such fluctuations.
Market Risk
The markets in which our power delivery operations participate are capital intensive and cyclical in nature. The volatility in customer demand is greatly driven by the change in the price of oil and gas. These factors influence the release of new capital projects by our customers, which are traditionally awarded in competitive bid situations. Coordination of project start dates is matched to the customer requirements and projects may take a number of months to complete; schedules also may change during the course of any particular project.
42
ITEM 8. FINANCIAL STATEMENTS AND SUPPLEMENTARY DATA

REPORT OF INDEPENDENT REGISTERED PUBLIC ACCOUNTING FIRM
To the Board of Directors and Stockholders of
Stabilis Energy, Inc.:
Opinion on the Consolidated Financial Statements
We have audited the accompanying consolidated balance sheets of Stabilis Energy, Inc. and Subsidiaries (collectively, the “Company”), as of December 31, 2019 and 2018, and the related consolidated statements of operations, comprehensive loss, stockholders’ equity and cash flows for the years then ended, and the related notes (collectively referred to as the “consolidated financial statements”). In our opinion, the consolidated financial statements present fairly, in all material respects, the financial position of the Company as of December 31, 2019 and 2018, and the results of its operations and its cash flows for the years then ended, in conformity with accounting principles generally accepted in the United States of America.
Basis for Opinion
These consolidated financial statements are the responsibility of the Company’s management. Our responsibility is to express an opinion on these consolidated financial statements based on our audits. We are a public accounting firm registered with the Public Company Accounting Oversight Board (United States) (“PCAOB”) and are required to be independent with respect to the Company in accordance with the U.S. federal securities laws and the applicable rules and regulations of the Securities and Exchange Commission and the PCAOB.
We conducted our audits in accordance with the standards of the PCAOB. Those standards require that we plan and perform the audit to obtain reasonable assurance about whether the consolidated financial statements are free from material misstatement, whether due to error or fraud. The Company is not required to have, nor were we engaged to perform, an audit of its internal control over financial reporting. As part of our audits we are required to obtain an understanding of internal control over financial reporting but not for the purpose of expressing an opinion on the effectiveness of the entity’s internal control over financial reporting. Accordingly, we express no such opinion.
Our audits included performing procedures to assess the risks of material misstatement of the consolidated financial statements, whether due to error or fraud, and performing procedures that respond to those risks. Such procedures included examining, on a test basis, evidence regarding the amounts and disclosures in the consolidated financial statements. Our audits also included evaluating the accounting principles used and significant estimates made by management, as well as evaluating the overall presentation of the consolidated financial statements. We believe that our audits provide a reasonable basis for our opinion.
We have served as Stabilis Energy, Inc.’s auditor since 2007.
Houston, Texas
March 16, 2020
43
Stabilis Energy, Inc. and Subsidiaries
Consolidated Balance Sheets
(in thousands, except share and per share data)
|
December 31, 2019
|
December 31, 2018
|
||||||
|
Assets
|
|||||||
|
Current assets:
|
|||||||
|
Cash and cash equivalents
|
$
|
3,979
|
|
$
|
1,247
|
|
|
|
Accounts receivable, net
|
5,945
|
|
4,359
|
|
|||
|
Inventories, net
|
209
|
|
106
|
|
|||
|
Prepaid expenses and other current assets
|
3,583
|
|
2,115
|
|
|||
|
Due from related parties
|
—
|
|
22
|
|
|||
|
Total current assets
|
13,716
|
|
7,849
|
|
|||
|
Property, plant and equipment, net
|
60,363
|
|
66,606
|
|
|||
|
Right-of-use assets
|
965
|
|
—
|
|
|||
|
Goodwill
|
4,453
|
|
—
|
|
|||
|
Investments in foreign joint ventures
|
10,521
|
|
—
|
|
|||
|
Other noncurrent assets
|
308
|
|
250
|
|
|||
|
Total assets
|
$
|
90,326
|
|
$
|
74,705
|
|
|
|
Liabilities and Equity
|
|||||||
|
Current liabilities:
|
|||||||
|
Current portion of long-term notes payable - related parties
|
$
|
1,000
|
|
$
|
2,500
|
|
|
|
Current portion of finance lease obligation - related parties
|
3,440
|
|
3,879
|
|
|||
|
Current portion of operating lease obligations
|
364
|
|
—
|
|
|||
|
Short-term notes payable
|
558
|
|
121
|
|
|||
|
Accrued liabilities
|
5,018
|
|
3,035
|
|
|||
|
Accounts payable
|
4,728
|
|
2,562
|
|
|||
|
Total current liabilities
|
15,108
|
|
12,097
|
|
|||
|
Long-term notes payable, net of current portion - related parties
|
6,077
|
|
6,577
|
|
|||
|
Finance lease obligations, net of current portion - related parties
|
648
|
|
3,367
|
|
|||
|
Long-term portion of operating lease obligations
|
650
|
|
—
|
|
|||
|
Total liabilities
|
22,483
|
|
22,041
|
|
|||
|
Commitments and contingencies (Note 13)
|
|
|
|
|
|||
|
Equity:
|
|||||||
|
Preferred Stock; $0.001 par value, 1,000,000 shares authorized, no shares issued and outstanding at December 31, 2019 and December 31, 2018, respectively (Note 17)
|
—
|
|
—
|
|
|||
|
Stockholders’ equity:
|
|||||||
|
Common stock; $0.001 par value, 37,500,000 shares authorized, 16,800,612 and 13,178,750 shares issued and outstanding at December 31, 2019 and December 31, 2018, respectively (Note 15)
|
17
|
|
13
|
|
|||
|
Additional paid-in capital
|
90,748
|
|
68,244
|
|
|||
|
Accumulated other comprehensive loss
|
(291
|
)
|
—
|
|
|||
|
Accumulated deficit
|
(22,631
|
)
|
(16,916
|
)
|
|||
|
Total stockholders’ equity
|
67,843
|
|
51,341
|
|
|||
|
Noncontrolling interest
|
—
|
|
1,323
|
|
|||
|
Total Equity
|
67,843
|
|
52,664
|
|
|||
|
Total liabilities and equity
|
$
|
90,326
|
|
$
|
74,705
|
|
|
The accompanying notes are an integral part of the consolidated financial statements.
44
Stabilis Energy, Inc. and Subsidiaries
Consolidated Statements of Operations
(in thousands, except share and per share data)
|
Year Ended December 31,
|
|||||||
|
2019
|
2018
|
||||||
|
Revenue
|
|||||||
|
LNG product
|
$
|
34,244
|
|
$
|
30,200
|
|
|
|
Rental, service and other
|
12,827
|
|
7,142
|
|
|||
|
Total revenues
|
47,071
|
|
37,342
|
|
|||
|
Operating expenses:
|
|||||||
|
Cost of LNG product
|
23,489
|
|
23,804
|
|
|||
|
Cost of rental, service and other
|
8,437
|
|
4,648
|
|
|||
|
Selling, general and administrative expenses
|
11,304
|
|
7,350
|
|
|||
|
Depreciation expense
|
9,271
|
|
8,822
|
|
|||
|
Total operating expenses
|
52,501
|
|
44,624
|
|
|||
|
Loss from operations before equity income
|
(5,430
|
)
|
(7,282
|
)
|
|||
|
Net equity income from foreign joint ventures' operations:
|
|||||||
|
Income from equity investments in foreign joint ventures
|
1,257
|
|
—
|
|
|||
|
Foreign joint ventures' operations related expenses
|
(124
|
)
|
—
|
|
|||
|
Net equity income from foreign joint ventures' operations
|
1,133
|
|
—
|
|
|||
|
Loss from operations
|
(4,297
|
)
|
(7,282
|
)
|
|||
|
Other income (expense):
|
|||||||
|
Interest expense, net
|
(33
|
)
|
(122
|
)
|
|||
|
Interest expense, net - related parties
|
(1,175
|
)
|
(4,299
|
)
|
|||
|
Other income
|
97
|
|
298
|
|
|||
|
Gain from disposal of fixed assets
|
16
|
|
319
|
|
|||
|
Total other income (expense)
|
(1,095
|
)
|
(3,804
|
)
|
|||
|
Loss before income tax expense
|
(5,392
|
)
|
(11,086
|
)
|
|||
|
Income tax expense
|
116
|
|
—
|
|
|||
|
Net loss
|
(5,508
|
)
|
(11,086
|
)
|
|||
|
Net income (loss) attributable to noncontrolling interests
|
207
|
|
(42
|
)
|
|||
|
Net loss attributable to Stabilis Energy, Inc.
|
$
|
(5,715
|
)
|
$
|
(11,044
|
)
|
|
|
Common Stock Data:
|
|||||||
|
Net loss per common share:
|
|||||||
|
Basic and diluted
|
$
|
(0.39
|
)
|
$
|
(2.42
|
)
|
|
|
Weighted average number of common shares outstanding:
|
|||||||
|
Basic and diluted
|
14,558,618
|
|
4,566,971
|
|
|||
The accompanying notes are an integral part of the consolidated financial statements.
45
Stabilis Energy, Inc. and Subsidiaries
Consolidated Statements of Comprehensive Loss
(in thousands)
|
Year Ended
December 31, |
|||||||
|
2019
|
2018
|
||||||
|
Net loss
|
$
|
(5,508
|
)
|
$
|
(11,086
|
)
|
|
|
Foreign currency translation adjustment
|
(291
|
)
|
—
|
|
|||
|
Total comprehensive loss
|
(5,799
|
)
|
(11,086
|
)
|
|||
|
Total comprehensive income (loss) attributable to noncontrolling interest
|
207
|
|
(42
|
)
|
|||
|
Total comprehensive loss attributable to Stabilis Energy, Inc.
|
$
|
(6,006
|
)
|
$
|
(11,044
|
)
|
|
The accompanying notes are an integral part of the consolidated financial statements.
46
Stabilis Energy, Inc. and Subsidiaries
Consolidated Statements of Stockholders’ Equity
(in thousands, except share data)
|
Common Stock
|
||||||||||||||||||||||||||
|
Shares
|
Amount
|
Additional
Paid-in Capital
|
Accumulated
Other
Comprehensive
Loss
|
Accumulated
Deficit
|
Non-controlling Interest
|
Total
|
||||||||||||||||||||
|
Balance at December 31, 2017
|
3,767,674
|
|
$
|
4
|
|
$
|
19,510
|
|
$
|
—
|
|
$
|
(5,872
|
)
|
$
|
1,365
|
|
$
|
15,007
|
|
||||||
|
Net loss
|
—
|
|
—
|
|
—
|
|
—
|
|
(11,044
|
)
|
(42
|
)
|
(11,086
|
)
|
||||||||||||
|
Contribution of notes payable by members
|
9,411,076
|
|
9
|
|
48,734
|
|
—
|
|
—
|
|
—
|
|
48,743
|
|
||||||||||||
|
Balance at December 31, 2018
|
13,178,750
|
|
13
|
|
68,244
|
|
—
|
|
(16,916
|
)
|
1,323
|
|
52,664
|
|
||||||||||||
|
Recapitalization due to reverse merger
|
1,466,092
|
|
1
|
|
12,618
|
|
—
|
|
—
|
|
(1,530
|
)
|
11,089
|
|
||||||||||||
|
Shares issued in extinguishment of debt
|
1,470,807
|
|
2
|
|
6,887
|
|
—
|
|
—
|
|
—
|
|
6,889
|
|
||||||||||||
|
Shares issued in acquisition of Diversenergy
|
684,963
|
|
1
|
|
2,999
|
|
—
|
|
—
|
|
—
|
|
3,000
|
|
||||||||||||
|
Net loss
|
—
|
|
—
|
|
—
|
|
—
|
|
(5,715
|
)
|
207
|
|
(5,508
|
)
|
||||||||||||
|
Other comprehensive loss
|
—
|
|
—
|
|
—
|
|
(291
|
)
|
—
|
|
—
|
|
(291
|
)
|
||||||||||||
|
Balance at December 31, 2019
|
16,800,612
|
|
$
|
17
|
|
$
|
90,748
|
|
$
|
(291
|
)
|
$
|
(22,631
|
)
|
$
|
—
|
|
$
|
67,843
|
|
||||||
The accompanying notes are an integral part of the consolidated financial statements.
47
Stabilis Energy, Inc. and Subsidiaries
Consolidated Statements of Cash Flows
(in thousands)
|
Year Ended December 31,
|
|||||||
|
2019
|
2018
|
||||||
|
Cash flows from operating activities:
|
|||||||
|
Net loss
|
$
|
(5,508
|
)
|
$
|
(11,086
|
)
|
|
|
Adjustments to reconcile net loss to net cash provided by (used in) operating activities:
|
|||||||
|
Depreciation and amortization
|
9,271
|
|
8,822
|
|
|||
|
Bad debt expense
|
80
|
|
—
|
|
|||
|
Gain on disposal of fixed assets
|
(16
|
)
|
(319
|
)
|
|||
|
Gain on extinguishment of debt
|
(111
|
)
|
—
|
|
|||
|
Income from equity investment in joint venture
|
(1,257
|
)
|
—
|
|
|||
|
Interest expense restructured to debt
|
—
|
|
3,121
|
|
|||
|
Change in operating assets and liabilities, net of acquisitions:
|
|||||||
|
Accounts receivable
|
(897
|
)
|
(559
|
)
|
|||
|
Due to/(from) related parties
|
131
|
|
(1,145
|
)
|
|||
|
Inventories
|
(34
|
)
|
(30
|
)
|
|||
|
Prepaid expenses and other current assets
|
523
|
|
(1,588
|
)
|
|||
|
Accounts payable and accrued liabilities
|
1,741
|
|
2,281
|
|
|||
|
Other
|
188
|
|
78
|
|
|||
|
Net cash provided by (used in) operating activities
|
4,111
|
|
(425
|
)
|
|||
|
Cash flows from investing activities:
|
|||||||
|
Acquisition of fixed assets
|
(2,116
|
)
|
(833
|
)
|
|||
|
Proceeds on sales of fixed assets
|
138
|
|
902
|
|
|||
|
Acquisition of American Electric, net of cash received
|
611
|
|
—
|
|
|||
|
Acquisition of Diversenergy, net of cash received
|
(1,876
|
)
|
—
|
|
|||
|
Net cash provided by (used in) investing activities
|
(3,243
|
)
|
69
|
|
|||
|
Cash flows from financing activities:
|
|||||||
|
Proceeds on long-term borrowings from related parties
|
5,000
|
|
4,603
|
|
|||
|
Payments on long-term borrowings from related parties
|
(3,159
|
)
|
(1,933
|
)
|
|||
|
Payments on long-term borrowings
|
—
|
|
(2,412
|
)
|
|||
|
Proceeds from short-term notes payable
|
767
|
|
425
|
|
|||
|
Payments on short-term notes payable
|
(668
|
)
|
(569
|
)
|
|||
|
Net cash provided by financing activities
|
1,940
|
|
114
|
|
|||
|
Effect of exchange rate changes on cash
|
(76
|
)
|
—
|
|
|||
|
Net increase (decrease) in cash and cash equivalents
|
2,732
|
|
(242
|
)
|
|||
|
Cash and cash equivalents, beginning of period
|
1,247
|
|
1,489
|
|
|||
|
Cash and cash equivalents, end of period
|
$
|
3,979
|
|
$
|
1,247
|
|
|
|
Supplemental disclosure of cash flow information:
|
|||||||
|
Interest paid
|
$
|
1,208
|
|
$
|
1,387
|
|
|
|
Income taxes paid
|
93
|
|
—
|
|
|||
|
Non-cash investing and financing activities:
|
|||||||
|
Restructure of long-term debt
|
$
|
—
|
|
$
|
49,243
|
|
|
|
Extinguishment of long-term debt
|
6,889
|
|
—
|
|
|||
|
Note receivable applied to long-term debt
|
—
|
|
(500
|
)
|
|||
|
Equipment acquired under capital leases
|
—
|
|
1,467
|
|
|||
The accompanying notes are an integral part of the consolidated financial statements.
48
STABILIS ENERGY, INC. AND SUBSIDIARIES
Notes to Consolidated Financial Statements
1. Basis of Presentation and Summary of Significant Accounting Policies
(a) Description of Business
Stabilis Energy, Inc. and its subsidiaries (the “Company”, “Stabilis”, “our”, “us” or “we”) produce, market, and sell liquefied natural gas (“LNG”). The Company also resells liquefied natural gas from third parties and provides services, transportation, and equipment to customers.
The Company is a supplier of LNG to the industrial, midstream, and oilfield sectors in North America and provides turnkey fuel solutions to help industrial users of propane, diesel and other crude-based fuel products convert to LNG, which may result in reduced fuel costs and improved environmental footprint. Stabilis opened its
100,000
gallons per day ("gpd") LNG production facility in George West, Texas in January 2015 to service industrial and oilfield customers in Texas and the greater Gulf Coast region. The Company owns a second liquefaction plant capable of producing
25,000
gpd that is being relocated and currently not in operation. Stabilis is vertically integrated from LNG production through distribution including cryogenic equipment rental and field services.
As a result of the business combination with American Electric Technologies, Inc. (“American Electric”) discussed below, we also provide power delivery solutions through our subsidiary in Brazil, M&I Electric Brazil Sistemas e Servicios em Energia LTDA (“M&I Brazil”) and our joint venture in China, BOMAY Electric Industries Co., Ltd. (“BOMAY”) with a subsidiary of China National Petroleum Company.
On July 26, 2019 (the “Effective Date”), the Company completed the Share Exchange with American Electric and its subsidiaries. In the Share Exchange, American Electric acquired directly
100%
of the outstanding limited liability company membership interests of Stabilis Energy, LLC (“Stabilis LLC”) from LNG Investment Company, LLC ("LNG Investment") and
20%
of the outstanding limited liability membership interests of PEG Partners, LLC ("PEG") from AEGIS NG LLC ("AEGIS"). AEGIS owned a
20%
noncontrolling interest of PEG. The remaining
80%
of the outstanding limited liability company interests of PEG were owned directly by Stabilis LLC. As a result, Stabilis became a direct
100%
owned subsidiary of American Electric and PEG became an indirectly-owned
100%
subsidiary of American Electric. Under the Share Exchange Agreement, American Electric issued
13,178,750
post-split shares of common stock to acquire Stabilis LLC, which represented approximately
90%
of the total amount of common stock of American Electric which was issued and outstanding as of July 26, 2019. The transaction was approved by the shareholders of American Electric at a Special Meeting of Stockholders. The Share Exchange resulted in a change of control of American Electric to control by Casey Crenshaw by virtue of his beneficial ownership of
88.4%
of the common stock of American Electric to be outstanding as of July 26, 2019.
Immediately following the Effective Date, the Company declared a reverse stock split of its outstanding common stock at a ratio of
one-for-eight
, American Electric changed its name to Stabilis Energy, Inc., and our common stock began trading under the ticker symbol “SLNG”. Unless otherwise noted, any share or per share amounts in the accompanying consolidated financial statements and related notes give retroactive effect to the reverse stock split.
Because the former owners of Stabilis LLC owned
88.4%
of the voting stock of the combined company immediately following the Effective Date and certain other factors including, that directors designated by LNG Investment constituted a majority of the board of directors, Stabilis LLC is treated as the acquiror of American Electric in the Share Exchange for accounting purposes. As a result, the Share Exchange is treated by American Electric as a reverse acquisition under the purchase method of accounting in accordance with United States generally accepted accounting principles (“US GAAP”). For further information regarding this transaction, see Note 2—Acquisitions.
(b) Basis of Presentation and Consolidation
The financial information represents the historical results of Stabilis for periods prior to the transaction
.
The operations of American Electric are included in our financial statements for the period following the completion of the Share Exchange on July 26, 2019. The accompanying consolidated financial statements include the accounts of the Company and its subsidiaries. All intercompany accounts and transactions have been eliminated in consolidation.
The accompanying consolidated financial statements have been prepared assuming that the Company will continue as a going concern, which contemplates the realization of assets and the satisfaction of liabilities in the normal course of business. The Company is required to make certain disclosures if it concludes that there is substantial doubt about the entity’s ability to continue
49
as a going concern within one year from the date of the issuance of these financial statements. The Company has incurred recurring operating losses and has negative working capital. The Company is subject to substantial business risks and uncertainties inherent in the current LNG industry. There is no assurance that the Company will be able to generate sufficient revenues in the future to sustain itself or to support future growth.
These factors were reviewed by management to determine if there was substantial doubt as to the Company’s ability to continue as a going concern. Management concluded that its plans would allow it to continue as a going concern.
Cash flows from operations have continued to improve due to sales volumes. Management believes that its business will continue to grow and will generate sufficient cash flows to fund future operations.
(c) Use of Estimates in the Preparation of the Consolidated Financial Statements
The preparation of the consolidated financial statements in conformity with U.S. GAAP requires management to make estimates and assumptions that affect the reported amounts of assets and liabilities and disclosure of contingent assets and liabilities at the date of the financial statements and the reported amounts of revenues and expenses during the reporting period. Significant items subject to such estimates include the carrying amount of contingencies, valuation allowances for receivables, inventories, and deferred income tax assets, valuations assigned to assets and liabilities in business combinations, and impairments of long-lived assets. Actual results could differ from those estimates, and these differences could be material to the consolidated financial statements.
(d) Cash and Cash Equivalents
The Company considers all highly liquid investments with maturities of three months or less, when purchased, to be cash and cash equivalents. Cash equivalents consist principally of money market accounts held with major financial institutions. The Company is exposed to credit risk from its deposits of cash and cash equivalents in excess of amounts insured by the Federal Deposit Insurance Corporation. The Company has not experienced any losses on its deposits of cash and cash equivalents.
(e) Accounts Receivable
Accounts receivable are recognized when products are sold. The Company extends credit to many of its customers in the ordinary course of business. Generally, these sales are unsecured.
Accounts receivable are stated at cost, net of any allowance for doubtful accounts. The Company maintains allowances for doubtful accounts for estimated losses where there is doubt as to the collectability of individual balances. In evaluating the collectability of individual receivable balances, the Company considers many factors, including the age of the balance, the customer’s payment history, its current credit-worthiness and current economic trends. At
December 31, 2019
and
2018
, management believed all balances were fully collectible such that no allowance for doubtful accounts was deemed necessary.
(f) Inventories
LNG inventory consists of LNG produced that is either (1) in a storage container at our plant or (2) in a storage trailer that is in transit to a customer. Inventory quantities are measured at each reporting period and are valued at the lower of cost or market, determined on a first-in, first-out basis.
Power delivery inventories are stated at the lower of cost or market, with material value determined using an average cost method. At
December 31, 2019
and
2018
, inventory is primarily raw materials for use on service jobs in Brazil.
50
(g) Property, Plant and Equipment
Property, plant and equipment are stated at cost, net of accumulated depreciation and amortization. Significant additions, renewals, and capital improvements are capitalized, whereas expenditures for maintenance and repairs are charged to expense as incurred. Leasehold improvements are amortized over the shorter of the applicable remaining lease term or the estimated useful life of the related assets. The cost and related accumulated depreciation of assets retired or sold are removed from the appropriate asset and depreciation accounts, and the resulting gain or loss is reflected in income. Depreciation and amortization are computed using the straight-line method over the estimated useful lives of the assets.
(h) Long-Lived Assets and Goodwill
Long lived assets, such as property, plant, and equipment, are reviewed for impairment whenever events or changes in circumstances indicate that the carrying amount of an asset may not be recoverable. If circumstances require a long-lived asset or asset group be tested for possible impairment, the Company first compares undiscounted cash flows expected to be generated by that asset or asset group to its carrying amount. If the carrying amount of the long-lived asset or asset group is not recoverable on an undiscounted cash flows basis, an impairment is recognized to the extent that the carrying amount exceeds its fair value. Fair value is determined through various valuation techniques including discounted cash flows models, quoted market values and third-party independent appraisals, as considered necessary. There were no impairments of the Company’s long-lived assets in the years ended
December 31, 2019
and
2018
.
Goodwill represents the excess of the cost of an acquired entity over the fair value of the assets acquired less liabilities assumed. Intangible assets are assets that lack physical substance (excluding financial assets). Goodwill acquired in a business combination and intangible assets with indefinite useful lives are not amortized, and intangible assets with finite useful lives are amortized. Goodwill and intangible assets not subject to amortization are tested for impairment annually or more frequently if events or changes in circumstances indicate the assets carrying value may not be recoverable. Business acquisitions during the third quarter of 2019 accounted for the balance of goodwill. We currently intend to test goodwill for impairment annually beginning in the third quarter of 2020. See Note 2 — Acquisitions and Note 7 — Goodwill for further discussion.
(i) Asset Retirement Obligations
The Company recognizes the fair value of the liability associated with an asset retirement obligation in the period in which the liability is incurred or becomes reasonably estimable and if there is a legal obligation to restore or remediate the property at the end of a lease term. Asset retirement obligations are based upon future retirement cost estimates and incorporate certain assumptions, such as costs to restore the property and any salvage value. Management does not believe the Company had any material asset retirement obligations at
December 31, 2019
and
2018
.
(j) Revenue Recognition
The Company recognizes revenue associated with the sale of LNG at the point in time when the customer obtains control of the asset. In evaluating when a customer has control of the asset, the Company primarily considers whether the transfer of legal title and physical delivery has occurred, whether the customer has significant risks and rewards of ownership, and whether the customer accepted delivery and a right of payment exists. Revenues from service and rental contracts are recognized over time, as the performance obligation is completed. See Note 3—Revenue Recognition for further discussion.
(k) Income Taxes
Deferred income taxes are accounted for under the asset-and-liability method. Deferred tax assets and liabilities are recognized for the future tax consequences attributable to differences between the financial statement carrying amounts of existing assets and liabilities and their respective tax basis and operating loss and tax credit carryforwards. Deferred tax assets and liabilities are measured using enacted tax rates expected to apply to taxable income in the years in which those temporary differences are expected to be recovered or settled. The effect on deferred tax assets and liabilities of a change in tax rates is recognized in income in the period that includes the enactment date. A valuation allowance is recorded when it is more likely than not that the net deferred tax asset will not be realized.
The Company recognizes the tax benefit or obligation from an uncertain tax position only if it is more likely than not that the tax position will be sustained on examination by the taxing authorities, based not only on the technical merits of the tax position based on tax law, but also past administrative practices and precedents of the taxing authority. The tax benefits or obligations are recognized in the financial statements if there is a greater than 50% likelihood of the tax benefit or obligation being realized upon ultimate resolution. As of
December 31, 2019
and
2018
, the Company had no uncertain tax positions that required recognition.
51
The Company files income tax returns in the United States of America and in the state of Texas. With few exceptions, the Company is subject to examination by the applicable taxing authorities for years after 2015.
(l) Commitments and Contingencies
Liabilities for loss contingencies arising from claims, assessments, litigation, fines, penalties and other sources are recorded when it is probable that a liability has been incurred and the amount can be reasonably estimated. Legal costs incurred in connection with loss contingencies are expensed as incurred.
(m) Fair Value Measurements
The Company utilizes valuation techniques that maximize the use of observable inputs and minimize the use of unobservable inputs to the extent possible. The Company determines fair value based on assumptions that market participants would use in pricing an asset or liability in the principal or most advantageous market. When considering market participant assumptions in the fair value measurements, the following fair value hierarchy distinguishes between observable and unobservable inputs, which are categorized in one of the following levels in accordance with U.S. GAAP:
Level 1 Inputs-Unadjusted quoted prices in active markets for identical assets or liabilities accessible to the reporting entity at the measurement date.
Level 2 Inputs-Other than quoted prices included in Level 1 inputs that are observable for the asset or liability, either directly or indirectly, for substantially the full term of the asset or liability.
Level 3 Inputs-Unobservable inputs for the asset or liability used to measure fair value to the extent that observable inputs are not available, thereby, allowing for situations in which there is little, if any, market activity for the asset or liability at the measurement date.
The carrying value of cash and cash equivalents, accounts receivable, inventory, accounts payable and accrued liabilities approximate their respective fair values due to their relative short maturities. The carrying value of the Company’s notes payable and finance lease obligations approximates fair value because the related interest rates approximate rates currently available to the Company.
Nonfinancial assets and liabilities measured at fair value on a nonrecurring basis include certain nonfinancial assets and liabilities acquired in a business combination, are measured at fair value using quoted market prices or, to the extent that there are no available quoted market prices, market prices for similar assets or liabilities.
(n) Foreign Currency Gains and Losses
Foreign currency translations are included as a separate component of comprehensive income (loss). The Company has determined the local currency of its foreign subsidiaries and foreign joint ventures to be the functional currency. In accordance with Accounting Standards Codification (ASC 830), the assets and liabilities of the foreign equity investees and foreign subsidiaries, denominated in foreign currency, are translated into United States dollars at exchange rates in effect at the consolidated balance sheet date and net sales and expenses are translated at the average exchange rate for the period. Related translation adjustments are reported as comprehensive income (loss), net of deferred income taxes, which is a separate component of stockholders’ equity, whereas gains and losses resulting from foreign currency transactions are included in results of operations.
(o) Recent Accounting Pronouncements
Recently Adopted Accounting Standards
In July 2018, the FASB issued ASU No. 2018-11, Leases (Topic 842): Targeted Improvements. ASU No. 2018-11 provides entities with an additional (and optional) transition method to adopt the new lease standard. Under this new transition method, an entity initially applies the new lease standard at the adoption date and recognizes a cumulative-effect adjustment to the opening balance of retained earnings in the period of adoption. Consequently, an entity’s reporting for the comparative periods presented in the financial statements in which it adopts the new lease standard will continue to be in accordance with current U.S. GAAP (Topic 840, Leases). ASU No. 2018-11 also provide lessors with a practical expedient, by class of underlying asset, to not separate non-lease components from the associated lease component and, instead, to account for those components as a single component if the non-lease components otherwise would be accounted for under the new revenue guidance (Topic 606) and certain criteria are met: If the non-lease component or components associated with the lease component are the predominant component of the combined component, an entity is required to account for the combined component in accordance with Topic 606. Otherwise, the entity must
52
account for the combined component as an operating lease in accordance with Topic 842. The amendments in ASU No. 2018-11 are effective at the same time as the amendments in ASU No. 2016-02 discussed below.
In January 2017, the FASB issued ASU No. 2017-01, Business Combinations (Topic 805): Clarifying the Definition of a Business. ASU No. 2017-01 clarifies the definition of a business with the objective of adding guidance to assist entities with evaluating whether transactions should be accounted for as acquisitions (or disposals) of a business or as acquisitions (or disposals) of assets. ASU No. 2017-01 is effective for annual periods beginning after December 15, 2018, with early adoption permitted under certain circumstances. The amendments of ASU No. 2017-01 were adopted by the Company effective January 1, 2019. The adoption of this standard had no impact on our consolidated financial position or results of operations.
In February 2016, the FASB issued ASU No. 2016-02, Leases, which requires lessees to recognize the following for all leases (with the exception of short-term leases) at the commencement date: (1) a lease liability, which is a lessee’s obligation to make lease payments arising from a lease, measured on a discounted basis; and (2) a right-of- use asset, which is an asset that represents the lessee’s right to use, or control the use of, a specified asset for the lease term. Under this new guidance, lessees are required to recognize assets and liabilities on the balance sheet for the rights and obligations created by all leases with lease terms of more than 12 months. We adopted this new standard as of January 1, 2019 using the modified retrospective transition method, applying the new standard to leases in place as of the adoption date. Prior periods have not been adjusted. The adoption of the new lease standard resulted in the recognition of lease liabilities and corresponding right-of-use assets of
$0.2 million
, on the consolidated balance sheet as of January 1, 2019 for real and personal property operating leases. The adoption of ASU 2016-02 did not have a material impact on our consolidated results of operations and cash flows.
Recently Issued Accounting Standards
In January 2017, the FASB issued ASU 2017-04, “Intangibles – Goodwill and Other: Simplifying the Test for Goodwill Impairment”. The new guidance simplifies the subsequent measurement of goodwill by removing the second step of the two-step impairment test. The amendment requires an entity to perform its annual or interim goodwill impairment test by comparing the fair value of a reporting unit with its carrying amount. An entity still has the option to perform the qualitative assessment for a reporting unit to determine if the quantitative impairment test is necessary. The new guidance will be effective for annual periods or any interim goodwill impairment tests in fiscal years beginning after December 15, 2019. The amendment should be applied on a prospective basis. Early adoption is permitted for interim or annual goodwill impairment tests performed on testing dates after January 1, 2017. Management does not anticipate that this adoption will have a significant impact on its consolidated financial position, results of operations, or cash flows.
In December 2019, the FASB issued ASU 2019-12, Simplifying the Accounting for Income Taxes (ASU 2019-12), which simplifies the accounting for income taxes by removing certain exceptions to the general principles of Topic 740, Income Taxes and also improves consistent application by clarifying and amending existing guidance. ASU 2019-12 is effective for fiscal years beginning after December 15, 2020, with early adoption permitted. We are currently evaluating the impact of this guidance on our financial statements.
2. Acquisitions
American Electric.
On July 26, 2019, we completed a Share Exchange with American Electric and its subsidiaries and began operating under the name Stabilis Energy, Inc. Because the former owners of Stabilis LLC owned approximately
88.4%
of the voting stock of the combined company immediately following the Effective Date and certain other factors, including that directors designated by LNG Investment, parent of Stabilis LLC, constituted a majority of the board of directors, Stabilis is treated as the acquiror of American Electric in the Share Exchange for accounting purposes. As a result, the Share Exchange is treated by American Electric as a reverse acquisition under the purchase method of accounting in accordance with US GAAP.
The completion of the Share Exchange positions the Company to become a leading North American small-scale LNG production and distribution company focused on consolidating existing LNG assets, as well as investing in new assets in the United States, Mexico, and Canada.
The aggregate consideration paid in connection with the Share Exchange was allocated to American Electric’s tangible and intangible assets and liabilities based on their fair market values at the time of the completion of the Share Exchange. The assets and liabilities and results of operations of American Electric are consolidated into the results of operations of Stabilis as of the completion of the Share Exchange.
The total purchase price of the Share Exchange is as follows:
53
|
Number of shares of the combined company to be owned by American Electric stockholders
|
1,466,092
|
|
|
|
Multiplied by the fair value per share of American Electric Common Stock
|
$
|
7.12
|
|
|
Cash
|
$
|
650,000
|
|
|
Purchase price
|
$
|
11,088,573
|
|
The number of shares of American Electric common stock includes the
1,173,914
outstanding as of July 26, 2019,
276,549
shares issued prior to the completion of the Share Exchange for conversion of
1,000,000
shares of outstanding Series A Convertible Preferred Stock and
15,629
shares related to restricted stock units and deferred shares. The fair value of American Electric common stock used in determining the purchase price was
$7.12
per share based on the closing price of American Electric’s common stock on July 26, 2019.
Consistent with the purchase method of accounting, the total purchase price is allocated to the acquired tangible and intangible assets and assumed liabilities of American Electric based on their estimated fair values as of the Share Exchange closing date. The excess of the purchase price over the fair value of the acquired assets and liabilities assumed is reflected as goodwill and is attributable to strategic advantages gained from the acquisition of a public entity with access to LNG markets in Brazil and China. All of the goodwill is assigned to the Power Delivery segment and is not expected to be deductible for income tax purposes.
The allocation of the purchase price for the acquired assets and liabilities of American Electric is as follows (in thousands):
|
Total purchase price
|
$
|
11,089
|
|
|
Current Assets
|
3,611
|
|
|
|
Property, plant and equipment, net
|
532
|
|
|
|
Investment in foreign joint venture
|
9,333
|
|
|
|
Other noncurrent assets
|
410
|
|
|
|
Total identifiable assets
|
13,886
|
|
|
|
Accounts payable and other accrued expenses
|
(2,714
|
)
|
|
|
Accrued liabilities and other current liabilities
|
(138
|
)
|
|
|
Other Liabilities
|
(84
|
)
|
|
|
Total liabilities assumed
|
(2,936
|
)
|
|
|
Goodwill
|
$
|
139
|
|
The following table presents summarized results of operations of American Electric for the period from July 26, 2019 to December 31, 2019 and are included in the accompanying Consolidated Statement of Operations for the year ended December 31, 2019.
|
July 27 - December 31,
|
|||
|
2019
|
|||
|
Revenue
|
$
|
3,421
|
|
|
Income before income tax expense
|
769
|
|
|
|
Net income from continuing operations
|
691
|
|
|
The following table presents unaudited pro forma results of operations reflecting the acquisition of American Electric as if the acquisition had occurred as of January 1, 2018. This information has been compiled from current and historical financial statements and is not necessarily indicative of the results that actually would have been achieved had the transaction occurred at the beginning of the periods presented or that may be achieved in the future.
|
Years Ended December 31,
|
|||||||
|
2019
|
2018
|
||||||
|
Revenue
|
$
|
50,898
|
|
$
|
44,934
|
|
|
|
Net loss
|
(7,389
|
)
|
(13,871
|
)
|
|||
54
Diversenergy, LLC (“Diversenergy").
On August 20, 2019 (the "acquisition date"), we completed our acquisition of privately held Diversenergy and its subsidiaries. We purchased all of the issued and outstanding membership interests of Diversenergy for total consideration of
684,963
shares of Company common stock valued as of the closing date and
$2.0 million
in cash, subject to adjustments for Diversenergy’s net working capital as of the closing date. Diversenergy specializes in virtual LNG distribution systems, providing LNG to customers who use it as a fuel in mobile high horsepower applications and to customers who do not have natural gas pipeline access. The completion of the acquisition will expand the Company's presence in the distributed LNG and compressed natural gas (“CNG”) markets in Mexico.
Consistent with the purchase method of accounting, the total purchase price is allocated to the acquired tangible and intangible assets and assumed liabilities of Diversenergy based on their estimated fair values as of the closing date. The excess of the purchase price over the fair value of the acquired assets and liabilities assumed is reflected as goodwill and is attributable to the strategic opportunities to grow the Company's LNG and CNG business in Mexico. All of the goodwill is assigned to the LNG segment and is not expected to be deductible for income tax purposes.
The aggregate consideration paid in connection with the acquisition has been allocated to Diversenergy's tangible and intangible assets and liabilities based on their fair market values at the time of the completion of the acquisition. The assets and liabilities and results of operations of Diversenergy are consolidated into the results of operations of Stabilis as of the acquisition date.
The total purchase price of the Diversenergy acquisition is as follows:
|
Number of shares issued to Diversenergy stockholders
|
684,963
|
|
|
|
Multiplied by the fair value per share of Stabilis Common Stock
|
$
|
4.38
|
|
|
Cash
|
$
|
2,000,000
|
|
|
Purchase price
|
$
|
5,000,000
|
|
The following table summarizes the allocation of the purchase price to the fair value of the respective assets and liabilities acquired (in thousands). The purchase price allocations are subject to change as additional information becomes available concerning the fair value and tax basis of the assets acquired and liabilities assumed. Any measurement period adjustments to the purchase price allocation will be made as soon as practicable but no later than one year from the date of acquisition.
|
Total purchase price
|
$
|
5,000
|
|
|
Current Assets
|
164
|
|
|
|
Property, plant and equipment, net
|
507
|
|
|
|
Other noncurrent assets
|
114
|
|
|
|
Total identifiable assets
|
785
|
|
|
|
Current liabilities
|
(99
|
)
|
|
|
Total liabilities assumed
|
(99
|
)
|
|
|
Goodwill
|
$
|
4,314
|
|
Pro forma results of operations reflecting the Diversenergy acquisition as if it occurred as of the beginning of the periods presented in this report do not materially differ from actual reported results.
Energía Superior.
On August 20, 2019, we established Energía Superior Gas Natural LLC (“Energía Superior”), as a joint venture with CryoMex Investment Group LLC (“CryoMex”), to pursue investments in distributed natural gas production and distribution assets in Mexico. CryoMex is led by Grupo CLISA, a Monterrey, Mexico-based developer and operator of businesses in multiple end markets including energy. We own a
50%
interest in Energía Superior.
The Joint Venture plans to invest in LNG and compressed natural gas production, transportation, storage, and regasification assets that serve multiple end markets throughout Mexico, including the industrial, mining, pipeline, utility, marine, and over-the-road transportation markets.
See Note 8—Investments in Foreign Joint Ventures for discussion of our investment in Energía Superior.
3. Revenue Recognition
In May 2014, the FASB issued ASU No. 2014-09, Revenue from Contracts with Customers, which outlines a single comprehensive model for entities to use in accounting for revenue arising from contracts with customers. This ASU supersedes the revenue recognition requirements in FASB ASC Topic 605, “Revenue Recognition”, and most industry-specific guidance and creates ASC Topic 606. This ASU provides guidance that an entity should recognize revenue to depict the transfer of promised goods or
55
services to customers in an amount that reflects the consideration to which the entity expects to be entitled in exchange for those goods and services. On January 1, 2018, the Company adopted ASC 606 on a modified retrospective basis and applied the guidance to all of its contracts. As a result of the Company’s adoption, there were no changes to the timing of the recognition or measurement of revenue, and there was no cumulative effect of adoption as of January 1, 2018. Therefore, the only changes to the financial statements related to the adoption is in the footnote disclosures as included herein.
Revenue is measured as consideration specified in a contract with a customer and excludes any sales incentives and amounts collected on behalf of third parties. The Company recognizes revenue when it satisfies a performance obligation by transferring control over a product or service to a customer. Amounts are billed upon completion of service or transfer of a product and are generally due within
30 days
.
Revenues from contracts with customers are disaggregated into (1) LNG product, (2) rental, (3) service, and (4) other.
LNG Product revenue generated includes the revenue from the product and delivery of the LNG to our customer’s location. The Company acts as a principal when using third party transportation companies and therefore recognizes the gross revenue for the delivery of LNG. Product contracts are established by agreeing on a sales price or transaction price for the related item. Revenue is recognized when the customer has taken control of the product. Payment terms for product contracts are generally within
thirty days
from the receipt of the invoice. Product revenue is recognized upon delivery of the related item to the customer, at which point the customer controls the product and the Company has an unconditional right to payment.
Rental and Service revenue generated by the Company includes equipment and people provided to the customer to support the use of LNG and power delivery solutions in their application. Rental contracts are established by agreeing on a rental price or transaction price for the related piece of equipment and the rental period which is generally daily or monthly. The Company has the ability to substitute alternative assets throughout the period of use (i.e., the customer cannot prevent the Company from substituting an asset), and alternative assets are readily available and could be sourced within a reasonable period of time. Revenue is recognized over time as the rental period is completed and for periods that cross month end, based on rental hours completed during the period. Payment terms for rental contracts are generally within
thirty days
from the receipt of the invoice. Performance obligations for rental revenue are considered to be satisfied as the rental period is completed based upon the terms of the related contract. LNG service revenue generated by the Company consists of mobilization and demobilization of equipment and onsite technical support while customers are consuming LNG in their applications. Power Delivery service revenue is generated from time and material projects and consulting services. Service revenue is billed based on contractual terms that can be based on an event (i.e. mobilization or demobilization) or an hourly rate. Revenue is recognized over time as the event is completed or work is done, based on labor hours incurred. Payment terms for service contracts are generally within
thirty days
from the receipt of the invoice. Performance obligations for service revenue are considered to be satisfied as the event is completed or work is done per the terms of the related contract. Other revenues include the resale of electrical and instrumentation equipment billed upon delivery and are generally due within
thirty days
from the receipt of the invoice.
All outstanding accounts receivable, net of allowance, on the consolidated balance sheet are typically due and collected within the next
30 days
for our LNG business and
12 months
for our Power Delivery business.
Taxes assessed by a governmental authority that are directly imposed on revenue-producing transactions between the Company and its customers, such as sales, use and value-added taxes, are excluded from revenue.
The table below presents revenue disaggregated by source, for the years ended
December 31, 2019
and
2018
(in thousands):
|
Years Ended December 31,
|
|||||||
|
2019
|
2018
|
||||||
|
LNG Product
|
$
|
34,244
|
|
$
|
30,200
|
|
|
|
Rental
|
6,569
|
|
4,584
|
|
|||
|
Service
|
4,412
|
|
1,859
|
|
|||
|
Other
|
1,846
|
|
699
|
|
|||
|
$
|
47,071
|
|
$
|
37,342
|
|
||
See Note 4—Business Segments, below, for additional disaggregation of revenue.
Contract Liabilities
56
The Company recognizes revenue contract liabilities upon receipt of payments for which the performance obligations have not been fulfilled at the reporting date, resulting in deferred revenue. The following table presents the changes in the Company’s contract liabilities for the years ended December 31, 2019 and 2018 (in thousands):
|
December 31,
|
|||||||
|
2019
|
2018
|
||||||
|
Balance at beginning of year
|
$
|
93
|
|
$
|
14
|
|
|
|
Cash received, excluding amounts recognized as revenue
|
185
|
|
93
|
|
|||
|
Amounts recognized as revenue
|
(93
|
)
|
(14
|
)
|
|||
|
Balance at end of year
|
$
|
185
|
|
$
|
93
|
|
|
The Company has
no
other material contract assets or liabilities and contract costs.
4. Business Segments
The Company’s revenues are derived from
two
operating segments: LNG and Power Delivery. The LNG segment supplies LNG to the industrial, midstream, and oilfield sectors in North America and provides turnkey fuel solutions to help users of propane, diesel and other crude-based fuel products convert to LNG. The Power Delivery segment provides power delivery solutions through our subsidiary in Brazil and in China through our
40%
interest in BOMAY.
|
Year Ended December 31, 2019
|
|||||||||||
|
(in thousands)
|
|||||||||||
|
LNG
|
Power Delivery
|
Total
|
|||||||||
|
Revenues
|
$
|
43,650
|
|
$
|
3,421
|
|
$
|
47,071
|
|
||
|
Depreciation
|
9,127
|
|
144
|
|
9,271
|
|
|||||
|
Operating loss
|
(5,016
|
)
|
(414
|
)
|
(5,430
|
)
|
|||||
|
Net equity income from foreign joint ventures' operations
|
—
|
|
1,133
|
|
1,133
|
|
|||||
|
Net income (loss)
|
(6,194
|
)
|
686
|
|
(5,508
|
)
|
|||||
|
Total Assets
|
$
|
75,883
|
|
$
|
14,443
|
|
$
|
90,326
|
|
||
|
Year Ended December 31, 2018
|
|||||||||||
|
(in thousands)
|
|||||||||||
|
LNG
|
Power Delivery
|
Total
|
|||||||||
|
Revenues
|
$
|
37,342
|
|
$
|
—
|
|
$
|
37,342
|
|
||
|
Depreciation
|
8,822
|
|
—
|
|
8,822
|
|
|||||
|
Operating loss
|
(7,282
|
)
|
—
|
|
(7,282
|
)
|
|||||
|
Net equity income from foreign joint ventures' operations
|
—
|
|
—
|
|
—
|
|
|||||
|
Net loss
|
(11,086
|
)
|
—
|
|
(11,086
|
)
|
|||||
|
Total Assets
|
$
|
74,705
|
|
$
|
—
|
|
$
|
74,705
|
|
||
For the purposes of the operating segment disclosure, the Company presents operating income (loss) as it is the most comparable measure to the amounts presented on the consolidated statement of operations.
Our operating segments offer different products and services and are managed separately as business units. Cash, cash equivalents and investments are not managed centrally, so the gains and losses on foreign currency remeasurement, and interest and dividend income, are included in the segments’ results.
57
Geographic Information
|
Years Ended December 31,
|
|||||||
|
(in thousands)
|
|||||||
|
2019
|
2018
|
||||||
|
Revenues
|
|||||||
|
Brazil
|
$
|
3,421
|
|
$
|
—
|
|
|
|
Mexico
|
131
|
|
—
|
|
|||
|
United States
|
43,519
|
|
37,342
|
|
|||
|
$
|
47,071
|
|
$
|
37,342
|
|
||
|
Years Ended December 31,
|
|||||||
|
(in thousands)
|
|||||||
|
2019
|
2018
|
||||||
|
Assets
|
|||||||
|
Brazil
|
$
|
3,276
|
|
$
|
—
|
|
|
|
China
|
11,167
|
|
—
|
|
|||
|
Mexico
|
4,916
|
|
—
|
|
|||
|
United States
|
70,967
|
|
74,705
|
|
|||
|
$
|
90,326
|
|
$
|
74,705
|
|
||
5. Prepaid Expenses and Other Current Assets
The Company’s prepaid expenses and other current assets consisted of the following (in thousands):
|
December 31,
|
|||||||
|
2019
|
2018
|
||||||
|
Prepaid LNG
|
$
|
189
|
|
$
|
367
|
|
|
|
Prepaid insurance
|
698
|
|
174
|
|
|||
|
Prepaid supplier expenses
|
229
|
|
211
|
|
|||
|
Other receivables
|
1,655
|
|
672
|
|
|||
|
Deposits
|
347
|
|
578
|
|
|||
|
Other
|
465
|
|
113
|
|
|||
|
Total prepaid expenses and other current assets
|
$
|
3,583
|
|
$
|
2,115
|
|
|
58
6. Property, Plant and Equipment
The Company’s property, plant and equipment consisted of the following (in thousands):
|
December 31,
|
|||||||||
|
Estimated
Useful Life
(years)
|
2019
|
2018
|
|||||||
|
Liquefaction plants and systems
|
10 - 15
|
$
|
40,617
|
|
$
|
39,679
|
|
||
|
Real property and buildings
|
3 - 25
|
1,794
|
|
1,396
|
|
||||
|
Vehicles and tanker trailers and equipment
|
2 - 10
|
46,597
|
|
44,878
|
|
||||
|
Computer and office equipment
|
2 - 7
|
453
|
|
238
|
|
||||
|
Construction in progress
|
—
|
409
|
|
1,071
|
|
||||
|
Leasehold improvements
|
—
|
31
|
|
1
|
|
||||
|
89,901
|
|
87,263
|
|
||||||
|
Less: accumulated depreciation
|
(29,538
|
)
|
(20,657
|
)
|
|||||
|
$
|
60,363
|
|
$
|
66,606
|
|
||||
Depreciation expense for
December 31, 2019
and
2018
totaled
$9.3 million
and
$8.8 million
respectively, of which all is included in the consolidated statements of operations as its own and separate line item.
7. Goodwill
The following presents changes in goodwill during 2019 (in thousands):
|
Goodwill
|
|||
|
December 31, 2018
|
$
|
—
|
|
|
Acquisition of American Electric
|
139
|
|
|
|
Acquisition of Diversenergy
|
4,314
|
|
|
|
December 31, 2019
|
$
|
4,453
|
|
See Note 2 — Acquisitions for discussion of the acquisitions.
8. Investments in Foreign Joint Ventures
BOMAY.
As a result of the completion of the Share Exchange on July 26, 2019, the Company holds a
40%
interest in BOMAY Electric Industries Company, Ltd. (“BOMAY”) which builds electrical systems for sale in China. The majority partner in this foreign joint venture is Baoji Oilfield Machinery Co., Ltd. (a subsidiary of China National Petroleum Corporation), who owns 51%. The remaining 9% is owned by AA Energies, Inc.
The Company made
no
sales to its joint venture during
2019
.
Below is summary financial information for BOMAY at
December 31, 2019
and operational results for the period from July 27, 2019 to
December 31, 2019
in U.S. dollars (in thousands):
59
|
December 31, 2019
|
|||
|
Assets:
|
|||
|
Total current assets
|
$
|
81,247
|
|
|
Total non-current assets
|
5,775
|
|
|
|
Total assets
|
$
|
87,022
|
|
|
Liabilities and equity:
|
|||
|
Total liabilities
|
$
|
58,176
|
|
|
Total joint ventures’ equity
|
28,846
|
|
|
|
Total liabilities and equity
|
$
|
87,022
|
|
|
July 27 - December 31,
|
|||
|
2019
|
|||
|
Revenue
|
$
|
50,421
|
|
|
Gross Profit
|
7,182
|
|
|
|
Earnings
|
3,143
|
|
|
The following is a summary of activity in our investment in BOMAY for the period from July 27, 2019 to
December 31, 2019
in U.S. dollars (in thousands):
|
December 31, 2019
|
|||
|
Investments in BOMAY
(1)
|
|||
|
Balance at July 26, 2019
|
$
|
9,333
|
|
|
Undistributed earnings:
|
|||
|
Balance at July 26, 2019
|
—
|
|
|
|
Equity in earnings
|
1,257
|
|
|
|
Dividend distributions
|
—
|
|
|
|
Balance at end of period
|
1,257
|
|
|
|
Foreign currency translation:
|
|||
|
Balance at July 26, 2019
|
—
|
|
|
|
Change during the period
|
(69
|
)
|
|
|
Balance at end of period
|
(69
|
)
|
|
|
Total investment in BOMAY at December 31, 2019 (2)
|
$
|
10,521
|
|
________
|
(1)
|
Accumulated statutory reserves in equity method investments of
$2.81 million
at
December 31, 2019
is included in our investment in BOMAY. In accordance with the People’s Republic of China, (“PRC”), regulations on enterprises with foreign ownership, an enterprise established in the PRC with foreign ownership is required to provide for certain statutory reserves, namely (i) General Reserve Fund, (ii) Enterprise Expansion Fund and (iii) Staff Welfare and Bonus Fund, which are appropriated from net profit as reported in the enterprise’s PRC statutory accounts. A non-wholly-owned foreign invested enterprise is permitted to provide for the above allocation at the discretion of its board of directors. The aforementioned reserves can only be used for specific purposes and are not distributable as cash dividends.
|
|
(2)
|
At
December 31, 2019
, the Company’s investment in BOMAY of
$10.5 million
differs from the Company’s
40%
share of BOMAY’s equity of
$11.5 million
as a result of applying fair value accounting pursuant to ASC 805. The basis difference of approximately
$1.0 million
will be accreted over the remaining
nine
year life of the joint venture. The Company's accretion during the year ended
December 31, 2019
totaled approximately
$54 thousand
and is included in income from equity investments in foreign joint ventures in the accompanying consolidated statement of operations.
|
The Company accounts for its investment in BOMAY using the equity method of accounting. Under the equity method, the Company’s share of the joint venture operations earnings or losses is recognized in the consolidated statements of operations as equity income (loss) from foreign joint venture operations. Joint venture income increases the carrying value of the joint venture
60
and joint venture losses reduce the carrying value. Dividends received from the joint venture reduce the carrying value. In accordance with our long-lived asset policy, when events or circumstances indicate the carrying amount of an asset may not be recoverable, management tests long-lived assets for impairment. If the estimated future cash flows are projected to be less than the carrying amount, an impairment write-down (representing the carrying amount of the long-lived asset which exceeds the present value of estimated expected future cash flows) would be recorded as a period expense. In making this evaluation, a variety of quantitative and qualitative factors are considered including national and local economic, political and market conditions, industry trends and prospects, liquidity and capital resources and other pertinent factors. Based on this evaluation for this reporting period, the Company does not believe an impairment adjustment is necessary at
December 31, 2019
.
Energía Superior.
On August 20, 2019, we completed the formation of Energía Superior, a joint venture with CryoMex, to pursue investments in distributed natural gas production and distribution assets in Mexico. CryoMex is controlled by Grupo CLISA, a Monterrey, Mexico-based developer and operator of businesses in multiple end markets including energy. We own a
50%
interest in Energía Superior.
As of
December 31, 2019
, the Company has not made any material investments in Energía Superior.
9. Accrued Liabilities
The Company’s accrued liabilities consisted of the following (in thousands):
|
December 31,
|
|||||||
|
2019
|
2018
|
||||||
|
Compensation and benefits
|
$
|
2,641
|
|
$
|
907
|
|
|
|
Professional fees
|
131
|
|
827
|
|
|||
|
LNG fuel and transportation
|
1,582
|
|
612
|
|
|||
|
Accrued interest
|
134
|
|
220
|
|
|||
|
Other taxes payable
|
163
|
|
100
|
|
|||
|
Contract liabilities
|
185
|
|
93
|
|
|||
|
Other operating expenses
|
182
|
|
276
|
|
|||
|
Total accrued liabilities
|
$
|
5,018
|
|
$
|
3,035
|
|
|
10. Debt
The Company’s carrying value of debt consisted of the following (in thousands):
|
December 31,
|
|||||||
|
2019
|
2018
|
||||||
|
Secured term note payable
|
$
|
2,077
|
|
$
|
9,077
|
|
|
|
Secured promissory note - related party
|
5,000
|
|
—
|
|
|||
|
Insurance and other notes payable
|
558
|
|
121
|
|
|||
|
Less: amounts due within one year
|
(1,558
|
)
|
(2,621
|
)
|
|||
|
Total long-term debt
|
$
|
6,077
|
|
$
|
6,577
|
|
|
Secured Term Note Payable
On September 30, 2013, Stabilis LNG Eagle Ford, LLC ("Stabilis LNG EF") entered into a Secured Term Note Payable with Chart Energy & Chemicals, Inc. (“Chart E&C”), a Delaware corporation and subsidiary of Chart, in connection with a Master Sales Agreement whereby Chart E&C agreed to sell Stabilis LNG EF certain equipment for its liquefaction plant. The total value of the agreement was not to exceed
$20.5 million
and was billed in advances based on a “Milestone Payment Schedule”. The note contained various covenants that limit Stabilis LNG EF’s ability to grant certain lines, incur additional indebtedness, guarantee or become contingently liable for obligations of any person except for those allowed by Chart E&C, merge or consolidate into or with a third party or engage in certain asset dispositions and acquisitions, pay dividends or make distributions, transact with affiliates, prepayment of indebtedness, and issue additional equity interests. Further, the Master Sales Agreement was secured by a
$20.0 million
equity interest and first lien on all plant assets including land. Borrowings bear interest on the outstanding principal at the rate of
3.0%
plus the London interbank offered rate (
4.7%
at
December 31, 2019
).
61
The Secured Term Note Payable was amended on August 21, 2017 whereby only the payment terms of principal and interest were modified to be payable in
eight
installments as follows: (i)
$2.5 million
plus accrued interest due on August, 24, 2017, (ii)
$2.5 million
plus accrued interest due on August 24, 2018, (iii)
$2.5 million
plus accrued interest due on August 24, 2019, (iv)
four
equal payments of
$1.5 million
plus accrued interest on each anniversary date of August 24, 2019 thereafter, (v) and
$0.6 million
plus accrued interest on the remaining unpaid balance of the Amended Secured Term Note Payable on August 24, 2024. In the event all principal and interest is paid in full by August 24, 2023, an additional payment of
$2.2 million
is to be forgiven.
On August 5, 2019, we entered into an exchange agreement (the “Exchange Agreement”) with Chart E&C, Stabilis LLC, and Stabilis LNG EF for the satisfaction of indebtedness of Stabilis LNG to Chart E&C in the principal amount of
$7 million
(the “Exchanged Indebtedness”) in exchange for unregistered shares of our common stock (such transactions, the “Chart Transaction”). We issued to Chart E&C
1,470,807
shares of Company common stock, based on the per share price of Company common stock of
90%
of the average of the dollar volume-weighted average prices per share of the common stock as calculated by Bloomberg for each of the
five
consecutive trading days ending on and including the third trading day immediately preceding the closing date, which took place on August 30, 2019. At closing, Stabilis LNG EF also paid to Chart E&C an amount in cash equal to the accrued and unpaid interest on the Exchanged Indebtedness due through the closing, plus a cash amount to be paid in lieu of the issuance of fractional shares of our Common Stock. Management determined the modifications to be substantial and pursuant to ASC 470, the transaction was treated as a debt extinguishment for accounting purposes. Accordingly, the Company recognized a gain on extinguishment of debt of
$0.1 million
, which is included in Other Income in the accompanying Consolidated Statement of Operations. The exchange agreement released certain collateral (including the Company’s LNG plant) and removed certain covenants of the original Note Payable.
On September 11, 2019, we entered into Amendment No. 1 to the Exchange Agreement, which eliminated the right of Chart E&C to elect an additional exchange of all or any portion of the balance of the unpaid principal amount of the Note. The Exchange Agreement previously provided for Chart E&C to elect an additional exchange, on a second closing date, of all or any portion of the balance of the unpaid principal amount of the Note, for additional shares of our common stock based on the foregoing pricing calculation related to the closing date.
Secured Promissory Note
On August 16, 2019, the Company issued a Secured Promissory Note to M/G Finance Co., Ltd., a related party, in the principal amount of
$5 million
, at an interest rate per annum of
6%
until December 10, 2020, and
12%
thereafter. The debt payments are interest only through December 2020 followed by monthly principal and interest payments through December 2022. The debt is secured by certain pieces of the Company’s equipment valued at
$5 million
. See Note 12—Related Party Transactions for further discussion of the Promissory Note.
Insurance Notes Payable
The Company finances its annual commercial insurance premiums for its business and operations with a finance company. The dollar amount financed was
$0.5 million
for the 2019 to 2020 policy. The outstanding principal balance on the premium finance note was
$0.1 million
at
December 31, 2018
and
$0.3 million
at
December 31, 2019
. The renewal occurred in August 2019 and covers a period of up to one year. The Company makes equal monthly payments of principal and interest over the term of the notes which are generally
10 months
in term. The interest rate for the
2018
to
2019
insurance policy was
5.4%
. The interest rate for the
2019
to
2020
insurance policy is
6.2%
. The note is secured.
Term Loan Facility
In connection with the acquisition of American Electric (see Note 2—Acquisitions), the Company assumed a loan facility between M&I Brazil, a subsidiary, and an employee and director of the Company. The loan facility provides the Company with a
$0.3 million
loan facility of which
$0.2 million
is drawn and is outstanding as of
December 31, 2019
. All outstanding amounts, including accrued but unpaid interested, are due in
June 2020
. Under the loan agreement, the interest rate on the loan facility is
10.0%
, per annum, payable each quarter. The loan facility is secured by the assets held by M&I Brazil.
Unsecured Term Note Payable
The Company also assumed a short-term financing arrangement between M&I Brazil and Santander Bank, which was used to finance project expenditures. The loan is due
March 2020
, with an interest rate of
11.88%
. At
December 31, 2019
, the outstanding balance is
$41 thousand
.
Notes Payable - Related Parties
As of January 1, 2018, Stabilis LLC had related party debt from its members and other related party creditors totaling
$48.7 million
. In November 2018, Stabilis LLC, its members and other related party creditors entered into a Contribution and Exchange
62
Agreement, whereby the related party debt was exchanged for membership interests in Stabilis LLC, as further discussed in Note 15—Stockholders’ Equity.
We had total indebtedness of
$7.6 million
in principal as of
December 31, 2019
with the expected maturities as follows (in thousands).
|
December 31, 2019
|
|||
|
2020
|
$
|
1,558
|
|
|
2021
|
3,428
|
|
|
|
2022
|
2,649
|
|
|
|
2023
|
—
|
|
|
|
2024
|
—
|
|
|
|
Thereafter
|
—
|
|
|
|
Total long-term debt, including current maturities
|
$
|
7,635
|
|
11. Leases
We determine if an arrangement is a lease at inception. Leases with an initial term of
12 months
or less are not recorded in our consolidated balance sheet unless it is reasonably certain we will renew the lease. All leases with an initial term greater than
12 months
, whether classified as operating or finance, are recorded to our consolidated balance sheet based on the present value of lease payments over the lease term, determined at lease commencement. Determination of the present value of lease payments requires a discount rate. We use the implicit rate in the lease agreement when available. Most of our leases do not provide an implicit interest rate: therefore, we use a weighted average borrowing rate based on the information available at the commencement date. Certain of our leases contain non-lease components which are not separated from the lease components when calculating the right-of-use asset and lease liability per our use of the practical expedient to combine both components of an arrangement for all classes of leased assets.
Our lease portfolio primarily consists of operating leases for certain facilities and office spaces, and financing leases for equipment. Our leases have remaining terms of
1 year
to
5 years
and may include options to extend or terminate the lease when it is reasonably certain that we will exercise that option. The operating lease asset also includes any upfront lease payments made and excludes lease incentives and initial direct cost incurred. Lease expense for operating leases is recognized on a straight-line basis over the lease term.
The following table summarizes the supplemental balance sheet information related to lease assets and lease liability obligations as of
December 31, 2019
(in thousands):
|
Classification
|
December 31, 2019
|
||||
|
Assets
|
|||||
|
Operating lease assets
|
Operating lease right-of-use assets
|
$
|
965
|
|
|
|
Finance lease assets
|
Property and equipment, net of accumulated depreciation
|
9,302
|
|
||
|
Total lease assets
|
10,267
|
|
|||
|
Liabilities
|
|||||
|
Current
|
|||||
|
Operating
|
Current portion of operating lease obligations
|
364
|
|
||
|
Finance
|
Current portion of finance lease obligation
|
3,440
|
|
||
|
Noncurrent
|
|||||
|
Operating
|
Operating lease liabilities
|
650
|
|
||
|
Finance
|
Finance lease obligations,—related parties, net of current portion
|
648
|
|
||
|
Total lease liabilities
|
$
|
5,102
|
|
||
63
The following table summarizes the components of lease expense for the year ended
December 31, 2019
(in thousands):
|
Lease Cost
|
Classification
|
December 31,
|
||||||||
|
2019
|
2018
|
|||||||||
|
Operating lease cost
|
Cost of sales
|
$
|
155
|
|
$
|
—
|
|
|||
|
Operating lease cost
|
Selling, general and administrative expenses
|
240
|
|
—
|
|
|||||
|
Finance lease cost
|
||||||||||
|
Amortization of leased assets
|
Depreciation expense
|
1,171
|
|
1,035
|
|
|||||
|
Interest on lease liabilities
|
Interest expense
|
644
|
|
730
|
|
|||||
|
Net lease cost
|
$
|
2,210
|
|
$
|
1,765
|
|
||||
In 2014, the Company entered into a
five
year non-cancelable operating lease for an office in Denver, Colorado. In January 2019, the Company amended its operating lease for the Denver, Colorado office relocating to a smaller office suite and reducing the lease expense for the remainder of the term. The total rent expense incurred under the lease for the years ended
December 31, 2019
and
2018
totaled
$92 thousand
and
$229 thousand
, respectively. In February of 2018, the Company began to sublease a portion of the office space to a subsidiary of TMG for
$5 thousand
a month through December 2018 and
$2 thousand
a month beginning January 2019 (see Note 12—Related Party Transactions for further discussion).
In December 2018, the Company entered into a
one year
lease for equipment used at our liquefaction plant in George West, Texas. The lease called for monthly payments of
$13 thousand
through December 31, 2019.
In January 2019, the Company extended its lease for
one year
for yard space from an unrelated party in Fort Lupton, Colorado. The lease called for monthly payments of
$2 thousand
through December 31, 2019. The Company subleased the yard space to a subsidiary of TMG during 2018 (see Note 12—Related Party Transactions for further discussion).
The Company leases certain buildings and facilities, including office space in Bellevue, Washington; Houston, Texas; and certain equipment under non-cancellable operating leases expiring at various dates through 2022. M&I Brazil leases offices and facilities in
three
cities in Brazil that are under operating lease agreements. The leases expire at various dates through January 2022. The assets and liabilities are recognized at the commencement date based on the present value of remaining lease payments based on Brazil’s General Market Price Index rate. Brazil also has multiple short-term equipment leases which are less than twelve months and have no cancellation penalties, therefore they are not recorded in the balance sheet.
Rent expense totaled approximately
$298 thousand
and
$872 thousand
for the years ended
December 31, 2019
and
2018
, respectively.
The following schedule presents the future minimum lease payments for our operating and finance lease obligations at
December 31, 2019
(in thousands):
|
Operating
Leases |
Finance
Leases |
Total
|
|||||||||
|
2020
|
$
|
421
|
|
$
|
3,811
|
|
$
|
4,232
|
|
||
|
2021
|
252
|
|
647
|
|
899
|
|
|||||
|
2022
|
175
|
|
—
|
|
175
|
|
|||||
|
2023
|
145
|
|
—
|
|
145
|
|
|||||
|
2024
|
149
|
|
—
|
|
149
|
|
|||||
|
Thereafter
|
26
|
|
—
|
|
26
|
|
|||||
|
Total lease payments
|
1,168
|
|
4,458
|
|
5,626
|
|
|||||
|
Less: Interest
|
(154
|
)
|
(370
|
)
|
(524
|
)
|
|||||
|
Present value of lease liabilities
|
$
|
1,014
|
|
$
|
4,088
|
|
$
|
5,102
|
|
||
Lease term and discount rates for our operating and finance lease obligations are as follows:
64
|
Lease Term and Discount Rate
|
December 31, 2019
|
||
|
Weighted-average remaining lease term (years)
|
|||
|
Operating leases
|
3.7
|
|
|
|
Finance leases
|
1
|
|
|
|
Weighted-average discount rate
|
|||
|
Operating leases
|
7.3
|
%
|
|
|
Finance leases
|
9.1
|
%
|
|
The following table summarizes the supplemental cash flow information related to leases as of
December 31, 2019
:
|
Other information
|
December 31, 2019
|
|||
|
(In thousands)
|
||||
|
Cash paid for amounts included in the measurement of lease liabilities
|
||||
|
Operating cash flows from operating leases
|
$
|
298
|
|
|
|
Financing cash flows from finance leases
|
3,491
|
|
||
|
Interest paid
|
644
|
|
||
|
Noncash activities from right-of-use assets obtained in exchange for lease obligations:
|
||||
|
Operating leases
|
$
|
1,208
|
|
|
12. Related Party Transactions
Finance Lease Obligations
On December 1, 2019, the Company refinanced its lease agreement with a subsidiary of The Modern Group, Ltd. (“The Modern Group”) for equipment purchases totaling approximately
$3.2 million
. Under the terms of the lease agreement, the Company’s monthly principal and interest payments are
$232 thousand
for the remaining
12
month term at an annual rate of
8.9%
. An upfront fee payment of
$131 thousand
is due July 1, 2020 and the remaining outstanding lease obligation of approximately
$646 thousand
is due by January 25, 2021. The following individuals serve in various leadership capacities for The Modern Group: Casey Crenshaw (our Executive Chairman and Chairman of our Board) as President, Will Crenshaw (a member of our Board) as Chairman and Chief Executive Officer, and Ben Broussard (a member of our Board) as Director of Finance and as COO of M/G Finance Co., Ltd., a subsidiary of The Modern Group. Casey Crenshaw is the beneficial owner of
25%
of the Modern Group and is deemed to jointly control The Modern Group with family members.
During 2018, Stabilis LLC entered into lease agreements with a subsidiary of The Modern Group to finance vehicles and machinery and equipment totaling approximately
$1.5 million
. Under the terms of the leases, the balance is due in equal monthly installments over
24 months
at an annual interest rate of
10%
.
The Company’s carrying value of finance lease obligations to related parties consisted of the following (in thousands):
|
December 31,
|
|||||||
|
2019
|
2018
|
||||||
|
Finance lease obligations with subsidiary of The Modern Group, Ltd
|
$
|
4,088
|
|
$
|
7,246
|
|
|
|
Less: amounts due within one year
|
(3,440
|
)
|
(3,879
|
)
|
|||
|
Total long term finance lease obligations to related parties
|
$
|
648
|
|
$
|
3,367
|
|
|
Secured Term Note Payable
The Company has a Secured Term Note Payable with Chart E&C in the principal amount of
$2.1 million
, at the rate of
3.0%
plus the London interbank offered rate (
4.7%
at
December 31, 2019
), in connection with a Master Sales Agreement whereby Chart E&C agreed to sell the Company certain equipment for its liquefaction plant. See Note 10—Debt for further discussion of the Note Payable.
65
Secured Promissory Note
On August 16, 2019, the Company issued a Secured Promissory Note to M/G Finance Co., Ltd. in the principal amount of
$5.0 million
, at an interest rate per annum of
6%
until December 10, 2020, and
12%
thereafter. Casey Crenshaw, our Executive Chairman and Chairman of our Board, serves as the President of M/G Finance Co., Ltd. M/G Finance Co. Ltd. is a subsidiary of The Modern Group. See Note 10—Debt for further discussion of the Promissory Note.
Term Loan Facility
In connection with the acquisition of American Electric (see Note 2—Acquisition), the Company assumed a loan facility between M&I Brazil, a subsidiary, and an employee and director of the Company. The loan facility provides the Company with a
$0.3 million
loan facility of which
$0.2 million
is drawn and is outstanding as of
December 31, 2019
. All outstanding amounts, including accrued but unpaid interested, are due in
June 2020
. Under the loan agreement, the interest rate on the loan facility is
10.0%
, per annum, payable each quarter. The loan facility is secured by the assets held by M&I Brazil.
Operating Leases
The Company subleases land in Fort Lupton, Colorado to a subsidiary of The Modern Group. During both the years ended
December 31, 2019
and
2018
, amounts billed to The Modern Group under the agreement totaled
$10 thousand
and
$12 thousand
, respectively.
The Company subleases space in Denver, Colorado to a subsidiary of The Modern Group. During the years ended
December 31, 2019
and
2018
, the Company billed
$24 thousand
and
$55 thousand
, respectively, to The Modern Group under the agreement.
Payroll and Benefits
The Company utilized payroll and benefit resources from The Modern Group. During the years ended
December 31, 2019
and
2018
, the Company incurred expenses of
$4 thousand
and
$13 thousand
for processing and administrative charges associated with payroll processing.
Other Purchases and Sales
The Company has issued a purchase order to Applied Cryo Technologies, Inc. (“ACT”), a company owned
51%
by Crenshaw Family Holdings International, Inc., for equipment totaling
$302 thousand
. The Company expects to take delivery of equipment late in
2019
. During the years ended
December 31, 2019
and
2018
, the Company also paid ACT
$145 thousand
and
$63 thousand
, respectively, for equipment repairs and services. The Company also sold
$4 thousand
of LNG to ACT during 2019. As of
December 31, 2019
we had
$4 thousand
due from ACT included in accounts receivable on the consolidated balance sheets. There was
no
receivable due from ACT as of
December 31, 2018
. As of
December 31, 2019
and
2018
, respectively, we had
$24 thousand
and
$5 thousand
due to ACT included in accounts payable on the consolidated balance sheets.
The Company purchases supplies and services from a subsidiary of The Modern Group. During the years ended
December 31, 2019
and
2018
, purchases from The Modern Group totaled
$175 thousand
and
$47 thousand
, respectively. The Company also sold
$52 thousand
and
$133 thousand
of supplies and services to The Modern Group in 2019 and 2018, respectively. There was
no
receivable due from The Modern Group as of
December 31, 2019
. As of
December 31, 2018
, we had
$4 thousand
due from The Modern Group included in accounts receivable on the consolidated balance sheets. As of
December 31, 2019
and
2018
, respectively, we had
$22 thousand
and
$29 thousand
due to The Modern Group included in accounts payable on the consolidated balance sheets.
The Company purchases services from Chart E&C. During the years ended
December 31, 2019
and
2018
, purchases from Chart E&C totaled
$80 thousand
and
$35 thousand
. As of
December 31, 2019
we had
$8 thousand
due to Chart E&C included in accounts payable on the consolidated balance sheets. There was
no
payable due to Chart E&C as of
December 31, 2018
.
66
13. Commitments and Contingencies
Environmental Matters
The Company is subject to federal, state and local environmental laws and regulations. The Company does not anticipate any expenditures to comply with such laws and regulations that would have a material impact on the Company’s consolidated financial position, results of operations or liquidity. The Company believes that its operations comply, in all material respects, with applicable federal, state and local environmental laws and regulations.
Litigation, Claims and Contingencies
The Company may become party to various legal actions that arise in the ordinary course of its business. The Company is also subject to audit by tax and other authorities for varying periods in various federal, state and local jurisdictions, and disputes may arise during the course of these audits. It is impossible to determine the ultimate liabilities that the Company may incur resulting from any of these lawsuits, claims, proceedings, audits, commitments, contingencies and related matters or the timing of these liabilities, if any. If these matters were to ultimately be resolved unfavorably, it is possible that such an outcome could have a material adverse effect upon the Company’s consolidated financial position, results of operations, or liquidity. The Company, does not, however, anticipate such an outcome and it believes the ultimate resolution of these matters will not have a material adverse effect on the Company’s consolidated financial position, results of operations, or liquidity. Additionally, the Company currently expenses all legal costs as they are incurred.
In October 2018, American Electric received notification of a potential liability of
$4.3 million
associated with an asset purchase agreement to sell substantially all of its U.S. business assets and operations to Myers Power Products, Inc. ("Myers"). The contractual terms of the agreement included a provision for true-up of the net working capital, estimated as of the date of closing, to actual working capital as calculated by Myers and agreed to by American Electric. Any difference in the actual (conclusive) net working capital in relation to the estimated working capital at closing results in an adjustment to the purchase price. American Electric received notification from Myers of their actual working capital calculation. In the notification, Myers communicated a decrease of approximately
$4.3 million
in net working capital, in comparison to the estimated working capital used at contract closing. The contractual terms of the transaction provided that in the event Myers and American Electric could not agree to a conclusive net working capital adjustment, then all items remaining in dispute shall be submitted by either one of the parties within thirty (30) calendar days after the expiration of the resolution period to a national or regional independent accounting firm mutually acceptable to Myers and American Electric (the "Neutral Arbitrator"). The Neutral Arbitrator shall act as an arbitrator to determine the conclusive net working capital. The conclusive net working capital, once determined, may result in a purchase price adjustment due to Myers or to the Company. As of
December 31, 2019
, there have not been any updates to the potential liability. The Company is working with legal counsel to resolve the matter.
In January of 2020, the Company received notification that its Subsidiary, M&I Electric Industries, Inc. (“M&I”) has been named as a defendant in a class action lawsuit “Pelton Ray Barrett, et al. v. Arkema, Inc., et al.” as the result of a fire on August 31, 2017, on a site owned or operated by Arkema, Inc. allegedly resulting in chemical exposure. Other defendants in the suit, including M&I are alleged to have been responsible for the installation, repair, design, and/or maintenance of the electrical, refrigeration and environmental systems required to mitigate damages from the release of chemicals. The Company, through its insurance providers, has engaged outside legal counsel to defend against these claims. The Company believes the ultimate resolution of this matter will not have a material adverse impact of the Company’s consolidated financial position, results of operations, or liquidity.
67
14. Concentration of Risks
Significant Customers
A material part of the Company’s business is dependent on a few customers, the loss of which could have a material adverse effect on the Company. The following table presents customers representing greater than 10% of total revenues and/or outstanding receivable as of and for the years ended
December 31, 2019
and
2018
(in thousands):
|
Consolidated
|
Revenue
|
%
|
Accounts
Receivable |
%
|
|||||||||
|
2019:
|
|
|
|
|
|||||||||
|
Customer 1
|
$
|
9,270
|
|
20
|
%
|
$
|
1,172
|
|
19
|
%
|
|||
|
|
$
|
9,270
|
|
20
|
%
|
$
|
1,172
|
|
19
|
%
|
|||
|
2018:
|
|||||||||||||
|
Customer 1
|
$
|
9,710
|
|
26
|
%
|
$
|
998
|
|
23
|
%
|
|||
|
Customer 2
|
4,451
|
|
12
|
|
113
|
|
3
|
|
|||||
|
|
$
|
14,161
|
|
38
|
%
|
$
|
1,111
|
|
26
|
%
|
|||
|
LNG Segment
|
Revenue
|
%
|
Accounts
Receivable |
%
|
|||||||||
|
2019:
|
|
|
|
|
|||||||||
|
Customer 1
|
$
|
9,270
|
|
21
|
%
|
$
|
1,172
|
|
23
|
%
|
|||
|
Customer 2
|
4,206
|
|
10
|
|
—
|
|
—
|
|
|||||
|
|
$
|
13,476
|
|
31
|
%
|
$
|
1,172
|
|
23
|
%
|
|||
|
2018:
|
|||||||||||||
|
Customer 1
|
$
|
9,710
|
|
26
|
%
|
$
|
998
|
|
23
|
%
|
|||
|
Customer 2
|
4,451
|
|
12
|
|
113
|
|
3
|
|
|||||
|
|
$
|
14,161
|
|
38
|
%
|
$
|
1,111
|
|
26
|
%
|
|||
|
Power Delivery Segment
|
Revenue
|
%
|
Accounts
Receivable |
%
|
|||||||||
|
2019:
|
|
|
|
|
|||||||||
|
Customer 1
|
$
|
472
|
|
14
|
%
|
$
|
51
|
|
6
|
%
|
|||
|
Customer 2
|
407
|
|
12
|
|
103
|
|
11
|
|
|||||
|
|
$
|
879
|
|
26
|
%
|
$
|
154
|
|
17
|
%
|
|||
|
2018:
|
|||||||||||||
|
Customer 1
|
$
|
—
|
|
—
|
%
|
$
|
—
|
|
—
|
%
|
|||
|
Customer 2
|
—
|
|
—
|
|
—
|
|
—
|
|
|||||
|
|
$
|
—
|
|
—
|
%
|
$
|
—
|
|
—
|
%
|
|||
No other customer represented more than 10% of the Company’s total revenue for the years ended
December 31, 2019
and
2018
. Based upon the expected collectability of our accounts receivable, management believed all balances were fully collectible such that no allowance for doubtful accounts was deemed necessary.
15. Stockholders’ Equity
On November 28, 2018, Stabilis LLC's members and related party creditors entered into a two-step Contribution and Exchange Agreement to form LNG Investment and restructure the capitalization of Stabilis LLC which resulted in the following transactions.
On November 30, 2018, Stabilis LLC's members contributed
1,000
membership units in Stabilis LLC having a carrying amount of
$20 million
to LNG Investment in exchange for
2,000
Class B units having a carrying amount of
$20 million
in LNG Investment. The contribution and exchange of units resulted in Stabilis LLC becoming a wholly owned subsidiary of LNG Investment. Subsequently, Stabilis LLC's members and related party creditors, holders of an aggregate net carrying amount of
$48.7 million
of indebtedness, contributed their individual indebtedness to LNG Investment in exchange for Class A units in proportion to th
68
eir percentage of indebtedness in total. An aggregate of
4,874.28
Class A units were issued by LNG Investment to the related party creditors of the Company having a carrying amount of
$48.7 million
.
On December 17, 2018, Stabilis LLC entered into a definitive share exchange agreement with American Electric to enter into a business combination transaction. Under the terms of the agreement, Stabilis LLC’s owners were to contribute
100%
of their outstanding membership units to American Electric in exchange for American Electric common stock resulting in Stabilis LLC and its subsidiaries becoming subsidiaries of American Electric.
On July 26, 2019, we completed the Share Exchange by which American Electric acquired
100%
of the outstanding limited liability company interests of Stabilis LLC from LNG Investment and
20%
of the outstanding limited liability company interests of PEG from AEGIS. The remaining
80%
of the outstanding limited liability company interests of PEG are owned directly by Stabilis LLC. As a result, Stabilis LLC became a
100%
directly-owned subsidiary and PEG became a
100%
indirectly-owned subsidiary of American Electric. Under the Share Exchange Agreement entered into on December 17, 2018 and amended on May 8, 2019, American Electric issued
13,178,750
shares of common stock to acquire Stabilis LLC, which represented
90%
of the total amount of the common stock of American Electric which was issued and outstanding as of July 26, 2019. The Share Exchange resulted in a change of control of American Electric to be controlled by Casey Crenshaw by virtue of his beneficial ownership of
88.4%
of the common stock of American Electric to be outstanding as of July 26, 2019.
The Consolidated Statements of Stockholders’ Equity presents the historical equity of Stabilis, retrospectively adjusted to the equity structure of American Electric prior to the reverse merger. The share amounts presented reflect the restated number of shares using the exchange ratio established in the Share Exchange Agreement.
Issuances of Common Stock
The Company is authorized to issue up to
37,500,000
shares of Common Stock,
$0.001
par value per share.
On August 20, 2019, we issued
684,963
shares of our common stock valued at
$3.0 million
to Diversenergy as partial consideration for the completion of our acquisition of Diversenergy.
On August 30, 2019, we issued
1,470,807
shares of our common stock to Chart E&C in exchange for the satisfaction of indebtedness in the principal amount of
$7 million
.
Issuances of Warrants
Except as otherwise noted, all issuance of common stock and warrants reflect the 1:
8
reverse stock split effective July 29, 2019.
As of
December 31, 2019
, we had outstanding Warrants to purchase
103,125
shares of our common stock as follows:
|
Date of Issuance
|
No. of Warrants
|
Exercise Price
|
Expiration Date
|
|||
|
May 2, 2012
|
15,625
|
$21.76
|
May 22, 2020
|
|||
|
May 2, 2012
|
25,000
|
$25.36
|
May 22, 2020
|
|||
|
Nov. 13, 2017
|
62,500
|
$18.08
|
Nov. 13, 2022
|
|||
The 2012 Warrants were issued in connection with the purchase of
$5 million
of the Company’s Series A Convertible Preferred Stock, since converted to common stock, by an affiliate of Casey Crenshaw and they are beneficially owned by Mr. Crenshaw. The 2017 Warrants were issued to an unaffiliated party in connection with a financing transaction. All of the Warrants have a cashless exercise option. The 2012 Warrants have an anti-dilution feature that may result in a lower exercise price in the event the Company engages in certain stock issuances at a lower price than the current Warrant exercise price, including in connection with certain acquisition transactions.
16. Stock-Based Compensation
On December 9, 2019, the Board of Directors of the Company adopted the 2019 Long Term Incentive Plan (the “2019 Plan”). The 2019 Plan provides for the award of Stock Options, Stock Appreciation Rights, Restricted Stock, Restricted Stock Units, Stock Awards, Dividend Equivalents, Other Stock-Based Awards, Cash Awards, Substitute Awards and Performance Awards. Awards may
69
be granted under the 2019 Plan to employees, officers and directors of the Company and our Affiliates, and any other person who provides services to the Company or any of our Affiliates.
The 2019 Plan succeeds our 2007 Employee Stock Incentive Plan (the “2007 Plan”) and no further shares will be issued under the 2007 Plan.
The maximum number of shares of common stock available for issuance under the 2019 Plan is
1,675,000
shares.
As of
December 31, 2019
, no awards have been granted under the 2019 Plan.
17. Redeemable Convertible Preferred Stock
As a result of the completion of the Share Exchange, our Board of Directors has the authority, without stockholder approval, to issue up to
1,000,000
shares of Preferred Stock,
$.001
par value. The authorized Preferred Stock may be issued by the Board of Directors in one or more series and with the rights, privileges and limitations of the Preferred Stock determined by the Board of Directors. The rights, preferences, powers and limitations of different series of Preferred Stock may differ with respect to dividend rates, amounts payable on liquidation, voting rights, conversion rights, redemption provisions, sinking fund provisions, and other matters. As of
December 31, 2019
, we have
no
Preferred Stock outstanding.
18. Employee Benefits
The Company has established a savings plan ("Savings Plan") which is qualified under Section 401(k) of the Internal Revenue Code. Eligible employees may elect to make contributions to the Savings Plan through salary deferrals of up to
90%
of their base pay, subject to Internal Revenue Code limitations. The Company contributes to the Savings Plans, subject to limitations. For the years ended
December 31, 2019
and
2018
, the Company contributed
$124 thousand
and
$57 thousand
, respectively, in matching contributions to the Savings Plan.
19. Income Taxes
The components for income tax expense included in the accompanying consolidated statements of operations for the years ended
December 31, 2019
and
2018
are as follows (in thousands):
|
December 31, 2019
|
December 31, 2018
|
||||||
|
Current state income tax expense
|
$
|
38
|
|
$
|
—
|
|
|
|
Current foreign income tax expense
|
78
|
|
—
|
|
|||
|
Deferred federal income tax expense
|
—
|
|
—
|
|
|||
|
Total income tax expense
|
$
|
116
|
|
$
|
—
|
|
|
A reconciliation of income taxes computed using the 21% U.S. federal statutory rate to the amount reflected in the accompanying consolidated statement of operations for the years ended
December 31, 2019
and
2018
is as follows (in thousands):
|
December 31, 2019
|
December 31, 2018
|
||||||
|
Income tax benefit using U.S. federal statutory rate
|
$
|
1,397
|
|
$
|
2,328
|
|
|
|
State income tax expense
|
(30
|
)
|
—
|
|
|||
|
Foreign income tax expense
|
(78
|
)
|
—
|
|
|||
|
Non-deductible expenses
|
(66
|
)
|
(17
|
)
|
|||
|
Change in valuation allowance
|
(1,306
|
)
|
(2,311
|
)
|
|||
|
Other
|
(33
|
)
|
—
|
|
|||
|
$
|
(116
|
)
|
$
|
—
|
|
||
70
The effects of temporary differences and carryforwards that give rise to deferred tax assets (liabilities) are as follows (in thousands):
|
December 31, 2019
|
December 31, 2018
|
||||||
|
Federal net operating loss carryforward
|
$
|
11,468
|
|
$
|
10,876
|
|
|
|
Accrued interest to related parties, not deductible until paid
|
449
|
|
334
|
|
|||
|
Accrued compensation
|
101
|
|
—
|
|
|||
|
Basis of intangible assets
|
368
|
|
221
|
|
|||
|
Valuation allowance
|
(5,256
|
)
|
(3,950
|
)
|
|||
|
Total deferred tax assets
|
7,130
|
|
7,481
|
|
|||
|
Basis of property, plant and equipment
|
6,821
|
|
7,447
|
|
|||
|
Bad debt expense
|
—
|
|
34
|
|
|||
|
Prepaid expenses
|
138
|
|
—
|
|
|||
|
Basis in foreign entity
|
171
|
|
—
|
|
|||
|
Total deferred tax liabilities
|
7,130
|
|
7,481
|
|
|||
|
Net deferred tax liabilities
|
$
|
—
|
|
$
|
—
|
|
|
At
December 31, 2019
, the Company has net operating loss carry forwards of approximately
$53.6 million
which may be used to offset future taxable income. The net operating loss carryforwards includes
$42.8 million
of losses arising prior to December 31, 2017 that expire in 2028 through 2037. Those arising in tax years after 2017 can be carried forward indefinitely. Also, for losses arising in taxable years beginning after December 31, 2017 the operating loss deduction is limited to 80% of taxable income (determined without regard to the deduction). Since the Company has not yet generated significant taxable income, a valuation allowance has been established to fully reserve the Company's net deferred tax assets at
December 31, 2019
. A change in ownership eliminated substantially all net operating loss carryforwards of an acquired subsidiary at July 26, 2019. The elimination of those loss carryforwards is shown above as a section 382 limitation.
The Company files a consolidated tax return with its subsidiary companies and provides income taxes as if the Company filed a consolidated return. The provision for estimated income taxes is based on elements of income and expense reported in the consolidated statement of income.
As of
December 31, 2019
, the Company's tax returns for years 2015 to 2018 remain subject to examination for both federal and state filings.
ITEM 9. CHANGES IN AND DISAGREEMENTS WITH ACCOUNTANTS ON ACCOUNTING AND FINANCIAL DISCLOSURE.
None.
ITEM 9A. CONTROLS AND PROCEDURES
Evaluation of Disclosure Controls and Procedures
As required by Rule 13a-15(b) of the Exchange Act, we have evaluated, under the supervision and with the participation of our management, including our principal executive officer and principal financial officer, the effectiveness of the design and operation of our disclosure controls and procedures (as defined in Rules 13a-15(e) and 15d-15(e) under the Exchange Act) as of the end of the period covered by this report. Our disclosure controls and procedures are designed to provide reasonable assurance that the information required to be disclosed by us in reports that we file or submit under the Exchange Act is accumulated and communicated to our management, including our principal executive officer and principal financial officer, as appropriate, to allow timely decisions regarding required disclosure and is recorded, processed, summarized and reported within the time periods specified in the rules and forms of the SEC. Based upon the evaluation, our principal executive officer and principal financial officer have concluded that our disclosure controls and procedures were effective at
December 31, 2019
at the reasonable assurance level.
Material Weakness in Internal Control Over Financial Reporting
71
In connection with its evaluation of the internal control over financial reporting for the year ended December 31, 2018, management identified deficiencies which collectively represent a material weakness in our internal controls over financial reporting. Prior to the completion of the Share Exchange transaction with American Electric, management identified the existence of the material weakness in internal controls over financial reporting. It was determined that American Electric's accounting personnel was reduced to a level that did not provide for sufficient segregation of duties, oversight of work performed and compensating controls in the accounting department. While these issues did not result in any material misstatements on our consolidated financial statements, they did collectively represent a material weakness in internal control over financial reporting.
Remediation Process
Management completed the remediation of the material weakness and has implemented additional controls, including hiring additional accounting personnel to provide additional supervision, approval and review of accounting transactions under the direction of an experienced Chief Financial Officer.
While we believe the remediation measures described above remediated this material weakness, due to its inherent limitations, internal control over financial reporting may not prevent or detect misstatements and, even when determined to be effective, can only provide reasonable, not absolute, assurance with respect to financial statement preparation and presentation. Projections of any evaluation of effectiveness to future periods are subject to risk that controls may become inadequate as a result of changes in conditions or deterioration in the degree of compliance.
Management’s Report on Internal Control over Financial Reporting
Our management is responsible for establishing and maintaining adequate internal control over financial reporting, as defined in Rule 13a-15(f) under the Exchange Act. Our management assessed the effectiveness of our internal control over financial reporting as of
December 31, 2019
. In making this assessment, our management used the criteria set forth by the Committee of Sponsoring Organizations of the Treadway Commission on Internal Control-Integrated Framework. Our management has concluded that our internal control over financial reporting was effective as of
December 31, 2019
based on these criteria. This annual report does not include an attestation report of our independent registered public accounting firm regarding internal control over financial reporting. Management’s report was not subject to attestation by our independent registered public accounting firm pursuant to section 404(c) of the Sarbanes-Oxley Act of 2002, as amended, that permits the Company, as a smaller reporting company, to provide only management’s report in this annual report.
Changes in Internal Control over Financial Reporting
There have been no changes in our internal control over financial reporting (as defined in Rule 13a-15(f) under the Exchange Act) that occurred during our last fiscal quarter that have materially affected or are reasonably likely to materially affect our internal control over financial reporting.
ITEM 9B. OTHER INFORMATION
None.
72
PART III
ITEM 10. DIRECTORS, EXECUTIVE OFFICERS AND CORPORATE GOVERNANCE
Directors and Executive Officers of Stabilis Energy, Inc.
The following table sets forth the names, ages (as of February 29, 2020) and titles of our current executive officers and directors.
|
Name
|
Age
|
Position
|
||
|
Casey Crenshaw
|
45
|
Executive Chairman of the Board of Directors
|
||
|
James Reddinger
|
48
|
President, Chief Executive Officer and Director
|
||
|
Andrew Puhala
|
50
|
Chief Financial Officer
|
||
|
Mushahid “Mush” Khan
|
52
|
Director
|
||
|
Ben Broussard
|
40
|
Director
|
||
|
James Aivalis
|
61
|
Chief Operating Officer, Director
|
||
|
Edward Kuntz
|
75
|
Director
|
||
|
Peter Mitchell
|
64
|
Director
|
||
|
Stacey B. Crenshaw
|
43
|
Director
|
||
Casey Crenshaw
Executive Chairman
Casey Crenshaw, age
45
, was appointed Executive Chairman of the Board of Directors of Stabilis on July 26, 2019. He served as the Executive Chairman of the Board of Directors of Stabilis Energy, LLC since November 2018. Mr. Crenshaw previously served as President of Stabilis Energy, LLC from its formation in February 2013 until November 2018. Mr. Crenshaw also serves as President and a member of the Board of Directors of The Modern Group, Ltd, a privately owned diversified manufacturing, parts and distribution, rental/leasing and finance business headquartered in Beaumont, Texas. Mr. Crenshaw has held various executive positions with The Modern Group since 1997, including over 10 years as CFO. Mr. Crenshaw has been a director of American Electric since 2012. Mr. Crenshaw holds a BA in Finance from Texas A&M University. Casey Crenshaw is spouse of Stacey Crenshaw.
James Reddinger
President, Chief Executive Officer and Director
James Reddinger, age
48
, is the President and Chief Executive Officer of Stabilis and previously served as the Chief Executive Officer of Stabilis Energy, LLC since November 2018. He was appointed to the Board of Directors of Stabilis on July 26, 2019. Mr. Reddinger has held various executive positions with Stabilis Energy, LLC, including Chief Financial Officer and Chief Operating Officer from 2013 to 2018. Prior to joining Stabilis, Mr. Reddinger was a private investor from 2010-2013. Mr. Reddinger was previously employed by UBS from 2004 to 2010 and Credit Suisse from 1998 to 2004. Mr. Reddinger holds an AB from Harvard University and an MBA from the JL Kellogg School of Management at Northwestern University.
Andrew Puhala
Chief Financial Officer
Andrew Puhala, age
50
, began serving as Chief Financial Officer of Stabilis in November 2018 and VP of Finance for The Modern Group, Ltd in August 2017. From September 2015 to June 2017 he served as Chief Financial Officer of ERA Group Inc. (NYSE:ERA), a provider of helicopter transport services primarily to the energy industry. Mr. Puhala served as Chief Financial Officer of American Electric from January 2013 to September 2015 and Chief Financial Officer of AccessESP from 2011- 2012. Mr. Puhala held a variety of senior financial roles at Baker Hughes, Inc. from 1996 through 2011 including VP Finance - Middle East Region, Division Controller and Assistant Treasurer. Mr. Puhala is a Certified Public Accountant and received a BBA in Accounting and an MPA from the University of Texas at Austin.
Mushahid “Mush” Khan
Director
Mushahid “Mush” Khan, age
52
, was appointed to the Board of Directors of Stabilis on July 26, 2019. He founded mkhangroup, LLC (MKG), an investment and advisory firm targeting companies in manufacturing and related industries in 2015 and has served as its Chief Executive Officer since founding. Mr. Khan has also been the President and Chief Executive Officer of APS Plastics and
73
Manufacturing (APS), a full-service custom plastic component manufacturer since January 2016. Mr. Khan acquired APS in 2016, in partnership with Framework Capital Partners. Mr. Khan has also provided consulting services since 2015. From 2014 until 2015, Mr. Khan served as Chief Executive Officer of Ringers Gloves, a global industrial safety glove company. From 2002 until 2014, he served as President and Chief Operating Officer of O’Rourke Petroleum, an industrial distribution company. Mr. Khan is also active in community service. He currently holds a board position with TXRX Labs, KIPP Houston Public Schools and Connect Communities, and is past board chair of Crisis Intervention of Houston as well as Devereaux Texas Treatment Centers. He is also an active member of Young Presidents Organization (YPO), Greater Houston Partnership’s advanced manufacturing workgroup, and Houston Exponential’s advanced manufacturing workgroup. Mr. Khan holds an MBA from The University of Houston (Clear Lake), and a BS in Mechanical Engineering from Louisiana State University.
Ben Broussard
Director
Ben Broussard, age
40
, was appointed to the Board of Directors of Stabilis on July 26, 2019. He has been the Director of Finance for The Modern Group, Ltd., since 2013 and Chief Operating Officer of its financing business, M/G Finance Co., Ltd., since 2017. Mr. Broussard began his career as a commercial banker with Washington Mutual Bank in 2001. After leaving the bank in 2008, he worked at T-Mobile until 2011 and then as a consultant to Microsoft’s Global Procurement Group from 2011 to 2013. Mr. Broussard holds a BA from the University of Notre Dame and JD from South Texas College of Law Houston.
James Aivalis
Director
James Aivalis, age
61
, has served as Chief Executive Officer, President and Director of Prometheus Energy Group since January 2013 and was appointed to the Board of Directors of Stabilis on July 26, 2019. He served as Managing Member of AEGIS NG, LLC from April 2016 until September 2019. From May 2006 through June 2012, Mr. Aivalis was the Chief Executive Officer and President of ThruBit, LLC, a Venture Capital funded company focused on drilling and evaluation technologies for horizontal wells and unconventional hydrocarbon reservoirs. From 2002 to 2006, Mr. Aivalis was GM/Managing Director at TenarisConnections, with global responsibilities for high performance OCTG premium connections. Mr. Aivalis served with Schlumberger from 1981 to 2002 with domestic and international roles in Management, Operations, Engineering, Project Management and Sales and Marketing. Mr. Aivalis served from October 2009 to September 2018 as a Non-Executive Director and Business Advisor with XACT Downhole Telemetry, Inc. in Calgary, Canada, and from August 2011 to December 2013 as a Business Advisor to Zinc Air Inc., developing grid scale flow batteries. Since June 2018, Mr. Aivalis has been a member of the Advisory Board at Florida Institute of Technology for the College of Engineering and Sciences. Mr. Aivalis holds a Bachelor of Science degree in Ocean Engineering from Florida Institute of Technology, has authored six patents focused on well construction and optimization technologies, and is a long-standing member of the Society of Petroleum Engineers.
Edward Kuntz
Director
Edward L. Kuntz, age
75
, was appointed to the Board of Directors of Stabilis on July 26, 2019. He served on the Board of Directors and as Chairman of the Audit Committee of American Electric from September 2013 to July 2019. Mr. Kuntz currently serves as a Director and Compliance Committee Chairman of U.S Physical Therapy, Inc., a large publicly-traded operator of outpatient physical and occupational therapy clinics since 2014. Mr. Kuntz is the former Chairman and Chief Executive Officer of Kindred Healthcare, the largest diversified provider of post-acute care services in the United States. From 1998 through May 2014 he served as Chairman of the Board of Directors of Kindred and as Chief Executive Officer from 1998 to 2004. From 2000 through 2016, Mr. Kuntz served as a director of Rotech Healthcare, Inc., one of the largest providers of home medical equipment and related products and services in the United States. Mr. Kuntz received B.A., J.D. and L.L.M. degrees from Temple University.
Peter Mitchell
Director
Peter C. Mitchell, age
64
, was appointed to the Board of Directors of Stabilis on July 26, 2019. He was most recently Senior Vice President and Chief Financial Officer of Coeur Mining, Inc. a leading precious metals producer, which owns and operates mines throughout North America, including the Palmarejo complex in Mexico, one of the world’s largest silver mines. Peter joined Coeur as CFO in 2013, and was responsible for investor relations, financial planning and analysis, financial reporting, information technology, tax and compliance, in addition to serving as a key team member on the Company’s acquisition and divestiture activities and leading all capital markets activity in multiple equity and debt financings. Previously, he held executive leadership positions in finance and operations with a variety of U.S. and Canadian companies both public and private equity sponsored, among them Taseko
74
Mines Ltd., Vatterott Education Centers, Von Hoffmann Corporation and Crown Packaging Ltd. He is a former member of the Board of Directors and Audit Committee Chair for Northern Dynasty Minerals Ltd and is currently a member of the Board of Directors of Northcliff Resources Ltd where he is also the Audit Committee Chair. He earned a BA in Economics from Western University, an MBA from the University of British Columbia, is a Chartered Accountant (CPA-CA).
Stacey B. Crenshaw
Director
Stacey B. Crenshaw, age
43
, was appointed to the Board of Directors of Stabilis on February 4, 2020. She co-founded Stabilis Energy, LLC in 2013. Prior to her role with Stabilis she was a practicing attorney with Germer Gertz, LLP from 2002 to 2004. Ms. Crenshaw is the owner of ClaraVaille, a designer and retailer of custom jewelry. Ms. Crenshaw is also actively involved in her local community through leadership roles at the Neches River Festival and the Symphony League of Beaumont. From 2006 to 2011 she was the founder and director of CHAD’s Place, a non-profit that held conferences and provided support groups for the bereaved. Ms. Crenshaw has also served on several boards including Family Services of Southeast Texas, All Saints Episcopal School, and the advisory board of the Art Museum of Southeast Texas. Ms. Crenshaw received a Bachelor of Liberal Arts degree in Journalism from Texas A&M University and a Doctor of Jurisprudence degree from the University of Houston Law Center. Stacey Crenshaw is the spouse of Casey Crenshaw.
Director Independence
The Board has determined that Mr. Peter Mitchell , Mushahid “Mush” Khan, and Edward Kuntz are currently the Company's independent directors as defined by the rules and regulations of the OTC Markets and SEC.
Although the Company is not currently subject to the NASDAQ listing requirements, our Board uses the independence standards under NASDAQ. The NASDAQ definition of independence includes a series of objective tests, such as that the director is not an employee of the Company and has not engaged in various types of business dealings involving the Company, which would prevent a director from being independent. The Board has determined that Messrs. Peter Mitchell, Mushahid “Mush” Khan, and Edward Kuntz are currently the Company’s independent directors as defined by the rules and regulations of NASDAQ and the SEC.
Board Committees
Shortly after the appointment of the current Board on July 26, 2019, we appointed current non-employee Board members to the Audit Committee and the Compensation Committee. Both Committees are governed by charters adopted by the Board. The charters establish the purposes of the Committees as well as membership guidelines. They also define the authority, responsibilities and procedures of each Committee in relation to the Committee’s role in supporting the Board and assisting the Board in discharging its duties in supervising and governing the Company.
The Audit Committee consist of Messrs. Peter Mitchell (Chair), Mushahid “Mush” Khan, and Edward Kuntz. The Board has determined that Mr. Mitchell satisfies the definition of “audit committee financial expert.”
The Audit Committee oversees, reviews, acts on and reports on various auditing and accounting matters to the Board, including the selection of our independent registered public accounting firm, the scope of our annual audits, fees to be paid to the independent registered public accounting firm, the performance of our independent registered public accounting firm and our accounting practices. In addition, the Audit Committee oversees our compliance programs relating to legal and regulatory requirements. The Audit Committee also reviews any potential related party transactions between the Company and its executive officers and directors.
The Compensation Committee consist of Mr. Casey Crenshaw (Chair), Mr. Peter Mitchell, Mushahid “Mush” Khan, and Edward Kuntz.
The Compensation Committee has the responsibility for developing and maintaining an executive compensation policy that creates a direct relationship between pay levels and corporate performance and returns to stockholders. The Board monitors the results of such policy to assure that the compensation payable to our executive officers provides overall competitive pay levels, creates proper incentives to enhance stockholder value, rewards superior performance, and is justified by the returns available to stockholders. Additionally, the Board administers compensation plans in a manner consistent with the terms of such plans (including, as applicable, the granting of stock options, restricted stock, stock units and other awards, the review of performance goals established for the relevant plan year, and the determination of performance compared to the goals at the end of the plan year). None of our executive officers served as a director or member of the Compensation Committee of any entity that has one or more executive officers serving on our Board.
75
Business Ethics and Conduct Policy
We have adopted a Code of Business Ethics and Conduct that is applicable to all employees, officers and members of our Board. The Company has made the Code of Business Ethics available on its website at www.stabilisenergy.com.
Delinquent Section 16(a) Reports
Section 16(a) of the Exchange Act requires our officers and directors and persons who own more than 10% of our common stock to file reports of ownership and changes in ownership of our common stock with the SEC. Based on our review of the copies of such reports, we believe that all such reports required by Section 16(a) of the Exchange Act were in compliance with such filing requirements during the fiscal year ended December 31, 2019, except that (i) the Form 4s filed jointly by JCH Crenshaw Holdings, LLC and J. Casey Crenshaw on February 14, 2019 and May 3, 2019 each contained one late transaction relating to issuances of a common stock dividend payable to holders of Series A Convertible Preferred Stock, par value $0.001 per share of American Electric and (ii) the Form 3s filed in connection with the appointment of each of the following directors or officers were filed late: Arthur G. Dauber, Edward L. Kuntz, Peter C. Mitchell, and Andrew L. Puhala. Each filing was made promptly after the issue was discovered.
ITEM 11. EXECUTIVE COMPENSATION
Overview & Oversight of Compensation Program
Overview and Objectives
We believe our success depends on the continued contributions of our named executive officers. We have established our executive compensation program to attract, motivate, and retain our key employees in order to enable us to maximize our profitability and value over the long term. Our policies are also intended to support the achievement of our strategic objectives by aligning the interests of our executive officers with those of our shareholders through operational and financial performance goals and equity-based compensation. We expect that our compensation program will continue to be focused on building long-term shareholder value by attracting, motivating and retaining talented, experienced executives and other key employees. Currently, our Principal Executive Officer oversees the compensation programs for our executive officers.
Named Executive Officers
We are currently considered a smaller reporting company within the meaning of the Securities Act, for purposes of the SEC’s executive compensation disclosure rules. In accordance with such rules, we are required to provide a Summary Compensation Table and an Outstanding Equity Awards at Fiscal Year End Table, as well as limited narrative disclosures regarding executive compensation for our last completed fiscal year. Further, our reporting obligations extend only to our “named executive officers,” who are the individuals who served as our principal executive officer during the last completed fiscal year, our next two other most highly compensated officers at the end of the last completed fiscal year and up to two additional individuals who would have been considered one of our next two most highly compensated officers except that such individuals did not serve as executive officers at the end of the last completed fiscal year. Prior to May 1, 2019, James Reddinger was acting in capacity of Chief Executive Officer and Chief Financial Officer. Mr. Reddinger continues to serve as our Chief Executive Officer, but on May 1, 2019 the Company hired Andrew Puhala as our Chief Financial Officer. No salary was paid to Mr. Puhala by Stabilis prior to May 1, 2019. Accordingly, our named executive officers are:
|
Name
|
Principal Position
|
|
James Reddinger
|
Chief Executive Officer, President
|
|
Koby Knight
|
SVP Operations
|
|
James Aivalis
|
Chief Operating Officer
|
76
Summary Compensation Table
The following table below summarizes the total compensation paid to or earned by each of the named executive officers for the fiscal years ended December 31, 2019 and 2018.
|
Name and Principal Position
|
Year
|
Salary
($)
|
Bonus
($)(1)
|
All other
compensation
($)(2)
|
Total
($)
|
|||||||||||||
|
James Reddinger,
|
2019
|
$
|
500,000
|
|
$
|
—
|
|
$
|
—
|
|
$
|
500,000
|
|
|||||
|
Chief Executive Officer
|
2018
|
500,000
|
|
—
|
|
—
|
|
500,000
|
|
|||||||||
|
Koby Knight,
|
2019
|
$
|
400,000
|
|
$
|
—
|
|
$
|
12,000
|
|
$
|
412,000
|
|
|||||
|
SVP Operations
|
2018
|
400,000
|
|
—
|
|
12,000
|
|
400,000
|
|
|||||||||
|
James Aivalis,
|
2019
|
$
|
356,288
|
|
$
|
155,910
|
|
$
|
9,000
|
|
$
|
521,198
|
|
|||||
|
Chief Operating Officer
|
2018
|
317,562
|
|
143,553
|
|
9,000
|
|
470,115
|
|
|||||||||
__________
|
(1)
|
The Amount represents the performance bonus awards earned by our named executive for the fiscal 2019 and 2018 performance.
|
|
(2)
|
The amount represents an annual auto allowance paid out on a monthly basis.
|
Outstanding Equity Awards
As of December 31, 2019, no equity awards have been granted to any of the named executive officers under the 2019 Long Term Incentive Plan discussed below.
Additional Narrative Disclosures
Elements of Compensation
Historically, we have compensated our named executive officers with annual base salaries, annual cash incentive bonuses and employee benefits. Additionally, our named executive officers may be awarded long-term equity incentives in the form of restricted stock awards and stock options. We expect that these elements will continue to constitute the primary elements of our compensation program, although the relative proportions of each element, and the specific plan and award designs, will likely evolve as we become a more established public company.
Employment, Severance or Change in Control Agreements
We are not party to any agreements with our executive officers that provide benefits upon termination of employment. Currently the executive officers are employed at will with no present arrangements or pledges of the Company’s securities which may result in a change of control of the Company. We intend to enter into employment agreements with executive officers in the near future.
Base Salary
Base salary is the fixed annual compensation we pay to each of our named executive officers for carrying out their specific job responsibilities. Base salaries are a major component of the total annual cash compensation paid to our named executive officers. Base salaries are determined after taking into account many factors, including (a) the responsibilities of the officer, the level of experience and expertise required for the position and the strategic impact of the position; (b) the need to recognize each officer’s unique value and demonstrated individual contribution, as well as future contributions; (c) the performance of the company and each officer; and (d) salaries paid for comparable positions in similarly-situated companies.
For the amounts of base salary that our named executive officers received in 2019 and 2018, see “Executive Compensation-Summary Compensation Table.”
Our Board reviews the base salaries for each named executive officer periodically as well as at the time of any promotion or significant change in job responsibilities and, in connection with each review, our Board considers individual and company performance over the course of the relevant time period. The Board may make adjustments to base salaries for named executive officers upon consideration of any factors that it deems relevant, including but not limited to: (a) any increase or decrease in the named executive officer’s responsibilities, (b) the named executive officer’s job performance, and (c) the level of compensation paid
77
to senior executives of other companies with whom we compete for executive talent, as estimated based on publicly available information and the experience of our directors.
Annual Cash Bonuses
Annual cash bonuses will be based on criteria determined in the discretion of our Board. At this time there is not a defined bonus plan in place. For the fiscal years ended December 31, 2019 and 2018, James Aivalis was awarded a cash bonus equal to 50% of annual base salary for his performance related to the Company’s operations.
Other Benefits
We offer participation in broad-based retirement, health and welfare plans to all of our employees.
Risk Considerations.
The Compensation Committee considers whether the Company’s compensation policies and practices for both executives and other employees encourage unnecessary or excessive risk taking.
Base salaries are not believed to encourage excessive risk taking. The Company’s Executive Performance Bonus Program does focus on achievement of annual Company and/or individual performance goals, but both the Company and individual goals are considered appropriate for achievement without unnecessary and excess risk taking.
Pension Benefits
We have not maintained and do not currently maintain a defined benefit pension plan or a supplemental executive retirement plan. Instead, our employees, including our named executive officers, may participate in a retirement plan intended to provide benefits under section 401(k) of the Code (the “401(k) Plan”) pursuant to which employees are allowed to contribute a portion of their base compensation to a tax-qualified retirement account in a defined safe harbor 401(k) Plan, subject to limitations.
Non-Qualified Defined Contribution and Other Non-Qualified Deferred Compensation Plans
We have not had and do not currently have any defined contribution or other plan that provides for the deferral of compensation on a basis that is not tax-qualified.
2019 Long Term Incentive Plan
On December 9, 2019, the Board of Directors of the Company adopted the 2019 Long Term Incentive Plan (the “2019 Plan”). The 2019 Plan provides for the award of Stock Options, Stock Appreciation Rights, Restricted Stock, Restricted Stock Units, Stock Awards, Dividend Equivalents, Other Stock-Based Awards, Cash Awards, Substitute Awards and Performance Awards. Awards may be granted under the 2019 Plan to employees, officers and directors of the Company and our Affiliates, and any other person who provides services to the Company or any of our Affiliates.
The 2019 Plan succeeds our 2007 Employee Stock Incentive Plan (the “2007 Plan”) and no further shares will be issued under the 2007 Plan.
Director Compensation
Our Board of Directors believes that attracting and retaining qualified non-employee directors will be critical to the future value growth and governance of our company. Our Board of Directors also believes that a significant portion of the total compensation package for our non-employee directors should be equity-based to align the interest of these directors with our stockholders. The Company established the fee for service on the Audit Committee at the rate of $100,000 per year payable one-half in cash and one-half in common stock. The common stock portion of such fees is subject to approval of the stockholders of the Company.
Cash
.
The Company pays each director an annual fee at the rate of fifty-thousand dollars ($50,000), which is paid in quarterly (4) equal installments.
The members of the Board of Directors are also eligible for reimbursement of their expenses incurred in attending Board meetings in accordance with our policies.
78
Directors who are also our employees do not receive any additional compensation for their service on our Board of Directors.
The following table describes the compensation earned following the completion of the Share Exchange on July 26, 2019 by each individual who served as a non-employee director during 2019.
|
Name
|
Fees Earned or Paid in Cash ($)
|
Stock Awards ($)
|
All Other Compensation ($)
|
Total ($)
|
|||||||||||
|
Edward Kuntz
|
$
|
25,000
|
|
$
|
25,000
|
|
$
|
—
|
|
$
|
50,000
|
|
|||
|
Peter Mitchell
|
25,000
|
|
25,000
|
|
—
|
|
50,000
|
|
|||||||
|
Mushahid “Mush” Khan
|
25,000
|
|
25,000
|
|
—
|
|
50,000
|
|
|||||||
|
Total
|
$
|
75,000
|
|
$
|
75,000
|
|
$
|
—
|
|
$
|
150,000
|
|
|||
ITEM 12. SECURITY OWNERSHIP OF CERTAIN BENEFICIAL OWNERS AND MANAGEMENT AND RELATED STOCKHOLDER MATTERS
The table below sets forth information, as of February 29, 2020, the amount and percentage of our outstanding shares of common stock beneficially owned by (i) each person known by us to own beneficially more than 5% of our outstanding common stock, (ii) each director, (iii) each of our executive officers, and (iv) all of our directors and executive officers as a group. Unless otherwise noted, the following table is based on
16,835,318
shares outstanding as of February 29, 2020.
|
Name(4)
|
Common Stock
|
|||
|
Number of
Shares
|
Percent of
Class
|
|||
|
Casey Crenshaw(1)
|
13,000,944
|
|
77.2
|
%
|
|
Stacey Crenshaw(1)
|
13,000,944
|
|
77.2
|
%
|
|
LNG Investment Company, LLC(2)
|
12,580,808
|
|
74.9
|
%
|
|
Andrew Puhala (4)
|
830
|
|
*
|
|
|
Chart Energy & Chemicals, Inc.(3)
|
1,470,807
|
|
8.7
|
%
|
|
James Reddinger (4)
|
1,452
|
|
—
|
|
|
Mushahid “Mush” Khan (4)
|
7,712
|
|
—
|
|
|
Ben Broussard (4)
|
1,000
|
|
—
|
|
|
James Aivalis (4)
|
1,100
|
|
—
|
|
|
Edward Kuntz (4)
|
9,442
|
|
—
|
|
|
Peter Mitchell (4)
|
7,812
|
|
—
|
|
|
All directors and officers as a group of (9) persons(5)
|
13,030,292
|
|
77.4
|
%
|
___________
|
*
|
Indicates less than 1%
|
|
(1)
|
Consists of (i) 12,580,808 shares owned by LNG Investment Company, LLC; (ii) 368,511 shares owned by JCH Crenshaw Holdings, LLC (“JCH”); (iii) 11,000 shares of Common Stock currently held by Mr. Crenshaw; and (iv) 40,625 shares issuable upon (y) exercise of the eight-year warrants owned by JCH and purchased pursuant to the Securities Purchase Agreement and the Warrant to Purchase Shares of Common Stock, dated May 2, 2012, at an exercise price of $6.00 per share and repriced pursuant to the Repricing Agreement at an exercise price of $2.72 per share (the “Series A Warrants”) and (z) exercise of the eight-year warrants owned by JCH and purchased pursuant to the Securities Purchase Agreement and the Warrant to Purchase Shares of Common Stock, dated May 2, 2012, at an exercise price of $7.00 per share and repriced pursuant to the Repricing Agreement at an exercise price of $3.17 per share (the “Series B Warrants” and together with the Series A Warrants, the “Warrants”). Mr. Crenshaw may be deemed to have voting and dispositive power over the securities held by each of LNG Investment Company, LLC and JCH by virtue of being the sole manager of LNG Investment Company, LLC and the sole managing member of JCH; thus, he may also be deemed to be the beneficial owner of these securities. Mrs. Crenshaw, as the spouse of Mr. Crenshaw, may be deemed to share voting and dispositive power over the securities held by each Mr. Crenshaw, JCH and LNG Investment Company, LLC. Mr. and Mrs. Crenshaw each disclaim any beneficial ownership of the securities owned by LNG Investment Company, LLC, JCH and their respective spouses in excess of their pecuniary interest in such securities. The 40,625 shares issuable upon exercise of the Warrants owned by JCH are deemed to be outstanding and to be beneficially owned by Mr. and Mrs. Crenshaw for the purpose of computing percentage ownership.
|
79
|
(2)
|
LNG Investment Company, LLC owns the 12,580,808 shares received in connection with the Share Exchange. Please see footnote (1) for additional information regarding the shares owned by LNG Investment Company, LLC.
|
|
(3)
|
Chart Energy & Chemicals, Inc. is a wholly owned subsidiary of Chart Industries, Inc. which manages the investments of Chart Energy & Chemicals, Inc. Jillian C. Evanko is the President and Chief Executive Officer of Chart Industries, Inc. and has voting and investment power over the shares held by Chart Energy & Chemicals, Inc. The business address of Chart Energy & Chemicals, Inc. is 8665 New Trails Drive, Suite 100, The Woodlands, Texas 77381. The business address of Chart Industries, Inc. is 3055 Torrington Drive, Ball Ground, Georgia 30107.
|
|
(4)
|
Unless otherwise noted, the address of the following entities or individuals is c/o Stabilis Energy, Inc. 10375 Richmond Avenue, Suite 700, Houston, Texas 77042.
|
|
(5)
|
The 40,625 shares issuable upon exercise of the Warrants owned by JCH are deemed to be outstanding and to be beneficially owned by Mr. Crenshaw for the purpose of computing percentage ownership.
|
Equity Compensation Plan
On December 9, 2019, the Board of Directors of the Company adopted the 2019 Long Term Incentive Plan (the “2019 Plan”). The 2019 Plan provides for the award of Stock Options, Stock Appreciation Rights, Restricted Stock, Restricted Stock Units, Stock Awards, Dividend Equivalents, Other Stock-Based Awards, Cash Awards, Substitute Awards and Performance Awards. Awards may be granted under the 2019 Plan to employees, officers and directors of the Company and our affiliates, and any other person who provides services to the Company or any of our affiliates.
The 2019 Plan succeeds our 2007 Employee Stock Incentive Plan (the “2007 Plan”) and no further shares will be issued under the 2007 Plan.
The maximum number of shares of common stock available for issuance under the 2019 Plan is 1,675,000 shares.
As of December 31, 2019, no awards have been granted under the 2019 Plan.
The following table summarizes information about the outstanding equity plan as of
December 31, 2019
.
|
Plan Category
|
Number of securities to be issued upon exercise of outstanding rights (1)
|
Weighted-average exercise price of outstanding options (2)
|
Number of securities remaining available under equity compensation plans (excluding securities reflected in column (1)) (3)(a)
|
|||||||
|
Equity compensation plans approved by security holders
|
—
|
|
$
|
—
|
|
—
|
|
|||
|
Equity compensation plans not approved by security holders
|
—
|
|
—
|
|
1,675,000
|
|
||||
|
Total
|
—
|
|
$
|
—
|
|
1,675,000
|
|
|||
__________
|
(1)
|
Includes shares of common stock issuable upon vesting of outstanding restricted stock units (RSUs).
|
|
(2)
|
The weighted average exercise price does not take into account the shares issuable upon vesting of outstanding RSUs, which convert to common stock on a one-to-one basis. No options were outstanding.
|
|
(3)
|
Consists of the shares available for future issuance under 2019 Employee Stock Incentive Plan for services by eligible employees, board members, independent contractors and consultants.
|
|
(a)
|
See Note 16—Stock-Based Compensation in the Notes to Consolidated Financial Statements included in this 10-K for the year ended December 31, 2019 for further information.
|
ITEM 13. CERTAIN RELATIONSHIPS AND RELATED PARTY TRANSACTIONS, AND DIRECTOR INDEPENDENCE
In the ordinary course of our business, we may enter into transactions with our directors, officers and 5% or greater stockholders.
80
Share Exchange Agreement
On July 26, 2019 (the “Effective Date”), the Share Exchange with American Electric and its subsidiaries was completed. In the Share Exchange, American Electric acquired directly
100%
of the outstanding limited liability company membership interests of Stabilis Energy, LLC (“Stabilis LLC”) from LNG Investment Company, LLC ("LNG Investment") and
20%
of the outstanding limited liability membership interests of PEG Partners, LLC ("PEG") from AEGIS NG LLC ("AEGIS"). AEGIS owned a
20%
noncontrolling interest of PEG. The remaining
80%
of the outstanding limited liability company interests of PEG were owned directly by Stabilis LLC. As a result, Stabilis became a direct
100%
owned subsidiary of American Electric and PEG became an indirectly-owned
100%
subsidiary of American Electric. Under the Share Exchange Agreement, American Electric issued
13,178,750
post-split shares of common stock to acquire Stabilis LLC, which represented approximately
90%
of the total amount of common stock of American Electric which was issued and outstanding as of July 26, 2019. The proposed transaction was approved by the shareholders of American Electric at a Special Meeting of Stockholders. The Share Exchange resulted in a change of control of American Electric to control by Casey Crenshaw by virtue of his beneficial ownership of
88.4%
of the common stock of American Electric to be outstanding as of July 26, 2019.
Immediately following the Effective Date, the Company declared a reverse stock split of its outstanding common stock at a ratio of
one-for-eight
, American Electric changed its name to Stabilis Energy, Inc., and our common stock began trading under the ticker symbol “SLNG”.
Transactions with Chart E&C
On September 30, 2013, Stabilis LNG Eagle Ford, LLC ("Stabilis LNG EF") entered into a Secured Term Note Payable with Chart Energy & Chemicals, Inc. (“Chart E&C”), a Delaware corporation and subsidiary of Chart, in connection with a Master Sales Agreement whereby Chart E&C agreed to sell Stabilis LNG EF certain equipment for its liquefaction plant. The total value of the agreement was not to exceed
$20.5 million
and was billed in advances based on a “Milestone Payment Schedule”. The note contained various covenants that limit the Stabilis LNG EF’s ability to grant certain lines, incur additional indebtedness, guarantee or become contingently liable for obligations of any person except for those allowed by Chart E&C, merge or consolidate into or with a third party or engage in certain asset dispositions and acquisitions, pay dividends or make distributions, transact with affiliates, prepayment of indebtedness, and issue additional equity interests. Further, the Master Sales Agreement was secured by a
$20.0 million
equity interest and first lien on all plant assets including land. Borrowings bear interest on the outstanding principal at the rate of
3.0%
plus the London interbank offered rate.
The Secured Term Note Payable was amended on August 21, 2017 whereby only the payment terms of principal and interest were modified to be payable in
eight
installments as follows: (i)
$2.5 million
plus accrued interest due on August, 24, 2017, (ii)
$2.5 million
plus accrued interest due on August 24, 2018, (iii)
$2.5 million
plus accrued interest due on August 24, 2019, (iv)
four
equal payments of
$1.5 million
plus accrued interest on each anniversary date of August 24, 2019 thereafter, (v) and
$0.6 million
plus accrued interest on the remaining unpaid balance of the Amended Secured Term Note Payable on August 24, 2024. In the event all principal and interest is paid in full by August 24, 2023, an additional payment of
$2.2 million
is to be forgiven.
On August 5, 2019, we entered into an exchange agreement (the “Exchange Agreement”) with Chart E&C, Stabilis LLC, and Stabilis LNG EF for the satisfaction of indebtedness of Stabilis LNG to Chart E&C in the principal amount of
$7 million
(the “Exchanged Indebtedness”) in exchange for unregistered shares of our common stock (such transactions, the “Chart Transaction”). We issued to Chart E&C
1,470,807
shares of Company common stock, based on the per share price of Company common stock of
90%
of the average of the dollar volume-weighted average prices per share of the common stock as calculated by Bloomberg for each of the
five
consecutive trading days ending on and including the third trading day immediately preceding the closing date, which took place on August 30, 2019. At closing, Stabilis LNG EF also paid to Chart E&C an amount in cash equal to the accrued and unpaid interest on the Exchanged Indebtedness due through the closing, plus a cash amount to be paid in lieu of the issuance of fractional shares of our Common Stock. Management determined the modifications to be substantial and pursuant to ASC 470, the transaction was treated as a debt extinguishment for accounting purposes. Accordingly, the Company recognized a gain on extinguishment of debt of
$0.1 million
, which is included in Other Income in the accompanying Consolidated Statement of Operations. The exchange agreement released certain collateral (including the Company’s LNG plant) and removed certain covenants of the original Note Payable.
On September 11, 2019, we entered into Amendment No. 1 to the Exchange Agreement, which eliminated the right of Chart E&C to elect an additional exchange of all or any portion of the balance of the unpaid principal amount of the Note. The Exchange Agreement previously provided for Chart E&C to elect an additional exchange, on a second closing date, of all or any portion of the balance of the unpaid principal amount of the Note, for additional shares of our common stock based on the foregoing pricing calculation related to the closing date.
81
Chart E&C has previously routinely sold equipment to us in the ordinary course of business and on customary commercial terms.
Diversenergy Acquisition
On August 20, 2019, we completed our acquisition of Diversenergy, LLC (“Diversenergy”) and its subsidiaries, creating what we believe will be one of the leading distributed LNG marketing and distribution companies in Mexico (such acquisition, the “Diversenergy Transaction”). Under the Membership Interest Purchase and Sale Agreement dated August 20, 2019, we purchased all of the issued and outstanding membership interests of Diversenergy for total consideration of
684,963
shares of Company common stock and
$2 million
in cash, subject to adjustments for Diversenergy’s net working capital as of the closing date. Diversenergy provides LNG to customers who use LNG as a fuel in mobile high horsepower applications and to customers who do not have natural gas pipeline access.
We also entered into a Registration Rights Agreement with certain holders of Diversenergy, as further described below.
In connection with the Diversenergy Acquisition, Lee L. Kellough III, who formerly served as Chief Executive Officer of Diversenergy, became Senior Vice President of the Company and President of Diversenergy S.A.P.I. de C.V., a Mexican subsidiary of Diversenergy. Mr. Kellough received 47,235 shares of Company common stock and $402,955 in the Diversenergy Transaction.
Registration Rights Agreements
In connection with the completion of the Share Exchange Agreement, American Electric, LNG Investment and AEGIS entered into a Registration Rights Agreement on July 26, 2019 (the “Registration Rights Agreement”). The shares that are the subject of the Registration Rights Agreement include the American Electric common stock issued to LNG Investment and AEGIS pursuant to the Share Exchange Agreement and any other securities issued or issuable with respect to such common stock by way of stock dividend or stock split or combination of shares, recapitalization, merger, consolidation or reorganization (the “Registrable Securities”). Such securities will no longer be subject to registration rights when disposed of pursuant to an effective registration statement; sold pursuant to Rule 144 and the transferee received securities that are not restricted securities as defined in Rule 144; securities which have ceased to be outstanding; or securities held by holder that is not LNG Investment or AEGIS or an affiliate thereof to whom registration rights have not been transferred in accordance with the Registration Rights Agreement.
Shelf Registrations.
Under the Registration Rights Agreement, we agreed to:
no later than 180 days following the closing of the Share Exchange, prepare and file with the SEC a registration statement on Form S-1, or Form S-3 if we are eligible to use Form S-3, to permit a public resale of all the Registrable Securities under the Securities Act on a continuous basis;
use our commercially reasonable efforts to cause the registration statement to be declared effective by the SEC within 30 days following the filing (or 90 days following the filing if the SEC notifies us that it will review the registration statement);
use our commercially reasonable efforts to cause such registration statement to remain effective until such time as there are no longer any Registrable Securities.
If the securities are initially filed on Form S-1, we shall use our commercially reasonable efforts to become and remain eligible to register the Registrable Securities on Form S-3 and convert the registration statement from a Form S-1 to a Form S-3 as soon as we are permitted to do so.
Piggyback Registration Rights.
We have also granted piggyback registration rights under the Registration Rights Agreement, pursuant to which we will:
notify the holders of Registrable Securities not less than 5 days prior to the anticipated filing date, whenever we propose to register any of our securities in an underwritten offering under the Securities Act, subject to certain exemptions described in the Registration Rights Agreement;
notify the holders of Registrable Securities not less than 5 days prior to the commencement of marketing efforts of an underwritten offering under a shelf registration, subject to certain exemptions described in the Registration Rights Agreement; and
include in any registration statement relating to such underwritten offering, subject to certain restrictions (including specified underwriter cutbacks and priority to the securities we propose to sell), and on a pro rata basis, all Registrable
82
Securities with respect to which we received a request for inclusion in priority to other securities requested to be included in such underwritten offering.
Holdback Agreements.
In connection with any underwritten public offering by us or any holder of Registrable Securities pursuant to the Registration Rights Agreement, each holder of Registrable Securities is subject to restrictions on public sale or distribution of similar securities for a lock-up period up to 60 days of the date of the final prospectus or prospectus supplement for the underwritten offering. However, holders of Registrable Securities may not be restricted from effecting any public sale or distribution of securities for more than 120 days in any 12 month period. We are also subject to effecting a public offering of similar securities or hedging transactions related to such securities during a lock-up period reasonably requested by the managing underwriter.
Registration Expenses.
We will pay the registration and listing expenses of the holders of the Registrable Securities that are included in a demand or piggyback registration, but shall not be responsible for underwriting fees and disbursements, discounts or commissions attributable to the sale of Registrable Securities.
The Exchange Agreement described above in “Transactions with Chart E&C” granted Chart E&C registration rights for the shares it received and requires the Company prepare and file, no later than 90 days after the Initial Closing, a Registration Statement on Form S-1 to permit the public resale of all of the registrable securities received by Chart E&C.
In connection with the Diversenergy Transaction, we entered into a Registration Rights Agreement with certain holders of Diversenergy (the “Diversenergy Registration Rights Agreement”). The shares that are the subject of the Diversenergy Registration Rights Agreement include the Company common stock issued in connection with the Membership Interest Purchase and Sale Agreement and any other securities issued or issuable with respect to such common stock by way of stock dividend or stock split, or in exchange for or upon conversion of such shares, or otherwise in connection with a combination of shares, distribution, recapitalization, merger, consolidation or reorganization. Such securities will no longer be subject to registration rights when disposed of pursuant to an effective registration statement; sold pursuant to Rule 144; securities that become eligible for sale pursuant to Rule 144 without volume or manner-of-sale restrictions and without the requirement for the Company to be in compliance with the current public information requirement under Rule 144(c)(1), as set forth in a written opinion letter to the transfer agent to such effect; securities otherwise transferred; or securities which have ceased to be outstanding.
Contribution and Exchange Agreement
On November 30, 2018, Stabilis LLC's members contributed
1,000
membership units in Stabilis LLC having a carrying amount of
$20 million
to LNG Investment in exchange for
2,000
Class B units having a carrying amount of
$20 million
in LNG Investment. An aggregate of
2,000
Class B units were issued by LNG Investment to Stabilis LLC having a carrying amount of
$20 million
. The contribution and exchange of units resulted in Stabilis LLC becoming a wholly owned subsidiary of LNG Investment. Subsequently, Stabilis LLC's members and related party creditors, holders of an aggregate net carrying amount of
$48.7 million
of indebtedness, contributed their individual indebtedness to LNG Investment in exchange for Class A units in proportion to their percentage of indebtedness in total. An aggregate of
4,874.28
Class A units were issued by LNG Investment to the related party creditors of the Company having a carrying amount of
$48.7 million
.
Finance Lease Obligations
On December 1, 2019, the Company refinanced its lease agreement with a subsidiary of The Modern Group, Ltd. (“The Modern Group”) for equipment purchases totaling approximately $3.2 million. Under the terms of the lease agreement, the Company’s monthly principal and interest payments are $232 thousand for the remaining 12 month term at an annual rate of 8.9%. An upfront fee payment of $131 thousand is due July 1, 2020 and the remaining outstanding lease obligation of approximately $646 thousand is due by January 25, 2021. The following individuals serve in various leadership capacities for The Modern Group: Casey Crenshaw (our Executive Chairman and Chairman of our Board) as President, Will Crenshaw (a former member of our Board) as Chairman and Chief Executive Officer, and Ben Broussard (a member of our Board) as Director of Finance and as COO of M/G Finance Co., Ltd., a subsidiary of The Modern Group. Casey Crenshaw is the beneficial owner of 25% of the Modern Group and is deemed to jointly control The Modern Group with family members.
During 2018, Stabilis LLC entered into lease agreements with a subsidiary of The Modern Group to finance vehicles and machinery and equipment totaling approximately
$1.5 million
. Under the terms of the leases, the balance is due in equal monthly installments over
24 months
at annual interest rate of
10%
.
83
The Company’s carrying value of capital lease obligations to related parties consisted of the following (in thousands):
|
December 31,
|
|||||||
|
2019
|
2018
|
||||||
|
Finance lease obligations with subsidiary of The Modern Group, Ltd
|
$
|
4,088
|
|
$
|
7,246
|
|
|
|
Less: amounts due within one year
|
(3,440
|
)
|
(3,879
|
)
|
|||
|
Total long term finance lease obligations to related parties
|
$
|
648
|
|
$
|
3,367
|
|
|
Secured Term Note Payable
The Company has a Secured Term Note Payable with Chart E&C in the principal amount of
$2.1 million
in connection with a Master Sales Agreement whereby Chart E&C agreed to sell the Company certain equipment for its liquefaction plant.
Promissory Note
On August 16, 2019, the Company issued a Secured Promissory Note to M/G Finance Co., Ltd. in the principal amount of
$5 million
. Casey Crenshaw, our Executive Chairman and Chairman of our Board, serves as the President of M/G Finance Co., Ltd. M/G Finance Co. Ltd. is a subsidiary of The Modern Group.
Term Loan Facility
In connection with the acquisition of American Electric (see Note 2—Acquisitions), the Company assumed a Loan Facility between M&I Brazil, a subsidiary, and an employee and director of the Company. The Loan Agreement provides the Company with a
$0.3 million
loan facility of which
$0.2 million
is drawn and is outstanding as of
December 31, 2019
. All outstanding amounts, including accrued but unpaid interested, are due in
June 2020
. Under the loan agreement, the interest rate on the loan facility is
10.0%
, per annum, payable each quarter. The loan facility is secured by the assets held by M&I Brazil.
Operating Leases
The Company subleases land in Fort Lupton, Colorado to a subsidiary of The Modern Group. During both the years ended
December 31, 2019
and
2018
, amounts billed to The Modern Group under the agreement totaled
$10 thousand
and
$12 thousand
, respectively.
The Company subleases space in Denver, Colorado to a subsidiary of The Modern Group. During the years ended
December 31, 2019
and
2018
, the Company billed
$24 thousand
and
$55 thousand
, respectively, to The Modern Group under the agreement.
Payroll and Benefits
The Company utilized payroll and benefit resources from The Modern Group. During the years ended
December 31, 2019
and
2018
, the Company incurred expenses of
$4 thousand
and
$13 thousand
for processing and administrative charges associated with payroll processing.
Other Purchases
The Company has issued a purchase order to Applied Cryo Technologies, Inc. (“ACT”), a company owned
51%
by Crenshaw Family Holdings International, Inc., for equipment totaling
$302 thousand
. The Company expects to take delivery of equipment late in
2020
. During the years ended
December 31, 2019
and
2018
, the Company also paid ACT
$145 thousand
and
$63 thousand
, respectively, for equipment repairs and services. The Company also sold
$4 thousand
of LNG to ACT during 2019. As of
December 31, 2019
we had
$4 thousand
due from ACT included in accounts receivable on the consolidated balance sheets. There was
no
receivable due from ACT as of
December 31, 2018
. As of
December 31, 2019
and
2018
, respectively, we had
$24 thousand
and
$5 thousand
due to ACT included in accounts payable on the consolidated balance sheets.
84
The Company purchases supplies and services from a subsidiary of The Modern Group. During the years ended
December 31, 2019
and
2018
, purchases from The Modern Group totaled
$175 thousand
and
$47 thousand
, respectively. The Company also sold
$52 thousand
and
$133 thousand
of supplies and services to The Modern Group in 2019 and 2018, respectively. There was
no
receivable due from The Modern Group as of
December 31, 2019
. As of
December 31, 2018
, we had
$4 thousand
due from The Modern Group included in accounts receivable on the consolidated balance sheets. As of
December 31, 2019
and
2018
, respectively, we had
$22 thousand
and
$29 thousand
due to The Modern Group included in accounts payable on the consolidated balance sheets.
The Company purchases services from Chart E&C. During the years ended
December 31, 2019
and
2018
, purchases from Chart E&C totaled
$80 thousand
and
$35 thousand
. As of
December 31, 2019
we had
$8 thousand
due to Chart E&C included in accounts payable on the consolidated balance sheets. There was
no
payable due to Chart E&C as of
December 31, 2018
.
Indemnification Agreements
Currently there are no indemnification agreements in place.
Review, Approval or Ratification of Transactions with Related Persons
The Audit Committee, which is comprised solely of independent directors, is responsible for reviewing related party transactions involving directors and executive officers. In addition, our Board is responsible for approving all related party transactions between us and any officer or director that would potentially require disclosure. The Board expects that any transactions in which related persons have a direct or indirect interest will be presented to the Board for review and approval but we have no written policy in place at this time.
ITEM 14. PRINCIPAL ACCOUNTING FEES AND SERVICES
The following table shows the aggregate fees billed to us for professional services rendered by Ham, Langston & Brezina, L.L.P. during the periods presented:
|
Year Ended December 31,
|
||||||||
|
Types of Fees
|
2019
|
2018
|
||||||
|
Audit Fees (1)
|
$
|
221,650
|
|
$
|
62,367
|
|
||
|
Audit-Related Fees (2)
|
—
|
|
—
|
|
||||
|
Tax Fees (3)
|
—
|
|
—
|
|
||||
|
Other Fees (4)
|
—
|
|
—
|
|
||||
|
Total Fees
|
$
|
221,650
|
|
$
|
62,367
|
|
||
__________
|
(1)
|
Audit fees consist of fees billed for professional services rendered for the audit of our annual consolidated financial statements and review of our interim condensed consolidated financial statements included in our quarterly reports, professional services rendered in connection with our filing of various registration statements (such as registration statements on Form S-8 and Form S-1, including related comfort letters) and other services that are normally provided by Ham, Langston & Brezina, L.L.P. in connection with statutory and regulatory filings or engagements.
|
|
(2)
|
Audit-related fees consist of fees billed for assurance and related services that are reasonably related to the performance of the audit or review of our consolidated financial statements and are not reported as audit fees. Ham, Langston & Brezina, L.L.P. rendered no such services for us in 2019 or 2018.
|
|
(3)
|
Tax fees consist of fees billed for professional services rendered for tax compliance, tax advice and tax planning (domestic and international). Ham, Langston & Brezina, L.L.P. rendered no such services for us in 2019 or 2018.
|
|
(4)
|
All other fees consist of fees billed for products and services other than the services described in notes (1), (2) and (3) above. Ham, Langston & Brezina, L.L.P. rendered no such services for us in 2019 or 2018.
|
85
PART IV
ITEM 15. EXHIBITS AND FINANCIAL STATEMENT SCHEDULES
(a) The following document are filed as part of this report:
(1) Consolidated Financial Statements
The following items are filed in Item 8. Financial Statements and Supplementary Data of this report:
Report of Independent Registered Public Accounting Firm
Consolidated Balance Sheets
Consolidated Statements of Operations
Consolidated Statements of Comprehensive Loss
Consolidated Statements of Stockholders’ Equity
Consolidated Statements of Cash Flows
Notes to Consolidated Financial Statements
(2) Financial Statement Schedules
All financial statement schedules have been omitted, since the required information is not applicable or is not present in amounts sufficient to require submission of the schedule, or because the information required is included in the Consolidated Financial Statements and Notes thereto.
(3) Index to Exhibits
The information required by this Item 15(a)(3) is set forth on the exhibit index, which immediately precedes the signature page to this report and is incorporated herein by reference.
ITEM 16. FORM 10-K SUMMARY
We have elected not to provide summary information.
EXHIBIT INDEX
|
Exhibit No.
|
Exhibit Description
|
|
|
2.1
|
|
|
|
2.2
|
|
|
|
3.1
|
|
|
|
3.2
|
|
|
|
4.1
|
|
|
|
4.2
|
|
|
|
4.3
|
|
|
86
|
Exhibit No.
|
Exhibit Description
|
|
|
4.4
|
|
|
|
4.5
|
|
|
|
4.6
|
|
|
|
4.7
|
|
|
|
4.8
|
|
|
|
4.9
|
|
|
|
4.10
|
||
|
10.1
|
|
|
|
10.2
|
|
|
|
10.3
|
|
|
|
10.4
|
|
|
|
10.5
|
|
|
|
10.6
|
|
|
|
10.7
|
|
|
|
10.8
|
|
|
|
10.9
|
|
|
|
10.10
|
|
|
|
10.11
|
|
|
87
|
Exhibit No.
|
Exhibit Description
|
|
|
10.12
|
|
|
|
10.13
|
|
|
|
10.14
|
|
|
|
10.15
|
|
|
|
10.16
|
|
|
|
10.17
|
|
|
|
10.18
|
||
|
10.19
|
|
|
|
10.20
|
|
|
|
10.21
|
|
|
|
10.22
|
|
|
|
10.23
|
|
|
|
10.24
|
|
|
|
10.25
|
|
|
|
10.26
|
|
|
|
10.27
|
|
|
|
21.1
|
||
|
23.1
|
||
|
31.1
|
||
|
31.2
|
||
|
32.1
|
||
|
101.INS
|
XBRL Instance Document.
|
|
88
|
Exhibit No.
|
Exhibit Description
|
|
|
101.SCH
|
XBRL Taxonomy Extension Schema Document.
|
|
|
101.CAL
|
XBRL Taxonomy Extension Calculation Linkbase Document.
|
|
|
101.DEF
|
XBRL Taxonomy Extension Definition Linkbase Document.
|
|
|
101.LAB
|
XBRL Taxonomy Extension Labels Linkbase Document.
|
|
|
101.PRE
|
XBRL Taxonomy Extension Presentation Linkbase Document.
|
|
|
(1)
|
Exhibits and schedules to the Share Exchange Agreement and Amendment have been omitted pursuant to Item 601(b)(2) of Regulation S-K. The Company hereby undertakes to furnish supplemental copies of any of the omitted exhibits and schedules upon request by the U.S. Securities and Exchange Commission.
|
* Filed herewith.
†
Indicates management contract or compensatory plan, contract or arrangement.
89
SIGNATURES
Pursuant to the requirements of Section 13 or 15(d) the Securities Exchange Act of 1934, the registrant has duly caused this report to be signed on its behalf by the undersigned thereunto duly authorized.
|
Date: March 16, 2020
|
||
|
STABILIS ENERGY, INC.
|
||
|
By:
|
/s/ James C. Reddinger
|
|
|
James C. Reddinger
|
||
|
President and Chief Executive Officer
(Principal Executive Officer) |
||
|
By:
|
/s/ Andrew L. Puhala
|
|
|
Andrew L. Puhala
|
||
|
Chief Financial Officer
(Principal Financial Officer) |
||
Pursuant to the requirements of the Securities Exchange Act of 1934, this report has been signed below by the following persons on behalf of the registrant and in the capacities and on
March 16, 2020
.
|
Signature
|
Title
|
|
|
/s/ Casey Crenshaw
|
Executive Chairman & Chairman of the Board
|
|
|
Casey Crenshaw
|
||
|
/s/ James Reddinger
|
President, Chief Executive Officer and Director
|
|
|
James Reddinger
|
(Principal Executive Officer)
|
|
|
/s/ Andrew Puhala
|
Senior Vice President and Chief Financial Officer
|
|
|
Andrew Puhala
|
(Principal Financial Officer and
|
|
|
Principal Accounting Officer)
|
||
|
/s/ James G. Aivalis
|
Director
|
|
|
James G. Aivalis
|
||
|
/s/ Ben Broussard
|
Director
|
|
|
Ben Broussard
|
||
|
/s/ Mushahid Khan
|
Director
|
|
|
Mushahid Khan
|
||
|
/s/ Edward Kuntz
|
Director
|
|
|
Edward Kuntz
|
||
|
/s/ Peter Mitchell
|
Director
|
|
|
Peter Mitchell
|
||
|
/s/ Stacey B. Crenshaw
|
Director
|
|
|
Stacey B. Crenshaw
|
||
90
TABLE OF CONTENTS
Part IItem 1. BusinessItem 1A. Risk FactorsItem 1B. Unresolved Staff CommentsItem 2. PropertiesItem 3. Legal ProceedingsItem 4. Mine Safety DisclosuresPart IIItem 5. Market For Regisrant's Common Equity, Related Stockholder Matters and Issuer Purchases Of Equity SecuritiesItem 5. Market For Regisrant's Common Equity, Related Stockholder Matters and IssuerItem 7. Management S Discussion and Analysis Of Financial Condition and Results Of OperationsItem 7A. Quantitative and Qualitative Disclosures About Market RiskItem 8. Financial Statements and Supplementary DataItem 9. Changes in and Disagreements with Accountants on Accounting and Financial DisclosureItem 9A. Controls and ProceduresItem 9B. Other InformationPart IIIItem 10. Directors, Executive Officers and Corporate GovernanceItem 11. Executive CompensationItem 12. Security Ownership Of Certain Beneficial Owners and Management and Related Stockholder MattersItem 13. Certain Relationships and Related Party Transactions, and Director IndependenceItem 14. Principal Accounting Fees and ServicesPart IVItem 15. Exhibits and Financial Statement SchedulesItem 16. Form 10-k Summary