SIMPLY GOOD FOODS CO
UNITED STATES
SECURITIES AND EXCHANGE COMMISSION
Washington, D.C. 20549
_______________________________________________________
FORM 10-K
_______________________________________________________
|
(Mark One)
|
|
|
ý
|
ANNUAL REPORT PURSUANT TO SECTION 13 OR 15(d) OF THE SECURITIES EXCHANGE ACT OF 1934
|
|
For the fiscal year ended August 31, 2019
|
|
|
OR
|
|
|
o
|
TRANSITION REPORT PURSUANT TO SECTION 13 OR 15(d) OF THE SECURITIES EXCHANGE ACT OF 1934
|
|
For the transition period from to
|
|
Commission File Number: 001-38115
___________________________________________________________________________________________________________
The Simply Good Foods Company
(Exact name of registrant as specified in its charter)

___________________________________________________________________________________________________________
|
Delaware
|
82-1038121
|
|
|
(State or other jurisdiction of incorporation or organization)
|
(I.R.S. Employer Identification No.)
|
|
1225 17th Street, Suite 1000
Denver, CO 80202
(Address of principal executive offices and zip code
)
(303) 633-2840
(Registrant's telephone number, including area code)
___________________________________________________________________________________________________________
Securities registered pursuant to Section 12(b) of the Act:
|
Title of each class
|
Trading symbol
|
Name of each exchange on which registered
|
||
|
Common Stock, par value $0.01 per share
|
SMPL
|
Nasdaq Capital Market
|
||
Securities registered pursuant to Section 12(g) of the Act:
None
Indicate by check mark if the registrant is a well-known seasoned issuer, as defined in Rule 405 of the Securities Act. Yes ☐ No
ý
Indicate by check mark if the registrant is not required to file reports pursuant to Section 13 or Section 15(d) of the Act. Yes ☐
No
ý
Indicate by check mark whether the registrant (1) has filed all reports required to be filed by Section 13 or 15(d) of the Securities Exchange Act of 1934 during the preceding 12 months (or for such shorter period that the registrant was required to file such reports), and (2) has been subject to such filing requirements for the past 90 days. Yes
ý
No
☒
Indicate by check mark whether the registrant has submitted electronically every Interactive Date File required to be submitted pursuant to Rule 405 of Regulation S-T (§232.405 of this chapter) during the preceding 12 months (or for such shorter period that the registrant was required to submit such files). Yes
ý
No ☐
Indicate by check mark whether the registrant is a large accelerated filer, an accelerated filer, a non-accelerated filer, a smaller reporting company, or an emerging growth company. See the definitions of “large accelerated filer,” “accelerated filer,” “smaller reporting company” and “emerging growth company” in Rule 12b-2 of the Exchange Act.
|
Large accelerated filer
|
ý
|
|
Accelerated filer
|
☐
|
|
Non-accelerated filer
|
☐
|
|
Smaller reporting company
|
☐
|
|
|
|
Emerging growth company
|
☐
|
|
If an emerging growth company, indicate by check mark if the registrant has elected not to use the extended transition period for complying with any new or revised financial accounting standards provided pursuant to Section 13(a) of the Exchange Act. ☐
Indicate by check mark whether the registrant is a shell company (as defined in Rule 12b-2 of the Exchange Act). Yes ☐ No
ý
The aggregate market value of the common stock held by non-affiliates of the registrant as of February 22, 2019, the last trading day of the registrant's most recently completed second fiscal quarter was approximately
$1.4 billion
based on the closing price of
$20.74
for one share of common stock, as reported on the Nasdaq Capital Market on that date.
As of
October 25, 2019
, there were
95,294,519
shares of common stock, par value $0.01 per share, issued and outstanding.
DOCUMENTS INCORPORATED BY REFERENCE
Certain portions of the registrant’s definitive proxy statement, in connection with its
2020
annual meeting of stockholders, to be filed within 120 days after the end of fiscal year ended
August 31, 2019
, are incorporated by reference into Part III of this Annual Report on Form 10‑K.
The Simply Good Foods Company and Subsidiaries
TABLE OF CONTENTS
|
Page
|
||
2
Cautionary Note Regarding Forward Looking Statements
This Form 10-K (this “Report”) contains forward-looking statements within the meaning of Section 21E of the Securities Exchange Act of 1934, as amended (the “Exchange Act”). When used anywhere in this Report, the words “expect,” “believe,” “anticipate,” “estimate,” “intend,” “plan” and similar expressions are intended to identify forward-looking statements. These statements relate to future events or our future financial or operational performance and involve known and unknown risks, uncertainties and other factors that could cause our actual results, levels of activity, performance or achievement to differ materially from those expressed or implied by these forward-looking statements. We caution you that these forward-looking statements are not guarantees of future performance and involve risks, uncertainties and assumptions that are difficult to predict. You should not place undue reliance on forward-looking statements. These statements reflect our current views with respect to future events, are based on assumptions and are subject to risks and uncertainties. These forward-looking statements include, among other things, statements about our ability to continue to operate at a profit, our ability to maintain current operation levels, our ability to maintain and gain market acceptance for our products or new products, our ability to capitalize on attractive opportunities, our ability to respond to competition and changes in the economy, the Acquisition (as defined herein) not being completed in the timeframe expected by us or at all, delays or failures relating to the financing of the Acquisition, unexpected costs, charges or expenses resulting from the Acquisition, failure to realize the anticipated benefits of the Acquisition, difficulties and delays in achieving the synergies and cost savings in connection with the Acquisition, changes in the business environment in which we operate including general financial, economic, capital market, regulatory and political conditions affecting us and the industry in which we operate, changes in consumer preferences and purchasing habits, our ability to maintain adequate product inventory levels to timely supply customer orders, the effect of the Tax Cuts and Jobs Act of 2017 on our business, changes in taxes, tariffs, duties, governmental laws and regulations, the availability of or competition for other brands, assets or other opportunities for investment by us or to expand our business, competitive product and pricing activity, difficulties of managing growth profitably, the loss of one or more members of our or of Quest’s (as defined herein) management team, and other risks and uncertainties indicated in this Report, including those set forth under “Risk Factors” in this Report. Important factors could cause actual results to differ materially from those indicated or implied by forward-looking statements such as those contained in documents we have filed with the U.S. Securities and Exchange Commission (the “SEC”), including in this Report in “Management’s Discussion and Analysis of Financial Condition and Results of Operations,” “Risk Factors” and those contained in subsequent reports we will file with the SEC. All forward-looking statements in this Report are qualified entirely by the cautionary statements included in this Report and such other filings. These risks and uncertainties or other important factors could cause actual results to differ materially from results expressed or implied by forward-looking statements contained in this Report. These forward-looking statements speak only as of the date of this Report. We undertake no intention or obligation to update or revise any forward-looking statements, whether as a result of new information, future events or otherwise, and readers should not rely on the forward-looking statements as representing the Company’s views as of any date subsequent to the date of the filing of this Report.
Explanatory Note
The Simply Good Foods Company (“Simply Good Foods”) was formed on March 30, 2017, to consummate a business combination (the “Business Combination”) between Conyers Park Acquisition Corp. (“Conyers Park”) and NCP-ATK Holdings, Inc. (“Atkins”), which occurred on July 7, 2017 (the “Closing Date”). As a result, Simply Good Foods owns all of the equity in Atkins.
Conyers Park, a special purpose acquisition company, was formed in 2016 for the purpose of effecting a merger, capital stock exchange, asset acquisition, stock purchase, reorganization or similar business combination with one or more businesses. Simply Good Foods is listed on the Nasdaq Capital Market under the symbol “SMPL.”
As a result of the Business Combination, Simply Good Foods is the acquirer, and for accounting purposes, the “Successor,” while Atkins is the acquiree, and accounting predecessor. Our financial statement presentation includes the financial statements of Atkins as “Predecessor” for periods prior to the Closing Date and of Simply Good Foods for periods after the Closing Date, including the consolidation of Atkins. The historical financial information of Conyers Park, prior to the Business Combination, are not reflected in the Predecessor financial statements as those amounts are considered de-minimis. As a result of the application of the acquisition method of accounting the financial statements, the Predecessor period and the Successor period are presented on a different basis of accounting and are therefore not comparable.
Unless the context otherwise requires, “we,” “us,” “our” and the “Company” refer, for periods prior to the completion of the Business Combination, to Atkins and its subsidiaries, and, for periods upon or after the completion of the Business Combination, to The Simply Good Foods Company and its subsidiaries. In context, “Atkins” may also refer to the Atkins
®
brand.
3
PART I
Item 1. Business
Simply Good Foods was formed in Delaware on March 30, 2017, to consummate the Business Combination, which occurred on July 7, 2017. As a result, Simply Good Foods owns all of the equity in Atkins.
Our principal executive offices are located at 1225 17
th
Street, Suite 1000, Denver, Colorado, 80202. Our telephone number is (303) 633-2840. We maintain a web site at
www.thesimplygoodfoodscompany.com
.
Overview
Simply Good Foods is a developer, marketer and seller of branded nutritional foods and snacking products. Our highly-focused product portfolio consists primarily of nutrition bars, ready-to-drink (“RTD”) shakes, snacks and confectionery products marketed under the Atkins®, SimplyProtein®, and Atkins Endulge® brand names. Our goal is to lead the nutritious snacking movement with trusted brands that offer a variety of convenient, innovative, great-tasting, “better-for-you” snacks and meal replacements. Over the past 45 years, Atkins has become an iconic American brand that for many consumers stands for “low carb,” “low sugar” and “protein rich” nutrition. The Atkins approach focuses on a healthy nutritional approach with reduced levels of refined carbohydrates and sugars and encourages the consumption of lean protein, fiber, fruits, vegetables and healthy fats.
In our core Atkins snacking business, we strive to offer a complete line of nutrition bars, RTD shakes and confections that satisfy hunger while providing consumers with a convenient, “better-for-you” snacking alternative. Our sales, marketing and R&D capabilities enable us to distribute products into a national customer base across the mass merchandiser, grocery, drug, club stores, e-commerce, and small format retail such as convenience and gas station. We believe that Atkins’ broad brand recognition, our depth of management talent and strong cash generation position us to continue to innovate in the Atkins brand and acquire other brands, and thereby become an industry leading snacking platform. To that end, in December 2016, Atkins completed the acquisition of Wellness Foods, Inc. (“Wellness Foods”), a Canada-based developer, marketer and seller of the SimplyProtein® brand that is focused on protein-rich and low-sugar products. On August 21, 2019, we announced that we entered into a definitive agreement to acquire Quest Nutrition, LLC, a healthy, lifestyle food brand. See “Recent Developments” for additional information on the Acquisition.
We believe snacking occasions are on the rise as consumers crave convenient, healthy and delicious foods, snacks and meal replacements for their on-the-go lifestyles. We believe our emphasis on nutrition bars and RTD shakes positions us to capitalize on consumers’ busy schedules. We believe a number of existing and emerging consumer trends within the U.S. food and beverage industry will continue to both drive the growth of the nutritional snacking category and increase the demand for our product offerings. Some of these trends include increased consumption of smaller, more frequent meals throughout the day, consumers’ strong preference for convenient, “better-for-you” snacks, consumers’ greater focus on health and wellness, and consumers’ moves toward controlling carbohydrate and sugar consumption, as well as the trend of consumers seeking to add convenient sources of protein and fiber to their diets.
Recent Developments
Quest Acquisition
On August 21, 2019, we entered into a stock purchase agreement (the “Purchase Agreement”) with Voyage Holdings, LLC, a Delaware limited liability company (“Voyage Holdings”), VMG Quest Blocker, Inc., a Delaware corporation (“VMG Blocker”, and together with Voyage Holdings, the “Target Companies”), VMG Voyage Holdings, LLC, a Delaware limited liability company, VMG Tax-Exempt II, L.P. a Delaware limited partnership (together with VMG Voyage Holdings, LLC, the “VMG Sellers”) and other parties (collectively, the “Sellers”). Pursuant to the Purchase Agreement, the Company will acquire Quest Nutrition, LLC (“Quest”), a healthy lifestyle food company (the “Acquisition”) for a cash purchase price of $1.0 billion (subject to customary adjustments for the Target Companies' levels of cash, indebtedness, net working capital and transaction expenses as of the closing). The Acquisition is expected to close by the end of the 2019 calendar year, subject to satisfaction of customary closing conditions. There is no financing condition for the Acquisition.
We expect to realize several benefits from the Acquisition, including the following:
|
•
|
Highly Attractive, Complementary Portfolio of Nutritional Snacking Brands
. Quest's products (primarily bars, cookies, chips and pizza) compete in many of the attractive, fast growing sub-segments within the nutritional snacking category. Quest has an extremely loyal following and favorable demographic profile with strong appeal among consumers ages 18-35 that complements Atkins' strength among consumers 35+.
|
|
•
|
Scalable, Growth-Oriented Platform
. Given Quest's growth trajectory, innovation pipeline and identified cost synergies, we believe there is financial flexibility to continue investing in the Quest business and expand margins that should, over time, be relatively similar to Simply Good Foods.
|
4
|
•
|
Enhances Innovative Culture to Deliver on Shared Mission
. This transaction will enable Simply Good Foods to benefit from Quest's effectiveness within e-commerce, social platforms as well as specialty and other non-tracked distribution channels, while Quest will benefit from Simply Good Foods' expertise in building distribution in food/drug/mass channels and growing brand awareness via broad reach media.
|
|
•
|
Achievable Synergies
. The transaction delivers on key growth criteria while achieving an estimated $20 million in run-rate cost synergies over three years by leveraging efficiencies of scale.
|
|
•
|
Financial Overview
. The strategic acquisition of Quest provides Simply Good Foods with additional scale and is complementary to the Company's long-term net sales and Adjusted EBITDA growth algorithm.
|
Financing of the Acquisition
On October 9, 2019, we completed an underwritten public offering of 13,379,205 shares of our common stock at a price per share of $26.16 (the “Offering”), resulting in net proceeds to us of approximately $350.0 million, after deducting underwriting discounts and commissions and our estimated fees and expenses for the Offering. We intend to use these net proceeds to pay a portion of the purchase price and related fees and expenses for the Acquisition, or for general corporate purposes if the acquisition is not consummated.
We plan to fund the remainder of the Acquisition by using a significant portion of the approximately $265 million of cash on hand and committed financing pursuant to debt commitments from Barclays, Credit Suisse and Goldman Sachs.
Our Strengths
Powerful brand with strong consumer awareness and loyalty
. We are a leading player in the fast growing nutritional snacking category, and Atkins is one of the leading brands with scale in both nutrition bars and RTD shakes. The Atkins iconic brand has 83% aided brand awareness with U.S. consumers today, based on a study conducted by Atkins in July 2019. Our highly-focused snacking portfolio provides us with a leading position within retailers’ nutrition and wellness aisles, resulting in meaningful shelf space. Atkins’ ability to appeal to both weight management program consumers and consumers focused on everyday nutritious eating makes it a highly attractive and strategic brand for a diverse set of retailers across various distribution channels.
Aligned with consumer mega trends.
Increasing global concern about growing rates of obesity and weight-related diseases and other health issues has resulted in increased scientific, media and consumer focus on nutrition. Over 100 independent, peer reviewed, clinical studies show the benefits of controlling carbohydrates. Management believes that this focus is prompting consumers to rebalance their nutritional breakdown away from carbohydrates. In fact, 73% of consumers are seeking to lower their carbohydrate intake according to Health Focus International. Atkins brand attributes, “low carb,” “low sugar” and “protein rich” nutrition, are well aligned with consumer mega trends. In addition, consumers’ eating habits are gradually shifting towards increased convenience, snacking and meal replacement. Our portfolio of convenient and nutritious products as well as our ongoing effort to meet consumer demands for “cleaner labels,” which we define as products made with fewer, simpler and more recognizable ingredients, are strategically aligned with these trends.
Scalable snacking and food platform.
With the highly-recognized Atkins brand as an anchor, we have been able to grow our product offerings through our brand extensions and through acquisitions, such as the December 2016 acquisition of Wellness Foods and the pending acquisition of Quest, a healthy lifestyle food brand. Our in-house product development experience, combined with our outsourced manufacturing model, allow us to bring new products to market quickly. We pride ourselves on knowing our consumers and mining insights that lead to new products and ideas. We believe that we have the ability to leverage our strong relationships with our retail customers and distributors, brand building record, and category management expertise to help new products, brands and brand extensions gain distribution and consumer recognition, allowing us to continue to successfully expand our snacking platform.
Asset-light business with strong cash generation
. We retain core in-house capabilities including sales, marketing, brand management, customer relationships, product development, and supply-chain know-how, while partnering with a diversified pool of contract manufacturers and distributors to execute manufacturing and distribution. Outsourcing these competencies allows us to focus our efforts on innovation, marketing and sales to strive to meet consumer demands. Our lean infrastructure allows for significant flexibility and speed-to-market and minimal capital investment, which translates into relatively consistent and robust free cash flow generation over time, driven by strong gross margins.
Experienced leadership team
. Simply Good Foods has an experienced team of industry veterans with extensive experience across multiple branded consumer products, food and nutrition categories. For example, our President and Chief Executive Officer, Joseph Scalzo, has significant experience operating packaged foods businesses, having served in various leadership roles at Dean Foods, WhiteWave Foods, The Gillette Company, The Coca-Cola Company, and The Procter & Gamble Company. Our management team's extensive experience is complemented by the significant industry expertise of our directors James Kilts, the former Chief Executive Officer of The Gillette Company and Nabisco, and former President of Kraft USA and Oscar Mayer, and David West, the former Chief Executive Officer of Big Heart Pet
5
Brands and The Hershey Company. Our management team’s deep expertise and proven track record in managing brands and operating packaged food businesses is a key driver of our success and positions Simply Good Foods as an attractive vehicle for future long-term growth within the snacking space and broader food category.
Our Strategies
Continue our advocacy, education and activation for core program consumers.
Consumers who purchase Atkins’ products have shown a strong affinity for the brand as evidenced by a relatively high level of servings per buyer, per year. Historically, our core target consumer base has consisted of individuals participating in branded weight management programs. These consumers are our most loyal, profitable and frequent purchasers. We use targeted television and print ads with a celebrity-based campaign that motivates the potential programmatic buyer to try the Atkins approach to weight loss. We retain these buyers with a value-added “tool-kit” of a resource-filled website and mobile app that contains all the content necessary to follow the Atkins approach successfully, including menu planners, shopping lists, carb counter, community support, inspirational success stories, and over 1,600 recipes. We have an active and growing digital and social presence, using a comprehensive approach of search, banner and search engine optimization efforts. We are a leader in social media, with a top-tier presence on Facebook, Instagram and Twitter. We also have a growing network of social influencers, who promote the Atkins philosophy in their targeted blogs. We believe that social media is a cost-effective way of continuing to attract and retain these core consumers. We expect our recently improved Atkins brand website and mobile application will continue to attract core consumers, including millennials, to our Atkins products. We believe that our ongoing efforts to educate consumers about the benefits of a lower carbohydrate lifestyle will further reinforce the brand to core consumers who are focused on a programmatic approach to weight management.
Further develop marketing strategy to reach self-directed low carbohydrate consumers
. We intend to continue to make focused changes to our approach to consumer outreach. According to an Information Resources, Inc. (“IRI”) study, over 50% of our current consumers are self-directed low carbohydrate eaters (not on a program diet) who buy and consume our products, despite the fact that historically, Atkins’ marketing and advertising have not been targeted towards them. Management expects that the brand’s redesigned marketing and advertising, such as our food-focused television advertising, will continue to be effective at reaching the large addressable market of self-directed low carbohydrate consumers. Additionally, social media continues to be an important component of our marketing tools and we have an active and growing presence on key social channels such as Facebook, Instagram and Twitter. During the
fifty-three week
period ended
August 31, 2019
, we had approximately
9 million
new visitors to our www.atkins.com website.
Innovate and expand the portfolio of product offerings to meet consumer demands for “cleaner labels,” higher protein products and new product forms.
Management expects that our ongoing efforts to meet consumer demands for “cleaner labels” will be effective at reaching self-directed low carbohydrate consumers, who are focused on weight management as part of overall health, wellness and “clean eating.” Management is committed to continually finding new and innovative formulations to reduce the number of product ingredients, as well as using “better for you” ingredients like nuts, fiber and whey protein in its existing products, while maintaining and improving taste and quality. In addition, we intend to continue to enhance, strengthen and expand our product offerings with new and innovative flavors and forms, simple ingredients and packaging alternatives, all while maintaining a commitment to delivering products that meet our nutritional profile and provide the convenience that consumers crave. Our in-house research and development laboratory allows us to develop new products internally and bring them to market quickly through our contract manufacturing network without diverging from high standards of taste, quality, safety and nutritional content. Additionally, we intend to satisfy developing consumer demands through the pursuit of merger and acquisition transactions, such as the December 2016 acquisition of Wellness Foods and our pending acquisition of Quest.
Expand distribution in white space opportunities.
In the
fifty-three week period ended August 31, 2019
, approximately
79%
of Atkins’ gross sales in the U.S. were through the mass retailer and grocery distribution channels. Management team believes there is opportunity for the brand to further penetrate other distribution channels such as convenience and club stores. Management also believes that the development of the SimplyProtein
®
brand will allow us to expand distribution into the natural and specialty channel. In addition, while shoppers have become heavy consumers of e-commerce purchases generally, only approximately
5%
of Atkins’ gross sales for the
fifty-three week period ended August 31, 2019
were through its e-commerce channel. We intend to leverage our brand recognition to further develop the distribution channels through which we reach consumers, including through the expansion of the e-commerce channel.
Leverage platform to expand in attractive food and snacking categories
. Management believes the fragmented snacking category presents a substantial opportunity for consolidation and the opportunity to build, through disciplined acquisitions, a leading platform in the snacking space and broader food category. As a leader in nutritious snacking, we believe we have the unique capability to leverage our operating platform and customer relationships to expand beyond the Atkins brand. Our experienced management team has deep expertise in brand building to expand the business into additional brands and products in the snacking segment. Over time, we expect to continue seeking to identify and evaluate acquisition opportunities to complement our platform, and we see significant opportunity for growth and synergies in complementary adjacent snacking categories such as the “better-for-you” eating space.
6
Our Goals
Our goal for the Atkins and Simply Protein brands is to improve global health by providing products that are consistent with how a healthier world eats. To make this vision a reality, we strive to embed our brand as a part of everyday life through advocacy, education and innovation. For over 45 years, Atkins has become an iconic American brand that for many consumers stands for “low carb,” “low sugar” and “protein rich” nutrition. Our vision and mission, coupled with our belief that today’s consumer is looking for sustainable, healthy long-term habits, has inspired our focus on nutritional snacking. We believe that wellbeing is not just about weight loss or quick results, but also about a healthier approach to eating.
Our Approach to Healthy Living and Healthy Weight
Over 150 independent, peer reviewed, clinical studies support that eating the right foods can improve health, not only in terms of weight management, but also in terms of related chronic issues like Type 2 Diabetes and cardiovascular disease. We believe that we offer a balanced approach to nutrition that can result in better health.
Dr. Robert Atkins, a well-known cardiologist, discovered the beneficial effects of a low carbohydrate nutritional regimen on his patients and helped refine the modern understanding of human nutrition and its link to health. More people are recognizing that Atkins is the foundation of the new convention of eating right, and that the old convention of eating excess carbohydrates and sugar has actually contributed to global obesity. Dr. Atkins limited his patients’ intake of sugar and carbohydrates not only for the weight management benefits, but also because of the numerous other health benefits to his patients. While calorie control plays some role in wellness, studies show that it can be far more important to know what the body does with food and its components. We believe that controlling consumption of carbohydrates that the human body quickly turns into sugar is the single biggest factor in eating right. When there is too much sugar and too many carbohydrates in the bloodstream, the body stores them as fat. Many people do not know that starchy carbohydrates such as breads, pasta, cereal, rice and potatoes are really just complex chains of sugars. We believe that eating proteins and healthy fat, while controlling carbohydrate consumption are the foundation of eating right. In our opinion, the old conventional wisdom of “all calories are created equal,” no matter how many of them are sugars, is simply wrong—eating sugar floods the body with the wrong kind of fuel and sends the wrong metabolic signals. Our approach aims to satisfy appetite while creating more stable energy, a higher metabolism and less stored fat. The human body works better with the right fuel.
Our Products
Core Products
Our core products consist of nutrition bars, RTD shakes and confections under the Atkins and SimplyProtein brands.
Nutrition Bars.
To keep on-the-go consumers energized and fueled, our nutrition bars offer a convenient and effective solution, providing consumers with protein, fiber and a delicious taste. Atkins offers two main types of nutrition bars: Atkins Meal Bars and Atkins Snack Bars. Atkins Meal Bars contain 13 to 17 grams of protein, and are available in 11 different flavors. With 2 to 4 grams of net carbs, Atkins Snack Bars contain 7 to 13 grams of protein. Atkins offers 15 varieties of Atkins Snack Bars.
To add to Atkins’ portfolio of nutrition bars and snacks, in December 2016 we acquired Wellness Foods, a Canada-based company which owns the SimplyProtein
®
brand. Beginning in October 2018, we began selling SimplyProtein products in select U.S. stores and online. SimplyProtein products offer snacking solutions with simple, recognizable ingredients that contain satisfying protein and 3 grams of sugar or less. SimplyProtein crispy bars, baked bars and crunchy bites offer on-the-go snacks that are Non-GMO Project Verified and gluten free, with no artificial sweeteners, colors, flavors or preservatives.
RTD Shakes.
Our rich and creamy Atkins RTD shakes contain 10 to 15 grams of protein, as well as other important vitamins and minerals. Available in a variety of flavors, including cookies and crème, café caramel and creamy chocolate, RTD shakes are made with high quality ingredients and are designed to provide energy balance through the day. Our Plus RTD shakes contain 30 grams of protein, for our consumers seeking higher protein content.
Confections.
We believe our Atkins Endulge
®
line, which is designed to satisfy consumers’ sweet cravings, and which we call Treats, consists of delicious desserts without all of the added sugar. Atkins offers a variety of different Treats, such as peanut butter cups and pecan caramel clusters, each with only 1 gram of sugar or less and low net carbs, providing consumers with the option to indulge.
Other Products
Through third-party partnerships, we offer complementary Atkins branded frozen meals.
Licensed Frozen Meals.
Atkins signed a renewable seven-year license agreement with Bellisio Foods, Inc., or “Bellisio”, effective September 1, 2016, to license its frozen meals business. Bellisio manufactures, distributes, markets, promotes and sells Atkins frozen food
7
products under the Atkins licensed marks. These products include Atkins branded frozen breakfasts, lunches and dinners. With a large selection of meal types, including pizzas, breakfast bowls and more, we believe our frozen meals offer a great way to learn the basics of protein rich, low-carbohydrate and low-sugar eating in a simple, convenient and delicious way. The scope of the license includes all frozen meals across all retail channels (excluding online), in the U.S., Canada and Mexico.
Recipes.
We offer over 1,600 protein rich, low-carbohydrate and low-sugar recipes designed to help consumers achieve and maintain a healthy lifestyle, while still enjoying delicious food.
Marketing, Advertising and Consumer Outreach
Simply Good Foods believes advocacy and education are key foundations of our approach to growth. By increasing consumer awareness about the benefits of adopting a low-carbohydrate approach to healthy eating, we are able to capture a larger audience and spread our message about the benefits of a low-carbohydrate approach to healthy living. Accordingly, we have structured our marketing and advertising not only to promote our products, but also to educate consumers.
Target Demographics
Atkins has built a large consumer following, with its weight management consumer forming the core of a much larger group of consumers looking for a more nutritious lifestyle. These consumers are an important foundation for our business. They are loyal, profitable and frequent purchasers of Atkins’ products. Beyond this group, we believe that there is significant opportunity to expand Atkins’ marketing, education and products to consumers who are not necessarily looking for a weight loss plan, but rather are focused more generally on long-term low-carbohydrate healthy living. We refer to these consumers as self-directed low-carb consumers. We believe our brand is uniquely positioned to capture both branded program consumers and self-directed low-carb consumers, and as part of our growth initiatives, we direct our marketing and advertising efforts to capitalize on this significant incremental opportunity.
Branded Program Consumers.
We identify branded program consumers as those consumers open to a weight-management program. These consumers are typically of the belief that Atkins’ nutritional approach is effective, that Atkins’ food products generally make them less hungry than other approaches and that Atkins’ snacks are an effective way to facilitate weight management. Our primary message to these consumers is that our products and snacks enable weight management while still allowing consumers to maintain a sustainable and satisfying lifestyle. Atkins emphasizes to these consumers the emotional benefits of healthy living - increased energy, strength and self-esteem - and the simplicity and healthiness of its program.
Self-Directed Low-Carb Consumers.
We identify self-directed low-carb consumers as those consumers not interested in a directed, programmatic approach to weight management, but who rather are interested in low-carbohydrate and low-sugar principles. These consumers are generally of the view that lowering carbohydrate and sugar intake is a better, healthier way to eat and should result in weight loss and maintenance. Our primary message to these consumers is that we offer delicious low-carbohydrate food options to provide better choices for snacking and meals. Atkins emphasizes appetite appeal and a more generalized theme of controlling carbohydrate and sugar consumption rather than weight management.
Education and Consumer Knowledge
We believe the first step in expanding our consumer base and growing our business is educating consumers on the benefits of the Atkins approach to eating and teaching them how to make smarter food choices. In order to facilitate awareness of the health benefits of a low-carbohydrate, low-sugar and protein rich eating approach and spread knowledge of what we believe are the dangers of a carbohydrate rich diet, we have established a variety of marketing and advertising strategies to connect with consumers, including digital marketing and social media platforms, television advertising, celebrity endorsements and free online consumer tracking, management and facilitation tools. We find that the more consumers know about the science behind the Atkins approach to nutritious eating, the more likely they are to rebalance their nutrition away from carbohydrates.
Celebrity Endorsements
We utilize celebrity partnerships to increase consumer awareness of our products and serve as real-life motivational and inspirational success stories. Rob Lowe is currently our official brand spokesperson, as a follower of the Atkins nutritional approach for many years. Atkins has also partnered with other celebrities, such as Lauren Alaina and Alyssa Milano, who publicly attribute their weight loss to Atkins’ products and programs. By actively supporting Atkins’ products and nutritional approach, these celebrities serve as a valuable resource contemporizing the Atkins brand, educating consumers, encouraging them to learn more about Atkins and building brand awareness.
8
Television Advertising
In addition to digital marketing and social media, we also engage in television advertising. Atkins specifically uses television as a means to encourage more consumers to learn about Atkins, share success stories and increase consumer awareness regarding the benefits of low-carbohydrate and low-sugar eating approaches. In the
fifty-three week period ended August 31, 2019
, approximately
39%
of Atkins’ U.S. Selling and marketing expenses were spent on television advertising.
Atkins’ Tools
We maintain a dynamic arsenal of complimentary educational, nutritional and weight management tools, including a mobile app and tracker, carb counter, meal plans and shopping lists. We also maintain discussion boards and groups on the Atkins website and social media platforms to keep our consumers inspired, motivated, connected and informed.
Mobile App.
The Atkins mobile app allows consumers to search, track and plan their meals on their mobile phone or tablet. The app includes a comprehensive food search, which helps consumers find nutritional information for grocery items, restaurant meals, and Atkins-friendly recipes and products. The recently upgraded meal tracker allows consumers to track net carbs consumed based on their specific program. The progress tracker allows consumers to record their weight, body measurements and exercise to track weight loss to date and proximity to their goal weight. In addition, the mobile app includes over 1,000 recipes, making it simple to find and prepare low-carbohydrate and low-sugar meals.
Carb Counter
. On Atkins’ website, Atkins offers a user-friendly guide to count carbohydrates. The Carb Counter tracks hundreds of different foods to assist consumers in tracking their daily carb intake. Specifically, the Carb Counter focuses on net carbs that effect blood sugar.
Meal Plans & Shopping Lists
. Whether looking to cook or preferring grab-and-go, Atkins offers meal plans that fit a plethora of lifestyles. These meal plans are easily downloaded from Atkins’ website. These meal plans outline what consumers should eat throughout the day, including snacks.
Discussion Boards and Groups
. Atkins maintains discussion boards on its website so that its consumers can connect with Atkins professionals and other members of the Atkins community. The discussion boards allow consumers to engage with Atkins nutrition professionals to receive advice and encouragement. Groups, also available on the website, facilitate support and encouragement among consumers and allow them to connect with one another and share their interests and goals. There are over 100 groups that a consumer may join, such as “Vegetarians on Atkins,” “Atkins Newbies” and “Continuing to Lose Weight”. A consumer may even start his or her own group.
Digital Marketing and Social Media
We dedicate a sizeable portion of our marketing and advertising spend to digital marketing channels. We maintain a registered domain at
www.atkins.com
, which serves as the primary source of information regarding Atkins’ products. In fiscal
2019
, Atkins had approximately
9 million
new visitors to its website, based on internal tracking. The Atkins website is used as a platform for consumer testimonials and success stories, and as a means to communicate simple nutrition choices that we believe can deliver a healthy holistic lifestyle and sustainable weight management.
We use social media platforms extensively for online collaboration like iPhone and Android smartphone apps, Facebook, Instagram and Twitter. These platforms are fundamentally changing the way we engage with our consumers and allow Atkins to directly reach desirable target demographics, such as millennials.
Facebook.
We maintain an Atkins Facebook page, which we use to facilitate consumer services, distribute brand information and news, and publish videos and pictures promoting the brand. We also conduct regular contests and giveaways. As of October
2019
, Atkins had approximately
829,000
Facebook followers.
Instagram
. We maintain an Atkins Instagram account, @atkinsnutritionals, which we use as motivational, inspirational and aspirational publishing, and as an authentic representation of low-carb lifestyles. We frequently publish consumer success stories, and conduct regular contests for our consumers. As of October
2019
, Atkins had approximately
75,000
Instagram followers.
Twitter
. We maintain an active Atkins Twitter account, @atkinsinsider, which we use to disseminate trending news and information, as well as to publish short format tips, tricks and hacks. We also engage in chats with success stories, and conduct regular contests for our consumers. As of October
2019
, Atkins had approximately
41,000
Twitter followers.
9
Product Innovation
A portion of our sales is driven by new products, and as a result, we believe innovation is, and will continue to be, an important component of our business. We take a deliberate approach to new product development, focusing on enhancing existing products, innovating flavor and form varieties and expanding into adjacent snacking products. Our innovation model is designed to respond to competitive demands, with a primary focus on enhancing the quality and flavor of our products while simplifying composition and reducing the number of ingredients to meet consumer demands for cleaner labels.
Our innovation strategy is based on ongoing research into consumers’ healthy lifestyle and nutritional needs. We pride ourselves on knowing our consumers and developing products that meet their needs. The average Atkins consumers purchases about 45 servings per year with multi-year consumers purchasing nearly 95 servings annually. Providing variety in snacking options to our consumers is an important strategy in our product innovation. New flavors, textures and snacking formats, like our new peppermint patties, are important to meeting consumer needs.
Management believes that an important component of meeting consumers' nutritional needs is a focus on evolving current products and creating new products with cleaner and fewer ingredients. Accordingly, we are committed to continually finding new and innovative formulations to reduce the number of ingredients in our products, as well as using “better-for-you” ingredients like nuts, fiber and whey protein, while continually improving taste and quality.
We maintain an in-house research and development team as well as market research and consumer insight capabilities. Through our research and development lab in Louisville, Colorado, we control the brand’s innovations and product formulations from the ground up. By developing new products, prototypes and adjacencies in-house, we facilitate our core competencies in product innovation, and enhance our speed to market.
In addition, as part of our innovation process, we collaborate with nationally recognized third-party flavor houses and product development firms for new product development and then conduct our own proprietary consumer research to identify and improve upon new product concepts. We plan to continue to conduct extensive consumer research in order to develop successful new products including product flavor and concept testing, marketing and trend analysis and consumer prototype testing.
Management also believes the fragmented snacking category presents a substantial opportunity for consolidation and the opportunity to build, through disciplined acquisitions, a leading platform in the snacking space and broader food category. As a leader in nutritious snacking, management believes we have the unique capability to leverage our operating platform and customer relationships to expand beyond the Atkins brand. Our experienced management team has deep expertise in brand building to expand the business into additional brands and products in the snacking segment. Simply Good Foods is actively seeking to identify and evaluate new acquisition opportunities to complement the Atkins platform, as evidenced by our pending acquisition of Quest, and sees significant opportunity for growth and synergies in complementary adjacent snacking categories such as sports/active and adult nutritional snacks, salty snacks and protein snacks, as well as in the “better-for-you” eating space.
Intellectual Property
We own numerous domestic and international trademarks and other proprietary rights that are important to our business. Depending upon the jurisdiction, trademarks are valid as long as they are used in the regular course of trade and/or their registrations are properly maintained. We believe the protection of our trademarks, copyrights, patents, domain names, trade dress and trade secrets are important to our success. We aggressively protect our intellectual property rights by relying on a combination of watch services and trademark, copyright, patent, trade dress and trade secret laws, and through the domain name dispute resolution system. Atkins domain name is
www.atkins.com
, which has traffic of approximately
9 million
new visitors in
2019
based on internal estimates. We also own virtually all of the recipes and specifications to our products.
Competition
We compete primarily with nutritional snacking brands in large retail environments. The nutritional snacking industry is fragmented and highly competitive, and includes a number of diverse competitors.
Our identified competitors include, but are not limited to, CLIF Bar, KIND bars, Special K, Slimfast, Muscle Milk, Premier Nutrition and thinkThin. On August 21, 2019, we announced that we entered into a definitive agreement to acquire Quest, a healthy, lifestyle food brand. See “Recent Developments” for additional information on the Acquisition.
We believe that the principal competitive factors in the nutritional snacking and weight management industries are:
|
•
|
ingredients;
|
|
•
|
taste;
|
10
|
•
|
low-carbohydrate, low-sugar, protein rich versus other nutritional approaches;
|
|
•
|
convenience;
|
|
•
|
brand awareness and loyalty among consumers;
|
|
•
|
media spending;
|
|
•
|
product variety and packaging; and
|
|
•
|
access to retailer shelf space.
|
We believe that we currently compete effectively with respect to each of these factors. However, a number of companies in the nutritional snacking and weight management industry have greater financial resources, more comprehensive product lines, broader market presence, longer standing relationships with distributors and suppliers, longer operating histories, greater distribution capabilities, stronger brand recognition and greater marketing resources than we have.
Supply Chain
We operate an asset-light business model. For the manufacture of our products, we subcontract with contract manufacturers, and as a result, our operations are highly flexible and require minimal capital expenditure. The supply chain for our international business also uses exclusively contract manufacturers, and is completely separate from our North American supply chain, which is described below.
U.S. Supply Chain
. The majority of our products are shipped directly to one central warehouse, which is a leased warehouse managed by a third-party logistics provider who then distributes products to customers. For certain customers, RTD shakes are shipped directly from the contract manufacturer to the customer's location. In addition, our use of demand forecasting and vendor-managed inventory systems enable us to meet shipping demands, ensure timely delivery of orders and offer service levels to our customers.
Sourcing.
The principal ingredients to manufacture our products include chocolate and other coatings, dairy, proteins, soy and nuts. Our packaging supplies consist of flexible film, cartons, tetra paper and corrugate. All of our core ingredients are purchased according to rigorous standards to assure food quality and safety. These core ingredients are generally available in adequate quantities from suppliers. We visit with major suppliers to source competitively priced, quality ingredients that meet our standards. We manage actively the cost of some ingredients including milk protein concentrate, whey proteins, chocolate coatings, some nuts, soy crisps and liquid soy, as well as packaging—corrugated, film, printed boxes and tetra paper.
Manufacturing.
We rely on contract manufacturers to manufacture our products. The contract manufacturers schedule and purchase ingredient inventory independently, according to parameters set in their contracts and forecasts we provide. Our contract manufacturers are regularly audited by third parties and are required to follow rigorous food safety guidelines. We believe our contract manufacturers have capacity to meet our anticipated supply needs, although short term high demand can cause disruptions. We monitor both near-term and long-term capacity as well as fulfillment rates and overall performance of our manufacturing partners and qualify alternate suppliers as needed. We receive finished products from our contract manufacturers, which includes all packaging and ingredients used, as well as an agreed-upon tolling charge for each item produced. These finished products are then shipped directly to our distribution center in Greenfield, Indiana, or shipped directly from the contract manufacturer to the customer, in the case of RTDs to select customers.
U.S. Storage.
We have one leased distribution center in Greenfield, Indiana, referred to as the Distribution Center, where we store finished goods. The Distribution Center has approximately
423,000
square feet of floor space.
Distribution.
For the majority of our customers, our logistics provider distributes the finished goods via truckloads from our Distribution Center, which first flow through regional terminals. At the terminals, our orders are consolidated with other customer orders. The finished goods are then distributed to retailer distribution centers. The regular weekly shipments and consolidation have diminished our costs. We manage approximately
44%
of outgoing volume by writing our own orders to retailer distribution centers and maintaining agreed finished goods inventory levels at their warehouse(s). For direct to customer shipments, a third party logistic provider ships products directly from a contract manufacturer's warehouse to the customer.
Retailers.
We have a wide variety of customers across the mass, food, club, drug, and e-commerce channels. Walmart Stores, Inc. (“Walmart”), our largest customer represents approximately
44%
of consolidated sales of Simply Good Foods in fiscal year
2019
, of which approximately
36%
is through their mass retail channel and approximately
8%
is through their club channel. No other customer represents more than 10% of sales.
E-Commerce
. We aim to ensure that our consumers may access our brand in the way that best suits their lifestyles by offering home delivery of Atkins’ snacking products. We sell our products on Atkins.com as well as Amazon.com.
Food Safety and Quality.
Food safety and quality is a top priority and we dedicate substantial resources to ensure that consumers receive safe, high quality food products. Our products are manufactured in facilities that have programs and controls in place regarding
11
consistent quality and food safety. Product attributes, such as taste, aroma, texture and appearance are regularly monitored. Good Manufacturing Practices and comprehensive food safety programs are designed to produce a safe, wholesome product. Our suppliers are required to have equally robust processes in place and confirm their compliance with product specifications with Letters of Guaranty and Certificates of Analysis for shipments of core ingredients to be used in our products. Finally, random samples of finished goods are regularly sent to a third-party laboratory for testing.
International
. Our products are also sold outside North America. Our top international sales are in Australia/New Zealand and the Netherlands. For the
fifty-three week period ended August 31, 2019
, international net sales represented approximately
5%
of total net sales. Our international supply chain is self-sufficient and run by a lean team solely focused on international operations. Similar to U.S. operations, international operations utilize contract manufacturers for products, and distributors for distributions and sales.
Atkins’ History
Dr. Robert Atkins was a cardiologist who discovered that by controlling carbohydrate consumption in his patients, he could improve their health and lower their weight. In 1972, Dr. Robert Atkins published a book, Dr. Atkins’ Diet Revolution, and became famous as a diet doctor. He also founded a company, Atkins Nutritionals, to make food products that were consistent with his approach to nutrition. In the 1980s and 1990s, Atkins was a doctor-founded diet brand. In 2003, Atkins was acquired from its founders by Parthenon and Goldman Sachs Capital Partners. In the early 2000s, in the midst of the low carb diet craze, the Atkins diet was the most popular diet in the U.S., with one in two adults claiming they were using Atkins for weight loss. The strategy pursued by management at that time was to proliferate the brand into numerous categories within the grocery store. Atkins launched over 1,100 SKUs in categories such as bread, macaroni and cheese, ice cream, barbecue sauce, vitamin pills and supplements—categories well beyond Atkins’ core snacking business. As the low carb diet craze faded, those new products did not sell well and Atkins filed for bankruptcy in 2005. Atkins re-emerged from bankruptcy in 2006, and was subsequently acquired by North Castle Partners in 2007. Atkins repositioned the business based on two strategies: a focus on core, programmatic weight loss consumers, and a focus on healthy snacking. Roark Capital Group (“Roark“) acquired Atkins in 2010. Atkins positioned the brand to consumers as a balanced approach to weight loss and upgraded the snacking products to improve taste and expand flavor variety. Supported by increased levels of marketing spending, those strategies resulted in eight consecutive years of U.S. Multi-Outlet Retail Sales growth. In 2016, Atkins evolved its strategy to continue to target consumers focused on a programmatic approach to weight loss, while adding a new target consumer: self-directed low carbohydrate consumers, who prefer a self-directed, rather than programmatic, approach to nutrition. Since 2016, Atkins has purposefully and thoughtfully broadened the brand, positioning toward a healthier approach to eating, while focusing on the core snacking business.
Segments
Our business is organized around one reportable segment that sells its branded nutritional foods and snacking products designed around the nutrition principles of the Atkins eating approach, which is based on our go-to-market strategies, the objectives of the business and how our chief decision maker, the CEO, monitors operating performance and allocates resources.
Employees
As of
August 31, 2019
, we had approximately
150
employees, including international employees. None of the U.S. employees are represented by a labor union or are covered by a collective bargaining agreement. We believe that we have good relations with our employees.
Regulation and Compliance
Along with contract manufacturers, brokers, distributors, ingredients and packaging suppliers, Simply Good Foods is primarily subject to laws and regulations in the United States promulgated by federal, state and local government authorities. In the United States, the federal agencies governing the manufacture, distribution and advertising of products including, among others, the U.S. Federal Trade Commission (“FTC”), the U.S. Food and Drug Administration (“FDA”), the United States Department of Agriculture (“USDA”), the U.S. Environmental Protection Agency and the Occupational Safety and Health Administration and similar state and local agencies. Under various statutes, these agencies, among other things, prescribe the requirements and establish the standards for quality and safety and regulate marketing and advertising to consumers. Certain of these agencies, in certain circumstances, must not only approve products, but also review the manufacturing processes and facilities used to produce these products before they can be marketed in the United States.
Simply Good Foods is subject to labor and employment laws, laws governing advertising, privacy laws, safety regulations and other laws, including consumer protection regulations that regulate retailers or govern the promotion and sale of merchandise. Our operations, and those of our contract manufacturers, distributors and suppliers, also are subject to various laws and regulations relating to environmental protection and worker health and safety matters. We continue to monitor their development and our compliance.
12
Food-Related Regulations
As a manufacturer and distributor of food products, we are subject to a number of food-related regulations, including the Federal Food, Drug and Cosmetic Act and regulations promulgated thereunder by the FDA. This comprehensive regulatory framework governs the manufacture (including composition and ingredients), labeling, packaging and safety of food in the United States. The FDA:
|
•
|
regulates manufacturing practices for foods through its current good manufacturing practices regulations;
|
|
•
|
specifies the standards of identity for certain foods, including many of the products we sell; and
|
|
•
|
prescribes the format and content of certain information required to appear on food product labels
|
We are subject to the Food Safety Modernization Act of 2011, which, among other things, mandates that the FDA adopt preventative controls to be implemented by food facilities in order to minimize or prevent hazards to food safety. We are subject to numerous other federal, state and local regulations involving such matters as the licensing and registration of manufacturing facilities, enforcement by government health agencies of standards for our products, inspection of our facilities and regulation of our trade practices in connection with the sale of food products.
Environmental Regulations
We are subject to various state and federal environmental laws, regulations and directives, including the Food Quality Protection Act of 1996, the Clean Air Act, the Clean Water Act, the Resource Conservation and Recovery Act, the Federal Insecticide, Fungicide and Rodenticide Act and the Comprehensive Environmental Response Compensation and Liability Act of 1980, as amended.
We believe that we are in material compliance with the environmental regulations applicable to our business. We do not expect the cost of our continued compliance to have a material effect on our capital expenditures, earnings, cash flows or competitive position in the foreseeable future. In addition, any asset retirement obligations are not material.
Labeling Regulations
We are subject to various labeling requirements with respect to our products at the federal, state and local levels. At the federal level, the FDA has authority to review product labeling, and the FTC may review labeling and advertising materials, including online and television advertisements, to determine if advertising materials are misleading. We are also subject to various state and local consumer protection laws. We believe we are in material compliance with all labeling laws and regulations applicable to our business.
Available Information
We file annual, quarterly and current reports, proxy statements and other information with the SEC.
We file our reports with the SEC electronically through the SEC’s Electronic Data Gathering, Analysis and Retrieval (“EDGAR”) system. The SEC maintains an Internet site that contains reports, proxy and information statements and other information regarding companies that file electronically with the SEC through EDGAR. The address of this Internet site is
www.sec.gov
.
We also make available free of charge through our website at
www.thesimplygoodfoodscompany.com
our Form 10-K, Quarterly Reports on Form 10-Q, Current Reports on Form 8-K, and amendments to those reports filed or furnished pursuant to Section 13(a) or 15(d) of the Exchange Act as soon as reasonably practicable after we electronically file such material with, or furnish it to, the SEC. We are not, however, including the information contained on our website, or information that may be accessed through links on our website, as part of, or incorporating such information by reference into, this Report.
13
Item 1A. Risk Factors
An investment in our securities involves a high degree of risk. You should carefully consider the risks described below before making an investment decision. Our business, prospects, financial condition or operating results could be harmed by any of these risks, as well as other risks not currently known to us or that we currently consider immaterial. The trading price of our securities could decline due to any of these risks, and, as a result, you may lose all or part of your investment.
Risks Related to our Business
We may not be able to compete successfully in the highly competitive nutritional snacking industry.
The nutritious snacking industry is large and intensely competitive because consumers are seeking simpler, “cleaner” and more sustainable eating habits. Our business is committed to providing people a more nutritious way to eat. As a result, we compete in the nutritional snacking industry, which is included in the general snack foods industry. Competitive factors in the nutritional snacking industry include product quality, taste, brand awareness among consumers, nutritional content, simpler and less processed ingredients, innovation of “on-trend” snacks, variety of snacks offered, grocery aisle placement, access to retailer shelf space, price, advertising and promotion, product packaging and package design. We compete in this market against numerous multinational, regional and local companies principally on the basis of our low-carb, low-sugar and protein-rich nutritional content, product taste and quality, our brand recognition and loyalty, marketing, advertising, price and the ability to satisfy specific consumer dietary needs. An increasing focus on healthy and simpler products in the marketplace will likely increase these competitive pressures within the category in future periods.
Our competitors in the nutritional snacking industry include companies selling branded weight loss programs who support these programs by offering a wide variety of diet foods, meal replacement bars, shakes and nutritional supplements, and through the promotion of weight loss and weight management approaches such as paleo, vegan, gluten free, vegetarian and others. Views towards nutritional snacking, weight loss and management, and other nutritional approaches, are cyclical and trendy in nature, with constantly changing consumer perceptions. In addition to remaining competitive through the quality of our products, consumer perceptions of the Atkins’ weight management approach and the effectiveness of a low-carb, low-sugar and protein-rich eating approach must continue to be viewed favorably, or our business and reputation may be materially and adversely affected. If other weight management approaches become more popular, or are generally perceived to be more effective than Atkins, we may not be able to compete effectively. Some of our competitors have substantially greater resources than us and sell brands that may be more widely recognized than Atkins’ brands. Our current and potential competitors may offer products similar to our products, a wider range of products than we offer, and may offer such products at more competitive prices than we do. Local or regional markets often have significant additional competitors, many of whom offer products similar to ours and may have unique ties to regional or national retail chains. Any increased competition from new entrants into the nutritional snacking industry or any increased success by existing competition could result in reductions in our sales, require us to reduce our prices, or both, which could materially and adversely affect our business, financial condition and results of operations.
If we fail to successfully implement our growth strategies on a timely basis, or at all, our ability to increase our revenue and operating profits could be materially and adversely affected.
Our future success depends, in large part, on our ability to implement our growth strategies effectively, including expanding on a low-carb, low-sugar and protein-rich healthy lifestyle while maintaining the traditional identity of our brands and the loyalty of our consumers. However, we may not succeed in implementing our growth strategies effectively. In December 2016, we transitioned from a single- to multibrand portfolio with the acquisition of Wellness Foods and the addition of the SimplyProtein® brand. On August 21, 2019, we announced our pending acquisition of Quest, a healthy lifestyle food company. We expect to focus on nutritional snacking in the future and intend to add additional brands to our product portfolio. As a multi-brand business, we face increased complexities and greater uncertainty with respect to consumer trends and demands than as a single-brand business. Our ability to successfully expand our nutritional snacking brands and other growth strategies depends on, among other things, our ability to identify, and successfully cater to, new demographics and consumer trends, develop new and innovative products, identify and acquire additional product lines and businesses, secure shelf space in grocery stores, wholesale clubs and other retailers, increase consumer awareness of our brands, enter into distribution and other strategic arrangements with third-party retailers and other potential distributors of our products, and compete with numerous other companies and products. In addition, self-directed lifestyle consumers of products may have different preferences and spending habits than the consumers of traditional weight loss products. We may not be successful in reaching and maintaining the loyalty of new consumers to the same extent, or at all, as we have with our historical consumers. We believe traditional weight management consumers actively on the Atkins program represent approximately 15% of our current consumer base whereas the remaining approximate 85% of our consumers are not currently on a program diet. We may not be successful in evolving our advertising and other efforts to appeal to both our branded weight loss consumers and self-directed healthy lifestyle consumers. If we are unable to identify and capture new audiences and demographics, our ability to successfully integrate additional brands will be adversely affected. Accordingly, we may not be able to successfully implement our growth strategies, expand our brands, or continue to maintain growth in our sales at our current rate, or at all. If we fail to implement our growth strategies or if we invest resources in growth strategies that ultimately prove unsuccessful, our sales and profitability may be negatively affected, which would materially and adversely affect our business, financial condition and results of operations.
14
If we do not continually enhance our brand recognition, increase distribution of our products, attract new consumers to our brands and introduce new and innovative products, either on a timely basis or at all, our business may suffer.
The nutritional snacking industry is subject to rapid and frequent changes in consumer demands. Because consumers are constantly seeking new products and strategies to achieve their healthy eating goals, our success relies heavily on our ability to continue to develop and market new and innovative products and extensions. New product sales represent a growing and important portion of our net sales. In order to respond to new and evolving consumer demands, achieve market acceptance and keep pace with new nutritional, weight management, technological and other developments, we must constantly introduce new and innovative products into the market, some of which may not be accepted by consumers, may be sent to market prematurely or may not be consistent with our quality and taste standards. Accordingly, we may not be successful in developing, introducing on a timely basis or marketing any new or enhanced products. If we are unable to commercialize new products, our revenue may not grow as expected, which would materially and adversely affect our business, financial condition and results of operations.
We rely on sales to a limited number of retailers for a substantial majority of our net sales, and the loss of one or more such retailers may materially harm our business. In addition, we maintain “at will” contracts with these retailers, which do not require recurring or minimum purchase amounts of our products.
A substantial majority of our sales are generated from a limited number of retailers. Sales to our largest retailer, Walmart, represented approximately
44%
of sales in fiscal year
2019
, of which approximately
36%
is through their mass retail channel and approximately
8%
is through their club channel. Although the composition of our significant retailers may vary from period-to-period, we expect that most of our net sales will continue to come from a relatively small number of retailers for the foreseeable future. These retailers may take actions that affect us for reasons that we cannot anticipate or control, such as their financial condition, changes in their business strategy, operations, the perceived quality of their products and the introduction of competing products. There can be no assurance that Walmart or our other significant retailers will continue to purchase our products in the same quantities or on the same terms as in the past, particularly as increasingly powerful retailers continue to demand lower pricing.
Our retailers typically do not provide us with firm, long- or short-term volume purchase commitments. As a result, we could have periods with little to no orders for our products while still incurring costs related to workforce maintenance, marketing, general corporate and debt service. Furthermore, despite operating in different channels, our retailers sometimes compete for the same consumers. As a result of actual or perceived conflicts resulting from competition, retailers may take actions that negatively affect us. We may not be able to find new retailers to supplement our revenue in periods when we experience reduced purchase orders, or recover fixed costs as a result of experiencing reduced purchase orders. Periods of reduced purchase orders could materially and adversely affect our business, financial condition and results of operations.
Conversely, from time to time, we may experience unanticipated increases in orders of our products from these retailers that can create supply chain problems and may result in unfilled orders. If we are unable to meet increased demand for our products, our reputation with these retailers may be harmed. Unanticipated fluctuations in product requirements could result in fluctuations in our results from quarter-to-quarter. Consolidation among retailers may also materially and adversely affect our results. An increase in the concentration of our sales to large customers may negatively affect our profitability due to the effect of higher shelving fees and reduced volumes of product sold. Furthermore, as retailers consolidate or account for a larger percentage of our sales, they may reduce the number of branded products they offer in order to accommodate private label products and pressure us to lower the prices of our products.
Our growth may be limited if we are unable to add additional shelf or retail space for our products.
Our results depend on our ability to drive revenue growth, in part, by expanding the distribution channels for our products. Our ability to do so may be limited by an inability to secure new retailers, or additional shelf and retail space for our products. Shelf and retail space for nutritional snacks is limited and subject to competitive and other pressures. There can be no assurance that retailers will provide sufficient, or any, shelf space, nor that online retailers will provide online access to their platform to enable us to meet our growth objectives.
Consumers generally shop for the Atkins brand first, then choose a product form or flavor second. Our ability to shelf all of Atkins' products together in one area at retail enables consumers to easily find all Atkins products when shopping. Any customer decision to separate Atkins products by form (bars, RTDs or confections) could negatively affect our business.
Unattractive shelf placement and pricing may put our products at a disadvantage compared to those of our competitors. Even if we obtain shelf space or preferable shelf placement, our new and existing products may fail to achieve the sales expectations set by our retailers, potentially causing these retailers to remove our products from their shelves. Additionally, an increase in the quantity and quality of private-label products in the product categories in which we compete could create more pressure for shelf space and placement for branded products within each such category, which could materially and adversely affect our sales.
15
Changes in consumer preferences, perceptions of healthy food products and discretionary spending may negatively affect our brand loyalty and net sales, and materially and adversely affect our business, financial condition and results of operations.
We focus on products that are, or that we believe are, perceived to have positive effects on health, and compete in a market that relies on innovation and evolving consumer preferences. The processed food industry in general, and the nutritional snacking industry in particular, is subject to changing consumer trends, demands and preferences. Emerging science, Atkins’ nutritional approach and theories regarding health are constantly evolving. Products or methods of eating once considered healthy may become disfavored by consumers, scientifically disproven or no longer be perceived as healthy. Trends within the food industry change often and our failure to anticipate, identify or react to changes in these trends could, among other things, lead to reduced consumer demand, shelf or retail space and price reductions, and could materially and adversely affect our business, financial condition and results of operations. Additionally, certain ingredients used in our products may become negatively perceived by consumers, resulting in reformulation of existing products to remove such ingredients, which may negatively affect the taste or other qualities of our products. Factors that may affect consumer perception of healthy products include dietary trends and attention to different nutritional aspects of foods, concerns regarding the health effects of specific ingredients and nutrients, trends away from specific ingredients in products and increasing awareness of the environmental and social effects of product production.
Consumer perceptions of the nutritional profile of low-carb, low-sugar and protein-rich eating practices and products may shift and consumers may no longer perceive products with fewer carbohydrates, higher levels of protein, higher levels of fat and additional fiber as healthy. Approaches regarding weight management and healthy lifestyles are the subject of numerous studies and publications, often with differentiating views and opinions, some of which may be adverse to us. Conflicting scientific information on what constitutes good nutrition, diet fads and other weight loss trends may materially and adversely affect our business from time to time. Our success depends, in part, on our ability to anticipate the tastes and dietary habits of consumers and other consumer trends and to offer products that appeal to their needs and preferences on a timely and affordable basis. A change in consumer discretionary spending, due to economic downturn or other reasons may also materially and adversely affect our sales, and our business, financial condition and results of operations.
The loss of, a disruption in or an inability to efficiently operate our fulfillment network could materially and adversely affect our business, financial condition and results of operations.
For our U.S. operations, we utilize a single distribution center in Greenfield, Indiana. Substantially all of our inventory is shipped directly to our retailers from this center by a third-party operator. We rely significantly on the orderly operation of this center. If complications arise, or if the facility is damaged or destroyed, our ability to deliver inventory on a timely basis will be significantly impaired, which could materially and adversely affect our business.
We rely on a single-sourced logistics provider for distribution and product shipments in the United States. Our utilization of delivery services for shipments is subject to risks that may affect the ability to provide delivery services that adequately meet our shipping needs including increases in fuel prices, employee strikes and inclement weather. From time to time, we may change third-party transportation providers and we could face logistical difficulties that could adversely affect deliveries. In addition, we could incur costs and expend resources in connection with such change, and fail to obtain terms as favorable as those we currently receive.
Disruptions at our distribution facility or in our operations due to natural or man-made disasters, fire, flooding, terrorism or other catastrophic events, system failure, labor disagreements or shipping problems may result in delays in the delivery of products to retailers.
Shortages or interruptions in the supply or delivery of our core ingredients, packaging and products could materially and adversely affect our operating results as we rely on a limited number of third-party suppliers to supply our core ingredients and a limited number of contract manufacturers to manufacture our products.
The core ingredients used in manufacturing our products include soy, nuts, dairy and cocoa. We rely on a limited number of third party suppliers to provide these ingredients, a portion of which are international companies. There may be a limited market supply of any of these core ingredients. Any disruption in supply could materially and adversely affect our business, particularly our profitability and margins. Events that adversely affect our suppliers could impair our ability to obtain core ingredient inventories in the quantities desired. Such events include problems with our suppliers’ businesses, finances, labor relations, ability to import core ingredients, costs, production, insurance, reputation and weather conditions during growing, harvesting or shipping, including flood, drought, frost and earthquakes, as well as man-made disasters or other catastrophic occurrences.
Our financial performance depends in large part on our ability to purchase core ingredients and packaging in sufficient quantities at competitive prices. We may not have continued supply, pricing or exclusive access to core ingredients and packaging from these sources. Any of our suppliers could discontinue or seek to alter their relationships with us. We may be adversely affected by increased demand for our specific core ingredients, a reduction in overall supply of required core ingredients, suppliers raising their prices, and increases in the cost of packaging and distributing core ingredients. Additionally, we may be adversely affected if suppliers stop selling to us or enter into arrangements that impair their abilities to provide us with core ingredients.
16
We rely on a limited number of contract manufacturers to manufacture our products. If any of these manufacturers experience adverse effects on their businesses or are unable to continue manufacturing our products at required levels, on a timely basis, or at all, we may be forced to seek other manufacturers. In addition, our contract manufacturers independently contract for and obtain some of the core ingredients in our products. If contract manufactures are unable to obtain these core ingredients in the required amounts or at all, their ability to manufacture our products would be adversely affected. It could take a significant period of time to locate and qualify such alternative production sources. We may not be able to identify and qualify new manufacturers in a timely manner that could allocate sufficient capacity to meet our requirements, which could adversely affect our ability to make timely deliveries of products. Furthermore, we may be unable to negotiate pricing or other terms with existing or new manufacturers as favorable as what we currently enjoy. In addition, there is no guarantee a new manufacturing partner could accurately replicate the production process and taste profile of the existing products.
We are subject to risks associated with protection of our trade secrets by our third party contract manufacturers. If our contract manufacturers fail to protect our trade secrets, either intentionally or unintentionally, our business, financial condition and results of operations could be materially and adversely affected. If we experience significant increased demand for our products, or need to replace an existing supplier or manufacturer, additional supplies of core ingredients or manufacturers may not be available when required, on acceptable terms, or at all. Suppliers may not allocate sufficient capacity to meet our requirements, fill our orders in a timely manner or meet our strict quality standards. Even if our existing suppliers and manufacturers are able to expand their capacities to meet our needs, or we are able to find new sources of core ingredients or new contract manufacturers, we may encounter delays in production, inconsistencies in quality and added costs. We may not be able to pass increased costs onto the consumer immediately, if at all, which may decrease or eliminate our profitability. Any manufacturing and/or supply disruptions or cost increases could have an adverse effect on our ability to meet consumer demand for our products and result in lower net sales and profitability, both in the short and long term.
We rely in part on our third-party contract manufacturers to maintain the quality of our products. The failure or inability of contract manufacturers to comply with the specifications and requirements of our products could result in product recall, which could materially and adversely affect our reputation and subject us to significant liability should the consumption of any of our products cause or be claimed to cause illness or physical harm. Our products implicate risks such as product contamination, spoilage, product tampering, other adulteration, mislabeling and misbranding. We also license certain products that contain our brand and logo, but which are produced and distributed exclusively by third parties of whom we have limited control. In addition, we do not own our warehouse facility, but it is managed for us by a third party.
Under certain circumstances, we may be required to, or may voluntarily, recall or withdraw products. For example, in 2016, as part of a larger national recall by several other food companies, we incurred losses, including recalled product as a result of potential contamination from an ingredient supplied to one of our third-party manufacturers at their manufacturing center. While the contamination did not result in any consumer illness, and we were indemnified for a substantial portion of our direct product loss, the recall may have damaged our reputation. A widespread recall or withdrawal of any of ours or Atkins’ licensed products may negatively and significantly affect our sales and profitability and could result in significant losses depending on the costs of the recall, destruction of product inventory, reduction in product availability, and reaction of competitors and consumers.
We may be subject to claims or lawsuits, including class actions lawsuits (which could significantly increase any adverse settlements or rulings) or judgments, resulting in liability for actual or claimed injuries, illness or death. Any of these events could materially and adversely affect our business, financial condition and results of operations. Whether or not a product liability claim or lawsuit is unsuccessful or is not fully pursued, the negative publicity surrounding any assertion that our products caused illness or physical harm could adversely affect our reputation with existing and potential consumers and our corporate and brand image. Moreover, claims or liabilities of this sort might not be covered by our insurance or by any rights of indemnity or contribution that we may have against others. We maintain product liability insurance in an amount that we believe to be adequate. However, we may incur claims or liabilities for which we are not insured or that exceed the amount of our insurance coverage. A product liability judgment against us or a product recall could materially and adversely affect our business, financial condition and results of operations.
Ingredient and packaging costs are volatile and may rise significantly, which may negatively affect the profitability of our business.
We negotiate the prices for large quantities of core ingredients, such as soy, nuts, dairy and cocoa, as well as packaging materials. A number of these ingredients are manufactured and packaged in Canada. Costs of ingredients and packaging are volatile and can fluctuate due to conditions that are difficult to predict, including global competition for resources, fluctuations in currency and exchange rates, weather conditions, natural or man-made disasters, consumer demand and changes in governmental trade and agricultural programs. Continued volatility in the prices of the core ingredients and other supplies we purchase could increase our cost of goods sold and reduce our profitability.
We do not use hedges or forward pricing for availability of any core ingredients. As such, any material upward movement in core ingredient pricing could negatively affect our margins if we are not able to pass these costs on to our consumers, or our sales if we are forced to increase our prices. If we are not successful in managing our ingredient and packaging costs, if we are unable to increase our prices to cover increased costs or if such price increases reduce our sales volumes, then such increases in costs will materially and adversely affect our business, financial condition and results of operations.
17
Certain of our core ingredient contracts have minimum volume commitments that could require purchases without matching revenue during weaker sales periods. Future core ingredient prices may be effected by new laws or regulations, tariffs, suppliers’ allocations to other purchasers, interruptions in production by suppliers, natural disasters, volatility in the price of crude oil and related petrochemical products and changes in exchange rates.
Severe weather conditions and natural disasters such as fires, floods, droughts, hurricanes, earthquakes and tornadoes can affect crop supplies, manufacturing facilities and distribution activities, and negatively affect the operating results of our business.
Severe weather conditions and natural disasters, such as fires, floods, droughts, frosts, hurricanes, earthquakes, tornadoes, insect infestations and plant disease, may affect the supply of core ingredients used to make food products, or may prevent the manufacturing or distribution of food products by third parties. Competing manufacturers might be affected differently by weather conditions and natural disasters, depending on the location of their sources of supplies and manufacturing or distribution facilities. If supplies of core ingredients available to us are reduced, we may not be able to find enough supplemental supply sources on favorable terms, which could materially and adversely affect our business, financial condition and results of operations. In addition, because we rely on few contract manufacturers for a majority of our manufacturing needs and a single distribution warehouse, adverse weather conditions could affect the ability for those third-party operators to manufacture and store our products.
If our brands or reputation are damaged, the perception of our brand by our consumers, distributors and retailers may diminish, which could materially and adversely affect our business, financial condition and results of operations.
We believe we have built our reputation on the efficacy of our nutritional approach, as well as the high quality flavor and nutritional content of our food. We must protect and expand on the value of our brands to continue to be successful in the future. Any incident that erodes consumer affinity for our brands could significantly reduce our value and damage our business. For example, negative third-party reports regarding the Atkins nutritional approach or the quality of our food, whether accurate or not, may adversely affect consumer perceptions, which could in turn cause the Atkins’ brand value to suffer and adversely affect our business. In addition, if we are forced, or voluntarily elect, to recall certain products, including frozen foods or licensed products over which we may not have full quality control, the public perception of the quality of our food may be diminished. We may also be adversely affected by news or other negative publicity, regardless of accuracy, regarding other aspects of our business, such as public health concerns, illness, safety, security breaches of confidential consumer or employee information, employee related claims relating to alleged employment discrimination, health care and benefit issues or government or industry findings concerning our retailers, distributors, manufacturers or others across the industry supply chain.
As part of our marketing initiatives, we have entered into agreements with certain public figures to market and endorse our products. While we maintain specific selection criteria and are diligent in our efforts to seek out public figures that resonate genuinely and effectively with our consumer audience, the individuals we choose to market and endorse our products may fall into negative favor with the general public. Because our consumers may associate the public figures that market and endorse our products with us, any negative publicity on behalf of such individuals may result in negative publicity about us and our products. This negative publicity could materially and adversely affect our brand and reputation as well as our revenue and profits.
Negative information, including inaccurate information, about us on social media may harm our reputation and brand, which could have a material and adverse effect on our business, financial condition and results of operations.
There has been a marked increase in the use of social media platforms and similar channels that provide individuals with access to a broad audience of consumers and other interested persons. The availability of information on social media platforms is virtually immediate, as is its effect. Many social media platforms immediately publish the content their subscribers and participants post, often without filters or checks on accuracy of the content posted. The opportunity for dissemination of information, including inaccurate information, is potentially limitless. Information concerning our business and/or products may be posted on such platforms at any time. Negative views regarding our products and the efficacy of the Atkins eating approach have been posted on various social media platforms, may continue to be posted in the future, and are out of our control. Regardless of their accuracy or authenticity, such information and views may be adverse to our interests and may harm our reputation and brand. The harm may be immediate without affording an opportunity for redress or correction. Ultimately, the risks associated with any such negative publicity cannot be eliminated or completely mitigated and may materially and adversely affect our business, financial condition and results of operations.
We must expend resources to maintain consumer awareness of our brands, build brand loyalty and generate interest in our products. Our marketing strategies and channels will evolve and our programs may or may not be successful.
We believe that the Atkins nutritional approach is broadly known and followed in the United States and many other countries in which we operate. In order to remain competitive and expand and keep shelf placement for our products, we may need to increase our marketing and advertising spending to maintain and increase consumer awareness, protect and grow our existing market share or promote new products, which could affect our operating results. Substantial advertising and promotional expenditures may be required to maintain or improve our brand’s market position or to introduce new products to the market, and participants in our industry are increasingly engaging with non-traditional media, including consumer outreach through social media and web-based channels, which may not prove successful. An increase
18
in our marketing and advertising efforts may not maintain our current reputation, or lead to increased brand awareness. Moreover, we may be unable to maintain current awareness of our brand due to any potential fragmentation of our marketing efforts as we continue to focus on a low-carb, low-sugar and protein-rich nutritional approach for everyday snacking consumers. In addition, we consistently evaluate our product lines to determine whether or not to discontinue certain products. Discontinuing product lines may increase our profitability but could reduce our sales and hurt our brands, and a reduction in sales of certain products could result in a reduction in sales of other products. The discontinuation of product lines may have an adverse effect on our business, financial condition and results of operations.
If we are unable to maintain or increase prices, our margins may decrease.
We rely in part on price increases to offset cost increases and improve the profitability of our business. Our ability to maintain prices or effectively implement price increases may be affected by a number of factors, including competition, effectiveness of our marketing programs, the continuing strength of our brand, market demand and general economic conditions, including inflationary pressures. During challenging economic times, consumers may be less willing or able to pay a price premium for our branded products and may shift purchases to lower-priced or other value offerings, making it more difficult for us to maintain prices and/or effectively implement price increases. In addition, our retail partners and distributors may pressure us to rescind price increases that we have announced or already implemented, whether through a change in list price or increased promotional activity. If we are unable to maintain or increase prices for our products or must increase promotional activity, our margins may be adversely affected. Furthermore, price increases generally result in volume losses, as consumers purchase fewer units. If such losses are greater than expected or if we lose distribution due to a price increase, our business, financial condition and results of operations may be materially and adversely affected.
We intend to grow through acquisitions or joint ventures and we may not successfully integrate, operate or realize the anticipated benefits of such business combinations.
As part of our strategic initiatives, we intend to pursue acquisitions or joint ventures, such as our acquisition of Wellness Foods and the pending Acquisition of Quest, a healthy lifestyle food company. Our acquisition strategy is based on identifying and acquiring brands with products that complement our existing products and identifying and acquiring brands in new categories and new geographies for the purpose of expanding our platform of nutritional snacks and potentially other food products. Although we regularly evaluate multiple acquisition candidates, we cannot be certain that we will be able to successfully identify suitable acquisition candidates, negotiate acquisitions of identified candidates on favorable terms, or integrate acquisitions that we complete.
Acquisitions involve numerous risks and uncertainties, including intense competition for suitable acquisition targets, which could increase target prices and/or materially and adversely affect our ability to consummate deals on favorable terms, the potential unavailability of financial resources necessary to consummate acquisitions, the risk that we improperly value and price a target, the potential inability to identify all of the risks and liabilities inherent in a target company or assets notwithstanding our diligence efforts, the diversion of management’s attention from the day-to-day operations of our business and additional strain on our existing personnel, increased leverage resulting from the additional debt financing that may be required to complete an acquisition, dilution of our net current book value per share if we issue additional equity securities to finance an acquisition, difficulties in identifying suitable acquisition targets or in completing any transactions identified on sufficiently favorable terms and the need to obtain regulatory or other governmental approvals that may be necessary to complete acquisitions.
Any future acquisitions may pose risks associated with entry into new geographic markets, including outside the United States and our current international markets, distribution channels, lines of business or product categories, where we may not have significant prior experience and where we may not be as successful or profitable as we are in businesses and geographic regions where we have greater familiarity and brand recognition. Potential acquisitions may entail significant transaction costs and require a significant amount of management time and distraction from our core business, even where we are unable to consummate or decide not to pursue a particular transaction.
In addition to the risks above, even when acquisitions are completed, integration of acquired entities can involve significant difficulties. These include failure to achieve financial or operating objectives with respect to an acquisition, systems, operational and managerial controls and procedures, the need to modify systems or to add management resources, difficulties in the integration and retention of consumers or personnel and the integration and effective deployment of operations or technologies, amortization of acquired assets (which would reduce future reported earnings), possible adverse short-term effects on cash flows or operating results, integrating personnel with diverse backgrounds and organizational cultures, coordinating sales and marketing functions and failure to obtain and retain key personnel of an acquired business. Failure to manage these acquisition growth risks could have an adverse effect on our business.
For more information, please see “Risks Related to the Acquisition” below.
Our indebtedness could materially and adversely affect our financial condition and ability to operate our company, and we may incur additional debt.
As of
August 31, 2019
, we had approximately
$196.5 million
in outstanding indebtedness and a revolving credit facility with availability of $75 million. We also intend to fund a portion of the purchase price of the Acquisition with committed financing pursuant to
19
additional debt commitments from Barclays, Credit Suisse and Goldman Sachs. Our current and future debt level and the terms of our debt arrangements could materially and adversely affect our financial condition and limit our ability to successfully implement our growth strategies. In addition, under the credit facilities governing our indebtedness, we have granted the lenders a security interest in substantially all of our assets, including the assets of our subsidiaries and an affiliate.
Our ability to meet our debt service obligations will depend on our future performance, which will be affected by the other risk factors described herein. If we do not generate enough cash flow to pay our debt service obligations, we may be required to refinance all or part of our existing debt, sell our assets, borrow more money or raise equity. We may not be able to take any of these actions on a timely basis, on terms satisfactory to us, or at all.
The credit facilities governing our debt arrangements contain financial and other covenants.
The credit facilities governing our existing debt arrangements contain certain financial and other covenants. Our revolving credit facility has a maximum total net leverage ratio equal to or less than 6.25:1.00 (with a reduction to 6.00:1.00 on and after the third anniversary of the closing date of the credit facilities) contingent on credit extensions in excess of 30% of the total amount of commitments available under the revolving credit facility, and limitations on our ability to, among other things, incur and/or undertake asset sales and other dispositions, liens, indebtedness, certain acquisitions and investments, consolidations, mergers, reorganizations and other fundamental changes, payment of dividends and other distributions to equity and warrant holders, and prepayments of material subordinated debt, in each case, subject to customary exceptions materially consistent with credit facilities of such type and size. Any failure to comply with the restrictions of the credit facilities may result in an event of default. The credit facilities governing our existing debt arrangements bear interest at variable rates. If market interest rates increase, variable rate debt will create higher debt service requirements, which could materially and adversely affect our cash flow.
Changes in interest rates may adversely affect our earnings and/or cash flows.
Our indebtedness under our revolving credit facility bears interest at variable interest rates that use the London Inter-Bank Offered Rate (“LIBOR”) as a benchmark rate. On July 27, 2017, the United Kingdom’s Financial Conduct Authority (“FCA”), which regulates LIBOR, announced that it intends to stop persuading or compelling banks to submit LIBOR quotations after 2021 (the “FCA Announcement”). The FCA announcement indicates that the continuation of LIBOR on the current basis cannot and will not be assured after 2021, and LIBOR may cease to exist or otherwise be unsuitable for use as a benchmark. Recent proposals for LIBOR reforms may result in the establishment of new methods of calculating LIBOR or the establishment of one or more alternative benchmark rates. Although our revolving credit facility provides for successor base rates, the successor base rates may be related to LIBOR, and the consequences of any potential cessation, modification or other reform of LIBOR cannot be predicted at this time. If LIBOR ceases to exist, we may need to amend our revolving credit facility, and we cannot predict what alternative interest rate(s) will be negotiated with our counterparties. As a result, our interest expense may increase, our ability to refinance some or all of our existing indebtedness may be effected and our available cash flow may be adversely affected.
All of our products must comply with regulations of the FDA as well as state and local regulations. Any non-compliance with the FDA or other applicable regulations could harm our business.
Our products must comply with various FDA rules and regulations, including those regarding product manufacturing, food safety, required testing and appropriate labeling of our products. The FDA has not defined nutrient content claims with respect to carbohydrates, but has not objected to the use of net carbohydrate information on food labels if the label adequately explains how the term is used so that it would not be false or misleading to consumers. The FDA requires all carbohydrates per serving to be listed on the Nutrition Facts Panel (“NFP”) of a package. In addition to the information on the NFP, we use the term “net carbohydrate” (or “net carbs”) on our Atkins' packaging to assist consumers in tracking the carbohydrates in that serving of food that effect their blood sugar (glucose) levels. We determine the number of net carbs in a serving by subtracting fiber, and sugar alcohols if any, from the actual number of carbohydrates listed on the NFP. Fiber and sugar alcohols can be subtracted from the carbohydrates because they minimally effect blood sugar. It is possible that FDA regulations and/or their interpretations may change related to, for example, definitions of certain of our core ingredients, such as fiber, labeling requirements for describing other ingredients or nutrients, such as sugar alcohols or protein, or disclosures of any ingredient labeled as genetically modified (“GMO”). As such, there is a risk that our products could become non-compliant with the FDA’s regulations, and any such non-compliance could harm our business.
In addition, if FDA or other regulations restrict us from labeling and marketing certain ingredients or product attributes, such as fiber or “net carb” count, we may be unable to effectively reach our target demographics, promote what we believe to be the benefits of our products or communicate that our products are composed of what we consider to be low-carb, low-sugar and protein-rich ingredients.
We must rely on the contract manufacturers we engage to produce our products to maintain compliance with applicable regulatory requirements. Although we require our contract manufacturers to be compliant with regulatory requirements, we do not have direct control over such facilities. Failure of our contract manufacturers to comply with applicable regulation could have a material and adverse effect on our business.
20
Conflicts between state and federal law regarding definitions of our core ingredients, as well as labeling requirements, may lead to non-compliance with state and local regulations. For example, certain states may maintain narrower definitions of certain ingredients, as well as more stringent labeling requirements, of which we are unaware. Any non-compliance at the state or local level could materially and adversely affect our business, financial condition and results of operations.
Our advertising is regulated for accuracy, and if our advertising is determined to be false or misleading, we may face fines or sanctions.
Our advertising is subject to regulation by the FTC under the Federal Trade Commission Act, which prohibits dissemination of false or misleading advertising. In addition, the National Advertising Division of the Council of Better Business Bureaus, Inc., which we refer to as NAD, administers a self-regulatory program of the advertising industry to ensure truth and accuracy in national advertising. NAD both monitors national advertising and entertains inquiries and challenges from competing companies and consumers. Should our advertising be determined to be false or misleading, we may have to pay damages, withdraw our campaign and possibly face fines or sanctions, which could have a material adverse effect on our sales and operating results.
Disruptions in the worldwide economy may materially and adversely affect our business, financial condition and results of operations.
Adverse and uncertain economic conditions may affect distributor, retailer and consumer demand for our products. In addition, our ability to manage normal commercial relationships with our suppliers, contract manufacturers, distributors, retailers, consumers and creditors may suffer. Consumers may shift purchases to lower-priced or other perceived value offerings during economic downturns, making it more difficult to sell our premium products. Due to the relative costs of our products, during economic downturns, it may be more difficult to convince consumers to switch to or continue to use our brands or convince new users to choose our brands without expensive sampling programs and price promotions. In particular, consumers may reduce their purchases of products without GMOs, gluten or preservatives when there are conventional offerings of similar products, which generally have lower retail prices. In addition, consumers may choose to purchase private-label products rather than branded products because they are generally less expensive. Distributors and retailers may become more conservative in their ordering in response to these conditions and seek to reduce their inventories. Our results of operations depend on, among other things, our ability to maintain and increase sales volume with our existing distributors and retailers, to attract new consumers and to provide products that appeal to consumers at prices they are willing and able to pay. Prolonged unfavorable economic conditions may have an adverse effect on our sales and profitability.
Changes in the legal and regulatory environment could limit our business activities, increase our operating costs, reduce demand for our products or result in litigation.
Elements of our business, including the production, storage, distribution, sale, display, advertising, marketing, labeling, health and safety practices, transportation and use of many of our products, are subject to various laws and regulations administered by federal, state and local governmental agencies in the United States, as well as the laws and regulations administered by government entities and agencies outside the United States in markets in which our products or components thereof, such as packaging, may be made, manufactured or sold. These laws, regulations and interpretations thereof may change, sometimes dramatically, as a result of a variety of factors, including political, economic or social events. Such factors may include changes in:
|
•
|
food and drug laws (including FDA regulations);
|
|
•
|
laws related to product labeling;
|
|
•
|
advertising and marketing laws and practices;
|
|
•
|
laws and programs restricting the sale and advertising of certain of our products;
|
|
•
|
laws and programs aimed at reducing, restricting or eliminating ingredients present in certain of our products;
|
|
•
|
laws and programs aimed at discouraging the consumption of products or ingredients or altering the package or portion size of certain of our products;
|
|
•
|
state consumer protection and disclosure laws;
|
|
•
|
taxation requirements, including the imposition or proposed imposition of new or increased taxes or other limitations on the sale of our products; competition laws;
|
|
•
|
anti-corruption laws, including the U.S. Foreign Corrupt Practices Act of 1977, as amended (the “FCPA”), and the UK Bribery Act of 2010 (the “Bribery Act”);
|
|
•
|
economic sanctions and anti-boycott laws, including laws administered by the U.S. Department of Treasury, Office of Foreign Assets Control (“OFAC”) and the European Union (“EU”);
|
|
•
|
laws relating to export, re-export, transfer, tariffs and import controls, including the Export Administration Regulations, the EU Dual Use Regulation and the customs and import laws administered by the U.S. Customs and Border Protection;
|
|
•
|
employment laws;
|
|
•
|
privacy laws;
|
21
|
•
|
laws regulating the price we may charge for our products; and
|
|
•
|
farming and environmental laws.
|
New laws, regulations or governmental policies and their related interpretations, or changes in any of the foregoing, including taxes, tariffs or other limitations on the sale of our products, ingredients contained in our products or commodities used in the production of our products, may alter the environment in which we do business and, therefore, may affect our operating results or increase our costs or liabilities. In addition, if we fail to adhere to such laws and regulations, we could be subject to regulatory investigations, civil or criminal sanctions, as well as class action litigation, which has increased in the industry in recent years.
Our geographic focus makes us particularly vulnerable to economic and other events and trends in North America.
We operate mainly in North America and, therefore, are particularly susceptible to adverse regulations, economic climate, consumer trends, market fluctuations, including commodity price fluctuations or supply shortages of key ingredients, and other adverse events in North America, including the U.S. and Canada. The concentration of our businesses in North America could present challenges and may increase the likelihood that an adverse event in North America would disproportionately materially and adversely affect product sales, financial condition and operating results.
Litigation or legal proceedings could expose us to significant liabilities and have a negative effect on our reputation.
From time to time, we may be party to various claims and litigation proceedings. We evaluate these claims and litigation proceedings to assess the likelihood of unfavorable outcomes and to estimate, if possible, potential losses. We may establish reserves, as appropriate based on the information available to management at the time. These assessments and estimates involve a significant amount of management judgment and may differ materially from actual outcomes.
There is an additional risk that potential litigation may lead to adverse publicity, consumer confusion, distrust and additional legal challenges for us. Should we become subject to related or additional unforeseen lawsuits, including claims related to our products, labeling or advertising, which may vary in accordance with state and federal rules and regulations, consumers may avoid purchasing our products or seek alternative products, even if the basis for the claims against us is unfounded.
Any consumer loss of confidence in the truthfulness of our labeling or ingredient claims would be difficult and costly to overcome and may significantly reduce our brand value. For example, publications and other third-party commentary may vary in opinion with respect to calculations of net carbs and vary on approach to calculations of net carbs, which may lead to reports questioning the accuracy of our calculations and reporting the amount of net carbs contained in certain of our products. Uncertainty among consumers as to the nutritional content or the ingredients used in our products, regardless of the cause, may have an adverse effect on our brands, business, results of operations and financial condition.
We may not be able to adequately protect our intellectual property and other proprietary rights that are material to our business.
Our ability to compete effectively depends in part upon protection of our rights in trademarks, trade dress, copyrights and other intellectual property rights we own or license. Our use of contractual provisions, confidentiality procedures and agreements, and trademark, copyright, unfair competition, trade secret and other laws to protect our intellectual property and other proprietary rights may not be adequate. We may not be able to preclude third parties from using our intellectual property with respect to food or beverage products, and may not be able to leverage our branding beyond our current product offerings. In addition, our trademark or other intellectual property applications may not always be granted. Third parties may oppose our intellectual property applications, or otherwise challenge our use of trademarks or other intellectual property. Third parties may infringe, misappropriate, or otherwise violate our intellectual property. Changes in applicable laws could serve to lessen or remove the current legal protections available for intellectual property. Any legal action that we may bring to protect our brand and other intellectual property could be unsuccessful, result is substantial costs and could divert management’s attention from other business concerns. A successful claim of trademark, copyright or other intellectual property infringement, misappropriation, or other violation against us could prevent us from providing our products or services, or could require us to redesign or rebrand our products or packaging if we are unable to license such third-party intellectual property on reasonable terms. Certain of our intellectual property licenses have fixed terms, and even for those that do not, we cannot guarantee that all of our intellectual property licenses will remain in effect indefinitely. Termination of intellectual property licenses granted by or to us could result in the loss of profits generated pursuant to such licenses. Any of the foregoing outcomes could materially and adversely harm our business, financial condition or results of our operations.
Any inadequacy, failure or interruption of our information technology systems may harm our ability to effectively operate our business, and our business is subject to online security risks, including security breaches and identity theft.
We are dependent on various information technology systems. A failure of our information technology systems to perform as we anticipate could disrupt our business. Our information technology systems may be vulnerable to damage or interruption from circumstances beyond our control, including natural disasters, terrorist attacks, telecommunications failures, computer viruses, hackers and other security
22
issues. Despite safeguards that we have implemented that are designed to prevent unauthorized access to our information technology systems, we cannot be certain that our information technology systems are free from vulnerability to security breaches (especially as the sophistication of cyber-security threats continues to increase), or from vulnerability to inadvertent disclosures of sensitive data by third parties or by us.
Unauthorized users who penetrate our information security systems could misappropriate proprietary, employee, or consumer information. As a result, it may become necessary to expend additional amounts of capital and resources to protect against, or to alleviate, problems caused by unauthorized access. Data security breaches could result in damaged reputation with consumers and reduced demand for our products. Additional expenditures may not prove to be a timely remedy against breaches by unauthorized users who are able to penetrate our information security. In addition to purposeful security breaches, the inadvertent transmission of computer viruses could adversely affect our computer systems and, in turn, harm our business.
A significant number of states require that consumers be notified if a security breach results in the disclosure of their personal financial account or other information. Additional states and governmental entities are considering such “notice” laws. In addition, other public disclosure laws may require that material security breaches be reported. If we experience a security breach, and such notice or public disclosure is required in the future, our reputation and our business may be harmed.
With the exception of limited information voluntarily submitted by users of our website, we typically do not collect or store consumer data or personal information. However, third-party providers, including our licensees, contract manufacturers, e-commerce contractors and third-party sellers may do so. The website operations of such third parties may be affected by reliance on other third-party hardware and software providers, technology changes, risks related to the failure of computer systems through which these website operations are conducted, telecommunications failures, data security breaches and similar disruptions. If we or our third-party providers fail to maintain or protect our respective information technology systems and data integrity effectively, fail to implement new systems, and/or update or expand existing systems or fail to anticipate, plan for or manage significant disruptions to systems involved in our operations, we could lose existing customers, have difficulty preventing, detecting, and controlling fraud, have disputes with customers, suppliers, distributors or others, and be subject to regulatory sanctions, including sanctions stemming from violations of the Health Insurance Portability and Accountability Act of 1996, and as a result, have increases in operating expenses.
If we are unable to implement appropriate systems, procedures and controls, we may not be able to successfully offer our products, grow our business and account for transactions in an appropriate and timely manner.
Our ability to successfully offer our products, grow our business and account for transactions in an appropriate and timely manner requires an effective planning and management process and certain other automated management and accounting systems. We currently do not have an integrated enterprise resource planning system and certain other automated management and accounting systems. We periodically update our operations and financial systems, procedures and controls; however; we still rely on manual processes and procedures that may not scale proportionately with our business growth. Our systems will continue to require automation, modifications and improvements to respond to current and future changes in our business. Failure to implement in a timely manner appropriate internal systems, procedures and controls could materially and adversely affect our business, financial condition and results of operations.
Our insurance may not provide adequate levels of coverage against claims.
We believe that we maintain insurance customary for businesses of our size and type. However, there are types of losses we may incur that cannot be insured against or that we believe are not economically reasonable to insure. Such losses could have a material adverse effect on our business, financial condition and results of operations.
Loss of our key executive officers or other personnel, or an inability to attract and retain such management and other personnel, could negatively affect our business.
Our future success depends to a significant degree on the skills, experience and efforts of our key executive officers. The loss of the services of any of these executives could materially and adversely affect our business and prospects, as we may not be able to find suitable individuals to replace them on a timely basis, if at all. Additionally, we also depend on our ability to attract and retain qualified personnel to operate and expand our business. If we fail to attract talented new employees, our business and results of operations could be negatively affected.
We may need additional capital in the future, and it may not be available on acceptable terms or at all.
We have historically relied upon cash generated by our operations to fund our operations and strategy. We may also need to access the debt and equity capital markets, however, these sources of financing may not be available on acceptable terms, or at all. Our ability to obtain additional financing will be subject to a number of factors, including market conditions, our operating performance, investor sentiment and our ability to incur additional debt in compliance with agreements governing our outstanding debt. These factors may make the timing, amount, terms or conditions of additional financing unattractive to us. If we are unable to generate sufficient funds from operations or raise additional capital, our growth could be impeded.
23
We have incurred and will continue to incur significantly increased costs as a result of operating as a public company, and our management has been and will continue to be required to devote substantial time to compliance efforts.
We have incurred and expect to continue to incur significant legal, accounting, insurance and other expenses as a result of being a public company. The Dodd-Frank Wall Street Reform and Customer Protection Act (the “Dodd-Frank Act”) and the Sarbanes-Oxley Act of 2002 (the
“
Sarbanes-Oxley Act
”)
, as well as related rules implemented by the SEC, have required changes in corporate governance practices of public companies. In addition, rules that the SEC is implementing or is required to implement pursuant to the Dodd-Frank Act are expected to require additional changes. Compliance with these and other similar laws, rules and regulations, including compliance with Section 404 of the Sarbanes-Oxley Act (“Section 404”), has and will continue to substantially increase expense, including our legal and accounting costs, and make some activities more time-consuming and costly. Our internal infrastructure may not be adequate to support our increased reporting obligations, and we may be unable to hire, train or retain necessary staff and may be reliant on engaging outside consultants or professionals to overcome our limited experience or employees which could adversely affect our business if our internal infrastructure is inadequate to fulfill our public company obligations. These laws, rules and regulations could also make it more expensive for us to obtain director and officer liability insurance and we may be forced to accept reduced policy limits and coverage or incur substantially higher costs to obtain the same or similar coverage. These laws and regulations could also make it more difficult for us to attract and retain qualified persons to serve on our board of directors, our board committees or as our executive officers.
If we do not maintain effective internal control over financial reporting, we could fail to report our financial results accurately.
Effective internal control over financial reporting is necessary for us to provide reliable financial reports. In the future, we may discover areas of our internal control over financial reporting that need improvement. Prior to the Business Combination, we had not historically documented our internal controls. If we identify a control deficiency that rises to the level of a material weakness in internal controls over financial reporting, our ability to record, process, summarize and report financial information timely and accurately may be adversely affected and, as a result, our financial statements may contain material misstatements or omissions. A material weakness is defined as a deficiency, or a combination of deficiencies, in internal control over financial reporting, such that there is a reasonable possibility that a material misstatement of the annual or interim financial statements will not be prevented or detected on a timely basis. In addition, our internal financial and accounting team is leanly staffed, which can lead to inefficiencies with respect to segregation of duties. If we fail to properly and efficiently maintain an effective internal control over financial reporting, we could fail to report our financial results accurately.
Our only significant asset is ownership of 100% of Atkins Intermediate Holdings, LLC and such ownership may not be sufficient to pay dividends or make distributions or loans to enable us to pay any dividends on our common stock or satisfy our other financial obligations.
We have no direct operations and no significant assets other than the direct ownership of 100% of Atkins Intermediate Holdings, LLC. We currently depend on Atkins Intermediate Holdings, LLC for distributions, loans and other payments to generate the funds necessary to meet our financial obligations and to pay any dividends with respect to our common stock. Legal and contractual restrictions in agreements governing our debt arrangements and future indebtedness of Atkins Intermediate Holdings, LLC, as well as the financial condition and operating requirements of Atkins Intermediate Holdings, LLC, may limit our ability to obtain funds in a timely manner from Atkins Intermediate Holdings, LLC. The earnings from, or other available assets of, Atkins Intermediate Holdings, LLC may not be sufficient to pay dividends, make distributions or loans to enable us to pay any dividends on our common stock, or satisfy our other financial obligations.
Our international operations expose us to regulatory, economic, political and social risks in the countries in which we operate.
The international nature of our operations involves a number of risks, including changes in U.S. and foreign regulations, tariffs, taxes and exchange controls, economic downturns, inflation and political and social instability in the countries in which we operate and our dependence on foreign personnel. Moreover, although our products in our foreign operations typically mirror those in the United States, consumers outside the United States may have different tastes, preferences and nutritional approaches than U.S. consumers. Our international business is small in comparison to our U.S. business, and as a result, our operations are more spread out which can add to our costs and limit our ability to effectively and timely react to adverse events. We cannot be certain that we will be able to enter and successfully compete in additional foreign markets or that we will be able to continue to compete in the foreign markets in which we currently operate.
Doing business outside the United States requires us to comply with the laws and regulations of the U.S. government and various foreign jurisdictions, which place restrictions on our operations, trade practices, partners and investment decisions. In particular, our operations are subject to U.S. and foreign anti-corruption and trade control laws and regulations, such as the FCPA or the Bribery Act, export controls and economic sanctions programs, including those administered by the OFAC and the EU. As a result of doing business in foreign countries and with foreign partners, we are exposed to a heightened risk of violating anti-corruption and trade control laws and sanctions regulations. The FCPA prohibits us from providing anything of value to foreign officials for the purposes of obtaining or retaining business or securing any improper business advantage. In addition, the Bribery Act extends beyond bribery of foreign public officials and also applies to transactions with private persons. The provisions of the Bribery Act are also more onerous than the FCPA in a number of other respects, including jurisdictional reach, non-exemption of facilitation payments and, potentially, penalties.
24
Our continued expansion outside the United States, including in developing countries, and our development of new partnerships and joint venture relationships worldwide, could increase the risk of FCPA, OFAC, Bribery Act or EU sanctions violations in the future. Violations of anti-corruption and trade control laws and sanctions regulations may cause reputational damage and are punishable by civil penalties, including fines, denial of export privileges, injunctions, asset seizures, debarment from government contracts and revocations or restrictions of licenses, as well as criminal fines and imprisonment.
Finally, our business could be negatively affected by changes in the U.S. and Canadian political environments, in particular. We operate primarily in the U.S. and Canada and we ship a large number of products between the U.S. and Canada. Adverse changes to trade agreements, import or export regulations, customs duties or tariffs by either or both governments may have a negative effect on our business, financial conditions and results of operations.
Our international operations expose us to fluctuations in exchange rates, which may materially and adversely affect our operating results.
We source large quantities of our core ingredients from foreign suppliers, and as a result, any material upward movement in foreign exchange rates relative to the U.S. dollar will adversely affect our profitability. Furthermore, the substantial majority of our revenue is generated domestically, while a substantial portion of our third party manufacturing is completed in Canada. Any U.S. dollar weakness may therefore materially and adversely affect revenue and cash flows while also increasing supply and manufacturing costs.
Risks Related to the Company's Common Stock
Our stock price may be volatile.
Our common stock is traded on the Nasdaq Capital Market (“Nasdaq”). The market price of our common stock has fluctuated in the past and could fluctuate substantially in the future, based on a variety of factors, including future announcements covering us or our key customers or competitors, government regulations, litigation, changes in earnings estimates by analysts, fluctuations in quarterly operating results or general conditions in our industry and may be exacerbated by the fact that there has historically been limited trading volume in our common stock. Furthermore, stock prices for many companies fluctuate widely for reasons that may be unrelated to their operating results. Those fluctuations and general economic, political and market conditions, such as recessions or international currency fluctuations and demand for our services, may adversely affect the market price of our common stock.
We do not expect to declare any dividends in the foreseeable future.
We do not anticipate declaring any cash dividends to holders of our common stock in the foreseeable future. Consequently, investors may need to rely on sales of their shares of common stock after the price has appreciated, which may never occur, as the only way to realize any future gains on their investment. Investors seeking cash dividends should not purchase our common stock.
Our amended and restated certificate of incorporation provides that, to the extent allowed by law, the doctrine of “corporate opportunity” does not apply with respect to the directors, officers, employees or representatives of Conyers Park Sponsor, LLC (“Conyers Park Sponsor
”
) Centerview Capital Holdings LLC (“Centerview Capital”) and Centerview Partners and their respective affiliates, excepted as provided below.
The doctrine of corporate opportunity generally provides that a corporate fiduciary may not develop an opportunity using corporate resources, acquire an interest adverse to that of the corporation or acquire property that is reasonably incident to the present or prospective business of the corporation or in which the corporation has a present or expectancy interest, unless that opportunity is first presented to the corporation and the corporation chooses not to pursue that opportunity. The doctrine of corporate opportunity is intended to preclude officers, directors or other fiduciaries from personally benefiting from opportunities that belong to the corporation. Our amended and restated certificate of incorporation provides that, to the extent allowed by law, the doctrine of “corporate opportunity” does not apply with respect to the directors, officers, employees or representatives of Conyers Park Sponsor, Centerview Capital and Centerview Partners and their respective affiliates. The doctrine of corporate opportunity shall apply with respect to any of our directors or officers with respect to a corporate opportunity that was offered in writing to such person solely in his or her capacity as our director or officer and such opportunity is one which they are legally and contractually permitted to undertake and would otherwise be reasonable for us to pursue. Therefore, except as provided above, these parties have no duty to communicate or present corporate opportunities to us, and have the right to either hold any corporate opportunity for their (and their affiliates’) own account and benefit or to recommend, assign or otherwise transfer such corporate opportunity to persons other than us.
As a result, certain of our stockholders, directors and their respective affiliates are not prohibited from operating or investing in competing businesses. We therefore may find ourselves in competition with certain of our stockholders, directors or their respective affiliates, and we may not have knowledge of, or be able to pursue, transactions that could potentially be beneficial to us. Accordingly, we may lose a corporate opportunity or suffer competitive harm, which could negatively affect our business or prospects.
25
If securities or industry analysts do not publish or cease publishing research or reports about us, our business, or our market, or if they change their recommendations regarding our common stock adversely, the price and trading volume of our common stock could decline.
The trading market for our common stock is influenced by the research and reports that industry or securities analysts publish about us, our business, our market or our competitors. Securities and industry analysts may not publish or may cease publishing research on us. If securities or industry analysts cease coverage, our stock price and trading volume may be negatively affected. If any of the analysts who cover us change their recommendation regarding our stock adversely, or provide more favorable relative recommendations about our competitors, the price of our common stock may decline. If any analysts were to cease coverage, or fail to regularly publish reports on our business, we could lose visibility in the financial markets, which could cause our stock price or trading volume to decline.
There may be future sales or other dilution of the Company's equity, which may adversely affect the market price of our common stock.
We are not generally restricted from issuing additional shares of common stock, or any securities that are convertible into or exchangeable for, or that represent the right to receive, shares of common stock. The issuance of any additional shares of common stock or preferred shares or securities convertible into, exchangeable for or that represent the right to receive shares of common stock or the exercise of such securities could be substantially dilutive to holders of our common stock. Additionally, 6,700,000 warrants to purchase our common stock on a one-for-one basis for an exercise price of $11.50 per share are outstanding. To the extent such warrants are exercised, additional shares of our common stock will be issued, which will result in dilution to our existing stockholders and increase the number of shares eligible for resale in the public market. Sales of substantial numbers of such shares in the public market could adversely affect the market price of our common stock.
The market price of our common stock could decline as a result of sales of our common stock made in the future or the perception that such sales could occur. Because our decision to issue securities in any future offering will depend on market conditions and other factors beyond our control, we cannot predict or estimate the amount, timing or nature of future offerings, if any. Thus, our stockholders bear the risk of future offerings reducing the market price of our common stock and diluting their holdings in the Company.
The Company's board of directors may issue, without stockholder approval, preferred stock with rights and preferences superior to those applicable to our common stock.
Our amended and restated certificate of incorporation includes a provision for the issuance of preferred stock, which may be issued in one or more series, with each series containing such rights and preferences as the board of directors may determine from time to time, without prior notice to or approval of stockholders. Among others, such rights and preferences might include the rights to dividends, liquidation preferences and rights to convert into common stock. The rights and preferences of any such series of preferred stock, if issued, may be superior to the rights and preferences applicable to the common stock and might result in a decrease in the price of our common stock.
Anti-takeover provisions contained in our amended and restated certificate of incorporation and second amended and restated bylaws, as well as provisions of Delaware law, could impair a takeover attempt.
Our amended and restated certificate of incorporation and second amended and restated bylaws contain provisions that may discourage unsolicited takeover proposals that stockholders may consider to be in their best interests. We are also subject to anti-takeover provisions under Delaware law, which could delay or prevent a change of control. Together these provisions may make the removal of management more difficult and may discourage transactions that otherwise could involve payment of a premium over prevailing market prices for our securities. These provisions include:
|
•
|
a staggered board providing for three classes of directors, which limits the ability of a stockholder or group to gain control of our board;
|
|
•
|
no cumulative voting in the election of directors, which limits the ability of minority stockholders to elect director candidates;
|
|
•
|
the right of our board of directors to elect a director to fill a vacancy created by the expansion of the board of directors or the resignation, death, or removal of a director in certain circumstances, which prevents stockholders from being able to fill vacancies on our board of directors;
|
|
•
|
the ability of our board of directors to determine whether to issue shares of our preferred stock and to determine the price and other terms of those shares, including preferences and voting rights, without stockholder approval, which could be used to significantly dilute the ownership of a hostile acquirer;
|
|
•
|
a prohibition on stockholder action by written consent, which forces stockholder action to be taken at an annual or special meeting of our stockholders;
|
|
•
|
a prohibition on stockholders calling a special meeting, which forces stockholder action to be taken at an annual of our stockholders or at a special meeting of our stockholders called by the chairman of the board, the chief executive officer of the board of directors pursuant to a resolution adopted by a majority of the board of directors;
|
26
|
•
|
the requirement that a meeting of stockholders may be called only by the board of directors, which may delay the ability of our stockholders to force consideration of a proposal or to take action, including the removal of directors;
|
|
•
|
providing that directors may be removed prior to the expiration of their terms by stockholders only for cause and upon the affirmative vote of a majority of the voting power of all outstanding shares of the combined company;
|
|
•
|
a requirement that changes or amends the amended and restated certificate of incorporation or the second amended and restated bylaws must be approved by at least 66⅔% of the voting power of our outstanding common stock; and
|
|
•
|
advance notice procedures that stockholders must comply with in order to nominate candidates to our board of directors or to propose matters to be acted upon at a stockholders’ meeting, which may discourage or deter a potential acquirer from conducting a solicitation of proxies to elect the acquirer’s own slate of directors or otherwise attempting to obtain control of the Company.
|
Risks Related to the Acquisition
If we fail to complete the Acquisition, we will not recognize the benefits we describe in this Report.
Although we have entered into the Purchase Agreement with respect to the Acquisition of Quest and its affiliated companies, we cannot guarantee when, or whether the Acquisition will be completed. The closing of the Acquisition is subject to customary conditions, and the Acquisition may not be completed as contemplated, or at all. If we are unable to complete the Acquisition, we will not realize many of the Acquisition benefits that are described in this Report, and the value of our common stock could be impaired.
We may not realize the expected benefits of the Acquisition because of integration difficulties and other challenges.
The success of the Acquisition will depend, in part, on our ability to realize all or some of the anticipated benefits from integrating Quest's business with our existing businesses. The integration process may be complex, costly and time-consuming. The difficulties of integrating the operations of Quest's business include, among others:
|
•
|
failure to implement our business plan for the combined business;
|
|
•
|
unanticipated issues in integrating co-manufacturing, logistics, information, communications and other systems;
|
|
•
|
possible inconsistencies in standards, controls, procedures and policies, and compensation structures between Quest's structure and our structure;
|
|
•
|
failure to retain key customers and suppliers;
|
|
•
|
unanticipated changes in applicable laws and regulations;
|
|
•
|
failure to retain key employees, and the complexities associated with integrating personnel from another company;
|
|
•
|
operating risks inherent in Quest's business and our business;
|
|
•
|
diversion of management's attention from other business concerns;
|
|
•
|
increasing the scope, geographic diversity and complexity of our operations; and
|
|
•
|
unanticipated issues, expenses and liabilities.
|
We may not be able to maintain the levels of revenue, earnings or operating efficiency that each of Simply Good Foods and Quest had achieved or might achieve separately. In addition, we may not accomplish the integration of Quest's business smoothly, successfully or within the anticipated costs or timeframe. If we experience difficulties with the integration process, the anticipated benefits of the Acquisition may not be realized fully, or at all, or may take longer to realize than expected.
We face risks associated with the Purchase Agreement in connection with the Acquisition.
In connection with the Acquisition, we will be subject to substantially all the liabilities of Quest that are not satisfied on or prior to the closing date. There may be liabilities that we underestimated or did not discover in the course of performing our due diligence investigation of Quest. Under the Purchase Agreement, the sellers have agreed to provide us with a limited set of representations and warranties. Our sole remedy from the sellers for any breach of those representations and warranties is an action for indemnification. Damages resulting from a breach of a representation or warranty could have a material and adverse effect on our financial condition and results of operations.
27
As a private company, Quest may not have in place an adequate system of internal control over financial reporting that we will need to manage that business effectively as part of a public company.
None of Quest and its affiliated companies have previously been subject to periodic reporting as a public company. There can be no assurance that Quest has in place a system of internal control over financial reporting that is required for public companies, and that will be required of us with respect to Quest when the Acquisition is completed. Establishing, testing and maintaining an effective system of internal control over financial reporting requires significant resources and time commitments on the part of our management and our finance and accounting staff, may require additional staffing and infrastructure investments, and would increase our costs of doing business. Moreover, if we discover aspects of Quest's internal controls that need improvement, we cannot be certain that our remedial measures will be effective. Any failure to implement required new or improved controls, or difficulties encountered in their implementation could harm our operating results or increase our risk of material weaknesses in internal controls over financial reporting.
We will incur substantial indebtedness in order to finance the Acquisition, which could adversely affect our business and limit our ability to plan for or respond to changes in our business.
In connection with the Acquisition, we have debt commitments with certain lenders. These debt commitments are subject to certain conditions, and we cannot assure you that those conditions will be satisfied. Upon consummation of the Acquisition, we will have substantially more indebtedness than has been the case for us historically. Our ability to make payments on and to refinance our debt obligations and to fund planned capital expenditures depends on our ability to generate cash from our future operations. This, to a certain extent, is subject to financial, competitive, legislative, regulatory and other factors that are beyond our control. In addition, if we cannot service our indebtedness, we may have to take actions such as selling assets, seeking additional equity or reducing or delaying capital expenditures, strategic acquisitions, investments and alliances, any of which could impede the implementation of our business strategy, prevent us from entering into transactions that would otherwise benefit our business and/or have a material adverse effect on our financial condition and results of operations. We may not be able to refinance our indebtedness or take such other actions, if necessary, on commercially reasonable terms, or at all. We cannot guarantee the lenders will provide sufficient financing under the debt commitments to finance the Acquisition.
In connection with the Acquisition, we have debt commitments with certain lenders. These debt commitments are subject to certain conditions and we cannot assure you that those conditions will be satisfied. There can also be no assurance that sufficient financing will be available at the time of the closing of the Acquisition, or that the lender counterparties in any such commitments will honor their contractual commitments. If we need additional capital and cannot raise it on acceptable terms, or at all, we may not be able to complete the Acquisition.
We will incur significant transaction and acquisition-related costs in connection with the Acquisition, whether or not it is completed.
We have already incurred significant costs, and expect to incur significant additional costs associated with the Acquisition. The substantial majority of these costs will be non-recurring transaction expenses and costs. These non-recurring costs and expenses are not reflected in the financial information included in this Report. These costs will reduce the amount of cash otherwise available for the payment of our debt and other corporate purposes.
Item 1B. Unresolved Staff Comments.
None.
Item 2. Properties
Our corporate headquarters is located at 1225 17
th
Street, Suite 1000, Denver, CO 80202. The Company leases this property, which occupies approximately
20,700
square feet. In addition, we lease office space and storage space in Louisville, Colorado and foreign countries, including the Netherlands, United Kingdom and Canada to support key international operations. The Company also leases the Distribution Center in Greenfield, Indiana, which has approximately
423,000
square feet of floor space.
The following table summarizes our leased properties as of the date of this Report:
|
Location
|
Principal Use
|
Type
|
Lease Expiration Date
|
|||
|
Denver, CO
|
Headquarters
|
Office
|
July 31, 2023
|
|||
|
Louisville, CO
|
Research and Development
|
Office
|
May 31, 2020
|
|||
|
Greenfield, IN
|
Distribution Center
|
Warehouse
|
December 31, 2022
|
|||
|
Rogers, AR
|
Sales Operations
|
Office
|
September 30, 2022
|
|||
|
Netherlands
|
International Operations
|
Office
|
February 2, 2021
|
|||
|
Toronto, Ontario
|
Wellness Foods Operations
|
Office
|
February 29, 2024
|
|||
28
Item 3. Legal Proceedings
From time to time, we have been and may again become involved in legal proceedings arising in the ordinary course of our business. We are not presently a party to any litigation that we believe to be material and we are not aware of any pending or threatened litigation against us that we believe could have a material adverse effect of our business, operating result, financial condition or cash flows.
Item 4. Mine Safety Disclosures
Not applicable.
29
PART II
Item 5. Market for Registrant’s Common Equity, Related Stockholder Matters and Issuer Purchases of Equity Securities
Market Information and Holders
Our common stock is currently quoted on the Nasdaq Capital Market under the symbol “SMPL.”
As of
October 25, 2019
, there were
95,294,519
shares outstanding and
19
record holders of our common stock.
Dividends
We currently do not pay dividends and have not paid any cash dividends on our common stock to date. We currently intend to retain our future earnings to finance the future development and expansion of our business, and as such we do not expect to pay any cash dividends on our common stock in the foreseeable future. The payment of future dividends, if any, will be at the discretion of our board of directors and will depend on our financial condition, results of operations, capital requirements, restrictions contained in current and/or future financing instruments, provisions of applicable law and any other factors our board of directors deems relevant.
Issuer Purchases of Equity Securities
|
Period
|
Total Number of
Shares Purchased
|
Average Price
Paid per Share
|
Total Number of Shares Purchase as Part of Publicly Announced Plans or Programs
(1)
|
Maximum Dollar Value of Shares that May Yet be Purchased Under the Plans or Programs
|
||||||||||
|
May 26, 2019 -
June 22, 2019
|
22,245
|
|
$
|
21.61
|
|
22,245
|
|
$
|
47,853,462
|
|
||||
|
June 23, 2019 -
July 20, 2019
|
—
|
|
—
|
|
—
|
|
47,853,462
|
|
||||||
|
July 21, 2019 -
August 31, 2019
|
—
|
|
—
|
|
—
|
|
47,853,462
|
|
||||||
|
Total
|
22,245
|
|
$
|
21.61
|
|
22,245
|
|
$
|
47,853,462
|
|
||||
|
(1)
|
On November 13, 2018, the Company announced that its Board of Directors had approved and authorized a $50.0 million stock repurchase program. As of
August 31, 2019
, approximately
$47.9 million
remained available for repurchase under the stock repurchase program. Under the stock repurchase program, the Company may repurchase shares from time to time in the open market or in privately negotiated transactions. The stock repurchase program does not obligate the Company to acquire any specific number of shares or acquire shares over any specific period of time. The stock repurchase program may be suspended or discontinued at any time by the Company, and does not have an expiration date.
|
30
Performance Graph
The following stock performance graph compares the outstanding stock from issuance of SMPL, July 10, 2017, through August 30, 2019 (the last trading day of our fiscal year ended
August 31, 2019
), the cumulative total stockholder return for (1) Company’s common stock, (2) the Standard & Poor’s 500 Index and (3) the Standard & Poor’s 500 Packaged Foods & Meats Index. The graph assumes the value of the investment in our common stock and each index was $100.00 on July 10, 2017 and assumes reinvestment of any dividends.
The stock price performance below is not necessarily indicative of future stock price performance.
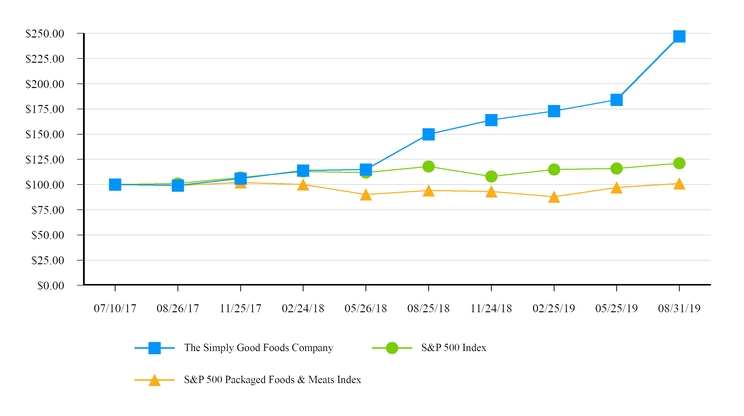
|
Annual Return Percentage
|
||||||||||||||||||||||||||||||||||||||||
|
Quarters Ending
|
||||||||||||||||||||||||||||||||||||||||
|
Company Name / Index
|
July 10, 2017
|
August 26, 2017
|
November 25, 2017
|
February 24, 2018
|
May 26, 2018
|
August 25, 2018
|
November 24, 2018
|
February 25, 2019
|
May 25, 2019
|
August 31, 2019
|
||||||||||||||||||||||||||||||
|
The Simply Good Foods Company
|
$
|
100.0
|
|
$
|
99.0
|
|
$
|
105.6
|
|
$
|
114.1
|
|
$
|
114.8
|
|
$
|
149.8
|
|
$
|
163.8
|
|
$
|
172.8
|
|
$
|
184.3
|
|
$
|
246.9
|
|
||||||||||
|
S&P 500 Index
|
100.0
|
|
100.6
|
|
107.2
|
|
113.2
|
|
112.1
|
|
118.4
|
|
108.5
|
|
115.1
|
|
116.4
|
|
120.6
|
|
||||||||||||||||||||
|
S&P 500 Packaged Foods & Meats Index
|
100.0
|
|
99.5
|
|
101.5
|
|
99.6
|
|
89.8
|
|
94.3
|
|
92.8
|
|
88.4
|
|
96.9
|
|
101.4
|
|
||||||||||||||||||||
31
Item 6. Selected Financial Data
As a result of the Business Combination that occurred in July of 2017, Simply Good Foods is the acquirer, and for accounting purposes the successor. Atkins is the acquiree and accounting predecessor. Our financial statement presentation includes the financial statements of Atkins as “Predecessor” for periods prior to the Closing Date and of Simply Good Foods for periods after the Closing Date, including the consolidation of Atkins.
The following table sets forth selected historical financial information derived from the audited financial statements. You should read the following selected financial information in conjunction with “Item 7. Management’s Discussion and Analysis of Financial Condition and Results of Operations” and the Consolidated Financial Statements and the related notes in “Item 8. Financial Statements and Supplementary Data”.
|
2019
|
2018
|
2017
|
2016
|
2015
|
2014
|
|||||||||||||||||||||||
|
53-weeks ended
|
52-weeks ended
|
From July 7, 2017
through August 26, 2017 |
From August 28, 2016
through July 6, 2017 |
52-weeks ended
|
35-weeks ended
|
52-weeks ended
|
||||||||||||||||||||||
|
August 31, 2019
|
August 25, 2018
|
August 27, 2016
|
August 29, 2015
|
December 27, 2014
|
||||||||||||||||||||||||
|
(audited)
|
(audited)
|
(audited)
|
(audited)
|
(audited)
|
(audited)
|
(audited)
|
||||||||||||||||||||||
|
(In thousands)
|
(Successor)
|
(Successor)
|
(Successor)
|
(Predecessor)
|
(Predecessor)
|
(Predecessor)
|
(Predecessor)
|
|||||||||||||||||||||
|
Net sales
|
$
|
523,383
|
|
$
|
431,429
|
|
$
|
56,334
|
|
$
|
339,837
|
|
$
|
427,858
|
|
$
|
252,898
|
|
$
|
429,858
|
|
|||||||
|
Cost of goods sold
(1)
|
305,978
|
|
251,063
|
|
39,584
|
|
200,026
|
|
248,464
|
|
151,978
|
|
249,832
|
|
||||||||||||||
|
Gross profit
|
217,405
|
|
180,366
|
|
16,750
|
|
139,811
|
|
179,394
|
|
100,920
|
|
180,026
|
|
||||||||||||||
|
Operating Expenses:
|
||||||||||||||||||||||||||||
|
Distribution
(1)
|
—
|
|
—
|
|
—
|
|
—
|
|
18,489
|
|
11,429
|
|
19,481
|
|
||||||||||||||
|
Selling and marketing
(2)
|
67,488
|
|
59,092
|
|
6,937
|
|
47,494
|
|
56,264
|
|
45,147
|
|
55,830
|
|
||||||||||||||
|
General and administrative
(1)
|
61,972
|
|
49,635
|
|
6,969
|
|
34,567
|
|
48,503
|
|
29,093
|
|
41,146
|
|
||||||||||||||
|
Depreciation and amortization
(1)
|
7,496
|
|
7,498
|
|
985
|
|
8,409
|
|
10,179
|
|
7,267
|
|
11,195
|
|
||||||||||||||
|
Business combination transaction costs
|
7,107
|
|
2,259
|
|
—
|
|
25,608
|
|
—
|
|
—
|
|
—
|
|
||||||||||||||
|
Loss (gain) in fair value change of contingent consideration - TRA liability
|
533
|
|
(2,848
|
)
|
—
|
|
—
|
|
—
|
|
—
|
|
—
|
|
||||||||||||||
|
Total operating expenses
|
144,596
|
|
115,636
|
|
14,891
|
|
116,078
|
|
133,435
|
|
92,936
|
|
127,652
|
|
||||||||||||||
|
Income from operations
|
72,809
|
|
64,730
|
|
1,859
|
|
23,733
|
|
45,959
|
|
7,984
|
|
52,374
|
|
||||||||||||||
|
Other income (expense):
|
||||||||||||||||||||||||||||
|
Change in warrant liabilities
|
—
|
|
—
|
|
—
|
|
722
|
|
(722
|
)
|
1,689
|
|
143
|
|
||||||||||||||
|
Interest income
|
3,826
|
|
—
|
|
—
|
|
—
|
|
—
|
|
—
|
|
—
|
|
||||||||||||||
|
Interest expense
|
(13,627
|
)
|
(12,551
|
)
|
(1,662
|
)
|
(22,724
|
)
|
(27,195
|
)
|
(18,331
|
)
|
(27,823
|
)
|
||||||||||||||
|
Gain on settlement of TRA liability
|
1,534
|
|
—
|
|
—
|
|
—
|
|
—
|
|
—
|
|
—
|
|
||||||||||||||
|
Loss (gain) on foreign currency transactions
|
(452
|
)
|
97
|
|
513
|
|
133
|
|
(619
|
)
|
(1,045
|
)
|
(1,211
|
)
|
||||||||||||||
|
Other income
|
196
|
|
815
|
|
30
|
|
221
|
|
118
|
|
55
|
|
96
|
|
||||||||||||||
|
Total other expense
|
(8,523
|
)
|
(11,639
|
)
|
(1,119
|
)
|
(21,648
|
)
|
(28,418
|
)
|
(17,632
|
)
|
(28,795
|
)
|
||||||||||||||
|
Income before income taxes
|
64,286
|
|
53,091
|
|
740
|
|
2,085
|
|
17,541
|
|
(9,648
|
)
|
23,579
|
|
||||||||||||||
|
Income tax (benefit) expense
|
16,750
|
|
(17,364
|
)
|
290
|
|
4,570
|
|
7,507
|
|
(4,334
|
)
|
9,623
|
|
||||||||||||||
|
Net income (loss)
|
$
|
47,536
|
|
$
|
70,455
|
|
$
|
450
|
|
$
|
(2,485
|
)
|
$
|
10,034
|
|
$
|
(5,314
|
)
|
$
|
13,956
|
|
|||||||
|
Earnings per share from net income:
|
||||||||||||||||||||||||||||
|
Basic
|
$
|
0.59
|
|
$
|
1.00
|
|
$
|
0.01
|
|
|||||||||||||||||||
|
Diluted
|
$
|
0.56
|
|
$
|
0.96
|
|
$
|
0.01
|
|
|||||||||||||||||||
|
Balance Sheet Data (at end of periods)
|
||||||||||||||||||||||||||||
|
Total assets
|
$
|
1,141,650
|
|
$
|
974,605
|
|
$
|
922,488
|
|
$
|
344,867
|
|
$
|
389,512
|
|
$
|
366,953
|
|
$
|
385,215
|
|
|||||||
|
Long-term debt, less current maturities
|
190,259
|
|
190,935
|
|
191,856
|
|
281,445
|
|
321,638
|
|
331,565
|
|
330,758
|
|
||||||||||||||
|
Warrant liabilities
|
—
|
|
—
|
|
—
|
|
15,000
|
|
15,722
|
|
15,000
|
|
16,689
|
|
||||||||||||||
|
Stockholders’ equity (deficit)
|
837,444
|
|
672,601
|
|
598,702
|
|
(28,027
|
)
|
(27,834
|
)
|
(41,322
|
)
|
(36,217
|
)
|
||||||||||||||
32
|
(1)
|
During the fifty-three weeks ended August 31, 2019, certain reclassifications were made to previously reported amount to conform to the current presentation. On the consolidated statement of operations, outbound freight previously included in distribution, distribution center expenses previously included in
General and administrative
, and depreciation for equipment used in warehouse operations were reclassified to
Cost of goods sold
. 2019, 2018 and 2017 reflect adjusted amounts in accordance with this accounting principle change. See Note 2 to the Consolidated Financial Statements included herein for additional information on the accounting principle change.
|
|
|
(2)
|
During the fifty-three weeks ended August 31, 2019, the Company combined Selling and Marketing within one financial statement line. All periods presented reflect this change.
|
|
33
Item 7. Management’s Discussion and Analysis of Financial Condition and Results of Operations
The following discussion and analysis of our financial condition and results of operations should be read in conjunction with our Consolidated Financial Statements and related notes included in Item 8 of this Report. In addition to historical information, the following discussion contains forward-looking statements, including, but not limited to, statements regarding the Company’s expectation for future performance, liquidity and capital resources that involve risks, uncertainties and assumptions that could cause actual results to differ materially from the Company's expectations. The Company's actual results may differ materially from those contained in or implied by any forward-looking statements. Factors that could cause such differences include those identified below and those described in “Cautionary Note Regarding Forward-Looking Statements,” and in Item 1A “Risk Factors” of this Report. The Company assumes no obligation to update any of these forward-looking statements.
Our fiscal year ends the last Saturday in August. Our fiscal years
2018
and
2017
ended
August 25, 2018
and
August 26, 2017
, respectively, and were each fifty-two week periods. Our fiscal year
2019
ended
August 31, 2019
was a fifty-three week period. Atkins’ fiscal quarters are comprised of thirteen weeks each, except for fifty-three week fiscal periods for the which the fourth quarter is comprised of fourteen weeks, and end on the thirteenth Saturday of each quarter (fourteenth Saturday of the fourth quarter, when applicable). Atkins’ fiscal quarters for fiscal
2019
ended on
November 24,
2018
,
February 23,
2019
,
May 25,
2019
and
August 31, 2019
.
As a result of the Business Combination, information is presented for the successor
fifty-three week period ended August 31, 2019
, the successor period for the fifty-two week period ended August 25, 2018, the successor period from July 7, 2017 through August 26, 2017, and the predecessor period from August 28, 2016 through July 6, 2017, are derived from Atkins’ audited consolidated financial statements and the notes thereto.
Overview
Simply Good Foods is a developer, marketer and seller of branded nutritional foods and snacking products. Our highly-focused product portfolio consists primarily of nutrition bars, RTD shakes, snacks and confectionery products marketed under the Atkins®, SimplyProtein®, and Atkins Endulge® brand names. Our goal is to lead the nutritious snacking movement with trusted brands that offer a variety of convenient, innovative, great-tasting, “better-for-you” snacks and meal replacements. Over the past 45 years, Atkins has become an iconic American brand that for many consumers stands for “low carb,” “low sugar” and “protein rich” nutrition. The Atkins philosophy focuses on a healthy nutritional approach with reduced levels of refined carbohydrates and sugars and encourages the consumption of lean protein, fiber, fruits, vegetables, and healthy fats.
In our core Atkins snacking business, we strive to offer a complete line of nutrition bars, ready-to-drink shakes and confections that satisfy hunger while providing consumers with a convenient, “better-for-you” snacking alternative. Our sales, marketing and R&D capabilities enable us to distribute products into a national customer base across the mass merchandiser, grocery and drug channels. We believe that Atkins’ broad brand recognition, our depth of management talent and strong cash generation position us to continue to innovate in the Atkins brand and acquire other brands, and thereby become an industry leading snacking platform. To that end, in December 2016, Atkins completed the acquisition of Wellness Foods, a Canada-based developer, marketer and seller of the SimplyProtein® brand that is focused on protein-rich and low-sugar products.
Quest Acquisition and Related Financing
On August 21, 2019, we entered into a stock purchase agreement (the “Purchase Agreement”) to acquire Quest Nutrition, LLC (“Quest”), a healthy lifestyle food company (the “Acquisition”). The Acquisition is expected to close by the end of the 2019 calendar year, subject to satisfaction of customary closing conditions. There is no financing condition for the Acquisition.
On October 9, 2019, we completed an underwritten public offering of 13,379,205 shares of our common stock at a price per share of $26.16 (the “Offering”), resulting in net proceeds to us of approximately $350.0 million, after deducting underwriting discounts and commissions and our estimated fees and expenses for the Offering. We intend to use these net proceeds to pay a portion of the purchase price and related fees and expenses for the Acquisition, or for general corporate purposes if the acquisition is not consummated.
We plan to fund the remainder of the Acquisition by using a significant portion of the approximately $265 million of cash on hand and committed financing pursuant to debt commitments from Barclays, Credit Suisse and Goldman Sachs.
Matters Affecting Comparability
The Simply Good Foods Company was formed on March 30, 2017 to consummate a business combination with Atkins and Conyers Park. Conyers Park, a special purpose acquisition company, was formed on April 20, 2016 for the purpose of effecting a merger, capital stock exchange, asset acquisition, stock purchase, reorganization or similar business combination with one or more businesses.
34
On April 10, 2017, Conyers Park and Atkins entered into a definitive merger agreement (the “Merger Agreement”). Under the terms of the agreement, Conyers Park and Atkins combined under a new holding company, Simply Good Foods, which was listed on the Nasdaq Capital Market under the symbol “SMPL” as of closing of the Business Combination.
On July 7, 2017 (the “Closing Date”) Simply Good Foods completed the business combination with Conyers Park and Atkins (the “Business Combination”). As a result, Simply Good Foods owns all of the equity in Atkins.
As a result of the Business Combination, Simply Good Foods is the acquirer for accounting purposes and the successor while Atkins is the acquiree and accounting predecessor. Our financial statement presentation includes the financial statements of Atkins as “Predecessor” for periods prior to the Closing Date and of Simply Good Foods for periods after the Closing Date, including the consolidation of Atkins.
Change in Accounting Principle
During the fourth quarter of fiscal 2019, we changed our accounting principle related to the presentation of third party delivery costs associated with shipping and handling activities previously included as operating expenses in Distribution in the Consolidated Statements of Operations and Comprehensive Income (Loss). In the new accounting principle, the Company is presenting these expenses within cost of goods sold (“COGS”) in the Consolidated Statements of Operations and Comprehensive Income (Loss).
In connection with the change in accounting principle, the Company also changed its definition of shipping and handling costs to include costs paid to third-party warehouse operators associated with delivering product to a customer, previously included in General and administrative and depreciation and amortization of the assets at the third-party warehouse, previously included in Depreciation and amortization. Under the previous definition of shipping and handling costs, the Company only included third-party delivery costs in Distribution.
Amounts presented for the successor
fifty-two week
period ended
August 25, 2018
, the successor period from July 7, 2017 through August 26, 2017, and the predecessor period from August 28, 2016 through July 6, 2017 have been adjusted in accordance with this accounting principle change. See
Note 2
to the Consolidated Financial Statements included herein for additional information on the accounting principle change.
Our Reportable Segment
Our business is organized around one reportable segment based on our go-to-market strategies, the objectives of the business and how our chief decision maker, our President and Chief Executive Officer, monitors operating performance and allocates resources.
Key Financial Definitions
Net sales.
Net sales consists primarily of product sales less cost of promotional activities, slotting fees and other sales credits and adjustments, including product returns. The Company also includes licensing revenue from the frozen meals business in net sales.
Cost of goods sold.
Cost of goods sold consists primarily of the costs we pay to our contract manufacturing partners to produce the products sold. These costs include the purchase of raw ingredients, packaging, shipping and handling, warehousing, depreciation of warehouse equipment, and a tolling charge for the contract manufacturer. Cost of goods sold includes products provided at no charge as part of promotions and the non-food materials provided with customer orders.
Operating expenses.
Operating expenses consist primarily of selling and marketing, general and administrative, depreciation and amortization, and other expenses. The following is a brief description of the components of operating expenses:
|
•
|
Selling and marketing.
Selling and marketing expenses are comprised of broker commissions, customer marketing, media and other marketing costs.
|
|
•
|
General and administrative.
General and administrative expenses are comprised of expenses associated with corporate and administrative functions that support our business, including fees for employee salaries, professional services, insurance and other general corporate expenses.
|
|
•
|
Depreciation and amortization.
Depreciation and amortization costs consist of costs associated with the depreciation of fixed assets and capitalized leasehold improvements and amortization of intangible assets. Depreciation and amortization excludes depreciation of warehouse equipment, which is included in cost of goods sold.
|
|
•
|
Business transaction costs.
Business transaction costs are comprised of legal, due diligence and accounting firm expenses associated with the process of actively pursuing potential business combinations.
|
|
•
|
Loss (gain) in fair value change of contingent consideration - TRA liability
. Gain in fair value change of contingent consideration - TRA liability charges relate to fair value adjustments of the Tax Receivable Agreement (the “TRA”) liability.
|
35
Results of Operations
In assessing the performance of our business, we consider a number of key performance indicators used by management and typically used by our competitors, including the non-GAAP measures of Adjusted EBITDA. Because not all companies use identical calculations, this presentation of Adjusted EBITDA may not be comparable to other similarly titled measures of other companies. See “Reconciliation of Adjusted EBITDA” below for a reconciliation of EBITDA and Adjusted EBITDA to net income for each applicable period.
Comparison of Results for the
Fifty-Three Weeks Ended August 31, 2019
and the
Fifty-Two Weeks Ended August 25, 2018
The following table presents, for the periods indicated, selected information from our consolidated financial results, including information presented as a percentage of net sales:
|
53-Weeks Ended
|
% of Sales
|
52-Weeks Ended
|
% of Sales
|
|||||||||||
|
(In thousands)
|
August 31, 2019
|
August 25, 2018
|
||||||||||||
|
(Successor)
|
(Successor)
|
|||||||||||||
|
Net sales
|
$
|
523,383
|
|
100.0
|
%
|
$
|
431,429
|
|
100.0
|
%
|
||||
|
Cost of goods sold
(1)
|
305,978
|
|
58.5
|
%
|
251,063
|
|
58.2
|
%
|
||||||
|
Gross profit
|
217,405
|
|
41.5
|
%
|
180,366
|
|
41.8
|
%
|
||||||
|
Operating expenses:
|
||||||||||||||
|
Selling and marketing
(2)
|
67,488
|
|
12.9
|
%
|
59,092
|
|
13.7
|
%
|
||||||
|
General and administrative
(1)
|
61,972
|
|
11.8
|
%
|
49,635
|
|
11.5
|
%
|
||||||
|
Depreciation and amortization
(1)
|
7,496
|
|
1.4
|
%
|
7,498
|
|
1.7
|
%
|
||||||
|
Business transaction costs
|
7,107
|
|
1.4
|
%
|
2,259
|
|
0.5
|
%
|
||||||
|
Gain in fair value change of contingent consideration - TRA liability
|
533
|
|
0.1
|
%
|
(2,848
|
)
|
(0.7
|
)%
|
||||||
|
Total operating expenses
|
144,596
|
|
27.6
|
%
|
115,636
|
|
26.8
|
%
|
||||||
|
Income from operations
|
72,809
|
|
13.9
|
%
|
64,730
|
|
15.0
|
%
|
||||||
|
Other income (expense):
|
||||||||||||||
|
Interest income
|
3,826
|
|
0.7
|
%
|
—
|
|
—
|
%
|
||||||
|
Interest expense
|
(13,627
|
)
|
(2.6
|
)%
|
(12,551
|
)
|
(2.9
|
)%
|
||||||
|
Gain on settlement of TRA liability
|
1,534
|
|
0.3
|
%
|
—
|
|
—
|
%
|
||||||
|
Gain (loss) on foreign currency transactions
|
(452
|
)
|
(0.1
|
)%
|
97
|
|
—
|
%
|
||||||
|
Other income
|
196
|
|
—
|
%
|
815
|
|
0.2
|
%
|
||||||
|
Total other expense
|
(8,523
|
)
|
(1.6
|
)%
|
(11,639
|
)
|
(2.7
|
)%
|
||||||
|
Income before income taxes
|
64,286
|
|
12.3
|
%
|
53,091
|
|
12.3
|
%
|
||||||
|
Income tax (benefit) expense
|
16,750
|
|
3.2
|
%
|
(17,364
|
)
|
(4.0
|
)%
|
||||||
|
Net income (loss)
|
$
|
47,536
|
|
9.1
|
%
|
$
|
70,455
|
|
16.3
|
%
|
||||
|
Other financial data:
|
||||||||||||||
|
Adjusted EBITDA
|
$
|
98,719
|
|
18.9
|
%
|
$
|
78,602
|
|
18.2
|
%
|
||||
|
(1)
|
During the fifty-three weeks ended August 31, 2019, certain reclassifications were made to previously reported amounts to conform to the current presentation. On the consolidated statement of operations, outbound freight previously included in Distribution, distribution center expenses previously included in
General and administrative
, and depreciation for equipment used in warehouse operations were reclassified to
Cost of goods sold
. 2018 reflects adjusted amounts in accordance with this accounting principle change. See Note 2 to the consolidated financial statements included herein for additional information on the accounting principle change.
|
|
|
(2)
|
During the fifty-three weeks ended August 31, 2019, the Company combined Selling and Marketing within one financial statement line. 2018 reflects adjusted amounts.
|
|
Net sales.
Net sales for the successor
fifty-three week period ended August 31, 2019
were
$523.4 million
compared to
$431.4 million
for the successor
fifty-two week period ended August 25, 2018
. The net sales
increase
of
21.3%
was driven by volume growth. Net price realization was a slight benefit, partially offset by a shift in non-price related customer activity. The fifty-third week of fiscal 2019 was a 1.8% contribution to full year sales growth.
36
Cost of goods sold.
Cost of goods sold for the successor
fifty-three week period ended August 31, 2019
were
$306.0 million
compared to
$251.1 million
for the successor
fifty-two week period ended August 25, 2018
. The cost of goods sold increase is driven by sales volume growth and increased distribution center expenses. These increases are partially offset by logistics efficiencies.
Gross profit.
Gross profit for the successor
fifty-three week period ended August 31, 2019
was
$217.4 million
, or
41.5%
of net sales compared to
$180.4 million
, or
41.8%
of net sales, for the successor
fifty-two week period ended August 25, 2018
, a
decrease
of
30
basis point. Gross margin is effected by non-price related customer activity that is a shift from selling and marketing expense.
Operating expenses.
Operating expenses for the successor
fifty-three week period ended August 31, 2019
were
$144.6 million
, or
27.6%
of net sales, compared to
$115.6 million
, or
26.8%
of net sales, for the successor
fifty-two week period ended August 25, 2018
due to the following:
|
•
|
Selling and marketing
. Selling and marketing expenses
increase
d
$8.4 million
, or
14.2%
, for the successor
fifty-three week period ended August 31, 2019
compared to the successor
fifty-two week period ended August 25, 2018
. The
increase
is primarily due to an increase in television media and e-commerce investments, offset by a shift in non-price related customer activity.
|
|
•
|
General and administrative
. General and administrative expenses
increase
d
$12.3 million
, or
24.9%
, for the successor
fifty-three week period ended August 31, 2019
compared to the successor
fifty-two week period ended August 25, 2018
. The increase is due to higher incentive compensation of $5.3 million, internal resource investments of $3.3 million, and a legal settlement of $3.5 million.
|
|
•
|
Depreciation and amortization
. Depreciation and amortization expenses for the successor
fifty-three week period ended August 31, 2019
were flat compared to the successor
fifty-two week period ended August 25, 2018
.
|
|
•
|
Business transaction costs
. Business transaction costs
increase
d
$4.8 million
for the successor
fifty-three week period ended August 31, 2019
compared to the successor
fifty-two week period ended August 25, 2018
. The increase is primarily due to the pending acquisition of Quest, as announced August 21, 2019 and discussed in “Recent Developments” in Item 1. Business. The
$2.3 million
recorded in the successor
fifty-two week period ended August 25, 2018
is comprised of expenses relating to business development activities.
|
|
•
|
Loss (gain) in fair value change of contingent consideration - TRA liability
. The successor
fifty-three week period ended August 31, 2019
included a loss in fair value change of contingent consideration of
$0.5 million
. The increase is due to the timing of the settlement of the TRA liability during the successor
fifty-three week period ended August 31, 2019
. The gain in the successor
fifty-two week period ended August 25, 2018
reflects the effect of the change in tax law in the prior year.
|
Interest income.
Interest income increased
$3.8 million
for the successor
fifty-three week period ended August 31, 2019
compared to the successor
fifty-three week period ended August 31, 2019
, due to the Company’s increased cash balance resulting from warrant exercises during the successor
fifty-three week period ended August 31, 2019
and an increase in market interest rates.
Interest expense.
Interest expense for the successor
fifty-three week period ended August 31, 2019
was
$13.6 million
compared to
$12.6 million
for the successor
fifty-two week period ended August 25, 2018
, an increase due to changes in market interest rates.
Gain on settlement of TRA liability.
The Company recorded a
$1.5 million
gain in connection with the settlement of the TRA liability in the
fifty-three week period ended August 31, 2019
. The TRA settlement is discussed in
Note 10
of the Consolidated Statements of Operations and Comprehensive Income (Loss) included in this Report.
(Loss) gain on foreign currency transactions.
A loss of
$0.5 million
in foreign currency transactions was recorded for the
fifty-three week period ended August 31, 2019
compared to a foreign currency gain of
$0.1 million
for the
fifty-two week period ended August 25, 2018
. The change relates to changes in foreign currency rates related to international operations.
Income tax (benefit) expense.
Income tax expense for the successor
fifty-three week period ended August 31, 2019
was
$16.8 million
compared to income tax benefit of
$17.4 million
for the successor
fifty-two week period ended August 25, 2018
. The increase in our income tax expense is primarily attributed to the one-time benefit of $29.0 million related to the tax law change and remeasurement of deferred tax liabilities recorded in the
fifty-two week period ended August 25, 2018
, which did not apply for the
fifty-three week period ended August 31, 2019
.
Adjusted EBITDA.
Adjusted EBITDA for the successor
fifty-three week period ended August 31, 2019
was
$98.7 million
compared to
$78.6 million
for the successor
fifty-two week period ended August 25, 2018
. For a reconciliation of Adjusted EBITDA to its most directly comparable GAAP measure, see “Reconciliation of Adjusted EBITDA” below.
37
Comparison of Results for the Successor
Fifty-Two Weeks Ended
August 25, 2018
, the Successor Period from July 7, 2017 through August 26, 2017 and the Predecessor Period from August 28, 2016 through July 6, 2017
The following table presents, for the periods indicated, selected information from our consolidated financial results, including information presented as a percentage of net sales:
|
Successor
|
Successor
|
Predecessor
|
||||||||||||||||||||
|
52-Weeks Ended
|
% of Sales
|
From July 7, 2017
through August 26, 2017 |
% of Sales
|
From August 28, 2016 through July 6, 2017
|
% of Sales
|
|||||||||||||||||
|
(In thousands)
|
August 25, 2018
|
|||||||||||||||||||||
|
Net sales
|
$
|
431,429
|
|
100.0
|
%
|
$
|
56,334
|
|
100.0
|
%
|
$
|
339,837
|
|
100.0
|
%
|
|||||||
|
Cost of goods sold
(1)
|
251,063
|
|
58.2
|
%
|
39,584
|
|
70.3
|
%
|
200,026
|
|
58.9
|
%
|
||||||||||
|
Gross profit
|
180,366
|
|
41.8
|
%
|
16,750
|
|
29.7
|
%
|
139,811
|
|
41.1
|
%
|
||||||||||
|
Operating expenses:
|
||||||||||||||||||||||
|
Selling and marketing
(2)
|
59,092
|
|
13.7
|
%
|
6,937
|
|
12.3
|
%
|
47,494
|
|
14.0
|
%
|
||||||||||
|
General and administrative
(1)
|
49,635
|
|
11.5
|
%
|
6,969
|
|
12.4
|
%
|
34,567
|
|
10.2
|
%
|
||||||||||
|
Depreciation and amortization
(1)
|
7,498
|
|
1.7
|
%
|
985
|
|
1.7
|
%
|
8,409
|
|
2.5
|
%
|
||||||||||
|
Business transaction costs
|
2,259
|
|
0.5
|
%
|
—
|
|
—
|
%
|
25,608
|
|
7.5
|
%
|
||||||||||
|
Gain in fair value change of contingent consideration - TRA liability
|
(2,848
|
)
|
(0.7
|
)%
|
—
|
|
—
|
%
|
—
|
|
—
|
%
|
||||||||||
|
Total operating expenses
|
115,636
|
|
26.8
|
%
|
14,891
|
|
26.4
|
%
|
116,078
|
|
34.2
|
%
|
||||||||||
|
Income from operations
|
64,730
|
|
15.0
|
%
|
1,859
|
|
3.3
|
%
|
23,733
|
|
7.0
|
%
|
||||||||||
|
Other income (expense):
|
||||||||||||||||||||||
|
Change in warrant liabilities
|
—
|
|
—
|
%
|
—
|
|
—
|
%
|
722
|
|
0.2
|
%
|
||||||||||
|
Interest expense
|
(12,551
|
)
|
(2.9
|
)%
|
(1,662
|
)
|
(3.0
|
)%
|
(22,724
|
)
|
(6.7
|
)%
|
||||||||||
|
Gain (loss) on foreign currency transactions
|
97
|
|
—
|
%
|
513
|
|
0.9
|
%
|
133
|
|
—
|
%
|
||||||||||
|
Other income
|
815
|
|
0.2
|
%
|
30
|
|
0.1
|
%
|
221
|
|
0.1
|
%
|
||||||||||
|
Total other expense
|
(11,639
|
)
|
(2.7
|
)%
|
(1,119
|
)
|
(2.0
|
)%
|
(21,648
|
)
|
(6.4
|
)%
|
||||||||||
|
Income before income taxes
|
53,091
|
|
12.3
|
%
|
740
|
|
1.3
|
%
|
2,085
|
|
0.6
|
%
|
||||||||||
|
Income tax (benefit) expense
|
(17,364
|
)
|
(4.0
|
)%
|
290
|
|
0.5
|
%
|
4,570
|
|
1.3
|
%
|
||||||||||
|
Net income (loss)
|
$
|
70,455
|
|
16.3
|
%
|
$
|
450
|
|
0.8
|
%
|
$
|
(2,485
|
)
|
(0.7
|
)%
|
|||||||
|
Other financial data:
|
||||||||||||||||||||||
|
Adjusted EBITDA
|
$
|
78,602
|
|
18.2
|
%
|
$
|
8,654
|
|
15.4
|
%
|
$
|
63,889
|
|
18.8
|
%
|
|||||||
|
(1)
|
During the fifty-three weeks ended August 31, 2019, certain reclassifications were made to previously reported amounts to conform to the current presentation. On the consolidated statement of operations, outbound freight previously included in Distribution, distribution center expenses previously included in
General and administrative
, and depreciation for equipment used in warehouse operations were reclassified to
Cost of goods sold
. 2018 and 2017 reflect adjusted amounts in accordance with this accounting principle change. See Note 2 to the consolidated financial statements included herein for additional information on the accounting principle change.
|
|
|
(2)
|
During the fifty-three weeks ended August 31, 2019, the Company combined Selling and Marketing within one financial statement line. 2018 and 2017 reflect adjusted amounts.
|
|
Comparison of Results for the Successor
Fifty-Two Weeks Ended
August 25, 2018
and the Successor Period from July 7, 2017 through August 26, 2017
Net sales.
Net sales for the successor
fifty-two week period ended August 25, 2018
were
$431.4 million
compared to
$56.3 million
for the successor period from July 7, 2017 through August 26, 2017.
Cost of goods sold.
Cost of goods sold for the successor
fifty-two week period ended August 25, 2018
were
$251.1 million
compared to
$39.6 million
for the successor period from July 7, 2017 through August 26, 2017.
Gross profit.
Gross profit for the successor
fifty-two week period ended August 25, 2018
was
$180.4 million
, or
41.8%
of net sales compared to
$16.8 million
, or
29.7%
of net sales, for the successor period from July 7, 2017 through August 26, 2017.
38
Operating expenses.
Operating expenses for the successor
fifty-two week period ended August 25, 2018
were
$115.6 million
, or
26.8%
of net sales, compared to
$14.9 million
, or
26.4%
of net sales, for the successor period from July 7, 2017 through August 26, 2017.
Interest expense.
Interest expense for the successor
fifty-two week period ended August 25, 2018
was
$12.6 million
, or
2.9%
of net sales, compared to
$1.7 million
, or
3.0%
of net sales, for the successor period from July 7, 2017 through August 26, 2017.
Income tax (benefit) expense.
Income tax benefit for the successor
fifty-two week period ended August 25, 2018
was
$17.4 million
compared to income tax expense of
$0.3 million
for the successor period from July 7, 2017 through August 26, 2017.
Adjusted EBITDA.
Adjusted EBITDA for the successor
fifty-two week period ended August 25, 2018
was
$78.6 million
compared to
$8.7 million
for the successor period from July 7, 2017 through August 26, 2017.
Comparison of Results for the Successor Period from July 7, 2017 through August 26, 2017 and the Predecessor Period from August 28, 2016 through July 6, 2017.
Net sales
. Net sales for the successor period from July 7, 2017 through August 26, 2017 were
$56.3 million
compared to
$339.8 million
for the predecessor period from August 28, 2016 through July 6, 2017. There was no effect to net sales as a result of the Business Combination.
Cost of goods sold.
Cost of goods sold for the successor period from July 7, 2017 through August 26, 2017 were
$39.6 million
compared to
$200.0 million
for the predecessor period from August 28, 2016 through July 6, 2017. As a result of the Business Combination, there was a one-time inventory fair value step-up of $6.0 million that was charged to cost of goods sold in the successor period from July 7, 2017 through August 26, 2017.
Gross profit.
Gross profit for the successor period from July 7, 2017 through August 26, 2017, including the effect of the one-time inventory fair value step-up, were
$16.8 million
, or
29.7%
of net sales, compared to the predecessor period from August 28, 2016 through July 6, 2017, gross profit was
$139.8 million
, or
41.1%
of net sales.
Operating expenses.
Operating expenses for the successor period from July 7, 2017 through August 26, 2017 were
$14.9 million
or
26.4%
of net sales compared to
$116.1 million
or
34.2%
of net sales the predecessor period from August 28, 2016 through July 6, 2017.
Interest expense.
Interest expense for the successor period from July 7, 2017 through August 26, 2017 was $1.7 million or 3.0% of net sales compared to $22.7 million or 6.7% of net sales for the predecessor period from August 28, 2016 through July 6, 2017. The lower interest expense in the successor period from July 7, 2017 through August 26, 2017 is the result of the reduced principal balance of the debt as well as a reduction in the rate of interest being incurred on the debt.
Income tax expense.
Income tax expense for the successor period from July 7, 2017 through August 26, 2017 was $0.3 million compared to $4.6 million for the predecessor period from August 28, 2016 through July 6, 2017. Higher taxes in the predecessor period relate to the effects of the nondeductible business combination transaction costs.
Adjusted EBITDA.
Adjusted EBITDA decreased $55.2 million or 86.5% for the successor period from July 7, 2017 through August 26, 2017 compared to the predecessor period from August 28, 2016 through July 6, 2017. For a reconciliation of Adjusted EBITDA to its most directly comparable GAAP measure, see “Reconciliation of Adjusted EBITDA”.
Reconciliation of Adjusted EBITDA
Adjusted EBITDA
.
Adjusted EBITDA is a non-GAAP financial measure commonly used in our industry and should not be construed as an alternative to net income as an indicator of operating performance or as an alternative to cash flow provided by operating activities as a measure of liquidity (each as determined in accordance with GAAP). Simply Good Foods defines Adjusted EBITDA (earnings before interest, tax, depreciation and amortization) as net income before interest expense, income tax expense, depreciation and amortization with further adjustments to exclude the following items: stock-based compensation and warrant expense, transaction and IPO readiness costs, restructuring costs, management fees, frozen media licensing fees, non-core legal costs, transactional exchange impact, change in fair value of contingent consideration - TRA liability, business transaction costs and other non-core expenses
.
Management uses Adjusted EBITDA to evaluate operating performance and this financial measure is among the primary measures used by management for planning and forecasting of future periods.
Adjusted EBITDA is also frequently used by analysts, investors, and other interested parties to evaluate companies in our industry. The Company believes that the inclusion of these supplementary adjustments in presenting Adjusted EBITDA is relevant and useful for investors because it provides additional information to investors, reflects operating results more accurately of the on-going operations,
39
allows investors to view results in a manner similar to the method used by management and facilitates comparison of the Company’s results with the results of other companies that have different financing and capital structures
.
The components of the Company’s computation of Adjusted EBITDA may not be comparable to other similarly titled captions of other companies due to differences in calculation.
The following unaudited tables below provide a reconciliation of Adjusted EBITDA to its most directly comparable GAAP measure, which is net income (loss).
|
Adjusted EBITDA Reconciliation:
|
53-Weeks Ended
|
52-Weeks Ended
|
From July 7, 2017
through August 26, 2017 |
From August 28, 2016 through July 6, 2017
|
|||||||||||||
|
August 31, 2019
|
August 25, 2018
|
||||||||||||||||
|
(In thousands)
|
(Successor)
|
(Successor)
|
(Successor)
|
(Predecessor)
|
|||||||||||||
|
Net income (loss)
|
$
|
47,536
|
|
$
|
70,455
|
|
$
|
450
|
|
$
|
(2,485
|
)
|
|||||
|
Interest expense
|
13,627
|
|
12,551
|
|
1,662
|
|
22,724
|
|
|||||||||
|
Interest income
|
(3,826
|
)
|
(301
|
)
|
—
|
|
—
|
|
|||||||||
|
Income tax expense (benefit)
|
16,750
|
|
(17,364
|
)
|
290
|
|
4,570
|
|
|||||||||
|
Depreciation and amortization
|
7,644
|
|
7,672
|
|
1,000
|
|
8,617
|
|
|||||||||
|
EBITDA
|
81,731
|
|
73,013
|
|
3,402
|
|
33,426
|
|
|||||||||
|
Business transaction costs
|
7,107
|
|
2,259
|
|
—
|
|
25,608
|
|
|||||||||
|
Stock-based compensation and warrant expense
|
5,501
|
|
4,029
|
|
412
|
|
1,719
|
|
|||||||||
|
Transaction fees / IPO readiness
|
—
|
|
—
|
|
—
|
|
371
|
|
|||||||||
|
Restructuring
|
22
|
|
631
|
|
—
|
|
167
|
|
|||||||||
|
Roark management fee
|
—
|
|
—
|
|
—
|
|
1,200
|
|
|||||||||
|
Recall receivable reserve
|
—
|
|
—
|
|
(1,195
|
)
|
—
|
|
|||||||||
|
Gain on settlement of TRA
|
(1,534
|
)
|
—
|
|
—
|
|
—
|
|
|||||||||
|
Frozen licensing media
|
—
|
|
250
|
|
456
|
|
794
|
|
|||||||||
|
Non-core legal costs
|
4,851
|
|
1,314
|
|
96
|
|
723
|
|
|||||||||
|
Loss (gain) in fair value change of contingent consideration - TRA liability
|
533
|
|
(2,848
|
)
|
—
|
|
—
|
|
|||||||||
|
Purchase accounting inventory step-up
|
—
|
|
—
|
|
5,989
|
|
—
|
|
|||||||||
|
Other (1)
|
508
|
|
(46
|
)
|
(506
|
)
|
(119
|
)
|
|||||||||
|
Adjusted EBITDA
|
$
|
98,719
|
|
$
|
78,602
|
|
$
|
8,654
|
|
$
|
63,889
|
|
|||||
_______________
|
(1)
|
Other items consist principally of exchange impact of foreign currency transactions and other expenses.
|
Liquidity and Capital Resources
Overview
We have historically funded our operations with cash flow from operations and borrowings under our credit facilities. Our principal uses for liquidity have been debt service and working capital. We believe our sources of liquidity and capital will be sufficient to finance our continued operations, growth strategy, and additional expenses we expect to incur including the pending acquisition of Quest for at least the next twelve months.
Debt and Credit Facilities
On July 7, 2017, the Company entered into a credit agreement with Barclays Bank PLC and other parties. The credit agreement provides for a term facility of
$200.0 million
(“Term Facility”) with a
seven
year maturity and a revolving credit facility of up to
$75.0 million
(the “Revolving Credit Facility”) with a
five
year maturity, under the first lien senior secured loan facilities (the “First Lien”). Substantially concurrent with the consummation of the Business Combination, the full
$200.0 million
of the First Lien term loan (the “Term Loan”) was drawn.
No
amounts were originally drawn on the Revolving Credit Facility. The interest rate per annum is based on either (i) a base rate equaling the higher of (a) the “prime rate”, (b) the federal funds effective rate plus
0.50%
and (c) the Euro-currency rate applicable for an interest period of one month plus
1.00%
plus (x)
3.00%
margin for Term Loan or (y)
2.00%
margin for Revolving Credit Facility, or (ii) London Interbank Offered Rate (“LIBOR”) adjusted for statutory reserve requirements, plus (x)
4.00%
margin for the Term Loan subject to a floor of
1.00%
or (y)
3.00%
margin for the Revolving Credit Facility. The applicable margin for Revolving Credit Facility was adjusted after the completion of the Company’s first full fiscal quarter after the closing of the Business Combination based upon the Company’s consolidated First Lien net leverage ratio. As security for the payment or performance of its debt, the Company has pledged certain equity interests in its subsidiaries.
40
On March 16, 2018 (the “Amendment Date”), the Company entered into an amendment (the “Repricing Amendment”) to the First Lien. As a result of the Repricing Amendment, the interest rate on the Term Loan was reduced and, as of the Amendment Date, such loans bear interest at a rate equal to, at the Company's option, either LIBOR plus an applicable margin of
3.50%
or a base rate plus an applicable margin of
2.50%
. The Repricing Amendment did not change the interest rate on the Revolving Credit Facility. The Revolving Credit Facility will continue to bear interest based upon the Company's consolidated First Lien net leverage ratio as of the last financial statements delivered to the administrative agent. No additional debt was incurred, or any proceeds received, by the Company in connection with the Repricing Amendment. The incremental fees paid to the administrative agent are reflected as additional debt discount and are amortized over the terms of the long-term financing agreements using the effective-interest method.
The credit facilities governing our debt arrangements contain certain financial and other covenants. The Revolving Credit Facility has a maximum total net leverage ratio equal to or less than
6.25
:1.00 (with a reduction to
6.00
:1.00 on and after the third anniversary of the closing date of the credit facilities) contingent on credit extensions in excess of
30%
of the total amount of commitments available under the revolving credit facility, and limitations on our ability to, among other things, incur and/or undertake asset sales and other dispositions, liens, indebtedness, certain acquisitions and investments, consolidations, mergers, reorganizations and other fundamental changes, payment of dividends and other distributions to equity and warrant holders, and prepayments of material subordinated debt, in each case, subject to customary exceptions materially consistent with credit facilities of such type and size. Any failure to comply with the restrictions of the credit facilities may result in an event of default. The credit facilities governing our debt arrangements bear interest at variable rates. If market interest rates increase, variable rate debt will create higher debt service requirements, which could adversely affect our cash flow. As the Company has not drawn on the Revolving Credit Facility as of
August 31, 2019
and
August 25, 2018
, no debt covenants were applicable as of the period then ended.
As of
August 31, 2019
, the outstanding principal balances of the Term Loan was
$196.5 million
, and
no
amounts were drawn under the
$75.0 million
Revolving Credit Facility.
Acquisition Financing
On August 21, 2019, we entered into a stock purchase agreement (the “Purchase Agreement”) to acquire Quest Nutrition, LLC (“Quest”), a healthy lifestyle food company (the “Acquisition”), for approximately $1.0 billion. The Acquisition is expected to close by the end of the 2019 calendar year, subject to satisfaction of customary closing conditions. There is no financing condition for the Acquisition.
On October 9, 2019, we completed an underwritten public offering of 13,379,205 shares of our common stock at a price per share of $26.16 (the “Offering”), resulting in net proceeds to us of approximately $350.0 million, after deducting underwriting discounts and commissions and our estimated fees and expenses for the Offering. We intend to use these net proceeds to pay a portion of the purchase price and related fees and expenses for the Acquisition, or for general corporate purposes if the acquisition is not consummated.
We plan to fund the remainder of the Acquisition by using a significant portion of the approximately $265 million of cash on hand and committed financing pursuant to debt commitments from Barclays, Credit Suisse and Goldman Sachs.
Equity Warrants
From August 26, 2018 through October 5, 2018, public warrants to purchase an aggregate of 9,866,451 shares of the Company’s common stock were exercised for cash at an exercise price of $11.50 per share, resulting in aggregate gross proceeds to the Company of $113.5 million.
On October 4, 2018, the Company delivered a notice for the redemption (the “Redemption Notice”) of all of its public warrants that remained unexercised immediately after November 5, 2018. Holders who exercised public warrants following the Redemption Notice were required to do so on a cashless basis. Accordingly, holders were no longer permitted to exercise public warrants in exchange for payment in cash of $11.50 per share. Instead, a holder exercising a public warrant was deemed to have paid the $11.50 per share exercise price by the surrender of 0.61885 of a share of common stock that the holder would have been entitled to receive upon a cash exercise of each public warrant. Exercising holders received 0.38115 of a share of the Company’s common stock for each public warrant surrendered for exercise. Following the Redemption Notice, 3,499,639 public warrants were exercised on a cashless basis. An aggregate of 1,333,848 shares of the Company’s common stock were issued in connection with these exercises of the public warrants. All remaining public warrants were redeemed as of November 5, 2018 for an immaterial amount.
The Company’s private warrants to purchase 6,700,000 shares of the Company’s common stock remain outstanding as of the date of this Report.
41
Cash Flows
The following table sets forth the major sources and uses of cash for each of the periods set forth below (in thousands):
|
53-Weeks Ended
|
52-Weeks Ended
|
From July 7, 2017 through August 26, 2017
|
From August 28, 2016 through July 6, 2017
|
||||||||||||||
|
August 31, 2019
|
August 25, 2018
|
||||||||||||||||
|
(Successor)
|
(Successor)
|
(Successor)
|
(Predecessor)
|
||||||||||||||
|
Net cash provided by (used in) operating activities
|
$
|
73,042
|
|
$
|
61,038
|
|
$
|
(27,356
|
)
|
$
|
21,939
|
|
|||||
|
Net cash used in investing activities
|
$
|
(1,787
|
)
|
$
|
(3,513
|
)
|
$
|
(197,304
|
)
|
$
|
(20,458
|
)
|
|||||
|
Net cash provided by (used in) financing activities
|
$
|
83,376
|
|
$
|
(1,587
|
)
|
$
|
280,799
|
|
$
|
(53,536
|
)
|
|||||
Operating activities.
Our net cash provided by operating activities was
$73.0 million
for the successor period ended
August 31, 2019
,
an increase
of
$12.0 million
compared to net cash provided by operating activities of
$61.0 million
for the successor period ended
August 25, 2018
. The increase was primarily driven by higher income before taxes.
Our net cash provided by operating activities was $61.0 million for the successor period ended August 25, 2018, an increase of $88.4 million compared to net cash used in operating activities of $27.4 million for the successor period ended August 26, 2017. The increase was primarily driven by higher income before taxes.
Investing activities.
Our net cash used in investing activities was
$1.8 million
for the successor period ended
August 31, 2019
, which was a decrease of
$1.7 million
compared to the investing activities for the successor period ended
August 25, 2018
.
The decrease is primarily the result of a payment for a working capital adjustment of $1.8 million to the former owners of Atkins in the prior period.
Our net cash used in investing activities was $3.5 million for the successor period ended August 25, 2018, which was a decrease of $193.8 million compared to the investing activities for the successor period ended August 26, 2017. The change was due to the Business Combination in the successor period ended August 26, 2017, offset by minor increases in purchases of property and equipment.
Financing activities.
Our net cash provided by financing activities was
$83.4 million
for the successor period ended
August 31, 2019
, compared to net cash used in financing activities of
$1.6 million
for the successor period ended
August 25, 2018
. Net cash provided by financing activities for the successor period ended
August 31, 2019
includes
$113.5 million
of cash received from warrant exercises, and is partially offset by the payment of the TRA liability of
$26.5 million
, repurchases of common stock of
$2.1 million
and debt principal payments of
$2.0 million
.
Our net cash used in financing activities was $1.6 million for the successor period ended August 25, 2018, compared to net cash provided by financing activities of $280.8 million for the successor period ended August 26, 2017. The decrease is due to the procee ds from the issuance of long term debt of $191.9 million and proceeds from the issuance of equity of $97.0 million related to the Business Combination in the successor period ended August 26, 2017.
The Company had
$266.3 million
in cash and cash equivalents as of
August 31, 2019
, which is sufficient to satisfy a portion of the pending acquisition of Quest, current liabilities, current maturities of long-term debt and the interest payments associated with them.
Off-Balance Sheet Arrangements
As of
August 31, 2019
, we had no material off-balance sheet arrangements that have or are reasonably likely to have a current or future material effect on its financial condition, changes in financial condition, income or expenses, results of operations, liquidity, capital expenditures or capital resources.
42
Contractual Obligations
The following table summarizes our expected material contractual payment obligations as of
August 31, 2019
. This table does not include any obligations related to the financing or any other aspect of the Acquisition.
|
Payments due by period
|
||||||||||||||||||||
|
(In thousands)
|
Total
|
Year 1
|
Years 2-3
|
Years 4-5
|
Thereafter
|
|||||||||||||||
|
Long-term debt obligations
|
$
|
196,500
|
|
$
|
2,000
|
|
$
|
4,000
|
|
$
|
190,500
|
|
$
|
—
|
|
|||||
|
Operating leases (1)
|
7,406
|
|
2,546
|
|
3,624
|
|
1,180
|
|
56
|
|
||||||||||
|
Interest payments
|
55,245
|
|
11,648
|
|
22,836
|
|
20,761
|
|
—
|
|
||||||||||
|
Total
|
$
|
259,151
|
|
$
|
16,194
|
|
$
|
30,460
|
|
$
|
212,441
|
|
$
|
56
|
|
|||||
_______________
|
(1)
|
As of
August 31, 2019
, the Company is obligated under multiple non-cancellable operating leases, which continue through 2024. Rent expenses, inclusive of real estate taxes, utilities and maintenance incurred under operating leases, are included in general and administrative expenses in the Company’s consolidated statements of operations. Rent expenses were
$2.2 million
for
fifty-three week period ended August 31, 2019
,
$2.4 million
for the
fifty-two week period ended August 25, 2018
,
$0.3 million
for
the successor period from July 7, 2017 through August 26, 2017
, and
$1.7 million
for
the predecessor period from August 28, 2016 through July 6, 2017
, respectively.
|
Critical Accounting Policies, Judgments and Estimates
General
The consolidated financial statements of the Company have been prepared in accordance with accounting principles generally accepted in the U.S. While the majority of the Company’s revenue, expenses, assets and liabilities are not based on estimates, there are certain accounting principles that require management to make estimates regarding matters that are uncertain and susceptible to change. Critical accounting policies are defined as those policies that are reflective of significant judgments, estimates and uncertainties, which could potentially result in materially different results under different assumptions and conditions. Management regularly reviews the estimates and assumptions used in the preparation of the Company’s financial statements for reasonableness and adequacy. Our significant accounting policies are discussed in
Note 3
,
Summary of Significant Accounting Policies
, of our Consolidated Financial Statements in this filing; however, the following discussion pertains to accounting policies the Company believes are most critical to the portrayal of its financial condition and results of operations and that require significant, difficult, subjective or complex judgments. Other companies in similar businesses may use different estimation policies and methodologies, which may affect the comparability of the Company’s financial condition, results of operations and cash flows to those of other companies.
Revenue Recognition
The Company recognizes revenue when performance obligations under the terms of a contract with its customer are satisfied. The Company has determined that fulfilling and delivering products is a single performance obligation. Revenue is recognized at the point in time when the Company has satisfied its performance obligation and the customer has obtained control of the products. This generally occurs at the time of delivery to the customer's location.
Revenue is measured as the amount of consideration expected to be received in exchange for transferring products, including estimates of variable consideration. The most common forms of variable consideration include trade programs, consumer incentives, coupon redemptions, allowances for unsaleable product, and any additional amounts where a distinct good or service cannot be identified or the value cannot be reasonably estimated. Estimates of variable consideration are made using various information including historical data on performance of similar promotional activities and market data from IRI, and the Company's best estimates of current activity. The Company reviews these estimates regularly and makes revisions as necessary. The Company does not have any material significant payments terms as payment is received shortly after the time of sale.
Trade Promotions
The Company offers trade promotions through various programs to customers and consumers. Trade promotions include discounts, rebates, slotting and other marketing activities. Trade promotions are recorded as a reduction to net sales with a corresponding reduction to accounts receivable at the time of revenue recognition for the underlying sale. The recognition of trade promotions requires management to make estimates regarding the volume of incentive that will be redeemed and their total cost. These estimates are made using various information including historical data on performance of similar trade promotional activities, market data from IRI, and the Company's best estimates of current activity.
43
At
August 31, 2019
and
August 25, 2018
, the allowance for trade promotions was
$10.3 million
and
$7.4 million
, respectively. Differences between estimated expense and actual redemptions are recognized as a change in management estimate in a subsequent period. These differences have historically been insignificant.
Goodwill and Other Intangible Assets
Goodwill and indefinite-lived intangible assets are not amortized, but are evaluated for impairment annually or more often if events or circumstances indicated that potential impairment may be present. Our annual impairment tests are conducted at the beginning of the fourth quarter.
We test goodwill and indefinite-lived intangible assets by performing either qualitative or quantitative assessments. In the qualitative assessment, factors including macro-economic conditions, industry and company-specific factors, legal and regulatory environments and historical company performance are evaluated in assessing fair value. If we determine that it is more likely than not that the fair value of the reporting unit is less than its carrying value, a quantitative test is then performed. Otherwise, no further testing is required. When using a quantitative approach, we compare the fair value of the reporting unit to its carrying amount, including goodwill. If the estimated fair value of the reporting unit is less than the carrying amount of the reporting unit, impairment is indicated, requiring recognition of a impairment charge for the differential.
During fiscal 2019, we elected to perform quantitative assessments of goodwill and indefinite-lived intangible assets. The inputs and assumptions used require considerable management judgment and are based on expectations of future operating performance. Based on the results of the assessments, it was determined that the fair value of goodwill and indefinite-lived assets exceeded their carrying values. Accordingly, no further impairment testing was completed and no impairment charges related to goodwill or indefinite-lived intangibles were recognized during the fiscal period ended
August 31, 2019
.
Qualitative assessments of goodwill and indefinite-lived intangible assets were performed in 2018 and 2017. Based on the results of assessment, it was determined that it is more likely than not the reporting unit had a fair value in excess of carrying value. Accordingly, no further impairment testing was completed and no impairment charges related to goodwill or indefinite-lived intangibles were recognized during the fiscal periods ended
August 25, 2018
or
August 26, 2017
.
The Company also has intangible assets that are expected to have determinable useful lives, consisting primarily of trademarks, customer relationships and licensing agreements. Costs of finite-lived intangible assets are amortized over their estimated useful lives. Finite-lived intangible assets are tested for impairment when events or circumstances indicated that the carrying amount may not be recoverable. For the fiscal periods ended
August 31, 2019
,
August 25, 2018
or
August 26, 2017
there were no impairments recorded related to finite-lived intangible assets.
Income Taxes
We are subject to income to income taxes in the United States and numerous other jurisdictions. Significant judgment is required in determining our provision for income tax, including evaluating uncertainties in the application of accounting principles and complex tax laws.
Income taxes include federal, state and foreign taxes currently payable and deferred taxes arising from temporary differences between income for financial reporting and income tax purposes. Deferred tax assets and liabilities are determined based on the differences between the financial statement balances and the tax bases of assets and liabilities using enacted tax rates in effect for the year in which the differences are expected to reverse. The effect on deferred tax assets and liabilities of a change in tax rates is recognized in income in the year that includes the enactment date. Valuation allowances are established when necessary to reduce deferred tax assets to amounts expected to be realized.
New Accounting Pronouncements
Refer to
Note 3
,
Summary of Significant Accounting Policies
, of our Consolidated Financial Statements in this filing for further information regarding recently issued accounting standards.
Item 7A. Quantitative and Qualitative Disclosures About Market Risk
Simply Good Foods' future income, cash flows and fair values relevant to financial instruments are dependent upon prevalent market interest rates. Market risk refers to the risk of loss from adverse changes in market prices and interest rates.
Interest rate risk.
We are subject to interest rate risk in connection with borrowing based on a variable interest rate. Derivative financial instruments, such as interest rate swap agreements and interest rate cap agreements, may be used for the purpose of managing fluctuating interest rate exposures that exist from our variable rate debt obligations that are expected to remain outstanding. Interest rate changes do not affect the market value of such debt, but could affect the amount of our interest payments, and accordingly, our future earnings
44
and cash flows, assuming other factors are held constant. Assuming average variable rate debt levels during the year, a 1% increase in interest rates would have increased interest expense by approximately
$2.0 million
for the
fifty-three week period ended August 31, 2019
.
Foreign currency risk.
We are exposed to changes in currency rates as a result of investments in foreign operations and revenue generated in currencies other than U.S. dollar. Revenue and profit generated by international operations will increase or decrease compared to prior periods as a result of changes in foreign currency exchange rates. Foreign currency risk is primarily related to operations in Canada. A 10% increase or decrease in the Canadian Dollar against the U.S. Dollar would result in less than a 1% change in our net income for the
fifty-three week period ended August 31, 2019
.
Inflation.
While inflation may affect Simply Good Foods’ revenue and cost of services and products, we believe the effects of inflation, if any, on its results of operations and financial condition have not been significant. However, there can be no assurance that results of operations and financial condition will not be materially impacted by inflation in the future.
45
Item 8. Financial Statements and Supplementary Data
TABLE OF CONTENTS
|
Page
|
||
46
REPORT OF INDEPENDENT REGISTERED PUBLIC ACCOUNTING FIRM
To the Stockholders and the Board of Directors of
The Simply Good Foods Company:
Opinion on the Financial Statements
We have audited the accompanying consolidated balance sheet of The Simply Good Foods Company and subsidiaries (the "Company") as of August 31, 2019, the related consolidated statements of operations and comprehensive income (loss), stockholders' equity (deficit), and cash flows, for the period ended August 31, 2019, and the related notes (collectively referred to as the “financial statements”). In our opinion, the financial statements present fairly, in all material respects, the financial position of the Company as of August 31, 2019, and the results of its operations and its cash flows for the period ended August 31, 2019, in conformity with accounting principles generally accepted in the United States of America.
We have also audited, in accordance with the standards of the Public Company Accounting Oversight Board (United States) (PCAOB), the Company’s internal control over financial reporting as of August 31, 2019, based on criteria established in Internal Control - Integrated Framework (2013) issued by the Committee of Sponsoring Organizations of the Treadway Commission and our report dated October 30, 2019, expressed an unqualified opinion on the Company’s internal control over financial reporting.
Change in Accounting Principle
As discussed in Note 2 to the financial statements, the Company has elected to change its method of accounting to reclassify shipping and handling costs relating to the delivery of products to customers from distribution expense to cost of goods sold in the year ended August 31, 2019. This change in accounting principle has been retrospectively applied to all periods presented.
Basis for Opinion
These financial statements are the responsibility of the Company’s management. Our responsibility is to express an opinion on the Company’s financial statements based on our audit. We are a public accounting firm registered with the PCAOB and are required to be independent with respect to the Company in accordance with the U.S. federal securities laws and the applicable rules and regulations of the Securities and Exchange Commission and the PCAOB.
We conducted our audit in accordance with the standards of the PCAOB. Those standards require that we plan and perform the audit to obtain reasonable assurance about whether the financial statements are free of material misstatement, whether due to error or fraud. Our audit included performing procedures to assess the risks of material misstatement of the financial statements, whether due to error or fraud, and performing procedures that respond to those risks. Such procedures included examining, on a test basis, evidence regarding the amounts and disclosures in the financial statements. Our audit also included evaluating the accounting principles used and significant estimates made by management, as well as evaluating the overall presentation of the financial statements. We believe that our audit provides a reasonable basis for our opinion.
Critical Audit Matter
The critical audit matter communicated below is a matter arising from the current-period audit of the financial statements that was communicated or required to be communicated to the Audit Committee and that (1) relates to accounts or disclosures that are material to the financial statements and (2) involved our especially challenging, subjective, or complex judgments. The communication of critical audit matters does not alter in any way our opinion on the financial statements, taken as a whole, and we are not, by communicating the critical audit matter below, providing a separate opinion on the critical audit matter or on the accounts or disclosures to which it relates.
Trade Promotions - Refer to Note 4 to the Financial Statements
Critical Audit Matter Description
The Company offers trade promotions through various programs to customers and consumers. Trade promotions include discounts, rebates, slotting, and other marketing activities. Trade promotions are recorded as a reduction to net sales with a corresponding reduction to accounts receivable at the time of revenue recognition for the underlying sale. The recognition of trade promotions requires the Company to make estimates regarding the volume of incentives that will be redeemed and their costs. These estimates are made using various information including historical data on performance of similar trade promotional activities, as well market data, and the Company’s best estimates of current activity. As of August 31, 2019, the allowance for trade promotions balance, which is recorded as a reduction to accounts receivable, was approximately $10.3 million.
47
Given the subjectivity of estimating the expected promotional claims and the volume of trade promotions, performing audit procedures to evaluate whether the allowance for trade promotion balance is appropriately recorded as of August 31, 2019, required a high degree of auditor judgment and an increased extent of effort.
How the Critical Audit Matter Was Addressed in the Audit
Our auditing procedures related to the allowance for trade promotion balance included the following, among others:
|
•
|
For a selection of allowances for trade promotion balances recorded as of August 31, 2019, we:
|
|
–
|
Confirmed contract terms directly with the customer.
|
|
–
|
Agreed contract terms from the accounting records to the promotion agreement with the customer and verified that the promotion period was prior to September 1, 2019.
|
|
•
|
We evaluated management’s ability to estimate promotional claims incurred, but not yet received for potential management bias by comparing historical promotional claims received to management’s estimates of the claims to be received.
|
|
•
|
For a selection of customer promotional claims presented or resolved after August 31, 2019, we compared that amount to the August 31, 2019 allowance for promotion balance and traced presented or resolved deduction to a properly recorded sale.
|
/s/ Deloitte & Touche LLP
Denver, Colorado
October 30, 2019
We have served as the Company’s auditor since 2019.
48
Report of Independent Registered Public Accounting Firm
The Board of Directors and Shareholders of
The Simply Good Foods Company and subsidiaries
Opinion on the Financial Statements
We have audited the accompanying consolidated balance sheets of The Simply Good Foods Company and subsidiaries (successor) as of August 25, 2018, and the related successor consolidated statements of operations and comprehensive income (loss), changes in stockholders’ equity, and cash flows for the 52-weeks ended August 25, 2018 and from July 7, 2017 through August 26, 2017. We have also audited the accompanying consolidated statements of operations and comprehensive income (loss), changes in stockholders’ equity (deficit), and cash flows of NCP-ATK Holdings, Inc. and subsidiaries (predecessor) for the period from August 28, 2016 through July 6, 2017, and the related notes (collectively referred to as the “consolidated financial statements”). In our opinion, the consolidated financial statements present fairly, in all material respects, the financial position of the Company at August 25, 2018 and the results of its operations and its cash flows for the 52-weeks ended August 25, 2018 and from July 7, 2017 through August 26, 2017 as well as the predecessor results for the period from August 28, 2016 through July 6, 2017, in conformity with U.S. generally accepted accounting principles.
Change in Accounting Principle
As discussed in Note 2 to the consolidated financial statements, the Company has elected to change its principle of accounting for the classification of shipping & handling costs relating to the delivery of products to customers from operating expenses to cost of sales in the 52-week period ended August 31, 2019. This change in accounting principle has been retrospectively applied to all periods presented.
Basis for Opinion
These financial statements are the responsibility of the Company's management. Our responsibility is to express an opinion on the Company’s financial statements based on our audits. We are a public accounting firm registered with the Public Company Accounting Oversight Board (United States) (PCAOB) and are required to be independent with respect to the Company in accordance with the U.S. federal securities laws and the applicable rules and regulations of the Securities and Exchange Commission and the PCAOB.
We conducted our audits in accordance with the standards of the PCAOB. Those standards require that we plan and perform the audit to obtain reasonable assurance about whether the financial statements are free of material misstatement, whether due to error or fraud. The Company is not required to have, nor were we engaged to perform, an audit of its internal control over financial reporting. As part of our audits we are required to obtain an understanding of internal control over financial reporting but not for the purpose of expressing an opinion on the effectiveness of the Company's internal control over financial reporting. Accordingly, we express no such opinion.
Our audits included performing procedures to assess the risks of material misstatement of the financial statements, whether due to error or fraud, and performing procedures that respond to those risks. Such procedures included examining, on a test basis, evidence regarding the amounts and disclosures in the financial statements. Our audits also included evaluating the accounting principles used and significant estimates made by management, as well as evaluating the overall presentation of the financial statements. We believe that our audits provide a reasonable basis for our opinion.
/s/ Ernst & Young LLP
We served as the Company’s auditor from 2011 to February 25, 2019.
Denver, Colorado
October 24, 2018
except with respect to our opinion on the consolidated financial statements insofar as it relates to the effects of the accounting principle change discussed in Note 2, as to which the date is
October 30, 2019
49
The Simply Good Foods Company and Subsidiaries
Consolidated Balance Sheets
(In thousands, except share data)
See accompanying Notes to the Consolidated Financial Statements
|
August 31, 2019
|
August 25, 2018
|
|||||||
|
(Successor)
|
(Successor)
|
|||||||
|
Assets
|
||||||||
|
Current assets:
|
||||||||
|
Cash and cash equivalents
|
$
|
266,341
|
|
$
|
111,971
|
|
||
|
Accounts receivable, net
|
44,240
|
|
36,622
|
|
||||
|
Inventories
|
38,085
|
|
30,001
|
|
||||
|
Prepaid expenses
|
2,882
|
|
2,069
|
|
||||
|
Other current assets
|
6,059
|
|
5,077
|
|
||||
|
Total current assets
|
357,607
|
|
185,740
|
|
||||
|
|
||||||||
|
Long-term assets:
|
||||||||
|
Property and equipment, net
|
2,456
|
|
2,565
|
|
||||
|
Intangible assets, net
|
306,139
|
|
312,643
|
|
||||
|
Goodwill
|
471,427
|
|
471,427
|
|
||||
|
Other long-term assets
|
4,021
|
|
2,230
|
|
||||
|
Total assets
|
$
|
1,141,650
|
|
$
|
974,605
|
|
||
|
|
||||||||
|
Liabilities and stockholders' equity
|
||||||||
|
Current liabilities:
|
||||||||
|
Accounts payable
|
$
|
15,730
|
|
$
|
11,158
|
|
||
|
Accrued interest
|
1,693
|
|
582
|
|
||||
|
Accrued expenses and other current liabilities
|
29,933
|
|
15,875
|
|
||||
|
Current portion of TRA liability
|
—
|
|
2,320
|
|
||||
|
Current maturities of long-term debt
|
676
|
|
648
|
|
||||
|
Total current liabilities
|
48,032
|
|
30,583
|
|
||||
|
|
||||||||
|
Long-term liabilities:
|
||||||||
|
Long-term debt, less current maturities
|
190,259
|
|
190,935
|
|
||||
|
Long-term portion of TRA liability
|
—
|
|
25,148
|
|
||||
|
Deferred income taxes
|
65,383
|
|
54,475
|
|
||||
|
Other long-term liabilities
|
532
|
|
863
|
|
||||
|
Total liabilities
|
304,206
|
|
302,004
|
|
||||
|
See commitments and contingencies (Note 11)
|
|
|
|
|
||||
|
|
||||||||
|
Stockholders' equity:
|
||||||||
|
Preferred stock, $0.01 par value, 100,000,000 shares authorized, none issued
|
—
|
|
—
|
|
||||
|
Common stock, $0.01 par value, 600,000,000 shares authorized, 81,973,284 and 70,605,675 issued at August 31, 2019 and August 25, 2018, respectively
|
820
|
|
706
|
|
||||
|
Treasury stock, 98,234 and 0 shares at cost at August 31, 2019 and August 25, 2018, respectively
|
(2,145
|
)
|
—
|
|
||||
|
Additional paid-in-capital
|
733,775
|
|
614,399
|
|
||||
|
Retained earnings
|
105,830
|
|
58,294
|
|
||||
|
Accumulated other comprehensive loss
|
(836
|
)
|
(798)
|
|
||||
|
Total stockholders' equity
|
837,444
|
|
672,601
|
|
||||
|
Total liabilities and stockholders' equity
|
$
|
1,141,650
|
|
$
|
974,605
|
|
||
50
The Simply Good Foods Company and Subsidiaries
Consolidated Statements of Operations and Comprehensive Income (Loss)
(In thousands, except share and per share data)
|
53-Weeks Ended
|
52-Weeks Ended
|
From July 7, 2017
through August 26, 2017 |
From August 28, 2016 through July 6, 2017
|
||||||||||||||
|
August 31, 2019
|
August 25, 2018
|
||||||||||||||||
|
(Successor)
|
(Successor)
|
(Successor)
|
(Predecessor)
|
||||||||||||||
|
Net sales
|
$
|
523,383
|
|
$
|
431,429
|
|
$
|
56,334
|
|
$
|
339,837
|
|
|||||
|
Cost of goods sold
|
305,978
|
|
251,063
|
|
39,584
|
|
200,026
|
|
|||||||||
|
Gross profit
|
217,405
|
|
180,366
|
|
16,750
|
|
139,811
|
|
|||||||||
|
Operating expenses:
|
|||||||||||||||||
|
Selling and marketing
|
67,488
|
|
59,092
|
|
6,937
|
|
47,494
|
|
|||||||||
|
General and administrative
|
61,972
|
|
49,635
|
|
6,969
|
|
34,567
|
|
|||||||||
|
Depreciation and amortization
|
7,496
|
|
7,498
|
|
985
|
|
8,409
|
|
|||||||||
|
Business transaction costs
|
7,107
|
|
2,259
|
|
—
|
|
25,608
|
|
|||||||||
|
Loss (gain) in fair value change of contingent consideration - TRA liability
|
533
|
|
(2,848
|
)
|
—
|
|
—
|
|
|||||||||
|
Total operating expenses
|
144,596
|
|
115,636
|
|
14,891
|
|
116,078
|
|
|||||||||
|
Income from operations
|
72,809
|
|
64,730
|
|
1,859
|
|
23,733
|
|
|||||||||
|
Other income (expense):
|
|||||||||||||||||
|
Change in warrant liabilities
|
—
|
|
—
|
|
—
|
|
722
|
|
|||||||||
|
Interest income
|
3,826
|
|
—
|
|
—
|
|
—
|
|
|||||||||
|
Interest expense
|
(13,627
|
)
|
(12,551
|
)
|
(1,662
|
)
|
(22,724
|
)
|
|||||||||
|
Gain on settlement of TRA liability
|
1,534
|
|
—
|
|
—
|
|
—
|
|
|||||||||
|
Gain (loss) on foreign currency transactions
|
(452
|
)
|
97
|
|
513
|
|
133
|
|
|||||||||
|
Other income
|
196
|
|
815
|
|
30
|
|
221
|
|
|||||||||
|
Total other expense
|
(8,523
|
)
|
(11,639
|
)
|
(1,119
|
)
|
(21,648
|
)
|
|||||||||
|
Income before income taxes
|
64,286
|
|
53,091
|
|
740
|
|
2,085
|
|
|||||||||
|
Income tax expense (benefit)
|
16,750
|
|
(17,364
|
)
|
290
|
|
4,570
|
|
|||||||||
|
Net income (loss)
|
$
|
47,536
|
|
$
|
70,455
|
|
$
|
450
|
|
$
|
(2,485
|
)
|
|||||
|
Other comprehensive income:
|
|||||||||||||||||
|
Foreign currency translation adjustments
|
(38
|
)
|
(817
|
)
|
19
|
|
(199
|
)
|
|||||||||
|
Comprehensive income (loss)
|
$
|
47,498
|
|
$
|
69,638
|
|
$
|
469
|
|
$
|
(2,684
|
)
|
|||||
|
Earnings per share from net income:
|
|||||||||||||||||
|
Basic
|
$
|
0.59
|
|
$
|
1.00
|
|
$
|
0.01
|
|
||||||||
|
Diluted
|
$
|
0.56
|
|
$
|
0.96
|
|
$
|
0.01
|
|
||||||||
|
Weighted average shares outstanding:
|
|||||||||||||||||
|
Basic
|
80,734,091
|
|
70,582,149
|
|
70,562,477
|
|
|||||||||||
|
Diluted
|
85,243,909
|
|
73,681,355
|
|
71,254,770
|
|
|||||||||||
See accompanying Notes to the Consolidated Financial Statements
51
The Simply Good Foods Company and Subsidiaries
Consolidated Statements of Cash Flows
(In thousands)
|
53-Weeks Ended
|
52-Weeks Ended
|
From July 7, 2017
through August 26, 2017 |
From August 28, 2016 through July 6, 2017
|
||||||||||||||
|
August 31, 2019
|
August 25, 2018
|
||||||||||||||||
|
(Successor)
|
(Successor)
|
(Successor)
|
(Predecessor)
|
||||||||||||||
|
Operating activities
|
|||||||||||||||||
|
Net income
|
$
|
47,536
|
|
$
|
70,455
|
|
$
|
450
|
|
$
|
(2,485
|
)
|
|||||
|
Adjustments to reconcile net income to net cash provided by operating activities:
|
|||||||||||||||||
|
Depreciation and amortization
|
7,644
|
|
7,672
|
|
1,000
|
|
8,617
|
|
|||||||||
|
Amortization of deferred financing costs and debt discount
|
1,352
|
|
1,312
|
|
192
|
|
1,950
|
|
|||||||||
|
Stock compensation expense
|
5,501
|
|
4,029
|
|
412
|
|
2,441
|
|
|||||||||
|
Change in warrant liabilities
|
—
|
|
—
|
|
—
|
|
(722
|
)
|
|||||||||
|
Loss (gain) in fair value change of contingent consideration - TRA liability
|
533
|
|
(2,848
|
)
|
—
|
|
—
|
|
|||||||||
|
Gain on settlement of TRA liability
|
(1,534
|
)
|
—
|
|
—
|
|
—
|
|
|||||||||
|
Unrealized (gain) loss on foreign currency transactions
|
452
|
|
(97
|
)
|
(513
|
)
|
(133
|
)
|
|||||||||
|
Deferred income taxes
|
10,908
|
|
(21,108
|
)
|
(382
|
)
|
(3,880
|
)
|
|||||||||
|
Loss on disposal of property and equipment
|
6
|
|
128
|
|
—
|
|
—
|
|
|||||||||
|
Changes in operating assets and liabilities:
|
|||||||||||||||||
|
Accounts receivable, net
|
(7,985
|
)
|
267
|
|
(5,556
|
)
|
14,447
|
|
|||||||||
|
Inventories
|
(8,272
|
)
|
(1,081
|
)
|
4,130
|
|
1,912
|
|
|||||||||
|
Prepaid expenses
|
(824
|
)
|
847
|
|
(1,107
|
)
|
36
|
|
|||||||||
|
Other current assets
|
(2,155
|
)
|
3,094
|
|
5,340
|
|
(10,548
|
)
|
|||||||||
|
Accounts payable
|
4,734
|
|
(3,603
|
)
|
2,089
|
|
(7,246
|
)
|
|||||||||
|
Accrued interest
|
1,111
|
|
21
|
|
561
|
|
(3,615
|
)
|
|||||||||
|
Accrued expenses and other current liabilities
|
13,961
|
|
1,962
|
|
(34,096
|
)
|
21,459
|
|
|||||||||
|
Other
|
74
|
|
(12
|
)
|
124
|
|
(294
|
)
|
|||||||||
|
Net cash provided by (used in) operating activities
|
73,042
|
|
61,038
|
|
(27,356
|
)
|
21,939
|
|
|||||||||
|
Investing activities
|
|||||||||||||||||
|
Purchases of property and equipment
|
(1,037
|
)
|
(1,770
|
)
|
(458
|
)
|
(498
|
)
|
|||||||||
|
Proceeds from sale of property and equipment
|
—
|
|
14
|
|
—
|
|
—
|
|
|||||||||
|
Issuance of note receivable
|
(750
|
)
|
—
|
|
—
|
|
—
|
|
|||||||||
|
Acquisition of business, net of cash acquired
|
—
|
|
(1,757
|
)
|
(600,825
|
)
|
(19,960
|
)
|
|||||||||
|
Cash withdrawn from trust account
|
—
|
|
—
|
|
403,979
|
|
—
|
|
|||||||||
|
Net cash used in investing activities
|
(1,787
|
)
|
(3,513
|
)
|
(197,304
|
)
|
(20,458
|
)
|
|||||||||
|
Financing activities
|
|||||||||||||||||
|
Proceeds from option exercises
|
706
|
|
120
|
|
—
|
|
109
|
|
|||||||||
|
Cash received from warrant exercises
|
113,464
|
|
232
|
|
—
|
|
—
|
|
|||||||||
|
Tax payments related to issuance of restricted stock units
|
(181
|
)
|
(120
|
)
|
—
|
|
—
|
|
|||||||||
|
Repurchase of common stock
|
(2,145
|
)
|
—
|
|
—
|
|
—
|
|
|||||||||
|
Excess tax benefits of stock-based compensation
|
—
|
|
—
|
|
—
|
|
(59
|
)
|
|||||||||
|
Deferred financing costs
|
—
|
|
(319
|
)
|
—
|
|
—
|
|
|||||||||
|
Settlement of TRA liability
|
(26,468
|
)
|
—
|
|
—
|
|
—
|
|
|||||||||
|
Principal payments of long-term debt
|
(2,000
|
)
|
(1,500
|
)
|
—
|
|
(53,586
|
)
|
|||||||||
|
Proceeds from issuance of private placement equity, net of issuance costs
|
—
|
|
—
|
|
97,000
|
|
—
|
|
|||||||||
|
Proceeds from issuance of long term debt, net of issuance costs
|
—
|
|
—
|
|
191,899
|
|
—
|
|
|||||||||
|
Payment of Conyers Park deferred equity issuance costs
|
—
|
|
—
|
|
(8,100
|
)
|
—
|
|
|||||||||
|
Net cash provided by (used in) financing activities
|
83,376
|
|
(1,587
|
)
|
280,799
|
|
(53,536
|
)
|
|||||||||
|
Cash and cash equivalents
|
|||||||||||||||||
|
Net increase in cash
|
154,631
|
|
55,938
|
|
56,139
|
|
(52,055
|
)
|
|||||||||
|
Effect of exchange rate on cash
|
(261
|
)
|
(468
|
)
|
159
|
|
(10
|
)
|
|||||||||
|
Cash at beginning of period
|
111,971
|
|
56,501
|
|
203
|
|
78,492
|
|
|||||||||
|
Cash and cash equivalents at end of period
|
$
|
266,341
|
|
$
|
111,971
|
|
$
|
56,501
|
|
$
|
26,427
|
|
|||||
52
|
53-Weeks Ended
|
52-Weeks Ended
|
From July 7, 2017
through August 26, 2017 |
From August 28, 2016 through July 6, 2017
|
||||||||||||||
|
August 31, 2019
|
August 25, 2018
|
||||||||||||||||
|
(Successor)
|
(Successor)
|
(Successor)
|
(Predecessor)
|
||||||||||||||
|
Supplemental disclosures of cash flow information
|
|||||||||||||||||
|
Cash paid for interest
|
$
|
11,164
|
|
$
|
11,218
|
|
$
|
909
|
|
$
|
24,334
|
|
|||||
|
Cash paid for taxes
|
$
|
7,451
|
|
$
|
4,577
|
|
$
|
—
|
|
$
|
12,711
|
|
|||||
See accompanying Notes to the Consolidated Financial Statements
53
The Simply Good Foods Company and Subsidiaries
Consolidated Statements of Stockholders' Equity (Deficit)
(In thousands, except share data)
|
NCP - ATK Holdings, Inc. and Subsidiaries
|
|||||||||||||||||||||||||||||||
|
Predecessor
|
Common Stock
|
Treasury Stock
|
Additional Paid in Capital
|
Retained Earnings
(Accumulated Deficit)
|
Accumulated Other Comprehensive Income (Loss)
|
Total
|
|||||||||||||||||||||||||
|
Shares
|
Amount
|
Shares
|
Amount
|
||||||||||||||||||||||||||||
|
Balance, August 26, 2016
|
508,132
|
|
$
|
5
|
|
$
|
—
|
|
$
|
—
|
|
$
|
(43,551
|
)
|
$
|
16,155
|
|
$
|
(443
|
)
|
$
|
(27,834
|
)
|
||||||||
|
Net income
|
—
|
|
—
|
|
—
|
|
—
|
|
—
|
|
(2,485
|
)
|
—
|
|
(2,485
|
)
|
|||||||||||||||
|
Stock-based compensation
|
—
|
|
—
|
|
—
|
|
—
|
|
2,441
|
|
—
|
|
—
|
|
2,441
|
|
|||||||||||||||
|
Foreign currency translation adjustments
|
—
|
|
—
|
|
—
|
|
—
|
|
—
|
|
—
|
|
(199
|
)
|
(199
|
)
|
|||||||||||||||
|
Excess tax benefit from stock-based compensation
|
—
|
|
—
|
|
—
|
|
—
|
|
(59
|
)
|
—
|
|
—
|
|
(59
|
)
|
|||||||||||||||
|
Exercise of options to purchase common stock
|
387
|
|
—
|
|
—
|
|
—
|
|
109
|
|
—
|
|
—
|
|
109
|
|
|||||||||||||||
|
Balance, July 6, 2017
|
508,519
|
|
$
|
5
|
|
$
|
—
|
|
$
|
—
|
|
$
|
(41,060
|
)
|
$
|
13,670
|
|
$
|
(642
|
)
|
$
|
(28,027
|
)
|
||||||||
|
The Simply Good Foods Company and Subsidiaries
|
||||||||||||||||||||||||||||||
|
Successor
|
Common Stock
|
Treasury Stock
|
Additional Paid in Capital
|
Retained Earnings
(Accumulated Deficit) |
Accumulated Other Comprehensive Income (Loss)
|
Total
|
||||||||||||||||||||||||
|
Shares
|
Amount
|
Shares
|
Amount
|
|||||||||||||||||||||||||||
|
Balance, July 7, 2016
|
70,562,477
|
|
$
|
706
|
|
—
|
|
$
|
—
|
|
$
|
609,726
|
|
$
|
(12,611
|
)
|
$
|
—
|
|
$
|
597,821
|
|
||||||||
|
Net income
|
—
|
|
—
|
|
—
|
|
—
|
|
—
|
|
450
|
|
—
|
|
450
|
|
||||||||||||||
|
Stock-based compensation
|
—
|
|
—
|
|
—
|
|
—
|
|
412
|
|
—
|
|
—
|
|
412
|
|
||||||||||||||
|
Foreign currency translation adjustments
|
—
|
|
—
|
|
—
|
|
—
|
|
—
|
|
—
|
|
19
|
|
19
|
|
||||||||||||||
|
Balance, August 26, 2017
|
70,562,477
|
|
$
|
706
|
|
—
|
|
—
|
|
$
|
610,138
|
|
$
|
(12,161
|
)
|
$
|
19
|
|
$
|
598,702
|
|
|||||||||
|
Net income
|
—
|
|
—
|
|
—
|
|
—
|
|
—
|
|
70,455
|
|
—
|
|
70,455
|
|
||||||||||||||
|
Stock-based compensation
|
—
|
|
—
|
|
—
|
|
—
|
|
4,029
|
|
—
|
|
—
|
|
4,029
|
|
||||||||||||||
|
Foreign currency translation adjustments
|
—
|
|
—
|
|
—
|
|
—
|
|
—
|
|
—
|
|
(817
|
)
|
(817
|
)
|
||||||||||||||
|
Shares issued upon vesting of Restricted Stock Units
|
12,986
|
|
—
|
|
—
|
|
—
|
|
(120
|
)
|
—
|
|
—
|
|
(120
|
)
|
||||||||||||||
|
Exercise of options to purchase common stock
|
10,000
|
|
—
|
|
—
|
|
—
|
|
120
|
|
—
|
|
—
|
|
120
|
|
||||||||||||||
|
Warrant conversion
|
20,212
|
|
—
|
|
—
|
|
—
|
|
232
|
|
—
|
|
—
|
|
232
|
|
||||||||||||||
|
Balance, August 25, 2018
|
70,605,675
|
|
$
|
706
|
|
—
|
|
—
|
|
$
|
614,399
|
|
$
|
58,294
|
|
$
|
(798
|
)
|
$
|
672,601
|
|
|||||||||
|
Net income
|
—
|
|
—
|
|
—
|
|
—
|
|
—
|
|
47,536
|
|
—
|
|
47,536
|
|
||||||||||||||
|
Stock-based compensation
|
—
|
|
—
|
|
—
|
|
—
|
|
5,501
|
|
—
|
|
—
|
|
5,501
|
|
||||||||||||||
|
Foreign currency translation adjustments
|
—
|
|
—
|
|
—
|
|
—
|
|
—
|
|
—
|
|
(38
|
)
|
(38
|
)
|
||||||||||||||
|
Repurchase of common stock
|
—
|
|
—
|
|
98,234
|
|
(2,145
|
)
|
—
|
|
—
|
|
—
|
|
(2,145
|
)
|
||||||||||||||
|
Shares issued upon vesting of Restricted Stock Units
|
80,293
|
|
1
|
|
—
|
|
—
|
|
(182
|
)
|
—
|
|
—
|
|
(181
|
)
|
||||||||||||||
|
Exercise of options to purchase common stock
|
87,017
|
|
1
|
|
—
|
|
—
|
|
705
|
|
—
|
|
—
|
|
706
|
|
||||||||||||||
|
Warrant conversion
|
11,200,299
|
|
112
|
|
—
|
|
—
|
|
113,352
|
|
—
|
|
—
|
|
113,464
|
|
||||||||||||||
|
Balance, August 31, 2019
|
81,973,284
|
|
$
|
820
|
|
98,234
|
|
(2,145
|
)
|
$
|
733,775
|
|
$
|
105,830
|
|
$
|
(836
|
)
|
$
|
837,444
|
|
|||||||||
54
Notes to Consolidated Financial Statements
(In thousands, except for share and per share data)
1
.
Nature of Operations and Principles of Consolidation
Description of Business
Conyers Park Acquisition Corp (“Conyers Park”) was formed on April 20, 2016, as a special purpose acquisition company for the purpose of effecting a merger, capital stock exchange, asset acquisition, stock purchase, reorganization or similar business combination with one or more businesses.
The Simply Good Foods Company (“Simply Good Foods”) was formed by Conyers Park on March 30, 2017. On April 10, 2017, Conyers Park and NCP-ATK Holdings, Inc. (“Atkins”) announced that they entered into a definitive merger agreement (the “Merger Agreement”). On
July 7, 2017
(the “Closing Date”), pursuant to the Merger Agreement, Conyers Park merged into Simply Good Foods, which acquired Atkins. As a result, Atkins became a wholly-owned subsidiary of Simply Good Foods (the “Business Combination”). Simply Good Foods was listed on the Nasdaq Capital Market under the symbol “SMPL” upon consummation of the Business Combination. Atkins was formerly owned by Roark Capital Management, LLC (“Roark”).
The Business Combination resulted in Conyers Park controlling the Board of Directors of the combined entity. For accounting purposes, Simply Good Foods is the acquirer and the accounting “Successor” in the Business Combination while Atkins is the acquiree and accounting “Predecessor”. Our financial statement presentation includes the financial statements of Atkins as “Predecessor” for all periods prior to the Closing Date and of Simply Good Foods, including the consolidation of Atkins, for periods after the Closing Date.
Simply Good Foods operates in the healthy snacking category. The Atkins brand approach focuses on a healthy eating approach with reduced levels of refined carbohydrates and sugars and encourages the consumption of lean protein, fiber, fruits, vegetables and healthy fats. The Company sells a variety of nutrition bars, shakes and frozen meals designed around the nutrition principles of the Atkins eating approach.
Basis of Presentation
The consolidated financial statements have been prepared in accordance with U.S. Generally Accepted Accounting Principles (“GAAP”). The Company maintains its accounting records on a
52
/
53
-week fiscal year, ending on the last Saturday in August.
The financial information presented within our consolidated financial statements has been prepared pursuant to the rules and regulations of the Securities and Exchange Commission (the “SEC”). The accompanying financial statements include Consolidated Balance Sheets for the successor entity for the periods ended
August 31, 2019
and
August 25, 2018
. The remaining financial statements include the successor
fifty-three week
period ended
August 31, 2019
, the successor
fifty-two week
period ended
August 25, 2018
, the successor period from July 7, 2017 through August 26, 2017, and the predecessor period from August 28, 2016 through July 6, 2017.
The consolidated financial statements include the accounts of the Company and its wholly-owned subsidiaries. All intercompany accounts and transactions have been eliminated. Unless the context otherwise requires, “we,” “us,” “our” and the “Company” refer to Atkins and its subsidiaries for periods prior to the completion of the Business Combination, and Simply Good Foods and its subsidiaries for periods upon or after the completion of the Business Combination.
Reclassification of Prior Year Amounts
Certain prior year amounts have been reclassified to conform to the current year presentation including Selling and Marketing expenses, which have been combined as
Selling and marketing
on the Consolidated Statements of Operations and Comprehensive Income (Loss) and other operating expense, which has been combined with
General and administrative
expense on the Consolidated Statements of Operations and Comprehensive Income (Loss).
Licensing of Frozen Meals
On September 1, 2016, the agreement with Bellisio Foods to license Atkins’ frozen meals resulting in royalty income became effective. Royalty income is recorded in net sales for the successor
fifty-three week
period ended
August 31, 2019
, the successor
fifty-two week
period ended
August 25, 2018
, the successor period from July 7, 2017 through August 26, 2017 and for the predecessor period from August 28, 2016 through July 6, 2017.
55
2
.
Change in Accounting Principle
During the fourth quarter ended August 31, 2019, the Company changed its accounting principle related to the presentation of third party delivery costs associated with shipping and handling activities previously included as operating expenses in Distribution in the Consolidated Statements of Operations and Comprehensive Income (Loss). The Company is now presenting these expenses within cost of goods sold in the Consolidated Statements of Operations and Comprehensive Income (Loss). In connection with the change in accounting principle, the Company also changed its definition of shipping and handling costs to include costs paid to third-party warehouse operators associated with delivering product to a customer, previously included in General and administrative and Depreciation and amortization of the assets at the third-party warehouse, previously included in Depreciation and amortization. Under the previous definition of shipping and handling costs, the Company only included third-party delivery costs in Distribution.
The Company believes that this change is preferable as outbound freight and distribution center expenses represent direct costs associated with the sale of our products, it better aligns these costs with the related revenue in the gross profit calculation and it improves comparability with the Company’s peers. The accounting policy change was applied retrospectively to all periods presented and the Consolidated Statements of Operations and Comprehensive Income (Loss) reflect the effect of this accounting principle change for all periods presented. This reclassification had no effect on income from operations, net income (loss) or earnings per share. The Consolidated Balance Sheets, Consolidated Statements of Stockholders’ Equity (Deficit), and the Consolidated Statements of Cash Flows are not affected by this change in accounting principle. The effect of the adjustment is as follows:
|
Fifty-Three Weeks Ended August 31, 2019
|
Under Previous Method
|
Change in Accounting Principle and Presentation
|
Other Operating Expense
(1)
|
As Reported
|
||||||||
|
Cost of goods sold
|
273,682
|
|
32,296
|
|
—
|
|
305,978
|
|
||||
|
Distribution
|
23,387
|
|
(23,387
|
)
|
—
|
|
—
|
|
||||
|
General and administrative
|
70,712
|
|
(8,761
|
)
|
21
|
|
61,972
|
|
||||
|
Depreciation and amortization
|
7,644
|
|
(148
|
)
|
—
|
|
7,496
|
|
||||
|
Fifty-Two Weeks Ended August 25, 2018
|
As Reported
|
Change in Accounting Principle and Presentation
|
Other Operating Expense
(1)
|
As Adjusted
|
||||||||
|
Cost of goods sold
|
223,873
|
|
27,190
|
|
—
|
|
251,063
|
|
||||
|
Distribution
|
19,685
|
|
(19,685
|
)
|
—
|
|
—
|
|
||||
|
General and administrative
|
56,333
|
|
(7,331
|
)
|
633
|
|
49,635
|
|
||||
|
Depreciation and amortization
|
7,672
|
|
(174
|
)
|
—
|
|
7,498
|
|
||||
|
From July 7, 2017 through August 26, 2017
|
As Reported
|
Change in Accounting Principle and Presentation
|
Other Operating Expense
(1)
|
As Adjusted
|
||||||||
|
Cost of goods sold
|
35,941
|
|
3,643
|
|
—
|
|
39,584
|
|
||||
|
Distribution
|
2,784
|
|
(2,784
|
)
|
—
|
|
—
|
|
||||
|
General and administrative
|
7,813
|
|
(844
|
)
|
—
|
|
6,969
|
|
||||
|
Depreciation and amortization
|
1,000
|
|
(15
|
)
|
—
|
|
985
|
|
||||
|
From August 28, 2016 through July 6, 2017
|
As Reported
|
Change in Accounting Principle and Presentation
|
Other Operating Expense
(1)
|
As Adjusted
|
||||||||
|
Cost of goods sold
|
179,998
|
|
20,028
|
|
—
|
|
200,026
|
|
||||
|
Distribution
|
14,970
|
|
(14,970
|
)
|
—
|
|
—
|
|
||||
|
General and administrative
|
39,276
|
|
(4,850
|
)
|
141
|
|
34,567
|
|
||||
|
Depreciation and amortization
|
8,617
|
|
(208
|
)
|
—
|
|
8,409
|
|
||||
|
(1
|
)
|
Other operating expense has been combined with
General and administrative
expense on the Consolidated Statements of Operations and Comprehensive Income (Loss).
|
|
3
.
Summary of Significant Accounting Policies
Use of Estimates
The preparation of consolidated financial statements in conformity with GAAP requires management to make estimates and assumptions that affect the reported amounts of assets and liabilities and disclosure of contingent assets and liabilities at the date of the consolidated financial statements. Estimates also affect the reported amounts of revenue and expenses during the reporting period. Actual results could differ from those estimates.
56
Cash and Cash Equivalents
Cash and cash equivalents
consist of cash on hand, deposits available on demand and other short-term, highly liquid investments with original maturities of three months or less. Cash equivalents are carried at cost, which approximates fair value.
Accounts Receivable, Net
Accounts receivable, net
consists primarily of trade receivables, net of allowances for doubtful accounts, returns and trade promotions. Our products are sold for cash or on credit terms. Our credit terms, which are established in accordance with local and industry practices, typically require payment within 30 days of delivery and may allow discounts for early payment. The Company estimates an allowance for doubtful accounts based upon a review of outstanding receivables, historical collection information and our analysis of customer data. Accounts receivable are written off when determined to be uncollectible. At
August 31, 2019
and
August 25, 2018
, the allowance for doubtful accounts was
$0.6 million
and
$0.7 million
, respectively.
Inventories
Inventories
are valued at the lower of cost or net realizable value on a first-in, first-out basis, adjusted for the value of inventory that is determined to be excess, obsolete, expired or unsaleable. Obsolete inventory is reserved at
50%
for inventory four to six months from expiration, and
100%
for items within three months of expiration. Reserves are also taken for certain products or packaging materials when it is determined their cost may not be recoverable. At
August 31, 2019
and
August 25, 2018
, the provision for obsolete inventory was
$0.4 million
and
$0.5 million
, respectively.
Property and Equipment, Net
Property and equipment, net
is stated at the allocated fair value. Additions to property and equipment are recorded at cost and depreciated straight-line over their estimated useful lives. The general ranges of estimated useful lives are:
|
Furniture and fixtures
|
7 years
|
|||
|
Computer equipment, software and website development costs
|
3
|
-
|
5 years
|
|
|
Machinery and equipment
|
7 years
|
|||
|
Office equipment
|
3
|
-
|
5 years
|
|
Leasehold improvements are amortized over the shorter of the remaining term of the lease or the useful life of the improvement utilizing the straight-line method.
The Company performs impairment tests when circumstances indicate that the carrying value of the asset may not be recoverable. There were
no
indicators of impairment in the fiscal period ending
August 31, 2019
, the fiscal period ending
August 25, 2018
,
the successor period from July 7, 2017 through August 26, 2017
, and
the predecessor period from August 28, 2016 through July 6, 2017
.
Goodwill and Intangible Assets
Goodwill
and
Intangible assets
result primarily from the Business Combination and acquisitions.
Intangible assets
primarily include brands and trademarks with indefinite lives and customer-related relationships with finite lives. Upon acquisition, the purchase price is first allocated to identifiable assets and liabilities, including customer-related intangible assets and trademarks, with any remaining purchase price recorded as
Goodwill
.
Goodwill and indefinite-lived intangible assets are not amortized, but are tested for impairment on an annual basis, or more frequently if indicators of impairment are present. Our annual impairment tests are conducted at the beginning of the fourth fiscal quarter. Goodwill and indefinite-lived intangible assets are assessed using either a qualitative or a quantitative approach. The qualitative assessment evaluates factors including macro-economic conditions, industry and company-specific factors, legal and regulatory environments, and historical company performance in assessing fair value. If we determine that it is more likely than not that the fair value of the reporting unit is less than its carrying value, a quantitative test is then performed. Otherwise, no further testing is required. When using a quantitative approach, we compare the fair value of the reporting unit to its carrying amount, including goodwill. If the estimated fair value of the reporting unit is less than the carrying amount of the reporting unit, impairment is indicated, requiring recognition of an impairment charge for the differential.
During fiscal 2019, we elected to perform quantitative assessments of goodwill and indefinite-lived intangible assets. Based on the results of the assessments, it was determined that the fair value of goodwill and indefinite-lived intangible assets exceeded their carrying values. Accordingly, no further impairment testing was completed and no impairment charges related to goodwill or indefinite-lived intangibles were recognized during the fiscal period ended
August 31, 2019
.
57
Qualitative assessments of goodwill and indefinite-lived intangible assets were performed in
2018
and
2017
. Based on the results of assessment, it was determined that it is more likely than not the reporting unit, brands and trademarks had a fair value in excess of carrying value. Accordingly, no further impairment testing was completed and no impairment charges related to goodwill or indefinite-lived intangibles were recognized during the fiscal periods ended
August 25, 2018
or
August 26, 2017
.
Finite-lived intangible assets are amortized on a straight-line basis over their estimated useful lives. The Company reviews for impairment indicators of finite-lived intangibles and other long-lived assets as described in the “Property and Equipment” significant accounting policy.
Deferred Financing Costs and Debt Discounts
Costs incurred in obtaining long-term financing paid to parties other than creditors are considered a debt discount and are amortized over the terms of the long-term financing agreements using the effective-interest method. Amounts paid to creditors are recorded as a reduction in the proceeds received by the creditor and are considered a discount on the issuance of debt.
Income Taxes
Income taxes include federal, state and foreign taxes currently payable and deferred taxes arising from temporary differences between income for financial reporting and income tax purposes. Deferred tax assets and liabilities are determined based on the differences between the financial statement balances and the tax bases of assets and liabilities using enacted tax rates in effect for the year in which the differences are expected to reverse. The effect on deferred tax assets and liabilities of a change in tax rates is recognized in income in the fiscal year that includes the enactment date. Valuation allowances are established when necessary to reduce deferred tax assets to amounts expected to be realized.
Foreign Currency Translation
For all foreign operations, the functional currency is the local currency. Assets and liabilities of these operations are translated into U.S. dollars using the exchange rate in effect at the end of each reporting period. Income statement accounts are translated at the average exchange rate prevailing during each reporting period. Translation adjustments are recorded as a component of
Other comprehensive income (loss)
. Gains or losses resulting from transactions in foreign currencies are included in
Other income (expense)
.
Advertising Costs
Production costs related to television commercials are expensed when first aired. All other advertising costs are expensed when incurred through
Selling and marketing
. Total advertising costs were
$35.4 million
for the
fifty-three week period ended August 31, 2019
,
$34.0 million
for the
fifty-two week period ended August 25, 2018
,
$3.8 million
for
the successor period from July 7, 2017 through August 26, 2017
, and
$26.6 million
for
the predecessor period from August 28, 2016 through July 6, 2017
.
Production costs related to television commercials not yet aired are included in
Prepaid expenses
in the accompanying Consolidated Balance Sheets. There were
no
productions costs related to television commercials not yet aired at
August 31, 2019
or
August 25, 2018
.
Research and Development Activities
The Company’s research and development activities primarily consist of generating and testing new product concepts, new flavors and packaging. The Company expenses research and development costs as incurred related to compensation, facility costs, consulting and supplies. Research and development activities are primarily internal and associated costs are included in
General and administrative
. The Company’s total research and development expenses were
$2.2 million
for the
fifty-three week period ended August 31, 2019
,
$2.5 million
for the
fifty-two week period ended August 25, 2018
,
$0.4 million
for the successor period from July 7, 2017 through August 26, 2017, and
$1.9 million
for the predecessor period from August 28, 2016 through July 6, 2017.
Share-Based Compensation
The Company uses share-based compensation, including stock options and restricted stock units, to provide long-term performance incentives for its employees and directors. Share-based compensation is recognized on a straight-line basis over the requisite service period of the award based on their grant-date fair value. Forfeitures are recognized as they occur. Share based compensation expense is included within the same financial statement caption where the recipient’s other compensation is reported.
58
Defined Contribution Plan
The Company sponsors defined contribution plans to provide retirement benefits to its employees. The Company's 401(k) plan and similar plans for non-domestic employees are based on a portion of eligible pay up to a defined maximum. All matching contributions are made in cash. Expense associated with defined contribution plans was
$0.6 million
for the
fifty-three week period ended August 31, 2019
,
$0.4 million
for the
fifty-two week period ended August 25, 2018
,
$0.0 million
for
the successor period from July 7, 2017 through August 26, 2017
, and
$0.3 million
for
the predecessor period from August 28, 2016 through July 6, 2017
.
Cost of Goods Sold
Costs of goods sold represent costs directly related to the manufacture and distribution of our products. Such costs include raw materials, co-manufacturing costs, packaging, shipping and handling, third-party distribution and depreciation of distribution center equipment and leasehold improvements.
Shipping and Handling Costs
Shipping and handling costs include costs paid to third-party warehouse operators associated with delivering product to customers, and depreciation and amortization of assets at the third-party warehouse. Shipping and handling costs are recognized in
Cost of goods sold
. Costs of
$32.3 million
for the
fifty-three week period ended August 31, 2019
,
$27.2 million
for the
fifty-two week period ended August 25, 2018
,
$3.6 million
for
the successor period from July 7, 2017 through August 26, 2017
, and
$20.0 million
for
the predecessor period from August 28, 2016 through July 6, 2017
were recorded relating to products shipped to customers.
Recently Issued and Adopted Accounting Pronouncements
Recently Issued Accounting Pronouncements Not Yet Adopted
In February 2016, the FASB issued ASU No. 2016-02,
Leases (Topic 842)
. The standard requires lessees to recognize the assets and liabilities that arise from leases on the balance sheet. A lessee should recognize in the statement of financial position a liability to make lease payments (the lease liability) and a right-of-use asset representing its right to use the underlying asset for the lease term. In July 2018, the FASB issued ASU 2018-11,
Leases (Topic 842): Targeted Improvements
. ASU 2018-11 provides entities another option for transition, allowing entities to not apply the new standard in the comparative periods they present in their financial statements in the year of adoption. The amendments provide the option for the ASU to be applied at the beginning of the period adopted using a modified retrospective approach with earlier application permitted as of the beginning of an interim or annual reporting period. The new guidance is effective for the Company beginning in fiscal 2020. The Company has completed the initial review of its material lease contracts and has been collecting the required information from lease contracts for adoption. The adoption of this ASU will result in a material increase to lease-related assets and liabilities on the Company's Consolidated Balance Sheets. The Company is currently assessing the impact that this standard will have on its accounting policies, processes, system requirements, internal controls, and disclosures. The Company does not anticipate that the adoption of this ASU will have a significant effect on the Company’s Consolidated Statements of Operations or Cash Flows.
In June 2016, the FASB issued ASU No. 2016-13,
Financial Instruments—Credit Losses (Topic 326)
, which modifies disclosure requirements for fair value measurements by removing, modifying or adding certain disclosures. This ASU is effective for annual periods beginning after December 15, 2020, with early adoption permitted. The amendments of this ASU should be applied on a retrospective basis to all periods presented. The Company is currently evaluating the effects adoption of this guidance will have on the consolidated financial statements.
In August 2018, the FASB issued ASU No. 2018-13,
Fair Value Measurement (Topic 820)
, which modifies disclosure requirements on fair value measurements of ASC 820. This ASU is effective for all entities for fiscal years beginning after December 15, 2019, including interim periods therein. Early adoption is permitted including in any interim period for which financial statements have not yet been issued. Entities are permitted to early adopt the eliminated or modified disclosure requirements and delay the adoption new disclosure requirements until their effective date. The Company does not anticipate adoption of this ASU to be material to its consolidated financial statements.
In August 2018, the FASB issued ASU No. 2018-15,
Intangibles-Goodwill and Other-Internal-Use Software (Subtopic 350-40), Customer's Accounting for Implementation Costs Incurred in a Cloud Computing Arrangement that is a Service Contract
, which aligns the requirements for capitalizing implementation costs incurred in a hosting arrangement that is a service contract with the requirements for capitalizing implementation costs incurred to develop or obtain internal-use software. The ASU is effective for fiscal years ending after December 15, 2019 with early adoption permitted. The Company is currently evaluating the effects adoption of this guidance will have on the consolidated financial statements.
59
Recently Adopted Accounting Pronouncements
In May 2014, the Financial Accounting Standards Board (the “FASB”) issued Accounting Standards Update (“ASU”) No. 2014-09,
Revenue from Contracts with Customers
(ASC Topic 606). The objective of ASU No. 2014-09 is to outline a new, single comprehensive model to use in accounting for revenue arising from contracts with customers. The new revenue recognition model provides a five-step analysis for determining when and how revenue is recognized, depicting the transfer of promised goods or services to customers in an amount that reflects the consideration expected to be received in exchange for those goods or services. The Company adopted the requirements of ASC Topic 606 and all related requirements using the modified retrospective method in the first quarter of fiscal 2019. Upon completing our assessment of ASC Topic 606, we concluded that no adjustments were required to the opening balance of retained earnings at the date of adoption and the comparative information has not been restated. The adoption of this ASU did not have a material effect on the Company’s consolidated financial statements. Disclosures required by ASC Topic 606 are presented within
Note 4
, Revenue Recognition.
In January 2016, the FASB issued ASU No. 2016-01,
Financial Instruments—Overall (Subtopic 825-10)
. This new standard enhances the reporting model for financial instruments regarding certain aspects of recognition, measurement, presentation, and disclosure. This ASU is to be applied using a cumulative-effect adjustment to the balance sheet as of the beginning of the fiscal year of adoption. The Company adopted this ASU in the first quarter of fiscal 2019. The adoption of this ASU did not have a material effect on the Company’s consolidated financial statements.
In
August 2016, the FASB issued ASU No. 2016-15,
Statement of Cash Flows (Topic 230): Classification of Certain Cash Receipts and Cash Payments.
The new guidance is intended to eliminate diversity in practice in how certain cash receipts and cash payments are presented and classified in the statement of cash flows. The guidance requires application using a retrospective transition method. The Company adopted this ASU in the first quarter of fiscal 2019. The adoption of this ASU did not have a material effect on the Company’s consolidated financial statements.
In January 2017, the FASB issued ASU No. 2017-04,
Intangibles—Goodwill and other (Topic 350): Simplifying the Test for Goodwill Impairment
. The standard simplifies how an entity tests goodwill by eliminating Step 2 of the goodwill impairment test. The amended standard also modifies the concept of impairment from the condition that exists when the carrying amount of goodwill exceeds its implied fair value to the condition that exists when the carrying amount of a reporting unit exceeds its fair value. The new guidance is effective for the Company beginning in fiscal 2020. The Company adopted this ASU in fiscal 2019. The adoption of this ASU did not have a material effect on the Company’s consolidated financial statements.
In January 2017, the FASB issued ASU No. 2017-01,
Business Combinations (Topic 805)
, to assist entities with evaluating whether transactions should be accounted for as acquisitions (or disposals) of assets or businesses. The provisions of this ASU provide a more robust framework to use in determining when a set of assets and activities is a business by clarifying the requirements related to inputs, processes, and outputs. The Company adopted this ASU in the first quarter of fiscal 2019. The adoption of this ASU did not have a material effect on the Company’s consolidated financial statements.
In May 2017, the FASB issued ASU No. 2017-09,
Compensation—Stock Compensation (Topic 718): Scope of Modification Accounting.
The amended standard specifies the modification accounting applicable to any entity which changes the terms or conditions of a stock-based payment award. The Company adopted this ASU in the first quarter of fiscal 2019. The adoption of this ASU did not have a material effect on the Company’s consolidated financial statements.
4
.
Revenue Recognition
A performance obligation is a promise in a contract to transfer a distinct good or service to the customer. A contract’s transaction price is allocated to each distinct performance obligation and recognized as revenue when, or as, the performance obligation is satisfied. The singular performance obligation of our customer contracts is determined by each individual purchase order and the products ordered, with revenue being recognized at a point-in-time when the obligation under the terms of the agreement is satisfied and product control is transferred to the customer. Specifically, control transfers to our customers when the product is delivered to or picked up by our customers based on applicable shipping terms. The performance obligations of our customer contracts are generally satisfied within 30 days.
Revenue is measured as the amount of consideration we expect to receive in exchange for fulfilled product orders, including estimates of variable consideration. The most common forms of variable consideration include trade programs, consumer incentives, coupon redemptions, allowances for unsaleable products, and any additional amounts where a distinct good or service cannot be identified or the value cannot be reasonably estimated. Estimates of variable consideration are made using various information including historical data on performance of similar trade promotional activities, market data from IRI, and the Company’s best estimate of current activity. We review these estimates regularly and make revisions as necessary. Revisions can include changes for consideration paid to customers that lack sufficient evidence to support a distinct good or service assertion, or for which a reasonably estimable fair value cannot be determined, primarily related to our assessments of cooperative advertising programs. Uncertainties related to the estimate of variable consideration are resolved in a short time frame and do not require any additional constraint on variable consideration. Adjustments to variable consideration are recognized in the
60
period the adjustments are identified and have historically been insignificant. Revenue is recognized net of any taxes collected from customers and subsequently remitted to governmental authorities.
We provide standard assurance type warranties that our products will comply with all agreed-upon specifications. No services beyond an assurance type warranty are provided to our customers. While customers generally have a right to return defective or non-conforming products, past experience has demonstrated that product returns have been immaterial. Customer remedies for defective or non-conforming products may include a refund or exchange. As a result, the right of return is estimated and recorded as a reduction in revenue, at the time of sale.
Our customer contracts identify product quantity, price and payment terms. Payment terms are granted consistent with industry standards. Although some payment terms may be more extended, the majority of our payment terms are less than 60 days. The Company does not have any payment terms that extend beyond one year. As a result, we do not adjust our revenue for the effects of a significant financing component. Amounts billed and due from our customers are classified as
Accounts receivable, net
on the Consolidated Balance Sheets.
The Company utilizes third-party contract manufacturers for the manufacture of our products. We have evaluated whether the Company is the principal or agent in these relationships. We have determined that the Company is the principal in all cases, as it maintains the responsibility for fulfillment, risk of loss and establishes the price.
We recognize a minor amount of royalty income for the license of Atkins’ frozen meals. Royalty income represents less than 1% of the Company’s net sales. Royalty revenue is recognized over time as sales of licensed products occur.
The Company has elected the following practical expedients in accordance with ASC Topic 606:
|
•
|
Shipping and handling costs
—We have elected to account for shipping and handling costs incurred to deliver products to customers as fulfillment activities, rather than a promised service. As such, fulfillment costs are included in
Cost of goods sold
in our Consolidated Statements of Operations and Comprehensive Income (Loss).
|
|
•
|
Costs of obtaining a contract
—We have elected to expense costs of obtaining a contract because the amortization period would be less than one year.
|
Revenue from transactions with external customers for each of Atkins’ products would be impracticable to disclose and management does not view its business by product line. For revenue disaggregated by geographic area see
Note 16
,
Segment and Customer Information
.
5
.
Property and Equipment, Net
Property and equipment, net
, as presented with the Consolidated Balance Sheets, are summarized as follows:
|
|
August 31, 2019
|
August 25, 2018
|
||||||
|
(In thousands)
|
(Successor)
|
(Successor)
|
||||||
|
Furniture and fixtures
|
$
|
715
|
|
$
|
638
|
|
||
|
Computer equipment and software
|
956
|
|
305
|
|
||||
|
Machinery and equipment
|
385
|
|
233
|
|
||||
|
Website development costs
|
2,237
|
|
1,746
|
|
||||
|
Leasehold improvements
|
361
|
|
337
|
|
||||
|
Construction in progress
|
139
|
|
507
|
|
||||
|
Property and equipment, gross
|
4,793
|
|
3,766
|
|
||||
|
Less: accumulated depreciation
|
(2,337
|
)
|
(1,201
|
)
|
||||
|
Property and equipment, net
|
$
|
2,456
|
|
$
|
2,565
|
|
||
Total depreciation expense was
$1.1 million
for the
fifty-two week
period ended
August 31, 2019
,
$1.2 million
for the
fifty-two week
period ended
August 25, 2018
,
$0.1 million
for
the successor period from July 7, 2017 through August 26, 2017
, and
$1.0 million
for
the predecessor period from August 28, 2016 through July 6, 2017
.
General and administrative
includes a
$0.1 million
loss on disposal of property and equipment in the
fifty-two week
period ended
August 25, 2018
.
61
6
.
Goodwill and Intangibles
The following table presents the changes in
Goodwill
:
|
(In thousands)
|
Total
|
|||
|
Balance as of August 26, 2017
|
$
|
465,030
|
|
|
|
Goodwill working capital adjustment
|
1,757
|
|
||
|
Measurement period adjustment of the Business Combination
|
4,640
|
|
||
|
Balance as of August 25, 2018
|
$
|
471,427
|
|
|
There were
no
changes in the Company's goodwill in the
fifty-three week period ended August 31, 2019
. There were
no
impairment charges related to goodwill in the period ended
August 31, 2019
or since the inception of the Company.
Intangible assets, net
in our consolidated balance sheets consist of the following:
|
August 31, 2019
|
||||||||||||||
|
(In thousands)
|
Useful life
|
Gross carrying amount
|
Accumulated amortization
|
Net carrying amount
|
||||||||||
|
Intangible assets with indefinite life:
|
||||||||||||||
|
Brands and trademarks
|
Indefinite life
|
$
|
232,000
|
|
$
|
—
|
|
$
|
232,000
|
|
||||
|
Intangible assets with finite lives:
|
||||||||||||||
|
Customer relationships
|
15 years
|
59,000
|
|
8,382
|
|
50,618
|
|
|||||||
|
Proprietary recipes and formulas
|
7 years
|
7,000
|
|
2,131
|
|
4,869
|
|
|||||||
|
Licensing agreements
|
14 years
|
22,000
|
|
3,348
|
|
18,652
|
|
|||||||
|
$
|
320,000
|
|
$
|
13,861
|
|
$
|
306,139
|
|
||||||
|
August 25, 2018
|
||||||||||||||
|
(In thousands)
|
Useful life
|
Gross carrying amount
|
Accumulated amortization
|
Net carrying amount
|
||||||||||
|
Intangible assets with indefinite life:
|
||||||||||||||
|
Brands and trademarks
|
Indefinite life
|
$
|
232,000
|
|
$
|
—
|
|
$
|
232,000
|
|
||||
|
Intangible assets with finite lives:
|
||||||||||||||
|
Customer relationships
|
15 years
|
59,000
|
|
4,448
|
|
54,552
|
|
|||||||
|
Proprietary recipes and formulas
|
7 years
|
7,000
|
|
1,131
|
|
5,869
|
|
|||||||
|
Licensing agreements
|
14 years
|
22,000
|
|
1,778
|
|
20,222
|
|
|||||||
|
$
|
320,000
|
|
$
|
7,357
|
|
$
|
312,643
|
|
||||||
Intangible assets, net
changed due to amortization expense. Amortization expense related to intangible assets was
$6.5 million
for the
fifty-three week
period ended
August 31, 2019
,
$6.5 million
for the
fifty-two week
period ended
August 25, 2018
,
$0.9 million
for
the successor period from July 7, 2017 through August 26, 2017
, and
$8.5 million
for
the predecessor period from August 28, 2016 through July 6, 2017
.
Estimated future amortization for each of the next five fiscal years and thereafter is as follows:
|
(In thousands)
|
||||
|
2020
|
$
|
6,505
|
|
|
|
2021
|
6,505
|
|
||
|
2022
|
6,505
|
|
||
|
2023
|
6,505
|
|
||
|
2024
|
6,505
|
|
||
|
Thereafter
|
41,614
|
|
||
|
Total
|
$
|
74,139
|
|
|
62
7
.
Accrued Expenses and Other Current Liabilities
Accrued expenses and other current liabilities were comprised of the following:
|
August 31, 2019
|
August 25, 2018
|
|||||||
|
(In thousands)
|
(Successor)
|
(Successor)
|
||||||
|
Professional fees
|
$
|
8,903
|
|
$
|
1,473
|
|
||
|
Accrued advertising allowances and claims
|
2,095
|
|
1,525
|
|
||||
|
Accrued bonus
|
10,908
|
|
6,726
|
|
||||
|
Freight accrual
|
1,791
|
|
1,318
|
|
||||
|
Payroll-related accruals
|
841
|
|
1,004
|
|
||||
|
Commissions
|
932
|
|
977
|
|
||||
|
Income taxes payable
|
382
|
|
386
|
|
||||
|
VAT payable
|
1,787
|
|
1,481
|
|
||||
|
Other
|
2,294
|
|
985
|
|
||||
|
Accrued expenses and other current liabilities
|
$
|
29,933
|
|
$
|
15,875
|
|
||
8
.
Long-Term Debt and Line of Credit
On July 7, 2017, the Company entered into a credit agreement with Barclays Bank PLC and other parties. The credit agreement provides for a term facility of
$200.0 million
(“Term Facility”) with a
seven
year maturity and a revolving credit facility of up to
$75.0 million
(the “Revolving Credit Facility”) with a
five
year maturity, under the first lien senior secured loan facilities (the “First Lien”). Substantially concurrent with the consummation of the Business Combination, the full
$200.0 million
of the First Lien term loan (the “Term Loan”) was drawn.
No
amounts were drawn on the Revolving Credit Facility. The interest rate per annum is based on either (i) a base rate equaling the higher of (a) the “prime rate”, (b) the federal funds effective rate plus
0.50%
and (c) the Euro-currency rate applicable for an interest period of one month plus
1.00%
plus (x)
3.00%
margin for Term Loan or (y)
2.00%
margin for Revolving Credit Facility, or (ii) London Interbank Offered Rate (“LIBOR”) adjusted for statutory reserve requirements, plus (x)
4.00%
margin for the Term Loan subject to a floor of
1.00%
or (y)
3.00%
margin for the Revolving Credit Facility. As security for the payment or performance of its debt, the Company has pledged certain equity interests in its subsidiaries.
On March 16, 2018 (the “Amendment Date”), the Company entered into an amendment (the “Repricing Amendment”) to the First Lien. As a result of the Repricing Amendment, the interest rate on the Term Loan was reduced and, as of the Amendment Date, such loans bear interest at a rate equal to, at the Company's option, either LIBOR plus an applicable margin of
3.50%
or a base rate plus an applicable margin of
2.50%
. The Repricing Amendment did not change the interest rate on the Revolving Credit Facility. The Revolving Credit Facility will continue to bear interest based upon the Company's consolidated First Lien net leverage ratio as of the last financial statements delivered to the administrative agent. No additional debt was incurred, or any proceeds received, by the Company in connection with the Repricing Amendment. The incremental fees paid to the administrative agent are reflected as additional debt discount and are amortized over the terms of the long-term financing agreements using the effective-interest method.
The credit facilities governing our debt contain certain financial and other covenants that limit our ability to, among other things, incur and/or undertake asset sales and other dispositions, liens, indebtedness, certain acquisitions and investments, consolidations, mergers, reorganizations and other fundamental changes, payment of dividends and other distributions to equity and warrant holders, and prepayments of material subordinated debt, in each case, subject to customary exceptions materially consistent with credit facilities of such type and size. The Revolving Credit Facility has a maximum total net leverage ratio equal to or less than
6.25
:1.00 (with a reduction to
6.00
:1.00 on the third anniversary of the closing date of the credit facilities) contingent on credit extensions in excess of
30%
of the total amount of commitments available under the Revolving Credit Facility. Any failure to comply with the restrictions of the credit facilities may result in an event of default. The Company was in compliance with all financial covenants as of
August 31, 2019
and
August 25, 2018
, respectively.
63
At
August 31, 2019
and
August 25, 2018
, there were
no
amounts drawn against the Revolving Credit Facility. Long-term debt consists of the following:
|
August 31, 2019
|
August 25, 2018
|
|||||||
|
(In thousands)
|
(Successor)
|
(Successor)
|
||||||
|
Term Loan
|
$
|
196,500
|
|
$
|
198,500
|
|
||
|
Less: Deferred financing fees
|
5,565
|
|
6,917
|
|
||||
|
Total debt
|
190,935
|
|
191,583
|
|
||||
|
Less: Current maturities, net of deferred financing fees of $1.3 million at August 31, 2019 and $1.4 million at August 25, 2018, respectively
|
676
|
|
648
|
|
||||
|
Long-term debt, net of deferred financing fees
|
$
|
190,259
|
|
$
|
190,935
|
|
||
Aggregate principal maturities of debt are as follows:
|
(In thousands)
|
|||
|
Fiscal year ending:
|
|||
|
2020
|
$
|
2,000
|
|
|
2021
|
2,000
|
|
|
|
2022
|
2,000
|
|
|
|
2023
|
2,000
|
|
|
|
2024
|
188,500
|
|
|
|
Thereafter
|
—
|
|
|
|
Total debt
|
$
|
196,500
|
|
The Company utilizes market approaches to estimate the fair value of certain outstanding borrowings by discounting anticipated future cash flows derived from the contractual terms of the obligations and observable market interest and foreign exchange rates. The Company carries debt at historical cost and discloses fair value. As of
August 31, 2019
and
August 25, 2018
, the book value of the Company’s debt approximated fair value. All term debt is valued based on observable inputs and classified as Level 2 in the fair value hierarchy.
9
.
Fair Value of Financial Instruments
Fair value is defined as the price that would be received to sell an asset or paid to transfer a liability in an orderly transaction between market participants at the measurement date. To increase the comparability of fair value measurements, a three-tier fair value hierarchy, which prioritizes the inputs used in the valuation methodologies, is as follows:
Level 1 – Valuations based on quoted prices for identical assets and liabilities in active markets.
Level 2 – Valuations based on observable inputs other than quoted prices included in Level 1, such as quoted prices for similar assets or liabilities in active markets, quoted prices for identical or similar assets and liabilities in markets that are not active, or other inputs that are observable or can be corroborated by observable market data.
Level 3 – Valuations based on unobservable inputs reflecting the Company’s own assumptions, consistent with reasonably available assumptions made by other market participants. These valuations require significant judgment.
The Company paid in full the Income Tax Receivable Agreement (the “TRA”) during the successor
fifty-three week
period ended
August 31, 2019
. As a result, the Company did not have any liabilities measured at fair value as of
August 31, 2019
.
The Company's liabilities measured at fair value as of
August 25, 2018
are summarized as follows:
|
Successor
|
Level 1
|
Level 2
|
Level 3
|
Total
|
||||||||||||
|
Liabilities
|
||||||||||||||||
|
TRA liability
|
$
|
—
|
|
$
|
—
|
|
$
|
27,468
|
|
$
|
27,468
|
|
||||
A loss of
$0.5 million
was charged to the
Loss (gain) in fair value change of contingent consideration - TRA liability
for the successor
fifty-three week
period ended
August 31, 2019
. For the successor
fifty-two week
period ended
August 25, 2018
, a benefit of
$2.8 million
was recognized in
Loss (gain) in fair value change of contingent consideration - TRA liability
. The gain is primarily due to the change in the federal tax rates.
64
The settlement of the TRA liability during the
fifty-three week
period ended
August 31, 2019
resulted in a gain of
$1.5 million
recognized in
Gain on settlement of TRA liability
. The settlement of the TRA liability is discussed in Note
10
,
Income Taxes
.
For the predecessor entity,
Changes in warrant liabilities
included other income of
$0.7 million
for
the predecessor period from August 28, 2016 through July 6, 2017
. The Company settled warrant liabilities of
$15.0 million
upon the Business Combination.
The carrying amounts of cash and cash equivalents, accounts receivable and accounts payable approximated fair value as of
August 31, 2019
and
August 25, 2018
due to the relatively short maturity of these instruments.
The predecessor entity historically carried warrant liabilities on the balance sheet at fair value. These warrant liabilities were settled with the change of control. The successor entity assumed the equity warrants of Conyers Park. The fair value of the warrants were calculated by estimating future cash payments to be made to the former owner, in part based on the probability-weighted present value of various payout scenarios. Key fair value inputs included the discount rate, expected future cash flows under various payout scenarios and a probability analysis of the payout scenarios. The methodology for measuring fair value is sensitive to the volatility of key inputs mentioned above. For additional information, see Note
12
,
Stockholders' Equity
.
10
.
Income Taxes
The sources of income (loss) before income taxes are as follows:
|
53-Weeks Ended
|
52-Weeks Ended
|
From July 7, 2017
through August 26, 2017 |
From August 28, 2016 through July 6, 2017
|
||||||||||||||
|
August 31, 2019
|
August 25, 2018
|
||||||||||||||||
|
(In thousands)
|
(Successor)
|
(Successor)
|
(Successor)
|
(Predecessor)
|
|||||||||||||
|
Domestic
|
$
|
64,244
|
|
$
|
49,748
|
|
$
|
78
|
|
$
|
(690
|
)
|
|||||
|
Foreign
|
42
|
|
3,343
|
|
662
|
|
2,775
|
|
|||||||||
|
Total
|
$
|
64,286
|
|
$
|
53,091
|
|
$
|
740
|
|
$
|
2,085
|
|
|||||
Income tax (benefit) expense was comprised of the following:
|
53-Weeks Ended
|
52-Weeks Ended
|
From July 7, 2017
through August 26, 2017 |
From August 28, 2016 through July 6, 2017
|
||||||||||||||
|
August 31, 2019
|
August 25, 2018
|
||||||||||||||||
|
(In thousands)
|
(Successor)
|
(Successor)
|
(Successor)
|
(Predecessor)
|
|||||||||||||
|
Current:
|
|||||||||||||||||
|
Federal
|
$
|
2,784
|
|
$
|
2,584
|
|
$
|
414
|
|
$
|
7,340
|
|
|||||
|
State and local
|
2,684
|
|
159
|
|
11
|
|
415
|
|
|||||||||
|
Foreign
|
374
|
|
1,001
|
|
247
|
|
695
|
|
|||||||||
|
Total current expense
|
5,842
|
|
3,744
|
|
672
|
|
8,450
|
|
|||||||||
|
Deferred:
|
|||||||||||||||||
|
Federal
|
9,976
|
|
(21,223
|
)
|
(379
|
)
|
(4,172
|
)
|
|||||||||
|
State and local
|
1,086
|
|
(26
|
)
|
(3
|
)
|
259
|
|
|||||||||
|
Foreign
|
(154
|
)
|
141
|
|
—
|
|
33
|
|
|||||||||
|
Total deferred income tax (benefit) expense
|
10,908
|
|
(21,108
|
)
|
(382
|
)
|
(3,880
|
)
|
|||||||||
|
Total tax (benefit) expense
|
$
|
16,750
|
|
$
|
(17,364
|
)
|
$
|
290
|
|
$
|
4,570
|
|
|||||
65
A reconciliation of the federal statutory income tax rate to the effective income tax rate is as follows:
|
53-Weeks Ended
|
52-Weeks Ended
|
From July 7, 2017
through August 26, 2017 |
From August 28, 2016 through July 6, 2017
|
||||||||||
|
August 31, 2019
|
August 25, 2018
|
||||||||||||
|
(In thousands)
|
(Successor)
|
(Successor)
|
(Successor)
|
(Predecessor)
|
|||||||||
|
Statutory income tax expense:
|
21.0
|
%
|
25.5
|
%
|
34.0
|
%
|
34.0
|
%
|
|||||
|
State income tax expense, net of federal
|
3.9
|
|
3.1
|
|
1.7
|
|
21.0
|
|
|||||
|
Valuation allowance
|
(0.6
|
)
|
0.6
|
|
5.2
|
|
(0.9
|
)
|
|||||
|
Taxes on foreign income above (below) the U.S. tax
|
0.2
|
|
0.4
|
|
(3.3
|
)
|
(7.5
|
)
|
|||||
|
Warrant liabilities
|
—
|
|
—
|
|
—
|
|
(11.8
|
)
|
|||||
|
Tax Cuts and Jobs Act
|
—
|
|
(58.4
|
)
|
—
|
|
—
|
|
|||||
|
Change in tax rate
|
1.5
|
|
(4.0
|
)
|
—
|
|
(4.2
|
)
|
|||||
|
Non-deductible transaction costs
|
—
|
|
—
|
|
—
|
|
182.7
|
|
|||||
|
TRA contingent consideration
|
(0.4
|
)
|
(1.5
|
)
|
—
|
|
—
|
|
|||||
|
Other permanent items
|
0.5
|
|
1.6
|
|
1.6
|
|
6.0
|
|
|||||
|
Income tax (benefit) expense
|
26.1
|
%
|
(32.7
|
)%
|
39.2
|
%
|
219.3
|
%
|
|||||
The comparability of our operating results of fiscal 2019 compared to the corresponding prior years was effected by the U.S. Tax Cuts and Jobs Act of 2017 (the “Tax Act”), which was enacted on December 22, 2017. The Tax Act introduced significant changes to U.S. income tax law including reducing the U.S. federal statutory tax rate from 35% to
21%
and imposing new taxes on certain foreign-sourced earnings and certain intercompany payments. Due to the timing of the enactment and the complexity involved in applying the provisions of the Tax Act, we made reasonable estimates of the effects and recorded provisional amounts in our financial statements as of fiscal 2018 in accordance with SEC Staff Accounting Bulletin No. 118 (“SAB 118”). During the period ended February 23, 2019, we completed our accounting for the Tax Act with no material adjustment to our provisional estimates recorded.
For the Global Intangible Low-Taxed Income (“GILTI”) provisions of the Tax Act, the Company completed its assessment during the second quarter of 2019 and, effective August 26, 2018, elected an accounting policy to record GILTI as period costs if and when incurred. Additionally, the Company concluded that it is has not met the threshold requirements of the base erosion and anti-abuse tax. Although the measurement period has closed, further technical guidance related to the Tax Act, including final regulations on a broad range of topics, is expected to be issued. In accordance with Accounting Standards Codification (ASC) 740, the Company will recognize any effects of the guidance in the period that such guidance is issued.
66
The tax effects of temporary differences that gave rise to significant portions of the deferred tax assets and liabilities at
August 31, 2019
and
August 25, 2018
were as follows:
|
August 31, 2019
|
August 25, 2018
|
|||||||
|
(In thousands)
|
(Successor)
|
(Successor)
|
||||||
|
Deferred tax assets
|
||||||||
|
Accounts receivable allowances
|
$
|
2,601
|
|
$
|
1,885
|
|
||
|
Inventories writedowns
|
67
|
|
107
|
|
||||
|
Accrued expenses
|
3,680
|
|
1,961
|
|
||||
|
Net operating loss carryforwards
|
4,179
|
|
10,150
|
|
||||
|
Share based compensation
|
1,755
|
|
975
|
|
||||
|
Tax credits
|
351
|
|
10,066
|
|
||||
|
Other
|
2,247
|
|
1,051
|
|
||||
|
Deferred tax assets
|
14,880
|
|
26,195
|
|
||||
|
Valuation allowance
|
(3,786
|
)
|
(4,195
|
)
|
||||
|
Deferred tax asset, net of valuation allowance
|
11,094
|
|
22,000
|
|
||||
|
Deferred tax liabilities:
|
||||||||
|
Prepaid expense
|
(474
|
)
|
(419
|
)
|
||||
|
Excess tax over book depreciation
|
(169
|
)
|
(77
|
)
|
||||
|
Website development costs
|
(226
|
)
|
(238
|
)
|
||||
|
Intangible assets
|
(74,431
|
)
|
(74,342
|
)
|
||||
|
Other
|
(1,177
|
)
|
(1,399
|
)
|
||||
|
Deferred tax liabilities
|
(76,477
|
)
|
(76,475
|
)
|
||||
|
Net deferred tax liabilities
|
$
|
(65,383
|
)
|
$
|
(54,475
|
)
|
||
The Company had available U.S. federal net operating loss carryforwards of
$0.0 million
and
$22.2 million
at
August 31, 2019
and
August 25, 2018
, respectively. The Company also had state net operating loss carryforwards of
$12.2 million
and
$33.6 million
and foreign net operating losses of
$14.2 million
and
$14.7 million
at
August 31, 2019
and
August 25, 2018
, respectively. The federal net operating loss carryforwards will begin to expire in 2034, while state net operating loss carryforwards will begin to expire in 2021.
During the
fifty-three week
period ended
August 31, 2019
, there was a
$0.5 million
decrease to the tax loss carryforwards in foreign jurisdictions. As the carryforwards were generated in jurisdictions where the Company has historically recognized book losses or does not have strong future earnings projections, the Company concluded it is more likely than not that the operating losses would not be realized, and thus maintained a full valuation allowance against the associated deferred tax assets. As of
August 31, 2019
, the Company has recorded total valuation allowances of
$3.8 million
.
As of
August 31, 2019
, the Company has recorded valuation allowances of
$3.4 million
on deferred tax assets related to foreign net operating loss carryforwards. The majority of this amount represents a full valuation allowance on the deferred tax assets of foreign entities within the United Kingdom, Netherlands, and Spain. Of the valuation allowance on deferred tax assets,
$0.4 million
relates to state net operating losses.
It is the Company’s intention to reinvest the earnings of non-U.S. subsidiaries in those operations. As of
August 31, 2019
, the Company has not made a provision for U.S. or additional foreign withholding taxes for any outside basis differences inherent in its investments in foreign subsidiaries that are indefinitely reinvested. It is not practicable to estimate the amount of deferred tax liability related to investments in these foreign subsidiaries.
As of
August 31, 2019
and
August 25, 2018
, the Company has
no
unrecognized tax benefits.
The Company records interest and penalties associated with unrecognized tax benefits as a component of tax expense. As of
August 31, 2019
and
August 25, 2018
, the Company has
no
t accrued interest or penalties on unrecognized tax benefits, as there is no position recorded as of the fiscal years. No changes to the uncertain tax position balance are anticipated within the next 12 months, and are not expected to materially affect the financial statements.
67
As of
August 31, 2019
, tax years 2013 to
2018
remain subject to examination in the United States and the tax years 2013 to
2018
remain subject to examination in other major foreign jurisdictions where Atkins conducts business. State income tax returns are generally subject to examination for a period of three to five years after the filing of the respective return.
Tax Receivable Agreement
Concurrent with the Business Combination, the Company entered into the TRA with the historical stockholders of Atkins. The TRA was valued based on the future expected payments under the terms of the agreement. As more fully described in the TRA, the TRA provides for the payment by Simply Good Foods to the Atkins’ selling equity holders for certain federal, state, local and non-U.S. tax benefits deemed realized in post-closing taxable periods by Simply Good Foods, Conyers Park, Atkins and Atkins’ eligible subsidiaries from the use of up to
$100 million
of the following tax attributes: (i) net operating losses available to be carried forward as of the closing of the Business Combination, (ii) certain deductions generated by the consummation of the business transaction and (iii) remaining depreciable tax basis from the 2003 acquisition of Atkins Nutritionals, Inc.
The Company re-measured the TRA in the second quarter of 2018 due to the Tax Act. The second quarter assessment of these changes resulted in a provisional one-time gain of
$4.7 million
, recognized in
Loss (gain) in fair value change of contingent consideration - TRA liability
.
During the first quarter of 2019, the Company entered into a termination agreement (the “Termination Agreement”) with Atkins Holdings, LLC and Roark Capital Acquisition, LLC. Pursuant to the Termination Agreement, the Company paid
$26.5 million
to settle the TRA in full. Under the Termination Agreement, each of the parties thereto agreed to terminate the TRA and to release any and all obligations and liabilities of the other parties thereunder effective as of the receipt of the termination payment. The Company recorded a
$0.5 million
loss on the fair value change in the TRA liability through the settlement on November 14, 2018 and recognized a gain of
$1.5 million
in connection with the execution of the Termination Agreement and final cash payment.
11
.
Commitments and Contingencies
Leases
The Company has non-cancellable operating leases for
six
buildings. Rent expenses were
$2.2 million
for the
fifty-three week period ended August 31, 2019
,
$2.4 million
for the
fifty-two week period ended August 25, 2018
,
$0.3 million
for
the successor period from July 7, 2017 through August 26, 2017
, and
$1.7 million
for
the predecessor period from August 28, 2016 through July 6, 2017
.
Future minimum payments under lease arrangements with a remaining term in excess of one year were as follows as of
August 31, 2019
:
|
(In thousands)
|
Future Payments
|
|||
|
2020
|
$
|
2,546
|
|
|
|
2021
|
1,947
|
|
||
|
2022
|
1,677
|
|
||
|
2023
|
1,093
|
|
||
|
2024
|
87
|
|
||
|
Thereafter
|
56
|
|
||
|
Total
|
$
|
7,406
|
|
|
Litigation
The Company is a party to certain litigation and claims that are considered normal to the operations of the business. From time to time, we have been and may again become involved in legal proceedings arising in the ordinary course of our business. We are not presently a party to any litigation that we believe to be material and we are not aware of any pending or threatened litigation against us that we believe could have a material adverse affect of our business, operating result, financial condition or cash flows.
During the
fifty-three week period ended August 31, 2019
, the Company reserved
$3.5 million
for the potential settlement of class action litigation concerning certain product label claims. The reserve is included within General and administrative in the Consolidated Statements of Comprehensive Income (Loss) and Accrued expenses and other current liabilities in the Consolidated Balance Sheets.
68
Other
The Company has entered into endorsement contracts with certain celebrity figures to promote and endorse the Atkins brand and line of products. These contracts contain endorsement fees, which are expensed ratably over the life of the contract, and performance fees, that are recognized at the time of achievement. Based on the terms of the contracts in place and achievement of performance conditions as of
August 31, 2019
the Company will be required to make payments of
$0.3 million
over the next year.
12
.
Stockholders' Equity
Successor Equity Warrants
Prior to the Business Combination, Conyers Park issued
13,416,667
public warrants and
6,700,000
private placement warrants. Simply Good Foods assumed the Conyers Park equity warrants upon the change of control event. As a result of the Business Combination, the warrants issued by Conyers Park are no longer exercisable for shares of Conyers Park common stock, but instead are exercisable for common stock of Simply Good Foods. All other features of the warrants remain unchanged.
From August 26, 2018 through October 5, 2018, public warrants to purchase an aggregate of
9,866,451
shares of the Company’s common stock were exercised for cash at an exercise price of
$11.50
per share, resulting in aggregate gross proceeds to the Company of
$113.5 million
.
On October 4, 2018, the Company delivered a notice for the redemption (the “Redemption Notice”) of all of its public warrants that remained unexercised immediately after November 5, 2018. Holders who exercised public warrants following the Redemption Notice were required to do so on a cashless basis. Accordingly, holders were no longer permitted to exercise public warrants in exchange for payment in cash of
$11.50
per share. Instead, a holder exercising a public warrant was deemed to have paid the
$11.50
per share exercise price by the surrender of
0.61885
of a share of common stock that the holder would have been entitled to receive upon a cash exercise of each public warrant. Exercising holders received
0.38115
of a share of the Company’s common stock for each public warrant surrendered for exercise. Following the Redemption Notice,
3,499,639
public warrants were exercised on a cashless basis. An aggregate of
1,333,848
shares of the Company’s common stock were issued in connection with these exercises of the public warrants. All remaining public warrants were redeemed as of November 5, 2018 for an immaterial amount.
The Company’s private warrants to purchase
6,700,000
shares of the Company’s common stock remain outstanding. The private warrants are owned by Conyers Park, a related party of the Company.
Predecessor Warrant Liabilities of Atkins
Atkins, the predecessor company, had outstanding warrants prior to the Business Combination. These warrants were settled as a part of the Business Combination.
Historically, the value of the predecessor warrants were reflected as a liability and adjusted to fair value each reporting period through
Change in warrant liabilities
. The Company recorded a benefit of
$0.7 million
in
the predecessor period from August 28, 2016 through July 6, 2017
in changes in warrant liabilities. The Company settled
$15.0 million
of warrant liabilities as part of the Business Combination.
Stock Repurchase Program
On November 13, 2018, the Company announced that its Board of Directors had adopted a
$50.0 million
stock repurchase program. Under the stock repurchase program, the Company may repurchase shares from time to time in the open market or in privately negotiated transactions. The stock repurchase program does not obligate the Company to acquire any specific number of shares or acquire shares over any specific period of time. The stock repurchase program may be suspended or discontinued at any time by the Company, and does not have an expiration date.
During the
fifty-three week period ended August 31, 2019
, the Company repurchased
98,234
shares of common stock at an average share price of
$21.83
per share.
13
.
Earnings Per Share
Basic earnings per share is based on the weighted average number of common shares issued and outstanding for the Successor period. Diluted earnings per share is based on the weighted average number of common shares issued and outstanding and the effect of all dilutive common stock equivalents outstanding during each of the successor periods.
69
The following table reconciles the numerators and denominators used in the computations of both basic and diluted earnings per share:
|
53-Weeks Ended
|
|
52-Weeks Ended
|
From July 7, 2017
through August 26, 2017 |
|||||||||
|
(In thousands, except share data)
|
August 31, 2019
|
August 25, 2018
|
||||||||||
|
Basic earnings per share computation:
|
|
|||||||||||
|
Numerator:
|
|
|||||||||||
|
Net income available to common stock stockholders
|
$
|
47,536
|
|
|
$
|
70,455
|
|
$
|
450
|
|
||
|
Denominator:
|
|
|||||||||||
|
Weighted average common shares - basic
|
80,734,091
|
|
|
70,582,149
|
|
70,562,477
|
|
|||||
|
Basic earnings per share from net income
|
$
|
0.59
|
|
$
|
1.00
|
|
$
|
0.01
|
|
|||
|
Diluted earnings per share computation:
|
||||||||||||
|
Numerator:
|
||||||||||||
|
Net income available to common stock stockholders
|
$
|
47,536
|
|
$
|
70,455
|
|
$
|
450
|
|
|||
|
Denominator:
|
||||||||||||
|
Weighted average common shares outstanding - basic
|
80,734,091
|
|
70,582,149
|
|
70,562,477
|
|
||||||
|
Public and private warrants
|
3,615,198
|
|
3,006,073
|
|
690,248
|
|
||||||
|
Employee stock options
|
801,700
|
|
43,779
|
|
|
—
|
|
|||||
|
Non-vested shares
|
92,920
|
|
49,354
|
|
2,045
|
|
||||||
|
Weighted average common shares - diluted
|
85,243,909
|
|
73,681,355
|
|
71,254,770
|
|
||||||
|
Diluted earnings per share from net income
|
$
|
0.56
|
|
$
|
0.96
|
|
$
|
0.01
|
|
|||
Earnings per share calculations for the
fifty-three week
period ended
August 31, 2019
, fifty-two week period ended
August 25, 2018
and
the successor period from July 7, 2017 through August 26, 2017
excluded
0.2 million
,
0.2 million
and
2.6 million
shares of stock options, respectively, that would have been anti-dilutive.
14
.
Stock Option Plan
Share-based compensation is recognized on a straight-line basis over the requisite service period of the award based on their grant-date fair value. The Company recorded stock-based compensation expense of
$5.5 million
in the
fifty-three week
successor period ended
August 31, 2019
,
$4.0 million
in the
fifty-two week
successor period ended
August 25, 2018
and
$0.4 million
in
the successor period from July 7, 2017 through August 26, 2017
.
In July 2017, the Company's stockholders approved the 2017 Omnibus Incentive Plan (the “Incentive Plan”). The Incentive Plan provides for the issuance of a maximum of
9,067,917
shares of stock-denominated awards to directors, employees, officers and agents of the Company. As of
August 31, 2019
, there were
5.8 million
shares available for grant under the Incentive Plan.
Stock Options
Stock options granted under the Incentive Plan are granted at a price equal to or more than the fair value of common stock on the date the option is granted. Stock options under the Incentive Plan generally become exercisable ratably over
three
years from the date of grant and must be exercised within
ten
years from the date of grant.
70
The following table summarizes stock option activity for the
fifty-three week
period ended
August 31, 2019
:
|
Shares
|
Weighted average
exercise price |
Weighted average remaining contractual life
(in years) |
Aggregate intrinsic
value |
||||||||||
|
Outstanding as of August 25, 2018
|
2,506,083
|
|
$
|
12.28
|
|
8.84
|
$
|
14,293,484
|
|
||||
|
Granted
|
362,565
|
|
20.34
|
|
|||||||||
|
Exercised
|
(119,913
|
)
|
12.00
|
|
|||||||||
|
Forfeited
|
—
|
|
—
|
|
|||||||||
|
Outstanding as of August 31, 2019
|
2,748,735
|
|
$
|
13.35
|
|
8.13
|
|||||||
|
Vested and expected to vest as of August 31, 2019
|
2,748,735
|
|
$
|
13.35
|
|
8.13
|
$
|
44,743,427
|
|
||||
|
Exercisable as of August 31, 2019
|
1,478,216
|
|
$
|
12.16
|
|
7.91
|
$
|
25,829,992
|
|
||||
The following table summarized information about stock options outstanding at
August 31, 2019
:
|
Range of Exercise Prices
|
Number Outstanding
|
Weighted-Average Exercise Price
|
Weighted-Average Remaining Life (Years)
|
Number Exercisable
|
Weighted-Average Exercise Price
|
||||||||||||||
|
$
|
12.00
|
|
-
|
14.99
|
2,268,617
|
$
|
12.05
|
|
7.90
|
1,439,033
|
|
$
|
12.05
|
|
|||||
|
$
|
15.00
|
|
-
|
17.99
|
117,553
|
16.88
|
|
8.88
|
39,183
|
|
16.88
|
|
|||||||
|
$
|
18.00
|
|
-
|
20.99
|
315,331
|
19.89
|
|
9.19
|
—
|
|
—
|
|
|||||||
|
$
|
21.00
|
|
-
|
23.99
|
13,386
|
21.49
|
|
9.75
|
—
|
|
—
|
|
|||||||
|
$
|
24.00
|
|
-
|
26.99
|
33,848
|
24.08
|
|
9.86
|
—
|
|
—
|
|
|||||||
|
2,748,735
|
$
|
13.35
|
|
8.13
|
1,478,216
|
|
$
|
12.16
|
|
||||||||||
The weighted average fair value of options granted during the
fifty-three week period ended August 31, 2019
,
fifty-two week period ended August 25, 2018
and for
the successor period from July 7, 2017 through August 26, 2017
were
$7.10
,
$4.60
and
$3.71
, respectively. No stock options were granted prior to the Business Combination. As such, there were
no
t any shares vested or exercisable for
the successor period from July 7, 2017 through August 26, 2017
.
The fair value of each option grant is estimated on the date of grant using the Black-Scholes Option Pricing Model based on the following assumptions:
|
|
August 31, 2019
|
August 25, 2018
|
|
From July 7, 2017 through August 26, 2017
|
||||||||
|
Expected volatility
|
29.3%
|
-
|
32.09
|
%
|
26.72%
|
-
|
27.5
|
%
|
27.5%
|
|||
|
Expected dividend yield
|
—%
|
—%
|
—%
|
|||||||||
|
Expected option term
|
6
|
6
|
6
|
|||||||||
|
Risk-free rate of return
|
1.82%
|
-
|
3.13
|
%
|
1.98%
|
-
|
2.79
|
%
|
1.98%
|
|||
Expected term is estimated using the simplified method, which takes into account vesting and contractual term. The simplified method is being used to calculate expected term instead of historical experience due to a lack of relevant historical data resulting from changes in option vesting schedules and changes in the pool of employees receiving option grants. Due to a lack of sufficient trading history for our common stock, expected stock price volatility is based on a sampling of comparable publicly traded companies. The Company believes a sample of comparable publicly traded companies most closely models the nature of the business and stock price volatility. The risk-free rates are based on the implied yield available on U.S. Treasury zero-coupon issues with an equivalent remaining term. Future annual dividends over the expected term are estimated to be
nil
.
As of
August 31, 2019
,
$5.0 million
of total unrecognized compensation cost related to stock option plans that will be recognized over a weighted average period of
1.4 years
. During the
fifty-three week period ended August 31, 2019
and the
fifty-two week period ended August 25, 2018
, the Company received
$0.7 million
and
$0.1 million
in cash from stock option exercises, respectively.
71
Restricted Stock Units
Restricted stock units granted under the Incentive Plan are granted at a price equal to closing market price of our common stock on the date of grant. Restricted stock units under the Incentive Plan generally vest over
three
years.
The following table summarized Restricted Stock Unit activity for the
fifty-three week
period ended
August 31, 2019
:
|
Units
|
Weighted average
grant-date fair value |
||||||
|
Outstanding as of August 25, 2018
|
111,085
|
|
$
|
12.06
|
|
||
|
Granted
|
78,180
|
|
18.84
|
|
|||
|
Vested
|
(87,158
|
)
|
11.98
|
|
|||
|
Forfeited
|
(9,707
|
)
|
15.61
|
|
|||
|
Outstanding as of August 31, 2019
|
92,400
|
|
$
|
17.50
|
|
||
As of
August 31, 2019
, the Company had
$0.7 million
of total unrecognized compensation cost related to restricted stock unit awards that will be recognized over a weighted average period of
1.0 years
.
Performance Stock Units
During the
fifty-three weeks ended
August 31, 2019
, the Board of Directors granted performance stock units under the Incentive Plan. Performance stock units vest in a range between
0%
and
100%
based upon the price of the Company’s common stock at the end of a
three
-year period. Performance stock units were valued using a Monte-Carlo simulation.
The following table summarized Performance Stock Unit activity for the
fifty-three week
period ended
August 31, 2019
:
|
Units
|
Weighted average
grant-date fair value |
||||||
|
Outstanding as of August 25, 2018
|
—
|
|
$
|
—
|
|
||
|
Granted
|
193,512
|
|
11.93
|
|
|||
|
Vested
|
—
|
|
—
|
|
|||
|
Forfeited
|
(1,123
|
)
|
11.93
|
|
|||
|
Outstanding as of August 31, 2019
|
192,389
|
|
$
|
11.93
|
|
||
As of
August 31, 2019
, the Company had
$1.7 million
of total unrecognized compensation cost related to performance stock unit awards that will be recognized over a weighted average period of
2.2 years
.
Predecessor
In January 2011, the predecessor's Board of Directors adopted the NCP-ATK Holdings, Inc. 2010 Stock Option Plan (the “Option Plan”). Under the terms of the Option Plan, nonqualified stock options were granted to employees, directors and consultants of the predecessor Company. An option certificate for each grant set forth the exercise price, vesting period, performance thresholds if applicable and other terms. Options with service conditions generally vested over a period of
five
years, and the Company recognized share-based compensation expense ratably over the vesting period. Options with performance conditions generally vested over
five
successive years, based on the achievement of certain annual financial targets. Options typically expired after
ten
years.
The unvested portion of the stock options forfeited as of the Business Combination effective date and the vested portion of the stock options were required to be exercised within five calendar days following receipt by the option holder of written notice of the change in control. If not exercised, these vested stock options were canceled.
72
The weighted average fair value of options granted during
the predecessor period from August 28, 2016 through July 6, 2017
were
$261.80
. The fair value of each option grant is estimated on the date of grant using the Black-Scholes Option Pricing Model based on the following assumptions:
|
|
From August 28, 2016 through July 6, 2017
|
||||
|
Expected volatility
|
55%
|
||||
|
Expected dividend yield
|
—%
|
||||
|
Expected option term
|
5.1
|
|
-
|
6.5 years
|
|
|
Risk-free rate of return
|
1.62
|
%
|
-
|
1.74%
|
|
The expected term of the options represented the estimated period of time until exercise and considered vesting schedules and expectations of future employee and director behavior. Expected stock price volatility was based on a sampling of comparable publicly traded companies that the Company believed most closely modeled the nature of its own business. The risk-free rates were based on the implied yield available on U.S. Treasury zero-coupon issued with an equivalent term.
A summary of the option activity under the plans for the predecessor company is as follows:
|
From August 28, 2016 through July 6, 2017
|
||||
|
Intrinsic value of options exercised
|
$
|
11,106
|
|
|
|
Fair value of shares vested
|
$
|
—
|
|
|
|
Tax benefit related to stock option expense
|
$
|
910
|
|
|
15
.
Related Party Transactions
Successor
Tax Receivable Agreement
During the
fifty-three week period ended August 31, 2019
, the Company entered into the Termination Agreement, pursuant to which, the Company paid
$26.5 million
to settle the TRA (the “Termination Payment”), which provided former stockholders of Atkins with payments for federal, state, local and non-U.S. tax benefits deemed realized by the Company.
Under the Termination Agreement, each of the parties thereto agreed to terminate the TRA and to release and discharge any and all obligations and liabilities of the other parties thereunder effective as of the exchange agent’s receipt of the Termination Payment. Richard Laube, a former director of the Company, Joseph Scalzo, our President and Chief Executive Officer and a director of the Company, and Scott Parker, our Chief Marketing Officer, were each former stockholders of Atkins and received their respective pro rata share of the Termination Payment as additional consideration for their former stock ownership in accordance with the terms of the Merger Agreement. The TRA liability and subsequent settlement are discussed in Note
10
,
Income Taxes
.
Merger Agreement Working Capital Adjustment
In the first quarter of fiscal 2018, pursuant to the terms of the Merger Agreement, Simply Good Foods paid a working capital adjustment of
$1.8 million
to the former owners of Atkins, which resulted in an increase to the previously recognized goodwill.
Predecessor
Pursuant to an arrangement with the former majority stockholder of Atkins, the predecessor company was obligated to pay a management fee of the greater of
$0.9 million
or an amount equal to
2%
of consolidated adjusted earnings before interest, tax, depreciation and amortization (EBITDA), as defined by the First Lien and Second Lien, which could have been prorated upon a fiscal year-end change. Annual reimbursements for out-of-pocket expenses were limited to
$0.2 million
.
For
the predecessor period from August 28, 2016 through July 6, 2017
, the management fee expense was
$1.2 million
.
73
16
.
Segment and Customer Information
The Company has organized its operations into
one
operating segment that sells its branded nutritional foods and snacking products designed around the nutrition principles of the Atkins eating approach. The results of the operating segment are reviewed by the Company’s chief operating decision maker to make decisions about resource expenditures and assessing financial performance. This operating segment is therefore the Company’s only reportable segment.
Reconciliations of the totals of reported segment revenue, profit or loss measurement, assets and other significant items reported by segment to the corresponding GAAP totals is not applicable to the Company as it only has one reportable segment. The following is a summary of revenue from external customers by geographical location:
|
53-Weeks Ended
|
52-weeks ended
|
From July 7, 2017
through August 26, 2017 |
From August 28, 2016 through July 6, 2017
|
||||||||||||||
|
August 31, 2019
|
August 25, 2018
|
||||||||||||||||
|
(In thousands)
|
(Successor)
|
(Successor)
|
(Successor)
|
(Predecessor)
|
|||||||||||||
|
Revenue from external customers
|
|||||||||||||||||
|
North America
|
$
|
498,196
|
|
$
|
405,055
|
|
$
|
52,373
|
|
$
|
316,776
|
|
|||||
|
International
|
25,187
|
|
26,374
|
|
3,961
|
|
23,061
|
|
|||||||||
|
Total
|
$
|
523,383
|
|
$
|
431,429
|
|
$
|
56,334
|
|
$
|
339,837
|
|
|||||
The following is a summary long lived assets by geographical location:
|
(In thousands)
|
August 31, 2019
|
August 25, 2018
|
||||||
|
Long lived assets
|
||||||||
|
North America
|
$
|
2,437
|
|
$
|
2,547
|
|
||
|
International
|
19
|
|
18
|
|
||||
|
Total
|
$
|
2,456
|
|
$
|
2,565
|
|
||
Revenue from transactions with external customers for each of the Company’s products would be impracticable to disclose. Management does not view its business by product line.
Significant Customers
Credit risk for the Company was concentrated in the following customer who comprised more than 10% of the Company’s total sales for
fifty-three week period ended August 31, 2019
,
the successor period from July 7, 2017 through August 26, 2017
and
the predecessor period from August 28, 2016 through July 6, 2017
:
|
53-Weeks Ended
|
52-weeks ended
|
From July 7, 2017
through August 26, 2017 |
From August 28, 2016 through July 6, 2017
|
||||||||||
|
August 31, 2019
|
August 25, 2018
|
||||||||||||
|
(Successor)
|
(Successor)
|
(Successor)
|
(Predecessor)
|
||||||||||
|
Customer 1
|
44
|
%
|
43
|
%
|
42
|
%
|
46
|
%
|
|||||
At
August 31, 2019
and
August 25, 2018
, the Company had a single significant customer that accounted for the following amounts of the Company’s accounts receivable, net:
|
(In thousands)
|
August 31, 2019
|
August 25, 2018
|
||||||||||||
|
Customer 1
|
$
|
17,386
|
|
39
|
%
|
$
|
14,519
|
|
34
|
%
|
||||
No other customers of the Company accounted for more than 10% of sales during these periods. The Company generally does not require collateral from its customers and has not incurred any significant losses on uncollectible accounts receivable.
74
17
.
Unaudited Quarterly Financial Data
Summarized quarterly financial data:
|
53-weeks ended
|
13-weeks ended
|
13-weeks ended
|
13-weeks ended
|
13-weeks ended
|
|||||||||||||||
|
(In thousands, except per share amounts)
|
August 31, 2019
|
August 31, 2019
|
May 25, 2019
|
February 23, 2019
|
November 24, 2018
|
||||||||||||||
|
Net sales
|
$
|
523,383
|
|
$
|
139,184
|
|
$
|
139,468
|
|
$
|
123,800
|
|
$
|
120,931
|
|
||||
|
Gross profit
(1)
|
$
|
217,405
|
|
$
|
59,173
|
|
$
|
56,657
|
|
$
|
49,655
|
|
$
|
51,920
|
|
||||
|
Income from operations
|
$
|
72,809
|
|
$
|
12,115
|
|
$
|
20,510
|
|
$
|
19,002
|
|
$
|
21,182
|
|
||||
|
Net income
|
$
|
47,536
|
|
$
|
6,091
|
|
$
|
13,466
|
|
$
|
12,722
|
|
$
|
15,257
|
|
||||
|
Earnings per share from net income:
|
|||||||||||||||||||
|
Basic
|
$
|
0.59
|
|
$
|
0.07
|
|
$
|
0.16
|
|
$
|
0.16
|
|
$
|
0.20
|
|
||||
|
Diluted
|
$
|
0.56
|
|
$
|
0.07
|
|
$
|
0.16
|
|
$
|
0.15
|
|
$
|
0.18
|
|
||||
|
52-weeks ended
|
13-weeks ended
|
13-weeks ended
|
13-weeks ended
|
13-weeks ended
|
|||||||||||||||
|
(In thousands, except per share amounts)
|
August 25, 2018
|
August 25, 2018
|
|
May 26, 2018
|
February 24, 2018
|
November 25, 2017
|
|||||||||||||
|
Net sales
|
$
|
431,429
|
|
$
|
108,262
|
|
$
|
107,233
|
|
$
|
109,347
|
|
$
|
106,587
|
|
||||
|
Gross profit
(1)
|
$
|
180,366
|
|
$
|
46,275
|
|
$
|
44,797
|
|
$
|
42,937
|
|
$
|
46,357
|
|
||||
|
Income from operations
|
$
|
64,730
|
|
$
|
14,859
|
|
$
|
13,802
|
|
$
|
16,783
|
|
$
|
19,286
|
|
||||
|
Net income
|
$
|
70,455
|
|
$
|
11,706
|
|
$
|
7,137
|
|
$
|
41,394
|
|
$
|
10,218
|
|
||||
|
Earnings per share from net income:
|
|||||||||||||||||||
|
Basic
|
$
|
1.00
|
|
$
|
0.17
|
|
$
|
0.10
|
|
$
|
0.59
|
|
$
|
0.14
|
|
||||
|
Diluted
|
$
|
0.96
|
|
$
|
0.15
|
|
$
|
0.10
|
|
$
|
0.56
|
|
$
|
0.14
|
|
||||
|
(1)
|
During the fifty-three weeks ended August 31, 2019, certain reclassifications were made to previously reported amounts to conform to the current presentation. On the consolidated statement of operations, inbound freight previously included in Distribution, distribution center expenses previously included in
General and administrative
, and depreciation for equipment used in warehouse operations were reclassified to
Cost of goods sold
. Including these expenses in Cost of goods sold better align costs with the related revenue. As a result, the first three quarters of fiscal 2019 and all quarterly results of 2018 have been adjusted on a retrospective basis to reflect the reclassification. For additional information on the change in accounting principle, see Note 2.
|
|
Earnings per common share amounts are computed independently for each of the quarters presented. Therefore, the sum of the quarterly earnings per share amounts may not equal the quarterly earnings per share amounts or the annual earnings per share amounts due to rounding.
18
.
Subsequent Events
Quest Acquisition and Related Financing
On August 21, 2019, we entered into a stock purchase agreement (the “Purchase Agreement”) to acquire Quest Nutrition, LLC (“Quest”), a healthy lifestyle food company (the “Acquisition”), for approximately $1.0 billion. The Acquisition is expected to close by the end of the 2019 calendar year, subject to satisfaction of customary closing conditions. There is no financing condition for the Acquisition.
On October 9, 2019, we completed an underwritten public offering of 13,379,205 shares of our common stock at a price per share of $26.16 (the “Offering”), resulting in net proceeds to us of approximately $350.0 million, after deducting underwriting discounts and commissions and our estimated fees and expenses for the Offering. We intend to use these net proceeds to pay a portion of the purchase price and related fees and expenses for the Acquisition, or for general corporate purposes if the acquisition is not consummated.
We plan to fund the remainder of the Acquisition by using a significant portion of the approximately $265 million of cash on hand and committed financing pursuant to debt commitments from Barclays, Credit Suisse and Goldman Sachs.
75
Item 9. Changes in and Disagreements with Accountants on Accounting and Financial Disclosure
None.
Item 9A. Controls and Procedures
We maintain disclosure controls and procedures, as such term is defined in Rules 13a-15(e) and 15d-15(e) under the Exchange Act of that are designed to provide reasonable assurance that information required to be disclosed by us in the reports that we file or submit under the Exchange Act is recorded, processed, summarized and reported within the time periods specified in the SEC rules and forms, and that such information is accumulated and communicated to our management, including our President and Chief Executive Officer and our Chief Financial Officer, as appropriate, to allow timely decisions regarding required financial disclosures.
Management, including the participation of our President and Chief Executive Officer and our Chief Financial Officer, conducted an evaluation of the effectiveness of our disclosure controls and procedures as of
August 31, 2019
, the end of the period covered by this Report. Based on this evaluation, our Chief Executive Officer and Chief Financial Officer concluded that, as of
August 31, 2019
, our disclosure controls and procedures were effective at the reasonable assurance level.
Management's Report on Internal Control over Financial Reporting
Management is responsible for designing, implementing and maintaining adequate internal control over financial reporting, as such term is defined in Rules 13a-15(f) and 15d-15(f) under the Exchange Act, to provide reasonable assurance regarding the reliability of our financial reporting and the preparation of financial statements in accordance with U.S. generally accepted accounting principles. Management assessed the effectiveness of our internal control over financial reporting as of
August 31, 2019
. Management based its assessment on criteria established in Internal Control-Integrated Framework (2013) issued by the Committee of Sponsoring Organizations of the Treadway Commission. Based on the assessment using this criteria, management has concluded that our internal control over financial reporting was effective as of
August 31, 2019
.
Internal control over financial reporting, no matter how well designed, has inherent limitations. Therefore, even those systems determined to be effective can provide only reasonable assurance with respect to financial statement preparation and presentation. Further, because of changes in conditions, the effectiveness of internal control over financial reporting may vary over time.
The effectiveness of our internal control over financial reporting as of August 31, 2019 was audited by Deloitte & Touche LLP, our independent registered public accounting firm, as stated in their report appearing below, which expressed an unqualified opinion on the effectiveness of our internal control over financial reporting as of August 31, 2019.
Changes in Internal Control over Financial Reporting
There were no changes in our internal control over financial reporting during the quarter ended August 31, 2019 that have materially affected, or are reasonably likely to materially affect, our internal control over financial reporting.
76
REPORT OF INDEPENDENT REGISTERED PUBLIC ACCOUNTING FIRM
To the Stockholders and the Board of Directors of The Simply Good Foods Company
Opinion on Internal Control over Financial Reporting
We have audited the internal control over financial reporting of The Simply Good Foods Company and subsidiaries (the “Company”) as of August 31, 2019, based on criteria established in Internal Control - Integrated Framework (2013) issued by the Committee of Sponsoring Organizations of the Treadway Commission (COSO). In our opinion, the Company maintained, in all material respects, effective internal control over financial reporting as of August 31, 2019, based on criteria established in Internal Control - Integrated Framework (2013) issued by COSO.
We have also audited, in accordance with the standards of the Public Company Accounting Oversight Board (United States) (PCAOB), the consolidated financial statements as of and for the year ended August 31, 2019, of the Company and our report dated October 30, 2019, expressed an unqualified opinion on those consolidated financial statements and included an explanatory paragraph relating to a change in accounting principle to reclassify shipping and handling costs from distribution expense to cost of goods sold.
Basis for Opinion
The Company’s management is responsible for maintaining effective internal control over financial reporting and for its assessment of the effectiveness of internal control over financial reporting, included in the accompanying "Management's Report on Internal Control over Financial Reporting." Our responsibility is to express an opinion on the Company’s internal control over financial reporting based on our audit. We are a public accounting firm registered with the PCAOB and are required to be independent with respect to the Company in accordance with the U.S. federal securities laws and the applicable rules and regulations of the Securities and Exchange Commission and the PCAOB.
We conducted our audit in accordance with the standards of the PCAOB. Those standards require that we plan and perform the audit to obtain reasonable assurance about whether effective internal control over financial reporting was maintained in all material respects. Our audit included obtaining an understanding of internal control over financial reporting, assessing the risk that a material weakness exists, testing and evaluating the design and operating effectiveness of internal control based on the assessed risk, and performing such other procedures as we considered necessary in the circumstances. We believe that our audit provides a reasonable basis for our opinion.
Definition and Limitations of Internal Control over Financial Reporting
A company’s internal control over financial reporting is a process designed to provide reasonable assurance regarding the reliability of financial reporting and the preparation of financial statements for external purposes in accordance with generally accepted accounting principles. A company’s internal control over financial reporting includes those policies and procedures that (1) pertain to the maintenance of records that, in reasonable detail, accurately and fairly reflect the transactions and dispositions of the assets of the company; (2) provide reasonable assurance that transactions are recorded as necessary to permit preparation of financial statements in accordance with generally accepted accounting principles, and that receipts and expenditures of the company are being made only in accordance with authorizations of management and directors of the company; and (3) provide reasonable assurance regarding prevention or timely detection of unauthorized acquisition, use, or disposition of the company’s assets that could have a material effect on the financial statements.
Because of its inherent limitations, internal control over financial reporting may not prevent or detect misstatements. Also, projections of any evaluation of effectiveness to future periods are subject to the risk that controls may become inadequate because of changes in conditions, or that the degree of compliance with the policies or procedures may deteriorate.
/s/ Deloitte & Touche LLP
Denver, Colorado
October 30, 2019
77
Item 9B. Other Information
Effective October 28, 2019, our board of directors adopted our second amended and restated bylaws to remove obsolete provisions, make immaterial corrections to section references and correct other non-substantive clerical errors. The second amended and restated bylaws is included as Exhibit 3.2 to this Report.
78
PART III
Item 10. Directors, Executive Officers and Corporate Governance
Incorporated herein by reference to our definitive proxy statement for our
2020
Annual Meeting of Stockholders to be filed no later than 120 days after the end of the fiscal year ended
August 31, 2019
.
Item 11. Executive Compensation
Incorporated herein by reference to our definitive proxy statement for our
2020
Annual Meeting of Stockholders to be filed no later than 120 days after the end of the fiscal year ended
August 31, 2019
.
Item 12. Security Ownership of Certain Beneficial Owners and Management and Related Stockholder Matters
Incorporated herein by reference to our definitive proxy statement for our
2020
Annual Meeting of Stockholders to be filed no later than 120 days after the end of the fiscal year ended
August 31, 2019
.
Item 13. Certain Relationships and Related Transactions, and Director Independence
Incorporated herein by reference to our definitive proxy statement for our
2020
Annual Meeting of Stockholders to be filed no later than 120 days after the end of the fiscal year ended
August 31, 2019
.
Item 14. Principal Accounting Fees and Services
Incorporated herein by reference to our definitive proxy statement for our
2020
Annual Meeting of Stockholders to be filed no later than 120 days after the end of the fiscal year ended
August 31, 2019
.
79
PART IV
Item 15. Exhibits, Financial Statement Schedules
The audited consolidated financial statements of The Simply Good Foods Company and its subsidiaries, as required to be filed, are included under Item 8 of this Annual Report on Form 10-K. Other schedules have been omitted as they are not applicable or the required information is set forth in the consolidated financial statements or notes thereto.
|
Exhibit No.
|
Document
|
|
|
2.1(a)
|
||
|
2.2(a)
|
||
|
3.1
|
||
|
3.2
|
||
|
4.1
|
||
|
4.2
|
||
|
4.3
|
||
|
4.4
|
||
|
10.1
|
||
|
10.2†
|
||
|
10.3†
|
||
|
10.4†
|
||
|
10.5
|
||
|
10.6
|
||
|
10.7†
|
||
|
10.8
|
||
|
10.9
|
||
|
10.10†
|
||
|
10.11†
|
||
|
10.12
|
||
|
10.13†
|
||
|
10.14†
|
||
|
10.15†
|
||
80
|
Exhibit No.
|
Document
|
|
|
18.1
|
||
|
21.1
|
||
|
23.1
|
||
|
23.2
|
||
|
31.1
|
||
|
31.2
|
||
|
32.1
|
||
|
101.INS
|
XBRL Instance Document
|
|
|
101.SCH
|
XBRL Taxonomy Extension Schema Document
|
|
|
101.CAL
|
XBRL Taxonomy Extension Calculation Linkbase Document
|
|
|
101.DEF
|
XBRL Taxonomy Extension Definition Linkbase Document
|
|
|
101.LAB
|
XBRL Taxonomy Extension Label Linkbase Document
|
|
|
101.PRE
|
XBRL Taxonomy Extension Presentation Linkbase Document
|
|
____________________
|
†
|
Indicates a management contract or compensatory plan.
|
|
(a)
|
Certain schedules and exhibits to this agreement have been omitted in accordance with Item 601(b)(2) of Regulation S-K. A copy of any omitted schedule and/or exhibit will be furnished to the Securities and Exchange Commission upon request.
|
Item 16. Form 10-K Summary
None.
81
SIGNATURES
Pursuant to the requirements of Section 13 or 15(d) of the Securities Exchange Act of 1934, the registrant has duly caused this report to be signed on its behalf by the undersigned thereunto, duly authorized.
|
|
|
|
THE SIMPLY GOOD FOODS COMPANY
|
|
|
By:
|
/s/ Joseph E. Scalzo
|
|||
|
Date:
|
October 30, 2019
|
Name:
|
Joseph E. Scalzo
|
|
|
Title:
|
President and Chief Executive Officer
|
|||
82
Pursuant to the requirements of the Securities Exchange Act of 1934, this report has been signed below by the following persons on behalf of the registrant and in the capacities and on the dates indicated.
|
Signature
|
Title
|
Date
|
||
|
/s/ Joseph E. Scalzo
|
President, Chief Executive Officer and Director
|
October 30, 2019
|
||
|
Joseph E. Scalzo
|
(Principal Executive Officer)
|
|||
|
/s/ Todd E. Cunfer
|
Chief Financial Officer
|
October 30, 2019
|
||
|
Todd E. Cunfer
|
(Principal Financial Officer)
|
|||
|
/s/ Timothy A. Matthews
|
Vice President, Controller and Chief Accounting Officer
|
October 30, 2019
|
||
|
Timothy A. Matthews
|
(Principal Accounting Officer)
|
|||
|
/s/ James M. Kilts
|
Chairman of the Board of Directors
|
October 30, 2019
|
||
|
James M. Kilts
|
||||
|
/s/ David J. West
|
Director
|
October 30, 2019
|
||
|
David J. West
|
||||
|
/s/ Clayton C. Daley, Jr.
|
Director
|
October 30, 2019
|
||
|
Clayton C. Daley, Jr.
|
||||
|
/s/ Brian K. Ratzan
|
Director
|
October 30, 2019
|
||
|
Brian K. Ratzan
|
||||
|
/s/ Nomi P. Ghez
|
Director
|
October 30, 2019
|
||
|
Nomi P. Ghez
|
||||
|
/s/ James E. Healey
|
Director
|
October 30, 2019
|
||
|
James E. Healey
|
||||
|
/s/ Robert G. Montgomery
|
Director
|
October 30, 2019
|
||
|
Robert G. Montgomery
|
||||
|
/s/ Michelle P. Goolsby
|
Director
|
October 30, 2019
|
||
|
Michelle P. Goolsby
|
||||
|
/s/ Arvin Kash
|
Director
|
October 30, 2019
|
||
|
Arvin Kash
|
||||
|
/s/ James D. White
|
Director
|
October 30, 2019
|
||
|
James D. White
|
||||
83
TABLE OF CONTENTS
Part IItem 1. BusinessItem 1A. Risk FactorsItem 1B. Unresolved Staff CommentsItem 2. PropertiesItem 3. Legal ProceedingsItem 4. Mine Safety DisclosuresPart IIItem 5. Market For Registrant S Common Equity, Related Stockholder Matters and Issuer Purchases Of Equity SecuritiesItem 6. Selected Financial DataItem 7. Management S Discussion and Analysis Of Financial Condition and Results Of OperationsItem 7A. Quantitative and Qualitative Disclosures About Market RiskItem 8. Financial Statements and Supplementary DataItem 9. Changes in and Disagreements with Accountants on Accounting and Financial DisclosureItem 9A. Controls and ProceduresItem 9B. Other InformationPart IIIItem 10. Directors, Executive Officers and Corporate GovernanceItem 11. Executive CompensationItem 12. Security Ownership Of Certain Beneficial Owners and Management and Related Stockholder MattersItem 13. Certain Relationships and Related Transactions, and Director IndependenceItem 14. Principal Accounting Fees and ServicesPart IVItem 15. Exhibits, Financial Statement SchedulesItem 16. Form 10-k Summary