SEMTECH CORP
10-Ks and 10-Qs
|
|
|
|
|
|
|
|
|
|
|
|
|
|
|
|
|
|
|
|
|
|
|
|
|
|
|
|
|
|
|
|
|
|
|
|
|
|
|
|
|
|
|
|
|
|
|
|
|
|
|
|
|
|
|
|
|
|
|
UNITED STATES
SECURITIES AND EXCHANGE COMMISSION
Washington, D.C. 20549
____________________________________
FORM 10-K
____________________________________
(Mark One)
|
☒
|
Annual report pursuant to Section 13 or 15(d) of the Securities Exchange Act of 1934
|
For the fiscal year ended
January 28, 2018
or
|
☐
|
Transition Report Pursuant to Section 13 or 15(d) of the Securities Exchange Act of 1934
|
For the transition period from to
Commission File Number 1-6395
____________________________________
SEMTECH CORPORATION
(Exact name of registrant as specified in its charter)
____________________________________
|
Delaware
|
|
95-2119684
|
|
(State or other jurisdiction of
incorporation or organization)
|
|
(I.R.S. Employer
Identification No.)
|
200 Flynn Road, Camarillo, California, 93012-8790
(Address of principal executive offices, Zip Code)
Registrant’s telephone number, including area code: (805) 498-2111
Securities registered pursuant to Section 12(b) of the Act:
|
Title of each class
|
|
Name of each exchange on which registered
|
|
Common Stock par value $.01 per share
|
|
The NASDAQ Stock Market LLC
|
Securities registered pursuant to Section 12(g) of the Act:
None
(Title of Class)
____________________________________
Indicate by check mark if the registrant is a well-known seasoned issuer, as defined in Rule 405 of the Securities Act. Yes
☒
No
☐
Indicate by check mark if the registrant is not required to file reports pursuant to Section 13 or Section 15(d) of the Act. Yes
☐
No
☒
Indicate by check mark whether the registrant (1) has filed all reports required to be filed by Section 13 or 15(d) of the Securities Exchange Act of 1934 during the preceding 12 months (or for such shorter period that the registrant was required to file such reports), and (2) has been subject to such filing requirements for the past 90 days. Yes
☒
No
☐
Indicate by check mark whether the registrant has submitted electronically and posted on its corporate Web site, if any, every Interactive Data File required to be submitted and posted pursuant to Rule 405 of Regulation S-T (§232.405 of this chapter) during the preceding 12 months (or for such shorter period that the registrant was required to submit and post such files). Yes
☒
No
☐
Indicate by check mark if disclosure of delinquent filers pursuant to Item 405 of Regulation S-K (§229.405 of this chapter) is not contained herein, and will not be contained, to the best of registrant’s knowledge, in definitive proxy or information statements incorporated by reference in Part III of this Form 10-K or any amendment to this Form 10-K.
☐
Indicate by check mark whether the registrant is a large accelerated filer, an accelerated filer, a non-accelerated filer, or a smaller reporting company. See the definitions of “large accelerated filer," "accelerated filer," "smaller reporting company" and "emerging growth company" in Rule 12b-2 of the Exchange Act.
|
Large accelerated filer
|
|
☒
|
|
Accelerated filer
|
|
☐
|
|
Non-accelerated filer
|
|
☐
(Do not check if a smaller reporting company)
|
|
Smaller reporting company
|
|
☐
|
|
Emerging growth company
|
☐
|
|||||
Indicate by check mark whether the registrant is a shell company (as defined in Rule 12b-2 of the Act). Yes
☐
No
☒
The aggregate market value of the common stock held by non-affiliates of the registrant (based upon the closing sale price of
$39.75
on the NASDAQ Global Select Market) as of
July 30, 2017
was approximately
$2.0 billion
. Stock held by directors, officers and shareholders owning 10% or more of the outstanding common stock (as reported by shareholders on Schedules 13D and 13G) were excluded as they may be deemed affiliates. This determination of affiliate status is not a conclusive determination for any other purpose.
Number of shares of Common Stock,
$0.01
par value per share, outstanding at
March 16, 2018
:
66,521,122
____________________________________
DOCUMENTS INCORPORATED BY REFERENCE
Portions of the following documents are incorporated by reference in Part III, Item numbers 11, 12, 13 and 14 and portions of Item 10 of this report to: Definitive Proxy Statement in connection with registrant’s annual meeting of shareholders to be held on
June 14, 2018
, to be filed no later than 120 days after the end of the registrant’s fiscal year ended
January 28, 2018
.
SEMTECH CORPORATION
INDEX TO FORM 10-K
FOR THE YEAR ENDED
JANUARY 28, 2018
|
Item 1
|
||
|
Item 1A
|
||
|
Item 1B
|
||
|
Item 2
|
||
|
Item 3
|
||
|
Item 4
|
||
|
Item 5
|
||
|
Item 6
|
||
|
Item 7
|
||
|
Item 7A
|
||
|
Item 8
|
||
|
Item 9
|
||
|
Item 9A
|
||
|
Item 9B
|
||
|
Item 10
|
||
|
Item 11
|
||
|
Item 12
|
||
|
Item 13
|
||
|
Item 14
|
||
|
Item 15
|
||
|
Item 16
|
||
2
Unless the context otherwise requires, the use of the terms "Semtech," "the Company," "we," "us" and "our" in this Annual Report on Form 10-K refers to Semtech Corporation and, as applicable, its consolidated subsidiaries.
Special Note
Regarding Forward-Looking and Cautionary Statements
This Annual Report on Form 10-K contains "forward-looking statements" within the meaning of the "safe harbor" provisions of the Private Securities Litigation Reform Act of 1995, as amended, based on our current expectations, estimates and projections about our operations, industry, financial condition, performance, operating results, and liquidity. Forward-looking statements are statements other than historical information or statements of current condition and relate to matters such as future financial performance, future operational performance, the anticipated impact of specific items on future earnings, and our plans, objectives and expectations. Statements containing words such as "may," "believe," "anticipate," "expect," "intend," "plan," "project," "estimate," "should," "will," "designed to," "projections," or "business outlook," or other similar expressions constitute forward-looking statements. Forward-looking statements involve known and unknown risks and uncertainties that could cause actual results and events to differ materially from those projected. Potential factors that could cause actual results to differ materially from those in the forward-looking statements include, but are not limited to: fluctuation in the Company's future results; downturns in the business cycle; decreased average selling prices of the Company's products; reduced demand for the Company's products due to global economic conditions; changes in U.S. and global social, political, regulatory and economic conditions or in laws and policies governing foreign trade, manufacturing, development and investment, including potential increases on tariffs of goods imported into the U.S.; business interruptions; the Company's reliance on a limited number of suppliers and subcontractors for component and materials; potentially insufficient liability insurance if the Company's products are found to be defective; obsolete inventories as a result of changes in demand and change in life cycles for the Company’s products; the Company may be unsuccessful in developing and selling new products; the Company’s products having to undergo a lengthy and expensive qualification process without any assurance of product sales; the Company's products failing to meet industry standards; the Company's inability to protect intellectual property rights; the Company suffering losses if its products infringe the intellectual property rights of others; the Company's need to commit resources to product production prior to receipt of purchase commitments; increased business risk from foreign customers; the Company's foreign currency exposures; potential increased tax liabilities and effective tax rate if the Company needs to repatriate funds held by foreign subsidiaries; export restrictions and laws affecting the Company's trade and investments; competition against larger, more established entities; increased competition due to industry consolidation; the loss of any one of the Company's significant customers; volatility of customer demand; termination of a contract by a distributor;the Company’s inability to effectively control the sales of its products on the gray market; the Company’s failure to maintain effective internal control over financial reporting or disclosure controls and procedures; government regulations and other standards that impose operational and reporting requirements; the Company's failure to comply with applicable environmental regulations; compliance with conflict minerals regulations; increase in the Company’s cost of doing business as a result of having to comply with the codes of conduct of certain of the Company’s customers and suppliers; volatility of the Company’s effective tax rate; changes in tax laws and review by taxing authorities; taxation of the Company in other jurisdictions; the Company’s limited experience with government contracting; potential government investigations and inquiries; loss of the Company's key personnel; risks associated with companies the Company has acquired in the past and may acquire in the future and the Company's ability to successfully integrate acquired businesses and benefit from expected synergies; the Company may be required to recognize additional impairment charges; losses in the value of investments in entities we do not control; the receipt of inaccurate, incomplete, or untimely financial information from entities in which we have an interest for which we are required to consolidate; the Company may be adversely affected by new accounting pronouncements; the Company's ability to generate cash to service its debt obligations; restrictive covenants in the Company's credit agreement which may restrict its ability to pursue its business strategies; the Company's reliance on certain critical information systems for the operation of its business; costs associated with the Company's indemnification of certain customers, distributors and other parties; the Company's common stock price could be subject to extreme price fluctuations; the impact on the Company’s common stock price if securities or industry analysts do not publish reports about the Company’s business or adversely change their recommendations regarding the Company’s common stock; anti-takeover provisions in the Company’s organizational documents could make an acquisition of the Company more difficult; the Company is subject to litigation risks which may be costly to defend. Additionally, forward-looking statements should be considered in conjunction with the cautionary statements contained in this Annual Report on Form 10-K, including, without limitation, information under the captions "Management's Discussion and Analysis of Financial Condition and Results of Operations" and "Risk Factors" and additional factors that accompany the related forward-looking statements in this Annual Report on Form 10-K, in the Company's other filings with the Securities and Exchange Commission ("SEC"), and in material incorporated herein and therein by reference. In light of the significant risks and uncertainties inherent in the forward-looking information included herein that may cause actual performance and results to differ materially from those predicted, any such forward-looking information should not be
3
regarded as representations or guarantees by the Company of future performance or results, or that its objectives or plans will be achieved, or that any of its operating expectations or financial forecasts will be realized. Reported results should not be considered an indication of future performance. Investors are cautioned not to place undue reliance on any forward-looking information contained herein, which reflect management's analysis only as of the date hereof. Except as required by law, the Company assumes no obligation to publicly release the results of any update or revision to any forward-looking statement that may be made to reflect new information, events or circumstances after the date hereof or to reflect the occurrence of unanticipated or future events, or otherwise.
In addition to regarding forward-looking statements with caution, you should consider that the preparation of the consolidated financial statements requires us to draw conclusions and make interpretations, judgments, assumptions and estimates with respect to certain factual, legal, and accounting matters. Our consolidated financial statements might have been materially impacted if we had reached different conclusions or made different interpretations, judgments, assumptions or estimates.
4
|
Item 1.
|
Business
|
General
We are a leading global supplier of high performance analog, mixed-signal semiconductors and advanced algorithms and were incorporated in Delaware in 1960. We design, develop, manufacture and market a wide range of products for commercial applications, the majority of which are sold into the enterprise computing, communications, high-end consumer and industrial end-markets.
Enterprise Computing
: datacenters, passive optical networks, desktops, notebooks, servers, monitors, printers and other computer peripherals.
Communications
: base stations, optical networks, carrier networks, switches and routers, cable modems, wireless LAN and other communication infrastructure equipment.
High-End Consumer
: handheld products, smartphones, wireless charging, set-top boxes, digital televisions, monitors and displays, tablets, wearables, digital video recorders and other consumer equipment.
Industrial
: analog and digital video broadcast equipment, video-over-IP solutions, automated meter reading, Internet of Things ("IoT"), smart grid, wireless charging, military and aerospace, medical, security systems, automotive, industrial and home automation and other industrial equipment.
Our end-customers are primarily original equipment manufacturers ("OEMs") and their suppliers.
Overview of the Semiconductor Industry
The semiconductor industry is broadly divided into analog and digital semiconductor products. Analog semiconductors condition and regulate "real world" functions such as temperature, speed, sound and electrical current. Digital semiconductors process binary information, such as that used by computers. Mixed-signal devices incorporate both analog and digital functions into a single chip and provide the ability for digital electronics to interface with the outside world.
The market for analog and mixed-signal semiconductors differs from the market for digital semiconductors. The analog and mixed-signal industry is typically characterized by longer product life cycles than the digital industry. In addition, analog semiconductor manufacturers tend to have lower capital investment requirements for manufacturing because their facilities tend to be less dependent than digital producers on state-of-the-art production equipment to manufacture leading edge process technologies. The end-product markets for analog and mixed-signal semiconductors are more varied and more specialized than the relatively standardized digital semiconductor product markets.
Another difference between the analog and digital markets is the amount of available talented labor. The analog industry relies more heavily than the digital industry on design and applications talent to distinguish its products from one another. Digital expertise is extensively taught in universities due to its overall market size, while analog and mixed-signal expertise tends to be learned over time based on experience and hands-on training. Consequently, personnel with analog training are scarcer than digital trained engineers. This has historically made it more difficult for new suppliers in the analog market to quickly develop products and gain significant market share.
Advancements in digital signal processing technology typically drive the need for corresponding advancements in analog and mixed-signal solutions. We believe that the diversity of our applications allows us to take advantage of areas of relative market strength and reduces our vulnerability to competitive pressure in any one area.
Business Strategy
Our objective is to be a leading supplier of high performance analog, mixed-signal semiconductors and advanced algorithms to the fastest growing segments of our target markets. We intend to leverage our pool of skilled technical personnel to develop new products, or, where appropriate, use strategic acquisitions or small strategic investments to either accelerate our position in the fastest growing areas or to gain entry into these areas. In order to capitalize on our strengths in analog and mixed-signal processing design, development and marketing, we intend to pursue the following strategies:
Leverage our rare analog/mixed signal design expertise
We have developed a strategy to invest heavily in human resources needed to define, design and market high-performance analog and mixed signal platform products. We have built a team of experienced engineers who combine industry expertise with advanced semiconductor design expertise to meet customer requirements and enable our customers to get their products to market rapidly. We intend to leverage this strategy to achieve new levels of integration, power reduction and performance, enabling our customers to achieve differentiation in their end systems.
5
Continue to release proprietary new products, achieve new design wins, and cross-sell products
We are focused on developing unique, new, proprietary products that bring value to our target customers in our target markets. These products are typically differentiated in performance but are priced competitively. We also focus on achieving design wins for our products with current and future customers. Design wins are indications by the customer that they intend to incorporate our products into their product designs. Although we believe that a design win is an indicator of future potential growth, it does not inevitably result in us being awarded business or receiving a purchase commitment. Our technical talent works closely with our customers in securing design wins, defining new products and in implementing and integrating our products into their systems. We also focus on selling our complete portfolio of products to our existing customers, as we believe the technical expertise of our marketing and sales team allows us to identify and capitalize on cross-selling opportunities.
Focus on fast-growing market segments and regions
We have chosen to target the analog/mixed signal sub-segments of some of the most exciting and fastest growing end-markets. We participate in these markets by focusing on specific product areas within the analog and mixed-signal market, including products for enterprise computing equipment, high-end consumer equipment, communications infrastructure and certain broad-based industrial markets. All of these markets are characterized by their need for leading-edge, high-performance analog and mixed-signal semiconductor technologies.
The enterprise computing, communications, high-end consumer and industrial end-markets we supply are characterized by several trends that we believe drive demand for our products. The key trends that we believe are significant for our future growth include:
|
•
|
Increasing bandwidth over high-speed networks, fueling growth in high speed multimedia transmission
|
|
•
|
Increasing electronic system requirements for smaller, lighter, more highly integrated and feature rich mobile devices
|
|
•
|
Increasing need for more efficient energy management in the home and in industrial environments and the proliferation of "green" standards
|
|
•
|
Increasing demands for Internet connectivity to low power sensors
|
Our products address these market trends by providing solutions that are ultra-low power thus extending battery life, small form factor enabling smaller more mobile devices, highly integrated enabling more functionality within devices and high performance enabling product differentiation within our customer base. Additionally, as communications functions are increasingly integrated into a range of systems and devices, these products require analog sensing, processing and control capabilities, which increases the number and size of our end-markets.
Leverage outsourced semiconductor fabrication capacity
We outsource most of our manufacturing in order to focus more of our resources on designing, developing and marketing our products. Our primary outside wafer foundries are bas
ed in China, Israel, the United States and Taiwan. We
believe that outsourcing provides us numerous benefits, including capital efficiency, the flexibility to adopt and leverage emerging process technologies without significant investment risk, and a more variable cost of goods, which provides us with greater operating flexibility.
Products and Technology
We design, develop, manufacture and market high-performance analog, mixed-signal semiconductors and advanced algorithms. We operate and account for results in one reportable segment through four product lines: Signal Integrity, Protection, Wireless and Sensing and Power and High-Reliability.
On July 1, 2017, the Company acquired AptoVision Technologies Inc. ("AptoVision"), a privately-held provider of uncompressed, zero-frame latency, video-over-IP solutions addressing the professional audio visual ("Pro AV") market. The unique combination of AptoVision's advanced algorithms for real-time, full bandwidth video transmission over IP networks, and Semtech's industry leading high-speed signal integrity and chip development expertise is expected to enable the adoption of Software Defined Video over Ethernet ("SDVoE") accelerating this natural progression in the evolution of video transport. This transaction, which was accounted for using the acquisition method of accounting, expanded our Signal Integrity portfolio.
On March 4, 2015, we completed the acquisition of Triune Systems, L.L.C. ("Triune"), a privately-held supplier of wireless charging, isolated switching and power management platforms targeted at high and low power, high efficiency applications. This transaction, which was accounted for using the acquisition method of accounting, expanded our power management portfolio.
Beginning in fiscal year 2016, we split the product line previously known as Protection, Power and High-Reliability into two new product lines now referred to as the Protection Products Group and the Power and High-Reliability Products Group.
6
Our product lines include:
Signal Integrity Products.
We design, develop and market a portfolio of optical data communications and video transport products used in a wide variety of enterprise computing, industrial, communications and high-end consumer applications. Our comprehensive portfolio of integrated circuits ("ICs") for data centers, enterprise networks, passive optical networks ("PON"), and wireless basestation optical transceivers and high-speed interfaces ranges from 100Mbps to 400Gbps and supports key industry standards such as Fibre Channel, Infiniband, Ethernet, PON and SONET. Our video products offer advanced solutions for next generation video broadcast applications, as well as highly differentiated video over IP technology for Pro AV applications.
Protection Products.
We design, develop and market high performance protection devices, which are often referred to as transient voltage suppressors ("TVS"). TVS devices provide protection for electronic systems where voltage spikes (called transients), such as electrostatic discharge ("ESD"), electrical over stress ("EOS") or secondary lightning surge energy, can permanently damage sensitive semiconductor ICs. Our portfolio of protection solutions include filter and termination devices that are integrated with the TVS device. Our products provide robust protection while preserving signal integrity in high-speed communications, networking and video interfaces. These products also operate at very low voltage. Our protection products can be found in a broad range of applications including smart phones, LCD and organic light-emitting diode TVs, set-top boxes, monitors and displays, tablets, computers, notebooks, base stations, routers, automobile and industrial instruments.
Wireless and Sensing Products.
We design, develop and market a portfolio of specialized RF products used in a wide variety of industrial, medical and communications applications, and specialized sensing products used in industrial and consumer applications. Our wireless products, which include our LoRa® devices and wireless radio frequency technology ("LoRa Technology"), feature industry leading and longest range industrial, scientific and medical radio, enabling a lower total cost of ownership and increased reliability in all environments. This makes these products particularly suitable for machine-to-machine (M2M) and IoT applications. Our unique sensing technology enables smart proximity sensing and advanced user interface solutions for mobile and consumer products. Our wireless and sensing products can be found in a broad range of applications in the industrial, medical and consumer markets.
Power and High-Reliability Products.
We design, develop and market power product devices that control, alter, regulate and condition the power within electronic systems. The highest volume product types within the Power product line are switching voltage regulators, combination switching and linear regulators, smart regulators, isolated switches and wireless charging. Our Power products feature highly integrated functionality for the communications, industrial and computing markets and low-power, small form factor and high-efficiency products for smart phones and other mobile devices, home automation and other consumer devices.
Our High-Reliability discrete semiconductor products are comprised of rectifiers, assemblies (packaged discrete rectifiers) and other products that are typically used to convert alternating currents into direct currents and to protect circuits against very high voltage spikes or high current surges. Our High-Reliability products can be found in a broad range of applications including industrial, military, medical, automotive, aerospace and defense systems, including satellite communications.
Systems Innovation Group.
Prior to the third quarter of fiscal year 2017, we had a Systems Innovation Group which combined the analog/mixed signal design competencies from our previous Sierra Monolithics, Inc. ("SMI") and Gennum Corporation ("Gennum") acquisitions and was chartered with developing innovative analog/mixed signal intellectual property (“IP”) for emerging systems.
On August 5, 2016, we completed the divestiture of our Snowbush IP business (the remaining part of our Systems Innovation Group) to Rambus Inc. ("Rambus") for $32.0 million in cash along with the opportunity to receive additional payments from Rambus through 2022 based upon a percentage of sales by Rambus of new products expected to be developed by Rambus from the disposed assets. In fiscal year 2017, we recorded a gain of $25.5 million on the disposition of this business. Other than this gain, the divestiture did not and is not expected to have a material impact on our consolidated financial statements. Following the divestiture, beginning in the third quarter of fiscal year 2017, we no longer have a Systems Innovation Group.
7
Our sales by product line are as follows:
|
Fiscal Years
|
|||||||||||
|
(in thousands)
|
2018
|
2017
|
2016
|
||||||||
|
Signal Integrity
|
$
|
263,015
|
|
$
|
258,824
|
|
$
|
221,185
|
|
||
|
Protection
|
176,482
|
|
149,865
|
|
138,674
|
|
|||||
|
Wireless and Sensing
|
117,596
|
|
81,657
|
|
70,712
|
|
|||||
|
Power and High-Reliability
|
46,973
|
|
59,117
|
|
54,999
|
|
|||||
|
Systems Innovation
|
—
|
|
205
|
|
4,649
|
|
|||||
|
Other: Warrant Shares
(1)
|
(16,219
|
)
|
(5,396
|
)
|
—
|
|
|||||
|
Total
|
$
|
587,847
|
|
$
|
544,272
|
|
$
|
490,219
|
|
||
(1)
On October 5, 2016, we issued a warrant (the "Warrant") to Comcast Cable Communications Management LLC ("Comcast") to purchase up to 1,086,957 shares (the "Warrant Shares") of our common stock. The Warrant was issued by us to Comcast in connection with an agreement between the parties regarding the intended trial deployment by Comcast of a low-power wide-area Network ("LPWAN") in the United States, based on our LoRa Technology. The Warrant is accounted for as equity and the cost is recognized as an offset to net sales over the respective performance period which is expected to be completed by April 2019. The Warrant consists of five performance tranches. The cost associated with each tranche is recognized based on the fair value at each reporting date until vesting which is the measurement date.
S
emtech End-Markets
Our products are sold primarily to customers in the enterprise computing, communications, high-end consumer and industrial end-markets. Our estimate of sales by major end-market is detailed below:
|
Fiscal Years
|
||||||||
|
(percentage of sales)
|
2018
|
2017
|
2016
|
|||||
|
Enterprise Computing
|
34
|
%
|
31
|
%
|
30
|
%
|
||
|
Industrial
|
26
|
%
|
26
|
%
|
26
|
%
|
||
|
High-End Consumer
|
31
|
%
|
26
|
%
|
25
|
%
|
||
|
Communications
|
12
|
%
|
18
|
%
|
19
|
%
|
||
|
Other: Warrant Shares
|
(3
|
)%
|
(1
|
)%
|
—
|
%
|
||
|
Total
|
100
|
%
|
100
|
%
|
100
|
%
|
||
We believe that our diversity in end-markets provides stability to our business and opportunity for growth.
8
The following table depicts our main product lines and their end-market and product applications:
|
Typical End-Product Applications
|
|||||||
|
Product Groups
|
Enterprise Computing
|
|
Communications
|
|
High-End Consumer
|
|
Industrial
|
|
Signal Integrity
|
Optical Transceiver Module IC’s supporting 100Mb/s to 400Gb/s for Ethernet, Fibre Channel, CPRI protocols in Datacenter and Fiber to the Home applications
|
|
Optical Transceiver Module IC's for wireless base stations Optical Transceiver Module IC’s supporting 100Mb/s to 100Gb/s for Telecom applications, Backplane CDR's and signal conditioners
|
|
Signal Conditioners for Thunderbolt Cables
|
|
Serial Digital Interconnect interface IC’s for Broadcast Video, Video over IP technology for Pro AV applications
|
|
Protection
|
Servers, workstations, desktop PC/ notebooks, Ultrabooks, optical modules, printers, copiers
|
|
4G/LTE Base stations, 10/100/1000 Gb/s
|
|
Smartphones, tablets, wearables cameras, TVs, set top boxes
|
|
Measurement & instrumentation devices, automotive
|
|
Wireless and Sensing
|
|
4G/LTE wireless base stations
|
|
Smartphones, media players, tablets, digital/still video cameras
|
|
Automated meter readers, industrial automation, IoT, keyless entry, hearing aids
|
|
|
Power and High-Reliability
|
Servers, workstations, desktop PC/ notebooks
|
Routers/Switches
Network cards, routers and hubs, telecom network boards
|
Smartphones, tablets, wearables cameras, smart TVs, set top boxes
|
Power supplies, wireless charging, automotive, industrial systems, military, aerospace, medical
|
|||
Seasonality
Historically, our results have reflected some seasonality, with demand levels generally being slightly lower in the industrial and high-end consumer products end-markets during the first and fourth quarters of our fiscal year in comparison to the second and third quarters.
Intellectual Capital and Product Development
The development of IP and the resulting proprietary products is a critical success factor for us. Recruiting and retaining key technical talent is the foundation for designing, developing and selling this IP, in the form of new proprietary products, in the global marketplace. Our ability to recruit and retain our engineering talent is one of the keys to maintaining our competitive advantage. Historically, we have been successful in retaining our key engineering staff and recruiting new talent. One of our strategies to recruit this talent is the establishment of multiple design center locations. As a result, we have design centers throughout the world.
Circuit design engineers, layout engineers, product and test engineers, application engineers, and field application engineers are our most valuable employees. Together they perform the critical tasks of design and layout of ICs, turning these circuits into silicon devices, and conferring with customers about designing these devices into their applications. The majority of our engineers fit into one of these categories. Most of these engineers have many years of experience in the design, development and layout of circuits targeted for use in protection, advanced communications, power management and high-reliability, multimedia and data communications, and wireless and sensing applications. We also employ a number of software engineers and systems engineers that specialize in the development of software and systems architecture, who enable us to develop systems oriented products in select markets.
In fiscal year
2018
, we incurred
$104.8 million
of product development and engineering expense, which represents
18%
of net sales. Product development and engineering expense for fiscal years
2017
and
2016
were
$102.5 million
and
$113.7 million
, or
19%
and
23%
of net sales,
respectively.
We occasionally enter into agreements with customers that allow us to recover certain costs associated with product design and engineering services. Any recovery for these services is typically recognized upon completion of services, which historically lags behind the period in which we recognize expense. This difference in recognition timing can create volatility in our reported product development and engineering expenses.
9
Sales and Marketing
Net sales made directly to custome
rs during fiscal years
2018
,
2017
and
2016
, were approximately
34%
,
35%
and
42%
, of total net sales, respectively. The remaining
66%
,
65%
and
58%
of net sales were made through independent distributors. The decline in direct sales is related to substantially lower sales of our 40 Gbps and 100 Gbps long-haul transport products which were predominantly sold di
rectly to our end-customers. Additionally, we have expanded the diversity of products sold to our Korean customers and a higher percentage of these new product sales are being made through distribution. We have direct sales personnel located throughout the United States, Europe and Asia who manage the sales activities of independent sales representative firms and independent distributors. We expense our advertising costs as they are incurred.
We operate internationally through our foreign subsidiaries. Semtech (International) AG serves the European and Asian markets from its headquarters in Rapperswil, Switzerland and through its wholly-owned subsidiaries based in the United Kingdom and Japan. Semtech (International) AG also maintains branch offices, either directly or through one of its wholly-owned subsidiaries, in multiple countries, including China, Taiwan and South Korea. Semtech Canada Corporation serves the Canadian market for Gennum products, which are now part of the Signal Integrity Products Group, from its headquarters in Burlington, Ontario. Independent representatives and distributors are also used to serve customers throughout the world. Some of our distributors and sales representatives also offer products from our competitors, as is customary in the industry.
Customers, Sales Data and Backlog
As a result of the breadth of our products and markets, we have a broad and balanced range of customers.
Representative Customers by End-Markets:
|
Enterprise Computing
|
Industrial
|
High-End Consumer
|
Communications
|
|||
|
Alphabet Inc.
|
Honeywell Inc.
|
Huawei Technologies Co., Ltd.
|
Cisco Systems, Inc.
|
|||
|
Hewlett-Packard
|
Itron, Inc.
|
LG Electronics Inc.
|
Ericsson
|
|||
|
LuxNet Corp
|
Panasonic Corp
|
Quanta Computer
|
Huawei Technologies Co., Ltd.
|
|||
|
Oclaro, Inc.
|
Raytheon Company
|
Samsung Electronics Co., Ltd.
|
Samsung Electronics Co., Ltd.
|
|||
|
Samsung Electronics Co., Ltd.
|
Rockwell Automation
|
Sharp Corporation
|
ZTE Corporation
|
|||
|
Sumitomo Electric
|
Sharp Corporation
|
|||||
|
ZTE Corporation
|
Sonova International
|
|||||
|
Sony Corp
|
||||||
Our customers include major OEMs and their subcontractors in the enterprise computing, communications, high-end consumer and industrial end-markets. Our products are typically purchased by these customers for our performance, price, and/or technical support, as compared to our competitors.
During fiscal years
2018
,
2017
and
2016
, sales in the United States ("U.S.") contributed 9%, 9%
and 12%, r
espectively to our sales. Foreign sales constituted
91%
, 91%
and 88%
of our sales during fiscal years
2018
,
2017
and
2016
, respectively. Sales to customers located in Taiwan, South Korea, Japan, and China (including Hong Kong) comprised
6%
,
8%
,
5%
, and
51%
of our sales, respectively, in fiscal year
2018
. No other foreign country comprised more than 5% of sales in fiscal year
2018
. See Note
15
to our Consolidated Financial Statements included in Item 8 of this Annual Report on Form 10-K for additional financial information by geographic region. Additional information regarding certain risks associated with our international operations is provided under Item 1A. Risk Factors - Risks Relating to Our Business - Risks Relating to International Operations.
10
Sales by Region
A summary of net sales by region is as follows:
|
Fiscal Years
|
||||||||||||||||||||
|
(in thousands, except percentages)
|
2018
|
2017
|
2016
|
|||||||||||||||||
|
Asia-Pacific
|
$
|
439,342
|
|
75
|
%
|
$
|
412,167
|
|
76
|
%
|
$
|
358,480
|
|
74
|
%
|
|||||
|
Europe
|
43,580
|
|
7
|
%
|
43,378
|
|
8
|
%
|
85,587
|
|
17
|
%
|
||||||||
|
North America
|
121,144
|
|
21
|
%
|
94,123
|
|
17
|
%
|
46,152
|
|
9
|
%
|
||||||||
|
Other: Warrant Shares
|
(16,219
|
)
|
(3
|
)%
|
(5,396
|
)
|
(1
|
)%
|
—
|
|
—
|
%
|
||||||||
|
Total Net Sales
|
$
|
587,847
|
|
100
|
%
|
$
|
544,272
|
|
100
|
%
|
$
|
490,219
|
|
100
|
%
|
|||||
The following table sets forth the concentration of sales among the customers that accounted for more than 10% of our sales in at least one of the fiscal years
2018
,
2017
and
2016
:
Concentration of Net Sales - Significant Customers
|
Fiscal Years
|
||||||||
|
(percentage of net sales)
|
2018
|
2017
|
2016
|
|||||
|
Arrow Electronics (and affiliates)
|
11
|
%
|
10
|
%
|
9
|
%
|
||
|
Trend-tek Technology Ltd (and affiliates)
|
10
|
%
|
10
|
%
|
7
|
%
|
||
|
Samsung Electronics (and affiliates)
|
8
|
%
|
7
|
%
|
7
|
%
|
||
|
Premier Technical Sales Korea, Inc. (and affiliates)
(1)
|
6
|
%
|
4
|
%
|
3
|
%
|
||
(1)
Premier is a distributor with a concentration of sales to Samsung. The above percentages represent our estimate of the sales activity related to Samsung that is passing through this distributor.
Concentration of Accounts Receivable - Significant Customers
The Company did not have any customers that accounted for at least 10% of total net receivables as of
January 28, 2018
or
January 29, 2017
.
Backlog
Our backlog of orders as of the end of fiscal years
2018
,
2017
and
2016
was approximately
$102.9 million
,
$112.4 million
and
$84.2 million
, respectivel
y. The majority of our backlog is typically requested for delivery within six months. In markets where the end system life cycles are relatively short, customers typically request delivery in four to eight weeks. A backlog analysis at any given time gives little indication of our future business except on a short-term basis, principally within the next 45 days. We do not have any significant backlog with deliveries beyond 18 months.
Manufacturing Capabilities
Our strategy is to outsource most of our manufacturing functions to third-party foundries and assembly and test contractors. The third-party foundries fabricate silicon wafers, and the assembly and test contractors package and test our products. We believe this outsourcing permits us to take advantage of the best available technology, leverage the capital investment of others, and reduce our operating costs associated with manufacturing assets.
We perform a limited amount of internal probe and final test activities at our facilities in Camarillo, Irvine, and San Diego in California; Neuchâtel in Switzerland; and Reynosa in Mexico. These activities accommodate situations in which tight coupling with product design is desirable or where there are unique requirements. Our packaged discrete rectifier products are packaged and tested in-house in Reynosa, Mexico. Almost all of our other products are packaged and tested by outside subcontractors.
In keeping with our mostly "fabless" business model, we have no wafer fabrication facilities except for our operation in Reynosa, Mexico. For fiscal year
2018
, the Reynosa facility provided almost all of the silicon for our packaged discrete rectifier products, which were approxim
ately
2%
of our end product net sales. The remaining
98%
of our end products were supported with finished silicon wafers purchased from third-party wafer foundries in China, Taiwan, Israel and the U.S.
We anticipate that substantially all the silicon wafers we require will come from third-party foundries in fiscal year
2019
.
Despite our use of third-party wafer foundries for sourcing a majority of our silicon needs, we do maintain internal process development capabilities. Our process engineers work closely with our third-party foundries on the improvement and development of process capabilities. In fiscal year
2018
, we purchased the vast majority of our wafers from approximately four different third-party wafer foundries and used various manufacturing processes, including Bipolar, CMOS, RF-CMOS and Silicon Germanium ("SiGe") BiCMOS processes.
11
While we do have some redundancy of fabrication processes by using multiple third-party foundries, any interruption of supply by one or more of these foundries could materially impact us. As a result, we maintain some amount of business interruption insurance in part to help reduce the financial risk associated with a wafer supply interruption, but we are not fully insured against this risk.
Although our products are made from basic materials (principally silicon, metals and plastics), all of which are available from a number of suppliers, capacity at wafer foundries sometimes becomes constrained. The limited availability of certain materials, such as silicon wafer substrates, may impact our suppliers’ ability to meet our demand needs or impact the price we are charged. The prices of certain other basic materials, such as metals, gases and chemicals used in the production of ICs can exhibit price volatility depending on the changes in demand for these basic commodities. In most cases we do not procure these materials ourselves, but we are nevertheless reliant on these materials for producing our products because our third-party foundry and package and test subcontractors must procure them. To help minimize risks associated with constrained capacity, we use multiple foundries and have taken other steps to prevent supply interruptions at certain foundries and subcontractors.
In fiscal years
2018
,
2017
, and
2016
, a Chinese foundry provid
ed
20%
,
25%
and
28%
of our total silicon requirements in terms of cost of wafers purchased, respectively. We have consigned certain equipment to this foundry to support our specialized processes run at the foundry and to ensure a specified level of capacity over the next few years. While the provision of these assets to the wafer foundry may be factored into certain pricing arrangements with the foundry, the impact of any pricing adjustments is insignificant and does not impact our margin trends.
We use third-party subcontractors to perform almost all of
our assembly and test operations. A majority of our assembly and test activity is conducted by third-party subcontractors based in China, Malaysia, Taiwan, Thailand, South Korea and the Philippines. We have operations offices located in the Philippines, Malaysia and China
that support and coordinate some of the worldwide shipment of products. We have installed our own test equipment at some of our packaging and testing subcontractors in order to ensure a certain level of capacity, assuming the subcontractor has ample employees to operate the equipment.
Our arrangements with both third-party wafer foundries and package and test subcontractors are designed to provide some assurance of capacity but are not expected to assure access to all the manufacturing capacity we may need in the future.
Competition
The analog, mixed-signal semiconductor and advanced algorithms industries are highly competitive, and we expect competitive pressures to continue. Our ability to compete effectively and to expand our business will depend on our ability to continue to recruit and retain key engineering talent, our ability to execute on new product developments, and our ability to persuade customers to design these new products into their applications.
Our industry is characterized by decreasing unit selling prices over the life of a product as the volumes typically increase. However, price decreases can sometimes be quite rapid and faster than the rate of increase of the associated product volumes. We believe we compete effectively based upon our ability to capitalize on efficiencies and economies of scale in production and sales, and our ability to maintain or improve our productivity and product yields to reduce manufacturing costs.
We are in direct and active competition, with respect to one or more of our product lines, with numerous manufacturers of varying size, technical capability and financial strength. A number of these competitors are dependent on semiconductor products as their principal source of income, and some are much larger and better resourced than we are. The number of competitors has grown due to expansion of the market segments in which we participate. Additionally, there has been a trend toward consolidation in our industry as companies attempt to strengthen or hold their market positions in an evolving industry. Such consolidations may make it more difficult for us to compete effectively, including on the basis of price, sales and marketing programs, channel coverage, technology or product functionality.
We consider our primary competitors with respect to our Protection products to include STMicroelectronics, Nexperia, ON Semiconductor Corporation and Infineon Technologies AG. Our primary competitors with respect to our Signal Integrity products are Texas Instruments Incorporated, Maxim Integrated Products, Inc., MACOM Technology Solutions Holdings, Inc., Inphi Corporation, Broadcom Limited and our customers' own internal solutions. With respect to our Power and High-Reliability products, we consider our primary competitors to include Texas Instruments Incorporated, Maxim Integrated Products Inc., Microsemi Corporation and Monolithic Power Systems. Our primary competitors with respect to our Wireless and Sensing products include Silicon Laboratories, Texas Instruments Incorporated, Analog Devices Inc., Cypress Semiconductor Corp and Huawei Technologies Co., Ltd.
12
Intellectual Property and Licenses
We have been granted
212
U.S. patents and
88
foreign patents and have numerous patent applications pending with respect to our products and to technologies associated with our business. The expiration dates of issued patents range from 2018 to 2036. Although we consider patents to be helpful in maintaining a competitive advantage, we do not believe they create definitive competitive barriers to entry. There can be no assurance that our patent applications will lead to issued patents, that others will not develop or patent similar or superior products or technologies, or that our patents will not be challenged, invalidated, or circumvented by others.
We have no revenue from patents that expire in calendar year 2018 and no material revenue associated with patents that expire in 2019 or 2020.
We have registered many of our trademarks in the U.S. and in various foreign jurisdictions. Registration generally provides rights in addition to basic trademark protections and is typically renewable upon proof of continued use. We have registered, or are in the process of registering, our SEMTECH trademark in many jurisdictions. In one location use of this trademark is prohibited, but we are permitted to use our Semtech International trade name. This restriction has not had a material impact on our business to date and we do not anticipate it will have a material impact in the future.
We also have registered certain materials in which we have copyright ownership, which provides additional protection for this intellectual property.
Employees
As of
January 28, 2018
, we had 1,282 full-time employees. There were 504 employees in research and development, 248 in sales, marketing and field services, and 187 in general, administrative and finance. The remaining employees support operational activities, including product and test engineering, assembly, manufacturing, distribution and quality functions.
We have not had a work stoppage in the last decade and the only unionized employees are approximately 186 Mexican nationals who work at our
manufacturing facility in Reynosa, Mexico. Our employee relations during the last fiscal year have been, and remain, satisfactory.
We adjust our workforce from time to time to meet the changing needs of our business. Competition for key design engineering talent globally is significant.
Government Regulations and Environmental Matters
We are required to comply, and it is our policy to comply, with numerous government regulations that are normal and customary to businesses in our industry and that operate in our markets and operating locations.
Our sales that serve the military and aerospace markets primarily consist of our High-Reliability products that have been qualified to be sold in these markets by the U.S. Department of Defense ("DOD"). In order to maintain these qualifications, we must comply with certain specifications promulgated by the DOD. As part of maintaining these qualifications, we are routinely audited by the DOD. Based on current specifications, we believe we can maintain our qualifications for the foreseeable future. However, these specifications could be modified by the DOD in the future or we could become subject to other government requirements, which could make the manufacturing of these products more difficult and thus could adversely impact our profitability in the Power and High-Reliability product group. In fiscal year
2018
, our sales that serve military and aerospace markets made up 2% of net sales. The U.S. State Department has determined that a small number of special assemblies from the Power and High-Reliability product line are subject to the International Traffic in Arms Regulations ("ITAR"). We have a Technical Assistance Agreement in place that permits us to assemble certain of these products in Mexico. International shipments of products subject to ITAR require a State Department license.
For further discussion related to environmental matters, see Note
13
to our Consolidated Financial Statements included in Item 8 of this Annual Report on Form 10-K.
Available Information
General information about us can be found on our website at
www.semtech.com
. The information on our website is for informational purposes only and should not be relied on for investment purposes. The information on our website is not incorporated by reference into this Annual Report on Form 10-K and should not be considered part of this or any other report filed with the SEC.
We make available free of charge, either by direct access on our website or a link to the SEC website, our annual report on Form 10-K, quarterly reports on Form 10-Q, current reports on Form 8-K and amendments to those reports filed or furnished pursuant to Section 13(a) or 15(d) of the Securities Exchange Act of 1934, as amended (the "Exchange Act"), as soon as reasonably practicable after such reports are electronically filed with, or furnished to, the SEC. Our reports filed with, or furnished to, the SEC are also available directly at the SEC’s website at www.sec.gov.
13
|
Item 1A.
|
Risk Factors
|
You should carefully consider and evaluate all of the information in this Annual Report on Form 10-K, including the risk factors listed below. The risks described below are not the only ones facing our Company. Additional risks not now known to us or that we currently deem immaterial may also impair our business operations. If any of these risks actually occur, our business could be materially harmed. If our business is harmed, the trading price of our common stock could decline.
As discussed earlier in "Special Note Regarding Forward-Looking and Cautionary Statements," this Annual Report on Form 10-K contains forward-looking statements that involve risks and uncertainties. Our actual results could differ materially from those anticipated in these forward-looking statements as a result of such risks and uncertainties and certain factors including the risks faced by us described below and elsewhere in this Annual Report on Form 10-K, including, without limitation, information under the section "Management's Discussion and Analysis of Financial Condition and Results of Operations" and additional factors that accompany the related forward-looking statements in this Annual Report on Form 10-K, in the Company's other filings with the SEC, and in material incorporated herein and therein by reference. In light of the significant risks and uncertainties inherent in the forward-looking information included herein that may cause actual performance and results to differ materially from those predicted, any such forward-looking information should not be regarded as representations or guarantees by the Company of future performance or results, or that its objectives or plans will be achieved or that any of its operating expectations or financial forecasts will be realized. Reported results should not be considered an indication of future performance. Investors are cautioned not to place undue reliance on any forward-looking information contained herein, which reflect management's analysis only as of the date hereof. Except as required by law, the Company assumes no obligation to publicly release the results of any update or revision to any forward-looking statements that may be made to reflect new information, events or circumstances after the date hereof or to reflect the occurrence of unanticipated or future events, or otherwise.
Risks Relating to General Business Conditions
Our future results may fluctuate, fail to match past performance or fail to meet expectations.
Our results may fluctuate in the future, may fail to match our past performance or fail to meet our expectations and the expectations of analysts and investors. Our results and related ratios, such as gross margin, operating income percentage and effective tax rate may fluctuate as a result of:
|
•
|
general economic conditions in the countries where we sell our products;
|
|
•
|
seasonality and variability in the computer market and our other end-markets;
|
|
•
|
the timing of new product introductions by us, our customers and our competitors;
|
|
•
|
product obsolescence;
|
|
•
|
the scheduling, rescheduling or cancellation of orders by our customers;
|
|
•
|
the cyclical nature of demand for our customers’ products;
|
|
•
|
our ability to predict and meet evolving industry standards and consumer preferences;
|
|
•
|
our ability to develop new process technologies and achieve volume production;
|
|
•
|
our ability to integrate and realize synergies from recent acquisitions;
|
|
•
|
changes in manufacturing yields;
|
|
•
|
capacity utilization;
|
|
•
|
product mix and pricing;
|
|
•
|
movements in exchange rates, interest rates or tax rates;
|
|
•
|
the availability of adequate supply commitments from our outside suppliers;
|
|
•
|
the manufacturing and delivery capabilities of our subcontractors; and
|
|
•
|
litigation and regulatory matters.
|
As a result of these factors, our past financial results are not necessarily indicative of our future results.
14
Downturns in the business cycle could adversely affect our revenues and profitability.
The semiconductor industry is highly cyclical and has experienced significant downturns, which are characterized by reduced product demand, production overcapacity, increased levels of inventory, industry-wide fluctuations in the demand for semiconductors and the significant erosion of average selling prices. The cyclical nature of the semiconductor industry may cause us to experience substantial period-to-period fluctuations in our operating results. The growth rate of the global economy is one of the factors affecting demand for semiconductor components. Many factors could adversely affect regional or global economic growth including increased price inflation for goods, services or materials, rising interest rates in the U.S. and the rest of the world, or tight credit markets. In addition, economic slowdowns may also affect our customers’ ability to pay for our products. Accordingly, economic slowdowns may harm our business.
The average selling prices of products in our markets have historically decreased rapidly and will likely do so in the future, which could harm our revenue and gross margins.
As is typical in the semiconductor industry, the average selling price of a particular product has historically declined significantly over the life of the product. In the past, we have reduced the average selling prices of our products in anticipation of future competitive pricing pressures, new product introductions by us or our competitors and other factors. We expect that we will have to similarly reduce prices in the future for older generations of products. Reductions in our average selling prices to one customer could also impact our average selling prices to all customers. A decline in average selling prices would harm our gross margins for a particular product. If not offset by sales of other products with higher gross margins, our overall gross margins may be adversely affected. Our business, results of operations, financial condition and prospects will suffer if we are unable to offer any reductions in our average selling prices by increasing our sales volumes, reducing our costs and developing new or enhanced products on a timely basis, with higher selling prices or gross margins.
Current global economic conditions and the potential changes in global economic policy, including the North American Free Trade Agreement, or NAFTA, and the Trans-Pacific Partnership, or TPP, could reduce demand for our products.
Uncertainty about global economic conditions can pose a risk to the overall economy by causing fluctuations to and reductions in consumer and commercial spending. Demand for our products could be different from our expectations due to many factors including changes in business and economic conditions, conditions in the credit market that affect consumer confidence, customer acceptance of our products, changes in customer order patterns, including order cancellations, and changes in the level of inventory held by vendors. In particular, in fiscal year
2018
, sales to customers in China comprised
51%
of our net sales. The recent economic slowdown in China could adversely affect our sales to customers in China and consequently, our business, operating results and financial condition.
Further, changes in U.S. and global social, political, regulatory and economic conditions or in laws and policies governing foreign trade, manufacturing, development and investment could adversely affect our business. For instance, significant changes to foreign trade policy, including NAFTA and TPP and potential increases on tariffs of goods imported into the U.S. could have a significant impact on the demand for end products that incorporate our components, which may reduce our sales.
Business interruptions could harm our business.
Our corporate headquarters, a portion of our assembly and research and development activities and certain other critical business operations are located near major earthquake fault lines. We do not maintain earthquake insurance and our business could be harmed in the event of a major earthquake. We generally do not maintain flood coverage, including for our Asian locations where certain of our operations support and sales offices are located. Such flood coverage has become very expensive; as a result we have elected not to purchase this coverage. If one of these locations were to experience a major flood, our business may be harmed.
Our business could be harmed if natural disasters interfere with production of wafers by our suppliers, with assembly and testing of products by our subcontractors, or with our distribution network. We maintain some business interruption insurance to help reduce the effect of such business interruptions, but we are not fully insured against such risks. Likewise, our business could be adversely impacted if a natural disaster were to shut down or significantly curtail production by one or more of our end customers. Any such loss of revenue due to a slowdown or cessation of end customer demand is uninsured.
When natural disasters such as an earthquake or other causes result in wide-spread destruction, the impact on our business may not be readily apparent. This is especially true when trying to assess the impact of the disaster on our end customers, who themselves may not fully understand the impact of the event on their businesses. The full extent and scope of natural disaster impacts, both in terms of direct impact on us and our supply chain, as well as on our end customers (to include their own supply chain issues as well as end-market issues), may not be known for a considerable period of time following the disaster. When any such natural disaster occurs, there can be no assurance that our operating results may not be materially affected as a result of the impact of the disaster on us or on our end customers.
We rely on third party freight firms for nearly all of our shipments from vendors to assembly and test sites, primarily in Asia, and for shipments of our final product to customers. This includes ground and air transportation. Any significant disruption of
15
such freight business globally or in certain parts of the world, particularly where our operations are concentrated, could materially and adversely affect our ability to generate revenues. Business interruption insurance may not provide enough protection to compensate us for losses that may occur. Accordingly, any of these disruptions could significantly harm our business.
Terrorist attacks, wars and other acts of violence, or any other national or international crisis, calamity or emergency, may result in interruption to the business activities of many entities, business losses and overall disruption of the economy at many levels. These events may directly impact our physical facilities or those of our customers and suppliers. Additionally, these events or armed conflicts may cause some of our customers or potential customers to reduce the level of expenditures on their services and products that ultimately may reduce our revenue. The consequences of these reductions are unpredictable, and we may not be able to foresee events that could have an adverse effect on our business. For example, as a result of these events, insurance premiums for businesses may increase and the scope of coverage may be decreased. Consequently, we may not be able to obtain adequate insurance coverage for our business and properties. To the extent that these disruptions result in delays or cancellations of customer orders, a general decrease in corporate spending, or our inability to effectively market our services and products, our business and operating results could be harmed.
We operate a manufacturing facility in Reynosa, Mexico. Historically, certain regions in Mexico have experienced high levels of violence. Any significant disruption of our operations at this facility could materially affect our ability to generate revenues for certain products within our High-Reliability product line. Some of the products that we produce at this facility require certification by the Defense Contract Audit Agency ("DCAA"). Failure to secure or maintain the required certification, either directly through the DCAA or through a qualifying third party would materially affect our authorization to manufacture applicable products at this facility, and our revenue for certain products within our Power and High-Reliability products line could materially decline. An audit was performed in May 2012 by the Defense Logistics Agency ("DLA") Land and Maritime office, which is the DOD agency having oversight responsibility for applicable products manufactured in this facility. We received a letter of certification allowing us to continue producing High-Reliability products in 2013. The applicable certification will maintain our listing on the DOD Qualified Parts List as a MIL-PRF-19500 Semiconductor Manufacturer of JAN, JANTX, JANTXV and JANS quality level components. The DLA has indicated, barring any unforeseen circumstances, that our next surveillance audit may occur in late
2018
.
A large percentage of our sales are to customers located in Asia and a large percentage of our products are manufactured in Asia. One of our largest customer bases in Asia is located in Taiwan. An outbreak of severe acute respiratory syndrome (SARS) or other health related issues, such as an avian influenza (bird flu) pandemic, could have a negative impact on consumer demand, on travel needed to secure new business or manage our operations, on transportation of our products from our suppliers or to our customers, or on workers needed to sell or manufacture our products or our customers’ products.
Risks Relating to Production Operations
We obtain many essential components and materials and certain critical manufacturing services from a limited number of suppliers and subcontractors, most of which are foreign-based entities.
Our reliance on a limited number of subcontractors and suppliers for wafers, packaging, testing and certain other processes involves several risks, including potential inability to obtain an adequate supply of required components and reduced control over the price, timely delivery, reliability and quality of components. These risks are attributable to several factors, including limitations on resources, labor problems, equipment failures or the occurrence of natural disasters. The good working relationships we have established with our suppliers and subcontractors could be disrupted, and our supply chain could suffer, if a supplier or subcontractor were to experience a change in control. There can be no assurance that problems will not occur in the future with suppliers or subcontractors. Disruption or termination of our supply sources or subcontractors could significantly delay our shipments and harm our business. Delays could also damage relationships with current and prospective customers. Any prolonged inability to obtain timely deliveries or quality manufacturing or any other circumstances that would require us to seek alternative sources of supply or to manufacture or package certain components internally could limit our growth and harm our business.
We are subject to risk from fluctuating market prices of certain commodity raw materials, particularly gold, that are incorporated into our end products or used by our suppliers to process our end products. Increased commodity prices are passed on to us in the form of higher prices from our suppliers, either in the form of general price increases or commodity surcharges. Although we generally deal with our suppliers on a purchase order basis rather than on a long-term contract basis, we generally attempt to obtain firm pricing for volumes consistent with planned production. Our gross margins may decline if we are not able to increase selling prices of our products or obtain manufacturing efficiencies to offset the increased cost. We do not enter into formal hedging arrangements to mitigate against commodity risk.
Most of our third-party subcontractors and suppliers, including foundries that supply silicon wafers, are located in foreign countries, including China, Taiwan and Israel. For fiscal year
2018
, approximately
20%
of our silicon in terms of cost of wafers, was supplied by a third-party foundry in China, and this percentage could be even higher in future periods. For fiscal
16
years
2017
and
2016
, approximately
25%
and
28%
of our silicon in terms of cost of wafers was supplied by this third-party foundry in China, respectively. While our utilization of multiple third-party foundries does create some redundancy of fabrication processes, any interruption of supply by one or more of these foundries could materially impact us. We maintain some amount of business interruption insurance to help reduce the risk of wafer supply interruption, but we are not fully insured against such risk.
A majority of our package and test operations are performed by third-party contractors based in Malaysia, South Korea, Taiwan, Thailand, the Philippines and China. Our international business activities, in general, are subject to a variety of potential risks resulting from political and economic uncertainties. Any political turmoil or trade restrictions in these countries, particularly China, could limit our ability to obtain goods and services from these suppliers and subcontractors. The effect of an economic crisis or political turmoil on our suppliers located in these countries may impact our ability to meet the demands of our customers. If we find it necessary to transition the goods and services received from our existing suppliers or subcontractors to other firms, we would likely experience an increase in production costs and a delay in production associated with such a transition, both of which could have a significant negative effect on our operating results, as these risks are substantially uninsured.
Our products may be found to be defective, product liability claims may be asserted against us and we may not have sufficient liability insurance.
Manufacturing semiconductors is a highly complex and precise process, requiring production in a tightly controlled, clean environment. Minute impurities in our manufacturing materials, contaminants in the manufacturing environment, manufacturing equipment failures, and other defects can cause our products to be non-compliant with customer requirements or otherwise nonfunctional. We face an inherent business risk of exposure to warranty and product liability claims in the event that our products fail to perform as expected or such failure of our products results, or is alleged to result, in bodily injury or property damage (or both). Since a defect or failure in our product could give rise to failures in the goods that incorporate them (and consequential claims for damages against our customers from their customers), we may face claims for damages that are disproportionate to the revenues and profits we receive from the products involved.
Our general warranty policy provides for repair or replacement of defective parts. In some cases, a refund of the purchase price is offered. In certain instances, we have agreed to other warranty terms, including some indemnification provisions, which could prove to be significantly more costly than repair, replacement or refund. We attempt to limit our liability through our standard terms and conditions and negotiation of sale and other customer contracts, but there is no assurance that such limitations will be accepted or effective. While we maintain some insurance for such events, a successful warranty or product liability claim against us in excess of our available insurance coverage, if any, and established reserves, or a requirement that we participate in a product recall, would have adverse effects (that could be material) on our business, operating results and financial condition. Additionally, in the event that our products fail to perform as expected, our reputation may be damaged, which could make it more difficult for us to sell our products to existing and prospective customers and could adversely affect our business, operating results and financial condition.
Obsolete inventories as a result of changes in demand for our products and change in life cycles of our products could adversely affect our business, operating results and financial condition.
The life cycles of some of our products depend heavily upon the life cycles of the end-products into which our products are designed. End-market products with short life cycles require us to manage closely our production and inventory levels. Inventory may also become obsolete because of adverse changes in end-market demand. We may in the future be adversely affected by obsolete or excess inventories, which may result from unanticipated changes in the estimated total demand for our products or the estimated life cycles of the end-products into which our products are designed. In addition, some customers restrict how far back the date of manufacture for our products can be and certain customers may stop ordering products from us and go out of business due to adverse economic conditions; therefore, some of our product inventory may become obsolete and, thus, adversely affect our business, operating results and financial condition.
Risks Relating to Research and Development, Engineering, Intellectual Property and New Technologies
We may be unsuccessful in developing and selling new products, which is central to our objective of maintaining and expanding our business.
We operate in a dynamic environment characterized by price erosion, rapid technological change, and design and other technological obsolescence. Our competitiveness and future success depend on our ability to predict and adapt to these changes in a timely and cost-effective manner by designing, developing, manufacturing, marketing and providing support for our own new products and technologies.
A failure to achieve design wins, to introduce these new products in a timely manner, or to achieve market acceptance for these products on commercially reasonable terms could harm our business.
17
The introduction of new products presents significant business challenges because product development commitments and expenditures must be made well in advance of product sales. The success of a new product depends on accurate forecasts of long-term market demand and future technological developments, as well as on a variety of specific implementation factors, including:
|
•
|
timely and efficient completion of technology, product and process design and development;
|
|
•
|
timely and efficient implementation of manufacturing, assembly, and test processes;
|
|
•
|
the ability to secure and effectively utilize fabrication capacity in different geometries;
|
|
•
|
product performance;
|
|
•
|
product quality and reliability; and
|
|
•
|
effective marketing, sales and service
|
Even if we are able to develop products and achieve design wins, the design wins may never generate revenues if end-customer projects are unsuccessful in the marketplace or the end-customer terminates the project, which may occur for a variety of reasons. Mergers and consolidations among customers may lead to termination of certain projects before the associated design win generates revenue. If design wins do generate revenue, the time lag between the design win and meaningful revenue can be uncertain and could be significant. If we fail to develop products with required features or performance standards or experience even a short delay in bringing a new product to market, or if our customers fail to achieve market acceptance of their products, our business, financial condition and operating results could be materially and adversely impacted.
Our customers require our products to undergo a lengthy and expensive qualification process without any assurance of product sales.
Prior to purchasing our products, our customers require that our products undergo an extensive qualification process, which involves testing of the products in the customer's system as well as rigorous reliability testing. This qualification process may continue for six months or longer. However, qualification of a product by a customer does not ensure any sales of the product to that customer. Even after successful qualification and sales of a product to a customer, a subsequent revision to the product or software, changes in the manufacturing process or the selection of a new supplier by us may require a new qualification process, which may result in delays and in us holding excess or obsolete inventory. After our products are qualified, it can take an additional six months or more before the customer commences volume production of components or devices that incorporate our products. Despite these uncertainties, we devote substantial resources, including design, engineering, sales, marketing and management efforts, toward qualifying our products with customers in anticipation of sales. If we are unsuccessful or delayed in qualifying any of our products with a customer, such failure or delay would preclude or delay sales of such product to the customer, which may impede our growth and cause our business to suffer.
Our products may fail to meet new industry standards or requirements and the efforts to meet such industry standards or requirements could be costly
.
Many of our products are based on industry standards that are continually evolving. Our ability to compete in the future will depend in part on our ability to anticipate, identify and ensure compatibility or compliance with these evolving industry standards. The emergence of new industry standards could render our products incompatible with products developed by our customers and potential customers. As a result, we could be required to invest significant time and effort and to incur significant expense to redesign our products to ensure compliance with relevant standards. If our products are not in compliance with prevailing industry standards or requirements, we could miss opportunities to achieve crucial design wins which in turn could have a material adverse effect on our business, operating results and financial conditions.
We may be unable to adequately protect our intellectual property rights.
We pursue patents for some of our new products and unique technologies, but we rely primarily on trade secret protections through a combination of nondisclosure agreements and other contractual provisions, as well as our employees’ commitment to confidentiality and loyalty, to protect our know-how and processes. We intend to continue protecting our proprietary technology, including through trademark and copyright registrations and patents. Despite this intention, we may not be successful in achieving adequate protection. Our failure to adequately protect our material know-how and processes could harm our business. There can be no assurance that the steps we take will be adequate to protect our proprietary rights, that our patent applications will lead to issued patents, that others will not develop or patent similar or superior products or technologies, or that our patents will not be challenged, invalidated, or circumvented by others. Furthermore, the laws of the countries in which our products are or may be developed, manufactured or sold may not protect our products and intellectual property rights to the same extent as laws in the U.S.
18
We may suffer losses and business interruption if our products infringe the intellectual property rights of others.
The semiconductor industry is characterized by frequent claims of infringement and litigation regarding patent and other intellectual property rights. Due to the number of competitors, intellectual property infringement is an ongoing risk since other companies in our industry could have intellectual property rights that may not be identifiable when we initiate development efforts. Litigation may be necessary to enforce our intellectual property rights and we may have to defend ourselves against infringement claims. Any such litigation could be very costly and may divert our management’s resources. If one of our products is found to infringe on a third party’s rights, we may have liability for past infringement and may need to seek a license to use such intellectual property going forward. If a license is not available or if we are unable to obtain a license on terms acceptable to us, we would either have to change our product so that it does not infringe or stop making the product.
We must commit resources to product production prior to receipt of purchase commitments and could lose some or all of the associated investment.
Sales are made primarily on a current delivery basis, pursuant to purchase orders that may be revised or cancelled by our customers without penalty, rather than pursuant to long-term contracts. Some contracts require that we maintain inventories of certain products at levels above the anticipated needs of our customers. As a result, we must commit resources to the production of products without binding purchase commitments from customers. Our inability to sell products after we devote significant resources to them could harm our business.
Risks Relating to International Operations
We sell and trade with foreign customers, which subjects our business to increased risks.
Sales to foreign customers accounted for approximately 91% of net sales in the fiscal year ended
January 28, 2018
. Sales to our customers located in China (including Hong Kong) and South Korea constituted
51%
and
8%
, respectively, of net sales for fiscal year
2018
. International sales are subject to certain risks, including unexpected changes in regulatory requirements, tariffs and other barriers, political and economic instability, difficulties in accounts receivable collection, difficulties in managing distributors and representatives, difficulties in staffing and managing foreign subsidiary and branch operations and potentially adverse tax consequences. Other risks include local business and cultural factors that may differ from our domestic standards and practices, including business practices from which we are prohibited from engaging by the Foreign Corrupt Practices Act and other anti-corruption laws and regulations, laws of certain foreign countries that may not protect our products, assets or intellectual property rights to the same extent as do U.S. laws, and difficulties enforcing contracts in such foreign countries generally. These factors may harm our business. Our use of the Semtech name may be prohibited or restricted in some countries, which may negatively impact our sales efforts. In addition, substantially all of our foreign sales are denominated in U.S. dollars and currency exchange fluctuations in countries where we do business could harm us by resulting in pricing that is not competitive with prices denominated in local currencies.
Our foreign currency exposures may change over time as the level of activity in foreign markets grows and could have an adverse impact upon financial results.
As a global enterprise, we face exposure to adverse movements in foreign currency exchange rates. Certain of our assets, including certain bank accounts, exist in non-U.S. dollar-denominated currencies, which are sensitive to foreign currency exchange rate fluctuations. The non-U.S. dollar-denominated currencies are principally the Swiss Franc, Euro, Canadian dollars, Mexican Peso, Japanese Yen and British Pound Sterling. We also have a significant number of employees that are paid in foreign currency, the largest groups being United Kingdom-based employees who are paid in British Pound Sterling, Swiss-based employees who are paid in Swiss Francs, Canada-based employees who are paid in Canadian dollars, and Mexican nationals who are paid in Mexican Pesos.
If the value of the U.S. dollar weakens relative to these specific currencies, as it has done in recent years, the cost of doing business in terms of U.S. dollars rises. With the growth of our international business, our foreign currency exposures may grow and under certain circumstances, could harm our business.
As a means of managing our foreign exchange exposure, we routinely convert U.S. dollars into foreign currency in advance of the expected payment. We regularly assess whether or not to hedge foreign exchange exposure. Any future use of forward contracts to hedge foreign exchange exposure may be required to be marked-to-market each quarter and can create volatility in net income not directly tied to our operating results.
We may be subject to increased tax liabilities and an increased effective tax rate if we need to repatriate funds held by our foreign subsidiaries.
As of
January 28, 2018
, we did not provide income and withholding taxes for
$453.6 million
("Untaxed Funds") of our total $693.6 million of foreign subsidiaries total foreign earnings. If we needed these Untaxed Funds for investment in our domestic operations, any repatriation, could result in increased tax liabilities and a higher effective tax rate.
19
We are subject to export restrictions and laws affecting trade and investments.
As a global company headquartered in the U.S., we are subject to U.S. laws and regulations that limit and restrict the export of some of our products and services and may restrict our transactions with certain customers, business partners and other persons, including, in certain cases, dealings with or between our employees and subsidiaries. In certain circumstances, export control and economic sanctions regulations may prohibit the export of certain products, services and technologies, and in other circumstances we may be required to obtain an export license before exporting the controlled item. Compliance with these laws has not significantly limited our operations or our sales in the recent past, but could significantly limit them in the future. We maintain an export compliance program but there are risks that the compliance controls could be circumvented, exposing us to legal liabilities. We must also comply with export restrictions and laws imposed by other countries affecting trade and investments. Although these restrictions and laws have not significantly restricted our operations in the recent past, there is a risk that they could do so in the future.
For example, on March 8, 2016, the U.S. Department of Commerce published a final rule in the Federal Register that amended the Export Administration Regulations by adding ZTE Corporation ("ZTE") and three of its affiliates to the “Entity List” for actions contrary to the national security and foreign policy interests of the U.S. This rule imposed new export licensing requirements on exports, reexports, and in-country transfers of all U.S.-regulated products, software and technology to the designated ZTE entities, which had the practical effect of preventing us from making any sales to ZTE. On March 24, 2016, the U.S. Department of Commerce issued a temporary general license suspending the enhanced export licensing requirements for ZTE and one of its designated affiliates through June 30, 2016, thereby enabling us to resume sales to ZTE. The temporary license was repeatedly extended until the Bureau of Industry and Security removed ZTE from the Entity List on May 29, 2017, after ZTE entered a guilty plea and agreed to pay a combined penalty of up to $1.19 billion to settle civil and criminal allegations against it. This or future regulatory activity may materially interfere with our ability to make sales to ZTE or other customers.
In addition, our association with customers that are or become subject to U.S. regulatory scrutiny or export restrictions could subject us to actual or perceived reputational harm among current or prospective investors, suppliers or customers, customers of our customers, other parties doing business with us, or the general public. Any such reputational harm could result in the loss of investors, suppliers or customers, which could harm our business, financial condition, operating results or prospects.
Risks Relating to Sales, Marketing and Competition
We compete against larger, more established entities and our market share may be reduced if we are unable to respond to our competitors effectively.
The semiconductor industry is intensely competitive and is characterized by price erosion, rapid technological change, and design and other technological obsolescence. We compete with domestic and international semiconductor companies, many of which have substantially greater financial and other resources with which to pursue engineering, manufacturing, marketing and distribution of their products. We consider our primary competitors with respect to our Protection Products to include STMicroelectronics, Nexperia, ON Semiconductor Corporation and Infineon Technologies AG. Our primary competitors with respect to our Signal Integrity Products are Texas Instruments Incorporated, Maxim Integrated Products, Inc., MACOM Technology Solutions Holdings, Inc., Inphi Corporation, Broadcom Limited, Applied Micro Circuits Corporation and our customers' own internal solutions. With respect to our Power and High-Reliability products, we consider our primary competitors to include Texas Instruments Corporation, Maxim Integrated Products Inc., Microsemi Corporation and Monolithic Power Systems. Our primary competitors with respect to our Wireless and Sensing products include Silicon Laboratories, Texas Instruments Incorporated, Atmel Corporation, Analog Devices, Inc. Cypress Semiconductor Corporation and Huawei Technologies Co., Ltd.
We expect continued competition from existing competitors as well as competition from new entrants in the semiconductor market. Our ability to compete successfully in the rapidly evolving area of integrated circuit technology depends on several factors, including:
|
•
|
success in designing and manufacturing new products that implement new technologies;
|
|
•
|
protection of our processes, trade secrets and know-how;
|
|
•
|
maintaining high product quality and reliability;
|
|
•
|
pricing policies of our competitors;
|
|
•
|
performance of competitors’ products;
|
|
•
|
ability to deliver in large volume on a timely basis;
|
|
•
|
marketing, manufacturing and distribution capability; and
|
|
•
|
financial strength.
|
20
To the extent that our products achieve market success, competitors typically seek to offer competitive products or lower prices; if they are successful, they could harm our business.
Industry consolidation may lead to increased competition and may harm our operating results.
There has been a trend toward industry consolidation in our industry as companies attempt to strengthen or hold their market positions in an evolving industry and as companies are acquired or are unable to continue operations. Some of our competitors have made acquisitions or entered into partnerships or other strategic relationships to offer a more comprehensive solution than they individually had offered. Such consolidations or strategic partnerships may continue in the future. The companies or alliances resulting from these possible consolidations may create more compelling bundled products as well as being able to offer greater pricing flexibility, making it more difficult for us to compete effectively, including on the basis of price, sales and marketing programs, channel coverage, technology or product functionality. Continued industry consolidation may adversely impact customers' perceptions of the viability of smaller and even medium-sized semiconductor companies such as ourselves and, consequently, customers' willingness to purchase from us. We believe that industry consolidation may result in stronger competitors, with more efficient cost structures that are better able to compete as sole-source vendors for our end-customers. This could lead to more variability in our operating results and could have a material adverse effect on our business, operating results and financial condition.
We receive a significant portion of our revenues from a small number of customers and the loss of any one of these customers or failure to collect a receivable from them could adversely affect our business.
Our largest customers have varied from year to year. Historically, we have had significant customers that individually accounted for 10% or more of consolidated revenues in certain quarters or years or represented 10% or more of net accounts receivables at any given date. The table below sets forth those customers representing greater than 10% of net sales for one more of fiscal years
2018
,
2017
and
2016
.
Concentration of Net Sales - Significant Customers
|
Fiscal Years
|
||||||||
|
(percentage of net sales)
|
2018
|
2017
|
2016
|
|||||
|
Arrow Electronics (and affiliates)
|
11
|
%
|
10
|
%
|
9
|
%
|
||
|
Trend-tek Technology Ltd (and affiliates)
|
10
|
%
|
10
|
%
|
7
|
%
|
||
|
Samsung Electronics (and affiliates)
|
8
|
%
|
7
|
%
|
7
|
%
|
||
|
Premier Technical Sales Korea, Inc. (and affiliates)
(1)
|
6
|
%
|
4
|
%
|
3
|
%
|
||
(1)
Premier is a distributor with a concentration of sales to Samsung. The above percentages represent our estimate of the sales activity related to Samsung that is passing through this distributor.
Concentration of Accounts Receivable - Significant Customers
The Company did
not
have any customers that accounted for at least 10% of total net receivables as of
January 28, 2018
or
January 29, 2017
.
Sales to our customers are generally made on open account, subject to credit limits we may impose, and the receivables are subject to the risk of being uncollectible.
The volatility of customer demand limits our ability to predict future levels of sales and profitability.
We primarily conduct our sales on a purchase order basis, rather than pursuant to long-term contracts. The loss of any significant customer, any material reduction in orders by any of our significant customers, the cancellation of a significant customer order or the cancellation or delay of a customer’s significant program or product could harm our business.
Semiconductor suppliers can rapidly increase production output in response to slight increases in demand, leading to a sudden oversupply situation and a subsequent reduction in order rates and revenues as customers adjust their inventories to account for shorter lead times. Conversely, when circumstances create longer lead times customers may order in excess of what they need to ensure availability, then cancel orders if lead times are reduced. A rapid and sudden decline in customer demand for products or cancellation of orders can result in excess quantities of certain products relative to demand. Should this occur, our operating results may be adversely affected as a result of charges to reduce the carrying value of our inventory to the estimated demand level or market price. Our quarterly revenues are highly dependent upon turns fill orders (orders booked and shipped in the same quarter). The short-term and volatile nature of customer demand makes it extremely difficult to accurately predict near term revenues and profits.
21
Most of our authorized distributors, which together represent more than half of our net sales, can terminate their contract with us with little or no notice. The termination of a distributor could negatively impact our business, including net sales and accounts receivable.
In fiscal year
2018
, authorized distributors accounted for approximately
66%
of our net sales. We generally do not have long-term contracts with our distributors and most can terminate their agreement with us with little or no notice. For fiscal year
2018
, our two largest distributors were based in Asia.
The termination of any of our distributor relationships could impact our net sales and limit our access to certain end-customers. It could also result in the return of excess inventory of our product held by that distributor. Since many distributors simply resell finished products, they generally operate on very thin profit margins. If a distributor were to terminate an agreement with us or go out of business, our accounts receivable from the particular distributor would be subject to significant collection risk. Our reliance on distributors also subjects us to a number of additional risks, including:
|
•
|
write-downs in inventories associated with stock rotation rights and increases in provisions for price adjustments granted to certain distributors;
|
|
•
|
potential reduction or discontinuation of sales of our products by distributors;
|
|
•
|
failure to devote resources necessary to sell our products at the prices, in the volumes and within the time frames that we expect;
|
|
•
|
dependence upon the continued viability and financial resources of these distributors, some of which are small organizations with limited working capital and all of which depend on general economic conditions and conditions within the semiconductor industry;
|
|
•
|
dependence on the timeliness and accuracy of shipment forecasts and resale reports from our distributors; and
|
|
•
|
management of relationships with distributors, which can deteriorate as a result of conflicts with efforts to sell directly to our end customers.
|
If any significant distributor becomes unable or unwilling to promote and sell our products, or if we are not able to renew our contracts with the distributors on acceptable terms, we may not be able to find a replacement distributor on reasonable terms or at all and our business could be harmed.
Our inability to effectively control the sales of our products on the gray market could have a material adverse effect on us.
We market and sell our products directly to OEMs and through authorized third-party distributors. From time to time, it's possible our products could be diverted from our authorized distribution channels and customers may purchase products from the unauthorized "gray market." Gray market products result in shadow inventory that is not visible to us, thus making it difficult to forecast demand accurately. Also, when gray market products enter the market, we and our distribution channels compete with these discounted gray market products, which adversely affects demand for our products and negatively impacts our margins. In addition, our inability to control gray market activities could result in customer satisfaction issues because when products are purchased outside of our authorized distribution channels there is a risk that our customers are buying products that may have been altered, mishandled or damaged, or are used products represented as new.
Risks Relating to Governmental Regulations, including Taxes, Financial Reporting Rules and Regulations, and Environmental Regulations
Failure to maintain effective internal control over financial reporting or disclosure controls and procedures could have a material adverse effect on our business and stock price.
Section 404 of the Sarbanes-Oxley Act requires an annual management assessment of the effectiveness of internal controls over financial reporting and an annual report by our independent registered public accounting firm opining on our internal controls over financial reporting. Management is similarly required to review disclosure controls, which are controls established to ensure that information required to be disclosed in SEC reports is recorded, processed, summarized and reported in a timely manner.
If we fail to maintain the adequacy of our internal controls, as such standards are modified, supplemented or amended from time to time, we may not be able to ensure that we can conclude on an ongoing basis that we have effective internal control over financial reporting. Moreover, effective internal controls are necessary for us to produce reliable financial reports and are important to help prevent fraud. As a result, any failure to satisfy the requirements of Section 404 on a timely basis could result in the loss of investor confidence in the reliability of our consolidated financial statements, which in turn could harm our business and negatively impact the trading price of our common stock.
22
We
are subject to government regulations and other standards that impose operational and reporting requirements.
We, our suppliers, and our customers are subject to a variety of U.S. federal, foreign, state and local governmental laws, rules and regulations, including those related to the use, storage, handling, discharge or disposal of certain toxic, volatile or otherwise hazardous chemicals and the incorporation of such substances into products available for sale. If we or our suppliers were to incur substantial additional expenses to acquire equipment or otherwise comply with environmental regulations, product costs could significantly increase, thus harming our business.
Additional laws, rules and regulations at the U.S. federal and relevant foreign levels governing data privacy protections for personal information, and corrupt practices/anti-bribery prohibitions, impact our business in terms of ongoing monitoring of compliance. Legislation and related regulations in the United Kingdom under that country’s Bribery Act could have extra-territorial application of compliance standards that may be inconsistent with comparable U.S. law, requiring us to re-evaluate and amend our compliance programs, policies and initiatives.
The SEC and NASDAQ Stock Market ("NASDAQ") have revised, and continue to revise, their regulations and listing standards. These developments have increased, and may continue to increase, our legal compliance and financial reporting costs. These developments also may make it more difficult and more expensive for us to obtain director and officer liability insurance, and we may be required to accept reduced coverage or incur substantially higher costs to obtain coverage. This, in turn, could make it more difficult for us to attract and retain qualified members of our Board of Directors, or qualified executive officers.
Failure to comply with present or future laws, rules and regulations of any kind that govern our business could result in suspension of all or a portion of production, cessation of all or a portion of operations, or the imposition of significant regulatory, administrative, civil, or criminal penalties or sanctions, any of which could harm our business.
Our failure to comply with any applicable environmental regulations could result in a range of consequences, including fines, suspension of production, excess inventory, sales limitations, and criminal and civil liabilities.
We are subject to various state, federal and international laws and regulations governing the environment, including restricting the presence of certain substances in electronic products and making producers of those products financially responsible for the collection, treatment, recycling and disposal of those products. Although our management systems are designed to maintain compliance, we cannot assure you that we have been or will be at all times in complete compliance with such laws and regulations. If we violate or fail to comply with any of them, a range of consequences could result, including fines, import/export restrictions, sales limitations, criminal and civil liabilities or other sanctions. We could also be held liable for any and all consequences arising out of exposure to hazardous materials used, stored, released, disposed of by us or located at, under or emanating from our facilities or other environmental or natural resource damage. We have incurred, and may continue to incur, liabilities under various statutes for the cleanup of pollutants at locations we have operated and at third-party disposal and recycling sites we have used. For example, during our fiscal year 2016, we recorded a total of $2.9 million for an environmental reserve associated with a cleanup and abatement order from a regulatory authority at our former facility in Newbury Park, California for groundwater contamination.
Environmental laws are complex, change frequently and have tended to become more stringent over time. For example, the European Union and China are two among a growing number of jurisdictions that have enacted in recent years restrictions on the use of lead, among other chemicals, in electronic products. These regulations affect semiconductor packaging. There is a risk that the cost, quality and manufacturing yields of lead-free products may be less favorable compared to lead-based products or that the transition to lead-free products may produce sudden changes in demand, which may result in excess inventory.
Future environmental legal requirements may become more stringent or costly and our compliance costs and potential liabilities arising from past and future releases of, or exposure to, hazardous substances may harm our business and our reputation.
"Conflict minerals" regulations may cause us to incur additional expenses, may make our supply chain more complex and may result in damage to our reputation with customers.
On August 22, 2012, under the Dodd-Frank Wall Street Reform and Consumer Protection Act of 2010 (the "Dodd-Frank Act"), the SEC adopted requirements for companies that use certain minerals and metals, known as conflict minerals, in their products, whether or not these products are manufactured by third parties. These metals are commonly used in electronic components and devices, including our products. These regulations require companies to investigate and disclose whether or not such minerals originate from the Democratic Republic of Congo or adjoining countries. The implementation of these requirements could adversely affect the sourcing, availability and pricing of such minerals used in the manufacture of semiconductor devices. As a result, there may only be a limited pool of suppliers who provide conflict free metals, and we cannot assure you that we will be able to obtain products in sufficient quantities or at competitive prices. In addition, we could incur additional costs to the extent that we are required to make changes to products, processes, or sources of supply due to the
23
foregoing requirements, including costs related to determining the source of any of the relevant minerals and metals used in our products. Also, since our supply chain is complex, we may face reputational challenges with our customers and other stockholders if we are unable to sufficiently verify the origins for all metals used in our products. In such event, we may also face difficulties in satisfying customers who require that all of the components of our products are certified as conflict mineral free. Our revenues and margins may be harmed if we are unable to meet this requirement at a reasonable price, or at all, or are unable to pass through any increased costs associated with meeting this requirement.
Certain of our customers and suppliers require us to comply with their codes of conduct, which may include certain restrictions that may substantially increase our cost of doing business as well as have an adverse effect on our operating efficiencies, operating results and financial condition
.
Certain of our customers and suppliers require us to agree to comply with their codes of conduct, which may include detailed provisions on labor, human rights, health and safety, environment, corporate ethics and management systems. Certain of these provisions are not requirements under the laws of the countries in which we operate and may be burdensome to comply with on a regular basis. Moreover, new provisions may be added or material changes may be made to any these codes of conduct, and we may have to promptly implement such new provisions or changes, which may substantially further increase the cost of our business, be burdensome to implement and adversely affect our operational efficiencies and operating results. If we violate any such codes of conduct, we may lose further business with the customer or supplier and, in addition, we may be subject to fines from the customer or supplier. While we believe that we are currently in compliance with our customers and suppliers’ codes of conduct, there can be no assurance that, from time to time, if any one of our customers and suppliers audits our compliance with such code of conduct, we would be found to be in full compliance. A loss of business from these customers or suppliers could have a material adverse effect on our business, operating results and financial condition.
Our operating results could be adversely affected as a result of changes in our effective tax rates, the adoption of new U.S. or international tax legislation or exposure to additional tax liabilities, or by material differences between our forecasted annual effective tax rates and actual tax rates.
Our future effective tax rates could be affected by changes in the mix of earnings in countries with differing statutory tax rates, changes in the valuation of deferred tax assets and liabilities, or changes in applicable tax laws or their interpretation. We are also subject to the examination of our tax returns and other tax matters by the Internal Revenue Service of the U.S. ("IRS") and other tax authorities and governmental bodies. We regularly assess the likelihood of an adverse outcome resulting from these examinations to determine the adequacy of our provision for taxes. There can be no assurance as to the outcome of these examinations. If our effective tax rates were to increase, particularly in the U.S. or Switzerland, or if the ultimate determination of taxes owed is for an amount in excess of amounts previously accrued, our operating results, cash flows, and financial condition could be adversely affected.
In October 2015, the Organization for Economic Co-operation and Development, an international association of 34 countries, including the U.S., released the final reports from its Base Erosion and Profit Shifting ("BEPS") Action Plans. The BEPS recommendations covered a number of issues, including country-by-country reporting, permanent establishment rules, transfer pricing rules and tax treaties. Although the BEPS recommendations are not themselves changes in tax law, this guidance has resulted in unilateral action by several member countries and is also prompting possible amendment of other countries’ tax laws and regulations on a prospective and potentially retroactive basis. In October 2015, the European Commission concluded that certain member countries had granted unlawful rulings that artificially reduced tax burdens and has ordered the recovery of the unpaid taxes. Future tax law changes resulting from these developments may result in changes to long-standing tax principles, which could adversely affect our effective tax rate or result in higher cash tax liabilities.
In addition, due to the complexity associated with the calculation of our tax provision, we have hired independent tax advisors to assist us. Significant judgment is required in the calculation of our tax provision and the resulting tax liabilities as well as determination of our ability to realize our deferred tax assets. Our estimates of future taxable income and the regional mix of this income can change as new information becomes available. Any such changes in our estimates or assumptions can significantly impact our tax provision in a given period by, for example, requiring us to impair existing deferred tax assets. Such required changes could result in us having to restate our consolidated financial statements. Restatements are generally costly and could adversely impact our operating results or have a negative impact on the trading price of our common stock.
We are subject to review by taxing authorities, including the Internal Revenue Service.
We are subject to review by domestic and foreign taxing authorities, including the IRS. Tax years prior to 2012 (fiscal year 2013) are generally not subject to examination by the IRS except for items with tax attributes that could impact open tax years. Changes to our tax filings could materially impact our tax liabilities and effective tax rate.
We may be subject to taxation and review of our compliance with value-added and other sales-type tax regulations in other jurisdictions which could negatively affect our operations.
24
As a global organization, we may be subject to a variety of transfer pricing or permanent establishment challenges by taxing authorities in various jurisdictions. If certain of our non-U.S. activities were treated as carrying on business as a permanent establishment and therefore, subject to income tax in such jurisdiction, our operating results could be materially adversely affected.
We are required to comply with rules regarding value-added taxes and other sales-type taxes in various jurisdictions. If these taxes are not properly collected and paid, our operating results could be materially adversely affected.
We have limited experience with government contracting, which entails differentiated business risks.
Although such contracts have not constituted a material portion of our revenue in the past, we may from time-to-time derive revenue from contracts and subcontracts with agencies of, or prime or secondary contractors to, the U.S. government, including U.S. military agencies. Consequently, we are subject to certain business risks that are particular to companies that contract with U.S. government agencies. These risks include the ability of the U.S. government or related contractors to unilaterally:
|
•
|
terminate contracts at its convenience;
|
|
•
|
terminate, modify or reduce the value of existing contracts, if there are budgetary constraints or needed changes;
|
|
•
|
cancel multi-year contracts and related orders, if funds become unavailable;
|
|
•
|
adjust contract costs and fees on the basis of audits performed by U.S. government agencies;
|
|
•
|
control and potentially prohibit the export of our products;
|
|
•
|
require that we continue to supply products despite the expiration of a contract under certain circumstances;
|
|
•
|
require that we fill certain types of rated orders for the U.S. government prior to filling any orders for other customers; and
|
|
•
|
suspend us from receiving new contracts pending resolution of any alleged violations of procurement laws or regulations.
|
In addition, because we may enter into defense industry contracts with respect to products that are sold both within and outside of the U.S., we are subject to the following additional risks in connection with government contracts:
|
•
|
the need to bid on programs prior to completing the necessary design, which may result in unforeseen technological difficulties, delays and/or cost overruns;
|
|
•
|
the difficulty in forecasting long-term costs and schedules and the potential obsolescence of products related to long-term fixed price contracts; and
|
|
•
|
the need to transfer and obtain security clearances and export licenses, as appropriate.
|
Government investigations and inquiries from regulatory agencies could lead to enforcement actions, fines, restatement of our financial statements or other penalties and could result in litigation against us.
In the past, we have been subject to government investigations and inquiries from regulatory agencies such as the SEC and we have had to restate our historical financial statements in connection with such inquiry related to our historical stock option practices. We may be subject to government investigations and receive additional inquiries from regulatory agencies in the future, which may lead to enforcement actions, fines or other penalties.
In addition, litigation has often been brought against a company in connection with the announcement of a government investigation or inquiry from a regulatory agency. Such lawsuits could result in the diversion of management’s time and attention away from business operations, which could harm our business. In addition, the costs of defense and any damages resulting from litigation, a ruling against us, or a settlement of the litigation could adversely affect our cash flow and financial results.
If such government investigations or inquiries result in a restatement of our financial statements, this could delay the filing of our subsequent SEC reports which, in turn, might result in the delisting of our common stock from NASDAQ for failure to meet continued listing requirements.
25
Risks Relating to our Business Strategies, Personnel and Other Operations
The loss of any of our key personnel or the failure to attract or retain specialized technical and management personnel could impair our ability to grow our business.
Our future success depends upon our ability to attract and retain highly qualified technical, marketing and managerial personnel. We are dependent on a relatively small group of key technical personnel with analog and mixed-signal expertise. Personnel with highly skilled managerial capabilities, and analog and mixed-signal design expertise, are scarce and competition for personnel with these skills is intense. There can be no assurance that we will be able to retain key employees or that we will be successful in attracting, integrating or retaining other highly qualified personnel in the future. If we are unable to retain the services of key employees or are unsuccessful in attracting new highly qualified employees, our business could be harmed.
If our stock price declines below the exercise price of stock options held by our employees, the retention incentive aspect of the stock options is lost and there is a greater likelihood we will be unable to retain key talent.
We face risks associated with companies we have acquired in the past and may acquire in the future.
We have expanded our operations through strategic acquisitions, such as the acquisition of SMI in December 2009, Gennum in March 2012, select assets from EnVerv in January 2015, Triune in March 2015, and AptoVision in 2017, and we may continue to expand and diversify our operations with additional acquisitions. Acquisitions have used and could use in the future a significant portion of our available liquid assets or we could incur debt or issue equity securities to fund acquisitions. Issuance of equity securities could be dilutive to existing shareholders. Debt financing could subject us to restrictive covenants that could have an adverse effect on our business. Although we undertake detailed reviews of proposed acquisition candidates and attempt to negotiate acquisition terms favorable to us, we may encounter difficulties or incur liabilities for which we have no recourse. We cannot provide any assurance that any acquisition will have a positive impact on our future performance.
If we are unsuccessful in integrating acquired companies into our operations or if integration is more difficult than anticipated, then we may not achieve anticipated cost savings or synergies and may experience disruptions that could harm our business. Some of the risks that may affect our ability to successfully integrate acquired companies include those associated with:
|
•
|
conforming the acquired company’s standards, processes, procedures and controls with our operations;
|
|
•
|
coordinating new product and process development, especially with respect to highly complex technologies;
|
|
•
|
assuring acquired products meet our quality standards;
|
|
•
|
loss of key employees or customers of the acquired company;
|
|
•
|
hiring additional management and other critical personnel;
|
|
•
|
increasing the scope, geographic diversity and complexity of our operations;
|
|
•
|
consolidation of facilities and functions;
|
|
•
|
the geographic distance between the companies; and
|
|
•
|
disparate corporate cultures.
|
Acquisitions could have a negative impact on our future earnings by way of poor performance by the acquired company or, if we later conclude we are unable to use or sell an acquired product or technology, we could be required to write down the related intangible assets and goodwill.
We may be required to recognize additional impairment charges in the future which could have an adverse effect on our financial condition and operating results.
We assess our goodwill, other intangible assets and our long-lived assets on an annual basis and whenever events or changes in circumstances indicate the carrying value of our assets may not be recoverable, and as and when required by accounting principles generally accepted in the U.S. ("GAAP") to determine whether they are impaired. Future restructuring or appraisal of our business impacting fair value of our assets or changes in estimates of our future cash flows could affect our impairment analysis in future periods and cause us to record either an additional expense for impairment of assets previously determined to be partially impaired or record an expense for impairment of other assets. Depending on future circumstances, we may never realize the full value of intangible assets. Any future determination or impairment of a significant portion of our goodwill and other intangibles could have an adverse effect on our financial condition and operating results.
We have significant investments in entities that we do not control. Losses in the value of such investments could have an adverse effect on our financial condition or operating results.
We have significant investments in entities that we do not control, including equity and cost method investments. Our interests in such entities do not provide us with control over the business strategy, financial goals, development roadmaps or other operational aspects of these entities. We cannot provide assurance that these entities will operate in a manner that will increase
26
or maintain the value of our investment, that our proportionate share of income or loss from these investments will continue at the current level in the future or that we will not incur losses from the holding of such investments.
To the extent that we have any interest in an entity for which we are required to consolidate, we would need to rely on those entities to timely deliver important financial information to us. In the event that the financial information is inaccurate, incomplete, or not timely, we may not be able to meet our financial reporting obligations as required by the SEC.
To the extent we create such arrangements for which we would be required to consolidate and the financial statements of such entities are not prepared by us, we will not have direct control over their financial statement preparation. As a result, we will, for our financial reporting, depend on what these entities report to us, which could result in us adding monitoring and audit processes, which could increase the difficulty of implementing and maintaining adequate controls over our financial processes and reporting in the future. This may be particularly true when such entities do not have sophisticated financial accounting processes in place, or where we are entering into new relationships at a rapid pace, straining our integration capacity. Additionally, if we do not receive the information from the variable interest entity on a timely basis, this could cause delays in our external reporting obligations as required by the SEC.
Our reported financial results may be adversely affected by new accounting pronouncements or changes in existing accounting standards and practices.
We prepare our financial statements in conformity with accounting principles generally accepted in the U.S. These accounting principles are subject to interpretation by the Financial Accounting Standards Board, SEC and various organizations formed to interpret and create appropriate accounting standards and practices. New accounting pronouncements and varying interpretations of accounting standards and practices have occurred and may occur in the future. New accounting pronouncements or a change in the interpretation of existing accounting standards or practices may have a significant effect on our reported financial results and may even affect our reporting of transactions completed before the change is announced or effective.
Our
ability to generate the significant amount of cash needed to service our debt obligations or to obtain additional financing depends on many factors beyond our control.
As of
January 28, 2018
, we had
$228.3 million
of outstanding indebtedness under our credit facilities.
Our ability to make payments on amounts borrowed under our credit facilities, and to fund our operations, will depend on our ability to generate substantial operating cash flow. Our cash flow generation will depend on our future performance, which will be subject to prevailing economic conditions and to financial, business and other factors, many of which are beyond our control.
Our business may not generate sufficient cash flow from operations and, if we cannot service our debt, we will have to take actions such as reducing or delaying capital investments, selling assets, or seeking additional equity capital. We may not be able to, if required, effect these actions on commercially reasonable terms, or at all. Because of these and other factors beyond our control, we may be unable to pay the interest on or other amounts in respect of our indebtedness.
Restrictive covenants in the credit agreement governing our senior secured first lien credit facilities may restrict our ability to pursue our business strategies.
The credit agreement governing our senior secured first lien credit facilities contain a number of restrictive covenants that impose significant operating and financial restrictions on us and may limit our ability to engage in acts that may be in our long-term best interests. The credit agreement includes covenants restricting, among other things, our and our subsidiaries’ ability to:
|
•
|
incur or guarantee additional debt or issue certain preferred stock;
|
|
•
|
pay dividends or make distributions on our capital stock or redeem, repurchase or retire our capital stock;
|
|
•
|
make certain investments and acquisitions;
|
|
•
|
create liens on our or our subsidiaries’ assets;
|
|
•
|
enter into transactions with affiliates;
|
|
•
|
merge or consolidate with another person or sell or otherwise dispose of substantially all of our assets;
|
|
•
|
make certain payments in respect of other material indebtedness;
|
|
•
|
alter the business that we conduct; and
|
|
•
|
make certain capital expenditures.
|
Under the credit agreement, we are required to maintain a consolidated leverage ratio and an interest expense coverage ratio. Our ability to meet such financial ratios can be affected by events beyond our control, and we cannot assure you that we will be
27
able to meet such ratios. The credit agreement also contains various covenants and restrictions and a breach of any covenant or restriction could result in a default under our credit agreement. If any such default occurs, the lenders may elect (after the expiration of any applicable notice or grace periods) to declare all outstanding borrowings, together with accrued and unpaid interest and other amounts payable thereunder, to be immediately due and payable. Further, following an event of default under our credit facilities, the lenders will have the right to proceed against the collateral granted to them to secure that debt. If the debt under our credit facilities were to be accelerated, our assets may not be sufficient to repay in full that debt that may become due as a result of that acceleration.
We rely on certain critical information systems for the operation of our business and a disruption in our information systems, including those related to cybersecurity, could adversely affect our business operations.
We maintain and rely upon certain critical information systems for the effective operation of our business. These information systems include telecommunications, the Internet, our corporate intranet, various computer hardware and software applications, network communications, and e-mail. These information systems may be owned by us or by our outsource providers or even third parties such as vendors and contractors and may be maintained by us or by such providers or third parties. These information systems are subject to attacks, failures, and access denials from a number of potential sources including viruses, destructive or inadequate code, power failures, and physical damage to computers, hard drives, communication lines and networking equipment. To the extent that these information systems are under our control, we have implemented security procedures, such as virus protection software and emergency recovery processes, to address the outlined risks; however, security procedures for information systems cannot be guaranteed to be failsafe and our inability to use or access these information systems at critical points in time could unfavorably impact the timely and efficient operation of our business. Additionally, any compromise of our information security could result in the unauthorized publication of our confidential business or proprietary information, including potential theft of our intellectual property or trade secrets (including our proprietary technology) or the unauthorized release of customer, supplier or employee data and result in a violation of privacy or other laws, thus exposing us to litigation or damage to our reputation. To the extent that our business is interrupted or data or proprietary technology is lost, destroyed or inappropriately used or disclosed, such disruption could adversely affect our competitive position, relationship with customers, suppliers or employees or our business, financial condition and operating results. In addition, we may be required to incur significant costs to protect against or repair the damage caused by these disruptions or security breaches in the future.
The costs associated with our indemnification of certain customers, distributors, and other parties could be higher in future periods.
In the normal course of our business, we indemnify other parties, including customers, distributors, and lessors, with respect to certain matters. These obligations typically arise pursuant to contracts under which we agree to hold the other party harmless against losses arising from a breach of representations and covenants related to certain matters, such as acts or omissions of our employees, infringement of third-party intellectual property rights, and certain environmental matters. We have not incurred any significant expense as a result of agreements of this type in at least a decade, but there can be no assurances that we will not incur expense under these indemnification provisions in the future.
We have also entered into agreements with our current and former directors and certain of our current and former executives indemnifying them against certain liabilities incurred in connection with their duties. Our Certificate of Incorporation and Bylaws contain similar indemnification obligations with respect to our current and former directors and employees, as does the California Labor Code. We cannot estimate the amount of potential future payments, if any, that we might be required to make as a result of these agreements.
Our stock price could be subject to extreme price fluctuations, and stockholders could have difficulty trading shares.
Historically, the market for the semiconductor companies has been volatile, and the market price of our common stock has been and may continue to be subject to significant fluctuations. Fluctuations could be in response to items such as operating results, announcements of technological innovations, or market conditions for semiconductor stocks in general. Additionally, the stock market in recent years has experienced extreme price and volume fluctuations that often have been unrelated to the operating performance of individual companies. These market fluctuations, as well as general economic conditions, may adversely affect the price of our common stock.
In addition, the future sale of a substantial number of shares of common stock by us or by our existing stockholders or option holders (including directors, officers, and employees, some of whom hold stock options that are approaching their expiration date) may have an adverse impact on the market price of the shares of common stock. There can be no assurance that the trading price of our common stock will remain at or near its current level.
If securities or industry analysts do not publish research or reports about our business, or if they adversely change their recommendations regarding our common stock or if our operating results do not meet their expectations, the trading price of our common stock could decline.
28
The market price of our common stock is influenced by the research and reports that industry or securities analysts publish about us or our business. There is no guarantee that these analysts will understand our business and results, or that their reports will be accurate or correctly predict our operating results or prospects. If one or more of these analysts cease coverage of our company or fail to publish reports on us regularly, we could lose visibility in the financial markets, which in turn could cause the market price of our common stock or its trading volume to decline. Moreover, if one or more of the analysts who cover our company downgrade our common stock or if our operating results or prospects do not meet their expectations, the market price of our common shares could decline significantly
.
Anti-takeover provisions in our Certificate of Incorporation and Bylaws could make an acquisition of us more difficult and may prevent attempts by our stockholders to replace or remove our current management.
Certain provisions in our Certificate of Incorporation and Bylaws may delay or prevent an acquisition of us or a change in our management. These provisions include:
|
•
|
the ability of our board of directors to determine the rights, preferences and privileges of our preferred shares and to issue the preferred shares without stockholder approval;
|
|
•
|
advance notice requirements for election to our board of directors and for proposing matters that can be acted upon at stockholder meetings; and
|
|
•
|
the inability of stockholders to call a special meeting.
|
These provisions could make it more difficult for a third-party to acquire us, even if the third-party's offer may be considered beneficial by many stockholders. As a result, stockholders may be limited in their ability to obtain a premium for their shares.
We are subject to litigation risks which may be costly to defend and the outcome of which is uncertain and could adversely affect our business and financial condition.
All industries, including the semiconductor industry, are subject to legal claims, with and without merit, which may divert the attention of our management and our resources in general. From time to time in the ordinary course of its business, the Company is involved in various claims, litigation, and other legal actions that are normal to the nature of its business, including with respect to IP, contract, product liability, employment, and environmental matters. We believe it is unlikely that the final outcome of these legal claims will have a material adverse effect on our financial condition, operating results or cash flows. However, defense and settlement costs can be substantial, even with respect to claims that we believe have no merit. Due to the inherent uncertainty of the litigation process, the resolution of any particular legal claim or proceeding could adversely affect our business, operating results and financial condition.
From time to time, we have been, or may in the future be, involved in securities litigation or litigation arising from our acquisitions. We can provide no assurance as to the outcome of any such litigation matter in which we are a party. These types of matters are costly to defend and even if resolved in our favor, could have a material adverse effect on our business, financial condition, operating results and cash flow. Such litigation could also substantially divert the attention of our management and our resources in general. Uncertainties resulting from the initiation and continuation of securities or other litigation could harm our ability to obtain credit and financing for our operations and to compete in the marketplace. Because the price of our common stock has been, and may continue to be, volatile, we can provide no assurance that securities litigation will not be filed against us in the future. In addition, we can provide no assurance that our past or future acquisitions will not subject us to additional litigation.
29
|
Item 1B.
|
Unresolved Staff Comments
|
None.
|
Item 2.
|
Properties
|
Our corporate headquarters is located in Camarillo, California where we own an approximately 87,600 square foot facility that was completed in 2002. The parcel on which our headquarters is located can accommodate substantial expansion.
As of
January 28, 2018
, we owned or leased multiple properties. The locations and primary functions of significant properties are summarized in the following table:
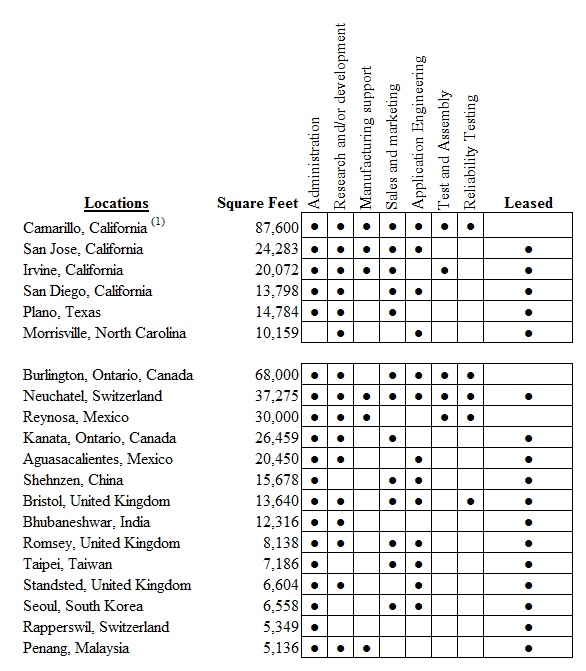
(1)
Our Corporate Headquarters have been pledged to secure our obligations under the Amended and Restated Credit Agreement dated November 15, 2016 entered into among Semtech Corporation, the guarantors party thereto, the lenders party thereto and HSBC Bank USA, National Association, as administrative agent and as swing line lender and letter of credit issuer.
In addition to the properties listed in the above table, we also lease Sales and Marketing, Research and Development, and Administrative offices at various locations in the U.S. and internationally under operating leases, none of which are material to our future cash flows. Our leases expire at various dates through
2027.
We believe that our existing leased and owned space is more than adequate for our current operations, and that suitable replacement and additional space will be available in the future on commercially reasonable terms as circumstances warrant.
30
|
Item 3.
|
Legal Proceedings
|
The descriptions of the legal proceedings in Note
13
to the Consolidated Financial Statements included in this Annual Report on Form 10-K are incorporated by reference to this Item 3.
|
Item 4.
|
Mine Safety Disclosures
|
Not applicable.
31
|
Item 5.
|
Market for Registrant’s Common Equity, Related Stockholder Matters and Issuer Purchases of Equity Securities
|
Market Information
During fiscal years
2018
and
2017
, our common stock traded on the NASDAQ Global Select Market under the symbol "SMTC." The following table sets forth, for the periods indicated, the high and low sale prices of our common stock, as reported on the NASDAQ Global Select Market, giving effect to all stock splits through the date hereof.
|
|
High
|
|
Low
|
|
Fiscal year ended January 28, 2018:
|
|||
|
First Quarter
|
$35.90
|
$31.60
|
|
|
Second Quarter
|
$40.75
|
$33.70
|
|
|
Third Quarter
|
$40.40
|
$35.05
|
|
|
Fourth Quarter
|
$41.05
|
$32.50
|
|
|
Fiscal year ended January 29, 2017:
|
|||
|
First Quarter
|
$23.48
|
$15.70
|
|
|
Second Quarter
|
$25.68
|
$20.09
|
|
|
Third Quarter
|
$28.21
|
$24.05
|
|
|
Fourth Quarter
|
$33.90
|
$22.81
|
|
Holders
As of
March 16, 2018
, we had
198 hold
ers of record of our common stock.
Dividends
The payment of dividends on our common stock is within the discretion of our Board of Directors. Currently, we intend to retain earnings to finance the growth of our business. We have not paid cash dividends on our common stock during at least the five most recent fiscal years and our Board of Directors has not indicated any intent to declare a cash dividend on the common stock in the foreseeable future. The credit agreement governing our senior secured first lien credit facilities includes covenants limiting our ability to pay dividends or make distributions on our capital stock.
Purchases of Equity
We maintain a stock repurchase program that was initially approved by our Board of Directors in March 2008 and announced by us on March 4, 2008. The stock repurchase program does not have an expiration date and our Board of Directors has authorized expansion of the program over the years. During fiscal year
2018
, we repurchased shares of common stock in an amount of
$14.8 million
. As of
January 28, 2018
, we have repurchased
$151.4 million
in shares of our common stock under the program since its inception and the current remaining authorization under our stock repurchase program is
$47.0 million
. Under the program, we may repurchase our common stock at any time or from time to time, without prior notice, subject to market conditions and other considerations. Our repurchases may be made through Rule 10b5-1 and/or Rule 10b-18 or other trading plans, open market purchases, privately negotiated transactions, block purchases or other transactions. We intend to fund repurchases under the program from cash on hand. We have no obligation to repurchase any shares under the program and may suspend or discontinue it at any time.
Information with respect to purchases by the Company of shares of common stock during the fourth quarter of fiscal year
2018
follows:
Issuer Purchases of Equity Securities
|
Fiscal Month/Year
|
Total Number of
Shares Purchased
|
Average Price Paid
per Share
|
Total Number of Shares
Purchased as Part of
Publicly Announced Program
|
Approximate Dollar Value
of Shares That May Yet
Be Purchased Under
The Program
|
||||||||||
|
November 2017 (10/30/17-11/26/17)
|
—
|
|
$
|
—
|
|
—
|
|
$
|
51.4
|
million
|
||||
|
December 2017 (11/27/17-12/24/17)
|
93,724
|
|
$
|
33.94
|
|
93,724
|
|
$
|
48.2
|
million
|
||||
|
January 2018 (12/25/17-01/28/18)
|
36,579
|
|
$
|
34.84
|
|
36,579
|
|
$
|
47.0
|
million
|
||||
|
Total activity in the fourth quarter
|
130,303
|
|
$
|
34.19
|
|
|
130,303
|
|
||||||
Securities Authorized for Issuance Under Equity Compensation Plans
See the information set forth in Part III, Item 12 of this Form 10-K.
Sales of Unregistered Securities
We did not make any sales of unregistered securities during fiscal year
2018
.
Performance Graph
This chart and graph show the value of a $100 cash investment on the last day of fiscal year 2013 in (i) the Company’s common stock, (ii) the NASDAQ Composite Index, and (iii) the Philadelphia Semiconductor Index. Note that historic stock price performance is not necessarily indicative of future stock price performance.
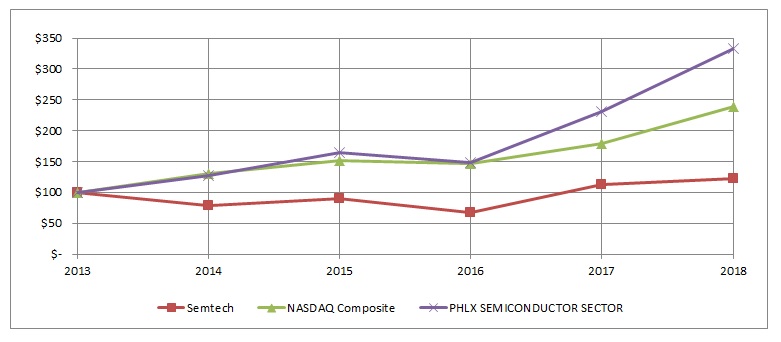
|
Fiscal Year
|
2013
|
2014
|
2015
|
2016
|
2017
|
2018
|
|||||
|
Semtech
|
$100
|
$78
|
|
$91
|
|
$67
|
|
$113
|
|
$122
|
|
|
NASDAQ Composite
|
$100
|
$131
|
|
$151
|
|
$146
|
|
$180
|
|
$238
|
|
|
PHLX SEMICONDUCTOR SECTOR
|
$100
|
$127
|
|
$164
|
|
$148
|
|
$232
|
|
$332
|
|
The information contained in this Item 5 under the heading "Performance Graph" (i) is being furnished and shall not be deemed "filed" for the purposes of Section 18 of the Exchange Act, or otherwise subject to the liabilities of that section, and (ii) shall not be incorporated by reference into any registration statement or other document pursuant to the Exchange Act, or the Securities Act of 1933, as amended, except as shall be expressly set forth by specific reference in such filing to this Item 5 Performance Graph information.
32
|
Item 6.
|
Selected Financial Data
|
The Consolidated Statements of Income data set forth below for fiscal years
2018
,
2017
and
2016
and the Consolidated Balance Sheets data as of the end of fiscal years
2018
and
2017
are derived from, and qualified by reference to, the Consolidated Financial Statements included in Item 8 of this Annual Report on Form 10-K. The Consolidated Statements of Income data for fiscal years
2015
and
2014
and the consolidated Balance Sheets data as of the end of fiscal years
2016
,
2015
and
2014
are derived from the Consolidated Financial Statements previously filed with the SEC on Form 10-K.
This information should be read in conjunction with Management’s Discussion and Analysis contained in Item 7 of this Annual Report on Form 10-K, the Consolidated Financial Statements and accompanying notes included in Item 8 of this Annual Report on Form 10-K, and the corresponding items included in our Annual Report on Form 10-K for fiscal years
2017
and
2016
.
All fiscal years presented consisted of
fifty-two
weeks except for the fiscal year ended January 31, 2016 which consisted of
fifty-three
weeks. Our past results are not necessarily indicative of our future performance.
Consolidated Income Statement Data
|
Fiscal Year Ended
|
|||||||||||||||||||
|
(in thousands, except per share amounts)
|
January 28, 2018
(1)
|
January 29, 2017
|
January 31, 2016
(1)
|
January 25, 2015
|
January 26, 2014
|
||||||||||||||
|
Net sales
|
$
|
587,847
|
|
|
$
|
544,272
|
|
|
$
|
490,219
|
|
|
$
|
557,885
|
|
|
$
|
594,977
|
|
|
Cost of sales
|
235,876
|
|
|
219,410
|
|
|
197,109
|
|
|
229,093
|
|
|
244,719
|
|
|||||
|
Cost of sales - lower of cost or market write-down
|
—
|
|
—
|
|
—
|
|
—
|
|
15,047
|
|
|||||||||
|
Gross profit
|
351,971
|
|
|
324,862
|
|
|
293,110
|
|
|
328,792
|
|
|
335,211
|
|
|||||
|
Operating costs and expenses:
|
|
|
|||||||||||||||||
|
Selling, general and administrative
(2)
|
146,303
|
|
|
138,708
|
|
|
140,677
|
|
|
128,419
|
|
|
129,119
|
|
|||||
|
Product development and engineering
|
104,798
|
|
|
102,500
|
|
|
113,737
|
|
|
119,371
|
|
|
137,437
|
|
|||||
|
Intangible amortization
|
27,867
|
|
|
25,301
|
|
|
25,059
|
|
|
25,718
|
|
|
29,002
|
|
|||||
|
Loss (gain) on disposition of business operations
|
375
|
|
(25,513
|
)
|
—
|
|
—
|
|
—
|
|
|||||||||
|
Changes in the fair value of contingent earn-out obligations
|
3,892
|
|
(215
|
)
|
(16,362
|
)
|
1,391
|
|
(654
|
)
|
|||||||||
|
Intangible asset impairments
|
—
|
|
—
|
|
—
|
|
11,636
|
|
32,538
|
|
|||||||||
|
Goodwill impairment
|
—
|
|
—
|
|
—
|
|
—
|
|
116,686
|
|
|||||||||
|
Total operating costs and expenses
|
283,235
|
|
|
240,781
|
|
|
263,111
|
|
|
286,535
|
|
|
444,128
|
|
|||||
|
Operating income (loss)
|
68,736
|
|
|
84,081
|
|
|
29,999
|
|
|
42,257
|
|
|
(108,917
|
)
|
|||||
|
Interest expense
|
(7,963
|
)
|
(9,300
|
)
|
(7,819
|
)
|
(5,927
|
)
|
(18,174
|
)
|
|||||||||
|
Non-operating (expense) income, net
|
(902
|
)
|
|
(1,721
|
)
|
|
(1,801
|
)
|
|
165
|
|
|
(1,390
|
)
|
|||||
|
Income before taxes and equity in net losses of equity method investments
|
59,871
|
|
|
73,060
|
|
|
20,379
|
|
|
36,495
|
|
|
(128,481
|
)
|
|||||
|
Provision for taxes
|
23,191
|
|
|
18,399
|
|
|
8,882
|
|
|
8,548
|
|
35,985
|
|
||||||
|
Net income before equity in net losses of equity method investments
|
36,680
|
|
54,661
|
|
11,497
|
|
27,947
|
|
(164,466
|
)
|
|||||||||
|
Equity in net losses of equity method investments
|
(254
|
)
|
—
|
|
—
|
|
—
|
|
|
—
|
|
||||||||
|
Net income (loss)
|
$
|
36,426
|
|
|
$
|
54,661
|
|
|
$
|
11,497
|
|
|
$
|
27,947
|
|
|
$
|
(164,466
|
)
|
|
Earnings (loss) per share:
|
|
|
|||||||||||||||||
|
Basic
|
$
|
0.55
|
|
$
|
0.84
|
|
$
|
0.18
|
|
|
$
|
0.42
|
|
|
$
|
(2.44
|
)
|
||
|
Diluted
|
$
|
0.54
|
|
$
|
0.83
|
|
$
|
0.17
|
|
|
$
|
0.41
|
|
|
$
|
(2.44
|
)
|
||
|
Weighted average number of shares used in computing earnings per share:
|
|
|
|||||||||||||||||
|
Basic
|
66,027
|
|
65,427
|
|
65,657
|
|
|
67,108
|
|
|
67,471
|
|
|||||||
|
Diluted
|
67,605
|
|
66,109
|
|
65,961
|
|
|
67,685
|
|
|
67,471
|
|
|||||||
|
Anti-dilutive shares not included in the EPS calculations
|
402
|
|
1,111
|
|
2,569
|
|
|
1,714
|
|
|
1,245
|
|
|||||||
33
Consolidated Balance Sheet Data
|
(in thousands)
|
January 28, 2018
(1)
|
January 29, 2017
|
January 31, 2016
(1)
|
January 25, 2015
|
January 26, 2014
|
||||||||||||||
|
Cash and cash equivalents
|
$
|
307,923
|
|
$
|
297,134
|
|
|
$
|
211,810
|
|
|
$
|
230,328
|
|
|
$
|
246,868
|
|
|
|
Working capital
|
335,024
|
|
315,453
|
|
|
237,334
|
|
|
288,647
|
|
|
282,706
|
|
||||||
|
Total assets
|
1,085,776
|
|
1,011,542
|
|
|
911,517
|
|
|
929,431
|
|
|
948,940
|
|
||||||
|
Long term debt, less current
|
211,114
|
|
226,524
|
|
239,177
|
|
234,746
|
|
273,293
|
|
|||||||||
|
Non-current liabilities
|
294,555
|
|
283,304
|
|
|
279,579
|
|
|
270,032
|
|
|
302,207
|
|
||||||
|
Total stockholders’ equity
|
665,013
|
|
605,263
|
|
|
528,051
|
|
|
551,358
|
|
|
535,843
|
|
||||||
(1)
The Company acquired AptoVision on July 1, 2017 and Triune on March 4, 2015. Refer to Note
3
to our Consolidated Financial Statements included in Item 8 of this report.
(2)
The Company has re-aligned resources and infrastructure, resulting in restructuring expense of $6.3 million, $2.3 million and $4.5 million in fiscal years 2018, 2017 and 2016, respectively, included in selling, general and administrative.
34
|
Item 7.
|
Management’s Discussion and Analysis of Financial Condition and Results of Operations
|
The following discussion and analysis of our financial condition and operating results should be read in conjunction with Item 6 "Selected Consolidated Financial Data" and our Consolidated Financial Statements and related Notes included elsewhere in this Annual Report on Form 10-K.
This Annual Report on Form 10-K contains "forward-looking statements" within the meaning of the "safe harbor" provisions of the Private Securities Litigation Reform Act of 1995, as amended, based on our current expectations, estimates and projections about our operations, industry, financial condition, performance, operating results, and liquidity. Forward-looking statements are statements other than historical information or statements of current condition and relate to matters such as future financial performance, future operational performance, the anticipated impact of specific items on future earnings, and our plans, objectives and expectations. Statements containing words such as "may," "believe," "anticipate," "expect," "intend," "plan," "project," "estimate," "should," "will," "designed to," "projections," or "business outlook," or other similar expressions constitute forward-looking statements. Forward-looking statements involve known and unknown risks and uncertainties that could cause actual results and events to differ materially from those projected. Please see Special Note Regarding Forward-Looking and Cautionary Statements elsewhere in this Annual Report on Form 10-K for potential factors that could cause actual results to differ materially from those in the forward-looking statements.
35
Overview
We are a leading global supplier of analog, mixed-signal semiconductors and advanced algorithms and were incorporated in Delaware in 1960. We design, develop, manufacture and market a broad range of products that are sold principally into applications within the high-end consumer, industrial, enterprise computing and communications end-markets. The high-end consumer end-market includes handheld devices, smartphones, tablets, wireless charging, set-top boxes, digital televisions, digital video recorders, thunderbolt cables and other consumer equipment. Applications for the industrial market include analog and digital video broadcast studio equipment, video-over-IP solutions, automated meter reading, smart grid, wireless charging, military and aerospace, medical, security systems, automotive, Internet of Things ("IoT"), industrial and home automation and other industrial equipment. Enterprise computing end-markets include datacenter related equipment, passive optical networks, storage networks, desktops, notebooks, servers, printers, monitors and computer peripherals. Communications end-market applications include wireless base stations, long-haul optical networks, carrier networks, switches and routers, cable modems, backplane signal conditioners, wireless LAN, and other communication infrastructure equipment. Our end-customers are primarily OEMs and their suppliers.
We report results on the basis of 52 and 53 week periods and our fiscal year ends on the last Sunday in January. The fiscal years ended
January 28, 2018
and
January 29, 2017
each consisted of 52 weeks. The fiscal year ended
January 31, 2016
consisted of 53 weeks.
On July 1, 2017, we acquired AptoVision Technologies Inc. ("AptoVision"), a privately-held provider of uncompressed, zero-frame latency, video-over-IP solutions addressing the professional audio visual market. The unique combination of AptoVision's advanced algorithms for real-time, full bandwidth video transmission over IP networks, and our industry leading high-speed signal integrity and chip development expertise is expected to enable the adoption of Software Defined Video over Ethernet ("SDVoE") accelerating this natural progression in the evolution of video transport.
Under the terms of the share purchase agreement, we acquired all of the outstanding equity interest in AptoVision for a cash payment of $17.6 million at closing, net of acquired cash, and a commitment to pay additional contingent consideration of up to a maximum of $47.0 million over three years if certain goals are achieved in each of the earn out periods. The fair value of the additional contingent consideration (the "AptoVision Earn-out") as of
January 28, 2018
was $21.0 million, of which $8.9 million is presented within "Accrued liabilities" and $12.1 million is presented within "Other long-term liabilities" in the Balance Sheets. Acquisition related transaction costs of $1.6 million are accounted for as an expense in the period in which the costs are incurred and are presented within "Selling, general and administrative" expense in the Statements of Income.
On March 4, 2015, we completed the acquisition of Triune Systems, L.L.C. ("Triune"), a privately-held supplier of wireless charging, isolated switching and power management platforms targeted at high and low power, high efficiency applications. Under the terms of the purchase agreement, we acquired all of the outstanding equity interests of Triune for an aggregate purchase price of $45.0 million consisting of $35.0 million cash paid at closing, with an additional cash consideration of $10.0 million which has since been paid. Subject to achieving certain future financial goals ("Triune Earn-out"), up to an additional $70.0 million of additional contingent consideration could have been paid over three years if certain revenue targets were achieved in each of the fiscal years 2016 through 2018. An additional payment of up to $16.0 million could have been paid after fiscal year 2018 if certain cumulative revenue and operating income targets are achieved. None of the Triune Earn-out targets were met and we do not expect to make any payments with regards to these periods which represented all of the additional $70.0 million contingent consideration. Our primary reason for the acquisition was to broaden our existing portfolio with platforms that are very complementary to our current market focus, including Triune's isolated switching platform and wireless charging platform.
See Note
3
and Note
13
to our Consolidated Financial Statements included in Item 8 of this Annual Report on Form 10-K.
We operate and account for results in one reportable segment. See Note
15
to our Consolidated Financial Statements included in Item 8 of this Annual Report on Form 10-K. In fiscal year 2016, we identified a total of five operating segments. Four of these operating segments aggregate into one reportable segment, the Semiconductor Products Group. The four operating segments aggregated into our one reportable segment all exhibit similar economic characteristics and we manage that business to a targeted gross margin range which all of the aggregated product lines are expected to meet. The remaining operating segment, the Systems Innovation Group (shown as "All others"), could not be aggregated with the other operating segments and did not meet the criteria for a separate reportable segment as defined by the guidance regarding segment disclosure. As a result, the financial activity associated with the Systems Innovation Group was reported separately from our Semiconductor Products Group. This separate reporting was included in the “All others” category. On August 5, 2016, we completed the divestiture of our Snowbush IP business (previously part of our Systems Innovation Group) to Rambus Inc. ("Rambus") for a purchase price of $32.0 million in cash along with the opportunity to receive additional payments from Rambus through 2022 based upon a percentage of sales by Rambus of new products expected to be developed by Rambus from the disposed assets. Beginning in the third quarter of fiscal year 2017, we no longer have a Systems Innovation Group or an “All others” category, and therefore we have only four operating segments that aggregate into one reportable segment, the Semiconductor Products Group.
36
Most of our sales to customers are made on the basis of individual customer purchase orders. Many customers include cancellation provisions in their purchase orders. Trends within the industry toward shorter lead-times and "just-in-time" deliveries have resulted in our reduced ability to predict future shipments. As a result, we rely on orders received and shipped within the same quarter for a significant portion of our sales. Sales made directly to customers during fiscal year
2018
were
34%
of net sales. The remaining
66%
of net sales were made through independent distributors.
Our business relies on foreign-based entities. Most of our subcontractors and suppliers, including third-party foundries that supply silicon waf
ers, are located in foreign countries, including China, Israel and Taiwan. For the fiscal year ended
January 28, 2018
, approximately
20%
of our silicon, in terms of cost of wafers purchased, was manufactured in China. Foreign sales for fiscal year
2018
constituted appro
ximately
91%
of our net sales. Approximately
75%
of foreign sales in fiscal year
2018
were to customers located in the Asia-Pacific region.
The remaining foreign sales were primarily to customers in
Europe, Canada and Mexico.
We use several metrics as indicators of future potential growth. The indicators that we believe best correlate to potential future revenue growth are design wins and new product releases. There are many factors that may cause a design win or new product release to not result in revenue, including a customer decision not to go to system production, a change in a customer’s perspective regarding a product’s value or a customer’s product failing in the end-market. As a result, although a design win or new product introduction is an important step towards generating future revenue, it does not inevitably result in us being awarded business or receiving a purchase commitment.
37
Results of Operations
Fiscal Year
2018
Compared With Fiscal Year
2017
All periods presented in the following summary of sales by major end-market reflect our current classification methodology (see Note
1
to our Consolidated Financial Statements in this Annual Report on Form 10-K for a description of each market category):
|
Fiscal Years
|
||||||||||||||||
|
(in thousands, except percentages)
|
2018
|
2017
|
||||||||||||||
|
Net Sales
|
% Net Sales
|
Net Sales
|
% Net Sales
|
Change
|
||||||||||||
|
Enterprise Computing
|
198,222
|
|
34
|
%
|
168,846
|
|
31
|
%
|
17
|
%
|
||||||
|
Industrial and Other
|
153,114
|
|
26
|
%
|
141,660
|
|
26
|
%
|
8
|
%
|
||||||
|
High-End Consumer
|
181,822
|
|
31
|
%
|
140,887
|
|
26
|
%
|
29
|
%
|
||||||
|
Communications
|
70,908
|
|
12
|
%
|
98,275
|
|
18
|
%
|
(28
|
)%
|
||||||
|
Other: Warrant Shares
|
(16,219
|
)
|
(3
|
)%
|
(5,396
|
)
|
(1
|
)%
|
201
|
%
|
||||||
|
Total
|
$
|
587,847
|
|
100
|
%
|
$
|
544,272
|
|
100
|
%
|
8
|
%
|
||||
Net Sales.
Net sales for fiscal year
2018
were
$587.8 million
, an
increase
of
8%
compared to
$544.3 million
for fiscal year
2017
. During fiscal year
2018
, our revenues within the high-end consumer end-market increased as a result of expanded use of our proximity sensing solutions and protection products across a broader range of phones and other devices. Our enterprise computing end-market benefited from strong demand for our optical products which are well positioned for the current cycle of datacenter upgrades and increased PON deployments. The escalating adoption of our LoRa® devices and wireless radio frequency technology ("LoRa Technology") continued to drive growth in the industrial market. The decline in our communications end-market was driven by lower demand in surveillance systems and base station markets.
In fiscal year
2019
, activity in the communications, enterprise computing and industrial end-markets is expected to benefit from continued demand for datacenter upgrades, and the build-out of metro communications infrastructure, including wireless base stations (specifically in China) and IoT applications.
Gross Profit.
Gross profit was
$352.0 million
and
$324.9 million
in fiscal years
2018
and
2017
, respectively. Our gross margin
was
59.9%
for fiscal year
2018
, comparable with
59.7%
in fiscal year
2017
. Fiscal year
2018
performance benefited from a more favorable mix of higher margin product sales, the benefit of which was offset by the $16.2 million charge (2.8% of net sales) related to the warrant ("Warrant") issued to Comcast Cable Communications Management LLC ("Comcast") which was reported as a reduction to revenue. In fiscal year 2017, the charge related to the Warrant was $5.4 million (1% of net sales). We expect overall gross margins for fiscal year
2019
to remain consistent with our fiscal year
2018
performance.
Operating Costs and Expenses
.
|
Fiscal Years
|
||||||||||||||||
|
(in thousands, except percentages)
|
2018
|
2017
|
||||||||||||||
|
Cost/Exp.
|
% Net Sales
|
Cost/Exp.
|
% Net Sales
|
Change
|
||||||||||||
|
Selling, general and administrative
|
146,303
|
|
27
|
%
|
138,708
|
|
25
|
%
|
5
|
%
|
||||||
|
Product development and engineering
|
104,798
|
|
19
|
%
|
102,500
|
|
19
|
%
|
2
|
%
|
||||||
|
Intangible amortization
|
27,867
|
|
5
|
%
|
25,301
|
|
5
|
%
|
10
|
%
|
||||||
|
Gain on disposition of business operations
|
375
|
|
—
|
%
|
(25,513
|
)
|
(5
|
)%
|
(101
|
)%
|
||||||
|
Changes in the fair value of contingent earn-out obligations
|
3,892
|
|
1
|
%
|
(215
|
)
|
—
|
%
|
(1,910
|
)%
|
||||||
|
Total operating costs and expenses
|
$
|
283,235
|
|
52
|
%
|
$
|
240,781
|
|
44
|
%
|
18
|
%
|
||||
Selling, General & Administrative Expense
Selling, general and administrative ("SG&A") expenses for fiscal year
2018
increase
d by
$7.6 million
as a result of a $6.3 million increase in share-based compensation and higher restructuring costs of
$6.3 million
compared to $2.3 million in fiscal year 2017. The higher levels of share-based compensation expense primarily resulted from much higher levels of anticipated
38
performance achievement, for awards with performance-based vesting conditions, and the impact of increases in our stock price and the related fair value re-measurement of awards accounted for as liability rather than equity.
Product Development and Engineering Expenses
Product development and engineering expenses for fiscal years
2018
and
2017
were
$104.8 million
and
$102.5 million
, respectively or an
increase
of
2%
. The
increase
was primarily a result of lower recoveries for non-recurring engineering
services and incremental spending associated with the development of SDVoE, partially offset by the benefit of lower spending compared with the higher expense associated with our actions in fiscal year 2017 to reduce our investment in the defense and microwave communications markets and to sell our Snowbush IP business to Rambus.
The levels of product development and engineering expenses reported in a fiscal period can be significantly impacted, and therefore experience period over period volatility, by the number of new product tape-outs and by the timing of recoveries from non-recurring engineering services which are recorded as a reduction to product development and engineering expense.
Intangible Amortization
Intangible amortization was
$27.9 million
and
$25.3 million
in fiscal years
2018
and
2017
, respectively. The increase is related to the amortization of intangible assets that were established as part of the purchase price allocation for AptoVision.
Gain on Disposition of Business Operations
In the third quarter of fiscal year 2017, we completed our divestiture of Snowbush IP to Rambus. As a result, we recognized a gain of $25.5 million on the disposition of this business.
Changes in the Fair Value of Contingent Earn-out Obligations
The contingent earn-out expense
increased
by
$4.1 million
in fiscal year
2018
primarily as a result of
the change in our estimated probability of projected net revenue and adjusted earnings associated with the AptoVision Earn-out.
We measure contingent earn-out liabilities at fair value on a recurring basis using significant unobservable inputs classified within Level 3 of the fair value hierarchy. We use a Monte Carlo valuation method as a valuation technique to determine the value of the earn-out liability. The significant unobservable inputs used in the fair value measurements are revenue projections over the earn-out period, and the probability outcome percentages assigned to each scenario. Significant increases or decreases to either of these inputs in isolation would result in a significantly higher or lower liability, with a higher liability capped by the
contractual maximum of the contingent earn-out obligation. Ultimately, the liability will be equivalent to the amount paid, and the difference between the fair value estimate and amount paid will be recorded in earnings.
None of the Triune Earn-out targets were met and we did not make any payments for the Triune Earn-out opportunity.
Interest Expense
Interest expense was
$8.0 million
and
$9.3 million
for fiscal years
2018
and
2017
, respectively. The
$1.3 million
decrease
is
primarily related to the non-reoccurrence of debt issuance costs and the write-off of historical debt issuance costs resulting from the debt modification that was completed in the fourth quarter of fiscal year 2017.
Our interest rate under our Amended and Restated Credit Agreement dated November 15, 2016 with certain lenders (the "Lenders") and HSBC Bank USA, National Association, as administrative agent (in such capacity, the "Administrative Agent") and as swing line lender and letter of credit issuer (the "Credit Agreement") can be influenced by our consolidated leverage ratio, as defined in the Credit Agreement ("Leverage Ratio"). Our Leverage Ratio is influenced by our consolidated indebtedness and our adjusted earnings before interest, taxes, depreciation and amortization.
Primarily as a result of declining revenue, our Leverage Ratio exceeded 2.50 at the beginning of fiscal year 2017 which resulted in our rate margin increasing to 2.25%. As our sales performance improved, we ended fiscal year 2017 with a Leverage Ratio of approximately 1.69. At the end of fiscal year 2018, our Leverage Ratio was 1.23 as we continued to benefit from increasing sales. We believe that our Leverage Ratio will continue to improve in the first quarter of fiscal year 2019 as a result of continued strength in sales trends. The impact of the benefit of improvements to our Leverage Ratio on our total interest costs is being more than offset by increases in the 30 day LIBOR rate. If the 30 day LIBOR rate increases 100 basis points, our interest costs for fiscal year 2019 will increase by $2.3 million.
Interest
Income and Other Expense, Net
Interest income and other expense, net was an expense of
$0.9 million
in fiscal year
2018
compared to
$1.7 million
in fiscal year
2017
. Interest income earned in the past few years has been insignificant. The slightly lower expense in fiscal year
2018
was primarily related to changes in the impact of movements in foreign exchange rates.
Provision for Taxes
The provision for income taxes was
$23.2 million
for fiscal year
2018
compared to
$18.4 million
for fiscal year
2017
. The effective tax rates for fiscal years
2018
and
2017
were a tax provision of
38.9%
and
25.2%
, respectively.
Our effective tax rate
39
increase was primarily the results of the one-time provisional impact of the U.S. Tax Cuts and Jobs Act of 2017 (“Tax Act”) that was enacted in December 2017. We do not expect the Tax Act to have a material impact on our future overall effective tax rate since U.S. based activities have historically generated operating losses for tax purposes. We have established a valuation allowance against these operating losses and, given our current assessment of operations, we expect to continue to establish valuation allowances against future generated operating losses. We will continue to assess the impact of, and opportunities presented by, the Tax Act on our operations.
We receive a tax benefit from a tax holiday that was granted in Switzerland. The tax holiday is effective for five years (“Initial Term”) and can be extended for an additional five years subject to meeting certain staffing targets. The ability to meet the requirements to extend the ruling is within our control and we do not anticipate any issues meeting the established targets. The maximum benefit under this tax holiday is CHF 500.0 million. Depending on the operational performance of our Swiss operations, it is possible that we could utilize the maximum benefit during the Initial Term. Once the term of the tax holiday expires or we achieve the maximum benefit, our effective tax rate could be negatively impacted if we are unable to negotiate an extension or expansion of the tax holiday.
For further information on the effective tax rate and Tax Act’s impact, see “Note 12: Income Taxes” within the Consolidated Financial Statements.
Fiscal Year
2017
Compared With Fiscal Year
2016
All periods presented in the following summary of sales by major end-market reflect our current classification methodology (see Note
1
to our Consolidated Financial Statements in this Annual Report on Form 10-K for a description of each market category):
|
Fiscal Years
|
||||||||||||||||
|
(in thousands, except percentages)
|
2017
|
2016
|
||||||||||||||
|
Net Sales
|
% Net Sales
|
Net Sales
|
% Net Sales
|
Change
|
||||||||||||
|
Enterprise Computing
|
168,846
|
|
31
|
%
|
145,047
|
|
30
|
%
|
16
|
%
|
||||||
|
Industrial and Other
|
141,660
|
|
26
|
%
|
127,779
|
|
26
|
%
|
11
|
%
|
||||||
|
High-End Consumer
|
140,887
|
|
26
|
%
|
125,033
|
|
25
|
%
|
13
|
%
|
||||||
|
Communications
|
98,275
|
|
18
|
%
|
92,360
|
|
19
|
%
|
6
|
%
|
||||||
|
Other: Warrant Shares
|
(5,396
|
)
|
(1
|
)%
|
—
|
|
—
|
%
|
(100
|
)%
|
||||||
|
Total
|
$
|
544,272
|
|
100
|
%
|
$
|
490,219
|
|
100
|
%
|
11
|
%
|
||||
Net Sales.
Net sales for fiscal year
2017
were
$544.3 million
, an
increase
of
11%
compared to
$490.2 million
for fiscal year
2016
which had benefited from an additional week compared to fiscal year
2017
. The net sales from this additional week were not significant. Fiscal year
2017
revenues within the enterprise computing end-market benefited from particular strength from our optical products which are well positioned for the current cycle of datacenter upgrades
and increased deployments of PONs, particularly in China
.
The continued decline of 40Gbps and 100Gbps SerDes devices going into the long-haul optical market in the communications end-market was offset by strength in the wireless base station market primarily in China. Net sales increased in our high-end consumer end-market due to higher demand from our largest Korean customers as well as strong growth from our China smartphone customers.
Gross Profit.
Gross profit was
$324.9 million
and
$293.1 million
in fiscal years
2017
and
2016
, respectively. Our gross margin was
59.7%
for fiscal year
2017
, comparable with
59.8%
in fiscal year
2016
. Fiscal year
2017
performance benefited from a more favorable mix of higher margin product sales, the benefit of which was offset by the $5.4 million charge related to the Comcast Warrant which was reported as a reduction to revenue.
40
Operating Costs and Expenses
.
|
Fiscal Years
|
||||||||||||||||
|
(in thousands, except percentages)
|
2017
|
2016
|
||||||||||||||
|
Cost/Exp.
|
% Net Sales
|
Cost/Exp.
|
% Net Sales
|
Change
|
||||||||||||
|
Selling, general and administrative
|
138,708
|
|
25
|
%
|
140,677
|
|
29
|
%
|
(1
|
)%
|
||||||
|
Product development and engineering
|
102,500
|
|
19
|
%
|
113,737
|
|
23
|
%
|
(10
|
)%
|
||||||
|
Intangible amortization
|
25,301
|
|
5
|
%
|
25,059
|
|
5
|
%
|
1
|
%
|
||||||
|
Gain on disposition of business operations
|
(25,513
|
)
|
(5
|
)%
|
—
|
|
—
|
%
|
(100
|
)%
|
||||||
|
Changes in the fair value of contingent earn-out obligations
|
(215
|
)
|
—
|
%
|
(16,362
|
)
|
(3
|
)%
|
(99
|
)%
|
||||||
|
Total operating costs and expenses
|
$
|
240,781
|
|
44
|
%
|
$
|
263,111
|
|
54
|
%
|
(8
|
)%
|
||||
Selling, General & Administrative Expenses
Selling, general and administrative ("SG&A") expenses for fiscal year
2017
decrease
d by
$2.0 million
as the benefit from the restructuring actions taken in fiscal year 2016, lower legal fees, and the non-reoccurrence of environmental reserves of $2.9 million were offset by an $8.0 million increase in share-based compensation resulting primarily from our higher stock price and a $9.5 million increase in our supplemental compensation costs associated with our improved financial performance.
This is offset by the $4.5 million we incurred for restructuring charges in fiscal year 2016, for severance and contract cancellation liabilities related to our decision to reduce our investments in the defense and microwave communications and long-haul optical markets, realign product groupings, and align spending with anticipated demand levels. Restructuring charges in fiscal year 2017, at $2.2 million, were more limited and focused on better aligning our global operational footprint with our updated business strategies.
Product Development and Engineering Expenses
Product development and engineering expenses for fiscal years
2017
and
2016
were
$102.5 million
and
$113.7 million
, respectively or a
decrease
of
10%
. The
decrease
was primarily a result of our decision to reduce our investment in the defense and microwave communications markets and to sell our Snowbush IP business to Rambus. The savings from these actions were partially offset by lower recoveries from third parties for non-recurring engineering services.
The levels of product development and engineering expenses reported in a fiscal period can be significantly impacted, and therefore experience period over period volatility, by the number of new product tape-outs and by the timing of recoveries from non-recurring engineering services which are recorded as a reduction to product development and engineering expense.
Intangible Amortization
Intangible amortization was
$25.3 million
and
$25.1 million
in fiscal years
2017
and
2016
, respectively.
Gain on Disposition of Business Operations
In the third quarter of fiscal year 2017, we completed our divestiture of Snowbush IP to Rambus. As a result, we recognized a gain of $25.5 million on the disposition of this business.
Changes in the Fair Value of Contingent Earn-out Obligations
The contingent earn-out expense
decrease
d by
$16.1 million
in fiscal year
2017
primarily as a result of a significant reduction in our estimate of projected revenue associated with the Triune Earn-out.
We measure contingent earn-out liabilities at fair value on a recurring basis using significant unobservable inputs classified within Level 3 of the fair value hierarchy. We use a Monte Carlo valuation method as a valuation technique to determine the value of the earn-out liability. The significant unobservable inputs used in the fair value measurements are revenue projections over the earn-out period, and the probability outcome percentages assigned to each scenario. Significant increases or decreases to either of these inputs in isolation would result in a significantly higher or lower liability, with a higher liability capped by the contractual maximum of the contingent earn-out obligation. Ultimately, the liability will be equivalent to the amount paid, and the difference between the fair value estimate and amount paid will be recorded in earnings. The Triune Earn-out targets for fiscal years
2017
and
2016
were not met and we do not expect to make any payments with regards to these periods which represented $36.0 million of the total $70.0 million opportunity.
Interest Expense
Interest expense was
$9.3 million
and
$7.8 million
for fiscal years
2017
and
2016
, respectively. The
$1.5 million
increase
is primarily related to the write-off of $0.5 million of debt issuance costs as a result of a debt modification that was completed in the fourth quarter of fiscal year 2017 and higher interest rates.
41
Our interest rate under our Amended and Restated Credit Agreement dated November 15, 2016 with certain lenders (the "Lenders") and HSBC Bank USA, National Association, as administrative agent (in such capacity, the "Administrative Agent") and as swing line lender and letter of credit issuer (the "Credit Agreement") can be influenced by our consolidated leverage ratio, as defined in the Credit Agreement ("Leverage Ratio"). Our Leverage Ratio is influenced by our consolidated indebtedness and our adjusted earnings before interest, taxes, depreciation and amortization. Historically, our Leverage Ratio under the Credit Agreement and prior credit agreement has been between 1.50 and 2.25 which resulted in an interest rate margin between 1.75% and 1.88%. Primarily as a result of declining revenue, our Leverage Ratio exceeded 2.50 at the end of fiscal year 2016 and the beginning of fiscal year 2017 which resulted in our rate margin increasing to 2.25%. As a result of higher sales, we ended fiscal year 2017 with a Leverage Ratio of approximately 1.69. The impact of the benefit of improvements to our Leverage Ratio on our total interest costs is being offset by increases in the 30 day LIBOR rate. If the 30 day LIBOR rate increases 25 basis points, our interest costs for fiscal year 2018 will increase by $0.6 million.
Interest Income and Other Expense, Net
Interest income and other expense, net was an expense of
$1.7 million
in fiscal year
2017
compared to
$1.8 million
in fiscal year
2016
. Interest income earned in the past few years has been insignificant. The slightly higher expense in fiscal year
2017
was primarily related to the impact of unfavorable movements in foreign exchange rates.
Provision for Taxes
The provision for income taxes was
$18.4 million
for fiscal year
2017
compared to
$8.9 million
for fiscal year
2016
. The effective tax rates for fiscal years
2017
and
2016
were a tax provision of
25.2%
and
43.6%
, respectively. The effective tax rates for fiscal years
2017
and
2016
reflect the adverse impact of $5.6 million and
$1.8 million respecti
vely, related to a valuation reserve against our deferred tax assets.
Our effective tax rate in fiscal year 2017 differs from the statutory federal income tax rate of 35% due primarily to a valuation reserve against our deferred tax assets and certain undistributed foreign earnings for which no U.S. taxes are provided, because such earnings are indefinitely reinvested outside of the U.S. The effective tax rate in fiscal year 2017 is lower than the statutory federal income tax rate due to regional mix of income causing a portion of the earnings to be taxed at foreign tax rates which are less than the federal rate. During fiscal year 2017, we also received an income tax rate benefit for our research and development tax credits in the United Kingdom ("U.K") and Canada.
We account for income taxes using the asset and liability method, which requires the recognition of deferred tax assets and liabilities for the expected future tax consequences of temporary differences between the carrying amounts and tax basis of the assets and liabilities.
As of
January 29, 2017
, we had a valuation allowance against our U.S. deferred tax assets of approximately
$83.0 million. We are required to assess whether a valuation allowance should be recorded against our deferred tax assets ("DTAs") based on the consideration of all available evidence, using a "more likely than not" realization standard. The four sources of taxable income that must be considered in determining whether DTAs will be realized are; (1) future reversals of existing taxable temporary differences (i.e. offset of gross deferred tax assets against gross deferred tax liabilities); (2) taxable income in prior carryback years, if carryback is permitted under the tax law; (3) tax planning strategies and (4) future taxable income exclusive of reversing temporary differences and carry-forwards.
In assessing whether a valuation allowance is required, significant weight is to be given to evidence that can be objectively verified. We have evaluated our DTAs each reporting period, including an assessment of our cumulative income or loss over the prior three-year period, to determine if a valuation allowance was required. A significant negative factor in our assessment was our three-year cumulative loss history in the U.S. as of
January 29, 2017
.
In fiscal years 2013 through 2015, our Canadian operations were in a cumulative loss position due to a loss generated in fiscal year 2013. However, as of the end of fiscal year 2016, Gennum was in a three year cumulative income position, since the loss that was generated in fiscal year 2013 was no longer included in the three year window for measuring income or loss. We are forecasting pretax income growth for Gennum over the next five years, and correspondingly estimated our Canadian-based taxes over the next five years. We compared the amount of taxes that we will owe in this period to our net deferred tax assets and concluded that we would be able to utilize our deferred tax assets without any concerns related to expiration.
We are forecasting pretax income growth for Gennum over the next five years, and correspondingly estimated our Canadian based taxes over the next five years. We compared the amount of taxes that we will owe in this period to our net deferred tax assets and concluded that we would be able to utilize our deferred tax assets without any concerns related to expiration.
We were able to conclude that the positive evidence related to long-term profitability and utilization of all deferred tax assets was sufficient to warrant a full release of the reserve on our Canadian deferred tax assets. As such, we released the entire reserve of approximately $7.2 million on our Canadian deferred tax asset in fiscal year 2016.
42
After a review of the four sources of taxable income described above and in view of our three-year cumulative loss, we were not able to conclude that it is more likely than not that our U.S. DTAs will be realized. As a result, we continue to record a full valuation allowance on our DTAs in the U.S, with a corresponding charge to the income tax provision.
As we enter fiscal year
2018
, we expect our tax rate to face upward pressure as a result of a less favorable mix of foreign and domestic income and our expected continued inability to benefit from U.S. deferred tax assets as a result of our recent history of tax losses in the U.S.
As a global organization, we are subject to audit by taxing authorities in various jurisdictions. To the extent that an audit, or the closure of a statute of limitations, results in our adjusting our reserves for uncertain tax positions, our effective tax rate could experience extreme volatility since any adjustment would be recorded as a discrete item in the period of adjustment.
43
Liquidity and Capital Resources
Our capital requirements depend on a variety of factors, including but not limited to, the rate of increase or decrease in our existing business base; the success, timing and amount of investment required to bring new products to market; revenue growth or decline; and potential acquisitions. We believe that we have the financial resources necessary to meet business requirements for the next 12 months, including funds needed for working capital requirements.
As of
January 28, 2018
, our total stockholders’ equity was
$665.0 million
. At that date, we also had approximately
$307.9 million
in cash and cash equivalents and
$226.5 million
of borrowings, net of debt discount.
We incur significant expenditures in order to fund the development, design, and manufacture of new products. We intend to continue to focus on those areas that have shown potential for viable and profitable market opportunities, which may require additional investment in equipment and the hiring of additional design and application engineers aimed at developing new products. Certain of these expenditures, particularly the addition of design engineers, do not generate significant payback in the short-term. We plan to finance these expenditures with cash generated by our operations and our existing cash balances.
A meaningful portion of our capital resources, and the liquidity they represent, are held by our foreign subsidiaries. As of
January 28, 2018
, our foreign subsidiaries held approximately
$215.1 million
of cash and cash equivalents compared to
$224.6 million
at
January 29, 2017
. Earnings previously taxed in the U.S. of
$19.0 million
could be repatriated subject only to a 5% withholding tax, as we do not assert permanent reinvestment of earnings previously taxed in the U.S. Additionally, in connection with the enactment of the Act, we determined that we will remit approximately $240.0 million of foreign earnings in the foreseeable future, and as a result, we have updated our assertion to reflect this change. As of
January 28, 2018
, our foreign subsidiaries had
$453.6 million
of unremitted earnings for which no Federal or state taxes have been provided. Those historical earnings have been and are expected to continue to be permanently reinvested.
One of our primary goals is to improve the cash flows from our existing business activities. Additionally, we will continue to seek to maintain or improve our existing business performance and deploy our accumulated cash balances in the most effective manner through alternatives such as capital expenditures, and potentially, acquisitions and other investments that support achievement of our business strategies. Acquisitions may be made for either cash or stock consideration, or a combination of both.
Operating Activities
Net cash provided by operating activities is primarily due to net income adjusted for non-cash items plus fluctuations in operating assets and liabilities.
Operating cash flows for fiscal years
2018
and
2017
were impacted by several significant non-cash transaction related items including, for fiscal
2018
, depreciation and amortization expense of
$49.0 million
and share-based compensation expense of
$47.9 million
. The significant non-cash transactions for fiscal
2017
included depreciation and amortization expense of
$47.1 million
, share-based compensation expense of
$30.8 million
.
Investing Activities
Cash flows from investing activities is primarily attributable to capital expenditures, net of proceeds from sales of property, plant and equipment and proceeds from sales of investments. Investing activities are also impacted by acquisitions, net of any cash received.
Capital expenditures were
$35.5 million
and
$32.9 million
in fiscal years 2018 and
2017
, respectively. On November 4, 2016, we entered into an agreement to acquire the facility we were leasing in Burlington, Ontario, Canada for $12.1 million. The transaction closed on December 2016, and we used available cash on hand to fund this purchase. In fiscal year
2018
, we increased capital expenditures to support our business growth and the release of new products.
In fiscal year
2019
, we expect our capital expenditures to be flat compared to our fiscal year 2018 levels. If product demand were to increase significantly beyond current projections, we would expect to increase capital spending to accommodate the growth. Similarly, to the extent practical, we would expect to decrease capital spending to address market contractions.
On July 1, 2017, we acquired AptoVision for an upfront cash payment of $17.6 million at closing, net of acquired cash, and a commitment to pay an additional contingent consideration of up to a maximum of $47.0 million over three years if certain goals are achieved in each of the earn out periods. We expect to fund any obligations associated with the additional cash consideration with cash generated by our operations and our existing cash balances.
In fiscal year
2018
, we invested $9.7 million in companies that are enabling the LoRaWAN
TM
ecosystem and developing technologies to support the requirements of our customers.
Financing Activities
Cash provided by financing activities is primarily attributable to borrowings under our revolving commitments offset by principal and interest payments related to our long-term debt and repurchase of outstanding common stock.
44
On May 2, 2013, we entered into a credit agreement with certain lenders (the "Prior Lenders") and HSBC Bank USA, National Association, as administrative agent and as swing line lender and letter of credit issuer (the "Prior Credit Agreement"). In accordance with this Prior Credit Agreement, the Prior Lenders provided us with senior secured first lien credit facilities in an aggregate principal amount of $400.0 million, consisting of term loans in an aggregate principal amount of $150.0 million and revolving line of credit commitments in an aggregate principal amount of $250.0 million.
On November 15, 2016 (the "Closing Date"), we entered into the Credit Agreement to refinance the Prior Credit Agreement. We accounted for the Credit Agreement as a debt modification. Pursuant to the Credit Agreement, the Lenders provided us with senior secured first lien credit facilities in an aggregate principal amount of $400.0 million (the "Facilities"), consisting of term loans in an aggregate principal amount of $150.0 million (the "Term Loans") and revolving commitments in an aggregate principal amount of $250.0 million (the "Revolving Commitments"). Up to $40.0 million of the Revolving Commitments may be used to obtain letters of credit, up to $25.0 million of the Revolving Commitments may be used to obtain swing line loans, and up to $40.0 million of the Revolving Commitments may be used to obtain revolving loans and letters of credit in certain currencies other than U.S. Dollars ("Alternative Currencies"). Each of the Term Loans and the Revolving Commitments is scheduled to mature on November 12, 2021.
The Credit Agreement refinanced our existing $400.0 million senior secured first lien credit facilities. All of the proceeds of the new Term Loans were used to repay in full all of the obligations outstanding under the Prior Credit Agreement and to pay
transaction costs in connection with such refinancing and the Credit Agreement. As of
January 28, 2018
we have $131.3 million
outstanding under our Term Loa
ns and $97.0 million
outstanding under our Revolving Commitments.
As of
January 28, 2018
,
$153.0 million of t
he new Revolving Commitments were undrawn. The proceeds of the revolving credit facility may be used by us for capital expenditures, permitted acquisitions, permitted dividends, working capital and general corporate purposes.
The Credit Agreement provides that, subject to certain conditions, we may request, at any time and from time to time, the establishment of one or more additional term loan facilities and/or increases to the Revolving Commitments in an aggregate principal amount not to exceed the sum of (a) $150.0 million and (b) the aggregate principal amount of all voluntary prepayments of Term Loans made prior to the date of incurrence of such additional term loan facilities and/or increases to the Revolving Commitments; however, the Lenders are not required to provide such increase upon our request.
Interest on loans made under the Credit Agreement in U.S. Dollars accrues, at our option, at a rate per annum equal to (1) the Base Rate (as defined below) plus a margin ranging from 0.25% to 1.25% depending upon our consolidated leverage ratio or (2) LIBOR (determined with respect to deposits in U.S. Dollars) for an interest period to be selected by us plus a margin ranging from 1.25% to 2.25% depending upon our consolidated leverage ratio (such margin, the "Applicable Margin"). The "Base Rate" is equal to a fluctuating rate equal to the highest of (a) the prime rate of the Administrative Agent, (b) ½ of 1% above the federal funds effective rate published by the Federal Reserve Bank of New York and (c) one-month LIBOR (determined with respect to deposits in U.S. Dollars) plus 1.00%.
Interest on loans made under the Credit Agreement in Alternative Currencies accrues at a rate per annum equal to LIBOR (determined with respect to deposits in the applicable Alternative Currency) (other than loans made in Canadian Dollars, for which a special reference rate for Canadian Dollars applies) for an interest period to be selected by us plus the Applicable Margin.
The outstanding principal balance of the Term Loans is subject to repayment in equal quarterly installments in an amount equal to 10.0% per annum of the original principal amount of the Term Loans on the Closing Date in the first two years after such date, 12.5% per annum in years three and four after such date, and 15.0% per annum in year five after such date, with the balance being due at maturity on November 12, 2021. No amortization is required with respect to the revolving credit facility. We may voluntarily prepay borrowings under the Facilities at any time and from time to time, without premium or penalty, other than customary "breakage costs" and fees for LIBOR-based loans.
The Term Loans must be mandatorily prepaid using the proceeds of certain dispositions of assets and receipt of insurance proceeds, subject to agreed upon thresholds and exceptions and customary reinvestment rights.
We currently have in effect a stock repurchase program that was initially approved by our Board of Directors in March 2008. This program represents one of our principal efforts to return value to our stockholders. During fiscal years
2018
and
2017
, we repurchased shares of common stock under this program for
$14.8 million
and
$1.0 million
, respectively. As of
January 28, 2018
, we had repurchased
$151.4 million
in shares of our common stock under the program since inception and the current remaining authorization under the program is
$47.0 million
.
In fiscal years
2018
and
2017
, we received
$6.7 million
in proceeds from the exercise of stock options. We do not directly control the timing of the exercise of stock options. Such exercises are independent decisions made by grantees and are influenced most directly by the stock price and the expiration dates of stock option awards. Such proceeds are difficult to
45
forecast, resulting from several factors which are outside our control. We believe that such proceeds will remain a nominal source of cash in the future.
Off-Balance Sheet Arrangements
We do not have any off-balance sheet arrangements, as those arrangements are defined by the SEC, that are reasonably likely to have a material effect on our financial condition, revenues or expenses, operating results, liquidity, capital expenditures or capital resources.
We do not have any unconsolidated subsidiaries or affiliated entities. We have no special purpose or limited purpose entities that provide off-balance sheet financing, liquidity or market or credit risk support. We do not engage in leasing, hedging, research and development services, or other relationships that expose us to liability that is not reflected on the face of the Consolidated Financial Statements.
Noted below under "Contractual Obligations" are various commitments we have associated with our business, such as lease commitments and open purchase obligations, which are not recorded as liabilities on our balance sheet because we have
not
yet received the related goods or services as of
January 28, 2018
.
Contractual Obligations
Presented below is a summary of our contractual obligations as of
January 28, 2018
.
|
(in thousands)
|
Less than 1 year
|
1-3 years
|
4-5 years
|
After 5 years
|
Total
|
||||||||||||||
|
Long-term debt
|
$
|
15,937
|
|
$
|
212,313
|
|
$
|
—
|
|
$
|
—
|
|
$
|
228,250
|
|
||||
|
Operating leases
|
4,693
|
|
|
7,403
|
|
|
1,906
|
|
|
41
|
|
|
14,043
|
|
|||||
|
Open capital purchase commitments
|
7,877
|
|
|
—
|
|
|
—
|
|
|
—
|
|
|
7,877
|
|
|||||
|
Other open purchase commitments
|
56,771
|
|
|
1,771
|
|
|
—
|
|
|
—
|
|
|
58,542
|
|
|||||
|
Deferred compensation
|
2,333
|
|
|
3,257
|
|
|
1,236
|
|
|
23,704
|
|
|
30,530
|
|
|||||
|
Cycleo-deferred compensation
|
2,008
|
|
1,919
|
|
1,593
|
|
—
|
|
5,520
|
|
|||||||||
|
AptoVision Earn-out
|
8,900
|
|
12,100
|
|
—
|
|
—
|
|
21,000
|
|
|||||||||
|
Share-based compensation
|
—
|
|
|
12,420
|
|
|
—
|
|
|
—
|
|
|
12,420
|
|
|||||
|
Swiss plan
(1)
|
1,857
|
|
3,297
|
|
3,155
|
|
7,797
|
|
16,106
|
|
|||||||||
|
Total contractual cash obligations
|
$
|
100,376
|
|
|
$
|
254,480
|
|
|
$
|
7,890
|
|
|
$
|
31,542
|
|
|
$
|
394,288
|
|
(1)
Amounts include expected payments under the current defined benefit pension plan for the employees of its Swiss subsidiary
through 2027.
The table above includes the interest payments we owe on our long-term debt. We have assumed no additional borrowings or repayments under our revolving credit facility. For debt that has variable rate interest, we have calculated future interest obligations based on the interest rate for that debt as of
January 28, 2018
.
Capital purchase commitments and other open purchase commitments are for the purchase of plant, equipment, raw material, supplies and services. They are not recorded as liabilities on our balance sheet as of
January 28, 2018
, as we have not yet received the related goods or taken title to the property.
As part of our acquisition of AptoVision and Cycleo SAS ("Cycleo"), we have agreed to pay consideration if certain revenue and operating income targets are achieved in each of the measurement periods. See Note
13
to our Consolidated Financial Statements included in Item 8 of this Annual Report on Form 10-K.
The table above does not include earn-out payments we may owe as part of our acquisition of Triune. The Triune Earn-out targets for all eligible periods were not met and we did not make any payments with regards to these periods which represented a $70.0 million opportunity.
We maintain a deferred compensation plan for certain officers and key executives that allow participants to defer a portion of their compensation for future distribution at various times permitted by the plan. Our liability for deferred compensation under this plan was
$30.5 million
and
$24.1 million
as of
January 28, 2018
and
January 29, 2017
, respectively, and is included in accrued liabilities and other long-term liabilities on the balance sheet and in the table above. The plan provides for a discretionary Company match up to a defined portion of the employee’s deferral, with any match subject to a vesting period.
We have purchased whole life insurance on the lives of some of our current and former deferred compensation plan participants. This Company-owned life insurance is held in a grantor trust and is intended to cover a majority of the costs of our
46
deferred compensation plan. The cash surrender value of our Company-owned life insurance was
$22.3 million
and
$18.9 million
as of
January 28, 2018
and
January 29, 2017
, respectively.
Inflation
Inflationary factors have not had a significant effect on our performance over the past several years. A significant increase in inflation would affect our future performance if we were unable to pass these higher costs on to our customers.
47
Critical Accounting Policies and Estimates
We prepare our consolidated financial statements in accordance with U.S. Generally Accepted Accounting Principles (GAAP). In doing so, we have to make estimates and assumptions that affect our reported amounts of assets, liabilities, revenues, and expenses, as well as related disclosure of contingent assets and liabilities. Accordingly, actual results could differ materially from our estimates. We consider an accounting policy to be a "critical accounting policy and estimate" if: (1) we must make assumptions that were uncertain when the judgment was made, and (2) changes in the estimate assumptions, or selection of a different estimate methodology could have a significant impact on our financial position and the results that we report in our consolidated financial statements. While we believe that our estimates, assumptions, and judgments are reasonable, they are based on information available when the estimate was made.
Refer to "Note
2
: Accounting Policies" within the Consolidated Financial Statements for further information on our critical accounting estimates and policies, which are as follows:
|
•
|
Inventories
- Inventoried product reflected at the lower of cost or market value considering future demand and market conditions; evaluation of inventories for excess quantities and obsolescence utilizing an analysis of sales levels by product and projections of future demand;
|
|
•
|
Business combinations
- the assumptions used to allocate the purchase price paid for assets acquired and liabilities assumed in connection with our acquisitions;
|
|
•
|
Property, plant and equipment
- the useful life determination and the related timing of when depreciation begins;
|
|
•
|
Long-lived assets
- the valuation methods and assumptions used in assessing the impairment of property, plant and equipment, identified intangibles, and goodwill, including the determination of asset groupings and the identification and allocation of goodwill to reporting units;
|
|
•
|
Revenue recognition -
the criteria used to recognize revenue. Adjustments to net sales due to offset by the cost of the Warrant issued to Comcast over the respective performance period (since the Warrant was issued to our customer in exchange for services) are further discussed in "Note
11
: Share-Based Compensation".
Since the computation of the Warrant cost is based on the level of performance completed and the then current fair value of the unvested Warrant milestones, rather than unit sales, net sales can experience variability that is unrelated to the recognition of revenue.
|
|
•
|
Income taxes -
the identification and measurement of deferred tax assets and liabilities and the provisional estimates associated with Tax Reform; and
|
|
•
|
Contingencies
- the estimation of when a loss is probable and reasonably estimable; measurement of contingent earn-out liabilities at fair value on a recurring basis using significant unobservable inputs classified within Level 3 of the fair value hierarchy.
|
New Accounting Standards
New accounting standards are discussed in Note
2
to our Consolidated Financial Statements, included in Item 8, of this Annual Report on Form 10-K.
48
|
Item 7A.
|
Quantitative and Qualitative Disclosures About Market Risk
|
We are subject to a variety of market risks, including commodity risk and the risks related to foreign currency, interest rates and market performance that are detailed below. Many of the factors that can have an impact on our market risk are external to us, and so we are unable to fully predict them.
Market Conditions
A deterioration of global economic conditions can impact demand for our products which could result in changes in customer order patterns, including order cancellations, and changes in the level of inventory held by vendors.
Commodity Risk
We are subject to risk from fluctuating market prices of certain commodity raw materials, particularly gold, that are incorporated into our end products or used by our suppliers to process our end products. Increased commodity prices are passed on to us in the form of higher prices from our suppliers, either in the form of general price increases or a commodity surcharge. Although we generally deal with our suppliers on a purchase order basis rather than on a long-term contract basis, we generally attempt to obtain firm pricing for volumes consistent with planned production. Our gross margins may decline if we are not able to increase selling prices of our products or obtain manufacturing efficiencies to offset the increased cost. We do not enter into formal hedging arrangements to mitigate against commodity risk.
Foreign Currency Risk
Our foreign operations expose us to the risk of fluctuations in foreign currency exchange rates against our functional currency (the U.S. dollar) and we may economically hedge this risk with foreign currency contracts (such as currency forward contracts). Gains or losses on these non-U.S.-currency balances are generally offset by corresponding losses or gains on the related hedging instruments. As of
January 28, 2018
, our largest foreign currency exposures were from the Canadian dollar, Swiss franc, and Japanese yen.
We considered the historical trends in foreign currency exchange rates and determined that it is reasonably possible that adverse changes in foreign exchange rates of 10% for all currencies could be experienced in the near-term. These reasonably possible adverse changes were applied to our total monetary assets and liabilities denominated in currencies other than our functional currency as of
January 28, 2018
, to compute the adverse impact these changes would have had (after taking into account balance sheet hedges only) on our income before taxes, to show an impact of $3.2 million.
Interest Rate and Credit Risk
We do not engage in the trading of derivative financial instruments in the normal course of business to mitigate our risk related to interest rates. In the event interest rates were to increase 100 basis points and holding all other variables constant, annual net income and cash flows for the following year would decrease by approximately $2.3 million as a result of our variable-rate debt. The effect of the 100 basis points increase would not be expected to significantly impact the fair value of our variable-rate debt.
Interest rates affect our return on excess cash and investments. As of
January 28, 2018
, we had
$307.9 million
of cash and cash equivalents. A majority of our cash and cash equivalents generate interest income based on prevailing interest rates. Investments and cash and cash equivalents generated interest income of $0.4 million in fiscal year
2018
. A significant change in interest rates would impact the amount of interest income generated from our cash and investments. It would also impact the market value of our investments.
Our investments are primarily subject to credit risk. Our investments are managed by a limited number of outside professional managers following investment guidelines set by us. Such guidelines prescribe credit quality, permissible investments, diversification, and duration restrictions. These restrictions are intended to limit risk by restricting our investments to high quality debt instruments with relatively short-term durations. Our investment strategy limits investment of new funds and maturing securities to U.S. Treasury, Federal agency securities, high quality money market funds and time deposits with our principal commercial banks.
49
|
Item 8.
|
Financial Statements and Supplementary Data
|
The information required by Item 8 is presented in the following order:
|
Consolidated Statements of
Income
|
|
50
MANAGEMENT’S REPORT ON INTERNAL CONTROL OVER FINANCIAL REPORTING
The report called for by Item 308(a) of Regulation S-K is incorporated herein by reference to the
Report of Management on Internal Control Over Financial Reporting
that is included in Part II, Item 9A of this Annual Report on Form 10-K.
REPORT OF INDEPENDENT REGISTERED PUBLIC ACCOUNTING FIRM
ON INTERNAL CONTROL OVER FINANCIAL REPORTING
The report called for by Item 308(b) of Regulation S-K is incorporated herein by reference to the
Report of Independent Registered Public Accounting Firm
on Internal Control Over Financial Reporting that is included in Part II, Item 9A of this Annual Report on Form 10-K.
51
REPORT OF INDEPENDENT REGISTERED PUBLIC ACCOUNTING FIRM
To the Board of Directors and Stockholders
Semtech Corporation
Camarillo, California
Opinion on the Financial Statements
We have audited the accompanying consolidated balance sheets of Semtech Corporation and subsidiaries (the "Company") as of January 28, 2018 and January 29, 2017, the related consolidated statements of operations, comprehensive income, stockholders’ equity, and cash flows for each of the two years in the period ended January 28, 2018, and the related notes and the schedule listed in the Index at Item 15(a) (collectively referred to as the “financial statements”). In our opinion, the financial statements present fairly, in all material respects, the financial position of the Company as of January 28, 2018 and January 29, 2017, and the results of its operations and its cash flows for each of the two years in the period ended January 28, 2018, in conformity with the accounting principles generally accepted in the United States of America.
We have also audited, in accordance with the standards of the Public Company Accounting Oversight Board (United States) (PCAOB), the Company's internal control over financial reporting as of January 28, 2018, based on criteria established in Internal Control - Integrated Framework (2013) issued by the Committee of Sponsoring Organizations of the Treadway Commission and our report dated March 22, 2018, expressed an unqualified opinion on the Company's internal control over financial reporting.
Basis for Opinion
These financial statements are the responsibility of the Company's management. Our responsibility is to express an opinion on the Company's financial statements based on our audits. We are a public accounting firm registered with the PCAOB and are required to be independent with respect to the Company in accordance with the U.S. federal securities laws and the applicable rules and regulations of the Securities and Exchange Commission and the PCAOB.
We conducted our audits in accordance with the standards of the PCAOB. Those standards require that we plan and perform the audit to obtain reasonable assurance about whether the financial statements are free of material misstatement, whether due to error or fraud. Our audits included performing procedures to assess the risks of material misstatement of the financial statements, whether due to error or fraud, and performing procedures that respond to those risks. Such procedures included examining, on a test basis, evidence regarding the amounts and disclosures in the financial statements. Our audits also included evaluating the accounting principles used and significant estimates made by management, as well as evaluating the overall presentation of the financial statements. We believe that our audits provide a reasonable basis for our opinion.
/s/ Deloitte & Touche LLP
Los Angeles, California
March 22, 2018
We have served as the Company's auditor since 2016.
52
REPORT OF INDEPENDENT REGISTERED PUBLIC ACCOUNTING FIRM
To the Board of Directors and Stockholders of Semtech Corporation
We have audited the accompanying consolidated statements of income, comprehensive income, stockholders’ equity and cash flows of Semtech Corporation and subsidiaries for the year ended January 31, 2016. Our audit also included the financial statement schedule listed in the Index at Item 15(a). These financial statements and schedule are the responsibility of the Company’s management. Our responsibility is to express an opinion on these financial statements and schedule based on our audit.
We conducted our audit in accordance with the standards of the Public Company Accounting Oversight Board (United States). Those standards require that we plan and perform the audit to obtain reasonable assurance about whether the financial statements are free of material misstatement. An audit includes examining, on a test basis, evidence supporting the amounts and disclosures in the financial statements. An audit also includes assessing the accounting principles used and significant estimates made by management, as well as evaluating the overall financial statement presentation. We believe that our audit provides a reasonable basis for our opinion.
In our opinion, the financial statements referred to above present fairly, in all material respects, the consolidated results of income and cash flows of Semtech Corporation and subsidiaries for the year ended January 31, 2016, in conformity with U.S. generally accepted accounting principles. Also, in our opinion, the related financial statement schedule, when considered in relation to the basic financial statements taken as a whole, presents fairly in all material respects the information set forth therein.
/s/ Ernst & Young LLP
Los Angeles, California
March 31, 2016
53
SEMTECH CORPORATION AND SUBSIDIARIES
CONSOLIDATED STATEMENTS OF INCOME
(in thousands, except per share amounts)
|
|
Fiscal Year Ended
|
||||||||||
|
|
January 28, 2018
|
January 29, 2017
|
January 31, 2016
|
||||||||
|
Net sales
|
$
|
587,847
|
|
$
|
544,272
|
|
$
|
490,219
|
|
||
|
Cost of sales
|
235,876
|
|
219,410
|
|
197,109
|
|
|||||
|
Gross profit
|
351,971
|
|
324,862
|
|
|
293,110
|
|
||||
|
Operating costs and expenses:
|
|||||||||||
|
Selling, general and administrative
|
146,303
|
|
138,708
|
|
140,677
|
|
|||||
|
Product development and engineering
|
104,798
|
|
102,500
|
|
113,737
|
|
|||||
|
Intangible amortization
|
27,867
|
|
25,301
|
|
25,059
|
|
|||||
|
Loss (gain) on disposition of business operations
|
375
|
|
(25,513
|
)
|
—
|
|
|||||
|
Changes in the fair value of contingent earn-out obligations
|
3,892
|
|
(215
|
)
|
(16,362
|
)
|
|||||
|
Total operating costs and expenses
|
283,235
|
|
240,781
|
|
263,111
|
|
|||||
|
Operating income
|
68,736
|
|
84,081
|
|
29,999
|
|
|||||
|
Interest expense, net
|
(7,963
|
)
|
(9,300
|
)
|
(7,819
|
)
|
|||||
|
Non-operating expense, net
|
(902
|
)
|
(1,721
|
)
|
(1,801
|
)
|
|||||
|
Income before taxes and equity in net losses of equity method investments
|
59,871
|
|
73,060
|
|
20,379
|
|
|||||
|
Provision for taxes
|
23,191
|
|
18,399
|
|
8,882
|
|
|||||
|
Net income before equity in net losses of equity method investments
|
36,680
|
|
54,661
|
|
11,497
|
|
|||||
|
Equity in net losses of equity method investments
|
(254
|
)
|
—
|
|
—
|
|
|||||
|
Net income
|
$
|
36,426
|
|
$
|
54,661
|
|
$
|
11,497
|
|
||
|
Earnings per share:
|
|||||||||||
|
Basic
|
$
|
0.55
|
|
$
|
0.84
|
|
$
|
0.18
|
|
||
|
Diluted
|
$
|
0.54
|
|
$
|
0.83
|
|
$
|
0.17
|
|
||
|
Weighted average number of shares used in computing earnings per share:
|
|||||||||||
|
Basic
|
66,027
|
|
65,427
|
|
65,657
|
|
|||||
|
Diluted
|
67,605
|
|
66,109
|
|
65,961
|
|
|||||
The accompanying notes are an integral part of these consolidated financial statements.
54
SEMTECH CORPORATION AND SUBSIDIARIES
CONSOLIDATED STATEMENTS OF COMPREHENSIVE INCOME
(in thousands)
|
|
Fiscal Year Ended
|
||||||||||
|
|
January 28,
2018 |
January 29,
2017 |
January 31,
2016 |
||||||||
|
Net income
|
$
|
36,426
|
|
$
|
54,661
|
|
$
|
11,497
|
|
||
|
Other comprehensive income, net:
|
|||||||||||
|
Unrealized gain on foreign currency cash flow hedges
|
942
|
|
522
|
|
—
|
|
|||||
|
Realized gain on foreign currency cash flow hedges
|
(1,232
|
)
|
(232
|
)
|
—
|
|
|||||
|
Change in unrealized gain on interest rate cap
|
—
|
|
48
|
|
490
|
|
|||||
|
Change in employee benefit plans
|
384
|
|
(2,414
|
)
|
—
|
|
|||||
|
Other changes to comprehensive income
|
—
|
|
129
|
|
—
|
|
|||||
|
Other comprehensive income (loss), net
|
94
|
|
(1,947
|
)
|
490
|
|
|||||
|
Comprehensive income
|
$
|
36,520
|
|
$
|
52,714
|
|
$
|
11,987
|
|
||
The accompanying notes are an integral part of these consolidated financial statements.
55
SEMTECH CORPORATION AND SUBSIDIARIES
CONSOLIDATED BALANCE SHEETS
AS OF
JANUARY 28, 2018
AND
JANUARY 29, 2017
(in thousands, except per share amounts)
|
January 28, 2018
|
January 29, 2017
|
||||||
|
Assets
|
|||||||
|
Current assets:
|
|||||||
|
Cash and cash equivalents
|
$
|
307,923
|
|
$
|
297,134
|
|
|
|
Accounts receivable, less allowances of $9,089 and $8,230, respectively
|
53,183
|
|
51,441
|
|
|||
|
Inventories
|
71,067
|
|
65,872
|
|
|||
|
Prepaid taxes
|
11,809
|
|
5,563
|
|
|||
|
Other current assets
|
17,250
|
|
18,418
|
|
|||
|
Total current assets
|
461,232
|
|
438,428
|
|
|||
|
Non-current assets:
|
|||||||
|
Property, plant and equipment, net of accumulated depreciation of $179,604 and $161,236, respectively
|
124,586
|
|
108,910
|
|
|||
|
Deferred tax assets
|
4,236
|
|
5,493
|
|
|||
|
Goodwill
|
341,897
|
|
329,703
|
|
|||
|
Other intangible assets, net
|
60,207
|
|
61,773
|
|
|||
|
Other assets
|
93,618
|
|
67,235
|
|
|||
|
TOTAL ASSETS
|
$
|
1,085,776
|
|
$
|
1,011,542
|
|
|
|
Liabilities and Stockholders’ Equity
|
|||||||
|
Current liabilities:
|
|||||||
|
Accounts payable
|
$
|
37,208
|
|
$
|
41,960
|
|
|
|
Accrued liabilities
|
60,832
|
|
54,524
|
|
|||
|
Deferred revenue
|
12,758
|
|
12,059
|
|
|||
|
Current portion - long term debt
|
15,410
|
|
14,432
|
|
|||
|
Total current liabilities
|
126,208
|
|
122,975
|
|
|||
|
Non-current liabilities:
|
|||||||
|
Deferred tax liabilities
|
14,682
|
|
6,881
|
|
|||
|
Long term debt, less current portion
|
211,114
|
|
226,524
|
|
|||
|
Other long-term liabilities
|
68,759
|
|
49,899
|
|
|||
|
Commitments and contingencies (Note 14)
|
|||||||
|
Stockholders’ equity:
|
|||||||
|
Common stock, $0.01 par value, 250,000,000 shares authorized, 78,136,144 issued and 66,280,129 outstanding and 78,136,144 issued and 65,793,083 outstanding, respectively
|
785
|
|
785
|
|
|||
|
Treasury stock, at cost, 11,856,015 shares and 12,343,061 shares, respectively
|
(251,974
|
)
|
(253,107
|
)
|
|||
|
Additional paid-in capital
|
415,056
|
|
390,938
|
|
|||
|
Retained earnings
|
502,346
|
|
467,941
|
|
|||
|
Accumulated other comprehensive (loss) income
|
(1,200
|
)
|
(1,294
|
)
|
|||
|
Total stockholders’ equity
|
665,013
|
|
605,263
|
|
|||
|
TOTAL LIABILITIES AND STOCKHOLDERS’ EQUITY
|
$
|
1,085,776
|
|
$
|
1,011,542
|
|
|
The accompanying notes are an integral part of these consolidated financial statements.
56
SEMTECH CORPORATION AND SUBSIDIARIES
CONSOLIDATED STATEMENTS OF STOCKHOLDERS’ EQUITY
(in thousands, except per share amounts)
|
Common Stock
|
Accumulated Other
|
|||||||||||||||||||||||||
|
Number of Shares Outstanding
|
Amount
|
Additional Paid-in Capital
|
Retained Earnings
|
Treasury Stock, at Cost
|
Comprehensive Income (Loss)
|
Stockholders’ Equity
|
||||||||||||||||||||
|
Balance at January 25, 2015
|
66,812,919
|
|
$
|
785
|
|
$
|
371,596
|
|
$
|
401,783
|
|
$
|
(222,969
|
)
|
$
|
163
|
|
$
|
551,358
|
|
||||||
|
Net income
|
—
|
|
—
|
|
—
|
|
11,497
|
|
—
|
|
—
|
|
11,497
|
|
||||||||||||
|
Other comprehensive income
|
—
|
|
—
|
|
—
|
|
—
|
|
—
|
|
490
|
|
490
|
|
||||||||||||
|
Stock-based compensation
|
—
|
|
—
|
|
22,778
|
|
—
|
|
—
|
|
—
|
|
22,778
|
|
||||||||||||
|
Repurchase of outstanding common stock
|
(2,681,476
|
)
|
—
|
|
—
|
|
—
|
|
(57,311
|
)
|
—
|
|
(57,311
|
)
|
||||||||||||
|
Treasury stock reissued
|
866,925
|
|
—
|
|
(14,744
|
)
|
—
|
|
14,105
|
|
—
|
|
(639
|
)
|
||||||||||||
|
Other
|
—
|
|
—
|
|
(154
|
)
|
—
|
|
—
|
|
—
|
|
(154
|
)
|
||||||||||||
|
Tax benefit from stock-based compensation
|
—
|
|
—
|
|
32
|
|
—
|
|
—
|
|
—
|
|
32
|
|
||||||||||||
|
Balance at January 31, 2016
|
64,998,368
|
|
$
|
785
|
|
$
|
379,508
|
|
$
|
413,280
|
|
$
|
(266,175
|
)
|
$
|
653
|
|
$
|
528,051
|
|
||||||
|
Net income
|
—
|
|
—
|
|
—
|
|
54,661
|
|
—
|
|
—
|
|
54,661
|
|
||||||||||||
|
Other comprehensive loss
|
—
|
|
—
|
|
—
|
|
—
|
|
—
|
|
(1,947
|
)
|
(1,947
|
)
|
||||||||||||
|
Stock-based compensation
|
—
|
|
—
|
|
26,249
|
|
—
|
|
—
|
|
—
|
|
26,249
|
|
||||||||||||
|
Repurchase of outstanding common stock
|
(39,024
|
)
|
—
|
|
—
|
|
—
|
|
(1,005
|
)
|
—
|
|
(1,005
|
)
|
||||||||||||
|
Treasury stock reissued
|
833,739
|
|
—
|
|
(14,819
|
)
|
—
|
|
14,003
|
|
—
|
|
(816
|
)
|
||||||||||||
|
Other
|
—
|
|
—
|
|
—
|
|
—
|
|
70
|
|
—
|
|
70
|
|
||||||||||||
|
Balance at January 29, 2017
|
65,793,083
|
|
$
|
785
|
|
$
|
390,938
|
|
$
|
467,941
|
|
$
|
(253,107
|
)
|
$
|
(1,294
|
)
|
$
|
605,263
|
|
||||||
|
Cumulative-effect adjustment to beginning balance from adoption of ASU 2016-09 (See Note 2)
|
—
|
|
—
|
|
—
|
|
(2,021
|
)
|
—
|
|
—
|
|
(2,021
|
)
|
||||||||||||
|
Net income
|
—
|
|
—
|
|
—
|
|
36,426
|
|
—
|
|
—
|
|
36,426
|
|
||||||||||||
|
Other comprehensive income
|
—
|
|
—
|
|
—
|
|
—
|
|
—
|
|
94
|
|
94
|
|
||||||||||||
|
Stock-based compensation
|
—
|
|
—
|
|
45,091
|
|
—
|
|
—
|
|
—
|
|
45,091
|
|
||||||||||||
|
Repurchase of outstanding common stock
|
(442,607
|
)
|
—
|
|
—
|
|
—
|
|
(14,849
|
)
|
—
|
|
(14,849
|
)
|
||||||||||||
|
Treasury stock reissued
|
929,653
|
|
—
|
|
(20,973
|
)
|
—
|
|
15,982
|
|
—
|
|
(4,991
|
)
|
||||||||||||
|
Balance at January 28, 2018
|
66,280,129
|
|
$
|
785
|
|
$
|
415,056
|
|
$
|
502,346
|
|
$
|
(251,974
|
)
|
$
|
(1,200
|
)
|
$
|
665,013
|
|
||||||
The accompanying notes are an integral part of these consolidated financial statements.
57
SEMTECH CORPORATION AND SUBSIDIARIES
CONSOLIDATED STATEMENTS OF CASH FLOWS
(in thousands)
|
|
Fiscal Year Ended
|
||||||||||
|
|
January 28, 2018
|
January 29, 2017
|
January 31, 2016
|
||||||||
|
Cash flows from operating activities:
|
|||||||||||
|
Net income
|
$
|
36,426
|
|
$
|
54,661
|
|
$
|
11,497
|
|
||
|
Adjustments to reconcile net income to net cash provided by operating activities:
|
|||||||||||
|
Depreciation and amortization
|
48,999
|
|
47,057
|
|
48,932
|
|
|||||
|
Impairment of assets
|
4,250
|
|
—
|
|
—
|
|
|||||
|
Accretion of deferred financing costs and debt discount
|
568
|
|
621
|
|
1,469
|
|
|||||
|
Write-off of deferred financing costs and debt discount
|
—
|
|
549
|
|
—
|
|
|||||
|
Deferred income taxes
|
15,232
|
|
2,185
|
|
(1,012
|
)
|
|||||
|
Share-based compensation and warrant costs
|
47,936
|
|
30,828
|
|
20,468
|
|
|||||
|
Loss (gain) on disposition of business operations and assets (Note 1)
|
276
|
|
(25,489
|
)
|
23
|
|
|||||
|
Earn-out liabilities
|
3,892
|
|
(215
|
)
|
(16,362
|
)
|
|||||
|
Equity in net losses of equity method investments
|
254
|
|
—
|
|
—
|
|
|||||
|
Gain from convertible debt settlement
|
(4,275
|
)
|
—
|
|
—
|
|
|||||
|
Contingencies
|
—
|
|
(1,518
|
)
|
2,855
|
|
|||||
|
Corporate owned life insurance, net
|
1,601
|
|
770
|
|
(420
|
)
|
|||||
|
Changes in assets and liabilities:
|
|||||||||||
|
Accounts receivable, net
|
(1,453
|
)
|
(7,403
|
)
|
25,354
|
|
|||||
|
Inventories
|
(5,515
|
)
|
(1,959
|
)
|
10,262
|
|
|||||
|
Other assets
|
(5,957
|
)
|
(7,516
|
)
|
(657
|
)
|
|||||
|
Accounts payable
|
(5,306
|
)
|
3,101
|
|
4,980
|
|
|||||
|
Accrued liabilities
|
2,474
|
|
10,582
|
|
(12,945
|
)
|
|||||
|
Deferred revenue
|
(26
|
)
|
4,533
|
|
2,780
|
|
|||||
|
Income taxes payable
|
(15,718
|
)
|
2,618
|
|
2,611
|
|
|||||
|
Other liabilities
|
(12,173
|
)
|
4,207
|
|
2,241
|
|
|||||
|
Net cash provided by operating activities
|
111,485
|
|
117,612
|
|
102,076
|
|
|||||
|
Cash flows from investing activities:
|
|||||||||||
|
Proceeds from convertible debt settlement
|
5,700
|
|
—
|
|
—
|
|
|||||
|
Proceeds from sales of property, plant and equipment
|
189
|
|
48
|
|
—
|
|
|||||
|
Purchase of property, plant and equipment
|
(35,461
|
)
|
(32,920
|
)
|
(13,026
|
)
|
|||||
|
Purchase of investments
|
(18,665
|
)
|
(13,198
|
)
|
(14,630
|
)
|
|||||
|
Acquisitions, net of cash acquired
|
(17,619
|
)
|
—
|
|
(39,171
|
)
|
|||||
|
Proceeds from disposition of business operations
|
—
|
|
32,000
|
|
—
|
|
|||||
|
Proceeds from sale of investments
|
—
|
|
555
|
|
—
|
|
|||||
|
Net cash used in investing activities
|
(65,856
|
)
|
(13,515
|
)
|
(66,827
|
)
|
|||||
|
Cash flows from financing activities:
|
|||||||||||
|
Proceeds from term loans
|
—
|
|
150,000
|
|
35,000
|
|
|||||
|
Payments of term loans
|
(15,000
|
)
|
(80,875
|
)
|
(30,750
|
)
|
|||||
|
Proceeds from revolving line of credit
|
—
|
|
97,000
|
|
—
|
|
|||||
|
Payments of revolving line of credit
|
—
|
|
(181,000
|
)
|
—
|
|
|||||
|
Deferred financing costs
|
—
|
|
(2,110
|
)
|
—
|
|
|||||
|
Payment for employee share-based compensation payroll taxes
|
(11,671
|
)
|
(6,562
|
)
|
(6,513
|
)
|
|||||
|
Proceeds from exercise of stock options
|
6,680
|
|
5,779
|
|
5,807
|
|
|||||
|
Repurchase of outstanding common stock
|
(14,849
|
)
|
(1,005
|
)
|
(57,311
|
)
|
|||||
|
Net cash used in financing activities
|
(34,840
|
)
|
(18,773
|
)
|
(53,767
|
)
|
|||||
|
Net increase (decrease) in cash and cash equivalents
|
10,789
|
|
85,324
|
|
(18,518
|
)
|
|||||
|
Cash and cash equivalents at beginning of period
|
297,134
|
|
211,810
|
|
230,328
|
|
|||||
|
Cash and cash equivalents at end of period
|
$
|
307,923
|
|
$
|
297,134
|
|
$
|
211,810
|
|
||
|
Supplemental disclosure of cash flow information
|
|||||||||||
|
Income taxes paid
|
$
|
31,013
|
|
$
|
10,503
|
|
$
|
7,924
|
|
||
|
Interest paid
|
$
|
6,341
|
|
$
|
6,492
|
|
$
|
5,732
|
|
||
58
|
Non-cash items
|
|||||||||||
|
Capital expenditures in accounts payable
|
$
|
3,789
|
|
$
|
3,373
|
|
$
|
—
|
|
||
|
Convertible debt
|
$
|
—
|
|
$
|
1,425
|
|
$
|
—
|
|
||
The accompanying notes are an integral part of these consolidated financial statements.
59
SEMTECH CORPORATION AND SUBSIDIARIES
NOTES TO CONSOLIDATED FINANCIAL STATEMENTS
Note
1
: Organization and Basis of Presentation
Semtech Corporation (together with its consolidated subsidiaries, the "Company" or "Semtech") is a global supplier of analog, mixed-signal semiconductors and advanced algorithms. The end-customers for the Company’s products are primarily original equipment manufacturers ("OEMs") that produce and sell electronics.
The Company designs, develops and markets a wide range of products for commercial applications, the majority of which are sold into the enterprise computing, communications, high-end consumer and industrial end-markets.
Enterprise Computing
: datacenters, passive optical networks, desktops, notebooks, servers, monitors, printers and other computer peripherals.
Communications
: base stations, optical networks, carrier networks, switches and routers, cable modems, wireless LAN and other communication infrastructure equipment.
High-End Consumer
: handheld products, smartphones, wireless charging, set-top boxes, digital televisions, monitors and displays, tablets, wearables, digital video recorders and other consumer equipment.
Industrial
: analog and digital video broadcast equipment, video-over-IP solutions, automated meter reading, Internet of Things ("IoT"), smart grid, wireless charging, military and aerospace, medical, security systems, automotive, industrial and home automation and other industrial equipment.
Fiscal Year
The Company reports results on the basis of
52
and
53
week periods and ends its fiscal year on the last Sunday in January. The fiscal years ended
January 28, 2018
and
January 29, 2017
each
consisted of
52
weeks.
The fiscal year ended
January 31, 2016
consisted of
53
weeks.
Principles of Consolidation
The accompanying consolidated financial statements include the accounts of the Company and its wholly-owned subsidiaries and have been prepared in conformity with accounting principles generally accepted in the United States (“GAAP”). All intercompany balances have been eliminated.
The Company’s Consolidated Statements of Income are referred to herein as the "Statements of Income." The Company’s Consolidated Balance Sheets are referred to herein as the "Balance Sheets" and Consolidated Statements of Cash Flows as the "Statements of Cash Flows."
Segment Information
The Company's Chief Executive Officer ("CEO") has been identified as the Chief Operating Decision Maker ("CODM") as defined by guidance regarding segment disclosures (see Note
15
for further discussion). In fiscal year 2016, the Company identified
five
operating segments in total.
Four
of the operating segments aggregated into
one
reportable segment, the Semiconductor Products Group. The remaining operating segment, the Systems Innovation Group (shown as "All others"), could not be aggregated with the other operating segments and did not meet the criteria for a separate reportable segment as defined by the guidance regarding segment disclosure. As a result, the financial activity associated with the Systems Innovation Group was reported separately from the Company's Semiconductor Products Group. This separate reporting was included in the "All others" category. On August 5, 2016, the Company completed its divestiture of its Snowbush Intellectual Property ("Snowbush IP") business (previously part of the Company’s Systems Innovation Group) to Rambus Inc. ("Rambus") for a purchase price of
$32.0 million
in cash along with the opportunity to receive additional payments from Rambus through 2022 based upon a percentage of sales by Rambus of new products expected to be developed by Rambus from the disposed assets. Therefore, beginning in fiscal years
2017
, the Company no longer has a Systems Innovation Group or an "All others" category, resulting in
four
operating segments that aggregate into
one
reportable segment, the Semiconductor Products Group.
Use of Estimates
The preparation of the consolidated financial statements in conformity with GAAP requires management to make estimates and assumptions that affect the reported amounts of assets and liabilities and disclosure of contingent assets and liabilities at the date of the consolidated financial statements and the reported amounts of revenues and expenses during the reporting period. Actual results could differ from those estimates.
60
Note
2
: Significant Accounting Policies
Cash and Cash Equivalents
The Company considers all highly-liquid investments with an original maturity of
90 days
or less and money market mutual funds to be cash equivalents. The Company maintains cash balances and cash equivalents in highly-qualified financial institutions. At various times such amounts are in excess of insured limits. Cash equivalents can consist of money market mutual funds, government and corporate obligations and bank time deposits.
Investments
The Company’s investment policy restricts investments to high credit quality investments with limits on the length to maturity and the amount invested with any one issuer. These investments, especially corporate obligations, are subject to default risk. The Company classifies its investments as available-for-sale ("AFS") and reports these investments at fair value, with unrealized gains and losses, net of tax, recorded in accumulated other comprehensive income (loss). Realized gains or losses on AFS investments are recorded in "Interest income and other (expense) income, net" in the Statements of Income. The Company recognizes losses in the income statement when it determines that declines in the fair value of its investments below their cost are other-than-temporary.
The Company has minority equity investments in privately held companies that are classified in "Other assets" in the Balance Sheets. Substantially, all of these investments are carried at cost because the Company does not have the ability to exercise significant influence over the company. The Company monitors these investments for impairment and makes appropriate reductions to the carrying value when necessary. As of
January 28, 2018
and
January 29, 2017
, the Company had aggregate net investments under the cost method of accounting of
$38.1 million
and
$27.1 million
, respectively. These investments consisted of privately-held equity securities without a readily determinable fair value and the Company has determined that it is not practicable to estimate the fair value of these investments. The Company tests these investments for impairment quarterly. In the third quarter of fiscal year 2018, the Company impaired
$4.3 million
of a minority investment. As of
January 28, 2018
, there have not been any events or changes in circumstances that the Company believes would have had a significant adverse effect on the fair value of these investments. As of
January 28, 2018
and
January 29, 2017
, aggregate net investment accounted for under equity method of accounting was
$3.4 million
and
$2.0 million
, respectively, included in "Other assets".
Accounts Receivable Allowances
Accounts receivable are recorded at net realizable value or the amount that the Company expects to collect on gross customer trade receivables. The Company evaluates the collectability of its accounts receivable based on a combination of factors. The Company generally does not require collateral on accounts receivable as the majority of the Company’s customers are large, well-established companies. Historically, bad debt provisions have been consistent with management’s expectations. If the Company becomes aware of a customer’s inability to meet its financial obligations after a sale has occurred, it records an allowance to reduce the net receivable to the amount it reasonably believes it will be able to collect from the customer. For all other customers, the Company recognizes allowances for doubtful accounts based on the length of time the receivables are past due, the current business environment and historical experience. If the financial condition of the Company’s customers were to deteriorate or if economic conditions worsen, additional allowances may be required in the future. All of the Company’s accounts receivables are trade-related receivables.
A summary of accounts receivable allowances for fiscal years ended
January 28, 2018
and
January 29, 2017
is as follows:
|
(in thousands)
|
January 28, 2018
|
January 29, 2017
|
|||||
|
Allowance for doubtful accounts
|
$
|
(2,700
|
)
|
$
|
(2,696
|
)
|
|
|
Sales rebate allowance
|
(2,634
|
)
|
(2,571
|
)
|
|||
|
Sales return allowance
|
(2,018
|
)
|
(1,795
|
)
|
|||
|
Other allowances
|
(1,737
|
)
|
(1,168
|
)
|
|||
|
Total
|
$
|
(9,089
|
)
|
$
|
(8,230
|
)
|
|
Inventories
Inventories are stated at lower of cost or market and consist of materials, labor and overhead. The Company determines the cost of inventory by the first-in, first-out method. The Company evaluates inventories for excess quantities and obsolescence. This evaluation includes analysis of sales levels by product and projections of future demand. In order to state the inventory at lower of cost or market, the Company maintains reserves against its inventory. If future demand or market conditions are less favorable than the Company’s projections, a write-down of inventory may be required, and would be reflected in cost of goods sold in the period the revision is made.
61
Business Combinations
The Company accounts for business combinations at fair value with any excess consideration, transferred over the acquisition date net fair values of the assets acquired and the liabilities assumed, recorded as Goodwill. Acquisition costs are expensed as incurred and recorded in general and administrative expenses; in-process research and development is recorded at fair value as an indefinite-lived intangible asset at the acquisition date; restructuring costs associated with a business combination are expensed subsequent to the acquisition date; contingent consideration obligations are recorded at fair value on the date of acquisition, with increases or decreases in the fair value arising from changes in assumptions or discount periods recorded as contingent consideration expenses in the Statements of Income in subsequent periods; and changes in deferred tax asset valuation allowances and income tax uncertainties after the acquisition date generally affect income tax expense. All changes that do not qualify as measurement period adjustments are included in current period earnings.
Significant judgment is required to determine the estimated fair value for assets and liabilities acquired and to assign their respective useful lives. The fair values assigned to tangible and intangible assets acquired and liabilities assumed, including contingent consideration, are based on management’s estimates and assumptions, as well as other information compiled by management, including available historical information and valuations that utilize customary valuation procedures and techniques.
The Company employs the income approach to estimate the fair value of intangible assets, which is based on forecasts of the expected future cash flows attributable to the respective assets. In determining significant estimates and assumptions inherent in the valuations, the Company considers the amount and timing of future cash flows (including expected growth rates and profitability), the underlying product life cycles, economic barriers to entry, a brand’s relative market position and the discount rate applied to the cash flows, among others.
If actual results differ from the estimates and judgments used in these estimates, the amounts recorded in the consolidated financial statements could result in a possible impairment of the intangible assets and goodwill, or require acceleration of the amortization expense of finite-lived intangible assets.
Variable Interest Entities
The Company is required to consolidate variable interest entities ("VIEs") in which it has a controlling financial interest in accordance with Financial Accounting Standards Board ("FASB") Accounting Standards Codification ("ASC") Topic 810, "Consolidation". A controlling financial interest will have both of the following characteristics: (i) the power to direct the activities of a VIE that most significantly impact the VIE’s economic performance, and (ii) the obligation to absorb losses of the VIE that could potentially be significant to the VIE or the right to receive benefits from the VIE that could potentially be significant to the VIE.
The Company’s variable interest in VIEs may be in the form of equity ownership, contracts to purchase assets, management services, and development agreements between the Company and a VIE, loans provided by the Company to a VIE or other member, and/or guarantees provided by members to banks and other parties.
The Company analyzes its investments or other interests to determine whether it represents a variable interest in a VIE. If so, the Company evaluates the facts to determine whether it is the primary beneficiary. The Company considers itself to be the primary beneficiary when it has both the power to direct activities of the VIE that most significantly impact the VIEs economic performance and the obligation to absorb losses from or the right to receive benefits of the VIE that could potentially be significant to the VIE. With regards to its investment in a private entity, the Company concluded that its equity interest represents a variable interest, but it is not the primary beneficiary as prescribed in ASC 810. Specifically, in reaching this conclusion, the Company considered the activities that most significantly drive profitability for the private entity and determined that the activity that most significantly drove profitability was related to the technology and related product road maps. The Company has a board observer role and thus concluded that it was not in a position of decision-making or other authority to influence the private entity’s activities that could be considered significant with respect to its operations, including research and development plans and changes to the product road map. There are currently no VIEs that are consolidated.
Derivatives and Hedging Activities
As required by ASC 815, the Company records all derivatives on the Balance Sheets at fair value. The accounting for changes in the fair value of derivatives depends on the intended use of the derivative, whether the Company has elected to designate a derivative in a hedging relationship and apply hedge accounting and whether the hedging relationship has satisfied the criteria necessary to apply hedge accounting. Derivatives designated and qualifying as a hedge of the exposure to variability in expected future cash flows, or other types of forecasted transactions, are considered cash flow hedges. Hedge accounting generally provides for the matching of the timing of gain or loss recognition on the hedging instrument with the recognition of the changes in the fair value of the hedged asset or liability that are attributable to the hedged risk in a fair value hedge or the earnings effect of the hedged forecasted transactions in a cash flow hedge. The Company may enter into derivative contracts
62
that are intended to economically hedge certain of its risk, even though hedge accounting does not apply or the Company elects not to apply hedge accounting.
In accordance with the FASB’s fair value measurement guidance, the Company made an accounting policy election to measure the credit risk of its derivative financial instruments that are subject to master netting agreements on a net basis by counterparty portfolio.
Property, Plant and Equipment
Property, plant and equipment are stated at cost. Depreciation is computed over the estimated useful lives of the related asset type or term of the operating lease using the straight-line method for financial statement purposes. Maintenance and repairs are charged to expense as incurred and the costs of additions and betterments that increase the useful lives of the assets are capitalized.
Goodwill
Goodwill is the excess of the purchase price over the fair value of identifiable net assets acquired in business combinations accounted for under the acquisition method. Goodwill is not amortized but is tested for impairment using either a qualitative assessment or a two-step method.
The Company performs an annual impairment assessment of goodwill at the reporting unit level in the fourth quarter of each year, or more frequently if indicators of potential impairment exist. The analysis may include both qualitative and quantitative factors to assess the likelihood of an impairment. The reporting unit’s carrying value used in an impairment test represents the assignment of various assets and liabilities.
Qualitative factors include industry and market considerations, overall financial performance, and other relevant events and factors affecting the reporting unit. Additionally, as part of this assessment, the Company may perform a quantitative analysis to support the qualitative factors above by applying sensitivities to assumptions and inputs used in measuring a reporting unit’s fair value.
The Company’s quantitative impairment test considers the historical rates and current market conditions when determining the discount and long-term growth rates to use in its analysis. The Company considers other valuation methods; such as the cost approach or market approach, if it is determined that these methods provide a more representative approximation of fair value. Significant estimates include market segment growth rates, the Company's assumed market segment share, estimated costs, and discount rates based on a reporting unit's weighted average cost of capital.
The Company tests the reasonableness of the inputs and outcomes of its discounted cash flow analysis against available market data. In the current year the fair value for all of the Company's reporting units exceeds their carrying value, and the Company's annual qualitative assessment did not indicate that a more detailed quantitative analysis was necessary.
Other Intangibles and Long-lived Assets
Finite-lived intangible assets resulting from business acquisitions or technology licenses purchased are amortized on a straight-line basis over their estimated useful lives. The useful lives of acquisition-related intangible assets represent the point where over
90%
of realizable undiscounted cash flows for each intangible asset are recognized. The assigned useful lives are based upon the Company’s historical experience with similar technology and other intangible assets owned by the Company. The useful life of technology licenses is usually based on the term of the agreement.
Acquired in-process research and development ("IPR&D") projects are recorded at fair value as of the date of acquisition as an indefinite-lived intangible asset until the completion or abandonment of the associated research and development efforts or impairment. Upon completion of development, acquired IPR&D assets are transferred to finite-lived intangible assets and amortized over their useful lives.
The Company reviews indefinite-lived intangible assets for impairment on an annual basis in conjunction with goodwill or whenever events or changes in circumstances indicate the carrying value may not be recoverable. Recoverability of indefinite-lived intangible assets is measured by comparing the carrying amount of the asset to the future discounted cash flows the asset is expected to generate. Also, the Company reassesses the estimated remaining useful lives of any impaired assets and adjusts accordingly estimates of future amortization expense related to these assets.
The Company assesses finite-lived intangibles and long-lived assets for impairment when indicators of impairment, such as reductions in demand or significant economic slowdowns in the semiconductor industry, are present. Reviews are performed to determine whether the carrying value of an asset is impaired, based on comparisons to undiscounted expected future cash flows. If this comparison indicates that there is impairment, the impaired asset is written down to fair value, which is typically calculated using: (i) quoted market prices and/or (ii) discounted expected future cash flows utilizing a discount rate. Impairment is based on the excess of the carrying amount over the fair value of those assets.
63
The fair values of individual tangible long-lived assets was determined upon the cost to reproduce the long-lived asset taking into account the age, condition, inflation using the U.S. Bureau of Labor Statistics and Marshall Valuation Services, and cost to ready the long-lived asset for its intended use. Additionally, the Company considered the potential existence of functional and economic obsolescence and quantified these elements in its cost approach as appropriate.
For intangible long-lived assets, which consist of core technology and customer relationships, the Company used the multi-period excess earnings method, an income approach, or the replacement cost method (a cost approach), to determine fair value. The multi-period excess earnings method, a form of the income approach, estimates the value of the asset based on the present value of the after-tax cash flows attributable to the intangible asset, which includes the Company's estimates of forecasted revenue, operating margins, taxes and discount rate. The replacement cost method incorporates a market participant’s assumption that an in-use premise is the highest and best use of customer relationships and core technology. The Company estimated the cost it would incur to rebuild or re-establish the intangible asset and the associated effort required to develop it.
Functional Currency
The Company has concluded that the functional currency of all subsidiaries is the U.S. Dollar.
Fair Value Measurements
When determining the fair value measurements for assets and liabilities required or permitted to be recorded at fair value, the Company considers the principal or most advantageous market in which it would transact and considers assumptions that market participants would use when pricing the asset or liability, such as inherent risk, transfer restrictions, and risk of nonperformance. The Company uses the following three levels of inputs in determining the fair value of the Company’s assets and liabilities, focusing on the most observable inputs when available:
Level 1 - Quoted prices in active markets for identical assets or liabilities.
Level 2 - Observable inputs other than Level 1 prices such as quoted prices for similar assets or liabilities; quoted prices in markets with insufficient volume or infrequent transactions (less active markets); or model-derived valuations in which all significant inputs are observable or can be derived principally from or corroborated by observable market data for substantially the full term of the assets or liabilities.
Level 3 - Unobservable inputs to the valuation methodology that are significant to the measurement of fair value of assets or liabilities.
To the extent that valuation is based on models or inputs that are less observable or unobservable in the market, the determination of fair value requires more judgment. In certain cases, the inputs used to measure fair value may fall into different levels of the fair value hierarchy. In such cases, for disclosure purposes, the level in the fair value hierarchy within which the fair value measurement is disclosed is determined based on the lowest level input that is significant to the fair value measurement.
Revenue Recognition
The Company recognizes product revenue when persuasive evidence of an arrangement exists, delivery has occurred, the fee is fixed or determinable and collectability is probable. Recovery of costs associated with product design and engineering services are recognized during the period in which services are performed. The product design and engineering recovery, when recognized, will be reported as a reduction to product development and engineering expense. Historically, these recoveries have not exceeded the cost of the related development efforts.
The Company includes revenue related to granted technology licenses as part of "Net sales." Historically, revenue from these arrangements has not been significant though it is part of its recurring ordinary business.
The Company defers revenue recognition on shipment of products to certain customers, principally distributors, under agreements which provide for limited pricing credits or return privileges, until these products are sold through to end-users or the return privileges lapse. For sales subject to certain pricing credits or return privileges, the amount of future pricing credits or inventory returns cannot be reasonably estimated given the relatively long period in which a particular product may be held by the customer. Therefore, the Company has concluded that sales to customers under these agreements are not fixed and determinable at the date of the sale and revenue recognition has been deferred. The Company estimates the deferred gross margin on these sales by applying an average gross profit margin to the actual gross sales. The average gross profit margin is calculated for each operating segment which is expected to approximate actual costs at the date of sale. The estimated deferred gross margins on these sales, where there are no outstanding receivables, are recorded on the Balance Sheets under the heading of "Deferred revenue." There were no significant impairments of deferred cost of sales in fiscal years
2018
,
2017
or
2016
.
The Company records a provision for estimated sales returns in the same period as the related revenues are recorded. The Company bases these estimates on historical sales returns and other known factors. Actual returns could be different from Company estimates and current provisions for sales returns and allowances, resulting in future charges to earnings.
64
The Company records a provision for sales rebates in the same period as the related revenues are recorded. These estimates are based on sales activity during the period. Actual rebates given could be different from our estimates and current provisions for sales rebates, resulting in future charges to earnings.
The estimated sales rebates for sales for which there are no outstanding receivables are recorded on the Balance Sheets under the heading of "Accrued liabilities."
The following table summarizes the deferred revenue balance:
|
(in thousands)
|
January 28, 2018
|
January 29, 2017
|
|||||
|
Deferred revenues
|
$
|
9,794
|
|
|
$
|
11,419
|
|
|
Deferred cost of revenues
|
(2,189
|
)
|
|
(2,246
|
)
|
||
|
Deferred revenue, net
|
7,605
|
|
|
9,173
|
|
||
|
Deferred product design and engineering recoveries
|
5,153
|
|
|
2,886
|
|
||
|
Total deferred revenue
|
$
|
12,758
|
|
|
$
|
12,059
|
|
Cost of Sales
Cost of sales includes materials, depreciation on fixed assets used in the manufacturing process, shipping costs, direct labor and overhead.
Sales and Marketing
The Company expenses sales and marketing costs, which include advertising costs, as they are incurred. Advertising costs were
$0.6 million
,
$0.4 million
and
$0.2 million
fo
r fiscal years
2018
,
2017
and
2016
, respectively.
Product Development and Engineering
Product development and engineering costs are charged to expense as incurred. Recoveries from nonrecurring engineering services are recorded as an offset to product development expense incurred in support of this effort since these activities do not represent an earnings process core to the Company’s business and serve as a mechanism to partially recover development expenditures.
The Company received approximately
$5.4 million
,
$11.9 million
and
$21.1 million
in fiscal years
2018
,
2017
and
2016
, respectively for nonrecurring engineering services.
Income Taxes
The Company accounts for income taxes using the asset and liability method. Under this method, deferred tax assets and liabilities are recognized for the estimated future tax consequences attributable to differences between the financial statement carrying amounts and their respective tax bases. The Balance Sheets include current and long term prepaid taxes under "Prepaid taxes" and "Other assets" and current and long term liabilities for uncertain tax positions under "Accrued liabilities" and "Other long-term liabilities."
As part of the process of preparing the Company’s consolidated financial statements, the Company estimates income taxes in each of the jurisdictions in which it operates. This process involves estimating the current tax liability together with assessing temporary differences resulting from differing treatment of items for tax and accounting purposes. These differences result in deferred tax assets and liabilities. The Company must assess the likelihood that its deferred tax assets will be recovered from future taxable income and, to the extent the Company believes that recovery is not likely, it must establish a valuation allowance. To the extent the Company changes its valuation allowance in a period, the change is generally recorded through the tax provision on the Statements of Income.
For intra-entity differences between the tax basis of an asset in the buyer’s tax jurisdiction and their cost as reported in the consolidated financial statements, the Company does not recognize a deferred tax asset. Income taxes paid on intra-entity profits on assets remaining within the group are accounted for as prepaid taxes. (See Note
12
for further discussion of income taxes).
The Company continually reviews its position on undistributed earnings from its foreign subsidiaries to determine whether those earnings are indefinitely reinvested offshore. Domestic and foreign operating cash flow forecasts are reviewed to determine the sources and uses of cash. Based on these forecasts, the Company determines the need to accrue deferred tax liabilities associated with its undistributed earnings offshore.
Other Comprehensive Income (Loss)
Other comprehensive income includes unrealized gains and losses on available-for-sale investments, interest rate hedging activities and foreign currency translation adjustments. This information is provided in the Statements of Comprehensive Income.
65
The following table summarizes the changes in other comprehensive income (loss) by component:
|
Fiscal Year Ended
|
|||||||||||||||||||||||||||||||||||||
|
January 28,
2018 |
January 29,
2017 |
January 31,
2016 |
|||||||||||||||||||||||||||||||||||
|
(in thousands)
|
Pre-tax Amount
|
Tax Benefit (Expense)
|
Net Amount
|
Pre-tax Amount
|
Tax Benefit (Expense)
|
Net Amount
|
Pre-tax Amount
|
Tax Benefit (Expense)
|
Net Amount
|
||||||||||||||||||||||||||||
|
Defined benefit plan:
|
|
|
|
|
|||||||||||||||||||||||||||||||||
|
Other comprehensive gain (loss) before reclassifications
|
$
|
637
|
|
$
|
(253
|
)
|
384
|
|
$
|
(2,861
|
)
|
$
|
447
|
|
$
|
(2,414
|
)
|
$
|
—
|
|
$
|
—
|
|
$
|
—
|
|
|||||||||||
|
Foreign currency hedge:
|
|
|
—
|
|
|
|
|
|
|
|
—
|
|
|
|
|
|
|||||||||||||||||||||
|
Other comprehensive gain before reclassifications
|
1,205
|
|
(263
|
)
|
942
|
|
586
|
|
(64
|
)
|
522
|
|
—
|
|
—
|
|
—
|
|
|||||||||||||||||||
|
Reclassification adjustments included in "Interest expense, net"
|
(1,531
|
)
|
299
|
|
(1,232
|
)
|
(260
|
)
|
28
|
|
(232
|
)
|
—
|
|
—
|
|
—
|
|
|||||||||||||||||||
|
Interest rate hedge:
|
|
|
|
|
|
|
|
|
|
|
|
|
|||||||||||||||||||||||||
|
Other comprehensive gain (loss) before reclassifications
|
—
|
|
—
|
|
—
|
|
48
|
|
—
|
|
48
|
|
(33
|
)
|
(171
|
)
|
(204
|
)
|
|||||||||||||||||||
|
Reclassification adjustments included in "Interest expense, net"
|
—
|
|
—
|
|
—
|
|
—
|
|
—
|
|
—
|
|
694
|
|
—
|
|
694
|
|
|||||||||||||||||||
|
Other:
|
|||||||||||||||||||||||||||||||||||||
|
Other comprehensive gain before reclassifications
|
—
|
|
—
|
|
—
|
|
129
|
|
—
|
|
129
|
|
—
|
|
—
|
|
—
|
|
|||||||||||||||||||
|
Other comprehensive income (loss)
|
$
|
311
|
|
$
|
(217
|
)
|
$
|
94
|
|
$
|
(2,358
|
)
|
$
|
411
|
|
$
|
(1,947
|
)
|
$
|
661
|
|
$
|
(171
|
)
|
$
|
490
|
|
||||||||||
Accumulated Other Comprehensive Income (Loss)
The following summarizes the changes in accumulated other comprehensive income (loss) by component:
|
(in thousands)
|
Defined Benefit Plan
|
Foreign Currency Hedge
|
Interest Rate Hedge
|
Other
|
Accumulated Other Comprehensive Income (Loss)
|
||||||||||||||
|
Balance as of January 25, 2015
|
$
|
—
|
|
$
|
—
|
|
$
|
(538
|
)
|
$
|
701
|
|
$
|
163
|
|
||||
|
Other comprehensive income
|
—
|
|
—
|
|
490
|
|
—
|
|
490
|
|
|||||||||
|
Balance as of January 31, 2016
|
—
|
|
—
|
|
(48
|
)
|
701
|
|
653
|
|
|||||||||
|
Other comprehensive (loss) income
|
(2,414
|
)
|
290
|
|
48
|
|
129
|
|
(1,947
|
)
|
|||||||||
|
Balance as of January 29, 2017
|
(2,414
|
)
|
290
|
|
—
|
|
830
|
|
(1,294
|
)
|
|||||||||
|
Other comprehensive income (loss)
|
384
|
|
(290
|
)
|
—
|
|
—
|
|
94
|
|
|||||||||
|
Balance as of January 28, 2018
|
$
|
(2,030
|
)
|
$
|
—
|
|
$
|
—
|
|
$
|
830
|
|
$
|
(1,200
|
)
|
||||
Share-Based Compensation
The Company measures compensation cost for all share-based payments (including stock options) at fair value using valuation models, which consider, among other things, estimates and assumptions on the rate of forfeiture, expected life of options and stock price volatility and market value of the Company's common stock. Additionally, for awards with a performance condition, the Company uses financial forecasts that use assumptions that are consistent with those used for other valuation exercises, including goodwill valuation and asset impairment assessments. If any of the assumptions used in the valuation model change significantly, share-based compensation expense may differ materially in the future from that recorded in the current period and actual results may differ from estimates. See the information set forth in Part II, Item 5 of this Annual Report on Form 10-K for market information detailing the trading prices of the Company's common stock.
66
The Company has various equity award plans ("Plans") that provide for granting stock-based awards to employees and non-employee directors of the Company. The Plans provide for the granting of several available forms of stock compensation. As of
January 28, 2018
, the Company has granted non-qualified stock option awards ("NQSOs") and restricted stock unit awards ("RSUs") under the Plans and has also issued some share-based compensation outside of the Plans, including NQSOs and RSUs as inducements to join the Company.
Earnings per Share
The computation of basic and diluted earnings per common share was as follows:
|
|
Fiscal Year Ended
|
||||||||||
|
(in thousands, except per share amounts)
|
January 28, 2018
|
January 29, 2017
|
January 31, 2016
|
||||||||
|
Net income
|
$
|
36,426
|
|
$
|
54,661
|
|
$
|
11,497
|
|
||
|
Weighted average common shares outstanding - basic
|
66,027
|
|
65,427
|
|
65,657
|
|
|||||
|
Dilutive effect of share-based compensation
|
1,578
|
|
682
|
|
304
|
|
|||||
|
Weighted average common shares outstanding - diluted
|
67,605
|
|
66,109
|
|
65,961
|
|
|||||
|
Basic earnings per common share
|
$
|
0.55
|
|
$
|
0.84
|
|
$
|
0.18
|
|
||
|
Diluted earnings per common share
|
$
|
0.54
|
|
$
|
0.83
|
|
$
|
0.17
|
|
||
|
Anti-dilutive shares not included in the above calculations
|
402
|
|
1,111
|
|
2,569
|
|
|||||
Basic earnings per common share is computed by dividing income available to common stockholders by the weighted-average number of shares of common stock outstanding during the reporting period. Diluted earnings per common share incorporates the incremental shares issuable, calculated using the treasury stock method, upon the assumed exercise of NQSOs and the vesting of RSUs.
Contingencies
The Company accrues an undiscounted liability for contingencies where the incurrence of a loss is probable and the amount can be reasonably estimated, and the Company discloses the amount accrued and the amount of a reasonably possible loss in excess of the amount accrued, if such disclosure is necessary for our consolidated financial statements not to be misleading. These accruals are adjusted periodically as assessments change or additional information becomes available. The Company does not record liabilities when the likelihood that the liability has been incurred is probable but the amount cannot be reasonably estimated, or when the liability is believed to be only reasonably possible or remote.
Because litigation outcomes are inherently unpredictable, the Company’s evaluation of legal proceedings often involves a series of complex assessments by management about future events and can rely heavily on estimates and assumptions. If the assessments indicate that loss contingencies that could be material to any one of our consolidated financial statements are not probable, but are reasonably possible, or are probable, but cannot be estimated, then the Company discloses the nature of the loss contingencies, together with an estimate of the range of possible loss or a statement that such loss is not reasonably estimable.
The Company also records contingent earn-out liabilities which represent the Company’s requirement to make additional payments related to acquisitions based on certain performance targets achieved during the earn-out periods. The Company measures contingent earn-out liabilities at fair value on a recurring basis using significant unobservable inputs classified within Level 3 of the fair value hierarchy. On a quarterly basis, the Company uses a Monte Carlo valuation method as a valuation technique to determine the value of the earn-out liability. The significant unobservable inputs used in the fair value measurements are revenue projections over the earn-out period (or other specified performance targets) and the probability outcome percentages assigned to each scenario. Significant increases or decreases to either of these inputs in isolation would result in a significantly higher or lower liability, with a higher liability capped by the contractual maximum of the contingent earn-out obligation.
Recently Adopted Accounting Guidance
In the first quarter of fiscal year 2018, the Company adopted FASB Accounting Standards Update ("ASU") No. 2016-09, Improvements to Employee Share-Based Payment Accounting (Topic 718). Under the amended guidance, all excess tax benefits and tax deficiencies will be recognized in the Statements of Income as they occur. This replaced the previous guidance, which required tax benefits that exceed compensation cost ("windfalls") to be recognized in additional paid in capital. It also eliminates the need to maintain a windfall pool, and removes the requirement to delay recognizing a windfall until it reduces current taxes payable. Using the modified retrospective adoption method, in the first quarter of fiscal year 2018, the Company
67
recognized deferred tax assets of
$8.4 million
for the windfall tax benefits and also recognized an increase of an equal amount in the valuation allowance against those deferred tax assets. Under the amended guidance, companies can make an accounting policy election to either continue to estimate forfeitures or account for forfeitures as they occur. Upon adoption, the Company elected to account for forfeitures when they occur, on a modified retrospective basis. In the first quarter of fiscal year 2018, a cumulative effect adjustment of
$2.0 million
was recorded to retained earnings. The amended guidance also changed the Statements of Cash Flow presentation of excess tax benefits, classifying them as operating activities instead of financing activities, consistent with other cash flows related to income taxes. Further, following the adoption of this updated guidance, there will be additional dilutive effects in earnings per share calculations because excess tax benefits are no longer recognized in additional paid in capital. Due to the valuation allowance maintained against the Company’s deferred tax assets, the adoption of this updated guidance did not have a material impact on the Company’s consolidated financial statements.
Accounting Guidance Issued but Not Adopted as of
January 28, 2018
In August 2017, the FASB issued ASU No. 2017-12, Derivatives and Hedging (Topic 815). The new standard is designed to refine and expand hedge accounting for both financial (e.g., interest rate) and commodity risks. Its provisions create more transparency around how economic results are presented, both on the face of the financial statements and in the footnotes. It also makes certain targeted improvements to simplify the application of hedge accounting guidance. The new standard is effective for interim and annual fiscal years beginning after December 15, 2018, and interim periods within those fiscal years. Early adoption, including adoption in an interim period, is permitted. The Company is currently evaluating the impact this ASU will have on its consolidated condensed financial statements and disclosures.
In July 2017, the FASB issued ASU No. 2017-11, Earnings Per Share (Topic 260); Distinguishing Liabilities from Equity (Topic 480); Derivatives and Hedging (Topic 815). This standard addresses narrow issues identified as a result of the complexity associated with applying GAAP for certain financial instruments with characteristics of liabilities and equity. Part I addresses the complexity of accounting for certain financial instruments with down round features. Part II addresses the difficulty of navigating Topic 480, Distinguishing Liabilities from Equity, because of the existence of pending content in the Accounting Standards Codification ("ASC") that results from the indefinite deferral of accounting requirements concerning mandatorily redeemable financial instruments of certain non-public entities and certain mandatorily redeemable non-controlling interests. The Company does not expect the adoption of this pronouncement to have a material impact on the Company’s consolidated financial statements.
In March 2017, the FASB issued ASU No. 2017-07, Compensation - Retirement Benefits (Topic 715). This standard amends the Statements of Income presentation of the components of net periodic benefit cost for defined benefit pension and other post retirement plans. This standard requires companies to: (1) disaggregate the current service cost component from the other components of net periodic benefit cost (the "other components") and present it in the same line items on the Statements of Income as other current compensation costs for related employees and (2) present the other components outside of operating profit. This standard is required to be applied retrospectively and is effective for annual and interim periods beginning after December 15, 2017. The Company does not expect the adoption of this pronouncement to have a material impact on the Company’s consolidated financial statements.
In January 2017, the FASB issued ASU No. 2017-04, Intangibles-Goodwill and Other (Topic 350). The pronouncement was issued to simplify the subsequent measurement of goodwill by eliminating Step 2 from the goodwill impairment test. This pronouncement stipulates that an entity should perform a goodwill impairment test by comparing the fair value of a reporting unit with its carrying amount, and will recognize an impairment charge for the amount by which the carrying amount exceeds the reporting unit’s fair value, with the loss recognized not exceeding the total amount of goodwill allocated to that reporting unit. The amendments in this pronouncement are to be applied on a prospective basis. This guidance will be effective for annual or any interim goodwill impairment tests in fiscal years beginning after December 15, 2019, with early adoption permitted for interim or annual goodwill impairment tests performed on testing dates after January 31, 2017. The adoption of this pronouncement is not expected to have a material impact on the Company’s consolidated financial statements.
In January 2017, the FASB issued ASU No. 2017-01, Business Combinations (Topic 805). This standard clarifies the definition of a business to assist entities with evaluating when a set of assets acquired or disposed of should be considered a business. The new standard requires an entity to evaluate if substantially all the fair value of the gross assets acquired is concentrated in a single identifiable asset or group of similar identifiable assets; if so, the set would not be considered a business. The new standard also requires a business to include at least one substantive process and narrows the definition of outputs. The new standard is effective for interim and annual periods beginning after December 15, 2017, and may be adopted earlier. The standard would be applied prospectively to any transaction occurring on or after the adoption date. The impact of this standard will be dependent upon the specific facts and circumstances of any applicable future acquisitions or dispositions.
In October 2016, the FASB issued ASU No. 2016-16, Intra-Entity Asset Transfers Other Than Inventory (Topic 740). This accounting standard update is aimed at recognizing the income tax consequences of intra-entity transfers of assets other than
68
inventory when they occur. This removes the exception to postpone recognition until the asset has been sold to an outside party. This ASU will be effective in the first quarter of fiscal year 2020. The standard update is required to be applied on a modified retrospective basis through a cumulative-effect adjustment to the Balance Sheet as of the beginning of the fiscal year of adoption. The Company is currently assessing the impact this pronouncement will have on its consolidated financial statements.
In August 2016, the FASB issued ASU 2016-15, Statement of Cash Flows: Classification of Certain Cash Receipts and Cash Payments (Topic 230). The primary purpose of this ASU is to reduce the diversity in practice that has resulted from the lack of consistent principles on this topic. This ASU is effective for fiscal years beginning after December 15, 2017. This ASU will be effective for the Company as of the beginning of fiscal year 2019. Early adoption is permitted in any interim or annual period. The Company is continuing to assess the overall impacts of the new standard.
In February 2016, the FASB issued ASU No. 2016-02, Leases (Topic 842), which will require that substantially all leases be recognized by lessees on their Balance Sheets as a right-of-use asset and corresponding lease liability, including leases currently accounted for as operating leases. The new standard also will result in enhanced quantitative and qualitative disclosures, including descriptions of significant judgments made by management, to provide greater insight into the extent of expense recognized and expected to be recognized from existing leases. The standard requires modified retrospective adoption and will be effective for the Company as of the beginning of fiscal year 2020. The Company expects the valuation of right of use assets and lease liabilities, previously described as operating leases, to be the present value of the Company's forecasted future lease commitments. The Company is continuing to assess the overall impacts of the new standard, including the discount rate to be applied in these valuations.
In May 2014, the FASB issued ASU No. 2014-09, Revenue from Contracts with Customers (Topic 606), which will require an entity to recognize revenue from the transfer of promised goods or services to customers in an amount that reflects the consideration to which the entity expects to be entitled in exchange for those goods or services. The guidance addresses, in particular, contracts with more than one performance obligation, as well as the accounting for some costs to obtain or fulfill a contract with a customer, and provides for additional disclosures with respect to revenues and cash flows arising from contracts with customers. Public entities are required to apply the amendments on either a full- or modified-retrospective basis for annual periods beginning after December 15, 2017 and for interim periods within those annual periods. This update will be effective for the Company beginning in the first quarter of fiscal year 2019. The Company plans to adopt the standard retrospectively with the cumulative effect of initially applying it recognized at the date of initial application ("modified retrospective" approach).
The Company is substantially complete with its impact assessment and identified a change in timing of revenue recognition on the Company's sales made to certain distributors where revenues are currently deferred and not recognized until the distributor sells to the end customers. Upon adoption of the standard, the Company will no longer defer revenue until sale by the distributor to the end customer, but rather, will record revenue at the time of sale to the distributor. The Company will also be required to estimate the effects of returns and allowances provided to distributors.
On the date of initial application, the Company will reverse the deferred net revenue through a cumulative adjustment to retained earnings on sales made to distributors where revenue was recognized upon sales to the end customer. The Company does not expect the impact of this cumulative adjustment to be material to the reported revenue in the period of adoption, or in future periods, as the impact will be offset by the revenue recognized for sales to distributors upon shipment, post adoption. The cumulative impact of adopting the standard on January 29, 2018 is expected to be between
$10.0 million
to
$12.0 million
(net of tax) increase to retained earnings and a corresponding decrease to deferred net revenue.
69
Note
3
: Acquisitions
AptoVision Technologies Inc.
On
July 1, 2017
, the Company acquired
AptoVision Technologies Inc.
("AptoVision"), a privately-held provider of uncompressed, zero-frame latency, video-over-IP solutions addressing the professional audio visual market. The unique combination of AptoVision's advanced algorithms for real-time, full bandwidth video transmission over IP networks, and Semtech's industry leading high-speed signal integrity and chip development expertise is expected to enable the adoption of Software Defined Video over Ethernet ("SDVoE") accelerating this natural progression in the evolution of video transport.
Under the terms of the share purchase agreement, the Company acquired all of the outstanding equity interest in AptoVision for a
cash payment of
$17.6 million
at closing, net of acquired cash, and a commitment to pay
additional contingent consideration of up to a maximum of
$47.0 million
over
three years
if certain goals are achieved in each of the earn out periods. The fair value of the additional contingent consideration (the "AptoVision Earn-out") as of
January 28, 2018
was
$21.0 million
, of which
$8.9 million
is presented within "Accrued liabilities" and
$12.1 million
is presented within "Other long-term liabilities" in the Balance Sheets. For the fiscal year ended January 28, 2018, acquisition related transaction costs of
$1.6 million
are accounted for as an expense in the period in which the costs are incurred and are presented within "Selling, general and administrative" expense in the Statements of Income.
AptoVision met the definition of a business and is accounted for under the acquisition method of accounting in accordance with the FASB’s ASC Topic 805, Business Combinations. The consideration to acquire AptoVision was allocated to the acquired tangible and intangible assets and assumed liabilities of AptoVision based on their respective estimated fair values as of the acquisition date. A summary of the allocation is as follows:
|
(in thousands)
|
Estimated Useful Life
|
January 28, 2018
|
|||
|
Finite-lived intangible asset - Developed Technology
|
6-7 years
|
$
|
20,000
|
|
|
|
Finite-lived intangible asset - Customer Relationships
|
3 years
|
4,000
|
|
||
|
Indefinite-lived intangible asset - in-process research and development ("IPR&D")
|
2,300
|
|
|||
|
Goodwill
|
12,194
|
|
|||
|
Other (liabilities) assets, net
|
(3,875
|
)
|
|||
|
Total consideration
|
$
|
34,619
|
|
||
The fair value of the developed technology rights acquired was determined by estimating the probability-weighted net cash flows attributable to these rights discounted to present value using a discount rate that represents the estimated rate that market participants would use to value this intangible asset. The developed technology rights acquired relate to AptoVision’s BlueRiver™ platform.
The fair value of the customer relationships was determined by estimating the amount that would be required currently to replace the customers from lead generations to product shipment.
The IPR&D primarily relates to an assumed license agreement that had been executed in close proximity to the acquisition date. The investment in the license approximates fair value.
The
$12.2 million
excess of the acquisition consideration over the fair value of the assets acquired and liabilities assumed was allocated to goodwill. The goodwill resulted from expected synergies and other benefits from the transaction. The Company expects that all such goodwill will be deductible for tax purposes. The purchase price allocation for the AptoVision acquisition is complete.
Net revenues and earnings attributable to AptoVision since the acquisition date were not material. Pro forma results of operations have not been presented as AptoVision’s annual financial results are not material to the Company’s consolidated financial statements.
Triune Systems, L.L.C
On
March 4, 2015
the Company acquired
Triune Systems, L.L.C.
("Triune"), a privately-held supplier of isolated switching, wireless charging and power management platforms targeted at, among other things, high and low power, high efficiency applications. Under the terms of the purchase agreement, the Company acquired all of the outstanding equity interest in Triune for a guaranteed minimum purchase price of
$45.0 million
consisting of
$35.0 million
in cash paid at closing, with an additional cash consideration of
$10.0 million
of which
$9.5 million
was paid in September 2015 and
$0.5 million
was paid in the second quarter of fiscal year 2017. In March 2015, the Company borrowed
$35.0 million
under its revolving line of credit in connection with this acquisition (see Note
10
for discussion regarding Credit Facilities).
70
Subject to achieving certain future financial goals ("Triune Earn-out"), up to
$70.0 million
of contingent consideration will be paid over
three years
if certain revenue targets are achieved in each of the fiscal years 2016 through 2018. An additional payment of up to
$16.0 million
will be paid after fiscal year 2018 if certain cumulative revenue and operating income targets are achieved.
The Triune Earn-out targets for fiscal year 2017 were not met and the Company does not expect the fiscal year 2018 targets to be achieved. The fair value of the Triune Earn-out liability was
zero
as of
January 28, 2018
. (See Notes
5
and
13
).
The Triune business meets the definition of a business and is accounted for under the acquisition method of accounting in accordance with the FASB’s ASC Topic 805, Business Combinations. The purchase price allocation for the Triune acquisition was finalized in the second quarter of fiscal year 2016. Total acquisition consideration has been allocated to the acquired tangible and intangible assets and assumed liabilities of Triune based on their respective estimated fair values as of the acquisition date. Acquisition-related transaction costs are not included as a component of consideration transferred, but are accounted for as an expense in the period in which the costs are incurred. Any excess of the acquisition consideration over the fair value of the assets acquired and liabilities assumed has been allocated to goodwill. The goodwill resulted from expected synergies from the transaction, including complementary products that will enhance the Company’s overall product portfolio, and opportunities within new markets. The Company expects that
$16.1 million
of goodwill will be deductible for tax purposes.
The Company’s allocation of the total purchase price for Triune is summarized below:
|
(in thousands)
|
At March 4, 2015
|
||
|
Current assets
|
$
|
877
|
|
|
Property, plant, and equipment, net
|
226
|
|
|
|
Amortizable intangible assets
|
12,000
|
|
|
|
Goodwill
|
49,384
|
|
|
|
Current liabilities
|
(1,287
|
)
|
|
|
Earn-out liability
|
(16,200
|
)
|
|
|
Total acquisition consideration
|
$
|
45,000
|
|
Triune’s technology complemented the portfolio of products offered in the Company’s legacy Power and High-Reliability Products Group. The Company concluded that the Triune and legacy Power and High-Reliability components should be aggregated and deemed a single reporting unit after considering similarities among different economic characteristics such as concentration of key customers, unit selling price decreases, increased competitors due to market expansion and chain of command of the newly acquired business.
Net revenues and earnings attributable to Triune since the acquisition date were not material. Pro forma operating results have not been presented as Triune’s annual operating results have not been material to the Company’s consolidated financial results.
71
Note
4
: Investments
Cash and cash equivalents includes investments in money market funds that are valued based on the net asset value of the funds. The cash equivalents consist primarily of money market funds that are Level 1 measurements. There were
no
investments in these funds for the fiscal year ended
January 28, 2018
and
$16.9 million
for the fiscal year ended
January 29, 2017
.
The following table summarizes the Company’s available-for-sale securities:
|
January 28, 2018
|
January 29, 2017
|
||||||||||||||||||||||
|
(in thousands)
|
Market Value
|
Adjusted
Cost
|
Gross
Unrealized
Gain
|
Market Value
|
Adjusted
Cost
|
Gross
Unrealized
Gain
|
|||||||||||||||||
|
Convertible debt
|
$
|
1,960
|
|
$
|
1,960
|
|
$
|
—
|
|
$
|
1,425
|
|
$
|
1,425
|
|
$
|
—
|
|
|||||
|
Total other assets
|
$
|
1,960
|
|
$
|
1,960
|
|
$
|
—
|
|
$
|
1,425
|
|
$
|
1,425
|
|
$
|
—
|
|
|||||
The following table summarizes the maturities of the Company’s available-for-sale securities:
|
January 28, 2018
|
January 29, 2017
|
||||||||||||||
|
(in thousands)
|
Market Value
|
Adjusted Cost
|
Market Value
|
Adjusted Cost
|
|||||||||||
|
Within 1 year
|
$
|
1,960
|
|
$
|
1,960
|
|
$
|
1,425
|
|
$
|
1,425
|
|
|||
|
After 1 year through 5 years
|
—
|
|
—
|
|
—
|
|
—
|
|
|||||||
|
Total investments
|
$
|
1,960
|
|
$
|
1,960
|
|
$
|
1,425
|
|
$
|
1,425
|
|
|||
The Company's available-for-sales securities consisted of an investment in a convertible debt instrument issued by a privately-held company and is included in "Other current assets" within the Balance Sheets. In fiscal year 2018, the Company issued a new
$2.0 million
convertible debt instrument, and in the third quarter of fiscal year 2018, the Company received cash to fully settle the previously-issued convertible debt instrument.
The Company currently has a
$28.0 million
investment in a private entity, which includes
$5.0 million
of restricted deposit that is accounted for at cost, and included in "Other assets" within the Balance Sheets. As part of its investment, the Company received a call option that allows the Company to purchase all of the outstanding equity of the entity. The call option, which was out of the money at inception, is exercisable until June 30, 2018.
72
Note
5
: Fair Value Measurements
Instruments Measured at Fair Value on a Recurring Basis
Financial assets and liabilities measured and recorded at fair value on a recurring basis were presented within the Company's Balance Sheets as follows:
|
Fair Value as of January 28, 2018
|
Fair Value as of January 29, 2017
|
||||||||||||||||||||||||||||||
|
(in thousands)
|
Total
|
(Level 1)
|
(Level 2)
|
(Level 3)
|
Total
|
(Level 1)
|
(Level 2)
|
(Level 3)
|
|||||||||||||||||||||||
|
Financial assets:
|
|||||||||||||||||||||||||||||||
|
Cash equivalents
|
$
|
—
|
|
$
|
—
|
|
$
|
—
|
|
$
|
—
|
|
$
|
16,945
|
|
$
|
16,945
|
|
$
|
—
|
|
$
|
—
|
|
|||||||
|
Convertible debt
|
1,960
|
|
—
|
|
—
|
|
1,960
|
|
1,425
|
|
—
|
|
—
|
|
1,425
|
|
|||||||||||||||
|
Derivative financial instruments
|
—
|
|
—
|
|
—
|
|
—
|
|
326
|
|
—
|
|
326
|
|
—
|
|
|||||||||||||||
|
Total financial assets
|
$
|
1,960
|
|
$
|
—
|
|
$
|
—
|
|
$
|
1,960
|
|
$
|
18,696
|
|
$
|
16,945
|
|
$
|
326
|
|
$
|
1,425
|
|
|||||||
|
Financial liabilities:
|
|||||||||||||||||||||||||||||||
|
AptoVision Earn-out
|
$
|
21,000
|
|
$
|
—
|
|
$
|
—
|
|
$
|
21,000
|
|
$
|
—
|
|
$
|
—
|
|
$
|
—
|
|
$
|
—
|
|
|||||||
|
Cycleo Earn-out
|
668
|
|
—
|
|
—
|
|
668
|
|
1,242
|
|
—
|
|
—
|
|
1,242
|
|
|||||||||||||||
|
Total financial liabilities
|
$
|
21,668
|
|
$
|
—
|
|
$
|
—
|
|
$
|
21,668
|
|
$
|
1,242
|
|
$
|
—
|
|
$
|
—
|
|
$
|
1,242
|
|
|||||||
During fiscal years
2018
and
2017
, the Company had
no
transfers of financial assets or liabilities between Level 1, Level 2 or Level 3. As of
January 28, 2018
and
January 29, 2017
, the Company had not elected the fair value option for any financial assets and liabilities for which such an election would have been permitted.
The fair values of the foreign exchange forward contracts are valued using Level 2 inputs. Foreign currency forward contracts are valued using readily available foreign currency forward and interest rate curves. The fair value of each contract is determined by comparing the contract rate to the forward rate and discounting to the present value. Contracts in a gain position are recorded in the Balance Sheets under the caption "Other current assets” and the value of contracts in a loss position are recorded under the caption "Accrued liabilities” within the Balance Sheets. Please see Note
18
for further discussion of the Company’s derivative instruments.
The convertible debt is valued using probability weighted cash flows (Level 3 inputs).
The AptoVision Earn-out liability is valued utilizing estimates of annual revenue, adjusted earnings and product development targets (Level 3 inputs) through July 2020. These estimates represent inputs for which market data are not available and are developed using the best information available about the assumptions that market participants would use when pricing the liability.
The Cycleo Earn-out liability (see Note
13
) is valued utilizing estimates of annual revenue and operating income (Level 3 inputs) through April 2020. These estimates represent inputs for which market data are not available and are developed using the best information available about the assumptions that market participants would use when pricing the liability.
The Company measures contingent earn-out liabilities at fair value on a recurring basis using significant unobservable inputs classified within Level 3 of the fair value hierarchy. The Company uses a Monte Carlo valuation method as a valuation technique to determine the value of the earn-out liability. The significant unobservable inputs used in the fair value measurements are revenue and earnings projections over the earn-out period, and the probability outcome percentages assigned to each scenario. Significant increases or decreases to either of these inputs in isolation would result in a significantly higher or lower liability, with a higher liability capped by the contractual maximum of the contingent earn-out obligation. Ultimately, the liability will be equivalent to the amount paid, and the difference between the fair value estimate and amount paid will be recorded in earnings. For the Triune Earn-out, Cycleo Earn-out and AptoVision Earn-out, these companies have business profiles comparable to a start-up company. Accordingly, their respective revenue projections are subject to significant revisions. This characteristic can result in volatile changes to the measurement of fair value for a given earn-out.
The Company reviews and re-assesses the estimated fair value of contingent consideration on a quarterly basis, and the updated fair value could differ materially from the previous estimates. Changes in the estimated fair value of the Company’s contingent earn-out liabilities related to the time component of the present value calculation are reported in "Interest expense” within the Statements of Income. Adjustments to the estimated fair value related to changes in all other unobservable inputs are reported in operating income.
73
A reconciliation of the change in the earn-out liability during the fiscal year ended
January 28, 2018
is as follows:
|
(in thousands)
|
AptoVision
|
Cycleo
|
Total
|
||||||||
|
Balance at January 29, 2017
|
$
|
—
|
|
$
|
1,242
|
|
$
|
1,242
|
|
||
|
Current acquisitions
|
17,000
|
|
—
|
|
17,000
|
|
|||||
|
Changes in fair value of contingent earn-out obligations
|
4,000
|
|
(108
|
)
|
3,892
|
|
|||||
|
Payments
|
—
|
|
(466
|
)
|
(466
|
)
|
|||||
|
Balance as of January 28, 2018
|
$
|
21,000
|
|
$
|
668
|
|
$
|
21,668
|
|
||
Instruments Not Recorded at Fair Value on a Recurring Basis
Some of the Company’s financial instruments are not measured at fair value on a recurring basis but are recorded at amounts that approximate fair value due to their liquid or short-term nature. Such financial assets and financial liabilities include: cash and cash equivalents, net receivables, certain other assets, accounts payable, accrued expenses, accrued personnel costs, and other current liabilities.
The Company’s long-term debt is not recorded at fair value on a recurring basis, but is measured at fair value for disclosure purposes. The fair value of the Company’s Term Loans (as defined in Note
10
) is
$131.3 million
and Revolving Commitments (as defined in Note
10
) is
$97.0 million
at
January 28, 2018
both of which are based on Level 2 inputs which are derived from transactions with similar amounts, maturities, credit ratings and payment terms.
Assets and Liabilities Recorded at Fair Value on a Non-Recurring Basis
The Company reduces the carrying amounts of its goodwill, intangible assets, long-lived assets and non-marketable equity securities to fair value when held for sale or determined to be impaired.
For its investment in non-marketable equity interests, the Company has not identified events or changes in circumstances that may have a significant adverse effect on the fair value of its equity investments during fiscal year
2018
.
74
Note
6
: Inventories
Inventories, consisting of material, material overhead, labor, and manufacturing overhead, are stated at the lower of cost (first-in, first-out) or market and consist of the following:
|
(in thousands)
|
January 28, 2018
|
January 29, 2017
|
|||||
|
Raw materials
|
$
|
1,651
|
|
$
|
2,968
|
|
|
|
Work in progress
|
46,884
|
|
44,740
|
|
|||
|
Finished goods
|
22,532
|
|
18,164
|
|
|||
|
Inventories
|
$
|
71,067
|
|
$
|
65,872
|
|
|
75
Note
7
: Property, Plant and Equipment
The following is a summary of property and equipment:
|
(in thousands)
|
Estimated Useful Lives
|
January 28, 2018
|
January 29, 2017
|
||||||
|
Property
|
|
$
|
11,314
|
|
|
$
|
11,314
|
|
|
|
Buildings
|
7 to 39 years
|
32,244
|
|
|
30,294
|
|
|||
|
Leasehold improvements
|
7 to 39 years
|
10,050
|
|
|
9,566
|
|
|||
|
Machinery and equipment
|
5 to 8 years
|
171,731
|
|
|
150,276
|
|
|||
|
Enterprise resource planning systems
|
13 years
|
32,673
|
|
28,166
|
|
||||
|
Furniture and office equipment
|
3 to 7 years
|
39,027
|
|
|
35,025
|
|
|||
|
Construction in progress
|
7,151
|
|
|
5,505
|
|
||||
|
Property, plant and equipment, gross
|
304,190
|
|
|
270,146
|
|
||||
|
Less accumulated depreciation and amortization
|
(179,604
|
)
|
(161,236
|
)
|
|||||
|
Property, plant and equipment, net
|
$
|
124,586
|
|
|
$
|
108,910
|
|
||
As of
January 28, 2018
and
January 29, 2017
, construction in progress consists primarily of machinery and equipment awaiting completion of installation and being placed in service.
Depreciation expense was
$21.1 million
,
$21.7 million
, and
$23.2 million
in fiscal years
2018
,
2017
, and
2016
, respectively.
76
Note
8
: Goodwill and Intangible Assets
Goodwill
– Changes in the carrying amount of goodwill by applicable reporting unit were as follows:
|
(in thousands)
|
Signal Integrity
|
Power and High-Reliability
|
Wireless and Sensing
|
Total
|
|||||||||||
|
Balance at January 29, 2017
|
$
|
261,891
|
|
$
|
49,384
|
|
|
$
|
18,428
|
|
|
$
|
329,703
|
|
|
|
Additions
|
12,194
|
|
—
|
|
—
|
|
12,194
|
|
|||||||
|
Balance at January 28, 2018
|
$
|
274,085
|
|
$
|
49,384
|
|
$
|
18,428
|
|
$
|
341,897
|
|
|||
During the second quarter of fiscal year 2018, goodwill associated with the Signal Integrity Products Group increased due to the Company’s acquisition of AptoVision (see Note
3
).
Goodwill is not amortized, but is tested for impairment using either a qualitative assessment or a two-step method on an annual basis and whenever events or changes in circumstances indicate that the carrying value may not be recoverable. The recoverability of goodwill is measured at the reporting unit level by comparing the reporting unit’s carrying amount, including goodwill, to the fair market value of the reporting unit.
Goodwill is allocated to
three
reporting units (Signal Integrity, Power and High-Reliability and Wireless and Sensing) (see Note
15
). The difference between the fair value and the carrying amount of these reporting units is one of several factors the Company will consider before reaching its conclusion about whether to perform the first step of the goodwill impairment test.
Goodwill was tested for impairment at the reporting unit level as of
November 30, 2017
and
November 30, 2016
, the dates of the Company’s annual impairment review for fiscal years
2018
and
2017
, respectively.
For fiscal years 2018 and 2017, the Company performed a qualitative assessment and concluded that it was more likely than not that the fair value of each of the three reporting units exceeded its carrying value. As such, the Company did not perform a quantitative impairment analysis.
In addition to its annual review, the Company performs a test of impairment when indicators of impairment are present. As of
January 28, 2018
and
January 29, 2017
, there were no indications of impairment of the Company's goodwill balances.
Acquired Intangibles
- The following table sets forth the Company’s finite-lived intangible assets resulting from business acquisitions and technology licenses purchased, which continue to be amortized:
|
|
January 28, 2018
|
January 29, 2017
|
|||||||||||||||||||||||
|
(in thousands)
|
Estimated
Useful Life
|
Gross
Carrying
Amount
|
Accumulated
Amortization
|
Net Carrying
Amount
|
Gross
Carrying
Amount
|
Accumulated
Amortization
|
Net Carrying
Amount
|
||||||||||||||||||
|
Core technologies
|
5-8 years
|
$
|
164,930
|
|
$
|
(115,628
|
)
|
$
|
49,302
|
|
$
|
144,930
|
|
$
|
(92,940
|
)
|
$
|
51,990
|
|
||||||
|
Customer relationships
|
3-10 years
|
34,031
|
|
(25,426
|
)
|
8,605
|
|
30,030
|
|
(20,247
|
)
|
9,783
|
|
||||||||||||
|
Total finite-lived intangible assets
|
$
|
198,961
|
|
$
|
(141,054
|
)
|
$
|
57,907
|
|
$
|
174,960
|
|
$
|
(113,187
|
)
|
$
|
61,773
|
|
|||||||
Amortization expenses recorded in the Statements of Income for each period were as follows:
|
(in thousands)
|
January 28, 2018
|
January 29, 2017
|
January 31, 2016
|
||||||||
|
Core technologies
|
$
|
22,688
|
|
$
|
20,901
|
|
$
|
20,692
|
|
||
|
Customer relationships
|
5,179
|
|
4,400
|
|
4,367
|
|
|||||
|
Total amortization expense
|
$
|
27,867
|
|
$
|
25,301
|
|
$
|
25,059
|
|
||
77
Future amortization expense by operating segment is expected to be as follows:
|
(in thousands)
|
|
|
|
||||||||
|
To be recognized in:
|
Core Technologies
|
Customer relationships
|
Total
|
||||||||
|
Fiscal year 2019
|
$
|
20,666
|
|
$
|
5,733
|
|
$
|
26,399
|
|
||
|
Fiscal year 2020
|
13,239
|
|
2,283
|
|
15,522
|
|
|||||
|
Fiscal year 2021
|
6,389
|
|
589
|
|
6,978
|
|
|||||
|
Fiscal year 2022
|
3,905
|
|
—
|
|
3,905
|
|
|||||
|
Fiscal year 2023
|
3,714
|
|
—
|
|
3,714
|
|
|||||
|
Thereafter
|
1,389
|
|
—
|
|
1,389
|
|
|||||
|
Total expected amortization expense
|
$
|
49,302
|
|
$
|
8,605
|
|
$
|
57,907
|
|
||
The following table sets forth the Company’s indefinite-lived intangible assets resulting from additions to IPR&D:
|
(in thousands)
|
Net Carrying Amount
|
||
|
Value at January 31, 2016
|
$
|
—
|
|
|
Value at January 29, 2017
|
—
|
|
|
|
In-process research and development through acquisitions
|
2,300
|
|
|
|
Value at January 28, 2018
|
$
|
2,300
|
|
The Company reviews indefinite-lived intangible assets for impairment as of November 30, each year, by comparing the carrying amount of the asset to the future discounted cash flows that asset is expected to generate.
78
The following is a summary of accrued liabilities for fiscal years
2018
and
2017
:
|
(in thousands)
|
January 28, 2018
|
January 29, 2017
|
|||||
|
Compensation
|
$
|
20,476
|
|
|
$
|
23,477
|
|
|
Earn-out liability
|
10,958
|
|
|
1,426
|
|
||
|
Deferred compensation
|
2,333
|
|
1,732
|
|
|||
|
Sales and marketing
|
4,284
|
|
4,322
|
|
|||
|
Professional fees
|
2,377
|
|
1,529
|
|
|||
|
Royalty
|
3,820
|
|
3,167
|
|
|||
|
Income taxes payable
|
1,470
|
|
|
11,382
|
|
||
|
Environment reserve
|
2,583
|
|
|
620
|
|
||
|
Restructuring
|
5,078
|
|
1,408
|
|
|||
|
Other
|
7,453
|
|
|
5,461
|
|
||
|
Accrued liabilities
|
$
|
60,832
|
|
$
|
54,524
|
|
|
79
Note
10
: Credit Facilities
On November 15, 2016 (the "Closing Date"), Semtech Corporation, with certain of its domestic subsidiaries as guarantors (the "Guarantors"), entered into the amended and restated credit facility with the lenders party thereto ("Lenders"), and HSBC Bank USA, National Association, as administrative agent and as swing line lender and letter of credit issuer. The amended and restated credit facility amended and restated the prior credit agreement. The Company accounted for the amended and restated credit facility as a debt modification. Pursuant to the amended and restated credit facility, the Lenders provided the Company with senior secured first lien credit facilities in an aggregate principal amount of
$400.0 million
, consisting of term loans in an aggregate initial principal amount of
$150.0 million
("Term Loans") and revolving commitments in an aggregate principal amount of
$250.0 million
("Revolving Commitments"). Up to
$40.0 million
of the revolving commitments may be used to obtain letters of credit, up to
$25.0 million
of the revolving commitments may be used to obtain swing line loans, and up to
$40.0 million
of the revolving commitments may be used to obtain revolving loans and letters of credit in certain currencies other than U.S. Dollars. Each of the term loans and the revolving commitments is scheduled to mature on
November 12, 2021
. As of
January 28, 2018
, there we
re no a
mounts outstanding under the letters of credit, swing line loans and alternative currency sub-facilities.
All of the proceeds of the amended and restated credit facility were used to repay in full all of the obligations outstanding under the Company’s prior credit facility and to pay transaction costs in connection with such refinancing. As of November 15, 2016,
$247.0 million
of borrowings were outstanding under the amended and restated credit facility, consisting of
$150.0 million
in term loans and
$97.0 million
in revolving loans, and there was
$153.0 million
of undrawn revolving commitments. The proceeds of the revolving credit facility may be used by the Company for capital expenditures, permitted acquisitions, permitted dividends, working capital and general corporate purposes.
The amended and restated credit facility provides that, subject to certain conditions, the Company may request the establishment of one or more additional term loan facilities and/or increases to the revolving commitments in an aggregate principal amount not to exceed the sum of (a)
$150.0 million
and (b) the aggregate principal amount of all voluntary prepayments of term loans made prior to the date of incurrence of such additional term loan facilities and/or increases to the revolving commitments. The Lenders will have an opportunity to, but are not required to participate in the additional term loan facilities and/or revolving commitment increases. If the Lenders do not agree to provide such incremental facilities, the Company may request such additional and/or increased facilities from additional lenders.
Interest on loans made under the amended and restated credit facility in U.S. Dollars accrues, at the Company's option, at a rate per annum equal to (1) the Base Rate (as defined below) plus a margin ranging from
0.25%
to
1.25%
depending upon the Company’s consolidated leverage ratio or (2) LIBOR (determined with respect to deposits in U.S. Dollars) for an interest period to be selected by the Company plus a margin ranging from
1.25%
to
2.25%
depending upon the Company's consolidated leverage ratio (such margin, the "Applicable Margin"). The initial interest margin will be
2.00%
for Base Rate loans and
1.00%
for LIBOR rate loans, applicable until 2 business days following delivery of a compliance certificate by Semtech to the administrative agent with respect to the first fiscal period ending after the Closing Date. The "Base Rate" is equal to a fluctuating rate equal to the highest of (a) the prime rate of the administrative agent, (b) ½ of
1%
above the federal funds effective rate published by the Federal Reserve Bank of New York and (c) one-month LIBOR (determined with respect to deposits in U.S. Dollars) plus
1.00%
. Interest on loans made under the amended and restated credit facility in alternative currencies accrues at a rate per annum equal to LIBOR (determined with respect to deposits in the applicable alternative currency) (other than loans made in Canadian Dollars, for which a special reference rate for Canadian Dollars applies) for an interest period to be selected by the Company plus the Applicable Margin.
Commitment fees on the unused portion of the revolving commitments accrue at a rate per annum ranging from
0.20%
to
0.45%
depending upon the Company's consolidated leverage ratio, provided the initial commitment fee shall be
0.40%
per annum, applicable until two business days following delivery of a compliance certificate by the Company to the administrative agent with respect to the first fiscal period ending after the Closing Date. With respect to letters of credit, the Company will pay the administrative agent, for the account of the lenders under the revolving credit facility, letter of credit participation fees at a rate per annum equal to the applicable margin then in effect with respect to LIBOR-based loans under the revolving commitments on the face amount of all outstanding letters of credit. The Company also will pay HSBC Bank USA, N.A., as the issuing bank, a fronting fee for each letter of credit issued under the amended and restated credit facility at a rate equal to
0.125%
per annum based on the maximum amount available to be drawn under each such letter of credit, as well as its customary documentation fees.
All obligations of the Company under the amended and restated credit facility are unconditionally guaranteed by each of the Guarantors, which currently consist of all of the direct and indirect domestic subsidiaries of Semtech Corporation. Semtech Corporation and the Guarantors have also pledged substantially all of their assets to secure their obligations under the amended and restated credit facility, including the Company's owned real property located in Camarillo, California.
The outstanding principal balance of the term loans will be subject to repayment in quarterly installments. No amortization is required with respect to the revolving credit facility. The Company may voluntarily prepay borrowings under the amended and
80
restated credit facility at any time and from time to time, without premium or penalty, other than customary "breakage costs" and fees for LIBOR-based loans.
The term loans must be mandatorily prepaid using the proceeds of certain dispositions of assets and receipt of insurance proceeds, subject to agreed-upon thresholds and exceptions and customary reinvestment rights.
The amended and restated credit facility contains customary covenants, including limitations on Company’s ability to, among other things, incur indebtedness, create liens on assets, engage in certain fundamental corporate changes, make investments, sell or otherwise dispose of assets, repurchase stock, pay dividends or make similar distributions, engage in certain transactions with affiliates and make capital expenditures. In addition, the Company must comply with the following financial covenants, tested at the end of each fiscal quarter on a trailing four-quarter basis: (i) a minimum consolidated interest coverage ratio of
3.00
to 1.00 and (ii) a maximum consolidated leverage ratio of
3.00
to 1.00 provided that, such maximum consolidated leverage ratio may be increased to
3.25
to 1.00 or
3.50
to 1.00, as applicable, for the four consecutive fiscal quarters ending on or after the date of consummation of a permitted acquisition which constitutes a "Material Acquisition" under the amended and restated credit facility, subject to the satisfaction of certain conditions. As of January 28, 2018, the Company was in compliance with its financial covenants.
The amended and restated credit facility also contains customary provisions pertaining to events of default. If any event of default occurs, the principal, interest, and any other monetary obligations on all the then outstanding amounts can become due and payable immediately by action of the administrative agent acting upon the instructions of or with the consent of the Lenders representing more than
50%
of the revolving commitments and outstanding term loans or automatically upon the occurrence of certain bankruptcy events related to the Company.
As of
January 28, 2018
, the interest rate payable on both the Term Loans and the Revolving Commitments was
3.19%
.
Scheduled maturities of current and long-term Term Loans are as follows:
|
(in thousands)
|
|||
|
Fiscal Year Ending:
|
|||
|
2019
|
$
|
15,937
|
|
|
2020
|
18,750
|
|
|
|
2021
|
19,688
|
|
|
|
2022
|
76,875
|
|
|
|
Total debt
|
$
|
131,250
|
|
There are no scheduled principal payments for the Revolving Commitments which had an outstanding balance of
$97.0 million
at
January 28, 2018
and is due on or before
November 12, 2021
.
81
Note
11
: Share-Based Compensation
Financial Statement Effects and Presentation
.
The following table summarizes pre-tax share-based compensation included in the Statements of Income for fiscal years
2018
,
2017
and
2016
:
|
Fiscal Year Ended
|
|||||||||||
|
(in thousands)
|
January 28, 2018
|
January 29, 2017
|
January 31, 2016
|
||||||||
|
Revenue offset (Warrant)
|
$
|
16,219
|
|
$
|
5,396
|
|
$
|
—
|
|
||
|
Cost of sales
|
1,477
|
|
1,591
|
|
1,555
|
|
|||||
|
Selling, general and administrative
|
22,423
|
|
18,019
|
|
10,055
|
|
|||||
|
Product development and engineering
|
7,817
|
|
5,822
|
|
8,858
|
|
|||||
|
Share-based compensation
|
$
|
47,936
|
|
$
|
30,828
|
|
$
|
20,468
|
|
||
|
Net change in share-based compensation capitalized into inventory
|
$
|
(414
|
)
|
$
|
38
|
|
$
|
(98
|
)
|
||
Grant Date Fair Values and Underlying Assumptions:
The Company uses the Black-Scholes pricing model to value stock options. The estimated fair value of restricted stock units, for which vesting is not linked to a market condition, is calculated based on the market price of the Company’s common stock on the date of grant. For restricted stock units that vest according to a market condition, the Company uses a Monte Carlo simulation model to value the award.
The following table summarizes the assumptions used in the Black-Scholes model to determine the fair value of stock options granted in fiscal years
2018
,
2017
and
2016
:
|
|
Fiscal Year Ended
|
||||
|
|
January 28, 2018
|
January 29, 2017
|
January 31, 2016
|
||
|
Expected lives, in years
|
4.2
|
4.1 - 4.5
|
4.2 - 4.3
|
||
|
Estimated volatility
|
31.7%
|
31% - 32%
|
29% - 32%
|
||
|
Dividend yield
|
—
|
—
|
—
|
||
|
Risk-free interest rate
|
1.68%
|
1.04% - 1.51%
|
1.24% - 1.49%
|
||
|
Weighted average fair value on grant date
|
$10.70
|
$5.71
|
$6.08
|
||
82
The assumptions used in the Black-Scholes option pricing model were determined as follows:
|
•
|
Fair Value of Common Stock
- The closing price on the date of the grant.
|
|
•
|
Expected Term
- The expected term represents the period that our stock-based awards are expected to be outstanding.
|
|
•
|
Expected Volatility
- The expected volatility was derived from the annualized volatility of the Company's closing stock price over the preceding
three
or
four
years depending upon the life of the option award.
|
|
•
|
Risk-Free Interest Rate
- The risk-free interest rate is based on the U.S. Treasury yield curve in effect at the time of grant for zero-coupon U.S. Treasury notes with maturities approximately equal to the expected term of the stock option grants.
|
|
•
|
Dividend Rate
- We have never declared or paid any cash dividends and do not plan to pay cash dividends in the foreseeable future, and, therefore, use an expected dividend yield of
zero
.
|
Stock Options
. The Company has historically granted non-qualified stock options to both employees and non-employee directors. The fair value of these grants was measured on the grant date. The grant date for these awards is equal to the measurement date. These awards are valued as of the measurement date and recognized as an expense over the requisite vesting period (typic
ally
3
-
4
years). T
he number of shares authorized per the equity incentive plan is
17,031,653
. The maximum contractual term of equity share options is
ten years
.
The following table summarizes the activity for stock options for fiscal years
2018
:
|
(in thousands, except for per share amounts)
|
Number
of
Shares
|
Weighted
Average
Exercise
Price
(per share)
|
Aggregate
Intrinsic
Value
(1)
|
Number of
Shares
Exercisable
|
Weighted
Average
Contractual
Term (years)
|
|||||||||
|
Balance at January 29, 2017
|
1,511
|
|
24.79
|
|
13,503
|
|
759
|
|||||||
|
Options granted
|
135
|
|
37.70
|
|
||||||||||
|
Options exercised
|
(275
|
)
|
24.27
|
|
3,446
|
|
||||||||
|
Options cancelled/forfeited
|
(26
|
)
|
26.22
|
|
||||||||||
|
Balance at January 28, 2018
|
1,345
|
|
$
|
26.17
|
|
$
|
13,953
|
|
807
|
|||||
|
Exercisable at January 29, 2018
|
807
|
|
$
|
26.61
|
|
$
|
7,941
|
|
2.1
|
|||||
|
Vested and expected to vest after January 29, 2018
|
1,345
|
|
$
|
26.17
|
|
$
|
13,953
|
|
3.0
|
|||||
(1)
The aggregate intrinsic value of stock options vested and exercisable and vested and expected to vest as of
January 28, 2018
is calculated based on the difference between the exercise price and the closing price
$36.45
of the Company's common stock on January 26, 2018.
The aggregate unrecognized compensation as of
January 28, 2018
is
$2.6 million
to be recognized over
1.9
years.
The following table summarizes information regarding unvested stock option awards at
January 28, 2018
:
|
(in thousands, except for per share amounts)
|
Number
of
Shares
|
Weighted Average
Exercise Price
(per share)
|
Weighted Average
Grant Date
Fair Value
(per share)
|
|||||||
|
Balance at January 29, 2017
|
749
|
|
|
22.66
|
|
|
6.29
|
|
||
|
Options granted
|
135
|
|
|
37.70
|
|
|
10.70
|
|
||
|
Options vested
|
(324
|
)
|
|
23.92
|
|
|
6.71
|
|
||
|
Options forfeited
|
(26
|
)
|
|
26.23
|
|
|
7.32
|
|
||
|
Balance at January 28, 2018
|
534
|
|
|
$
|
25.50
|
|
|
$
|
7.10
|
|
83
Performance-Based Units
. The Company grants performance-based restricted stock units to select employees. These awards have a performance condition in addition to a service condition. Prior to fiscal year 2018, the Company granted performance-based restricted stock units with performance metrics that were based on a pre-defined cumulative
three
-year performance of the Company’s revenue and non-GAAP operating income measured against internal goals. For these awards, the performance was tied to the Company’s performance in the grant year and the succeeding two fiscal years. The performance award recipients must be employed for the entire three-year period, which is the explicit service and requisite service period, and be an active employee at the time of vesting of the awards (cliff vesting at the end of the third year). Under the terms of these awards, assuming the highest performance level of
200%
with no cancellations due to forfeitures, the maximum number of shares that can be earned would be
219,000
shares and an additional
219,000
shares would be settled in cash. The Company would have a liability accrued under "Other liabilities" within the Balance Sheets equal to the value of
219,000
shares on the settlement date, which would be settled in cash. Only cash performance-based restricted stock unit awards are classified as liabilities and the value of these awards is re-measured at each reporting date. At
January 28, 2018
, the performance metrics associated with the outstanding awards issued in fiscal year
2017
is expected to be met at a level which would result in a grant at
190%
of target.
The performance-based restricted stock units are valued as of the measurement date and expense is recognized on a straight line basis for the awards expected to vest based on the probability of attainment of the performance condition for each separately vesting portion of the award.
Beginning in fiscal year 2018, the Company granted
215,857
performance-based restricted stock units that have a pre-defined market condition and service condition. These grants are accounted for as equity awards. The market condition is determined based upon the Company’s total stockholder return ("TSR") benchmarked against the TSR of the S&P SPDR Semiconductor ETF (NYSE:XSD) over a
one
,
two
and
three
-year performance period (
one-third of the awards vesting each performance period
). Award recipients must be employed for the entire performance period and be an active employee at the time of vesting. The Company used a Monte Carlo simulation to determine the grant-date fair value for these awards, which takes into consideration the possible outcomes pertaining to the TSR market condition. The grant-date fair value per unit of the awards granted in the first quarter of fiscal year 2018 for each one, two and three-year performance period is
$38.01
,
$39.76
and
$40.89
, respectively. The portion of the awards that vested at the end of fiscal year 2018 reflected a performance achievement of
58.2%
of target. At
January 28, 2018
, the market metrics associated with the outstanding awards issued in fiscal year 2018 is expected to be met at a level which would result in a performance achievement of
58.2%
of target.
The following table summarizes the activity for performance-based restricted stock units for fiscal years
2018
and
2017
:
|
|
Subject to
Share Settlement
|
Subject to
Cash Settlement
|
Weighted
Average
Grant Date
|
|||||||||||||
|
(in thousands, except for per share amounts)
|
Total
Units
|
Units
|
Units
|
Recorded
Liability
|
Fair Value
(per share)
|
|||||||||||
|
Balance at January 29, 2017
|
383
|
|
195
|
|
188
|
|
$
|
1,677
|
|
22.31
|
|
|||||
|
Performance units granted
|
216
|
|
216
|
|
—
|
|
39.55
|
|
||||||||
|
Performance units vested
|
(42
|
)
|
(42
|
)
|
—
|
|
—
|
|
38.01
|
|
||||||
|
Performance units cancelled/forfeited
|
(194
|
)
|
(114
|
)
|
(80
|
)
|
30.07
|
|
||||||||
|
Change in liability
|
—
|
|
4,791
|
|
||||||||||||
|
Balance at January 28, 2018
|
363
|
|
255
|
|
108
|
|
$
|
6,468
|
|
$
|
26.58
|
|
||||
The liability associated with performance-based restricted stock units increased by
$4.8 million
in fiscal year
2018
due to
the re-measurement adjustments and changes in the expected performance results.
The aggregate unrecognized compensation as of
January 28, 2018
is
$5.9 million
which will be recognized over
1.2
years.
Market Performance Restricted Stock Units.
On February 26, 2014, the Company granted its CEO restricted stock units with a market performance condition. The award is eligible to vest during the period commencing February 26, 2014 and ending February 26, 2019 (the "Performance Period") as follows:
30%
of the restricted stock units covered by the award will vest if, during any consecutive
120
calendar day period that commences and ends during the Performance Period, the average per-share closing price of the Company’s common stock equals or exceeds
$35.00
("Tranche 1") and the award will vest in full if, during any consecutive
120
calendar day period that commences and ends during the Performance Period, the average per-share closing price of the Company’s common stock equals or exceeds
$40.00
("Tranche 2"). The award will also vest if a majority change in control of the Company occurs during the Performance Period and, in connection with such event, the Company’s stockholders become entitled to receive per-share consideration having a value equal to or greater than
$40.00
. The fair value of the awards was determined to be
$17.26
and
$14.88
for Tranche 1 and Tranche 2, respectively, on the grant date by application of the Monte Carlo simulation model. These awards were fully expensed prior to fiscal year 2018.
84
The following tables summarize the assumptions used in the Monte Carlo simulation model to determine the fair value of restricted stock units granted in fiscal year 2015 for both Tranche 1 and Tranche 2.
|
January 25, 2015
|
|||
|
Tranche 1
|
Tranche 2
|
||
|
Expected life, in years
|
1.6
|
2.1
|
|
|
Estimated volatility
|
34%
|
34%
|
|
|
Dividend yield
|
—%
|
—%
|
|
|
Risk-free interest rate
|
1.5%
|
1.5%
|
|
|
Weighted average fair value on grant date
|
$17.26
|
$14.88
|
|
The following table summarizes the activity for the market performance restricted stock units for the fiscal year ended
January 28, 2018
:
|
(in thousands, except for per share amounts)
|
Total Units
|
Weighted Average
Grant Date
Fair Value
(per unit)
|
||||
|
Balance at January 29, 2017
|
220
|
|
|
$
|
15.59
|
|
|
Market performance units granted
|
—
|
|
|
—
|
|
|
|
Market performance units vested
|
(66
|
)
|
|
17.26
|
|
|
|
Market performance units cancelled/forfeited
|
—
|
|
|
—
|
|
|
|
Balance at January 28, 2018
|
154
|
|
$
|
14.88
|
|
|
Restricted Stock Units, Employees
. The Company grants restricted stock units to employees which are expected to be settled with shares of the Company's common stock. The grant date for these awards is equal to the measurement date. These awards are valued as of the measurement date and recognized as an expense over the requisite vesting period (typic
ally
4
ye
ars).
|
(in thousands, except for per share amounts)
|
Restricted Stock Units, Stock Grants, and Stock Units
|
Performance Shares
(1)
|
|||||||||||||||
|
2018
|
2017
|
2016
|
2018
|
2017
|
2016
|
||||||||||||
|
Units granted
|
983
|
|
|
1,228
|
|
|
1,032
|
|
|
216
|
|
231
|
|
235
|
|
||
|
Weighted-average grant date fair value
|
36.96
|
|
|
22.12
|
|
|
20.79
|
|
|
39.55
|
|
17.51
|
|
28.60
|
|
||
(1)
Restricted stock units granted includes awards that will be cash settled of
0
units in fiscal year
2018
,
115,500
units in fiscal year
2017
, and
90,500
units in fiscal year
2016
.
The following table is a summary of the status of non-vested restricted stock unit awards as of
January 28, 2018
and changes during the year.
|
Restricted Stock Units, Stock Grants, and Stock Units
|
Performance Shares
|
||||||||||||
|
(in thousands, except for per share amounts)
|
Shares
|
Weighted Average
Grant Date
Fair Value
(per unit)
|
Shares
|
Weighted Average
Grant Date
Fair Value
(per unit)
|
|||||||||
|
Nonvested at January 29, 2017
|
2,141
|
|
|
$
|
22.54
|
|
383
|
|
$
|
22.31
|
|
||
|
Granted
|
983
|
|
|
$
|
36.96
|
|
216
|
|
$
|
39.55
|
|
||
|
Vested
|
(792
|
)
|
|
$
|
23.41
|
|
(42
|
)
|
$
|
38.01
|
|
||
|
Forfeited
|
(157
|
)
|
|
$
|
27.03
|
|
(194
|
)
|
$
|
30.07
|
|
||
|
Nonvested at January 28, 2018
|
2,175
|
|
$
|
28.42
|
|
363
|
|
$
|
26.58
|
|
|||
The aggregate unrecognized compensation for the non-vested restricted stock units and performance shares as of
January 28, 2018
is
$47.5 million
and
$5.9 million
, respectively, which will be recognized over
2.3
and
1.2
years, respectively.
Restricted Stock Units, Cash-Settled, Non-Employee Directors
. The Company maintains a compensation program pursuant to which restricted stock units are granted to the Company’s directors that are not employed by the Company or any of its
85
subsidiaries. In June 2015, the Company changed its director compensation program so that a portion of the stock units granted under the program would be settled in cash and a portion would be settled in shares of the Company's common stock. Restricted stock units awarded under the program are scheduled to vest on the earlier of (i)
one
year after the grant date or (ii) the day immediately preceding the annual meeting of shareholders in the year following the grant. The portion of a restricted stock unit award under the program that is to be settled in cash will, subject to vesting, be settled when the director who received the award separates from the board of directors. The portion of a restricted stock unit award under the program that is to be settled in shares of stock will, subject to vesting, be settled promptly following vesting. There were no changes to the terms and conditions of the existing awards.
The restricted stock units that are to be settled in cash are accounted for as liabilities. Because these awards are not typically settled until a non-employee director’s separation from service, the value of these awards is re-measured at the end of each reporting period until settlement.
As of
January 28, 2018
, the total number of vested but unsettled restricted stock units for non-employee directors is
197,313
. As of
January 28, 2018
,
$7.5 million
of the liability associated with these awards is included in "Other long-term liabilities" within the Balance Sheets.
Restricted Stock Units, Stock Settled, Non-Employee Directors.
As a result of the June 2015 changes to the Company’s director compensation program, beginning in July 2015, the Company began granting new restricted stock units to non-employee Directors which are expected to be settled with shares of the Company's common stock at the time of vesting. The grant date for these awards is equal to the measurement date. These awards are valued as of the measurement date and recognized as an expense over the requisite vesting period (typically
one year
).
Modification of Awards.
On December 19, 2014 and August 17, 2015, the Company modified the equity awards of certain executive officers by providing for the acceleration of vesting upon termination of their employment in certain circumstances in connection with a change in control of the Company. The awards are not considered probable of vesting and the Company will continue to evaluate the probability going forward. These modifications impacted the stock awards of
12
executive employees and resulted in
no
incremental compensation cost for the fiscal year ended
January 28, 2018
since it is not considered probable as of this date that a change of control will occur.
Warrant.
On October 5, 2016 the Company issued a warrant (the "Warrant") to Comcast Cable Communications Management LLC ("Comcast") to purchase up to
1,086,957
shares (the "Warrant Shares") of the Company’s common stock, par value
$0.01
per share, representing a total of
$30.0 million
of common stock based on the average closing price over the
10
-trading day period ended October 4, 2016, at an exercise price of
$0.01
per Warrant Share. The Warrant provides for net share settlement that, if elected by Comcast, will reduce the number of Warrant Shares issued upon exercise to reflect net settlement of the exercise price. Comcast may also request cash settlement of the Warrant upon exercise in lieu of the issuance of Warrant Shares; however, such cash settlement is at the sole and absolute discretion of the Company. The Warrant vested
10%
on its issuance, and the remainder vests based on the achievement during the subsequent
30
-month period ("Milestone Period") by Comcast (or its designee) of certain milestones related to the deployment of a LoRaWAN™-based network in cities around the country. The number of Warrant Shares are subject to customary adjustment provisions for stock split, reclassification, reorganization, consolidation, merger, and similar transactions. The Warrant has a term of
seven years
from October 5, 2016.
The Warrant was issued by the Company to Comcast in connection with an agreement between the parties regarding the intended trial deployment by Comcast of a low-power wide-area Network ("LPWAN") in the United States, based on the Company’s LoRa® devices and wireless radio frequency technology.
The Warrant is accounted for as equity. The cost of the Warrant is recognized as an offset to net sales over the respective performance period which is expected to be completed by April 2018. The Warrant consists of
five
performance tranches. The cost associated with each tranche is recognized based on the fair value at each reporting date until vesting which is the measurement date.
The underlying Warrant Shares issued to Comcast in fiscal year
2017
, which amounted to
978
shares at a weighted average grant date fair value of
$27.74
, had aggregate unrecognized compensation of
$20.6 million
as of
January 28, 2018
. During fiscal year 2018,
109,000
shares underlying the Warrant vested and such portion of the Warrant for the underlying
109,000
shares has been exercised. The Warrant has a contractual life of
seven years
. Given the nominal exercise price of the Warrant Share, the Company valued the awards using the closing price of the Company’s stock on the measurement date for shares that have vested and the fair value on the Balance Sheets date for the other shares.
86
Note
12
: Income Taxes
The Company's regional income before income taxes is as follows:
|
Fiscal Year Ended
|
|||||||||||
|
(in thousands)
|
January 28, 2018
|
January 29, 2017
|
January 31, 2016
|
||||||||
|
Domestic
|
$
|
(14,421
|
)
|
$
|
(19,602
|
)
|
$
|
(5,636
|
)
|
||
|
Foreign
|
74,292
|
|
92,662
|
|
26,015
|
|
|||||
|
Total
|
$
|
59,871
|
|
$
|
73,060
|
|
$
|
20,379
|
|
||
The provision for taxes consists of the following:
|
Fiscal Year Ended
|
|||||||||||
|
(in thousands)
|
January 28, 2018
|
January 29, 2017
|
January 31, 2016
|
||||||||
|
Current tax provision
|
|
|
|||||||||
|
Federal
|
$
|
2,108
|
|
$
|
—
|
|
|
$
|
—
|
|
|
|
State
|
—
|
|
—
|
|
|
—
|
|
||||
|
Foreign
|
13,442
|
|
16,034
|
|
|
8,709
|
|
||||
|
Subtotal
|
15,550
|
|
16,034
|
|
|
8,709
|
|
||||
|
Deferred tax provision (benefit)
|
|
|
|||||||||
|
Federal
|
7,701
|
|
107
|
|
|
6,679
|
|
||||
|
State
|
—
|
|
—
|
|
|
(96
|
)
|
||||
|
Foreign
|
(60
|
)
|
2,258
|
|
|
(6,410
|
)
|
||||
|
Subtotal
|
7,641
|
|
2,365
|
|
|
173
|
|
||||
|
Provision for taxes
|
$
|
23,191
|
|
$
|
18,399
|
|
|
$
|
8,882
|
|
|
The provision for taxes reconciles to the amount computed by applying the statutory federal rate to income before taxes as follows:
|
Fiscal Year Ended
|
|||||||||||
|
(in thousands)
|
January 28, 2018
|
January 29, 2017
|
January 31, 2016
|
||||||||
|
Federal income tax at statutory rate
|
$
|
20,222
|
|
|
$
|
25,571
|
|
|
$
|
7,133
|
|
|
State income taxes, net of federal benefit
|
(159
|
)
|
|
—
|
|
|
(7
|
)
|
|||
|
Foreign taxes at rates less than federal rates
|
(8,698
|
)
|
|
(12,074
|
)
|
|
(62
|
)
|
|||
|
Tax credits generated
|
(3,278
|
)
|
|
(2,864
|
)
|
|
(3,598
|
)
|
|||
|
Changes in valuation allowance
|
(41,911
|
)
|
|
5,578
|
|
|
1,847
|
|
|||
|
Non-taxable gain on sale
|
—
|
|
(2,978
|
)
|
—
|
|
|||||
|
Changes in uncertain tax positions
|
1,538
|
|
|
1,047
|
|
|
1,009
|
|
|||
|
Deemed dividends
|
299
|
|
|
266
|
|
|
276
|
|
|||
|
Equity compensation
|
(8,333
|
)
|
|
2,553
|
|
|
2,529
|
|
|||
|
Permanent differences
|
264
|
|
|
448
|
|
|
28
|
|
|||
|
Deferred tax provision - indefinite life intangibles
|
—
|
|
|
—
|
|
|
5,670
|
|
|||
|
Triune Earn-out
|
—
|
|
|
—
|
|
|
(5,670
|
)
|
|||
|
Revaluation of deferred tax assets and liabilities
|
—
|
|
|
—
|
|
|
334
|
|
|||
|
Impact of US tax reform
(1)
|
65,442
|
|
—
|
|
—
|
|
|||||
|
Other
|
(2,195
|
)
|
|
852
|
|
|
(607
|
)
|
|||
|
Provision for taxes
|
$
|
23,191
|
|
|
$
|
18,399
|
|
|
$
|
8,882
|
|
(1)
Impact of US tax reform includes
$2.6 million
of benefit from remeasurement of deferreds,
$0.4 million
of expense due to change in permanent reinvestment assertion net of foreign tax credits generated, and
$66.5 million
of expense due to the estimated impact of the transition tax, net of foreign tax credits generated. The transition tax, net of previously fully valued deferreds results in a total estimated current income tax payable of
$1.1 million
.
87
The Company receives an income tax benefit from tax rate differentials due to its presence in foreign jurisdictions such as Switzerland and Canada where statutory rates are lower than U.S. federal tax rates. This income tax benefit is reflected in the line item "Foreign taxes at rates less than federal rates." This line also includes the benefit of the Swiss Ruling discussed below.
The Company, via its Swiss subsidiary, Semtech (International) AG, receives an income tax benefit in Switzerland because only a portion of its total earnings are subject to taxation in Switzerland. Specifically, in the third quarter of fiscal year 2014, the Company received a Swiss tax ruling ("Swiss Ruling"), with an effective date retroactive to the beginning of fiscal year 2014, which allows the Company to compute Swiss income tax using an allocated portion of its total pre-tax earnings that are attributable to the sourcing of production activities. This Swiss Ruling superseded a Swiss tax ruling that was in effect during fiscal years 2012 and 2013.
On December 6, 2016, the Company was granted a tax holiday ("Tax Holiday") with an effective date of January 30, 2017. This Tax Holiday replaces the current Swiss Ruling. The Tax Holiday provides Semtech (International) AG with a
70%
reduction to the Cantonal tax rate, bringing the statutory Cantonal tax rate down from
12.56%
to
3.77%
. The maximum benefit under this Tax Holiday is
CHF 500.0 million
of cumulative after tax profit which equates to a maximum potential tax savings of
CHF 44.0 million
. The Tax Holiday is effective for
five years
and can be extended for an additional
five years
if the Company meets certain staffing targets by January 30, 2022.
The Tax Cuts and Jobs Act of 2017
On December 22, 2017, the U.S. enacted the Tax Cuts and Jobs Act (“Tax Act”) that instituted fundamental changes to the taxation of multinational corporations. The Tax Act includes changes to the taxation of foreign earnings by implementing a dividend exemption system, expansion of the current anti-deferral rules, a minimum tax on low-taxed foreign earnings and new measures to deter base erosion. The Tax Act also includes a permanent reduction in the corporate tax rate to
21%
, repeal of the corporate alternative minimum tax, expensing of capital investment, and limitation of the deduction for interest expense. Furthermore, as part of the transition to the new tax system, a one-time transition tax is imposed on a U.S. shareholder’s historical undistributed earnings of foreign affiliates. Although the Tax Act is generally effective January 1, 2018, U.S. GAAP requires recognition of the tax effects of new legislation during the reporting period that includes the enactment date, which was December 22, 2017.
As a result of the impact of the Tax Act, the SEC provided guidance (Staff Accounting Bulletin 118 (“SAB 118”)) that allows public companies to record provisional amounts for those impacts, with the requirement that the accounting be completed in a period not to exceed one year from the date of enactment. As of January 28, 2018, the Company has not completed the accounting for the tax effects of the Tax Act. Therefore, the Company has recorded provisional amounts for the effects of the Tax Act, including but not limited to, the following primary impacts of the Tax Act: re-measurement of deferred tax assets and liabilities and the estimated calculation of the one-time mandatory transition tax on undistributed earnings of foreign affiliates.
Corporate Tax Rate Change
: For the year ended January 28, 2018, the Company recorded an income tax benefit of approximately
$2.6 million
due to the decrease in the corporate tax rate from
35%
to
21%
and resulting re-measurement of the Company’s indefinite-lived deferred tax liability.
Mandatory Transition Tax
: For the year ended January 28, 2018, the Company recorded a provisional income tax expense of
$2.1 million
(net of valuation allowance) due to the imposition of the mandatory transition tax on the deemed repatriation of undistributed foreign earnings. In connection with this expense, the Company has estimated that it will utilize approximately
$78.4 million
of tax attributes, resulting in a current tax liability of
$1.1 million
. The Tax Act imposes a one-time tax on undistributed and previously untaxed post-1986 foreign earnings and profits, as determined in accordance with U.S. tax principles, of certain foreign corporations owned by U.S. shareholders. The mandatory transition tax is imposed at a rate of
15.5%
to the extent of the cash and cash equivalents that are held by the foreign affiliates at certain testing dates; the remaining earning and profits are taxed at a rate of
8.0%
. In accordance with the Tax Act, the Company will elect to pay the mandatory transitional tax liability during fiscal 2019. The Company has recorded a provisional amount because there is limited information from federal and state taxing authorities regarding the application and interpretation of the recently enacted legislation. The Company will disclose the impact to the provisional amount in the reporting period in which the accounting is completed, which will not exceed one year from the date of enactment of the Tax Act.
Undistributed Foreign Earnings
: Prior to the enactment of the Tax Act, with few exceptions, U.S. federal income and foreign withholding taxes had not been provided on the excess of the amount for financial reporting over the tax basis of investments in the Company’s foreign subsidiaries that were essentially permanent in duration. With the enactment of the Tax Act, all post-1986 previously unremitted earnings for which no U.S. deferred tax liability had been accrued have now been subject to U.S. tax. Not withstanding the U.S. taxation of these amounts, the Company has determined that
$453.6 million
of foreign earnings will continue to be reinvested indefinitely outside of the U.S. As a result, the Company has not provided any tax on these amounts because the Company believes that it currently has the ability to keep those earnings indefinitely invested and the Company has specific plans for reinvestment of these undistributed foreign earnings. In connection with the enactment of
88
the Act, the Company has determined it will remit approximately
$240.0 million
of foreign earnings in the foreseeable future, and as a result, has established a deferred income tax liability for the withholding tax that will be due upon distribution of these earnings.
Global Intangible Low Taxed Income
: In addition to the changes described above, the Tax Act imposes a U.S. tax on global intangible low taxed income (“GILTI”) that is earned by certain foreign affiliates owned by a U.S. shareholder. The computation of GILTI is still subject to interpretation and additional clarifying guidance is expected, but is generally intended to impose tax on the earnings of a foreign corporation that are deemed to exceed a certain threshold return relative to the underlying business investment. The Company is continuing to evaluate the impact of the GILTI provisions on our domestic valuation allowance, if any. We do not currently have all the information necessary to complete this analysis, and, as such, have not adjusted our valuation allowance analysis in the current fiscal year to reflect the impact of the GILTI provisions. In accordance with guidance issued by the FASB, the Company has made a policy election to treat future taxes related to GILTI as a current period expense in the reporting period in which the tax is incurred.
The components of the net deferred income tax assets and liabilities at
January 28, 2018
and
January 29, 2017
are as follows:
|
(in thousands)
|
January 28, 2018
|
January 29, 2017
|
|||||
|
Non-current deferred tax asset:
|
|
||||||
|
Deferred revenue
|
$
|
—
|
|
$
|
6,229
|
|
|
|
Inventory reserve
|
2,406
|
|
3,096
|
|
|||
|
Bad debt reserve
|
659
|
|
645
|
|
|||
|
Accrued service fees
|
306
|
|
—
|
|
|||
|
Foreign tax credits
|
9,987
|
|
|
—
|
|
||
|
Research credit carryforward
|
11,707
|
|
|
25,770
|
|
||
|
NOL carryforward
|
8,326
|
|
|
42,870
|
|
||
|
Payroll and related accruals
|
7,344
|
|
|
12,556
|
|
||
|
Share-based compensation
|
9,282
|
|
|
5,524
|
|
||
|
Foreign pension deferred
|
477
|
|
727
|
|
|||
|
Other deferred assets
|
1,847
|
|
|
5,918
|
|
||
|
Valuation allowance
|
(41,050
|
)
|
|
(82,961
|
)
|
||
|
Total non-current deferred tax asset
|
11,291
|
|
|
20,374
|
|
||
|
Non-current deferred tax liabilities:
|
|
||||||
|
Inventory reserve - foreign
|
—
|
|
—
|
|
|||
|
Goodwill and other intangibles
|
(5,844
|
)
|
|
(12,534
|
)
|
||
|
Property, plant and equipment
|
(4,955
|
)
|
|
(7,483
|
)
|
||
|
Repatriation of foreign earnings
|
(10,427
|
)
|
—
|
|
|||
|
Other non-current deferred tax liabilities
|
(511
|
)
|
|
(1,745
|
)
|
||
|
Total non-current deferred tax liabilities
|
(21,737
|
)
|
|
(21,762
|
)
|
||
|
Net deferred tax assets (liabilities)
|
$
|
(10,446
|
)
|
|
$
|
(1,388
|
)
|
As of
January 28, 2018
, the Company had federal and state net operating loss carryforwards of
$0.0 million
and
$111.4 million
, respectively, which, subject to certain limitations, are available to offset future taxable income through fiscal year 2038. The Company does not expect these changes in control limitations to significantly impact its ability to utilize these attributes.
In the first quarter of fiscal year 2018, the Company adopted FASB ASU No. 2016-09, Improvements to Employee Share-Based Payment Accounting (Topic 718). Under the amended guidance, all excess tax benefits and tax deficiencies will be recognized in the Statements of Income as they occur. This replaced the previous guidance, which requires tax benefits that exceed compensation cost ("windfalls") to be recognized in additional paid in capital. It also eliminates the need to maintain a windfall pool, and removes the requirement to delay recognizing a windfall until it reduces current taxes payable. Using the modified retrospective adoption method, in the first quarter of fiscal year 2018, the Company recognized deferred tax assets of
$8.4 million
for the windfall tax benefits and also recognized an increase of an equal amount in the valuation allowance against those deferred tax assets.
As of
January 28, 2018
, the Company had gross federal and state research credits available of approximately
$6.3 million
and
$14.6 million
, respectively, which are available to offset taxable income. These credits will expire between fiscal years 2032
89
through 2038. The Company also had gross Canadian research credits available of approximately
$11.6 million
. These credits will expire between fiscal years 2029 and 2038.
As of January 28, 2018 and January 29, 2017, the Company had approximately
$30.6 million
and
$81.6 million
of net deferred tax assets, respectively, the majority of which are in the U.S. and Canada. The Company has recorded valuation allowances of
$41 million
and
$83 million
against its deferred tax assets at January 28, 2018 and January 29, 2017, respectively, based on the Company's assessment of its ability to utilize its deferred tax assets. The valuation allowances established relate to all U. S. and state deferred tax assets, for which the Company has determined that it is more likely than not that a benefit will not be realized. In considering in whether a valuation allowance was required for our U.S. deferred income tax assets, the Company considered all available positive and negative evidence. Positive evidence considered included reversing taxable temporary differences. Negative evidence considered included the cumulative taxable losses in the U.S. recorded during the three year period ended January 29, 2018, on both an annual and cumulative basis.
Based on the weight of all available evidence, we concluded that the negative evidence outweighed the positive evidence and that it was more likely than not that the U.S. federal and state deferred tax assets that cannot be realized through the reversal of taxable temporary differences would not be realized. As a result, we have established a full valuation allowance against the deferred tax assets in the U.S. that will not be realized through the reversal of taxable temporary differences.
Changes in the valuation allowance for the three years ended
January 28, 2018
are summarized in the table below:
|
Fiscal Year Ended
|
|||||||||||
|
(in thousands)
|
January 28, 2018
|
January 29, 2017
|
January 31, 2016
|
||||||||
|
Beginning balance
|
$
|
82,961
|
|
|
$
|
77,383
|
|
|
$
|
75,536
|
|
|
Additions
|
74
|
|
|
5,578
|
|
|
9,055
|
|
|||
|
Releases
|
(41,985
|
)
|
|
—
|
|
|
(7,208
|
)
|
|||
|
Ending balance
|
$
|
41,050
|
|
|
$
|
82,961
|
|
$
|
77,383
|
|
|
Uncertain Tax Positions
The Company uses a two-step approach to recognize and measure uncertain tax positions ("UTP"). The first step is to evaluate the tax position for recognition by determining if the weight of available evidence indicates that it is more likely than not that the position will be sustained on audit, including resolution of related appeals or litigation processes, if any. The second step is to measure the tax benefit as the largest amount that is more than
50%
likely of being realized upon ultimate settlement.
A reconciliation of the beginning and ending amount of gross unrecognized tax benefits (before federal impact of state items) is as follows:
|
Fiscal Year Ended
|
|||||||
|
(in thousands)
|
January 28, 2018
|
January 29, 2017
|
|||||
|
Beginning balance
|
$
|
11,452
|
|
|
$
|
10,567
|
|
|
Additions based on tax positions related to the current year
|
5,789
|
|
|
1,005
|
|
||
|
Reductions for tax positions of prior years, net
|
(1,182
|
)
|
|
(120
|
)
|
||
|
Ending balance
|
$
|
16,059
|
|
|
$
|
11,452
|
|
Included in the balance of gross unrecognized tax benefits at
January 28, 2018
and
January 29, 2017
, are
$3.9 million
and
$9.3 million
, respectively, of net tax benefits (after federal impact of state items) that, if recognized, would impact the effective tax rate.
The liability for UTP is reflected on the Balance Sheets as follows:
|
Fiscal Year Ended
|
|||||||
|
(in thousands)
|
January 28, 2018
|
January 29, 2017
|
|||||
|
Deferred tax assets - non-current
|
$
|
12,135
|
|
$
|
9,309
|
|
|
|
Accrued liabilities
|
—
|
|
—
|
|
|||
|
Other long-term liabilities
|
3,924
|
|
2,143
|
|
|||
|
Total accrued taxes
|
$
|
16,059
|
|
$
|
11,452
|
|
|
The Company’s policy is to include net interest and penalties related to unrecognized tax benefits within the provision for taxes on the Statements of Income. Since the Company has sufficient net operating losses and research and development ("R&D")
90
credit carryforwards, there would be no cash tax liability, and therefore no additional penalties or interest accrued during fiscal year 2018. The Company had approximately
$0.0 million
and
$0.3 million
of net interest and penalties accrued at
January 28, 2018
and
January 29, 2017
, respectively.
Tax years prior to 2013 (the Company’s fiscal year 2014) are generally not subject to examination by the Internal Revenue Service ("IRS") except for items involving tax attributes that have been carried forward to tax years whose statute of limitations remains open. For state returns, the Company is generally not subject to income tax examinations for years prior to 2012 (the Company’s fiscal year 2013). The Company has a significant tax presence in Switzerland for which Swiss tax filings have been examined through fiscal year 2017. The Company is also subject to routine examinations by various foreign tax jurisdictions in which it operates. The Company believes that adequate provisions have been made for any adjustments that may result from tax examinations. However, the outcome of tax audits cannot be predicted with certainty. If any issues addressed in the Company’s tax audits are resolved in a manner not consistent with the Company's expectations, the Company could be required to adjust its provision for income taxes in the period such resolution occurs.
91
Note
13
: Commitments and Contingencies
Leases
The Company leases facilities and certain equipment under operating lease arrangements expiring in various years through fiscal year 2027. The aggregate minimum annual lease payments under leases in effect on
January 28, 2018
are as follows:
Minimum Annual Lease Payments
|
(in thousands)
|
|||
|
Fiscal Year Ending:
|
|||
|
2019
|
$
|
4,693
|
|
|
2020
|
4,002
|
|
|
|
2021
|
3,401
|
|
|
|
2022
|
1,305
|
|
|
|
2023
|
601
|
|
|
|
Thereafter
|
41
|
|
|
|
Total minimum lease commitments
|
$
|
14,043
|
|
Rent expense was
$5.9 million
,
$6.7 million
and
$7.7 million
for fiscal years
2018
,
2017
and
2016
, respectively. The Company received
$141,000
,
$131,000
and
$135,000
of sub-lease income in fiscal years
2018
,
2017
and
2016
, respectively.
Unconditional Purchase Commitments
The following table shows the Company’s open capital commitments and other open purchase commitments for the purchase of plant, equipment, raw material, supplies and services:
|
(in thousands)
|
Less than 1 year
|
1-3 years
|
Total
|
||||||||
|
Open capital purchase commitments
|
$
|
7,877
|
|
|
$
|
—
|
|
$
|
7,877
|
|
|
|
Other open purchase commitments
|
56,771
|
|
|
1,771
|
|
58,542
|
|
||||
|
Total purchase commitments
|
$
|
64,648
|
|
$
|
1,771
|
|
$
|
66,419
|
|
||
Legal Matters
In accordance with accounting standards regarding loss contingencies, the Company accrues an undiscounted liability for those contingencies where the incurrence of a loss is probable and the amount can be reasonably estimated. The Company also discloses the amount accrued and the amount of a reasonably possible loss in excess of the amount accrued, if such disclosure is necessary for its consolidated financial statements not to be misleading. The Company does not record liabilities when the likelihood that the liability has been incurred is probable but the amount cannot be reasonably estimated, or when the liability is believed to be only reasonably possible or remote. The Company evaluates, at least quarterly, developments in its legal matters that could affect the amount of liability that has been previously accrued, and makes adjustments as appropriate. Significant judgment is required to determine both probability and the estimated amount. The Company may be unable to estimate a possible loss or range of possible loss due to various reasons, including, among others: (i) if the damages sought are indeterminate; (ii) if the proceedings are in early stages, (iii) if there is uncertainty as to the outcome of pending appeals, motions or settlements, (iv) if there are significant factual issues to be determined or resolved, and (v) if there are novel or unsettled legal theories presented. In such instances, there is considerable uncertainty regarding the ultimate resolution of such matters, including a possible eventual loss, if any.
Because the outcomes of litigation and other legal matters are inherently unpredictable, the Company’s evaluation of legal matters or proceedings often involves a series of complex assessments by management about future events and can rely heavily on estimates and assumptions. While the consequences of certain unresolved matters and proceedings are not presently determinable, and an estimate of the probable and reasonably possible loss or range of loss in excess of amounts accrued for such proceedings cannot be reasonably made, an adverse outcome from such proceedings could have a material adverse effect on the Company’s earnings in any given reporting period. However, in the opinion of management, after consulting with legal counsel, any ultimate liability related to current outstanding claims and lawsuits, individually or in the aggregate, is not expected to have a material adverse effect on the Company’s consolidated financial statements, as a whole. However, legal matters are inherently unpredictable and subject to significant uncertainties, some of which are beyond the Company’s control.
92
As such, even though the Company intends to vigorously defend itself with respect to its legal matters, there can be no assurance that the final outcome of these matters will not materially and adversely affect the Company’s business, financial condition, operating results, or cash flows.
From time to time, the Company is involved in various claims, litigation, and other legal actions that are normal to the nature of its business, including with respect to IP, contract, product liability, employment, and environmental matters. In the opinion of management, after consulting with legal counsel, any ultimate liability related to current outstanding claims and lawsuits, individually or in the aggregate, is not expected to have a material adverse effect on the Company’s consolidated financial statements, as a whole.
The Company’s currently pending legal matters of note are discussed below:
Environmental Matters
The Company vacated a former facility in Newbury Park, California in 2002, but continues to address groundwater and soil contamination at the site.
The Company’s efforts to address site conditions have been at the direction of the Los Angeles Regional Water Quality Control Board (“RWQCB”). In October 2013, an order was issued including a scope of proposed additional site work, monitoring, and proposed remediation activities. The Company filed appeals of the October 2013 order seeking reconsideration by the RWQCB and review by the State Water Resources Control Board ("SWRCB") of the removal of two other potentially responsible parties, and seeking clarification of certain other factual findings. In April 2015, the RWQCB denied the Company’s request to name the two other potentially responsible parties to the order, but did correct certain findings of fact identified by the Company in its petition for reconsideration. The SWRCB has not yet ruled on the Company’s petition for review of the RWQCB’s action as the petition was filed with a request it be held in abeyance.
The Company has been complying with RWQCB orders and direction, and is implementing an approved remedial action plan (prepared by an environmental firm retained by the Company) addressing the cleanup of soil, groundwater, and soil vapor at the site.
The Company has accrued liabilities where it is probable that a loss will be incurred and the cost or amount of loss can be reasonably estimated. Based on the latest determinations by the RWQCB and the most recent actions taken pursuant to the remedial action plan, the Company continues to estimate the range of probable loss between
$4.4 million
and
$7.2 million
. Given the uncertainties associated with environmental assessment and the remediation activities, the Company is unable to determine a best estimate within the range of loss. Therefore, the Company has recorded the minimum amount of probable loss. These estimates could change as a result of changes in planned remedial actions, further actions from the regulatory agency, remediation technology, and other factors.
Indemnification
The Company has entered into agreements with its current and former executives and directors indemnifying them against certain liabilities incurred in connection with the performance of their duties. The Company’s Certificate of Incorporation and Bylaws contain comparable indemnification obligations with respect to the Company’s current directors and employees.
Product Warranties
The Company’s general warranty policy provides for repair or replacement of defective parts. In some cases, a refund of the purchase price is offered. In certain instances the Company has agreed to other or additional warranty terms, including indemnification provisions.
The product warranty accrual reflects the Company’s best estimate of probable liability under its product warranties. The Company accrues for known warranty issues if a loss is probable and can be reasonably estimated, and accrues for estimated incurred but unidentified issues based on historical experience. Historically, warranty expense has been immaterial to the Company’s consolidated financial statements.
Retirement Plans
The Company contributed
$1.3 million
,
$1.2 million
and
$1.3 million
, respe
ctively, in fiscal years
2018
,
2017
and
2016
to the 401(k) retirement plan maintained for its employees based in the U.S.
In addition, the Company also contributed
$0.8 million
,
$1.0 million
and
$1.1 million
in fiscal years
2018
,
2017
and
2016
to a defined contribution plan for its employees in Canada.
93
The Company has a defined benefit pension plan for the employees of its Swiss subsidiary (the "Swiss Plan"). The Swiss Plan is a multiple-employer plan that provides government mandated retirement, death and disability benefits. Under the Swiss Plan, the Company and its employees make government mandated minimum contributions. Minimum contributions are based on the respective employee’s age, salary, and gender. As of
January 28, 2018
, the Swiss Plan had an unfunded net pension obligation of approximately
$4.3 million
, plan assets of approximately
$25.5 million
, and a projected benefit obligation of approximately
$29.8 million
. Net periodic pension expense and contributions made by the Company for fiscal year
2018
were
$0.6 million
and
$0.9 million
, respectively. The entire pension liability has been classified as non-current because the current portion of the liability is not material.
Although the Swiss Plan originated in prior years, the Company accounted for the Swiss Plan in accordance with ASC 715-30
Defined Benefit Plans - Pensions
starting in 2017. The Company evaluated the impact of not recording the net pension obligation in the Balance Sheets and corresponding charges in net income and total comprehensive income in the Statements of Income and Statements of Comprehensive Income in the historical periods presented, and concluded that the effect was immaterial. The Company corrected the immaterial error in fiscal year 2017 by recording an out of period expense, computed as of February 1, 2016, resulting in a decrease of
$1.4 million
in net income, an increase in the pension obligation of
$5.8 million
, an increase in deferred income tax assets of
$1.3 million
, and a decrease to accumulated other comprehensive income of
$3.1 million
.
Deferred Compensation
The Company maintains a deferred compensation plan for certain officers and key executives that allow participants to defer a portion of their compensation for future distribution at various times permitted by the plan. This plan provides for a discretionary Company match up to a defined portion of the employee’s deferral, with any match subject to a vesting period.
Under this plan, the Company incurred an expense, net of forfeitures, of
$6.0 million
and
$4.3 million
in the fiscal years ended
2018
and
2017
, respectively, and a benefit, net of forfeitures, of
$0.8 million
in fiscal year
2016
.
The Company’s liability for the deferred compensation plan is presented below:
|
(in thousands)
|
January 28, 2018
|
January 29, 2017
|
|||||
|
Accrued liabilities
|
$
|
2,333
|
|
|
$
|
1,732
|
|
|
Other long-term liabilities
|
28,197
|
|
|
22,322
|
|
||
|
Total deferred compensation liabilities under this plan
|
$
|
30,530
|
|
|
$
|
24,054
|
|
The Company has purchased whole life insurance on the lives of certain current deferred compensation plan participants. This Company-owned life insurance is held in a grantor trust and is intended to cover a majority of the Company’s costs of the deferred compensation plan. The cash surrender value of the Company-owned life insurance was
$22.3 million
and
$18.9 million
as of
January 28, 2018
and
January 29, 2017
, respectively, and is included in "Other assets" on the Balance Sheets.
Earn-out Liability
Pursuant to the terms of the amended earn-out arrangement ("Cycleo Earn-out") with the former shareholders of Cycleo SAS ("Cycleo Earn-out Beneficiaries"), which the Company acquired on March 7, 2012, the Company potentially may make payments totaling up to approximately
$16.0 million
based on the achievement of a combination of certain revenue and operating income milestones over a defined period ("Cycleo Defined Earn-out Period"). The Cycleo Defined Earn-out Period covers the period April 27, 2015 to April 26, 2020. For certain of the Cycleo Earn-out Beneficiaries, payment of the earn-out liability is contingent upon continued employment and is accounted for as post-acquisition compensation expense over the service period. The portion of the earn-out liability that is not dependent on continued employment is not considered as compensation expense. The Company has recorded a liability for the Cycleo Earn-out of
$5.5 million
and
$6.1 million
as of
January 28, 2018
and
January 29, 2017
, respectively, of which
$2.0 million
is expected to be paid within twelve months.
Pursuant to the terms of the Triune Earn-out with the former members of Triune ("Triune Earn-out Beneficiaries"), which the Company acquired on March 4, 2015, the Company could have potentially made payments totaling up to approximately
$70.0 million
based on achievement of certain net revenue targets measured at each fiscal year end, starting with fiscal year 2016 and ending in fiscal year 2018. An additional payment of up to
$16.0 million
may be made based upon a combination of cumulative revenue and contribution margin targets measured from the acquisition date through the end of the Company’s fiscal year 2018. For certain of the Triune Earn-out Beneficiaries, payment of the earn-out liability is contingent upon continued employment and is accounted for as post-acquisition compensation expense over the service period. The portion of the earn-out liability that is not dependent on continued employment is not considered as compensation expense. The Triune Earn-out targets for fiscal
94
years 2017 and 2016 were not met and the Company does not expect the fiscal year 2018 targets to be achieved. Refer to Note
5
for additional discussion regarding fair value measurements.
Pursuant to the terms of the AptoVision Earn-out with the former shareholders of AptoVision ("AptoVision Earn-out Beneficiaries"), which the Company acquired on July 1, 2017, the Company potentially may make payments totaling up to approximately
$47.0 million
based on the achievement of a combination of certain net revenue, adjusted earnings and product development targets measured from the acquisition date through July 26, 2020.
A summary of earn-out liabilities, included in "Accrued liabilities" and "Other long-term liabilities", by classification follows:
|
Balance at January 28, 2018
|
Balance at January 29, 2017
|
||||||||||||||||||||||
|
(in thousands)
|
AptoVision
|
Cycleo
|
Total
|
AptoVision
|
Cycleo
|
Total
|
|||||||||||||||||
|
Compensation expense
|
$
|
—
|
|
$
|
4,408
|
|
$
|
4,408
|
|
$
|
—
|
|
$
|
4,576
|
|
$
|
4,576
|
|
|||||
|
Not conditional upon continued employment
|
21,000
|
|
668
|
|
21,668
|
|
—
|
|
949
|
|
949
|
|
|||||||||||
|
Interest expense
|
—
|
|
444
|
|
444
|
|
—
|
|
543
|
|
543
|
|
|||||||||||
|
Total liability
|
$
|
21,000
|
|
$
|
5,520
|
|
$
|
26,520
|
|
$
|
—
|
|
$
|
6,068
|
|
$
|
6,068
|
|
|||||
|
Amount expected to be settled within twelve months
|
$
|
8,900
|
|
$
|
2,008
|
|
$
|
10,908
|
|
||||||||||||||
|
Amount settled during fiscal year 2018
|
$
|
—
|
|
$
|
1,580
|
|
$
|
1,580
|
|
||||||||||||||
95
Note
14
: Concentration of Risk
Significant Customers
Sales to the Company’s customers are generally made on open account, subject to credit limits the Company may impose, and the receivables are subject to the risk of being uncollectible.
The following significant customers accounted for at least
10%
of net sales in one or more of the periods indicated:
|
Fiscal Year Ended
|
||||||||
|
(percentage of net sales)
|
January 28, 2018
|
January 29, 2017
|
January 31, 2016
|
|||||
|
Arrow Electronics (and affiliates)
|
11
|
%
|
10
|
%
|
9
|
%
|
||
|
Trend-tek Technology Ltd (and affiliates)
|
10
|
%
|
10
|
%
|
7
|
%
|
||
|
Samsung Electronics (and affiliates)
|
8
|
%
|
7
|
%
|
7
|
%
|
||
|
Premier Technical Sales Korea, Inc. (and affiliates)
(1)
|
6
|
%
|
4
|
%
|
3
|
%
|
||
(1)
Premier is a distributor with a concentration of sales to Samsung. The above percentages represent the Company's estimate of the sales activity related to Samsung that is passing through this distributor.
The Company
did not ha
ve any customer that accounted for at least
10%
of total net receivables as of
January 28, 2018
or
January 29, 2017
.
Outside Subcontractors and Suppliers
The Company relies on a limited number of third-party subcontractors and suppliers for the production of silicon wafers, packaging and certain other tasks. Disruption or termination of supply sources or subcontractors, including due to natural disasters such as an earthquake or other causes, could delay shipments and could have a material adverse effect on the Company. Although there are generally alternate sources for these materials and services, qualification of the alternate sources could cause delays sufficient to have a material adverse effect on the Company. Several of the Company’s third-party subcontractors and suppliers, including third-party foundries that supply silicon wafers, are located in foreign countries, includi
ng China, Israel and Taiwan.
A significant amount of the Company’s assembly and test operations are conducted by third-party contractors in
China, Malaysia, Taiwan, Thailand, South Korea and the Philippines.
For fiscal year
2018
, approximately
20%
of the Company’s silicon in terms of cost of wafers was supplied by a third-party foundry in China, and this percentage could be higher in future periods. For fiscal years
2017
and
2016
, approximately
25%
and
28%
of the Company’s silicon in terms of cost of wafers was supplied by this third-party foundry in China, respectively.
In fiscal year
2018
, authorized distributors accounted for approximately
66%
of the Company’s net sales. Generally, the Company does not have long-term contracts with its distributors and most can terminate their agreement with little or no notice. For fiscal year
2018
, our two largest distributors were based in Asia.
96
Note
15
: Segment Information
Segment Information
See Note
1
regarding recent developments affecting the Company's operating segments.
The Company had
five
operating segments that existed prior to the third quarter of fiscal year 2017 and currently has
four
. The
Company’s CEO functions as the CODM. The Company’s CODM makes operating decisions and assesses performance based on these operating segments. The
four
operating segments: Protection Products Group, Power and High-Reliability Products Group, Signal Integrity Products Group, and Wireless and Sensing Products Group, all have similar economic characteristics and have been aggregated into
one
reportable segment identified in the table below as the "Semiconductor Products Group."
On August 5, 2016, the Company completed its divestiture of its Snowbush IP business, and the Company no longer has a Systems Innovation Group or an "All others" category, which previously existed as a separate operating segment.
The Company’s assets are commingled among the various operating segments and the CODM does not use that information in making operating decisions or assessing performance. Therefore, the Company has not included asset information by segment below.
Net sales by segment are as follows:
|
Fiscal Year Ended
|
|||||||||||
|
(in thousands)
|
January 28, 2018
|
January 29, 2017
|
January 31, 2016
|
||||||||
|
Semiconductor Products Group
|
$
|
587,847
|
|
$
|
544,067
|
|
$
|
485,570
|
|
||
|
All others
|
—
|
|
205
|
|
4,649
|
|
|||||
|
Total
|
$
|
587,847
|
|
|
$
|
544,272
|
|
$
|
490,219
|
|
|
Income by segment and reconciliation to consolidated operating income:
|
Fiscal Year Ended
|
|||||||||||
|
(in thousands)
|
January 28, 2018
|
January 29, 2017
|
January 31, 2016
|
||||||||
|
Semiconductor Products Group
|
$
|
160,810
|
|
$
|
126,271
|
|
$
|
83,422
|
|
||
|
All others
|
—
|
|
23,406
|
|
(3,670
|
)
|
|||||
|
Operating income by segment
|
160,810
|
|
149,677
|
|
79,752
|
|
|||||
|
Items to reconcile segment operating income to consolidated income before taxes
|
|||||||||||
|
Share-based compensation
|
47,936
|
|
30,828
|
|
20,468
|
|
|||||
|
Intangible amortization
|
27,867
|
|
25,301
|
|
25,059
|
|
|||||
|
Changes in the fair value of contingent earn-out obligations
|
3,892
|
|
(215
|
)
|
(16,362
|
)
|
|||||
|
Other non-segment related expenses
|
12,189
|
|
7,455
|
|
19,067
|
|
|||||
|
Amortization of fair value adjustments related to acquired property, plant and equipment
|
190
|
|
2,227
|
|
1,521
|
|
|||||
|
Interest expense, net
|
7,963
|
|
9,300
|
|
7,819
|
|
|||||
|
Non-operating expense, net
|
902
|
|
1,721
|
|
1,801
|
|
|||||
|
Income before taxes
|
$
|
59,871
|
|
$
|
73,060
|
|
$
|
20,379
|
|
||
97
Information by Product Line
The Company operates exclusively in the semiconductor industry and primarily within the analog and mixed-signal sector.
The table below provides net sales activity by product line on a comparative basis for all periods.
|
Fiscal Year Ended
|
||||||||||||||||||||
|
(in thousands, except percentages)
|
January 28, 2018
|
January 29, 2017
|
January 31, 2016
|
|||||||||||||||||
|
Signal Integrity
|
$
|
263,015
|
|
45
|
%
|
$
|
258,824
|
|
47
|
%
|
$
|
221,185
|
|
46
|
%
|
|||||
|
Protection
|
176,482
|
|
30
|
%
|
149,865
|
|
28
|
%
|
138,674
|
|
28
|
%
|
||||||||
|
Wireless and Sensing
|
117,596
|
|
20
|
%
|
81,657
|
|
15
|
%
|
70,712
|
|
14
|
%
|
||||||||
|
Power and High-Reliability
|
46,973
|
|
8
|
%
|
59,117
|
|
11
|
%
|
54,999
|
|
11
|
%
|
||||||||
|
Systems Innovation
|
—
|
|
—
|
%
|
205
|
|
—
|
%
|
4,649
|
|
1
|
%
|
||||||||
|
Other: Warrant Shares
|
(16,219
|
)
|
(3
|
)%
|
(5,396
|
)
|
(1
|
)%
|
—
|
|
—
|
%
|
||||||||
|
Total Net Sales
|
$
|
587,847
|
|
|
100
|
%
|
$
|
544,272
|
|
|
100
|
%
|
$
|
490,219
|
|
|
100
|
%
|
||
The cost of the Warrant granted is recognized as an offset to net sales over the respective performance period (see Note
11
for discussion regarding Share-Based Compensation).
Geographic Information
The Company generates virtually all of its sales from its Semiconductor Products Group through sales of analog and mixed-signal devices.
Sales activity by geographic region is as follows:
|
|
Fiscal Year Ended
|
|||||||||||||||||||
|
(in thousands, except percentages)
|
January 28, 2018
|
January 29, 2017
|
January 31, 2016
|
|||||||||||||||||
|
Asia-Pacific
|
$
|
439,342
|
|
75
|
%
|
$
|
412,167
|
|
76
|
%
|
$
|
358,480
|
|
74
|
%
|
|||||
|
North America
|
121,144
|
|
21
|
%
|
94,123
|
|
17
|
%
|
46,152
|
|
9
|
%
|
||||||||
|
Europe
|
43,580
|
|
7
|
%
|
43,378
|
|
8
|
%
|
85,587
|
|
17
|
%
|
||||||||
|
Other: Warrant Shares
|
(16,219
|
)
|
(3
|
)%
|
(5,396
|
)
|
(1
|
)%
|
—
|
|
—
|
%
|
||||||||
|
Total Net Sales
|
$
|
587,847
|
|
100
|
%
|
$
|
544,272
|
|
100
|
%
|
$
|
490,219
|
|
100
|
%
|
|||||
The Company attributes sales to a country based on the ship-to address. The table below summarizes sales activity to countries that represented greater than
10%
of total sales for at least one of the periods presented:
|
|
Fiscal Year Ended
|
|||||||
|
(percentage of total net sales)
|
January 28, 2018
|
January 29, 2017
|
January 31, 2016
|
|||||
|
China (including Hong Kong)
|
51
|
%
|
48
|
%
|
47
|
%
|
||
|
United States
|
9
|
%
|
9
|
%
|
12
|
%
|
||
|
Total Net Sales
|
60
|
%
|
57
|
%
|
59
|
%
|
||
Long-lived Assets
Long-lived assets, which consist of property, plant and equipment, net of accumulated depreciation and classified by location are summarized as follows:
|
Fiscal Year Ended
|
|||||||
|
(in thousands)
|
January 28, 2018
|
January 29, 2017
|
|||||
|
United States
|
$
|
48,289
|
|
|
$
|
50,747
|
|
|
Rest of North America
|
34,941
|
|
30,435
|
|
|||
|
Europe
|
9,752
|
|
8,821
|
|
|||
|
Asia and all others
|
31,624
|
|
|
18,907
|
|
||
|
Total
|
$
|
124,606
|
|
$
|
108,910
|
|
|
Some of these assets are at locations owned or operated by the Company’s suppliers. The Company has consigned certain equipment to a foundry based in China to support its specialized processes run at the foundry. The Company has also installed
98
its own equipment at some of its packaging and testing subcontractors in order to ensure a certain level of capacity, assuming the subcontractor has ample employees to operate the equipment.
The net book value of equipment and machinery that are consigned to multiple foundries in China is
$15.4 million
and
$5.1 million
as of
January 28, 2018
and
January 29, 2017
, respectively. The net book value of equipment and machinery that are consigned to a foundry in Malaysia is
$6.1 million
and
$2.3 million
as of
January 28, 2018
and
January 29, 2017
, respectively.
99
Note
16
: Restructuring
From time to time, the Company takes steps to realign the business to focus on high-growth areas, provide customer value and make the Company more efficient. As a result, the Company has re-aligned resources and infrastructure, which resulted in restructuring expense of
$6.3 million
,
$2.3 million
and
$4.5 million
in fiscal years
2018
,
2017
and
2016
, respectively.
Restructuring related liabilities are included in "Accrued liabilities" within the Balance Sheets as of
January 28, 2018
and
January 29, 2017
, respectively. Restructuring charges are presented in "Selling, general and administrative" within the Statements of Income.
Activity under the restructuring plans is summarized in the following table:
|
(in thousands)
|
One-time employee termination benefits
|
Contract commitments
|
Total
|
||||||||
|
Balance at January 25, 2015
|
$
|
282
|
|
$
|
—
|
|
$
|
282
|
|
||
|
Charges
|
4,526
|
|
—
|
|
4,526
|
|
|||||
|
Cash payments
|
(4,466
|
)
|
—
|
|
(4,466
|
)
|
|||||
|
Reclassifications
|
—
|
|
—
|
|
—
|
|
|||||
|
Balance at January 31, 2016
|
342
|
|
—
|
|
342
|
|
|||||
|
Charges
|
2,282
|
|
—
|
|
2,282
|
|
|||||
|
Cash payments
|
(2,611
|
)
|
—
|
|
(2,611
|
)
|
|||||
|
Balance at January 29, 2017
|
13
|
|
—
|
|
13
|
|
|||||
|
Charges
|
5,615
|
|
686
|
|
6,301
|
|
|||||
|
Cash payments
|
(1,565
|
)
|
—
|
|
(1,565
|
)
|
|||||
|
Balance at January 28, 2018
|
$
|
4,063
|
|
$
|
686
|
|
$
|
4,749
|
|
||
100
Note
17
: Stock Repurchase Program
The Company maintains a stock repurchase program that was initially approved by its Board of Directors in March 2008. The stock repurchase program does not have an expiration date and the Company’s Board of Directors has authorized expansion of the program over the years. The following table summarizes activity under the program for the fiscal years listed below:
|
Fiscal Year Ended
|
||||||||||||||||||||
|
January 28, 2018
|
January 29, 2017
|
January 31, 2016
|
||||||||||||||||||
|
(in thousands, except number of shares)
|
Shares
|
Value
|
Shares
|
Value
|
Shares
|
Value
|
||||||||||||||
|
Shares repurchased under the stock repurchase program
|
442,607
|
|
$
|
14,849
|
|
39,024
|
|
$
|
1,005
|
|
2,681,476
|
|
$
|
57,311
|
|
|||||
|
Total treasury shares required
|
442,607
|
|
$
|
14,849
|
|
39,024
|
|
$
|
1,005
|
|
2,681,476
|
|
$
|
57,311
|
|
|||||
As of
January 28, 2018
, the Company had repurchased
$151.4 million
in shares of its common stock under the program since its inception and the remaining authorization under the program was
$47.0 million
. Under the program, the Company may repurchase its common stock at any time or from time to time, without prior notice, subject to market conditions and other considerations. The Company’s repurchases may be made through Rule 10b5-1 and/or Rule 10b-18 or other trading plans, open market purchases, privately negotiated transactions, block purchases or other transactions. The Company intends to fund repurchases under the program from cash on hand. The Company has no obligation to repurchase any shares under the program and may suspend or discontinue it at any time.
101
Note
18
: Derivatives and Hedging Activities
The Company is exposed to certain risk arising from both its business operations and economic conditions and principally manages its exposures to a wide variety of business and operational risks through management of its core business activities. The Company, on a routine basis and in the normal course of business, experiences expenses denominated in Swiss Franc ("CHF"), Canadian Dollar ("CAD") and Great British Pound ("GBP"). Such expenses expose the Company to exchange rate fluctuations between these foreign currencies and the U.S. Dollar ("USD"). The Company uses derivative financial instruments in the form of forward contracts to mitigate risk associated with adverse movements in these foreign currency exchange rates on a portion of foreign denominated expenses expected to be realized during the current and following fiscal year.
Currency forward contracts involve fixing the exchange rate for delivery of a specified amount of foreign currency on a specified date.
The Company’s accounting treatment for these instruments is based on whether or not the instruments are designated as a hedging instrument. The Company is currently applying hedge accounting to all foreign currency derivatives and has designated these hedges as cash flow hedges.
At
January 28, 2018
, the Company had no outstanding foreign exchange contracts.
These contracts met the criteria for cash flow hedges and the unrealized gains or losses, after tax, are recorded as a component of "Accumulated other comprehensive loss" within the Balance Sheets. The effective portions of cash flow hedges are recorded in accumulated other comprehensive income or loss ("AOCI") until the hedged item is recognized in "Selling, general and administrative" ("SG&A") expense within the Statements of Income when the underlying hedged expense is recognized. Any ineffective portions of cash flow hedges are recorded in "Non-operating expense, net" within the Statements of Income. The Company presents its derivative assets and liabilities at their gross fair values on the Balance Sheets.
The table below summarizes the carrying values of derivative instruments as of
January 29, 2017
:
|
Carrying Values of Derivative Instruments as of January 29, 2017
|
||||||||||||
|
Fair Value - Assets
(2)
|
Fair Value - (Liabilities)
(2)
|
Derivative Net Carrying Value
|
||||||||||
|
Derivatives designated as hedging instruments
|
||||||||||||
|
Foreign exchange contracts
(1)
|
$
|
326
|
|
$
|
—
|
|
$
|
326
|
|
|||
|
Total derivatives
|
$
|
326
|
|
$
|
—
|
|
$
|
326
|
|
|||
(1)
Assets are included in "Other current assets" and liabilities are included in "Accrued liabilities" within the Balance Sheets.
(2)
The fair values of the foreign exchange forward contracts are valued using Level 2 inputs. Please refer to Note
5
.
The following table summarizes the amount of income recognized from derivative instruments for the fiscal years ended
January 28, 2018
and
January 29, 2017
as well as the line items within the accompanying Statements of Income where the results are recorded for cash flow hedges:
|
Amount of Gain (Loss) Recognized in AOCI on Derivative (Effective Portion)
|
Location of Gain or Loss into Income (Effective Portion)
|
Amount of (Gain) Loss Reclassified from AOCI into Income (Effective Portion)
|
Location of Gain or Loss Recognized in Income on Derivative (Ineffective Portion and Amount Excluded from Effectiveness Testing)
|
Amount of Gain (Loss) Recognized in Income on Derivative (Ineffective Portion and Amount Excluded from Effectiveness Testing)
|
|||||||||||||||||||||||
|
Fiscal Year Ended
|
Fiscal Year Ended
|
Fiscal Year Ended
|
|||||||||||||||||||||||||
|
(in thousands)
|
January 28, 2018
|
January 29, 2017
|
January 28, 2018
|
January 29, 2017
|
January 28, 2018
|
January 29, 2017
|
|||||||||||||||||||||
|
Sell USD/Buy CHF Forward Contract
|
$
|
—
|
|
$
|
(6
|
)
|
SG&A
|
$
|
—
|
|
$
|
6
|
|
SG&A
|
$
|
—
|
|
$
|
(1
|
)
|
|||||||
|
Sell USD/Buy CAD Forward Contract
|
841
|
|
1,100
|
|
SG&A
|
(841
|
)
|
(1,100
|
)
|
SG&A
|
4
|
|
5
|
|
|||||||||||||
|
Sell USD/Buy GBP Forward Contract
|
364
|
|
(508
|
)
|
SG&A
|
(690
|
)
|
834
|
|
SG&A
|
—
|
|
(4
|
)
|
|||||||||||||
|
$
|
1,205
|
|
$
|
586
|
|
$
|
(1,531
|
)
|
$
|
(260
|
)
|
$
|
4
|
|
$
|
—
|
|
||||||||||
The amount of losses and gains, respectively, related to the effective portion of derivative instruments designated as cash flow hedges included in AOCI within the Balance Sheets as of
January 28, 2018
and
January 29, 2017
was
$0.3 million
and
$0.3 million
.
102
Note
19
: Selected Quarterly Financial Data (Unaudited)
The following tables set forth the Company’s Statements of Income data for each of the eight quarterly periods ended
January 28, 2018
, as well as that data expressed as a percentage of the Company’s net sales for the quarters presented. The sum of quarterly per share amounts may differ from year to date amounts due to rounding. In the third quarter of fiscal year 2017, the Company recognized a gain of
$25.5 million
on the disposition of assets related to the divestiture of Snowbush IP to Rambus. This gain is presented in "Operating income."
Selected Quarterly Financial Data (Unaudited)
|
Fiscal Year 2018
|
Fiscal Year 2017
|
||||||||||||||||||||||||||||||
|
Quarters Ended
|
Quarters Ended
|
||||||||||||||||||||||||||||||
|
(in thousands, except per share amounts)
|
January 28,
2018 |
October 29,
2017 |
July 30,
2017 |
April 30,
2017 |
January 29,
2017 |
October 30,
2016 |
July 31,
2016 |
May 1,
2016 |
|||||||||||||||||||||||
|
Net sales
|
$
|
140,614
|
|
$
|
150,304
|
|
$
|
153,127
|
|
$
|
143,802
|
|
$
|
140,031
|
|
$
|
137,185
|
|
$
|
135,911
|
|
$
|
131,145
|
|
|||||||
|
Gross profit
|
85,401
|
|
89,419
|
|
92,236
|
|
84,915
|
|
83,498
|
|
81,065
|
|
81,775
|
|
78,524
|
|
|||||||||||||||
|
Operating income
|
14,009
|
|
17,579
|
|
18,892
|
|
18,256
|
|
15,288
|
|
39,099
|
|
16,427
|
|
13,267
|
|
|||||||||||||||
|
Net (loss) income
|
$
|
(1,297
|
)
|
$
|
13,338
|
|
$
|
12,564
|
|
$
|
11,821
|
|
$
|
8,020
|
|
$
|
30,776
|
|
$
|
8,978
|
|
$
|
6,887
|
|
|||||||
|
Earnings per share:
|
|||||||||||||||||||||||||||||||
|
Basic
|
$
|
(0.02
|
)
|
$
|
0.20
|
|
$
|
0.19
|
|
$
|
0.18
|
|
$
|
0.12
|
|
$
|
0.47
|
|
$
|
0.14
|
|
$
|
0.11
|
|
|||||||
|
Diluted
|
$
|
(0.02
|
)
|
$
|
0.20
|
|
$
|
0.19
|
|
$
|
0.18
|
|
$
|
0.12
|
|
$
|
0.46
|
|
$
|
0.14
|
|
$
|
0.11
|
|
|||||||
|
Weighted average number of shares used in computing earnings per share:
|
|||||||||||||||||||||||||||||||
|
Basic
|
66,310
|
|
66,194
|
|
65,763
|
|
65,839
|
|
65,716
|
|
65,549
|
|
65,299
|
|
65,144
|
|
|||||||||||||||
|
Diluted
|
66,310
|
|
67,817
|
|
67,470
|
|
67,376
|
|
66,757
|
|
66,206
|
|
65,905
|
|
65,552
|
|
|||||||||||||||
103
|
Item 9.
|
Changes in and Disagreements With Accountants on Accounting and Financial Disclosure
|
None.
|
Item 9A.
|
Controls and Procedures
|
Disclosure Controls and Procedures
The Company carried out an evaluation, under the supervision and with the participation of the CEO and Chief Financial Officer ("CFO"), of the effectiveness of the Company’s disclosure controls and procedures (as defined in Rules 13a-15(e) and 15d-15(e)) as of
January 28, 2018
. Based on that evaluation, the Company’s CEO and CFO have concluded that such disclosure controls and procedures were effective as of such date.
Changes in Internal Controls
There have been no changes to our internal control over financial reporting that occurred during the period covered by this report that have materially affected, or are reasonably likely to materially affect, our internal control over financial reporting.
Report of Management on Internal Control Over Financial Reporting
Our management is responsible for establishing and maintaining adequate internal control over financial reporting, as such term is defined in Securities Exchange Act of 1934, as amended (the "Exchange Act") Rules 13a-15(f) and 15d-15(f). Under the supervision and with the participation of our management, including our principal executive officer and principal financial officer, we conducted an evaluation of the effectiveness of our internal control over financial reporting based on the framework set forth in Internal Control-Integrated Framework (2013) issued by the Committee of Sponsoring Organizations of the Treadway Commission. Based on our evaluation under the framework, our management has concluded that as of
January 28, 2018
the Company’s internal control over financial reporting was effective to provide reasonable assurance regarding the reliability of financial reporting and the preparation of financial statements for external purposes in accordance with generally accepted accounting principles.
Deloitte & Touche LLP, an independent registered public accounting firm, audited the consolidated financial statements included in this report, and has audited our internal control over financial reporting as of
January 28, 2018
as stated in their report included below.
Report of Independent Registered Public Accounting Firm
The Board of Directors and Stockholders of
Semtech Corporation
Camarillo, California
Opinion on Internal Control over Financial Reporting
We have audited the internal control over financial reporting of Semtech Corporation and subsidiaries (the "Company") as of January 28, 2018, based on criteria established in Internal Control - Integrated Framework (2013) issued by the Committee of Sponsoring Organizations of the Treadway Commission (COSO). In our opinion, the Company maintained, in all material respects, effective internal control over financial reporting as of January 28, 2018, based on criteria established in Internal Control - Integrated Framework (2013) issued by COSO.
We have also audited, in accordance with the standards of the Public Company Accounting Oversight Board (United States) (PCAOB), the consolidated financial statements as of and for the year ended January 28, 2018, of the Company and our report dated March 22, 2018, expressed an unqualified opinion on those financial statements.
Basis for Opinion
The Company’s management is responsible for maintaining effective internal control over financial reporting and for its assessment of the effectiveness of internal control over financial reporting, included in the accompanying Report of Management on Internal Control Over Financial Reporting. Our responsibility is to express an opinion on the Company’s internal control over financial reporting based on our audit. We are a public accounting firm registered with the PCAOB and are required to be independent with respect to the Company in accordance with the U.S. federal securities laws and the applicable rules and regulations of the Securities and Exchange Commission and the PCAOB.
We conducted our audit in accordance with the standards of the PCAOB. Those standards require that we plan and perform the audit to obtain reasonable assurance about whether effective internal control over financial reporting was maintained in all
104
material respects. Our audit included obtaining an understanding of internal control over financial reporting, assessing the risk that a material weakness exists, testing and evaluating the design and operating effectiveness of internal control based on the assessed risk, and performing such other procedures as we considered necessary in the circumstances. We believe that our audit provides a reasonable basis for our opinion.
Definition and Limitations of Internal Control over Financial Reporting
A company’s internal control over financial reporting is a process designed to provide reasonable assurance regarding the reliability of financial reporting and the preparation of financial statements for external purposes in accordance with generally accepted accounting principles. A company’s internal control over financial reporting includes those policies and procedures that (1) pertain to the maintenance of records that, in reasonable detail, accurately and fairly reflect the transactions and dispositions of the assets of the company; (2) provide reasonable assurance that transactions are recorded as necessary to permit preparation of financial statements in accordance with generally accepted accounting principles, and that receipts and expenditures of the company are being made only in accordance with authorizations of management and directors of the company; and (3) provide reasonable assurance regarding prevention or timely detection of unauthorized acquisition, use, or disposition of the company’s assets that could have a material effect on the financial statements.
Because of its inherent limitations, internal control over financial reporting may not prevent or detect misstatements. Also, projections of any evaluation of effectiveness to future periods are subject to the risk that controls may become inadequate because of changes in conditions, or that the degree of compliance with the policies or procedures may deteriorate.
/s/ Deloitte & Touche LLP
Los Angeles, California
March 22, 2018
|
Item 9B.
|
Other Information
|
None.
105
|
Item 10.
|
Directors, Executive Officers and Corporate Governance
|
We have adopted a written Code of Conduct that applies to everyone in the Company, including our CEO, CFO and Controller. Our Code of Conduct serves as our written code of ethics for those officers, and for persons performing similar functions. Our current Code of Conduct is incorporated in this Annual Report on Form 10-K for fiscal year
2018
as Exhibit 14. The Code of Conduct is also available at the Corporate Governance section of the Investors page on our website at www.semtech.com. Alternatively, you can request a copy of the Code of Conduct free of charge by sending a written request to the Company’s Secretary at 200 Flynn Road, Camarillo, CA 93012. If we make any substantive amendments to the Code of Conduct or grant any waiver, including an implicit waiver, from the Code of Conduct to our CEO, CFO or Controller, we will within four business days of the event disclose the nature of the amendment or waiver on our website or in a report on Form 8-K.
The information relating to our directors, our nominees for directors, and our executive officers pursuant to Items 401; and Item 407(c)(3), (d)(4) and (d)(5) of Regulation S-K required by this item will be contained under the caption "Proposal 1: Election of Directors" in our Definitive Proxy Statement relating to our annual meeting of stockholders to be held on
June 14, 2018
, to be filed with the SEC pursuant to Regulation 14A of the Exchange Act and is hereby specifically incorporated by reference thereto.
The information required pursuant to Item 405 of Regulation S-K will be contained under the caption "Section 16(a) Beneficial Ownership Reporting Compliance" in our Definitive Proxy Statement relating to our annual meeting of stockholders, to be held on
June 14, 2018
, to be filed with the SEC pursuant to Regulation 14A of the Exchange Act and is hereby specifically incorporated by reference thereto.
|
Item 11.
|
Executive Compensation
|
The information required under this item will appear under the captions "Director Compensation," "Compensation Discussion and Analysis", "Executive Compensation" and related discussion and disclosure thereto, in the Definitive Proxy Statement relating to our annual meeting of stockholders to be held on
June 14, 2018
, to be filed by us with the SEC pursuant to Regulation 14A of the Exchange Act, and is hereby specifically incorporated herein by reference thereto.
|
Item 12.
|
Security Ownership of Certain Beneficial Owners and Management and Related Stockholder Matters
|
The information required under this item will appear under the captions "Beneficial Ownership of Securities," "Securities Authorized for Issuance under Equity Compensation Plans" and related discussion and disclosure thereto, in the Definitive Proxy Statement relating to our annual meeting of stockholders to be held on
June 14, 2018
, to be filed by us with the SEC pursuant to Regulation 14A of the Exchange Act, and is hereby specifically incorporated herein by reference thereto.
|
Item 13.
|
Certain Relationships and Related Transactions, and Director Independence
|
The information required under this item will appear under the captions "Election of Directors (Proposal Number 1)" "Corporate Governance, Transactions with Related Parties" and related discussion and disclosure thereto, in the Definitive Proxy Statement relating to our annual meeting of stockholders to be held on
June 14, 2018
, to be filed by us with the SEC pursuant to Regulation 14A of the Exchange Act, and is hereby specifically incorporated herein by reference thereto.
|
Item 14.
|
Principal Accounting Fees and Services
|
The information required under this item will appear under the captions "Independent Accountant Fees," and "Policy on Audit Committee Pre-Approval of Audit and Permissible Non-Audit Services" and related discussion and disclosure thereto, in the Definitive Proxy Statement relating to our annual meeting of stockholders to be held on
June 14, 2018
, to be filed by us with the SEC pursuant to Regulation 14A of the Exchange Act, and is hereby specifically incorporated herein by reference thereto.
106
|
Item 15.
|
Exhibits, Financial Statement Schedules
|
|
(a)(1)
|
The financial statements, schedules, and reports included in this Form 10-K are listed in the index under Item 8 in this report.
|
|
(a)(2)
|
Schedules other than those listed in Item 8 are omitted since they are not applicable, not required, or the information required to be set forth herein is included in the consolidated financial statements or notes thereto.
|
SCHEDULE II
SEMTECH CORPORATION AND SUBSIDIARIES
SCHEDULE II - VALUATION AND QUALIFYING ACCOUNTS
THREE YEARS ENDED
JANUARY 28, 2018
|
Total of Accounts Receivable and Other Sales Allowances
|
Balance at
Beginning of Year
|
Charged (Reversal) to Costs and Expenses
|
Deductions
|
Balance at
End of Year
|
|||||||||||
|
Year ended January 31, 2016
|
$
|
3,523,148
|
|
$
|
5,154,545
|
|
$
|
(884,894
|
)
|
$
|
7,792,799
|
|
|||
|
Year ended January 29, 2017
|
$
|
7,792,799
|
|
$
|
951,612
|
|
$
|
(514,436
|
)
|
$
|
8,229,975
|
|
|||
|
Year ended January 28, 2018
|
$
|
8,229,975
|
|
$
|
11,365,813
|
|
$
|
(10,506,484
|
)
|
$
|
9,089,304
|
|
|||
|
(a)(3)
|
Exhibits. These exhibits are available without charge upon written request directed to the Company’s Secretary at 200 Flynn Road, Camarillo, CA 93012. Documents that are not physically filed with this report are incorporated herein by reference to the location indicated.
|
|
Exhibit No.
|
|
Description
|
|
Location
|
|
|
|
|||
|
|
|
|||
|
|
|
|||
|
|
|
|||
|
*
|
|
|||
|
*
|
|
|||
|
*
|
||||
|
*
|
||||
107
|
*
|
|
|||
|
*
|
|
|||
|
*
|
||||
|
*
|
||||
|
*
|
||||
|
*
|
|
|
||
|
*
|
|
|||
|
*
|
|
|||
|
*
|
|
|||
|
*
|
|
|||
|
*
|
|
|||
|
*
|
|
|||
|
*
|
|
|||
|
*
|
|
|||
|
*
|
|
|||
|
*
|
|
|||
|
*
|
|
|||
|
*
|
||||
108
|
*
|
|
|||
|
*
|
|
|||
|
*
|
|
|||
|
*
|
|
|||
|
*
|
||||
|
*
|
||||
|
*
|
||||
|
*
|
||||
|
*
|
||||
|
*
|
||||
|
*
|
||||
|
*
|
||||
|
*
|
|
|||
|
*
|
|
|||
|
*
|
|
|||
|
*
|
|
|||
|
*
|
|
|||
|
|
|
|||
109
|
*
|
|
|||
|
|
|
|||
|
|
|
|||
|
*
|
|
|||
|
*
|
|
|
||
|
*
|
|
|
||
|
*
|
|
|
||
|
*
|
|
|
||
|
*
|
|
|
||
|
*
|
|
|
||
|
*
|
|
|
||
|
*
|
|
|
||
|
*
|
|
|
||
110
|
*
|
|
|
||
|
*
|
|
|
||
|
|
|
|||
|
|
|
|||
|
|
|
|||
|
|
|
|||
|
|
|
|||
|
|
|
|||
|
|
|
|||
|
|
|
|||
|
101.INS
|
XBRL Instance Document
|
Filed herewith
|
||
|
101.SCH
|
XBRL Taxonomy Extension Schema Document
|
Filed herewith
|
||
|
101.CAL
|
XBRL Taxonomy Extension Calculation Linkbase Document
|
Filed herewith
|
||
|
101.DEF
|
XBRL Taxonomy Extension Definition Linkbase Document
|
Filed herewith
|
||
|
101.LAB
|
XBRL Taxonomy Extension Label Linkbase Document
|
Filed herewith
|
||
111
|
101.PRE
|
XBRL Taxonomy Extension Presentation Linkbase Document
|
Filed herewith
|
||
|
*
|
Management contract or compensatory plan or arrangement.
|
|
Item 16.
|
Form 10-K Summary
|
None.
112
SIGNATURES
Pursuant to the requirements of Section 13 or 15(d) of the Securities Exchange Act of 1934, the registrant has duly caused this report to be signed on its behalf by the undersigned, thereunto duly authorized.
|
Semtech Corporation
|
|
|
Date: March 22, 2018
|
/s/ Mohan R. Maheswaran
|
|
Mohan R. Maheswaran
|
|
|
President and Chief Executive Officer
|
|
113
SIGNATURES
Pursuant to the requirements of the Securities Exchange Act of 1934, this report has been signed below by the following persons on behalf of the Registrant and in the capacities and on the dates indicated.
|
Date: March 22, 2018
|
/s/ Mohan R. Maheswaran
|
|
Mohan R. Maheswaran
|
|
|
President and Chief Executive Officer
|
|
|
Director
|
|
|
Date: March 22, 2018
|
/s/ Emeka N. Chukwu
|
|
Emeka N. Chukwu
|
|
|
Executive Vice President and Chief Financial Officer
|
|
|
(Principal Accounting and Financial Officer)
|
|
|
Date: March 22, 2018
|
/s/ Rockell N. Hankin
|
|
Rockell N. Hankin
|
|
|
Chairman of the Board
|
|
|
Date: March 22, 2018
|
/s/ Glen M. Antle
|
|
Glen M. Antle
|
|
|
Director
|
|
|
Date: March 22, 2018
|
/s/ James P. Burra
|
|
James P. Burra
|
|
|
Director
|
|
|
Date: March 22, 2018
|
/s/ Bruce C. Edwards
|
|
Bruce C. Edwards
|
|
|
Director
|
|
|
Date: March 22, 2018
|
/s/ Ye Jane Li
|
|
Ye Jane Li
|
|
|
Director
|
|
|
Date: March 22, 2018
|
/s/ James T. Lindstrom
|
|
James T. Lindstrom
|
|
|
Director
|
|
|
Date: March 22, 2018
|
/s/ Carmelo J. Santoro
|
|
Carmelo J. Santoro
|
|
|
Director
|
|
|
Date: March 22, 2018
|
/s/ Sylvia Summers
|
|
Sylvia Summers
|
|
|
Director
|
|
114
TABLE OF CONTENTS
Part IItem 1. BusinessItem 1A. Risk FactorsItem 1B. Unresolved Staff CommentsItem 2. PropertiesItem 3. Legal ProceedingsItem 4. Mine Safety DisclosuresPart IIItem 5. Market For Registrant S Common Equity, Related Stockholder Matters and Issuer Purchases Of Equity SecuritiesItem 6. Selected Financial DataItem 7. Management S Discussion and Analysis Of Financial Condition and Results Of OperationsItem 7A. Quantitative and Qualitative Disclosures About Market RiskItem 8. Financial Statements and Supplementary DataNote 1: Organization and Basis Of PresentationNote 2: Significant Accounting PoliciesNote 3: AcquisitionsNote 4: InvestmentsNote 5: Fair Value MeasurementsNote 6: InventoriesNote 7: Property, Plant and EquipmentNote 8: Goodwill and Intangible AssetsNote 9: Accrued LiabilitiesNote 10: Credit FacilitiesNote 11: Share-based CompensationNote 12: Income TaxesNote 13: Commitments and ContingenciesNote 14: Concentration Of RiskNote 15: Segment InformationNote 16: RestructuringNote 17: Stock Repurchase ProgramNote 18: Derivatives and Hedging ActivitiesNote 19: Selected Quarterly Financial Data (unaudited)Item 9. Changes in and Disagreements with Accountants on Accounting and Financial DisclosureItem 9A. Controls and ProceduresItem 9B. Other InformationPart IIIItem 10. Directors, Executive Officers and Corporate GovernanceItem 11. Executive CompensationItem 12. Security Ownership Of Certain Beneficial Owners and Management and Related Stockholder MattersItem 13. Certain Relationships and Related Transactions, and Director IndependenceItem 14. Principal Accounting Fees and ServicesPart IVItem 15. Exhibits, Financial Statement SchedulesItem 16. Form 10-k Summary